UNITED STATES
SECURITIES AND EXCHANGE COMMISSION
Washington, D.C. 20549
FORM N-CSR
CERTIFIED SHAREHOLDER REPORT OF REGISTERED
MANAGEMENT INVESTMENT COMPANIES
Investment Company Act file number | 811-05686 |
AIM Investment Securities Funds (Invesco Investment Securities Funds)
(Exact name of registrant as specified in charter)
| 11 Greenway Plaza, Suite 1000 Houston, Texas 77046 |
| | | (Address of principal executive offices) (Zip code) |
Sheri Morris 11 Greenway Plaza, Suite 1000 Houston, Texas 77046 |
| | | (Name and address of agent for service) |
Registrant's telephone number, including area code: | (713) 626-1919 | |
Date of fiscal year end: | | 02/29 | | | | |
Date of reporting period: | | 02/29/2020 | | | | |
Item 1. Report to Stockholders.
Annual Report to Shareholders | February 29, 2020 |
Invesco Corporate Bond Fund
Nasdaq:
A: ACCBX C: ACCEX R: ACCZX Y: ACCHX R5: ACCWX R6: ICBFX
Beginning on January 1, 2021, as permitted by regulations adopted by the Securities and Exchange Commission, paper copies of the Fund's shareholder reports will no longer be sent by mail, unless you specifically request paper copies of the reports from the Fund or from your financial intermediary, such as a broker-dealer or bank. Instead, the reports will be made available on the Fund's web- site, and you will be notified by mail each time a report is posted and provided with a website link to access the report.
If you already elected to receive shareholder reports electronically, you will not be affected by this change and you need not take any action. You may elect to receive shareholder reports and other communications from the Fund electronically by contacting your financial intermediary (such as a broker-dealer or bank) or, if you are a direct investor, by enrolling at invesco.com/edelivery.
You may elect to receive all future reports in paper free of charge. If you invest through a financial intermediary, you can contact your financial intermediary to request that you continue to receive paper copies of your shareholder reports. If you invest directly with the Fund, you can call (800) 959-4246 to let the Fund know you wish to continue receiving paper copies of your shareholder reports. Your election to receive reports in paper will apply to all funds held with your financial intermediary or all funds held with the fund complex if you invest directly with the Fund.
Andrew Schlossberg
Letters to Shareholders
Dear Shareholders:
This annual report includes information about your Fund, including performance data and a complete list of its investments as of the close of the reporting period. Inside is a discussion of how your Fund was managed and the factors that affected its performance during the reporting period.
The reporting period proved to be another tumultuous time for both global equities and fixed-income secu- rities. In early 2019, global equity markets were buoyed by a more accommodative stance from central banks and optimism about a potential US-China trade deal. In May, US-China trade concerns and slowing global growth led to a global equity sell-off and rally in US Treasuries. Despite the May sell-off, domestic equity mar- kets rallied in June in anticipation of a US Federal Reserve (the Fed) interest rate cut and closed the second quarter with modest gains. Continued US-China trade worries and signs of slowing global economic growth led to increased market volatility in August. The US Treasury yield curve inverted several times as fears of a US recession increased. As a result, global equity markets were largely flat for the third quarter. In the final
months of 2019, geopolitical and macroeconomic issues largely abated. This combined with better-than-expected third quarter corporate earnings and initial agreement of the phase one US-China trade deal provided a favorable backdrop for equities and impressive fourth quar- ter global equity returns.
As the new year began, US equities were largely buoyed in January by the signing of the phase one trade agreement and strong eco- nomic data although returns were dampened by the spread of the Coronavirus (COVID-19). Concerns over the virus had a greater impact on international equities, which were largely lower for the month. As the virus spread outside of China and the number of cases increased, fears of diminished global growth led to a sharp global equity sell-off at the end of February 2020 and sent the yield on the US 10-year Treasury to a new all-time low.
Throughout 2019, central banks continued to be accommodative, providing sources of liquidity. In July, the Fed lowered interest rates for the first time in 11 years. It again lowered rates in September and once again in October. During the rest of the year, the Fed left rates unchanged. Overseas, the European Central Bank left its policy rate unchanged and continued its bond purchasing program. In 2020, with the increased spread of the coronavirus, the Fed shifted from a more neutral policy to the possibility of further rate cuts in the new year. As 2020 unfolds, we'll see how the interplay of interest rates, economic data, geopolitics and a host of other factors affect US and overseas equity and fixed income markets.
Investor uncertainty and market volatility, such as we witnessed during the reporting period, are unfortunate facts of life when it comes to investing. That's why Invesco encourages investors to work with a professional financial adviser who can stress the importance of starting to save and invest early and the importance of adhering to a disciplined investment plan. A financial adviser who knows your unique finan- cial situation, investment goals and risk tolerance can be an invaluable partner as you seek to achieve your financial goals. Financial advis- ers can also offer a long-term perspective when markets are volatile and time-tested advice and guidance when your financial situation or investment goals change.
Visit our website for more information on your investments
Our website, invesco.com/us, offers a wide range of market insights and investment perspectives. On the website, you'll find detailed infor- mation about our funds, including performance, holdings and portfolio manager commentaries. You can access information about your account by completing a simple, secure online registration. To do so, select "Log In" on the right side of the homepage, and then select "Register for Individual Account Access."
In addition to the resources accessible on our website and through our mobile app, you can obtain timely updates to help you stay informed about the markets and the economy by connecting with Invesco on Twitter, LinkedIn or Facebook. You can access our blog at blog.invesco.us.com. Our goal is to provide you the information you want, when and where you want it.
Finally, I'm pleased to share with you Invesco's commitment to both the Principles for Responsible Investment and to considering environ- mental, social and governance issues in our robust investment process. I invite you to learn more at invesco.com/esg.
Have questions?
For questions about your account, contact an Invesco client services representative at 800 959 4246.
All of us at Invesco look forward to serving your investment management needs. Thank you for investing with us.
Sincerely,
Andrew Schlossberg
Head of the Americas,
Senior Managing Director, Invesco Ltd.
2Invesco Corporate Bond Fund
Bruce Crockett
Dear Shareholders:
Among the many important lessons I've learned in more than 40 years in a variety of business endeavors is the value of a trusted advocate.
As independent chair of the Invesco Funds Board, I can assure you that the members of the Board are strong advocates for the interests of investors in Invesco's mutual funds. We work hard to represent your interests through oversight of the quality of the investment management services your funds receive and other matters important to your investment, including but not limited to:
Ensuring that Invesco offers a diverse lineup of mutual funds that your financial adviser can use to strive to meet your financial needs as your investment goals change over time.
Monitoring how the portfolio management teams of the Invesco funds are performing in light of changing economic and market conditions.
Assessing each portfolio management team's investment performance within the context of the investment strategy described in the fund's prospectus.
Monitoring for potential conflicts of interests that may impact the nature of the services that your funds receive.
We believe one of the most important services we provide our fund shareholders is the annual review of the funds' advisory and sub-
advisory contracts with Invesco Advisers and its affiliates. This review is required by the Investment Company Act of 1940 and focuses on the nature and quality of the services Invesco provides as the adviser to the Invesco funds and the reasonableness of the fees that it charges for those services. Each year, we spend months carefully reviewing information received from Invesco and a variety of independent sources, such as performance and fee data prepared by Lipper, Inc. (a subsidiary of Broadridge Financial Solutions, Inc.), an independent, third-party firm widely recognized as a leader in its field. We also meet with our independent legal counsel and other independent advisers to review and help us assess the information that we have received. Our goal is to assure that you receive quality investment management services for a reasonable fee.
I trust the measures outlined above provide assurance that you have a worthy advocate when it comes to choosing the Invesco Funds. On behalf of the Board, we look forward to continuing to represent your interests and serving your needs.
Sincerely,
Bruce L. Crockett
Independent Chair
Invesco Funds Board of Trustees
3Invesco Corporate Bond Fund

Management's Discussion of Fund Performance
Performance summary
For the fiscal year ended February 29, 2020, Class A shares of Invesco Corporate Bond Fund (the Fund), at net asset value (NAV), underperformed the Fund's broad market/style-specific benchmark, the Bloomberg Barclays U.S. Credit Index.
Your Fund's long-term performance appears later in this report.
Fund vs. Indexes
Total returns, 2/28/19 to 2/29/20, at net asset value (NAV). Performance shown does not include applicable contingent deferred sales charges (CDSC) or front-end sales charges, which would have reduced performance.
Class A Shares | 15.20% |
Class C Shares | 14.43 |
Class R Shares | 15.06 |
Class Y Shares | 15.62 |
Class R5 Shares | 15.55 |
Class R6 Shares | 15.62 |
Bloomberg Barclays U.S. Credit Index (Broad Market/Style-Specific Index) | 15.30 |
Lipper BBB Rated Funds Index (Peer Group Index) | 15.57 |
Source(s): RIMES Technologies Corp.; Lipper Inc.
fiscal year, duration of the portfolio was main- tained in line with the broad market/style- specific benchmark, on average, and the tim- ing of changes and the degree of variance from the Fund's broad market/style-specific benchmark had a small negative effect on relative returns. Buying and selling US Trea- sury futures was an important tool used for the management of interest rate risk and to maintain our targeted portfolio duration dur- ing the fiscal year.
Part of the Fund's strategy in seeking to manage credit and currency risk during the fiscal year entailed purchasing and selling credit and currency derivatives. We sought to manage credit risk by purchasing and selling credit default swaps at various points throughout the fiscal year. Management of currency risk was carried out via currency forwards and options on as-needed basis and we believe it was effective in managing the currency positioning within the Fund during the fiscal year.
Market conditions and your Fund
During the fiscal year, US Treasury yields fell considerably, especially in February 2020, as concerns regarding the spread of the Corona- virus (COVID-19) took hold. The US credit market performed strongly over the fiscal year, with total returns above 15%, as mea- sured by the Bloomberg Barclays U.S. Credit Index. Credit spreads tightened for most of the fiscal year, but with worries stemming from the coronavirus, credit spreads widened in the last two months. With spreads roughly unchanged over the past 12 months, the pri- mary driver of returns was the decline in US Treasury yields. In particular, the 10-year US Treasury yield fell from 2.73% at the begin- ning of the fiscal year to 1.13% as of Febru- ary 29, 2020.1
During the fiscal year, the US Federal Re- serve (the Fed) cut interest rates three times: in July, September and October 2019 for a total decrease of 75 basis points.2 (A basis point is one one-hundredth of a percent- age point.) As a result, the federal funds tar- get rate stood at a range of 1.50% to 1.75%, on October 31, 2019, as well as at the end of the fiscal year.2 In addition to the decline in interest rates, US Treasury yields fell across all maturities. US investment grade credit returns were positive each month during the fiscal year, except for September. The out-of-
Portfolio Composition
By security type | % of total net assets |
U.S. Dollar Denominated Bonds & |
Notes | 87.51% |
U.S. Treasury Securities | 4.84 |
Preferred Stocks | 1.63 |
Asset-Backed Securities | 1.28 |
Security Types Each Less Than |
1% of Portfolio | 1.36 |
Money Market Funds Plus Other |
Assets Less Liabilities | 3.38 |
index US high yield sector posted a positive return for the fiscal year, as did emerging markets credit.
The Fund, at NAV, posted a positive return for the fiscal year, but underperformed its broad market/style-specific benchmark, the Bloomberg Barclays U.S. Credit Index. Secu- rity selection in investment grade corporate bonds was the most notable contributor to the Fund's relative performance. Security selection in the financials and industrials sec- tors contributed significantly to the Fund's relative performance, as did an out-of-index exposure to the high yield sector.
The Fund's shorter duration relative to the broad market/style-specific benchmark damp- ened its performance, as interest rates fell meaningfully during the fiscal year. Addition- ally, an underweight allocation to the non- corporate credit sector, particularly local au- thority issuers, was a minor detractor from the Fund's relative performance, as the sec- tor performed well during the fiscal year.
The Fund may use active duration and yield curve positioning for risk management and for generating excess return versus its broad market/style-specific benchmark. Duration measures a portfolio's price sensitivity to in- terest rate changes. Yield curve positioning refers to actively emphasizing particular points (maturities) along the yield curve with favorable risk-return expectations. During the
Top Five Debt Issuers*
% of total net assets |
1. U.S. Treasury | 4.84% |
2. Enterprise Products | |
Operating LLC | 2.47 |
3. AbbVie, Inc. | 1.92 |
4. AT&T, Inc. | 1.69 |
5. Sprint Spectrum Co. LLC/Sprint | |
Spectrum Co. II LLC/Sprint | |
Spectrum Co. III LLC | 1.52 |
We wish to remind you that the Fund is subject to interest rate risk, meaning when interest rates rise, the value of fixed income securities tends to fall. The risk may be greater in the current market enviroment be- cause interest rates are near historic lows. The degree to which the value of fixed income securities may decline due to rising interest rates may vary depending on the speed and magnitude of the increase in interest rates, as well as individual security characteristics, such as price, maturity, duration and coupon and market forces, such as supply and de- mand for similar securities. We are monitor- ing interest rates, and the market, economic and geopolitical factors that may impact the direction, speed and magnitude of changes to interest rates across the maturity spectrum, including the potential impact of monetary policy changes by the Fed and certain foreign central banks. If interest rates rise or fall faster than expected, markets may experience increased volatility, which may affect the value and/or liquidity of certain of the Fund's investments.
Thank you for investing in Invesco Corpo- rate Bond Fund and for sharing our long-term investment horizon.
1Source: US Department of the Treasury
2 Source: US Federal Reserve
The Fund's holdings are subject to change, and there is no assurance that the Fund will continue to hold any particular security.
*Excluding money market fund holdings, if any.
Data presented here are as of February 29, 2020.
4Invesco Corporate Bond Fund
Portfolio Managers:
Matthew Brill
Chuck Burge
Michael Hyman
Scott Roberts
Todd Schomberg
The views and opinions expressed in management's discussion of Fund performance are those of Invesco Advisers, Inc. These views and opinions are subject to change at any time based on factors such as market and economic conditions. These views and opinions may not be relied upon as investment advice or recommendations, or as an offer for a particular security. The information is not a complete analysis of every aspect of any market, country, industry, security or the Fund. Statements of fact are from sources considered reliable, but Invesco Advisers, Inc. makes no representation or warranty as to their completeness or accuracy. Although historical performance is no guarantee of future results, these insights may help you understand our investment management philosophy.
See important Fund and, if applicable, index disclosures later in this report.
5Invesco Corporate Bond Fund
Your Fund's Long-Term Performance
Results of a $10,000 Investment — Oldest Share Class(es)
Fund and index data from 2/28/10
$20,000
$17,638 Lipper BBB Rated Funds Index1
$17,081 Bloomberg Barclays U.S. Credit Index2

 $17,004 Invesco Corporate Bond Fund — Class A Shares
15,000
10,000
5,000
2/28/10 | 2/11 | 2/12 | 2/13 | 2/14 | 2/15 | 2/16 | 2/17 | 2/18 | 2/19 | 2/20 |
1 Source: Lipper Inc.
2 Source: RIMES Technologies Corp.
Past performance cannot guarantee future results.
The data shown in the chart include rein- vested distributions, applicable sales charges and Fund expenses including management
fees. Index results include reinvested divi- dends, but they do not reflect sales charges. Performance of the peer group, if applicable, reflects fund expenses and management fees; performance of a market index does not. Per-
formance shown in the chart and table(s) does not reflect deduction of taxes a share- holder would pay on Fund distributions or sale of Fund shares.
6Invesco Corporate Bond Fund

Average Annual Total Returns
As of 2/29/20, including maximum applicable sales charges
Class A Shares
Inception (9/23/71) | 7.06% |
10 Years | 5.45 |
5 | Years | 4.14 |
1 | Year | 10.33 |
Class C Shares | |
Inception (8/30/93) | 5.33% |
10 Years | 5.18 |
5 | Years | 4.31 |
1 | Year | 13.43 |
Class R Shares | |
10 Years | 5.66% |
5 | Years | 4.80 |
1 | Year | 15.06 |
Class Y Shares | |
Inception (8/12/05) | 5.83% |
10 Years | 6.20 |
5 | Years | 5.31 |
1 | Year | 15.62 |
Class R5 Shares | |
10 Years | 6.31% |
5 | Years | 5.41 |
1 | Year | 15.55 |
Class R6 Shares | |
10 Years | 6.26% |
5 | Years | 5.50 |
1 | Year | 15.62 |
Effective June 1, 2010, Class A, Class C and Class I shares of the predecessor fund, Van Kampen Corporate Bond Fund, advised by Van Kampen Asset Management were reorganized into Class A, Class C and Class Y shares, respectively, of Invesco Van Kampen Corporate Bond Fund (re- named Invesco Corporate Bond Fund). Re- turns shown above, prior to June 1, 2010, for Class A, Class C and Class Y shares are blended returns of the predecessor fund and Invesco Corporate Bond Fund. Share class returns will differ from the predeces- sor fund because of different expenses.
Class R shares incepted on June 6, 2011. Performance shown prior to that date is that of the Fund's and the predecessor fund's Class A shares, restated to reflect the higher 12b-1 fees applicable to Class R shares.
Class R5 shares incepted on June 1, 2010. Performance shown prior to that date is that of the predecessor fund's Class A shares and includes the 12b-1 fees applicable to Class A shares.
Class R6 shares incepted on Septem-
ber 24, 2012. Performance shown prior to that date is that of the Fund's and the pre- decessor fund's Class A shares and in- cludes the 12b-1 fees applicable to Class A shares.
The performance data quoted represent past performance and cannot guarantee future results; current performance may be lower or higher. Please visit invesco.com/ performance for the most recent month- end performance. Performance figures re- flect reinvested distributions, changes in net asset value and the effect of the maxi- mum sales charge unless otherwise stated. Performance figures do not reflect deduc- tion of taxes a shareholder would pay on Fund distributions or sale of Fund shares. Investment return and principal value will fluctuate so that you may have a gain or loss when you sell shares.
Class A share performance reflects the maximum 4.25% sales charge, and Class C share performance reflects the applicable contingent deferred sales charge (CDSC) for the period involved. The CDSC on Class C shares is 1% for the first year after purchase. Class R, Class Y, Class R5 and Class R6 shares do not have a front-end sales charge or a CDSC; therefore, perfor- mance is at net asset value.
The performance of the Fund's share classes will differ primarily due to different sales charge structures and class expenses. Fund performance reflects any applicable
fee waivers and/or expense reimburse- ments. Had the adviser not waived fees and/or reimbursed expenses currently or in the past, returns would have been lower. See current prospectus for more informa- tion.
7Invesco Corporate Bond Fund

Invesco Corporate Bond Fund's investment objective is to seek to provide current income with preservation of capital. Capital appreciation is a secondary objective that is sought only when consistent with the Fund's primary investment objective.
Unless otherwise stated, information presented in this report is as of February 29, 2020, and is based on total net assets.
Unless otherwise noted, all data provided by Invesco.
To access your Fund's reports/prospectus, visit invesco.com/fundreports.
About indexes used in this report
The Bloomberg Barclays U.S. Credit Index is an unmanaged index considered representative of publicly issued, SEC- registered US corporate and specified for- eign debentures and secured notes.
The Lipper BBB Rated Funds Index is an unmanaged index considered representa- tive of BBB-rated funds tracked by Lipper.
The Fund is not managed to track the per- formance of any particular index, including the index(es) described here, and conse- quently, the performance of the Fund may deviate significantly from the performance of the index(es).
A direct investment cannot be made in an index. Unless otherwise indicated, index results include reinvested dividends, and they do not reflect sales charges. Perfor- mance of the peer group, if applicable, reflects fund expenses; performance of a market index does not.
This report must be accompanied or preceded by a currently effective Fund prospectus, which contains more complete information, including sales charges and expenses. Investors should read it carefully before investing.
NOT FDIC INSURED | MAY LOSE VALUE | NO BANK GUARANTEE
8Invesco Corporate Bond Fund

Schedule of Investments(a)
February 29, 2020
Principal
AmountValue
U.S. Dollar Denominated Bonds & Notes–87.51%
Advertising–0.23% | | | |
Lamar Media Corp., | | | |
3.75%, 02/15/2028(b) | $ 3,842,000 | $ | 3,862,363 |
4.00%, 02/15/2030(b) | 1,302,000 | | 1,305,255 |
| | | 5,167,618 |
Aerospace & Defense–0.63% | | | |
Boeing Co. (The), | | | |
2.95%, 02/01/2030 | 7,000,000 | | 7,351,189 |
3.95%, 08/01/2059 | 5,000,000 | | 5,483,503 |
Moog, Inc., 4.25%, 12/15/2027(b) | 149,000 | | 151,980 |
Spirit AeroSystems, Inc., 4.60%, | | | |
06/15/2028 | 96,000 | | 95,394 |
TransDigm UK Holdings PLC, 6.88%, | | | |
05/15/2026 | 301,000 | | 316,907 |
TransDigm, Inc., | | | |
6.50%, 07/15/2024 | 70,000 | | 71,721 |
6.38%, 06/15/2026 | 141,000 | | 145,145 |
Triumph Group, Inc., 7.75%, | | | |
08/15/2025 | 331,000 | | 328,655 |
| | | 13,944,494 |
Agricultural & Farm Machinery–0.02% | | |
Titan International, Inc., 6.50%, | | | |
11/30/2023 | 470,000 | | 353,870 |
Air Freight & Logistics–0.00% | | | |
XPO Logistics, Inc., 6.50%, | | | |
06/15/2022(b) | 84,000 | | 84,099 |
Airlines–5.60% | | | |
American Airlines Pass Through Trust, | | | |
Series 2017-1, Class B, 4.95%, | | | |
02/15/2025 | 2,076,900 | | 2,232,796 |
Series 2016-1, Class AA, 3.58%, | | | |
01/15/2028 | 1,673,737 | | 1,836,253 |
Series 2019-1, Class B, 3.85%, | | | |
02/15/2028 | 3,613,534 | | 3,791,678 |
Series 2016-3, Class AA, 3.00%, | | | |
10/15/2028 | 4,036,714 | | 4,299,037 |
Series 2017-1, Class AA, 3.65%, | | | |
02/15/2029 | 2,761,247 | | 3,045,077 |
Series 2017-2, Class A, 3.60%, | | | |
10/15/2029 | 3,746,014 | | 4,014,579 |
Series 2017-2, Class AA, 3.35%, | | | |
10/15/2029 | 4,663,913 | | 5,044,690 |
Series 2019-1, Class AA, 3.15%, | | | |
02/15/2032 | 7,379,602 | | 7,965,534 |
Avianca Holdings S.A. (Colombia), | | | |
9.00%, 05/10/2023(b) | 2,909,000 | | 2,465,377 |
British Airways Pass Through Trust | | | |
(United Kingdom), | | | |
Series 2019-1, Class A, 3.35%, | | | |
06/15/2029(b) | 2,556,000 | | 2,724,893 |
Series 2019-1, Class AA, 3.30%, | | | |
12/15/2032(b) | 6,049,427 | | 6,593,548 |
| Principal | | |
| Amount | | Value |
Airlines–(continued) | | | |
Delta Air Lines Pass Through Trust, | | | |
Series 2019-1, Class A, 3.40%, | | | |
04/25/2024 | $ 3,233,000 | $ | 3,443,124 |
Series 2019-1, Class AA, 3.20%, | | | |
04/25/2024 | 4,673,000 | | 4,968,471 |
Delta Air Lines, Inc., | | | |
3.63%, 03/15/2022 | 9,961,000 | | 10,264,069 |
3.80%, 04/19/2023 | 2,065,000 | | 2,149,842 |
2.90%, 10/28/2024 | 7,922,000 | | 7,990,793 |
3.75%, 10/28/2029 | 10,445,000 | | 10,483,221 |
LATAM Airlines Group S.A. Pass | | | |
Through Trust (Chile), | | | |
Series 2015-1, Class A, 4.20%, | | | |
11/15/2027 | 4,849,648 | | 5,023,496 |
Norwegian Air Shuttle ASA Pass Through | | | |
Trust (Norway), | | | |
Series 2016-1, Class B, 7.50%, | | | |
11/10/2023(b) | 4,549,019 | | 4,824,747 |
Series 2016-1, Class A, 4.88%, | | | |
05/10/2028(b) | 4,288,499 | | 4,183,809 |
Southwest Airlines Co., 2.63%, | | | |
02/10/2030 | 3,055,000 | | 3,075,493 |
United Airlines Pass Through Trust, | | | |
Series 2014-2, Class B, 4.63%, | | | |
09/03/2022 | 1,594,765 | | 1,666,028 |
Series 2016-1, Class B, 3.65%, | | | |
01/07/2026 | 2,301,310 | | 2,410,871 |
Series 2019-2, Class B, 3.50%, | | | |
05/01/2028 | 2,833,000 | | 2,939,440 |
Series 2018-1, Class A, 3.70%, | | | |
03/01/2030 | 4,649,206 | | 4,989,386 |
Series 2018-1, Class AA, 3.50%, | | | |
03/01/2030 | 4,381,019 | | 4,770,132 |
Series 2019-1, Class A, 4.55%, | | | |
08/25/2031 | 2,021,743 | | 2,325,737 |
Series 2019-1, Class AA, 4.15%, | | | |
08/25/2031 | 3,942,854 | | 4,467,608 |
| | | 123,989,729 |
Alternative Carriers–0.17% | | | |
CenturyLink, Inc., | | | |
Series S, 6.45%, 06/15/2021 | 299,000 | | 310,885 |
Series Y, 7.50%, 04/01/2024 | 264,000 | | 296,450 |
4.00%, 02/15/2027(b) | 1,966,000 | | 1,980,548 |
Level 3 Financing, Inc., | | | |
5.38%, 05/01/2025 | 717,000 | | 733,430 |
5.25%, 03/15/2026 | 377,000 | | 389,950 |
| | | 3,711,263 |
Aluminum–0.04% | | | |
Alcoa Nederland Holding B.V., | | | |
6.75%, 09/30/2024(b) | 600,000 | | 616,506 |
Novelis Corp., 4.75%, | | | |
01/30/2030(b) | 198,000 | | 194,966 |
| | | 811,472 |
Apparel Retail–0.05% | | | |
L Brands, Inc., | | | |
6.88%, 11/01/2035 | 539,000 | | 548,042 |
6.75%, 07/01/2036 | 303,000 | | 307,575 |
See accompanying Notes to Financial Statements which are an integral part of the financial statements.
9Invesco Corporate Bond Fund
| | Principal | | |
| | Amount | | Value |
Apparel Retail–(continued) | | | | |
Michaels Stores, Inc., 8.00%, | | | | |
07/15/2027(b) | $ | 267,000 | $ | 223,065 |
| | | | 1,078,682 |
Apparel, Accessories & Luxury Goods–0.03% | | |
Hanesbrands, Inc., | | | | |
4.63%, 05/15/2024(b) | | 69,000 | | 72,249 |
4.88%, 05/15/2026(b) | | 560,000 | | 587,636 |
| | | | 659,885 |
Asset Management & Custody Banks–1.14% | | |
Affiliated Managers Group, Inc., | | | | |
4.25%, 02/15/2024 | | 4,515,000 | | 4,908,673 |
Apollo Management Holdings L.P., | | | | |
4.95%, 01/14/2050(b)(c) | | 7,115,000 | | 7,161,618 |
Blackstone Holdings Finance Co. LLC, | | | | |
5.00%, 06/15/2044(b) | | 4,355,000 | | 5,643,174 |
Carlyle Holdings II Finance LLC, | | | | |
5.63%, 03/30/2043(b) | | 5,900,000 | | 7,492,917 |
| | | | 25,206,382 |
Auto Parts & Equipment–0.04% | | | | |
Adient Global Holdings Ltd., 4.88%, | | | | |
08/15/2026(b) | | 200,000 | | 173,005 |
Dana Financing Luxembourg S.a.r.l., | | | | |
5.75%, 04/15/2025(b) | | 132,000 | | 136,345 |
Dana, Inc., 5.38%, 11/15/2027 | | 221,000 | | 223,763 |
Panther BF Aggregator 2 L.P./Panther | | | | |
Finance Co., Inc. (Canada), | | | | |
6.25%, 05/15/2026(b) | | 135,000 | | 138,925 |
8.50%, 05/15/2027(b) | | 178,000 | | 181,444 |
Tenneco, Inc., 5.00%, 07/15/2026 | | 115,000 | | 99,190 |
| | | | 952,672 |
Automobile Manufacturers–2.85% | | | |
Ford Motor Credit Co. LLC, | | | | |
5.09%, 01/07/2021 | | 2,887,000 | | 2,962,561 |
5.60%, 01/07/2022 | | 410,000 | | 432,718 |
3.35%, 11/01/2022 | | 7,372,000 | | 7,444,550 |
5.58%, 03/18/2024 | | 5,254,000 | | 5,624,923 |
4.06%, 11/01/2024 | | 4,000,000 | | 4,078,620 |
General Motors Financial Co., Inc., | | | | |
Series B, 6.50%(d) | | 200,000 | | 203,651 |
3.20%, 07/06/2021 | | 1,175,000 | | 1,189,028 |
5.10%, 01/17/2024 | | 2,352,000 | | 2,575,870 |
Hyundai Capital America, | | | | |
2.85%, 11/01/2022(b) | | 3,237,000 | | 3,320,404 |
4.30%, 02/01/2024(b) | | 14,635,000 | | 15,770,048 |
2.65%, 02/10/2025(b) | | 5,060,000 | | 5,161,388 |
3.50%, 11/02/2026(b) | | 6,823,000 | | 7,218,826 |
J.B. Poindexter & Co., Inc., 7.13%, | | | | |
04/15/2026(b) | | 539,000 | | 570,479 |
Toyota Motor Credit Corp., 2.15%, | | | | |
02/13/2030 | | 3,406,000 | | 3,449,445 |
Volkswagen Group of America | | | | |
Finance LLC (Germany), | | | | |
2.65%, (3 mo. USD LIBOR + | | | | |
0.94%), 11/12/2021(b)(c) | | 2,876,000 | | 2,905,495 |
3.20%, 09/26/2026(b) | | 200,000 | | 210,274 |
| | | | 63,118,280 |
| Principal | | |
| Amount | | Value |
Automotive Retail–0.23% | | | |
Advance Auto Parts, Inc., 4.50%, | | | |
12/01/2023 | $ 3,400,000 | $ | 3,738,857 |
Asbury Automotive Group, Inc., | | | |
4.75%, 03/01/2030(b) | 113,000 | | 115,260 |
AutoZone, Inc., 3.75%, | | | |
04/18/2029 | 200,000 | | 226,460 |
Lithia Motors, Inc., | | | |
5.25%, 08/01/2025(b) | 108,000 | | 112,905 |
4.63%, 12/15/2027(b) | 106,000 | | 108,775 |
Murphy Oil USA, Inc., 5.63%, | | | |
05/01/2027 | 300,000 | | 317,895 |
Penske Automotive Group, Inc., | | | |
5.50%, 05/15/2026 | 509,000 | | 529,029 |
| | | 5,149,181 |
Biotechnology–2.22% | | | |
AbbVie, Inc., | | | |
2.30%, 11/21/2022(b) | 6,144,000 | | 6,249,433 |
3.75%, 11/14/2023 | 250,000 | | 268,106 |
2.60%, 11/21/2024(b) | 10,844,000 | | 11,213,492 |
3.20%, 11/21/2029(b) | 8,501,000 | | 8,984,637 |
4.05%, 11/21/2039(b) | 9,357,000 | | 10,352,006 |
4.88%, 11/14/2048 | 4,254,000 | | 5,242,897 |
Amgen, Inc., | | | |
2.45%, 02/21/2030 | 1,695,000 | | 1,725,456 |
3.15%, 02/21/2040 | 3,286,000 | | 3,397,843 |
3.38%, 02/21/2050 | 1,694,000 | | 1,731,589 |
| | | 49,165,459 |
Brewers–0.20% | | | |
Anheuser-Busch InBev Worldwide, Inc. | | | |
(Belgium), | | | |
4.00%, 04/13/2028 | 300,000 | | 338,473 |
8.00%, 11/15/2039 | 2,414,000 | | 3,914,295 |
Molson Coors Beverage Co., 5.00%, | | | |
05/01/2042 | 249,000 | | 282,185 |
| | | 4,534,953 |
Broadcasting–0.32% | | | |
AMC Networks, Inc., | | | |
5.00%, 04/01/2024 | 329,000 | | 331,467 |
4.75%, 08/01/2025 | 61,000 | | 60,926 |
Clear Channel Worldwide Holdings, | | | |
Inc., 9.25%, 02/15/2024(b) | 223,000 | | 237,402 |
Gray Television, Inc., 7.00%, | | | |
05/15/2027(b) | 167,000 | | 181,462 |
iHeartCommunications, Inc., 8.38%, | | | |
05/01/2027 | 275,000 | | 299,145 |
NBCUniversal Media LLC, 5.95%, | | | |
04/01/2041 | 3,964,000 | | 5,780,916 |
TV Azteca S.A.B. de C.V. (Mexico), | | | |
8.25%, 08/09/2024(b) | 300,000 | | 272,126 |
| | | 7,163,444 |
Building Products–0.06% | | | |
Advanced Drainage Systems, Inc., | | | |
5.00%, 09/30/2027(b) | 138,000 | | 143,051 |
Owens Corning, 4.30%, | | | |
07/15/2047 | 250,000 | | 268,386 |
Standard Industries, Inc., | | | |
6.00%, 10/15/2025(b) | 725,000 | | 759,430 |
5.00%, 02/15/2027(b) | 47,000 | | 48,360 |
| | | 1,219,227 |
See accompanying Notes to Financial Statements which are an integral part of the financial statements.
10 | Invesco Corporate Bond Fund |
| | Principal | | |
| | Amount | | Value |
Cable & Satellite–1.98% | | | | |
Altice Financing S.A. (Luxembourg), | | | | |
7.50%, 05/15/2026(b) | $ | 260,000 | $ | 274,144 |
CCO Holdings LLC/CCO Holdings Capital | | | | |
Corp., | | | | |
5.75%, 09/01/2023 | | 576,000 | | 582,552 |
5.75%, 02/15/2026(b) | | 1,273,000 | | 1,325,893 |
4.50%, 08/15/2030(b) | | 131,000 | | 132,719 |
Charter Communications Operating LLC/ | | | | |
Charter Communications Operating | | | | |
Capital Corp., | | | | |
4.91%, 07/23/2025 | | 5,493,000 | | 6,158,334 |
5.38%, 04/01/2038 | | 2,239,000 | | 2,575,146 |
5.75%, 04/01/2048 | | 2,515,000 | | 3,003,664 |
6.83%, 10/23/2055 | | 4,449,000 | | 6,011,803 |
Comcast Corp., | | | | |
3.95%, 10/15/2025 | | 1,775,000 | | 1,987,740 |
6.45%, 03/15/2037 | | 1,885,000 | | 2,786,319 |
4.60%, 10/15/2038 | | 2,560,000 | | 3,226,996 |
3.25%, 11/01/2039 | | 1,040,000 | | 1,126,575 |
3.45%, 02/01/2050 | | 4,305,000 | | 4,759,236 |
4.95%, 10/15/2058 | | 2,621,000 | | 3,586,240 |
Cox Communications, Inc., 3.35%, | | | | |
09/15/2026(b) | | 2,316,000 | | 2,473,673 |
CSC Holdings LLC, | | | | |
7.75%, 07/15/2025(b) | | 434,000 | | 457,866 |
10.88%, 10/15/2025(b) | | 356,000 | | 391,271 |
6.63%, 10/15/2025(b) | | 200,000 | | 209,502 |
5.50%, 05/15/2026(b) | | 265,000 | | 274,984 |
DISH DBS Corp., | | | | |
5.88%, 11/15/2024 | | 239,000 | | 245,648 |
7.75%, 07/01/2026 | | 130,000 | | 139,933 |
Globo Comunicacao e Participacoes | | | | |
S.A. (Brazil), 4.88%, | | | | |
01/22/2030(b) | | 1,191,000 | | 1,193,084 |
UPC Holding B.V. (Netherlands), | | | | |
5.50%, 01/15/2028(b) | | 200,000 | | 203,190 |
Virgin Media Secured Finance PLC | | | | |
(United Kingdom), 5.50%, | | | | |
08/15/2026(b) | | 239,000 | | 246,502 |
VTR Finance B.V. (Chile), 6.88%, | | | | |
01/15/2024(b) | | 200,000 | | 204,333 |
Ziggo B.V. (Netherlands), 5.50%, | | | | |
01/15/2027(b) | | 225,000 | | 232,175 |
| | | | 43,809,522 |
Casinos & Gaming–0.07% | | | | |
Boyd Gaming Corp., | | | | |
6.38%, 04/01/2026 | | 115,000 | | 120,100 |
6.00%, 08/15/2026 | | 113,000 | | 116,396 |
MGM Resorts International, | | | | |
7.75%, 03/15/2022 | | 301,000 | | 330,131 |
6.00%, 03/15/2023 | | 559,000 | | 602,789 |
Wynn Las Vegas LLC/Wynn Las Vegas | | | | |
Capital Corp., 5.50%, | | | | |
03/01/2025(b) | | 319,000 | | 313,813 |
| | | | 1,483,229 |
Coal & Consumable Fuels–0.02% | | | | |
SunCoke Energy Partners | | | | |
L.P./SunCoke Energy Partners | | | | |
Finance Corp., 7.50%, | | | | |
06/15/2025(b) | | 602,000 | | 543,299 |
| | Principal | | |
| | Amount | | Value |
Commodity Chemicals–0.13% | | | | |
Alpek S.A.B. de C.V. (Mexico), | | | | |
4.25%, 09/18/2029(b) | $ | 1,987,000 | $ | 2,077,408 |
Koppers, Inc., 6.00%, | | | | |
02/15/2025(b) | | 219,000 | | 216,260 |
Nufarm Australia Ltd./Nufarm | | | | |
Americas, Inc. (Australia), 5.75%, | | | | |
04/30/2026(b) | | 153,000 | | 151,141 |
Olin Corp., 5.63%, 08/01/2029 | | 509,000 | | 514,421 |
| | | | 2,959,230 |
Communications Equipment–0.03% | | |
Hughes Satellite Systems Corp., | | | | |
7.63%, 06/15/2021 | | 281,000 | | 296,421 |
5.25%, 08/01/2026 | | 263,000 | | 289,063 |
| | | | 585,484 |
Construction & Engineering–0.18% | | | |
AECOM, 5.13%, 03/15/2027 | | 133,000 | | 137,804 |
Shea Homes L.P./Shea Homes | | | | |
Funding Corp., 4.75%, | | | | |
02/15/2028(b) | | 3,579,000 | | 3,587,572 |
Valmont Industries, Inc., 5.00%, | | | | |
10/01/2044 | | 250,000 | | 288,220 |
| | | | 4,013,596 |
Construction Machinery & Heavy Trucks–0.11% | | |
Ashtead Capital, Inc. (United | | | | |
Kingdom), 4.00%, | | | | |
05/01/2028(b) | | 2,115,000 | | 2,137,675 |
Westinghouse Air Brake Technologies | | | | |
Corp., 4.95%, 09/15/2028 | | 209,000 | | 237,847 |
| | | | 2,375,522 |
Construction Materials–1.42% | | | | |
Carrier Global Corp., | | | | |
2.24%, 02/15/2025(b) | | 7,631,000 | | 7,772,701 |
2.49%, 02/15/2027(b) | | 2,982,000 | | 3,038,671 |
2.72%, 02/15/2030(b) | | 6,236,000 | | 6,338,958 |
3.38%, 04/05/2040(b) | | 5,956,000 | | 6,122,869 |
3.58%, 04/05/2050(b) | | 4,027,000 | | 4,141,102 |
CRH America Finance, Inc. (Ireland), | | | | |
3.95%, 04/04/2028(b) | | 3,524,000 | | 3,999,721 |
| | | | 31,414,022 |
Consumer Finance–1.29% | | | | |
Ally Financial, Inc., | | | | |
4.13%, 03/30/2020 | | 4,155,000 | | 4,167,507 |
5.13%, 09/30/2024 | | 434,000 | | 481,699 |
4.63%, 03/30/2025 | | 1,303,000 | | 1,422,869 |
American Express Co., Series C, | | | | |
4.90% (3 mo. USD LIBOR + | | | | |
3.29%)(c)(d) | | 3,075,000 | | 3,063,100 |
Capital One Financial Corp., 3.75%, | | | | |
03/09/2027 | | 6,970,000 | | 7,619,932 |
Credit Acceptance Corp., | | | | |
5.13%, 12/31/2024(b) | | 1,381,000 | | 1,425,882 |
6.63%, 03/15/2026(b) | | 1,923,000 | | 2,023,751 |
Discover Bank, 4.68% (5 yr. | | | | |
U.S. Swap Rate + 1.73%), | | | | |
08/09/2028(c) | | 1,990,000 | | 2,116,395 |
See accompanying Notes to Financial Statements which are an integral part of the financial statements.
11 | Invesco Corporate Bond Fund |
| | Principal | | |
| | Amount | | Value |
Consumer Finance–(continued) | | | | |
Navient Corp., | | | | |
8.00%, 03/25/2020 | $ | 99,000 | $ | 99,516 |
7.25%, 01/25/2022 | | 160,000 | | 168,685 |
7.25%, 09/25/2023 | | 1,040,000 | | 1,120,590 |
5.00%, 03/15/2027 | | 486,000 | | 471,274 |
Synchrony Financial, 4.50%, | | | | |
07/23/2025 | | 4,000,000 | | 4,399,021 |
| | | | 28,580,221 |
Copper–0.64% | | | | |
First Quantum Minerals Ltd. (Zambia), | | | | |
7.50%, 04/01/2025(b) | | 548,000 | | 523,112 |
Freeport-McMoRan, Inc., | | | | |
5.00%, 09/01/2027 | | 4,626,000 | | 4,574,513 |
4.13%, 03/01/2028 | | 4,062,000 | | 3,854,229 |
4.25%, 03/01/2030 | | 4,062,000 | | 3,827,419 |
5.40%, 11/14/2034 | | 1,102,000 | | 1,077,401 |
Taseko Mines Ltd. (Canada), 8.75%, | | | | |
06/15/2022(b) | | 445,000 | | 401,751 |
| | | | 14,258,425 |
Data Processing & Outsourced Services–0.49% | | |
Alliance Data Systems Corp., 4.75%, | | | | |
12/15/2024(b) | | 2,112,000 | | 2,077,680 |
Cardtronics, Inc./Cardtronics USA, | | | | |
Inc., 5.50%, 05/01/2025(b) | | 212,000 | | 217,918 |
Fiserv, Inc., 4.20%, 10/01/2028 | | 2,400,000 | | 2,746,180 |
PayPal Holdings, Inc., | | | | |
2.65%, 10/01/2026 | | 3,243,000 | | 3,389,923 |
2.85%, 10/01/2029 | | 2,247,000 | | 2,363,675 |
| | | | 10,795,376 |
Department Stores–0.01% | | | | |
Kohl's Corp., 5.55%, 07/17/2045 | | 249,000 | | 267,177 |
Diversified Banks–10.07% | | | | |
Africa Finance Corp. (Supranational), | | | | |
4.38%, 04/17/2026(b) | | 7,620,000 | | 8,247,583 |
ANZ New Zealand (Int'l) Ltd. (New | | | | |
Zealand), 2.13%, 07/28/2021(b) | | 3,990,000 | | 4,034,676 |
Australia & New Zealand Banking Group | | | | |
Ltd. (Australia), | | | | |
2.95%, 07/22/2030(b)(c) | | 3,576,000 | | 3,657,759 |
6.75%(b)(d) | | 3,847,000 | | 4,345,514 |
Banco del Estado de Chile (Chile), | | | | |
2.70%, 01/09/2025(b) | | 2,875,000 | | 2,910,938 |
Bank of America Corp., | | | | |
3.86%, (3 mo. USD LIBOR + | | | | |
0.94%), 07/23/2024(c) | | 8,727,000 | | 9,342,152 |
7.75%, 05/14/2038 | | 2,850,000 | | 4,614,856 |
Series AA, 6.10%(d) | | 6,420,000 | | 7,121,738 |
Series DD, 6.30%(d) | | 2,040,000 | | 2,303,497 |
Series Z, 6.50%(d) | | 4,500,000 | | 4,969,627 |
Bank of China Ltd. (China), 5.00%, | | | | |
11/13/2024(b) | | 2,850,000 | | 3,182,622 |
Barclays Bank PLC (United Kingdom), | | | | |
5.14%, 10/14/2020 | | 765,000 | | 781,498 |
7.63%, 11/21/2022 | | 200,000 | | 222,974 |
Barclays PLC (United Kingdom), | | | | |
4.84%, 05/09/2028 | | 965,000 | | 1,068,310 |
BBVA Bancomer S.A. (Mexico), | | | | |
4.38%, 04/10/2024(b) | | 2,015,000 | | 2,151,869 |
| Principal | | |
| Amount | | Value |
Diversified Banks–(continued) | | | |
BNP Paribas S.A. (France), | | | |
4.38%, 03/01/2033(b)(c) | $ 5,330,000 | $ | 5,895,719 |
4.50%(b)(c)(d) | 6,218,000 | | 5,942,076 |
BPCE S.A. (France), 2.38%, | | | |
01/14/2025(b) | 3,971,000 | | 4,032,094 |
Citigroup, Inc., | | | |
3.50%, 05/15/2023 | 3,980,000 | | 4,187,778 |
2.88%, (3 mo. USD LIBOR + | | | |
0.95%), 07/24/2023(c) | 1,575,000 | | 1,616,939 |
5.50%, 09/13/2025 | 4,845,000 | | 5,676,203 |
3.98%, 03/20/2030(c) | 4,000,000 | | 4,529,983 |
4.65%, 07/23/2048 | 1,983,000 | | 2,629,173 |
Series Q, 5.95%(d) | 1,570,000 | | 1,593,212 |
Series T, 6.25%(d) | 2,110,000 | | 2,345,613 |
Series U, 5.00%(d) | 7,500,000 | | 7,688,962 |
Series V, 4.70%(c)(d) | 2,340,000 | | 2,312,213 |
Credit Agricole S.A. (France), | | | |
8.13%(b)(d) | 202,000 | | 239,044 |
Federation des caisses Desjardins du | | | |
Quebec (Canada), 2.05%, | | | |
02/10/2025(b) | 5,537,000 | | 5,608,319 |
Global Bank Corp. (Panama), 4.50%, | | | |
10/20/2021(b) | 6,573,000 | | 6,747,184 |
HSBC Holdings PLC (United Kingdom), | | | |
4.00%, 03/30/2022 | 2,070,000 | | 2,165,022 |
2.69%, (3 mo. USD LIBOR + | | | |
1.00%), 05/18/2024(c) | 2,663,000 | | 2,680,842 |
6.00%(d) | 5,365,000 | | 5,578,715 |
ING Groep N.V. (Netherlands), | | | |
6.00%(d) | 465,000 | | 464,954 |
JPMorgan Chase & Co., | | | |
2.30%, 08/15/2021 | 4,545,000 | | 4,553,408 |
2.70%, (3 mo. USD LIBOR + | | | |
0.89%), 07/23/2024(c) | 5,790,000 | | 5,842,170 |
3.63%, 12/01/2027 | 2,750,000 | | 2,982,709 |
3.70%, 05/06/2030(c) | 4,000,000 | | 4,458,246 |
4.26%, (3 mo. USD LIBOR + | | | |
1.58%), 02/22/2048(c) | 1,935,000 | | 2,423,921 |
Series W, 2.69% (3 mo. USD | | | |
LIBOR + 1.00%), 05/15/2047(c) | 5,770,000 | | 5,116,519 |
Series HH, 4.60% (SOFR + | | | |
3.13%)(c)(d) | 3,330,000 | | 3,350,813 |
Series I, 5.24% (3 mo. USD LIBOR | | | |
+ 3.47%)(c)(d) | 2,726,000 | | 2,725,305 |
Series V, 5.23% (3 mo. USD LIBOR | | | |
+ 3.32%)(c)(d) | 2,005,000 | | 1,998,474 |
National Australia Bank Ltd. | | | |
(Australia), 3.93%, | | | |
08/02/2034(b)(c) | 1,690,000 | | 1,848,834 |
Royal Bank of Scotland Group PLC (The) | | | |
(United Kingdom), | | | |
3.50%, (3 mo. USD LIBOR + | | | |
1.48%), 05/15/2023(c) | 5,711,000 | | 5,899,077 |
3.75%, 11/01/2029(c) | 1,895,000 | | 1,970,882 |
SMBC Aviation Capital Finance DAC | | | |
(Ireland), | | | |
3.00%, 07/15/2022(b) | 3,147,000 | | 3,249,321 |
4.13%, 07/15/2023(b) | 4,076,000 | | 4,382,807 |
Societe Generale S.A. (France), | | | |
7.38%(b)(d) | 202,000 | | 211,550 |
7.38%(b)(d) | 1,507,000 | | 1,578,243 |
7.38%(b)(d) | 3,665,000 | | 3,956,166 |
See accompanying Notes to Financial Statements which are an integral part of the financial statements.
12 | Invesco Corporate Bond Fund |
| | Principal | | |
| | Amount | | Value |
Diversified Banks–(continued) | | | | |
Standard Chartered PLC (United | | | | |
Kingdom), | | | | |
3.09%, (3 mo. USD LIBOR + | | | | |
1.20%), 09/10/2022(b)(c) | $ | 3,395,000 | $ | 3,425,373 |
2.97%, (3 mo. USD LIBOR + | | | | |
1.15%), 01/20/2023(b)(c) | | 1,442,000 | | 1,454,140 |
4.30%, 02/19/2027(b) | | 1,628,000 | | 1,752,021 |
7.50%(b)(d) | | 200,000 | | 210,187 |
7.75%(b)(d) | | 2,690,000 | | 2,899,793 |
Sumitomo Mitsui Financial Group, Inc. | | | | |
(Japan), 3.04%, 07/16/2029 | | 4,755,000 | | 5,064,737 |
Wells Fargo & Co., | | | | |
4.15%, 01/24/2029 | | 4,000,000 | | 4,599,317 |
5.38%, 11/02/2043 | | 7,865,000 | | 10,400,742 |
4.75%, 12/07/2046 | | 2,045,000 | | 2,572,460 |
Westpac Banking Corp. (Australia), | | | | |
2.89%, 02/04/2030(c) | | 3,166,000 | | 3,213,023 |
| | | | 223,029,896 |
Diversified Capital Markets–1.03% | | | |
Credit Suisse AG (Switzerland), | | | | |
3.00%, 10/29/2021 | | 2,065,000 | | 2,114,045 |
Credit Suisse Group AG (Switzerland), | | | | |
7.50%(b)(d) | | 2,410,000 | | 2,603,149 |
7.25%(b)(d) | | 330,000 | | 364,879 |
5.10%(b)(d) | | 4,230,000 | | 4,203,563 |
Macquarie Bank Ltd. (Australia), | | | | |
6.13%(b)(c)(d) | | 5,010,000 | | 5,295,996 |
UBS Group AG (Switzerland), 3.13% | | | | |
(3 mo. USD LIBOR + 1.47%), | | | | |
08/13/2030(b)(c) | | 7,847,000 | | 8,327,543 |
| | | | 22,909,175 |
Diversified Chemicals–0.21% | | | | |
Chemours Co. (The), 7.00%, | | | | |
05/15/2025 | | 105,000 | | 98,131 |
Dow Chemical Co. (The), 3.15%, | | | | |
05/15/2024 | | 2,023,000 | | 2,148,589 |
OCP S.A. (Morocco), 4.50%, | | | | |
10/22/2025(b) | | 2,259,000 | | 2,446,877 |
| | | | 4,693,597 |
Diversified Metals & Mining–0.60% | | | |
Corp. Nacional del Cobre de Chile (Chile), | | | | |
3.15%, 01/14/2030(b) | | 3,425,000 | | 3,509,206 |
3.70%, 01/30/2050(b) | | 2,345,000 | | 2,373,102 |
Hudbay Minerals, Inc. (Canada), | | | | |
7.63%, 01/15/2025(b) | | 285,000 | | 275,143 |
Teck Resources Ltd. (Canada), | | | | |
6.13%, 10/01/2035 | | 5,753,000 | | 6,844,580 |
Vedanta Resources Ltd. (India), | | | | |
6.38%, 07/30/2022(b) | | 291,000 | | 278,141 |
| | | | 13,280,172 |
Diversified REITs–0.99% | | | | |
iStar, Inc., 4.75%, 10/01/2024 | | 560,000 | | 572,799 |
Trust F/1401 (Mexico), | | | | |
5.25%, 12/15/2024(b) | | 4,124,000 | | 4,556,669 |
5.25%, 01/30/2026(b) | | 3,705,000 | | 4,076,787 |
4.87%, 01/15/2030(b) | | 4,150,000 | | 4,551,512 |
6.39%, 01/15/2050(b) | | 6,695,000 | | 7,872,885 |
| | Principal | | |
| | Amount | | Value |
Diversified REITs–(continued) | | | | |
VICI Properties L.P./VICI Note Co., Inc., | | | | |
3.50%, 02/15/2025(b) | $ | 93,000 | $ | 93,319 |
3.75%, 02/15/2027(b) | | 93,000 | | 92,477 |
4.13%, 08/15/2030(b) | | 93,000 | | 93,291 |
| | | | 21,909,739 |
Drug Retail–0.17% | | | | |
CVS Pass Through Trust, 5.77%, | | | | |
01/10/2033(b) | | 1,772,364 | | 2,113,406 |
CVS Pass-Through Trust, 6.04%, | | | | |
12/10/2028 | | 1,341,328 | | 1,548,071 |
| | | | 3,661,477 |
Electric Utilities–2.18% | | | | |
Commonwealth Edison Co., | | | | |
Series 127, 3.20%, 11/15/2049 | | 4,289,000 | | 4,557,861 |
DPL, Inc., 4.35%, 04/15/2029(b) | | 42,000 | | 39,285 |
Drax Finco PLC (United Kingdom), | | | | |
6.63%, 11/01/2025(b) | | 3,600,000 | | 3,766,086 |
Electricite de France S.A. (France), | | | | |
6.00%, 01/22/2114(b) | | 6,655,000 | | 8,667,771 |
Georgia Power Co., | | | | |
2.85%, 05/15/2022 | | 3,862,000 | | 3,987,689 |
Series A, 2.20%, 09/15/2024 | | 10,999,000 | | 11,263,669 |
Southern Co. (The), Series B, 5.50%, | | | | |
03/15/2057(c) | | 11,592,000 | | 11,941,359 |
Xcel Energy, Inc., 3.50%, | | | | |
12/01/2049 | | 3,632,000 | | 4,011,226 |
| | | | 48,234,946 |
Electrical Components & Equipment–0.03% | | |
EnerSys, | | | | |
5.00%, 04/30/2023(b) | | 476,000 | | 499,603 |
4.38%, 12/15/2027(b) | | 107,000 | | 108,471 |
| | | | 608,074 |
Electronic Components–1.43% | | | | |
Corning, Inc., 5.45%, 11/15/2079 | | 28,236,000 | | 31,575,786 |
Electronic Equipment & Instruments–0.03% | | |
Itron, Inc., 5.00%, 01/15/2026(b) | | 239,000 | | 246,684 |
MTS Systems Corp., 5.75%, | | | | |
08/15/2027(b) | | 316,000 | | 322,430 |
| | | | 569,114 |
Environmental & Facilities Services–0.01% | | |
Waste Pro USA, Inc., 5.50%, | | | | |
02/15/2026(b) | | 219,000 | | 214,111 |
Fertilizers & Agricultural Chemicals–0.01% | | |
OCI N.V. (Netherlands), 6.63%, | | | | |
04/15/2023(b) | | 211,000 | | 219,335 |
Financial Exchanges & Data–0.12% | | |
Moody's Corp., | | | | |
4.88%, 02/15/2024 | | 232,000 | | 258,369 |
5.25%, 07/15/2044 | | 1,665,000 | | 2,280,892 |
MSCI, Inc., 5.25%, 11/15/2024(b) | | 60,000 | | 61,769 |
| | | | 2,601,030 |
Food Distributors–0.02% | | | | |
US Foods, Inc., 5.88%, | | | | |
06/15/2024(b) | | 466,000 | | 475,127 |
See accompanying Notes to Financial Statements which are an integral part of the financial statements.
13 | Invesco Corporate Bond Fund |
| | Principal | | |
| | Amount | | Value |
Food Retail–0.34% | | | | |
Albertson's Cos., Inc./Safeway, Inc./New | | | | |
Albertson's L.P./Albertson's LLC, | | | | |
3.50%, 02/15/2023(b) | $ | 3,502,000 | $ | 3,515,132 |
6.63%, 06/15/2024 | | 363,000 | | 373,886 |
4.63%, 01/15/2027(b) | | 248,000 | | 244,739 |
5.88%, 02/15/2028(b) | | 193,000 | | 200,942 |
4.88%, 02/15/2030(b) | | 1,812,000 | | 1,816,530 |
Alimentation Couche-Tard, Inc. | | | | |
(Canada), 2.95%, 01/25/2030(b) | | 1,317,000 | | 1,357,142 |
| | | | 7,508,371 |
Forest Products–0.02% | | | | |
Norbord, Inc. (Canada), 5.75%, | | | | |
07/15/2027(b) | | 410,000 | | 430,642 |
Gas Utilities–0.08% | | | | |
AmeriGas Partners L.P./AmeriGas | | | | |
Finance Corp., | | | | |
5.63%, 05/20/2024 | | 298,000 | | 310,572 |
5.88%, 08/20/2026 | | 464,000 | | 482,268 |
Suburban Propane Partners | | | | |
L.P./Suburban Energy Finance | | | | |
Corp., 5.50%, 06/01/2024 | | 590,000 | | 585,286 |
Superior Plus L.P./Superior General | | | | |
Partner, Inc. (Canada), 7.00%, | | | | |
07/15/2026(b) | | 339,000 | | 363,695 |
| | | | 1,741,821 |
Health Care Equipment–0.00% | | | | |
Teleflex, Inc., 4.88%, 06/01/2026 | | 50,000 | | 52,267 |
Health Care Facilities–0.83% | | | | |
Acadia Healthcare Co., Inc., 6.50%, | | | | |
03/01/2024 | | 164,000 | | 168,783 |
HCA Healthcare, Inc., 6.25%, | | | | |
02/15/2021 | | 621,000 | | 645,483 |
HCA, Inc., | | | | |
5.00%, 03/15/2024 | | 9,500,000 | | 10,565,418 |
5.38%, 02/01/2025 | | 242,000 | | 268,036 |
5.25%, 04/15/2025 | | 151,000 | | 171,682 |
5.88%, 02/15/2026 | | 166,000 | | 187,701 |
5.38%, 09/01/2026 | | 111,000 | | 123,743 |
5.50%, 06/15/2047 | | 5,161,000 | | 6,143,779 |
| | | | 18,274,625 |
Health Care REITs–0.54% | | | | |
Diversified Healthcare Trust, 6.75%, | | | | |
12/15/2021 | | 2,606,000 | | 2,770,726 |
Healthpeak Properties, Inc., 4.25%, | | | | |
11/15/2023 | | 983,000 | | 1,070,504 |
MPT Operating Partnership L.P./MPT | | | | |
Finance Corp., | | | | |
5.00%, 10/15/2027 | | 605,000 | | 632,851 |
4.63%, 08/01/2029 | | 2,463,000 | | 2,592,320 |
Physicians Realty L.P., 4.30%, | | | | |
03/15/2027 | | 1,775,000 | | 1,980,806 |
Welltower, Inc., 3.10%, | | | | |
01/15/2030 | | 2,680,000 | | 2,864,642 |
| | | | 11,911,849 |
Health Care Services–1.16% | | | | |
AMN Healthcare, Inc., 5.13%, | | | | |
10/01/2024(b) | | 181,000 | | 186,053 |
| | Principal | | |
| | Amount | | Value |
Health Care Services–(continued) | | | |
Cigna Corp., | | | | |
4.50%, 03/15/2021(b) | $ | 1,860,000 | $ | 1,898,171 |
3.75%, 07/15/2023 | | 5,052,000 | | 5,381,620 |
2.72%, (3 mo. USD LIBOR + | | | | |
0.89%), 07/15/2023(c) | | 5,327,000 | | 5,394,803 |
4.38%, 10/15/2028 | | 1,938,000 | | 2,206,069 |
4.80%, 08/15/2038 | | 5,467,000 | | 6,586,594 |
CVS Health Corp., 2.63%, | | | | |
08/15/2024 | | 3,015,000 | | 3,116,163 |
Envision Healthcare Corp., 8.75%, | | | | |
10/15/2026(b) | | 145,000 | | 77,162 |
Hadrian Merger Sub, Inc., 8.50%, | | | | |
05/01/2026(b) | | 371,000 | | 380,404 |
MPH Acquisition Holdings LLC, | | | | |
7.13%, 06/01/2024(b) | | 281,000 | | 262,091 |
Team Health Holdings, Inc., 6.38%, | | | | |
02/01/2025(b) | | 172,000 | | 95,101 |
| | | | 25,584,231 |
Home Improvement Retail–0.35% | | | |
Hillman Group, Inc. (The), 6.38%, | | | | |
07/15/2022(b) | | 131,000 | | 117,859 |
Lowe's Cos., Inc., 3.65%, | | | | |
04/05/2029 | | 6,778,000 | | 7,520,159 |
| | | | 7,638,018 |
Homebuilding–1.22% | | | | |
Ashton Woods USA LLC/Ashton Woods | | | | |
Finance Co., 9.88%, | | | | |
04/01/2027(b) | | 251,000 | | 284,972 |
Beazer Homes USA, Inc., 5.88%, | | | | |
10/15/2027 | | 41,000 | | 41,616 |
KB Home, 4.80%, 11/15/2029 | | 456,000 | | 479,940 |
Lennar Corp., | | | | |
8.38%, 01/15/2021 | | 36,000 | | 37,645 |
5.38%, 10/01/2022 | | 324,000 | | 344,351 |
4.75%, 11/15/2022 | | 172,000 | | 180,294 |
5.25%, 06/01/2026 | | 636,000 | | 702,683 |
M.D.C. Holdings, Inc., | | | | |
3.85%, 01/15/2030 | | 8,643,000 | | 8,659,206 |
6.00%, 01/15/2043 | | 12,008,000 | | 13,277,546 |
Mattamy Group Corp. (Canada), | | | | |
5.25%, 12/15/2027(b) | | 174,000 | | 180,525 |
4.63%, 03/01/2030(b) | | 1,700,000 | | 1,652,477 |
Meritage Homes Corp., 5.13%, | | | | |
06/06/2027 | | 322,000 | | 359,142 |
PulteGroup, Inc., 6.38%, | | | | |
05/15/2033 | | 15,000 | | 18,429 |
Taylor Morrison Communities, Inc., | | | | |
6.63%, 07/15/2027(b) | | 352,000 | | 382,578 |
5.75%, 01/15/2028(b) | | 226,000 | | 250,346 |
Taylor Morrison Communities, | | | | |
Inc./Taylor Morrison Holdings II, | | | | |
Inc., 5.88%, 04/15/2023(b) | | 57,000 | | 61,156 |
| | | | 26,912,906 |
Hotel & Resort REITs–0.09% | | | | |
Service Properties Trust, | | | | |
4.95%, 02/15/2027 | | 1,665,000 | | 1,768,722 |
4.95%, 10/01/2029 | | 249,000 | | 262,938 |
| | | | 2,031,660 |
See accompanying Notes to Financial Statements which are an integral part of the financial statements.
14 | Invesco Corporate Bond Fund |
| Principal | | |
| Amount | | Value |
Hotels, Resorts & Cruise Lines–0.20% | | |
Royal Caribbean Cruises Ltd., | | | |
3.70%, 03/15/2028 | $ 4,310,000 | $ | 4,428,559 |
Household Products–0.06% | | | |
Reynolds Group Issuer, Inc./LLC, | | | |
5.13%, 07/15/2023(b) | 90,000 | | 91,088 |
7.00%, 07/15/2024(b) | 732,000 | | 740,239 |
Spectrum Brands, Inc., | | | |
5.75%, 07/15/2025 | 331,000 | | 340,099 |
5.00%, 10/01/2029(b) | 108,000 | | 111,831 |
| | | 1,283,257 |
Independent Power Producers & Energy Traders–0.08% |
AES Corp. (The), 5.50%, | | | |
04/15/2025 | 733,000 | | 751,626 |
Calpine Corp., 5.50%, 02/01/2024 | 248,000 | | 244,283 |
Enviva Partners L.P./Enviva Partners | | | |
Finance Corp., 6.50%, | | | |
01/15/2026(b) | 210,000 | | 218,929 |
NRG Energy, Inc., 6.63%, | | | |
01/15/2027 | 622,000 | | 649,660 |
| | | 1,864,498 |
Industrial Conglomerates–0.78% | | | |
GE Capital International Funding Co. | | | |
Unlimited Co., 4.42%, | | | |
11/15/2035 | 5,911,000 | | 6,758,387 |
General Electric Co., 5.55%, | | | |
01/05/2026 | 9,094,000 | | 10,610,607 |
| | | 17,368,994 |
Industrial Machinery–0.25% | | | |
Cleaver-Brooks, Inc., 7.88%, | | | |
03/01/2023(b) | 576,000 | | 569,039 |
EnPro Industries, Inc., 5.75%, | | | |
10/15/2026 | 489,000 | | 520,955 |
Mueller Industries, Inc., 6.00%, | | | |
03/01/2027 | 492,000 | | 498,321 |
Parker-Hannifin Corp., 3.25%, | | | |
06/14/2029 | 3,633,000 | | 3,924,912 |
| | | 5,513,227 |
Industrial REITs–0.16% | | | |
Cibanco S.A. Ibm/PLA Administradora | | | |
Industrial S de RL de C.V. (Mexico), | | | |
4.96%, 07/18/2029(b) | 1,844,000 | | 1,993,825 |
Prologis L.P., | | | |
2.13%, 04/15/2027 | 640,000 | | 648,302 |
3.00%, 04/15/2050 | 796,000 | | 812,089 |
| | | 3,454,216 |
Integrated Oil & Gas–1.35% | | | |
Occidental Petroleum Corp., 2.90%, | | | |
08/15/2024 | 12,219,000 | | 12,392,252 |
Petrobras Global Finance B.V. | | | |
(Brazil), 5.75%, 02/01/2029 | 353,000 | | 398,625 |
Petroleos Mexicanos (Mexico), | | | |
6.88%, 08/04/2026 | 110,000 | | 120,092 |
5.95%, 01/28/2031(b) | 115,000 | | 112,700 |
6.95%, 01/28/2060(b) | 1,670,000 | | 1,609,463 |
| Principal | | |
| Amount | | Value |
Integrated Oil & Gas–(continued) | | | |
Saudi Arabian Oil Co. (Saudi Arabia), | | | |
2.88%, 04/16/2024(b) | $10,449,000 | $ | 10,739,740 |
4.25%, 04/16/2039(b) | 1,687,000 | | 1,873,649 |
4.38%, 04/16/2049(b) | 2,407,000 | | 2,730,202 |
| | | 29,976,723 |
Integrated Telecommunication Services–1.97% | | |
Altice France S.A. (France), 7.38%, | | | |
05/01/2026(b) | 400,000 | | 420,220 |
AT&T, Inc., | | | |
3.07%, (3 mo. USD LIBOR + | | | |
1.18%), 06/12/2024(c) | 2,832,000 | | 2,867,127 |
5.25%, 03/01/2037 | 2,660,000 | | 3,282,854 |
5.15%, 03/15/2042 | 3,670,000 | | 4,486,584 |
5.35%, 12/15/2043 | 3,360,000 | | 4,174,534 |
4.75%, 05/15/2046 | 2,895,000 | | 3,418,703 |
5.15%, 02/15/2050 | 8,382,000 | | 10,518,335 |
5.70%, 03/01/2057 | 2,735,000 | | 3,782,862 |
Cincinnati Bell, Inc., | | | |
7.00%, 07/15/2024(b) | 202,000 | | 212,855 |
8.00%, 10/15/2025(b) | 43,000 | | 46,324 |
CommScope, Inc., 6.00%, | | | |
03/01/2026(b) | 413,000 | | 424,690 |
Embarq Corp., 8.00%, 06/01/2036 | 425,000 | | 453,379 |
Frontier Communications Corp., | | | |
10.50%, 09/15/2022 | 146,000 | | 66,658 |
11.00%, 09/15/2025 | 159,000 | | 73,140 |
Telecom Italia Capital S.A. (Italy), | | | |
6.38%, 11/15/2033 | 46,000 | | 53,407 |
7.20%, 07/18/2036 | 589,000 | | 730,861 |
Telefonica Emisiones S.A. (Spain), | | | |
7.05%, 06/20/2036 | 2,865,000 | | 4,137,943 |
T-Mobile USA, Inc., 6.50%, | | | |
01/15/2026 | 1,352,000 | | 1,425,887 |
Verizon Communications, Inc., | | | |
4.81%, 03/15/2039 | 2,267,000 | | 2,909,817 |
Virgin Media Finance PLC (United | | | |
Kingdom), 6.00%, | | | |
10/15/2024(b) | 200,000 | | 204,977 |
| | | 43,691,157 |
Interactive Media & Services–1.21% | | |
Cable Onda S.A. (Panama), 4.50%, | | | |
01/30/2030(b) | 200,000 | | 203,870 |
Cumulus Media New Holdings, Inc., | | | |
6.75%, 07/01/2026(b) | 247,000 | | 256,960 |
Diamond Sports Group LLC/Diamond | | | |
Sports Finance Co., | | | |
5.38%, 08/15/2026(b) | 4,738,000 | | 4,377,410 |
6.63%, 08/15/2027(b) | 339,000 | | 275,217 |
Match Group, Inc., 5.63%, | | | |
02/15/2029(b) | 5,513,000 | | 5,838,805 |
Tencent Holdings Ltd. (China), | | | |
2.99%, 01/19/2023(b) | 2,073,000 | | 2,143,964 |
3.60%, 01/19/2028(b) | 4,305,000 | | 4,649,590 |
3.93%, 01/19/2038(b) | 3,137,000 | | 3,619,179 |
Twitter, Inc., 3.88%, | | | |
12/15/2027(b) | 5,404,000 | | 5,532,345 |
| | | 26,897,340 |
See accompanying Notes to Financial Statements which are an integral part of the financial statements.
15 | Invesco Corporate Bond Fund |
| Principal | | |
| Amount | | Value |
Internet & Direct Marketing Retail–0.88% | | |
Alibaba Group Holding Ltd. (China), | | | |
4.20%, 12/06/2047 | $ 2,190,000 | $ | 2,653,157 |
4.40%, 12/06/2057 | 2,190,000 | | 2,792,528 |
QVC, Inc., | | | |
4.75%, 02/15/2027 | 1,869,000 | | 1,841,822 |
5.45%, 08/15/2034 | 12,014,000 | | 12,115,588 |
| | | 19,403,095 |
Investment Banking & Brokerage–1.77% | | |
Cantor Fitzgerald L.P., 6.50%, | | | |
06/17/2022(b) | 3,205,000 | | 3,513,029 |
Charles Schwab Corp. (The), Series E, | | | |
4.63%(d) | 4,560,000 | | 4,624,114 |
Goldman Sachs Group, Inc. (The), | | | |
6.75%, 10/01/2037 | 4,675,000 | | 6,705,332 |
4.80%, 07/08/2044 | 4,280,000 | | 5,480,797 |
Series P, 5.00%(d) | 3,255,000 | | 3,200,511 |
Jefferies Group LLC/Jefferies Group | | | |
Capital Finance, Inc., 4.15%, | | | |
01/23/2030 | 3,874,000 | | 4,203,119 |
Morgan Stanley, | | | |
4.35%, 09/08/2026 | 350,000 | | 392,097 |
2.70%, 01/22/2031(c) | 10,493,000 | | 10,836,376 |
Raymond James Financial, Inc., | | | |
4.95%, 07/15/2046 | 228,000 | | 292,488 |
| | | 39,247,863 |
IT Consulting & Other Services–0.07% | | |
DXC Technology Co., 4.45%, | | | |
09/18/2022 | 1,460,000 | | 1,546,519 |
Leisure Facilities–0.03% | | | |
Cedar Fair L.P./Canada's Wonderland | | | |
Co./Magnum Management Corp., | | | |
5.38%, 06/01/2024 | 247,000 | | 252,042 |
Six Flags Entertainment Corp., | | | |
4.88%, 07/31/2024(b) | 352,000 | | 348,158 |
| | | 600,200 |
Life & Health Insurance–2.52% | | | |
American Equity Investment Life | | | |
Holding Co., 5.00%, | | | |
06/15/2027 | 3,375,000 | | 3,737,621 |
Athene Global Funding, 2.50%, | | | |
01/14/2025(b) | 3,440,000 | | 3,532,004 |
Athene Holding Ltd., 4.13%, | | | |
01/12/2028 | 7,130,000 | | 7,595,838 |
Brighthouse Financial, Inc., 4.70%, | | | |
06/22/2047 | 6,627,000 | | 6,715,529 |
Dai-ichi Life Insurance Co. Ltd. (The) | | | |
(Japan), 4.00%(b)(d) | 3,060,000 | | 3,253,805 |
Global Atlantic Fin Co., 4.40%, | | | |
10/15/2029(b) | 10,195,000 | | 10,791,468 |
MetLife, Inc., | | | |
4.13%, 08/13/2042 | 2,400,000 | | 2,874,677 |
Series C, 5.25%(d) | 3,990,000 | | 3,964,564 |
Series D, 5.88%(d) | 300,000 | | 334,745 |
Nationwide Financial Services, Inc., | | | |
5.38%, 03/25/2021(b) | 6,660,000 | | 6,934,272 |
3.90%, 11/30/2049(b) | 3,344,000 | | 3,759,079 |
Prudential Financial, Inc., 3.91%, | | | |
12/07/2047 | 2,001,000 | | 2,268,728 |
| | | 55,762,330 |
| | Principal | | |
| | Amount | | Value |
Life Sciences Tools & Services–0.02% | | |
Charles River Laboratories | | | | |
International, Inc., 4.25%, | | | | |
05/01/2028(b) | $ | 383,000 | $ | 386,121 |
Managed Health Care–0.17% | | | | |
Centene Corp., | | | | |
5.25%, 04/01/2025(b) | | 340,000 | | 351,050 |
5.38%, 06/01/2026(b) | | 521,000 | | 549,317 |
5.38%, 08/15/2026(b) | | 155,000 | | 163,331 |
4.63%, 12/15/2029(b) | | 221,000 | | 236,879 |
UnitedHealth Group, Inc., 3.75%, | | | | |
07/15/2025 | | 2,134,000 | | 2,366,243 |
| | | | 3,666,820 |
Marine Ports & Services–0.05% | | | | |
Adani Abbot Point Terminal Pty. Ltd. | | | | |
(Australia), 4.45%, | | | | |
12/15/2022(b) | | 1,004,000 | | 1,024,117 |
Metal & Glass Containers–0.25% | | | | |
Ardagh Packaging Finance | | | | |
PLC/Ardagh Holdings USA, Inc., | | | | |
6.00%, 02/15/2025(b) | | 200,000 | | 209,000 |
Ball Corp., 5.25%, 07/01/2025 | | 359,000 | | 397,742 |
Berry Global, Inc., | | | | |
5.50%, 05/15/2022 | | 144,000 | | 145,079 |
6.00%, 10/15/2022 | | 58,000 | | 59,088 |
Flex Acquisition Co., Inc., | | | | |
6.88%, 01/15/2025(b) | | 195,000 | | 190,127 |
7.88%, 07/15/2026(b) | | 252,000 | | 256,365 |
OI European Group B.V., 4.00%, | | | | |
03/15/2023(b) | | 73,000 | | 74,034 |
Silgan Holdings, Inc., 4.13%, | | | | |
02/01/2028(b) | | 4,279,000 | | 4,300,395 |
| | | | 5,631,830 |
Movies & Entertainment–0.17% | | | | |
AMC Entertainment Holdings, Inc., | | | | |
5.75%, 06/15/2025 | | 268,000 | | 215,851 |
6.13%, 05/15/2027 | | 285,000 | | 228,720 |
Netflix, Inc., | | | | |
5.88%, 11/15/2028 | | 1,110,000 | | 1,250,027 |
5.38%, 11/15/2029(b) | | 1,927,000 | | 2,098,599 |
| | | | 3,793,197 |
Multi-line Insurance–0.73% | | | | |
American International Group, Inc., | | | | |
4.50%, 07/16/2044 | | 2,260,000 | | 2,776,108 |
Fairfax Financial Holdings Ltd. | | | | |
(Canada), 4.85%, 04/17/2028 | | 3,010,000 | | 3,382,186 |
Guardian Life Insurance Co. of | | | | |
America (The), 3.70%, | | | | |
01/22/2070(b) | | 3,061,000 | | 3,466,516 |
Nationwide Mutual Insurance Co., | | | | |
4.95%, 04/22/2044(b) | | 3,210,000 | | 4,210,674 |
XLIT Ltd. (Bermuda), 5.50%, | | | | |
03/31/2045 | | 1,670,000 | | 2,392,361 |
| | | | 16,227,845 |
See accompanying Notes to Financial Statements which are an integral part of the financial statements.
16 | Invesco Corporate Bond Fund |
| | Principal | | |
| | Amount | | Value |
Multi-Utilities–0.41% | | | | |
CenterPoint Energy, Inc., | | | | |
2.50%, 09/01/2024 | $ | 3,210,000 | $ | 3,316,744 |
Series A, 6.13%(d) | | 5,595,000 | | 5,772,949 |
| | | | 9,089,693 |
Office REITs–0.39% | | | | |
Alexandria Real Estate Equities, Inc., | | | | |
3.95%, 01/15/2027 | | 2,940,000 | | 3,262,843 |
3.38%, 08/15/2031 | | 1,848,000 | | 2,052,299 |
4.00%, 02/01/2050 | | 2,811,000 | | 3,400,817 |
| | | | 8,715,959 |
Office Services & Supplies–0.05% | | | |
Pitney Bowes, Inc., 5.20%, | | | | |
04/01/2023 | | 1,079,000 | | 1,082,145 |
Oil & Gas Drilling–0.02% | | | | |
Ensign Drilling, Inc. (Canada), 9.25%, | | | | |
04/15/2024(b) | | 223,000 | | 200,981 |
Precision Drilling Corp. (Canada), | | | | |
5.25%, 11/15/2024 | | 207,000 | | 183,670 |
Transocean, Inc., 8.00%, | | | | |
02/01/2027(b) | | 81,000 | | 67,939 |
| | | | 452,590 |
Oil & Gas Equipment & Services–0.17% | | |
Baker Hughes, a GE Co. LLC/Baker | | | | |
Hughes Co-Obligor, Inc., 3.34%, | | | | |
12/15/2027 | | 3,477,000 | | 3,660,474 |
Hilcorp Energy I L.P./Hilcorp Finance | | | | |
Co., 6.25%, 11/01/2028(b) | | 256,000 | | 186,974 |
| | | | 3,847,448 |
Oil & Gas Exploration & Production–1.95% | | |
Antero Resources Corp., 5.63%, | | | | |
06/01/2023 | | 285,000 | | 154,612 |
Ascent Resources Utica | | | | |
Holdings LLC/ARU Finance Corp., | | | | |
10.00%, 04/01/2022(b) | | 177,000 | | 151,284 |
Callon Petroleum Co., | | | | |
6.13%, 10/01/2024 | | 231,000 | | 183,645 |
6.38%, 07/01/2026 | | 92,000 | | 71,792 |
Cameron LNG LLC, | | | | |
3.30%, 01/15/2035(b) | | 4,239,000 | | 4,567,430 |
3.40%, 01/15/2038(b) | | 4,567,000 | | 5,025,679 |
Concho Resources, Inc., 4.38%, | | | | |
01/15/2025 | | 6,682,000 | | 6,899,574 |
Continental Resources, Inc., 5.00%, | | | | |
09/15/2022 | | 24,378,000 | | 24,350,694 |
Genesis Energy L.P./Genesis Energy | | | | |
Finance Corp., | | | | |
6.25%, 05/15/2026 | | 255,000 | | 213,651 |
7.75%, 02/01/2028 | | 304,000 | | 265,620 |
Gulfport Energy Corp., | | | | |
6.63%, 05/01/2023 | | 423,000 | | 222,206 |
6.00%, 10/15/2024 | | 236,000 | | 79,060 |
QEP Resources, Inc., 5.63%, | | | | |
03/01/2026 | | 480,000 | | 385,212 |
Southwestern Energy Co., | | | | |
7.50%, 04/01/2026 | | 190,000 | | 145,355 |
7.75%, 10/01/2027 | | 434,000 | | 329,851 |
| | Principal | | |
| | Amount | | Value |
Oil & Gas Exploration & Production–(continued) | | |
Whiting Petroleum Corp., | | | | |
Conv., 1.25%, 04/01/2020 | $ | 39,000 | $ | 35,198 |
5.75%, 03/15/2021 | | 241,000 | | 139,117 |
6.63%, 01/15/2026 | | 172,000 | | 63,214 |
| | | | 43,283,194 |
Oil & Gas Refining & Marketing–0.28% | | |
Calumet Specialty Products Partners | | | | |
L.P./Calumet Finance Corp., | | | | |
7.63%, 01/15/2022 | | 347,000 | | 344,185 |
EnLink Midstream Partners L.P., | | | | |
4.85%, 07/15/2026 | | 371,000 | | 318,531 |
5.60%, 04/01/2044 | | 327,000 | | 252,606 |
NuStar Logistics L.P., 6.00%, | | | | |
06/01/2026 | | 556,000 | | 582,118 |
Parkland Fuel Corp. (Canada), | | | | |
6.00%, 04/01/2026(b) | | 406,000 | | 425,021 |
5.88%, 07/15/2027(b) | | 3,025,000 | | 3,113,723 |
PBF Holding Co. LLC/PBF Finance | | | | |
Corp., 6.00%, 02/15/2028(b) | | 317,000 | | 313,830 |
Sunoco L.P./Sunoco Finance Corp., | | | | |
5.88%, 03/15/2028 | | 723,000 | | 741,326 |
| | | | 6,091,340 |
Oil & Gas Storage & Transportation–9.07% | | |
Antero Midstream Partners | | | | |
L.P./Antero Midstream Finance | | | | |
Corp., 5.38%, 09/15/2024 | | 410,000 | | 310,575 |
Cheniere Energy Partners L.P., | | | | |
5.63%, 10/01/2026 | | 236,000 | | 237,622 |
Crestwood Midstream Partners | | | | |
L.P./Crestwood Midstream Finance | | | | |
Corp., 5.75%, 04/01/2025 | | 241,000 | | 236,178 |
DCP Midstream Operating L.P., | | | | |
5.13%, 05/15/2029 | | 394,000 | | 387,834 |
Energy Transfer Operating L.P., | | | | |
5.88%, 01/15/2024 | | 508,000 | | 569,803 |
2.90%, 05/15/2025 | | 4,349,000 | | 4,441,503 |
3.75%, 05/15/2030 | | 7,127,000 | | 7,237,755 |
4.90%, 03/15/2035 | | 8,695,000 | | 9,386,911 |
5.00%, 05/15/2050 | | 7,841,000 | | 7,979,016 |
Series A, 6.25%(d) | | 515,000 | | 460,026 |
Enterprise Products Operating LLC, | | | | |
3.13%, 07/31/2029 | | 3,900,000 | | 4,085,990 |
2.80%, 01/31/2030 | | 7,601,000 | | 7,779,412 |
4.80%, 02/01/2049 | | 2,369,000 | | 2,767,199 |
4.20%, 01/31/2050 | | 2,786,000 | | 2,970,672 |
3.70%, 01/31/2051 | | 15,335,000 | | 15,354,783 |
3.95%, 01/31/2060 | | 7,233,000 | | 7,116,362 |
Series D, | | | | |
6.88%, 03/01/2033 | | 2,660,000 | | 3,771,447 |
4.88%, 08/16/2077(c) | | 11,201,000 | | 10,996,526 |
Hess Midstream Operations L.P., | | | | |
5.63%, 02/15/2026(b) | | 389,000 | | 388,939 |
Holly Energy Partners L.P./Holly | | | | |
Energy Finance Corp., 5.00%, | | | | |
02/01/2028(b) | | 95,000 | | 95,772 |
Kinder Morgan Energy Partners L.P., | | | | |
4.30%, 05/01/2024 | | 2,383,000 | | 2,586,281 |
Kinder Morgan, Inc., | | | | |
7.80%, 08/01/2031 | | 9,500,000 | | 13,357,533 |
7.75%, 01/15/2032 | | 7,672,000 | | 11,185,202 |
See accompanying Notes to Financial Statements which are an integral part of the financial statements.
17 | Invesco Corporate Bond Fund |
| Principal | | |
| Amount | | Value |
Oil & Gas Storage & Transportation–(continued) | | |
MPLX L.P., | | | |
2.79%, (3 mo. USD LIBOR + | | | |
0.90%), 09/09/2021(c) | $ 7,864,000 | $ | 7,887,362 |
2.99%, (3 mo. USD LIBOR + | | | |
1.10%), 09/09/2022(c) | 5,688,000 | | 5,709,405 |
4.80%, 02/15/2029 | 2,355,000 | | 2,640,560 |
4.70%, 04/15/2048 | 2,781,000 | | 2,903,754 |
5.50%, 02/15/2049 | 3,731,000 | | 4,197,431 |
NGL Energy Partners L.P./NGL Energy | | | |
Finance Corp., 7.50%, | | | |
04/15/2026 | 357,000 | | 304,297 |
NGPL PipeCo. LLC, 7.77%, | | | |
12/15/2037(b) | 7,250,000 | | 9,408,624 |
Plains All American Pipeline L.P., | | | |
Series B, 6.13%(d) | 6,150,000 | | 5,447,393 |
Plains All American Pipeline L.P./PAA | | | |
Finance Corp., 3.55%, | | | |
12/15/2029 | 13,704,000 | | 13,509,292 |
Sabine Pass Liquefaction LLC, | | | |
5.75%, 05/15/2024 | 10,100,000 | | 11,365,742 |
Targa Resources Partners L.P./Targa | | | |
Resources Partners Finance Corp., | | | |
5.25%, 05/01/2023 | 2,445,000 | | 2,444,230 |
5.13%, 02/01/2025 | 439,000 | | 441,748 |
5.88%, 04/15/2026 | 677,000 | | 698,646 |
5.00%, 01/15/2028 | 201,000 | | 198,894 |
5.50%, 03/01/2030(b) | 63,000 | | 62,430 |
Western Midstream Operating L.P., | | | |
4.00%, 07/01/2022 | 2,910,000 | | 2,981,394 |
2.70%, (3 mo. USD LIBOR + | | | |
0.85%), 01/13/2023(c) | 3,960,000 | | 3,946,179 |
3.10%, 02/01/2025 | 2,149,000 | | 2,149,991 |
Williams Cos., Inc. (The), | | | |
4.13%, 11/15/2020 | 6,204,000 | | 6,267,995 |
7.88%, 09/01/2021 | 140,000 | | 153,267 |
3.60%, 03/15/2022 | 3,670,000 | | 3,788,301 |
4.55%, 06/24/2024 | 399,000 | | 437,412 |
3.75%, 06/15/2027 | 250,000 | | 262,421 |
| | | 200,910,109 |
Other Diversified Financial Services–0.76% | | |
Carlyle Finance LLC, 5.65%, | | | |
09/15/2048(b) | 11,281,000 | | 14,757,548 |
eG Global Finance PLC (Netherlands), | | | |
6.75%, 02/07/2025(b) | 259,000 | | 253,712 |
Football Trust V, 5.35%, | | | |
10/05/2020(b) | 450,270 | | 460,128 |
ILFC E-Capital Trust II, 4.15%, | | | |
12/21/2065(b)(c) | 620,000 | | 507,430 |
Lions Gate Capital Holdings LLC, | | | |
6.38%, 02/01/2024(b) | 242,000 | | 237,763 |
LPL Holdings, Inc., 5.75%, | | | |
09/15/2025(b) | 241,000 | | 250,638 |
Tempo Acquisition LLC/Tempo | | | |
Acquisition Finance Corp., 6.75%, | | | |
06/01/2025(b) | 378,000 | | 377,172 |
| | | 16,844,391 |
Packaged Foods & Meats–0.40% | | | |
B&G Foods, Inc., | | | |
5.25%, 04/01/2025 | 237,000 | | 234,529 |
5.25%, 09/15/2027 | 96,000 | | 95,160 |
| Principal | | |
| Amount | | Value |
Packaged Foods & Meats–(continued) | | |
Conagra Brands, Inc., 5.30%, | | | |
11/01/2038 | $ 300,000 | $ | 364,520 |
Hershey Co. (The), 3.13%, | | | |
11/15/2049 | 2,833,000 | | 3,059,504 |
JBS USA LUX S.A./JBS USA Food | | | |
Co./JBS USA Finance, Inc., | | | |
5.50%, 01/15/2030(b) | 217,000 | | 229,404 |
Kraft Heinz Foods Co., | | | |
6.88%, 01/26/2039 | 249,000 | | 297,925 |
5.00%, 06/04/2042 | 235,000 | | 236,345 |
Lamb Weston Holdings, Inc., 4.63%, | | | |
11/01/2024(b) | 186,000 | | 193,982 |
Mars, Inc., 2.70%, 04/01/2025(b) | 3,334,000 | | 3,525,695 |
Pilgrim's Pride Corp., 5.88%, | | | |
09/30/2027(b) | 398,000 | | 413,184 |
TreeHouse Foods, Inc., 6.00%, | | | |
02/15/2024(b) | 223,000 | | 230,713 |
| | | 8,880,961 |
Paper Packaging–0.13% | | | |
Cascades, Inc./Cascades USA, Inc. | | | |
(Canada), 5.38%, 01/15/2028(b) | 2,547,000 | | 2,629,778 |
Trivium Packaging Finance B.V. | | | |
(Netherlands), 5.50%, | | | |
08/15/2026(b) | 200,000 | | 207,625 |
| | | 2,837,403 |
Paper Products–0.16% | | | |
Mercer International, Inc. (Germany), | | | |
6.50%, 02/01/2024 | 157,000 | | 161,186 |
5.50%, 01/15/2026 | 88,000 | | 83,224 |
Schweitzer-Mauduit International, | | | |
Inc., 6.88%, 10/01/2026(b) | 485,000 | | 521,544 |
Suzano Austria GmbH (Brazil), | | | |
6.00%, 01/15/2029 | 2,408,000 | | 2,701,902 |
| | | 3,467,856 |
Pharmaceuticals–1.74% | | | |
Bausch Health Cos., Inc., | | | |
6.13%, 04/15/2025(b) | 188,000 | | 192,152 |
5.50%, 11/01/2025(b) | 177,000 | | 182,605 |
9.00%, 12/15/2025(b) | 202,000 | | 225,424 |
Bayer US Finance II LLC (Germany), | | | |
2.58%, (3 mo. USD LIBOR + | | | |
0.63%), 06/25/2021(b)(c) | 2,759,000 | | 2,765,310 |
2.90%, (3 mo. USD LIBOR + | | | |
1.01%), 12/15/2023(b)(c) | 5,955,000 | | 5,972,082 |
3.88%, 12/15/2023(b) | 1,964,000 | | 2,109,611 |
Bristol-Myers Squibb Co., | | | |
2.90%, 07/26/2024(b) | 8,373,000 | | 8,828,239 |
3.20%, 06/15/2026(b) | 3,106,000 | | 3,392,924 |
3.40%, 07/26/2029(b) | 300,000 | | 336,331 |
4.25%, 10/26/2049(b) | 3,196,000 | | 4,117,234 |
Endo Dac/Endo Finance LLC/Endo | | | |
Finco, Inc., 6.00%, | | | |
07/15/2023(b) | 200,000 | | 157,502 |
GlaxoSmithKline Capital PLC (United | | | |
Kingdom), 2.88%, 06/01/2022 | 4,053,000 | | 4,173,313 |
HLF Financing S.a.r.l. LLC/Herbalife | | | |
International, Inc., 7.25%, | | | |
08/15/2026(b) | 245,000 | | 247,756 |
Par Pharmaceutical, Inc., 7.50%, | | | |
04/01/2027(b) | 205,000 | | 216,998 |
See accompanying Notes to Financial Statements which are an integral part of the financial statements.
18 | Invesco Corporate Bond Fund |
| Principal | | |
| Amount | | Value |
Pharmaceuticals–(continued) | | | |
Pfizer, Inc., 2.95%, 03/15/2024 | $ 5,274,000 | $ | 5,599,506 |
| | | 38,516,987 |
Property & Casualty Insurance–0.09% | | |
Allstate Corp. (The), 4.20%, | | | |
12/15/2046 | 1,505,000 | | 1,932,153 |
AmWINS Group, Inc., 7.75%, | | | |
07/01/2026(b) | 107,000 | | 111,385 |
| | | 2,043,538 |
Publishing–0.01% | | | |
Meredith Corp., 6.88%, | | | |
02/01/2026 | 322,000 | | 323,786 |
Railroads–1.93% | | | |
Canadian Pacific Railway Co. | | | |
(Canada), 6.13%, 09/15/2115 | 11,960,000 | | 19,428,475 |
CSX Corp., 4.65%, 03/01/2068 | 3,463,000 | | 4,251,152 |
Kenan Advantage Group, Inc. (The), | | | |
7.88%, 07/31/2023(b) | 408,000 | | 403,069 |
Norfolk Southern Corp., | | | |
2.55%, 11/01/2029 | 2,799,000 | | 2,913,525 |
3.40%, 11/01/2049 | 3,568,000 | | 3,791,931 |
Union Pacific Corp., | | | |
2.15%, 02/05/2027 | 3,779,000 | | 3,856,411 |
2.40%, 02/05/2030 | 4,719,000 | | 4,843,112 |
3.95%, 08/15/2059 | 2,888,000 | | 3,256,905 |
| | | 42,744,580 |
Regional Banks–1.69% | | | |
CIT Group, Inc., 5.00%, | | | |
08/01/2023 | 311,000 | | 332,641 |
Citizens Financial Group, Inc., | | | |
2.38%, 07/28/2021 | 5,719,000 | | 5,776,540 |
2.50%, 02/06/2030 | 3,653,000 | | 3,709,608 |
Series A, 5.50%(d) | 1,100,000 | | 1,094,726 |
Fifth Third Bancorp, | | | |
4.30%, 01/16/2024 | 2,730,000 | | 2,963,699 |
2.38%, 01/28/2025 | 7,685,000 | | 7,915,338 |
First Niagara Financial Group, Inc., | | | |
7.25%, 12/15/2021 | 1,300,000 | | 1,424,100 |
KeyCorp, 2.25%, 04/06/2027 | 5,309,000 | | 5,370,078 |
M&T Bank Corp., Series F, 5.13%(d) | 1,366,000 | | 1,466,176 |
Synovus Financial Corp., 3.13%, | | | |
11/01/2022 | 2,457,000 | | 2,522,491 |
Zions Bancorporation N.A., 3.25%, | | | |
10/29/2029 | 4,640,000 | | 4,866,777 |
| | | 37,442,174 |
Research & Consulting Services–0.00% | | |
Dun & Bradstreet Corp. (The), | | | |
10.25%, 02/15/2027(b) | 57,000 | | 64,088 |
Residential REITs–0.52% | | | |
Essex Portfolio L.P., 3.63%, | | | |
08/15/2022 | 3,600,000 | | 3,766,758 |
Spirit Realty L.P., | | | |
4.00%, 07/15/2029 | 1,790,000 | | 2,004,827 |
3.40%, 01/15/2030 | 5,305,000 | | 5,666,617 |
| | | 11,438,202 |
| | Principal | | |
| | Amount | | Value |
Restaurants–0.38% | | | | |
1011778 BC ULC/New Red Finance, | | | | |
Inc. (Canada), 5.00%, | | | | |
10/15/2025(b) | $ | 489,000 | $ | 492,259 |
Aramark Services, Inc., 5.00%, | | | | |
04/01/2025(b) | | 215,000 | | 222,523 |
IRB Holding Corp., 6.75%, | | | | |
02/15/2026(b) | | 239,000 | | 237,888 |
Starbucks Corp., 4.45%, | | | | |
08/15/2049 | | 6,077,000 | | 7,349,868 |
| | | | 8,302,538 |
Retail REITs–0.12% | | | | |
Regency Centers L.P., 4.13%, | | | | |
03/15/2028 | | 2,396,000 | | 2,716,172 |
Security & Alarm Services–0.02% | | | |
Brink's Co. (The), 4.63%, | | | | |
10/15/2027(b) | | 201,000 | | 206,492 |
Prime Security Services | | | | |
Borrower LLC/Prime Finance, Inc., | | | | |
5.75%, 04/15/2026(b) | | 240,000 | | 250,050 |
| | | | 456,542 |
Semiconductor Equipment–0.00% | | | |
Lam Research Corp., 3.75%, | | | | |
03/15/2026 | | 50,000 | | 55,190 |
Semiconductors–1.88% | | | | |
Analog Devices, Inc., 3.13%, | | | | |
12/05/2023 | | 2,420,000 | | 2,557,521 |
Broadcom Corp./Broadcom Cayman | | | | |
Finance Ltd., | | | | |
3.00%, 01/15/2022 | | 8,505,000 | | 8,674,678 |
3.88%, 01/15/2027 | | 5,965,000 | | 6,260,272 |
3.50%, 01/15/2028 | | 7,101,000 | | 7,338,559 |
Micron Technology, Inc., | | | | |
4.98%, 02/06/2026 | | 2,035,000 | | 2,276,187 |
4.19%, 02/15/2027 | | 6,500,000 | | 6,965,072 |
NXP B.V./NXP Funding LLC | | | | |
(Netherlands), 3.88%, | | | | |
09/01/2022(b) | | 7,160,000 | | 7,513,390 |
| | | | 41,585,679 |
Soft Drinks–0.32% | | | | |
Fomento Economico Mexicano S.A.B. | | | | |
de C.V. (Mexico), 3.50%, | | | | |
01/16/2050 | | 6,480,000 | | 6,879,507 |
Keurig Dr Pepper, Inc., 4.60%, | | | | |
05/25/2028 | | 250,000 | | 288,636 |
| | | | 7,168,143 |
Sovereign Debt–0.84% | | | | |
Banque Ouest Africaine de | | | | |
Developpement (Supranational), | | | | |
5.00%, 07/27/2027(b) | | 8,000,000 | | 8,691,920 |
Oman Government International Bond | | | | |
(Oman), 4.13%, 01/17/2023(b) | | 2,929,000 | | 2,957,576 |
Saudi Government International Bond | | | | |
(Saudi Arabia), 3.75%, | | | | |
01/21/2055(b) | | 6,865,000 | | 6,976,556 |
| | | | 18,626,052 |
See accompanying Notes to Financial Statements which are an integral part of the financial statements.
19 | Invesco Corporate Bond Fund |
| Principal | | |
| Amount | | Value |
Specialized Consumer Services–0.04% | | |
ServiceMaster Co. LLC (The), | | | |
5.13%, 11/15/2024(b) | $ 235,000 | $ | 242,834 |
7.45%, 08/15/2027 | 463,000 | | 531,453 |
| | | 774,287 |
Specialized Finance–0.27% | | | |
National Rural Utilities Cooperative | | | |
Finance Corp., 2.40%, | | | |
03/15/2030 | 5,840,000 | | 6,066,998 |
Specialized REITs–0.18% | | | |
Equinix, Inc., | | | |
5.88%, 01/15/2026 | 723,000 | | 765,462 |
3.20%, 11/18/2029 | 120,000 | | 125,818 |
GLP Capital L.P./GLP Financing II, | | | |
Inc., 5.38%, 04/15/2026 | 247,000 | | 279,266 |
Iron Mountain US Holdings, Inc., | | | |
5.38%, 06/01/2026(b) | 343,000 | | 355,982 |
Iron Mountain, Inc., | | | |
6.00%, 08/15/2023 | 182,000 | | 185,565 |
5.75%, 08/15/2024 | 84,000 | | 84,839 |
5.25%, 03/15/2028(b) | 456,000 | | 472,940 |
4.88%, 09/15/2029(b) | 991,000 | | 984,402 |
Rayonier A.M. Products, Inc., 5.50%, | | | |
06/01/2024(b) | 409,000 | | 235,091 |
SBA Communications Corp., 4.88%, | | | |
09/01/2024 | 507,000 | | 522,106 |
| | | 4,011,471 |
Specialty Chemicals–0.28% | | | |
Ashland LLC, 4.75%, 08/15/2022 | 20,000 | | 20,850 |
Braskem Idesa S.A.P.I. (Mexico), | | | |
7.45%, 11/15/2029(b) | 4,585,000 | | 4,592,978 |
Element Solutions, Inc., 5.88%, | | | |
12/01/2025(b) | 232,000 | | 233,742 |
GCP Applied Technologies, Inc., | | | |
5.50%, 04/15/2026(b) | 349,000 | | 363,954 |
PolyOne Corp., 5.25%, | | | |
03/15/2023 | 219,000 | | 233,780 |
PQ Corp., 6.75%, 11/15/2022(b) | 195,000 | | 199,630 |
Sherwin-Williams Co. (The), 2.95%, | | | |
08/15/2029 | 491,000 | | 517,758 |
| | | 6,162,692 |
Steel–1.12% | | | |
POSCO (South Korea), | | | |
2.38%, 01/17/2023(b) | 18,285,000 | | 18,585,775 |
2.50%, 01/17/2025(b) | 6,160,000 | | 6,245,869 |
| | | 24,831,644 |
Systems Software–0.12% | | | |
Camelot Finance S.A., 4.50%, | | | |
11/01/2026(b) | 107,000 | | 107,725 |
Microsoft Corp., 4.25%, | | | |
02/06/2047 | 1,868,000 | | 2,464,659 |
| | | 2,572,384 |
Technology Distributors–0.11% | | | |
Avnet, Inc., 4.63%, 04/15/2026 | 2,250,000 | | 2,458,227 |
CDW LLC/CDW Finance Corp., 5.00%, | | | |
09/01/2025 | 80,000 | | 82,591 |
| | | 2,540,818 |
| Principal | | |
| Amount | | Value |
Technology Hardware, Storage & Peripherals–0.97% | |
Apple, Inc., 2.05%, 09/11/2026 | $ 3,868,000 | $ | 3,969,667 |
Dell International LLC/EMC Corp., | | | |
7.13%, 06/15/2024(b) | 708,000 | | 741,630 |
4.00%, 07/15/2024(b) | 3,160,000 | | 3,387,022 |
6.02%, 06/15/2026(b) | 4,252,000 | | 4,983,104 |
4.90%, 10/01/2026(b) | 1,860,000 | | 2,087,870 |
8.10%, 07/15/2036(b) | 249,000 | | 342,242 |
8.35%, 07/15/2046(b) | 4,426,000 | | 6,021,170 |
| | | 21,532,705 |
Textiles–0.01% | | | |
Eagle Intermediate Global Holding | | | |
B.V./Ruyi US Finance LLC (China), | | | |
7.50%, 05/01/2025(b) | 214,000 | | 150,424 |
Thrifts & Mortgage Finance–0.00% | | |
Nationstar Mortgage Holdings, Inc., | | | |
6.00%, 01/15/2027(b) | 67,000 | | 68,190 |
Tobacco–1.33% | | | |
Altria Group, Inc., | | | |
3.80%, 02/14/2024 | 4,363,000 | | 4,687,734 |
4.40%, 02/14/2026 | 7,026,000 | | 7,874,519 |
4.80%, 02/14/2029 | 5,300,000 | | 6,067,549 |
6.20%, 02/14/2059 | 2,066,000 | | 2,709,932 |
BAT Capital Corp. (United Kingdom), | | | |
2.79%, 09/06/2024 | 4,677,000 | | 4,812,121 |
4.76%, 09/06/2049 | 2,996,000 | | 3,233,519 |
| | | 29,385,374 |
Trading Companies & Distributors–1.52% | | |
AerCap Global Aviation Trust | | | |
(Ireland), 6.50%, | | | |
06/15/2045(b)(c) | 11,026,000 | | 11,881,618 |
AerCap Ireland Capital DAC/AerCap | | | |
Global Aviation Trust (Ireland), | | | |
3.50%, 05/26/2022 | 1,798,000 | | 1,849,056 |
Air Lease Corp., | | | |
3.88%, 04/01/2021 | 3,660,000 | | 3,749,276 |
3.38%, 06/01/2021 | 3,865,000 | | 3,946,856 |
3.00%, 09/15/2023 | 1,965,000 | | 2,025,562 |
2.30%, 02/01/2025 | 300,000 | | 300,418 |
Aircastle Ltd., | | | |
7.63%, 04/15/2020 | 71,000 | | 71,451 |
5.00%, 04/01/2023 | 534,000 | | 581,555 |
4.40%, 09/25/2023 | 4,000,000 | | 4,265,077 |
BMC East LLC, 5.50%, | | | |
10/01/2024(b) | 370,000 | | 382,178 |
BOC Aviation Ltd. (Singapore), | | | |
3.07% (3 mo. USD LIBOR + | | | |
1.13%), 09/26/2023(b)(c) | 2,446,000 | | 2,459,123 |
Herc Holdings, Inc., 5.50%, | | | |
07/15/2027(b) | 245,000 | | 254,782 |
United Rentals North America, Inc., | | | |
5.50%, 07/15/2025 | 192,000 | | 198,320 |
5.88%, 09/15/2026 | 704,000 | | 742,702 |
6.50%, 12/15/2026 | 327,000 | | 349,285 |
5.50%, 05/15/2027 | 129,000 | | 135,131 |
5.25%, 01/15/2030 | 343,000 | | 361,470 |
| | | 33,553,860 |
See accompanying Notes to Financial Statements which are an integral part of the financial statements.
20 | Invesco Corporate Bond Fund |
| Principal | | |
| Amount | | Value |
Trucking–1.53% | | | |
Aviation Capital Group LLC, | | | |
2.44%, (3 mo. USD LIBOR + | | | |
0.67%), 07/30/2021(b)(c) | $ 1,914,000 | $ | 1,921,391 |
4.13%, 08/01/2025(b) | 5,593,000 | | 5,992,329 |
3.50%, 11/01/2027(b) | 15,922,000 | | 16,527,841 |
Avis Budget Car Rental LLC/Avis Budget | | | |
Finance, Inc., | | | |
5.25%, 03/15/2025(b) | 273,000 | | 275,953 |
5.75%, 07/15/2027(b) | 1,877,000 | | 1,881,739 |
DAE Funding LLC (United Arab | | | |
Emirates), 4.00%, | | | |
08/01/2020(b) | 2,872,000 | | 2,883,883 |
Penske Truck Leasing Co. L.P./PTL | | | |
Finance Corp., | | | |
3.90%, 02/01/2024(b) | 3,433,000 | | 3,699,335 |
3.40%, 11/15/2026(b) | 405,000 | | 428,384 |
Ryder System, Inc., 2.90%, | | | |
12/01/2026 | 303,000 | | 320,786 |
| | | 33,931,641 |
Wireless Telecommunication Services–2.25% | | |
Digicel Group One Ltd. (Jamaica), | | | |
8.25%, 12/30/2022(b) | 109,000 | | 70,339 |
Digicel Group Two Ltd. (Jamaica), | | | |
8.25%, 09/30/2022(b) | 104,000 | | 25,300 |
Intelsat Jackson Holdings S.A. | | | |
(Luxembourg), 8.50%, | | | |
10/15/2024(b) | 265,000 | | 232,428 |
Oztel Holdings SPC Ltd. (Oman), | | | |
5.63%, 10/24/2023(b) | 1,473,000 | | 1,550,221 |
Rogers Communications, Inc. (Canada), | | | |
4.50%, 03/15/2043 | 330,000 | | 392,274 |
5.00%, 03/15/2044 | 4,835,000 | | 6,248,544 |
4.35%, 05/01/2049 | 870,000 | | 1,039,564 |
Sprint Spectrum Co. LLC/Sprint Spectrum | | | |
Co. II LLC/Sprint Spectrum Co. III LLC, | | | |
Class A-1, 3.36%, | | | |
09/20/2021(b) | 8,225,438 | | 8,302,345 |
4.74%, 03/20/2025(b) | 11,472,000 | | 12,307,907 |
5.15%, 03/20/2028(b) | 11,487,000 | | 12,961,959 |
VEON Holdings B.V. (Netherlands), | | | |
4.00%, 04/09/2025(b) | 6,366,000 | | 6,541,065 |
Ypso Finance Bis S.A. (Luxembourg), | | | |
10.50%, 05/15/2027(b) | 210,000 | | 238,875 |
| | | 49,910,821 |
Total U.S. Dollar Denominated Bonds & Notes | | |
(Cost $1,808,670,406) | | | 1,937,711,759 |
U.S. Treasury Securities–4.84% | | |
U.S. Treasury Bills–0.22% | | | |
1.50% - 1.52%, | | | |
04/09/2020(e)(f) | 4,860,000 | | 4,852,005 |
U.S. Treasury Bonds–2.35% | | | |
2.38%, 11/15/2049 | 44,509,700 | | 51,971,160 |
U.S. Treasury Notes–2.27% | | | |
1.38%, 01/31/2025 | 24,923,000 | | 25,469,164 |
1.50%, 01/31/2027 | 7,947,800 | | 8,189,339 |
1.50%, 02/15/2030 | 16,068,000 | | 16,617,827 |
| | | 50,276,330 |
Total U.S. Treasury Securities | | | |
(Cost $102,288,623) | | | 107,099,495 |
| | | Shares | | Value |
| Preferred Stocks–1.63% | | | | |
Diversified Banks–1.00% | | | | |
Bank of America Corp., 7.25%, Series L, | | | |
| Conv. Pfd. | | 100 | $ | 150,000 |
Wells Fargo & Co., 7.50%, Class A, | | | | |
| Series L, Conv. Pfd. | | 14,554 | | 21,903,770 |
| | | | | 22,053,770 |
Investment Banking & Brokerage–0.52% | | |
Morgan Stanley, 7.13%, Series E, Pfd. | 265,000 | | 7,356,400 |
Morgan Stanley, 6.88%, Series F, Pfd. | 150,000 | | 4,135,500 |
| | | | | 11,491,900 |
Regional Banks–0.11% | | | | |
PNC Financial Services Group, Inc. (The), | | | |
| 6.13%, Series P, Pfd. | | 95,000 | | 2,526,050 |
| Total Preferred Stocks (Cost $31,500,112) | | 36,071,720 |
| | | Principal | | |
| | | Amount | | |
Asset-Backed Securities–1.28% | | |
Hertz Vehicle Financing II L.P., | | | | |
| Series 2016-2A, Class B, 3.94%, | | | | |
| 03/25/2022(b) | | $ 7,500,000 | | 7,649,156 |
Jimmy Johns Funding LLC, | | | | |
| Series 2017-1A, Class A2II, | | | | |
| 4.85%, 07/30/2047(b) | | 4,265,722 | | 4,658,998 |
Sonic Capital LLC, Series 2020-1A, | | | | |
| Class A2I, 3.85%, | | | | |
| 01/20/2050(b) | | 10,971,000 | | 11,383,123 |
Wendy's Funding LLC, | | | | |
| Series 2018-1A, Class A2II, | | | | |
| 3.88%, 03/15/2048(b) | | 4,459,000 | | 4,722,661 |
| Total Asset-Backed Securities | | | | |
| (Cost $27,493,625) | | | | 28,413,938 |
Variable Rate Senior Loan Interests–0.56%(g) | |
Diversified REITs–0.56% | | | | |
Asterix, Inc. (Canada), Term Loan, | | | | |
3.90%, 03/31/2023 | | | | |
| (Cost $12,427,138)(h) | | 16,616,326 | | 12,379,457 |
Non-U.S. Dollar Denominated Bonds & Notes–0.51%(i) |
Diversified Banks–0.01% | | | | |
Erste Group Bank AG (Austria), | | | | |
| 6.50%(b)(d) | EUR | 200,000 | | 250,343 |
Food Retail–0.01% | | | | |
Iceland Bondco PLC (United Kingdom), | | | |
| 4.63%, 03/15/2025(b) | GBP | 200,000 | | 201,818 |
Quatrim S.A.S.U. (France), 5.88%, | | | | |
| 01/15/2024(b) | EUR | 100,000 | | 111,361 |
| | | | | 313,179 |
Integrated Telecommunication Services–0.22% | | |
AT&T, Inc., Series B, 2.88%(c)(d) | EUR | 4,400,000 | | 4,777,234 |
Movies & Entertainment–0.14% | | | |
Netflix, Inc., 3.88%, 11/15/2029(b) EUR | 2,600,000 | | 3,018,448 |
Sovereign Debt–0.13% | | | | |
Ukraine Government International | | | | |
| Bond (Ukraine), 4.38%, | | | | |
| 01/27/2030(b) | EUR | 2,765,000 | | 2,890,332 |
| Total Non-U.S. Dollar Denominated Bonds & Notes | | |
| (Cost $11,380,106) | | | | 11,249,536 |
See accompanying Notes to Financial Statements which are an integral part of the financial statements.
21 | Invesco Corporate Bond Fund |
| | | Principal | | |
| | | Amount | | Value |
Municipal Obligations–0.25% | | | | |
Florida Development Finance Corp. (Palm | | | | |
Bay Academy, Inc.), | | | | |
Series 2017, Ref. RB, 9.00%, | | | | |
05/15/2024(b) | $ | 735,000 | $ | 749,200 |
Series 2017, Ref. RB, 0.00%, | | | | |
05/15/2037(b)(h)(j) | | 360,000 | | 3,600 |
Series 2017, Ref. RB, 0.00%, | | | | |
05/15/2037(b)(h)(j) | | 350,000 | | 230,730 |
Grand Parkway Transportation Corp., | | | | |
Series 2020, Ref. RB, 3.24%, | | | | |
10/01/2052 | | 4,465,000 | | 4,552,425 |
| Total Municipal Obligations (Cost $5,515,448) | | 5,535,955 |
| | | Shares | | |
Common Stocks & Other Equity Interests–0.00% |
Diversified Support Services–0.00% | | |
ACC Claims Holdings LLC(h)(k) | | 727,470 | | 1 |
Other Diversified Financial Services–0.00% | | |
Adelphia Recovery Trust, Series ACC1(k)(l) | | 859,558 | | 1,633 |
| Total Common Stocks & Other Equity Interests | | |
| (Cost $218,117) | | | | 1,634 |
Investment Abbreviations: | | | | |
Conv. – Convertible | | | | |
DAC | – Designated Activity Co. | | | | |
EUR | – Euro | | | | |
GBP | – British Pound Sterling | | | | |
LIBOR – London Interbank Offered Rate | | | | |
Pfd. | – Preferred | | | | |
RB | – Revenue Bonds | | | | |
Ref. | – Refunding | | | | |
REIT | – Real Estate Investment Trust | | | | |
SOFR | – Secured Overnight Financing Rate | | | | |
USD | – U.S. Dollar | | | | |
Notes to Schedule of Investments:
| | Shares | | Value |
| Money Market Funds–2.90% | | | |
Invesco Government & Agency Portfolio, | | | |
| Institutional Class, 1.50%(m) | 23,166,315 | $ | 23,166,314 |
Invesco Liquid Assets Portfolio, | | | |
| Institutional Class, 1.64%(m) | 14,686,555 | | 14,693,899 |
Invesco Treasury Portfolio, Institutional | | | |
| Class, 1.48%(m) | 26,475,788 | | 26,475,788 |
| Total Money Market Funds (Cost $64,334,592) | | 64,336,001 |
Options Purchased–0.04% | | | |
| (Cost $1,185,847)(n) | | | 888,558 |
TOTAL INVESTMENTS IN SECURITIES–99.52% | | |
| (Cost $2,065,014,014) | | | 2,203,688,053 |
OTHER ASSETS LESS LIABILITIES—0.48% | | | 10,639,296 |
NET ASSETS–100.00% | | $2,214,327,349 |
(a)Industry and/or sector classifications used in this report are generally according to the Global Industry Classification Standard, which was developed by and is the exclusive property and a service mark of MSCI Inc. and Standard & Poor's.
(b)Security purchased or received in a transaction exempt from registration under the Securities Act of 1933, as amended (the "1933 Act"). The security may be resold pursuant to an exemption from registration under the 1933 Act, typically to qualified institutional buyers. The aggregate value of these securities at February 29, 2020 was $724,347,604, which represented 32.71% of the Fund's Net Assets.
(c)Interest or dividend rate is redetermined periodically. Rate shown is the rate in effect on February 29, 2020.
(d)Perpetual bond with no specified maturity date.
(e)All or a portion of the value was pledged and/or designated as collateral to cover margin requirements for open futures contracts and swap agreements. See Note 1K and Note 1M.
(f)Security traded on a discount basis. The interest rate shown represents the discount rate at the time of purchase by the Fund.
(g)Variable rate senior loan interests are, at present, not readily marketable, not registered under the 1933 Act and may be subject to contractual and legal restrictions on sale. Variable rate senior loan interests in the Fund's portfolio generally have variable rates which adjust to a base, such as the London Interbank Offered Rate ("LIBOR"), on set dates, typically every 30 days, but not greater than one year, and/or have interest rates that float at margin above a widely recognized base lending rate such as the Prime Rate of a designated U.S. bank.
(h)Security valued using significant unobservable inputs (Level 3). See Note 3.
(i)Foreign denominated security. Principal amount is denominated in the currency indicated.
(j)Zero coupon bond issued at a discount.
(k)Non-income producing security.
(l)Non-income producing security acquired as part of the Adelphia Communications bankruptcy reorganization.
(m)The money market fund and the Fund are affiliated by having the same investment adviser. The rate shown is the 7-day SEC standardized yield as of February 29, 2020.
(n)The table below details options purchased.
See accompanying Notes to Financial Statements which are an integral part of the financial statements.
22 | Invesco Corporate Bond Fund |

Open Exchange-Traded Equity Options Purchased
| | Type of | Expiration | Number of | Exercise | | Notional | |
Description | | Contract | Date | Contracts | Price | | | Value* | Value |
Equity Risk | | | | | | | | | |
Amazon.com, Inc. | | Call | 06/18/2021 | 1 | $2,200.00 | $ | 220,000 | $ 14,787 |
Apple, Inc. | | Call | 01/15/2021 | 16 | 340.00 | | 544,000 | 16,560 |
| | | | | | | | |
Booking Holdings, Inc. | | Call | 01/15/2021 | 2 | 2,100.00 | | 420,000 | 15,790 |
| | | | | | | | |
Consumer Discretionary Select Sector SPDR Fund | | Call | 06/18/2021 | 20 | 135.00 | | 270,000 | 7,000 |
Health Care Select Sector SPDR Fund Option | | Call | 01/15/2021 | 25 | 104.00 | | 260,000 | 6,250 |
Health Care Select Sector SPDR Fund Option | | Call | 01/15/2021 | 25 | 106.00 | | 265,000 | 6,063 |
| | | | | | | | |
Industrial Select Sector SPDR Fund | | Call | 01/15/2021 | 20 | 85.00 | | 170,000 | 5,000 |
Intel Corp. Option | | Call | 01/15/2021 | 48 | 72.50 | | 348,000 | 8,520 |
JPMorgan Chase & Co. | | Call | 01/15/2021 | 15 | 135.00 | | 202,500 | 7,275 |
| | | | | | | | |
Microsoft Corp. | | Call | 03/19/2021 | 24 | 190.00 | | 456,000 | 24,120 |
Oracle Corp. | | Call | 01/15/2021 | 27 | 62.50 | | 168,750 | 3,105 |
QUALCOMM, Inc. | | Call | 01/15/2021 | 2 | 97.50 | | 19,500 | 783 |
| | | | | | | | |
UnitedHealth Group, Inc. | | Call | 01/15/2021 | 8 | 290.00 | | 232,000 | 13,280 |
| | | | | | | | |
Verizon Communications, Inc. | | Call | 01/15/2021 | 30 | 60.00 | | 180,000 | 5,805 |
Total Open Exchange-Traded Equity Options Purchased | | | 263 | | | | | $134,338 |
| | | | | |
* Notional Value is calculated by multiplying the Number of Contracts by the Exercise Price by the multiplier. | | | | | |
| Open Exchange-Traded Index Options Purchased | | | | |
| | Type of | Expiration | Number of | Exercise | | Notional | |
Description | | Contract | Date | Contracts | Price | | | Value* | Value |
Equity Risk | | | | | | | | | |
S&P 500 Index | | Call | 06/18/2021 | 43 | $3,100.00 | $13,330,000 | $754,220 |
| | | | | |
* Notional Value is calculated by multiplying the Number of Contracts by the Exercise Price by the multiplier. | | | | | |
| Open Exchange-Traded Equity Options Written | | | | |
| | | | | | | | | Unrealized |
| Type of | Expiration | Number of | Exercise | Premiums | Notional | | Appreciation |
Description | Contract | Date | Contracts | Price | Received | Value* | Value | (Depreciation) |
Equity Risk | | | | | | | | | |
Booking Holdings, Inc. | Call | 01/15/2021 | 2 | $2,400.00 | $(15,194) | $480,000 | $ (5,810) | $ 9,384 |
| | | | | | | | |
Health Care Select Sector SPDR Fund | Call | 01/15/2021 | 25 | 103.33 | (17,549) | 258,325 | (7,125) | 10,424 |
| | | | | | | | | |
Oracle Corp. | Call | 01/15/2021 | 12 | 70.00 | (1,643) | | 84,000 | (522) | 1,121 |
QUALCOMM, Inc. | Call | 01/15/2021 | 1 | 110.00 | (267) | | 11,000 | (223) | 44 |
UnitedHealth Group, Inc. | Call | 01/15/2021 | 3 | 300.00 | (3,006) | | 90,000 | (4,080) | (1,074) |
| | | | | | | | | |
Total Exchange-Traded Equity Options Written | | | | | $(37,659) | | | $(17,760) | $19,899 |
*Notional Value is calculated by multiplying the Number of Contracts by the Exercise Price by the multiplier.
Open Over-The-Counter Credit Default Swaptions Written
| | | | (Pay)/ | | | | | | | |
| | | | Receive | | | Implied | | | | |
| Type of | Exercise | Reference | Fixed | Payment | Expiration | Credit | Premiums | Notional | | Unrealized |
Counterparty | Contract | Rate | Entity | Rate | Frequency | Date | Spread | Received | Value | Value | (Depreciation) |
Credit Risk | | | | | | | | | | | |
| | | Markit CDX North | | | | | | | | |
Morgan Stanley and | | | America High Yield | | | | | | | | |
Co. International | | | Index, Series 33, | | | | | | | | |
PLC | Buy | 106.00% | Version 2 | 3MonthUSDLIBOR% Quarterly | 03/18/2020 | 3.769 | $(218,804) | $(55,953,000) | $(869,157) | $(650,353) |
LIBOR London Interbank Offered Rate
See accompanying Notes to Financial Statements which are an integral part of the financial statements.
23 | Invesco Corporate Bond Fund |

Open Futures Contracts
| | | | | | | | | | | Unrealized |
Long Futures Contracts | | | | Number of | Expiration | Notional | | | Appreciation |
| | | Contracts | Month | Value | | | Value | (Depreciation) |
Interest Rate Risk | | | | | | | | | | | | | |
U.S. Treasury 2 Year Notes | | | | 948 | June-2020 | $ 206,975,063 | $ 1,257,196 | $ 1,257,196 | |
U.S. Treasury 10 Year Notes | | | | 681 | June-2020 | 91,764,750 | 1,239,275 | 1,239,275 | |
| | | | | | | | | | |
U.S. Treasury Long Bonds | | | | 585 | June-2020 | 99,596,250 | 2,639,199 | 2,639,199 | |
| | | | | | | | | | | | |
Subtotal—Long Futures Contracts | | | | | | | | | 5,135,670 | 5,135,670 | | |
| | | | | | | | | | | | | |
Short Futures Contracts | | | | | | | | | | | | | |
Interest Rate Risk | | | | | | | | | | | | | |
U.S. Treasury Ultra Bonds | | | | 192 | June-2020 | (39,840,000) | | (958,926) | (958,926) |
| | | | | | | | | | |
U.S. Treasury 5 Year Notes | | | | 317 | June-2020 | (38,911,750) | | (381,288) | (381,288) |
| | | | | | | | | |
U.S. Treasury 10 Year Ultra Bonds | | | | 779 | June-2020 | (117,020,406) | (1,845,690) | (1,845,690) |
| | | | | | | | | | | |
Subtotal—Short Futures Contracts | | | | | | | | | (3,185,904) | (3,185,904) |
Total Futures Contracts | | | | | | | | | $ 1,949,766 | $ 1,949,766 | |
| | | | | | | |
| Open Centrally Cleared Credit Default Swap Agreements | | | | | | |
| | (Pay)/ | | | | | | | | | | | |
| | Receive | | | Implied | | | Upfront | | | | | |
| Buy/Sell | Fixed | Payment | | Credit | | | Payments Paid | | Unrealized |
Reference Entity | Protection | Rate | Frequency | Maturity Date | Spread(a) | Notional Value | (Received) | Value | Appreciation |
Credit Risk | | | | | | | | | | | | | |
Markit CDX North America High Yield | | | | | | | | | | | | | |
Index, Series 33, Version 2 | Buy | (5.00)% | Quarterly | 12/20/2024 | 3.769% | USD 55,393,470 | $(5,082,895) | $(2,994,958) | $2,087,937 | |
(a)Implied credit spreads represent the current level, as of February 29, 2020, at which protection could be bought or sold given the terms of the existing credit default swap agreement and serve as an indicator of the current status of the payment/performance risk of the credit default swap agreement. An implied credit spread that has widened or increased since entry into the initial agreement may indicate a deteriorating credit profile and increased risk of default for the reference entity. A declining or narrowing spread may indicate an improving credit profile or decreased risk of default for the reference entity. Alternatively, credit spreads may increase or decrease reflecting the general tolerance for risk in the credit markets generally.
Open Forward Foreign Currency Contracts
| | | | Contract to | | | Unrealized |
Settlement | | | | | Appreciation |
| | | | | |
Date | | Counterparty | | Deliver | | Receive | (Depreciation) |
Currency Risk | | | | | | | | |
05/29/2020 | Canadian Imperial Bank of Commerce | CAD 19,863,000 | USD 14,961,303 | $ | 163,537 |
05/29/2020 | Goldman Sachs & Co. | GBP | 150,888 | USD | 195,569 | | 1,711 |
| | | | | | | |
Subtotal—Appreciation | | | | | | | 165,248 |
Currency Risk | | | | | | | | |
05/29/2020 | Citibank N.A. | EUR | 253,538 | USD | 276,124 | | (5,166) |
05/29/2020 | Goldman Sachs & Co. | EUR | 9,680,250 | USD 10,564,589 | | (175,243) |
Subtotal—Depreciation | | | | | | | (180,409) |
| | | | | | | | |
| Total Forward Foreign Currency Contracts | | | | | | $ | (15,161) |
| | | | | | | | |
Abbreviations: | | | | | | | | |
CAD | —Canadian Dollar | | | | | | | |
EUR | —Euro | | | | | | | | |
GBP | —British Pound Sterling | | | | | | | |
SPDR —Standard & Poor's Depositary Receipt | | | | | | | |
USD | —U.S. Dollar | | | | | | | | |
See accompanying Notes to Financial Statements which are an integral part of the financial statements.
24 | Invesco Corporate Bond Fund |
Statement of Assets and Liabilities
February 29, 2020
Assets: | |
Investments in securities, at value | |
(Cost $2,000,679,422) | $2,139,352,052 |
Investments in affiliated money market funds, at value | |
(Cost $64,334,592) | 64,336,001 |
Other investments: | |
Variation margin receivable — futures contracts | 324,531 |
Unrealized appreciation on forward foreign currency | |
contracts outstanding | 165,248 |
Foreign currencies, at value (Cost $2,483,256) | 2,485,678 |
Receivable for: | |
Investments sold | 4,387,501 |
Fund shares sold | 8,729,238 |
Dividends | 320,563 |
Interest | 19,440,324 |
Investment for trustee deferred compensation and | |
retirement plans | 208,012 |
Other assets | 60,682 |
Total assets | 2,239,809,830 |
Liabilities: | |
Other investments: | |
Options written, at value (premiums received | |
$256,463) | 886,917 |
Variation margin payable — centrally cleared swap | |
agreements | 70,285 |
Unrealized depreciation on forward foreign currency | |
contracts outstanding | 180,409 |
Payable for: | |
Investments purchased | 13,582,126 |
Dividends | 881,416 |
Fund shares reacquired | 7,725,320 |
Amount due custodian | 778,149 |
Accrued fees to affiliates | 800,353 |
Accrued trustees' and officers' fees and benefits | 4,287 |
Accrued other operating expenses | 344,244 |
Trustee deferred compensation and retirement plans | 228,975 |
Total liabilities | 25,482,481 |
Net assets applicable to shares outstanding | $2,214,327,349 |
Net assets consist of: | | |
Shares of beneficial interest | $2,053,510,712 |
Distributable earnings | | 160,816,637 |
| $2,214,327,349 |
Net Assets: | | |
Class A | $1,224,248,147 |
Class C | $ | 66,661,742 |
Class R | $ | 12,435,044 |
Class Y | $ | 343,579,892 |
Class R5 | $ | 8,536,700 |
Class R6 | $ | 558,865,824 |
Shares outstanding, no par value, with an unlimited number of shares authorized:
Class A | | 156,910,009 |
Class C | | 8,475,032 |
Class R | | 1,592,846 |
Class Y | | 43,934,810 |
Class R5 | | 1,092,646 |
Class R6 | | 71,458,127 |
Class A: | | |
Net asset value per share | $ | 7.80 |
Maximum offering price per share | | |
(Net asset value of $7.80 ÷ 95.75%) | $ | 8.15 |
Class C: | | |
Net asset value and offering price per share | $ | 7.87 |
Class R: | | |
Net asset value and offering price per share | $ | 7.81 |
Class Y: | | |
Net asset value and offering price per share | $ | 7.82 |
Class R5: | | |
Net asset value and offering price per share | $ | 7.81 |
Class R6: | | |
Net asset value and offering price per share | $ | 7.82 |
See accompanying Notes to Financial Statements which are an integral part of the financial statements.
25 | Invesco Corporate Bond Fund |
Statement of Operations
For the year ended February 29, 2020
Investment income: | | | | |
Interest | $ | 71,416,105 | |
Dividends | | 1,991,111 | |
Dividends from affiliated money market funds | | 746,254 | | |
Total investment income | | 74,153,470 | |
Expenses: | | | | |
Advisory fees | | 5,953,163 | |
Administrative services fees | | 258,095 | | |
Custodian fees | | 100,983 | | |
Distribution fees: | | | | |
Class A | | 2,702,111 | |
Class C | | 498,891 | | |
Class R | | 47,156 | | |
Transfer agent fees — A, C, R and Y | | 2,187,867 | |
Transfer agent fees — R5 | | 7,456 | | |
Transfer agent fees — R6 | | 70,557 | | |
Trustees' and officers' fees and benefits | | 40,244 | | |
Registration and filing fees | | 170,430 | | |
Reports to shareholders | | 364,436 | | |
Professional services fees | | 99,956 | | |
Other | | 75,311 | | |
Total expenses | | 12,576,656 | |
Less: Fees waived and/or expense offset arrangement(s) | | (50,641) |
Net expenses | | 12,526,015 | |
Net investment income | | 61,627,455 | |
Realized and unrealized gain (loss) from: | | | | |
Net realized gain (loss) from: | | | | |
Investment securities | | 38,624,371 | |
Foreign currencies | | (133,968) |
Forward foreign currency contracts | | 416,951 | | |
Futures contracts | | 2,352,505 | | |
Option contracts written | | 178,716 | | |
Swap agreements | | (166,390) |
| | 41,272,185 | |
Change in net unrealized appreciation (depreciation) of: | | | | |
Investment securities | | 148,689,419 | |
Foreign currencies | | 2,455 | | |
Forward foreign currency contracts | | (7,988) |
Futures contracts | | 2,152,996 | |
Option contracts written | | (603,697) |
Swap agreements | | 2,087,937 | |
| | 152,321,122 | |
Net realized and unrealized gain | | 193,593,307 | |
Net increase in net assets resulting from operations | $ | 255,220,762 | |
See accompanying Notes to Financial Statements which are an integral part of the financial statements.
26 | Invesco Corporate Bond Fund |
Statement of Changes in Net Assets
For the years ended February 29, 2020 and February 28, 2019
| | 2020 | | 2019 | | |
Operations: | | | | | | |
Net investment income | $ | 61,627,455 | $ | 62,749,097 | |
Net realized gain (loss) | | 41,272,185 | | (14,858,734) |
| | | | | |
Change in net unrealized appreciation (depreciation) | | 152,321,122 | | (24,719,740) |
Net increase in net assets resulting from operations | | 255,220,762 | | 23,170,623 | |
Distributions to shareholders from distributable earnings: | | | | | | |
Class A | | (39,207,717) | | (39,985,134) |
| | | | | |
Class C | | (1,423,644) | | (2,347,265) |
| | | | | |
Class R | | (314,228) | | (286,266) |
| | | | | |
Class Y | | (7,404,773) | | (3,526,392) |
| | | | | |
Class R5 | | (299,295) | | (289,714) |
| | | | | |
Class R6 | | (18,464,031) | | (18,562,159) |
| | | | | |
Total distributions from distributable earnings | | (67,113,688) | | (64,996,930) |
Share transactions–net: | | | | | | |
Class A | | 142,684,257 | | (7,544,776) |
| | | | | |
Class C | | 24,316,590 | | (43,254,102) |
| | | | | |
Class R | | 4,577,992 | | (104,011) |
Class Y | | 237,103,282 | | 968,322 | | |
Class R5 | | 902,229 | | 3,168,593 | |
Class R6 | | 122,588,233 | | (14,236,672) |
| | | | | |
Net increase (decrease) in net assets resulting from share transactions | | 532,172,583 | | (61,002,646) |
| | | | | |
Net increase (decrease) in net assets | | 720,279,657 | | (102,828,953) |
Net assets: | | | | | | |
Beginning of year | | 1,494,047,692 | | 1,596,876,645 | |
End of year | $2,214,327,349 | $1,494,047,692 | |
See accompanying Notes to Financial Statements which are an integral part of the financial statements.
27 | Invesco Corporate Bond Fund |
Financial Highlights
The following schedule presents financial highlights for a share of the Fund outstanding throughout the periods indicated.
| | | | | | | | | | | | Ratio of | Ratio of | | |
| | | | | | | | | | | | expenses | expenses | | |
| | | Net gains | | | | | | | | | to average | to average net | | |
| | | (losses) | | | | | | | | | net assets | assets without | Ratio of net | |
| Net asset | | on securities | | Dividends | Distributions | | | | | with fee waivers | fee waivers | investment | |
| value, | Net | (both | Total from | from net | from net | | Net asset | | Net assets, | and/or | and/or | income | |
| beginning | investment | realized and | investment | investment | realized | Total | value, end | Total | end ofperiod | expenses | expenses | to average | Portfolio |
| ofperiod | income(a) | unrealized) | operations | income | gains | distributions | ofperiod | return (b) | (000's omitted) | absorbed | absorbed | net assets | turnover (c) |
Class A | | | | | | | | | | | | 0.80%(d) | 0.80%(d) | 3.30%(d) | |
Year ended 02/29/20 | $7.02 | $0.25 | $ 0.80 | $ 1.05 | $(0.27) | $ | — | $(0.27) | $7.80 | 15.20% | $1,224,248 | 192% |
Year ended 02/28/19 | 7.20 | 0.28 | (0.17) | 0.11 | (0.29) | | (0.00) | (0.29) | 7.02 | 1.65 | 968,160 | 0.83 | 0.83 | 4.00 | 145 |
Year ended 02/28/18 | 7.31 | 0.26 | (0.06) | 0.20 | (0.27) | | (0.04) | (0.31) | 7.20 | 2.68 | 1,001,173 | 0.85 | 0.85 | 3.58 | 180 |
Year ended 02/28/17 | 6.89 | 0.26 | 0.42 | 0.68 | (0.26) | | — | (0.26) | 7.31 | 9.97 | 948,305 | 0.90 | 0.90 | 3.60 | 212 |
Year ended 02/29/16 | 7.40 | 0.27 | (0.52) | (0.25) | (0.26) | | — | (0.26) | 6.89 | (3.37) | 873,526 | 0.90 | 0.90 | 3.79 | 202 |
Class C | | | | | | | | | | | | 1.55(d) | 1.55(d) | 2.55(d) | 192 |
Year ended 02/29/20 | 7.08 | 0.19 | 0.82 | 1.01 | (0.22) | | — | (0.22) | 7.87 | 14.43 | 66,662 |
Year ended 02/28/19 | 7.26 | 0.23 | (0.17) | 0.06 | (0.24) | | (0.00) | (0.24) | 7.08 | 0.91(e) | 37,280 | 1.53 | 1.53 | 3.30 | 145 |
Year ended 02/28/18 | 7.36 | 0.21 | (0.06) | 0.15 | (0.21) | | (0.04) | (0.25) | 7.26 | 2.07(e) | 82,939 | 1.58(e) | 1.58(e) | 2.85(e) | 180 |
Year ended 02/28/17 | 6.92 | 0.21 | 0.42 | 0.63 | (0.19) | | — | (0.19) | 7.36 | 9.17 | 85,127 | 1.65 | 1.65 | 2.85 | 212 |
Year ended 02/29/16 | 7.42 | 0.22 | (0.53) | (0.31) | (0.19) | | — | (0.19) | 6.92 | (4.18)(e) | 68,853 | 1.64(e) | 1.64(e) | 3.05(e) | 202 |
Class R | | | | | | | | | | | | 1.05(d) | 1.05(d) | 3.05(d) | 192 |
Year ended 02/29/20 | 7.02 | 0.23 | 0.81 | 1.04 | (0.25) | | — | (0.25) | 7.81 | 15.06 | 12,435 |
Year ended 02/28/19 | 7.21 | 0.26 | (0.17) | 0.09 | (0.28) | | (0.00) | (0.28) | 7.02 | 1.30 | 6,889 | 1.08 | 1.08 | 3.75 | 145 |
Year ended 02/28/18 | 7.31 | 0.25 | (0.06) | 0.19 | (0.25) | | (0.04) | (0.29) | 7.21 | 2.57 | 7,196 | 1.10 | 1.10 | 3.33 | 180 |
Year ended 02/28/17 | 6.89 | 0.24 | 0.42 | 0.66 | (0.24) | | — | (0.24) | 7.31 | 9.70 | 6,742 | 1.15 | 1.15 | 3.35 | 212 |
Year ended 02/29/16 | 7.40 | 0.26 | (0.52) | (0.26) | (0.25) | | — | (0.25) | 6.89 | (3.62) | 6,847 | 1.15 | 1.15 | 3.54 | 202 |
Class Y | | | | | | | | | | | | 0.55(d) | 0.55(d) | 3.55(d) | |
Year ended 02/29/20 | 7.03 | 0.27 | 0.81 | 1.08 | (0.29) | | — | (0.29) | 7.82 | 15.62 | 343,580 | 192 |
Year ended 02/28/19 | 7.22 | 0.30 | (0.18) | 0.12 | (0.31) | | (0.00) | (0.31) | 7.03 | 1.76 | 86,657 | 0.58 | 0.58 | 4.25 | 145 |
Year ended 02/28/18 | 7.32 | 0.28 | (0.05) | 0.23 | (0.29) | | (0.04) | (0.33) | 7.22 | 3.08 | 87,895 | 0.60 | 0.60 | 3.83 | 180 |
Year ended 02/28/17 | 6.90 | 0.28 | 0.42 | 0.70 | (0.28) | | — | (0.28) | 7.32 | 10.23 | 235,464 | 0.65 | 0.65 | 3.85 | 212 |
Year ended 02/29/16 | 7.41 | 0.29 | (0.52) | (0.23) | (0.28) | | — | (0.28) | 6.90 | (3.11) | 26,500 | 0.65 | 0.65 | 4.04 | 202 |
Class R5 | | | | | | | | | | | | 0.49(d) | 0.49(d) | 3.61(d) | 192 |
Year ended 02/29/20 | 7.03 | 0.27 | 0.80 | 1.07 | (0.29) | | — | (0.29) | 7.81 | 15.55 | 8,537 |
Year ended 02/28/19 | 7.21 | 0.30 | (0.17) | 0.13 | (0.31) | | (0.00) | (0.31) | 7.03 | 2.00 | 6,841 | 0.49 | 0.49 | 4.34 | 145 |
Year ended 02/28/18 | 7.31 | 0.29 | (0.06) | 0.23 | (0.29) | | (0.04) | (0.33) | 7.21 | 3.16 | 3,829 | 0.53 | 0.53 | 3.90 | 180 |
Year ended 02/28/17 | 6.89 | 0.29 | 0.42 | 0.71 | (0.29) | | — | (0.29) | 7.31 | 10.34 | 5,222 | 0.56 | 0.56 | 3.94 | 212 |
Year ended 02/29/16 | 7.40 | 0.29 | (0.51) | (0.22) | (0.29) | | — | (0.29) | 6.89 | (2.98) | 4,547 | 0.54 | 0.54 | 4.15 | 202 |
Class R6 | | | | | | | | | | | | 0.41(d) | 0.41(d) | 3.69(d) | |
Year ended 02/29/20 | 7.04 | 0.28 | 0.80 | 1.08 | (0.30) | | — | (0.30) | 7.82 | 15.62 | 558,866 | 192 |
Year ended 02/28/19 | 7.22 | 0.31 | (0.17) | 0.14 | (0.32) | | (0.00) | (0.32) | 7.04 | 2.01 | 388,221 | 0.43 | 0.43 | 4.40 | 145 |
Year ended 02/28/18 | 7.32 | 0.30 | (0.06) | 0.24 | (0.30) | | (0.04) | (0.34) | 7.22 | 3.25 | 413,844 | 0.44 | 0.44 | 3.99 | 180 |
Year ended 02/28/17 | 6.90 | 0.29 | 0.42 | 0.71 | (0.29) | | — | (0.29) | 7.32 | 10.43 | 29,232 | 0.47 | 0.47 | 4.03 | 212 |
Year ended 02/29/16 | 7.40 | 0.30 | (0.50) | (0.20) | (0.30) | | — | (0.30) | 6.90 | (2.80) | 22,567 | 0.46 | 0.46 | 4.23 | 202 |
(a)Calculated using average shares outstanding.
(b)Includes adjustments in accordance with accounting principles generally accepted in the United States of America and as such, the net asset value for financial reporting purposes and the returns based upon those net asset values may differ from the net asset value and returns for shareholder transactions. Does not include sales charges and is not annualized for periods less than one year, if applicable.
(c)Portfolio turnover is calculated at the fund level and is not annualized for periods less than one year, if applicable.
(d)Ratios are based on average daily net assets (000's omitted) of $1,083,445, $49,889, $9,431, $196,357, $7,608 and $461,526 for Class A, Class C, Class R, Class Y, Class R5 and Class R6 shares, respectively.
(e)The total return, ratio of expenses to average net assets and ratio of net investment income (loss) to average net assets reflect actual 12b-1 fees of 0.95%, 0.98% and 0.99% for the years ended February 28, 2019, February 28, 2018 and February 29, 2016, respectively.
See accompanying Notes to Financial Statements which are an integral part of the financial statements.
28 | Invesco Corporate Bond Fund |
Notes to Financial Statements
February 29, 2020
NOTE 1—Significant Accounting Policies
Invesco Corporate Bond Fund (the "Fund"), is a series portfolio of AIM Investment Securities Funds (Invesco Investment Securities Funds) (the "Trust"). The Trust is organized as a Delaware statutory trust and is registered under the Investment Company Act of 1940, as amended (the "1940 Act"), as an open-end series management investment company authorized to issue an unlimited number of shares of beneficial interest. Information presented in these financial statements pertains only to the Fund. Matters affecting the Fund or each class will be voted on exclusively by the shareholders of the Fund or each class.
The Fund's primary investment objective is to seek to provide current income with preservation of capital. Capital appreciation is a secondary objective that is sought only when consistent with the Fund's primary investment objective.
The Fund currently consists of six different classes of shares: Class A, Class C, Class R, Class Y, Class R5 and Class R6. Class Y shares are available only to certain investors. Class A shares are sold with a front-end sales charge unless certain waiver criteria are met. Under certain circumstances, load waived shares may be subject to contingent deferred sales charges ("CDSC"). Class C shares are sold with a CDSC. Class R, Class Y, Class R5 and Class R6 shares are sold at net asset value. Class C shares held for ten years after purchase are eligible for automatic conversion into Class A shares of the same Fund (the "Conversion Feature"). The automatic conversion pursuant to the Conversion Feature will generally occur at the end of the month following the tenth anniversary after a purchase of Class C shares.
The Fund is an investment company and accordingly follows the investment company accounting and reporting guidance in accordance with Financial Accounting Standards Board Accounting Standards Codification Topic 946, Financial Services – Investment Companies.
The following is a summary of the significant accounting policies followed by the Fund in the preparation of its financial statements.
A.Security Valuations – Securities, including restricted securities, are valued according to the following policy.
Debt obligations (including convertible securities) and unlisted equities are fair valued using an evaluated quote provided by an independent pricing service. Evaluated quotes provided by the pricing service may be determined without exclusive reliance on quoted prices, and may reflect appropriate factors such as institution-size trading in similar groups of securities, developments related to specific securities, dividend rate (for unlisted equities), yield (for debt obligations), quality, type of issue, coupon rate (for debt obligations), maturity (for debt obligations), individual trading characteristics and other market data. Pricing services generally value debt obligations assuming orderly transactions of institutional round lot size, but a fund may hold or transact in the same securities in smaller, odd lot sizes. Odd lots often trade at lower prices than institutional round lots. Debt obligations are subject to interest rate and credit risks. In addition, all debt obligations involve some risk of default with respect to interest and/or principal payments.
Variable rate senior loan interests are fair valued using quotes provided by an independent pricing service. Quotes provided by the pricing service may reflect appropriate factors such as ratings, tranche type, industry, company performance, spread, individual trading characteristics, institution-size trading in similar groups of securities and other market data.
A security listed or traded on an exchange (except convertible securities) is valued at its last sales price or official closing price as of the close of the customary trading session on the exchange where the security is principally traded, or lacking any sales or official closing price on a particular day, the security may be valued at the closing bid price on that day. Securities traded in the over-the-counter market are valued based on prices furnished by independent pricing services or market makers. When such securities are valued by an independent pricing service they may be considered fair valued. Futures contracts are valued at the final settlement price set by an exchange on which they are principally traded. Listed options are valued at the mean between the last bid and asked prices from the exchange on which they are principally traded. Options not listed on an exchange are valued by an independent source at the mean between the last bid and asked prices. For purposes of determining net asset value ("NAV") per share, futures and option contracts generally are valued 15 minutes after the close of the customary trading session of the New York Stock Exchange ("NYSE").
Investments in open-end and closed-end registered investment companies that do not trade on an exchange are valued at the end-of-day net asset value per share. Investments in open-end and closed-end registered investment companies that trade on an exchange are valued at the last sales price or official closing price as of the close of the customary trading session on the exchange where the security is principally traded.
Swap agreements are fair valued using an evaluated quote, if available, provided by an independent pricing service. Evaluated quotes provided by the pricing service are valued based on a model which may include end-of-day net present values, spreads, ratings, industry, company performance and returns of referenced assets. Centrally cleared swap agreements are valued at the daily settlement price determined by the relevant exchange or clearinghouse.
Foreign securities' (including foreign exchange contracts) prices are converted into U.S. dollar amounts using the applicable exchange rates as of the close of the NYSE. If market quotations are available and reliable for foreign exchange-traded equity securities, the securities will be valued at the market quotations. Because trading hours for certain foreign securities end before the close of the NYSE, closing market quotations may become unreliable. If between the time trading ends on a particular security and the close of the customary trading session on the NYSE, events occur that the investment adviser determines are significant and make the closing price unreliable, the Fund may fair value the security. If the event is likely to have affected the closing price of the security, the security will be valued at fair value in good faith using procedures approved by the Board of Trustees. Adjustments to closing prices to reflect fair value may also be based on a screening process of an independent pricing service to indicate the degree of certainty, based on historical data, that the closing price in the principal market where a foreign security trades is not the current value as of the close of the NYSE. Foreign securities' prices meeting the approved degree of certainty that the price is not reflective of current value will be priced at the indication of fair value from the independent pricing service. Multiple factors may be considered by the independent pricing service in determining adjustments to reflect fair value and may include information relating to sector indices, American Depositary Receipts and domestic and foreign index futures. Foreign securities may have additional risks including exchange rate changes, potential for sharply devalued currencies and high inflation, political and economic upheaval, the relative lack of issuer information, relatively low market liquidity and the potential lack of strict financial and accounting controls and standards.
Securities for which market prices are not provided by any of the above methods may be valued based upon quotes furnished by independent sources. The last bid price may be used to value equity securities. The mean between the last bid and asked prices is used to value debt obligations, including corporate loans.
Securities for which market quotations are not readily available or became unreliable are valued at fair value as determined in good faith by or under the supervision of the Trust's officers following procedures approved by the Board of Trustees. Issuer specific events, market trends, bid/asked quotes of brokers and information providers and other market data may be reviewed in the course of making a good faith determination of a security's fair value.
The Fund may invest in securities that are subject to interest rate risk, meaning the risk that the prices will generally fall as interest rates rise and, conversely, the prices will generally rise as interest rates fall. Specific securities differ in their sensitivity to changes in interest rates depending on their individual characteristics. Changes in interest rates may result in increased market volatility, which may affect the value and/or liquidity of certain Fund investments.
Valuations change in response to many factors including the historical and prospective earnings of the issuer, the value of the issuer's assets, general economic conditions, interest rates, investor perceptions and market liquidity. Because of the inherent uncertainties of valuation, the values reflected in the financial statements may materially differ from the value received upon actual sale of those investments.
B.Securities Transactions and Investment Income – Securities transactions are accounted for on a trade date basis. Realized gains or losses on sales are computed on the basis of specific identification of the securities sold. Interest income (net of withholding tax, if any) is recorded on an accrual basis from settlement date. Bond premiums and discounts are amortized and/or accreted over the lives of the respective securities. Pay-in-kind interest income and non-cash
29 | Invesco Corporate Bond Fund |
dividend income received in the form of securities in-lieu of cash are recorded at the fair value of the securities received. Paydown gains and losses on mortgage and asset-backed securities are recorded as adjustments to interest income. Dividend income (net of withholding tax, if any) is recorded on the ex-dividend date.
The Fund may periodically participate in litigation related to Fund investments. As such, the Fund may receive proceeds from litigation settlements. Any proceeds received are included in the Statement of Operations as realized gain (loss) for investments no longer held and as unrealized gain (loss) for investments still held.
Brokerage commissions and mark ups are considered transaction costs and are recorded as an increase to the cost basis of securities purchased and/or a reduction of proceeds on a sale of securities. Such transaction costs are included in the determination of net realized and unrealized gain (loss) from investment securities reported in the Statement of Operations and the Statement of Changes in Net Assets and the net realized and unrealized gains (losses) on securities per share in the Financial Highlights. Transaction costs are included in the calculation of the Fund's net asset value and, accordingly, they reduce the Fund's total returns. These transaction costs are not considered operating expenses and are not reflected in net investment income reported in the Statement of Operations and the Statement of Changes in Net Assets, or the net investment income per share and the ratios of expenses and net investment income reported in the Financial Highlights, nor are they limited by any expense limitation arrangements between the Fund and the investment adviser.
The Fund allocates realized and unrealized capital gains and losses to a class based on the relative net assets of each class. The Fund allocates income to a class based on the relative value of the settled shares of each class.
C.Country Determination — For the purposes of making investment selection decisions and presentation in the Schedule of Investments, the investment adviser may determine the country in which an issuer is located and/or credit risk exposure based on various factors. These factors include the laws of the country under which the issuer is organized, where the issuer maintains a principal office, the country in which the issuer derives 50% or more of its total revenues and the country that has the primary market for the issuer's securities, as well as other criteria. Among the other criteria that may be evaluated for making this determination are the country in which the issuer maintains 50% or more of its assets, the type of security, financial guarantees and enhancements, the nature of the collateral and the sponsor organization. Country of issuer and/or credit risk exposure has been determined to be the United States of America, unless otherwise noted.
D.Distributions – Distributions from net investment income, if any, are declared daily and paid monthly. Distributions from net realized capital gain, if any, are generally declared and paid annually and recorded on the ex-dividend date. The Fund may elect to treat a portion of the proceeds from redemptions as distributions for federal income tax purposes.
E.Federal Income Taxes – The Fund intends to comply with the requirements of Subchapter M of the Internal Revenue Code of 1986, as amended (the "Internal Revenue Code"), necessary to qualify as a regulated investment company and to distribute substantially all of the Fund's taxable earnings to shareholders. As such, the Fund will not be subject to federal income taxes on otherwise taxable income (including net realized capital gain) that is distributed to shareholders. Therefore, no provision for federal income taxes is recorded in the financial statements.
The Fund recognizes the tax benefits of uncertain tax positions only when the position is more likely than not to be sustained. Management has analyzed the Fund's uncertain tax positions and concluded that no liability for unrecognized tax benefits should be recorded related to uncertain tax positions. Management is not aware of any tax positions for which it is reasonably possible that the total amounts of unrecognized tax benefits will change materially in the next 12 months.
The Fund files tax returns in the U.S. Federal jurisdiction and certain other jurisdictions. Generally, the Fund is subject to examinations by such taxing authorities for up to three years after the filing of the return for the tax period.
F.Expenses – Fees provided for under the Rule 12b-1 plan of a particular class of the Fund are charged to the operations of such class. Transfer agency fees and expenses and other shareholder recordkeeping fees and expenses attributable to Class R5 and Class R6 are allocated to each share class based on relative net assets. Sub-accounting fees attributable to Class R5 are charged to the operations of the class. Transfer agency fees and expenses and other shareholder recordkeeping fees and expenses relating to all other classes are allocated among those classes based on relative net assets. All other expenses are allocated among the classes based on relative net assets.
G.Accounting Estimates – The preparation of financial statements in conformity with accounting principles generally accepted in the United States of America ("GAAP") requires management to make estimates and assumptions that affect the reported amounts of assets and liabilities at the date of the financial statements and the reported amounts of revenues and expenses during the reporting period including estimates and assumptions related to taxation. Actual results could differ from those estimates by a significant amount. In addition, the Fund monitors for material events or transactions that may occur or become known after the period-end date and before the date the financial statements are released to print.
H.Indemnifications – Under the Fund's organizational documents, each Trustee, officer, employee or other agent of the Fund is indemnified against certain liabilities that may arise out of the performance of their duties to the Fund. Additionally, in the normal course of business, the Fund enters into contracts, including the Fund's servicing agreements, that contain a variety of indemnification clauses. The Fund's maximum exposure under these arrangements is unknown as this would involve future claims that may be made against the Fund that have not yet occurred. The risk of material loss as a result of such indemnification claims is considered remote.
I.Foreign Currency Translations — Foreign currency is valued at the close of the NYSE based on quotations posted by banks and major currency dealers. Portfolio securities and other assets and liabilities denominated in foreign currencies are translated into U.S. dollar amounts at the date of valuation. Purchases and sales of portfolio securities (net of foreign taxes withheld on disposition) and income items denominated in foreign currencies are translated into U.S. dollar amounts on the respective dates of such transactions. The Fund does not separately account for the portion of the results of operations resulting from changes in foreign exchange rates on investments and the fluctuations arising from changes in market prices of securities held. The combined results of changes in foreign exchange rates and the fluctuation of market prices on investments (net of estimated foreign tax withholding) are included with the net realized and unrealized gain or loss from investments in the Statement of Operations. Reported net realized foreign currency gains or losses arise from (1) sales of foreign currencies, (2) currency gains or losses realized between the trade and settlement dates on securities transactions, and (3) the difference between the amounts of dividends, interest, and foreign withholding taxes recorded on the Fund's books and the U.S. dollar equivalent of the amounts actually received or paid. Net unrealized foreign currency gains and losses arise from changes in the fair values of assets and liabilities, other than investments in securities at fiscal period end, resulting from changes in exchange rates.
The Fund may invest in foreign securities, which may be subject to foreign taxes on income, gains on investments or currency repatriation, a portion of which may be recoverable. Foreign taxes, if any, are recorded based on the tax regulations and rates that exist in the foreign markets in which the Fund invests and are shown in the Statement of Operations.
J.Forward Foreign Currency Contracts — The Fund may engage in foreign currency transactions either on a spot (i.e. for prompt delivery and settlement) basis, or through forward foreign currency contracts, to manage or minimize currency or exchange rate risk.
The Fund may also enter into forward foreign currency contracts for the purchase or sale of a security denominated in a foreign currency in order to "lock in" the U.S. dollar price of that security, or the Fund may also enter into forward foreign currency contracts that do not provide for physical settlement of the two currencies, but instead are settled by a single cash payment calculated as the difference between the agreed upon exchange rate and the spot rate at settlement based upon an agreed upon notional amount (non-deliverable forwards). The Fund will set aside liquid assets in an amount equal to the daily mark-to-market obligation for forward foreign currency contracts.
A forward foreign currency contract is an obligation between two parties ("Counterparties") to purchase or sell a specific currency for an agreed-upon price at a future date. The use of forward foreign currency contracts does not eliminate fluctuations in the price of the underlying securities the Fund owns or intends to acquire but establishes a rate of exchange in advance. Fluctuations in the value of these contracts are measured by the difference in the contract date and
30 | Invesco Corporate Bond Fund |
reporting date exchange rates and are recorded as unrealized appreciation (depreciation) until the contracts are closed. When the contracts are closed, realized gains (losses) are recorded. Realized and unrealized gains (losses) on the contracts are included in the Statement of Operations. The primary risks associated with forward foreign currency contracts include failure of the Counterparty to meet the terms of the contract and the value of the foreign currency changing unfavorably. These risks may be in excess of the amounts reflected in the Statement of Assets and Liabilities.
K.Futures Contracts — The Fund may enter into futures contracts to manage exposure to interest rate, equity and market price movements and/or currency risks. A futures contract is an agreement between Counterparties to purchase or sell a specified underlying security, currency or commodity (or delivery of a cash settlement price, in the case of an index future) for a fixed price at a future date. The Fund currently invests only in exchange-traded futures and they are standardized as to maturity date and underlying financial instrument. Initial margin deposits required upon entering into futures contracts are satisfied by the segregation of specific securities or cash as collateral at the futures commission merchant (broker). During the period the futures contracts are open, changes in the value of the contracts are recognized as unrealized gains or losses by recalculating the value of the contracts on a daily basis. Subsequent or variation margin payments are received or made depending upon whether unrealized gains or losses are incurred. These amounts are reflected as receivables or payables on the Statement of Assets and Liabilities. When the contracts are closed or expire, the Fund recognizes a realized gain or loss equal to the difference between the proceeds from, or cost of, the closing transaction and the Fund's basis in the contract. The net realized gain (loss) and the change in unrealized gain (loss) on futures contracts held during the period is included on the Statement of Operations. The primary risks associated with futures contracts are market risk and the absence of a liquid secondary market. If the Fund were unable to liquidate a futures contract and/or enter into an offsetting closing transaction, the Fund would continue to be subject to market risk with respect to the value of the contracts and continue to be required to maintain the margin deposits on the futures contracts. Futures contracts have minimal Counterparty risk since the exchange's clearinghouse, as Counterparty to all exchange-traded futures, guarantees the futures against default. Risks may exceed amounts recognized in the Statement of Assets and Liabilities.
L.Call Options Purchased and Written – The Fund may write covered call options and/or buy call options. A covered call option gives the purchaser of such option the right to buy, and the writer the obligation to sell, the underlying security or foreign currency at the stated exercise price during the option period. Options written by the Fund normally will have expiration dates between three and nine months from the date written. The exercise price of a call option may be below, equal to, or above the current market value of the underlying security at the time the option is written.
When the Fund writes a covered call option, an amount equal to the premium received by the Fund is recorded as an asset and an equivalent liability in the Statement of Assets and Liabilities. The amount of the liability is subsequently "marked-to-market" to reflect the current market value of the option written. If a written covered call option expires on the stipulated expiration date, or if the Fund enters into a closing purchase transaction, the Fund realizes a gain (or a loss if the closing purchase transaction exceeds the premium received when the option was written) without regard to any unrealized gain or loss on the underlying security, and the liability related to such option is extinguished. If a written covered call option is exercised, the Fund realizes a gain or a loss from the sale of the underlying security and the proceeds of the sale are increased by the premium originally received. Realized and unrealized gains and losses on call options written are included in the Statement of Operations as Net realized gain (loss) from and Change in net unrealized appreciation (depreciation) of Option contracts written. A risk in writing a covered call option is that the Fund gives up the opportunity for profit if the market price of the security increases and the option is exercised.
When the Fund buys a call option, an amount equal to the premium paid by the Fund is recorded as an investment on the Statement of Assets and Liabilities. The amount of the investment is subsequently "marked-to-market" to reflect the current value of the option purchased. Realized and unrealized gains and losses on call options purchased are included in the Statement of Operations as Net realized gain (loss) from and Change in net unrealized appreciation (depreciation) of Investment securities. A risk in buying an option is that the Fund pays a premium whether or not the option is exercised. In addition, there can be no assurance that a liquid secondary market will exist for any option purchased.
M.Swap Agreements — The Fund may enter into various swap transactions, including interest rate, total return, index, currency and credit default swap contracts ("CDS") for investment purposes or to manage interest rate, currency or credit risk. Such transactions are agreements between Counterparties. A swap agreement may be negotiated bilaterally and traded over-the-counter ("OTC") between two parties ("uncleared/ OTC") or, in some instances, must be transacted through a future commission merchant ("FCM") and cleared through a clearinghouse that serves as a central Counterparty ("centrally cleared swap"). These agreements may contain among other conditions, events of default and termination events, and various covenants and representations such as provisions that require the Fund to maintain a pre-determined level of net assets, and/ or provide limits regarding the decline of the Fund's NAV over specific periods of time. If the Fund were to trigger such provisions and have open derivative positions at that time, the Counterparty may be able to terminate such agreement and request immediate payment in an amount equal to the net liability positions, if any.
Interest rate, total return, index, and currency swap agreements are two-party contracts entered into primarily to exchange the returns (or differentials in rates of returns) earned or realized on particular predetermined investments or instruments. The gross returns to be exchanged or "swapped" between the parties are calculated with respect to a notional amount, i.e., the return on or increase in value of a particular dollar amount invested at a particular interest rate or return of an underlying asset, in a particular foreign currency, or in a "basket" of securities representing a particular index.
In a centrally cleared swap, the Fund's ultimate Counterparty is a central clearinghouse. The Fund initially will enter into centrally cleared swaps through an executing broker. When a fund enters into a centrally cleared swap, it must deliver to the central Counterparty (via the FCM) an amount referred to as "initial margin." Initial margin requirements are determined by the central Counterparty, but an FCM may require additional initial margin above the amount required by the central Counterparty. Initial margin deposits required upon entering into centrally cleared swaps are satisfied by cash or securities as collateral at the FCM. Securities deposited as initial margin are designated on the Schedule of Investments and cash deposited is recorded on the Statement of Assets and Liabilities. During the term of a cleared swap agreement, a "variation margin" amount may be required to be paid by the Fund or may be received by the Fund, based on the daily change in price of the underlying reference instrument subject to the swap agreement and is recorded as a receivable or payable for variation margin in the Statement of Assets and Liabilities until the centrally cleared swap is terminated at which time a realized gain or loss is recorded.
A CDS is an agreement between Counterparties to exchange the credit risk of an issuer. A buyer of a CDS is said to buy protection by paying a fixed payment over the life of the agreement and in some situations an upfront payment to the seller of the CDS. If a defined credit event occurs (such as payment default or bankruptcy), the Fund as a protection buyer would cease paying its fixed payment, the Fund would deliver eligible bonds issued by the reference entity to the seller, and the seller would pay the full notional value, or the "par value", of the referenced obligation to the Fund. A seller of a CDS is said to sell protection and thus would receive a fixed payment over the life of the agreement and an upfront payment, if applicable. If a credit event occurs, the Fund as a protection seller would cease to receive the fixed payment stream, the Fund would pay the buyer "par value" or the full notional value of the referenced obligation, and the Fund would receive the eligible bonds issued by the reference entity. In turn, these bonds may be sold in order to realize a recovery value. Alternatively, the seller of the CDS and its Counterparty may agree to net the notional amount and the market value of the bonds and make a cash payment equal to the difference to the buyer of protection. If no credit event occurs, the Fund receives the fixed payment over the life of the agreement. As the seller, the Fund would effectively add leverage to its portfolio because, in addition to its total net assets, the Fund would be subject to investment exposure on the notional amount of the CDS. In connection with these agreements, cash and securities may be identified as collateral in accordance with the terms of the respective swap agreements to provide assets of value and recourse in the event of default under the swap agreement or bankruptcy/insolvency of a party to the swap agreement. If a Counterparty becomes bankrupt or otherwise fails to perform its obligations due to financial difficulties, the Fund may experience significant delays in obtaining any recovery in a bankruptcy or other reorganization proceeding. The Fund may obtain only limited recovery or may obtain no recovery in such circumstances. The Fund's maximum risk of loss from Counterparty risk, either as the protection seller or as the protection buyer, is the value of the contract. The risk may be mitigated by having a master netting arrangement between the Fund and the Counterparty and by the designation of collateral by the Counterparty to cover the Fund's exposure to the Counterparty.
31 | Invesco Corporate Bond Fund |
Implied credit spreads represent the current level at which protection could be bought or sold given the terms of the existing CDS contract and serve as an indicator of the current status of the payment/performance risk of the CDS. An implied spread that has widened or increased since entry into the initial contract may indicate a deteriorating credit profile and increased risk of default for the reference entity. A declining or narrowing spread may indicate an improving credit profile or decreased risk of default for the reference entity. Alternatively, credit spreads may increase or decrease reflecting the general tolerance for risk in the credit markets.
An interest rate swap is an agreement between Counterparties pursuant to which the parties exchange a floating rate payment for a fixed rate payment based on a specified notional amount.
Changes in the value of centrally cleared and OTC swap agreements are recognized as unrealized gains (losses) in the Statement of Operations by "marking to market" on a daily basis to reflect the value of the swap agreement at the end of each trading day. Payments received or paid at the beginning of the agreement are reflected as such on the Statement of Assets and Liabilities and may be referred to as upfront payments. The Fund accrues for the fixed payment stream and amortizes upfront payments, if any, on swap agreements on a daily basis with the net amount, recorded as a component of realized gain (loss) on the Statement of Operations. A liquidation payment received or made at the termination of a swap agreement is recorded as realized gain (loss) on the Statement of Operations. The Fund segregates cash or liquid securities having a value at least equal to the amount of the potential obligation of a Fund under any swap transaction. Cash held as collateral is recorded as deposits with brokers on the Statement of Assets and Liabilities. Entering into these agreements involves, to varying degrees, lack of liquidity and elements of credit, market, and Counterparty risk in excess of amounts recognized on the Statement of Assets and Liabilities. Such risks involve the possibility that a swap is difficult to sell or liquidate; the Counterparty does not honor its obligations under the agreement and unfavorable interest rates and market fluctuations. It is possible that developments in the swaps market, including potential government regulation, could adversely affect the Fund's ability to terminate existing swap agreements or to realize amounts to be received under such agreements. Additionally, ISDA master agreements include credit related contingent features which allow Counterparties to OTC derivatives to terminate derivative contracts prior to maturity in the event that, for example, the Fund's net assets decline by a stated percentage or the Fund fails to meet the terms of its ISDA master agreements, which would cause the Fund to accelerate payment of any net liability owed to the Counterparty. A short position in a security poses more risk than holding the same security long. As there is no limit on how much the price of the security can increase, the Fund's exposure is unlimited.
Notional amounts of each individual credit default swap agreement outstanding as of February 29, 2020 for which the Fund is the seller of protection are disclosed in the open swap agreements table. These potential amounts would be partially offset by any recovery values of the respective referenced obligations, upfront payments received upon entering into the agreement, or net amounts received from the settlement of buy protection credit default swap agreements entered into by the Fund for the same referenced entity or entities.
N.Other Risks - Active trading of portfolio securities may result in added expenses, a lower return and increased tax liability.
O.Leverage Risk — Leverage exists when the Fund can lose more than it originally invests because it purchases or sells an instrument or enters into a transaction without investing an amount equal to the full economic exposure of the instrument or transaction.
P.Collateral —To the extent the Fund has designated or segregated a security as collateral and that security is subsequently sold, it is the Fund's practice to replace such collateral no later than the next business day.
NOTE 2—Advisory Fees and Other Fees Paid to Affiliates
The Trust has entered into a master investment advisory agreement with Invesco Advisers, Inc. (the "Adviser" or "Invesco"). Under the terms of the investment advisory agreement, the Fund accrues daily and pays monthly an advisory fee to the Adviser based on the annual rate of the Fund's average daily net assets as follows:
Average Daily Net Assets | Rate |
First $500 million | 0.420% |
Next $750 million | 0.350% |
Over $1.25 billion | 0.220% |
| |
For the year ended February 29, 2020, the effective advisory fee rate incurred by the Fund was 0.33%.
Under the terms of a master sub-advisory agreement between the Adviser and each of Invesco Asset Management Deutschland GmbH, Invesco Asset Management Limited, Invesco Asset Management (Japan) Limited, Invesco Hong Kong Limited, Invesco Senior Secured Management, Inc. and Invesco Canada Ltd. (collectively, the "Affiliated Sub-Advisers") the Adviser, not the Fund, will pay 40% of the fees paid to the Adviser to any such Affiliated Sub-Adviser(s) that provide(s) discretionary investment management services to the Fund based on the percentage of assets allocated to such Affiliated Sub-Adviser(s).
The Adviser has contractually agreed, through at least June 30, 2020, to waive advisory fees and/or reimburse expenses of all shares to the extent necessary to limit total annual fund operating expenses after fee waiver and/or expense reimbursement (excluding certain items discussed below) of Class A, Class C, Class R, Class Y, Class R5 and Class R6 shares to 1.50%, 2.25%, 1.75%, 1.25%, 1.25% and 1.25%, respectively, of the Fund's average daily net assets (the "expense limits"). In determining the Adviser's obligation to waive advisory fees and/or reimburse expenses, the following expenses are not taken into account, and could cause the total annual fund operating expenses after fee waiver and/or reimbursement to exceed the numbers reflected above: (1) interest; (2) taxes; (3) dividend expense on short sales; (4) extraordinary or non-routine items, including litigation expenses; and (5) expenses that the Fund has incurred but did not actually pay because of an expense offset arrangement. Unless Invesco continues the fee waiver agreement, it will terminate on June 30, 2020. During its term, the fee waiver agreement cannot be terminated or amended to increase the expense limits or reduce the advisory fee waivers without approval of the Board of Trustees. The Adviser did not waive fees and/or reimburse expenses during the period under this expense limit.
The Adviser has contractually agreed, through at least June 30, 2021, to waive the advisory fee payable by the Fund in an amount equal to 100% of the net advisory fees the Adviser receives from the affiliated money market funds on investments by the Fund of uninvested cash in such affiliated money market funds.
For the year ended February 29, 2020, the Adviser waived advisory fees of $40,754.
The Trust has entered into a master administrative services agreement with Invesco pursuant to which the Fund has agreed to pay Invesco for certain administrative costs incurred in providing accounting services to the Fund. For the year ended February 29, 2020, expenses incurred under the agreement are shown in the Statement of Operations as Administrative services fees. Invesco has entered into a sub-administration agreement whereby State Street Bank and Trust Company ("SSB") serves as fund accountant and provides certain administrative services to the Fund. Pursuant to a custody agreement with the Trust on behalf of the Fund, SSB also serves as the Fund's custodian.
The Trust has entered into a transfer agency and service agreement with Invesco Investment Services, Inc. ("IIS") pursuant to which the Fund has agreed to pay IIS a fee for providing transfer agency and shareholder services to the Fund and reimburse IIS for certain expenses incurred by IIS in the course of providing such services. IIS may make payments to intermediaries that provide omnibus account services, sub-accounting services and/or networking services. All fees payable by IIS to intermediaries that provide omnibus account services or sub-accounting services are charged back to the Fund, subject to certain limitations approved by the Trust's Board of Trustees. For the year ended February 29, 2020, expenses incurred under the agreement are shown in the Statement of Operations as Transfer agent fees.
Shares of the Fund are distributed by Invesco Distributors, Inc. ("IDI"). The Fund has adopted a distribution plan pursuant to Rule 12b-1 under the 1940 Act, and a service plan (collectively, the "Plans") for Class A shares, Class C shares and Class R shares to compensate IDI for the sale, distribution, shareholder servicing and
32 | Invesco Corporate Bond Fund |
maintenance of shareholder accounts for these shares. Under the Plans, the Fund will incur annual fees of up to 0.25% of Class A average daily net assets and up to 1.00% of Class C average daily net assets and 0.50% of Class R average daily net assets. The fees are accrued daily and paid monthly.
With respect to Class C shares, the Fund is authorized to reimburse in future years any distribution related expenses that exceed the maximum annual reimbursement rate for such class, so long as such reimbursement does not cause the Fund to exceed the Class C maximum annual reimbursement rate, respectively. With respect to Class A shares, distribution related expenses that exceed the maximum annual reimbursement rate for such class are not carried forward to future years and the Fund will not reimburse IDI for any such expenses.
Front-end sales commissions and CDSC (collectively, the "sales charges") are not recorded as expenses of the Fund. Front-end sales commissions are deducted from proceeds from the sales of Fund shares prior to investment in Class A shares of the Fund. CDSC are deducted from redemption proceeds prior to remittance to the shareholder. During the year ended February 29, 2020, IDI advised the Fund that IDI retained $189,239 in front-end sales commissions from the sale of Class A shares and $17,377 and $2,812 from Class A and Class C shares, respectively, for CDSC imposed upon redemptions by shareholders.
Certain officers and trustees of the Trust are officers and directors of the Adviser, IIS and/or IDI.
NOTE 3—Additional Valuation Information
GAAP defines fair value as the price that would be received to sell an asset or paid to transfer a liability in an orderly transaction between market participants at the measurement date, under current market conditions. GAAP establishes a hierarchy that prioritizes the inputs to valuation methods, giving the highest priority to readily available unadjusted quoted prices in an active market for identical assets (Level 1) and the lowest priority to significant unobservable inputs (Level 3), generally when market prices are not readily available or are unreliable. Based on the valuation inputs, the securities or other investments are tiered into one of three levels. Changes in valuation methods may result in transfers in or out of an investment's assigned level:
Level 1 – Prices are determined using quoted prices in an active market for identical assets.
Level 2 – Prices are determined using other significant observable inputs. Observable inputs are inputs that other market participants may use in pricing a security. These may include quoted prices for similar securities, interest rates, prepayment speeds, credit risk, yield curves, loss severities, default rates, discount rates, volatilities and others.
Level 3 – Prices are determined using significant unobservable inputs. In situations where quoted prices or observable inputs are unavailable (for example, when there is little or no market activity for an investment at the end of the period), unobservable inputs may be used. Unobservable inputs reflect the Fund's own assumptions about the factors market participants would use in determining fair value of the securities or instruments and would be based on the best available information.
The following is a summary of the tiered valuation input levels, as of February 29, 2020. The level assigned to the securities valuations may not be an indication of the risk or liquidity associated with investing in those securities. Because of the inherent uncertainties of valuation, the values reflected in the financial statements may materially differ from the value received upon actual sale of those investments.
| | Level 1 | Level 2 | | Level 3 | Total |
Investments in Securities | | | | | | | | |
U.S. Dollar Denominated Bonds & Notes | $ | — | $1,937,711,759 | $ | — | $1,937,711,759 | |
U.S. Treasury Securities | | — | 107,099,495 | | — | 107,099,495 | |
Preferred Stocks | | 36,071,720 | — | | — | 36,071,720 | |
Asset-Backed Securities | | — | 28,413,938 | | — | 28,413,938 | |
Variable Rate Senior Loan Interests | | — | — | | 12,379,457 | 12,379,457 | |
Non-U.S. Dollar Denominated Bonds & Notes | | — | 11,249,536 | | — | 11,249,536 | |
Municipal Obligations | | — | 5,301,625 | | 234,330 | 5,535,955 | |
Common Stocks & Other Equity Interests | | 1,633 | — | | 1 | 1,634 | | |
Money Market Funds | | 64,336,001 | — | | — | 64,336,001 | |
Options Purchased | | 888,558 | — | | — | 888,558 | | |
Total Investments in Securities | | 101,297,912 | 2,089,776,353 | | 12,613,788 | 2,203,688,053 | |
Other Investments - Assets* | | | | | | | | |
Futures Contracts | | 5,135,670 | — | | — | 5,135,670 | |
Forward Foreign Currency Contracts | | — | 165,248 | | — | 165,248 | | |
Swap Agreements | | — | 2,087,937 | | — | 2,087,937 | |
| | 5,135,670 | 2,253,185 | | — | 7,388,855 | |
Other Investments - Liabilities* | | | | | | | | |
Futures Contracts | | (3,185,904) | — | | — | (3,185,904) |
| | | | | | | |
Forward Foreign Currency Contracts | | — | (180,409) | | — | (180,409) |
| | | | | | | |
Options Written | | (17,760) | (869,157) | | — | (886,917) |
| | | | | | | |
| | (3,203,664) | (1,049,566) | | — | (4,253,230) |
Total Other Investments | | 1,932,006 | 1,203,619 | | — | 3,135,625 | |
Total Investments | $103,229,918 | $2,090,979,972 | $ | 12,613,788 | $2,206,823,678 | |
*Forward foreign currency contracts, futures contracts and swap agreements are valued at unrealized appreciation (depreciation). Options written are shown at value.
NOTE 4—Derivative Investments
The Fund may enter into an International Swaps and Derivatives Association Master Agreement ("ISDA Master Agreement") under which a fund may trade OTC derivatives. An OTC transaction entered into under an ISDA Master Agreement typically involves a collateral posting arrangement, payment netting provisions and close-out netting provisions. These netting provisions allow for reduction of credit risk through netting of contractual obligations. The enforceability of the netting provisions of the ISDA Master Agreement depends on the governing law of the ISDA Master Agreement, among other factors.
For financial reporting purposes, the Fund does not offset OTC derivative assets or liabilities that are subject to ISDA Master Agreements in the Statement of Assets and Liabilities.
33 | Invesco Corporate Bond Fund |
Value of Derivative Investments at Period-End
The table below summarizes the value of the Fund's derivative investments, detailed by primary risk exposure, held as of February 29, 2020:
| | | | | | | Value | | | | | | |
| | | Credit | | Currency | | Equity | | Interest | | | | |
Derivative Assets | | | Risk | | Risk | | Risk | | Rate Risk | | Total | |
Unrealized appreciation on futures contracts — Exchange-Traded(a) | $ | - | $ | - | $ | - | $ | 5,135,670 | $ | 5,135,670 |
Unrealized appreciation on swap agreements — Centrally Cleared(a) | | | 2,087,937 | | - | | - | | - | | 2,087,937 | |
Unrealized appreciation on forward foreign currency contracts | | | | | | | | | | | | | |
outstanding | | | - | | 165,248 | | - | | - | | 165,248 | |
Options purchased, at value — Exchange-Traded | | | - | | - | | 888,558 | | - | | 888,558 | |
| | | | | | | | | | | | |
Total Derivative Assets | | | 2,087,937 | | 165,248 | | 888,558 | | 5,135,670 | | 8,277,413 | |
Derivatives not subject to master netting agreements | | | (2,087,937) | | - | | (888,558) | | (5,135,670) | | (8,112,165) |
| | | | | | | | | | | |
Total Derivative Assets subject to master netting agreements | $ | - | $ | 165,248 | $ | - | $ | - | $ | 165,248 | |
| | | | | | | Value | | | | | | |
| | | Credit | | Currency | | Equity | | Interest | | | | |
Derivative Liabilities | | | Risk | | Risk | | Risk | | Rate Risk | | Total | |
Unrealized depreciation on futures contracts — Exchange-Traded(a) | $ | - | $ | - | $ | - | $(3,185,904) | $(3,185,904) |
Unrealized depreciation on forward foreign currency contracts | | | | | | | | | | | | | |
outstanding | | | - | | (180,409) | | - | | - | | (180,409) |
| | | | | | | | | | | | |
Options written, at value — Exchange-Traded | | | - | | - | | (17,760) | | - | | (17,760) |
| | | | | | | | | | | | |
Options written, at value — OTC | | | (869,157) | | - | | - | | - | | (869,157) |
| | | | | | | | | | | | |
Total Derivative Liabilities | | | (869,157) | | (180,409) | | (17,760) | | (3,185,904) | | (4,253,230) |
Derivatives not subject to master netting agreements | | | - | | - | | 17,760 | | 3,185,904 | | 3,203,664 | |
| | | | | | | | | | |
Total Derivative Liabilities subject to master netting agreements | $ | (869,157) | $(180,409) | $ | - | $ | - | $ | (1,049,566) |
| | | | | | | | | | | | | |
(a)The daily variation margin receivable (payable) at period-end is recorded in the Statement of Assets and Liabilities.
Offsetting Assets and Liabilities
The table below reflects the Fund's exposure to Counterparties subject to either an ISDA Master Agreement or other agreement for OTC derivative transactions as of February 29, 2020.
| Financial Derivative Assets | Financial Derivative Liabilities | | | | | | | |
| Forward | | | Forward | | | | | | | | | | |
| Foreign | | Foreign | | | | | | | | | | |
| Currency | | Currency | | Options | | Total | Net Value of | Collateral | Net | |
Counterparty | Contracts | Contracts | | Written | | Liabilities | Derivatives | (Received/Pledged) | Amount | |
Canadian Imperial Bank of Commerce | $163,537 | | $ | - | $ | - | | $ | - | $ 163,537 | $- | $- | $ 163,537 | |
Citibank N.A. | - | | | (5,166) | | - | | | (5,166) | (5,166) | - | - | (5,166) | |
| | | | | | | | | | | | | | |
Goldman Sachs International | 1,711 | | | (175,243) | | - | | | (175,243) | (173,532) | - | - | (173,532) | |
| | | | | | | | | | | | | | |
Morgan Stanley and Co. International PLC | - | | | - | | (869,157) | | | (869,157) | (869,157) | - | - | (869,157) | |
| | | | | | | | | | | |
Total | $165,248 | | $(180,409) | $(869,157) | | $(1,049,566) | $(884,318) | $- | $- | $(884,318) | |
| | | | | | | | | | | | | | |
Effect of Derivative Investments for the year ended February 29, 2020
The table below summarizes the gains (losses) on derivative investments, detailed by primary risk exposure, recognized in earnings during the period:
| | | | | Location of Gain (Loss) on | | | | |
| | | | | Statement of Operations | | | | |
| | | Credit | Currency | | Equity | | Interest | | |
| | | Risk | Risk | | Risk | | Rate Risk | Total |
Realized Gain (Loss): | | | | | | | | | | |
Forward foreign currency contracts | $ | - | $416,951 | $ | - | $ | - | $ 416,951 | |
Futures contracts | | | - | - | | - | | 2,352,505 | 2,352,505 |
Options purchased(a) | | | - | - | | 898,746 | | - | 898,746 | |
Options written | | | 223,873 | - | | (45,157) | | - | 178,716 | |
| | | | | | | | | | |
Swap agreements | | | (166,390) | - | | - | | - | (166,390) |
| | | | | | | | | | |
34 | Invesco Corporate Bond Fund |

| | | | | | Location of Gain (Loss) on | | | | | | |
| | | | | | Statement of Operations | | | | | | |
| | | Credit | Currency | | Equity | | Interest | | | | |
| | | Risk | | Risk | | Risk | | Rate Risk | | Total |
Change in Net Unrealized Appreciation (Depreciation): | | | | | | | | | | | | | |
Forward foreign currency contracts | $ | - | $ | (7,988) | $ | - | $ | - | $ | (7,988) |
Futures contracts | | | - | | - | | - | | 2,152,996 | | 2,152,996 | |
| | | | | | | | | | | | | |
Options purchased(a) | | | - | | - | | (434,528) | | - | | (434,528) |
| | | | | | | | | | | | |
Options written | | | (650,353) | | - | | 46,656 | | - | | (603,697) |
Swap agreements | | | 2,087,937 | | - | | - | | - | | 2,087,937 | |
| | | | | | | | | | |
Total | $ | 1,495,067 | $408,963 | $ | 465,717 | $4,505,501 | $ | 6,875,248 | | |
(a)Options purchased are included in the net realized gain (loss) from investment securities and the change in net unrealized appreciation (depreciation) of investment securities.
The table below summarizes the average notional value of derivatives held during the period.
| Forward | | Equity | Index | Equity | | |
| Foreign Currency | Futures | Options | Options | Options | Swaptions | Swap |
| Contracts | Contracts | Purchased | Purchased | Written | Written | Agreements |
Average notional value | $19,436,658 | $404,164,354 | $2,651,988 | $14,623,333 | $856,221 | $50,460,000 | $70,924,788 |
| | | | | | | |
Average Contracts | — | — | 237 | 48 | 33 | — | — |
NOTE 5—Expense Offset Arrangement(s) | | | | | | | |
The expense offset arrangement is comprised of transfer agency credits which result from balances in demand deposit accounts used by the transfer agent for clearing shareholder transactions. For the year ended February 29, 2020, the Fund received credits from this arrangement, which resulted in the reduction of the Fund's total expenses of $9,887.
NOTE 6—Trustees' and Officers' Fees and Benefits
Trustees' and Officers' Fees and Benefits include amounts accrued by the Fund to pay remuneration to certain Trustees and Officers of the Fund. Trustees have the option to defer compensation payable by the Fund, and Trustees' and Officers' Fees and Benefits also include amounts accrued by the Fund to fund such deferred compensation amounts. Those Trustees who defer compensation have the option to select various Invesco Funds in which their deferral accounts shall be deemed to be invested. Finally, certain current Trustees were eligible to participate in a retirement plan that provided for benefits to be paid upon retirement to Trustees over a period of time based on the number of years of service. The Fund may have certain former Trustees who also participate in a retirement plan and receive benefits under such plan. Trustees' and Officers' Fees and Benefits include amounts accrued by the Fund to fund such retirement benefits. Obligations under the deferred compensation and retirement plans represent unsecured claims against the general assets of the Fund.
NOTE 7—Cash Balances
The Fund is permitted to temporarily carry a negative or overdrawn balance in its account with SSB, the custodian bank. Such balances, if any at period-end, are shown in the Statement of Assets and Liabilities under the payable caption Amount due custodian. To compensate the custodian bank for such overdrafts, the overdrawn Fund may either (1) leave funds as a compensating balance in the account so the custodian bank can be compensated by earning the additional interest; or (2) compensate by paying the custodian bank at a rate agreed upon by the custodian bank and Invesco, not to exceed the contractually agreed upon rate. The Fund may not purchase additional securities when any borrowings from banks or broker-dealers exceed 5% of the Fund's total assets, or when any borrowings from an Invesco Fund are outstanding.
NOTE 8—Distributions to Shareholders and Tax Components of Net Assets
Tax Character of Distributions to Shareholders Paid During the Fiscal Years Ended February 29, 2020 and February 28, 2019:
| | 2020 | 2019 | | |
Ordinary income | $67,113,688 | $64,595,437 | |
Long-term capital gain | — | 401,493 | | |
| | | | | |
Total distributions | $67,113,688 | $64,996,930 | |
Tax Components of Net Assets at Period-End: | | | | |
| | | 2020 | | |
Undistributed ordinary income | | $ 26,598,989 | |
Net unrealized appreciation — investments | | 134,408,913 | |
| | | | |
Net unrealized appreciation - foreign currencies | | 2,555 | | |
Temporary book/tax differences | | (193,820) |
Shares of beneficial interest | | 2,053,510,712 | |
| | | |
Total net assets | | $2,214,327,349 | |
The difference between book-basis and tax-basis unrealized appreciation (depreciation) is due to differences in the timing of recognition of gains and losses on investments for tax and book purposes. The Fund's net unrealized appreciation (depreciation) difference is attributable primarily to futures, straddle loss deferrals and book to tax accretion and amortization differences.
35 | Invesco Corporate Bond Fund |

The temporary book/tax differences are a result of timing differences between book and tax recognition of income and/or expenses. The Fund's temporary book/tax differences are the result of the trustee deferral of compensation and retirement plan benefits.
Capital loss carryforward is calculated and reported as of a specific date. Results of transactions and other activity after that date may affect the amount of capital loss carryforward actually available for the Fund to utilize. The ability to utilize capital loss carryforward in the future may be limited under the Internal Revenue Code and related regulations based on the results of future transactions.
The Fund does not have a capital loss carryforward as of February 29, 2020.
NOTE 9—Investment Transactions
The aggregate amount of investment securities (other than short-term securities, U.S. Treasury obligations and money market funds, if any) purchased and sold by the Fund during the year ended February 29, 2020 was $1,980,347,859 and $1,449,518,935, respectively. During the same period, purchases and sales of
U.S. Treasury obligations were $1,895,435,675 and $1,925,505,630, respectively. Cost of investments, including any derivatives, on a tax basis includes the adjustments for financial reporting purposes as of the most recently completed federal income tax reporting period-end.
Unrealized Appreciation (Depreciation) of Investments on a Tax Basis
Aggregate unrealized appreciation of investments | $146,103,393 | |
Aggregate unrealized (depreciation) of investments | (11,694,480) |
Net unrealized appreciation of investments | $134,408,913 | |
Cost of investments for tax purposes is $2,072,633,569.
NOTE 10—Reclassification of Permanent Differences
Primarily as a result of differing book/tax treatment of bond premiums, swap income, distributions and foreign currency, on February 29, 2020, undistributed net investment income was increased by $1,694,197 and undistributed net realized gain was decreased by $1,694,197. This reclassification had no effect on the net assets or the distributable earnings of the Fund.
NOTE 11—Share Information
Summary of Share Activity
| Year ended | | Year ended |
| February 29, 2020(a) | | | February 28, 2019 | |
| Shares | Amount | | Shares | | Amount |
Sold: | | | | | | | | | |
Class A | 35,473,678 | $ 265,742,466 | 22,630,208 | $ | 158,265,062 | |
Class C | 4,995,520 | 37,734,235 | 1,644,529 | | 11,664,181 | |
Class R | 846,111 | 6,311,286 | 299,482 | | 2,104,226 | | |
Class Y | 36,561,873 | 274,343,654 | 6,772,125 | | 47,607,764 | |
Class R5 | 240,168 | 1,800,871 | 527,336 | | 3,768,703 | | |
Class R6 | 24,644,498 | 184,754,126 | 16,991,650 | | 120,048,362 | |
Issued as reinvestment of dividends: | | | | | | | | | |
Class A | 4,531,180 | 33,863,830 | 5,046,534 | | 35,328,974 | | |
Class C | 144,917 | 1,094,634 | 278,543 | | 1,966,430 | | |
Class R | 41,726 | 312,904 | 40,314 | | 282,480 | | |
Class Y | 704,707 | 5,325,759 | 319,405 | | 2,239,815 | |
Class R5 | 39,872 | 298,388 | 41,138 | | 288,128 | | |
Class R6 | 2,262,580 | 16,973,096 | 2,471,199 | | 17,337,173 | |
Automatic conversion of Class C shares to Class A shares: | | | | | | | | | |
Class A | 430,893 | 3,202,034 | - | | - | | |
Class C | (427,339) | (3,202,034) | - | | - | | |
Reacquired: | | | | | | | | | |
Class A | (21,473,851) | (160,124,073) | (28,738,755) | | (201,138,812) |
| | | | | | |
Class C | (1,503,420) | (11,310,245) | (8,085,359) | | (56,884,713) |
| | | | | | |
Class R | (276,033) | (2,046,198) | (356,893) | | (2,490,717) |
| | | | | | |
Class Y | (5,650,686) | (42,566,131) | (6,948,007) | | (48,879,257) |
| | | | | | |
Class R5 | (160,791) | (1,197,030) | (126,151) | | (888,238) |
| | | | | | |
Class R6 | (10,627,583) | (79,138,989) | (21,631,387) | | (151,622,207) |
| | | | | | |
Net increase (decrease) in share activity | 70,798,020 | $ 532,172,583 | (8,824,089) | $ | (61,002,646) |
| | | | | | | | | |
(a)There are entities that are record owners of more than 5% of the outstanding shares of the Fund and in the aggregate own 66% of the outstanding shares of the Fund. IDI has an agreement with these entities to sell Fund shares. The Fund, Invesco and/or Invesco affiliates may make payments to these entities, which are considered to be related to the Fund, for providing services to the Fund, Invesco and/or Invesco affiliates including but not limited to services such as securities brokerage, distribution, third party record keeping and account servicing. The Fund has no knowledge as to whether all or any portion of the shares owned of record by these entities are also owned beneficially.
36 | Invesco Corporate Bond Fund |
NOTE 12—Subsequent Event
During the first quarter of 2020, the World Health Organization declared the coronavirus (COVID-19) to be a public health emergency. COVID-19 has led to increased short-term market volatility and may have adverse long-term effects on U.S. and world economies and markets in general. COVID-19 may adversely impact the Fund's ability to achieve its investment objective. Because of the uncertainties on valuation, the global economy and business operations, values reflected in these financial statements may materially differ from the value received upon actual sales of those investments.
The Coronavirus Aid, Relief, and Economic Security Act, commonly referred to as the "CARES Act," was signed into law on March 27, 2020 by President Trump. The Adviser is assessing the components of the Act, and the impacts to the Fund should be immaterial.
37 | Invesco Corporate Bond Fund |
Report of Independent Registered Public Accounting Firm
To the Board of Trustees of AIM Investment Securities Funds (Invesco Investment Securities Funds) and Shareholders of Invesco Corporate Bond
Opinion on the Financial Statements
We have audited the accompanying statement of assets and liabilities, including the schedule of investments, of Invesco Corporate Bond (one of the funds constituting AIM Investment Securities Funds (Invesco Investment Securities Funds), hereafter referred to as the "Fund") as of February 29, 2020, the related statement of operations for the year ended February 29, 2020, the statement of changes in net assets for each of the two years in the period ended February 29, 2020, including the related notes, and the financial highlights for each of the five years in the period ended February 29, 2020 (collectively referred to as the financial statements). In our opinion, the financial statements present fairly, in all material respects, the financial position of the Fund as of February 29, 2020, the results of its operations for the year then ended, the changes in its net assets for each of the two years in the period ended February 29, 2020 and the financial highlights financial highlights for each of the five years in the period ended February 29, 2020 in conformity with accounting principles generally accepted in the United States of America.
Basis for Opinion
These financial statements are the responsibility of the Fund's management. Our responsibility is to express an opinion on the Fund's financial statements based on our audits. We are a public accounting firm registered with the Public Company Accounting Oversight Board (United States) (PCAOB) and are required to be independent with respect to the Fund in accordance with the U.S. federal securities laws and the applicable rules and regulations of the Securities and Exchange Commission and the
PCAOB.
We conducted our audits of these financial statements in accordance with the standards of the PCAOB. Those standards require that we plan and perform the audit to obtain reasonable assurance about whether the financial statements are free of material misstatement, whether due to error or fraud.
Our audits included performing procedures to assess the risks of material misstatement of the financial statements, whether due to error or fraud, and performing procedures that respond to those risks. Such procedures included examining, on a test basis, evidence regarding the amounts and disclosures in the financial statements. Our audits also included evaluating the accounting principles used and significant estimates made by management, as well as evaluating the overall presentation of the financial statements. Our procedures included confirmation of securities owned as of February 29, 2020 by correspondence with the custodian, transfer agent and brokers; when replies were not received from brokers, we performed other auditing procedures. We believe that our audits provide a reasonable basis for our opinion.
/s/PricewaterhouseCoopers LLP
Houston, Texas
April 28, 2020
We have served as the auditor of one or more of the investment companies in the Invesco group of investment companies since at least 1995. We have not been able to determine the specific year we began serving as auditor.
38 | Invesco Corporate Bond Fund |
Calculating your ongoing Fund expenses
Example
As a shareholder of the Fund, you incur two types of costs: (1) transaction costs, which may include sales charges (loads) on purchase payments or contingent deferred sales charges on redemptions, if any; and (2) ongoing costs, including management fees, distribution and/or service (12b-1) fees, and other Fund expenses. This example is intended to help you understand your ongoing costs (in dollars) of investing in the Fund and to compare these costs with ongoing costs of investing in other mutual funds. The example is based on an investment of $1,000 invested at the beginning of the period and held for the entire period September 1, 2019 through February 29, 2020.
Actual expenses
The table below provides information about actual account values and actual expenses. You may use the information in this table, together with the amount you invested, to estimate the expenses that you paid over the period. Simply divide your account value by $1,000 (for example, an $8,600 account value divided by $1,000 = 8.6), then multiply the result by the number in the table under the heading entitled "Actual Expenses Paid During Period" to estimate the expenses you paid on your account during this period.
Hypothetical example for comparison purposes
The table below also provides information about hypothetical account values and hypothetical expenses based on the Fund's actual expense ratio and an assumed rate of return of 5% per year before expenses, which is not the Fund's actual return.
The hypothetical account values and expenses may not be used to estimate the actual ending account balance or expenses you paid for the period. You may use this information to compare the ongoing costs of investing in the Fund and other funds. To do so, compare this 5% hypothetical example with the 5% hypothetical examples that appear in the shareholder reports of the other funds.
Please note that the expenses shown in the table are meant to highlight your ongoing costs only and do not reflect any transaction costs, such as sales charges (loads) on purchase payments or contingent deferred sales charges on redemptions, if any. Therefore, the hypothetical information is useful in comparing ongoing costs only, and will not help you determine the relative total costs of owning different funds. In addition, if these transaction costs were included, your costs would have been higher.
| | | | | HYPOTHETICAL | |
| | | | | (5% annual return before | |
| | | ACTUAL | | expenses) | |
| Beginning | Ending | | Expenses | Ending | | Expenses | Annualized |
| Account Value | Account Value | | Paid During | Account Value | | Paid During | Expense |
| (09/01/19) | (02/29/20)1 | | Period2 | (02/29/20) | | Period2 | Ratio |
Class A | $1,000.00 | $1,042.00 | | $3.91 | $1,021.03 | | $3.87 | 0.77% |
| | | | | | | | |
Class C | 1,000.00 | 1,039.20 | | 7.71 | 1,017.30 | | 7.62 | 1.52 |
| | | | | | | | |
Class R | 1,000.00 | 1,040.70 | | 5.18 | 1,019.79 | | 5.12 | 1.02 |
| | | | | | | | |
Class Y | 1,000.00 | 1,043.20 | | 2.64 | 1,022.28 | | 2.61 | 0.52 |
Class R5 | 1,000.00 | 1,043.50 | | 2.39 | 1,022.53 | | 2.36 | 0.47 |
| | | | | | | | |
Class R6 | 1,000.00 | 1,043.90 | | 1.93 | 1,022.97 | | 1.91 | 0.38 |
1The actual ending account value is based on the actual total return of the Fund for the period September 1, 2019 through February 29, 2020, after actual expenses and will differ from the hypothetical ending account value which is based on the Fund's expense ratio and a hypothetical annual return of 5% before expenses.
2Expenses are equal to the Fund's annualized expense ratio as indicated above multiplied by the average account value over the period, multiplied by 182/366 to reflect the most recent fiscal half year.
39 | Invesco Corporate Bond Fund |
Tax Information
Form 1099-DIV, Form 1042-S and other year-end tax information provide shareholders with actual calendar year amounts that should be included in their tax returns. Shareholders should consult their tax advisors.
The following distribution information is being provided as required by the Internal Revenue Code or to meet a specific state's requirement.
The Fund designates the following amounts or, if subsequently determined to be different, the maximum amount allowable for its fiscal year ended February 29, 2020:
Federal and State Income Tax
Qualified Dividend Income* | 6.61% |
Corporate Dividends Received Deduction* | 6.54% |
U.S. Treasury Obligations* | 2.98% |
* The above percentages are based on ordinary income dividends paid to shareholders during the Fund's fiscal year.
40 | Invesco Corporate Bond Fund |
Trustees and Officers
The address of each trustee and officer is AIM Investment Securities Funds (Invesco Investment Securities Funds) (the "Trust"), 11 Greenway Plaza, Suite 1000, Houston, Texas 77046-1173. The trustees serve for the life of the Trust, subject to their earlier death, incapacitation, resignation, retirement or removal as more specifically provided in the Trust's organizational documents. Each officer serves for a one year term or until their successors are elected and qualified. Column two below includes length of time served with predecessor entities, if any.
| Trustee | | Number of | Other |
Name, Year of Birth and | | Funds in | Directorship(s) |
and/or | | Fund Complex | Held by Trustee |
Position(s) | Officer | Principal Occupation(s) | Overseen by | During Past 5 |
Held with the Trust | Since | During Past 5 Years | Trustee | Years |
Interested Trustee | | | | |
Martin L. Flanagan1 — 1960 | 2007 | Executive Director, Chief Executive Officer and President, Invesco Ltd. | 229 | None |
Trustee and Vice Chair | | (ultimate parent of Invesco and a global investment management firm); | | |
| | Trustee and Vice Chair, The Invesco Funds; Vice Chair, Investment Company | | |
| | Institute; and Member of Executive Board, SMU Cox School of Business | | |
| | Formerly: Advisor to the Board, Invesco Advisers, Inc. (formerly known as | | |
| | Invesco Institutional (N.A.), Inc.); Chairman and Chief Executive Officer, | | |
| | Invesco Advisers, Inc. (registered investment adviser); Director, Chairman, | | |
| | Chief Executive Officer and President, Invesco Holding Company (US), Inc. | | |
| | (formerly IVZ Inc.) (holding company), Invesco Group Services, Inc. (service | | |
| | provider) and Invesco North American Holdings, Inc. (holding company); | | |
| | Director, Chief Executive Officer and President, Invesco Holding Company | | |
| | Limited (parent of Invesco and a global investment management firm); | | |
| | Director, Invesco Ltd.; Chairman, Investment Company Institute and President, | | |
| | Co-Chief Executive Officer, Co-President, Chief Operating Officer and Chief | | |
| | Financial Officer, Franklin Resources, Inc. (global investment management | | |
| | organization) | | |
1Mr. Flanagan is considered an interested person (within the meaning of Section 2(a)(19) of the 1940 Act) of the Trust because he is an officer of the Adviser to the Trust, and an officer and a director of Invesco Ltd., ultimate parent of the Adviser.
T-1 | Invesco Corporate Bond Fund |
Trustees and Officers—(continued)
| | | Number of | |
| | | Funds | Other |
| Trustee | | in | Directorship(s) |
Name, Year of Birth and | and/or | | Fund Complex | Held by Trustee |
Position(s) | Officer | Principal Occupation(s) | Overseen by | During Past 5 |
Held with the Trust | Since | During Past 5 Years | Trustee | Years |
Independent Trustees | | | | |
Bruce L. Crockett – 1944 | 1992 | Chairman, Crockett Technologies Associates (technology consulting company) | 229 | Director and |
Trustee and Chair | | Formerly: Director, Captaris (unified messaging provider); Director, President | | Chairman of the |
| | | Audit Committee, |
| | and Chief Executive Officer, COMSAT Corporation; Chairman, Board of | |
| | | ALPS (Attorneys |
| | Governors of INTELSAT (international communications company); ACE Limited | |
| | | Liability |
| | (insurance company); Independent Directors Council and Investment Company | |
| | | Protection |
| | Institute: Member of the Audit Committee, Investment Company Institute; | |
| | | Society) |
| | Member of the Executive Committee and Chair of the Governance Committee, | |
| | | (insurance |
| | Independent Directors Council | |
| | | company); |
| | | |
| | | | Director and |
| | | | Member of the |
| | | | Audit Committee |
| | | | and |
| | | | Compensation |
| | | | Committee, |
| | | | Ferroglobe PLC |
| | | | (metallurgical |
| | | | company) |
David C. Arch – 1945 | 2010 | Chairman of Blistex Inc. (consumer health care products manufacturer); | 229 | Board member of |
Trustee | | Member, World Presidents' Organization | | the Illinois |
| | | | Manufacturers' |
| | | | Association |
Beth Ann Brown – 1968 | 2019 | Independent Consultant | 229 | Director, Board of |
Trustee | | Formerly: Head of Intermediary Distribution, Managing Director, Strategic | | Directors of |
| | | Caron |
| | Relations, Managing Director, Head of National Accounts, Senior Vice | |
| | | Engineering Inc.; |
| | President, National Account Manager and Senior Vice President, Key Account | |
| | | Advisor, Board of |
| | Manager, Columbia Management Investment Advisers LLC; Vice President, Key | |
| | | Advisors of Caron |
| | Account Manager, Liberty Funds Distributor, Inc.; and Trustee of certain | |
| | | Engineering Inc.; |
| | Oppenheimer Funds | |
| | | President and |
| | | |
| | | | Director, Acton |
| | | | Shapleigh Youth |
| | | | Conservation |
| | | | Corps (non - |
| | | | profit); and Vice |
| | | | President and |
| | | | Director of |
| | | | Grahamtastic |
| | | | Connection (non- |
| | | | profit) |
Jack M. Fields – 1952 | 1997 | Chief Executive Officer, Twenty First Century Group, Inc. (government affairs | 229 | Member, Board of Directors of |
Trustee | | company); and Chairman, Discovery Learning Alliance (non-profit) | | Baylor College of Medicine |
| | Formerly: Owner and Chief Executive Officer, Dos Angeles Ranch L.P. (cattle, | | |
| | hunting, corporate entertainment); Director, Insperity, Inc. (formerly known as | | |
| | Administaff) (human resources provider); Chief Executive Officer, Texana | | |
| | Timber LP (sustainable forestry company); Director of Cross Timbers Quail | | |
| | Research Ranch (non-profit); and member of the U.S. House of Representatives | | |
| | | | |
T-2 | Invesco Corporate Bond Fund |

Trustees and Officers—(continued)
| | | Number of | |
| | | Funds | Other |
| Trustee | | in | Directorship(s) |
Name, Year of Birth and | and/or | | Fund Complex | Held by Trustee |
Position(s) | Officer | Principal Occupation(s) | Overseen by | During Past 5 |
Held with the Trust | Since | During Past 5 Years | Trustee | Years |
Independent Trustees—(continued) | | | |
Cynthia Hostetler —1962 | 2017 | Non-Executive Director and Trustee of a number of public and private business | 229 | Vulcan Materials |
Trustee | | corporations | | Company |
| | Formerly: Director, Aberdeen Investment Funds (4 portfolios); Head of | | (construction |
| | | materials |
| | Investment Funds and Private Equity, Overseas Private Investment | |
| | | company); Trilinc |
| | Corporation; President, First Manhattan Bancorporation, Inc.; Attorney, | |
| | | Global Impact |
| | Simpson Thacher & Bartlett LLP | |
| | | Fund; Genesee & |
| | | |
| | | | Wyoming, Inc. |
| | | | (railroads); Artio |
| | | | Global Investment |
| | | | LLC (mutual fund |
| | | | complex); Edgen |
| | | | Group, Inc. |
| | | | (specialized |
| | | | energy and |
| | | | infrastructure |
| | | | products |
| | | | distributor); |
| | | | Investment |
| | | | Company Institute |
| | | | (professional |
| | | | organization); |
| | | | Independent |
| | | | Directors Council |
| | | | (professional |
| | | | organization) |
Eli Jones – 1961 | 2016 | Professor and Dean, Mays Business School - Texas A&M University | 229 | Insperity, Inc. |
Trustee | | Formerly: Professor and Dean, Walton College of Business, University of | | (formerly known |
| | | as Administaff) |
| | Arkansas and E.J. Ourso College of Business, Louisiana State University; | |
| | | (human resources |
| | Director, Arvest Bank | |
| | | provider) |
| | | |
Elizabeth Krentzman – 1959 | 2019 | Formerly: Principal and Chief Regulatory Advisor for Asset Management | 229 | Trustee of the |
Trustee | | Services and U.S. Mutual Fund Leader of Deloitte & Touche LLP; General | | University of |
| | Counsel of the Investment Company Institute (trade association); National | | Florida National |
| | Director of the Investment Management Regulatory Consulting Practice, | | Board Foundation |
| | Principal, Director and Senior Manager of Deloitte & Touche LLP; Assistant | | and Audit |
| | Director of the Division of Investment Management - Office of Disclosure and | | Committee |
| | Investment Adviser Regulation of the U.S. Securities and Exchange | | Member; Member |
| | Commission and various positions with the Division of Investment Management | | of the Cartica |
| | – Office of Regulatory Policy of the U.S. Securities and Exchange Commission; | | Funds Board of |
| | Associate at Ropes & Gray LLP; Advisory Board Member of the Securities and | | Directors (private |
| | Exchange Commission Historical Society; and Trustee of certain Oppenheimer | | investment |
| | Funds | | funds); Member |
| | | | of the University |
| | | | of Florida Law |
| | | | Center |
| | | | Association, Inc. |
| | | | Board of Trustees |
| | | | and Audit |
| | | | Committee |
| | | | Member |
Anthony J. LaCava, Jr. – 1956 | 2019 | Formerly: Director and Member of the Audit Committee, Blue Hills Bank | 229 | Blue Hills Bank; |
Trustee | | (publicly traded financial institution) and Managing Partner, KPMG LLP | | Chairman, |
| | | | Bentley |
| | | | University; |
| | | | Member, |
| | | | Business School |
| | | | Advisory Council; |
| | | | and Nominating |
| | | | Committee |
| | | | KPMG LLP |
Prema Mathai-Davis – 1950 | 1998 | Retired | 229 | None |
Trustee | | Co-Owner & Partner of Quantalytics Research, LLC, (a FinTech Investment | | |
| | | |
Research Platform for the Self-Directed Investor)
T-3 | Invesco Corporate Bond Fund |

Trustees and Officers—(continued)
| | | Number of | |
| | | Funds | Other |
| Trustee | | in | Directorship(s) |
Name, Year of Birth and | and/or | | Fund Complex | Held by Trustee |
Position(s) | Officer | Principal Occupation(s) | Overseen by | During Past 5 |
Held with the Trust | Since | During Past 5 Years | Trustee | Years |
Independent Trustees—(continued) | | | |
Joel W. Motley – 1952 | 2019 | Director of Office of Finance, Federal Home Loan Bank System; Member of the | 229 | Member of Board |
Trustee | | Vestry of Trinity Wall Street; Managing Director of Carmona Motley Inc. | | of Greenwall |
| | (privately held financial advisor); Member of the Council on Foreign Relations | | Foundation |
| | and its Finance and Budget Committee; Chairman Emeritus of Board of Human | | (bioethics research |
| | Rights Watch and Member of its Investment Committee; and Member of | | foundation) and |
| | Investment Committee and Board of Historic Hudson Valley (non-profit cultural | | its Investment |
| | organization) | | Committee; |
| | Formerly: Managing Director of Public Capital Advisors, LLC (privately held | | Member of Board of |
| | | Friends of the LRC |
| | financial advisor); Managing Director of Carmona Motley Hoffman, Inc. | |
| | | (non-profit |
| | (privately held financial advisor); Trustee of certain Oppenheimer Funds; and | |
| | | legal advocacy); |
| | Director of Columbia Equity Financial Corp. (privately held financial advisor) | |
| | | Board Member |
| | | |
| | | | and Investment |
| | | | Committee |
| | | | Member of |
| | | | Pulizer Center for |
| | | | Crisis Reporting |
| | | | (non-profit |
| | | | journalism) |
Teresa M. Ressel — 1962 | 2017 | Non-executive director and trustee of a number of public and private business | 229 | Atlantic Power |
Trustee | | corporations | | Corporation |
| | Formerly: Chief Financial Officer, Olayan America, The Olayan Group | | (power generation |
| | | company); ON |
| | (international investor/commercial/industrial); Chief Executive Officer, UBS | |
| | | Semiconductor |
| | Securities LLC; Group Chief Operating Officer, Americas, UBS AG; Assistant | |
| | | Corp. |
| | Secretary for Management & Budget and CFO, US Department of the Treasury | |
| | | (semiconductor |
| | | |
| | | | supplier) |
| | | | |
Ann Barnett Stern – 1957 | 2017 | President and Chief Executive Officer, Houston Endowment Inc. (private | 229 | Federal Reserve |
Trustee | | philanthropic institution) | | Bank of Dallas |
| | Formerly: Executive Vice President and General Counsel, Texas Children's | | |
| | Hospital; Attorney, Beck, Redden and Secrest, LLP; Business Law Instructor, | | |
| | University of St. Thomas; Attorney, Andrews & Kurth LLP | | |
Robert C. Troccoli – 1949 | 2016 | Retired | 229 | None |
Trustee | | Formerly: Adjunct Professor, University of Denver – Daniels College of | | |
| | | |
| | Business; Senior Partner, KPMG LLP | | |
| | | | |
Daniel S. Vandivort –1954 | 2019 | Treasurer, Chairman of the Audit and Finance Committee, and Trustee, Board | 229 | Chairman and |
Trustee | | of Trustees, Huntington Disease Foundation of America; and President, Flyway | | Lead Independent |
| | Advisory Services LLC (consulting and property management) | | Director, |
| | Formerly: Trustee and Governance Chair, of certain Oppenheimer Funds | | Chairman of the |
| | | Audit Committee, |
| | | |
| | | | and Director, |
| | | | Board of |
| | | | Directors, Value |
| | | | Line Funds |
James D. Vaughn – 1945 | 2019 | Retired | 229 | Board member |
Trustee | | Formerly: Managing Partner, Deloitte & Touche LLP; Trustee and Chairman of | | and Chairman of |
| | | Audit Committee |
| | the Audit Committee, Schroder Funds; Board Member, Mile High United Way, | |
| | | of AMG National |
| | Boys and Girls Clubs, Boy Scouts, Colorado Business Committee for the Arts, | |
| | | Trust Bank; |
| | Economic Club of Colorado and Metro Denver Network (economic development | |
| | | Trustee and |
| | corporation); and Trustee of certain Oppenheimer Funds | |
| | | Investment |
| | | |
| | | | Committee |
| | | | member, |
| | | | University of |
| | | | South Dakota |
| | | | Foundation; |
| | | | Board member, |
| | | | Audit Committee |
| | | | Member and past |
| | | | Board Chair, |
| | | | Junior |
| | | | Achievement |
| | | | (non-profit) |
Christopher L. Wilson - | 2017 | Retired | 229 | ISO New |
1957 | | Formerly: Director, TD Asset Management USA Inc. (mutual fund complex) (22 | | England, Inc. |
Trustee, Vice Chair and Chair | | | (non-profit |
| portfolios); Managing Partner, CT2, LLC (investing and consulting firm); | |
Designate | | | organization |
| President/Chief Executive Officer, Columbia Funds, Bank of America | |
| | | |
| Corporation; President/Chief Executive Officer, CDC IXIS Asset Management | managing |
| regional electricity |
| Services, Inc.; Principal & Director of Operations, Scudder Funds, Scudder, |
| market) |
| Stevens & Clark, Inc.; Assistant Vice President, Fidelity Investments |
| |
T-4 | Invesco Corporate Bond Fund |
Trustees and Officers—(continued)
| | | Number of | Other |
| Trustee | | Funds in | Directorship(s) |
Name, Year of Birth and | and/or | | Fund Complex | Held by Trustee |
Position(s) | Officer | Principal Occupation(s) | Overseen by | During Past 5 |
Held with the Trust | Since | During Past 5 Years | Trustee | Years |
Officers | | | | |
Sheri Morris — 1964 | 1999 | Head of Global Fund Services, Invesco Ltd.; President, Principal Executive | N/A | N/A |
President, Principal Executive | | Officer and Treasurer, The Invesco Funds; Vice President, Invesco Advisers, | | |
Officer and Treasurer | | Inc. (formerly known as Invesco Institutional (N.A.), Inc.) (registered | | |
| | investment adviser); and Vice President, Invesco Exchange-Traded Fund Trust, | | |
| | Invesco Exchange-Traded Fund Trust II, Invesco India Exchange-Traded Fund | | |
| | Trust, Invesco Actively Managed Exchange-Traded Fund Trust, Invesco Actively | | |
| | Managed Exchange-Traded Commodity Fund Trust and Invesco | | |
| | Exchange-Traded Self-Indexed Fund Trust; and Vice President, | | |
| | OppenheimerFunds, Inc. | | |
| | Formerly: Vice President and Principal Financial Officer, The Invesco Funds; | | |
| | Vice President, Invesco AIM Advisers, Inc., Invesco AIM Capital Management, | | |
| | Inc. and Invesco AIM Private Asset Management, Inc.; Assistant Vice President | | |
| | and Assistant Treasurer, The Invesco Funds and Assistant Vice President, | | |
| | Invesco Advisers, Inc., Invesco AIM Capital Management, Inc. and Invesco AIM | | |
| | Private Asset Management, Inc.; and Treasurer, Invesco Exchange-Traded | | |
| | Fund Trust, Invesco Exchange-Traded Fund Trust II, Invesco India | | |
| | Exchange-Traded Fund Trust and Invesco Actively Managed Exchange-Traded | | |
| | Fund Trust | | |
Russell C. Burk — 1958 | 2005 | Senior Vice President and Senior Officer, The Invesco Funds | N/A | N/A |
Senior Vice President and Senior | | | | |
Officer | | | | |
Jeffrey H. Kupor – 1968 | 2018 | Head of Legal of the Americas, Invesco Ltd.; Senior Vice President and | N/A | N/A |
Senior Vice President, Chief Legal | | Secretary, Invesco Advisers, Inc. (formerly known as Invesco Institutional | | |
Officer and Secretary | | (N.A.), Inc.) (registered investment adviser); Senior Vice President and | | |
| | Secretary, Invesco Distributors, Inc. (formerly known as Invesco AIM | | |
| | Distributors, Inc.); Vice President and Secretary, Invesco Investment Services, | | |
| | Inc. (formerly known as Invesco AIM Investment Services, Inc.) Senior Vice | | |
| | President, Chief Legal Officer and Secretary, The Invesco Funds; Secretary and | | |
| | General Counsel, Invesco Investment Advisers LLC (formerly known as Van | | |
| | Kampen Asset Management); Secretary and General Counsel, Invesco Capital | | |
| | Markets, Inc. (formerly known as Van Kampen Funds Inc.) and Chief Legal | | |
| | Officer, Invesco Exchange-Traded Fund Trust, Invesco Exchange-Traded Fund | | |
| | Trust II, Invesco India Exchange-Traded Fund Trust, Invesco Actively Managed | | |
| | Exchange-Traded Fund Trust, Invesco Actively Managed Exchange-Traded | | |
| | Commodity Fund Trust and Invesco Exchange-Traded Self-Indexed Fund Trust; | | |
| | Secretary, Invesco Indexing LLC; Secretary, W.L. Ross & Co., LLC | | |
| | Formerly: Secretary and Vice President, Jemstep, Inc.; Head of Legal, | | |
| | Worldwide Institutional, Invesco Ltd.; Secretary and General Counsel, INVESCO | | |
| | Private Capital Investments, Inc.; Senior Vice President, Secretary and General | | |
| | Counsel, Invesco Management Group, Inc. (formerly known as Invesco AIM | | |
| | Management Group, Inc.); Assistant Secretary, INVESCO Asset Management | | |
| | (Bermuda) Ltd.; Secretary and General Counsel, Invesco Private Capital, Inc.; | | |
| | Assistant Secretary and General Counsel, INVESCO Realty, Inc.; Secretary and | | |
| | General Counsel, Invesco Senior Secured Management, Inc.; and Secretary, | | |
| | Sovereign G./P. Holdings Inc. | | |
Andrew R. Schlossberg – 1974 | 2019 | Head of the Americas and Senior Managing Director, Invesco Ltd.; Director and | N/A | N/A |
Senior Vice President | | Senior Vice President, Invesco Advisers, Inc. (formerly known as Invesco | | |
| | Institutional (N.A.), Inc.) (registered investment adviser); Director and | | |
| | Chairman, Invesco Investment Services, Inc. (formerly known as Invesco AIM | | |
| | Investment Services, Inc.) (registered transfer agent); Senior Vice President, | | |
| | The Invesco Funds; Director, Invesco Investment Advisers LLC (formerly known | | |
| | as Van Kampen Asset Management); Director, President and Chairman, Invesco | | |
| | Insurance Agency, Inc. | | |
| | Formerly: Director, Invesco UK Limited; Director and Chief Executive, Invesco | | |
| | Asset Management Limited and Invesco Fund Managers Limited; Assistant Vice | | |
| | President, The Invesco Funds; Senior Vice President, Invesco Advisers, Inc. | | |
| | (formerly known as Invesco Institutional (N.A.), Inc.) (registered investment | | |
| | adviser); Director and Chief Executive, Invesco Administration Services Limited | | |
| | and Invesco Global Investment Funds Limited; Director, Invesco Distributors, | | |
| | Inc.; Head of EMEA, Invesco Ltd.; President, Invesco Actively Managed | | |
| | Exchange-Traded Commodity Fund Trust, Invesco Actively Managed | | |
| | Exchange-Traded Fund Trust, Invesco Exchange-Traded Fund Trust, Invesco | | |
| | Exchange-Traded Fund Trust II and Invesco India Exchange-Traded Fund Trust; | | |
| | Managing Director and Principal Executive Officer, Invesco Capital | | |
| | Management LLC | | |
T-5 | Invesco Corporate Bond Fund |
Trustees and Officers—(continued)
| | | Number of | Other |
| Trustee | | Funds in | Directorship(s) |
Name, Year of Birth and | and/or | | Fund Complex | Held by Trustee |
Position(s) | Officer | Principal Occupation(s) | Overseen by | During Past 5 |
Held with the Trust | Since | During Past 5 Years | Trustee | Years |
Officers—(continued) | | | | |
John M. Zerr — 1962 | 2006 | Chief Operating Officer of the Americas; Senior Vice President, Invesco | N/A | N/A |
Senior Vice President | | Advisers, Inc. (formerly known as Invesco Institutional (N.A.), Inc.) (registered | | |
| | investment adviser); Senior Vice President, Invesco Distributors, Inc. (formerly | | |
| | known as Invesco AIM Distributors, Inc.); Director and Vice President, Invesco | | |
| | Investment Services, Inc. (formerly known as Invesco AIM Investment | | |
| | Services, Inc.) Senior Vice President, The Invesco Funds; Managing Director, | | |
| | Invesco Capital Management LLC; Director, Invesco Investment Advisers LLC | | |
| | (formerly known as Van Kampen Asset Management); Senior Vice President, | | |
| | Invesco Capital Markets, Inc. (formerly known as Van Kampen Funds Inc.); | | |
| | Manager, Invesco Indexing LLC; Manager, Invesco Specialized Products, LLC; | | |
| | Director and Senior Vice President, Invesco Insurance Agency, Inc.; Member, | | |
| | Invesco Canada Funds Advisory Board; Director, President and Chief Executive | | |
| | Officer, Invesco Corporate Class Inc. (corporate mutual fund company); and | | |
| | Director, Chairman, President and Chief Executive Officer, Invesco Canada Ltd. | | |
| | (formerly known as Invesco Trimark Ltd./Invesco Trimark Ltèe) (registered | | |
| | investment adviser and registered transfer agent); President, Invesco, Inc. | | |
| | Formerly: Director and Senior Vice President, Invesco Management Group, Inc. | | |
| | (formerly known as Invesco AIM Management Group, Inc.); Secretary and | | |
| | General Counsel, Invesco Management Group, Inc. (formerly known as Invesco | | |
| | AIM Management Group, Inc.); Secretary, Invesco Investment Services, Inc. | | |
| | (formerly known as Invesco AIM Investment Services, Inc.); Chief Legal Officer | | |
| | and Secretary, The Invesco Funds; Secretary and General Counsel, Invesco | | |
| | Investment Advisers LLC (formerly known as Van Kampen Asset Management); | | |
| | Secretary and General Counsel, Invesco Capital Markets, Inc. (formerly known | | |
| | as Van Kampen Funds Inc.); Chief Legal Officer, Invesco Exchange-Traded Fund | | |
| | Trust, Invesco Exchange-Traded Fund Trust II, Invesco India Exchange-Traded | | |
| | Fund Trust, Invesco Actively Managed Exchange-Traded Fund Trust, Invesco | | |
| | Actively Managed Exchange-Traded Commodity Fund Trust and Invesco | | |
| | Exchange-Traded Self-Indexed Fund Trust; Secretary, Invesco Indexing LLC; | | |
| | Director, Secretary, General Counsel and Senior Vice President, Van Kampen | | |
| | Exchange Corp.; Director, Vice President and Secretary, IVZ Distributors, Inc. | | |
| | (formerly known as INVESCO Distributors, Inc.); Director and Vice President, | | |
| | INVESCO Funds Group, Inc.; Director and Vice President, Van Kampen | | |
| | Advisors Inc.; Director, Vice President, Secretary and General Counsel, Van | | |
| | Kampen Investor Services Inc.;Director and Secretary, Invesco Distributors, | | |
| | Inc. (formerly known as Invesco AIM Distributors, Inc.); Director, Senior Vice | | |
| | President, General Counsel and Secretary, Invesco AIM Advisers, Inc. and Van | | |
| | Kampen Investments Inc.; Director, Vice President and Secretary, Fund | | |
| | Management Company; Director, Senior Vice President, Secretary, General | | |
| | Counsel and Vice President, Invesco AIM Capital Management, Inc.; Chief | | |
| | Operating Officer and General Counsel, Liberty Ridge Capital, Inc. (an | | |
| | investment adviser) | | |
Gregory G. McGreevey - 1962 | 2012 | Senior Managing Director, Invesco Ltd.; Director, Chairman, President, and | N/A | N/A |
Senior Vice President | | Chief Executive Officer, Invesco Advisers, Inc. (formerly known as Invesco | | |
| | Institutional (N.A.), Inc.) (registered investment adviser); Director, Invesco | | |
| | Mortgage Capital, Inc. and Invesco Senior Secured Management, Inc.; and | | |
| | Senior Vice President, The Invesco Funds; and President, SNW Asset | | |
| | Management Corporation and Invesco Managed Accounts, LLC | | |
| | Formerly: Senior Vice President, Invesco Management Group, Inc. and Invesco | | |
| | Advisers, Inc.; Assistant Vice President, The Invesco Funds | | |
Kelli Gallegos – 1970 | 2008 | Principal Financial and Accounting Officer – Investments Pool, Invesco | N/A | N/A |
Vice President, Principal Financial | | Specialized Products, LLC; Vice President, Principal Financial Officer and | | |
Officer and Assistant Treasurer | | Assistant Treasurer, The Invesco Funds; Principal Financial and Accounting | | |
| | Officer – Pooled Investments, Invesco Capital Management LLC; Vice President | | |
| | and Treasurer, Invesco Exchange-Traded Fund Trust, Invesco Exchange-Traded | | |
| | Fund Trust II, Invesco India Exchange-Traded Fund Trust, Invesco Actively | | |
| | Managed Exchange-Traded Fund Trust, Invesco Actively Managed | | |
| | Exchange-Traded Commodity Fund Trust and Invesco Exchange-Traded | | |
| | Self-Indexed Fund Trust; Vice President, Invesco Advisers, Inc. | | |
| | Formerly: Assistant Treasurer, Invesco Specialized Products, LLC; Assistant | | |
| | Treasurer, Invesco Exchange-Traded Fund Trust, Invesco Exchange-Traded | | |
| | Fund Trust II, Invesco India Exchange-Traded Fund Trust, Invesco Actively | | |
| | Managed Exchange-Traded Fund Trust, Invesco Actively Managed | | |
| | Exchange-Traded Commodity Fund Trust and Invesco Exchange-Traded | | |
| | Self-Indexed Fund Trust; Assistant Treasurer, Invesco Capital | | |
| | Management LLC; Assistant Vice President, The Invesco Funds | | |
Crissie M. Wisdom – 1969 | 2013 | Anti-Money Laundering and OFAC Compliance Officer for Invesco U.S. entities | N/A | N/A |
Anti-Money Laundering | | including: Invesco Advisers, Inc. and its affiliates, Invesco Capital Markets, | | |
Compliance Officer | | Inc., Invesco Distributors, Inc., Invesco Investment Services, Inc., The Invesco | | |
| | Funds, Invesco Capital Management, LLC, Invesco Trust Company; | | |
| | OppenheimerFunds Distributor, Inc., and Fraud Prevention Manager for | | |
| | Invesco Investment Services, Inc. | | |
T-6 | Invesco Corporate Bond Fund |
Trustees and Officers—(continued)
| | | Number of | Other |
| Trustee | | Funds in | Directorship(s) |
Name, Year of Birth and | and/or | | Fund Complex | Held by Trustee |
Position(s) | Officer | Principal Occupation(s) | Overseen by | During Past 5 |
Held with the Trust | Since | During Past 5 Years | Trustee | Years |
Officers—(continued) | | | | |
Robert R. Leveille – 1969 | 2016 | Chief Compliance Officer, Invesco Advisers, Inc. (registered investment | N/A | N/A |
Chief Compliance Officer | | adviser); and Chief Compliance Officer, The Invesco Funds | | |
| | Formerly: Chief Compliance Officer, Putnam Investments and the Putnam | | |
| | Funds | | |
The Statement of Additional Information of the Trust includes additional information about the Fund's Trustees and is available upon request, without charge, by calling 1.800.959.4246. Please refer to the Fund's Statement of Additional Information for information on the Fund's sub-advisers.
Office of the Fund | Investment Adviser | Distributor | Auditors |
11 Greenway Plaza, Suite 1000 | Invesco Advisers, Inc. | Invesco Distributors, Inc. | PricewaterhouseCoopers LLP |
Houston, TX 77046-1173 | 1555 Peachtree Street, N.E. | 11 Greenway Plaza, Suite 1000 | 1000 Louisiana Street, Suite 5800 |
| Atlanta, GA 30309 | Houston, TX 77046-1173 | Houston, TX 77002-5678 |
Counsel to the Fund | Counsel to the Independent Trustees | Transfer Agent | Custodian |
Stradley Ronon Stevens & Young, LLP | Goodwin Procter LLP | Invesco Investment Services, Inc. | State Street Bank and Trust Company |
2005 Market Street, Suite 2600 | 901 New York Avenue, N.W. | 11 Greenway Plaza, Suite 1000 | 225 Franklin Street |
Philadelphia, PA 19103-7018 | Washington, D.C. 20001 | Houston, TX 77046-1173 | Boston, MA 02110-2801 |
T-7 | Invesco Corporate Bond Fund |

Go paperless with eDelivery
Visit invesco.com/edelivery to enjoy the convenience and security of anytime electronic access to your investment documents.
With eDelivery, you can elect to have any or all of the following materials delivered straight to your inbox to download, save and print from your own computer:
•Fund reports and prospectuses
•Quarterly statements
•Daily confirmations
•Tax forms
Invesco mailing information
Send general correspondence to Invesco Investment Services, Inc., P.O. Box 219078, Kansas City, MO 64121-9078.
Important notice regarding delivery of security holder documents
To reduce Fund expenses, only one copy of most shareholder documents may be mailed to shareholders with multiple accounts at the same address (Householding). Mailing of your shareholder documents may be householded indefinitely unless you instruct us otherwise. If you do not want the mailing of these documents to be combined with those for other members of your household, please contact Invesco Investment Services, Inc. at 800 959 4246 or contact your financial institution. We will begin sending you individual copies for each account within 30 days after receiving your request.
Fund holdings and proxy voting information
The Fund provides a complete list of its holdings four times in each fiscal year, at the quarter-ends. For the second and fourth quarters, the list appears in the Fund's semiannual and annual reports to shareholders. For the first and third quarters, the Fund files the lists with the Securities and Exchange Commission (SEC) as an exhibit to its reports on Form N-PORT. The most recent list of portfolio holdings is available at invesco.com/completeqtrholdings. Shareholders can also look up the Fund's Form N-PORT filings on the SEC website, sec.gov. The SEC file numbers for the Fund are shown below.
A description of the policies and procedures that the Fund uses to determine how to vote proxies relating to portfolio secu- rities is available without charge, upon request, from our Client Services department at 800 959 4246, or at invesco.com/ proxyguidelines. The information is also available on the SEC website, sec.gov.
Information regarding how the Fund voted proxies related to its portfolio securities during the most
recent 12-month period ended June 30 is available at invesco.com/proxysearch. This information is also available on the SEC website, sec.gov.
Invesco Advisers, Inc. is an investment adviser; it provides investment advisory services to individual and institutional clients and does not sell securities. Invesco Distributors, Inc. is the US distributor for Invesco Ltd.'s retail mutual funds, exchange-traded funds and institutional money market funds. Both are wholly owned, indirect subsidiaries of Invesco Ltd.
SEC file numbers: 811-05686 and 033-39519 | Invesco Distributors, Inc. | VK-CBD-AR-1 |
Annual Report to Shareholders | February 29, 2020 |
Invesco Global Real Estate Fund
Nasdaq:
A: AGREX C: CGREX R: RGREX Y: ARGYX R5: IGREX R6: FGREX
Beginning on January 1, 2021, as permitted by regulations adopted by the Securities and Exchange Commission, paper copies of the Fund's shareholder reports will no longer be sent by mail, unless you specifically request paper copies of the reports from the Fund or from your financial intermediary, such as a broker-dealer or bank. Instead, the reports will be made available on the Fund's web- site, and you will be notified by mail each time a report is posted and provided with a website link to access the report.
If you already elected to receive shareholder reports electronically, you will not be affected by this change and you need not take any action. You may elect to receive shareholder reports and other communications from the Fund electronically by contacting your financial intermediary (such as a broker-dealer or bank) or, if you are a direct investor, by enrolling at invesco.com/edelivery.
You may elect to receive all future reports in paper free of charge. If you invest through a financial intermediary, you can contact your financial intermediary to request that you continue to receive paper copies of your shareholder reports. If you invest directly with the Fund, you can call (800) 959-4246 to let the Fund know you wish to continue receiving paper copies of your shareholder reports. Your election to receive reports in paper will apply to all funds held with your financial intermediary or all funds held with the fund complex if you invest directly with the Fund.
Andrew Schlossberg
Letters to Shareholders
Dear Shareholders:
This annual report includes information about your Fund, including performance data and a complete list of its investments as of the close of the reporting period. Inside is a discussion of how your Fund was managed and the factors that affected its performance during the reporting period.
The reporting period proved to be another tumultuous time for both global equities and fixed-income secu- rities. In early 2019, global equity markets were buoyed by a more accommodative stance from central banks and optimism about a potential US-China trade deal. In May, US-China trade concerns and slowing global growth led to a global equity sell-off and rally in US Treasuries. Despite the May sell-off, domestic equity mar- kets rallied in June in anticipation of a US Federal Reserve (the Fed) interest rate cut and closed the second quarter with modest gains. Continued US-China trade worries and signs of slowing global economic growth led to increased market volatility in August. The US Treasury yield curve inverted several times as fears of a US recession increased. As a result, global equity markets were largely flat for the third quarter. In the final
months of 2019, geopolitical and macroeconomic issues largely abated. This combined with better-than-expected third quarter corporate earnings and initial agreement of the phase one US-China trade deal provided a favorable backdrop for equities and impressive fourth quar- ter global equity returns.
As the new year began, US equities were largely buoyed in January by the signing of the phase one trade agreement and strong eco- nomic data although returns were dampened by the spread of the Coronavirus (COVID-19). Concerns over the virus had a greater impact on international equities, which were largely lower for the month. As the virus spread outside of China and the number of cases increased, fears of diminished global growth led to a sharp global equity sell-off at the end of February 2020 and sent the yield on the US 10-year Treasury to a new all-time low.
Throughout 2019, central banks continued to be accommodative, providing sources of liquidity. In July, the Fed lowered interest rates for the first time in 11 years. It again lowered rates in September and once again in October. During the rest of the year, the Fed left rates unchanged. Overseas, the European Central Bank left its policy rate unchanged and continued its bond purchasing program. In 2020, with the increased spread of the coronavirus, the Fed shifted from a more neutral policy to the possibility of further rate cuts in the new year. As 2020 unfolds, we'll see how the interplay of interest rates, economic data, geopolitics and a host of other factors affect US and overseas equity and fixed income markets.
Investor uncertainty and market volatility, such as we witnessed during the reporting period, are unfortunate facts of life when it comes to investing. That's why Invesco encourages investors to work with a professional financial adviser who can stress the importance of starting to save and invest early and the importance of adhering to a disciplined investment plan. A financial adviser who knows your unique finan- cial situation, investment goals and risk tolerance can be an invaluable partner as you seek to achieve your financial goals. Financial advis- ers can also offer a long-term perspective when markets are volatile and time-tested advice and guidance when your financial situation or investment goals change.
Visit our website for more information on your investments
Our website, invesco.com/us, offers a wide range of market insights and investment perspectives. On the website, you'll find detailed infor- mation about our funds, including performance, holdings and portfolio manager commentaries. You can access information about your account by completing a simple, secure online registration. To do so, select "Log In" on the right side of the homepage, and then select "Register for Individual Account Access."
In addition to the resources accessible on our website and through our mobile app, you can obtain timely updates to help you stay informed about the markets and the economy by connecting with Invesco on Twitter, LinkedIn or Facebook. You can access our blog at blog.invesco.us.com. Our goal is to provide you the information you want, when and where you want it.
Finally, I'm pleased to share with you Invesco's commitment to both the Principles for Responsible Investment and to considering environ- mental, social and governance issues in our robust investment process. I invite you to learn more at invesco.com/esg.
Have questions?
For questions about your account, contact an Invesco client services representative at 800 959 4246.
All of us at Invesco look forward to serving your investment management needs. Thank you for investing with us.
Sincerely,
Andrew Schlossberg
Head of the Americas,
Senior Managing Director, Invesco Ltd.
2Invesco Global Real Estate Fund
Bruce Crockett
Dear Shareholders:
Among the many important lessons I've learned in more than 40 years in a variety of business endeavors is the value of a trusted advocate.
As independent chair of the Invesco Funds Board, I can assure you that the members of the Board are strong advocates for the interests of investors in Invesco's mutual funds. We work hard to represent your interests through oversight of the quality of the investment management services your funds receive and other matters important to your investment, including but not limited to:
Ensuring that Invesco offers a diverse lineup of mutual funds that your financial adviser can use to strive to meet your financial needs as your investment goals change over time.
Monitoring how the portfolio management teams of the Invesco funds are performing in light of changing economic and market conditions.
Assessing each portfolio management team's investment performance within the context of the investment strategy described in the fund's prospectus.
Monitoring for potential conflicts of interests that may impact the nature of the services that your funds receive.
We believe one of the most important services we provide our fund shareholders is the annual review of the funds' advisory and sub-
advisory contracts with Invesco Advisers and its affiliates. This review is required by the Investment Company Act of 1940 and focuses on the nature and quality of the services Invesco provides as the adviser to the Invesco funds and the reasonableness of the fees that it charges for those services. Each year, we spend months carefully reviewing information received from Invesco and a variety of independent sources, such as performance and fee data prepared by Lipper, Inc. (a subsidiary of Broadridge Financial Solutions, Inc.), an independent, third-party firm widely recognized as a leader in its field. We also meet with our independent legal counsel and other independent advisers to review and help us assess the information that we have received. Our goal is to assure that you receive quality investment management services for a reasonable fee.
I trust the measures outlined above provide assurance that you have a worthy advocate when it comes to choosing the Invesco Funds. On behalf of the Board, we look forward to continuing to represent your interests and serving your needs.
Sincerely,
Bruce L. Crockett
Independent Chair
Invesco Funds Board of Trustees
3Invesco Global Real Estate Fund

Management's Discussion of Fund Performance
Performance summary
For the fiscal year ended February 29, 2020, Class A shares of Invesco Global Real Estate Fund (the Fund), at net asset value (NAV), outperformed the Fund's style- specific benchmark, the Custom Invesco Global Real Estate Index.
Your Fund's long-term performance appears later in this report.
Fund vs. Indexes
Total returns, 2/28/19 to 2/29/20, at net asset value (NAV). Performance shown does not include applicable contingent deferred sales charges (CDSC) or front-end sales charges, which would have reduced performance.
Class A Shares | 3.28% |
Class C Shares | 2.51 |
Class R Shares | 3.02 |
Class Y Shares | 3.55 |
Class R5 Shares | 3.68 |
Class R6 Shares | 3.77 |
MSCI World Index (Broad Market Index) | 4.63 |
Custom Invesco Global Real Estate Index (Style-Specific Index) | 2.20 |
Lipper Global Real Estate Funds Classification Average (Peer Group) | 4.54 |
Source(s): RIMES Technologies Corp.;Invesco, RIMES Technologies Corp.;Lipper Inc.
companies are mid-way through reporting year-end financial results. There have been few surprises so far. Retail has been weak, with declines in asset values and some emerg- ing re-purposing strategies to meet the chal- lenges of excess mall capacity. Elsewhere, across most property types and geographies, results have been positive, showing asset value and earnings growth. Management teams continue to show cautious optimism, with a willingness to continue to acquire and develop assets. Listed real estate ends the fiscal year trading at a small discount to net asset value (NAV) on average. European and US REITs are trading at or above NAV on av- erage, while Asian real estate shows discounts in Hong Kong and Japan.
During the fiscal year, the Fund's security selection in the US, UK and Hong Kong con- tributed to performance relative to its style- specific benchmark. Conversely, relative de- tractors included an underweight allocation to Belgium and an allocation to cash. Although the portfolio held a small amount of ancillary
Market conditions and your Fund
At the close of the fiscal year, equity markets reacted strongly to the prospect of dimin- ished global growth as a result of the impact of the Coronavirus (COVID-19) outbreak. At the close of the fiscal year, GDP growth esti- mates for 2020 were cut, as the magnitude and duration of the impact are still far from clear. Government bond yields fell amid risk aversion and in anticipation of interest rate cuts from key central banks. Hong Kong, Sin- gapore and the Chinese government were the first to add stimulus to their economies, with many economic activity indicators showing recessionary levels. However, additional stimulus measures are expected from most central banks around the world to support domestic economies hit by uncertainty. Completion of phase one of a trade deal be- tween China and the US had previously of- fered some positive news to capital markets following significant uncertainty during 2019. We believe negotiations on future trade terms will likely continue. The fiscal year ended with US consumer confidence rising for four con-
Portfolio Composition
By country | % of total net assets |
United States | 48.25% |
Japan | 10.62 |
China | 5.80 |
Germany | | 5.78 |
Hong Kong | | 5.40 |
United Kingdom | | 4.13 |
Canada | | 3.14 |
Australia | | 3.05 |
Singapore | | 2.51 |
Sweden | | 2.14 |
Countries, each less than 2% of | |
portfolio | | 7.24 |
Money Market Funds Plus Other | |
Assets Less Liabilities | | 1.94 |
secutive months and was accompanied by increases in housing starts and non-farm pay- rolls. However, areas of caution remain in the US, as industrial production and retail sales reported slight declines. Brexit is now guaran- teed, and the focus will now move to future trade arrangements with the European Union. Published European economic data has shown some stabilization, with the European manu- facturing index showing its highest level in over a year. However, we believe it is likely that the coronavirus outbreak will diminish upcoming activity and resulting economic and wider corporate earnings data.
Global listed real estate offered positive absolute performance over the fiscal year driven by a combination of supportive funda- mental and macro-related factors. Real estate investment trusts (REITs) generally out- performed other risk assets through the late period market sell-off, reflecting underlying income security, as markets tended to reward predictable growth and well-covered divi- dends during a period of falling bond yields and slowing global growth. Listed real estate
Top 10 Equity Holdings*
% of total net assets
1. Boston Properties, Inc. | 3.96% |
2. AvalonBay Communities, Inc. | 2.84 |
3. Vonovia SE | 2.79 |
4. Ventas, Inc. | 2.35 |
5. | UDR, Inc. | 2.12 |
6. | Simon Property Group, Inc. | 2.06 |
7. | VEREIT, Inc. | 2.00 |
8. | Healthpeak Properties, Inc. | 1.88 |
9. | Invitation Homes, Inc. | 1.79 |
10. | Prologis, Inc. | 1.74 |
cash, it detracted as markets gained through much of the fiscal year.
Top individual absolute contributors to the Fund's performance during the fiscal year included Prologis and Mid-America Apart- ment Communities. In one of the largest transactions of 2019, Prologis acquired Lib- erty Property Trust in an all-stock deal valued at $12.6 billion, representing an opportunity for Prologis to utilize their global platform as a leading operator of distribution centers that serve local consumers or more global trade routes. Additionally, several residential REITs did well over the year, benefiting from eco- nomic and job growth tailwinds, including Mid- America Apartment Communities.
Top individual absolute detractors from Fund performance during the fiscal year in- cluded two positions in the challenged retail sector, Simon Property Group and Macerich. Simon Property Group is the largest mall owner in the US. The company has a strong management team and a track record of pre- dictable cash flow growth, strong asset alloca- tion, and attractive reinvestment returns.
The Fund's holdings are subject to change, and there is no assurance that the Fund will continue to hold any particular security.
*Excluding money market fund holdings.
Data presented here are as of February 29, 2020.
4Invesco Global Real Estate Fund

Macerich is a regional mall operator that owns high quality properties in the US. The company offered a discounted valuation and the prospect of stabilized operating results.
At the end of the fiscal year, on a regional and country level, the Fund was overweight North America overall, with overweight posi- tioning in Canada and relatively neutral posi- tioning to the US, relative to the style-specific index. Canadian real estate continues to offer a modest yield premium, geopolitical stability and consistent real estate fundamental growth. In the US, positioning is focused on sectors and market exposures that support rental growth, as well as companies that can generate growth from attractive capital de- ployment opportunities.
Relative to the style-specific index, the Fund held a modest underweight allocation to the Asia Pacific region at the end of the fiscal year. Across the region, the Fund had gener- ally neutral allocations to Australia and Japan and slight underweight exposures to Singa- pore and Hong Kong. Key active positioning reflects underweight exposure to retail fo- cused REITs in the region and overweight exposure to industrial real estate and diversi- fied developers.
The Fund ended the fiscal year with neutral exposure to Europe, relative to its style- specific index. Key active positioning reflects material underweight exposure to retail fo- cused REITs and overweight exposure to resi- dential real estate. The Fund held under- weight positions in Belgium and the Netherlands, and material country overweight exposure to Germany. Additionally, France and Spain show overweight exposure, driven by positions in office focused REITs.
Relative to the style-specific index, the Fund ended the fiscal year with an under- weight allocation to emerging markets (EM). Key active positioning for EM reflects under- weight exposure to ASEAN, Brazilian and Chi- nese homebuilders.
At the end of the fiscal year, real estate continued to offer investors tangible asset exposure, with rents that can adjust upwards (or downwards) over time with economic strength and inflation. Listed real estate com- panies were generally maintaining financial discipline. Falling credit costs were improving cash flows modestly, and absolute levels of debt remained in check. Many companies had the ability to utilize attractively priced new equity and debt to complete accretive acquisi- tions and enhance their growth rate. While recognizing the need to maintain attractive yield characteristics in an income starved world, our overall portfolio maintains a bias toward companies that we believe have higher quality assets, supply constrained real estate market exposure, generally lower lev- eraged balance sheets and most importantly, above average earnings and asset value growth.
We thank you for your continued invest- ment in Invesco Global Real Estate Fund.
Portfolio managers:
Mark Blackburn
James Cowen - Lead
Paul Curbo - Lead
Grant Jackson
Joe Rodriguez, Jr. - Lead
Darin Turner
Ping-Ying Wang - Lead
The views and opinions expressed in management's discussion of Fund performance are those of Invesco Advisers, Inc. These views and opinions are subject to change at any time based on factors such as market and economic conditions. These views and opinions may not be relied upon as investment advice or recommendations, or as an offer for a particular security. The information is not a complete analysis of every aspect of any market, country, industry, security or the Fund. Statements of fact are from sources considered reliable, but Invesco Advisers, Inc. makes no representation or warranty as to their completeness or accuracy. Although historical performance is no guarantee of future results, these insights may help you understand our investment management philosophy.
See important Fund and, if applicable, index disclosures later in this report.
5Invesco Global Real Estate Fund
Your Fund's Long-Term Performance
Results of a $10,000 Investment — Oldest Share Class(es)
Fund and index data from 2/28/10
$30,000
$23,129 MSCI World Index1
$22,032 Lipper Global Real Estate Funds Classification Average3
25,000$21,614 Custom Invesco Global Real Estate Index2 $21,128 Invesco Global Real Estate Fund — Class R5 Shares
$19,601 Invesco Global Real Estate Fund — Class R Shares
 $19,031 Invesco Global Real Estate Fund — Class A Shares
 $18,653 Invesco Global Real Estate Fund — Class C Shares
15,000
10,000
5,000
2/28/10 | 2/11 | 2/12 | 2/13 | 2/14 | 2/15 | 2/16 | 2/17 | 2/18 | 2/19 | 2/20 |
1 Source: RIMES Technologies Corp.
2Source: Invesco, RIMES Technologies Corp.
3 Source: Lipper Inc.
Past performance cannot guarantee future results.
The data shown in the chart include rein- vested distributions, applicable sales charges and Fund expenses including management
fees. Index results include reinvested divi- dends, but they do not reflect sales charges. Performance of the peer group, if applicable, reflects fund expenses and management fees;
performance of a market index does not. Per- formance shown in the chart does not reflect deduction of taxes a shareholder would pay on Fund distributions or sale of Fund shares.
6Invesco Global Real Estate Fund

Average Annual Total Returns
As of 2/29/20, including maximum applicable sales charges
Class A Shares
Inception (4/29/05) | 5.05% |
10 Years | 6.65 |
5 | Years | 1.82 |
1 | Year | –2.38 |
Class C Shares | |
Inception (4/29/05) | 4.92% |
10 Years | 6.43 |
5 | Years | 2.20 |
1 | Year | 1.59 |
Class R Shares | |
Inception (4/29/05) | 5.18% |
10 Years | 6.96 |
5 | Years | 2.70 |
1 | Year | 3.02 |
Class Y Shares | |
Inception (10/3/08) | 6.35% |
10 Years | 7.51 |
5 | Years | 3.23 |
1 | Year | 3.55 |
Class R5 Shares | |
Inception (4/29/05) | 5.94% |
10 Years | 7.77 |
5 | Years | 3.38 |
1 | Year | 3.68 |
Class R6 Shares | |
10 Years | 7.66% |
5 | Years | 3.47 |
1 | Year | 3.77 |
Class R6 shares incepted on September 24, 2012. Performance shown prior to that date is that of Class A shares and includes the 12b-1 fees applicable to Class A shares.
The performance data quoted represent past performance and cannot guarantee future results; current performance may be lower or higher. Please visit invesco.com/ performance for the most recent month- end performance. Performance figures re- flect reinvested distributions, changes in net asset value and the effect of the maxi- mum sales charge unless otherwise stated. Performance figures do not reflect deduc- tion of taxes a shareholder would pay on Fund distributions or sale of Fund shares. Investment return and principal value will fluctuate so that you may have a gain or loss when you sell shares.
Class A share performance reflects the maximum 5.50% sales charge, and Class C share performance reflects the applicable contingent deferred sales charge (CDSC) for the period involved. The CDSC on Class C shares is 1% for the first year after purchase. Class R, Class Y, Class R5 and Class R6 shares do not have a front-end sales charge or a CDSC; therefore, perfor- mance is at net asset value.
The performance of the Fund's share classes will differ primarily due to different sales charge structures and class expenses. Fund performance reflects any applicable
fee waivers and/or expense reimburse- ments. Had the adviser not waived fees and/or reimbursed expenses currently or in the past, returns would have been lower. See current prospectus for more informa- tion.
7Invesco Global Real Estate Fund

Invesco Global Real Estate Fund's investment objective is total return through growth of capital and current income.
Unless otherwise stated, information presented in this report is as of February 29, 2020, and is based on total net assets.
Unless otherwise noted, all data provided by Invesco.
To access your Fund's reports/prospectus, visit invesco.com/fundreports.
About indexes used in this report
The MSCI World IndexSM is an unman- aged index considered representative of stocks of developed countries. The index is computed using the net return, which withholds applicable taxes for non-resident investors.
The Custom Invesco Global Real Estate Index is composed of the FTSE EPRA/ Nareit Developed Index (gross) from Fund inception through February 17, 2005; the FTSE EPRA/Nareit Developed Index (net) index from February 18, 2005, through June 30, 2014; and the FTSE EPRA/ Nareit Global (net) Index from July 1, 2014.
The Lipper Global Real Estate Funds Classification Average represents an av- erage of all funds in the Lipper Global Real Estate Funds classification.
The FTSE EPRA/Nareit Developed Index is an unmanaged index considered repre- sentative of global real estate companies and REITs. The index is computed using the net return, which withholds taxes for non-resident investors.
The FTSE EPRA/Nareit Global Index is designed to track the performance of listed real estate companies and REITs in both developed and emerging markets. The index is computed using the net re- turn, which withholds taxes for non- resident investors.
The Fund is not managed to track the per- formance of any particular index, including the index(es) described here, and conse- quently, the performance of the Fund may deviate significantly from the performance of the index(es).
A direct investment cannot be made in an index. Unless otherwise indicated, index results include reinvested dividends, and they do not reflect sales charges. Perfor- mance of the peer group, if applicable, reflects fund expenses; performance of a market index does not.
Other information
Property type classifications used in this report are generally according to the FTSE National Association of Real Estate Invest- ment Trusts (Nareit) Equity All REITS Index, which is exclusively owned by Na- reit. The FTSE Nareit Equity All REITS Index is an unmanaged index considered representative of US REITs.
This report must be accompanied or preceded by a currently effective Fund prospectus, which contains more complete information, including sales charges and expenses. Investors should read it carefully before investing.
NOT FDIC INSURED | MAY LOSE VALUE | NO BANK GUARANTEE
8Invesco Global Real Estate Fund

Schedule of Investments
February 29, 2020
SharesValue
Common Stocks & Other Equity Interests–98.06%
Australia–3.05% | | | |
Charter Hall Long Wale REIT | 193,515 | $ | 694,624 |
Dexus | 878,333 | | 6,877,267 |
Goodman Group | 384,720 | | 3,704,086 |
GPT Group (The) | 503,957 | | 1,880,056 |
Mirvac Group | 2,251,693 | | 4,405,925 |
Scentre Group | 1,800,004 | | 4,009,210 |
| | | 21,571,168 |
Belgium–0.23% | | | |
Cofinimmo S.A. | 7,637 | | 1,219,904 |
Montea C.V.A | 4,523 | | 425,084 |
| | | 1,644,988 |
Brazil–0.54% | | | |
BR Malls Participacoes S.A. | 452,276 | | 1,652,584 |
Cyrela Brazil Realty S.A. | | | |
Empreendimentos e Participacoes | 144,800 | | 965,894 |
Multiplan Empreendimentos | | | |
Imobiliarios S.A. | 173,300 | | 1,182,745 |
| | | 3,801,223 |
Canada–3.14% | | | |
Allied Properties REIT | 138,892 | | 5,636,392 |
Canadian Apartment Properties REIT | 93,770 | | 3,921,259 |
H&R REIT | 103,500 | | 1,496,692 |
Killam Apartment REIT | 279,960 | | 4,476,023 |
SmartCentres REIT | 236,600 | | 5,073,085 |
Summit Industrial Income REIT | 175,400 | | 1,659,586 |
| | | 22,263,037 |
Chile–0.07% | | | |
Parque Arauco S.A. | 241,920 | | 496,914 |
China–5.80% | | | |
Agile Group Holdings Ltd. | 1,142,000 | | 1,616,568 |
CapitaLand Retail China Trust | 1,214,761 | | 1,236,798 |
China Evergrande Group | 875,000 | | 1,986,390 |
China Jinmao Holdings Group Ltd. | 2,498,000 | | 1,840,086 |
China Overseas Land & Investment Ltd. | 1,345,700 | | 4,552,713 |
China Resources Land Ltd. | 1,063,377 | | 4,947,153 |
China SCE Group Holdings Ltd. | 2,348,000 | | 1,289,792 |
China Vanke Co. Ltd., H Shares | 545,000 | | 2,116,059 |
CIFI Holdings Group Co. Ltd. | 3,120,000 | | 2,410,657 |
Guangzhou R&F Properties Co. Ltd., H | | | |
Shares | 398,800 | | 626,688 |
Logan Property Holdings Co. Ltd. | 1,174,000 | | 2,021,481 |
Longfor Group Holdings Ltd.(a) | 593,000 | | 2,765,736 |
Powerlong Real Estate Holdings Ltd. | 1,155,000 | | 726,501 |
Ronshine China Holdings Ltd.(b) | 475,500 | | 531,088 |
Shenzhen Investment Ltd. | 1,946,000 | | 657,771 |
Shimao Property Holdings Ltd. | 1,304,500 | | 4,712,955 |
Sunac China Holdings Ltd. | 828,000 | | 4,566,556 |
Times China Holdings Ltd. | 705,000 | | 1,317,321 |
Yuexiu Property Co. Ltd. | 5,482,000 | | 1,125,597 |
| | | 41,047,910 |
| Shares | Value |
France–1.70% | | |
Gecina S.A. | 45,597 | $ 8,158,636 |
ICADE | 38,613 | 3,857,443 |
| | 12,016,079 |
Germany–5.78% | | |
Aroundtown S.A. | 658,084 | 5,695,668 |
Deutsche Wohnen SE | 155,223 | 6,265,798 |
Grand City Properties S.A. | 253,860 | 5,950,756 |
LEG Immobilien AG | 27,437 | 3,278,490 |
Vonovia SE | 367,964 | 19,766,018 |
| | 40,956,730 |
Hong Kong–5.40% | | |
CK Asset Holdings Ltd. | 1,087,500 | 6,846,378 |
Hang Lung Properties Ltd. | 2,984,000 | 6,575,893 |
Kerry Properties Ltd. | 213,500 | 611,821 |
Link REIT | 684,100 | 6,371,577 |
Mapletree North Asia Commercial Trust | 712,000 | 566,443 |
New World Development Co. Ltd. | 5,092,000 | 6,602,442 |
Sun Hung Kai Properties Ltd. | 676,100 | 9,682,978 |
Wharf Holdings Ltd. (The)(c) | 466,000 | 990,199 |
| | 38,247,731 |
India–0.11% | | |
Oberoi Realty Ltd. | 115,818 | 818,598 |
Indonesia–0.17% | | |
PT Bumi Serpong Damai Tbk(b) | 3,476,800 | 244,045 |
PT Pakuwon Jati Tbk | 16,869,500 | 627,841 |
PT Summarecon Agung Tbk | 5,194,800 | 306,993 |
| | 1,178,879 |
Japan–10.62% | | |
Activia Properties, Inc. | 907 | 4,256,773 |
Comforia Residential REIT, Inc. | 1,182 | 3,620,841 |
Daiwa House REIT Investment Corp. | 1,822 | 4,551,246 |
Daiwa Office Investment Corp. | 444 | 3,398,805 |
Invincible Investment Corp. | 3,535 | 1,412,002 |
Japan Prime Realty Investment Corp. | 784 | 3,424,371 |
Japan Real Estate Investment Corp. | 941 | 6,332,955 |
Japan Rental Housing Investments, Inc. | 2,351 | 2,124,453 |
Japan Retail Fund Investment Corp. | 1,300 | 2,448,556 |
LaSalle Logiport REIT | 2,323 | 3,403,854 |
Mitsui Fudosan Co. Ltd. | 384,000 | 8,895,807 |
Mitsui Fudosan Logistics Park, Inc.(b) | 876 | 3,881,091 |
Mori Hills REIT Investment Corp. | 1,353 | 2,127,277 |
Nippon Accommodations Fund, Inc. | 429 | 2,622,806 |
Nippon Building Fund, Inc. | 849 | 6,293,224 |
Nomura Real Estate Holdings, Inc. | 148,500 | 3,234,815 |
Sumitomo Realty & Development Co. Ltd. | 301,200 | 9,502,678 |
Tokyu Fudosan Holdings Corp. | 576,600 | 3,627,757 |
| | 75,159,311 |
Malta–0.00% | | |
BGP Holdings PLC(b)(c) | 9,888,325 | 0 |
Mexico–0.34% | | |
Fibra Uno Administracion S.A. de C.V. | 384,994 | 578,772 |
See accompanying Notes to Financial Statements which are an integral part of the financial statements.
9Invesco Global Real Estate Fund
| Shares | Value |
Mexico–(continued) | | |
Macquarie Mexico Real Estate Management | | |
S.A. de C.V.(a) | 901,400 | $ 1,196,188 |
PLA Administradora Industrial, S. de R.L. de | | |
C.V. | 412,200 | 620,719 |
| | 2,395,679 |
Philippines–0.92% | | |
Altus San Nicolas Corp.(b)(c) | 22,307 | 2,273 |
Ayala Land, Inc. | 2,911,200 | 2,235,228 |
Megaworld Corp. | 20,961,200 | 1,401,224 |
SM Prime Holdings, Inc. | 3,816,200 | 2,862,216 |
| | 6,500,941 |
Singapore–2.51% | | |
Ascendas India Trust | 691,000 | 820,444 |
Ascendas REIT | 1,467,100 | 3,236,040 |
CapitaLand Ltd. | 1,606,700 | 4,107,367 |
CapitaLand Mall Trust | 132,300 | 216,919 |
City Developments Ltd. | 444,000 | 3,112,912 |
Keppel DC REIT | 936,000 | 1,542,853 |
Mapletree Commercial Trust | 1,888,515 | 2,869,167 |
Mapletree Logistics Trust | 1,412,500 | 1,879,001 |
| | 17,784,703 |
South Africa–0.44% | | |
Growthpoint Properties Ltd. | 1,507,567 | 1,719,877 |
Redefine Properties Ltd. | 2,664,001 | 928,618 |
SA Corporate Real Estate Ltd. | 3,554,091 | 475,119 |
| | 3,123,614 |
Spain–1.06% | | |
Inmobiliaria Colonial SOCIMI S.A. | 293,664 | 3,768,950 |
Merlin Properties SOCIMI S.A. | 290,531 | 3,748,553 |
| | 7,517,503 |
Sweden–2.14% | | |
Fabege AB | 462,557 | 7,609,038 |
Hufvudstaden AB, Class A | 98,980 | 1,780,723 |
Wihlborgs Fastigheter AB | 299,317 | 5,748,218 |
| | 15,137,979 |
Switzerland–0.98% | | |
Swiss Prime Site AG(b) | 57,429 | 6,923,974 |
Thailand–0.47% | | |
Central Pattana PCL, Foreign Shares | 1,971,300 | 3,315,473 |
Turkey–0.03% | | |
Emlak Konut Gayrimenkul Yatirim Ortakligi | | |
A.S. | 903,872 | 208,720 |
United Arab Emirates–0.18% | | |
Emaar Development PJSC | 889,578 | 863,757 |
Emaar Malls PJSC | 893,565 | 387,142 |
| | 1,250,899 |
United Kingdom–4.13% | | |
Assura PLC | 3,884,996 | 3,690,612 |
Big Yellow Group PLC | 168,496 | 2,311,014 |
Derwent London PLC | 68,594 | 3,485,532 |
GCP Student Living PLC | 745,859 | 1,814,871 |
Grainger PLC | 446,365 | 1,694,848 |
Land Securities Group PLC | 495,118 | 5,330,547 |
| Shares | Value |
United Kingdom–(continued) | | |
Segro PLC | 424,427 | $ 4,492,804 |
Tritax Big Box REIT PLC | 2,068,957 | 3,467,072 |
Workspace Group PLC | 201,406 | 2,938,608 |
| | 29,225,908 |
United States–48.25% | | |
Agree Realty Corp. | 94,221 | 6,766,952 |
Alexandria Real Estate Equities, Inc. | 40,890 | 6,210,373 |
American Assets Trust, Inc. | 69,056 | 2,862,371 |
American Homes 4 Rent, Class A | 280,717 | 7,267,763 |
Americold Realty Trust | 183,067 | 5,614,665 |
AvalonBay Communities, Inc. | 100,285 | 20,116,168 |
Boston Properties, Inc. | 217,424 | 28,034,651 |
Camden Property Trust | 81,267 | 8,612,677 |
CareTrust REIT, Inc. | 177,508 | 3,704,592 |
Crown Castle International Corp. | 17,725 | 2,539,815 |
CyrusOne, Inc. | 67,628 | 4,096,904 |
Digital Realty Trust, Inc. | 37,582 | 4,513,974 |
EastGroup Properties, Inc. | 28,631 | 3,599,776 |
Empire State Realty Trust, Inc., Class A | 32,371 | 378,741 |
EPR Properties | 90,045 | 5,334,266 |
Equity Residential | 80,562 | 6,050,206 |
Essential Properties Realty Trust, Inc. | 110,802 | 2,538,474 |
Essex Property Trust, Inc. | 1,449 | 410,589 |
Extra Space Storage, Inc. | 23,314 | 2,339,793 |
Federal Realty Investment Trust | 43,953 | 5,113,492 |
Four Corners Property Trust, Inc. | 53,413 | 1,532,419 |
Gaming and Leisure Properties, Inc. | 116,789 | 5,216,965 |
Healthpeak Properties, Inc. | 420,083 | 13,291,426 |
Hudson Pacific Properties, Inc. | 372,393 | 12,020,846 |
Invitation Homes, Inc. | 441,380 | 12,663,192 |
Kilroy Realty Corp. | 16,322 | 1,186,446 |
Macerich Co. (The) | 199,295 | 4,069,604 |
Medical Properties Trust, Inc. | 222,496 | 4,701,341 |
Mid-America Apartment Communities, Inc. | 51,024 | 6,595,362 |
Omega Healthcare Investors, Inc. | 115,869 | 4,588,412 |
Park Hotels & Resorts, Inc. | 182,813 | 3,338,165 |
Pebblebrook Hotel Trust | 262,070 | 5,296,435 |
Prologis, Inc. | 145,946 | 12,300,329 |
Public Storage | 47,176 | 9,865,445 |
QTS Realty Trust, Inc., Class A | 82,560 | 4,637,395 |
Realty Income Corp. | 4,652 | 336,758 |
Regency Centers Corp. | 10,604 | 609,094 |
Retail Opportunity Investments Corp. | 179,843 | 2,697,645 |
Rexford Industrial Realty, Inc. | 132,404 | 6,192,535 |
SBA Communications Corp., Class A | 7,080 | 1,876,837 |
Simon Property Group, Inc. | 118,590 | 14,596,057 |
STAG Industrial, Inc. | 190,103 | 5,319,082 |
Sun Communities, Inc. | 66,453 | 10,159,335 |
Sunstone Hotel Investors, Inc. | 336,130 | 3,680,624 |
Terreno Realty Corp. | 73,489 | 4,032,341 |
UDR, Inc. | 333,881 | 15,017,967 |
Ventas, Inc. | 308,946 | 16,612,026 |
VEREIT, Inc. | 1,636,132 | 14,168,903 |
VICI Properties, Inc. | 455,850 | 11,423,601 |
Vornado Realty Trust | 95,845 | 5,135,375 |
See accompanying Notes to Financial Statements which are an integral part of the financial statements.
10 | Invesco Global Real Estate Fund |
| Shares | Value |
United States–(continued) | | |
Welltower, Inc. | 31,503 | $ 2,357,056 |
| | 341,625,260 |
Total Common Stocks & Other Equity Interests | |
(Cost $605,943,534) | | 694,213,221 |
Money Market Funds–1.11%
Invesco Government & Agency Portfolio, | | |
Institutional Class, 1.50%(d) | 2,763,063 | 2,763,063 |
Invesco Liquid Assets Portfolio, Institutional | | |
Class, 1.64%(d) | 1,972,828 | 1,973,814 |
Investment Abbreviations:
REIT – Real Estate Investment Trust
Notes to Schedule of Investments:
| | Shares | | Value |
| Money Market Funds–(continued) | | |
Invesco Treasury Portfolio, Institutional | | | |
| Class, 1.48%(d) | 3,157,786 | $ | 3,157,786 |
| Total Money Market Funds (Cost $7,894,368) | | 7,894,663 |
TOTAL INVESTMENTS IN SECURITIES—99.17% | | | |
| (Cost $613,837,902) | | | 702,107,884 |
OTHER ASSETS LESS LIABILITIES–0.83% | | | 5,871,050 |
NET ASSETS–100.00% | | $707,978,934 |
(a)Security purchased or received in a transaction exempt from registration under the Securities Act of 1933, as amended (the "1933 Act"). The security may be resold pursuant to an exemption from registration under the 1933 Act, typically to qualified institutional buyers. The aggregate value of these securities at February 29, 2020 was $3,961,924, which represented less than 1% of the Fund's Net Assets.
(b)Non-income producing security.
(c)Security valued using significant unobservable inputs (Level 3). See Note 3.
(d)The money market fund and the Fund are affiliated by having the same investment adviser. The rate shown is the 7-day SEC standardized yield as of February 29, 2020.
See accompanying Notes to Financial Statements which are an integral part of the financial statements.
11 | Invesco Global Real Estate Fund |
Statement of Assets and Liabilities
February 29, 2020
Assets: | |
Investments in securities, at value | |
(Cost $605,943,534) | $694,213,221 |
Investments in affiliated money market funds, at value | |
(Cost $7,894,368) | 7,894,663 |
Cash | 349,187 |
Foreign currencies, at value (Cost $1,172,892) | 1,170,387 |
Receivable for: | |
Investments sold | 21,829,457 |
Fund shares sold | 1,702,839 |
Dividends | 1,261,231 |
Investment for trustee deferred compensation and | |
retirement plans | 153,340 |
Other assets | 19,461 |
Total assets | 728,593,786 |
Liabilities: | |
Payable for: | |
Investments purchased | 18,379,849 |
Fund shares reacquired | 1,646,310 |
Accrued fees to affiliates | 285,181 |
Accrued trustees' and officers' fees and benefits | 3,255 |
Accrued other operating expenses | 130,218 |
Trustee deferred compensation and retirement plans | 170,039 |
Total liabilities | 20,614,852 |
Net assets applicable to shares outstanding | $707,978,934 |
Net assets consist of: | |
Shares of beneficial interest | $631,808,565 |
Distributable earnings | 76,170,369 |
| $707,978,934 |
Net Assets: | | |
Class A | $143,448,335 |
Class C | $ | 12,169,004 |
Class R | $ | 22,292,579 |
Class Y | $ | 166,068,770 |
Class R5 | $164,048,225 |
Class R6 | $199,952,021 |
Shares outstanding, no par value, with an unlimited number of shares authorized:
Class A | | 12,309,792 |
Class C | | 1,044,261 |
Class R | | 1,914,369 |
Class Y | | 14,253,570 |
Class R5 | | 14,127,943 |
Class R6 | | 17,221,113 |
Class A: | | |
Net asset value per share | $ | 11.65 |
Maximum offering price per share | | |
(Net asset value of $11.65 ÷ 94.50%) | $ | 12.33 |
Class C: | | |
Net asset value and offering price per share | $ | 11.65 |
Class R: | | |
Net asset value and offering price per share | $ | 11.64 |
Class Y: | | |
Net asset value and offering price per share | $ | 11.65 |
Class R5: | | |
Net asset value and offering price per share | $ | 11.61 |
Class R6: | | |
Net asset value and offering price per share | $ | 11.61 |
See accompanying Notes to Financial Statements which are an integral part of the financial statements.
12 | Invesco Global Real Estate Fund |
Statement of Operations
For the year ended February 29, 2020
Investment income: | | | |
Dividends (net of foreign withholding taxes of $1,293,431) | $ 24,690,648 | |
Dividends from affiliated money market funds | 182,094 | | |
Total investment income | 24,872,742 | |
Expenses: | | | |
Advisory fees | 5,853,288 | |
Administrative services fees | 112,728 | | |
Custodian fees | 97,776 | | |
Distribution fees: | | | |
Class A | 391,442 | | |
Class C | 140,030 | | |
Class R | 122,448 | | |
Transfer agent fees — A, C, R and Y | 822,767 | | |
Transfer agent fees — R5 | 189,402 | | |
Transfer agent fees — R6 | 20,674 | | |
Trustees' and officers' fees and benefits | 27,720 | | |
Registration and filing fees | 120,143 | | |
Reports to shareholders | 86,109 | | |
Professional services fees | 65,457 | | |
Other | 25,393 | | |
Total expenses | 8,075,377 | | |
Less: Fees waived and/or expense offset arrangement(s) | (13,771) |
Net expenses | 8,061,606 | | |
Net investment income | 16,811,136 | |
Realized and unrealized gain (loss) from: | | | |
Net realized gain (loss) from: | | | |
Investment securities (net of foreign taxes of $136,467) | 70,082,890 | |
Foreign currencies | (85,920) |
| 69,996,970 | |
Change in net unrealized appreciation (depreciation) of: | | | |
Investment securities (net of foreign taxes of $157,083) | (55,360,616) |
Foreign currencies | 8,493 | | |
| (55,352,123) |
Net realized and unrealized gain | 14,644,847 | |
Net increase in net assets resulting from operations | $ 31,455,983 | |
See accompanying Notes to Financial Statements which are an integral part of the financial statements.
13 | Invesco Global Real Estate Fund |
Statement of Changes in Net Assets
For the years ended February 29, 2020 and February 28, 2019
| | 2020 | | 2019 | | |
Operations: | | | | | | |
Net investment income | $ | 16,811,136 | $ | 26,532,879 |
Net realized gain | | 69,996,970 | | 62,388,136 |
Change in net unrealized appreciation (depreciation) | | (55,352,123) | | 6,376,044 |
Net increase in net assets resulting from operations | | 31,455,983 | | 95,297,059 |
Distributions to shareholders from distributable earnings: | | | | | | |
Class A | | (16,229,157) | | (14,253,216) |
| | | | | | |
Class C | | (1,318,000) | | (2,148,367) |
| | | | | | |
Class R | | (2,418,883) | | (2,314,959) |
| | | | | | |
Class Y | | (20,721,453) | | (24,652,771) |
| | | | | | |
Class R5 | | (19,388,296) | | (23,113,218) |
| | | | | | |
Class R6 | | (23,170,603) | | (21,000,926) |
| | | | | | |
Total distributions from distributable earnings | | (83,246,392) | | (87,483,457) |
Share transactions–net: | | | | | | |
Class A | | (35,816) | | (1,637,843) |
| | | | | | |
Class C | | (1,640,150) | | (12,820,462) |
Class R | | (67,751) | | 570,595 | |
Class Y | | (13,153,212) | | (443,783,707) |
| | | | | |
Class R5 | | (33,727,538) | | (50,509,782) |
Class R6 | | 7,961,247 | | 11,243,127 |
Net increase (decrease) in net assets resulting from share transactions | | (40,663,220) | | (496,938,072) |
| | | | | |
Net increase (decrease) in net assets | | (92,453,629) | | (489,124,470) |
Net assets: | | | | | | |
Beginning of year | | 800,432,563 | | 1,289,557,033 |
End of year | $707,978,934 | $ | 800,432,563 |
See accompanying Notes to Financial Statements which are an integral part of the financial statements.
14 | Invesco Global Real Estate Fund |
Financial Highlights
The following schedule presents financial highlights for a share of the Fund outstanding throughout the periods indicated.
| | | | | | | | | | | Ratio of | Ratio of | | |
| | | | | | | | | | | expenses | expenses | | |
| | | Net gains | | | | | | | | to average | to average net | | |
| | | (losses) | | | | | | | | net assets | assets without | Ratio of net | |
| Net asset | | on securities | | Dividends | Distributions | | | | | with fee waivers | fee waivers | investment | |
| value, | Net | (both | Total from | from net | from net | | Net asset | | Net assets, | and/or | and/or | income | |
| beginning | investment | realized and | investment | investment | realized | Total | value, end | Total | end ofperiod | expenses | expenses | to average | Portfolio |
| ofperiod | income(a) | unrealized) | operations | income | gains | distributions | ofperiod | return (b) | (000's omitted) | absorbed | absorbed | net assets | turnover (c) |
Class A | | | | | | | | | | | 1.27%(d) | 1.27%(d) | 1.87%(d) | |
Year ended 02/29/20 | $12.59 | $0.24 | $ 0.22 | $ 0.46 | $(0.54) | $(0.86) | $(1.40) | $11.65 | 3.20% | $ 143,448 | 60% |
Year ended 02/28/19 | 12.76 | 0.29 | 0.84 | 1.13 | (0.60) | (0.70) | (1.30) | 12.59 | 9.46 | 154,173 | 1.26 | 1.26 | 2.26 | 47 |
Year ended 02/28/18 | 12.83 | 0.30(e) | (0.01) | 0.29 | (0.28) | (0.08) | (0.36) | 12.76 | 2.17 | 156,543 | 1.27 | 1.27 | 2.31(e) | 51 |
Year ended 02/28/17 | 11.94 | 0.20 | 1.16 | 1.36 | (0.47) | — | (0.47) | 12.83 | 11.54 | 221,942 | 1.36 | 1.36 | 1.54 | 57 |
Year ended 02/29/16 | 13.51 | 0.19 | (1.53) | (1.34) | (0.23) | — | (0.23) | 11.94 | (10.00) | 254,298 | 1.43 | 1.43 | 1.47 | 84 |
Class C | | | | | | | | | | | 2.02(d) | 2.02(d) | 1.12(d) | 60 |
Year ended 02/29/20 | 12.59 | 0.15 | 0.21 | 0.36 | (0.44) | (0.86) | (1.30) | 11.65 | 2.43 | 12,169 |
Year ended 02/28/19 | 12.75 | 0.20 | 0.84 | 1.04 | (0.50) | (0.70) | (1.20) | 12.59 | 8.71 | 14,673 | 2.01 | 2.01 | 1.51 | 47 |
Year ended 02/28/18 | 12.83 | 0.21(e) | (0.03) | 0.18 | (0.18) | (0.08) | (0.26) | 12.75 | 1.33 | 27,654 | 2.02 | 2.02 | 1.56(e) | 51 |
Year ended 02/28/17 | 11.95 | 0.10 | 1.16 | 1.26 | (0.38) | — | (0.38) | 12.83 | 10.62 | 33,299 | 2.11 | 2.11 | 0.79 | 57 |
Year ended 02/29/16 | 13.52 | 0.09 | (1.53) | (1.44) | (0.13) | — | (0.13) | 11.95 | (10.67) | 36,419 | 2.18 | 2.18 | 0.72 | 84 |
Class R | | | | | | | | | | | 1.52(d) | 1.52(d) | 1.62(d) | 60 |
Year ended 02/29/20 | 12.58 | 0.21 | 0.21 | 0.42 | (0.50) | (0.86) | (1.36) | 11.64 | 2.94 | 22,293 |
Year ended 02/28/19 | 12.75 | 0.26 | 0.84 | 1.10 | (0.57) | (0.70) | (1.27) | 12.58 | 9.18 | 24,003 | 1.51 | 1.51 | 2.01 | 47 |
Year ended 02/28/18 | 12.83 | 0.27(e) | (0.02) | 0.25 | (0.25) | (0.08) | (0.33) | 12.75 | 1.84 | 23,658 | 1.52 | 1.52 | 2.06(e) | 51 |
Year ended 02/28/17 | 11.95 | 0.17 | 1.15 | 1.32 | (0.44) | — | (0.44) | 12.83 | 11.17 | 19,718 | 1.61 | 1.61 | 1.29 | 57 |
Year ended 02/29/16 | 13.52 | 0.16 | (1.53) | (1.37) | (0.20) | — | (0.20) | 11.95 | (10.22) | 17,999 | 1.68 | 1.68 | 1.22 | 84 |
Class Y | | | | | | | | | | | 1.02(d) | 1.02(d) | 2.12(d) | |
Year ended 02/29/20 | 12.59 | 0.28 | 0.21 | 0.49 | (0.57) | (0.86) | (1.43) | 11.65 | 3.46 | 166,069 | 60 |
Year ended 02/28/19 | 12.76 | 0.33 | 0.83 | 1.16 | (0.63) | (0.70) | (1.33) | 12.59 | 9.74 | 191,757 | 1.01 | 1.01 | 2.51 | 47 |
Year ended 02/28/18 | 12.83 | 0.34(e) | (0.02) | 0.32 | (0.31) | (0.08) | (0.39) | 12.76 | 2.42 | 623,470 | 1.02 | 1.02 | 2.56(e) | 51 |
Year ended 02/28/17 | 11.95 | 0.23 | 1.15 | 1.38 | (0.50) | — | (0.50) | 12.83 | 11.72 | 1,167,799 | 1.11 | 1.11 | 1.79 | 57 |
Year ended 02/29/16 | 13.52 | 0.22 | (1.53) | (1.31) | (0.26) | — | (0.26) | 11.95 | (9.77) | 1,199,430 | 1.18 | 1.18 | 1.72 | 84 |
Class R5 | | | | | | | | | | | 0.91(d) | 0.91(d) | 2.23(d) | 60 |
Year ended 02/29/20 | 12.55 | 0.29 | 0.21 | 0.50 | (0.58) | (0.86) | (1.44) | 11.61 | 3.59 | 164,048 |
Year ended 02/28/19 | 12.72 | 0.34 | 0.84 | 1.18 | (0.65) | (0.70) | (1.35) | 12.55 | 9.87 | 208,742 | 0.92 | 0.92 | 2.60 | 47 |
Year ended 02/28/18 | 12.81 | 0.35(e) | (0.03) | 0.32 | (0.33) | (0.08) | (0.41) | 12.72 | 2.40 | 260,397 | 0.93 | 0.93 | 2.65(e) | 51 |
Year ended 02/28/17 | 11.93 | 0.26 | 1.15 | 1.41 | (0.53) | — | (0.53) | 12.81 | 12.00 | 264,906 | 0.88 | 0.88 | 2.02 | 57 |
Year ended 02/29/16 | 13.49 | 0.25 | (1.52) | (1.27) | (0.29) | — | (0.29) | 11.93 | (9.47) | 296,506 | 0.91 | 0.91 | 1.99 | 84 |
Class R6 | | | | | | | | | | | 0.82(d) | 0.82(d) | 2.32(d) | |
Year ended 02/29/20 | 12.55 | 0.30 | 0.22 | 0.52 | (0.60) | (0.86) | (1.46) | 11.61 | 3.68 | 199,952 | 60 |
Year ended 02/28/19 | 12.72 | 0.35 | 0.84 | 1.19 | (0.66) | (0.70) | (1.36) | 12.55 | 9.97 | 207,085 | 0.83 | 0.83 | 2.69 | 47 |
Year ended 02/28/18 | 12.81 | 0.36(e) | (0.03) | 0.33 | (0.34) | (0.08) | (0.42) | 12.72 | 2.49 | 197,835 | 0.85 | 0.85 | 2.73(e) | 51 |
Year ended 02/28/17 | 11.93 | 0.27 | 1.15 | 1.42 | (0.54) | — | (0.54) | 12.81 | 12.07 | 54,547 | 0.81 | 0.81 | 2.09 | 57 |
Year ended 02/29/16 | 13.49 | 0.26 | (1.52) | (1.26) | (0.30) | — | (0.30) | 11.93 | (9.41) | 86,307 | 0.84 | 0.84 | 2.06 | 84 |
(a)Calculated using average shares outstanding.
(b)Includes adjustments in accordance with accounting principles generally accepted in the United States of America and as such, the net asset value for financial reporting purposes and the returns based upon those net asset values may differ from the net asset value and returns for shareholder transactions. Does not include sales charges and is not annualized for periods less than one year, if applicable.
(c)Portfolio turnover is calculated at the fund level and is not annualized for periods less than one year, if applicable.
(d)Ratios are based on average daily net assets (000's omitted) of $156,577, $14,003, $24,490, $193,694, $189,241 and $213,542 for Class A, Class C, Class R, Class Y, Class R5 and Class R6 shares, respectively.
(e)Net investment income per share and the ratio of net investment income to average net assets includes significant dividends received during the year ended February 28, 2018. Net investment income per share and the ratio of net investment income to average net assets excluding the significant dividends are $0.25 and 1.92%, $0.16 and 1.17%, $0.22 and 1.67%, $0.29 and 2.17%, $0.30 and 2.26%, $0.31 and 2.34% for Class A, Class C, Class R, Class Y, Class R5 and Class R6 shares, respectively.
See accompanying Notes to Financial Statements which are an integral part of the financial statements.
15 | Invesco Global Real Estate Fund |
Notes to Financial Statements
February 29, 2020
NOTE 1—Significant Accounting Policies
Invesco Global Real Estate Fund (the "Fund"), is a series portfolio of AIM Investment Securities Funds (Invesco Investment Securities Funds) (the "Trust"). The Trust is organized as a Delaware statutory trust and is registered under the Investment Company Act of 1940, as amended (the "1940 Act"), as an open-end series management investment company authorized to issue an unlimited number of shares of beneficial interest. Information presented in these financial statements pertains only to the Fund. Matters affecting the Fund or each class will be voted on exclusively by the shareholders of the Fund or each class.
The Fund's investment objective is total return through growth of capital and current income.
The Fund currently consists of six different classes of shares: Class A, Class C, Class R, Class Y, Class R5 and Class R6. Class Y shares are available only to certain investors. Class A shares are sold with a front-end sales charge unless certain waiver criteria are met. Under certain circumstances, load waived shares may be subject to contingent deferred sales charges ("CDSC"). Class C shares are sold with a CDSC. Class R, Class Y, Class R5 and Class R6 shares are sold at net asset value. Class C shares held for ten years after purchase are eligible for automatic conversion into Class A shares of the same Fund (the "Conversion Feature"). The automatic conversion pursuant to the Conversion Feature will generally occur at the end of the month following the tenth anniversary after a purchase of Class C shares.
The Fund is an investment company and accordingly follows the investment company accounting and reporting guidance in accordance with Financial Accounting Standards Board Accounting Standards Codification Topic 946, Financial Services – Investment Companies.
The following is a summary of the significant accounting policies followed by the Fund in the preparation of its financial statements.
A.Security Valuations — Securities, including restricted securities, are valued according to the following policy.
A security listed or traded on an exchange (except convertible securities) is valued at its last sales price or official closing price as of the close of the customary trading session on the exchange where the security is principally traded, or lacking any sales or official closing price on a particular day, the security may be valued at the closing bid price on that day. Securities traded in the over-the-counter market are valued based on prices furnished by independent pricing services or market makers. When such securities are valued by an independent pricing service they may be considered fair valued. Futures contracts are valued at the final settlement price set by an exchange on which they are principally traded. Listed options are valued at the mean between the last bid and asked prices from the exchange on which they are principally traded. Options not listed on an exchange are valued by an independent source at the mean between the last bid and asked prices. For purposes of determining net asset value ("NAV") per share, futures and option contracts generally are valued 15 minutes after the close of the customary trading session of the New York Stock Exchange ("NYSE").
Investments in open-end and closed-end registered investment companies that do not trade on an exchange are valued at the end-of-day net asset value per share. Investments in open-end and closed-end registered investment companies that trade on an exchange are valued at the last sales price or official closing price as of the close of the customary trading session on the exchange where the security is principally traded.
Debt obligations (including convertible securities) and unlisted equities are fair valued using an evaluated quote provided by an independent pricing service. Evaluated quotes provided by the pricing service may be determined without exclusive reliance on quoted prices, and may reflect appropriate factors such as institution-size trading in similar groups of securities, developments related to specific securities, dividend rate (for unlisted equities), yield (for debt obligations), quality, type of issue, coupon rate (for debt obligations), maturity (for debt obligations), individual trading characteristics and other market data. Pricing services generally value debt obligations assuming orderly transactions of institutional round lot size, but a fund may hold or transact in the same securities in smaller, odd lot sizes. Odd lots often trade at lower prices than institutional round lots. Debt obligations are subject to interest rate and credit risks. In addition, all debt obligations involve some risk of default with respect to interest and/or principal payments.
Foreign securities' (including foreign exchange contracts) prices are converted into U.S. dollar amounts using the applicable exchange rates as of the close of the NYSE. If market quotations are available and reliable for foreign exchange-traded equity securities, the securities will be valued at the market quotations. Because trading hours for certain foreign securities end before the close of the NYSE, closing market quotations may become unreliable. If between the time trading ends on a particular security and the close of the customary trading session on the NYSE, events occur that the investment adviser determines are significant and make the closing price unreliable, the Fund may fair value the security. If the event is likely to have affected the closing price of the security, the security will be valued at fair value in good faith using procedures approved by the Board of Trustees. Adjustments to closing prices to reflect fair value may also be based on a screening process of an independent pricing service to indicate the degree of certainty, based on historical data, that the closing price in the principal market where a foreign security trades is not the current value as of the close of the NYSE. Foreign securities' prices meeting the approved degree of certainty that the price is not reflective of current value will be priced at the indication of fair value from the independent pricing service. Multiple factors may be considered by the independent pricing service in determining adjustments to reflect fair value and may include information relating to sector indices, American Depositary Receipts and domestic and foreign index futures. Foreign securities may have additional risks including exchange rate changes, potential for sharply devalued currencies and high inflation, political and economic upheaval, the relative lack of issuer information, relatively low market liquidity and the potential lack of strict financial and accounting controls and standards.
Securities for which market prices are not provided by any of the above methods may be valued based upon quotes furnished by independent sources. The last bid price may be used to value equity securities. The mean between the last bid and asked prices is used to value debt obligations, including corporate loans.
Securities for which market quotations are not readily available or became unreliable are valued at fair value as determined in good faith by or under the supervision of the Trust's officers following procedures approved by the Board of Trustees. Issuer specific events, market trends, bid/asked quotes of brokers and information providers and other market data may be reviewed in the course of making a good faith determination of a security's fair value.
The Fund may invest in securities that are subject to interest rate risk, meaning the risk that the prices will generally fall as interest rates rise and, conversely, the prices will generally rise as interest rates fall. Specific securities differ in their sensitivity to changes in interest rates depending on their individual characteristics. Changes in interest rates may result in increased market volatility, which may affect the value and/or liquidity of certain Fund investments.
Valuations change in response to many factors including the historical and prospective earnings of the issuer, the value of the issuer's assets, general economic conditions, interest rates, investor perceptions and market liquidity. Because of the inherent uncertainties of valuation, the values reflected in the financial statements may materially differ from the value received upon actual sale of those investments.
B.Securities Transactions and Investment Income – Securities transactions are accounted for on a trade date basis. Realized gains or losses on sales are computed on the basis of specific identification of the securities sold. Interest income (net of withholding tax, if any) is recorded on an accrual basis from settlement date. Dividend income (net of withholding tax, if any) is recorded on the ex-dividend date.
The Fund may periodically participate in litigation related to Fund investments. As such, the Fund may receive proceeds from litigation settlements. Any proceeds received are included in the Statement of Operations as realized gain (loss) for investments no longer held and as unrealized gain (loss) for investments still held.
Brokerage commissions and mark ups are considered transaction costs and are recorded as an increase to the cost basis of securities purchased and/or a reduction of proceeds on a sale of securities. Such transaction costs are included in the determination of net realized and unrealized gain (loss) from investment securities reported in the Statement of Operations and the Statement of Changes in Net Assets and the net realized and unrealized gains (losses) on securities per share in the Financial Highlights. Transaction costs are included in the calculation of the Fund's net asset value and, accordingly, they reduce the Fund's total returns. These transaction costs are not considered operating expenses and are not reflected in net investment income reported in the Statement of Operations
16 | Invesco Global Real Estate Fund |
and the Statement of Changes in Net Assets, or the net investment income per share and the ratios of expenses and net investment income reported in the Financial Highlights, nor are they limited by any expense limitation arrangements between the Fund and the investment adviser.
The Fund allocates income and realized and unrealized capital gains and losses to a class based on the relative net assets of each class.
The Fund recharacterizes distributions received from REIT investments based on information provided by the REIT into the following categories: ordinary income, long-term and short-term capital gains, and return of capital. If information is not available on a timely basis from the REIT, the recharacterization will be based on available information which may include the previous year's allocation. If new or additional information becomes available from the REIT at a later date, a recharacterization will be made in the following year. The Fund records as dividend income the amount recharacterized as ordinary income and as realized gain the amount recharacterized as capital gain in the Statement of Operations, and the amount recharacterized as return of capital as a reduction of the cost of the related investment. These recharacterizations are reflected in the accompanying financial statements.
C.Country Determination — For the purposes of making investment selection decisions and presentation in the Schedule of Investments, the investment adviser may determine the country in which an issuer is located and/or credit risk exposure based on various factors. These factors include the laws of the country under which the issuer is organized, where the issuer maintains a principal office, the country in which the issuer derives 50% or more of its total revenues and the country that has the primary market for the issuer's securities, as well as other criteria. Among the other criteria that may be evaluated for making this determination are the country in which the issuer maintains 50% or more of its assets, the type of security, financial guarantees and enhancements, the nature of the collateral and the sponsor organization. Country of issuer and/or credit risk exposure has been determined to be the United States of America, unless otherwise noted.
D.Distributions - Distributions from net investment income, if any, are declared and paid quarterly and are recorded on the ex-dividend date. Distributions from net realized capital gain, if any, are generally declared and paid annually and recorded on the ex-dividend date. The Fund may elect to treat a portion of the proceeds from redemptions as distributions for federal income tax purposes.
E.Federal Income Taxes – The Fund intends to comply with the requirements of Subchapter M of the Internal Revenue Code of 1986, as amended (the "Internal Revenue Code"), necessary to qualify as a regulated investment company and to distribute substantially all of the Fund's taxable earnings to shareholders. As such, the Fund will not be subject to federal income taxes on otherwise taxable income (including net realized capital gain) that is distributed to shareholders. Therefore, no provision for federal income taxes is recorded in the financial statements.
The Fund recognizes the tax benefits of uncertain tax positions only when the position is more likely than not to be sustained. Management has analyzed the Fund's uncertain tax positions and concluded that no liability for unrecognized tax benefits should be recorded related to uncertain tax positions. Management is not aware of any tax positions for which it is reasonably possible that the total amounts of unrecognized tax benefits will change materially in the next 12 months.
The Fund files tax returns in the U.S. Federal jurisdiction and certain other jurisdictions. Generally, the Fund is subject to examinations by such taxing authorities for up to three years after the filing of the return for the tax period.
F.Expenses – Fees provided for under the Rule 12b-1 plan of a particular class of the Fund are charged to the operations of such class. Transfer agency fees and expenses and other shareholder recordkeeping fees and expenses attributable to Class R5 and Class R6 are allocated to each share class based on relative net assets. Sub-accounting fees attributable to Class R5 are charged to the operations of the class. Transfer agency fees and expenses and other shareholder recordkeeping fees and expenses relating to all other classes are allocated among those classes based on relative net assets. All other expenses are allocated among the classes based on relative net assets.
G.Accounting Estimates – The preparation of financial statements in conformity with accounting principles generally accepted in the United States of America ("GAAP") requires management to make estimates and assumptions that affect the reported amounts of assets and liabilities at the date of the financial statements and the reported amounts of revenues and expenses during the reporting period including estimates and assumptions related to taxation. Actual results could differ from those estimates by a significant amount. In addition, the Fund monitors for material events or transactions that may occur or become known after the period-end date and before the date the financial statements are released to print.
H.Indemnifications – Under the Trust's organizational documents, each Trustee, officer, employee or other agent of the Trust is indemnified against certain liabilities that may arise out of the performance of their duties to the Fund. Additionally, in the normal course of business, the Fund enters into contracts, including the Fund's servicing agreements, that contain a variety of indemnification clauses. The Fund's maximum exposure under these arrangements is unknown as this would involve future claims that may be made against the Fund that have not yet occurred. The risk of material loss as a result of such indemnification claims is considered remote.
I.Foreign Currency Translations — Foreign currency is valued at the close of the NYSE based on quotations posted by banks and major currency dealers. Portfolio securities and other assets and liabilities denominated in foreign currencies are translated into U.S. dollar amounts at the date of valuation. Purchases and sales of portfolio securities (net of foreign taxes withheld on disposition) and income items denominated in foreign currencies are translated into U.S. dollar amounts on the respective dates of such transactions. The Fund does not separately account for the portion of the results of operations resulting from changes in foreign exchange rates on investments and the fluctuations arising from changes in market prices of securities held. The combined results of changes in foreign exchange rates and the fluctuation of market prices on investments (net of estimated foreign tax withholding) are included with the net realized and unrealized gain or loss from investments in the Statement of Operations. Reported net realized foreign currency gains or losses arise from (1) sales of foreign currencies, (2) currency gains or losses realized between the trade and settlement dates on securities transactions, and (3) the difference between the amounts of dividends, interest, and foreign withholding taxes recorded on the Fund's books and the U.S. dollar equivalent of the amounts actually received or paid. Net unrealized foreign currency gains and losses arise from changes in the fair values of assets and liabilities, other than investments in securities at fiscal period end, resulting from changes in exchange rates.
The Fund may invest in foreign securities, which may be subject to foreign taxes on income, gains on investments or currency repatriation, a portion of which may be recoverable. Foreign taxes, if any, are recorded based on the tax regulations and rates that exist in the foreign markets in which the Fund invests and are shown in the Statement of Operations.
J.Forward Foreign Currency Contracts — The Fund may engage in foreign currency transactions either on a spot (i.e. for prompt delivery and settlement) basis, or through forward foreign currency contracts, to manage or minimize currency or exchange rate risk.
The Fund may also enter into forward foreign currency contracts for the purchase or sale of a security denominated in a foreign currency in order to "lock in" the U.S. dollar price of that security, or the Fund may also enter into forward foreign currency contracts that do not provide for physical settlement of the two currencies, but instead are settled by a single cash payment calculated as the difference between the agreed upon exchange rate and the spot rate at settlement based upon an agreed upon notional amount (non-deliverable forwards). The Fund will set aside liquid assets in an amount equal to the daily mark-to-market obligation for forward foreign currency contracts.
A forward foreign currency contract is an obligation between two parties ("Counterparties") to purchase or sell a specific currency for an agreed-upon price at a future date. The use of forward foreign currency contracts does not eliminate fluctuations in the price of the underlying securities the Fund owns or intends to acquire but establishes a rate of exchange in advance. Fluctuations in the value of these contracts are measured by the difference in the contract date and reporting date exchange rates and are recorded as unrealized appreciation (depreciation) until the contracts are closed. When the contracts are closed, realized gains (losses) are recorded. Realized and unrealized gains (losses) on the contracts are included in the Statement of Operations. The primary risks associated with forward foreign currency contracts include failure of the Counterparty to meet the terms of the contract and the value of the foreign currency changing unfavorably. These risks may be in excess of the amounts reflected in the Statement of Assets and Liabilities.
17 | Invesco Global Real Estate Fund |
K.Other Risks - The Fund's investments are concentrated in a comparatively narrow segment of the economy. Consequently, the Fund may tend to be more volatile than other mutual funds, and the value of the Fund's investments may tend to rise and fall more rapidly.
Because the Fund concentrates its assets in the real estate industry, an investment in the Fund will be closely linked to the performance of the real estate markets. Property values may fall due to increasing vacancies or declining rents resulting from economic, legal, cultural or technological developments.Emerging markets (also referred to as developing markets) are generally subject to greater market volatility, political, social and economic instability, uncertainty regarding the existence of trading markets and more governmental limitations on foreign investment than more developed markets. In addition, companies operating in emerging markets may be subject to lower trading volume and greater price fluctuations than companies in more developed markets. Securities law in many emerging market countries is relatively new and unsettled. Therefore, laws regarding foreign investment in emerging market securities, securities regulation, title to securities, and shareholder rights may change quickly and unpredictably. In addition, the enforcement of systems of taxation at federal, regional and local levels in emerging market countries may be inconsistent, and subject to sudden change. Other risks of investing in emerging markets securities may include additional transaction costs, delays in settlement procedures, and lack of timely information.
NOTE 2—Advisory Fees and Other Fees Paid to Affiliates
The Trust has entered into a master investment advisory agreement with Invesco Advisers, Inc. (the "Adviser" or "Invesco"). Under the terms of the investment advisory agreement, the Fund accrues daily and pays monthly an advisory fee to the Adviser based on the annual rate of the Fund's average daily net assets as follows:
Average Daily Net Assets | Rate |
First $250 million | 0.750% |
| |
Next $250 million | 0.740% |
| |
Next $500 million | 0.730% |
Next $1.5 billion | 0.720% |
| |
Next $2.5 billion | 0.710% |
| |
Next $2.5 billion | 0.700% |
Next $2.5 billion | 0.690% |
Over $10 billion | 0.680% |
| |
For the year ended February 29, 2020, the effective advisory fee rate incurred by the Fund was 0.74%.
Under the terms of a master sub-advisory agreement between the Adviser and each of Invesco Asset Management Deutschland GmbH, Invesco Asset Management Limited, Invesco Asset Management (Japan) Limited, Invesco Hong Kong Limited, Invesco Senior Secured Management, Inc. and Invesco Canada Ltd. and separate sub-advisory agreements with Invesco Capital Management LLC and Invesco Asset Management (India) Private Limited (collectively, the "Affiliated Sub-Advisers") the Adviser, not the Fund, will pay 40% of the fees paid to the Adviser to any such Affiliated Sub-Adviser(s) that provide(s) discretionary investment management services to the Fund based on the percentage of assets allocated to such Affiliated Sub-Adviser(s).
The Adviser has contractually agreed, through at least June 30, 2020, to waive advisory fees and/or reimburse expenses of all shares to the extent necessary to limit total annual fund operating expenses after fee waiver and/or expense reimbursement (excluding certain items discussed below) of Class A, Class C, Class R, Class Y, Class R5 and Class R6 shares to 2.00%, 2.75%, 2.25%, 1.75%, 1.75% and 1.75%, respectively, of the Fund's average daily net assets (the "expense limits"). In determining the Adviser's obligation to waive advisory fees and/or reimburse expenses, the following expenses are not taken into account, and could cause the total annual fund operating expenses after fee waiver and/or reimbursement to exceed the numbers reflected above: (1) interest; (2) taxes; (3) dividend expense on short sales; (4) extraordinary or non-routine items, including litigation expenses; and (5) expenses that the Fund has incurred but did not actually pay because of an expense offset arrangement. Unless Invesco continues the fee waiver agreement, it will terminate on June 30, 2020. During its term, the fee waiver agreement cannot be terminated or amended to increase the expense limits or reduce the advisory fee waivers without approval of the Board of Trustees. The Adviser did not waive fees and/or reimburse expenses during the period under this expense limit.
The Adviser has contractually agreed, through at least June 30, 2021, to waive the advisory fee payable by the Fund in an amount equal to 100% of the net advisory fees the Adviser receives from the affiliated money market funds on investments by the Fund of uninvested cash in such affiliated money market funds.
For the year ended February 29, 2020, the Adviser waived advisory fees of $10,373.
The Trust has entered into a master administrative services agreement with Invesco pursuant to which the Fund has agreed to pay Invesco for certain administrative costs incurred in providing accounting services to the Fund. For the year ended February 29, 2020, expenses incurred under the agreement are shown in the Statement of Operations as Administrative services fees. Invesco has entered into a sub-administration agreement whereby State Street Bank and Trust Company ("SSB") serves as fund accountant and provides certain administrative services to the Fund. Pursuant to a custody agreement with the Trust on behalf of the Fund, SSB also serves as the Fund's custodian.
The Trust has entered into a transfer agency and service agreement with Invesco Investment Services, Inc. ("IIS") pursuant to which the Fund has agreed to pay IIS a fee for providing transfer agency and shareholder services to the Fund and reimburse IIS for certain expenses incurred by IIS in the course of providing such services. IIS may make payments to intermediaries that provide omnibus account services, sub-accounting services and/or networking services. All fees payable by IIS to intermediaries that provide omnibus account services or sub-accounting services are charged back to the Fund, subject to certain limitations approved by the Trust's Board of Trustees. For the year ended February 29, 2020, expenses incurred under the agreement are shown in the Statement of Operations as Transfer agent fees.
The Trust has entered into master distribution agreements with Invesco Distributors, Inc. ("IDI") to serve as the distributor for the Class A, Class C, Class R, Class Y, Class R5 and Class R6 shares of the Fund. The Trust has adopted plans pursuant to Rule 12b-1 under the 1940 Act with respect to the Fund's Class A, Class C and Class R shares (collectively, the "Plans"). The Fund, pursuant to the Plans, pays IDI compensation at the annual rate of 0.25% of the Fund's average daily net assets of Class A shares, 1.00% of the average daily net assets of Class C shares and 0.50% of the average daily net assets of Class R shares. The fees are accrued daily and paid monthly. Of the Plan payments, up to 0.25% of the average daily net assets of each class of shares may be paid to furnish continuing personal shareholder services to customers who purchase and own shares of such classes. Any amounts not paid as a service fee under the Plans would constitute an asset-based sales charge. Rules of the Financial Industry Regulatory Authority ("FINRA") impose a cap on the total sales charges, including asset-based sales charges, that may be paid by any class of shares of the Fund. For the year ended February 29, 2020, expenses incurred under the Plans are shown in the Statement of Operations as Distribution fees.
Front-end sales commissions and CDSC (collectively, the "sales charges") are not recorded as expenses of the Fund. Front-end sales commissions are deducted from proceeds from the sales of Fund shares prior to investment in Class A shares of the Fund. CDSC are deducted from redemption proceeds prior to remittance to the shareholder. During the year ended February 29, 2020, IDI advised the Fund that IDI retained $20,288 in front-end sales commissions from the sale of Class A shares and $377 and $94 from Class A and Class C shares, respectively, for CDSC imposed upon redemptions by shareholders.
Certain officers and trustees of the Trust are officers and directors of the Adviser, IIS and/or IDI.
18 | Invesco Global Real Estate Fund |
NOTE 3—Additional Valuation Information
GAAP defines fair value as the price that would be received to sell an asset or paid to transfer a liability in an orderly transaction between market participants at the measurement date, under current market conditions. GAAP establishes a hierarchy that prioritizes the inputs to valuation methods, giving the highest priority to readily available unadjusted quoted prices in an active market for identical assets (Level 1) and the lowest priority to significant unobservable inputs (Level 3), generally when market prices are not readily available or are unreliable. Based on the valuation inputs, the securities or other investments are tiered into one of three levels. Changes in valuation methods may result in transfers in or out of an investment's assigned level:
Level 1 – Prices are determined using quoted prices in an active market for identical assets.
Level 2 – Prices are determined using other significant observable inputs. Observable inputs are inputs that other market participants may use in pricing a security. These may include quoted prices for similar securities, interest rates, prepayment speeds, credit risk, yield curves, loss severities, default rates, discount rates, volatilities and others.
Level 3 – Prices are determined using significant unobservable inputs. In situations where quoted prices or observable inputs are unavailable (for example, when there is little or no market activity for an investment at the end of the period), unobservable inputs may be used. Unobservable inputs reflect the Fund's own assumptions about the factors market participants would use in determining fair value of the securities or instruments and would be based on the best available information.
The following is a summary of the tiered valuation input levels, as of February 29, 2020. The level assigned to the securities valuations may not be an indication of the risk or liquidity associated with investing in those securities. Because of the inherent uncertainties of valuation, the values reflected in the financial statements may materially differ from the value received upon actual sale of those investments.
| | Level 1 | | Level 2 | | Level 3 | | Total |
Investments in Securities | | | | | | | | |
Australia | $ | — | $ | 21,571,168 | $ | — | $ | 21,571,168 |
Belgium | | — | | 1,644,988 | | — | | 1,644,988 |
Brazil | | 3,801,223 | | — | | — | | 3,801,223 |
Canada | | 22,263,037 | | — | | — | | 22,263,037 |
Chile | | 496,914 | | — | | — | | 496,914 |
China | | — | | 41,047,910 | | — | | 41,047,910 |
France | | — | | 12,016,079 | | — | | 12,016,079 |
Germany | | — | | 40,956,730 | | — | | 40,956,730 |
Hong Kong | | — | | 37,257,532 | | 990,199 | | 38,247,731 |
India | | — | | 818,598 | | — | | 818,598 |
Indonesia | | — | | 1,178,879 | | — | | 1,178,879 |
Japan | | — | | 75,159,311 | | — | | 75,159,311 |
Malta | | — | | — | | 0 | | 0 |
Mexico | | 2,395,679 | | — | | — | | 2,395,679 |
Philippines | | — | | 6,498,668 | | 2,273 | | 6,500,941 |
Singapore | | — | | 17,784,703 | | — | | 17,784,703 |
South Africa | | — | | 3,123,614 | | — | | 3,123,614 |
Spain | | — | | 7,517,503 | | — | | 7,517,503 |
Sweden | | — | | 15,137,979 | | — | | 15,137,979 |
Switzerland | | — | | 6,923,974 | | — | | 6,923,974 |
Thailand | | 3,315,473 | | — | | — | | 3,315,473 |
Turkey | | — | | 208,720 | | — | | 208,720 |
United Arab Emirates | | — | | 1,250,899 | | — | | 1,250,899 |
United Kingdom | | — | | 29,225,908 | | — | | 29,225,908 |
United States | | 341,625,260 | | — | | — | | 341,625,260 |
Money Market Funds | | 7,894,663 | | — | | — | | 7,894,663 |
Total Investments | $381,792,249 | $319,323,163 | $992,472 | $702,107,884 |
NOTE 4—Expense Offset Arrangement(s)
The expense offset arrangement is comprised of transfer agency credits which result from balances in demand deposit accounts used by the transfer agent for clearing shareholder transactions. For the year ended February 29, 2020, the Fund received credits from this arrangement, which resulted in the reduction of the Fund's total expenses of $3,398.
NOTE 5—Trustees' and Officers' Fees and Benefits
Trustees' and Officers' Fees and Benefits include amounts accrued by the Fund to pay remuneration to certain Trustees and Officers of the Fund. Trustees have the option to defer compensation payable by the Fund, and Trustees' and Officers' Fees and Benefits also include amounts accrued by the Fund to fund such deferred compensation amounts. Those Trustees who defer compensation have the option to select various Invesco Funds in which their deferral accounts shall be deemed to be invested. Finally, certain current Trustees were eligible to participate in a retirement plan that provided for benefits to be paid upon retirement to Trustees over a period of time based on the number of years of service. The Fund may have certain former Trustees who also participate in a retirement plan and receive benefits under such plan. Trustees' and Officers' Fees and Benefits include amounts accrued by the Fund to fund such retirement benefits. Obligations under the deferred compensation and retirement plans represent unsecured claims against the general assets of the Fund.
NOTE 6—Cash Balances
The Fund is permitted to temporarily carry a negative or overdrawn balance in its account with SSB, the custodian bank. Such balances, if any at period-end, are shown in the Statement of Assets and Liabilities under the payable caption Amount due custodian. To compensate the custodian bank for such overdrafts, the overdrawn Fund
19 | Invesco Global Real Estate Fund |

may either (1) leave funds as a compensating balance in the account so the custodian bank can be compensated by earning the additional interest; or (2) compensate by paying the custodian bank at a rate agreed upon by the custodian bank and Invesco, not to exceed the contractually agreed upon rate. The Fund may not purchase additional securities when any borrowings from banks or broker-dealers exceed 5% of the Fund's total assets, or when any borrowings from an Invesco Fund are outstanding.
NOTE 7—Distributions to Shareholders and Tax Components of Net Assets
Tax Character of Distributions to Shareholders Paid During the Fiscal Years Ended February 29, 2020 and February 28, 2019:
| | 2020 | | 2019 | | |
Ordinary income | $36,141,284 | | $44,078,531 | |
Long-term capital gain | 47,105,108 | | 43,404,926 | |
| | | | | |
Total distributions | $83,246,392 | | $87,483,457 | |
| | | | | | |
Tax Components of Net Assets at Period-End: | | | | | |
| | | | 2020 | | |
Undistributed ordinary income | | $ | 250,116 | |
| | | | |
Undistributed long-term capital gain | | | 14,837,069 | |
| | | | |
Net unrealized appreciation — investments | | | 61,232,081 | |
Net unrealized appreciation (depreciation) - foreign currencies | | | (4,472) |
| | | | |
Temporary book/tax differences | | | (144,425) |
| | | | |
Shares of beneficial interest | | | 631,808,565 | |
Total net assets | | $707,978,934 | |
| | | | | | |
The difference between book-basis and tax-basis unrealized appreciation (depreciation) is due to differences in the timing of recognition of gains and losses on investments for tax and book purposes. The Fund's net unrealized appreciation (depreciation) difference is attributable primarily to wash sales and passive foreign investment companies.
The temporary book/tax differences are a result of timing differences between book and tax recognition of income and/or expenses. The Fund's temporary book/tax differences are the result of the trustee deferral of compensation and retirement plan benefits.
Capital loss carryforward is calculated and reported as of a specific date. Results of transactions and other activity after that date may affect the amount of capital loss carryforward actually available for the Fund to utilize. The ability to utilize capital loss carryforward in the future may be limited under the Internal Revenue Code and related regulations based on the results of future transactions.
The Fund does not have a capital loss carryforward as of February 29, 2020.
NOTE 8—Investment Transactions
The aggregate amount of investment securities (other than short-term securities, U.S. Treasury obligations and money market funds, if any) purchased and sold by the Fund during the year ended February 29, 2020 was $465,940,777 and $577,406,691, respectively. Cost of investments, including any derivatives, on a tax basis includes the adjustments for financial reporting purposes as of the most recently completed federal income tax reporting period-end.
Unrealized Appreciation (Depreciation) of Investments on a Tax Basis
Aggregate unrealized appreciation of investments | $ 93,072,150 | |
Aggregate unrealized (depreciation) of investments | (31,840,069) |
Net unrealized appreciation of investments | $ 61,232,081 | |
Cost of investments for tax purposes is $640,875,803.
NOTE 9—Reclassification of Permanent Differences
Primarily as a result of differing book/tax treatment of passive foreign investment companies, on February 29, 2020, undistributed net investment income was increased by $15,260,163 and undistributed net realized gain was decreased by $15,260,163. This reclassification had no effect on the net assets or the distributable earnings of the Fund.
NOTE 10—Share Information
| | Summary of Share Activity | |
| Year ended | Year ended |
| February 29, 2020(a) | | February 28, 2019 |
| Shares | Amount | Shares | Amount |
Sold: | | | | | |
Class A | 1,760,818 | $ 22,777,589 | 2,261,028 | $ 28,724,879 |
Class C | 173,924 | 2,281,093 | 280,616 | 3,445,906 |
Class R | 541,461 | 7,037,148 | 508,914 | 6,562,910 |
Class Y | 3,394,041 | 43,782,059 | 7,846,913 | 102,720,711 |
Class R5 | 2,239,175 | 29,026,282 | 3,078,116 | 39,448,509 |
Class R6 | 3,369,073 | 43,574,823 | 2,447,897 | 31,729,406 |
20 | Invesco Global Real Estate Fund |
| | | Summary of Share Activity | | | | |
| | Year ended | | Year ended |
| | February 29, 2020(a) | | | February 28, 2019 | |
| | Shares | Amount | | Shares | | Amount |
Issued as reinvestment of dividends: | | | | | | | | | | |
Class A | 1,205,299 | $ 14,851,940 | 1,075,963 | $ | 13,026,819 | |
Class C | 93,998 | 1,156,416 | 160,975 | | 1,942,867 | | |
Class R | 196,327 | 2,417,775 | 191,461 | | 2,312,699 | | |
Class Y | 1,071,649 | 13,209,094 | 1,358,715 | | 16,776,278 | |
Class R5 | 1,466,494 | 18,054,391 | 1,699,311 | | 20,530,863 | |
Class R6 | 1,871,716 | 23,015,529 | 1,732,677 | | 20,919,474 | |
Automatic conversion of Class C shares to Class A shares: | | | | | | | | | | |
Class A | 106,558 | 1,397,846 | - | | - | | |
Class C | (106,495) | (1,397,846) | - | | - | | |
Reacquired: | | | | | | | | | | |
Class A | (3,009,415) | (39,063,191) | (3,361,221) | | (43,389,541) |
| | | | | | |
Class C | (282,806) | (3,679,813) | (1,444,421) | | (18,209,235) |
| | | | | | |
Class R | (731,407) | (9,522,674) | (648,158) | | (8,305,014) |
| | | | | | |
Class Y | (5,446,309) | (70,144,365) | (42,848,838) | | (563,280,696) |
| | | | | | |
Class R5 | (6,211,721) | (80,808,211) | (8,613,685) | | (110,489,154) |
| | | | | | |
Class R6 | (4,522,828) | (58,629,105) | (3,231,067) | | (41,405,753) |
| | | | | | |
Net increase (decrease) in share activity | (2,820,448) | $(40,663,220) | (37,504,804) | $ | (496,938,072) |
| | | | | | | | | | |
(a)There are entities that are record owners of more than 5% of the outstanding shares of the Fund and in the aggregate own 52% of the outstanding shares of the Fund. IDI has an agreement with these entities to sell Fund shares. The Fund, Invesco and/or Invesco affiliates may make payments to these entities, which are considered to be related to the Fund, for providing services to the Fund, Invesco and/or Invesco affiliates including but not limited to services such as securities brokerage, distribution, third party record keeping and account servicing. The Fund has no knowledge as to whether all or any portion of the shares owned of record by these entities are also owned beneficially.
NOTE 11—Subsequent Event
During the first quarter of 2020, the World Health Organization declared the coronavirus (COVID-19) to be a public health emergency. COVID-19 has led to increased short-term market volatility and may have adverse long-term effects on U.S. and world economies and markets in general. COVID-19 may adversely impact the Fund's ability to achieve its investment objective. Because of the uncertainties on valuation, the global economy and business operations, values reflected in these financial statements may materially differ from the value received upon actual sales of those investments.
The Coronavirus Aid, Relief, and Economic Security Act, commonly referred to as the "CARES Act," was signed into law on March 27, 2020 by President Trump. The Adviser is assessing the components of the Act, and the impacts to the Fund should be immaterial.
21 | Invesco Global Real Estate Fund |
Report of Independent Registered Public Accounting Firm
To the Board of Trustees of AIM Investment Securities Funds (Invesco Investment Securities Funds) and Shareholders of Invesco Global Real Estate Fund
Opinion on the Financial Statements
We have audited the accompanying statement of assets and liabilities, including the schedule of investments, of Invesco Global Real Estate Fund (one of the funds constituting AIM Investment Securities Funds (Invesco Investment Securities Funds), hereafter referred to as the "Fund") as of February 29, 2020, the related statement of operations for the year ended February 29, 2020, the statement of changes in net assets for each of the two years in the period ended February 29, 2020, including the related notes, and the financial highlights for each of the five years in the period ended February 29, 2020 (collectively referred to as the financial statements). In our opinion, the financial statements present fairly, in all material respects, the financial position of the Fund as of February 29, 2020, the results of its operations for the year then ended, the changes in its net assets for each of the two years in the period ended February 29, 2020 and the financial highlights financial highlights for each of the five years in the period ended February 29, 2020 in conformity with accounting principles generally accepted in the United States of America.
Basis for Opinion
These financial statements are the responsibility of the Fund's management. Our responsibility is to express an opinion on the Fund's financial statements based on our audits. We are a public accounting firm registered with the Public Company Accounting Oversight Board (United States) (PCAOB) and are required to be independent with respect to the Fund in accordance with the U.S. federal securities laws and the applicable rules and regulations of the Securities and Exchange Commission and the
PCAOB.
We conducted our audits of these financial statements in accordance with the standards of the PCAOB. Those standards require that we plan and perform the audit to obtain reasonable assurance about whether the financial statements are free of material misstatement, whether due to error or fraud.
Our audits included performing procedures to assess the risks of material misstatement of the financial statements, whether due to error or fraud, and performing procedures that respond to those risks. Such procedures included examining, on a test basis, evidence regarding the amounts and disclosures in the financial statements. Our audits also included evaluating the accounting principles used and significant estimates made by management, as well as evaluating the overall presentation of the financial statements. Our procedures included confirmation of securities owned as of February 29, 2020 by correspondence with the custodian, transfer agent and brokers; when replies were not received from brokers, we performed other auditing procedures. We believe that our audits provide a reasonable basis for our opinion.
/s/PricewaterhouseCoopers LLP
Houston, Texas
April 28, 2020
We have served as the auditor of one or more of the investment companies in the Invesco group of investment companies since at least 1995. We have not been able to determine the specific year we began serving as auditor.
22 | Invesco Global Real Estate Fund |
Calculating your ongoing Fund expenses
Example
As a shareholder of the Fund, you incur two types of costs: (1) transaction costs, which may include sales charges (loads) on purchase payments or contingent deferred sales charges on redemptions, if any; and (2) ongoing costs, including management fees, distribution and/or service (12b-1) fees, and other Fund expenses. This example is intended to help you understand your ongoing costs (in dollars) of investing in the Fund and to compare these costs with ongoing costs of investing in other mutual funds. The example is based on an investment of $1,000 invested at the beginning of the period and held for the entire period September 1, 2019 through February 29, 2020.
Actual expenses
The table below provides information about actual account values and actual expenses. You may use the information in this table, together with the amount you invested, to estimate the expenses that you paid over the period. Simply divide your account value by $1,000 (for example, an $8,600 account value divided by $1,000 = 8.6), then multiply the result by the number in the table under the heading entitled "Actual Expenses Paid During Period" to estimate the expenses you paid on your account during this period.
Hypothetical example for comparison purposes
The table below also provides information about hypothetical account values and hypothetical expenses based on the Fund's actual expense ratio and an assumed rate of return of 5% per year before expenses, which is not the Fund's actual return.
The hypothetical account values and expenses may not be used to estimate the actual ending account balance or expenses you paid for the period. You may use this information to compare the ongoing costs of investing in the Fund and other funds. To do so, compare this 5% hypothetical example with the 5% hypothetical examples that appear in the shareholder reports of the other funds.
Please note that the expenses shown in the table are meant to highlight your ongoing costs only and do not reflect any transaction costs, such as sales charges (loads) on purchase payments or contingent deferred sales charges on redemptions, if any. Therefore, the hypothetical information is useful in comparing ongoing costs only, and will not help you determine the relative total costs of owning different funds. In addition, if these transaction costs were included, your costs would have been higher.
| | | | | HYPOTHETICAL | |
| | | | | (5% annual return before | |
| | | ACTUAL | | expenses) | |
| Beginning | Ending | | Expenses | Ending | | Expenses | Annualized |
| Account Value | Account Value | | Paid During | Account Value | | Paid During | Expense |
| (09/01/19) | (02/29/20)1 | | Period2 | (02/29/20) | | Period2 | Ratio |
Class A | $1,000.00 | $976.50 | | $6.04 | $1,018.75 | | $6.17 | 1.23% |
| | | | | | | | |
Class C | 1,000.00 | 972.70 | | 9.71 | 1,015.02 | | 9.92 | 1.98 |
| | | | | | | | |
Class R | 1,000.00 | 975.20 | | 7.27 | 1,017.50 | | 7.42 | 1.48 |
| | | | | | | | |
Class Y | 1,000.00 | 977.80 | | 4.82 | 1,019.99 | | 4.92 | 0.98 |
Class R5 | 1,000.00 | 978.10 | | 4.33 | 1,020.49 | | 4.42 | 0.88 |
| | | | | | | | |
Class R6 | 1,000.00 | 978.60 | | 3.89 | 1,020.93 | | 3.97 | 0.79 |
1The actual ending account value is based on the actual total return of the Fund for the period September 1, 2019 through February 29, 2020, after actual expenses and will differ from the hypothetical ending account value which is based on the Fund's expense ratio and a hypothetical annual return of 5% before expenses.
2Expenses are equal to the Fund's annualized expense ratio as indicated above multiplied by the average account value over the period, multiplied by 182/366 to reflect the most recent fiscal half year.
23 | Invesco Global Real Estate Fund |
Tax Information
Form 1099-DIV, Form 1042-S and other year–end tax information provide shareholders with actual calendar year amounts that should be included in their tax returns. Shareholders should consult their tax advisers.
The following distribution information is being provided as required by the Internal Revenue Code or to meet a specific state's requirement.
The Fund designates the following amounts or, if subsequently determined to be different, the maximum amount allowable for its fiscal year ended February 29, 2020:
Federal and State Income Tax
Long-Term Capital Gain Distributions | $47,105,108 |
Qualified Business Income* | 29.01% |
Qualified Dividend Income* | 23.62% |
Corporate Dividends Received Deduction* | 0.08% |
U.S. Treasury Obligations* | 0.00% |
* The above percentages are based on ordinary income dividends paid to shareholders during the Fund's fiscal year.
24 | Invesco Global Real Estate Fund |
Trustees and Officers
The address of each trustee and officer is AIM Investment Securities Funds (Invesco Investment Securities Funds) (the "Trust"), 11 Greenway Plaza, Suite 1000, Houston, Texas 77046-1173. The trustees serve for the life of the Trust, subject to their earlier death, incapacitation, resignation, retirement or removal as more specifically provided in the Trust's organizational documents. Each officer serves for a one year term or until their successors are elected and qualified. Column two below includes length of time served with predecessor entities, if any.
| Trustee | | Number of | Other |
Name, Year of Birth and | | Funds in | Directorship(s) |
and/or | | Fund Complex | Held by Trustee |
Position(s) | Officer | Principal Occupation(s) | Overseen by | During Past 5 |
Held with the Trust | Since | During Past 5 Years | Trustee | Years |
Interested Trustee | | | | |
Martin L. Flanagan1 — 1960 | 2007 | Executive Director, Chief Executive Officer and President, Invesco Ltd. | 229 | None |
Trustee and Vice Chair | | (ultimate parent of Invesco and a global investment management firm); | | |
| | Trustee and Vice Chair, The Invesco Funds; Vice Chair, Investment Company | | |
| | Institute; and Member of Executive Board, SMU Cox School of Business | | |
| | Formerly: Advisor to the Board, Invesco Advisers, Inc. (formerly known as | | |
| | Invesco Institutional (N.A.), Inc.); Chairman and Chief Executive Officer, | | |
| | Invesco Advisers, Inc. (registered investment adviser); Director, Chairman, | | |
| | Chief Executive Officer and President, Invesco Holding Company (US), Inc. | | |
| | (formerly IVZ Inc.) (holding company), Invesco Group Services, Inc. (service | | |
| | provider) and Invesco North American Holdings, Inc. (holding company); | | |
| | Director, Chief Executive Officer and President, Invesco Holding Company | | |
| | Limited (parent of Invesco and a global investment management firm); | | |
| | Director, Invesco Ltd.; Chairman, Investment Company Institute and President, | | |
| | Co-Chief Executive Officer, Co-President, Chief Operating Officer and Chief | | |
| | Financial Officer, Franklin Resources, Inc. (global investment management | | |
| | organization) | | |
1Mr. Flanagan is considered an interested person (within the meaning of Section 2(a)(19) of the 1940 Act) of the Trust because he is an officer of the Adviser to the Trust, and an officer and a director of Invesco Ltd., ultimate parent of the Adviser.
T-1 | Invesco Global Real Estate Fund |
Trustees and Officers—(continued)
| | | Number of | |
| | | Funds | Other |
| Trustee | | in | Directorship(s) |
Name, Year of Birth and | and/or | | Fund Complex | Held by Trustee |
Position(s) | Officer | Principal Occupation(s) | Overseen by | During Past 5 |
Held with the Trust | Since | During Past 5 Years | Trustee | Years |
Independent Trustees | | | | |
Bruce L. Crockett – 1944 | 1992 | Chairman, Crockett Technologies Associates (technology consulting company) | 229 | Director and |
Trustee and Chair | | Formerly: Director, Captaris (unified messaging provider); Director, President | | Chairman of the |
| | | Audit Committee, |
| | and Chief Executive Officer, COMSAT Corporation; Chairman, Board of | |
| | | ALPS (Attorneys |
| | Governors of INTELSAT (international communications company); ACE Limited | |
| | | Liability |
| | (insurance company); Independent Directors Council and Investment Company | |
| | | Protection |
| | Institute: Member of the Audit Committee, Investment Company Institute; | |
| | | Society) |
| | Member of the Executive Committee and Chair of the Governance Committee, | |
| | | (insurance |
| | Independent Directors Council | |
| | | company); |
| | | |
| | | | Director and |
| | | | Member of the |
| | | | Audit Committee |
| | | | and |
| | | | Compensation |
| | | | Committee, |
| | | | Ferroglobe PLC |
| | | | (metallurgical |
| | | | company) |
David C. Arch – 1945 | 2010 | Chairman of Blistex Inc. (consumer health care products manufacturer); | 229 | Board member of |
Trustee | | Member, World Presidents' Organization | | the Illinois |
| | | | Manufacturers' |
| | | | Association |
Beth Ann Brown – 1968 | 2019 | Independent Consultant | 229 | Director, Board of |
Trustee | | Formerly: Head of Intermediary Distribution, Managing Director, Strategic | | Directors of |
| | | Caron |
| | Relations, Managing Director, Head of National Accounts, Senior Vice | |
| | | Engineering Inc.; |
| | President, National Account Manager and Senior Vice President, Key Account | |
| | | Advisor, Board of |
| | Manager, Columbia Management Investment Advisers LLC; Vice President, Key | |
| | | Advisors of Caron |
| | Account Manager, Liberty Funds Distributor, Inc.; and Trustee of certain | |
| | | Engineering Inc.; |
| | Oppenheimer Funds | |
| | | President and |
| | | |
| | | | Director, Acton |
| | | | Shapleigh Youth |
| | | | Conservation |
| | | | Corps (non - |
| | | | profit); and Vice |
| | | | President and |
| | | | Director of |
| | | | Grahamtastic |
| | | | Connection (non- |
| | | | profit) |
Jack M. Fields – 1952 | 1997 | Chief Executive Officer, Twenty First Century Group, Inc. (government affairs | 229 | Member, Board of Directors of |
Trustee | | company); and Chairman, Discovery Learning Alliance (non-profit) | | Baylor College of Medicine |
| | Formerly: Owner and Chief Executive Officer, Dos Angeles Ranch L.P. (cattle, | | |
| | hunting, corporate entertainment); Director, Insperity, Inc. (formerly known as | | |
| | Administaff) (human resources provider); Chief Executive Officer, Texana | | |
| | Timber LP (sustainable forestry company); Director of Cross Timbers Quail | | |
| | Research Ranch (non-profit); and member of the U.S. House of Representatives | | |
| | | | |
T-2 | Invesco Global Real Estate Fund |

Trustees and Officers—(continued)
| | | Number of | |
| | | Funds | Other |
| Trustee | | in | Directorship(s) |
Name, Year of Birth and | and/or | | Fund Complex | Held by Trustee |
Position(s) | Officer | Principal Occupation(s) | Overseen by | During Past 5 |
Held with the Trust | Since | During Past 5 Years | Trustee | Years |
Independent Trustees—(continued) | | | |
Cynthia Hostetler —1962 | 2017 | Non-Executive Director and Trustee of a number of public and private business | 229 | Vulcan Materials |
Trustee | | corporations | | Company |
| | Formerly: Director, Aberdeen Investment Funds (4 portfolios); Head of | | (construction |
| | | materials |
| | Investment Funds and Private Equity, Overseas Private Investment | |
| | | company); Trilinc |
| | Corporation; President, First Manhattan Bancorporation, Inc.; Attorney, | |
| | | Global Impact |
| | Simpson Thacher & Bartlett LLP | |
| | | Fund; Genesee & |
| | | |
| | | | Wyoming, Inc. |
| | | | (railroads); Artio |
| | | | Global Investment |
| | | | LLC (mutual fund |
| | | | complex); Edgen |
| | | | Group, Inc. |
| | | | (specialized |
| | | | energy and |
| | | | infrastructure |
| | | | products |
| | | | distributor); |
| | | | Investment |
| | | | Company Institute |
| | | | (professional |
| | | | organization); |
| | | | Independent |
| | | | Directors Council |
| | | | (professional |
| | | | organization) |
Eli Jones – 1961 | 2016 | Professor and Dean, Mays Business School - Texas A&M University | 229 | Insperity, Inc. |
Trustee | | Formerly: Professor and Dean, Walton College of Business, University of | | (formerly known |
| | | as Administaff) |
| | Arkansas and E.J. Ourso College of Business, Louisiana State University; | |
| | | (human resources |
| | Director, Arvest Bank | |
| | | provider) |
| | | |
Elizabeth Krentzman – 1959 | 2019 | Formerly: Principal and Chief Regulatory Advisor for Asset Management | 229 | Trustee of the |
Trustee | | Services and U.S. Mutual Fund Leader of Deloitte & Touche LLP; General | | University of |
| | Counsel of the Investment Company Institute (trade association); National | | Florida National |
| | Director of the Investment Management Regulatory Consulting Practice, | | Board Foundation |
| | Principal, Director and Senior Manager of Deloitte & Touche LLP; Assistant | | and Audit |
| | Director of the Division of Investment Management - Office of Disclosure and | | Committee |
| | Investment Adviser Regulation of the U.S. Securities and Exchange | | Member; Member |
| | Commission and various positions with the Division of Investment Management | | of the Cartica |
| | – Office of Regulatory Policy of the U.S. Securities and Exchange Commission; | | Funds Board of |
| | Associate at Ropes & Gray LLP; Advisory Board Member of the Securities and | | Directors (private |
| | Exchange Commission Historical Society; and Trustee of certain Oppenheimer | | investment |
| | Funds | | funds); Member |
| | | | of the University |
| | | | of Florida Law |
| | | | Center |
| | | | Association, Inc. |
| | | | Board of Trustees |
| | | | and Audit |
| | | | Committee |
| | | | Member |
Anthony J. LaCava, Jr. – 1956 | 2019 | Formerly: Director and Member of the Audit Committee, Blue Hills Bank | 229 | Blue Hills Bank; |
Trustee | | (publicly traded financial institution) and Managing Partner, KPMG LLP | | Chairman, |
| | | | Bentley |
| | | | University; |
| | | | Member, |
| | | | Business School |
| | | | Advisory Council; |
| | | | and Nominating |
| | | | Committee |
| | | | KPMG LLP |
Prema Mathai-Davis – 1950 | 1998 | Retired | 229 | None |
Trustee | | Co-Owner & Partner of Quantalytics Research, LLC, (a FinTech Investment | | |
| | | |
Research Platform for the Self-Directed Investor)
T-3 | Invesco Global Real Estate Fund |

Trustees and Officers—(continued)
| | | Number of | |
| | | Funds | Other |
| Trustee | | in | Directorship(s) |
Name, Year of Birth and | and/or | | Fund Complex | Held by Trustee |
Position(s) | Officer | Principal Occupation(s) | Overseen by | During Past 5 |
Held with the Trust | Since | During Past 5 Years | Trustee | Years |
Independent Trustees—(continued) | | | |
Joel W. Motley – 1952 | 2019 | Director of Office of Finance, Federal Home Loan Bank System; Member of the | 229 | Member of Board |
Trustee | | Vestry of Trinity Wall Street; Managing Director of Carmona Motley Inc. | | of Greenwall |
| | (privately held financial advisor); Member of the Council on Foreign Relations | | Foundation |
| | and its Finance and Budget Committee; Chairman Emeritus of Board of Human | | (bioethics research |
| | Rights Watch and Member of its Investment Committee; and Member of | | foundation) and |
| | Investment Committee and Board of Historic Hudson Valley (non-profit cultural | | its Investment |
| | organization) | | Committee; |
| | Formerly: Managing Director of Public Capital Advisors, LLC (privately held | | Member of Board of |
| | | Friends of the LRC |
| | financial advisor); Managing Director of Carmona Motley Hoffman, Inc. | |
| | | (non-profit |
| | (privately held financial advisor); Trustee of certain Oppenheimer Funds; and | |
| | | legal advocacy); |
| | Director of Columbia Equity Financial Corp. (privately held financial advisor) | |
| | | Board Member |
| | | |
| | | | and Investment |
| | | | Committee |
| | | | Member of |
| | | | Pulizer Center for |
| | | | Crisis Reporting |
| | | | (non-profit |
| | | | journalism) |
Teresa M. Ressel — 1962 | 2017 | Non-executive director and trustee of a number of public and private business | 229 | Atlantic Power |
Trustee | | corporations | | Corporation |
| | Formerly: Chief Financial Officer, Olayan America, The Olayan Group | | (power generation |
| | | company); ON |
| | (international investor/commercial/industrial); Chief Executive Officer, UBS | |
| | | Semiconductor |
| | Securities LLC; Group Chief Operating Officer, Americas, UBS AG; Assistant | |
| | | Corp. |
| | Secretary for Management & Budget and CFO, US Department of the Treasury | |
| | | (semiconductor |
| | | |
| | | | supplier) |
| | | | |
Ann Barnett Stern – 1957 | 2017 | President and Chief Executive Officer, Houston Endowment Inc. (private | 229 | Federal Reserve |
Trustee | | philanthropic institution) | | Bank of Dallas |
| | Formerly: Executive Vice President and General Counsel, Texas Children's | | |
| | Hospital; Attorney, Beck, Redden and Secrest, LLP; Business Law Instructor, | | |
| | University of St. Thomas; Attorney, Andrews & Kurth LLP | | |
Robert C. Troccoli – 1949 | 2016 | Retired | 229 | None |
Trustee | | Formerly: Adjunct Professor, University of Denver – Daniels College of | | |
| | | |
| | Business; Senior Partner, KPMG LLP | | |
| | | | |
Daniel S. Vandivort –1954 | 2019 | Treasurer, Chairman of the Audit and Finance Committee, and Trustee, Board | 229 | Chairman and |
Trustee | | of Trustees, Huntington Disease Foundation of America; and President, Flyway | | Lead Independent |
| | Advisory Services LLC (consulting and property management) | | Director, |
| | Formerly: Trustee and Governance Chair, of certain Oppenheimer Funds | | Chairman of the |
| | | Audit Committee, |
| | | |
| | | | and Director, |
| | | | Board of |
| | | | Directors, Value |
| | | | Line Funds |
James D. Vaughn – 1945 | 2019 | Retired | 229 | Board member |
Trustee | | Formerly: Managing Partner, Deloitte & Touche LLP; Trustee and Chairman of | | and Chairman of |
| | | Audit Committee |
| | the Audit Committee, Schroder Funds; Board Member, Mile High United Way, | |
| | | of AMG National |
| | Boys and Girls Clubs, Boy Scouts, Colorado Business Committee for the Arts, | |
| | | Trust Bank; |
| | Economic Club of Colorado and Metro Denver Network (economic development | |
| | | Trustee and |
| | corporation); and Trustee of certain Oppenheimer Funds | |
| | | Investment |
| | | |
| | | | Committee |
| | | | member, |
| | | | University of |
| | | | South Dakota |
| | | | Foundation; |
| | | | Board member, |
| | | | Audit Committee |
| | | | Member and past |
| | | | Board Chair, |
| | | | Junior |
| | | | Achievement |
| | | | (non-profit) |
Christopher L. Wilson - | 2017 | Retired | 229 | ISO New |
1957 | | Formerly: Director, TD Asset Management USA Inc. (mutual fund complex) (22 | | England, Inc. |
Trustee, Vice Chair and Chair | | | (non-profit |
| portfolios); Managing Partner, CT2, LLC (investing and consulting firm); | |
Designate | | | organization |
| President/Chief Executive Officer, Columbia Funds, Bank of America | |
| | | |
| Corporation; President/Chief Executive Officer, CDC IXIS Asset Management | managing |
| regional electricity |
| Services, Inc.; Principal & Director of Operations, Scudder Funds, Scudder, |
| market) |
| Stevens & Clark, Inc.; Assistant Vice President, Fidelity Investments |
| |
T-4 | Invesco Global Real Estate Fund |
Trustees and Officers—(continued)
| | | Number of | Other |
| Trustee | | Funds in | Directorship(s) |
Name, Year of Birth and | and/or | | Fund Complex | Held by Trustee |
Position(s) | Officer | Principal Occupation(s) | Overseen by | During Past 5 |
Held with the Trust | Since | During Past 5 Years | Trustee | Years |
Officers | | | | |
Sheri Morris — 1964 | 1999 | Head of Global Fund Services, Invesco Ltd.; President, Principal Executive | N/A | N/A |
President, Principal Executive | | Officer and Treasurer, The Invesco Funds; Vice President, Invesco Advisers, | | |
Officer and Treasurer | | Inc. (formerly known as Invesco Institutional (N.A.), Inc.) (registered | | |
| | investment adviser); and Vice President, Invesco Exchange-Traded Fund Trust, | | |
| | Invesco Exchange-Traded Fund Trust II, Invesco India Exchange-Traded Fund | | |
| | Trust, Invesco Actively Managed Exchange-Traded Fund Trust, Invesco Actively | | |
| | Managed Exchange-Traded Commodity Fund Trust and Invesco | | |
| | Exchange-Traded Self-Indexed Fund Trust; and Vice President, | | |
| | OppenheimerFunds, Inc. | | |
| | Formerly: Vice President and Principal Financial Officer, The Invesco Funds; | | |
| | Vice President, Invesco AIM Advisers, Inc., Invesco AIM Capital Management, | | |
| | Inc. and Invesco AIM Private Asset Management, Inc.; Assistant Vice President | | |
| | and Assistant Treasurer, The Invesco Funds and Assistant Vice President, | | |
| | Invesco Advisers, Inc., Invesco AIM Capital Management, Inc. and Invesco AIM | | |
| | Private Asset Management, Inc.; and Treasurer, Invesco Exchange-Traded | | |
| | Fund Trust, Invesco Exchange-Traded Fund Trust II, Invesco India | | |
| | Exchange-Traded Fund Trust and Invesco Actively Managed Exchange-Traded | | |
| | Fund Trust | | |
Russell C. Burk — 1958 | 2005 | Senior Vice President and Senior Officer, The Invesco Funds | N/A | N/A |
Senior Vice President and Senior | | | | |
Officer | | | | |
Jeffrey H. Kupor – 1968 | 2018 | Head of Legal of the Americas, Invesco Ltd.; Senior Vice President and | N/A | N/A |
Senior Vice President, Chief Legal | | Secretary, Invesco Advisers, Inc. (formerly known as Invesco Institutional | | |
Officer and Secretary | | (N.A.), Inc.) (registered investment adviser); Senior Vice President and | | |
| | Secretary, Invesco Distributors, Inc. (formerly known as Invesco AIM | | |
| | Distributors, Inc.); Vice President and Secretary, Invesco Investment Services, | | |
| | Inc. (formerly known as Invesco AIM Investment Services, Inc.) Senior Vice | | |
| | President, Chief Legal Officer and Secretary, The Invesco Funds; Secretary and | | |
| | General Counsel, Invesco Investment Advisers LLC (formerly known as Van | | |
| | Kampen Asset Management); Secretary and General Counsel, Invesco Capital | | |
| | Markets, Inc. (formerly known as Van Kampen Funds Inc.) and Chief Legal | | |
| | Officer, Invesco Exchange-Traded Fund Trust, Invesco Exchange-Traded Fund | | |
| | Trust II, Invesco India Exchange-Traded Fund Trust, Invesco Actively Managed | | |
| | Exchange-Traded Fund Trust, Invesco Actively Managed Exchange-Traded | | |
| | Commodity Fund Trust and Invesco Exchange-Traded Self-Indexed Fund Trust; | | |
| | Secretary, Invesco Indexing LLC; Secretary, W.L. Ross & Co., LLC | | |
| | Formerly: Secretary and Vice President, Jemstep, Inc.; Head of Legal, | | |
| | Worldwide Institutional, Invesco Ltd.; Secretary and General Counsel, INVESCO | | |
| | Private Capital Investments, Inc.; Senior Vice President, Secretary and General | | |
| | Counsel, Invesco Management Group, Inc. (formerly known as Invesco AIM | | |
| | Management Group, Inc.); Assistant Secretary, INVESCO Asset Management | | |
| | (Bermuda) Ltd.; Secretary and General Counsel, Invesco Private Capital, Inc.; | | |
| | Assistant Secretary and General Counsel, INVESCO Realty, Inc.; Secretary and | | |
| | General Counsel, Invesco Senior Secured Management, Inc.; and Secretary, | | |
| | Sovereign G./P. Holdings Inc. | | |
Andrew R. Schlossberg – 1974 | 2019 | Head of the Americas and Senior Managing Director, Invesco Ltd.; Director and | N/A | N/A |
Senior Vice President | | Senior Vice President, Invesco Advisers, Inc. (formerly known as Invesco | | |
| | Institutional (N.A.), Inc.) (registered investment adviser); Director and | | |
| | Chairman, Invesco Investment Services, Inc. (formerly known as Invesco AIM | | |
| | Investment Services, Inc.) (registered transfer agent); Senior Vice President, | | |
| | The Invesco Funds; Director, Invesco Investment Advisers LLC (formerly known | | |
| | as Van Kampen Asset Management); Director, President and Chairman, Invesco | | |
| | Insurance Agency, Inc. | | |
| | Formerly: Director, Invesco UK Limited; Director and Chief Executive, Invesco | | |
| | Asset Management Limited and Invesco Fund Managers Limited; Assistant Vice | | |
| | President, The Invesco Funds; Senior Vice President, Invesco Advisers, Inc. | | |
| | (formerly known as Invesco Institutional (N.A.), Inc.) (registered investment | | |
| | adviser); Director and Chief Executive, Invesco Administration Services Limited | | |
| | and Invesco Global Investment Funds Limited; Director, Invesco Distributors, | | |
| | Inc.; Head of EMEA, Invesco Ltd.; President, Invesco Actively Managed | | |
| | Exchange-Traded Commodity Fund Trust, Invesco Actively Managed | | |
| | Exchange-Traded Fund Trust, Invesco Exchange-Traded Fund Trust, Invesco | | |
| | Exchange-Traded Fund Trust II and Invesco India Exchange-Traded Fund Trust; | | |
| | Managing Director and Principal Executive Officer, Invesco Capital | | |
| | Management LLC | | |
T-5 | Invesco Global Real Estate Fund |
Trustees and Officers—(continued)
| | | Number of | Other |
| Trustee | | Funds in | Directorship(s) |
Name, Year of Birth and | and/or | | Fund Complex | Held by Trustee |
Position(s) | Officer | Principal Occupation(s) | Overseen by | During Past 5 |
Held with the Trust | Since | During Past 5 Years | Trustee | Years |
Officers—(continued) | | | | |
John M. Zerr — 1962 | 2006 | Chief Operating Officer of the Americas; Senior Vice President, Invesco | N/A | N/A |
Senior Vice President | | Advisers, Inc. (formerly known as Invesco Institutional (N.A.), Inc.) (registered | | |
| | investment adviser); Senior Vice President, Invesco Distributors, Inc. (formerly | | |
| | known as Invesco AIM Distributors, Inc.); Director and Vice President, Invesco | | |
| | Investment Services, Inc. (formerly known as Invesco AIM Investment | | |
| | Services, Inc.) Senior Vice President, The Invesco Funds; Managing Director, | | |
| | Invesco Capital Management LLC; Director, Invesco Investment Advisers LLC | | |
| | (formerly known as Van Kampen Asset Management); Senior Vice President, | | |
| | Invesco Capital Markets, Inc. (formerly known as Van Kampen Funds Inc.); | | |
| | Manager, Invesco Indexing LLC; Manager, Invesco Specialized Products, LLC; | | |
| | Director and Senior Vice President, Invesco Insurance Agency, Inc.; Member, | | |
| | Invesco Canada Funds Advisory Board; Director, President and Chief Executive | | |
| | Officer, Invesco Corporate Class Inc. (corporate mutual fund company); and | | |
| | Director, Chairman, President and Chief Executive Officer, Invesco Canada Ltd. | | |
| | (formerly known as Invesco Trimark Ltd./Invesco Trimark Ltèe) (registered | | |
| | investment adviser and registered transfer agent); President, Invesco, Inc. | | |
| | Formerly: Director and Senior Vice President, Invesco Management Group, Inc. | | |
| | (formerly known as Invesco AIM Management Group, Inc.); Secretary and | | |
| | General Counsel, Invesco Management Group, Inc. (formerly known as Invesco | | |
| | AIM Management Group, Inc.); Secretary, Invesco Investment Services, Inc. | | |
| | (formerly known as Invesco AIM Investment Services, Inc.); Chief Legal Officer | | |
| | and Secretary, The Invesco Funds; Secretary and General Counsel, Invesco | | |
| | Investment Advisers LLC (formerly known as Van Kampen Asset Management); | | |
| | Secretary and General Counsel, Invesco Capital Markets, Inc. (formerly known | | |
| | as Van Kampen Funds Inc.); Chief Legal Officer, Invesco Exchange-Traded Fund | | |
| | Trust, Invesco Exchange-Traded Fund Trust II, Invesco India Exchange-Traded | | |
| | Fund Trust, Invesco Actively Managed Exchange-Traded Fund Trust, Invesco | | |
| | Actively Managed Exchange-Traded Commodity Fund Trust and Invesco | | |
| | Exchange-Traded Self-Indexed Fund Trust; Secretary, Invesco Indexing LLC; | | |
| | Director, Secretary, General Counsel and Senior Vice President, Van Kampen | | |
| | Exchange Corp.; Director, Vice President and Secretary, IVZ Distributors, Inc. | | |
| | (formerly known as INVESCO Distributors, Inc.); Director and Vice President, | | |
| | INVESCO Funds Group, Inc.; Director and Vice President, Van Kampen | | |
| | Advisors Inc.; Director, Vice President, Secretary and General Counsel, Van | | |
| | Kampen Investor Services Inc.;Director and Secretary, Invesco Distributors, | | |
| | Inc. (formerly known as Invesco AIM Distributors, Inc.); Director, Senior Vice | | |
| | President, General Counsel and Secretary, Invesco AIM Advisers, Inc. and Van | | |
| | Kampen Investments Inc.; Director, Vice President and Secretary, Fund | | |
| | Management Company; Director, Senior Vice President, Secretary, General | | |
| | Counsel and Vice President, Invesco AIM Capital Management, Inc.; Chief | | |
| | Operating Officer and General Counsel, Liberty Ridge Capital, Inc. (an | | |
| | investment adviser) | | |
Gregory G. McGreevey - 1962 | 2012 | Senior Managing Director, Invesco Ltd.; Director, Chairman, President, and | N/A | N/A |
Senior Vice President | | Chief Executive Officer, Invesco Advisers, Inc. (formerly known as Invesco | | |
| | Institutional (N.A.), Inc.) (registered investment adviser); Director, Invesco | | |
| | Mortgage Capital, Inc. and Invesco Senior Secured Management, Inc.; and | | |
| | Senior Vice President, The Invesco Funds; and President, SNW Asset | | |
| | Management Corporation and Invesco Managed Accounts, LLC | | |
| | Formerly: Senior Vice President, Invesco Management Group, Inc. and Invesco | | |
| | Advisers, Inc.; Assistant Vice President, The Invesco Funds | | |
Kelli Gallegos – 1970 | 2008 | Principal Financial and Accounting Officer – Investments Pool, Invesco | N/A | N/A |
Vice President, Principal Financial | | Specialized Products, LLC; Vice President, Principal Financial Officer and | | |
Officer and Assistant Treasurer | | Assistant Treasurer, The Invesco Funds; Principal Financial and Accounting | | |
| | Officer – Pooled Investments, Invesco Capital Management LLC; Vice President | | |
| | and Treasurer, Invesco Exchange-Traded Fund Trust, Invesco Exchange-Traded | | |
| | Fund Trust II, Invesco India Exchange-Traded Fund Trust, Invesco Actively | | |
| | Managed Exchange-Traded Fund Trust, Invesco Actively Managed | | |
| | Exchange-Traded Commodity Fund Trust and Invesco Exchange-Traded | | |
| | Self-Indexed Fund Trust; Vice President, Invesco Advisers, Inc. | | |
| | Formerly: Assistant Treasurer, Invesco Specialized Products, LLC; Assistant | | |
| | Treasurer, Invesco Exchange-Traded Fund Trust, Invesco Exchange-Traded | | |
| | Fund Trust II, Invesco India Exchange-Traded Fund Trust, Invesco Actively | | |
| | Managed Exchange-Traded Fund Trust, Invesco Actively Managed | | |
| | Exchange-Traded Commodity Fund Trust and Invesco Exchange-Traded | | |
| | Self-Indexed Fund Trust; Assistant Treasurer, Invesco Capital | | |
| | Management LLC; Assistant Vice President, The Invesco Funds | | |
Crissie M. Wisdom – 1969 | 2013 | Anti-Money Laundering and OFAC Compliance Officer for Invesco U.S. entities | N/A | N/A |
Anti-Money Laundering | | including: Invesco Advisers, Inc. and its affiliates, Invesco Capital Markets, | | |
Compliance Officer | | Inc., Invesco Distributors, Inc., Invesco Investment Services, Inc., The Invesco | | |
| | Funds, Invesco Capital Management, LLC, Invesco Trust Company; | | |
| | OppenheimerFunds Distributor, Inc., and Fraud Prevention Manager for | | |
| | Invesco Investment Services, Inc. | | |
T-6 | Invesco Global Real Estate Fund |
Trustees and Officers—(continued)
| | | Number of | Other |
| Trustee | | Funds in | Directorship(s) |
Name, Year of Birth and | and/or | | Fund Complex | Held by Trustee |
Position(s) | Officer | Principal Occupation(s) | Overseen by | During Past 5 |
Held with the Trust | Since | During Past 5 Years | Trustee | Years |
Officers—(continued) | | | | |
Robert R. Leveille – 1969 | 2016 | Chief Compliance Officer, Invesco Advisers, Inc. (registered investment | N/A | N/A |
Chief Compliance Officer | | adviser); and Chief Compliance Officer, The Invesco Funds | | |
| | Formerly: Chief Compliance Officer, Putnam Investments and the Putnam | | |
| | Funds | | |
The Statement of Additional Information of the Trust includes additional information about the Fund's Trustees and is available upon request, without charge, by calling 1.800.959.4246. Please refer to the Fund's Statement of Additional Information for information on the Fund's sub-advisers.
Office of the Fund | Investment Adviser | Distributor | Auditors |
11 Greenway Plaza, Suite 1000 | Invesco Advisers, Inc. | Invesco Distributors, Inc. | PricewaterhouseCoopers LLP |
Houston, TX 77046-1173 | 1555 Peachtree Street, N.E. | 11 Greenway Plaza, Suite 1000 | 1000 Louisiana Street, Suite 5800 |
| Atlanta, GA 30309 | Houston, TX 77046-1173 | Houston, TX 77002-5678 |
Counsel to the Fund | Counsel to the Independent Trustees | Transfer Agent | Custodian |
Stradley Ronon Stevens & Young, LLP | Goodwin Procter LLP | Invesco Investment Services, Inc. | State Street Bank and Trust Company |
2005 Market Street, Suite 2600 | 901 New York Avenue, N.W. | 11 Greenway Plaza, Suite 1000 | 225 Franklin Street |
Philadelphia, PA 19103-7018 | Washington, D.C. 20001 | Houston, TX 77046-1173 | Boston, MA 02110-2801 |
T-7 | Invesco Global Real Estate Fund |

Go paperless with eDelivery
Visit invesco.com/edelivery to enjoy the convenience and security of anytime electronic access to your investment documents.
With eDelivery, you can elect to have any or all of the following materials delivered straight to your inbox to download, save and print from your own computer:
•Fund reports and prospectuses
•Quarterly statements
•Daily confirmations
•Tax forms
Invesco mailing information
Send general correspondence to Invesco Investment Services, Inc., P.O. Box 219078, Kansas City, MO 64121-9078.
Important notice regarding delivery of security holder documents
To reduce Fund expenses, only one copy of most shareholder documents may be mailed to shareholders with multiple accounts at the same address (Householding). Mailing of your shareholder documents may be householded indefinitely unless you instruct us otherwise. If you do not want the mailing of these documents to be combined with those for other members of your household, please contact Invesco Investment Services, Inc. at 800 959 4246 or contact your financial institution. We will begin sending you individual copies for each account within 30 days after receiving your request.
Fund holdings and proxy voting information
The Fund provides a complete list of its holdings four times in each fiscal year, at the quarter-ends. For the second and fourth quarters, the list appears in the Fund's semiannual and annual reports to shareholders. For the first and third quarters, the Fund files the lists with the Securities and Exchange Commission (SEC) as an exhibit to its reports on Form N-PORT. The most recent list of portfolio holdings is available at invesco.com/completeqtrholdings. Shareholders can also look up the Fund's Form N-PORT filings on the SEC website, sec.gov. The SEC file numbers for the Fund are shown below.
A description of the policies and procedures that the Fund uses to determine how to vote proxies relating to portfolio secu- rities is available without charge, upon request, from our Client Services department at 800 959 4246, or at invesco.com/ proxyguidelines. The information is also available on the SEC website, sec.gov.
Information regarding how the Fund voted proxies related to its portfolio securities during the most
recent 12-month period ended June 30 is available at invesco.com/proxysearch. This information is also available on the SEC website, sec.gov.
Invesco Advisers, Inc. is an investment adviser; it provides investment advisory services to individual and institutional clients and does not sell securities. Invesco Distributors, Inc. is the US distributor for Invesco Ltd.'s retail mutual funds, exchange-traded funds and institutional money market funds. Both are wholly owned, indirect subsidiaries of Invesco Ltd.
SEC file numbers: 811-05686 and 033-39519 | Invesco Distributors, Inc. | GRE-AR-1 |
Annual Report to Shareholders | February 29, 2020 |
Invesco Government Money Market Fund
Nasdaq:
Cash Reserve: AIMXX AX: ACZXX CX: ACXXX Investor: INAXX R6: INVXX
Beginning on January 1, 2021, as permitted by regulations adopted by the Securities and Exchange Commission, paper copies of the Fund's shareholder reports will no longer be sent by mail, unless you specifically request paper copies of the reports from the Fund or from your financial intermedi- ary, such as a broker-dealer or bank. Instead, the reports will be made available on the Fund's website, and you will be notified by mail each time a report is posted and provided with a website link to access the report.
If you already elected to receive shareholder reports elec- tronically, you will not be affected by this change and you need not take any action. You may elect to receive share- holder reports and other communications from the Fund electronically by contacting your financial intermediary (such as a broker-dealer or bank) or, if you are a direct investor, by enrolling at invesco.com/edelivery.
You may elect to receive all future reports in paper free of charge. If you invest through a financial intermediary, you can contact your financial intermediary to request that you continue to receive paper copies of your shareholder reports. If you invest directly with the Fund, you can
call (800) 959-4246 to let the Fund know you wish to con- tinue receiving paper copies of your shareholder reports. Your election to receive reports in paper will apply to all funds held with your financial intermediary or all funds held with the fund complex if you invest directly with the Fund.
Andrew Schlossberg
Letters to Shareholders
Dear Shareholders:
This annual report includes information about your Fund, including performance data and a complete list of its investments as of the close of the reporting period. Inside is a discussion of how your Fund was managed and the factors that affected its performance during the reporting period.
The reporting period proved to be another tumultuous time for both global equities and fixed-income secu- rities. In early 2019, global equity markets were buoyed by a more accommodative stance from central banks and optimism about a potential US-China trade deal. In May, US-China trade concerns and slowing global growth led to a global equity sell-off and rally in US Treasuries. Despite the May sell-off, domestic equity mar- kets rallied in June in anticipation of a US Federal Reserve (the Fed) interest rate cut and closed the second quarter with modest gains. Continued US-China trade worries and signs of slowing global economic growth led to increased market volatility in August. The US Treasury yield curve inverted several times as fears of a US recession increased. As a result, global equity markets were largely flat for the third quarter. In the final
months of 2019, geopolitical and macroeconomic issues largely abated. This combined with better-than-expected third quarter corporate earnings and initial agreement of the phase one US-China trade deal provided a favorable backdrop for equities and impressive fourth quar- ter global equity returns.
As the new year began, US equities were largely buoyed in January by the signing of the phase one trade agreement and strong eco- nomic data although returns were dampened by the spread of the Coronavirus (COVID-19). Concerns over the virus had a greater impact on international equities, which were largely lower for the month. As the virus spread outside of China and the number of cases increased, fears of diminished global growth led to a sharp global equity sell-off at the end of February 2020 and sent the yield on the US 10-year Treasury to a new all-time low.
Throughout 2019, central banks continued to be accommodative, providing sources of liquidity. In July, the Fed lowered interest rates for the first time in 11 years. It again lowered rates in September and once again in October. During the rest of the year, the Fed left rates unchanged. Overseas, the European Central Bank left its policy rate unchanged and continued its bond purchasing program. In 2020, with the increased spread of the coronavirus, the Fed shifted from a more neutral policy to the possibility of further rate cuts in the new year. As 2020 unfolds, we'll see how the interplay of interest rates, economic data, geopolitics and a host of other factors affect US and overseas equity and fixed income markets.
Investor uncertainty and market volatility, such as we witnessed during the reporting period, are unfortunate facts of life when it comes to investing. That's why Invesco encourages investors to work with a professional financial adviser who can stress the importance of starting to save and invest early and the importance of adhering to a disciplined investment plan. A financial adviser who knows your unique finan- cial situation, investment goals and risk tolerance can be an invaluable partner as you seek to achieve your financial goals. Financial advis- ers can also offer a long-term perspective when markets are volatile and time-tested advice and guidance when your financial situation or investment goals change.
Visit our website for more information on your investments
Our website, invesco.com/us, offers a wide range of market insights and investment perspectives. On the website, you'll find detailed infor- mation about our funds, including performance, holdings and portfolio manager commentaries. You can access information about your account by completing a simple, secure online registration. To do so, select "Log In" on the right side of the homepage, and then select "Register for Individual Account Access."
In addition to the resources accessible on our website and through our mobile app, you can obtain timely updates to help you stay informed about the markets and the economy by connecting with Invesco on Twitter, LinkedIn or Facebook. You can access our blog at blog.invesco.us.com. Our goal is to provide you the information you want, when and where you want it.
Finally, I'm pleased to share with you Invesco's commitment to both the Principles for Responsible Investment and to considering environ- mental, social and governance issues in our robust investment process. I invite you to learn more at invesco.com/esg.
Have questions?
For questions about your account, contact an Invesco client services representative at 800 959 4246.
All of us at Invesco look forward to serving your investment management needs. Thank you for investing with us.
Sincerely,
Andrew Schlossberg
Head of the Americas,
Senior Managing Director, Invesco Ltd.
2Invesco Government Money Market Fund
Bruce Crockett
Dear Fellow Shareholders:
Among the many important lessons I've learned in more than 40 years in a variety of business endeavors is the value of a trusted advocate.
As independent chair of the Invesco Funds Board, I can assure you that the members of the Board are strong advocates for the interests of investors in Invesco's mutual funds. We work hard to represent your interests through oversight of the quality of the investment management services your funds receive and other matters important to your investment, including but not limited to:
Ensuring that Invesco offers a diverse lineup of mutual funds that your financial adviser can use to strive to meet your financial needs as your investment goals change over time.
Monitoring how the portfolio management teams of the Invesco funds are performing in light of changing economic and market conditions.
Assessing each portfolio management team's investment performance within the context of the investment strategy described in the fund's prospectus.
Monitoring for potential conflicts of interests that may impact the nature of the services that your funds receive.
We believe one of the most important services we provide our fund shareholders is the annual review of the funds' advisory and sub-
advisory contracts with Invesco Advisers and its affiliates. This review is required by the Investment Company Act of 1940 and focuses on the nature and quality of the services Invesco provides as the adviser to the Invesco funds and the reasonableness of the fees that it charges for those services. Each year, we spend months carefully reviewing information received from Invesco and a variety of independent sources, such as performance and fee data prepared by Lipper, Inc. (a subsidiary of Broadridge Financial Solutions, Inc.), an independent, third-party firm widely recognized as a leader in its field. We also meet with our independent legal counsel and other independent advisers to review and help us assess the information that we have received. Our goal is to assure that you receive quality investment management services for a reasonable fee.
I trust the measures outlined above provide assurance that you have a worthy advocate when it comes to choosing the Invesco Funds. On behalf of the Board, we look forward to continuing to represent your interests and serving your needs.
Sincerely,
Bruce L. Crockett
Independent Chair
Invesco Funds Board of Trustees
3Invesco Government Money Market Fund
Management's Discussion of your Fund
About your Fund
This annual report for Invesco Government Money Market Fund covers the fiscal year ended February 29, 2020. As of that date, the Fund's net assets totaled $2.7 billion. As of the same date, the Fund's weighted aver- age maturity was 17 days and the Fund's weighted average life was 113 days.1
Market conditions affecting money market funds
The largest development affecting money market funds and the money market fund industry during the fiscal year was the US Federal Reserve (the Fed) cutting interest rates three times from a range of 2.25%- 2.50% to 1.50%-1.75%². In the beginning of 2020, markets saw an increase in volatility as a result of the impact of the Coronavirus (COVID-19). This has caused the outlook for the Fed to shift from a neutral policy during 2020 to a higher possibility of several rate cuts. Rate cuts by the Fed would likely cause yields on government money market funds to decrease as a result.
Another major development impacting money market funds and the money market industry during the reporting period was the volatility in the short-term funding markets, when repo rates saw a sudden spike. In Octo- ber 2019, the Fed directed the Federal Re- serve Bank of New York Trading Desk (the Desk) to purchase $60 billion per month in short-term Treasury Bills at least into the sec- ond quarter of 2020 to maintain sufficient reserve balances. This resulted in the flatten- ing of the US Treasury curve and the stabili- zation of the repurchase agreement opera- tions (repo) markets. The Fed has indicated their commitment to continuing both perma- nent and temporary open market operations in order to maintain stability in the funding markets.
Thank you for investing in Invesco Govern- ment Money Market Fund. We believe our long-term approach to short-term investing makes us a strong partner for investors seek- ing premier liquidity management.
1Weighted average maturity (WAM) is an average of the maturities of all securities held in the port- folio, weighted by each security's percentage of net assets. The days to maturity for WAM is the lower of the stated maturity date or next interest rate reset date. WAM reflects how a portfolio would react to interest rate changes. Weighted average life (WAL) is an average of all the maturities of all securities held in the portfolio, weighted by each security's percentage of net assets. The days to maturity for WAL is the lower of the stated maturity date or next demand feature date. WAL reflects how a portfo-
lio would react to deteriorating credit (widening spreads) or tightening liquidity conditions.
2 Source: US Federal Reserve
Team managed by Invesco Advisers, Inc.
The views and opinions expressed in management's discussion of Fund performance are those of Invesco Advisers, Inc. These views and opinions are subject to change at any time based on factors such as market and economic conditions. These views and opinions may not be relied upon as investment advice or recommendations, or as an offer for a particular security. The information is not a complete analysis of every aspect of any market, country, industry, security or the Fund. Statements of fact are from sources considered reliable, but Invesco Advisers, Inc. makes no representation or warranty as to their completeness or accuracy. Although historical performance is no guarantee of future results, these insights may help you understand our investment management philosophy.
See important Fund and, if applicable, index disclosures later in this report.
Portfolio Composition by Maturity | |
In days, as of 02/29/2020 | |
1-7 | 15.8% |
8-30 | 5.1 |
31-60 | 27.5 |
61-90 | 8.1 |
91-180 | 15.4 |
181+ | 28.1 |
The number of days to maturity of each holding is determined in accordance with the provisions of Rule 2a-7 under the Investment Company Act of 1940.
You could lose money by investing in the Fund. Although the Fund seeks to preserve your investment at $1.00 per share, it cannot guarantee it will do so. An investment in the Fund is not insured or guaranteed by the Federal Deposit Insurance Corporation or any other government agency. The Fund's sponsor has no legal obligation to provide financial support to the Fund, and you should not expect that the sponsor will provide financial support to the Fund at any time.
4Invesco Government Money Market Fund
Invesco Government Money Market Fund's investment objective is to provide current income consistent with preservation of capital and liquidity.
Unless otherwise stated, information presented in this report is as of February 29, 2020, and is based on total net assets.
Unless otherwise noted, all data provided by Invesco.
To access your Fund's reports/prospectus, visit invesco.com/fundreports.
This report must be accompanied or preceded by a currently effective Fund prospectus, which contains more complete information, including sales charges and expenses. Investors should read it carefully before investing.
NOT FDIC INSURED | MAY LOSE VALUE | NO BANK GUARANTEE
5Invesco Government Money Market Fund
Schedule of Investments
February 29, 2020 | | | | Principal | | |
| | | | | |
| Interest | Maturity | | Amount | | |
| Rate | Date | | (000) | | Value |
U.S. Government Sponsored Agency Securities-34.39% | | | | | | |
Federal Farm Credit Bank (FFCB)-1.14% | | | | | | |
Federal Farm Credit Bank (1 mo. USD LIBOR - 0.06%)(a) | 1.52% | 07/29/2020 | $ | 20,000 | $ | 19,999,010 |
Federal Farm Credit Bank (1 mo. USD LIBOR + 0.08%)(a) | 1.66% | 02/01/2021 | | 5,000 | | 5,004,107 |
Federal Farm Credit Bank (SOFR + 0.08%)(a) | 2.07% | 06/10/2021 | | 2,000 | | 2,000,000 |
Federal Farm Credit Bank (SOFR + 0.08%)(a) | 1.72% | 07/09/2021 | | 4,000 | | 4,000,000 |
| | | | | | 31,003,117 |
Federal Home Loan Bank (FHLB)-26.04% | | | | | | |
Federal Home Loan Bank (SOFR + 0.03%)(a) | 1.67% | 03/06/2020 | | 25,000 | | 25,000,000 |
Federal Home Loan Bank (b) | 1.57% | 04/01/2020 | | 52,000 | | 51,929,923 |
Federal Home Loan Bank (1 mo. USD LIBOR - 0.07%)(a) | 1.60% | 04/06/2020 | | 40,000 | | 40,000,000 |
Federal Home Loan Bank (b) | 1.45% | 04/15/2020 | | 3,000 | | 2,994,562 |
Federal Home Loan Bank (b) | 1.58% | 04/20/2020 | | 4,970 | | 4,959,093 |
Federal Home Loan Bank (b) | 1.58% | 04/22/2020 | | 5,000 | | 4,988,589 |
Federal Home Loan Bank (b) | 1.41% | 04/24/2020 | | 7,000 | | 6,985,195 |
Federal Home Loan Bank (1 mo. USD LIBOR - 0.06%)(a) | 1.54% | 04/28/2020 | | 45,000 | | 45,000,000 |
Federal Home Loan Bank (1 mo. USD LIBOR + 0.05%)(a) | 1.63% | 05/01/2020 | | 10,000 | | 10,001,832 |
Federal Home Loan Bank (SOFR + 0.04%)(a) | 1.68% | 05/08/2020 | | 7,000 | | 7,000,000 |
Federal Home Loan Bank (SOFR + 0.08%)(a) | 1.72% | 05/11/2020 | | 15,000 | | 15,000,000 |
Federal Home Loan Bank (SOFR + 0.02%)(a) | 1.66% | 05/22/2020 | | 25,000 | | 25,000,000 |
Federal Home Loan Bank (3 mo. USD LIBOR - 0.22%)(a) | 1.67% | 06/08/2020 | | 25,000 | | 25,000,000 |
Federal Home Loan Bank (1 mo. USD LIBOR - 0.06%)(a) | 1.61% | 06/09/2020 | | 20,000 | | 20,000,000 |
Federal Home Loan Bank (3 mo. USD LIBOR - 0.22%)(a) | 1.67% | 06/09/2020 | | 15,000 | | 15,000,000 |
Federal Home Loan Bank (1 mo. USD LIBOR - 0.06%)(a) | 1.61% | 06/10/2020 | | 20,000 | | 20,000,000 |
Federal Home Loan Bank (1 mo. USD LIBOR - 0.07%)(a) | 1.59% | 06/12/2020 | | 20,000 | | 20,000,000 |
Federal Home Loan Bank (SOFR + 0.04%)(a) | 1.68% | 06/19/2020 | | 10,000 | | 10,000,000 |
Federal Home Loan Bank (b) | 1.58% | 07/06/2020 | | 15,000 | | 14,916,974 |
Federal Home Loan Bank (1 mo. USD LIBOR - 0.07%)(a) | 1.59% | 07/13/2020 | | 15,000 | | 15,000,000 |
Federal Home Loan Bank (1 mo. USD LIBOR - 0.07%)(a) | 1.59% | 07/16/2020 | | 10,000 | | 10,000,000 |
Federal Home Loan Bank (SOFR + 0.10%)(a) | 1.65% | 07/17/2020 | | 10,000 | | 10,000,000 |
Federal Home Loan Bank (SOFR + 0.03%)(a) | 1.67% | 07/17/2020 | | 10,000 | | 10,000,000 |
Federal Home Loan Bank (SOFR + 0.08%)(a) | 1.72% | 07/24/2020 | | 5,000 | | 5,000,000 |
Federal Home Loan Bank (1 mo. USD LIBOR - 0.06%)(a) | 1.60% | 08/13/2020 | | 15,000 | | 15,000,000 |
Federal Home Loan Bank (b) | 1.50% | 08/19/2020 | | 5,475 | | 5,436,251 |
Federal Home Loan Bank (SOFR + 0.02%)(a) | 1.66% | 08/19/2020 | | 50,000 | | 50,000,000 |
Federal Home Loan Bank (SOFR + 0.03%)(a) | 1.67% | 08/21/2020 | | 10,000 | | 10,000,000 |
Federal Home Loan Bank (SOFR + 0.02%)(a) | 1.66% | 08/28/2020 | | 10,000 | | 10,000,000 |
Federal Home Loan Bank (SOFR + 0.05%)(a) | 2.08% | 09/28/2020 | | 15,000 | | 15,000,000 |
Federal Home Loan Bank (1 mo. USD LIBOR - 0.05%)(a) | 1.61% | 10/15/2020 | | 30,000 | | 30,000,000 |
Federal Home Loan Bank (3 mo. USD LIBOR - 0.21%)(a) | 1.64% | 10/16/2020 | | 5,000 | | 5,000,000 |
Federal Home Loan Bank (SOFR + 0.03%)(a) | 1.67% | 11/06/2020 | | 4,000 | | 4,000,000 |
Federal Home Loan Bank (3 mo. USD LIBOR - 0.19%)(a) | 1.65% | 11/16/2020 | | 10,000 | | 10,000,000 |
Federal Home Loan Bank (1 mo. USD LIBOR - 0.04%)(a) | 1.62% | 12/18/2020 | | 5,000 | | 5,000,000 |
Federal Home Loan Bank (SOFR + 0.10%)(a) | 4.48% | 12/23/2020 | | 16,000 | | 16,000,000 |
Federal Home Loan Bank (SOFR + 0.05%)(a) | 1.69% | 01/22/2021 | | 5,000 | | 5,000,000 |
Federal Home Loan Bank (SOFR + 0.05%)(a) | 1.69% | 01/28/2021 | | 10,000 | | 10,000,000 |
Federal Home Loan Bank (SOFR + 0.04%)(a) | 1.68% | 02/09/2021 | | 15,000 | | 15,000,000 |
Federal Home Loan Bank (SOFR + 0.04%)(a) | 1.68% | 02/25/2021 | | 10,000 | | 10,000,000 |
Federal Home Loan Bank (SOFR + 0.07%)(a) | 1.71% | 02/26/2021 | | 14,000 | | 14,000,000 |
Federal Home Loan Bank (3 mo. USD LIBOR - 0.11%)(a) | 1.77% | 04/09/2021 | | 7,000 | | 7,000,000 |
Federal Home Loan Bank (SOFR + 0.17%)(a) | 1.81% | 04/09/2021 | | 14,000 | | 14,000,000 |
Federal Home Loan Bank (3 mo. USD LIBOR - 0.11%)(a) | 1.74% | 04/13/2021 | | 5,000 | | 5,000,000 |
Federal Home Loan Bank (3 mo. USD LIBOR - 0.14%)(a) | 1.70% | 04/14/2021 | | 12,000 | | 12,000,000 |
Federal Home Loan Bank (3 mo. USD LIBOR - 0.14%)(a) | 1.70% | 04/19/2021 | | 10,000 | | 10,000,000 |
Federal Home Loan Bank (SOFR + 0.08%)(a) | 1.72% | 07/23/2021 | | 10,000 | | 10,000,000 |
See accompanying Notes to Financial Statements which are an integral part of the financial statements.
6Invesco Government Money Market Fund
| | | | Principal | | |
| Interest | Maturity | | Amount | | |
| Rate | Date | | (000) | | Value |
Federal Home Loan Bank (FHLB)-(continued) | | | | | | |
Federal Home Loan Bank (SOFR + 0.09%)(a) | 1.73% | 09/10/2021 | $ | 5,000 | $ | 5,000,000 |
| | | | | | 706,212,419 |
Federal Home Loan Mortgage Corp. (FHLMC)-5.38% | | | | | | |
Federal Home Loan Mortgage Corp. (SOFR + 0.04%)(a) | 1.68% | 04/03/2020 | | 25,000 | | 25,000,000 |
Federal Home Loan Mortgage Corp. (SOFR + 0.02%)(a) | 1.66% | 07/08/2020 | | 25,000 | | 25,000,000 |
Federal Home Loan Mortgage Corp. (SOFR + 0.02%)(a) | 2.28% | 07/10/2020 | | 10,000 | | 9,999,254 |
Federal Home Loan Mortgage Corp. (SOFR + 0.01%)(a) | 1.65% | 07/22/2020 | | 15,000 | | 15,000,000 |
Federal Home Loan Mortgage Corp. (SOFR + 0.04%)(a) | 1.68% | 09/10/2020 | | 15,000 | | 15,000,000 |
Federal Home Loan Mortgage Corp. (SOFR + 0.04%)(a) | 1.68% | 12/14/2020 | | 15,000 | | 15,000,000 |
Federal Home Loan Mortgage Corp. (SOFR + 0.03%)(a) | 3.48% | 02/05/2021 | | 7,000 | | 7,000,000 |
Federal Home Loan Mortgage Corp. (SOFR + 0.03%)(a) | 1.67% | 02/19/2021 | | 4,000 | | 4,000,000 |
Federal Home Loan Mortgage Corp. (SOFR + 0.03%)(a) | 1.67% | 02/24/2021 | | 30,000 | | 30,000,000 |
| | | | | | 145,999,254 |
Federal National Mortgage Association (FNMA)-0.88% | | | | | | |
Federal National Mortgage Association (b) | 1.51% | 06/12/2020 | | 10,000 | | 9,957,083 |
Federal National Mortgage Association (SOFR + 0.06%)(a) | 1.70% | 07/30/2020 | | 4,000 | | 4,000,000 |
Federal National Mortgage Association (SOFR + 0.04%)(a) | 1.68% | 01/29/2021 | | 10,000 | | 10,000,000 |
| | | | | | 23,957,083 |
U.S. International Development Finance Corp. (DFC)-0.95% | | | | | | |
U.S. International Development Finance Corp. VRD Bonds (3 mo. U.S. Treasury Bill Rate)(c) | 1.60% | 06/15/2025 | | 5,000 | | 5,000,000 |
U.S. International Development Finance Corp. VRD Bonds (3 mo. U.S. Treasury Bill Rate)(c) | 1.48% | 02/15/2028 | | 8,636 | | 8,636,400 |
U.S. International Development Finance Corp. VRD Bonds (3 mo. U.S. Treasury Bill Rate)(c) | 1.60% | 02/15/2028 | | 8,889 | | 8,888,889 |
U.S. International Development Finance Corp. VRD Bonds (3 mo. U.S. Treasury Bill Rate)(c) | 1.48% | 10/15/2040 | | 3,200 | | 3,200,000 |
| | | | | | 25,725,289 |
Total U.S. Government Sponsored Agency Securities (Cost $932,897,162) | | | | | | 932,897,162 |
U.S. Treasury Securities-20.10% | | | | | | |
U.S. Treasury Bills-8.64%(b) | | | | | | |
U.S. Treasury Bills | 1.57% | 03/05/2020 | | 35,000 | | 34,993,933 |
U.S. Treasury Bills | 1.55% | 03/19/2020 | | 30,000 | | 29,976,900 |
U.S. Treasury Bills | 1.56% | 03/26/2020 | | 20,000 | | 19,978,403 |
U.S. Treasury Bills | 1.81% | 04/02/2020 | | 20,000 | | 19,968,089 |
U.S. Treasury Bills | 1.69% | 04/09/2020 | | 15,000 | | 14,972,700 |
U.S. Treasury Bills | 1.63% | 04/16/2020 | | 10,000 | | 9,979,300 |
U.S. Treasury Bills | 1.61% | 04/23/2020 | | 5,000 | | 4,988,222 |
U.S. Treasury Bills | 1.62% | 04/30/2020 | | 25,000 | | 24,932,917 |
U.S. Treasury Bills | 1.58% | 06/25/2020 | | 20,000 | | 19,898,822 |
U.S. Treasury Bills | 1.57% | 07/02/2020 | | 25,000 | | 24,866,750 |
U.S. Treasury Bills | 1.52% | 08/20/2020 | | 10,000 | | 9,927,856 |
U.S. Treasury Bills | 1.45% | 08/27/2020 | | 10,000 | | 9,928,400 |
U.S. Treasury Bills | 1.47% | 12/31/2020 | | 10,000 | | 9,876,941 |
| | | | | | 234,289,233 |
U.S. Treasury Notes-11.46% | | | | | | |
U.S. Treasury Floating Rate Notes (3 mo. U.S. Treasury Bill Money Market Yield Rate + | | | | | | |
0.04%)(a) | 1.20% | 07/31/2020 | | 7,000 | | 6,999,782 |
U.S. Treasury Floating Rate Notes (3 mo. U.S. Treasury Bill Money Market Yield Rate + | | | | | | |
0.05%)(a) | 1.20% | 10/31/2020 | | 62,000 | | 61,984,954 |
U.S. Treasury Floating Rate Notes (3 mo. U.S. Treasury Bill Money Market Yield Rate + | | | | | | |
0.12%)(a) | 1.27% | 01/31/2021 | | 88,000 | | 87,975,413 |
U.S. Treasury Floating Rate Notes (3 mo. U.S. Treasury Bill Money Market Yield Rate + | | | | | | |
0.14%)(a) | 1.30% | 04/30/2021 | | 82,000 | | 81,978,263 |
U.S. Treasury Floating Rate Notes (3 mo. U.S. Treasury Bill Money Market Yield Rate + | | | | | | |
0.22%)(a) | 1.38% | 07/31/2021 | | 17,000 | | 16,997,483 |
U.S. Treasury Floating Rate Notes (3 mo. U.S. Treasury Bill Money Market Yield Rate + | | | | | | |
0.30%)(a) | 1.46% | 10/31/2021 | | 25,000 | | 25,013,210 |
See accompanying Notes to Financial Statements which are an integral part of the financial statements.
7Invesco Government Money Market Fund
| | | | Principal | | |
| Interest | Maturity | | Amount | | |
| Rate | Date | | (000) | | Value |
U.S. Treasury Notes-(continued) | | | | | | |
U.S. Treasury Floating Rate Notes (3 mo. U.S. Treasury Bill Money Market Yield Rate + | | | | | | |
0.15%)(a) | 1.31% | 01/31/2022 | $ | 5,000 | $ | 4,998,378 |
U.S. Treasury Notes | 1.38% | 09/15/2020 | | 10,000 | | 9,993,808 |
U.S. Treasury Notes | 2.75% | 09/30/2020 | | 15,000 | | 15,113,826 |
| | | | | | 311,055,117 |
Total U.S. Treasury Securities (Cost $545,344,350) | | | | | | 545,344,350 |
TOTAL INVESTMENTS IN SECURITIES (excluding Repurchase Agreements)-54.49% | | | | | | |
(Cost $1,478,241,512) | | | | | | 1,478,241,512 |
| | | | Repurchase | | |
Repurchase Agreements-43.64%(d) | | | | Amount | | |
| | | | | |
ABN AMRO Bank N.V., joint agreement dated 02/28/2020, aggregate maturing value of | | | | | | |
$600,080,500 (collateralized by domestic agency mortgage-backed securities valued at | | | | | | |
$612,000,000; 1.50% - 4.50%; 01/01/2024 - 10/20/2049) | 1.61% | 03/02/2020 | | 50,006,708 | | 50,000,000 |
Bank of Montreal, joint term agreement dated 02/12/2020, aggregate maturing value of | | | | | | |
$250,998,472 (collateralized by U.S. Treasury obligations valued at $255,000,182; | | | | | | |
0% - 3.88%; 05/31/2020 - 11/15/2049)(e) | 1.58% | 05/14/2020 | | 20,079,878 | | 20,000,000 |
Bank of Montreal, joint term agreement dated 02/12/2020, aggregate maturing value of | | | | | | |
$251,011,111 (collateralized by domestic agency mortgage-backed securities valued at | | | | | | |
$255,000,002; 3.00% - 4.00%; 10/01/2048 - 02/01/2050)(e) | 1.60% | 05/14/2020 | | 20,080,889 | | 20,000,000 |
BMO Capital Markets Corp., joint term agreement dated 01/15/2020, aggregate maturing | | | | | | |
value of $502,040,833 (collateralized by U.S. Treasury obligations valued at | | | | | | |
$510,000,136; 0% - 8.75%; 02/29/2020 - 02/15/2050)(e) | 1.58% | 04/17/2020 | | 25,102,042 | | 25,000,000 |
BMO Capital Markets Corp., term agreement dated 01/13/2020, maturing value of | | | | | | |
$40,158,744 (collateralized by a U.S. government sponsored agency obligation and | | | | | | |
domestic agency mortgage-backed securities valued at $40,800,000; 2.50% - 7.00%; | | | | | | |
04/03/2024 - 09/15/2061)(e) | 1.57% | 04/13/2020 | | 40,158,744 | | 40,000,000 |
BNP Paribas Securities Corp., joint term agreement dated 01/08/2020, aggregate maturing | | | | | | |
value of $1,003,950,000 (collateralized by U.S. Treasury obligations valued at | | | | | | |
$1,020,000,183; 0% - 8.75%; 03/05/2020 - 11/15/2049)(e) | 1.58% | 04/07/2020 | | 50,197,500 | | 50,000,000 |
BNP Paribas Securities Corp., joint term agreement dated 01/08/2020, aggregate maturing | | | | | | |
value of $2,364,361,125 (collateralized by U.S. Treasury obligations, a U.S. government | | | | | | |
sponsored agency obligation and domestic agency mortgage-backed securities valued at | | | | | | |
$2,402,100,000; 0% - 8.75%; 04/02/2020 - 02/25/2050)(e) | 1.59% | 04/07/2020 | | 155,616,125 | | 155,000,000 |
BNP Paribas Securities Corp., term agreement dated 12/04/2019, maturing value of | | | | | | |
$31,126,325 (collateralized by U.S. Treasury obligations and domestic agency | | | | | | |
mortgage-backed securities valued at $31,620,000; 0% - 5.50%; 02/15/2021 - | | | | | | |
10/01/2049)(e) | 1.63% | 03/03/2020 | | 31,126,325 | | 31,000,000 |
CIBC World Markets Corp., joint term agreement dated 02/13/2020, aggregate maturing | | | | | | |
value of $582,126,183 (collateralized by U.S. Treasury obligations valued at | | | | | | |
$591,600,183; 0.13% - 3.63%; 12/31/2020 - 11/15/2046)(e) | 1.59% | 05/06/2020 | | 30,109,975 | | 30,000,000 |
CIBC World Markets Corp., term agreement dated 02/13/2020, maturing value of | | | | | | |
$125,311,111 (collateralized by domestic agency mortgage-backed securities valued at | | | | | | |
$127,500,000; 3.00% - 6.00%; 05/01/2028 - 02/01/2057)(e) | 1.60% | 04/09/2020 | | 125,311,111 | | 125,000,000 |
Credit Agricole Corporate & Investment Bank, joint term agreement dated 12/23/2019, | | | | | | |
aggregate maturing value of $1,004,044,444 (collateralized by U.S. Treasury obligations | | | | | | |
valued at $1,020,000,074; 0.40% - 2.88%; 11/15/2021 - 01/15/2027)(e) | 1.60% | 03/23/2020 | | 15,060,667 | | 15,000,000 |
ING Financial Markets, LLC, joint term agreement dated 02/10/2020, aggregate maturing | | | | | | |
value of $100,135,000 (collateralized by domestic agency mortgage-backed securities | | | | | | |
valued at $102,000,000; 2.50% - 5.50%; 03/01/2029 - 09/01/2057) | 1.62% | 03/11/2020 | | 7,009,450 | | 7,000,000 |
ING Financial Markets, LLC, term agreement dated 02/18/2020, maturing value of | | | | | | |
$68,282,200 (collateralized by domestic agency mortgage-backed securities valued at | | | | | | |
$69,360,000; 2.31% - 6.50%; 01/01/2024 - 05/01/2058) | 1.66% | 05/18/2020 | | 68,282,200 | | 68,000,000 |
J.P. Morgan Securities LLC, joint agreement dated 02/28/2020, aggregate maturing value of | | | | | | |
$500,067,083 (collateralized by domestic agency mortgage-backed securities and U.S. | | | | | | |
goverment sponsored agency obligations valued at $510,000,000; 0% - 6.00%; | | | | | | |
12/01/2027 - 03/01/2050) | 1.61% | 03/02/2020 | | 50,006,708 | | 50,000,000 |
J.P. Morgan Securities LLC, joint open agreement dated 05/02/2019 (collateralized by | | | | | | |
domestic agency mortgage-backed securities and a U.S. Treasury obligation valued at | | | | | | |
$510,000,063; 0% - 6.00%; 06/01/2023 - 03/01/2050)(f) | 1.59% | - | | - | | 28,000,000 |
J.P. Morgan Securities LLC, joint open agreement dated 05/15/2019 (collateralized by | | | | | | |
domestic agency mortgage-backed securities and a U.S. Treasury obligation valued at | | | | | | |
$295,800,032; 0% - 7.00%; 08/01/2021 - 03/01/2050)(f) | 1.63% | - | | - | | 15,000,000 |
See accompanying Notes to Financial Statements which are an integral part of the financial statements.
8Invesco Government Money Market Fund
| | Interest | Maturity | | Repurchase | |
| | Rate | Date | | Amount | Value |
J.P. Morgan Securities LLC, joint open agreement dated 07/18/2019 (collateralized by | | | | | |
U.S. Treasury obligations valued at $357,000,087; 0% - 4.75%; 02/29/2020 - | | | | | |
11/15/2048)(f) | 1.57% | - | $ | - $ | 15,000,000 |
J.P. Morgan Securities LLC, joint open agreement dated 10/15/2019 (collateralized by | | | | | |
domestic agency mortgage-backed securities and a U.S. Treasury obligation valued at | | | | | |
$408,000,056; 0% - 6.00%; 05/01/2024 - 02/20/2050)(f) | 1.60% | - | | - | 25,000,000 |
J.P. Morgan Securities LLC, joint term agreement dated 12/04/2019, aggregate maturing | | | | | |
value of $572,000,000 (collateralized by U.S. Treasury obligations valued at | | | | | |
$583,440,393; 0% - 3.00%; 04/14/2020 - 02/15/2048)(a)(e) | 1.61% | 03/04/2020 | | 35,000,000 | 35,000,000 |
Metropolitan Life Insurance Co., joint term agreement dated 02/25/2020, aggregate | | | | | |
maturing value of $350,117,559 (collateralized by U.S. Treasury obligations valued at | | | | | |
$367,166,166; 0% - 2.63%; 03/26/2020 - 05/15/2046)(e) | 1.61% | 03/03/2020 | | 25,009,264 | 25,001,438 |
Mitsubishi UFJ Trust & Banking Corp., joint term agreement dated 02/27/2020, aggregate | | | | | |
maturing value of $1,022,822,087 (collateralized by U.S. Treasury obligations valued at | | | | | |
$1,050,853,400; 2.00%; 04/30/2024)(e) | 1.62% | 03/05/2020 | | 61,369,325 | 61,350,000 |
Mitsubishi UFJ Trust & Banking Corp., joint term agreement dated 02/27/2020, aggregate | | | | | |
maturing value of $100,031,306 (collateralized by U.S. Treasury obligations valued at | | | | | |
$102,009,376; 2.63%; 02/15/2029)(e) | 1.61% | 03/05/2020 | | 25,007,826 | 25,000,000 |
RBC Capital Markets LLC, joint agreement dated 02/28/2020, aggregate maturing value of | | | | | |
$100,013,417 (collateralized by domestic agency mortgage-backed securities and U.S. | | | | | |
goverment sponsored agency obligations valued at $102,000,001; 2.05% - 5.00%; | | | | | |
07/25/2024 - 07/01/2042) | 1.61% | 03/02/2020 | | 50,006,708 | 50,000,000 |
RBC Capital Markets LLC, joint term agreement dated 02/28/2020, aggregate maturing value | | | | | |
of $1,250,000,000 (collateralized by domestic agency mortgage-backed securities, U.S. | | | | | |
goverment sponsored agency obligations and a foreign corporate obligation valued at | | | | | |
$1,275,000,001; 1.70% - 8.00%; 06/15/2021 - 02/20/2067)(a)(e) | 1.64% | 04/29/2020 | | 85,000,000 | 85,000,000 |
RBC Dominion Securities Inc., joint term agreement dated 02/07/2020, aggregate maturing | | | | | |
value of $350,954,819 (collateralized by domestic agency mortgage-backed securities, | | | | | |
U.S. government sponsored agency obligations and U.S. Treasury obligations valued at | | | | | |
$357,000,003; 0% - 5.00%; 01/28/2021 - 02/20/2050)(e) | 1.61% | 04/08/2020 | | 25,068,201 | 25,000,000 |
Royal Bank of Canada, joint term agreement dated 12/20/2019, aggregate maturing value of | | | | | |
$1,004,000,000 (collateralized by domestic agency mortgage-backed securities valued | | | | | |
at $1,020,000,001; 1.93% - 6.00%; 01/25/2029 - 02/01/2050)(e) | 1.60% | 03/19/2020 | | 60,240,000 | 60,000,000 |
Societe Generale, joint open agreement dated 06/25/2018 (collateralized by U.S. Treasury | | | | | |
obligations and domestic agency mortgage-backed securities valued at $510,000,011; | | | | | |
0% - 4.00%; 08/27/2020 - 01/01/2050)(f) | 1.61% | - | | - | 15,000,000 |
Wells Fargo Securities, LLC, joint agreement dated 02/28/2020, aggregate maturing value of | | | | | |
$500,066,250 (collateralized by U.S. Treasury obligations valued at $510,000,001; | | | | | |
0% - 2.88%; 03/05/2020 - 03/31/2026) | 1.59% | 03/02/2020 | | 33,416,868 | 33,412,441 |
| Total Repurchase Agreements (Cost $1,183,763,879) | | | | | 1,183,763,879 |
TOTAL INVESTMENTS IN SECURITIES(g)-98.13% (Cost $2,662,005,391) | | | | | 2,662,005,391 |
OTHER ASSETS LESS LIABILITIES-1.87% | | | | | 50,602,668 |
NET ASSETS-100.00% | | | | $ | 2,712,608,059 |
Investment Abbreviations: | | | | | |
LIBOR -London Interbank Offered Rate | | | | | |
SOFR | -Secured Overnight Financing Rate | | | | | |
USD | -U.S. Dollar | | | | | |
VRD | -Variable Rate Demand | | | | | |
Notes to Schedule of Investments:
(a)Interest or dividend rate is redetermined periodically. Rate shown is the rate in effect on February 29, 2020.
(b)Security traded on a discount basis. The interest rate shown represents the discount rate at the time of purchase by the Fund.
(c)Demand security payable upon demand by the Fund at specified time intervals no greater than thirteen months. Interest rate is redetermined periodically based on current market interest rates. Rate shown is the rate in effect on February 29, 2020.
(d)Principal amount equals value at period end. See Note 1I.
(e)The Fund may demand payment of the term repurchase agreement upon one to seven business days' notice depending on the timing of the demand.
(f)Either party may terminate the agreement upon demand. Interest rates, principal amount and collateral are redetermined daily.
(g)Also represents cost for federal income tax purposes.
See accompanying Notes to Financial Statements which are an integral part of the financial statements.
9Invesco Government Money Market Fund
Statement of Assets and Liabilities
February 29, 2020
Assets: | |
Investments in securities, excluding repurchase | |
agreements, at value and cost | $1,478,241,512 |
Repurchase agreements, at value and cost | 1,183,763,879 |
Cash | 11,380,715 |
Receivable for: | |
Fund shares sold | 57,883,225 |
Interest | 3,292,266 |
Investment for trustee deferred compensation and | |
retirement plans | 242,040 |
Other assets | 3,887 |
Total assets | 2,734,807,524 |
Liabilities: | |
Payable for: | |
Fund shares reacquired | 20,639,016 |
Dividends | 61,023 |
Accrued fees to affiliates | 1,192,580 |
Accrued trustees' and officers' fees and benefits | 6,046 |
Accrued operating expenses | 27,943 |
Trustee deferred compensation and retirement plans | 272,857 |
Total liabilities | 22,199,465 |
Net assets applicable to shares outstanding | $2,712,608,059 |
Net assets consist of: | |
Shares of beneficial interest | $2,712,360,175 |
Distributable earnings | 247,884 |
| $2,712,608,059 |
Net Assets: | | |
Invesco Cash Reserve Shares | $ | 2,406,243,050 |
Class AX | $ | 76,169,436 |
Class C | $ | 43,478,364 |
Class CX | $ | 506,572 |
Class R | $ | 32,296,515 |
Class Y | $ | 42,686,006 |
Investor Class | $ | 111,207,901 |
Class R6 | $ | 20,215 |
Shares outstanding, no par value, | | |
unlimited number of shares authorized: | | |
Invesco Cash Reserve Shares | | 2,406,268,494 |
Class AX | | 76,169,869 |
Class C | | 43,478,602 |
Class CX | | 506,575 |
Class R | | 32,296,656 |
Class Y | | 42,686,177 |
Investor Class | | 111,208,390 |
Class R6 | | 20,215 |
Net asset value and offering price per share for each | | |
class | $ | 1.00 |
See accompanying Notes to Financial Statements which are an integral part of the financial statements.
10 | Invesco Government Money Market Fund |
Statement of Operations
For the year ended February 29, 2020
Investment income: | | |
Interest | $46,720,762 | |
Expenses: | | |
Advisory fees | 3,399,376 | |
Administrative services fees | 1,003,816 | |
Custodian fees | 3,355 | |
Distribution fees: | | |
Invesco Cash Reserve Shares | 2,948,013 | |
Class AX | 118,367 | |
Class C | 380,821 | |
Class CX | 5,258 | |
Class R | 122,037 | |
Transfer agent fees - Invesco Cash Reserve Shares, AX, C, CX, R, Y and Investor | 3,333,596 | |
Transfer agent fees - R6 | 21 | |
Trustees' and officers' fees and benefits | 46,501 | |
Registration and filing fees | 397,071 | |
Reports to shareholders | 33,917 | |
Professional services fees | 12,807 | |
Other | 14,155 | |
Total expenses | 11,819,111 | |
Less: Expense offset arrangement(s) | (30,425) |
Net expenses | 11,788,686 | |
Net investment income | 34,932,076 | |
Net realized gain from investment securities | 9,188 | |
Net increase in net assets resulting from operations | $34,941,264 | |
See accompanying Notes to Financial Statements which are an integral part of the financial statements.
11 | Invesco Government Money Market Fund |
Statement of Changes in Net Assets
For the years ended February 29, 2020 and February 28, 2019
| | 2020 | | 2019 | | |
Operations: | | | | | | |
Net investment income | $ | 34,932,076 | $ | 19,320,432 | |
Net realized gain (loss) | | 9,188 | | (1,472) |
Net increase in net assets resulting from operations | | 34,941,264 | | 19,318,960 | |
Distributions to shareholders from distributable earnings: | | | | | | |
Invesco Cash Reserve Shares | | (30,342,270) | | (14,729,147) |
| | | | | |
Class AX | | (1,262,786) | | (1,281,740) |
| | | | | |
Class C | | (350,056) | | (458,067) |
| | | | | |
Class CX | | (5,071) | | (25,911) |
| | | | | |
Class R | | (402,873) | | (328,797) |
| | | | | |
Class Y | | (572,434) | | (524,759) |
| | | | | |
Investor Class | | (2,011,585) | | (1,971,836) |
| | | | | |
Class R6 | | (343) | | (183) |
| | | | | |
Total distributions from distributable earnings | | (34,947,418) | | (19,320,440) |
Share transactions-net: | | | | | | |
Invesco Cash Reserve Shares | | 1,106,837,803 | | 483,786,108 | |
Class AX | | (4,941,382) | | (10,796,325) |
| | | | | |
Class C | | 4,777,928 | | (26,711,159) |
| | | | | |
Class CX | | (162,552) | | (3,444,863) |
| | | | | |
Class R | | 6,425,067 | | (1,515,629) |
Class Y | | 8,581,230 | | 4,024,953 | |
Investor Class | | (14,679,384) | | 8,255,956 | |
Class R6 | | 8,026 | | 2,189 | | |
Net increase in net assets resulting from share transactions | | 1,106,846,736 | | 453,601,230 | |
Net increase in net assets | | 1,106,840,582 | | 453,599,750 | |
Net assets: | | | | | | |
Beginning of year | | 1,605,767,477 | | 1,152,167,727 | |
End of year | $2,712,608,059 | $ | 1,605,767,477 | |
See accompanying Notes to Financial Statements which are an integral part of the financial statements.
12 | Invesco Government Money Market Fund |
Financial Highlights
February 29, 2020
The following schedule presents financial highlights for a share of the Fund outstanding throughout the periods indicated.
| | | | | | | | | Ratio of | Ratio of | | |
| | | | | | | | | expenses | expenses | | |
| | | | | | | | | to average | to average net | Ratio of net |
| Net asset | | Net gains | | Dividends | | | | net assets | assets without | investment |
| value, | Net | (losses) | Total from | from net | Net asset | | Net assets, | with fee waivers | fee waivers | income |
| beginning | investment | on securities | investment | investment | value, end | Total | end of period | and/or expenses | and/or expenses | to average |
| of period | income(a) | (realized) | operations | income | of period | return(b) | (000's omitted) | absorbed | absorbed | net assets | |
Invesco Cash Reserve Shares | | | | | | | | | 0.51%(c) | 0.51%(c) | 1.55%(c) |
Year ended 02/29/20 | $1.00 | $0.02 | $ 0.00 | $0.02 | $(0.02) | $1.00 | 1.61% | $2,406,243 |
Year ended 02/28/19 | 1.00 | 0.02 | (0.00) | 0.02 | (0.02) | 1.00 | 1.50 | 1,299,414 | 0.58 | 0.58 | 1.52 | |
Year ended 02/28/18 | 1.00 | 0.00 | (0.00) | 0.00 | (0.00) | 1.00 | 0.40 | 815,631 | 0.68 | 0.68 | 0.39 | |
Year ended 02/28/17 | 1.00 | 0.00 | 0.00 | 0.00 | (0.00) | 1.00 | 0.06 | 841,039 | 0.43 | 0.68 | 0.06 | |
Year ended 02/29/16 | 1.00 | 0.00 | 0.00 | 0.00 | (0.00) | 1.00 | 0.06 | 796,108 | 0.23 | 0.85 | 0.05 | |
Class AX | | | | | | | | | 0.51(c) | 0.51(c) | 1.55(c) |
Year ended 02/29/20 | 1.00 | 0.02 | 0.00 | 0.02 | (0.02) | 1.00 | 1.61 | 76,169 |
Year ended 02/28/19 | 1.00 | 0.02 | (0.00) | 0.02 | (0.02) | 1.00 | 1.50 | 81,110 | 0.58 | 0.58 | 1.52 | |
Year ended 02/28/18 | 1.00 | 0.00 | (0.00) | 0.00 | (0.00) | 1.00 | 0.40 | 91,906 | 0.68 | 0.68 | 0.39 | |
Year ended 02/28/17 | 1.00 | 0.00 | 0.00 | 0.00 | (0.00) | 1.00 | 0.06 | 102,748 | 0.43 | 0.68 | 0.06 | |
Year ended 02/29/16 | 1.00 | 0.00 | 0.00 | 0.00 | (0.00) | 1.00 | 0.06 | 117,923 | 0.23 | 0.85 | 0.05 | |
Class C | | | | | | | | | 1.26(c) | 1.26(c) | 0.80(c) |
Year ended 02/29/20 | 1.00 | 0.01 | 0.00 | 0.01 | (0.01) | 1.00 | 0.85 | 43,478 |
Year ended 02/28/19 | 1.00 | 0.01 | (0.00) | 0.01 | (0.01) | 1.00 | 0.76 | 38,700 | 1.31 | 1.33 | 0.79 | |
Year ended 02/28/18 | 1.00 | 0.00 | (0.00) | 0.00 | (0.00) | 1.00 | 0.27 | 65,411 | 0.81 | 1.43 | 0.26 | |
Year ended 02/28/17 | 1.00 | 0.00 | 0.00 | 0.00 | (0.00) | 1.00 | 0.05 | 88,605 | 0.43 | 1.43 | 0.06 | |
Year ended 02/29/16 | 1.00 | 0.00 | 0.00 | 0.00 | (0.00) | 1.00 | 0.06 | 90,970 | 0.23 | 1.60 | 0.05 | |
Class CX | | | | | | | | | 1.26(c) | 1.26(c) | 0.80(c) |
Year ended 02/29/20 | 1.00 | 0.01 | 0.00 | 0.01 | (0.01) | 1.00 | 0.85 | 507 |
Year ended 02/28/19 | 1.00 | 0.01 | (0.00) | 0.01 | (0.01) | 1.00 | 0.77 | 669 | 1.31 | 1.33 | 0.79 | |
Year ended 02/28/18 | 1.00 | 0.00 | (0.00) | 0.00 | (0.00) | 1.00 | 0.27 | 4,114 | 0.81 | 1.43 | 0.26 | |
Year ended 02/28/17 | 1.00 | 0.00 | 0.00 | 0.00 | (0.00) | 1.00 | 0.05 | 4,959 | 0.43 | 1.43 | 0.06 | |
Year ended 02/29/16 | 1.00 | 0.00 | 0.00 | 0.00 | (0.00) | 1.00 | 0.06 | 6,509 | 0.23 | 1.60 | 0.05 | |
Class R | | | | | | | | | 0.76(c) | 0.76(c) | 1.30(c) |
Year ended 02/29/20 | 1.00 | 0.01 | 0.00 | 0.01 | (0.01) | 1.00 | 1.35 | 32,297 |
Year ended 02/28/19 | 1.00 | 0.01 | (0.00) | 0.01 | (0.01) | 1.00 | 1.25 | 25,871 | 0.83 | 0.83 | 1.27 | |
Year ended 02/28/18 | 1.00 | 0.00 | (0.00) | 0.00 | (0.00) | 1.00 | 0.27 | 27,387 | 0.80 | 0.93 | 0.27 | |
Year ended 02/28/17 | 1.00 | 0.00 | 0.00 | 0.00 | (0.00) | 1.00 | 0.05 | 34,794 | 0.43 | 0.93 | 0.06 | |
Year ended 02/29/16 | 1.00 | 0.00 | 0.00 | 0.00 | (0.00) | 1.00 | 0.06 | 38,241 | 0.23 | 1.10 | 0.05 | |
Class Y | | | | | | | | | 0.36(c) | 0.36(c) | 1.70(c) |
Year ended 02/29/20 | 1.00 | 0.02 | 0.00 | 0.02 | (0.02) | 1.00 | 1.76 | 42,686 |
Year ended 02/28/19 | 1.00 | 0.02 | (0.00) | 0.02 | (0.02) | 1.00 | 1.65 | 34,105 | 0.43 | 0.43 | 1.67 | |
Year ended 02/28/18 | 1.00 | 0.01 | (0.00) | 0.01 | (0.01) | 1.00 | 0.55 | 30,080 | 0.53 | 0.53 | 0.54 | |
Year ended 02/28/17 | 1.00 | 0.00 | 0.00 | 0.00 | (0.00) | 1.00 | 0.09 | 27,738 | 0.40 | 0.53 | 0.09 | |
Year ended 02/29/16 | 1.00 | 0.00 | 0.00 | 0.00 | (0.00) | 1.00 | 0.06 | 22,602 | 0.23 | 0.70 | 0.05 | |
Investor Class | | | | | | | | | 0.36(c) | 0.36(c) | 1.70(c) |
Year ended 02/29/20 | 1.00 | 0.02 | 0.00 | 0.02 | (0.02) | 1.00 | 1.76 | 111,208 |
Year ended 02/28/19 | 1.00 | 0.02 | (0.00) | 0.02 | (0.02) | 1.00 | 1.65 | 125,886 | 0.43 | 0.43 | 1.67 | |
Year ended 02/28/18 | 1.00 | 0.01 | (0.00) | 0.01 | (0.01) | 1.00 | 0.55 | 117,630 | 0.53 | 0.53 | 0.54 | |
Year ended 02/28/17 | 1.00 | 0.00 | 0.00 | 0.00 | (0.00) | 1.00 | 0.09 | 123,466 | 0.40 | 0.53 | 0.09 | |
Year ended 02/29/16 | 1.00 | 0.00 | 0.00 | 0.00 | (0.00) | 1.00 | 0.06 | 152,042 | 0.23 | 0.70 | 0.05 | |
Class R6 | | | | | | | | | 0.32(c) | 0.32(c) | 1.74(c) |
Year ended 02/29/20 | 1.00 | 0.02 | 0.00 | 0.02 | (0.02) | 1.00 | 1.81 | 20 |
Year ended 02/28/19 | 1.00 | 0.02 | (0.00) | 0.02 | (0.02) | 1.00 | 1.80 | 12 | 0.36 | 0.38 | 1.74 | |
Year ended 02/28/18(d) | 1.00 | 0.01 | (0.00) | 0.01 | (0.01) | 1.00 | 0.69 | 10 | 0.37(e) | 0.37(e) | 0.70(e) | |
(a)Calculated using average shares outstanding.
(b)Includes adjustments in accordance with accounting principles generally accepted in the United States of America and does not include sales charges and is not annualized for periods less than one year, if applicable.
(c)Ratios are based on average daily net assets (000's omitted) of $1,965,323, $78,911, $42,313, $584, $30,509, $33,715, $114,875, and $21 for Invesco Cash Reserve Shares, Class AX, Class C, Class CX, Class R, Class Y, Investor Class, and Class R6 shares, respectively.
(d)Commencement date of April 04, 2017.
(e)Annualized.
See accompanying Notes to Financial Statements which are an integral part of the financial statements.
13 | Invesco Government Money Market Fund |
Notes to Financial Statements
February 29, 2020
NOTE 1—Significant Accounting Policies
Invesco Government Money Market Fund (the "Fund"), is a series portfolio of AIM Investment Securities Funds (Invesco Investment Securities Funds) (the "Trust"). The Trust is a Delaware statutory trust registered under the Investment Company Act of 1940, as amended (the "1940 Act"), as an open-end series management investment company authorized to issue an unlimited number of shares of beneficial interest. Information presented in these financial statements pertains only to the Fund. Matters affecting the Fund or each class will be voted on exclusively by the shareholders of the Fund or each class.
The Fund's investment objective is to provide current income consistent with preservation of capital and liquidity.
The Fund currently consists of nine different classes of shares: Invesco Cash Reserve Shares, Class A (not yet commenced), Class AX, Class C, Class CX, Class R, Class Y, Investor Class and Class R6. Effective December 10,2019, Class A shares were incepted. Class A, Class AX and Class CX shares are closed to new investors. Class Y and Investor Class shares are available only to certain investors. Class C and Class CX shares are sold with a contingent deferred sales charges ("CDSC"). Invesco Cash Reserve Shares, Class A, Class AX, Class R, Class Y, Investor Class and Class R6 shares are sold at net asset value.
The Fund is an investment company and accordingly follows the investment company accounting and reporting guidance in accordance with
Financial Accounting Standards Board Accounting Standards Codification Topic 946, Financial Services – Investment Companies. The following is a summary of the significant accounting policies followed by the Fund in the preparation of its financial statements.
The Fund is a "government money market fund" as defined in Rule 2a-7 under the 1940 Act and seeks to maintain a stable or constant NAV of $1.00 per share using an amortized cost method of valuation. "Government money market funds" are required to invest at least 99.5% of their total assets in cash, Government Securities (as defined in the 1940 Act), and/or repurchase agreements collateralized fully by cash or Government Securities. The Board of Trustees has elected not to subject the Fund to liquidity fee and redemption gate requirements at this time, as permitted by Rule 2a-7.
A.Security Valuations — The Fund's securities are recorded on the basis of amortized cost which approximates value as permitted by Rule 2a-7 under the 1940 Act. This method values a security at its cost on the date of purchase and, thereafter, assumes a constant amortization to maturity of any premiums or accretion of any discounts.
Because of the inherent uncertainties of valuation, the values reflected in the financial statements may materially differ from the value received upon actual sale of those investments.
The Fund may invest in securities that are subject to interest rate risk, meaning the risk that the prices will generally fall as interest rates rise and, conversely, the prices will generally rise as interest rates fall. Specific securities differ in their sensitivity to changes in interest rates depending on their individual characteristics. Changes in interest rates may result in increased market volatility, which may affect the value and/or liquidity of certain Fund investments.
B.Securities Transactions and Investment Income — Securities transactions are accounted for on a trade date basis. Realized gains or losses on sales are computed on the basis of specific identification of the securities sold. Interest income (net of withholding tax, if any) is recorded on the accrual basis from settlement date. Bond premiums and discounts are amortized and/or accreted over the lives of the respective securities.
The Fund may periodically participate in litigation related to Fund investments. As such, the Fund may receive proceeds from litigation settlements. Any proceeds received are included in the Statement of Operations as realized gain (loss) for investments no longer held and as unrealized gain (loss) for investments still held.
Brokerage commissions and mark ups are considered transaction costs and are recorded as an increase to the cost basis of securities purchased and/or a reduction of proceeds on a sale of securities. Such transaction costs are included in the determination of net realized gain (loss) from investment securities reported in the Statement of Operations and the Statement of Changes in Net Assets and the net realized gains (losses) on securities per share in the Financial Highlights. Transaction costs are included in the calculation of the Fund's net asset value and, accordingly, they reduce the Fund's total returns. These transaction costs are not considered operating expenses and are not reflected in net investment income reported in the Statement of Operations and the Statement of Changes in Net Assets, or the net investment income per share and the ratios of expenses and net investment income reported in the Financial Highlights, nor are they limited by any expense limitation arrangements between the Fund and the investment adviser.
The Fund allocates realized capital gains and losses to a class based on the relative net assets of each class. The Fund allocates income to a class based on the relative value of the settled shares of each class.
C.Country Determination - For the purposes of making investment selection decisions and presentation in the Schedule of Investments, the investment adviser may determine the country in which an issuer is located and/or credit risk exposure based on various factors. These factors include the laws of the country under which the issuer is organized, where the issuer maintains a principal office, the country in which the issuer derives 50% or more of its total revenues and the country that has the primary market for the issuer's securities, as well as other criteria. Among the other criteria that may be evaluated for making this determination are the country in which the issuer maintains 50% or more of its assets, the type of security, financial guarantees and enhancements, the nature of the collateral and the sponsor organization. Country of issuer and/or credit risk exposure has been determined to be the United States of America, unless otherwise noted.
D.Distributions - Distributions from net investment income are declared daily and paid monthly. Distributions from net realized capital gain, if any, are generally declared and paid annually and recorded on the ex-dividend date.
E.Federal Income Taxes - The Fund intends to comply with the requirements of Subchapter M of the Internal Revenue Code of 1986, as amended (the "Internal Revenue Code"), necessary to qualify as a regulated investment company and to distribute substantially all of the Fund's taxable earnings to shareholders. As such, the Fund will not be subject to federal income taxes on otherwise taxable income (including net realized capital gain) that is distributed to shareholders. Therefore, no provision for federal income taxes is recorded in the financial statements.
The Fund recognizes the tax benefits of uncertain tax positions only when the position is more likely than not to be sustained. Management has analyzed the Fund's uncertain tax positions and concluded that no liability for unrecognized tax benefits should be recorded related to uncertain tax positions. Management is not aware of any tax positions for which it is reasonably possible that the total amounts of unrecognized tax benefits will change materially in the next 12 months.
The Fund files tax returns in the U.S. Federal jurisdiction and certain other jurisdictions. Generally, the Fund is subject to examinations by such taxing authorities for up to three years after the filing of the return for the tax period.
F.Expenses — Fees provided for under the Rule 12b-1 plan of a particular class of the Fund are charged to the operations of such class. Transfer agency fees and expenses and other shareholder recordkeeping fees and expenses attributable to Class R6 are charged to such class. Transfer agency fees and expenses and other shareholder recordkeeping fees and expenses relating to all other classes are allocated among those classes based on relative net assets. All other expenses are allocated among the classes based on relative net assets.
G.Accounting Estimates — The preparation of financial statements in conformity with accounting principles generally accepted in the United States of America ("GAAP") requires management to make estimates and assumptions that affect the reported amounts of assets and liabilities at the date of the financial statements and the reported amounts of revenues and expenses during the reporting period including estimates and assumptions related to taxation. Actual results could differ from those estimates by a significant amount. In addition, the Fund monitors for material events or transactions that may occur or become known after the period-end date and before the date the financial statements are released to print.
H.Indemnifications - Under the Trust's organizational documents, each Trustee, officer, employee or other agent of the Trust is indemnified against certain
14 | Invesco Government Money Market Fund |
liabilities that may arise out of the performance of their duties to the Fund. Additionally, in the normal course of business, the Fund enters into contracts, including the Fund's servicing agreements, that contain a variety of indemnification clauses. The Fund's maximum exposure under these arrangements is unknown as this would involve future claims that may be made against the Fund that have not yet occurred. The risk of material loss as a result of such indemnification claims is considered remote.
I.Repurchase Agreements - The Fund may enter into repurchase agreements. Collateral on repurchase agreements, including the Fund's pro-rata interest in joint repurchase agreements, is taken into possession by the Fund upon entering into the repurchase agreement. Collateral consisting of U.S. Government Securities and U.S. Government Sponsored Agency Securities is marked to market daily to ensure its market value is at least 102% of the sales price of the repurchase agreement. The investments in some repurchase agreements, pursuant to procedures approved by the Board of Trustees, are through participation with other mutual funds, private accounts and certain non-registered investment companies managed by the investment adviser or its affiliates ("Joint repurchase agreements"). The principal amount of the repurchase agreement is equal to the value at period-end. If the seller of a repurchase agreement fails to repurchase the security in accordance with the terms of the agreement, the Fund might incur expenses in enforcing its rights, and could experience losses, including a decline in the value of the collateral and loss of income.
J.Other Risks - Investments in obligations issued by agencies and instrumentalities of the U.S. Government may vary in the level of support they receive from the government. The government may choose not to provide financial support to government sponsored agencies or instrumentalities if it is not legally obligated to do so. In this case, if the issuer defaulted, the Fund may not be able to recover its investment in such issuer from the U.S. Government.
NOTE 2—Advisory Fees and Other Fees Paid to Affiliates
The Trust has entered into a master investment advisory agreement with Invesco Advisers, Inc. (the "Adviser" or "Invesco"). Under the terms of the investment advisory agreement, the Fund accrues daily and pays monthly an advisory fee to the Adviser based on the annual rate of 0.15% of the Fund's average daily net assets.
Under the terms of a master sub-advisory agreement between the Adviser and each of Invesco Asset Management Deutschland GmbH, Invesco Asset Management Limited, Invesco Asset Management (Japan) Limited, Invesco Hong Kong Limited, Invesco Senior Secured Management, Inc. and Invesco Canada Ltd. (collectively, the "Affiliated Sub-Advisers") the Adviser, not the Fund, will pay 40% of the fees paid to the Adviser to any such Affiliated Sub-Adviser(s) that provide(s) discretionary investment management services to the Fund based on the percentage of assets allocated to such Affiliated Sub-Adviser(s).
The Trust has entered into a master administrative services agreement with Invesco pursuant to which the Fund has agreed to pay Invesco for certain administrative costs incurred in providing accounting services to the Fund. For the year ended February 29, 2020, expenses incurred under the agreement are shown in the Statement of Operations as Administrative services fees. Also, Invesco has entered into a sub-administration agreement whereby The Bank of New York Mellon ("BNY Mellon") serves as custodian and fund accountant and provides certain administrative services to the Fund.
The Trust has entered into a transfer agency and service agreement with Invesco Investment Services, Inc. ("IIS") pursuant to which the Fund has agreed to pay IIS a fee for providing transfer agency and shareholder services to the Fund and reimburse IIS for certain expenses incurred by IIS in the course of providing such services. IIS may make payments to intermediaries that provide omnibus account services, sub-accounting services and/or networking services. All fees payable by IIS to intermediaries that provide omnibus account services or sub-accounting services are charged back to the Fund, subject to certain limitations approved by the Trust's Board of Trustees. For the year ended February 29, 2020, expenses incurred under the agreement are shown in the Statement of Operations as Transfer agent fees.
The Trust has entered into master distribution agreements with IDI to serve as the distributor for the Invesco Cash Reserve Shares, Class AX, Class C, Class CX, Class R, Class Y, Investor Class and Class R6 shares of the Fund. The Trust has adopted plans pursuant to Rule 12b-1 under the 1940 Act with respect to the Fund's Invesco Cash Reserve Shares, Class AX, Class C, Class CX and Class R shares (collectively, the "Plans"). The Fund, pursuant to the Plans, pays IDI compensation at the annual rate of 0.15% of the Fund's average daily net assets of Invesco Cash Reserve Shares and Class AX shares, 0.90% of the average daily net assets of Class C and Class CX shares and 0.40% of the average daily net assets of Class R shares. The fees are accrued daily and paid monthly. Of the Plan payments, up to 0.25% of the average daily net assets of each class of shares may be paid to furnish continuing personal shareholder services to customers who purchase and own shares of such classes. Any amounts not paid as a service fee under the Plans would constitute an asset-based sales charge. Rules of the Financial Industry Regulatory Authority ("FINRA") impose a cap on the total sales charges, including asset-based sales charges, that may be paid by any class of shares of the Fund. For the year ended February 29, 2020, expenses incurred under the plans are shown in the Statement of Operations as Distribution fees.
CDSC are not recorded as expenses of the Fund. CDSC are deducted from redemption proceeds prior to remittance to the shareholder. During the year ended February 29, 2020, IDI advised the Fund that IDI retained $3,327, $10,933 and $17 from Invesco Cash Reserve Shares, Class C, and Class CX shares, respectively, for CDSC imposed on redemptions by shareholders.
Certain officers and trustees of the Trust are officers and directors of the Adviser, IIS and/or IDI.
NOTE 3—Additional Valuation Information
GAAP defines fair value as the price that would be received to sell an asset or paid to transfer a liability in an orderly transaction between market participants at the measurement date, under current market conditions. GAAP establishes a hierarchy that prioritizes the inputs to valuation methods, giving the highest priority to readily available unadjusted quoted prices in an active market for identical assets (Level 1) and the lowest priority to significant unobservable inputs (Level 3), generally when market prices are not readily available or are unreliable. Based on the valuation inputs, the securities or other investments are tiered into one of three levels. Changes in valuation methods may result in transfers in or out of an investment's assigned level:
Level 1 — Prices are determined using quoted prices in an active market for identical assets.
Level 2 — Prices are determined using other significant observable inputs. Observable inputs are inputs that other market participants may use in pricing a security. These may include quoted prices for similar securities, interest rates, prepayment speeds, credit risk, yield curves, loss severities, default rates, discount rates, volatilities and others.
Level 3 — Prices are determined using significant unobservable inputs. In situations where quoted prices or observable inputs are unavailable (for example, when there is little or no market activity for an investment at the end of the period), unobservable inputs may be used. Unobservable inputs reflect the Fund's own assumptions about the factors market participants would use in determining fair value of the securities or instruments and would be based on the best available information.
As of February 29, 2020, all of the securities in this Fund were valued based on Level 2 inputs (see the Schedule of Investments for security categories). The level assigned to the securities valuations may not be an indication of the risk or liquidity associated with investing in those securities. Because of the inherent uncertainties of valuation, the values reflected in the financial statements may materially differ from the value received upon actual sale of those investments.
NOTE 4—Expense Offset Arrangement(s)
The expense offset arrangement is comprised of transfer agency credits which result from balances in demand deposit accounts used by the transfer agent for clearing shareholder transactions. For the year ended February 29, 2020, the Fund received credits from this arrangement, which resulted in the reduction of the Fund's total expenses of $30,425.
15 | Invesco Government Money Market Fund |

NOTE 5—Trustees' and Officers' Fees and Benefits
Trustees' and Officers' Fees and Benefits include amounts accrued by the Fund to pay remuneration to certain Trustees and Officers of the Fund. Trustees have the option to defer compensation payable by the Fund, and Trustees' and Officers' Fees and Benefits also include amounts accrued by the Fund to fund such deferred compensation amounts. Those Trustees who defer compensation have the option to select various Invesco Funds in which their deferral accounts shall be deemed to be invested. Finally, certain current Trustees were eligible to participate in a retirement plan that provided for benefits to be paid upon retirement to Trustees over a period of time based on the number of years of service. The Fund may have certain former Trustees who also participate in a retirement plan and receive benefits under such plan. Trustees' and Officers' Fees and Benefits include amounts accrued by the Fund to fund such retirement benefits. Obligations under the deferred compensation and retirement plans represent unsecured claims against the general assets of the Fund.
NOTE 6—Cash Balances
The Fund is permitted to temporarily carry a negative or overdrawn balance in its account with BNY Mellon, the custodian bank. Such balances, if any at period-end, are shown in the Statement of Assets and Liabilities under the payable caption Amount due custodian. To compensate the custodian bank for such overdrafts, the overdrawn Fund may either (1) leave funds as a compensating balance in the account so the custodian bank can be compensated by earning the additional interest; or
(2) compensate by paying the custodian bank at a rate agreed upon by the custodian bank and Invesco, not to exceed the contractually agreed upon rate.
NOTE 7—Distributions to Shareholders and Tax Components of Net Assets
Tax Character of Distributions to Shareholders Paid During the Years Ended February 29, 2020 and February 28, 2019:
| | 2020 | | 2019 | | |
Ordinary income | $34,947,418 | | $19,320,440 | |
Tax Components of Net Assets at Period-End: | | | | | |
| | | | 2020 | | |
Undistributed ordinary income | | $ | 524,928 | |
| | | | |
Temporary book/tax differences | | | (234,577) |
| | | | |
Capital loss carryforward | | | (42,467) |
Shares of beneficial interest | | | 2,712,360,175 | |
| | | |
Total net assets | | $2,712,608,059 | |
The temporary book/tax differences are a result of timing differences between book and tax recognition of income and/or expenses. The Fund's temporary book/tax differences are the result of the trustee deferral of compensation and retirement plan benefits.
Capital loss carryforward is calculated and reported as of a specific date. Results of transactions and other activity after that date may affect the amount of capital loss carryforward actually available for the Funds to utilize. The ability to utilize capital loss carryforward in the future may be limited under the Internal Revenue Code and related regulations based on the results of future transactions.
The Fund has a capital loss carryforward as of February 29, 2020 as follows:
Capital Loss Carryforward
Expiration | Short-Term | Long-Term | Total |
Not subject to expiration | $22,196 | $20,271 | $42,467 |
| | | |
*Capital loss carryforward is reduced for limitations, if any, to the extent required by the Internal Revenue Code and may be further limited depending upon a variety of factors, including the realization of net unrealized gains or losses as of the date of any reorganization.
NOTE 8—Share Information
| | Summary of Share Activity | |
| Year ended February 29, 2020(a) | | Year ended February 28, 2019 |
| Shares | Amount | Shares | Amount |
Sold: | | | | | |
Invesco Cash Reserve Shares | 3,219,840,068 | $ 3,219,840,068 | 1,625,821,651 | $ 1,625,821,651 |
Class AX | 9,084,309 | 9,084,309 | 11,117,507 | 11,117,507 |
Class C | 62,381,745 | 62,381,745 | 53,294,381 | 53,294,381 |
Class CX | 88,034 | 88,034 | 74,248 | 74,248 |
Class R | 26,996,158 | 26,996,158 | 10,236,938 | 10,236,938 |
Class Y | 52,296,157 | 52,296,157 | 40,526,564 | 40,526,564 |
Investor Class | 35,406,235 | 35,406,235 | 50,488,673 | 50,488,673 |
Class R6 | 78,922 | 78,922 | 2,981 | 2,981 |
16 | Invesco Government Money Market Fund |
| | | Summary of Share Activity | | | |
| Year ended February 29, 2020(a) | | Year ended February 28, 2019 | |
| Shares | | Amount | Shares | | Amount |
Issued as reinvestment of dividends: | | | | | | | | |
Invesco Cash Reserve Shares | 27,747,430 | $ | 27,747,430 | 14,729,147 | $ | 14,729,147 | |
Class AX | 1,223,418 | | 1,223,418 | 1,281,740 | | 1,281,740 | |
Class C | 330,434 | | 330,434 | 458,067 | | 458,067 | |
Class CX | 4,961 | | 4,961 | 25,507 | | 25,507 | |
Class R | 402,873 | | 402,873 | 328,797 | | 328,797 | |
Class Y | 568,606 | | 568,606 | 524,759 | | 524,759 | |
Investor Class | 1,979,601 | | 1,979,601 | 1,971,836 | | 1,971,836 | |
Class R6 | 152 | | 152 | 4 | | 4 | |
Automatic Conversion of Class C and CX shares to | | | | | | | | |
Invesco Cash Reserve Shares: | | | | | | | | |
Invesco Cash Reserve Shares | 2,691,606 | | 2,691,606 | - | | - | |
Class C | (2,504,019) | | (2,504,019) | - | | - | |
Class CX | (187,587) | | (187,587) | - | | - | |
Reacquired: | | | | | | | | |
Invesco Cash Reserve Shares | (2,143,441,301) | | (2,143,441,301) | (1,156,764,690) | | (1,156,764,690) |
| | | | | | | |
Class AX | (15,249,109) | | (15,249,109) | (23,195,572) | | (23,195,572) |
| | | | | | | |
Class C | (55,430,232) | | (55,430,232) | (80,463,607) | | (80,463,607) |
| | | | | | | |
Class CX | (67,960) | | (67,960) | (3,544,618) | | (3,544,618) |
| | | | | | | |
Class R | (20,973,964) | | (20,973,964) | (12,081,364) | | (12,081,364) |
| | | | | | | |
Class Y | (44,283,533) | | (44,283,533) | (37,026,370) | | (37,026,370) |
| | | | | | | |
Investor Class | (52,065,220) | | (52,065,220) | (44,204,553) | | (44,204,553) |
| | | | | | | |
Class R6 | (71,048) | | (71,048) | (796) | | (796) |
Net increase in share activity | 1,106,846,736 | $ | 1,106,846,736 | 453,601,230 | $ | 453,601,230 | |
(a)There are entities that are record owners of more than 5% of the outstanding shares of the Fund and in the aggregate own 58% of the outstanding shares of the Fund. IDI has an agreement with these entities to sell Fund shares. The Fund, Invesco and/or Invesco affiliates may make payments to these entities, which are considered to be related to the Fund, for providing services to the Fund, Invesco and/or Invesco affiliates including but not limited to services such as securities brokerage, distribution, third party record keeping and account servicing. The Fund has no knowledge as to whether all or any portion of the shares owned of record by these entities are also owned beneficially.
NOTE 9—Significant Event
The Board of Trustees of the Fund unanimously approved an Agreement and Plan of Reorganization (the "Agreement") pursuant to which the Fund would acquire all of the assets and liabilities of Invesco Oppenheimer Government Cash Reserves Fund (the "Target Fund") in exchange for shares of the Fund.
The reorganization is expected to be consummated on or around May 15, 2020. Upon closing of the reorganization, shareholders of the Target Fund will receive shares of the Fund in exchange for their shares of the Target Fund, and the Target Fund will liquidate and cease operations.
NOTE 10—Subsequent Event
During the first quarter of 2020, the World Health Organization declared the coronavirus (COVID-19) to be a public health emergency. COVID-19 has led to increased short-term market volatility and may have adverse long-term effects on U.S. and world economies and markets in general. COVID-19 may adversely impact the Fund's ability to achieve its investment objective. Because of the uncertainties on valuation, the global economy and business operations, values reflected in these financial statements may materially differ from the value received upon actual sales of those investments.
The Coronavirus Aid, Relief, and Economic Security Act, commonly referred to as the "CARES Act," was signed into law on March 27, 2020 by President Trump. The Adviser is assessing the components of the Act, and the impacts to the Fund should be immaterial.
17 | Invesco Government Money Market Fund |
Report of Independent Registered Public Accounting Firm
To the Board of Trustees of AIM Investment Securities Funds (Invesco Investment Securities Funds) and Shareholders of Invesco Government Money Market Fund
Opinion on the Financial Statements
We have audited the accompanying statement of assets and liabilities, including the schedule of investments, of Invesco Government Money Market Fund (one of the funds constituting AIM Investment Securities Funds (Invesco Investment Securities Funds), hereafter referred to as the "Fund") as of February 29, 2020, the related statement of operations for the year ended February 29, 2020, the statement of changes in net assets for each of the two years in the period ended February 29, 2020, including the related notes, and the financial highlights for each of the periods indicated therein (collectively referred to as the financial statements). In our opinion, the financial statements present fairly, in all material respects, the financial position of the Fund as of February 29, 2020, the results of its operations for the year then ended, the changes in its net assets for each of the two years in the period ended February 29, 2020 and the financial highlights financial highlights for each of the periods indicated therein in conformity with accounting principles generally accepted in the United States of America.
Basis for Opinion
These financial statements are the responsibility of the Fund's management. Our responsibility is to express an opinion on the Fund's financial statements based on our audits. We are a public accounting firm registered with the Public Company Accounting Oversight Board (United States) (PCAOB) and are required to be independent with respect to the Fund in accordance with the U.S. federal securities laws and the applicable rules and regulations of the Securities and Exchange Commission and the
PCAOB.
We conducted our audits of these financial statements in accordance with the standards of the PCAOB. Those standards require that we plan and perform the audit to obtain reasonable assurance about whether the financial statements are free of material misstatement, whether due to error or fraud.
Our audits included performing procedures to assess the risks of material misstatement of the financial statements, whether due to error or fraud, and performing procedures that respond to those risks. Such procedures included examining, on a test basis, evidence regarding the amounts and disclosures in the financial statements. Our audits also included evaluating the accounting principles used and significant estimates made by management, as well as evaluating the overall presentation of the financial statements. Our procedures included confirmation of securities owned as of February 29, 2020 by correspondence with the custodian and brokers; when replies were not received from brokers, we performed other auditing procedures. We believe that our audits provide a reasonable basis for our opinion.
/s/PricewaterhouseCoopers LLP
Houston, TX
April 28, 2020
We have served as the auditor of one or more of the investment companies in the Invesco group of investment companies since at least 1995. We have not been able to determine the specific year we began serving as auditor.
18 | Invesco Government Money Market Fund |
Calculating your ongoing Fund expenses
Example
As a shareholder of the Fund, you incur two types of costs: (1) transaction costs, which may include sales charges (loads) on purchase payments or contingent deferred sales charges on redemptions, if any; and (2) ongoing costs, including management fees, distribution and/or service (12b-1) fees, and other Fund expenses. This example is intended to help you understand your ongoing costs (in dollars) of investing in the Fund and to compare these costs with ongoing costs of investing in other mutual funds. The example is based on an investment of $1,000 invested at the beginning of the period and held for the entire period September 1, 2019 through February 29, 2020.
Actual expenses
The table below provides information about actual account values and actual expenses. You may use the information in this table, together with the amount you invested, to estimate the expenses that you paid over the period. Simply divide your account value by $1,000 (for example, an $8,600 account value divided by $1,000 = 8.6), then multiply the result by the number in the table under the heading entitled "Actual Expenses Paid During Period" to estimate the expenses you paid on your account during this period.
Hypothetical example for comparison purposes
The table below also provides information about hypothetical account values and hypothetical expenses based on the Fund's actual expense ratio and an assumed rate of return of 5% per year before expenses, which is not the Fund's actual return.
The hypothetical account values and expenses may not be used to estimate the actual ending account balance or expenses you paid for the period. You may use this information to compare the ongoing costs of investing in the Fund and other funds. To do so, compare this 5% hypothetical example with the 5% hypothetical examples that appear in the shareholder reports of the other funds.
Please note that the expenses shown in the table are meant to highlight your ongoing costs only and do not reflect any transaction costs, such as sales charges (loads) on purchase payments or contingent deferred sales charges on redemptions, if any. Therefore, the hypothetical information is useful in comparing ongoing costs only, and will not help you determine the relative total costs of owning different funds. In addition, if these transaction costs were included, your costs would have been higher.
| | | | | HYPOTHETICAL | |
| | | ACTUAL | (5% annual return before expenses) | |
| | | | | | | |
| Beginning | Ending | | Expenses | Ending | Expenses | Annualized |
| Account Value | Account Value | | Paid During | Account Value | Paid During | Expense |
Class | (09/01/19) | (02/29/20)1 | | Period2 | (02/29/20) | Period2 | Ratio |
Invesco Cash Reserve | $1,000.00 | $1,006.50 | | $2.39 | $1,022.48 | $2.41 | 0.48% |
Shares | | | | | | | |
AX | 1,000.00 | 1,006.50 | | 2.39 | 1,022.48 | 2.41 | 0.48 |
| | | | | | | |
C | 1,000.00 | 1,002.80 | | 6.12 | 1,018.75 | 6.17 | 1.23 |
| | | | | | | |
CX | 1,000.00 | 1,002.80 | | 6.12 | 1,018.75 | 6.17 | 1.23 |
| | | | | | | |
R | 1,000.00 | 1,005.30 | | 3.64 | 1,021.23 | 3.67 | 0.73 |
| | | | | | | |
Y | 1,000.00 | 1,007.30 | | 1.65 | 1,023.22 | 1.66 | 0.33 |
| | | | | | | |
Investor | 1,000.00 | 1,007.30 | | 1.65 | 1,023.22 | 1.66 | 0.33 |
| | | | | | | |
R6 | 1,000.00 | 1,007.40 | | 1.55 | 1,023.32 | 1.56 | 0.31 |
| | | | | | | |
1The actual ending account value is based on the actual total return of the Fund for the period September 1, 2019 through February 29, 2020, after actual expenses and will differ from the hypothetical ending account value which is based on the Fund's expense ratio and a hypothetical annual return of 5% before expenses.
2Expenses are equal to the Fund's annualized expense ratio as indicated above multiplied by the average account value over the period, multiplied by 182/366 to reflect the most recent fiscal half year.
19 | Invesco Government Money Market Fund |
Tax Information
Form 1099-DIV, Form 1042-S and other year-end tax information provide shareholders with actual calendar year amounts that should be included in their tax returns. Shareholders should consult their tax advisors.
The following distribution information is being provided as required by the Internal Revenue Code or to meet a specific state's requirement.
The Fund designates the following amounts or, if subsequently determined to be different, the maximum amount allowable for its fiscal year ended February 29, 2020:
Federal and State Income Tax
Qualified Dividend Income* | 0.00% |
Corporate Dividends Received Deduction* | 0.00% |
U.S. Treasury Obligations* | 21.07% |
* The above percentages are based on ordinary income dividends paid to shareholders during the Fund's fiscal year.
20 | Invesco Government Money Market Fund |
Trustees and Officers
The address of each trustee and officer is AIM Investment Securities Funds (Invesco Investment Securities Funds) (the "Trust"), 11 Greenway Plaza, Suite 1000, Houston, Texas 77046-1173. The trustees serve for the life of the Trust, subject to their earlier death, incapacitation, resignation, retirement or removal as more specifically provided in the Trust's organizational documents. Each officer serves for a one year term or until their successors are elected and qualified. Column two below includes length of time served with predecessor entities, if any.
| Trustee | | Number of | Other |
Name, Year of Birth and | | Funds in | Directorship(s) |
and/or | | Fund Complex | Held by Trustee |
Position(s) | Officer | Principal Occupation(s) | Overseen by | During Past 5 |
Held with the Trust | Since | During Past 5 Years | Trustee | Years |
Interested Trustee | | | | |
Martin L. Flanagan1 — 1960 | 2007 | Executive Director, Chief Executive Officer and President, Invesco Ltd. | 229 | None |
Trustee and Vice Chair | | (ultimate parent of Invesco and a global investment management firm); | | |
| | Trustee and Vice Chair, The Invesco Funds; Vice Chair, Investment Company | | |
| | Institute; and Member of Executive Board, SMU Cox School of Business | | |
| | Formerly: Advisor to the Board, Invesco Advisers, Inc. (formerly known as | | |
| | Invesco Institutional (N.A.), Inc.); Chairman and Chief Executive Officer, | | |
| | Invesco Advisers, Inc. (registered investment adviser); Director, Chairman, | | |
| | Chief Executive Officer and President, Invesco Holding Company (US), Inc. | | |
| | (formerly IVZ Inc.) (holding company), Invesco Group Services, Inc. (service | | |
| | provider) and Invesco North American Holdings, Inc. (holding company); | | |
| | Director, Chief Executive Officer and President, Invesco Holding Company | | |
| | Limited (parent of Invesco and a global investment management firm); | | |
| | Director, Invesco Ltd.; Chairman, Investment Company Institute and President, | | |
| | Co-Chief Executive Officer, Co-President, Chief Operating Officer and Chief | | |
| | Financial Officer, Franklin Resources, Inc. (global investment management | | |
| | organization) | | |
1Mr. Flanagan is considered an interested person (within the meaning of Section 2(a)(19) of the 1940 Act) of the Trust because he is an officer of the Adviser to the Trust, and an officer and a director of Invesco Ltd., ultimate parent of the Adviser.
T-1 | Invesco Government Money Market Fund |
Trustees and Officers—(continued)
| | | Number of | |
| | | Funds | Other |
| Trustee | | in | Directorship(s) |
Name, Year of Birth and | and/or | | Fund Complex | Held by Trustee |
Position(s) | Officer | Principal Occupation(s) | Overseen by | During Past 5 |
Held with the Trust | Since | During Past 5 Years | Trustee | Years |
Independent Trustees | | | | |
Bruce L. Crockett – 1944 | 1992 | Chairman, Crockett Technologies Associates (technology consulting company) | 229 | Director and |
Trustee and Chair | | Formerly: Director, Captaris (unified messaging provider); Director, President | | Chairman of the |
| | | Audit Committee, |
| | and Chief Executive Officer, COMSAT Corporation; Chairman, Board of | |
| | | ALPS (Attorneys |
| | Governors of INTELSAT (international communications company); ACE Limited | |
| | | Liability |
| | (insurance company); Independent Directors Council and Investment Company | |
| | | Protection |
| | Institute: Member of the Audit Committee, Investment Company Institute; | |
| | | Society) |
| | Member of the Executive Committee and Chair of the Governance Committee, | |
| | | (insurance |
| | Independent Directors Council | |
| | | company); |
| | | |
| | | | Director and |
| | | | Member of the |
| | | | Audit Committee |
| | | | and |
| | | | Compensation |
| | | | Committee, |
| | | | Ferroglobe PLC |
| | | | (metallurgical |
| | | | company) |
David C. Arch – 1945 | 2010 | Chairman of Blistex Inc. (consumer health care products manufacturer); | 229 | Board member of |
Trustee | | Member, World Presidents' Organization | | the Illinois |
| | | | Manufacturers' |
| | | | Association |
Beth Ann Brown – 1968 | 2019 | Independent Consultant | 229 | Director, Board of |
Trustee | | Formerly: Head of Intermediary Distribution, Managing Director, Strategic | | Directors of |
| | | Caron |
| | Relations, Managing Director, Head of National Accounts, Senior Vice | |
| | | Engineering Inc.; |
| | President, National Account Manager and Senior Vice President, Key Account | |
| | | Advisor, Board of |
| | Manager, Columbia Management Investment Advisers LLC; Vice President, Key | |
| | | Advisors of Caron |
| | Account Manager, Liberty Funds Distributor, Inc.; and Trustee of certain | |
| | | Engineering Inc.; |
| | Oppenheimer Funds | |
| | | President and |
| | | |
| | | | Director, Acton |
| | | | Shapleigh Youth |
| | | | Conservation |
| | | | Corps (non - |
| | | | profit); and Vice |
| | | | President and |
| | | | Director of |
| | | | Grahamtastic |
| | | | Connection (non- |
| | | | profit) |
Jack M. Fields – 1952 | 1997 | Chief Executive Officer, Twenty First Century Group, Inc. (government affairs | 229 | Member, Board of Directors of |
Trustee | | company); and Chairman, Discovery Learning Alliance (non-profit) | | Baylor College of Medicine |
| | Formerly: Owner and Chief Executive Officer, Dos Angeles Ranch L.P. (cattle, | | |
| | hunting, corporate entertainment); Director, Insperity, Inc. (formerly known as | | |
| | Administaff) (human resources provider); Chief Executive Officer, Texana | | |
| | Timber LP (sustainable forestry company); Director of Cross Timbers Quail | | |
| | Research Ranch (non-profit); and member of the U.S. House of Representatives | | |
| | | | |
T-2 | Invesco Government Money Market Fund |

Trustees and Officers—(continued)
| | | Number of | |
| | | Funds | Other |
| Trustee | | in | Directorship(s) |
Name, Year of Birth and | and/or | | Fund Complex | Held by Trustee |
Position(s) | Officer | Principal Occupation(s) | Overseen by | During Past 5 |
Held with the Trust | Since | During Past 5 Years | Trustee | Years |
Independent Trustees—(continued) | | | |
Cynthia Hostetler —1962 | 2017 | Non-Executive Director and Trustee of a number of public and private business | 229 | Vulcan Materials |
Trustee | | corporations | | Company |
| | Formerly: Director, Aberdeen Investment Funds (4 portfolios); Head of | | (construction |
| | | materials |
| | Investment Funds and Private Equity, Overseas Private Investment | |
| | | company); Trilinc |
| | Corporation; President, First Manhattan Bancorporation, Inc.; Attorney, | |
| | | Global Impact |
| | Simpson Thacher & Bartlett LLP | |
| | | Fund; Genesee & |
| | | |
| | | | Wyoming, Inc. |
| | | | (railroads); Artio |
| | | | Global Investment |
| | | | LLC (mutual fund |
| | | | complex); Edgen |
| | | | Group, Inc. |
| | | | (specialized |
| | | | energy and |
| | | | infrastructure |
| | | | products |
| | | | distributor); |
| | | | Investment |
| | | | Company Institute |
| | | | (professional |
| | | | organization); |
| | | | Independent |
| | | | Directors Council |
| | | | (professional |
| | | | organization) |
Eli Jones – 1961 | 2016 | Professor and Dean, Mays Business School - Texas A&M University | 229 | Insperity, Inc. |
Trustee | | Formerly: Professor and Dean, Walton College of Business, University of | | (formerly known |
| | | as Administaff) |
| | Arkansas and E.J. Ourso College of Business, Louisiana State University; | |
| | | (human resources |
| | Director, Arvest Bank | |
| | | provider) |
| | | |
Elizabeth Krentzman – 1959 | 2019 | Formerly: Principal and Chief Regulatory Advisor for Asset Management | 229 | Trustee of the |
Trustee | | Services and U.S. Mutual Fund Leader of Deloitte & Touche LLP; General | | University of |
| | Counsel of the Investment Company Institute (trade association); National | | Florida National |
| | Director of the Investment Management Regulatory Consulting Practice, | | Board Foundation |
| | Principal, Director and Senior Manager of Deloitte & Touche LLP; Assistant | | and Audit |
| | Director of the Division of Investment Management - Office of Disclosure and | | Committee |
| | Investment Adviser Regulation of the U.S. Securities and Exchange | | Member; Member |
| | Commission and various positions with the Division of Investment Management | | of the Cartica |
| | – Office of Regulatory Policy of the U.S. Securities and Exchange Commission; | | Funds Board of |
| | Associate at Ropes & Gray LLP; Advisory Board Member of the Securities and | | Directors (private |
| | Exchange Commission Historical Society; and Trustee of certain Oppenheimer | | investment |
| | Funds | | funds); Member |
| | | | of the University |
| | | | of Florida Law |
| | | | Center |
| | | | Association, Inc. |
| | | | Board of Trustees |
| | | | and Audit |
| | | | Committee |
| | | | Member |
Anthony J. LaCava, Jr. – 1956 | 2019 | Formerly: Director and Member of the Audit Committee, Blue Hills Bank | 229 | Blue Hills Bank; |
Trustee | | (publicly traded financial institution) and Managing Partner, KPMG LLP | | Chairman, |
| | | | Bentley |
| | | | University; |
| | | | Member, |
| | | | Business School |
| | | | Advisory Council; |
| | | | and Nominating |
| | | | Committee |
| | | | KPMG LLP |
Prema Mathai-Davis – 1950 | 1998 | Retired | 229 | None |
Trustee | | Co-Owner & Partner of Quantalytics Research, LLC, (a FinTech Investment | | |
| | | |
Research Platform for the Self-Directed Investor)
T-3 | Invesco Government Money Market Fund |

Trustees and Officers—(continued)
| | | Number of | |
| | | Funds | Other |
| Trustee | | in | Directorship(s) |
Name, Year of Birth and | and/or | | Fund Complex | Held by Trustee |
Position(s) | Officer | Principal Occupation(s) | Overseen by | During Past 5 |
Held with the Trust | Since | During Past 5 Years | Trustee | Years |
Independent Trustees—(continued) | | | |
Joel W. Motley – 1952 | 2019 | Director of Office of Finance, Federal Home Loan Bank System; Member of the | 229 | Member of Board |
Trustee | | Vestry of Trinity Wall Street; Managing Director of Carmona Motley Inc. | | of Greenwall |
| | (privately held financial advisor); Member of the Council on Foreign Relations | | Foundation |
| | and its Finance and Budget Committee; Chairman Emeritus of Board of Human | | (bioethics research |
| | Rights Watch and Member of its Investment Committee; and Member of | | foundation) and |
| | Investment Committee and Board of Historic Hudson Valley (non-profit cultural | | its Investment |
| | organization) | | Committee; |
| | Formerly: Managing Director of Public Capital Advisors, LLC (privately held | | Member of Board of |
| | | Friends of the LRC |
| | financial advisor); Managing Director of Carmona Motley Hoffman, Inc. | |
| | | (non-profit |
| | (privately held financial advisor); Trustee of certain Oppenheimer Funds; and | |
| | | legal advocacy); |
| | Director of Columbia Equity Financial Corp. (privately held financial advisor) | |
| | | Board Member |
| | | |
| | | | and Investment |
| | | | Committee |
| | | | Member of |
| | | | Pulizer Center for |
| | | | Crisis Reporting |
| | | | (non-profit |
| | | | journalism) |
Teresa M. Ressel — 1962 | 2017 | Non-executive director and trustee of a number of public and private business | 229 | Atlantic Power |
Trustee | | corporations | | Corporation |
| | Formerly: Chief Financial Officer, Olayan America, The Olayan Group | | (power generation |
| | | company); ON |
| | (international investor/commercial/industrial); Chief Executive Officer, UBS | |
| | | Semiconductor |
| | Securities LLC; Group Chief Operating Officer, Americas, UBS AG; Assistant | |
| | | Corp. |
| | Secretary for Management & Budget and CFO, US Department of the Treasury | |
| | | (semiconductor |
| | | |
| | | | supplier) |
| | | | |
Ann Barnett Stern – 1957 | 2017 | President and Chief Executive Officer, Houston Endowment Inc. (private | 229 | Federal Reserve |
Trustee | | philanthropic institution) | | Bank of Dallas |
| | Formerly: Executive Vice President and General Counsel, Texas Children's | | |
| | Hospital; Attorney, Beck, Redden and Secrest, LLP; Business Law Instructor, | | |
| | University of St. Thomas; Attorney, Andrews & Kurth LLP | | |
Robert C. Troccoli – 1949 | 2016 | Retired | 229 | None |
Trustee | | Formerly: Adjunct Professor, University of Denver – Daniels College of | | |
| | | |
| | Business; Senior Partner, KPMG LLP | | |
| | | | |
Daniel S. Vandivort –1954 | 2019 | Treasurer, Chairman of the Audit and Finance Committee, and Trustee, Board | 229 | Chairman and |
Trustee | | of Trustees, Huntington Disease Foundation of America; and President, Flyway | | Lead Independent |
| | Advisory Services LLC (consulting and property management) | | Director, |
| | Formerly: Trustee and Governance Chair, of certain Oppenheimer Funds | | Chairman of the |
| | | Audit Committee, |
| | | |
| | | | and Director, |
| | | | Board of |
| | | | Directors, Value |
| | | | Line Funds |
James D. Vaughn – 1945 | 2019 | Retired | 229 | Board member |
Trustee | | Formerly: Managing Partner, Deloitte & Touche LLP; Trustee and Chairman of | | and Chairman of |
| | | Audit Committee |
| | the Audit Committee, Schroder Funds; Board Member, Mile High United Way, | |
| | | of AMG National |
| | Boys and Girls Clubs, Boy Scouts, Colorado Business Committee for the Arts, | |
| | | Trust Bank; |
| | Economic Club of Colorado and Metro Denver Network (economic development | |
| | | Trustee and |
| | corporation); and Trustee of certain Oppenheimer Funds | |
| | | Investment |
| | | |
| | | | Committee |
| | | | member, |
| | | | University of |
| | | | South Dakota |
| | | | Foundation; |
| | | | Board member, |
| | | | Audit Committee |
| | | | Member and past |
| | | | Board Chair, |
| | | | Junior |
| | | | Achievement |
| | | | (non-profit) |
Christopher L. Wilson - | 2017 | Retired | 229 | ISO New |
1957 | | Formerly: Director, TD Asset Management USA Inc. (mutual fund complex) (22 | | England, Inc. |
Trustee, Vice Chair and Chair | | | (non-profit |
| portfolios); Managing Partner, CT2, LLC (investing and consulting firm); | |
Designate | | | organization |
| President/Chief Executive Officer, Columbia Funds, Bank of America | |
| | | |
| Corporation; President/Chief Executive Officer, CDC IXIS Asset Management | managing |
| regional electricity |
| Services, Inc.; Principal & Director of Operations, Scudder Funds, Scudder, |
| market) |
| Stevens & Clark, Inc.; Assistant Vice President, Fidelity Investments |
| |
T-4 | Invesco Government Money Market Fund |
Trustees and Officers—(continued)
| | | Number of | Other |
| Trustee | | Funds in | Directorship(s) |
Name, Year of Birth and | and/or | | Fund Complex | Held by Trustee |
Position(s) | Officer | Principal Occupation(s) | Overseen by | During Past 5 |
Held with the Trust | Since | During Past 5 Years | Trustee | Years |
Officers | | | | |
Sheri Morris — 1964 | 1999 | Head of Global Fund Services, Invesco Ltd.; President, Principal Executive | N/A | N/A |
President, Principal Executive | | Officer and Treasurer, The Invesco Funds; Vice President, Invesco Advisers, | | |
Officer and Treasurer | | Inc. (formerly known as Invesco Institutional (N.A.), Inc.) (registered | | |
| | investment adviser); and Vice President, Invesco Exchange-Traded Fund Trust, | | |
| | Invesco Exchange-Traded Fund Trust II, Invesco India Exchange-Traded Fund | | |
| | Trust, Invesco Actively Managed Exchange-Traded Fund Trust, Invesco Actively | | |
| | Managed Exchange-Traded Commodity Fund Trust and Invesco | | |
| | Exchange-Traded Self-Indexed Fund Trust; and Vice President, | | |
| | OppenheimerFunds, Inc. | | |
| | Formerly: Vice President and Principal Financial Officer, The Invesco Funds; | | |
| | Vice President, Invesco AIM Advisers, Inc., Invesco AIM Capital Management, | | |
| | Inc. and Invesco AIM Private Asset Management, Inc.; Assistant Vice President | | |
| | and Assistant Treasurer, The Invesco Funds and Assistant Vice President, | | |
| | Invesco Advisers, Inc., Invesco AIM Capital Management, Inc. and Invesco AIM | | |
| | Private Asset Management, Inc.; and Treasurer, Invesco Exchange-Traded | | |
| | Fund Trust, Invesco Exchange-Traded Fund Trust II, Invesco India | | |
| | Exchange-Traded Fund Trust and Invesco Actively Managed Exchange-Traded | | |
| | Fund Trust | | |
Russell C. Burk — 1958 | 2005 | Senior Vice President and Senior Officer, The Invesco Funds | N/A | N/A |
Senior Vice President and Senior | | | | |
Officer | | | | |
Jeffrey H. Kupor – 1968 | 2018 | Head of Legal of the Americas, Invesco Ltd.; Senior Vice President and | N/A | N/A |
Senior Vice President, Chief Legal | | Secretary, Invesco Advisers, Inc. (formerly known as Invesco Institutional | | |
Officer and Secretary | | (N.A.), Inc.) (registered investment adviser); Senior Vice President and | | |
| | Secretary, Invesco Distributors, Inc. (formerly known as Invesco AIM | | |
| | Distributors, Inc.); Vice President and Secretary, Invesco Investment Services, | | |
| | Inc. (formerly known as Invesco AIM Investment Services, Inc.) Senior Vice | | |
| | President, Chief Legal Officer and Secretary, The Invesco Funds; Secretary and | | |
| | General Counsel, Invesco Investment Advisers LLC (formerly known as Van | | |
| | Kampen Asset Management); Secretary and General Counsel, Invesco Capital | | |
| | Markets, Inc. (formerly known as Van Kampen Funds Inc.) and Chief Legal | | |
| | Officer, Invesco Exchange-Traded Fund Trust, Invesco Exchange-Traded Fund | | |
| | Trust II, Invesco India Exchange-Traded Fund Trust, Invesco Actively Managed | | |
| | Exchange-Traded Fund Trust, Invesco Actively Managed Exchange-Traded | | |
| | Commodity Fund Trust and Invesco Exchange-Traded Self-Indexed Fund Trust; | | |
| | Secretary, Invesco Indexing LLC; Secretary, W.L. Ross & Co., LLC | | |
| | Formerly: Secretary and Vice President, Jemstep, Inc.; Head of Legal, | | |
| | Worldwide Institutional, Invesco Ltd.; Secretary and General Counsel, INVESCO | | |
| | Private Capital Investments, Inc.; Senior Vice President, Secretary and General | | |
| | Counsel, Invesco Management Group, Inc. (formerly known as Invesco AIM | | |
| | Management Group, Inc.); Assistant Secretary, INVESCO Asset Management | | |
| | (Bermuda) Ltd.; Secretary and General Counsel, Invesco Private Capital, Inc.; | | |
| | Assistant Secretary and General Counsel, INVESCO Realty, Inc.; Secretary and | | |
| | General Counsel, Invesco Senior Secured Management, Inc.; and Secretary, | | |
| | Sovereign G./P. Holdings Inc. | | |
Andrew R. Schlossberg – 1974 | 2019 | Head of the Americas and Senior Managing Director, Invesco Ltd.; Director and | N/A | N/A |
Senior Vice President | | Senior Vice President, Invesco Advisers, Inc. (formerly known as Invesco | | |
| | Institutional (N.A.), Inc.) (registered investment adviser); Director and | | |
| | Chairman, Invesco Investment Services, Inc. (formerly known as Invesco AIM | | |
| | Investment Services, Inc.) (registered transfer agent); Senior Vice President, | | |
| | The Invesco Funds; Director, Invesco Investment Advisers LLC (formerly known | | |
| | as Van Kampen Asset Management); Director, President and Chairman, Invesco | | |
| | Insurance Agency, Inc. | | |
| | Formerly: Director, Invesco UK Limited; Director and Chief Executive, Invesco | | |
| | Asset Management Limited and Invesco Fund Managers Limited; Assistant Vice | | |
| | President, The Invesco Funds; Senior Vice President, Invesco Advisers, Inc. | | |
| | (formerly known as Invesco Institutional (N.A.), Inc.) (registered investment | | |
| | adviser); Director and Chief Executive, Invesco Administration Services Limited | | |
| | and Invesco Global Investment Funds Limited; Director, Invesco Distributors, | | |
| �� | Inc.; Head of EMEA, Invesco Ltd.; President, Invesco Actively Managed | | |
| | Exchange-Traded Commodity Fund Trust, Invesco Actively Managed | | |
| | Exchange-Traded Fund Trust, Invesco Exchange-Traded Fund Trust, Invesco | | |
| | Exchange-Traded Fund Trust II and Invesco India Exchange-Traded Fund Trust; | | |
| | Managing Director and Principal Executive Officer, Invesco Capital | | |
| | Management LLC | | |
T-5 | Invesco Government Money Market Fund |
Trustees and Officers—(continued)
| | | Number of | Other |
| Trustee | | Funds in | Directorship(s) |
Name, Year of Birth and | and/or | | Fund Complex | Held by Trustee |
Position(s) | Officer | Principal Occupation(s) | Overseen by | During Past 5 |
Held with the Trust | Since | During Past 5 Years | Trustee | Years |
Officers—(continued) | | | | |
John M. Zerr — 1962 | 2006 | Chief Operating Officer of the Americas; Senior Vice President, Invesco | N/A | N/A |
Senior Vice President | | Advisers, Inc. (formerly known as Invesco Institutional (N.A.), Inc.) (registered | | |
| | investment adviser); Senior Vice President, Invesco Distributors, Inc. (formerly | | |
| | known as Invesco AIM Distributors, Inc.); Director and Vice President, Invesco | | |
| | Investment Services, Inc. (formerly known as Invesco AIM Investment | | |
| | Services, Inc.) Senior Vice President, The Invesco Funds; Managing Director, | | |
| | Invesco Capital Management LLC; Director, Invesco Investment Advisers LLC | | |
| | (formerly known as Van Kampen Asset Management); Senior Vice President, | | |
| | Invesco Capital Markets, Inc. (formerly known as Van Kampen Funds Inc.); | | |
| | Manager, Invesco Indexing LLC; Manager, Invesco Specialized Products, LLC; | | |
| | Director and Senior Vice President, Invesco Insurance Agency, Inc.; Member, | | |
| | Invesco Canada Funds Advisory Board; Director, President and Chief Executive | | |
| | Officer, Invesco Corporate Class Inc. (corporate mutual fund company); and | | |
| | Director, Chairman, President and Chief Executive Officer, Invesco Canada Ltd. | | |
| | (formerly known as Invesco Trimark Ltd./Invesco Trimark Ltèe) (registered | | |
| | investment adviser and registered transfer agent); President, Invesco, Inc. | | |
| | Formerly: Director and Senior Vice President, Invesco Management Group, Inc. | | |
| | (formerly known as Invesco AIM Management Group, Inc.); Secretary and | | |
| | General Counsel, Invesco Management Group, Inc. (formerly known as Invesco | | |
| | AIM Management Group, Inc.); Secretary, Invesco Investment Services, Inc. | | |
| | (formerly known as Invesco AIM Investment Services, Inc.); Chief Legal Officer | | |
| | and Secretary, The Invesco Funds; Secretary and General Counsel, Invesco | | |
| | Investment Advisers LLC (formerly known as Van Kampen Asset Management); | | |
| | Secretary and General Counsel, Invesco Capital Markets, Inc. (formerly known | | |
| | as Van Kampen Funds Inc.); Chief Legal Officer, Invesco Exchange-Traded Fund | | |
| | Trust, Invesco Exchange-Traded Fund Trust II, Invesco India Exchange-Traded | | |
| | Fund Trust, Invesco Actively Managed Exchange-Traded Fund Trust, Invesco | | |
| | Actively Managed Exchange-Traded Commodity Fund Trust and Invesco | | |
| | Exchange-Traded Self-Indexed Fund Trust; Secretary, Invesco Indexing LLC; | | |
| | Director, Secretary, General Counsel and Senior Vice President, Van Kampen | | |
| | Exchange Corp.; Director, Vice President and Secretary, IVZ Distributors, Inc. | | |
| | (formerly known as INVESCO Distributors, Inc.); Director and Vice President, | | |
| | INVESCO Funds Group, Inc.; Director and Vice President, Van Kampen | | |
| | Advisors Inc.; Director, Vice President, Secretary and General Counsel, Van | | |
| | Kampen Investor Services Inc.;Director and Secretary, Invesco Distributors, | | |
| | Inc. (formerly known as Invesco AIM Distributors, Inc.); Director, Senior Vice | | |
| | President, General Counsel and Secretary, Invesco AIM Advisers, Inc. and Van | | |
| | Kampen Investments Inc.; Director, Vice President and Secretary, Fund | | |
| | Management Company; Director, Senior Vice President, Secretary, General | | |
| | Counsel and Vice President, Invesco AIM Capital Management, Inc.; Chief | | |
| | Operating Officer and General Counsel, Liberty Ridge Capital, Inc. (an | | |
| | investment adviser) | | |
Gregory G. McGreevey - 1962 | 2012 | Senior Managing Director, Invesco Ltd.; Director, Chairman, President, and | N/A | N/A |
Senior Vice President | | Chief Executive Officer, Invesco Advisers, Inc. (formerly known as Invesco | | |
| | Institutional (N.A.), Inc.) (registered investment adviser); Director, Invesco | | |
| | Mortgage Capital, Inc. and Invesco Senior Secured Management, Inc.; and | | |
| | Senior Vice President, The Invesco Funds; and President, SNW Asset | | |
| | Management Corporation and Invesco Managed Accounts, LLC | | |
| | Formerly: Senior Vice President, Invesco Management Group, Inc. and Invesco | | |
| | Advisers, Inc.; Assistant Vice President, The Invesco Funds | | |
Kelli Gallegos – 1970 | 2008 | Principal Financial and Accounting Officer – Investments Pool, Invesco | N/A | N/A |
Vice President, Principal Financial | | Specialized Products, LLC; Vice President, Principal Financial Officer and | | |
Officer and Assistant Treasurer | | Assistant Treasurer, The Invesco Funds; Principal Financial and Accounting | | |
| | Officer – Pooled Investments, Invesco Capital Management LLC; Vice President | | |
| | and Treasurer, Invesco Exchange-Traded Fund Trust, Invesco Exchange-Traded | | |
| | Fund Trust II, Invesco India Exchange-Traded Fund Trust, Invesco Actively | | |
| | Managed Exchange-Traded Fund Trust, Invesco Actively Managed | | |
| | Exchange-Traded Commodity Fund Trust and Invesco Exchange-Traded | | |
| | Self-Indexed Fund Trust; Vice President, Invesco Advisers, Inc. | | |
| | Formerly: Assistant Treasurer, Invesco Specialized Products, LLC; Assistant | | |
| | Treasurer, Invesco Exchange-Traded Fund Trust, Invesco Exchange-Traded | | |
| | Fund Trust II, Invesco India Exchange-Traded Fund Trust, Invesco Actively | | |
| | Managed Exchange-Traded Fund Trust, Invesco Actively Managed | | |
| | Exchange-Traded Commodity Fund Trust and Invesco Exchange-Traded | | |
| | Self-Indexed Fund Trust; Assistant Treasurer, Invesco Capital | | |
| | Management LLC; Assistant Vice President, The Invesco Funds | | |
Crissie M. Wisdom – 1969 | 2013 | Anti-Money Laundering and OFAC Compliance Officer for Invesco U.S. entities | N/A | N/A |
Anti-Money Laundering | | including: Invesco Advisers, Inc. and its affiliates, Invesco Capital Markets, | | |
Compliance Officer | | Inc., Invesco Distributors, Inc., Invesco Investment Services, Inc., The Invesco | | |
| | Funds, Invesco Capital Management, LLC, Invesco Trust Company; | | |
| | OppenheimerFunds Distributor, Inc., and Fraud Prevention Manager for | | |
| | Invesco Investment Services, Inc. | | |
T-6 | Invesco Government Money Market Fund |
Trustees and Officers—(continued)
| | | Number of | Other |
| Trustee | | Funds in | Directorship(s) |
Name, Year of Birth and | and/or | | Fund Complex | Held by Trustee |
Position(s) | Officer | Principal Occupation(s) | Overseen by | During Past 5 |
Held with the Trust | Since | During Past 5 Years | Trustee | Years |
Officers—(continued) | | | | |
Robert R. Leveille – 1969 | 2016 | Chief Compliance Officer, Invesco Advisers, Inc. (registered investment | N/A | N/A |
Chief Compliance Officer | | adviser); and Chief Compliance Officer, The Invesco Funds | | |
| | Formerly: Chief Compliance Officer, Putnam Investments and the Putnam | | |
| | Funds | | |
The Statement of Additional Information of the Trust includes additional information about the Fund's Trustees and is available upon request, without charge, by calling 1.800.959.4246. Please refer to the Fund's Statement of Additional Information for information on the Fund's sub-advisers.
Office of the Fund | Investment Adviser | Distributor | Auditors |
11 Greenway Plaza, Suite 1000 | Invesco Advisers, Inc. | Invesco Distributors, Inc. | PricewaterhouseCoopers LLP |
Houston, TX 77046-1173 | 1555 Peachtree Street, N.E. | 11 Greenway Plaza, Suite 1000 | 1000 Louisiana Street, Suite 5800 |
| Atlanta, GA 30309 | Houston, TX 77046-1173 | Houston, TX 77002-5678 |
Counsel to the Fund | Counsel to the Independent Trustees | Transfer Agent | Custodian |
Stradley Ronon Stevens & Young, LLP | Goodwin Procter LLP | Invesco Investment Services, Inc. | Bank of New York Mellon |
2005 Market Street, Suite 2600 | 901 New York Avenue, N.W. | 11 Greenway Plaza, Suite 1000 | 2 Hanson Place |
Philadelphia, PA 19103-7018 | Washington, D.C. 20001 | Houston, TX 77046-1173 | Brooklyn, NY 11217-1431 |
T-7 | Invesco Government Money Market Fund |

Go paperless with eDelivery
Visit invesco.com/edelivery to enjoy the convenience and security of anytime electronic access to your investment documents.
With eDelivery, you can elect to have any or all of the following materials delivered straight to your inbox to download, save and print from your own computer:
•Fund reports and prospectuses
•Quarterly statements
•Daily confirmations
•Tax forms
Invesco mailing information
Send general correspondence to Invesco Investment Services, Inc., P.O. Box 219078, Kansas City, MO 64121-9078.
Important notice regarding delivery of security holder documents
To reduce Fund expenses, only one copy of most shareholder documents may be mailed to shareholders with multiple accounts at the same address (Householding). Mailing of your shareholder documents may be householded indefinitely unless you instruct us otherwise. If you do not want the mailing of these documents to be combined with those for other members of your household, please contact Invesco Investment Services, Inc. at 800 959 4246 or contact your financial institution. We will begin sending you individual copies for each account within 30 days after receiving your request.
Fund holdings and proxy voting information
The Fund provides a complete list of its holdings in various monthly and quarterly regulatory filings. The Fund files a complete schedule of portfolio holdings with the Securities and Exchange Commission (SEC) monthly on Form N-MFP. For the second and fourth quarters, the list appears in the Fund's semiannual and annual reports to shareholders. The most recent list of portfolio holdings is available at invesco.com/us. Shareholders can also look up the Fund's Form N-MFP filings on the SEC website, sec.gov. The SEC file numbers for the Fund are shown below.
A description of the policies and procedures that the Fund uses to determine how to vote proxies relating to portfolio secu- rities is available without charge, upon request, from our Client Services department at 800 959 4246, or at invesco.com/ proxyguidelines. The information is also available on the SEC website, sec.gov.
Information regarding how the Fund voted proxies related to its portfolio securities during the most
recent 12-month period ended June 30 is available at invesco.com/proxysearch. This information is also available on the SEC website, sec.gov.
Invesco Advisers, Inc. is an investment adviser; it provides investment advisory services to individual and institutional clients and does not sell securities. Invesco Distributors, Inc. is the US distributor for Invesco Ltd.'s retail mutual funds, exchange-traded funds and institutional money market funds. Both are wholly owned, indirect subsidiaries of Invesco Ltd.
SEC file numbers: 811-05686 and 033-39519 | Invesco Distributors, Inc. | GMKT-AR-1 |
Annual Report to Shareholders | February 29, 2020 |
Invesco High Yield Fund
Nasdaq:
A: AMHYX C: AHYCX Y: AHHYX Investor: HYINX R5: AHIYX R6: HYIFX
Beginning on January 1, 2021, as permitted by regulations adopted by the Securities and Exchange Commission, paper copies of the Fund's shareholder reports will no longer be sent by mail, unless you specifically request paper copies of the reports from the Fund or from your financial intermediary, such as a broker-dealer or bank. Instead, the reports will be made available on the Fund's web- site, and you will be notified by mail each time a report is posted and provided with a website link to access the report.
If you already elected to receive shareholder reports electronically, you will not be affected by this change and you need not take any action. You may elect to receive shareholder reports and other communications from the Fund electronically by contacting your financial intermediary (such as a broker-dealer or bank) or, if you are a direct investor, by enrolling at invesco.com/edelivery.
You may elect to receive all future reports in paper free of charge. If you invest through a financial intermediary, you can contact your financial intermediary to request that you continue to receive paper copies of your shareholder reports. If you invest directly with the Fund, you can call (800) 959-4246 to let the Fund know you wish to continue receiving paper copies of your shareholder reports. Your election to receive reports in paper will apply to all funds held with your financial intermediary or all funds held with the fund complex if you invest directly with the Fund.
Andrew Schlossberg
Letters to Shareholders
Dear Shareholders:
This annual report includes information about your Fund, including performance data and a complete list of its investments as of the close of the reporting period. Inside is a discussion of how your Fund was managed and the factors that affected its performance during the reporting period.
The reporting period proved to be another tumultuous time for both global equities and fixed-income secu- rities. In early 2019, global equity markets were buoyed by a more accommodative stance from central banks and optimism about a potential US-China trade deal. In May, US-China trade concerns and slowing global growth led to a global equity sell-off and rally in US Treasuries. Despite the May sell-off, domestic equity mar- kets rallied in June in anticipation of a US Federal Reserve (the Fed) interest rate cut and closed the second quarter with modest gains. Continued US-China trade worries and signs of slowing global economic growth led to increased market volatility in August. The US Treasury yield curve inverted several times as fears of a US recession increased. As a result, global equity markets were largely flat for the third quarter. In the final
months of 2019, geopolitical and macroeconomic issues largely abated. This combined with better-than-expected third quarter corporate earnings and initial agreement of the phase one US-China trade deal provided a favorable backdrop for equities and impressive fourth quar- ter global equity returns.
As the new year began, US equities were largely buoyed in January by the signing of the phase one trade agreement and strong eco- nomic data although returns were dampened by the spread of the Coronavirus (COVID-19). Concerns over the virus had a greater impact on international equities, which were largely lower for the month. As the virus spread outside of China and the number of cases increased, fears of diminished global growth led to a sharp global equity sell-off at the end of February 2020 and sent the yield on the US 10-year Treasury to a new all-time low.
Throughout 2019, central banks continued to be accommodative, providing sources of liquidity. In July, the Fed lowered interest rates for the first time in 11 years. It again lowered rates in September and once again in October. During the rest of the year, the Fed left rates unchanged. Overseas, the European Central Bank left its policy rate unchanged and continued its bond purchasing program. In 2020, with the increased spread of the coronavirus, the Fed shifted from a more neutral policy to the possibility of further rate cuts in the new year. As 2020 unfolds, we'll see how the interplay of interest rates, economic data, geopolitics and a host of other factors affect US and overseas equity and fixed income markets.
Investor uncertainty and market volatility, such as we witnessed during the reporting period, are unfortunate facts of life when it comes to investing. That's why Invesco encourages investors to work with a professional financial adviser who can stress the importance of starting to save and invest early and the importance of adhering to a disciplined investment plan. A financial adviser who knows your unique finan- cial situation, investment goals and risk tolerance can be an invaluable partner as you seek to achieve your financial goals. Financial advis- ers can also offer a long-term perspective when markets are volatile and time-tested advice and guidance when your financial situation or investment goals change.
Visit our website for more information on your investments
Our website, invesco.com/us, offers a wide range of market insights and investment perspectives. On the website, you'll find detailed infor- mation about our funds, including performance, holdings and portfolio manager commentaries. You can access information about your account by completing a simple, secure online registration. To do so, select "Log In" on the right side of the homepage, and then select "Register for Individual Account Access."
In addition to the resources accessible on our website and through our mobile app, you can obtain timely updates to help you stay informed about the markets and the economy by connecting with Invesco on Twitter, LinkedIn or Facebook. You can access our blog at blog.invesco.us.com. Our goal is to provide you the information you want, when and where you want it.
Finally, I'm pleased to share with you Invesco's commitment to both the Principles for Responsible Investment and to considering environ- mental, social and governance issues in our robust investment process. I invite you to learn more at invesco.com/esg.
Have questions?
For questions about your account, contact an Invesco client services representative at 800 959 4246.
All of us at Invesco look forward to serving your investment management needs. Thank you for investing with us.
Sincerely,
Andrew Schlossberg
Head of the Americas,
Senior Managing Director, Invesco Ltd.
Bruce Crockett
Dear Shareholders:
Among the many important lessons I've learned in more than 40 years in a variety of business endeavors is the value of a trusted advocate.
As independent chair of the Invesco Funds Board, I can assure you that the members of the Board are strong advocates for the interests of investors in Invesco's mutual funds. We work hard to represent your interests through oversight of the quality of the investment management services your funds receive and other matters important to your investment, including but not limited to:
Ensuring that Invesco offers a diverse lineup of mutual funds that your financial adviser can use to strive to meet your financial needs as your investment goals change over time.
Monitoring how the portfolio management teams of the Invesco funds are performing in light of changing economic and market conditions.
Assessing each portfolio management team's investment performance within the context of the investment strategy described in the fund's prospectus.
Monitoring for potential conflicts of interests that may impact the nature of the services that your funds receive.
We believe one of the most important services we provide our fund shareholders is the annual review of the funds' advisory and sub-
advisory contracts with Invesco Advisers and its affiliates. This review is required by the Investment Company Act of 1940 and focuses on the nature and quality of the services Invesco provides as the adviser to the Invesco funds and the reasonableness of the fees that it charges for those services. Each year, we spend months carefully reviewing information received from Invesco and a variety of independent sources, such as performance and fee data prepared by Lipper, Inc. (a subsidiary of Broadridge Financial Solutions, Inc.), an independent, third-party firm widely recognized as a leader in its field. We also meet with our independent legal counsel and other independent advisers to review and help us assess the information that we have received. Our goal is to assure that you receive quality investment management services for a reasonable fee.
I trust the measures outlined above provide assurance that you have a worthy advocate when it comes to choosing the Invesco Funds. On behalf of the Board, we look forward to continuing to represent your interests and serving your needs.
Sincerely,
Bruce L. Crockett
Independent Chair
Invesco Funds Board of Trustees

Management's Discussion of Fund Performance
Performance summary
For the fiscal year ended February 29, 2020, Class A shares of Invesco High Yield Fund (the Fund), at net asset value (NAV), underperformed the Fund's style- specific benchmark, the Bloomberg Barclays U.S. Corporate High Yield 2% Issuer Cap Index.
Your Fund's long-term performance appears later in this report.
Fund vs. Indexes
Total returns, February 28, 2019 to February 29, 2020, at net asset value (NAV). Performance shown does not include applicable contingent deferred sales charges (CDSC) or front-end sales charges, which would have reduced performance.
Class A Shares | 3.53% |
Class C Shares | 2.75 |
Class Y Shares | 3.54 |
Investor Class Shares | 3.53 |
Class R5 Shares | 3.75 |
Class R6 Shares | 3.70 |
Bloomberg Barclays U.S. Aggregate Bond Index (Broad Market Index) | 11.68 |
Bloomberg Barclays U.S. Corporate High Yield 2% Issuer Cap Index | |
(Style-Specific Index) | 6.10 |
Lipper High Current Yield Bond Funds Index (Peer Group Index) | 5.65 |
Source(s): RIMES Technologies Corp.; Lipper Inc.
During the fiscal year, the Fund benefited from its positioning in the environmental sub- industry, as well as the aerospace and de- fense and transportation services sectors. While the Fund had an underweight allocation to the pharmaceuticals sector relative to its style-specific benchmark, security selection was a significant contributor to the Fund's relative performance. The Fund's overweight allocation to diversified manufacturing was also beneficial to relative performance during the fiscal year, along with security selection in the pharmaceuticals and home construction sectors.
The largest detractors from the Fund's per- formance relative to the style-specific bench- mark during the fiscal year were positions in independent energy, technology and mid- stream industries. In those industries, security selection was a drag on the Fund's relative performance. Moreover, an underweight allo- cation to the packaging sector was a minor drag on the Fund's relative performance along with security selection in the construc- tion machinery and oil field services sectors. An underweight allocation to BB-rated bonds
Market conditions and your Fund
For the fiscal year, US high yield bond returns were positive. The fiscal year began with heightened volatility as investors feared that the US Federal Reserve (the Fed) had gone too far in its monetary policy tightening and that the effects would lead to a synchronized global economic growth slowdown. That un- certainty was quickly alleviated when the Fed changed its course and all but promised no rate hikes in 2019. The renewed risk appetite was further inspired by dovish central banks globally.
This trend continued throughout the fiscal year until February 2020, when investors began to fear that the spread of the Corona- virus (COVID-19) would lead to a global eco- nomic slowdown. Despite the uptick in volatil- ity late in the fiscal year, defaults continued to stay below the long-term average of about 2.91%.1 In particular, the par-weighted high yield default rate ended the fiscal year at 2.30%.1
Portfolio Composition*
By credit quality, based on total investments
A | 1.8% |
BBB | 5.2 |
BB | 30.2 |
B | 40.4 |
CCC | 15.0 |
CC | 0.5 |
C | 0.2 |
D | 0.3 |
Cash | 2.3 |
Non-Rated | 4.1 |
The Fed cut interest rates three times dur- ing the fiscal year to a range of 1.50% to 1.75%.2 The European Central Bank also cut rates at the end of 2019 to -0.50%.3 This, coupled with easier fiscal and monetary policy in China and the continued economic woes plaguing the European Union, led to easier financial conditions globally, which, in turn, drove interest rates lower across maturities.
Against this backdrop, the high yield mar- ket produced positive monthly returns in 10 of the 12 months of the fiscal year. By qual- ity, BB-rated† bonds led the way during the fiscal year. By sector, housing and automo- tive had the strongest returns, while the en- ergy sector had the weakest performance for the fiscal year.
The Bloomberg Barclays U.S. Corporate High Yield 2% Issuer Cap Index, which mea- sures the performance of the US high yield bond market and is the Fund's style-specific index, generated a positive return for the fis- cal year. Likewise, the Fund, at NAV, gener- ated a positive return for the fiscal year.
Top Five Debt Issuers
| | % of total net assets |
| | | |
1. | CSC Holdings, LLC | | 1.45% |
2. | Sprint Corp. | | 1.43 |
3. | Navient Corp. | | 1.17 |
4. | HCA, Inc. | | 1.13 |
5. | Kenan Advantage Group, Inc. | |
| (The) | | 1.00 |
was also a detractor from relative perfor- mance during the fiscal year; however, an allocation to BBB-rated bonds partially offset the underperformance.
During the fiscal year, we used derivatives to mitigate overall portfolio risk. These instru- ments include credit default swaps (CDX), options on CDX (known as swaptions) and total return swaps, which offer greater effi- ciency and lower transaction costs than cash bonds. However, derivatives may amplify tra- ditional investment risks through the creation of leverage and may be less liquid than tradi- tional securities. For the fiscal year, deriva- tives employed by the Fund had a small posi- tive impact on the Fund's performance.
We also used currency forward contracts
during the fiscal year to hedge currency expo- sure of our non-US dollar-denominated posi- tions. The use of currency forward contracts had a negligible impact on the Fund's perfor- mance.
At the close of the fiscal year, despite the uptick in volatility experienced during this
The Fund's holdings are subject to change, and there is no assurance that the Fund will continue to hold any particular security.
Data presented here are as of February 29, 2020.
*Source: Standard & Poor's. A credit rating is an assessment provided by a nationally recognized statistical rating organization (NRSRO) of the creditworthiness of an issuer with respect to debt obligations, including specific securities, money market instruments or other debts. Ratings are measured on a scale that generally ranges from
AAA(highest) to D (lowest); ratings are subject to change without notice. "Non- Rated" indicates the debtor was not rated, and should not be interpreted as indicating low quality. For more information on Standard & Poor's rating methodology, please visit standardandpoors.com and select "Understanding Ratings" under Rating Resources on the homepage.

time, we believed solid company fundamen- tals and low defaults could provide a solid foundation for 2020. We note recent macro- economic events, namely the coronavirus, have caused a material widening in credit spreads. It is unclear when these issues will be resolved, but it is our view that they will have a negative effect on second-quarter gross domestic product. That said, we also firmly believe that central banks will provide liquidity in an effort to avoid stressed financial condi- tions in a macroeconomic environment where company level revenues may suffer a short- term negative impact. In terms of new issue supply, many companies have already ac- cessed the market to refinance, thereby pushing out maturities. We believe there may be an increase in default activity in challenged sectors like energy, but we also recognize many of the companies have attractive hedges in place through year-end 2020, which may provide good visibility into near- term revenues. We expect continued chal- lenges in the wireline and retail industries as fundamental challenges threaten many com- panies in each sector. Given current uncer- tainties surrounding company level revenues, we think companies are likely to focus on pre- serving the strength of their balance sheets, as opposed to deliberately adding new debt. While we remain cautious, it is our opinion that the recent credit spread widening will create investment opportunities that we have not seen during the last few months of the fiscal year.
We wish to remind you that the Fund is subject to interest rate risk, meaning when interest rates rise, the value of fixed income securities tends to fall. The risk may be greater in the current market environment because interest rates are near historic lows. The degree to which the value of fixed income securities may decline due to rising interest rates may vary depending on the speed and magnitude of the increase in interest rates, as well as individual security characteristics, such as price, maturity, duration and coupon and market forces, such as supply and de- mand for similar securities. We are monitor- ing interest rates, and the market, economic and geopolitical factors that may impact the direction, speed and magnitude of changes to interest rates across the maturity spectrum, including the potential impact of monetary policy changes by the Fed and certain foreign central banks. If interest rates rise or fall faster than expected, markets may experience increased volatility which may affect the value and/or liquidity of certain of the Fund's invest- ments.
Thank you for investing in Invesco High Yield Fund and for sharing our long-term in- vestment horizon.
1 Source: JP Morgan
2 Source: US Federal Reserve
3 Source: European Central Bank
†A credit rating is an assessment provided by a nationally recognized statistical rating organization (NRSRO) of the creditworthiness of an issuer with respect to debt obligations, including specific
securities, money market instruments or other debts. Ratings are measured on a scale that generally ranges from AAA (highest) to D (lowest); ratings are subject to change without notice. "Non-Rated" indicates the debtor was not rated, and should not be interpreted as indicating low quality. For more information on rating methodology, please visit www.standardandpoors.com and select "Under-standing Ratings" under Rating Resources on the homepage; www.fitchratings.com and select "Understanding Credit Ratings" from the drop-down menu on the homepage; and www.moodys.com and select "Methodology," then "Rating Methodologies" under Research Type on the left-hand side.
Portfolio Managers:
Andrew Geryol
Joseph Portera
Scott Roberts
The views and opinions expressed in management's discussion of Fund performance are those of Invesco Advisers, Inc. These views and opinions are subject to change at any time based on factors such as market and economic conditions. These views and opinions may not be relied upon as investment advice or recommendations, or as an offer for a particular security. The information is not a complete analysis of every aspect of any market, country, industry, security or the Fund. Statements of fact are from sources considered reliable, but Invesco Advisers, Inc. makes no representation or warranty as to their completeness or accuracy. Although historical performance is no guarantee of future results, these insights may help you understand our investment management philosophy.
See important Fund and, if applicable, index disclosures later in this report.
Your Fund's Long-Term Performance
Results of a $10,000 Investment — Oldest Share Class(es)
Fund and index data from 2/28/10
$25,000
$20,133 Bloomberg Barclays U.S. Corporate High Yield 2% Issuer
20,000Cap Index1
 $18,877 Lipper High Current Yield Bond Funds Index2
$16,895 Invesco High Yield Fund — Class A Shares
15,000 | $14,707 Bloomberg Barclays U.S. Aggregate Bond Index1 |
|
10,000 | |
5,000 | |
2/28/10 | 2/11 | 2/12 | 2/13 | 2/14 | 2/15 | 2/16 | 2/17 | 2/18 | 2/19 | 2/20 |
1Source: RIMES Technologies Corp.
2 Source: Lipper Inc.
Past performance cannot guarantee future results.
The data shown in the chart include rein- vested distributions, applicable sales charges and Fund expenses including management
fees. Index results include reinvested divi- dends, but they do not reflect sales charges. Performance of the peer group, if applicable, reflects fund expenses and management fees; performance of a market index does not. Per-
formance shown in the chart and table(s) does not reflect deduction of taxes a share- holder would pay on Fund distributions or sale of Fund shares.

Average Annual Total Returns
As of 2/29/20, including maximum applicable sales charges
Class A Shares
Inception (7/11/78) | 7.25% |
10 Years | 5.38 |
5 | Years | 2.53 |
1 | Year | –0.88 |
Class C Shares | |
Inception (8/4/97) | 3.40% |
10 Years | 5.06 |
5 | Years | 2.63 |
1 | Year | 1.78 |
Class Y Shares | |
Inception (10/3/08) | 7.84% |
10 Years | 6.13 |
5 | Years | 3.67 |
1 | Year | 3.54 |
Investor Class Shares | |
Inception (9/30/03) | 6.56% |
10 Years | 5.87 |
5 | Years | 3.44 |
1 | Year | 3.53 |
Class R5 Shares | |
Inception (4/30/04) | 6.54% |
10 Years | 6.17 |
5 | Years | 3.72 |
1 | Year | 3.75 |
Class R6 Shares | |
10 Years | 6.16% |
5 | Years | 3.83 |
1 | Year | 3.70 |
Class R6 shares incepted on September 24, 2012. Performance shown prior to that date is that of Class A shares and includes the 12b-1 fees applicable to Class A shares.
The performance data quoted represent past performance and cannot guarantee future results; current performance may be lower or higher. Please visit invesco.com/ performance for the most recent month- end performance. Performance figures re- flect reinvested distributions, changes in net asset value and the effect of the maxi- mum sales charge unless otherwise stated. Performance figures do not reflect deduc- tion of taxes a shareholder would pay on Fund distributions or sale of Fund shares. Investment return and principal value will fluctuate so that you may have a gain or loss when you sell shares.
Class A share performance reflects the maximum 4.25% sales charge, and Class C share performance reflects the applicable contingent deferred sales charge (CDSC) for the period involved. The CDSC on Class C shares is 1% for the first year after purchase. Class Y, Investor Class, Class R5 and Class R6 shares do not have a front- end sales charge or a CDSC; therefore, per- formance is at net asset value.
The performance of the Fund's share classes will differ primarily due to different sales charge structures and class expenses. Fund performance reflects any applicable
fee waivers and/or expense reimburse- ments. Had the adviser not waived fees and/or reimbursed expenses currently or in the past, returns would have been lower. See current prospectus for more informa- tion.

Invesco High Yield Fund's investment objective is total return through growth of capital and current income.
Unless otherwise stated, information presented in this report is as of February 29, 2020, and is based on total net assets.
Unless otherwise noted, all data provided by Invesco.
To access your Fund's reports/prospectus, visit invesco.com/fundreports.
About indexes used in this report
The Bloomberg Barclays U.S. Aggregate Bond Index is an unmanaged index con- sidered representative of the US invest- ment grade, fixed rate bond market.
The Bloomberg Barclays U.S. Corporate High Yield 2% Issuer Cap Index is an un- managed index considered representative of the US high yield, fixed rate corporate bond market. Index weights for each is- suer are capped at 2%.
The Lipper High Current Yield Bond Funds Index is an unmanaged index con- sidered representative of high yield bond funds tracked by Lipper.
The Fund is not managed to track the per- formance of any particular index, including the index(es) described here, and conse- quently, the performance of the Fund may deviate significantly from the performance of the index(es).
A direct investment cannot be made in an index. Unless otherwise indicated, index results include reinvested dividends, and they do not reflect sales charges. Perfor- mance of the peer group, if applicable, reflects fund expenses; performance of a market index does not.
This report must be accompanied or preceded by a currently effective Fund prospectus, which contains more complete information, including sales charges and expenses. Investors should read it carefully before investing.
NOT FDIC INSURED | MAY LOSE VALUE | NO BANK GUARANTEE

Schedule of Investments(a)
February 29, 2020
Principal
AmountValue
U.S. Dollar Denominated Bonds & Notes–88.93%
Aerospace & Defense–3.40% | | | |
Bombardier, Inc. (Canada), | | | |
8.75%, 12/01/2021(b) | $ 1,614,000 | $ | 1,712,083 |
5.75%, 03/15/2022(b) | 2,034,000 | | 2,078,300 |
7.50%, 03/15/2025(b) | 4,486,000 | | 4,441,140 |
7.88%, 04/15/2027(b) | 2,362,000 | | 2,350,249 |
Moog, Inc., 4.25%, 12/15/2027(b) | 1,748,000 | | 1,782,960 |
Spirit AeroSystems, Inc., 4.60%, | | | |
06/15/2028 | 1,112,000 | | 1,104,980 |
TransDigm UK Holdings PLC, 6.88%, | | | |
05/15/2026 | 5,218,000 | | 5,493,758 |
TransDigm, Inc., | | | |
6.50%, 07/15/2024 | 1,266,000 | | 1,297,125 |
6.50%, 05/15/2025 | 2,936,000 | | 3,036,661 |
6.25%, 03/15/2026(b) | 5,566,000 | | 5,903,444 |
Triumph Group, Inc., | | | |
5.25%, 06/01/2022 | 2,400,000 | | 2,358,749 |
7.75%, 08/15/2025 | 5,404,000 | | 5,365,713 |
| | | 36,925,162 |
Agricultural & Farm Machinery–0.63% | | |
Titan International, Inc., 6.50%, | | | |
11/30/2023 | 9,131,000 | | 6,874,867 |
Airlines–0.61% | | | |
Air Canada (Canada), 7.75%, | | | |
04/15/2021(b) | 6,290,000 | | 6,575,566 |
Alternative Carriers–1.06% | | | |
CenturyLink, Inc., | | | |
Series S, 6.45%, 06/15/2021 | 1,411,000 | | 1,467,088 |
Series Y, 7.50%, 04/01/2024 | 4,292,000 | | 4,819,551 |
Level 3 Financing, Inc., | | | |
5.38%, 05/01/2025 | 1,282,000 | | 1,311,377 |
5.25%, 03/15/2026 | 3,752,000 | | 3,880,881 |
| | | 11,478,897 |
Aluminum–0.21% | | | |
Novelis Corp., 4.75%, | | | |
01/30/2030(b) | 2,269,000 | | 2,234,228 |
Apparel Retail–1.02% | | | |
L Brands, Inc., | | | |
6.88%, 11/01/2035 | 4,409,000 | | 4,482,961 |
6.75%, 07/01/2036 | 1,490,000 | | 1,512,499 |
Michaels Stores, Inc., 8.00%, | | | |
07/15/2027(b) | 6,063,000 | | 5,065,333 |
| | | 11,060,793 |
Apparel, Accessories & Luxury Goods–0.33% | | |
William Carter Co. (The), 5.63%, | | | |
03/15/2027(b) | 3,379,000 | | 3,602,850 |
Application Software–0.03% | | | |
Castle US Holding Corp., 9.50%, | | | |
02/15/2028(b) | 335,000 | | 336,047 |
| | Principal | | |
| | Amount | | Value |
Asset Management & Custody Banks–0.25% | | |
RegionalCare Hospital Partners | | | | |
Holdings, Inc., 8.25%, | | | | |
05/01/2023(b) | $ | 2,600,000 | $ | 2,720,939 |
Auto Parts & Equipment–1.14% | | | | |
Adient Global Holdings Ltd., 4.88%, | | | | |
08/15/2026(b) | | 2,248,000 | | 1,944,576 |
Dana, Inc., | | | | |
5.50%, 12/15/2024 | | 1,322,000 | | 1,339,576 |
5.38%, 11/15/2027 | | 2,324,000 | | 2,353,050 |
Panther BF Aggregator 2 L.P./Panther | | | | |
Finance Co., Inc. (Canada), | | | | |
6.25%, 05/15/2026(b) | | 1,600,000 | | 1,646,519 |
8.50%, 05/15/2027(b) | | 2,706,000 | | 2,758,361 |
Tenneco, Inc., 5.00%, 07/15/2026 | | 2,766,000 | | 2,385,744 |
| | | | 12,427,826 |
Automobile Manufacturers–1.53% | | | |
Ford Motor Credit Co. LLC, | | | | |
5.60%, 01/07/2022 | | 3,902,000 | | 4,118,208 |
5.11%, 05/03/2029 | | 3,948,000 | | 3,978,591 |
J.B. Poindexter & Co., Inc., 7.13%, | | | | |
04/15/2026(b) | | 8,045,000 | | 8,514,848 |
Motors Liquidation Co., 0.00%, | | | | |
07/15/2033(c)(d) | | 14,770,000 | | 0 |
| | | | 16,611,647 |
Automotive Retail–2.22% | | | | |
Asbury Automotive Group, Inc., | | | | |
4.75%, 03/01/2030(b) | | 1,078,000 | | 1,099,560 |
Capitol Investment Merger Sub 2 LLC, | | | | |
10.00%, 08/01/2024(b) | | 6,099,000 | | 6,132,026 |
Lithia Motors, Inc., | | | | |
5.25%, 08/01/2025(b) | | 2,065,000 | | 2,158,782 |
4.63%, 12/15/2027(b) | | 1,237,000 | | 1,269,385 |
Murphy Oil USA, Inc., | | | | |
5.63%, 05/01/2027 | | 4,067,000 | | 4,309,607 |
4.75%, 09/15/2029 | | 1,619,000 | | 1,701,002 |
Penske Automotive Group, Inc., | | | | |
5.50%, 05/15/2026 | | 7,105,000 | | 7,384,582 |
| | | | 24,054,944 |
Brewers–0.29% | | | | |
Molson Coors Beverage Co., 5.00%, | | | | |
05/01/2042 | | 2,800,000 | | 3,173,166 |
Broadcasting–2.43% | | | | |
AMC Networks, Inc., | | | | |
5.00%, 04/01/2024 | | 3,466,000 | | 3,491,995 |
4.75%, 08/01/2025 | | 1,457,000 | | 1,455,230 |
Clear Channel Worldwide Holdings, | | | | |
Inc., 9.25%, 02/15/2024(b) | | 7,360,000 | | 7,835,346 |
Gray Television, Inc., 7.00%, | | | | |
05/15/2027(b) | | 4,142,000 | | 4,500,697 |
iHeartCommunications, Inc., 8.38%, | | | | |
05/01/2027 | | 5,979,000 | | 6,503,956 |
TV Azteca S.A.B. de C.V. (Mexico), | | | | |
8.25%, 08/09/2024(b) | | 2,905,000 | | 2,635,082 |
| | | | 26,422,306 |
See accompanying Notes to Financial Statements which are an integral part of the financial statements.
| Principal | | |
| Amount | | Value |
Building Products–0.45% | | | |
Advanced Drainage Systems, Inc., | | | |
5.00%, 09/30/2027(b) | $ 1,614,000 | $ | 1,673,068 |
Builders FirstSource, Inc., 5.00%, | | | |
03/01/2030(b) | 914,000 | | 916,153 |
Standard Industries, Inc., 6.00%, | | | |
10/15/2025(b) | 2,220,000 | | 2,325,428 |
| | | 4,914,649 |
Cable & Satellite–5.34% | | | |
Altice Financing S.A. (Luxembourg), | | | |
7.50%, 05/15/2026(b) | 3,510,000 | | 3,700,944 |
CCO Holdings LLC/CCO Holdings Capital | | | |
Corp., | | | |
5.75%, 02/15/2026(b) | 7,396,000 | | 7,703,304 |
4.50%, 08/15/2030(b) | 1,276,000 | | 1,292,747 |
Charter Communications | | | |
Operating LLC/Charter | | | |
Communications Operating Capital | | | |
Corp., 5.38%, 04/01/2038 | 2,800,000 | | 3,220,370 |
CSC Holdings LLC, | | | |
7.75%, 07/15/2025(b) | 3,100,000 | | 3,270,469 |
10.88%, 10/15/2025(b) | 5,809,000 | | 6,384,527 |
6.50%, 02/01/2029(b) | 4,625,000 | | 5,101,953 |
5.75%, 01/15/2030(b) | 826,000 | | 874,527 |
DISH DBS Corp., | | | |
5.88%, 11/15/2024 | 6,155,000 | | 6,326,201 |
7.75%, 07/01/2026 | 2,782,000 | | 2,994,573 |
DISH Network Corp., Conv., 3.38%, | | | |
08/15/2026 | 3,951,000 | | 3,824,598 |
Telenet Finance Luxembourg Notes | | | |
S.a r.l. (Belgium), 5.50%, | | | |
03/01/2028(b) | 3,000,000 | | 3,183,000 |
UPC Holding B.V. (Netherlands), | | | |
5.50%, 01/15/2028(b) | 1,000,000 | | 1,015,950 |
Virgin Media Secured Finance PLC | | | |
(United Kingdom), 5.50%, | | | |
08/15/2026(b) | 3,502,000 | | 3,611,928 |
VTR Finance B.V. (Chile), 6.88%, | | | |
01/15/2024(b) | 4,647,000 | | 4,747,677 |
Ziggo B.V. (Netherlands), 5.50%, | | | |
01/15/2027(b) | 225,000 | | 232,175 |
Ziggo Bond Co B.V. (Netherlands), | | | |
5.13%, 02/28/2030(b) | 488,000 | | 487,085 |
| | | 57,972,028 |
Casinos & Gaming–2.27% | | | |
Boyd Gaming Corp., | | | |
6.38%, 04/01/2026 | 730,000 | | 762,375 |
6.00%, 08/15/2026 | 1,499,000 | | 1,544,041 |
Cirsa Finance International S.a.r.l. | | | |
(Spain), 7.88%, 12/20/2023(b) | 1,368,000 | | 1,432,828 |
Codere Finance 2 (Luxembourg) S.A. | | | |
(Spain), 7.63%, 11/01/2021(b) | 2,114,000 | | 1,851,251 |
Melco Resorts Finance Ltd. | | | |
(Hong Kong), 5.63%, | | | |
07/17/2027(b) | 1,807,000 | | 1,894,226 |
MGM China Holdings Ltd. (Macau), | | | |
5.88%, 05/15/2026(b) | 851,000 | | 863,234 |
MGM Resorts International, 7.75%, | | | |
03/15/2022 | 5,095,000 | | 5,588,094 |
Scientific Games International, Inc., | | | |
7.00%, 05/15/2028(b) | 1,856,000 | | 1,811,874 |
Studio City Finance Ltd. (Macau), | | | |
7.25%, 02/11/2024(b) | 4,037,000 | | 4,237,175 |
| | Principal | | |
| | Amount | | Value |
Casinos & Gaming–(continued) | | | | |
Wynn Las Vegas LLC/Wynn Las Vegas | | | | |
Capital Corp., 5.50%, | | | | |
03/01/2025(b) | $ | 4,770,000 | $ | 4,692,440 |
| | | | 24,677,538 |
Coal & Consumable Fuels–0.67% | | | | |
SunCoke Energy Partners | | | | |
L.P./SunCoke Energy Partners | | | | |
Finance Corp., 7.50%, | | | | |
06/15/2025(b) | | 8,108,000 | | 7,317,389 |
Commodity Chemicals–0.87% | | | | |
Koppers, Inc., 6.00%, | | | | |
02/15/2025(b) | | 3,677,000 | | 3,631,000 |
Nufarm Australia Ltd./Nufarm | | | | |
Americas, Inc. (Australia), 5.75%, | | | | |
04/30/2026(b) | | 2,054,000 | | 2,029,039 |
Olin Corp., 5.63%, 08/01/2029 | | 3,749,000 | | 3,788,927 |
| | | | 9,448,966 |
Communications Equipment–0.68% | | |
Hughes Satellite Systems Corp., | | | | |
7.63%, 06/15/2021 | | 5,663,000 | | 5,973,785 |
5.25%, 08/01/2026 | | 1,250,000 | | 1,373,872 |
| | | | 7,347,657 |
Construction & Engineering–0.30% | | | |
Valmont Industries, Inc., 5.00%, | | | | |
10/01/2044 | | 2,811,000 | | 3,240,753 |
Construction Materials–0.19% | | | | |
Cemex S.A.B. de C.V. (Mexico), | | | | |
5.45%, 11/19/2029(b) | | 2,020,000 | | 2,030,100 |
Consumer Finance–1.66% | | | | |
Ally Financial, Inc., 8.00%, | | | | |
03/15/2020 | | 5,353,000 | | 5,365,847 |
Navient Corp., | | | | |
8.00%, 03/25/2020 | | 1,719,000 | | 1,727,965 |
7.25%, 01/25/2022 | | 2,639,000 | | 2,782,245 |
7.25%, 09/25/2023 | | 5,808,000 | | 6,258,062 |
5.00%, 03/15/2027 | | 1,897,000 | | 1,839,521 |
| | | | 17,973,640 |
Copper–1.87% | | | | |
First Quantum Minerals Ltd. (Zambia), | | | | |
7.50%, 04/01/2025(b) | | 7,686,000 | | 7,336,941 |
Freeport-McMoRan, Inc., 5.40%, | | | | |
11/14/2034 | | 7,829,000 | | 7,654,237 |
Taseko Mines Ltd. (Canada), 8.75%, | | | | |
06/15/2022(b) | | 5,925,000 | | 5,349,161 |
| | | | 20,340,339 |
Data Processing & Outsourced Services–0.46% | | |
Alliance Data Systems Corp., 4.75%, | | | | |
12/15/2024(b) | | 2,903,000 | | 2,855,826 |
Cardtronics, Inc./Cardtronics USA, | | | | |
Inc., 5.50%, 05/01/2025(b) | | 2,095,000 | | 2,153,482 |
| | | | 5,009,308 |
Department Stores–0.28% | | | | |
Kohl's Corp., 5.55%, 07/17/2045 | | 2,800,000 | | 3,004,396 |
See accompanying Notes to Financial Statements which are an integral part of the financial statements.
10 | Invesco High Yield Fund |
| | Principal | | |
| | Amount | | Value |
Distributors–0.69% | | | | |
Core & Main Holdings L.P., 9.38% PIK | | | | |
Rate, 8.63% Cash Rate, | | | | |
09/15/2024(b)(e) | $ | 7,185,000 | $ | 7,475,382 |
Diversified Banks–0.83% | | | | |
Barclays Bank PLC (United Kingdom), | | | | |
7.63%, 11/21/2022 | | 1,212,000 | | 1,351,222 |
Credit Agricole S.A. (France), | | | | |
8.13%(b)(f) | | 3,082,000 | | 3,647,193 |
Societe Generale S.A. (France), | | | | |
7.38%(b)(f) | | 2,005,000 | | 2,099,786 |
Standard Chartered PLC (United | | | | |
Kingdom), 7.50%(b)(f) | | 1,836,000 | | 1,929,517 |
| | | | 9,027,718 |
Diversified Capital Markets–0.09% | | | |
Credit Suisse Group AG (Switzerland), | | | | |
5.10%(b)(f) | | 945,000 | | 939,094 |
Diversified Chemicals–0.32% | | | | |
Chemours Co. (The), 7.00%, | | | | |
05/15/2025 | | 1,735,000 | | 1,621,505 |
Trinseo Materials Operating | | | | |
S.C.A./Trinseo Materials Finance, | | | | |
Inc., 5.38%, 09/01/2025(b) | | 2,017,000 | | 1,875,810 |
| | | | 3,497,315 |
Diversified Metals & Mining–0.63% | | | |
Hudbay Minerals, Inc. (Canada), | | | | |
7.25%, 01/15/2023(b) | | 1,100,000 | | 1,108,706 |
7.63%, 01/15/2025(b) | | 2,853,000 | | 2,754,329 |
Vedanta Resources Ltd. (India), | | | | |
6.38%, 07/30/2022(b) | | 3,108,000 | | 2,970,664 |
| | | | 6,833,699 |
Diversified REITs–1.16% | | | | |
Colony Capital, Inc., | | | | |
Conv., | | | | |
3.88%, 01/15/2021 | | 240,000 | | 238,191 |
5.00%, 04/15/2023 | | 2,808,000 | | 2,788,197 |
iStar, Inc., 4.75%, 10/01/2024 | | 6,250,000 | | 6,392,844 |
VICI Properties L.P./VICI Note Co., Inc., | | | | |
3.50%, 02/15/2025(b) | | 1,072,000 | | 1,075,671 |
3.75%, 02/15/2027(b) | | 1,077,000 | | 1,070,942 |
4.13%, 08/15/2030(b) | | 1,077,000 | | 1,080,366 |
| | | | 12,646,211 |
Diversified Support Services–0.15% | | |
IAA, Inc., 5.50%, 06/15/2027(b) | | 1,528,000 | | 1,620,597 |
Electric Utilities–0.22% | | | | |
DPL, Inc., 4.35%, 04/15/2029(b) | | 2,542,000 | | 2,377,700 |
Electrical Components & Equipment–0.64% | | |
EnerSys, | | | | |
5.00%, 04/30/2023(b) | | 5,451,000 | | 5,721,288 |
4.38%, 12/15/2027(b) | | 1,256,000 | | 1,273,270 |
| | | | 6,994,558 |
Electronic Equipment & Instruments–0.70% | | |
Itron, Inc., 5.00%, 01/15/2026(b) | | 3,406,000 | | 3,515,511 |
MTS Systems Corp., 5.75%, | | | | |
08/15/2027(b) | | 3,957,000 | | 4,037,515 |
| | | | 7,553,026 |
| | Principal | | |
| | Amount | | Value |
Environmental & Facilities Services–0.39% | | |
GFL Environmental, Inc. (Canada), | | | | |
7.00%, 06/01/2026(b) | $ | 1,041,000 | $ | 1,097,316 |
Waste Pro USA, Inc., 5.50%, | | | | |
02/15/2026(b) | | 3,233,000 | | 3,160,831 |
| | | | 4,258,147 |
Fertilizers & Agricultural Chemicals–0.21% | | |
OCI N.V. (Netherlands), 6.63%, | | | | |
04/15/2023(b) | | 2,223,000 | | 2,310,809 |
Food Retail–1.22% | | | | |
Albertson's Cos., Inc./Safeway, Inc./New | | | | |
Albertson's L.P./Albertson's LLC, | | | | |
6.63%, 06/15/2024 | | 5,651,000 | | 5,820,473 |
7.50%, 03/15/2026(b) | | 2,024,000 | | 2,252,967 |
4.63%, 01/15/2027(b) | | 2,869,000 | | 2,831,273 |
5.88%, 02/15/2028(b) | | 2,251,000 | | 2,343,629 |
| | | | 13,248,342 |
Forest Products–0.40% | | | | |
Norbord, Inc. (Canada), 5.75%, | | | | |
07/15/2027(b) | | 4,166,000 | | 4,375,748 |
Gas Utilities–0.53% | | | | |
AmeriGas Partners L.P./AmeriGas | | | | |
Finance Corp., 5.88%, | | | | |
08/20/2026 | | 2,485,000 | | 2,582,834 |
Suburban Propane Partners | | | | |
L.P./Suburban Energy Finance | | | | |
Corp., 5.50%, 06/01/2024 | | 2,685,000 | | 2,663,547 |
Superior Plus L.P./Superior General | | | | |
Partner, Inc. (Canada), 7.00%, | | | | |
07/15/2026(b) | | 426,000 | | 457,033 |
| | | | 5,703,414 |
Health Care Facilities–2.43% | | | | |
Acadia Healthcare Co., Inc., | | | | |
5.63%, 02/15/2023 | | 2,000 | | 2,019 |
6.50%, 03/01/2024 | | 3,255,000 | | 3,349,932 |
Community Health Systems, Inc., | | | | |
6.88%, 02/01/2022 | | 1,532,000 | | 1,443,910 |
6.63%, 02/15/2025(b) | | 2,480,000 | | 2,535,800 |
8.00%, 03/15/2026(b) | | 3,229,000 | | 3,340,639 |
HCA, Inc., | | | | |
7.50%, 02/15/2022 | | 5,063,000 | | 5,604,640 |
5.38%, 02/01/2025 | | 2,630,000 | | 2,912,949 |
5.88%, 02/15/2026 | | 748,000 | | 845,786 |
5.38%, 09/01/2026 | | 1,437,000 | | 1,601,975 |
5.50%, 06/15/2047 | | 1,130,000 | | 1,345,179 |
Tenet Healthcare Corp., 8.13%, | | | | |
04/01/2022 | | 3,174,000 | | 3,444,520 |
| | | | 26,427,349 |
Health Care REITs–0.29% | | | | |
MPT Operating Partnership L.P./MPT | | | | |
Finance Corp., 5.00%, | | | | |
10/15/2027REIT | | 3,050,000 | | 3,190,407 |
Health Care Services–1.36% | | | | |
Envision Healthcare Corp., 8.75%, | | | | |
10/15/2026(b) | | 1,650,000 | | 878,052 |
Hadrian Merger Sub, Inc., 8.50%, | | | | |
05/01/2026(b) | | 5,801,000 | | 5,948,041 |
See accompanying Notes to Financial Statements which are an integral part of the financial statements.
11 | Invesco High Yield Fund |
| | Principal | | |
| | Amount | | Value |
Health Care Services–(continued) | | | |
MPH Acquisition Holdings LLC, | | | | |
7.13%, 06/01/2024(b) | $ | 4,760,000 | $ | 4,439,699 |
Surgery Center Holdings, Inc., | | | | |
10.00%, 04/15/2027(b) | | 1,596,000 | | 1,748,174 |
Team Health Holdings, Inc., 6.38%, | | | | |
02/01/2025(b) | | 3,167,000 | | 1,751,082 |
| | | | 14,765,048 |
Home Improvement Retail–0.16% | | | |
Hillman Group, Inc. (The), 6.38%, | | | | |
07/15/2022(b) | | 1,874,000 | | 1,686,015 |
Homebuilding–2.28% | | | | |
Ashton Woods USA LLC/Ashton Woods | | | | |
Finance Co., 9.88%, | | | | |
04/01/2027(b) | | 3,296,000 | | 3,742,105 |
KB Home, 4.80%, 11/15/2029 | | 2,227,000 | | 2,343,918 |
Lennar Corp., | | | | |
8.38%, 01/15/2021 | | 867,000 | | 906,622 |
5.38%, 10/01/2022 | | 4,053,000 | | 4,307,577 |
5.25%, 06/01/2026 | | 990,000 | | 1,093,799 |
Mattamy Group Corp. (Canada), | | | | |
5.25%, 12/15/2027(b) | | 2,060,000 | | 2,137,250 |
Meritage Homes Corp., 5.13%, | | | | |
06/06/2027 | | 2,788,000 | | 3,109,589 |
PulteGroup, Inc., 6.38%, | | | | |
05/15/2033 | | 87,000 | | 106,886 |
Taylor Morrison Communities, Inc., | | | | |
6.63%, 07/15/2027(b) | | 4,406,000 | | 4,788,749 |
5.75%, 01/15/2028(b) | | 2,034,000 | | 2,253,118 |
| | | | 24,789,613 |
Hotel & Resort REITs–0.27% | | | | |
Service Properties Trust, 4.95%, | | | | |
10/01/2029 | | 2,800,000 | | 2,956,734 |
Household Products–1.16% | | | | |
Energizer Holdings, Inc., | | | | |
6.38%, 07/15/2026(b) | | 578,000 | | 600,629 |
7.75%, 01/15/2027(b) | | 2,083,000 | | 2,263,908 |
Reynolds Group Issuer, Inc./LLC, | | | | |
7.00%, 07/15/2024(b) | | 3,834,000 | | 3,877,152 |
Spectrum Brands, Inc., 5.75%, | | | | |
07/15/2025 | | 5,658,000 | | 5,813,538 |
| | | | 12,555,227 |
Human Resource & Employment Services–0.36% | |
ASGN, Inc., 4.63%, 05/15/2028(b) | | 3,926,000 | | 3,889,292 |
Independent Power Producers & Energy Traders–0.86% |
AES Corp. (The), 5.50%, | | | | |
04/15/2025 | | 1,569,000 | | 1,608,868 |
Calpine Corp., 5.50%, 02/01/2024 | | 2,200,000 | | 2,167,022 |
Enviva Partners L.P./Enviva Partners | | | | |
Finance Corp., 6.50%, | | | | |
01/15/2026(b) | | 2,480,000 | | 2,585,450 |
NRG Energy, Inc., | | | | |
6.63%, 01/15/2027 | | 445,000 | | 464,789 |
5.25%, 06/15/2029(b) | | 2,402,000 | | 2,501,059 |
| | | | 9,327,188 |
Industrial Machinery–1.71% | | | | |
Cleaver-Brooks, Inc., 7.88%, | | | | |
03/01/2023(b) | | 7,661,000 | | 7,568,417 |
| | Principal | | |
| | Amount | | Value |
Industrial Machinery–(continued) | | | | |
EnPro Industries, Inc., 5.75%, | | | | |
10/15/2026 | $ | 4,997,000 | $ | 5,323,541 |
Mueller Industries, Inc., 6.00%, | | | | |
03/01/2027 | | 5,570,000 | | 5,641,561 |
| | | | 18,533,519 |
Integrated Oil & Gas–0.62% | | | | |
Petrobras Global Finance B.V. | | | | |
(Brazil), 5.75%, 02/01/2029 | | 4,851,000 | | 5,477,992 |
Petroleos Mexicanos (Mexico), | | | | |
5.95%, 01/28/2031(b) | | 1,330,000 | | 1,303,400 |
| | | | 6,781,392 |
Integrated Telecommunication Services–3.83% | | |
Altice France S.A. (France), 7.38%, | | | | |
05/01/2026(b) | | 4,808,000 | | 5,051,044 |
AT&T, Inc., 4.75%, 05/15/2046 | | 2,800,000 | | 3,306,518 |
Cincinnati Bell, Inc., | | | | |
7.00%, 07/15/2024(b) | | 3,388,000 | | 3,570,071 |
8.00%, 10/15/2025(b) | | 666,000 | | 717,478 |
CommScope, Inc., | | | | |
6.00%, 03/01/2026(b) | | 3,812,000 | | 3,919,895 |
8.25%, 03/01/2027(b) | | 5,981,000 | | 6,044,399 |
Embarq Corp., 8.00%, 06/01/2036 | | 3,195,000 | | 3,408,346 |
Frontier Communications Corp., | | | | |
10.50%, 09/15/2022 | | 9,954,000 | | 4,544,618 |
11.00%, 09/15/2025 | | 4,028,000 | | 1,852,880 |
Telecom Italia Capital S.A. (Italy), | | | | |
6.38%, 11/15/2033 | | 731,000 | | 848,713 |
7.20%, 07/18/2036 | | 2,822,000 | | 3,501,679 |
T-Mobile USA, Inc., 6.50%, | | | | |
01/15/2026 | | 4,609,000 | | 4,860,882 |
| | | | 41,626,523 |
Interactive Media & Services–1.41% | | |
Cable Onda S.A. (Panama), 4.50%, | | | | |
01/30/2030(b) | | 1,575,000 | | 1,605,476 |
Cumulus Media New Holdings, Inc., | | | | |
6.75%, 07/01/2026(b) | | 5,021,000 | | 5,223,467 |
Diamond Sports Group LLC/Diamond | | | | |
Sports Finance Co., | | | | |
5.38%, 08/15/2026(b) | | 3,456,000 | | 3,192,978 |
6.63%, 08/15/2027(b) | | 6,543,000 | | 5,311,934 |
| | | | 15,333,855 |
Internet & Direct Marketing Retail–0.32% | | |
Prosus N.V. (China), 3.68%, | | | | |
01/21/2030(b) | | 585,000 | | 606,592 |
QVC, Inc., 5.45%, 08/15/2034 | | 2,800,000 | | 2,823,676 |
| | | | 3,430,268 |
Internet Services & Infrastructure–0.02% | | |
EIG Investors Corp., 10.88%, | | | | |
02/01/2024 | | 146,000 | | 152,904 |
Rackspace Hosting, Inc., 8.63%, | | | | |
11/15/2024(b) | | 11,000 | | 10,560 |
| | | | 163,464 |
Leisure Products–0.30% | | | | |
Mattel, Inc., 6.75%, 12/31/2025(b) | | 3,041,000 | | 3,202,279 |
See accompanying Notes to Financial Statements which are an integral part of the financial statements.
12 | Invesco High Yield Fund |
| | Principal | | |
| | Amount | | Value |
Managed Health Care–0.70% | | | | |
Centene Corp., | | | | |
5.38%, 06/01/2026(b) | $ | 2,317,000 | $ | 2,442,929 |
5.38%, 08/15/2026(b) | | 1,267,000 | | 1,335,101 |
4.63%, 12/15/2029(b) | | 1,816,000 | | 1,946,480 |
Molina Healthcare, Inc., 4.88%, | | | | |
06/15/2025(b) | | 1,846,000 | | 1,879,071 |
| | | | 7,603,581 |
Metal & Glass Containers–0.68% | | | | |
Ardagh Packaging Finance | | | | |
PLC/Ardagh Holdings USA, Inc., | | | | |
6.00%, 02/15/2025(b) | | 1,244,000 | | 1,299,980 |
Flex Acquisition Co., Inc., 7.88%, | | | | |
07/15/2026(b) | | 5,993,000 | | 6,096,814 |
| | | | 7,396,794 |
Movies & Entertainment–1.37% | | | | |
AMC Entertainment Holdings, Inc., | | | | |
5.75%, 06/15/2025 | | 4,931,000 | | 3,971,502 |
6.13%, 05/15/2027 | | 3,873,000 | | 3,108,179 |
Netflix, Inc., | | | | |
5.88%, 11/15/2028 | | 3,418,000 | | 3,849,181 |
5.38%, 11/15/2029(b) | | 3,645,000 | | 3,969,587 |
| | | | 14,898,449 |
Office Services & Supplies–0.12% | | | |
Pitney Bowes, Inc., 5.20%, | | | | |
04/01/2023 | | 1,266,000 | | 1,269,690 |
Oil & Gas Drilling–1.02% | | | | |
Diamond Offshore Drilling, Inc., | | | | |
4.88%, 11/01/2043 | | 1,582,000 | | 643,186 |
Ensign Drilling, Inc. (Canada), 9.25%, | | | | |
04/15/2024(b) | | 2,797,000 | | 2,520,824 |
Precision Drilling Corp. (Canada), | | | | |
7.75%, 12/15/2023 | | 712,000 | | 699,836 |
5.25%, 11/15/2024 | | 2,608,000 | | 2,314,065 |
Transocean, Inc., | | | | |
8.00%, 02/01/2027(b) | | 934,000 | | 783,393 |
7.50%, 04/15/2031 | | 4,178,000 | | 2,496,459 |
Valaris PLC, 7.75%, 02/01/2026 | | 4,109,000 | | 1,633,225 |
| | | | 11,090,988 |
Oil & Gas Equipment & Services–0.43% | | |
Calfrac Holdings L.P. (Canada), | | | | |
10.88%, 03/15/2026(b) | | 716,100 | | 648,071 |
8.50%, 06/15/2026(b) | | 1,349,000 | | 360,891 |
Hilcorp Energy I L.P./Hilcorp Finance | | | | |
Co., 6.25%, 11/01/2028(b) | | 1,800,000 | | 1,314,661 |
SESI LLC, 7.13%, 12/15/2021(b) | | 2,904,000 | | 2,368,212 |
| | | | 4,691,835 |
Oil & Gas Exploration & Production–4.39% | | |
Ascent Resources Utica | | | | |
Holdings LLC/ARU Finance Corp., | | | | |
10.00%, 04/01/2022(b) | | 4,137,000 | | 3,535,950 |
California Resources Corp., 8.00%, | | | | |
12/15/2022(b) | | 4,503,000 | | 1,046,948 |
Callon Petroleum Co., | | | | |
6.13%, 10/01/2024 | | 3,325,000 | | 2,643,375 |
6.38%, 07/01/2026 | | 1,434,000 | | 1,119,018 |
Chesapeake Energy Corp., 11.50%, | | | | |
01/01/2025(b) | | 1,377,040 | | 826,224 |
| Principal | | |
| Amount | | Value |
Oil & Gas Exploration & Production–(continued) | | |
Denbury Resources, Inc., | | | |
9.00%, 05/15/2021(b) | $ 2,100,000 | $ | 1,842,225 |
5.50%, 05/01/2022 | 3,015,000 | | 1,665,094 |
EP Energy LLC/Everest Acquisition | | | |
Finance, Inc., 8.00%, | | | |
11/29/2024(b)(c) | 3,430,000 | | 1,457,750 |
Genesis Energy L.P./Genesis Energy | | | |
Finance Corp., | | | |
6.25%, 05/15/2026 | 6,911,000 | | 5,790,364 |
7.75%, 02/01/2028 | 1,404,000 | | 1,226,745 |
Gulfport Energy Corp., | | | |
6.63%, 05/01/2023 | 6,163,000 | | 3,237,486 |
6.00%, 10/15/2024 | 3,518,000 | | 1,178,530 |
Oasis Petroleum, Inc., | | | |
6.88%, 03/15/2022 | 1,100,000 | | 866,250 |
6.88%, 01/15/2023 | 3,971,000 | | 3,087,452 |
6.25%, 05/01/2026(b) | 2,368,000 | | 1,462,299 |
QEP Resources, Inc., | | | |
5.25%, 05/01/2023 | 1,561,000 | | 1,385,700 |
5.63%, 03/01/2026 | 6,163,000 | | 4,945,962 |
SM Energy Co., 6.63%, | | | |
01/15/2027 | 2,115,000 | | 1,644,037 |
Southwestern Energy Co., | | | |
7.50%, 04/01/2026 | 3,252,000 | | 2,487,861 |
7.75%, 10/01/2027 | 1,800,000 | | 1,368,045 |
Whiting Petroleum Corp., | | | |
Conv., 1.25%, 04/01/2020 | 458,000 | | 413,345 |
5.75%, 03/15/2021 | 2,920,000 | | 1,685,570 |
6.25%, 04/01/2023 | 2,971,000 | | 1,344,377 |
6.63%, 01/15/2026 | 3,760,000 | | 1,381,894 |
| | | 47,642,501 |
Oil & Gas Refining & Marketing–1.74% | | |
Calumet Specialty Products Partners | | | |
L.P./Calumet Finance Corp., | | | |
7.63%, 01/15/2022 | 5,185,000 | | 5,142,939 |
EnLink Midstream Partners L.P., | | | |
5.60%, 04/01/2044 | 2,117,000 | | 1,635,372 |
NuStar Logistics L.P., 6.00%, | | | |
06/01/2026 | 4,647,000 | | 4,865,288 |
Parkland Fuel Corp. (Canada), | | | |
6.00%, 04/01/2026(b) | 4,302,000 | | 4,503,549 |
PBF Holding Co. LLC/PBF Finance | | | |
Corp., 6.00%, 02/15/2028(b) | 2,726,000 | | 2,698,740 |
| | | 18,845,888 |
Oil & Gas Storage & Transportation–1.91% | | |
Antero Midstream Partners | | | |
L.P./Antero Midstream Finance | | | |
Corp., 5.75%, 01/15/2028(b) | 6,616,000 | | 4,558,258 |
Crestwood Midstream Partners | | | |
L.P./Crestwood Midstream Finance | | | |
Corp., 5.75%, 04/01/2025 | 1,404,000 | | 1,375,906 |
Holly Energy Partners L.P./Holly | | | |
Energy Finance Corp., 5.00%, | | | |
02/01/2028(b) | 1,095,000 | | 1,103,897 |
NGL Energy Partners L.P./NGL Energy | | | |
Finance Corp., 7.50%, | | | |
04/15/2026 | 5,764,000 | | 4,913,075 |
See accompanying Notes to Financial Statements which are an integral part of the financial statements.
13 | Invesco High Yield Fund |
| | Principal | | |
| | Amount | | Value |
Oil & Gas Storage & Transportation–(continued) | | |
Targa Resources Partners L.P./Targa | | | | |
Resources Partners Finance Corp., | | | | |
5.13%, 02/01/2025 | $ | 3,016,000 | $ | 3,034,880 |
5.88%, 04/15/2026 | | 2,638,000 | | 2,722,347 |
5.50%, 03/01/2030(b) | | 746,000 | | 739,249 |
Williams Cos., Inc. (The), 7.88%, | | | | |
09/01/2021 | | 2,127,000 | | 2,328,566 |
| | | | 20,776,178 |
Other Diversified Financial Services–1.65% | | |
eG Global Finance PLC (Netherlands), | | | | |
6.75%, 02/07/2025(b) | | 3,100,000 | | 3,036,714 |
8.50%, 10/30/2025(b) | | 1,474,000 | | 1,539,718 |
Lions Gate Capital Holdings LLC, | | | | |
6.38%, 02/01/2024(b) | | 3,757,000 | | 3,691,215 |
LPL Holdings, Inc., 5.75%, | | | | |
09/15/2025(b) | | 3,003,000 | | 3,123,090 |
Tempo Acquisition LLC/Tempo | | | | |
Acquisition Finance Corp., 6.75%, | | | | |
06/01/2025(b) | | 6,590,000 | | 6,575,568 |
| | | | 17,966,305 |
Packaged Foods & Meats–2.76% | | | | |
B&G Foods, Inc., | | | | |
5.25%, 04/01/2025 | | 3,737,000 | | 3,698,042 |
5.25%, 09/15/2027 | | 1,033,000 | | 1,023,961 |
JBS USA LUX S.A./JBS USA Food | | | | |
Co./JBS USA Finance, Inc., | | | | |
5.50%, 01/15/2030(b) | | 4,218,000 | | 4,459,101 |
Kraft Heinz Foods Co., | | | | |
6.88%, 01/26/2039 | | 2,800,000 | | 3,350,162 |
5.00%, 06/04/2042 | | 2,720,000 | | 2,735,571 |
Pilgrim's Pride Corp., 5.88%, | | | | |
09/30/2027(b) | | 2,597,000 | | 2,696,075 |
Post Holdings, Inc., | | | | |
5.63%, 01/15/2028(b) | | 2,642,000 | | 2,766,332 |
4.63%, 04/15/2030(b) | | 2,342,000 | | 2,314,107 |
Simmons Foods, Inc., 5.75%, | | | | |
11/01/2024(b) | | 3,929,000 | | 3,897,902 |
TreeHouse Foods, Inc., 6.00%, | | | | |
02/15/2024(b) | | 2,964,000 | | 3,066,510 |
| | | | 30,007,763 |
Paper Packaging–0.43% | | | | |
Cascades, Inc./Cascades USA, Inc. | | | | |
(Canada), 5.38%, 01/15/2028(b) | | 1,600,000 | | 1,652,000 |
Trivium Packaging Finance B.V. | | | | |
(Netherlands), | | | | |
5.50%, 08/15/2026(b) | | 2,134,000 | | 2,215,361 |
8.50%, 08/15/2027(b) | | 708,000 | | 745,630 |
| | | | 4,612,991 |
Paper Products–0.82% | | | | |
Mercer International, Inc. (Germany), | | | | |
5.50%, 01/15/2026 | | 2,013,000 | | 1,903,744 |
Schweitzer-Mauduit International, | | | | |
Inc., 6.88%, 10/01/2026(b) | | 6,512,000 | | 7,002,663 |
| | | | 8,906,407 |
Pharmaceuticals–2.07% | | | | |
Bausch Health Americas, Inc., | | | | |
9.25%, 04/01/2026(b) | | 2,613,000 | | 2,924,391 |
| | Principal | | |
| | Amount | | Value |
Pharmaceuticals–(continued) | | | | |
Bausch Health Cos., Inc., | | | | |
5.50%, 11/01/2025(b) | $ | 1,820,000 | $ | 1,877,630 |
9.00%, 12/15/2025(b) | | 3,441,000 | | 3,840,018 |
5.75%, 08/15/2027(b) | | 1,092,000 | | 1,163,635 |
Endo Dac/Endo Finance LLC/Endo | | | | |
Finco, Inc., 6.00%, | | | | |
07/15/2023(b) | | 5,715,000 | | 4,500,620 |
HLF Financing S.a.r.l. LLC/Herbalife | | | | |
International, Inc., 7.25%, | | | | |
08/15/2026(b) | | 5,571,000 | | 5,633,674 |
Par Pharmaceutical, Inc., 7.50%, | | | | |
04/01/2027(b) | | 2,346,000 | | 2,483,300 |
| | | | 22,423,268 |
Property & Casualty Insurance–0.12% | | |
AmWINS Group, Inc., 7.75%, | | | | |
07/01/2026(b) | | 1,251,000 | | 1,302,263 |
Publishing–0.51% | | | | |
Meredith Corp., 6.88%, | | | | |
02/01/2026 | | 5,463,000 | | 5,493,306 |
Railroads–1.00% | | | | |
Kenan Advantage Group, Inc. (The), | | | | |
7.88%, 07/31/2023(b) | | 11,007,000 | | 10,873,980 |
Real Estate Development–0.02% | | | | |
China Evergrande Group (China), | | | | |
8.25%, 03/23/2022(b) | | 240,000 | | 226,436 |
Research & Consulting Services–0.19% | | |
Dun & Bradstreet Corp. (The), | | | | |
10.25%, 02/15/2027(b) | | 1,858,000 | | 2,089,042 |
Restaurants–0.65% | | | | |
1011778 BC ULC/New Red Finance, | | | | |
Inc. (Canada), 5.00%, | | | | |
10/15/2025(b) | | 2,663,000 | | 2,680,749 |
IRB Holding Corp., 6.75%, | | | | |
02/15/2026(b) | | 4,432,000 | | 4,411,380 |
| | | | 7,092,129 |
Security & Alarm Services–0.65% | | | |
Brink's Co. (The), 4.63%, | | | | |
10/15/2027(b) | | 3,983,000 | | 4,091,825 |
GW B-CR Security Corp. (Canada), | | | | |
9.50%, 11/01/2027(b) | | 1,507,000 | | 1,600,208 |
Prime Security Services | | | | |
Borrower LLC/Prime Finance, Inc., | | | | |
5.75%, 04/15/2026(b) | | 1,335,000 | | 1,390,902 |
| | | | 7,082,935 |
Specialized Consumer Services–0.57% | | |
ServiceMaster Co. LLC (The), 7.45%, | | | | |
08/15/2027 | | 5,389,000 | | 6,185,750 |
Specialized REITs–1.07% | | | | |
Iron Mountain US Holdings, Inc., | | | | |
5.38%, 06/01/2026(b) | | 355,000 | | 368,436 |
Iron Mountain, Inc., | | | | |
5.75%, 08/15/2024 | | 4,067,000 | | 4,107,629 |
5.25%, 03/15/2028(b) | | 4,557,000 | | 4,726,293 |
Rayonier A.M. Products, Inc., 5.50%, | | | | |
06/01/2024(b) | | 4,162,000 | | 2,392,297 |
| | | | 11,594,655 |
See accompanying Notes to Financial Statements which are an integral part of the financial statements.
14 | Invesco High Yield Fund |
| | Principal | | |
| | Amount | | Value |
Specialty Chemicals–0.70% | | | | |
Element Solutions, Inc., 5.88%, | | | | |
12/01/2025(b) | $ | 3,778,000 | $ | 3,806,373 |
GCP Applied Technologies, Inc., | | | | |
5.50%, 04/15/2026(b) | | 3,689,000 | | 3,847,064 |
| | | | 7,653,437 |
Steel–0.15% | | | | |
AK Steel Corp., 7.63%, 10/01/2021 | | 1,600,000 | | 1,601,520 |
Systems Software–0.21% | | | | |
Banff Merger Sub, Inc., 9.75%, | | | | |
09/01/2026(b) | | 1,030,000 | | 1,040,326 |
Camelot Finance S.A., 4.50%, | | | | |
11/01/2026(b) | | 1,251,000 | | 1,259,474 |
| | | | 2,299,800 |
Technology Hardware, Storage & Peripherals–0.97% | |
Dell International LLC/EMC Corp., | | | | |
7.13%, 06/15/2024(b) | | 5,499,000 | | 5,760,202 |
8.10%, 07/15/2036(b) | | 2,880,000 | | 3,958,467 |
Exela Intermediate LLC/Exela | | | | |
Finance Inc., 10.00%, | | | | |
07/15/2023(b) | | 830,000 | | 282,200 |
Presidio Holdings, Inc., 8.25%, | | | | |
02/01/2028(b) | | 550,000 | | 568,563 |
| | | | 10,569,432 |
Textiles–0.33% | | | | |
Eagle Intermediate Global Holding | | | | |
B.V./Ruyi US Finance LLC (China), | | | | |
7.50%, 05/01/2025(b) | | 5,094,000 | | 3,580,649 |
Thrifts & Mortgage Finance–0.07% | | | |
Nationstar Mortgage Holdings, Inc., | | | | |
6.00%, 01/15/2027(b) | | 773,000 | | 786,725 |
Trading Companies & Distributors–1.80% | | |
AerCap Global Aviation Trust | | | | |
(Ireland), 6.50%, | | | | |
06/15/2045(b)(g) | | 3,288,000 | | 3,543,149 |
BMC East LLC, 5.50%, | | | | |
10/01/2024(b) | | 4,521,000 | | 4,669,809 |
Herc Holdings, Inc., 5.50%, | | | | |
07/15/2027(b) | | 4,747,000 | | 4,936,524 |
United Rentals North America, Inc., | | | | |
5.88%, 09/15/2026 | | 2,084,000 | | 2,198,568 |
6.50%, 12/15/2026 | | 1,487,000 | | 1,588,339 |
5.25%, 01/15/2030 | | 2,478,000 | | 2,611,440 |
| | | | 19,547,829 |
Trucking–0.36% | | | | |
Avis Budget Car Rental LLC/Avis | | | | |
Budget Finance, Inc., 5.25%, | | | | |
03/15/2025(b) | | 3,890,000 | | 3,932,070 |
Wireless Telecommunication Services–3.72% | | |
Digicel Group One Ltd. (Jamaica), | | | | |
8.25%, 12/30/2022(b) | | 1,698,000 | | 1,095,740 |
Digicel Group Two Ltd. (Jamaica), | | | | |
8.25%, 09/30/2022(b) | | 1,602,000 | | 389,719 |
Intelsat (Luxembourg) S.A. | | | | |
(Luxembourg), 7.75%, | | | | |
06/01/2021 | | 2,609,000 | | 1,976,317 |
| Principal | | |
| Amount | | Value |
Wireless Telecommunication Services–(continued) | |
Intelsat Connect Finance S.A. | | | |
(Luxembourg), 9.50%, | | | |
02/15/2023(b) | $ 1,873,000 | $ | 1,147,213 |
Intelsat Jackson Holdings S.A. | | | |
(Luxembourg), | | | |
5.50%, 08/01/2023 | 2,970,000 | | 2,560,392 |
8.50%, 10/15/2024(b) | 3,410,000 | | 2,990,860 |
9.75%, 07/15/2025(b) | 2,428,000 | | 2,153,842 |
Oztel Holdings SPC Ltd. (Oman), | | | |
5.63%, 10/24/2023(b) | 3,188,000 | | 3,355,128 |
Sprint Capital Corp., 8.75%, | | | |
03/15/2032 | 1,730,000 | | 2,407,900 |
Sprint Communications, Inc., | | | |
11.50%, 11/15/2021 | 3,000,000 | | 3,432,960 |
Sprint Corp., | | | |
7.88%, 09/15/2023 | 9,559,000 | | 10,949,022 |
7.63%, 02/15/2025 | 2,028,000 | | 2,357,550 |
7.63%, 03/01/2026 | 1,837,000 | | 2,175,743 |
Ypso Finance Bis S.A. (Luxembourg), | | | |
10.50%, 05/15/2027(b) | 2,953,000 | | 3,359,037 |
| | | 40,351,423 |
Total U.S. Dollar Denominated Bonds & Notes | | |
(Cost $1,000,358,232) | | | 965,691,953 |
Asset-Backed Securities–2.07%
Apidos CLO XV, Series 2013-15A, | | |
Class CRR, 3.67% (3 mo. USD | | |
LIBOR + 1.85%), | | |
04/20/2031(b)(g) | 3,478,000 | 3,419,006 |
Bain Capital Credit CLO Ltd. (Cayman | | |
Islands), | | |
Series 2019-1A, Class C, 4.57% | | |
(3 mo. USD LIBOR + 2.75%), | | |
04/18/2032(b)(g) | 3,280,000 | 3,293,653 |
Series 2019-3A, Class C, 4.73% | | |
(3 mo. USD LIBOR + 2.85%), | | |
10/21/2032(b)(g) | 2,319,000 | 2,334,745 |
Magnetite XXIII Ltd., Series 2019- | | |
23A, Class C, 4.27% (3 mo. USD | | |
LIBOR + 2.40%), | | |
10/25/2032(b)(g) | 3,469,000 | 3,478,797 |
Neuberger Berman Loan Advisers CLO | | |
34 Ltd., Series 2019-34A, | | |
Class C1, 4.51% (3 mo. USD | | |
LIBOR + 2.60%), | | |
01/20/2033(b)(g) | 3,455,000 | 3,469,474 |
Octagon Investment Partners XVII | | |
Ltd., Series 2013-1A, Class CR2, | | |
3.49% (3 mo. USD LIBOR + | | |
1.70%), 01/25/2031(b)(g) | 3,248,497 | 3,160,439 |
Sonic Capital LLC, Series 2020-1A, | | |
Class A2I, 3.85%, | | |
01/20/2050(b) | 3,232,000 | 3,353,410 |
Total Asset-Backed Securities | | |
(Cost $22,225,163) | | 22,509,524 |
Exchange-Traded Funds–2.01% | Shares | |
| |
Invesco Senior Loan ETF(h) | 743,000 | 16,338,570 |
SPDR S&P 500 ETF Trust | 18,500 | 5,480,810 |
Total Exchange-Traded Funds | | |
(Cost $22,198,297) | | 21,819,380 |
See accompanying Notes to Financial Statements which are an integral part of the financial statements.
15 | Invesco High Yield Fund |
| | Principal | | |
| | Amount | | Value |
Variable Rate Senior Loan Interests–1.76%(i) | |
Cable & Satellite–0.84% | | | | |
Altice Financing S.A. (Luxembourg), | | | | |
Term Loan, 4.41% (1 mo. USD | | | | |
LIBOR + 2.75%), 07/15/2025(g) | $ | 2,443,718 | $ | 2,368,891 |
Charter Communications | | | | |
Operating LLC, Term Loan B-1, | | | | |
3.36% (1 mo. USD LIBOR + | | | | |
1.75%), 04/30/2025(g) | | 3,400,326 | | 3,373,973 |
CSC Holdings LLC, Term Loan, 4.16% | | | | |
(1 mo. USD LIBOR + 2.50%), | | | | |
04/15/2027(g) | | 3,411,000 | | 3,381,154 |
| | | | 9,124,018 |
Household Products–0.31% | | | | |
Reynolds Group Issuer, Inc./LLC, | | | | |
Incremental Term Loan, 4.35% (1 | | | | |
mo. USD LIBOR + 2.75%), | | | | |
02/05/2023(g) | | 3,405,224 | | 3,380,399 |
Pharmaceuticals–0.30% | | | | |
Valeant Pharmaceuticals | | | | |
International, Inc. (Canada), First | | | | |
Lien Incremental Term Loan, | | | | |
4.41% (1 mo. USD LIBOR + | | | | |
2.75%), 11/27/2025(g) | | 3,321,314 | | 3,309,391 |
Wireless Telecommunication Services–0.31% | | |
Sprint Communications, Inc., | | | | |
Incremental Term Loan, 4.63% (1 | | | | |
mo. USD LIBOR + 3.00%), | | | | |
02/02/2024(g) | | 3,364,504 | | 3,343,476 |
Total Variable Rate Senior Loan Interests | | |
(Cost $19,339,468) | | | | 19,157,284 |
Non-U.S. Dollar Denominated Bonds & Notes–0.55%(j) |
Diversified Banks–0.23% | | | | |
Erste Group Bank AG (Austria), | | | | |
6.50%(f) | EUR | 2,000,000 | | 2,503,428 |
Food Retail–0.23% | | | | |
Iceland Bondco PLC (United Kingdom), | | | |
4.63%, 03/15/2025(b) | GBP | 2,350,000 | | 2,371,363 |
Quatrim S.A.S.U. (France), 5.88%, | | | | |
01/15/2024(b) | EUR | 150,000 | | 167,041 |
| | | | 2,538,404 |
Other Diversified Financial Services–0.02% | | |
eG Global Finance PLC (United | | | | |
Kingdom), 6.25%, | | | | |
10/30/2025(b) | EUR | 200,000 | | 215,347 |
Paper Packaging–0.05% | | | | |
M&G Finance Luxembourg S.A. (Italy), | | | | |
5.23%(c)(f) | EUR | 4,100,000 | | 543,143 |
Textiles–0.02% | | | | |
Eagle Intermediate Global Holding | | | | |
B.V./Ruyi US Finance LLC (China), | | | | |
5.38%, 05/01/2023(b) | EUR | 200,000 | | 165,593 |
Total Non-U.S. Dollar Denominated Bonds & Notes | | |
(Cost $7,356,237) | | | | 5,965,915 |
| | Principal | | |
| | Amount | | Value |
| U.S. Treasury Securities–0.21% | | |
U.S. Treasury Bills–0.21% | | | |
1.69%, 04/09/2020 | | | |
| (Cost $2,271,233)(k)(l) | $ 2,275,000 | $ | 2,271,233 |
U.S. Government Sponsored Agency Mortgage-Backed |
| Securities–0.07% | | | |
| Freddie Mac Multifamily | | | |
| Connecticut Avenue Securities | | | |
| Trust, Series 2019-01, | | | |
| Class M10, | | | |
| 4.88% (1 mo. USD LIBOR + | | | |
| 3.25%), 10/15/2049(b)(g) | | | |
| (Cost $747,000) | 747,000 | | 780,344 |
| | Shares | | |
Common Stocks & Other Equity Interests–0.00% |
Diversified Support Services–0.00% | | |
ACC Claims Holdings LLC(d)(m) | 4,130,550 | | 4 |
Integrated Telecommunication Services–0.00% | | |
Ventelo Ltd. (United Kingdom)(d)(m) | 73,021 | | 0 |
Leisure Products–0.00% | | | |
HF Holdings, Inc.(d)(m) | 36,820 | | 0 |
Other Diversified Financial Services–0.00% | | |
Adelphia Recovery Trust, | | | |
| Series ACC1(m)(n) | 4,846,549 | | 9,208 |
Adelphia Recovery Trust, | | | |
| Series Arahova(m)(n) | 2,211,702 | | 3,318 |
| | | | 12,526 |
| Total Common Stocks & Other Equity Interests | | |
| (Cost $9,361,768) | | | 12,530 |
Money Market Funds–3.28% | | | |
Invesco Government & Agency Portfolio, | | | |
| Institutional Class, 1.50%(o) | 12,220,019 | | 12,220,019 |
Invesco Liquid Assets Portfolio, | | | |
| Institutional Class, 1.64%(o) | 9,414,582 | | 9,419,290 |
Invesco Treasury Portfolio, Institutional | | | |
| Class, 1.48%(o) | 13,965,736 | | 13,965,736 |
| Total Money Market Funds (Cost $35,604,124) | | 35,605,045 |
TOTAL INVESTMENTS IN SECURITIES–98.88% | | |
| (Cost $1,119,461,522) | | | 1,073,813,208 |
OTHER ASSETS LESS LIABILITIES—1.12% | | | 12,140,089 |
NET ASSETS–100.00% | | $1,085,953,297 |
See accompanying Notes to Financial Statements which are an integral part of the financial statements.
16 | Invesco High Yield Fund |

Investment Abbreviations:
CLO | – Collateralized Loan Obligation |
Conv. – Convertible |
ETF | – Exchange-Traded Fund |
EUR | – Euro |
GBP | – British Pound Sterling |
LIBOR – London Interbank Offered Rate |
PIK | – Pay-in-Kind |
REIT | – Real Estate Investment Trust |
SPDR | – Standard & Poor's Depositary Receipt |
USD | – U.S. Dollar |
Notes to Schedule of Investments:
(a)Industry and/or sector classifications used in this report are generally according to the Global Industry Classification Standard, which was developed by and is the exclusive property and a service mark of MSCI Inc. and Standard & Poor's.
(b)Security purchased or received in a transaction exempt from registration under the Securities Act of 1933, as amended (the "1933 Act"). The security may be resold pursuant to an exemption from registration under the 1933 Act, typically to qualified institutional buyers. The aggregate value of these securities at February 29, 2020 was $579,774,887, which represented 53.62% of the Fund's Net Assets.
(c)Defaulted security. Currently, the issuer is in default with respect to principal and/or interest payments. The aggregate value of these securities at February 29, 2020 was $2,000,893, which represented less than 1% of the Fund's Net Assets.
(d)Securities valued using significant unobservable inputs (Level 3). See Note 3.
(e)All or a portion of this security is Pay-in-Kind. Pay-in-Kind securities pay interest income in the form of securities.
(f)Perpetual bond with no specified maturity date.
(g)Interest or dividend rate is redetermined periodically. Rate shown is the rate in effect on February 29, 2020.
(h)The security and the Fund are affiliated by having the same investment adviser. The table below shows the Fund's transactions in, and earnings from, its investments in affiliates (excluding affiliated money market funds) for the fiscal year ended February 29, 2020.
| | | | Change in | | | |
| | | | Unrealized | | | |
| Value | Purchases | Proceeds | Appreciation | Realized | Value | Dividend |
| February 28, 2019 | at Cost | from Sales | (Depreciation) | Gain | February 29, 2020 | Income |
Invesco Senior Loan ETF | $- | $16,858,670 | $- | $(520,100) | $- | $16,338,570 | $- |
| | | | | | | |
(i)Variable rate senior loan interests are, at present, not readily marketable, not registered under the 1933 Act and may be subject to contractual and legal restrictions on sale. Variable rate senior loan interests in the Fund's portfolio generally have variable rates which adjust to a base, such as the London Interbank Offered Rate ("LIBOR"), on set dates, typically every 30 days, but not greater than one year, and/or have interest rates that float at margin above a widely recognized base lending rate such as the Prime Rate of a designated U.S. bank.
(j)Foreign denominated security. Principal amount is denominated in the currency indicated.
(k)All or a portion of the value was designated as collateral to cover margin requirements for swap agreements. See Note 1M.
(l)Security traded on a discount basis. The interest rate shown represents the discount rate at the time of purchase by the Fund.
(m)Non-income producing security.
(n)Acquired as part of the Adelphia Communications bankruptcy reorganization.
(o)The money market fund and the Fund are affiliated by having the same investment adviser. The rate shown is the 7-day SEC standardized yield as of February 29, 2020.
Open Forward Foreign Currency Contracts
| | Contract to | | Unrealized |
Settlement | | Appreciation |
Date | Counterparty | Deliver | Receive | (Depreciation) |
Currency Risk | | | | | | |
05/29/2020 | Goldman Sachs International | GBP 852,762 | USD 1,105,286 | $ | 9,668 |
| | | | | | |
Currency Risk | | | | | | |
05/29/2020 | Goldman Sachs International | EUR 8,743,418 | USD 9,542,173 | | (158,283) |
Total Forward Foreign Currency Contracts | | | | $ | (148,615) |
| | | | | | |
See accompanying Notes to Financial Statements which are an integral part of the financial statements.
17 | Invesco High Yield Fund |
Open Over-The-Counter Total Return Swap Agreements
| | | | | | | | Upfront | | |
| | | | | | | | Payments | | Unrealized |
| Pay/ | | Fixed | Payment | Number of | | | Paid | | Appreciation |
Counterparty | Receive | Reference Entity | Rate | Frequency | Contracts | Maturity Date | Notional Value | (Received) | Value | (Depreciation) |
Interest Rate Risk | | | | | | | | | | |
Morgan Stanley & Co. | | Markit iBoxx USD Liquid | | | | | | | | |
LLC | Receive | Leveraged Loan Index | 1.91% | Quarterly | 60,887 | June—2020 | $ 10,825,000 | $— | $(153,991) | $(153,991) |
Morgan Stanley & Co. | | Markit iBoxx USD Liquid | | | | | | | | |
LLC | Receive | Leveraged Loan Index | 1.91 | Quarterly | 94,915 | June—2020 | 16,875,000 | — | (240,055) | (240,055) |
Total — Total Return Swap Agreements | | | | | | $— | $(394,046) | $(394,046) |
| | | | | | | | | | |
Abbreviations:
EUR —Euro
GBP —British Pound Sterling
USD —U.S. Dollar
See accompanying Notes to Financial Statements which are an integral part of the financial statements.
18 | Invesco High Yield Fund |
Statement of Assets and Liabilities
February 29, 2020
Assets: | |
Investments in securities, at value | |
(Cost $1,083,857,398) | $1,038,208,163 |
Investments in affiliated money market funds, at value | |
(Cost $35,604,124) | 35,605,045 |
Other investments: | |
Unrealized appreciation on forward foreign currency | |
contracts outstanding | 9,668 |
Cash | 1,862,291 |
Foreign currencies, at value (Cost $9,174,825) | 9,206,704 |
Receivable for: | |
Investments sold | 3,478,339 |
Fund shares sold | 696,080 |
Dividends | 43,559 |
Interest | 18,080,836 |
Investments matured, at value (Cost $2,672,027) | 0 |
Investment for trustee deferred compensation and | |
retirement plans | 323,361 |
Other assets | 55,510 |
Total assets | 1,107,569,556 |
Liabilities: | |
Other investments: | |
Unrealized depreciation on forward foreign currency | |
contracts outstanding | 158,283 |
Swaps payable — OTC | 105,703 |
Unrealized depreciation on swap agreements—OTC | 394,046 |
Payable for: | |
Investments purchased | 14,625,394 |
Dividends | 1,078,265 |
Fund shares reacquired | 4,242,353 |
Accrued fees to affiliates | 508,925 |
Accrued trustees' and officers' fees and benefits | 3,661 |
Accrued other operating expenses | 100,266 |
Trustee deferred compensation and retirement plans | 399,363 |
Total liabilities | 21,616,259 |
Net assets applicable to shares outstanding | $1,085,953,297 |
Net assets consist of: | | | |
Shares of beneficial interest | $1,304,441,242 | |
Distributable earnings (loss) | | (218,487,945) |
| $1,085,953,297 | |
Net Assets: | | | |
Class A | $ | 663,578,344 | |
Class C | $ | 35,743,067 | |
Class Y | $ | 61,065,387 | |
Investor Class | $ | 80,043,252 | |
Class R5 | $ | 55,520,225 | |
Class R6 | $ | 190,003,022 | |
Shares outstanding, no par value, with an unlimited number of shares authorized:
Class A | | 167,606,730 |
Class C | | 9,050,159 |
Class Y | | 15,383,255 |
Investor Class | | 20,226,376 |
Class R5 | | 14,081,104 |
Class R6 | | 48,090,684 |
Class A: | | |
Net asset value per share | $ | 3.96 |
Maximum offering price per share | | |
(Net asset value of $3.96 ÷ 95.75%) | $ | 4.14 |
Class C: | | |
Net asset value and offering price per share | $ | 3.95 |
Class Y: | | |
Net asset value and offering price per share | $ | 3.97 |
Investor Class: | | |
Net asset value and offering price per share | $ | 3.96 |
Class R5: | | |
Net asset value and offering price per share | $ | 3.94 |
Class R6: | | |
Net asset value and offering price per share | $ | 3.95 |
See accompanying Notes to Financial Statements which are an integral part of the financial statements.
19 | Invesco High Yield Fund |
Statement of Operations
For the year ended February 29, 2020
Investment income: | | | |
Interest | $ 67,721,778 |
Dividends from affiliated money market funds | 1,107,112 |
Dividends | 408,664 | |
Total investment income | 69,237,554 |
Expenses: | | | |
Advisory fees | 6,009,143 |
Administrative services fees | 161,692 | |
Custodian fees | 30,801 | |
Distribution fees: | | | |
Class A | 1,705,771 |
Class C | 364,465 | |
Investor Class | 204,188 | |
Transfer agent fees — A, C, Y and Investor | 1,618,411 |
Transfer agent fees — R5 | 60,944 | |
Transfer agent fees — R6 | 16,946 | |
Trustees' and officers' fees and benefits | 29,872 | |
Registration and filing fees | 124,642 | |
Reports to shareholders | 128,604 | |
Professional services fees | 202,984 | |
Other | 24,277 | |
Total expenses | 10,682,740 |
Less: Fees waived and/or expense offset arrangement(s) | (77,783) |
Net expenses | 10,604,957 |
Net investment income | 58,632,597 |
Realized and unrealized gain (loss) from: | | | |
Net realized gain (loss) from: | | | |
Investment securities | (24,612,433) |
| | |
Foreign currencies | (253,749) |
Forward foreign currency contracts | 720,414 | |
Option contracts written | 1,206,315 | |
Swap agreements | 1,114,175 | |
| (21,825,278) |
Change in net unrealized appreciation (depreciation) of: | | | |
Investment securities | 3,888,322 | |
Foreign currencies | 29,725 | |
Forward foreign currency contracts | (94,538) |
| | |
Swap agreements | (1,076,153) |
| 2,747,356 | |
Net realized and unrealized gain (loss) | (19,077,922) |
Net increase in net assets resulting from operations | $ 39,554,675 |
See accompanying Notes to Financial Statements which are an integral part of the financial statements.
20 | Invesco High Yield Fund |
Statement of Changes in Net Assets
For the years ended February 29, 2020 and February 28, 2019
| | 2020 | | 2019 | | |
Operations: | | | | | | |
Net investment income | $ | 58,632,597 | $ | 60,064,399 | |
Net realized gain (loss) | | (21,825,278) | | 78,303 | | |
Change in net unrealized appreciation (depreciation) | | 2,747,356 | | (20,698,748) |
Net increase in net assets resulting from operations | | 39,554,675 | | 39,443,954 | |
Distributions to shareholders from distributable earnings: | | | | | | |
Class A | | (38,994,977) | | (34,588,949) |
| | | | | |
Class C | | (1,808,858) | | (3,276,545) |
| | | | | |
Class Y | | (4,886,397) | | (5,794,540) |
| | | | | |
Investor Class | | (4,667,659) | | (4,750,718) |
| | | | | |
Class R5 | | (3,764,959) | | (3,788,389) |
| | | | | |
Class R6 | | (11,783,723) | | (10,543,548) |
| | | | | |
Total distributions from distributable earnings | | (65,906,573) | | (62,742,689) |
Share transactions–net: | | | | | | |
Class A | | (5,464,341) | | (4,157,866) |
| | | | | |
Class C | | (1,015,015) | | (48,996,297) |
| | | | | |
Class Y | | (49,924,429) | | (2,683,956) |
| | | | | |
Investor Class | | 2,533,035 | | (16,578,847) |
| | | | | |
Class R5 | | (7,920,168) | | (8,938,197) |
| | | | | |
Class R6 | | 7,796,010 | | (4,496,115) |
| | | | | |
Net increase (decrease) in net assets resulting from share transactions | | (53,994,908) | | (85,851,278) |
| | | | | |
Net increase (decrease) in net assets | | (80,346,806) | | (109,150,013) |
Net assets: | | | | | | |
Beginning of year | | 1,166,300,103 | | 1,275,450,116 | |
End of year | $1,085,953,297 | $ | 1,166,300,103 | |
See accompanying Notes to Financial Statements which are an integral part of the financial statements.
21 | Invesco High Yield Fund |
Financial Highlights
The following schedule presents financial highlights for a share of the Fund outstanding throughout the periods indicated.
| | | | | | | | | | | | Ratio of | Ratio of | | |
| | | | | | | | | | | | expenses | expenses | | |
| | | Net gains | | | | | | | | | to average | to average net | | |
| | | (losses) | | | | | | | | | net assets | assets without | Ratio of net | |
| Net asset | | on securities | | Dividends | | | | | | | with fee waivers | fee waivers | investment | |
| value, | Net | (both | Total from | from net | | | | Net asset | | Net assets, | and/or | and/or | income | |
| beginning | investment | realized and | investment | investment | Return of | Total | value, end | Total | end ofperiod | expenses | expenses | to average | Portfolio |
| ofperiod | income(a) | unrealized) | operations | income | capital | distributions | ofperiod | return (b) | (000's omitted) | absorbed | absorbed | net assets | turnover (c) |
Class A | | | | | | | | | | | | 1.01%(d) | 1.02%(d) | 5.09%(d) | |
Year ended 02/29/20 | $4.05 | $0.21 | $(0.07) | $ 0.14 | $(0.23) | $ | — | $(0.23) | $3.96 | 3.53% | $663,578 | 62% |
Year ended 02/28/19 | 4.13 | 0.20 | (0.07) | 0.13 | (0.21) | | — | (0.21) | 4.05 | 3.28 | 685,222 | 1.15 | 1.15 | 4.96 | 34 |
Year ended 02/28/18 | 4.21 | 0.20 | (0.07) | 0.13 | (0.21) | | — | (0.21) | 4.13 | 3.07 | 701,560 | 1.07 | 1.08 | 4.69 | 56 |
Year ended 02/28/17 | 3.83 | 0.21 | 0.39 | 0.60 | (0.21) | | (0.01) | (0.22) | 4.21 | 15.91 | 828,560 | 1.00 | 1.01 | 5.10 | 99 |
Year ended 02/29/16 | 4.38 | 0.23 | (0.54) | (0.31) | (0.24) | | — | (0.24) | 3.83 | (7.43) | 744,564 | 1.03 | 1.03 | 5.39 | 84 |
Class C | | | | | | | | | | | | 1.76(d) | 1.77(d) | 4.34(d) | 62 |
Year ended 02/29/20 | 4.04 | 0.18 | (0.07) | 0.11 | (0.20) | | — | (0.20) | 3.95 | 2.75 | 35,743 |
Year ended 02/28/19 | 4.12 | 0.17 | (0.07) | 0.10 | (0.18) | | — | (0.18) | 4.04 | 2.50 | 37,607 | 1.90 | 1.90 | 4.21 | 34 |
Year ended 02/28/18 | 4.20 | 0.16 | (0.06) | 0.10 | (0.18) | | — | (0.18) | 4.12 | 2.29 | 88,812 | 1.82 | 1.83 | 3.94 | 56 |
Year ended 02/28/17 | 3.82 | 0.18 | 0.39 | 0.57 | (0.18) | | (0.01) | (0.19) | 4.20 | 15.09 | 101,572 | 1.75 | 1.76 | 4.35 | 99 |
Year ended 02/29/16 | 4.37 | 0.19 | (0.54) | (0.35) | (0.20) | | — | (0.20) | 3.82 | (8.18) | 92,310 | 1.78 | 1.78 | 4.64 | 84 |
Class Y | | | | | | | | | | | | 0.76(d) | 0.77(d) | 5.34(d) | 62 |
Year ended 02/29/20 | 4.07 | 0.22 | (0.08) | 0.14 | (0.24) | | — | (0.24) | 3.97 | 3.54 | 61,065 |
Year ended 02/28/19 | 4.14 | 0.21 | (0.06) | 0.15 | (0.22) | | — | (0.22) | 4.07 | 3.79 | 112,350 | 0.90 | 0.90 | 5.21 | 34 |
Year ended 02/28/18 | 4.23 | 0.21 | (0.08) | 0.13 | (0.22) | | — | (0.22) | 4.14 | 3.09 | 116,954 | 0.82 | 0.83 | 4.94 | 56 |
Year ended 02/28/17 | 3.84 | 0.22 | 0.40 | 0.62 | (0.22) | | (0.01) | (0.23) | 4.23 | 16.44 | 201,080 | 0.75 | 0.76 | 5.35 | 99 |
Year ended 02/29/16 | 4.39 | 0.24 | (0.54) | (0.30) | (0.25) | | — | (0.25) | 3.84 | (7.18) | 88,893 | 0.78 | 0.78 | 5.64 | 84 |
Investor Class | | | | | | | | | | | | 1.01(d) | 1.02(d) | 5.09(d) | |
Year ended 02/29/20 | 4.05 | 0.21 | (0.07) | 0.14 | (0.23) | | — | (0.23) | 3.96 | 3.53 | 80,043 | 62 |
Year ended 02/28/19 | 4.13 | 0.20 | (0.07) | 0.13 | (0.21) | | — | (0.21) | 4.05 | 3.31 | 79,404 | 1.15 | 1.15 | 4.96 | 34 |
Year ended 02/28/18 | 4.21 | 0.20 | (0.07) | 0.13 | (0.21) | | — | (0.21) | 4.13 | 3.11(e) | 97,913 | 1.01(e) | 1.02(e) | 4.75(e) | 56 |
Year ended 02/28/17 | 3.83 | 0.21 | 0.39 | 0.60 | (0.21) | | (0.01) | (0.22) | 4.21 | 15.95(e) | 105,545 | 0.96(e) | 0.97(e) | 5.14(e) | 99 |
Year ended 02/29/16 | 4.38 | 0.23 | (0.54) | (0.31) | (0.24) | | — | (0.24) | 3.83 | (7.40)(e) | 100,212 | 1.01(e) | 1.01(e) | 5.41(e) | 84 |
Class R5 | | | | | | | | | | | | 0.68(d) | 0.69(d) | 5.42(d) | 62 |
Year ended 02/29/20 | 4.04 | 0.22 | (0.07) | 0.15 | (0.25) | | — | (0.25) | 3.94 | 3.75 | 55,520 |
Year ended 02/28/19 | 4.12 | 0.21 | (0.07) | 0.14 | (0.22) | | — | (0.22) | 4.04 | 3.59 | 64,804 | 0.84 | 0.84 | 5.27 | 34 |
Year ended 02/28/18 | 4.20 | 0.21 | (0.07) | 0.14 | (0.22) | | — | (0.22) | 4.12 | 3.40 | 75,185 | 0.75 | 0.76 | 5.01 | 56 |
Year ended 02/28/17 | 3.82 | 0.22 | 0.39 | 0.61 | (0.22) | | (0.01) | (0.23) | 4.20 | 16.32 | 88,644 | 0.66 | 0.67 | 5.44 | 99 |
Year ended 02/29/16 | 4.37 | 0.24 | (0.54) | (0.30) | (0.25) | | — | (0.25) | 3.82 | (7.15) | 86,239 | 0.69 | 0.69 | 5.73 | 84 |
Class R6 | | | | | | | | | | | | 0.59(d) | 0.60(d) | 5.51(d) | |
Year ended 02/29/20 | 4.05 | 0.22 | (0.07) | 0.15 | (0.25) | | — | (0.25) | 3.95 | 3.70 | 190,003 | 62 |
Year ended 02/28/19 | 4.12 | 0.22 | (0.06) | 0.16 | (0.23) | | — | (0.23) | 4.05 | 3.94 | 186,913 | 0.75 | 0.75 | 5.36 | 34 |
Year ended 02/28/18 | 4.20 | 0.21 | (0.07) | 0.14 | (0.22) | | — | (0.22) | 4.12 | 3.49 | 195,027 | 0.66 | 0.67 | 5.10 | 56 |
Year ended 02/28/17 | 3.82 | 0.23 | 0.39 | 0.62 | (0.23) | | (0.01) | (0.24) | 4.20 | 16.42 | 157,367 | 0.57 | 0.58 | 5.53 | 99 |
Year ended 02/29/16 | 4.37 | 0.24 | (0.54) | (0.30) | (0.25) | | — | (0.25) | 3.82 | (7.07) | 125,310 | 0.60 | 0.60 | 5.82 | 84 |
(a)Calculated using average shares outstanding.
(b)Includes adjustments in accordance with accounting principles generally accepted in the United States of America and as such, the net asset value for financial reporting purposes and the returns based upon those net asset values may differ from the net asset value and returns for shareholder transactions. Not annualized for periods less than one year, if applicable.
(c)Portfolio turnover is calculated at the fund level and is not annualized for periods less than one year, if applicable.
(d)Ratios are based on average daily net assets (000's omitted) of $682,308, $36,447, $82,123, $81,675 , $60,891 and $191,921 for Class A, Class C, Class Y, Investor Class, Class R5 and Class R6 shares, respectively.
(e)The total return, ratio of expenses to average net assets and ratio of net investment income to average net assets reflect actual 12b-1 fees of 0.19%, 0.21% and 0.23% for the years ended February 28, 2018, February 28, 2017 and February 29, 2016, respectively.
See accompanying Notes to Financial Statements which are an integral part of the financial statements.
22 | Invesco High Yield Fund |
Notes to Financial Statements
February 29, 2020
NOTE 1—Significant Accounting Policies
Invesco High Yield Fund (the "Fund"), is a series portfolio of AIM Investment Securities Funds (Invesco Investment Securities Funds) (the "Trust"). The Trust is organized as a Delaware statutory trust and is registered under the Investment Company Act of 1940, as amended (the "1940 Act"), as an open-end series management investment company authorized to issue an unlimited number of shares of beneficial interest. Information presented in these financial statements pertains only to the Fund. Matters affecting the Fund or each class will be voted on exclusively by the shareholders of the Fund or each class.
The Fund's investment objective is total return through growth of capital and current income.
The Fund currently consists of six different classes of shares: Class A, Class C, Class Y, Investor Class, Class R5 and Class R6. Class Y and Investor Class shares are available only to certain investors. Class A shares are sold with a front-end sales charge unless certain waiver criteria are met and under certain circumstances load waived shares may be subject to contingent deferred sales charges ("CDSC"). Class C shares are sold with a CDSC. Class Y, Investor Class, Class R5 and Class R6 shares are sold at net asset value. Class C shares held for ten years after purchase are eligible for automatic conversion into Class A shares of the same Fund (the "Conversion Feature"). The automatic conversion pursuant to the Conversion Feature will generally occur at the end of the month following the tenth anniversary after a purchase of Class C shares.
The Fund is an investment company and accordingly follows the investment company accounting and reporting guidance in accordance with Financial Accounting Standards Board Accounting Standards Codification Topic 946, Financial Services – Investment Companies.
The following is a summary of the significant accounting policies followed by the Fund in the preparation of its financial statements.
A.Security Valuations – Securities, including restricted securities, are valued according to the following policy.
Debt obligations (including convertible securities) and unlisted equities are fair valued using an evaluated quote provided by an independent pricing service. Evaluated quotes provided by the pricing service may be determined without exclusive reliance on quoted prices, and may reflect appropriate factors such as institution-size trading in similar groups of securities, developments related to specific securities, dividend rate (for unlisted equities), yield (for debt obligations), quality, type of issue, coupon rate (for debt obligations), maturity (for debt obligations), individual trading characteristics and other market data. Pricing services generally value debt obligations assuming orderly transactions of institutional round lot size, but a fund may hold or transact in the same securities in smaller, odd lot sizes. Odd lots often trade at lower prices than institutional round lots. Debt obligations are subject to interest rate and credit risks. In addition, all debt obligations involve some risk of default with respect to interest and/or principal payments.
Variable rate senior loan interests are fair valued using quotes provided by an independent pricing service. Quotes provided by the pricing service may reflect appropriate factors such as ratings, tranche type, industry, company performance, spread, individual trading characteristics, institution-size trading in similar groups of securities and other market data.
A security listed or traded on an exchange (except convertible securities) is valued at its last sales price or official closing price as of the close of the customary trading session on the exchange where the security is principally traded, or lacking any sales or official closing price on a particular day, the security may be valued at the closing bid price on that day. Securities traded in the over-the-counter market are valued based on prices furnished by independent pricing services or market makers. When such securities are valued by an independent pricing service they may be considered fair valued. Futures contracts are valued at the final settlement price set by an exchange on which they are principally traded. Listed options are valued at the mean between the last bid and asked prices from the exchange on which they are principally traded. Options not listed on an exchange are valued by an independent source at the mean between the last bid and asked prices. For purposes of determining net asset value ("NAV") per share, futures and option contracts generally are valued 15 minutes after the close of the customary trading session of the New York Stock Exchange ("NYSE").
Investments in open-end and closed-end registered investment companies that do not trade on an exchange are valued at the end-of-day net asset value per share. Investments in open-end and closed-end registered investment companies that trade on an exchange are valued at the last sales price or official closing price as of the close of the customary trading session on the exchange where the security is principally traded.
Swap agreements are fair valued using an evaluated quote, if available, provided by an independent pricing service. Evaluated quotes provided by the pricing service are valued based on a model which may include end-of-day net present values, spreads, ratings, industry, company performance and returns of referenced assets. Centrally cleared swap agreements are valued at the daily settlement price determined by the relevant exchange or clearinghouse.
Foreign securities' (including foreign exchange contracts) prices are converted into U.S. dollar amounts using the applicable exchange rates as of the close of the NYSE. If market quotations are available and reliable for foreign exchange-traded equity securities, the securities will be valued at the market quotations. Because trading hours for certain foreign securities end before the close of the NYSE, closing market quotations may become unreliable. If between the time trading ends on a particular security and the close of the customary trading session on the NYSE, events occur that the investment adviser determines are significant and make the closing price unreliable, the Fund may fair value the security. If the event is likely to have affected the closing price of the security, the security will be valued at fair value in good faith using procedures approved by the Board of Trustees. Adjustments to closing prices to reflect fair value may also be based on a screening process of an independent pricing service to indicate the degree of certainty, based on historical data, that the closing price in the principal market where a foreign security trades is not the current value as of the close of the NYSE. Foreign securities' prices meeting the approved degree of certainty that the price is not reflective of current value will be priced at the indication of fair value from the independent pricing service. Multiple factors may be considered by the independent pricing service in determining adjustments to reflect fair value and may include information relating to sector indices, American Depositary Receipts and domestic and foreign index futures. Foreign securities may have additional risks including exchange rate changes, potential for sharply devalued currencies and high inflation, political and economic upheaval, the relative lack of issuer information, relatively low market liquidity and the potential lack of strict financial and accounting controls and standards.
Securities for which market prices are not provided by any of the above methods may be valued based upon quotes furnished by independent sources. The last bid price may be used to value equity securities. The mean between the last bid and asked prices is used to value debt obligations, including corporate loans.
Securities for which market quotations are not readily available or became unreliable are valued at fair value as determined in good faith by or under the supervision of the Trust's officers following procedures approved by the Board of Trustees. Issuer specific events, market trends, bid/asked quotes of brokers and information providers and other market data may be reviewed in the course of making a good faith determination of a security's fair value.
The Fund may invest in securities that are subject to interest rate risk, meaning the risk that the prices will generally fall as interest rates rise and, conversely, the prices will generally rise as interest rates fall. Specific securities differ in their sensitivity to changes in interest rates depending on their individual characteristics. Changes in interest rates may result in increased market volatility, which may affect the value and/or liquidity of certain Fund investments.
Valuations change in response to many factors including the historical and prospective earnings of the issuer, the value of the issuer's assets, general economic conditions, interest rates, investor perceptions and market liquidity. Because of the inherent uncertainties of valuation, the values reflected in the financial statements may materially differ from the value received upon actual sale of those investments.
B.Securities Transactions and Investment Income – Securities transactions are accounted for on a trade date basis. Realized gains or losses on sales are computed on the basis of specific identification of the securities sold. Interest income (net of withholding tax, if any) is recorded on an accrual basis from settlement date. Bond premiums and discounts are amortized and/or accreted over the lives of the respective securities. Pay-in-kind interest income and non-cash
23 | Invesco High Yield Fund |
dividend income received in the form of securities in-lieu of cash are recorded at the fair value of the securities received. Paydown gains and losses on mortgage and asset-backed securities are recorded as adjustments to interest income. Dividend income (net of withholding tax, if any) is recorded on the ex-dividend date.
The Fund may periodically participate in litigation related to Fund investments. As such, the Fund may receive proceeds from litigation settlements. Any proceeds received are included in the Statement of Operations as realized gain (loss) for investments no longer held and as unrealized gain (loss) for investments still held.
Brokerage commissions and mark ups are considered transaction costs and are recorded as an increase to the cost basis of securities purchased and/or a reduction of proceeds on a sale of securities. Such transaction costs are included in the determination of net realized and unrealized gain (loss) from investment securities reported in the Statement of Operations and the Statement of Changes in Net Assets and the net realized and unrealized gains (losses) on securities per share in the Financial Highlights. Transaction costs are included in the calculation of the Fund's net asset value and, accordingly, they reduce the Fund's total returns. These transaction costs are not considered operating expenses and are not reflected in net investment income reported in the Statement of Operations and the Statement of Changes in Net Assets, or the net investment income per share and the ratios of expenses and net investment income reported in the Financial Highlights, nor are they limited by any expense limitation arrangements between the Fund and the investment adviser.
The Fund allocates realized and unrealized capital gains and losses to a class based on the relative net assets of each class. The Fund allocates income to a class based on the relative value of the settled shares of each class.
C.Country Determination — For the purposes of making investment selection decisions and presentation in the Schedule of Investments, the investment adviser may determine the country in which an issuer is located and/or credit risk exposure based on various factors. These factors include the laws of the country under which the issuer is organized, where the issuer maintains a principal office, the country in which the issuer derives 50% or more of its total revenues and the country that has the primary market for the issuer's securities, as well as other criteria. Among the other criteria that may be evaluated for making this determination are the country in which the issuer maintains 50% or more of its assets, the type of security, financial guarantees and enhancements, the nature of the collateral and the sponsor organization. Country of issuer and/or credit risk exposure has been determined to be the United States of America, unless otherwise noted.
D.Distributions – Distributions from net investment income, if any, are declared daily and paid monthly. Distributions from net realized capital gain, if any, are generally declared and paid annually and recorded on the ex-dividend date. The Fund may elect to treat a portion of the proceeds from redemptions as distributions for federal income tax purposes.
E.Federal Income Taxes – The Fund intends to comply with the requirements of Subchapter M of the Internal Revenue Code of 1986, as amended (the "Internal Revenue Code"), necessary to qualify as a regulated investment company and to distribute substantially all of the Fund's taxable earnings to shareholders. As such, the Fund will not be subject to federal income taxes on otherwise taxable income (including net realized capital gain) that is distributed to shareholders. Therefore, no provision for federal income taxes is recorded in the financial statements.
The Fund recognizes the tax benefits of uncertain tax positions only when the position is more likely than not to be sustained. Management has analyzed the Fund's uncertain tax positions and concluded that no liability for unrecognized tax benefits should be recorded related to uncertain tax positions. Management is not aware of any tax positions for which it is reasonably possible that the total amounts of unrecognized tax benefits will change materially in the next 12 months.
The Fund files tax returns in the U.S. Federal jurisdiction and certain other jurisdictions. Generally, the Fund is subject to examinations by such taxing authorities for up to three years after the filing of the return for the tax period.
F.Expenses – Fees provided for under the Rule 12b-1 plan of a particular class of the Fund are charged to the operations of such class. Transfer agency fees and expenses and other shareholder recordkeeping fees and expenses attributable to Class R5 and Class R6 are allocated to each share class based on relative net assets. Sub-accounting fees attributable to Class R5 are charged to the operations of the class. Transfer agency fees and expenses and other shareholder recordkeeping fees and expenses relating to all other classes are allocated among those classes based on relative net assets. All other expenses are allocated among the classes based on relative net assets.
G.Accounting Estimates – The preparation of financial statements in conformity with accounting principles generally accepted in the United States of America ("GAAP") requires management to make estimates and assumptions that affect the reported amounts of assets and liabilities at the date of the financial statements and the reported amounts of revenues and expenses during the reporting period including estimates and assumptions related to taxation. Actual results could differ from those estimates by a significant amount. In addition, the Fund monitors for material events or transactions that may occur or become known after the period-end date and before the date the financial statements are released to print.
H.Indemnifications – Under the Trust's organizational documents, each Trustee, officer, employee or other agent of the Trust is indemnified against certain liabilities that may arise out of the performance of their duties to the Fund. Additionally, in the normal course of business, the Fund enters into contracts, including the Fund's servicing agreements, that contain a variety of indemnification clauses. The Fund's maximum exposure under these arrangements is unknown as this would involve future claims that may be made against the Fund that have not yet occurred. The risk of material loss as a result of such indemnification claims is considered remote.
I.Foreign Currency Translations — Foreign currency is valued at the close of the NYSE based on quotations posted by banks and major currency dealers. Portfolio securities and other assets and liabilities denominated in foreign currencies are translated into U.S. dollar amounts at the date of valuation. Purchases and sales of portfolio securities (net of foreign taxes withheld on disposition) and income items denominated in foreign currencies are translated into U.S. dollar amounts on the respective dates of such transactions. The Fund does not separately account for the portion of the results of operations resulting from changes in foreign exchange rates on investments and the fluctuations arising from changes in market prices of securities held. The combined results of changes in foreign exchange rates and the fluctuation of market prices on investments (net of estimated foreign tax withholding) are included with the net realized and unrealized gain or loss from investments in the Statement of Operations. Reported net realized foreign currency gains or losses arise from (1) sales of foreign currencies, (2) currency gains or losses realized between the trade and settlement dates on securities transactions, and (3) the difference between the amounts of dividends, interest, and foreign withholding taxes recorded on the Fund's books and the U.S. dollar equivalent of the amounts actually received or paid. Net unrealized foreign currency gains and losses arise from changes in the fair values of assets and liabilities, other than investments in securities at fiscal period end, resulting from changes in exchange rates.
The Fund may invest in foreign securities, which may be subject to foreign taxes on income, gains on investments or currency repatriation, a portion of which may be recoverable. Foreign taxes, if any, are recorded based on the tax regulations and rates that exist in the foreign markets in which the Fund invests and are shown in the Statement of Operations.
J.Forward Foreign Currency Contracts — The Fund may engage in foreign currency transactions either on a spot (i.e. for prompt delivery and settlement) basis, or through forward foreign currency contracts, to manage or minimize currency or exchange rate risk.
The Fund may also enter into forward foreign currency contracts for the purchase or sale of a security denominated in a foreign currency in order to "lock in" the U.S. dollar price of that security, or the Fund may also enter into forward foreign currency contracts that do not provide for physical settlement of the two currencies, but instead are settled by a single cash payment calculated as the difference between the agreed upon exchange rate and the spot rate at settlement based upon an agreed upon notional amount (non-deliverable forwards). The Fund will set aside liquid assets in an amount equal to the daily mark-to-market obligation for forward foreign currency contracts.
A forward foreign currency contract is an obligation between two parties ("Counterparties") to purchase or sell a specific currency for an agreed-upon price at a future date. The use of forward foreign currency contracts does not eliminate fluctuations in the price of the underlying securities the Fund owns or intends to acquire but establishes a rate of exchange in advance. Fluctuations in the value of these contracts are measured by the difference in the contract date and
24 | Invesco High Yield Fund |
reporting date exchange rates and are recorded as unrealized appreciation (depreciation) until the contracts are closed. When the contracts are closed, realized gains (losses) are recorded. Realized and unrealized gains (losses) on the contracts are included in the Statement of Operations. The primary risks associated with forward foreign currency contracts include failure of the Counterparty to meet the terms of the contract and the value of the foreign currency changing unfavorably. These risks may be in excess of the amounts reflected in the Statement of Assets and Liabilities.
K.Call Options Purchased and Written – The Fund may write covered call options and/or buy call options. A covered call option gives the purchaser of such option the right to buy, and the writer the obligation to sell, the underlying security or foreign currency at the stated exercise price during the option period. Options written by the Fund normally will have expiration dates between three and nine months from the date written. The exercise price of a call option may be below, equal to, or above the current market value of the underlying security at the time the option is written.
When the Fund writes a covered call option, an amount equal to the premium received by the Fund is recorded as an asset and an equivalent liability in the Statement of Assets and Liabilities. The amount of the liability is subsequently "marked-to-market" to reflect the current market value of the option written. If a written covered call option expires on the stipulated expiration date, or if the Fund enters into a closing purchase transaction, the Fund realizes a gain (or a loss if the closing purchase transaction exceeds the premium received when the option was written) without regard to any unrealized gain or loss on the underlying security, and the liability related to such option is extinguished. If a written covered call option is exercised, the Fund realizes a gain or a loss from the sale of the underlying security and the proceeds of the sale are increased by the premium originally received. Realized and unrealized gains and losses on call options written are included in the Statement of Operations as Net realized gain (loss) from and Change in net unrealized appreciation (depreciation) of Option contracts written. A risk in writing a covered call option is that the Fund gives up the opportunity for profit if the market price of the security increases and the option is exercised.
When the Fund buys a call option, an amount equal to the premium paid by the Fund is recorded as an investment on the Statement of Assets and Liabilities. The amount of the investment is subsequently "marked-to-market" to reflect the current value of the option purchased. Realized and unrealized gains and losses on call options purchased are included in the Statement of Operations as Net realized gain (loss) from and Change in net unrealized appreciation (depreciation) of Investment securities. A risk in buying an option is that the Fund pays a premium whether or not the option is exercised. In addition, there can be no assurance that a liquid secondary market will exist for any option purchased.
L.Put Options Purchased and Written – The Fund may purchase and write put options including options on securities indexes, or foreign currency and/or futures contracts. By purchasing a put option, the Fund obtains the right (but not the obligation) to sell the option's underlying instrument at a fixed strike price. In return for this right, the Fund pays an option premium. The option's underlying instrument may be a security, securities index, or a futures contract. Put options may be used by the Fund to hedge securities it owns by locking in a minimum price at which the Fund can sell. If security prices fall, the put option could be exercised to offset all or a portion of the Fund's resulting losses. At the same time, because the maximum the Fund has at risk is the cost of the option, purchasing put options does not eliminate the potential for the Fund to profit from an increase in the value of the underlying portfolio securities. The Fund may write put options to earn additional income in the form of option premiums if it expects the price of the underlying instrument to remain stable or rise during the option period so that the option will not be exercised. The risk in this strategy is that the price of the underlying securities may decline by an amount greater than the premium received. Put options written are reported as a liability in the Statement of Assets and Liabilities. Realized and unrealized gains and losses on put options purchased and put options written are included in the Statement of Operations as Net realized gain (loss) from and Change in net unrealized appreciation (depreciation) of Investment securities and Option contracts written, respectively. A risk in buying an option is that the Fund pays a premium whether or not the option is exercised. In addition, there can be no assurance that a liquid secondary market will exist for any option purchased.
M.Swap Agreements — The Fund may enter into various swap transactions, including interest rate, total return, index, currency and credit default swap contracts ("CDS") for investment purposes or to manage interest rate, currency or credit risk. Such transactions are agreements between Counterparties. A swap agreement may be negotiated bilaterally and traded over-the-counter ("OTC") between two parties ("uncleared/ OTC") or, in some instances, must be transacted through a future commission merchant ("FCM") and cleared through a clearinghouse that serves as a central Counterparty ("centrally cleared swap"). These agreements may contain among other conditions, events of default and termination events, and various covenants and representations such as provisions that require the Fund to maintain a pre-determined level of net assets, and/ or provide limits regarding the decline of the Fund's NAV over specific periods of time. If the Fund were to trigger such provisions and have open derivative positions at that time, the Counterparty may be able to terminate such agreement and request immediate payment in an amount equal to the net liability positions, if any.
Interest rate, total return, index, and currency swap agreements are two-party contracts entered into primarily to exchange the returns (or differentials in rates of returns) earned or realized on particular predetermined investments or instruments. The gross returns to be exchanged or "swapped" between the parties are calculated with respect to a notional amount, i.e., the return on or increase in value of a particular dollar amount invested at a particular interest rate or return of an underlying asset, in a particular foreign currency, or in a "basket" of securities representing a particular index.
In a centrally cleared swap, the Fund's ultimate Counterparty is a central clearinghouse. The Fund initially will enter into centrally cleared swaps through an executing broker. When a fund enters into a centrally cleared swap, it must deliver to the central Counterparty (via the FCM) an amount referred to as "initial margin." Initial margin requirements are determined by the central Counterparty, but an FCM may require additional initial margin above the amount required by the central Counterparty. Initial margin deposits required upon entering into centrally cleared swaps are satisfied by cash or securities as collateral at the FCM. Securities deposited as initial margin are designated on the Schedule of Investments and cash deposited is recorded on the Statement of Assets and Liabilities. During the term of a cleared swap agreement, a "variation margin" amount may be required to be paid by the Fund or may be received by the Fund, based on the daily change in price of the underlying reference instrument subject to the swap agreement and is recorded as a receivable or payable for variation margin in the Statement of Assets and Liabilities until the centrally cleared swap is terminated at which time a realized gain or loss is recorded.
A CDS is an agreement between Counterparties to exchange the credit risk of an issuer. A buyer of a CDS is said to buy protection by paying a fixed payment over the life of the agreement and in some situations an upfront payment to the seller of the CDS. If a defined credit event occurs (such as payment default or bankruptcy), the Fund as a protection buyer would cease paying its fixed payment, the Fund would deliver eligible bonds issued by the reference entity to the seller, and the seller would pay the full notional value, or the "par value", of the referenced obligation to the Fund. A seller of a CDS is said to sell protection and thus would receive a fixed payment over the life of the agreement and an upfront payment, if applicable. If a credit event occurs, the Fund as a protection seller would cease to receive the fixed payment stream, the Fund would pay the buyer "par value" or the full notional value of the referenced obligation, and the Fund would receive the eligible bonds issued by the reference entity. In turn, these bonds may be sold in order to realize a recovery value. Alternatively, the seller of the CDS and its Counterparty may agree to net the notional amount and the market value of the bonds and make a cash payment equal to the difference to the buyer of protection. If no credit event occurs, the Fund receives the fixed payment over the life of the agreement. As the seller, the Fund would effectively add leverage to its portfolio because, in addition to its total net assets, the Fund would be subject to investment exposure on the notional amount of the CDS. In connection with these agreements, cash and securities may be identified as collateral in accordance with the terms of the respective swap agreements to provide assets of value and recourse in the event of default under the swap agreement or bankruptcy/insolvency of a party to the swap agreement. If a Counterparty becomes bankrupt or otherwise fails to perform its obligations due to financial difficulties, the Fund may experience significant delays in obtaining any recovery in a bankruptcy or other reorganization proceeding. The Fund may obtain only limited recovery or may obtain no recovery in such circumstances. The Fund's maximum risk of loss from Counterparty risk, either as the protection seller or as the protection buyer, is the value of the contract. The risk may be mitigated by having a master netting arrangement between the Fund and the Counterparty and by the designation of collateral by the Counterparty to cover the Fund's exposure to the Counterparty.
Implied credit spreads represent the current level at which protection could be bought or sold given the terms of the existing CDS contract and serve as an indicator of the current status of the payment/performance risk of the CDS. An implied spread that has widened or increased since entry into the initial contract
25 | Invesco High Yield Fund |
may indicate a deteriorating credit profile and increased risk of default for the reference entity. A declining or narrowing spread may indicate an improving credit profile or decreased risk of default for the reference entity. Alternatively, credit spreads may increase or decrease reflecting the general tolerance for risk in the credit markets.
An interest rate swap is an agreement between Counterparties pursuant to which the parties exchange a floating rate payment for a fixed rate payment based on a specified notional amount.
Changes in the value of centrally cleared and OTC swap agreements are recognized as unrealized gains (losses) in the Statement of Operations by "marking to market" on a daily basis to reflect the value of the swap agreement at the end of each trading day. Payments received or paid at the beginning of the agreement are reflected as such on the Statement of Assets and Liabilities and may be referred to as upfront payments. The Fund accrues for the fixed payment stream and amortizes upfront payments, if any, on swap agreements on a daily basis with the net amount, recorded as a component of realized gain (loss) on the Statement of Operations. A liquidation payment received or made at the termination of a swap agreement is recorded as realized gain (loss) on the Statement of Operations. The Fund segregates cash or liquid securities having a value at least equal to the amount of the potential obligation of a Fund under any swap transaction. Cash held as collateral is recorded as deposits with brokers on the Statement of Assets and Liabilities. Entering into these agreements involves, to varying degrees, lack of liquidity and elements of credit, market, and Counterparty risk in excess of amounts recognized on the Statement of Assets and Liabilities. Such risks involve the possibility that a swap is difficult to sell or liquidate; the Counterparty does not honor its obligations under the agreement and unfavorable interest rates and market fluctuations. It is possible that developments in the swaps market, including potential government regulation, could adversely affect the Fund's ability to terminate existing swap agreements or to realize amounts to be received under such agreements. Additionally, ISDA master agreements include credit related contingent features which allow Counterparties to OTC derivatives to terminate derivative contracts prior to maturity in the event that, for example, the Fund's net assets decline by a stated percentage or the Fund fails to meet the terms of its ISDA master agreements, which would cause the Fund to accelerate payment of any net liability owed to the Counterparty. A short position in a security poses more risk than holding the same security long. As there is no limit on how much the price of the security can increase, the Fund's exposure is unlimited.
Notional amounts of each individual credit default swap agreement outstanding as of February 29, 2020 for which the Fund is the seller of protection are disclosed in the open swap agreements table. These potential amounts would be partially offset by any recovery values of the respective referenced obligations, upfront payments received upon entering into the agreement, or net amounts received from the settlement of buy protection credit default swap agreements entered into by the Fund for the same referenced entity or entities.
N.Other Risks - The current low interest rate environment was created in part by the Federal Reserve Board (FRB) and certain foreign central banks keeping the federal funds and equivalent foreign rates near historical lows. Increases in the federal funds and equivalent foreign rates may expose fixed income markets to heightened volatility and reduced liquidity for certain fixed income investments, particularly those with longer maturities. In addition, decreases in fixed income dealer market-making capacity may also potentially lead to heightened volatility and reduced liquidity in the fixed income markets. As a result, the value of the Fund's investments and share price may decline. Changes in central bank policies could also result in higher than normal shareholder redemptions, which could potentially increase portfolio turnover and the Fund's transaction costs. CLOs are subject to the risks of substantial losses due to actual defaults by underlying borrowers, which will be greater during periods of economic or financial stress. CLOs may also lose value due to collateral defaults and disappearance of subordinate tranches, market anticipation of defaults, and investor aversion to CLO securities as a class. The risks of CLOs will be greater if the Fund invests in CLOs that hold loans of uncreditworthy borrowers or if the Fund holds subordinate tranches of the CLO that absorbs losses from the defaults before senior tranches. In addition, CLOs are subject to interest rate risk and credit risk. The market values of convertible securities are affected by market interest rates, the risk of actual issuer default on interest or principal payments and the value of the underlying common stock into which the convertible security may be converted. Additionally, a convertible security is subject to the same types of market and issuer risks as apply to the underlying common stock. In addition, certain convertible securities are subject to involuntary conversions and may undergo principal write-downs upon the occurrence of certain triggering events, and, as a result, are subject to an increased risk of loss. Convertible securities may be rated below investment grade. Emerging markets (also referred to as developing markets) are generally subject to greater market volatility, political, social and economic instability, uncertainty regarding the existence of trading markets and more governmental limitations on foreign investment than more developed markets. In addition, companies operating in emerging markets may be subject to lower trading volume and greater price fluctuations than companies in more developed markets. Securities law in many emerging market countries is relatively new and unsettled. Therefore, laws regarding foreign investment in emerging market securities, securities regulation, title to securities, and shareholder rights may change quickly and unpredictably. In addition, the enforcement of systems of taxation at federal, regional and local levels in emerging market countries may be inconsistent, and subject to sudden change. Other risks of investing in emerging markets securities may include additional transaction costs, delays in settlement procedures, and lack of timely information. The Fund's foreign investments may be adversely affected by political and social instability, changes in economic or taxation policies, difficulty in enforcing obligations, decreased liquidity or increased volatility. Foreign investments also involve the risk of the possible seizure, nationalization or expropriation of the issuer or foreign deposits (in which the Fund could lose its entire investments in a certain market) and the possible adoption of foreign governmental restrictions such as exchange controls. Unless the Fund has hedged its foreign securities risk, foreign securities risk also involves the risk of negative foreign currency rate fluctuations, which may cause the value of securities denominated in such foreign currency (or other instruments through which the Fund has exposure to foreign currencies) to decline in value. Currency exchange rates may fluctuate significantly over short periods of time. Currency hedging strategies, if used, are not always successful. The Fund may invest in lower-quality debt securities, i.e., "junk bonds". Investments in lower-rated securities or unrated securities of comparable quality tend to be more sensitive to economic conditions than higher rated securities. Junk bonds involve a greater risk of default by the issuer because such securities are generally unsecured and are often subordinated to other creditors' claim. Mortgage- and asset-backed securities, including collateralized debt obligations and collateralized mortgage obligations, are subject to prepayment or call risk, which is the risk that a borrower's payments may be received earlier or later than expected due to changes in prepayment rates on underlying loans. This could result in the Fund reinvesting these early payments at lower interest rates, thereby reducing the Fund's income. Mortgage- and asset-backed securities also are subject to extension risk, which is the risk that an unexpected rise in interest rates could reduce the rate of prepayments, causing the price of the mortgage- and asset-backed securities and the Fund's share price to fall. An unexpectedly high rate of defaults on the mortgages held by a mortgage pool may adversely affect the value of mortgage-backed securities and could result in losses to the Fund. Privately-issued mortgage-backed securities and asset-backed securities may be less liquid than other types of securities and the Fund may be unable to sell these securities at the time or price it desires. The risk of a municipal obligation generally depends on the financial and credit status of the issuer. Constitutional amendments, legislative enactments, executive orders, administrative regulations, voter initiatives, and the issuer's regional economic conditions may affect the municipal security's value, interest payments, repayment of principal and the Fund's ability to sell the security. Failure of a municipal security issuer to comply with applicable tax requirements may make income paid thereon taxable, resulting in a decline in the security's value. In addition, there could be changes in applicable tax laws or tax treatments that reduce or eliminate the current federal income tax exemption on municipal securities or otherwise adversely affect the current federal or state tax status of municipal securities. Preferred securities are subject to issuer-specific and market risks applicable generally to equity securities. Preferred securities also may be subordinated to bonds or other debt instruments, subjecting them to a greater risk of non-payment, may be less liquid than many other securities, such as common stocks, and generally offer no voting rights with respect to the issuer.
O.Leverage Risk — Leverage exists when the Fund can lose more than it originally invests because it purchases or sells an instrument or enters into a transaction without investing an amount equal to the full economic exposure of the instrument or transaction.
P.Collateral —To the extent the Fund has designated or segregated a security as collateral and that security is subsequently sold, it is the Fund's practice to replace such collateral no later than the next business day.
26 | Invesco High Yield Fund |
NOTE 2—Advisory Fees and Other Fees Paid to Affiliates
The Trust has entered into a master investment advisory agreement with Invesco Advisers, Inc. (the "Adviser" or "Invesco"). Under the terms of the investment advisory agreement, the Fund accrues daily and pays monthly an advisory fee to the Adviser based on the annual rate of the Fund's average daily net assets as follows:
Average Daily Net Assets | Rate |
First $200 million | 0.625% |
| |
Next $300 million | 0.550% |
| |
Next $500 million | 0.500% |
Over $1 billion | 0.450% |
| |
For the year ended February 29, 2020, the effective advisory fee rate incurred by the Fund was 0.529%.
Under the terms of a master sub-advisory agreement between the Adviser and each of Invesco Asset Management Deutschland GmbH, Invesco Asset Management Limited, Invesco Asset Management (Japan) Limited, Invesco Hong Kong Limited, Invesco Senior Secured Management, Inc. and Invesco Canada Ltd. and separate sub-advisory agreements with Invesco Capital Management LLC and Invesco Asset Management (India) Private Limited (collectively, the "Affiliated Sub-Advisers") the Adviser, not the Fund, will pay 40% of the fees paid to the Adviser to any such Affiliated Sub-Adviser(s) that provide(s) discretionary investment management services to the Fund based on the percentage of assets allocated to such Affiliated Sub-Adviser(s).
The Adviser has contractually agreed, through at least June 30, 2020, to waive advisory fees and/or reimburse expenses of all shares to the extent necessary to limit total annual fund operating expenses after fee waiver and/or expense reimbursement (excluding certain items discussed below) of Class A, Class C, Class Y, Investor Class, Class R5 and Class R6 shares to 1.50%, 2.25%, 1.25%, 1.50%, 1.25% and 1.25%, respectively, of the Fund's average daily net assets (the "expense limits"). In determining the Adviser's obligation to waive advisory fees and/or reimburse expenses, the following expenses are not taken into account, and could cause the total annual fund operating expenses after fee waiver and/or reimbursement to exceed the numbers reflected above: (1) interest; (2) taxes; (3) dividend expense on short sales; (4) extraordinary or non-routine items, including litigation expenses; and (5) expenses that the Fund has incurred but did not actually pay because of an expense offset arrangement. Unless Invesco continues the fee waiver agreement, it will terminate on June 30, 2020. During its term, the fee waiver agreement cannot be terminated or amended to increase the expense limits or reduce the advisory fee waivers without approval of the Board of Trustees. The Adviser did not waive fees and/or reimburse expenses during the period under this expense limit.
The Adviser has contractually agreed, through at least June 30, 2021, to waive the advisory fee payable by the Fund in an amount equal to 100% of the net advisory fees the Adviser receives from the affiliated money market funds on investments by the Fund of uninvested cash in such affiliated money market funds.
For the year ended February 29, 2020, the Adviser waived advisory fees of $65,673.
The Trust has entered into a master administrative services agreement with Invesco pursuant to which the Fund has agreed to pay Invesco for certain administrative costs incurred in providing accounting services to the Fund. For the year ended February 29, 2020, expenses incurred under the agreement are shown in the Statement of Operations as Administrative services fees. Invesco has entered into a sub-administration agreement whereby State Street Bank and Trust Company ("SSB") serves as fund accountant and provides certain administrative services to the Fund. Pursuant to a custody agreement with the Trust on behalf of the Fund, SSB also serves as the Fund's custodian.
The Trust has entered into a transfer agency and service agreement with Invesco Investment Services, Inc. ("IIS") pursuant to which the Fund has agreed to pay IIS a fee for providing transfer agency and shareholder services to the Fund and reimburse IIS for certain expenses incurred by IIS in the course of providing such services. IIS may make payments to intermediaries that provide omnibus account services, sub-accounting services and/or networking services. All fees payable by IIS to intermediaries that provide omnibus account services or sub-accounting services are charged back to the Fund, subject to certain limitations approved by the Trust's Board of Trustees. For the year ended February 29, 2020, expenses incurred under the agreement are shown in the Statement of Operations as Transfer agent fees.
The Trust has entered into master distribution agreements with Invesco Distributors, Inc. ("IDI") to serve as the distributor for the Class A, Class C, Class Y, Investor Class, Class R5 and Class R6 shares of the Fund. The Trust has adopted plans pursuant to Rule 12b-1 under the 1940 Act with respect to the Fund's Class A, Class C and Investor Class shares (collectively, the "Plans"). The Fund, pursuant to the Plans, pays IDI compensation at the annual rate of 0.25% of the Fund's average daily net assets of Class A shares and 1.00% of the average daily net assets of Class C shares. The Fund, pursuant to the Investor Class Plan, reimburses IDI for its allocated share of expenses incurred pursuant to the Investor Class Plan for the period, up to a maximum annual rate of 0.25% of the average daily net assets of Investor Class shares. The fees are accrued daily and paid monthly. Of the Plan payments, up to 0.25% of the average daily net assets of each class of shares may be paid to furnish continuing personal shareholder services to customers who purchase and own shares of such classes. Any amounts not paid as a service fee under the Plans would constitute an asset-based sales charge. Rules of the Financial Industry Regulatory Authority ("FINRA") impose a cap on the total sales charges, including asset-based sales charges, that may be paid by any class of shares of the Fund. For the year ended February 29, 2020, expenses incurred under the Plans are shown in the Statement of Operations as Distribution fees.
Front-end sales commissions and CDSC (collectively, the "sales charges") are not recorded as expenses of the Fund. Front-end sales commissions are deducted from proceeds from the sales of Fund shares prior to investment in Class A shares of the Fund. CDSC are deducted from redemption proceeds prior to remittance to the shareholder. During the year ended February 29, 2020, IDI advised the Fund that IDI retained $76,683 in front-end sales commissions from the sale of Class A shares and $10,498 and $1,178 from Class A and Class C shares, respectively, for CDSC imposed upon redemptions by shareholders.
Certain officers and trustees of the Trust are officers and directors of the Adviser, IIS and/or IDI.
NOTE 3—Additional Valuation Information
GAAP defines fair value as the price that would be received to sell an asset or paid to transfer a liability in an orderly transaction between market participants at the measurement date, under current market conditions. GAAP establishes a hierarchy that prioritizes the inputs to valuation methods, giving the highest priority to readily available unadjusted quoted prices in an active market for identical assets (Level 1) and the lowest priority to significant unobservable inputs (Level 3), generally when market prices are not readily available or are unreliable. Based on the valuation inputs, the securities or other investments are tiered into one of three levels. Changes in valuation methods may result in transfers in or out of an investment's assigned level:
Level 1 – Prices are determined using quoted prices in an active market for identical assets.
Level 2 – Prices are determined using other significant observable inputs. Observable inputs are inputs that other market participants may use in pricing a security. These may include quoted prices for similar securities, interest rates, prepayment speeds, credit risk, yield curves, loss severities, default rates, discount rates, volatilities and others.
Level 3 – Prices are determined using significant unobservable inputs. In situations where quoted prices or observable inputs are unavailable (for example, when there is little or no market activity for an investment at the end of the period), unobservable inputs may be used. Unobservable inputs reflect the Fund's own assumptions about the factors market participants would use in determining fair value of the securities or instruments and would be based on the best available information.
27 | Invesco High Yield Fund |
The following is a summary of the tiered valuation input levels, as of February 29, 2020. The level assigned to the securities valuations may not be an indication of the risk or liquidity associated with investing in those securities. Because of the inherent uncertainties of valuation, the values reflected in the financial statements may materially differ from the value received upon actual sale of those investments.
| | Level 1 | | Level 2 | Level 3 | | Total |
Investments in Securities | | | | | | | | | |
U.S. Dollar Denominated Bonds & Notes | $ | — | $ | 965,691,953 | $0 | $ | 965,691,953 | |
Asset-Backed Securities | | — | | 22,509,524 | — | | 22,509,524 | |
Exchange-Traded Funds | | 21,819,380 | | — | — | | 21,819,380 | |
Variable Rate Senior Loan Interests | | — | | 19,157,284 | — | | 19,157,284 | |
Non-U.S. Dollar Denominated Bonds & Notes | | — | | 5,965,915 | — | | 5,965,915 | |
U.S. Treasury Securities | | — | | 2,271,233 | — | | 2,271,233 | |
U.S. Government Sponsored Agency Mortgage-Backed Securities | | — | | 780,344 | — | | 780,344 | | |
Common Stocks & Other Equity Interests | | 12,526 | | — | 4 | | 12,530 | | |
Money Market Funds | | 35,605,045 | | — | — | | 35,605,045 | |
Total Investments in Securities | | 57,436,951 | | 1,016,376,253 | 4 | | 1,073,813,208 | |
Other Investments - Assets* | | | | | | | | | |
Investments Matured | | — | | — | 0 | | 0 | | |
Forward Foreign Currency Contracts | | — | | 9,668 | — | | 9,668 | | |
| | — | | 9,668 | 0 | | 9,668 | | |
Other Investments - Liabilities* | | | | | | | | | |
Forward Foreign Currency Contracts | | — | | (158,283) | — | | (158,283) |
| | | | | | | | |
Swap Agreements | | — | | (394,046) | — | | (394,046) |
| | | | | | | | |
| | — | | (552,329) | — | | (552,329) |
| | | | | | | | |
Total Other Investments | | — | | (542,661) | — | | (542,661) |
Total Investments | $ | 57,436,951 | $1,015,833,592 | $4 | $1,073,270,547 | |
*Forward foreign currency contracts and swap agreements are valued at unrealized appreciation (depreciation). Investments matured are shown at value.
NOTE 4—Derivative Investments
The Fund may enter into an International Swaps and Derivatives Association Master Agreement ("ISDA Master Agreement") under which a fund may trade OTC derivatives. An OTC transaction entered into under an ISDA Master Agreement typically involves a collateral posting arrangement, payment netting provisions and close-out netting provisions. These netting provisions allow for reduction of credit risk through netting of contractual obligations. The enforceability of the netting provisions of the ISDA Master Agreement depends on the governing law of the ISDA Master Agreement, among other factors.
For financial reporting purposes, the Fund does not offset OTC derivative assets or liabilities that are subject to ISDA Master Agreements in the Statement of Assets and Liabilities.
Value of Derivative Investments at Period-End
The table below summarizes the value of the Fund's derivative investments, detailed by primary risk exposure, held as of February 29, 2020:
| | Value | |
| Currency | Interest | |
Derivative Assets | Risk | Rate Risk | Total |
Unrealized appreciation on forward foreign currency contracts outstanding | $ | 9,668 | $ | - | $ | 9,668 |
Derivatives not subject to master netting agreements | | | - | | - | | - | |
Total Derivative Assets subject to master netting agreements | $ | 9,668 | $ | - | $ | 9,668 |
| | | | | | | | | |
| | | | | Value | | | | |
| | | Currency | | Interest | | | | |
Derivative Liabilities | | | Risk | | Rate Risk | | Total | |
Unrealized depreciation on swap agreements — OTC | $ | - | $(394,046) | $(394,046) |
| | | | | | | | |
Unrealized depreciation on forward foreign currency contracts outstanding | | | (158,283) | | - | | (158,283) |
| | | | | | | | |
Total Derivative Liabilities | | | (158,283) | | (394,046) | | (552,329) |
| | | | | | | | |
Derivatives not subject to master netting agreements | | | - | | - | | - | |
Total Derivative Liabilities subject to master netting agreements | $(158,283) | $(394,046) | $(552,329) |
| | | | | | | | | |
28 | Invesco High Yield Fund |
Offsetting Assets and Liabilities
The table below reflects the Fund's exposure to Counterparties subject to either an ISDA Master Agreement or other agreement for OTC derivative transactions as of February 29, 2020.
| | | | | | | | | | | Collateral | | |
| Financial Derivative Assets | | | Financial Derivative Liabilities | | (Received/Pledged) | | |
| Forward | | | | Forward | | | | | | | | | | |
| Foreign | | | Foreign | | | | | | | | | | |
| Currency | | | Currency | | Swap | Total | Net Value of | | | | Net |
Counterparty | Contracts | | | Contracts | Agreements | Liabilities | Derivatives | Non-Cash | Cash | Amount | |
Goldman Sachs International | $9,668 | | $(158,283) | $ | – | $(158,283) | $(148,615) | $– | $– | $(148,615) |
| | | | | | | | | | | | |
Morgan Stanley & Co. LLC | – | | | – | | (499,749) | (499,749) | (499,749) | – | – | (499,749) |
| | | | | | | | | | |
Total | $9,668 | | $(158,283) | $(499,749) | $(658,032) | $(648,364) | $– | $– | $(648,364) |
| | | | | | | | | | | | | | | |
Effect of Derivative Investments for the year ended February 29, 2020
The table below summarizes the gains (losses) on derivative investments, detailed by primary risk exposure, recognized in earnings during the period:
| | | | Location of Gain (Loss) on | | | | |
| | | | Statement of Operations | | | | |
| | Credit | | Currency | | Interest | | | | |
| | Risk | | Risk | | Rate Risk | | Total |
Realized Gain (Loss): | | | | | | | | | | |
Forward foreign currency contracts | $ | - | $ | 720,414 | $ | - | $ | 720,414 | |
Options purchased(a) | | - | | (1,489,586) | | - | | (1,489,586) |
Options written | | - | | - | | 1,206,315 | | 1,206,315 | | |
Swap agreements | | 2,417,757 | | - | | (1,303,582) | | 1,114,175 | | |
Change in Net Unrealized Appreciation (Depreciation): | | | | | | | | | | |
Forward foreign currency contracts | | - | | (94,538) | | - | | (94,538) |
| | | | | | | | | |
Swap agreements | | (682,107) | | - | | (394,046) | | (1,076,153) |
| | | | | | | | | | |
Total | $ | 1,735,650 | $ | (863,710) | $ | (491,313) | $ | 380,627 | | |
(a)Options purchased are included in the net realized gain (loss) from investment securities. The table below summarizes the average notional value of derivatives held during the period.
| | | Foreign | | |
| Forward | | Currency | | |
| Foreign Currency | Swaptions | Options | Swaptions | Swap |
| Contracts | Purchased | Purchased | Written | Agreements |
Average notional value | $10,854,674 | $140,871,429 | $23,122,700 | $121,471,429 | $136,655,727 |
| | | | | |
NOTE 5—Expense Offset Arrangement(s)
The expense offset arrangement is comprised of transfer agency credits which result from balances in demand deposit accounts used by the transfer agent for clearing shareholder transactions. For the year ended February 29, 2020, the Fund received credits from this arrangement, which resulted in the reduction of the Fund's total expenses of $12,110.
NOTE 6—Trustees' and Officers' Fees and Benefits
Trustees' and Officers' Fees and Benefits include amounts accrued by the Fund to pay remuneration to certain Trustees and Officers of the Fund. Trustees have the option to defer compensation payable by the Fund, and Trustees' and Officers' Fees and Benefits also include amounts accrued by the Fund to fund such deferred compensation amounts. Those Trustees who defer compensation have the option to select various Invesco Funds in which their deferral accounts shall be deemed to be invested. Finally, certain current Trustees were eligible to participate in a retirement plan that provided for benefits to be paid upon retirement to Trustees over a period of time based on the number of years of service. The Fund may have certain former Trustees who also participate in a retirement plan and receive benefits under such plan. Trustees' and Officers' Fees and Benefits include amounts accrued by the Fund to fund such retirement benefits. Obligations under the deferred compensation and retirement plans represent unsecured claims against the general assets of the Fund.
NOTE 7—Cash Balances
The Fund may borrow for leveraging in an amount up to 5% of the Fund's total assets (excluding the amount borrowed) at the time the borrowing is made. In doing so, the Fund is permitted to temporarily carry a negative or overdrawn balance in its account with SSB, the custodian bank. Such balances, if any at period end, are shown in the Statement of Assets and Liabilities under the payable caption Amount due custodian. To compensate the custodian bank for such overdrafts, the overdrawn Fund may either (1) leave funds as a compensating balance in the account so the custodian bank can be compensated by earning the additional interest; or (2) compensate by paying the custodian bank at a rate agreed upon by the custodian bank and Invesco, not to exceed the contractually agreed upon rate. The Fund may not purchase additional securities when any borrowings from banks or broker-dealers exceed 5% of the Fund's total assets, or when any borrowings from an Invesco Fund are outstanding.
29 | Invesco High Yield Fund |

NOTE 8—Distributions to Shareholders and Tax Components of Net Assets
Tax Character of Distributions to Shareholders Paid During the Fiscal Years Ended February 29, 2020 and February 28, 2019:
| | 2020 | | 2019 | | |
Ordinary income | $65,906,573 | | $62,742,689 |
Tax Components of Net Assets at Period-End: | | | | | |
| | | | 2020 | | |
Undistributed ordinary income | | $ | 4,355,069 |
| | | | |
Net unrealized appreciation (depreciation) — investments | | | (56,029,865) |
Net unrealized appreciation - foreign currencies | | | 31,099 | |
Temporary book/tax differences | | | (345,754) |
| | | | |
Capital loss carryforward | | | (166,498,494) |
Shares of beneficial interest | | | 1,304,441,242 |
Total net assets | | $1,085,953,297 |
| | | | | | |
The difference between book-basis and tax-basis unrealized appreciation (depreciation) is due to differences in the timing of recognition of gains and losses on investments for tax and book purposes. The Fund's net unrealized appreciation (depreciation) difference is attributable primarily to book to tax accretion and amortization differences.
The temporary book/tax differences are a result of timing differences between book and tax recognition of income and/or expenses. The Fund's temporary book/tax differences are the result of the trustee deferral of compensation and retirement plan benefits.
Capital loss carryforward is calculated and reported as of a specific date. Results of transactions and other activity after that date may affect the amount of capital loss carryforward actually available for the Fund to utilize. The ability to utilize capital loss carryforward in the future may be limited under the Internal Revenue Code and related regulations based on the results of future transactions.
The Fund has a capital loss carryforward as of February 29, 2020, as follows:
Capital Loss Carryforward*
Expiration | Short-Term | Long-Term | Total |
Not subject to expiration | $56,282,480 | $110,216,014 | $166,498,494 |
*Capital loss carryforward is reduced for limitations, if any, to the extent required by the Internal Revenue Code and may be further limited depending upon a variety of factors, including the realization of net unrealized gains or losses as of the date of any reorganization.
NOTE 9—Investment Transactions
The aggregate amount of investment securities (other than short-term securities, U.S. Treasury obligations and money market funds, if any) purchased and sold by the Fund during the year ended February 29, 2020 was $646,614,683 and $698,966,861, respectively. During the same period, purchases and sales of U.S. Treasury obligations were $8,411,674 and $8,940,000, respectively. Cost of investments, including any derivatives, on a tax basis includes the adjustments for financial reporting purposes as of the most recently completed federal income tax reporting period-end.
Unrealized Appreciation (Depreciation) of Investments on a Tax Basis
Aggregate unrealized appreciation of investments | $ 29,882,027 | |
Aggregate unrealized (depreciation) of investments | (85,911,892) |
| | |
Net unrealized appreciation (depreciation) of investments | $(56,029,865) |
| | | |
Cost of investments for tax purposes is $1,129,300,412.
NOTE 10—Reclassification of Permanent Differences
Primarily as a result of differing book/tax treatment of market discounts and defaulted bonds, on February 29, 2020, undistributed net investment income was increased by $7,166,613 and undistributed net realized gain (loss) was decreased by $7,166,613. This reclassification had no effect on the net assets or the distributable earnings (loss) of the Fund.
NOTE 11—Share Information
Summary of Share Activity
| Year ended | Year ended |
| February 29, 2020(a) | | February 28, 2019 |
| Shares | Amount | Shares | Amount |
Sold: | | | | | |
Class A | 23,841,441 | $ 97,035,143 | 25,858,723 | $ 103,785,274 |
Class C | 3,327,980 | 13,502,209 | 2,090,715 | 8,428,988 |
Class Y | 7,578,729 | 30,934,255 | 25,840,783 | 104,305,214 |
Investor Class | 12,534,765 | 50,900,080 | 7,727,438 | 31,014,518 |
Class R5 | 4,044,966 | 16,396,532 | 3,035,402 | 12,267,352 |
Class R6 | 10,619,933 | 43,170,211 | 9,073,020 | 36,708,703 |
30 | Invesco High Yield Fund |

Summary of Share Activity
| Year ended | | Year ended |
| February 29, 2020(a) | | | February 28, 2019 | |
| Shares | | Amount | | Shares | | Amount |
Issued as reinvestment of dividends: | | | | | | | | | | |
Class A | 7,073,317 | $ | 28,695,757 | 6,648,792 | $ | 26,840,856 | |
Class C | 324,143 | | 1,311,503 | 595,394 | | 2,397,035 | | |
Class Y | 872,444 | | 3,550,538 | 1,109,580 | | 4,502,646 | |
Investor Class | 956,579 | | 3,878,323 | 1,011,065 | | 4,082,371 | |
Class R5 | 931,449 | | 3,764,899 | 935,850 | | 3,768,412 | | |
Class R6 | 2,850,554 | | 11,540,297 | 2,573,626 | | 10,370,646 | |
Automatic conversion of Class C shares to Class A shares: | | | | | | | | | | |
Class A | 1,137,000 | | 4,626,129 | - | | - | | |
Class C | (1,139,802) | | (4,626,129) | - | | - | | |
Reacquired: | | | | | | | | | | |
Class A | (33,465,100) | | (135,821,370) | (33,374,204) | | (134,783,996) |
| | | | | | | |
Class C | (2,762,570) | | (11,202,598) | (14,958,720) | | (59,822,320) |
| | | | | | | |
Class Y | (20,705,904) | | (84,409,222) | (27,548,353) | | (111,491,816) |
| | | | | | | |
Investor Class | (12,851,746) | | (52,245,368) | (12,859,586) | | (51,675,736) |
| | | | | | | |
Class R5 | (6,925,624) | | (28,081,599) | (6,201,655) | | (24,973,961) |
| | | | | | | |
Class R6 | (11,587,672) | | (46,914,498) | (12,777,701) | | (51,575,464) |
| | | | | | | |
Net increase (decrease) in share activity | (13,345,118) | $ | (53,994,908) | (21,219,831) | $ | (85,851,278) |
| | | | | | | | | | |
(a)There are entities that are record owners of more than 5% of the outstanding shares of the Fund and in the aggregate own 37% of the outstanding shares of the Fund. IDI may have an agreement with these entities to sell Fund shares. The Fund, Invesco and/or Invesco affiliates may make payments to these entities, which are considered to be related to the Fund, for providing services to the Fund, Invesco and/or Invesco affiliates including but not limited to services such as securities brokerage, distribution, third party record keeping and account servicing. The Fund has no knowledge as to whether all or any portion of the shares owned of record by these entities are also owned beneficially.
In addition, 8% of the outstanding shares of the Fund are owned by the Adviser or an affiliate of the Adviser.
NOTE 12—Subsequent Event
During the first quarter of 2020, the World Health Organization declared the coronavirus (COVID-19) to be a public health emergency. COVID-19 has led to increased short-term market volatility and may have adverse long-term effects on U.S. and world economies and markets in general. COVID-19 may adversely impact the Fund's ability to achieve its investment objective. Because of the uncertainties on valuation, the global economy and business operations, values reflected in these financial statements may materially differ from the value received upon actual sales of those investments.
The Coronavirus Aid, Relief, and Economic Security Act, commonly referred to as the "CARES Act," was signed into law on March 27, 2020 by President Trump. The Adviser is assessing the components of the Act, and the impacts to the Fund should be immaterial.
31 | Invesco High Yield Fund |
Report of Independent Registered Public Accounting Firm
To the Board of Trustees of AIM Investment Securities Funds (Invesco Investment Securities Funds) and Shareholders of Invesco High Yield Fund
Opinion on the Financial Statements
We have audited the accompanying statement of assets and liabilities, including the schedule of investments, of Invesco High Yield Fund (one of the funds constituting AIM Investment Securities Funds (Invesco Investment Securities Funds), hereafter referred to as the "Fund") as of February 29, 2020, the related statement of operations for the year ended February 29, 2020, the statement of changes in net assets for each of the two years in the period ended February 29, 2020, including the related notes, and the financial highlights for each of the five years in the period ended February 29, 2020 (collectively referred to as the financial statements). In our opinion, the financial statements present fairly, in all material respects, the financial position of the Fund as of February 29, 2020, the results of its operations for the year then ended, the changes in its net assets for each of the two years in the period ended February 29, 2020 and the financial highlights financial highlights for each of the five years in the period ended February 29, 2020 in conformity with accounting principles generally accepted in the United States of America.
Basis for Opinion
These financial statements are the responsibility of the Fund's management. Our responsibility is to express an opinion on the Fund's financial statements based on our audits. We are a public accounting firm registered with the Public Company Accounting Oversight Board (United States) (PCAOB) and are required to be independent with respect to the Fund in accordance with the U.S. federal securities laws and the applicable rules and regulations of the Securities and Exchange Commission and the
PCAOB.
We conducted our audits of these financial statements in accordance with the standards of the PCAOB. Those standards require that we plan and perform the audit to obtain reasonable assurance about whether the financial statements are free of material misstatement, whether due to error or fraud.
Our audits included performing procedures to assess the risks of material misstatement of the financial statements, whether due to error or fraud, and performing procedures that respond to those risks. Such procedures included examining, on a test basis, evidence regarding the amounts and disclosures in the financial statements. Our audits also included evaluating the accounting principles used and significant estimates made by management, as well as evaluating the overall presentation of the financial statements. Our procedures included confirmation of securities owned as of February 29, 2020 by correspondence with the custodian, transfer agent and brokers; when replies were not received from brokers, we performed other auditing procedures. We believe that our audits provide a reasonable basis for our opinion.
/s/PricewaterhouseCoopers LLP
Houston, Texas
April 28, 2020
We have served as the auditor of one or more of the investment companies in the Invesco group of investment companies since at least 1995. We have not been able to determine the specific year we began serving as auditor.
32 | Invesco High Yield Fund |
Calculating your ongoing Fund expenses
Example
As a shareholder of the Fund, you incur two types of costs: (1) transaction costs, which may include sales charges (loads) on purchase payments or contingent deferred sales charges on redemptions, if any; and (2) ongoing costs, including management fees, distribution and/or service (12b-1) fees, and other Fund expenses. This example is intended to help you understand your ongoing costs (in dollars) of investing in the Fund and to compare these costs with ongoing costs of investing in other mutual funds. The example is based on an investment of $1,000 invested at the beginning of the period and held for the entire period September 1, 2019 through February 29, 2020.
Actual expenses
The table below provides information about actual account values and actual expenses. You may use the information in this table, together with the amount you invested, to estimate the expenses that you paid over the period. Simply divide your account value by $1,000 (for example, an $8,600 account value divided by $1,000 = 8.6), then multiply the result by the number in the table under the heading entitled "Actual Expenses Paid During Period" to estimate the expenses you paid on your account during this period.
Hypothetical example for comparison purposes
The table below also provides information about hypothetical account values and hypothetical expenses based on the Fund's actual expense ratio and an assumed rate of return of 5% per year before expenses, which is not the Fund's actual return.
The hypothetical account values and expenses may not be used to estimate the actual ending account balance or expenses you paid for the period. You may use this information to compare the ongoing costs of investing in the Fund and other funds. To do so, compare this 5% hypothetical example with the 5% hypothetical examples that appear in the shareholder reports of the other funds.
Please note that the expenses shown in the table are meant to highlight your ongoing costs only and do not reflect any transaction costs, such as sales charges (loads) on purchase payments or contingent deferred sales charges on redemptions, if any. Therefore, the hypothetical information is useful in comparing ongoing costs only, and will not help you determine the relative total costs of owning different funds. In addition, if these transaction costs were included, your costs would have been higher.
| | | | | HYPOTHETICAL | |
| | | | | (5% annual return before | |
| | | ACTUAL | | expenses) | |
| Beginning | Ending | | Expenses | Ending | | Expenses | Annualized |
| Account Value | Account Value | | Paid During | Account Value | | Paid During | Expense |
| (09/01/19) | (02/29/20)1 | | Period2 | (02/29/20) | | Period2 | Ratio |
Class A | $1,000.00 | $1,004.30 | | $5.08 | $1,019.79 | | $5.12 | 1.02% |
| | | | | | | | |
Class C | 1,000.00 | 1,000.50 | | 8.80 | 1,016.06 | | 8.87 | 1.77 |
| | | | | | | | |
Class Y | 1,000.00 | 1,005.70 | | 3.84 | 1,021.03 | | 3.87 | 0.77 |
| | | | | | | | |
Investor Class | 1,000.00 | 1,004.30 | | 5.08 | 1,019.79 | | 5.12 | 1.02 |
Class R5 | 1,000.00 | 1,005.80 | | 3.49 | 1,021.38 | | 3.52 | 0.70 |
| | | | | | | | |
Class R6 | 1,000.00 | 1,006.30 | | 3.04 | 1,021.83 | | 3.07 | 0.61 |
1The actual ending account value is based on the actual total return of the Fund for the period September 1, 2019 through February 29, 2020, after actual expenses and will differ from the hypothetical ending account value which is based on the Fund's expense ratio and a hypothetical annual return of 5% before expenses.
2Expenses are equal to the Fund's annualized expense ratio as indicated above multiplied by the average account value over the period, multiplied by 182/366 to reflect the most recent fiscal half year.
33 | Invesco High Yield Fund |
Tax Information
Form 1099-DIV, Form 1042-S and other year–end tax information provide shareholders with actual calendar year amounts that should be included in their tax returns. Shareholders should consult their tax advisers.
The following distribution information is being provided as required by the Internal Revenue Code or to meet a specific state's requirement.
The Fund designates the following amounts or, if subsequently determined to be different, the maximum amount allowable for its fiscal year ended February 29, 2020:
Federal and State Income Tax
Qualified Dividend Income* | 0.61% |
Corporate Dividends Received Deduction* | 0.48% |
U.S. Treasury Obligations* | 0.10% |
* The above percentages are based on ordinary income dividends paid to shareholders during the Fund's fiscal year.
34 | Invesco High Yield Fund |
Trustees and Officers
The address of each trustee and officer is AIM Investment Securities Funds (Invesco Investment Securities Funds) (the "Trust"), 11 Greenway Plaza, Suite 1000, Houston, Texas 77046-1173. The trustees serve for the life of the Trust, subject to their earlier death, incapacitation, resignation, retirement or removal as more specifically provided in the Trust's organizational documents. Each officer serves for a one year term or until their successors are elected and qualified. Column two below includes length of time served with predecessor entities, if any.
| Trustee | | Number of | Other |
Name, Year of Birth and | | Funds in | Directorship(s) |
and/or | | Fund Complex | Held by Trustee |
Position(s) | Officer | Principal Occupation(s) | Overseen by | During Past 5 |
Held with the Trust | Since | During Past 5 Years | Trustee | Years |
Interested Trustee | | | | |
Martin L. Flanagan1 — 1960 | 2007 | Executive Director, Chief Executive Officer and President, Invesco Ltd. | 229 | None |
Trustee and Vice Chair | | (ultimate parent of Invesco and a global investment management firm); | | |
| | Trustee and Vice Chair, The Invesco Funds; Vice Chair, Investment Company | | |
| | Institute; and Member of Executive Board, SMU Cox School of Business | | |
| | Formerly: Advisor to the Board, Invesco Advisers, Inc. (formerly known as | | |
| | Invesco Institutional (N.A.), Inc.); Chairman and Chief Executive Officer, | | |
| | Invesco Advisers, Inc. (registered investment adviser); Director, Chairman, | | |
| | Chief Executive Officer and President, Invesco Holding Company (US), Inc. | | |
| | (formerly IVZ Inc.) (holding company), Invesco Group Services, Inc. (service | | |
| | provider) and Invesco North American Holdings, Inc. (holding company); | | |
| | Director, Chief Executive Officer and President, Invesco Holding Company | | |
| | Limited (parent of Invesco and a global investment management firm); | | |
| | Director, Invesco Ltd.; Chairman, Investment Company Institute and President, | | |
| | Co-Chief Executive Officer, Co-President, Chief Operating Officer and Chief | | |
| | Financial Officer, Franklin Resources, Inc. (global investment management | | |
| | organization) | | |
1Mr. Flanagan is considered an interested person (within the meaning of Section 2(a)(19) of the 1940 Act) of the Trust because he is an officer of the Adviser to the Trust, and an officer and a director of Invesco Ltd., ultimate parent of the Adviser.
T-1 | Invesco High Yield Fund |
Trustees and Officers—(continued)
| | | Number of | |
| | | Funds | Other |
| Trustee | | in | Directorship(s) |
Name, Year of Birth and | and/or | | Fund Complex | Held by Trustee |
Position(s) | Officer | Principal Occupation(s) | Overseen by | During Past 5 |
Held with the Trust | Since | During Past 5 Years | Trustee | Years |
Independent Trustees | | | | |
Bruce L. Crockett – 1944 | 1992 | Chairman, Crockett Technologies Associates (technology consulting company) | 229 | Director and |
Trustee and Chair | | Formerly: Director, Captaris (unified messaging provider); Director, President | | Chairman of the |
| | | Audit Committee, |
| | and Chief Executive Officer, COMSAT Corporation; Chairman, Board of | |
| | | ALPS (Attorneys |
| | Governors of INTELSAT (international communications company); ACE Limited | |
| | | Liability |
| | (insurance company); Independent Directors Council and Investment Company | |
| | | Protection |
| | Institute: Member of the Audit Committee, Investment Company Institute; | |
| | | Society) |
| | Member of the Executive Committee and Chair of the Governance Committee, | |
| | | (insurance |
| | Independent Directors Council | |
| | | company); |
| | | |
| | | | Director and |
| | | | Member of the |
| | | | Audit Committee |
| | | | and |
| | | | Compensation |
| | | | Committee, |
| | | | Ferroglobe PLC |
| | | | (metallurgical |
| | | | company) |
David C. Arch – 1945 | 2010 | Chairman of Blistex Inc. (consumer health care products manufacturer); | 229 | Board member of |
Trustee | | Member, World Presidents' Organization | | the Illinois |
| | | | Manufacturers' |
| | | | Association |
Beth Ann Brown – 1968 | 2019 | Independent Consultant | 229 | Director, Board of |
Trustee | | Formerly: Head of Intermediary Distribution, Managing Director, Strategic | | Directors of |
| | | Caron |
| | Relations, Managing Director, Head of National Accounts, Senior Vice | |
| | | Engineering Inc.; |
| | President, National Account Manager and Senior Vice President, Key Account | |
| | | Advisor, Board of |
| | Manager, Columbia Management Investment Advisers LLC; Vice President, Key | |
| | | Advisors of Caron |
| | Account Manager, Liberty Funds Distributor, Inc.; and Trustee of certain | |
| | | Engineering Inc.; |
| | Oppenheimer Funds | |
| | | President and |
| | | |
| | | | Director, Acton |
| | | | Shapleigh Youth |
| | | | Conservation |
| | | | Corps (non - |
| | | | profit); and Vice |
| | | | President and |
| | | | Director of |
| | | | Grahamtastic |
| | | | Connection (non- |
| | | | profit) |
Jack M. Fields – 1952 | 1997 | Chief Executive Officer, Twenty First Century Group, Inc. (government affairs | 229 | Member, Board of Directors of |
Trustee | | company); and Chairman, Discovery Learning Alliance (non-profit) | | Baylor College of Medicine |
| | Formerly: Owner and Chief Executive Officer, Dos Angeles Ranch L.P. (cattle, | | |
| | hunting, corporate entertainment); Director, Insperity, Inc. (formerly known as | | |
| | Administaff) (human resources provider); Chief Executive Officer, Texana | | |
| | Timber LP (sustainable forestry company); Director of Cross Timbers Quail | | |
| | Research Ranch (non-profit); and member of the U.S. House of Representatives | | |
| | | | |
T-2 | Invesco High Yield Fund |

Trustees and Officers—(continued)
| | | Number of | |
| | | Funds | Other |
| Trustee | | in | Directorship(s) |
Name, Year of Birth and | and/or | | Fund Complex | Held by Trustee |
Position(s) | Officer | Principal Occupation(s) | Overseen by | During Past 5 |
Held with the Trust | Since | During Past 5 Years | Trustee | Years |
Independent Trustees—(continued) | | | |
Cynthia Hostetler —1962 | 2017 | Non-Executive Director and Trustee of a number of public and private business | 229 | Vulcan Materials |
Trustee | | corporations | | Company |
| | Formerly: Director, Aberdeen Investment Funds (4 portfolios); Head of | | (construction |
| | | materials |
| | Investment Funds and Private Equity, Overseas Private Investment | |
| | | company); Trilinc |
| | Corporation; President, First Manhattan Bancorporation, Inc.; Attorney, | |
| | | Global Impact |
| | Simpson Thacher & Bartlett LLP | |
| | | Fund; Genesee & |
| | | |
| | | | Wyoming, Inc. |
| | | | (railroads); Artio |
| | | | Global Investment |
| | | | LLC (mutual fund |
| | | | complex); Edgen |
| | | | Group, Inc. |
| | | | (specialized |
| | | | energy and |
| | | | infrastructure |
| | | | products |
| | | | distributor); |
| | | | Investment |
| | | | Company Institute |
| | | | (professional |
| | | | organization); |
| | | | Independent |
| | | | Directors Council |
| | | | (professional |
| | | | organization) |
Eli Jones – 1961 | 2016 | Professor and Dean, Mays Business School - Texas A&M University | 229 | Insperity, Inc. |
Trustee | | Formerly: Professor and Dean, Walton College of Business, University of | | (formerly known |
| | | as Administaff) |
| | Arkansas and E.J. Ourso College of Business, Louisiana State University; | |
| | | (human resources |
| | Director, Arvest Bank | |
| | | provider) |
| | | |
Elizabeth Krentzman – 1959 | 2019 | Formerly: Principal and Chief Regulatory Advisor for Asset Management | 229 | Trustee of the |
Trustee | | Services and U.S. Mutual Fund Leader of Deloitte & Touche LLP; General | | University of |
| | Counsel of the Investment Company Institute (trade association); National | | Florida National |
| | Director of the Investment Management Regulatory Consulting Practice, | | Board Foundation |
| | Principal, Director and Senior Manager of Deloitte & Touche LLP; Assistant | | and Audit |
| | Director of the Division of Investment Management - Office of Disclosure and | | Committee |
| | Investment Adviser Regulation of the U.S. Securities and Exchange | | Member; Member |
| | Commission and various positions with the Division of Investment Management | | of the Cartica |
| | – Office of Regulatory Policy of the U.S. Securities and Exchange Commission; | | Funds Board of |
| | Associate at Ropes & Gray LLP; Advisory Board Member of the Securities and | | Directors (private |
| | Exchange Commission Historical Society; and Trustee of certain Oppenheimer | | investment |
| | Funds | | funds); Member |
| | | | of the University |
| | | | of Florida Law |
| | | | Center |
| | | | Association, Inc. |
| | | | Board of Trustees |
| | | | and Audit |
| | | | Committee |
| | | | Member |
Anthony J. LaCava, Jr. – 1956 | 2019 | Formerly: Director and Member of the Audit Committee, Blue Hills Bank | 229 | Blue Hills Bank; |
Trustee | | (publicly traded financial institution) and Managing Partner, KPMG LLP | | Chairman, |
| | | | Bentley |
| | | | University; |
| | | | Member, |
| | | | Business School |
| | | | Advisory Council; |
| | | | and Nominating |
| | | | Committee |
| | | | KPMG LLP |
Prema Mathai-Davis – 1950 | 1998 | Retired | 229 | None |
Trustee | | Co-Owner & Partner of Quantalytics Research, LLC, (a FinTech Investment | | |
| | | |
Research Platform for the Self-Directed Investor)
T-3 | Invesco High Yield Fund |

Trustees and Officers—(continued)
| | | Number of | |
| | | Funds | Other |
| Trustee | | in | Directorship(s) |
Name, Year of Birth and | and/or | | Fund Complex | Held by Trustee |
Position(s) | Officer | Principal Occupation(s) | Overseen by | During Past 5 |
Held with the Trust | Since | During Past 5 Years | Trustee | Years |
Independent Trustees—(continued) | | | |
Joel W. Motley – 1952 | 2019 | Director of Office of Finance, Federal Home Loan Bank System; Member of the | 229 | Member of Board |
Trustee | | Vestry of Trinity Wall Street; Managing Director of Carmona Motley Inc. | | of Greenwall |
| | (privately held financial advisor); Member of the Council on Foreign Relations | | Foundation |
| | and its Finance and Budget Committee; Chairman Emeritus of Board of Human | | (bioethics research |
| | Rights Watch and Member of its Investment Committee; and Member of | | foundation) and |
| | Investment Committee and Board of Historic Hudson Valley (non-profit cultural | | its Investment |
| | organization) | | Committee; |
| | Formerly: Managing Director of Public Capital Advisors, LLC (privately held | | Member of Board of |
| | | Friends of the LRC |
| | financial advisor); Managing Director of Carmona Motley Hoffman, Inc. | |
| | | (non-profit |
| | (privately held financial advisor); Trustee of certain Oppenheimer Funds; and | |
| | | legal advocacy); |
| | Director of Columbia Equity Financial Corp. (privately held financial advisor) | |
| | | Board Member |
| | | |
| | | | and Investment |
| | | | Committee |
| | | | Member of |
| | | | Pulizer Center for |
| | | | Crisis Reporting |
| | | | (non-profit |
| | | | journalism) |
Teresa M. Ressel — 1962 | 2017 | Non-executive director and trustee of a number of public and private business | 229 | Atlantic Power |
Trustee | | corporations | | Corporation |
| | Formerly: Chief Financial Officer, Olayan America, The Olayan Group | | (power generation |
| | | company); ON |
| | (international investor/commercial/industrial); Chief Executive Officer, UBS | |
| | | Semiconductor |
| | Securities LLC; Group Chief Operating Officer, Americas, UBS AG; Assistant | |
| | | Corp. |
| | Secretary for Management & Budget and CFO, US Department of the Treasury | |
| | | (semiconductor |
| | | |
| | | | supplier) |
| | | | |
Ann Barnett Stern – 1957 | 2017 | President and Chief Executive Officer, Houston Endowment Inc. (private | 229 | Federal Reserve |
Trustee | | philanthropic institution) | | Bank of Dallas |
| | Formerly: Executive Vice President and General Counsel, Texas Children's | | |
| | Hospital; Attorney, Beck, Redden and Secrest, LLP; Business Law Instructor, | | |
| | University of St. Thomas; Attorney, Andrews & Kurth LLP | | |
Robert C. Troccoli – 1949 | 2016 | Retired | 229 | None |
Trustee | | Formerly: Adjunct Professor, University of Denver – Daniels College of | | |
| | | |
| | Business; Senior Partner, KPMG LLP | | |
| | | | |
Daniel S. Vandivort –1954 | 2019 | Treasurer, Chairman of the Audit and Finance Committee, and Trustee, Board | 229 | Chairman and |
Trustee | | of Trustees, Huntington Disease Foundation of America; and President, Flyway | | Lead Independent |
| | Advisory Services LLC (consulting and property management) | | Director, |
| | Formerly: Trustee and Governance Chair, of certain Oppenheimer Funds | | Chairman of the |
| | | Audit Committee, |
| | | |
| | | | and Director, |
| | | | Board of |
| | | | Directors, Value |
| | | | Line Funds |
James D. Vaughn – 1945 | 2019 | Retired | 229 | Board member |
Trustee | | Formerly: Managing Partner, Deloitte & Touche LLP; Trustee and Chairman of | | and Chairman of |
| | | Audit Committee |
| | the Audit Committee, Schroder Funds; Board Member, Mile High United Way, | |
| | | of AMG National |
| | Boys and Girls Clubs, Boy Scouts, Colorado Business Committee for the Arts, | |
| | | Trust Bank; |
| | Economic Club of Colorado and Metro Denver Network (economic development | |
| | | Trustee and |
| | corporation); and Trustee of certain Oppenheimer Funds | |
| | | Investment |
| | | |
| | | | Committee |
| | | | member, |
| | | | University of |
| | | | South Dakota |
| | | | Foundation; |
| | | | Board member, |
| | | | Audit Committee |
| | | | Member and past |
| | | | Board Chair, |
| | | | Junior |
| | | | Achievement |
| | | | (non-profit) |
Christopher L. Wilson - | 2017 | Retired | 229 | ISO New |
1957 | | Formerly: Director, TD Asset Management USA Inc. (mutual fund complex) (22 | | England, Inc. |
Trustee, Vice Chair and Chair | | | (non-profit |
| portfolios); Managing Partner, CT2, LLC (investing and consulting firm); | |
Designate | | | organization |
| President/Chief Executive Officer, Columbia Funds, Bank of America | |
| | | |
| Corporation; President/Chief Executive Officer, CDC IXIS Asset Management | managing |
| regional electricity |
| Services, Inc.; Principal & Director of Operations, Scudder Funds, Scudder, |
| market) |
| Stevens & Clark, Inc.; Assistant Vice President, Fidelity Investments |
| |
T-4 | Invesco High Yield Fund |
Trustees and Officers—(continued)
| | | Number of | Other |
| Trustee | | Funds in | Directorship(s) |
Name, Year of Birth and | and/or | | Fund Complex | Held by Trustee |
Position(s) | Officer | Principal Occupation(s) | Overseen by | During Past 5 |
Held with the Trust | Since | During Past 5 Years | Trustee | Years |
Officers | | | | |
Sheri Morris — 1964 | 1999 | Head of Global Fund Services, Invesco Ltd.; President, Principal Executive | N/A | N/A |
President, Principal Executive | | Officer and Treasurer, The Invesco Funds; Vice President, Invesco Advisers, | | |
Officer and Treasurer | | Inc. (formerly known as Invesco Institutional (N.A.), Inc.) (registered | | |
| | investment adviser); and Vice President, Invesco Exchange-Traded Fund Trust, | | |
| | Invesco Exchange-Traded Fund Trust II, Invesco India Exchange-Traded Fund | | |
| | Trust, Invesco Actively Managed Exchange-Traded Fund Trust, Invesco Actively | | |
| | Managed Exchange-Traded Commodity Fund Trust and Invesco | | |
| | Exchange-Traded Self-Indexed Fund Trust; and Vice President, | | |
| | OppenheimerFunds, Inc. | | |
| | Formerly: Vice President and Principal Financial Officer, The Invesco Funds; | | |
| | Vice President, Invesco AIM Advisers, Inc., Invesco AIM Capital Management, | | |
| | Inc. and Invesco AIM Private Asset Management, Inc.; Assistant Vice President | | |
| | and Assistant Treasurer, The Invesco Funds and Assistant Vice President, | | |
| | Invesco Advisers, Inc., Invesco AIM Capital Management, Inc. and Invesco AIM | | |
| | Private Asset Management, Inc.; and Treasurer, Invesco Exchange-Traded | | |
| | Fund Trust, Invesco Exchange-Traded Fund Trust II, Invesco India | | |
| | Exchange-Traded Fund Trust and Invesco Actively Managed Exchange-Traded | | |
| | Fund Trust | | |
Russell C. Burk — 1958 | 2005 | Senior Vice President and Senior Officer, The Invesco Funds | N/A | N/A |
Senior Vice President and Senior | | | | |
Officer | | | | |
Jeffrey H. Kupor – 1968 | 2018 | Head of Legal of the Americas, Invesco Ltd.; Senior Vice President and | N/A | N/A |
Senior Vice President, Chief Legal | | Secretary, Invesco Advisers, Inc. (formerly known as Invesco Institutional | | |
Officer and Secretary | | (N.A.), Inc.) (registered investment adviser); Senior Vice President and | | |
| | Secretary, Invesco Distributors, Inc. (formerly known as Invesco AIM | | |
| | Distributors, Inc.); Vice President and Secretary, Invesco Investment Services, | | |
| | Inc. (formerly known as Invesco AIM Investment Services, Inc.) Senior Vice | | |
| | President, Chief Legal Officer and Secretary, The Invesco Funds; Secretary and | | |
| | General Counsel, Invesco Investment Advisers LLC (formerly known as Van | | |
| | Kampen Asset Management); Secretary and General Counsel, Invesco Capital | | |
| | Markets, Inc. (formerly known as Van Kampen Funds Inc.) and Chief Legal | | |
| | Officer, Invesco Exchange-Traded Fund Trust, Invesco Exchange-Traded Fund | | |
| | Trust II, Invesco India Exchange-Traded Fund Trust, Invesco Actively Managed | | |
| | Exchange-Traded Fund Trust, Invesco Actively Managed Exchange-Traded | | |
| | Commodity Fund Trust and Invesco Exchange-Traded Self-Indexed Fund Trust; | | |
| | Secretary, Invesco Indexing LLC; Secretary, W.L. Ross & Co., LLC | | |
| | Formerly: Secretary and Vice President, Jemstep, Inc.; Head of Legal, | | |
| | Worldwide Institutional, Invesco Ltd.; Secretary and General Counsel, INVESCO | | |
| | Private Capital Investments, Inc.; Senior Vice President, Secretary and General | | |
| | Counsel, Invesco Management Group, Inc. (formerly known as Invesco AIM | | |
| | Management Group, Inc.); Assistant Secretary, INVESCO Asset Management | | |
| | (Bermuda) Ltd.; Secretary and General Counsel, Invesco Private Capital, Inc.; | | |
| | Assistant Secretary and General Counsel, INVESCO Realty, Inc.; Secretary and | | |
| | General Counsel, Invesco Senior Secured Management, Inc.; and Secretary, | | |
| | Sovereign G./P. Holdings Inc. | | |
Andrew R. Schlossberg – 1974 | 2019 | Head of the Americas and Senior Managing Director, Invesco Ltd.; Director and | N/A | N/A |
Senior Vice President | | Senior Vice President, Invesco Advisers, Inc. (formerly known as Invesco | | |
| | Institutional (N.A.), Inc.) (registered investment adviser); Director and | | |
| | Chairman, Invesco Investment Services, Inc. (formerly known as Invesco AIM | | |
| | Investment Services, Inc.) (registered transfer agent); Senior Vice President, | | |
| | The Invesco Funds; Director, Invesco Investment Advisers LLC (formerly known | | |
| | as Van Kampen Asset Management); Director, President and Chairman, Invesco | | |
| | Insurance Agency, Inc. | | |
| | Formerly: Director, Invesco UK Limited; Director and Chief Executive, Invesco | | |
| | Asset Management Limited and Invesco Fund Managers Limited; Assistant Vice | | |
| | President, The Invesco Funds; Senior Vice President, Invesco Advisers, Inc. | | |
| | (formerly known as Invesco Institutional (N.A.), Inc.) (registered investment | | |
| | adviser); Director and Chief Executive, Invesco Administration Services Limited | | |
| | and Invesco Global Investment Funds Limited; Director, Invesco Distributors, | | |
| | Inc.; Head of EMEA, Invesco Ltd.; President, Invesco Actively Managed | | |
| | Exchange-Traded Commodity Fund Trust, Invesco Actively Managed | | |
| | Exchange-Traded Fund Trust, Invesco Exchange-Traded Fund Trust, Invesco | | |
| | Exchange-Traded Fund Trust II and Invesco India Exchange-Traded Fund Trust; | | |
| | Managing Director and Principal Executive Officer, Invesco Capital | | |
| | Management LLC | | |
T-5 | Invesco High Yield Fund |
Trustees and Officers—(continued)
| | | Number of | Other |
| Trustee | | Funds in | Directorship(s) |
Name, Year of Birth and | and/or | | Fund Complex | Held by Trustee |
Position(s) | Officer | Principal Occupation(s) | Overseen by | During Past 5 |
Held with the Trust | Since | During Past 5 Years | Trustee | Years |
Officers—(continued) | | | | |
John M. Zerr — 1962 | 2006 | Chief Operating Officer of the Americas; Senior Vice President, Invesco | N/A | N/A |
Senior Vice President | | Advisers, Inc. (formerly known as Invesco Institutional (N.A.), Inc.) (registered | | |
| | investment adviser); Senior Vice President, Invesco Distributors, Inc. (formerly | | |
| | known as Invesco AIM Distributors, Inc.); Director and Vice President, Invesco | | |
| | Investment Services, Inc. (formerly known as Invesco AIM Investment | | |
| | Services, Inc.) Senior Vice President, The Invesco Funds; Managing Director, | | |
| | Invesco Capital Management LLC; Director, Invesco Investment Advisers LLC | | |
| | (formerly known as Van Kampen Asset Management); Senior Vice President, | | |
| | Invesco Capital Markets, Inc. (formerly known as Van Kampen Funds Inc.); | | |
| | Manager, Invesco Indexing LLC; Manager, Invesco Specialized Products, LLC; | | |
| | Director and Senior Vice President, Invesco Insurance Agency, Inc.; Member, | | |
| | Invesco Canada Funds Advisory Board; Director, President and Chief Executive | | |
| | Officer, Invesco Corporate Class Inc. (corporate mutual fund company); and | | |
| | Director, Chairman, President and Chief Executive Officer, Invesco Canada Ltd. | | |
| | (formerly known as Invesco Trimark Ltd./Invesco Trimark Ltèe) (registered | | |
| | investment adviser and registered transfer agent); President, Invesco, Inc. | | |
| | Formerly: Director and Senior Vice President, Invesco Management Group, Inc. | | |
| | (formerly known as Invesco AIM Management Group, Inc.); Secretary and | | |
| | General Counsel, Invesco Management Group, Inc. (formerly known as Invesco | | |
| | AIM Management Group, Inc.); Secretary, Invesco Investment Services, Inc. | | |
| | (formerly known as Invesco AIM Investment Services, Inc.); Chief Legal Officer | | |
| | and Secretary, The Invesco Funds; Secretary and General Counsel, Invesco | | |
| | Investment Advisers LLC (formerly known as Van Kampen Asset Management); | | |
| | Secretary and General Counsel, Invesco Capital Markets, Inc. (formerly known | | |
| | as Van Kampen Funds Inc.); Chief Legal Officer, Invesco Exchange-Traded Fund | | |
| | Trust, Invesco Exchange-Traded Fund Trust II, Invesco India Exchange-Traded | | |
| | Fund Trust, Invesco Actively Managed Exchange-Traded Fund Trust, Invesco | | |
| | Actively Managed Exchange-Traded Commodity Fund Trust and Invesco | | |
| | Exchange-Traded Self-Indexed Fund Trust; Secretary, Invesco Indexing LLC; | | |
| | Director, Secretary, General Counsel and Senior Vice President, Van Kampen | | |
| | Exchange Corp.; Director, Vice President and Secretary, IVZ Distributors, Inc. | | |
| | (formerly known as INVESCO Distributors, Inc.); Director and Vice President, | | |
| | INVESCO Funds Group, Inc.; Director and Vice President, Van Kampen | | |
| | Advisors Inc.; Director, Vice President, Secretary and General Counsel, Van | | |
| | Kampen Investor Services Inc.;Director and Secretary, Invesco Distributors, | | |
| | Inc. (formerly known as Invesco AIM Distributors, Inc.); Director, Senior Vice | | |
| | President, General Counsel and Secretary, Invesco AIM Advisers, Inc. and Van | | |
| | Kampen Investments Inc.; Director, Vice President and Secretary, Fund | | |
| | Management Company; Director, Senior Vice President, Secretary, General | | |
| | Counsel and Vice President, Invesco AIM Capital Management, Inc.; Chief | | |
| | Operating Officer and General Counsel, Liberty Ridge Capital, Inc. (an | | |
| | investment adviser) | | |
Gregory G. McGreevey - 1962 | 2012 | Senior Managing Director, Invesco Ltd.; Director, Chairman, President, and | N/A | N/A |
Senior Vice President | | Chief Executive Officer, Invesco Advisers, Inc. (formerly known as Invesco | | |
| | Institutional (N.A.), Inc.) (registered investment adviser); Director, Invesco | | |
| | Mortgage Capital, Inc. and Invesco Senior Secured Management, Inc.; and | | |
| | Senior Vice President, The Invesco Funds; and President, SNW Asset | | |
| | Management Corporation and Invesco Managed Accounts, LLC | | |
| | Formerly: Senior Vice President, Invesco Management Group, Inc. and Invesco | | |
| | Advisers, Inc.; Assistant Vice President, The Invesco Funds | | |
Kelli Gallegos – 1970 | 2008 | Principal Financial and Accounting Officer – Investments Pool, Invesco | N/A | N/A |
Vice President, Principal Financial | | Specialized Products, LLC; Vice President, Principal Financial Officer and | | |
Officer and Assistant Treasurer | | Assistant Treasurer, The Invesco Funds; Principal Financial and Accounting | | |
| | Officer – Pooled Investments, Invesco Capital Management LLC; Vice President | | |
| | and Treasurer, Invesco Exchange-Traded Fund Trust, Invesco Exchange-Traded | | |
| | Fund Trust II, Invesco India Exchange-Traded Fund Trust, Invesco Actively | | |
| | Managed Exchange-Traded Fund Trust, Invesco Actively Managed | | |
| | Exchange-Traded Commodity Fund Trust and Invesco Exchange-Traded | | |
| | Self-Indexed Fund Trust; Vice President, Invesco Advisers, Inc. | | |
| | Formerly: Assistant Treasurer, Invesco Specialized Products, LLC; Assistant | | |
| | Treasurer, Invesco Exchange-Traded Fund Trust, Invesco Exchange-Traded | | |
| | Fund Trust II, Invesco India Exchange-Traded Fund Trust, Invesco Actively | | |
| | Managed Exchange-Traded Fund Trust, Invesco Actively Managed | | |
| | Exchange-Traded Commodity Fund Trust and Invesco Exchange-Traded | | |
| | Self-Indexed Fund Trust; Assistant Treasurer, Invesco Capital | | |
| | Management LLC; Assistant Vice President, The Invesco Funds | | |
Crissie M. Wisdom – 1969 | 2013 | Anti-Money Laundering and OFAC Compliance Officer for Invesco U.S. entities | N/A | N/A |
Anti-Money Laundering | | including: Invesco Advisers, Inc. and its affiliates, Invesco Capital Markets, | | |
Compliance Officer | | Inc., Invesco Distributors, Inc., Invesco Investment Services, Inc., The Invesco | | |
| | Funds, Invesco Capital Management, LLC, Invesco Trust Company; | | |
| | OppenheimerFunds Distributor, Inc., and Fraud Prevention Manager for | | |
| | Invesco Investment Services, Inc. | | |
T-6 | Invesco High Yield Fund |
Trustees and Officers—(continued)
| | | Number of | Other |
| Trustee | | Funds in | Directorship(s) |
Name, Year of Birth and | and/or | | Fund Complex | Held by Trustee |
Position(s) | Officer | Principal Occupation(s) | Overseen by | During Past 5 |
Held with the Trust | Since | During Past 5 Years | Trustee | Years |
Officers—(continued) | | | | |
Robert R. Leveille – 1969 | 2016 | Chief Compliance Officer, Invesco Advisers, Inc. (registered investment | N/A | N/A |
Chief Compliance Officer | | adviser); and Chief Compliance Officer, The Invesco Funds | | |
| | Formerly: Chief Compliance Officer, Putnam Investments and the Putnam | | |
| | Funds | | |
The Statement of Additional Information of the Trust includes additional information about the Fund's Trustees and is available upon request, without charge, by calling 1.800.959.4246. Please refer to the Fund's Statement of Additional Information for information on the Fund's sub-advisers.
Office of the Fund | Investment Adviser | Distributor | Auditors |
11 Greenway Plaza, Suite 1000 | Invesco Advisers, Inc. | Invesco Distributors, Inc. | PricewaterhouseCoopers LLP |
Houston, TX 77046-1173 | 1555 Peachtree Street, N.E. | 11 Greenway Plaza, Suite 1000 | 1000 Louisiana Street, Suite 5800 |
| Atlanta, GA 30309 | Houston, TX 77046-1173 | Houston, TX 77002-5678 |
Counsel to the Fund | Counsel to the Independent Trustees | Transfer Agent | Custodian |
Stradley Ronon Stevens & Young, LLP | Goodwin Procter LLP | Invesco Investment Services, Inc. | State Street Bank and Trust Company |
2005 Market Street, Suite 2600 | 901 New York Avenue, N.W. | 11 Greenway Plaza, Suite 1000 | 225 Franklin Street |
Philadelphia, PA 19103-7018 | Washington, D.C. 20001 | Houston, TX 77046-1173 | Boston, MA 02110-2801 |
T-7 | Invesco High Yield Fund |
(This page intentionally left blank)
(This page intentionally left blank)

Go paperless with eDelivery
Visit invesco.com/edelivery to enjoy the convenience and security of anytime electronic access to your investment documents.
With eDelivery, you can elect to have any or all of the following materials delivered straight to your inbox to download, save and print from your own computer:
•Fund reports and prospectuses
•Quarterly statements
•Daily confirmations
•Tax forms
Invesco mailing information
Send general correspondence to Invesco Investment Services, Inc., P.O. Box 219078, Kansas City, MO 64121-9078.
Important notice regarding delivery of security holder documents
To reduce Fund expenses, only one copy of most shareholder documents may be mailed to shareholders with multiple accounts at the same address (Householding). Mailing of your shareholder documents may be householded indefinitely unless you instruct us otherwise. If you do not want the mailing of these documents to be combined with those for other members of your household, please contact Invesco Investment Services, Inc. at 800 959 4246 or contact your financial institution. We will begin sending you individual copies for each account within 30 days after receiving your request.
Fund holdings and proxy voting information
The Fund provides a complete list of its holdings four times in each fiscal year, at the quarter-ends. For the second and fourth quarters, the list appears in the Fund's semiannual and annual reports to shareholders. For the first and third quarters, the Fund files the lists with the Securities and Exchange Commission (SEC) as an exhibit to its reports on Form N-PORT. The most recent list of portfolio holdings is available at invesco.com/completeqtrholdings. Shareholders can also look up the Fund's Form N-PORT filings on the SEC website, sec.gov. The SEC file numbers for the Fund are shown below.
A description of the policies and procedures that the Fund uses to determine how to vote proxies relating to portfolio secu- rities is available without charge, upon request, from our Client Services department at 800 959 4246, or at invesco.com/ proxyguidelines. The information is also available on the SEC website, sec.gov.
Information regarding how the Fund voted proxies related to its portfolio securities during the most
recent 12-month period ended June 30 is available at invesco.com/proxysearch. This information is also available on the SEC website, sec.gov.
Invesco Advisers, Inc. is an investment adviser; it provides investment advisory services to individual and institutional clients and does not sell securities. Invesco Distributors, Inc. is the US distributor for Invesco Ltd.'s retail mutual funds, exchange-traded funds and institutional money market funds. Both are wholly owned, indirect subsidiaries of Invesco Ltd.
SEC file numbers: 811-05686 and 033-39519 | Invesco Distributors, Inc. | HYI-AR-1 |
Annual Report to Shareholders | February 29, 2020 |
Invesco Income Fund
Nasdaq:
A: AGOVX C: AGVCX R: AGVRX Y: AGVYX Investor: AGIVX R5: AGOIX
R6: AGVSX
Beginning on January 1, 2021, as permitted by regulations adopted by the Securities and Exchange Commission, paper copies of the Fund's shareholder reports will no longer be sent by mail, unless you specifically request paper copies of the reports from the Fund or from your financial intermediary, such as a broker-dealer or bank. Instead, the reports will be made available on the Fund's web- site, and you will be notified by mail each time a report is posted and provided with a website link to access the report.
If you already elected to receive shareholder reports electronically, you will not be affected by this change and you need not take any action. You may elect to receive shareholder reports and other communications from the Fund electronically by contacting your financial intermediary (such as a broker-dealer or bank) or, if you are a direct investor, by enrolling at invesco.com/edelivery.
You may elect to receive all future reports in paper free of charge. If you invest through a financial intermediary, you can contact your financial intermediary to request that you continue to receive paper copies of your shareholder reports. If you invest directly with the Fund, you can call (800) 959-4246 to let the Fund know you wish to continue receiving paper copies of your shareholder reports. Your election to receive reports in paper will apply to all funds held with your financial intermediary or all funds held with the fund complex if you invest directly with the Fund.
Andrew Schlossberg
Letters to Shareholders
Dear Shareholders:
This annual report includes information about your Fund, including performance data and a complete list of its investments as of the close of the reporting period. Inside is a discussion of how your Fund was managed and the factors that affected its performance during the reporting period.
The reporting period proved to be another tumultuous time for both global equities and fixed-income secu- rities. In early 2019, global equity markets were buoyed by a more accommodative stance from central banks and optimism about a potential US-China trade deal. In May, US-China trade concerns and slowing global growth led to a global equity sell-off and rally in US Treasuries. Despite the May sell-off, domestic equity mar- kets rallied in June in anticipation of a US Federal Reserve (the Fed) interest rate cut and closed the second quarter with modest gains. Continued US-China trade worries and signs of slowing global economic growth led to increased market volatility in August. The US Treasury yield curve inverted several times as fears of a US recession increased. As a result, global equity markets were largely flat for the third quarter. In the final
months of 2019, geopolitical and macroeconomic issues largely abated. This combined with better-than-expected third quarter corporate earnings and initial agreement of the phase one US-China trade deal provided a favorable backdrop for equities and impressive fourth quar- ter global equity returns.
As the new year began, US equities were largely buoyed in January by the signing of the phase one trade agreement and strong eco- nomic data although returns were dampened by the spread of the Coronavirus (COVID-19). Concerns over the virus had a greater impact on international equities, which were largely lower for the month. As the virus spread outside of China and the number of cases increased, fears of diminished global growth led to a sharp global equity sell-off at the end of February 2020 and sent the yield on the US 10-year Treasury to a new all-time low.
Throughout 2019, central banks continued to be accommodative, providing sources of liquidity. In July, the Fed lowered interest rates for the first time in 11 years. It again lowered rates in September and once again in October. During the rest of the year, the Fed left rates unchanged. Overseas, the European Central Bank left its policy rate unchanged and continued its bond purchasing program. In 2020, with the increased spread of the coronavirus, the Fed shifted from a more neutral policy to the possibility of further rate cuts in the new year. As 2020 unfolds, we'll see how the interplay of interest rates, economic data, geopolitics and a host of other factors affect US and overseas equity and fixed income markets.
Investor uncertainty and market volatility, such as we witnessed during the reporting period, are unfortunate facts of life when it comes to investing. That's why Invesco encourages investors to work with a professional financial adviser who can stress the importance of starting to save and invest early and the importance of adhering to a disciplined investment plan. A financial adviser who knows your unique finan- cial situation, investment goals and risk tolerance can be an invaluable partner as you seek to achieve your financial goals. Financial advis- ers can also offer a long-term perspective when markets are volatile and time-tested advice and guidance when your financial situation or investment goals change.
Visit our website for more information on your investments
Our website, invesco.com/us, offers a wide range of market insights and investment perspectives. On the website, you'll find detailed infor- mation about our funds, including performance, holdings and portfolio manager commentaries. You can access information about your account by completing a simple, secure online registration. To do so, select "Log In" on the right side of the homepage, and then select "Register for Individual Account Access."
In addition to the resources accessible on our website and through our mobile app, you can obtain timely updates to help you stay informed about the markets and the economy by connecting with Invesco on Twitter, LinkedIn or Facebook. You can access our blog at blog.invesco.us.com. Our goal is to provide you the information you want, when and where you want it.
Finally, I'm pleased to share with you Invesco's commitment to both the Principles for Responsible Investment and to considering environ- mental, social and governance issues in our robust investment process. I invite you to learn more at invesco.com/esg.
Have questions?
For questions about your account, contact an Invesco client services representative at 800 959 4246.
All of us at Invesco look forward to serving your investment management needs. Thank you for investing with us.
Sincerely,
Andrew Schlossberg
Head of the Americas,
Senior Managing Director, Invesco Ltd.
Bruce Crockett
Dear Shareholders:
Among the many important lessons I've learned in more than 40 years in a variety of business endeavors is the value of a trusted advocate.
As independent chair of the Invesco Funds Board, I can assure you that the members of the Board are strong advocates for the interests of investors in Invesco's mutual funds. We work hard to represent your interests through oversight of the quality of the investment management services your funds receive and other matters important to your investment, including but not limited to:
Ensuring that Invesco offers a diverse lineup of mutual funds that your financial adviser can use to strive to meet your financial needs as your investment goals change over time.
Monitoring how the portfolio management teams of the Invesco funds are performing in light of changing economic and market conditions.
Assessing each portfolio management team's investment performance within the context of the investment strategy described in the fund's prospectus.
Monitoring for potential conflicts of interests that may impact the nature of the services that your funds receive.
We believe one of the most important services we provide our fund shareholders is the annual review of the funds' advisory and sub-
advisory contracts with Invesco Advisers and its affiliates. This review is required by the Investment Company Act of 1940 and focuses on the nature and quality of the services Invesco provides as the adviser to the Invesco funds and the reasonableness of the fees that it charges for those services. Each year, we spend months carefully reviewing information received from Invesco and a variety of independent sources, such as performance and fee data prepared by Lipper, Inc. (a subsidiary of Broadridge Financial Solutions, Inc.), an independent, third-party firm widely recognized as a leader in its field. We also meet with our independent legal counsel and other independent advisers to review and help us assess the information that we have received. Our goal is to assure that you receive quality investment management services for a reasonable fee.
I trust the measures outlined above provide assurance that you have a worthy advocate when it comes to choosing the Invesco Funds. On behalf of the Board, we look forward to continuing to represent your interests and serving your needs.
Sincerely,
Bruce L. Crockett
Independent Chair
Invesco Funds Board of Trustees

Management's Discussion of Fund Performance
Performance summary
For the fiscal year ended February 29, 2020, Class A shares of Invesco Income Fund (the Fund), at net asset value (NAV), underperformed the Bloomberg Bar- clays U.S. Aggregate Bond Index, the Fund's broad market benchmark.
Your Fund's long-term performance appears later in this report.
Fund vs. Indexes
Total returns, February 28, 2019 to February 29, 2020, at net asset value (NAV). Performance shown does not include applicable contingent deferred sales charges (CDSC) or front-end sales charges, which would have reduced performance.
Class A Shares | 6.75% |
Class C Shares | 6.09 |
Class R Shares | 6.61 |
Class Y Shares | 7.14 |
Investor Class Shares | 6.93 |
Class R5 Shares | 7.24 |
Class R6 Shares | 7.13 |
Bloomberg Barclays U.S. Aggregate Bond Index (Broad Market Index) | 11.68 |
Source(s): RIMES Technologies Corp.
Risk assets performed well through most of the fiscal year, but experienced spread widen- ing as the fiscal year ended. Structured credit sectors such as non-agency MBS (RMBS), commercial mortgage-backed securities (CMBS) and asset-backed securities (ABS) outperformed US Treasuries, benefiting from a broadly bullish environment. Structured credit, along with other spread products, ben- efited from the Fed's decision to cut rates three times over the fiscal year. Investment grade corporate bonds performed well as solid corporate fundamentals and demand for high quality assets were robust. High yield corporate bonds also posted positive returns during the fiscal year as underlying company fundamentals remained supportive despite a weakening outlook for the energy and materi- als sector. Emerging market sovereign and corporate debt both produced posted positive returns for the fiscal year driven by easier financial conditions and the global hunt for yield as investors flocked to the asset class.
Market conditions and your Fund
The fiscal year proved to be an increasingly volatile time for the US bond market. US bonds posted strong nominal results for the fiscal year, as rates fell amid anxiety over a decelerating global economy, persistent trade disputes between the US and China and the spread of the new Coronavirus (COVID-19). Global risks remained throughout most of the fiscal year; however, in the final months of 2019, rates increased amid diminishing risks of imminent rate cuts by the US Federal Re- serve (the Fed), which were previously priced in. The global economy appeared to be stabi- lizing as trade disputes between the US and China, Brexit uncertainties and Chinese data all seemed less threatening to valuations. However, the final month of the fiscal year proved to bring on more volatility as the spread of the coronavirus wreaked havoc on financial markets and economies across the world. Equity markets fell steeply, and US Treasury yields plummeted as uncertainty regarding the spread and severity of the coronavirus put extreme pressure on risk as-
Portfolio Composition
By security type | % of total net assets |
Asset-Backed Securities | | 68.82% |
U.S. Government Sponsored | |
Agency Mortgage-Backed | | |
Securities | | 12.15 |
Agency Credit Risk Transfer | |
Notes | | 10.38 |
U.S. Dollar Denominated Bonds | |
& Notes | | 7.73 |
Preferred Stocks | | 6.82 |
U.S. Treasury Securities | | 1.80 |
Common Stocks & Other Equity | |
Interests | | 1.73 |
Exchange-Traded Fund | | 1.00 |
Money Market Funds Plus Other | |
Assets Less Liabilities | | (10.43) |
sets causing investors to flock to perceived safe havens. The Fed cut interest rates three times during the fiscal year: in July, Septem- ber, and October 2019.1 At its December meeting, the Fed gave the clear indication that the target rate would likely remain at its current level through 2020 as factors that had driven risk aversion during 2019 had shown signs of improving. However, in Febru- ary 2020, Fed Chairman Jerome Powell made it clear that the Fed was prepared to act as coronavirus posed a new threat to eco- nomic activity.
In regard to rate movements during the fiscal year, the two-year US Treasury yield declined from 2.52% to 0.86%, the 10-year US Treasury yield decreased from 2.73% to 1.13% and the 30-year US Treasury yield decreased from 3.09% to 1.65%.2 The yield curve, as measured by the yield differential of the two-year US Treasury yield versus the
30-year US Treasury yield, steepened notably from 57 basis points to 79 basis points.2 (A basis point is one one-hundredth of a percent- age point.)
Top Five Debt Issuers
% of total net assets
1. Government National Mortgage | |
| Association | 11.3% |
2. | Commercial Mortgage Trust | 7.4 |
3. | Wells Fargo Commercial | |
| Mortgage Trust | 5.2 |
4. | Progress Residential Trust | 5.1 |
5. | Invitation Homes Trust | 4.2 |
Given this market backdrop, Class A shares of Invesco Income Fund, at NAV, generated a positive return but underperformed its broad market index, the Bloomberg Barclays
U.S. Aggregate Bond Index. The Fund's out- of-benchmark allocation to structured securi- ties, such as RMBS and ABS, contributed to relative Fund performance for the fiscal year. The Fund's out-of-benchmark allocation to real estate investment trust preferred and common equity was also a contributor to the Fund's relative performance.
During the fiscal year, the Fund used active duration and yield curve positioning for risk management and for generating returns. Du- ration measures a portfolio's price sensitivity to interest rate changes, with a shorter- duration portfolio tending to be less sensitive to these changes. Buying and selling US Trea- sury futures contracts was an important tool we used for the management of interest rate risk and to maintain the Fund's targeted port- folio duration. During the fiscal year, the Fund's duration and yield curve positioning were detractors from performance relative to the broad market benchmark. The Fund's
The Fund's holdings are subject to change, and there is no assurance that the Fund will continue to hold any particular security.
Data presented here are as of February 29, 2020.

security selection within investment grade corporates was also a detractor from relative Fund performance.
Please note that our strategy is imple- mented using derivative instruments, includ- ing futures and swaps. Therefore, a portion of the performance of the Fund, both positive and negative, can be attributed to these in- struments. Derivatives can be a cost-effective way to gain or hedge exposure to certain risks. However, derivatives may amplify tradi- tional investment risks through the creation of leverage and may be less liquid than tradi- tional securities.
We wish to remind you that the Fund is subject to interest rate risk, meaning when interest rates rise, the value of fixed income securities tends to fall. The risk may be greater in the current market environment because interest rates are near historic lows. The degree to which the value of fixed income securities may decline due to rising interest rates may vary depending on the speed and magnitude of the increase in interest rates, as well as individual security characteristics, such as price, maturity, duration and coupon and market forces, such as supply and de- mand for similar securities. We are monitor- ing interest rates and the market, economic and geopolitical factors that may impact the direction, speed and magnitude of changes to interest rates across the maturity spectrum, including the potential impact of monetary policy changes by the Fed and certain foreign central banks. If interest rates rise or fall faster than expected, markets may experience increased volatility, which may affect the value and/or liquidity of certain of the Fund's investments.
We welcome new investors who joined the Fund during the fiscal year and thank you for your investment in Invesco Income Fund.
1 Source: US Federal Reserve
2 Source: US Department of the Treasury
Portfolio Managers:
Philip Armstrong
Mario Clemente
Kevin Collins
Clint Dudley
David Lyle
Brian Norris
The views and opinions expressed in management's discussion of Fund performance are those of Invesco Advisers, Inc. These views and opinions are subject to change at any time based on factors such as market and economic conditions. These views and opinions may not be relied upon as investment advice or recommendations, or as an offer for a particular security. The information is not a complete analysis of every aspect of any market, country, industry, security or the Fund. Statements of fact are from sources considered reliable, but Invesco Advisers, Inc. makes no representation or warranty as to their completeness or accuracy. Although historical performance is no guarantee of future results, these insights may help you understand our investment management philosophy.
See important Fund and, if applicable, index disclosures later in this report.
Your Fund's Long-Term Performance
Results of a $10,000 Investment — Oldest Share Class(es)
Fund and index data from 2/28/10
$15,000
$14,707 Bloomberg Barclays U.S. Aggregate Bond Index1
12,000 | | | | $12,039 Invesco Income Fund — Class A Shares |
| | |
9,000
2/28/10 | 2/11 | 2/12 | 2/13 | 2/14 | 2/15 | 2/16 | 2/17 | 2/18 | 2/19 | 2/20 |
1 Source: RIMES Technologies Corp.
Past performance cannot guarantee future results.
The data shown in the chart include rein- vested distributions, applicable sales charges and Fund expenses including management
fees. Index results include reinvested divi- dends, but they do not reflect sales charges. Performance of the peer group, if applicable, reflects fund expenses and management fees;
performance of a market index does not. Per- formance shown in the chart does not reflect deduction of taxes a shareholder would pay on Fund distributions or sale of Fund shares.

Average Annual Total Returns
As of 2/29/20, including maximum applicable sales charges
Class A Shares
Inception (4/28/87) | 4.80% |
10 Years | 1.87 |
5 | Years | 0.95 |
1 | Year | 2.19 |
Class C Shares | |
Inception (8/4/97) | 3.48% |
10 Years | 1.57 |
5 | Years | 1.07 |
1 | Year | 5.09 |
Class R Shares | |
Inception (6/3/02) | 3.03% |
10 Years | 2.09 |
5 | Years | 1.60 |
1 | Year | 6.61 |
Class Y Shares | |
Inception (10/3/08) | 3.05% |
10 Years | 2.60 |
5 | Years | 2.08 |
1 | Year | 7.14 |
Investor Class Shares | |
Inception (9/30/03) | 3.09% |
10 Years | 2.37 |
5 | Years | 1.89 |
1 | Year | 6.93 |
Class R5 Shares | |
Inception (4/29/05) | 3.59% |
10 Years | 2.70 |
5 | Years | 2.21 |
1 | Year | 7.24 |
Class R6 Shares | |
10 Years | 2.42% |
5 | Years | 2.02 |
1 | Year | 7.13 |
Performance includes litigation proceeds. Had these proceeds not been received, total returns would have been lower.
Class R6 shares incepted on April 4, 2017. Performance shown prior to that date is that of Class A shares and includes the
12b-1 fees applicable to Class A shares. The performance data quoted represent
past performance and cannot guarantee future results; current performance may be lower or higher. Please visit invesco.com/ performance for the most recent month- end performance. Performance figures re- flect reinvested distributions, changes in net asset value and the effect of the maxi- mum sales charge unless otherwise stated. Performance figures do not reflect deduc- tion of taxes a shareholder would pay on Fund distributions or sale of Fund shares. Investment return and principal value will fluctuate so that you may have a gain or loss when you sell shares.
Class A share performance reflects the maximum 4.25% sales charge, and Class C share performance reflects the applicable contingent deferred sales charge (CDSC) for the period involved. The CDSC on Class C shares is 1% for the first year after purchase. Class R, Class Y, Investor Class, Class R5 and Class R6 shares do not have a front-end sales charge or a CDSC; there- fore, performance is at net asset value.
The performance of the Fund's share classes will differ primarily due to different sales charge structures and class expenses. Fund performance reflects any applicable
fee waivers and/or expense reimburse- ments. Had the adviser not waived fees and/or reimbursed expenses currently or in the past, returns would have been lower. See current prospectus for more informa- tion.

Invesco Income Fund's investment objective is current income and, secondarily, capital appreciation.
Unless otherwise stated, information presented in this report is as of February 29, 2020, and is based on total net assets.
Unless otherwise noted, all data provided by Invesco.
To access your Fund's reports/prospectus, visit invesco.com/fundreports.
About indexes used in this report
The Bloomberg Barclays U.S. Aggregate Bond Index is an unmanaged index con- sidered representative of the US invest- ment grade, fixed-rate bond market.
The Fund is not managed to track the per- formance of any particular index, including the index(es) described here, and conse- quently, the performance of the Fund may deviate significantly from the performance of the index(es).
A direct investment cannot be made in an index. Unless otherwise indicated, index results include reinvested dividends, and they do not reflect sales charges. Perfor- mance of the peer group, if applicable, reflects fund expenses; performance of a market index does not.
This report must be accompanied or preceded by a currently effective Fund prospectus, which contains more complete information, including sales charges and expenses. Investors should read it carefully before investing.
NOT FDIC INSURED | MAY LOSE VALUE | NO BANK GUARANTEE
Schedule of Investments
February 29, 2020
| Principal | |
| Amount | Value |
Asset-Backed Securities–68.82% | |
Adagio V CLO DAC, Series V-X, Class E, | | |
3.20% (3 mo. EURIBOR + 3.20%), | | |
10/15/2031(a)(b) | $ 4,000,000 | $ 4,422,910 |
Angel Oak Mortgage Trust, | | |
Series 2019-5, Class B1, 3.96%, | | |
10/25/2049(a)(c) | 2,361,000 | 2,440,188 |
Avoca CLO XX DAC, Series 20A, | | |
Class D1, 3.90% (3 mo. EURIBOR + | | |
3.90%), 07/15/2032(a)(b) | 2,675,000 | 3,000,411 |
Banc of America Commercial Mortgage | | |
Trust, Series 2015-UBS7, Class XA, | | |
IO, 0.81%, 09/15/2048(c) | 18,422,710 | 716,102 |
Bank, Series 2018-BN14, Class E, | | |
3.00%, 09/15/2060(a)(c) | 5,750,000 | 5,203,105 |
Bear Stearns Adjustable Rate Mortgage | | |
Trust, Series 2004-10, Class 12A1, | | |
3.83%, 01/25/2035(c) | 490,215 | 496,932 |
Benchmark Mortgage Trust, | | |
Series 2018-B6, Class E, 3.12%, | | |
10/10/2051(a)(c) | 8,000,000 | 7,139,190 |
Series 2019-B11, Class D, 3.00%, | | |
05/15/2052(a) | 5,250,000 | 4,889,453 |
Series 2019-B14, Class C, 3.78%, | | |
12/15/2062 | 4,650,000 | 5,001,782 |
Blackbird Capital Aircraft Lease | | |
Securitization Ltd., Series 2016- | | |
1A, Class B, 5.68%, | | |
12/16/2041(a)(c)(d) | 5,182,813 | 5,361,090 |
CAL Funding III Ltd., Series 2018-1A, | | |
Class B, 4.80%, 02/25/2043(a) | 1,600,000 | 1,629,314 |
Cantor Commercial Real Estate | | |
Lending, | | |
Series 2019-CF1, Class 65D, | | |
4.66%, 05/15/2052(a)(c) | 4,517,000 | 4,650,435 |
Series 2019-CF2, Class E, 2.50%, | | |
11/15/2052(a) | 3,000,000 | 2,532,382 |
Cerberus Loan Funding XXV L.P., | | |
Series 2018-4RA, Class DR, 5.63% | | |
(3 mo. USD LIBOR + 3.80%), | | |
10/15/2030(a)(b) | 2,100,000 | 2,029,933 |
Cerberus Loan Funding XXVI L.P., | | |
Series 2019-1A, Class D, 6.68% (3 | | |
mo. USD LIBOR + 4.85%), | | |
04/15/2031(a)(b) | 2,500,000 | 2,514,718 |
Chase Mortgage Finance Corp., | | |
Series 2016-SH1, Class M3, | | |
3.75%, 04/25/2045(a)(c) | 2,142,019 | 2,246,500 |
Series 2016-SH2, Class M3, | | |
3.75%, 12/25/2045(a)(c) | 2,735,464 | 2,864,187 |
Citigroup Commercial Mortgage Trust, | | |
Series 2013-GC11, Class D, | | |
4.42%, 04/10/2023(a)(c) | 4,885,000 | 5,135,022 |
Series 2014-GC25, Class C, | | |
4.53%, 10/10/2047(c) | 4,000,000 | 4,323,477 |
Series 2015-GC29, Class D, | | |
3.11%, 04/10/2048(a) | 5,000,000 | 4,843,771 |
| Principal | |
| Amount | Value |
Commercial Mortgage Trust, | | |
Series 2014-CR16, Class C, | | |
4.93%, 04/10/2047(c) | $10,000,000 | $ 10,874,413 |
Series 2014-CR19, Class C, | | |
4.73%, 08/10/2024(c) | 4,578,800 | 4,957,847 |
Series 2014-UBS4, Class C, 4.64%, | | |
07/10/2024(c) | 5,000,000 | 5,321,120 |
Series 2015-CR24, Class B, | | |
4.38%, 08/10/2048(c) | 6,800,000 | 7,484,733 |
Series 2015-CR26, Class C, | | |
4.48%, 10/10/2048(c) | 4,000,000 | 4,378,396 |
CSAIL Commercial Mortgage Trust, | | |
Series 2016-C6, Class E, 3.92%, | | |
01/15/2049(a)(c) | 3,000,000 | 2,545,890 |
Series 2017-CX9, Class D, 4.15%, | | |
09/15/2050(a)(c) | 6,304,000 | 6,224,093 |
Series 2018-C14, Class E, 4.89%, | | |
11/15/2051(a)(c) | 4,548,000 | 4,737,942 |
CVC Cordatus Loan Fund XIV DAC, | | |
Series 14A, Class C1, 2.65% (3 | | |
mo. EURIBOR + 2.65%), | | |
05/22/2032(a)(b) | 1,000,000 | 1,115,162 |
DB Master Finance LLC, | | |
Series 2019-1A, Class A23, | | |
4.35%, 05/20/2049(a) | 3,136,300 | 3,376,552 |
Diamond CLO Ltd., Series 2019-1A, | | |
Class D, 6.54% (3 mo. USD LIBOR + | | |
4.75%), 04/25/2029(a)(b) | 3,000,000 | 3,006,583 |
Flagstar Mortgage Trust, | | |
Series 2018-5, Class B1, 4.54%, | | |
09/25/2048(a)(c) | 1,653,766 | 1,822,476 |
Series 2018-5, Class B2, 4.54%, | | |
09/25/2048(a)(c) | 1,981,601 | 2,150,368 |
Series 2018-6RR, Class B2, | | |
5.01%, 10/25/2048(a)(c) | 2,925,920 | 3,369,229 |
Series 2018-6RR, Class B3, | | |
5.01%, 10/25/2048(a)(c) | 2,925,920 | 3,277,436 |
Galton Funding Mortgage Trust, | | |
Series 2019-H1, Class B1, 3.89%, | | |
10/25/2059(a)(c) | 5,480,000 | 5,566,273 |
GCAT Trust, Series 2019-NQM3, | | |
Class B1, 3.95%, 11/25/2059(a)(c) | 4,000,000 | 4,045,706 |
GPT Mortgage Trust, Series 2018-GPP, | | |
Class D, 3.51% (1 mo. USD LIBOR + | | |
1.85%), 06/15/2035(a)(b) | 159,196 | 157,929 |
GS Mortgage Securities Corp. Trust, | | |
Series 2017-SLP, Class E, 4.59%, | | |
10/10/2032(a)(c) | 5,050,000 | 5,171,177 |
Series 2018-TWR, Class G, 5.58% | | |
(1 mo. USD LIBOR + 3.92%), | | |
07/15/2021(a)(b) | 3,000,000 | 3,026,357 |
Hertz Vehicle Financing II L.P., | | |
Series 2016-4A, Class C, 5.06%, | | |
07/25/2022(a) | 6,000,000 | 6,195,829 |
Holland Park CLO DAC (Ireland), | | |
Class C, 4.40% (3 mo. EURIBOR + | | |
4.40%), 11/14/2032(a)(b) | 2,000,000 | 2,227,550 |
Class D, 7.03% (3 mo. EURIBOR + | | |
7.03%), 11/14/2032(a)(b) | 2,000,000 | 2,260,643 |
See accompanying Notes to Financial Statements which are an integral part of the financial statements.
| Principal | |
| Amount | Value |
Home Partners of America Trust, | | |
Series 2017-1, Class E, 4.31% (1 | | |
mo. USD LIBOR + 2.65%), | | |
07/17/2034(a)(b) | $ 5,000,000 | $ 5,020,436 |
Horizon Aircraft Finance III Ltd., | | |
Series 2019-2, Class B, 4.46%, | | |
11/15/2039(a) | 1,976,190 | 2,007,047 |
Invitation Homes Trust, | | |
Series 2018-SFR1, Series E, 3.66% | | |
(1 mo. USD LIBOR + 2.00%), | | |
03/17/2037(a)(b) | 6,056,172 | 6,070,793 |
Series 2018-SFR2, Class E, 3.66% | | |
(1 mo. USD LIBOR + 2.00%), | | |
06/17/2037(a)(b) | 5,000,000 | 4,984,022 |
Series 2018-SFR4, Series E, 3.61% | | |
(1 mo. USD LIBOR + 1.95%), | | |
01/17/2038(a)(b) | 4,000,000 | 4,018,020 |
Series 2018-SFR4, Series F, 3.86% | | |
(1 mo. USD LIBOR + 2.20%), | | |
01/17/2038(a)(b) | 4,000,000 | 4,008,637 |
Jimmy Johns Funding LLC, | | |
Series 2017-1A, Class A2II, | | |
4.85%, 07/30/2047(a) | 6,337,500 | 6,921,782 |
JP Morgan Chase Commercial Mortgage | | |
Securities Trust, | | |
Series 2018-PHH, Class E, 4.07% | | |
(1 mo. USD LIBOR + 2.41%), | | |
06/15/2020(a)(b) | 2,000,000 | 1,997,690 |
Series 2018-PHH, Class F, 4.67% | | |
(1 mo. USD LIBOR + 3.01%), | | |
06/15/2020(a)(b) | 2,000,000 | 1,997,102 |
Series 2018-WPT, Class DFL, | | |
3.92% (1 mo. USD LIBOR + | | |
2.25%), 07/05/2033(a)(b) | 3,000,000 | 3,006,605 |
JPMBB Commercial Mortgage | | |
Securities Trust, Series 2014-C26, | | |
Class D, 3.88%, 12/15/2024(a)(c) | 4,000,000 | 4,016,062 |
MACH 1 Cayman Ltd., Series 2019-1, | | |
Class B, 4.34%, 10/15/2039(a) | 2,191,861 | 2,217,266 |
Morgan Stanley Bank of America Merrill | | |
Lynch Trust, | | |
Series 2015-C20, Class D, 3.07%, | | |
02/15/2048(a) | 3,200,000 | 3,079,295 |
Series 2015-C24, Class D, 3.26%, | | |
07/15/2025(a) | 5,000,000 | 4,848,188 |
Morgan Stanley Capital I Trust, | | |
Series 2018-H4, Class C, 5.08%, | | |
12/15/2051(c) | 5,000,000 | 5,907,176 |
Progress Residential Trust, | | |
Series 2017-SFR2, Class D, 3.60%, | | |
12/17/2034(a) | 3,413,000 | 3,454,600 |
Series 2017-SFR2, Class E, 4.14%, | | |
12/17/2034(a) | 3,000,000 | 3,048,810 |
Series 2018-SFR1, Class F, 4.78%, | | |
03/17/2035(a) | 525,000 | 535,893 |
Series 2018-SFR2, Class E, 4.66%, | | |
08/17/2035(a) | 3,000,000 | 3,101,393 |
Series 2018-SFR3, Class D, 4.43%, | | |
10/17/2035(a) | 7,000,000 | 7,263,383 |
Series 2019-SFR1, Class E, 4.47%, | | |
08/17/2035(a) | 5,000,000 | 5,221,381 |
Residential Mortgage Loan Trust, | | |
Series 2019-1, Class M1, 4.59%, | | |
10/25/2058(a)(c) | 5,000,000 | 5,117,110 |
Series 2019-3, Class B1, 3.81%, | | |
09/25/2059(a)(c) | 3,276,000 | 3,294,812 |
| Principal | |
| Amount | Value |
Sapphire Aviation Finance II Ltd., | | |
Series 2020-1A, Class B, 4.34%, | | |
03/15/2040(a) | $ 3,250,000 | $ 3,238,274 |
Seasoned Credit Risk Transfer Trust, | | |
Series 2017-4, Class M, 4.75%, | | |
06/25/2057(a)(c) | 3,000,000 | 3,174,322 |
Sonic Capital LLC, Series 2020-1A, | | |
Class A2I, 3.85%, 01/20/2050(a) | 2,713,000 | 2,814,913 |
Taco Bell Funding LLC, Series 2018- | | |
1A, Class A2I, 4.32%, | | |
11/25/2048(a) | 4,443,750 | 4,590,705 |
Textainer Marine Containers V Ltd., | | |
Series 2017-2A, Class B, 4.75%, | | |
06/20/2042(a) | 1,731,296 | 1,793,444 |
Textainer Marine Containers VII Ltd., | | |
Series 2018-1A, Class B, 4.93%, | | |
07/20/2043(a) | 1,002,220 | 1,046,577 |
Thunderbolt II Aircraft Lease Ltd., | | |
Series 2018-A, Class B, 5.07%, | | |
09/15/2038(a)(c)(d) | 4,494,048 | 4,677,518 |
Tricon American Homes Trust, | | |
Series 2018-SFR1, Class D, 4.17%, | | |
05/17/2037(a) | 2,000,000 | 2,131,770 |
Triton Container Finance VI LLC, | | |
Series 2018-2A, Class A, 5.05%, | | |
06/22/2043(a) | 3,750,000 | 3,786,611 |
Voya CLO Ltd., Series 2014-1A, | | |
Class CR2, 4.62% (3 mo. USD LIBOR | | |
+ 2.80%), 04/18/2031(a)(b) | 1,300,000 | 1,249,326 |
Wells Fargo Commercial Mortgage Trust, | | |
Series 2014-LC18, Class D, 3.96%, | | |
12/15/2024(a)(c) | 6,000,000 | 5,890,861 |
Series 2015-C28, Class B, 4.11%, | | |
05/15/2048(c) | 7,100,000 | 7,817,716 |
Series 2015-NXS2, Class D, 4.31%, | | |
07/15/2025(c) | 6,000,000 | 6,273,134 |
Series 2017-RC1, Class D, 3.25%, | | |
01/15/2060(a) | 4,000,000 | 3,753,577 |
Wendy's Funding LLC, Series 2015-1A, | | |
Class A23, 4.50%, 06/15/2045(a) | 4,787,500 | 4,951,858 |
Total Asset-Backed Securities (Cost $297,331,601) | 313,062,715 |
U.S. Government Sponsored Agency Mortgage-Backed Securities–12.15%
Collateralized Mortgage Obligations–0.65% | |
Fannie Mae REMICs, | | |
2.25%, 02/25/2021 | 261 | 261 |
Freddie Mac Multifamily Connecticut | | |
Avenue Securities Trust, | | |
Series 2019-01, Class M10, | | |
4.88% (1 mo. USD LIBOR + | | |
3.25%), 10/15/2049(a)(b) | 1,333,000 | 1,392,502 |
Series 2019-01, Class B10, | | |
7.13% (1 mo. USD LIBOR + | | |
5.50%), 10/15/2049(a)(b) | 1,500,000 | 1,566,723 |
| | 2,959,486 |
See accompanying Notes to Financial Statements which are an integral part of the financial statements.
| | Principal | | |
| | Amount | | Value |
Federal Home Loan Mortgage Corp. (FHLMC)–0.01% |
10.00%, 04/01/2020 | $ | 191 | $ | 191 |
4.50%, 09/01/2020 | | 442 | | 442 |
9.50%, 11/01/2020 to | | | | |
04/01/2025 | | 5,806 | | 5,923 |
9.00%, 06/01/2021 to | | | | |
04/01/2025 | | 28,328 | | 31,058 |
6.50%, 06/01/2029 to | | | | |
08/01/2032 | | 4,001 | | 4,509 |
7.00%, 03/01/2032 to | | | | |
05/01/2032 | | 1,289 | | 1,391 |
| | | | 43,514 |
Federal National Mortgage Association (FNMA)–0.04% |
5.50%, 03/01/2021 | | 12 | | 12 |
10.00%, 12/20/2021 | | 864 | | 874 |
9.50%, 08/01/2022 to | | | | |
04/20/2025 | | 195 | | 196 |
6.00%, 04/01/2024 | | 323 | | 358 |
6.75%, 07/01/2024 | | 111,979 | | 124,978 |
6.95%, 07/01/2025 to | | | | |
10/01/2025 | | 27,814 | | 28,017 |
6.50%, 01/01/2026 to | | | | |
10/01/2036 | | 7,028 | | 7,917 |
7.00%, 06/01/2029 to | | | | |
02/01/2032 | | 1,838 | | 1,899 |
8.00%, 10/01/2029 | | 32 | | 38 |
| | | | 164,289 |
Government National Mortgage Association (GNMA)–11.45% |
9.00%, 04/15/2021 | | 2 | | 2 |
8.00%, 11/15/2021 to | | | | |
02/15/2036 | | 638,100 | | 735,901 |
7.00%, 01/15/2023 to | | | | |
12/15/2036 | | 517,217 | | 552,393 |
9.50%, 03/15/2023 | | 988 | | 992 |
6.50%, 07/15/2024 to | | | | |
09/15/2032 | | 78,060 | | 81,235 |
10.00%, 07/15/2024 | | 38 | | 38 |
6.95%, 07/20/2025 to | | | | |
11/20/2026 | | 156,031 | | 163,572 |
6.00%, 11/15/2031 | | 744 | | 825 |
8.50%, 01/15/2037 | | 16,240 | | 16,779 |
TBA, | | | | |
2.50%, 03/01/2050 | | 14,000,000 | | 14,376,250 |
3.00%, 03/01/2050 | | 35,000,000 | | 36,164,843 |
| | | | 52,092,830 |
Total U.S. Government Sponsored Agency | | |
Mortgage-Backed Securities (Cost $54,582,599) | | 55,260,119 |
Agency Credit Risk Transfer Notes–10.38% | | |
Fannie Mae Connecticut Avenue Securities | | | | |
7.13% (1 mo. USD LIBOR + | | | | |
5.50%), 09/25/2029(b) | | 3,825,000 | | 4,502,752 |
5.18% (1 mo. USD LIBOR + | | | | |
3.55%), 07/25/2030(b) | | 5,000,000 | | 5,303,511 |
3.83% (1 mo. USD LIBOR + | | | | |
2.20%), 08/25/2030(b) | | 1,291,040 | | 1,304,913 |
6.13% (1 mo. USD LIBOR + | | | | |
4.50%), 12/25/2030(b) | | 3,500,000 | | 3,922,626 |
Series 2019-R02, Class 1B1, | | | | |
5.78% (1 mo. USD LIBOR + | | | | |
4.15%), 08/25/2031(a)(b) | | 6,956,000 | | 7,521,631 |
| | Principal | |
| | Amount | Value |
Freddie MacSeries 2018-HQA1, | | | |
Class M2, STACR®, 3.93% (1 mo. | | | |
USD LIBOR + 2.30%), | | | |
09/25/2030(b) | $ | 5,000,000 | $ 5,051,957 |
Freddie Mac Structured Agency Credit Risk | | | |
Debt Notes | | | |
Series 2017-DNA2, Class B1, | | | |
STACR®, 6.78% (1 mo. USD LIBOR + | | | |
5.15%), 10/25/2029(b) | | 805,000 | 925,424 |
Series 2018-HRP2, Class M3, | | | |
STACR®, 4.03% (1 mo. USD LIBOR + | | | |
2.40%), 02/25/2047(a)(b) | | 5,000,000 | 5,110,513 |
Series 2018-SPI3, Class M1, | | | |
STACR®, 4.15% 08/25/2048(a)(c) | | 864,953 | 869,945 |
Golub Capital Partners CLO 34M Ltd., | | | |
(Cayman Islands), Series 2017- | | | |
34A, Class CR, 5.39% (3 mo. USD | | | |
LIBOR + 3.65%), 03/14/2031(a)(b) | | 5,000,000 | 5,010,324 |
Madison Park Euro Funding XIII DAC, | | | |
(Ireland), Series 13A, 2.60% (3 | | | |
mo. EURIBOR + 2.60%), | | | |
01/15/2032(a)(b) | | 2,400,000 | 2,667,983 |
Strata CLO I Ltd., (Cayman Islands), | | | |
Series 2018-1A, Class D, 5.89% (3 | | | |
mo. USD LIBOR + 4.06%), | | | |
01/15/2031(a)(b) | | 5,000,000 | 5,037,095 |
Total Agency Credit Risk Transfer Notes | | |
(Cost $46,500,693) | | | 47,228,674 |
U.S. Dollar Denominated Bonds & Notes–7.73%
Airlines–0.43%
Latam Finance Ltd. (Chile), 7.00%, | | |
03/01/2026(a) | 1,970,000 | 1,973,615 |
Diversified Banks–0.87% | | |
Banco Santander Mexico S.A. | | |
Institucion de Banca Multiple Grupo | | |
Financiero Santander (Mexico), | | |
5.95% (5yr. U.S. Treasury Yield | | |
Curve Rate + 3.00%), | | |
10/01/2028(a)(b) | 2,500,000 | 2,710,269 |
Lloyds Banking Group PLC (United | | |
Kingdom), 7.50%(e) | 1,110,000 | 1,235,646 |
| | 3,945,915 |
Diversified Capital Markets–0.61% | | |
Credit Suisse Group AG (Switzerland), | | |
7.25%(a)(e) | 2,500,000 | 2,764,237 |
Electric Utilities–0.58% | | |
Inkia Energy Ltd. (Peru), 5.88%, | | |
11/09/2027(a) | 2,500,000 | 2,621,875 |
Electronic Components–1.23% | | |
Corning, Inc., 5.45%, 11/15/2079 | 5,000,000 | 5,591,406 |
Integrated Oil & Gas–0.22% | | |
Petroleos Mexicanos (Mexico), 6.84%, | | |
01/23/2030(a) | 971,000 | 1,016,394 |
Marine–0.45% | | |
Hidrovias International Finance S.a.r.l. | | |
(Brazil), 5.95%, 01/24/2025(a) | 2,000,000 | 2,054,170 |
Oil & Gas Exploration & Production–0.46% | |
Canacol Energy Ltd. (Colombia), | | |
7.25%, 05/03/2025(a) | 2,000,000 | 2,095,830 |
See accompanying Notes to Financial Statements which are an integral part of the financial statements.
| | Principal | |
| | Amount | Value |
Oil & Gas Refining & Marketing–0.43% | |
Puma International Financing S.A. | | |
(Singapore), 5.13%, | | |
10/06/2024(a) | $ 2,000,000 | $ 1,954,044 |
Packaged Foods & Meats–0.69% | | |
NBM US Holdings, Inc. (Brazil), 7.00%, | | |
05/14/2026(a) | 3,000,000 | 3,142,117 |
Real Estate Development–0.60% | | |
Longfor Group Holdings Ltd. (China), | | |
4.50%, 01/16/2028(a) | 2,500,000 | 2,701,999 |
Sovereign Debt–1.16% | | |
Dominican Republic International Bond | | |
(Dominican Republic), 6.88%, | | |
01/29/2026(a) | 2,500,000 | 2,850,894 |
Oman Government International Bond | | |
(Oman), 4.75%, 06/15/2026(a) | 2,500,000 | 2,442,225 |
| | | 5,293,119 |
Total U.S. Dollar Denominated Bonds & Notes | |
| (Cost $32,730,565) | | 35,154,721 |
Preferred Stocks–6.82% | Shares | |
| |
Mortgage REITs–6.82% | | |
AG Mortgage Investment Trust, Inc., | | |
8.00%, Series C, Pfd. | 150,000 | 3,789,000 |
Annaly Capital Management, Inc., 6.50%, | | |
Series G, Pfd. | 100,000 | 2,386,000 |
Dynex Capital, Inc., 7.63%, Series B, Pfd. | 17,352 | 432,065 |
Dynex Capital, Inc., 6.90%, Series C, Pfd. | 160,000 | 3,963,200 |
MFA Financial, Inc., 6.50%, Series C, Pfd. | 150,000 | 3,633,000 |
New Residential Investment Corp., 7.13%, | | |
Series B, Pfd. | 100,000 | 2,493,000 |
New York Mortgage Trust, Inc., 7.88%, | | |
Series C, Pfd. | 143,616 | 3,590,400 |
New York Mortgage Trust, Inc., 8.00%, | | |
Series D, Pfd. | 175,000 | 4,345,250 |
PennyMac Mortgage Investment Trust, | | |
8.00%, Series B, Pfd. | 100,000 | 2,540,000 |
Investment Abbreviations: | | |
CLO | – Collateralized Loan Obligation | | |
ETF | – Exchange-Traded Fund | | |
EURIBOR – Euro Interbank Offered Rate | | |
IO | – Interest Only | | |
LIBOR | – London Interbank Offered Rate | | |
Pfd. | – Preferred | | |
REIT | – Real Estate Investment Trust | | |
REMICs | – Real Estate Mortgage Investment Conduits | |
STACR® – Structured Agency Credit Risk | | |
TBA | – To Be Announced | | |
USD | – U.S. Dollar | | |
| | Shares | | Value |
Mortgage REITs–(continued) | | | | | |
Two Harbors Investment Corp., 7.25%, | | | | | |
Series C, Pfd. | | 150,000 | $ | 3,844,500 | |
Total Preferred Stocks (Cost $31,144,210) | | 31,016,415 | |
| | Principal | | | |
U.S. Treasury Securities–1.80% | Amount | | | |
| | | |
U.S. Treasury Bills–0.34% | | | | | |
1.50% - 1.57%, 04/09/2020(f)(g) | $ | 1,550,000 | | 1,547,461 | |
U.S. Treasury Notes–1.46% | | | | | |
1.75%, 11/15/2029 | | 6,300,000 | | 6,653,145 | |
Total U.S. Treasury Securities (Cost $7,903,078) | | 8,200,606 | |
| | Shares | | | |
Common Stocks & Other Equity Interests–1.73% |
Mortgage REITs–1.73% | | | | | |
New Residential Investment Corp. | | 100,000 | | 1,556,000 | |
New York Mortgage Trust, Inc. | | 800,000 | | 4,560,000 | |
PennyMac Mortgage Investment Trust | | 85,000 | | 1,759,500 | |
| | | | 7,875,500 | |
Total Common Stocks & Other Equity Interests | | | |
(Cost $8,495,646) | | | | 7,875,500 | |
Exchange-Traded Funds–1.00% | | | | |
Invesco Senior Loan ETF | | | | | |
(Cost $ 4,712,810) | | 207,000 | | 4,551,930 | |
Money Market Funds–0.92% | | | | | |
Invesco Government & Agency Portfolio, | | | | | |
Institutional Class, 1.50%(h) | | 2,515,116 | | 2,515,116 | |
Invesco Treasury Portfolio, Institutional | | | | | |
Class, 1.48%(h) | | 1,676,744 | | 1,676,744 | |
Total Money Market Funds (Cost $4,191,860) | | 4,191,860 | |
TOTAL INVESTMENTS IN SECURITIES–111.35% | | | | |
(Cost $487,593,062) | | | | 506,542,540 | |
OTHER ASSETS LESS LIABILITIES—(11.35)% | | | | (51,612,429) |
NET ASSETS–100.00% | | | $454,930,111 | |
See accompanying Notes to Financial Statements which are an integral part of the financial statements.

Notes to Schedule of Investments:
(a)Security purchased or received in a transaction exempt from registration under the Securities Act of 1933, as amended (the "1933 Act"). The security may be resold pursuant to an exemption from registration under the 1933 Act, typically to qualified institutional buyers. The aggregate value of these securities at February 29, 2020 was $307,014,272, which represented 67.49% of the Fund's Net Assets.
(b)Interest or dividend rate is redetermined periodically. Rate shown is the rate in effect on February 29, 2020.
(c)Interest rate is redetermined periodically based on the cash flows generated by the pool of assets backing the security, less any applicable fees. The rate shown is the rate in effect on February 29, 2020.
(d)Step coupon bond. The interest rate represents the coupon rate at which the bond will accrue at a specified future date.
(e)Perpetual bond with no specified maturity date.
(f)All or a portion of the value was pledged as collateral to cover margin requirements for open futures contracts. See Note 1J.
(g)Security traded on a discount basis. The interest rate shown represents the discount rate at the time of purchase by the Fund.
(h)The money market fund and the Fund are affiliated by having the same investment adviser. The rate shown is the 7-day SEC standardized yield as of February 29, 2020.
Open Futures Contracts
| | | | | | | | | | | | | | Unrealized |
Short Futures Contracts | | | | Number of | Expiration | Notional | | | | | Appreciation |
| | | Contracts | Month | Value | | | Value | (Depreciation) |
Interest Rate Risk | | | | | | | | | | | | | | | |
U.S. Treasury Long Bonds | | | | 24 | June-2020 | $ (4,086,000) | $ | | (85,552) | $ (85,552) |
| | | | | | | | | | | |
U.S. Treasury 5 Year Notes | | | | 944 | June-2020 | (115,876,000) | | (1,086,031) | (1,086,031) |
| | | | | | | | | | | | |
U.S. Treasury 10 Year Notes | | | | 387 | June-2020 | (52,148,250) | | | (600,098) | (600,098) |
| | | | | | | | | | | | |
U.S. Treasury 10 Year Ultra Bonds | | | | 164 | June-2020 | (24,635,875) | | | (394,912) | (394,912) |
| | | | | | | | | | | | |
Total Futures Contracts | | | | | | | | | $(2,166,593) | $(2,166,593) |
| | | Open Forward Foreign Currency Contracts | | | | | | | |
| | | | | | | | | Contract to | | | | Unrealized |
Settlement | | | | | | | | | | | | Appreciation |
Date | Counterparty | | | | | | | Deliver | | | Receive | (Depreciation) |
Currency Risk | | | | | | | | | | | | | | | |
05/29/2020 | Goldman Sachs & International | | | | | | EUR 13,696,074 | USD 14,947,279 | $(247,941) | |
| | | | | | | | | |
| | Open Centrally Cleared Credit Default Swap Agreements | | | | | | | |
| | | (Pay)/ | | | | | | | | | | | | |
| | | Receive | | | Implied | | | Upfront | | | | Unrealized |
| | Buy/Sell | Fixed | Payment | | Credit | | | Payments Paid | | | Appreciation |
Reference Entity | | Protection | Rate | Frequency | Maturity Date | Spread(a) | Notional Value | (Received) | | Value | (Depreciation) |
Credit Risk | | | | | | | | | | | | | | | |
Markit CDX North America High Yield | | | | | | | | | | | | | | |
Index, Series 33, Version 2 | Buy | (5.00)% | Quarterly | 12/20/2024 | 3.77% | USD 49,500,000 | $(2,417,773) | $(2,676,316) | $(258,543) | |
(a)Implied credit spreads represent the current level, as of February 29, 2020, at which protection could be bought or sold given the terms of the existing credit default swap agreement and serve as an indicator of the current status of the payment/performance risk of the credit default swap agreement. An implied credit spread that has widened or increased since entry into the initial agreement may indicate a deteriorating credit profile and increased risk of default for the reference entity. A declining or narrowing spread may indicate an improving credit profile or decreased risk of default for the reference entity. Alternatively, credit spreads may increase or decrease reflecting the general tolerance for risk in the credit markets generally.
See accompanying Notes to Financial Statements which are an integral part of the financial statements.

Open Over-The-Counter Credit Default Swap Agreements
| | | (Pay)/ | | | Implied | | | Upfront | | | | Unrealized |
| | Buy/Sell | Receive | Payment | Maturity | Credit | Notional | Payments Paid | | | Appreciation |
Counterparty | Reference Entity | Protection | Fixed Rate | Frequency | Date | Spread(a) | Value | (Received) | | Value | (Depreciation) |
Credit Risk | | | | | | | | | | | | | |
Morgan Stanley | | | | | | | | | | | | | |
& Co. | | | | | | | | | | | | | |
International | Markit CMBX North America BBB- | | | | | | | | | | | | |
PLC | Index, Series 7, Version 1 | Sell | 3.00% | Monthly | 01/17/2047 | 3.65% | $ 10,000,000 | $(303,208) | $ | (220,490) | $ | 82,718 |
Subtotal—Appreciation | | | | | | | | (303,208) | | (220,490) | | 82,718 |
| | | | | | | | | | | | | |
Credit Risk | | | | | | | | | | | | | |
J.P. Morgan | | | | | | | | | | | | | |
Chase Bank, | Markit CMBX North America A | | | | | | | | | | | | |
N.A. | Index, Series 13, Version 1 | Sell | 2.00% | Monthly | 12/16/2072 | 2.23% | $ 25,000,000 | $ | 23,987 | $ | (469,781) | $ | (493,768) |
J.P. Morgan | Markit CMBX North America A | | | | | | | | | | | | |
Chase Bank, | | | | | | | | | | | | |
N.A. | Index, Series 13, Version 1 | Sell | 2.00% | Monthly | 12/16/2072 | 2.23% | $ 20,000,000 | $ | 161,223 | $ | (375,825) | $ | (537,048) |
| | | | | | | | | | | | | |
Merrill Lynch | Markit CMBX North America A | | | | | | | | | | | | |
International | Index, Series 12, Version 1 | Sell | 2.00% | Monthly | 08/17/2061 | 2.10% | $ 15,000,000 | $ | 54,633 | $ | (118,350) | $ | (172,983) |
| | | | | | | | | | | | | |
Merrill Lynch | Markit CMBX North America A | | | | | | | | | | | | |
International | Index, Series 12, Version 1 | Sell | 2.00% | Monthly | 08/17/2061 | 2.10% | $ 10,000,000 | $ | 88,731 | $ | (78,900) | $ | (167,631) |
Merrill Lynch | Markit CMBX North America BBB | | | | | | | | | | | | |
International | Index, Series 12, Version 1 | Sell | 3.00% | Monthly | 08/17/2061 | 3.79% | $ 10,000,000 | $ | (141,684) | $ | (558,179) | $ | (416,495) |
| | | | | | | | | | | | |
Subtotal—Depreciation | | | | | | | | 186,890 | | (1,601,035) | | (1,787,925) |
| | | | | | | | |
Total Open Over-The-Counter Credit Default Swap Agreements | | | | | $ | (116,318) | $(1,821,525) | $(1,705,207) |
| | | | | | | | | | | | | |
(a)Implied credit spreads represent the current level, as of February 29, 2020, at which protection could be bought or sold given the terms of the existing credit default swap agreement and serve as an indicator of the current status of the payment/performance risk of the credit default swap agreement. An implied credit spread that has widened or increased since entry into the initial agreement may indicate a deteriorating credit profile and increased risk of default for the reference entity. A declining or narrowing spread may indicate an improving credit profile or decreased risk of default for the reference entity. Alternatively, credit spreads may increase or decrease reflecting the general tolerance for risk in the credit markets generally.
Abbreviations:
EUR —Euro
USD —U.S. Dollar
See accompanying Notes to Financial Statements which are an integral part of the financial statements.
Statement of Assets and Liabilities
February 29, 2020
Assets: | |
Investments in securities, at value | |
(Cost $483,401,202) | $502,350,680 |
Investments in affiliated money market funds, at value | |
(Cost $4,191,860) | 4,191,860 |
Other investments: | |
Unrealized appreciation on swap agreements — OTC | 82,718 |
Deposits with brokers: | |
Cash collateral — OTC Derivatives | 640,000 |
Foreign currencies, at value (Cost $329,578) | 330,731 |
Receivable for: | |
Investments sold | 4,623,444 |
Fund shares sold | 527,862 |
Dividends | 172,235 |
Interest | 1,772,033 |
Principal paydowns | 326 |
Investment for trustee deferred compensation and | |
retirement plans | 224,136 |
Other assets | 39,217 |
Total assets | 514,955,242 |
Liabilities: | |
Other investments: | |
Variation margin payable - futures contracts | 1,842,203 |
Variation margin payable — centrally cleared swap | |
agreements | 258,543 |
Premiums received on swap agreements — OTC | 116,318 |
Unrealized depreciation on forward foreign currency | |
contracts outstanding | 247,941 |
Swaps payable — OTC | 158,243 |
Unrealized depreciation on swap agreements—OTC | 1,787,925 |
Payable for: | |
Investments purchased | 53,798,171 |
Dividends | 216,484 |
Fund shares reacquired | 921,780 |
Amount due custodian | 10,391 |
Accrued fees to affiliates | 289,772 |
Accrued trustees' and officers' fees and benefits | 2,846 |
Accrued other operating expenses | 132,867 |
Trustee deferred compensation and retirement plans | 241,647 |
Total liabilities | 60,025,131 |
Net assets applicable to shares outstanding | $454,930,111 |
Net assets consist of: | | | |
Shares of beneficial interest | $ | 480,615,704 | |
Distributable earnings (loss) | | (25,685,593) |
| $454,930,111 | |
Net Assets: | | | |
Class A | $405,061,115 | |
Class C | $ | 9,555,876 | |
Class R | $ | 4,442,584 | |
Class Y | $ | 10,540,011 | |
Investor Class | $ | 24,786,531 | |
Class R5 | $ | 507,701 | |
Class R6 | $ | 36,293 | |
Shares outstanding, no par value, with an unlimited number of shares authorized:
Class A | | 46,671,793 |
Class C | | 1,100,957 |
Class R | | 511,201 |
Class Y | | 1,212,310 |
Investor Class | | 2,852,090 |
Class R5 | | 58,477 |
Class R6 | | 4,185 |
Class A: | | |
Net asset value per share | $ | 8.68 |
Maximum offering price per share | | |
(Net asset value of $8.68 ÷ 95.75%) | $ | 9.07 |
Class C: | | |
Net asset value and offering price per share | $ | 8.68 |
Class R: | | |
Net asset value and offering price per share | $ | 8.69 |
Class Y: | | |
Net asset value and offering price per share | $ | 8.69 |
Investor Class: | | |
Net asset value and offering price per share | $ | 8.69 |
Class R5: | | |
Net asset value and offering price per share | $ | 8.68 |
Class R6: | | |
Net asset value and offering price per share | $ | 8.67 |
See accompanying Notes to Financial Statements which are an integral part of the financial statements.
Statement of Operations
For the year ended February 29, 2020
Investment income: | | | |
Interest | $20,624,392 |
Dividends | 3,129,290 |
Dividends from affiliated money market funds | 68,245 | |
Total investment income | 23,821,927 |
Expenses: | | | |
Advisory fees | 2,075,453 | |
Administrative services fees | 66,777 | |
Custodian fees | 35,616 | |
Distribution fees: | | | |
Class A | 1,041,564 | |
Class C | 97,379 | |
Class R | 29,066 | |
Investor Class | 47,363 | |
Transfer agent fees — A, C, R, Y and Investor | 979,537 | |
Transfer agent fees — R5 | 850 | |
Transfer agent fees — R6 | 35 | |
Trustees' and officers' fees and benefits | 25,127 | |
Registration and filing fees | 106,993 | |
Reports to shareholders | 129,692 | |
Professional services fees | 63,451 | |
Other | 24,947 | |
Total expenses | 4,723,850 | |
Less: Fees waived and/or expense offset arrangement(s) | (14,955) |
Net expenses | 4,708,895 | |
Net investment income | 19,113,032 |
Realized and unrealized gain (loss) from: | | | |
Net realized gain (loss) from: | | | |
Investment securities | 3,277,708 | |
Foreign currencies | 37,903 | |
Forward foreign currency contracts | 790,406 | |
Futures contracts | (9,202,970) |
Swap agreements | 4,125,080 | |
| (971,873) |
Change in net unrealized appreciation (depreciation) of: | | | |
Investment securities | 18,273,146 |
Foreign currencies | (11,364) |
| | |
Forward foreign currency contracts | (234,638) |
| | |
Futures contracts | (2,552,252) |
| | |
Swap agreements | (2,610,655) |
| 12,864,237 |
Net realized and unrealized gain | 11,892,364 |
Net increase in net assets resulting from operations | $31,005,396 |
See accompanying Notes to Financial Statements which are an integral part of the financial statements.
Statement of Changes in Net Assets
For the years ended February 29, 2020 and February 28, 2019
| | 2020 | | 2019 | | |
Operations: | | | | | | |
Net investment income | $ | 19,113,032 | $ | 15,945,650 |
Net realized gain (loss) | | (971,873) | | (15,313,056) |
Change in net unrealized appreciation | | 12,864,237 | | 6,932,102 |
Net increase in net assets resulting from operations | | 31,005,396 | | 7,564,696 |
Distributions to shareholders from distributable earnings: | | | | | | |
Class A | | (19,046,833) | | (14,181,232) |
| | | | | | |
Class C | | (370,901) | | (552,544) |
| | | | | | |
Class R | | (250,528) | | (168,191) |
| | | | | | |
Class Y | | (505,774) | | (374,763) |
| | | | | | |
Investor Class | | (1,169,531) | | (900,373) |
| | | | | | |
Class R5 | | (42,190) | | (31,756) |
| | | | | | |
Class R6 | | (1,940) | | (78,120) |
| | | | | | |
Total distributions from distributable earnings | | (21,387,697) | | (16,286,979) |
Share transactions–net: | | | | | | |
Class A | | (27,484,448) | | (51,542,185) |
| | | | | | |
Class C | | (502,958) | | (19,823,468) |
Class R | | (1,250,819) | | 224,121 | |
Class Y | | 657,951 | | (776,382) |
| | | | | |
Investor Class | | (1,416,835) | | (3,927,700) |
Class R5 | | (460,448) | | 348,195 | |
Class R6 | | (6,461) | | (6,590,194) |
| | | | | |
Net increase (decrease) in net assets resulting from share transactions | | (30,464,018) | | (82,087,613) |
| | | | | |
Net increase (decrease) in net assets | | (20,846,319) | | (90,809,896) |
Net assets: | | | | | | |
Beginning of year | | 475,776,430 | | 566,586,326 |
End of year | $454,930,111 | $475,776,430 |
See accompanying Notes to Financial Statements which are an integral part of the financial statements.
Financial Highlights
The following schedule presents financial highlights for a share of the Fund outstanding throughout the periods indicated.
| | | | | | | | | Ratio of | Ratio of | | |
| | | | | | | | | expenses | expenses | | |
| | | Net gains | | | | | | to average | to average net | | |
| | | (losses) | | | | | | net assets | assets without | Ratio of net | |
| Net asset | | on securities | | Dividends | | | | with fee waivers | fee waivers | investment | |
| value, | Net | (both | Total from | from net | Net asset | | Net assets, | and/or | and/or | income | |
| beginning | investment | realized and | investment | investment | value, end | Total | end of period | expenses | expenses | to average | Portfolio |
| of period | income(a) | unrealized) | operations | income | of period | return (b) (000's omitted) | absorbed | absorbed | net assets | turnover (c) |
Class A | | | | | | | | | 1.00%(d) | 1.00%(d) | 4.08%(d) | |
Year ended 02/29/20 | $8.51 | $0.35 | $ 0.22 | $ 0.57 | $(0.40) | $8.68 | 6.75% | $405,061 | 50% |
Year ended 02/28/19 | 8.65 | 0.27(e) | (0.13) | 0.14 | (0.28) | 8.51 | 1.66 | 424,003 | 1.01 | 1.08 | 3.12(e) | 119(e) |
Year ended 02/28/18 | 8.84 | 0.12 | (0.15) | (0.03) | (0.16) | 8.65 | (0.34) | 482,902 | 0.98 | 0.98 | 1.34 | 25 |
Year ended 02/28/17 | 9.02 | 0.11 | (0.12)(f) | (0.01) | (0.17) | 8.84 | (0.15)(f) | 559,388 | 0.97 | 0.97 | 1.25 | 30 |
Year ended 02/29/16 | 9.05 | 0.10 | 0.01 | 0.11 | (0.14) | 9.02 | 1.25 | 629,429 | 0.95 | 0.95 | 1.10 | 61 |
Class C | | | | | | | | | 1.75(d) | 1.75(d) | 3.33(d) | 50 |
Year ended 02/29/20 | 8.50 | 0.29 | 0.22 | 0.51 | (0.33) | 8.68 | 6.09 | 9,556 |
Year ended 02/28/19 | 8.65 | 0.20(e) | (0.13) | 0.07 | (0.22) | 8.50 | 0.78 | 9,862 | 1.76 | 1.83 | 2.37(e) | 119(e) |
Year ended 02/28/18 | 8.83 | 0.05 | (0.13) | (0.08) | (0.10) | 8.65 | (0.97) | 30,223 | 1.73 | 1.73 | 0.59 | 25 |
Year ended 02/28/17 | 9.02 | 0.04 | (0.13)(f) | (0.09) | (0.10) | 8.83 | (1.00)(f) | 40,481 | 1.72 | 1.72 | 0.50 | 30 |
Year ended 02/29/16 | 9.04 | 0.03 | 0.02 | 0.05 | (0.07) | 9.02 | 0.60 | 49,156 | 1.70 | 1.70 | 0.35 | 61 |
Class R | | | | | | | | | 1.25(d) | 1.25(d) | 3.83(d) | 50 |
Year ended 02/29/20 | 8.52 | 0.33 | 0.21 | 0.54 | (0.37) | 8.69 | 6.48 | 4,443 |
Year ended 02/28/19 | 8.66 | 0.25(e) | (0.13) | 0.12 | (0.26) | 8.52 | 1.41 | 5,557 | 1.26 | 1.33 | 2.87(e) | 119(e) |
Year ended 02/28/18 | 8.85 | 0.10 | (0.15) | (0.05) | (0.14) | 8.66 | (0.58) | 5,427 | 1.23 | 1.23 | 1.09 | 25 |
Year ended 02/28/17 | 9.03 | 0.09 | (0.12)(f) | (0.03) | (0.15) | 8.85 | (0.39)(f) | 6,219 | 1.22 | 1.22 | 1.00 | 30 |
Year ended 02/29/16 | 9.06 | 0.08 | 0.01 | 0.09 | (0.12) | 9.03 | 1.00 | 6,123 | 1.20 | 1.20 | 0.85 | 61 |
Class Y | | | | | | | | | 0.75(d) | 0.75(d) | 4.33(d) | |
Year ended 02/29/20 | 8.52 | 0.38 | 0.21 | 0.59 | (0.42) | 8.69 | 7.02 | 10,540 | 50 |
Year ended 02/28/19 | 8.67 | 0.29(e) | (0.14) | 0.15 | (0.30) | 8.52 | 1.80 | 9,674 | 0.76 | 0.83 | 3.37(e) | 119(e) |
Year ended 02/28/18 | 8.86 | 0.14 | (0.15) | (0.01) | (0.18) | 8.67 | (0.08) | 10,671 | 0.73 | 0.73 | 1.59 | 25 |
Year ended 02/28/17 | 9.04 | 0.14 | (0.13)(f) | 0.01 | (0.19) | 8.86 | 0.11(f) | 12,554 | 0.72 | 0.72 | 1.50 | 30 |
Year ended 02/29/16 | 9.06 | 0.12 | 0.02 | 0.14 | (0.16) | 9.04 | 1.62 | 17,407 | 0.70 | 0.70 | 1.35 | 61 |
Investor Class | | | | | | | 6.81(g) | 24,787 | 0.93(d)(g) | 0.93(d)(g) | 4.15(d)(g) | 50 |
Year ended 02/29/20 | 8.52 | 0.36 | 0.21 | 0.57 | (0.40) | 8.69 |
Year ended 02/28/19 | 8.66 | 0.27(e) | (0.13) | 0.14 | (0.28) | 8.52 | 1.71(g) | 25,692 | 0.95(g) | 1.02(g) | 3.18(e)(g) | 119(e) |
Year ended 02/28/18 | 8.85 | 0.12 | (0.14) | (0.02) | (0.17) | 8.66 | (0.29)(g) | 30,085 | 0.96(g) | 0.96(g) | 1.36(g) | 25 |
Year ended 02/28/17 | 9.03 | 0.12 | (0.13)(f) | (0.01) | (0.17) | 8.85 | (0.12)(f)(g) | 35,471 | 0.92(g) | 0.92(g) | 1.30(g) | 30 |
Year ended 02/29/16 | 9.06 | 0.10 | 0.01 | 0.11 | (0.14) | 9.03 | 1.28(g) | 41,492 | 0.93(g) | 0.93(g) | 1.12(g) | 61 |
Class R5 | | | | | | | | | 0.64(d) | 0.64(d) | 4.44(d) | |
Year ended 02/29/20 | 8.51 | 0.38 | 0.22 | 0.60 | (0.43) | 8.68 | 7.11 | 508 | 50 |
Year ended 02/28/19 | 8.66 | 0.30(e) | (0.14) | 0.16 | (0.31) | 8.51 | 1.87 | 946 | 0.70 | 0.73 | 3.43(e) | 119(e) |
Year ended 02/28/18 | 8.85 | 0.15 | (0.14) | 0.01 | (0.20) | 8.66 | 0.04 | 615 | 0.58 | 0.58 | 1.74 | 25 |
Year ended 02/28/17 | 9.03 | 0.14 | (0.12)(f) | 0.02 | (0.20) | 8.85 | 0.20(f) | 1,093 | 0.62 | 0.62 | 1.60 | 30 |
Year ended 02/29/16 | 9.04 | 0.13 | 0.03 | 0.16 | (0.17) | 9.03 | 1.84 | 2,068 | 0.59 | 0.59 | 1.46 | 61 |
Class R6 | | | | | | | | | 0.63(d) | 0.63(d) | 4.45(d) | 50 |
Year ended 02/29/20 | 8.51 | 0.39 | 0.20 | 0.59 | (0.43) | 8.67 | 7.00 | 36 |
Year ended 02/28/19 | 8.66 | 0.30(e) | (0.14) | 0.16 | (0.31) | 8.51 | 1.88 | 42 | 0.69 | 0.70 | 3.44(e) | 119(e) |
Year ended 02/28/18(h) | 8.84 | 0.14 | (0.14) | (0.00) | (0.18) | 8.66 | (0.03) | 6,663 | 0.57(i) | 0.57(i) | 1.75(i) | 25 |
(a)Calculated using average shares outstanding.
(b)Includes adjustments in accordance with accounting principles generally accepted in the United States of America and as such, the net asset value for financial reporting purposes and the returns based upon those net asset values may differ from the net asset value and returns for shareholder transactions. Does not include sales charges and is not annualized for periods less than one year, if applicable.
(c)Portfolio turnover is calculated at the fund level and is not annualized for periods less than one year, if applicable.
(d)Ratios are based on average daily net assets (000's omitted) of $416,626, $9,738, $5,813, $10,504, $25,294, $850 and $39 for Class A, Class C, Class R, Class Y, Investor Class, Class R5 and Class R6 shares, respectively.
(e)Effective July 26, 2018, the Fund modified certain investment policies utilized in achieving its investment objective throughout the period. The Fund's net investment income, ratio of net investment income and portfolio turnover have increased significantly due to the realignment of the Fund's portfolio of investments as a result of these changes.
(f)Includes litigation proceeds received during the period. Had the litigation proceeds not been received, Net gains (losses) on securities (both realized and unrealized) per share would have been $(0.17), $(0.18), $(0.17), $(0.18), $(0.18) and $(0.17) for Class A, Class C, Class R, Class Y, Investor Class and Class R5 shares, respectively and total returns would have been lower.
(g)The total return, ratio of expenses to average net assets and ratio of net investment income to average net assets reflect actual 12b-1 fees of 0.19%, 0.19%, 0.23%, 0.21% and 0.22% for the years ended February 29, 2020, February 28, 2019, February 28, 2018, February 28, 2017 and February 29, 2016, respectively.
(h)Commencement date of April 4, 2017.
(i)Annualized.
See accompanying Notes to Financial Statements which are an integral part of the financial statements.
Notes to Financial Statements
February 29, 2020
NOTE 1—Significant Accounting Policies
Invesco Income Fund (the "Fund") is a series portfolio of AIM Investment Securities Funds (Invesco Investment Securities Funds) (the "Trust"). The Trust is a Delaware statutory trust registered under the Investment Company Act of 1940, as amended (the "1940 Act"), as an open-end series management investment company authorized to issue an unlimited number of shares of beneficial interest. Information presented in these financial statements pertains only to the Fund. Matters affecting the Fund or each class will be voted on exclusively by the shareholders of the Fund or each class.
The Fund's investment objective is current income, and secondarily, capital appreciation.
The Fund currently consists of seven different classes of shares: Class A, Class C, Class R, Class Y, Investor Class, Class R5 and Class R6. Class Y and Investor Class shares are available only to certain investors. Class A shares are sold with a front-end sales charge unless certain waiver criteria are met. Under certain circumstances, load waived shares may be subject to contingent deferred sales charges ("CDSC"). Class C shares are sold with a CDSC. Class R, Class Y, Investor Class, Class R5 and Class R6 shares are sold at net asset value. Class C shares held for ten years after purchase are eligible for automatic conversion into Class A shares of the same Fund (the "Conversion Feature"). The automatic conversion pursuant to the Conversion Feature will generally occur at the end of the month following the tenth anniversary after a purchase of Class C shares.
The Fund is an investment company and accordingly follows the investment company accounting and reporting guidance in accordance with Financial Accounting Standards Board Accounting Standards Codification Topic 946, Financial Services – Investment Companies.
The following is a summary of the significant accounting policies followed by the Fund in the preparation of its financial statements.
A.Security Valuations – Securities, including restricted securities, are valued according to the following policy.
Debt obligations (including convertible securities) and unlisted equities are fair valued using an evaluated quote provided by an independent pricing service. Evaluated quotes provided by the pricing service may be determined without exclusive reliance on quoted prices, and may reflect appropriate factors such as institution-size trading in similar groups of securities, developments related to specific securities, dividend rate (for unlisted equities), yield (for debt obligations), quality, type of issue, coupon rate (for debt obligations), maturity (for debt obligations), individual trading characteristics and other market data. Pricing services generally value debt obligations assuming orderly transactions of institutional round lot size, but a fund may hold or transact in the same securities in smaller, odd lot sizes. Odd lots often trade at lower prices than institutional round lots. Debt obligations are subject to interest rate and credit risks. In addition, all debt obligations involve some risk of default with respect to interest and/or principal payments.
A security listed or traded on an exchange (except convertible securities) is valued at its last sales price or official closing price as of the close of the customary trading session on the exchange where the security is principally traded, or lacking any sales or official closing price on a particular day, the security may be valued at the closing bid price on that day. Securities traded in the over-the-counter market are valued based on prices furnished by independent pricing services or market makers. When such securities are valued by an independent pricing service they may be considered fair valued. Futures contracts are valued at the final settlement price set by an exchange on which they are principally traded. Listed options are valued at the mean between the last bid and asked prices from the exchange on which they are principally traded. Options not listed on an exchange are valued by an independent source at the mean between the last bid and asked prices. For purposes of determining net asset value ("NAV") per share, futures and option contracts generally are valued 15 minutes after the close of the customary trading session of the New York Stock Exchange ("NYSE").
Investments in open-end and closed-end registered investment companies that do not trade on an exchange are valued at the end-of-day net asset value per share. Investments in open-end and closed-end registered investment companies that trade on an exchange are valued at the last sales price or official closing price as of the close of the customary trading session on the exchange where the security is principally traded.
Swap agreements are fair valued using an evaluated quote, if available, provided by an independent pricing service. Evaluated quotes provided by the pricing service are valued based on a model which may include end-of-day net present values, spreads, ratings, industry, company performance and returns of referenced assets. Centrally cleared swap agreements are valued at the daily settlement price determined by the relevant exchange or clearinghouse.
Foreign securities' (including foreign exchange contracts) prices are converted into U.S. dollar amounts using the applicable exchange rates as of the close of the NYSE. If market quotations are available and reliable for foreign exchange-traded equity securities, the securities will be valued at the market quotations. Because trading hours for certain foreign securities end before the close of the NYSE, closing market quotations may become unreliable. If between the time trading ends on a particular security and the close of the customary trading session on the NYSE, events occur that the investment adviser determines are significant and make the closing price unreliable, the Fund may fair value the security. If the event is likely to have affected the closing price of the security, the security will be valued at fair value in good faith using procedures approved by the Board of Trustees. Adjustments to closing prices to reflect fair value may also be based on a screening process of an independent pricing service to indicate the degree of certainty, based on historical data, that the closing price in the principal market where a foreign security trades is not the current value as of the close of the NYSE. Foreign securities' prices meeting the approved degree of certainty that the price is not reflective of current value will be priced at the indication of fair value from the independent pricing service. Multiple factors may be considered by the independent pricing service in determining adjustments to reflect fair value and may include information relating to sector indices, American Depositary Receipts and domestic and foreign index futures. Foreign securities may have additional risks including exchange rate changes, potential for sharply devalued currencies and high inflation, political and economic upheaval, the relative lack of issuer information, relatively low market liquidity and the potential lack of strict financial and accounting controls and standards.
Securities for which market prices are not provided by any of the above methods may be valued based upon quotes furnished by independent sources. The last bid price may be used to value equity securities. The mean between the last bid and asked prices is used to value debt obligations, including corporate loans.
Securities for which market quotations are not readily available or became unreliable are valued at fair value as determined in good faith by or under the supervision of the Trust's officers following procedures approved by the Board of Trustees. Issuer specific events, market trends, bid/asked quotes of brokers and information providers and other market data may be reviewed in the course of making a good faith determination of a security's fair value.
The Fund may invest in securities that are subject to interest rate risk, meaning the risk that the prices will generally fall as interest rates rise and, conversely, the prices will generally rise as interest rates fall. Specific securities differ in their sensitivity to changes in interest rates depending on their individual characteristics. Changes in interest rates may result in increased market volatility, which may affect the value and/or liquidity of certain Fund investments.
Valuations change in response to many factors including the historical and prospective earnings of the issuer, the value of the issuer's assets, general economic conditions, interest rates, investor perceptions and market liquidity. Because of the inherent uncertainties of valuation, the values reflected in the financial statements may materially differ from the value received upon actual sale of those investments.
B.Securities Transactions and Investment Income – Securities transactions are accounted for on a trade date basis. Realized gains or losses on sales are computed on the basis of specific identification of the securities sold. Interest income (net of withholding tax, if any) is recorded on an accrual basis from settlement date. Bond premiums and discounts are amortized and/or accreted over the lives of the respective securities. Pay-in-kind interest income and non-cash
dividend income received in the form of securities in-lieu of cash are recorded at the fair value of the securities received. Paydown gains and losses on mortgage and asset-backed securities are recorded as adjustments to interest income. Dividend income (net of withholding tax, if any) is recorded on the ex-dividend date.
The Fund may periodically participate in litigation related to Fund investments. As such, the Fund may receive proceeds from litigation settlements. Any proceeds received are included in the Statement of Operations as realized gain (loss) for investments no longer held and as unrealized gain (loss) for investments still held.
Brokerage commissions and mark ups are considered transaction costs and are recorded as an increase to the cost basis of securities purchased and/or a reduction of proceeds on a sale of securities. Such transaction costs are included in the determination of net realized and unrealized gain (loss) from investment securities reported in the Statement of Operations and the Statement of Changes in Net Assets and the net realized and unrealized gains (losses) on securities per share in the Financial Highlights. Transaction costs are included in the calculation of the Fund's net asset value and, accordingly, they reduce the Fund's total returns. These transaction costs are not considered operating expenses and are not reflected in net investment income reported in the Statement of Operations and the Statement of Changes in Net Assets, or the net investment income per share and the ratios of expenses and net investment income reported in the Financial Highlights, nor are they limited by any expense limitation arrangements between the Fund and the investment adviser.
The Fund allocates realized and unrealized capital gains and losses to a class based on the relative net assets of each class. The Fund allocates income to a class based on the relative value of the settled shares of each class.
C.Country Determination — For the purposes of making investment selection decisions and presentation in the Schedule of Investments, the investment adviser may determine the country in which an issuer is located and/or credit risk exposure based on various factors. These factors include the laws of the country under which the issuer is organized, where the issuer maintains a principal office, the country in which the issuer derives 50% or more of its total revenues and the country that has the primary market for the issuer's securities, as well as other criteria. Among the other criteria that may be evaluated for making this determination are the country in which the issuer maintains 50% or more of its assets, the type of security, financial guarantees and enhancements, the nature of the collateral and the sponsor organization. Country of issuer and/or credit risk exposure has been determined to be the United States of America, unless otherwise noted.
D.Distributions – Distributions from net investment income, if any, are declared daily and paid monthly. Distributions from net realized capital gain, if any, are generally declared and paid annually and recorded on the ex-dividend date. The Fund may elect to treat a portion of the proceeds from redemptions as distributions for federal income tax purposes.
E.Federal Income Taxes – The Fund intends to comply with the requirements of Subchapter M of the Internal Revenue Code of 1986, as amended (the "Internal Revenue Code"), necessary to qualify as a regulated investment company and to distribute substantially all of the Fund's taxable earnings to shareholders. As such, the Fund will not be subject to federal income taxes on otherwise taxable income (including net realized capital gain) that is distributed to shareholders. Therefore, no provision for federal income taxes is recorded in the financial statements.
The Fund recognizes the tax benefits of uncertain tax positions only when the position is more likely than not to be sustained. Management has analyzed the Fund's uncertain tax positions and concluded that no liability for unrecognized tax benefits should be recorded related to uncertain tax positions. Management is not aware of any tax positions for which it is reasonably possible that the total amounts of unrecognized tax benefits will change materially in the next 12 months.
The Fund files tax returns in the U.S. Federal jurisdiction and certain other jurisdictions. Generally, the Fund is subject to examinations by such taxing authorities for up to three years after the filing of the return for the tax period.
F.Expenses – Fees provided for under the Rule 12b-1 plan of a particular class of the Fund are charged to the operations of such class. Transfer agency fees and expenses and other shareholder recordkeeping fees and expenses attributable to Class R5 and Class R6 are allocated to each share class based on relative net assets. Sub-accounting fees attributable to Class R5 are charged to the operations of the class. Transfer agency fees and expenses and other shareholder recordkeeping fees and expenses relating to all other classes are allocated among those classes based on relative net assets. All other expenses are allocated among the classes based on relative net assets.
G.Accounting Estimates – The preparation of financial statements in conformity with accounting principles generally accepted in the United States of America ("GAAP") requires management to make estimates and assumptions that affect the reported amounts of assets and liabilities at the date of the financial statements and the reported amounts of revenues and expenses during the reporting period including estimates and assumptions related to taxation. Actual results could differ from those estimates by a significant amount. In addition, the Fund monitors for material events or transactions that may occur or become known after the period-end date and before the date the financial statements are released to print.
H.Indemnifications – Under the Fund's organizational documents, each Trustee, officer, employee or other agent of the Fund is indemnified against certain liabilities that may arise out of the performance of their duties to the Fund. Additionally, in the normal course of business, the Fund enters into contracts, including the Fund's servicing agreements, that contain a variety of indemnification clauses. The Fund's maximum exposure under these arrangements is unknown as this would involve future claims that may be made against the Fund that have not yet occurred. The risk of material loss as a result of such indemnification claims is considered remote.
I.Commercial Mortgage-Backed Securities – The Fund may invest in both single and multi-issuer Commercial Mortgage-Backed Securities ("CMBS"). This includes both investment grade and non-investment grade CMBS as well as other non-rated CMBS. A CMBS is a type of mortgage-backed security that is secured by one or more mortgage loans on interests in commercial real estate property. CMBS differ from conventional debt securities because principal is paid back over the life of the security rather than at maturity. Investments in CMBS are subject to the various risks which relate to the pool of underlying assets in which the CMBS represents an interest. Securities backed by commercial real estate assets are subject to securities market risks as well as risks similar to those of direct ownership of commercial real estate loans. Risks include the ability of a borrower to meet its obligations on the loan which could lead to default or foreclosure of the property. Such actions may impact the amount of proceeds ultimately derived from the loan, and the timing of receipt of such proceeds.
Management estimates future expected cash flows at the time of purchase based on the anticipated repayment dates on the CMBS. Subsequent changes in expected cash flow projection may result in a prospective change in the timing or character of income recognized on these securities, or the amortized cost of these securities. The Fund amortizes premiums and/or accretes discounts based on the projected cash flows. Realized and unrealized gains and losses on CMBS are included in the Statement of Operations as Net realized gain (loss) from investment securities and Change in net unrealized appreciation (depreciation)of investment securities, respectively.
J.Futures Contracts — The Fund may enter into futures contracts to manage exposure to interest rate, equity and market price movements and/or currency risks. A futures contract is an agreement between two parties ("Counterparties") to purchase or sell a specified underlying security, currency or commodity (or delivery of a cash settlement price, in the case of an index future) for a fixed price at a future date. The Fund currently invests only in exchange-traded futures and they are standardized as to maturity date and underlying financial instrument. Initial margin deposits required upon entering into futures contracts are satisfied by the segregation of specific securities or cash as collateral at the futures commission merchant (broker). During the period the futures contracts are open, changes in the value of the contracts are recognized as unrealized gains or losses by recalculating the value of the contracts on a daily basis. Subsequent or variation margin payments are received or made depending upon whether unrealized gains or losses are incurred. These amounts are reflected as receivables or payables on the Statement of Assets and Liabilities. When the contracts are closed or expire, the Fund recognizes a realized gain or loss equal to the difference between the proceeds from, or cost of, the closing transaction and the Fund's basis in the contract. The net realized gain (loss) and the change in unrealized gain (loss) on futures contracts held during the period is included on the Statement of Operations. The primary risks associated with futures contracts are market risk and the absence of a liquid secondary market. If the Fund were unable to liquidate a futures contract and/or enter into an offsetting closing transaction, the Fund would continue to be subject to market risk with respect to the value of the contracts and continue to be required to maintain the margin deposits on the futures
contracts. Futures contracts have minimal Counterparty risk since the exchange's clearinghouse, as Counterparty to all exchange-traded futures, guarantees the futures against default. Risks may exceed amounts recognized in the Statement of Assets and Liabilities.
K.Call Options Purchased and Written – The Fund may write call options and/or buy call options. A covered call option gives the purchaser of such option the right to buy, and the writer the obligation to sell, the underlying security or foreign currency at the stated exercise price during the option period. An uncovered call option exists without the ownership of the underlying security. Options written by the Fund normally will have expiration dates between three and nine months from the date written. The exercise price of a call option may be below, equal to, or above the current market value of the underlying security at the time the option is written.
When the Fund writes a covered call option, an amount equal to the premium received by the Fund is recorded as an asset and an equivalent liability in the Statement of Assets and Liabilities. The amount of the liability is subsequently "marked-to-market" to reflect the current market value of the option written. If a written covered call option expires on the stipulated expiration date, or if the Fund enters into a closing purchase transaction, the Fund realizes a gain (or a loss if the closing purchase transaction exceeds the premium received when the option was written) without regard to any unrealized gain or loss on the underlying security, and the liability related to such option is extinguished. If a written covered call option is exercised, the Fund realizes a gain or a loss from the sale of the underlying security and the proceeds of the sale are increased by the premium originally received. Realized and unrealized gains and losses on call options written are included in the Statement of Operations as Net realized gain (loss) from and Change in net unrealized appreciation (depreciation) of Option contracts written. A risk in writing a covered call option is that the Fund gives up the opportunity for profit if the market price of the security increases and the option is exercised. The risk in writing an uncovered call option is that the Fund may incur significant losses if the value of the written security exceeds the exercise price of the option.
When the Fund buys a call option, an amount equal to the premium paid by the Fund is recorded as an investment on the Statement of Assets and Liabilities. The amount of the investment is subsequently "marked-to-market" to reflect the current value of the option purchased. Realized and unrealized gains and losses on call options purchased are included in the Statement of Operations as Net realized gain (loss) from and Change in net unrealized appreciation (depreciation) of Investment securities. A risk in buying an option is that the Fund pays a premium whether or not the option is exercised. In addition, there can be no assurance that a liquid secondary market will exist for any option purchased.
L.Put Options Purchased – The Fund may purchase put options including options on securities indexes, or foreign currency and/or futures contracts. By purchasing a put option, the Fund obtains the right (but not the obligation) to sell the option's underlying instrument at a fixed strike price. In return for this right, the Fund pays an option premium. The option's underlying instrument may be a security, securities index, or a futures contract.
Additionally, the Fund may enter into an option on a swap agreement, also called a "swaption". A swaption is an option that gives the buyer the right, but not the obligation, to enter into a swap on a future date in exchange for paying a market-based premium. A receiver swaption gives the owner the right to receive the total return of a specified asset, reference rate or index. Swaptions also include options that allow an existing swap to be terminated or extended by one of the Counterparties.
Put options may be used by the Fund to hedge securities it owns by locking in a minimum price at which the Fund can sell. If security prices fall, the put option could be exercised to offset all or a portion of the Fund's resulting losses. At the same time, because the maximum the Fund has at risk is the cost of the option, purchasing put options does not eliminate the potential for the Fund to profit from an increase in the value of the securities hedged. Realized and unrealized gains and losses on put options purchased are included in the Statement of Operations as Net realized gain (loss) from and Change in net unrealized appreciation (depreciation) of Investment securities. A risk in buying an option is that the Fund pays a premium whether or not the option is exercised. In addition, there can be no assurance that a liquid secondary market will exist for any option purchased.
M.Swap Agreements — The Fund may enter into various swap transactions, including interest rate, total return, index, currency and credit default swap contracts ("CDS") for investment purposes or to manage interest rate, currency or credit risk. Such transactions are agreements between Counterparties. A swap agreement may be negotiated bilaterally and traded over-the-counter ("OTC") between two parties ("uncleared/ OTC") or, in some instances, must be transacted through a future commission merchant ("FCM") and cleared through a clearinghouse that serves as a central Counterparty ("centrally cleared swap"). These agreements may contain among other conditions, events of default and termination events, and various covenants and representations such as provisions that require the Fund to maintain a pre-determined level of net assets, and/ or provide limits regarding the decline of the Fund's NAV over specific periods of time. If the Fund were to trigger such provisions and have open derivative positions at that time, the Counterparty may be able to terminate such agreement and request immediate payment in an amount equal to the net liability positions, if any.
Interest rate, total return, index, and currency swap agreements are two-party contracts entered into primarily to exchange the returns (or differentials in rates of returns) earned or realized on particular predetermined investments or instruments. The gross returns to be exchanged or "swapped" between the parties are calculated with respect to a notional amount, i.e., the return on or increase in value of a particular dollar amount invested at a particular interest rate or return of an underlying asset, in a particular foreign currency, or in a "basket" of securities representing a particular index.
In a centrally cleared swap, the Fund's ultimate Counterparty is a central clearinghouse. The Fund initially will enter into centrally cleared swaps through an executing broker. When a fund enters into a centrally cleared swap, it must deliver to the central Counterparty (via the FCM) an amount referred to as "initial margin." Initial margin requirements are determined by the central Counterparty, but an FCM may require additional initial margin above the amount required by the central Counterparty. Initial margin deposits required upon entering into centrally cleared swaps are satisfied by cash or securities as collateral at the FCM. Securities deposited as initial margin are designated on the Schedule of Investments and cash deposited is recorded on the Statement of Assets and Liabilities. During the term of a cleared swap agreement, a "variation margin" amount may be required to be paid by the Fund or may be received by the Fund, based on the daily change in price of the underlying reference instrument subject to the swap agreement and is recorded as a receivable or payable for variation margin in the Statement of Assets and Liabilities until the centrally cleared swap is terminated at which time a realized gain or loss is recorded.
A CDS is an agreement between Counterparties to exchange the credit risk of an issuer. A buyer of a CDS is said to buy protection by paying a fixed payment over the life of the agreement and in some situations an upfront payment to the seller of the CDS. If a defined credit event occurs (such as payment default or bankruptcy), the Fund as a protection buyer would cease paying its fixed payment, the Fund would deliver eligible bonds issued by the reference entity to the seller, and the seller would pay the full notional value, or the "par value", of the referenced obligation to the Fund. A seller of a CDS is said to sell protection and thus would receive a fixed payment over the life of the agreement and an upfront payment, if applicable. If a credit event occurs, the Fund as a protection seller would cease to receive the fixed payment stream, the Fund would pay the buyer "par value" or the full notional value of the referenced obligation, and the Fund would receive the eligible bonds issued by the reference entity. In turn, these bonds may be sold in order to realize a recovery value. Alternatively, the seller of the CDS and its Counterparty may agree to net the notional amount and the market value of the bonds and make a cash payment equal to the difference to the buyer of protection. If no credit event occurs, the Fund receives the fixed payment over the life of the agreement. As the seller, the Fund would effectively add leverage to its portfolio because, in addition to its total net assets, the Fund would be subject to investment exposure on the notional amount of the CDS. In connection with these agreements, cash and securities may be identified as collateral in accordance with the terms of the respective swap agreements to provide assets of value and recourse in the event of default under the swap agreement or bankruptcy/insolvency of a party to the swap agreement. If a Counterparty becomes bankrupt or otherwise fails to perform its obligations due to financial difficulties, the Fund may experience significant delays in obtaining any recovery in a bankruptcy or other reorganization proceeding. The Fund may obtain only limited recovery or may obtain no recovery in such circumstances. The Fund's maximum risk of loss from Counterparty risk, either as the protection seller or as the protection buyer, is the value of the contract. The risk may be mitigated by having a master netting arrangement between the Fund and the Counterparty and by the designation of collateral by the Counterparty to cover the Fund's exposure to the Counterparty.
Implied credit spreads represent the current level at which protection could be bought or sold given the terms of the existing CDS contract and serve as an indicator of the current status of the payment/performance risk of the CDS. An implied spread that has widened or increased since entry into the initial contract may indicate a deteriorating credit profile and increased risk of default for the reference entity. A declining or narrowing spread may indicate an improving credit profile or decreased risk of default for the reference entity. Alternatively, credit spreads may increase or decrease reflecting the general tolerance for risk in the credit markets.
An interest rate swap is an agreement between Counterparties pursuant to which the parties exchange a floating rate payment for a fixed rate payment based on a specified notional amount.
Changes in the value of centrally cleared and OTC swap agreements are recognized as unrealized gains (losses) in the Statement of Operations by "marking to market" on a daily basis to reflect the value of the swap agreement at the end of each trading day. Payments received or paid at the beginning of the agreement are reflected as such on the Statement of Assets and Liabilities and may be referred to as upfront payments. The Fund accrues for the fixed payment stream and amortizes upfront payments, if any, on swap agreements on a daily basis with the net amount, recorded as a component of realized gain (loss) on the Statement of Operations. A liquidation payment received or made at the termination of a swap agreement is recorded as realized gain (loss) on the Statement of Operations. The Fund segregates cash or liquid securities having a value at least equal to the amount of the potential obligation of a Fund under any swap transaction. Cash held as collateral is recorded as deposits with brokers on the Statement of Assets and Liabilities. Entering into these agreements involves, to varying degrees, lack of liquidity and elements of credit, market, and Counterparty risk in excess of amounts recognized on the Statement of Assets and Liabilities. Such risks involve the possibility that a swap is difficult to sell or liquidate; the Counterparty does not honor its obligations under the agreement and unfavorable interest rates and market fluctuations. It is possible that developments in the swaps market, including potential government regulation, could adversely affect the Fund's ability to terminate existing swap agreements or to realize amounts to be received under such agreements. Additionally, ISDA master agreements include credit related contingent features which allow Counterparties to OTC derivatives to terminate derivative contracts prior to maturity in the event that, for example, the Fund's net assets decline by a stated percentage or the Fund fails to meet the terms of its ISDA master agreements, which would cause the Fund to accelerate payment of any net liability owed to the Counterparty. A short position in a security poses more risk than holding the same security long. As there is no limit on how much the price of the security can increase, the Fund's exposure is unlimited.
Notional amounts of each individual credit default swap agreement outstanding as of February 29, 2020 for which the Fund is the seller of protection are disclosed in the open swap agreements table. These potential amounts would be partially offset by any recovery values of the respective referenced obligations, upfront payments received upon entering into the agreement, or net amounts received from the settlement of buy protection credit default swap agreements entered into by the Fund for the same referenced entity or entities.
N.Dollar Rolls and Forward Commitment Transactions - The Fund may enter into dollar roll transactions to enhance the Fund's performance. The Fund executes its dollar roll transactions in the to be announced ("TBA") market whereby the Fund makes a forward commitment to purchase a security and, instead of accepting delivery, the position is offset by the sale of the security with a simultaneous agreement to repurchase at a future date.
The Fund accounts for dollar roll transactions as purchases and sales and realizes gains and losses on these transactions. These transactions increase the Fund's portfolio turnover rate. The Fund will segregate liquid assets in an amount equal to its dollar roll commitments.
Dollar roll transactions involve the risk that a Counterparty to the transaction may fail to complete the transaction. If this occurs, the Fund may lose the opportunity to purchase or sell the security at the agreed upon price. Dollar roll transactions also involve the risk that the value of the securities retained by the Fund may decline below the price of the securities that the Fund has sold but is obligated to purchase under the agreement. Dollar roll transactions covered in this manner are not treated as senior securities for purposes of a Fund's fundamental investment limitation on senior securities and borrowings.
O.Other Risks - The Fund may invest in obligations issued by agencies and instrumentalities of the U.S. Government that may vary in the level of support they receive from the government. The government may choose not to provide financial support to government sponsored agencies or instrumentalities if it is not legally obligated to do so. In this case, if the issuer defaulted, the Fund may not be able to recover its investment in such issuer from the U.S. Government. Many securities purchased by the Fund are not guaranteed by the U.S. Government. The current low interest rate environment was created in part by the Federal Reserve Board (FRB) and certain foreign central banks keeping the federal funds and equivalent foreign rates near historical lows. Increases in the federal funds and equivalent foreign rates may expose fixed income markets to heightened volatility and reduced liquidity for certain fixed income investments, particularly those with longer maturities. In addition, decreases in fixed income dealer market-making capacity may also potentially lead to heightened volatility and reduced liquidity in the fixed income markets. As a result, the value of the Fund's investments and share price may decline. Changes in central bank policies could also result in higher than normal shareholder redemptions, which could potentially increase portfolio turnover and the Fund's transaction costs. CLOs are subject to the risks of substantial losses due to actual defaults by underlying borrowers, which will be greater during periods of economic or financial stress. CLOs may also lose value due to collateral defaults and disappearance of subordinate tranches, market anticipation of defaults, and investor aversion to CLO securities as a class. The risks of CLOs will be greater if the Fund invests in CLOs that hold loans of uncreditworthy borrowers or if the Fund holds subordinate tranches of the CLO that absorbs losses from the defaults before senior tranches. In addition, CLOs are subject to interest rate risk and credit risk. The market values of convertible securities are affected by market interest rates, the risk of actual issuer default on interest or principal payments and the value of the underlying common stock into which the convertible security may be converted. Additionally, a convertible security is subject to the same types of market and issuer risks as apply to the underlying common stock. In addition, certain convertible securities are subject to involuntary conversions and may undergo principal write-downs upon the occurrence of certain triggering events, and, as a result, are subject to an increased risk of loss. Convertible securities may be rated below investment grade. Emerging markets (also referred to as developing markets) are generally subject to greater market volatility, political, social and economic instability, uncertainty regarding the existence of trading markets and more governmental limitations on foreign investment than more developed markets. In addition, companies operating in emerging markets may be subject to lower trading volume and greater price fluctuations than companies in more developed markets. Securities law in many emerging market countries is relatively new and unsettled. Therefore, laws regarding foreign investment in emerging market securities, securities regulation, title to securities, and shareholder rights may change quickly and unpredictably. In addition, the enforcement of systems of taxation at federal, regional and local levels in emerging market countries may be inconsistent, and subject to sudden change. Other risks of investing in emerging markets securities may include additional transaction costs, delays in settlement procedures, and lack of timely information. The Fund may invest in lower-quality debt securities, i.e., "junk bonds". Investments in lower-rated securities or unrated securities of comparable quality tend to be more sensitive to economic conditions than higher rated securities. Junk bonds involve a greater risk of default by the issuer because such securities are generally unsecured and are often subordinated to other creditors' claim. Mortgage- and asset-backed securities, including collateralized debt obligations and collateralized mortgage obligations, are subject to prepayment or call risk, which is the risk that a borrower's payments may be received earlier or later than expected due to changes in prepayment rates on underlying loans. This could result in the Fund reinvesting these early payments at lower interest rates, thereby reducing the Fund's income. Mortgage- and asset-backed securities also are subject to extension risk, which is the risk that an unexpected rise in interest rates could reduce the rate of prepayments, causing the price of the mortgage- and asset-backed securities and the Fund's share price to fall. An unexpectedly high rate of defaults on the mortgages held by a mortgage pool may adversely affect the value of mortgage-backed securities and could result in losses to the Fund. Privately-issued mortgage-backed securities and asset-backed securities may be less liquid than other types of securities and the Fund may be unable to sell these securities at the time or price it desires. The risk of a municipal obligation generally depends on the financial and credit status of the issuer. Constitutional amendments, legislative enactments, executive orders, administrative regulations, voter initiatives, and the issuer's regional economic conditions may affect the municipal security's value, interest payments, repayment of principal and the Fund's ability to sell the security. Failure of a municipal security issuer to comply with applicable tax requirements may make income paid thereon taxable, resulting in a decline in the security's value. In addition, there could be changes in applicable tax laws or tax treatments that reduce
or eliminate the current federal income tax exemption on municipal securities or otherwise adversely affect the current federal or state tax status of municipal securities. Preferred securities are subject to issuer-specific and market risks applicable generally to equity securities. Preferred securities also may be subordinated to bonds or other debt instruments, subjecting them to a greater risk of non-payment, may be less liquid than many other securities, such as common stocks, and generally offer no voting rights with respect to the issuer. Obligations of U.S. Government agencies and authorities receive varying levels of support and may not be backed by the full faith and credit of the U.S. Government, which could affect the Fund's ability to recover should they default. No assurance can be given that the U.S. Government will provide financial support to its agencies and authorities if it is not obligated by law to do so.
P.Collateral —To the extent the Fund has designated or segregated a security as collateral and that security is subsequently sold, it is the Fund's practice to replace such collateral no later than the next business day.
NOTE 2—Advisory Fees and Other Fees Paid to Affiliates
The Trust has entered into a master investment advisory agreement with Invesco Advisers, Inc. (the "Adviser" or "Invesco"). Under the terms of the investment advisory agreement, the Fund accrues daily and pays monthly an advisory fee to the Adviser based on the annual rate of the Fund's average daily net assets as follows:
Average Daily Net Assets | Rate |
First $200 million | 0.500% |
Next $300 million | 0.400% |
Next $500 million | 0.350% |
| |
Next $19.5 billion | 0.300% |
| |
Over $20.5 billion | 0.240% |
For the year ended February 29, 2020, the effective advisory fee rate incurred by the Fund was 0.44%.
Under the terms of a master sub-advisory agreement between the Adviser and each of Invesco Asset Management Deutschland GmbH, Invesco Asset Management Limited, Invesco Asset Management (Japan) Limited, Invesco Hong Kong Limited, Invesco Senior Secured Management, Inc. and Invesco Canada Ltd. (collectively, the "Affiliated Sub-Advisers") the Adviser, not the Fund, will pay 40% of the fees paid to the Adviser to any such Affiliated Sub-Adviser(s) that provide(s) discretionary investment management services to the Fund based on the percentage of assets allocated to such Affiliated Sub-Adviser(s).
Effective July 1, 2019, the Adviser has contractually agreed, through at least June 30, 2020, to waive advisory fees and/or reimburse expenses of all shares to the extent necessary to limit total annual fund operating expenses after fee waiver and/or expense reimbursement (excluding certain items discussed below) of Class A, Class C, Class R, Class Y, Investor Class, Class R5 and Class R6 shares to 1.07%, 1.82%, 1.32%, 0.82%, 1.07%, 0.82% and 0.82%, respectively, of average daily net assets (the "expense limits"). Prior to July 1, 2019, the Adviser had contractually agreed to waive advisory fees and/or reimburse expenses of all shares to the extent necessary to limit total annual fund operating expenses after fee waiver and/or expense reimbursement (excluding certain items discussed below) of Class A, Class C, Class R, Class Y, Investor Class, Class R5 and Class R6 shares to 1.01%, 1.76%, 1.26%, 0.76%, 1.01%, 0.76% and 0.76%, respectively, of the Fund's average daily net assets (the "expense limits"). In determining the Adviser's obligation to waive advisory fees and/or reimburse expenses, the following expenses are not taken into account, and could cause the total annual fund operating expenses after fee waiver and/or reimbursement to exceed the numbers reflected above: (1) interest; (2) taxes; (3) dividend expense on short sales; (4) extraordinary or non-routine items, including litigation expenses; and (5) expenses that the Fund has incurred but did not actually pay because of an expense offset arrangement. Unless Invesco continues the fee waiver agreement, it will terminate on June 30, 2020. During its term, the fee waiver agreement cannot be terminated or amended to increase the expense limits or reduce the advisory fee waivers without approval of the Board of Trustees.
The Adviser has contractually agreed, through at least June 30, 2021, to waive the advisory fee payable by the Fund in an amount equal to 100% of the net advisory fees the Adviser receives from the affiliated money market funds on investments by the Fund of uninvested cash in such affiliated money market funds.
For the year ended February 29, 2020, the Adviser waived advisory fees of $3,791.
The Trust has entered into a master administrative services agreement with Invesco pursuant to which the Fund has agreed to pay Invesco for certain administrative costs incurred in providing accounting services to the Fund. For the year ended February 29, 2020, expenses incurred under the agreement are shown in the Statement of Operations as Administrative services fees. Invesco has entered into a sub-administration agreement whereby State Street Bank and Trust Company ("SSB") serves as fund accountant and provides certain administrative services to the Fund. Pursuant to a custody agreement with the Trust on behalf of the Fund, SSB also serves as the Fund's custodian.
The Trust has entered into a transfer agency and service agreement with Invesco Investment Services, Inc. ("IIS") pursuant to which the Fund has agreed to pay IIS a fee for providing transfer agency and shareholder services to the Fund and reimburse IIS for certain expenses incurred by IIS in the course of providing such services. IIS may make payments to intermediaries that provide omnibus account services, sub-accounting services and/or networking services. All fees payable by IIS to intermediaries that provide omnibus account services or sub-accounting services are charged back to the Fund, subject to certain limitations approved by the Trust's Board of Trustees. For the year ended February 29, 2020, expenses incurred under the agreement are shown in the Statement of Operations as Transfer agent fees.
The Trust has entered into master distribution agreements with Invesco Distributors, Inc. ("IDI") to serve as the distributor for the Class A, Class C, Class R, Class Y, Investor Class, Class R5 and Class R6 shares of the Fund. The Trust has adopted plans pursuant to Rule 12b-1 under the 1940 Act with respect to the Fund's Class A, Class C, Class R and Investor Class shares (collectively, the "Plans"). The Fund, pursuant to the Plans, pays IDI compensation at the annual rate of 0.25% of the Fund's average daily net assets of Class A shares, 1.00% of the average daily net assets of Class C shares and 0.50% of the average daily net assets of Class R shares. The Fund, pursuant to the Investor Class Plan, reimburses IDI for its allocated share of expenses incurred pursuant to the Investor Class Plan for the period, up to a maximum annual rate of 0.25% of the average daily net assets of Investor Class shares. Of the Plan payments, up to 0.25% of the average daily net assets of each class of shares may be paid to furnish continuing personal shareholder services to customers who purchase and own shares of such classes. Any amounts not paid as a service fee under the Plans would constitute an asset-based sales charge. Rules of the Financial Industry Regulatory Authority ("FINRA") impose a cap on the total sales charges, including asset-based sales charges, that may be paid by any class of shares of the Fund. For the year ended February 29, 2020, expenses incurred under the Plans are shown in the Statement of Operations as Distribution fees.
Front-end sales commissions and CDSC (collectively, the "sales charges") are not recorded as expenses of the Fund. Front-end sales commissions are deducted from proceeds from the sales of Fund shares prior to investment in Class A shares of the Fund. CDSC are deducted from redemption proceeds prior to remittance to the shareholder. During the year ended February 29, 2020, IDI advised the Fund that IDI retained $22,230 in front-end sales commissions from the sale of Class A shares and $2,015 and $580 from Class A and Class C shares, respectively, for CDSC imposed upon redemptions by shareholders.
Certain officers and trustees of the Trust are officers and directors of the Adviser, IIS and/or IDI.
NOTE 3—Additional Valuation Information
GAAP defines fair value as the price that would be received to sell an asset or paid to transfer a liability in an orderly transaction between market participants at the measurement date, under current market conditions. GAAP establishes a hierarchy that prioritizes the inputs to valuation methods, giving the highest priority to readily available unadjusted quoted prices in an active market for identical assets (Level 1) and the lowest priority to significant unobservable inputs (Level 3), generally when
market prices are not readily available or are unreliable. Based on the valuation inputs, the securities or other investments are tiered into one of three levels. Changes in valuation methods may result in transfers in or out of an investment's assigned level:
Level 1 – Prices are determined using quoted prices in an active market for identical assets.
Level 2 – Prices are determined using other significant observable inputs. Observable inputs are inputs that other market participants may use in pricing a security. These may include quoted prices for similar securities, interest rates, prepayment speeds, credit risk, yield curves, loss severities, default rates, discount rates, volatilities and others.
Level 3 – Prices are determined using significant unobservable inputs. In situations where quoted prices or observable inputs are unavailable (for example, when there is little or no market activity for an investment at the end of the period), unobservable inputs may be used. Unobservable inputs reflect the Fund's own assumptions about the factors market participants would use in determining fair value of the securities or instruments and would be based on the best available information.
The following is a summary of the tiered valuation input levels, as of February 29, 2020. The level assigned to the securities valuations may not be an indication of the risk or liquidity associated with investing in those securities. Because of the inherent uncertainties of valuation, the values reflected in the financial statements may materially differ from the value received upon actual sale of those investments.
| | Level 1 | Level 2 | Level 3 | Total |
Investments in Securities | | | | | | | |
Asset-Backed Securities | $ | — | $313,062,715 | $— | $313,062,715 | |
U.S. Government Sponsored Agency Mortgage-Backed Securities | | — | 55,260,119 | — | 55,260,119 | |
Agency Credit Risk Transfer Notes | | — | 47,228,674 | — | 47,228,674 | |
U.S. Dollar Denominated Bonds & Notes | | — | 35,154,721 | — | 35,154,721 | |
Preferred Stocks | | 31,016,415 | — | — | 31,016,415 | |
U.S. Treasury Securities | | — | 8,200,606 | — | 8,200,606 | |
Common Stocks & Other Equity Interests | | 7,875,500 | — | — | 7,875,500 | |
Exchange-Traded Fund | | 4,551,930 | — | — | 4,551,930 | |
Money Market Funds | | 4,191,860 | — | — | 4,191,860 | |
Total Investments in Securities | | 47,635,705 | 458,906,835 | — | 506,542,540 | |
Other Investments - Assets* | | | | | | | |
Swap Agreements | | — | 82,718 | — | 82,718 | |
Other Investments - Liabilities* | | | | | | | |
Futures Contracts | | (2,166,593) | — | — | (2,166,593) |
| | | | | | |
Forward Foreign Currency Contracts | | — | (247,941) | — | (247,941) |
| | | | | | |
Swap Agreements | | — | (2,046,468) | — | (2,046,468) |
| | | | | | |
| | (2,166,593) | (2,294,409) | — | (4,461,002) |
| | | | | | |
Total Other Investments | | (2,166,593) | (2,211,691) | — | (4,378,284) |
Total Investments | $45,469,112 | $456,695,144 | $— | $502,164,256 | |
*Unrealized appreciation (depreciation).
NOTE 4—Derivative Investments
The Fund may enter into an International Swaps and Derivatives Association Master Agreement ("ISDA Master Agreement") under which a fund may trade OTC derivatives. An OTC transaction entered into under an ISDA Master Agreement typically involves a collateral posting arrangement, payment netting provisions and close-out netting provisions. These netting provisions allow for reduction of credit risk through netting of contractual obligations. The enforceability of the netting provisions of the ISDA Master Agreement depends on the governing law of the ISDA Master Agreement, among other factors.
For financial reporting purposes, the Fund does not offset OTC derivative assets or liabilities that are subject to ISDA Master Agreements in the Statement of Assets and Liabilities.
Value of Derivative Investments at Period-End
The table below summarizes the value of the Fund's derivative investments, detailed by primary risk exposure, held as of February 29, 2020:
| | | | | Value | | | |
| | Credit | | Currency | | Interest | | |
Derivative Assets | | Risk | | Risk | | Rate Risk | | Total |
Unrealized appreciation on swap agreements — OTC | $ | 82,718 | $ | - | $ | - | $ | 82,718 |
Derivatives not subject to master netting agreements | | - | | - | | - | | - |
| | | | | | | | |
Total Derivative Assets subject to master netting agreements | $ | 82,718 | $ | - | $ | - | $ | 82,718 |
| | | | | Value | | | |
| | Credit | | Currency | | Interest | | |
Derivative Liabilities | | Risk | | Risk | | Rate Risk | Total | |
Unrealized depreciation on futures contracts — Exchange-Traded(a) | $ | - | $ | - | $(2,166,593) | $(2,166,593) |
| | | | | | | | |
Unrealized depreciation on swap agreements — OTC | | (1,787,925) | | - | | - | (1,787,925) |
| | | | | | | | |
Unrealized depreciation on swap agreements — Centrally Cleared(a) | | (258,543) | | - | | - | (258,543) |
| | | | | | | | |
Unrealized depreciation on forward foreign currency contracts outstanding | | - | | (247,941) | | - | (247,941) |
| | | | | | | | |
Total Derivative Liabilities | | (2,046,468) | | (247,941) | | (2,166,593) | (4,461,002) |
Derivatives not subject to master netting agreements | | 258,543 | | - | | 2,166,593 | 2,425,136 | |
| | | | | | |
Total Derivative Liabilities subject to master netting agreements | $(1,787,925) | $(247,941) | $ | - | $(2,035,866) |
| | | | | | | | |
(a)The daily variation margin receivable (payable) at period-end is recorded in the Statement of Assets and Liabilities.
Offsetting Assets and Liabilities
The table below reflects the Fund's exposure to Counterparties subject to either an ISDA Master Agreement or other agreement for OTC derivative transactions as of February 29, 2020.
| Financial Derivative Assets | | Financial Derivative Liabilities | | | | | | | | |
| | | | | Forward | | | | | | | | Collateral | | | | |
| | | | | Foreign | | | | | | | | | | | |
| | | | | | | | | | | | (Received/Pledged) | | | | |
| | Swap | | Currency | | Swap | | Total | Net Value of | | | Net |
Counterparty | Agreements | | | Contracts | Agreements | | Liabilities | Derivatives | Non-Cash | Cash | | | Amount | |
Goldman Sachs International | $ | - | | $(247,941) | $ | - | $ | (247,941) | $ | (247,941) | $- | $ | - | $ | (247,941) |
| | | | | | | | | | | | | | | | |
JP Morgan Chase Bank, N.A. | | - | | - | | (1,030,816) | | (1,030,816) | | (1,030,816) | - | | - | | (1,030,816) |
| | | | | | | | | | | | | | | |
Merrill Lynch International | | - | | - | | (915,352) | | (915,352) | | (915,352) | - | 640,000 | | (275,352) |
| | | | | | | | | | | | | | | | | |
Morgan Stanley and Co. International PLC | | 82,718 | | - | | - | | - | | | 82,718 | - | | - | | 82,718 | |
Total | $82,718 | | $(247,941) | $ | (1,946,168) | $(2,194,109) | $(2,111,391) | $- | $640,000 | $(1,471,391) |
| | | | | | | | | | | | | | | | | | |
Effect of Derivative Investments for the year ended February 29, 2020
The table below summarizes the gains (losses) on derivative investments, detailed by primary risk exposure, recognized in earnings during the period:
| | | | Location of Gain (Loss) on | | | | |
| | | | Statement of Operations | | | | |
| | | Credit | Currency | Interest | | | | |
| | | Risk | Risk | Rate Risk | | Total |
Realized Gain (Loss): | | | | | | | | | |
Forward foreign currency contracts | $ | - | $ 790,406 | $ | - | $ 790,406 | |
Futures contracts | | | - | - | (9,202,970) | (9,202,970) |
Swap agreements | | | 4,125,080 | - | | - | 4,125,080 | |
| | | | | | | | | |
Change in Net Unrealized Appreciation (Depreciation): | | | | | | | | | |
Forward foreign currency contracts | | | - | (234,638) | | - | (234,638) |
| | | | | | | |
Futures contracts | | | - | - | (2,552,252) | (2,552,252) |
| | | | | | | | |
Swap agreements | | | (2,610,655) | - | | - | (2,610,655) |
| | | | | | |
Total | $ | 1,514,425 | $ 555,768 | $(11,755,222) | $(9,685,029) |
| | | | | | |
The table below summarizes the average notional value of derivatives held during the period. | | | | | | |
| | | | Forward | | | | | |
| | | | Foreign Currency | Futures | | Swap |
| | | | Contracts | Contracts | | Agreements | |
Average notional value | | | | $12,645,047 | $133,037,696 | | $87,745,833 | |
| | | | | | | | | |
NOTE 5—Expense Offset Arrangement(s)
The expense offset arrangement is comprised of transfer agency credits which result from balances in demand deposit accounts used by the transfer agent for clearing shareholder transactions. For the year ended February 29, 2020, the Fund received credits from this arrangement, which resulted in the reduction of the Fund's total expenses of $11,164.
NOTE 6—Trustees' and Officers' Fees and Benefits
Trustees' and Officers' Fees and Benefits include amounts accrued by the Fund to pay remuneration to certain Trustees and Officers of the Fund. Trustees have the option to defer compensation payable by the Fund, and Trustees' and Officers' Fees and Benefits also include amounts accrued by the Fund to fund such deferred compensation amounts. Those Trustees who defer compensation have the option to select various Invesco Funds in which their deferral accounts shall be deemed to be invested. Finally, certain current Trustees were eligible to participate in a retirement plan that provided for benefits to be paid upon retirement to Trustees over a period of time based on the number of years of service. The Fund may have certain former Trustees who also participate in a retirement plan and receive benefits under

such plan. Trustees' and Officers' Fees and Benefits include amounts accrued by the Fund to fund such retirement benefits. Obligations under the deferred compensation and retirement plans represent unsecured claims against the general assets of the Fund.
NOTE 7—Cash Balances
The Fund may borrow for leveraging in an amount up to 5% of the Fund's total assets (excluding the amount borrowed) at the time the borrowing is made. In doing so, the Fund is permitted to temporarily carry a negative or overdrawn balance in its account with SSB, the custodian bank. Such balances, if any at period end, are shown in the Statement of Assets and Liabilities under the payable caption Amount due custodian. To compensate the custodian bank for such overdrafts, the overdrawn Fund may either (1) leave funds as a compensating balance in the account so the custodian bank can be compensated by earning the additional interest; or (2) compensate by paying the custodian bank at a rate agreed upon by the custodian bank and Invesco, not to exceed the contractually agreed upon rate. The Fund may not purchase additional securities when any borrowings from banks or broker-dealers exceed 5% of the Fund's total assets, or when any borrowings from an Invesco Fund are outstanding.
NOTE 8—Distributions to Shareholders and Tax Components of Net Assets
Tax Character of Distributions to Shareholders Paid During the Fiscal Years Ended February 29, 2020 and February 28, 2019:
| | 2020 | 2019 | | |
Ordinary income | $21,387,698 | $16,286,979 |
Tax Components of Net Assets at Period-End: | | | | |
| | | 2020 | | |
Undistributed ordinary income | | $ 1,745,767 |
| | | |
Net unrealized appreciation — investments | | 16,786,781 |
Net unrealized appreciation - foreign currencies | | 1,589 | |
Temporary book/tax differences | | (204,090) |
| | | |
Capital loss carryforward | | (44,015,640) |
Shares of beneficial interest | | 480,615,704 |
Total net assets | | $454,930,111 |
| | | | | |
The difference between book-basis and tax-basis unrealized appreciation (depreciation) is due to differences in the timing of recognition of gains and losses on investments for tax and book purposes. The Fund's net unrealized appreciation (depreciation) difference is attributable primarily to forward contracts and futures contracts.
The temporary book/tax differences are a result of timing differences between book and tax recognition of income and/or expenses. The Fund's temporary book/tax differences are the result of the trustee deferral of compensation and retirement plan benefits.
Capital loss carryforward is calculated and reported as of a specific date. Results of transactions and other activity after that date may affect the amount of capital loss carryforward actually available for the Fund to utilize. The ability to utilize capital loss carryforward in the future may be limited under the Internal Revenue Code and related regulations based on the results of future transactions.
The Fund has a capital loss carryforward as of February 29, 2020, as follows:
Capital Loss Carryforward*
Expiration | Short-Term | Long-Term | Total |
Not subject to expiration | $12,123,526 | $31,892,114 | $44,015,640 |
*Capital loss carryforward is reduced for limitations, if any, to the extent required by the Internal Revenue Code and may be further limited depending upon a variety of factors, including the realization of net unrealized gains or losses as of the date of any reorganization.
NOTE 9—Investment Transactions
The aggregate amount of investment securities (other than short-term securities, U.S. Treasury obligations and money market funds, if any) purchased and sold by the Fund during the year ended February 29, 2020 was $432,045,187 and $405,838,402, respectively. During the same period, purchases and sales of U.S. Treasury obligations were $33,506,094 and $58,964,600, respectively. Cost of investments, including any derivatives, on a tax basis includes the adjustments for financial reporting purposes as of the most recently completed federal income tax reporting period-end.
Unrealized Appreciation (Depreciation) of Investments on a Tax Basis
Aggregate unrealized appreciation of investments | $23,090,390 | |
Aggregate unrealized (depreciation) of investments | (6,303,609) |
Net unrealized appreciation of investments | $16,786,781 | |
Cost of investments for tax purposes is $485,377,475.
NOTE 10—Reclassification of Permanent Differences
Primarily as a result of differing book/tax treatment of foreign currency transactions and swap income, on February 29, 2020, undistributed net investment income was increased by $2,831,973 and undistributed net realized gain (loss) was decreased by $2,831,973. This reclassification had no effect on the net assets or the distributable earnings (loss) of the Fund.
NOTE 11—Share Information
| | Summary of Share Activity | | | |
| Year ended | Year ended |
| February 29, 2020(a) | | February 28, 2019 | |
| Shares | Amount | Shares | Amount |
Sold: | | | | | | | |
Class A | 2,130,404 | $ 18,534,383 | 4,031,812 | $ 34,311,976 |
Class C | 316,687 | 2,753,344 | 250,021 | 2,141,661 | |
Class R | 221,072 | 1,921,311 | 109,486 | 937,672 | |
Class Y | 771,953 | 6,695,585 | 726,889 | 6,258,779 | |
Investor Class | 130,188 | 1,135,316 | 114,345 | 981,519 | |
Class R5 | 32,274 | 278,633 | 76,145 | 656,750 | |
Class R6 | - | - | | 111,277 | 961,635 | |
Issued as reinvestment of dividends: | | | | | | | |
Class A | 1,877,185 | 16,272,173 | 1,449,135 | 12,337,543 |
Class C | 38,334 | 332,348 | 55,756 | 473,731 | |
Class R | 28,178 | 244,556 | 19,572 | 166,650 | |
Class Y | 46,088 | 400,368 | 32,850 | 280,106 | |
Investor Class | 130,934 | 1,136,640 | 101,907 | 867,515 | |
Class R5 | 4,727 | 40,958 | 3,633 | 30,933 | |
Class R6 | 166 | 1,434 | 8,028 | 69,421 | |
Automatic conversion of Class C shares to Class A shares: | | | | | | | |
Class A | 119,864 | 1,038,536 | - | - | | |
Class C | (119,827) | (1,038,536) | - | - | | |
Reacquired: | | | | | | | |
Class A | (7,301,314) | (63,329,540) | (11,460,472) | (98,191,704) |
| | | | | |
Class C | (293,945) | (2,550,114) | (2,641,892) | (22,438,860) |
| | | | | |
Class R | (390,467) | (3,416,686) | (103,213) | (880,201) |
| | | | | |
Class Y | (740,947) | (6,438,002) | (855,886) | (7,315,267) |
| | | | | |
Investor Class | (424,722) | (3,688,791) | (674,338) | (5,776,734) |
| | | | | |
Class R5 | (89,666) | (780,039) | (39,713) | (339,488) |
| | | | | |
Class R6 | (909) | (7,895) | (883,831) | (7,621,250) |
| | | | | |
Net increase (decrease) in share activity | (3,513,743) | $(30,464,018) | (9,568,489) | $(82,087,613) |
| | | | | | | |
(a)There are entities that are record owners of more than 5% of the outstanding shares of the Fund and in the aggregate own 21% of the outstanding shares of the Fund. IDI has an agreement with these entities to sell Fund shares. The Fund, Invesco and/or Invesco affiliates may make payments to these entities, which are considered to be related to the Fund, for providing services to the Fund, Invesco and/or Invesco affiliates including but not limited to services such as securities brokerage, distribution, third party record keeping and account servicing. The Fund has no knowledge as to whether all or any portion of the shares owned of record by these entities are also owned beneficially.
NOTE 12—Subsequent Event
During the first quarter of 2020, the World Health Organization declared the coronavirus (COVID-19) to be a public health emergency. COVID-19 has led to increased short-term market volatility and may have adverse long-term effects on U.S. and world economies and markets in general. COVID-19 may adversely impact the Fund's ability to achieve its investment objective. Because of the uncertainties on valuation, the global economy and business operations, values reflected in these financial statements may materially differ from the value received upon actual sales of those investments.
The Coronavirus Aid, Relief, and Economic Security Act, commonly referred to as the "CARES Act," was signed into law on March 27, 2020 by President Trump. The Adviser is assessing the components of the Act, and the impacts to the Fund should be immaterial.
Report of Independent Registered Public Accounting Firm
To the Board of Trustees of AIM Investment Securities Funds (Invesco Investment Securities Funds) and Shareholders of Invesco Income Fund
Opinion on the Financial Statements
We have audited the accompanying statement of assets and liabilities, including the schedule of investments, of Invesco Income Fund, formerly Invesco
U.S. Government Fund, (one of the funds constituting AIM Investment Securities Funds (Invesco Investment Securities Funds), hereafter referred to as the "Fund") as of February 29, 2020, the related statement of operations for the year ended February 29, 2020, the statement of changes in net assets for each of the two years in the period ended February 29, 2020, including the related notes, and the financial highlights for each of the periods indicated therein (collectively referred to as the financial statements). In our opinion, the financial statements present fairly, in all material respects, the financial position of the Fund as of February 29, 2020, the results of its operations for the year then ended, the changes in its net assets for each of the two years in the period ended February 29, 2020 and the financial highlights financial highlights for each of the periods indicated therein in conformity with accounting principles generally accepted in the United States of America.
Basis for Opinion
These financial statements are the responsibility of the Fund's management. Our responsibility is to express an opinion on the Fund's financial statements based on our audits. We are a public accounting firm registered with the Public Company Accounting Oversight Board (United States) (PCAOB) and are required to be independent with respect to the Fund in accordance with the U.S. federal securities laws and the applicable rules and regulations of the Securities and Exchange Commission and the
PCAOB.
We conducted our audits of these financial statements in accordance with the standards of the PCAOB. Those standards require that we plan and perform the audit to obtain reasonable assurance about whether the financial statements are free of material misstatement, whether due to error or fraud.
Our audits included performing procedures to assess the risks of material misstatement of the financial statements, whether due to error or fraud, and performing procedures that respond to those risks. Such procedures included examining, on a test basis, evidence regarding the amounts and disclosures in the financial statements. Our audits also included evaluating the accounting principles used and significant estimates made by management, as well as evaluating the overall presentation of the financial statements. Our procedures included confirmation of securities owned as of February 29, 2020 by correspondence with the custodian, transfer agent and brokers; when replies were not received from brokers, we performed other auditing procedures. We believe that our audits provide a reasonable basis for our opinion.
/s/PricewaterhouseCoopers LLP
Houston, Texas
April 28, 2020
We have served as the auditor of one or more of the investment companies in the Invesco group of investment companies since at least 1995. We have not been able to determine the specific year we began serving as auditor.
Calculating your ongoing Fund expenses
Example
As a shareholder of the Fund, you incur two types of costs: (1) transaction costs, which may include sales charges (loads) on purchase payments or contingent deferred sales charges on redemptions, if any; and (2) ongoing costs, including management fees, distribution and/or service (12b-1) fees, and other Fund expenses. This example is intended to help you understand your ongoing costs (in dollars) of investing in the Fund and to compare these costs with ongoing costs of investing in other mutual funds. The example is based on an investment of $1,000 invested at the beginning of the period and held for the entire period September 1, 2019 through February 29, 2020.
Actual expenses
The table below provides information about actual account values and actual expenses. You may use the information in this table, together with the amount you invested, to estimate the expenses that you paid over the period. Simply divide your account value by $1,000 (for example, an $8,600 account value divided by $1,000 = 8.6), then multiply the result by the number in the table under the heading entitled "Actual Expenses Paid During Period" to estimate the expenses you paid on your account during this period.
Hypothetical example for comparison purposes
The table below also provides information about hypothetical account values and hypothetical expenses based on the Fund's actual expense ratio and an assumed rate of return of 5% per year before expenses, which is not the Fund's actual return.
The hypothetical account values and expenses may not be used to estimate the actual ending account balance or expenses you paid for the period. You may use this information to compare the ongoing costs of investing in the Fund and other funds. To do so, compare this 5% hypothetical example with the 5% hypothetical examples that appear in the shareholder reports of the other funds.
Please note that the expenses shown in the table are meant to highlight your ongoing costs only and do not reflect any transaction costs, such as sales charges (loads) on purchase payments or contingent deferred sales charges on redemptions, if any. Therefore, the hypothetical information is useful in comparing ongoing costs only, and will not help you determine the relative total costs of owning different funds. In addition, if these transaction costs were included, your costs would have been higher.
| | | | | HYPOTHETICAL | |
| | | | | (5% annual return before | |
| | | ACTUAL | | expenses) | |
| Beginning | Ending | | Expenses | Ending | | Expenses | Annualized |
| Account Value | Account Value | | Paid During | Account Value | | Paid During | Expense |
| (09/01/19) | (02/29/20)1 | | Period2 | (02/29/20) | | Period2 | Ratio |
Class A | $1,000.00 | $1,016.10 | | $4.91 | $1,019.99 | | $4.92 | 0.98% |
| | | | | | | | |
Class C | 1,000.00 | 1,012.30 | | 8.66 | 1,016.26 | | 8.67 | 1.73 |
| | | | | | | | |
Class R | 1,000.00 | 1,016.00 | | 6.17 | 1,018.75 | | 6.17 | 1.23 |
| | | | | | | | |
Class Y | 1,000.00 | 1,017.40 | | 3.66 | 1,021.23 | | 3.67 | 0.73 |
Investor Class | 1,000.00 | 1,017.50 | | 4.51 | 1,020.39 | | 4.52 | 0.90 |
| | | | | | | | |
Class R5 | 1,000.00 | 1,019.10 | | 3.11 | 1,021.78 | | 3.12 | 0.62 |
| | | | | | | | |
Class R6 | 1,000.00 | 1,018.00 | | 3.06 | 1,021.83 | | 3.07 | 0.61 |
| | | | | | | | |
1The actual ending account value is based on the actual total return of the Fund for the period September 1, 2019 through February 29, 2020, after actual expenses and will differ from the hypothetical ending account value which is based on the Fund's expense ratio and a hypothetical annual return of 5% before expenses.
2Expenses are equal to the Fund's annualized expense ratio as indicated above multiplied by the average account value over the period, multiplied by 182/366 to reflect the most recent fiscal half year.
Tax Information
Form 1099-DIV, Form 1042-S and other year–end tax information provide shareholders with actual calendar year amounts that should be included in their tax returns. Shareholders should consult their tax advisers.
The following distribution information is being provided as required by the Internal Revenue Code or to meet a specific state's requirement.
The Fund designates the following amounts or, if subsequently determined to be different, the maximum amount allowable for its fiscal year ended February 29, 2020:
Qualified Dividend Income* | 0.51% |
Corporate Dividends Received Deduction* | 0.00% |
Qualified Business Income* | 9.26% |
U.S. Treasury Obligations* | 1.15% |
Tax-Exempt Interest Dividends* | 0.00% |
* The above percentages are based on ordinary income dividends paid to shareholders during the Fund's fiscal year.
Trustees and Officers
The address of each trustee and officer is AIM Investment Securities Funds (Invesco Investment Securities Funds) (the "Trust"), 11 Greenway Plaza, Suite 1000, Houston, Texas 77046-1173. The trustees serve for the life of the Trust, subject to their earlier death, incapacitation, resignation, retirement or removal as more specifically provided in the Trust's organizational documents. Each officer serves for a one year term or until their successors are elected and qualified. Column two below includes length of time served with predecessor entities, if any.
| Trustee | | Number of | Other |
Name, Year of Birth and | | Funds in | Directorship(s) |
and/or | | Fund Complex | Held by Trustee |
Position(s) | Officer | Principal Occupation(s) | Overseen by | During Past 5 |
Held with the Trust | Since | During Past 5 Years | Trustee | Years |
Interested Trustee | | | | |
Martin L. Flanagan1 — 1960 | 2007 | Executive Director, Chief Executive Officer and President, Invesco Ltd. | 229 | None |
Trustee and Vice Chair | | (ultimate parent of Invesco and a global investment management firm); | | |
| | Trustee and Vice Chair, The Invesco Funds; Vice Chair, Investment Company | | |
| | Institute; and Member of Executive Board, SMU Cox School of Business | | |
| | Formerly: Advisor to the Board, Invesco Advisers, Inc. (formerly known as | | |
| | Invesco Institutional (N.A.), Inc.); Chairman and Chief Executive Officer, | | |
| | Invesco Advisers, Inc. (registered investment adviser); Director, Chairman, | | |
| | Chief Executive Officer and President, Invesco Holding Company (US), Inc. | | |
| | (formerly IVZ Inc.) (holding company), Invesco Group Services, Inc. (service | | |
| | provider) and Invesco North American Holdings, Inc. (holding company); | | |
| | Director, Chief Executive Officer and President, Invesco Holding Company | | |
| | Limited (parent of Invesco and a global investment management firm); | | |
| | Director, Invesco Ltd.; Chairman, Investment Company Institute and President, | | |
| | Co-Chief Executive Officer, Co-President, Chief Operating Officer and Chief | | |
| | Financial Officer, Franklin Resources, Inc. (global investment management | | |
| | organization) | | |
1Mr. Flanagan is considered an interested person (within the meaning of Section 2(a)(19) of the 1940 Act) of the Trust because he is an officer of the Adviser to the Trust, and an officer and a director of Invesco Ltd., ultimate parent of the Adviser.
| | | Number of | |
| | | Funds | Other |
| Trustee | | in | Directorship(s) |
Name, Year of Birth and | and/or | | Fund Complex | Held by Trustee |
Position(s) | Officer | Principal Occupation(s) | Overseen by | During Past 5 |
Held with the Trust | Since | During Past 5 Years | Trustee | Years |
Independent Trustees | | | | |
Bruce L. Crockett – 1944 | 1992 | Chairman, Crockett Technologies Associates (technology consulting company) | 229 | Director and |
Trustee and Chair | | Formerly: Director, Captaris (unified messaging provider); Director, President | | Chairman of the |
| | | Audit Committee, |
| | and Chief Executive Officer, COMSAT Corporation; Chairman, Board of | |
| | | ALPS (Attorneys |
| | Governors of INTELSAT (international communications company); ACE Limited | |
| | | Liability |
| | (insurance company); Independent Directors Council and Investment Company | |
| | | Protection |
| | Institute: Member of the Audit Committee, Investment Company Institute; | |
| | | Society) |
| | Member of the Executive Committee and Chair of the Governance Committee, | |
| | | (insurance |
| | Independent Directors Council | |
| | | company); |
| | | |
| | | | Director and |
| | | | Member of the |
| | | | Audit Committee |
| | | | and |
| | | | Compensation |
| | | | Committee, |
| | | | Ferroglobe PLC |
| | | | (metallurgical |
| | | | company) |
David C. Arch – 1945 | 2010 | Chairman of Blistex Inc. (consumer health care products manufacturer); | 229 | Board member of |
Trustee | | Member, World Presidents' Organization | | the Illinois |
| | | | Manufacturers' |
| | | | Association |
Beth Ann Brown – 1968 | 2019 | Independent Consultant | 229 | Director, Board of |
Trustee | | Formerly: Head of Intermediary Distribution, Managing Director, Strategic | | Directors of |
| | | Caron |
| | Relations, Managing Director, Head of National Accounts, Senior Vice | |
| | | Engineering Inc.; |
| | President, National Account Manager and Senior Vice President, Key Account | |
| | | Advisor, Board of |
| | Manager, Columbia Management Investment Advisers LLC; Vice President, Key | |
| | | Advisors of Caron |
| | Account Manager, Liberty Funds Distributor, Inc.; and Trustee of certain | |
| | | Engineering Inc.; |
| | Oppenheimer Funds | |
| | | President and |
| | | |
| | | | Director, Acton |
| | | | Shapleigh Youth |
| | | | Conservation |
| | | | Corps (non - |
| | | | profit); and Vice |
| | | | President and |
| | | | Director of |
| | | | Grahamtastic |
| | | | Connection (non- |
| | | | profit) |
| | | | |

Trustees and Officers—(continued)
| | | Number of | |
| | | Funds | Other |
| Trustee | | in | Directorship(s) |
Name, Year of Birth and | and/or | | Fund Complex | Held by Trustee |
Position(s) | Officer | Principal Occupation(s) | Overseen by | During Past 5 |
Held with the Trust | Since | During Past 5 Years | Trustee | Years |
Independent Trustees—(continued) | | | |
Jack M. Fields – 1952 | 1997 | Chief Executive Officer, Twenty First Century Group, Inc. (government affairs | 229 | Member, Board of Directors of |
Trustee | | company); and Chairman, Discovery Learning Alliance (non-profit) | | Baylor College of Medicine |
| | Formerly: Owner and Chief Executive Officer, Dos Angeles Ranch L.P. (cattle, | | |
| | hunting, corporate entertainment); Director, Insperity, Inc. (formerly known as | | |
| | Administaff) (human resources provider); Chief Executive Officer, Texana | | |
| | Timber LP (sustainable forestry company); Director of Cross Timbers Quail | | |
| | Research Ranch (non-profit); and member of the U.S. House of Representatives | | |
Cynthia Hostetler —1962 | 2017 | Non-Executive Director and Trustee of a number of public and private business | 229 | Vulcan Materials |
Trustee | | corporations | | Company |
| | Formerly: Director, Aberdeen Investment Funds (4 portfolios); Head of | | (construction |
| | | materials |
| | Investment Funds and Private Equity, Overseas Private Investment | |
| | | company); Trilinc |
| | Corporation; President, First Manhattan Bancorporation, Inc.; Attorney, | |
| | | Global Impact |
| | Simpson Thacher & Bartlett LLP | |
| | | Fund; Genesee & |
| | | |
| | | | Wyoming, Inc. |
| | | | (railroads); Artio |
| | | | Global Investment |
| | | | LLC (mutual fund |
| | | | complex); Edgen |
| | | | Group, Inc. |
| | | | (specialized |
| | | | energy and |
| | | | infrastructure |
| | | | products |
| | | | distributor); |
| | | | Investment |
| | | | Company Institute |
| | | | (professional |
| | | | organization); |
| | | | Independent |
| | | | Directors Council |
| | | | (professional |
| | | | organization) |
Eli Jones – 1961 | 2016 | Professor and Dean, Mays Business School - Texas A&M University | 229 | Insperity, Inc. |
Trustee | | Formerly: Professor and Dean, Walton College of Business, University of | | (formerly known |
| | | as Administaff) |
| | Arkansas and E.J. Ourso College of Business, Louisiana State University; | |
| | | (human resources |
| | Director, Arvest Bank | |
| | | provider) |
| | | |
Elizabeth Krentzman – 1959 | 2019 | Formerly: Principal and Chief Regulatory Advisor for Asset Management | 229 | Trustee of the |
Trustee | | Services and U.S. Mutual Fund Leader of Deloitte & Touche LLP; General | | University of |
| | Counsel of the Investment Company Institute (trade association); National | | Florida National |
| | Director of the Investment Management Regulatory Consulting Practice, | | Board Foundation |
| | Principal, Director and Senior Manager of Deloitte & Touche LLP; Assistant | | and Audit |
| | Director of the Division of Investment Management - Office of Disclosure and | | Committee |
| | Investment Adviser Regulation of the U.S. Securities and Exchange | | Member; Member |
| | Commission and various positions with the Division of Investment Management | | of the Cartica |
| | – Office of Regulatory Policy of the U.S. Securities and Exchange Commission; | | Funds Board of |
| | Associate at Ropes & Gray LLP; Advisory Board Member of the Securities and | | Directors (private |
| | Exchange Commission Historical Society; and Trustee of certain Oppenheimer | | investment |
| | Funds | | funds); Member |
| | | | of the University |
| | | | of Florida Law |
| | | | Center |
| | | | Association, Inc. |
| | | | Board of Trustees |
| | | | and Audit |
| | | | Committee |
| | | | Member |
Anthony J. LaCava, Jr. – 1956 | 2019 | Formerly: Director and Member of the Audit Committee, Blue Hills Bank | 229 | Blue Hills Bank; |
Trustee | | (publicly traded financial institution) and Managing Partner, KPMG LLP | | Chairman, |
| | | | Bentley |
| | | | University; |
| | | | Member, |
| | | | Business School |
| | | | Advisory Council; |
| | | | and Nominating |
| | | | Committee |
| | | | KPMG LLP |
Prema Mathai-Davis – 1950 | 1998 | Retired | 229 | None |
Trustee | | Co-Owner & Partner of Quantalytics Research, LLC, (a FinTech Investment | | |
| | | |
Research Platform for the Self-Directed Investor)

Trustees and Officers—(continued)
| | | Number of | |
| | | Funds | Other |
| Trustee | | in | Directorship(s) |
Name, Year of Birth and | and/or | | Fund Complex | Held by Trustee |
Position(s) | Officer | Principal Occupation(s) | Overseen by | During Past 5 |
Held with the Trust | Since | During Past 5 Years | Trustee | Years |
Independent Trustees—(continued) | | | |
Joel W. Motley – 1952 | 2019 | Director of Office of Finance, Federal Home Loan Bank System; Member of the | 229 | Member of Board |
Trustee | | Vestry of Trinity Wall Street; Managing Director of Carmona Motley Inc. | | of Greenwall |
| | (privately held financial advisor); Member of the Council on Foreign Relations | | Foundation |
| | and its Finance and Budget Committee; Chairman Emeritus of Board of Human | | (bioethics research |
| | Rights Watch and Member of its Investment Committee; and Member of | | foundation) and |
| | Investment Committee and Board of Historic Hudson Valley (non-profit cultural | | its Investment |
| | organization) | | Committee; |
| | Formerly: Managing Director of Public Capital Advisors, LLC (privately held | | Member of Board of |
| | | Friends of the LRC |
| | financial advisor); Managing Director of Carmona Motley Hoffman, Inc. | |
| | | (non-profit |
| | (privately held financial advisor); Trustee of certain Oppenheimer Funds; and | |
| | | legal advocacy); |
| | Director of Columbia Equity Financial Corp. (privately held financial advisor) | |
| | | Board Member |
| | | |
| | | | and Investment |
| | | | Committee |
| | | | Member of |
| | | | Pulizer Center for |
| | | | Crisis Reporting |
| | | | (non-profit |
| | | | journalism) |
Teresa M. Ressel — 1962 | 2017 | Non-executive director and trustee of a number of public and private business | 229 | Atlantic Power |
Trustee | | corporations | | Corporation |
| | Formerly: Chief Financial Officer, Olayan America, The Olayan Group | | (power generation |
| | | company); ON |
| | (international investor/commercial/industrial); Chief Executive Officer, UBS | |
| | | Semiconductor |
| | Securities LLC; Group Chief Operating Officer, Americas, UBS AG; Assistant | |
| | | Corp. |
| | Secretary for Management & Budget and CFO, US Department of the Treasury | |
| | | (semiconductor |
| | | |
| | | | supplier) |
| | | | |
Ann Barnett Stern – 1957 | 2017 | President and Chief Executive Officer, Houston Endowment Inc. (private | 229 | Federal Reserve |
Trustee | | philanthropic institution) | | Bank of Dallas |
| | Formerly: Executive Vice President and General Counsel, Texas Children's | | |
| | Hospital; Attorney, Beck, Redden and Secrest, LLP; Business Law Instructor, | | |
| | University of St. Thomas; Attorney, Andrews & Kurth LLP | | |
Robert C. Troccoli – 1949 | 2016 | Retired | 229 | None |
Trustee | | Formerly: Adjunct Professor, University of Denver – Daniels College of | | |
| | | |
| | Business; Senior Partner, KPMG LLP | | |
| | | | |
Daniel S. Vandivort –1954 | 2019 | Treasurer, Chairman of the Audit and Finance Committee, and Trustee, Board | 229 | Chairman and |
Trustee | | of Trustees, Huntington Disease Foundation of America; and President, Flyway | | Lead Independent |
| | Advisory Services LLC (consulting and property management) | | Director, |
| | Formerly: Trustee and Governance Chair, of certain Oppenheimer Funds | | Chairman of the |
| | | Audit Committee, |
| | | |
| | | | and Director, |
| | | | Board of |
| | | | Directors, Value |
| | | | Line Funds |
James D. Vaughn – 1945 | 2019 | Retired | 229 | Board member |
Trustee | | Formerly: Managing Partner, Deloitte & Touche LLP; Trustee and Chairman of | | and Chairman of |
| | | Audit Committee |
| | the Audit Committee, Schroder Funds; Board Member, Mile High United Way, | |
| | | of AMG National |
| | Boys and Girls Clubs, Boy Scouts, Colorado Business Committee for the Arts, | |
| | | Trust Bank; |
| | Economic Club of Colorado and Metro Denver Network (economic development | |
| | | Trustee and |
| | corporation); and Trustee of certain Oppenheimer Funds | |
| | | Investment |
| | | |
| | | | Committee |
| | | | member, |
| | | | University of |
| | | | South Dakota |
| | | | Foundation; |
| | | | Board member, |
| | | | Audit Committee |
| | | | Member and past |
| | | | Board Chair, |
| | | | Junior |
| | | | Achievement |
| | | | (non-profit) |
Christopher L. Wilson - | 2017 | Retired | 229 | ISO New |
1957 | | Formerly: Director, TD Asset Management USA Inc. (mutual fund complex) (22 | | England, Inc. |
Trustee, Vice Chair and Chair | | | (non-profit |
| portfolios); Managing Partner, CT2, LLC (investing and consulting firm); | |
Designate | | | organization |
| President/Chief Executive Officer, Columbia Funds, Bank of America | |
| | | |
| Corporation; President/Chief Executive Officer, CDC IXIS Asset Management | managing |
| regional electricity |
| Services, Inc.; Principal & Director of Operations, Scudder Funds, Scudder, |
| market) |
| Stevens & Clark, Inc.; Assistant Vice President, Fidelity Investments |
| |
Trustees and Officers—(continued)
| | | Number of | Other |
| Trustee | | Funds in | Directorship(s) |
Name, Year of Birth and | and/or | | Fund Complex | Held by Trustee |
Position(s) | Officer | Principal Occupation(s) | Overseen by | During Past 5 |
Held with the Trust | Since | During Past 5 Years | Trustee | Years |
Officers | | | | |
Sheri Morris — 1964 | 1999 | Head of Global Fund Services, Invesco Ltd.; President, Principal Executive | N/A | N/A |
President, Principal Executive | | Officer and Treasurer, The Invesco Funds; Vice President, Invesco Advisers, | | |
Officer and Treasurer | | Inc. (formerly known as Invesco Institutional (N.A.), Inc.) (registered | | |
| | investment adviser); and Vice President, Invesco Exchange-Traded Fund Trust, | | |
| | Invesco Exchange-Traded Fund Trust II, Invesco India Exchange-Traded Fund | | |
| | Trust, Invesco Actively Managed Exchange-Traded Fund Trust, Invesco Actively | | |
| | Managed Exchange-Traded Commodity Fund Trust and Invesco | | |
| | Exchange-Traded Self-Indexed Fund Trust; and Vice President, | | |
| | OppenheimerFunds, Inc. | | |
| | Formerly: Vice President and Principal Financial Officer, The Invesco Funds; | | |
| | Vice President, Invesco AIM Advisers, Inc., Invesco AIM Capital Management, | | |
| | Inc. and Invesco AIM Private Asset Management, Inc.; Assistant Vice President | | |
| | and Assistant Treasurer, The Invesco Funds and Assistant Vice President, | | |
| | Invesco Advisers, Inc., Invesco AIM Capital Management, Inc. and Invesco AIM | | |
| | Private Asset Management, Inc.; and Treasurer, Invesco Exchange-Traded | | |
| | Fund Trust, Invesco Exchange-Traded Fund Trust II, Invesco India | | |
| | Exchange-Traded Fund Trust and Invesco Actively Managed Exchange-Traded | | |
| | Fund Trust | | |
Russell C. Burk — 1958 | 2005 | Senior Vice President and Senior Officer, The Invesco Funds | N/A | N/A |
Senior Vice President and Senior | | | | |
Officer | | | | |
Jeffrey H. Kupor – 1968 | 2018 | Head of Legal of the Americas, Invesco Ltd.; Senior Vice President and | N/A | N/A |
Senior Vice President, Chief Legal | | Secretary, Invesco Advisers, Inc. (formerly known as Invesco Institutional | | |
Officer and Secretary | | (N.A.), Inc.) (registered investment adviser); Senior Vice President and | | |
| | Secretary, Invesco Distributors, Inc. (formerly known as Invesco AIM | | |
| | Distributors, Inc.); Vice President and Secretary, Invesco Investment Services, | | |
| | Inc. (formerly known as Invesco AIM Investment Services, Inc.) Senior Vice | | |
| | President, Chief Legal Officer and Secretary, The Invesco Funds; Secretary and | | |
| | General Counsel, Invesco Investment Advisers LLC (formerly known as Van | | |
| | Kampen Asset Management); Secretary and General Counsel, Invesco Capital | | |
| | Markets, Inc. (formerly known as Van Kampen Funds Inc.) and Chief Legal | | |
| | Officer, Invesco Exchange-Traded Fund Trust, Invesco Exchange-Traded Fund | | |
| | Trust II, Invesco India Exchange-Traded Fund Trust, Invesco Actively Managed | | |
| | Exchange-Traded Fund Trust, Invesco Actively Managed Exchange-Traded | | |
| | Commodity Fund Trust and Invesco Exchange-Traded Self-Indexed Fund Trust; | | |
| | Secretary, Invesco Indexing LLC; Secretary, W.L. Ross & Co., LLC | | |
| | Formerly: Secretary and Vice President, Jemstep, Inc.; Head of Legal, | | |
| | Worldwide Institutional, Invesco Ltd.; Secretary and General Counsel, INVESCO | | |
| | Private Capital Investments, Inc.; Senior Vice President, Secretary and General | | |
| | Counsel, Invesco Management Group, Inc. (formerly known as Invesco AIM | | |
| | Management Group, Inc.); Assistant Secretary, INVESCO Asset Management | | |
| | (Bermuda) Ltd.; Secretary and General Counsel, Invesco Private Capital, Inc.; | | |
| | Assistant Secretary and General Counsel, INVESCO Realty, Inc.; Secretary and | | |
| | General Counsel, Invesco Senior Secured Management, Inc.; and Secretary, | | |
| | Sovereign G./P. Holdings Inc. | | |
Andrew R. Schlossberg – 1974 | 2019 | Head of the Americas and Senior Managing Director, Invesco Ltd.; Director and | N/A | N/A |
Senior Vice President | | Senior Vice President, Invesco Advisers, Inc. (formerly known as Invesco | | |
| | Institutional (N.A.), Inc.) (registered investment adviser); Director and | | |
| | Chairman, Invesco Investment Services, Inc. (formerly known as Invesco AIM | | |
| | Investment Services, Inc.) (registered transfer agent); Senior Vice President, | | |
| | The Invesco Funds; Director, Invesco Investment Advisers LLC (formerly known | | |
| | as Van Kampen Asset Management); Director, President and Chairman, Invesco | | |
| | Insurance Agency, Inc. | | |
| | Formerly: Director, Invesco UK Limited; Director and Chief Executive, Invesco | | |
| | Asset Management Limited and Invesco Fund Managers Limited; Assistant Vice | | |
| | President, The Invesco Funds; Senior Vice President, Invesco Advisers, Inc. | | |
| | (formerly known as Invesco Institutional (N.A.), Inc.) (registered investment | | |
| | adviser); Director and Chief Executive, Invesco Administration Services Limited | | |
| | and Invesco Global Investment Funds Limited; Director, Invesco Distributors, | | |
| | Inc.; Head of EMEA, Invesco Ltd.; President, Invesco Actively Managed | | |
| | Exchange-Traded Commodity Fund Trust, Invesco Actively Managed | | |
| | Exchange-Traded Fund Trust, Invesco Exchange-Traded Fund Trust, Invesco | | |
| | Exchange-Traded Fund Trust II and Invesco India Exchange-Traded Fund Trust; | | |
| | Managing Director and Principal Executive Officer, Invesco Capital | | |
| | Management LLC | | |
Trustees and Officers—(continued)
| | | Number of | Other |
| Trustee | | Funds in | Directorship(s) |
Name, Year of Birth and | and/or | | Fund Complex | Held by Trustee |
Position(s) | Officer | Principal Occupation(s) | Overseen by | During Past 5 |
Held with the Trust | Since | During Past 5 Years | Trustee | Years |
Officers—(continued) | | | | |
John M. Zerr — 1962 | 2006 | Chief Operating Officer of the Americas; Senior Vice President, Invesco | N/A | N/A |
Senior Vice President | | Advisers, Inc. (formerly known as Invesco Institutional (N.A.), Inc.) (registered | | |
| | investment adviser); Senior Vice President, Invesco Distributors, Inc. (formerly | | |
| | known as Invesco AIM Distributors, Inc.); Director and Vice President, Invesco | | |
| | Investment Services, Inc. (formerly known as Invesco AIM Investment | | |
| | Services, Inc.) Senior Vice President, The Invesco Funds; Managing Director, | | |
| | Invesco Capital Management LLC; Director, Invesco Investment Advisers LLC | | |
| | (formerly known as Van Kampen Asset Management); Senior Vice President, | | |
| | Invesco Capital Markets, Inc. (formerly known as Van Kampen Funds Inc.); | | |
| | Manager, Invesco Indexing LLC; Manager, Invesco Specialized Products, LLC; | | |
| | Director and Senior Vice President, Invesco Insurance Agency, Inc.; Member, | | |
| | Invesco Canada Funds Advisory Board; Director, President and Chief Executive | | |
| | Officer, Invesco Corporate Class Inc. (corporate mutual fund company); and | | |
| | Director, Chairman, President and Chief Executive Officer, Invesco Canada Ltd. | | |
| | (formerly known as Invesco Trimark Ltd./Invesco Trimark Ltèe) (registered | | |
| | investment adviser and registered transfer agent); President, Invesco, Inc. | | |
| | Formerly: Director and Senior Vice President, Invesco Management Group, Inc. | | |
| | (formerly known as Invesco AIM Management Group, Inc.); Secretary and | | |
| | General Counsel, Invesco Management Group, Inc. (formerly known as Invesco | | |
| | AIM Management Group, Inc.); Secretary, Invesco Investment Services, Inc. | | |
| | (formerly known as Invesco AIM Investment Services, Inc.); Chief Legal Officer | | |
| | and Secretary, The Invesco Funds; Secretary and General Counsel, Invesco | | |
| | Investment Advisers LLC (formerly known as Van Kampen Asset Management); | | |
| | Secretary and General Counsel, Invesco Capital Markets, Inc. (formerly known | | |
| | as Van Kampen Funds Inc.); Chief Legal Officer, Invesco Exchange-Traded Fund | | |
| | Trust, Invesco Exchange-Traded Fund Trust II, Invesco India Exchange-Traded | | |
| | Fund Trust, Invesco Actively Managed Exchange-Traded Fund Trust, Invesco | | |
| | Actively Managed Exchange-Traded Commodity Fund Trust and Invesco | | |
| | Exchange-Traded Self-Indexed Fund Trust; Secretary, Invesco Indexing LLC; | | |
| | Director, Secretary, General Counsel and Senior Vice President, Van Kampen | | |
| | Exchange Corp.; Director, Vice President and Secretary, IVZ Distributors, Inc. | | |
| | (formerly known as INVESCO Distributors, Inc.); Director and Vice President, | | |
| | INVESCO Funds Group, Inc.; Director and Vice President, Van Kampen | | |
| | Advisors Inc.; Director, Vice President, Secretary and General Counsel, Van | | |
| | Kampen Investor Services Inc.;Director and Secretary, Invesco Distributors, | | |
| | Inc. (formerly known as Invesco AIM Distributors, Inc.); Director, Senior Vice | | |
| | President, General Counsel and Secretary, Invesco AIM Advisers, Inc. and Van | | |
| | Kampen Investments Inc.; Director, Vice President and Secretary, Fund | | |
| | Management Company; Director, Senior Vice President, Secretary, General | | |
| | Counsel and Vice President, Invesco AIM Capital Management, Inc.; Chief | | |
| | Operating Officer and General Counsel, Liberty Ridge Capital, Inc. (an | | |
| | investment adviser) | | |
Gregory G. McGreevey - 1962 | 2012 | Senior Managing Director, Invesco Ltd.; Director, Chairman, President, and | N/A | N/A |
Senior Vice President | | Chief Executive Officer, Invesco Advisers, Inc. (formerly known as Invesco | | |
| | Institutional (N.A.), Inc.) (registered investment adviser); Director, Invesco | | |
| | Mortgage Capital, Inc. and Invesco Senior Secured Management, Inc.; and | | |
| | Senior Vice President, The Invesco Funds; and President, SNW Asset | | |
| | Management Corporation and Invesco Managed Accounts, LLC | | |
| | Formerly: Senior Vice President, Invesco Management Group, Inc. and Invesco | | |
| | Advisers, Inc.; Assistant Vice President, The Invesco Funds | | |
Kelli Gallegos – 1970 | 2008 | Principal Financial and Accounting Officer – Investments Pool, Invesco | N/A | N/A |
Vice President, Principal Financial | | Specialized Products, LLC; Vice President, Principal Financial Officer and | | |
Officer and Assistant Treasurer | | Assistant Treasurer, The Invesco Funds; Principal Financial and Accounting | | |
| | Officer – Pooled Investments, Invesco Capital Management LLC; Vice President | | |
| | and Treasurer, Invesco Exchange-Traded Fund Trust, Invesco Exchange-Traded | | |
| | Fund Trust II, Invesco India Exchange-Traded Fund Trust, Invesco Actively | | |
| | Managed Exchange-Traded Fund Trust, Invesco Actively Managed | | |
| | Exchange-Traded Commodity Fund Trust and Invesco Exchange-Traded | | |
| | Self-Indexed Fund Trust; Vice President, Invesco Advisers, Inc. | | |
| | Formerly: Assistant Treasurer, Invesco Specialized Products, LLC; Assistant | | |
| | Treasurer, Invesco Exchange-Traded Fund Trust, Invesco Exchange-Traded | | |
| | Fund Trust II, Invesco India Exchange-Traded Fund Trust, Invesco Actively | | |
| | Managed Exchange-Traded Fund Trust, Invesco Actively Managed | | |
| | Exchange-Traded Commodity Fund Trust and Invesco Exchange-Traded | | |
| | Self-Indexed Fund Trust; Assistant Treasurer, Invesco Capital | | |
| | Management LLC; Assistant Vice President, The Invesco Funds | | |
Crissie M. Wisdom – 1969 | 2013 | Anti-Money Laundering and OFAC Compliance Officer for Invesco U.S. entities | N/A | N/A |
Anti-Money Laundering | | including: Invesco Advisers, Inc. and its affiliates, Invesco Capital Markets, | | |
Compliance Officer | | Inc., Invesco Distributors, Inc., Invesco Investment Services, Inc., The Invesco | | |
| | Funds, Invesco Capital Management, LLC, Invesco Trust Company; | | |
| | OppenheimerFunds Distributor, Inc., and Fraud Prevention Manager for | | |
| | Invesco Investment Services, Inc. | | |
Trustees and Officers—(continued)
| | | Number of | Other |
| Trustee | | Funds in | Directorship(s) |
Name, Year of Birth and | and/or | | Fund Complex | Held by Trustee |
Position(s) | Officer | Principal Occupation(s) | Overseen by | During Past 5 |
Held with the Trust | Since | During Past 5 Years | Trustee | Years |
Officers—(continued) | | | | |
Robert R. Leveille – 1969 | 2016 | Chief Compliance Officer, Invesco Advisers, Inc. (registered investment | N/A | N/A |
Chief Compliance Officer | | adviser); and Chief Compliance Officer, The Invesco Funds | | |
| | Formerly: Chief Compliance Officer, Putnam Investments and the Putnam | | |
| | Funds | | |
The Statement of Additional Information of the Trust includes additional information about the Fund's Trustees and is available upon request, without charge, by calling 1.800.959.4246. Please refer to the Fund's Statement of Additional Information for information on the Fund's sub-advisers.
Office of the Fund | Investment Adviser | Distributor | Auditors |
11 Greenway Plaza, Suite 1000 | Invesco Advisers, Inc. | Invesco Distributors, Inc. | PricewaterhouseCoopers LLP |
Houston, TX 77046-1173 | 1555 Peachtree Street, N.E. | 11 Greenway Plaza, Suite 1000 | 1000 Louisiana Street, Suite 5800 |
| Atlanta, GA 30309 | Houston, TX 77046-1173 | Houston, TX 77002-5678 |
Counsel to the Fund | Counsel to the Independent Trustees | Transfer Agent | Custodian |
Stradley Ronon Stevens & Young, LLP | Goodwin Procter LLP | Invesco Investment Services, Inc. | State Street Bank and Trust Company |
2005 Market Street, Suite 2600 | 901 New York Avenue, N.W. | 11 Greenway Plaza, Suite 1000 | 225 Franklin Street |
Philadelphia, PA 19103-7018 | Washington, D.C. 20001 | Houston, TX 77046-1173 | Boston, MA 02110-2801 |
(This page intentionally left blank)
(This page intentionally left blank)

Go paperless with eDelivery
Visit invesco.com/edelivery to enjoy the convenience and security of anytime electronic access to your investment documents.
With eDelivery, you can elect to have any or all of the following materials delivered straight to your inbox to download, save and print from your own computer:
•Fund reports and prospectuses
•Quarterly statements
•Daily confirmations
•Tax forms
Invesco mailing information
Send general correspondence to Invesco Investment Services, Inc., P.O. Box 219078, Kansas City, MO 64121-9078.
Important notice regarding delivery of security holder documents
To reduce Fund expenses, only one copy of most shareholder documents may be mailed to shareholders with multiple accounts at the same address (Householding). Mailing of your shareholder documents may be householded indefinitely unless you instruct us otherwise. If you do not want the mailing of these documents to be combined with those for other members of your household, please contact Invesco Investment Services, Inc. at 800 959 4246 or contact your financial institution. We will begin sending you individual copies for each account within 30 days after receiving your request.
Fund holdings and proxy voting information
The Fund provides a complete list of its holdings four times in each fiscal year, at the quarter-ends. For the second and fourth quarters, the list appears in the Fund's semiannual and annual reports to shareholders. For the first and third quarters, the Fund files the lists with the Securities and Exchange Commission (SEC) as an exhibit to its reports on Form N-PORT. The most recent list of portfolio holdings is available at invesco.com/completeqtrholdings. Shareholders can also look up the Fund's Form N-PORT filings on the SEC website, sec.gov. The SEC file numbers for the Fund are shown below.
A description of the policies and procedures that the Fund uses to determine how to vote proxies relating to portfolio secu- rities is available without charge, upon request, from our Client Services department at 800 959 4246, or at invesco.com/ proxyguidelines. The information is also available on the SEC website, sec.gov.
Information regarding how the Fund voted proxies related to its portfolio securities during the most
recent 12-month period ended June 30 is available at invesco.com/proxysearch. This information is also available on the SEC website, sec.gov.
Invesco Advisers, Inc. is an investment adviser; it provides investment advisory services to individual and institutional clients and does not sell securities. Invesco Distributors, Inc. is the US distributor for Invesco Ltd.'s retail mutual funds, exchange-traded funds and institutional money market funds. Both are wholly owned, indirect subsidiaries of Invesco Ltd.
SEC file numbers: 811-05686 and 033-39519 | Invesco Distributors, Inc. | INC-AR-1 |
Annual Report to Shareholders | February 29, 2020 |
Invesco Real Estate Fund
Nasdaq:
A: IARAX C: IARCX R: IARRX Y: IARYX Investor: REINX R5: IARIX R6: IARFX
Beginning on January 1, 2021, as permitted by regulations adopted by the Securities and Exchange Commission, paper copies of the Fund's shareholder reports will no longer be sent by mail, unless you specifically request paper copies of the reports from the Fund or from your financial intermediary, such as a broker-dealer or bank. Instead, the reports will be made available on the Fund's web- site, and you will be notified by mail each time a report is posted and provided with a website link to access the report.
If you already elected to receive shareholder reports electronically, you will not be affected by this change and you need not take any action. You may elect to receive shareholder reports and other communications from the Fund electronically by contacting your financial intermediary (such as a broker-dealer or bank) or, if you are a direct investor, by enrolling at invesco.com/edelivery.
You may elect to receive all future reports in paper free of charge. If you invest through a financial intermediary, you can contact your financial intermediary to request that you continue to receive paper copies of your shareholder reports. If you invest directly with the Fund, you can call (800) 959-4246 to let the Fund know you wish to continue receiving paper copies of your shareholder reports. Your election to receive reports in paper will apply to all funds held with your financial intermediary or all funds held with the fund complex if you invest directly with the Fund.
Andrew Schlossberg
Letters to Shareholders
Dear Shareholders:
This annual report includes information about your Fund, including performance data and a complete list of its investments as of the close of the reporting period. Inside is a discussion of how your Fund was managed and the factors that affected its performance during the reporting period.
The reporting period proved to be another tumultuous time for both global equities and fixed-income secu- rities. In early 2019, global equity markets were buoyed by a more accommodative stance from central banks and optimism about a potential US-China trade deal. In May, US-China trade concerns and slowing global growth led to a global equity sell-off and rally in US Treasuries. Despite the May sell-off, domestic equity mar- kets rallied in June in anticipation of a US Federal Reserve (the Fed) interest rate cut and closed the second quarter with modest gains. Continued US-China trade worries and signs of slowing global economic growth led to increased market volatility in August. The US Treasury yield curve inverted several times as fears of a US recession increased. As a result, global equity markets were largely flat for the third quarter. In the final
months of 2019, geopolitical and macroeconomic issues largely abated. This combined with better-than-expected third quarter corporate earnings and initial agreement of the phase one US-China trade deal provided a favorable backdrop for equities and impressive fourth quar- ter global equity returns.
As the new year began, US equities were largely buoyed in January by the signing of the phase one trade agreement and strong eco- nomic data although returns were dampened by the spread of the Coronavirus (COVID-19). Concerns over the virus had a greater impact on international equities, which were largely lower for the month. As the virus spread outside of China and the number of cases increased, fears of diminished global growth led to a sharp global equity sell-off at the end of February 2020 and sent the yield on the US 10-year Treasury to a new all-time low.
Throughout 2019, central banks continued to be accommodative, providing sources of liquidity. In July, the Fed lowered interest rates for the first time in 11 years. It again lowered rates in September and once again in October. During the rest of the year, the Fed left rates unchanged. Overseas, the European Central Bank left its policy rate unchanged and continued its bond purchasing program. In 2020, with the increased spread of the coronavirus, the Fed shifted from a more neutral policy to the possibility of further rate cuts in the new year. As 2020 unfolds, we'll see how the interplay of interest rates, economic data, geopolitics and a host of other factors affect US and overseas equity and fixed income markets.
Investor uncertainty and market volatility, such as we witnessed during the reporting period, are unfortunate facts of life when it comes to investing. That's why Invesco encourages investors to work with a professional financial adviser who can stress the importance of starting to save and invest early and the importance of adhering to a disciplined investment plan. A financial adviser who knows your unique finan- cial situation, investment goals and risk tolerance can be an invaluable partner as you seek to achieve your financial goals. Financial advis- ers can also offer a long-term perspective when markets are volatile and time-tested advice and guidance when your financial situation or investment goals change.
Visit our website for more information on your investments
Our website, invesco.com/us, offers a wide range of market insights and investment perspectives. On the website, you'll find detailed infor- mation about our funds, including performance, holdings and portfolio manager commentaries. You can access information about your account by completing a simple, secure online registration. To do so, select "Log In" on the right side of the homepage, and then select "Register for Individual Account Access."
In addition to the resources accessible on our website and through our mobile app, you can obtain timely updates to help you stay informed about the markets and the economy by connecting with Invesco on Twitter, LinkedIn or Facebook. You can access our blog at blog.invesco.us.com. Our goal is to provide you the information you want, when and where you want it.
Finally, I'm pleased to share with you Invesco's commitment to both the Principles for Responsible Investment and to considering environ- mental, social and governance issues in our robust investment process. I invite you to learn more at invesco.com/esg.
Have questions?
For questions about your account, contact an Invesco client services representative at 800 959 4246.
All of us at Invesco look forward to serving your investment management needs. Thank you for investing with us.
Sincerely,
Andrew Schlossberg
Head of the Americas,
Senior Managing Director, Invesco Ltd.
2Invesco Real Estate Fund
Bruce Crockett
Dear Shareholders:
Among the many important lessons I've learned in more than 40 years in a variety of business endeavors is the value of a trusted advocate.
As independent chair of the Invesco Funds Board, I can assure you that the members of the Board are strong advocates for the interests of investors in Invesco's mutual funds. We work hard to represent your interests through oversight of the quality of the investment management services your funds receive and other matters important to your investment, including but not limited to:
Ensuring that Invesco offers a diverse lineup of mutual funds that your financial adviser can use to strive to meet your financial needs as your investment goals change over time.
Monitoring how the portfolio management teams of the Invesco funds are performing in light of changing economic and market conditions.
Assessing each portfolio management team's investment performance within the context of the investment strategy described in the fund's prospectus.
Monitoring for potential conflicts of interests that may impact the nature of the services that your funds receive.
We believe one of the most important services we provide our fund shareholders is the annual review of the funds' advisory and sub-
advisory contracts with Invesco Advisers and its affiliates. This review is required by the Investment Company Act of 1940 and focuses on the nature and quality of the services Invesco provides as the adviser to the Invesco funds and the reasonableness of the fees that it charges for those services. Each year, we spend months carefully reviewing information received from Invesco and a variety of independent sources, such as performance and fee data prepared by Lipper, Inc. (a subsidiary of Broadridge Financial Solutions, Inc.), an independent, third-party firm widely recognized as a leader in its field. We also meet with our independent legal counsel and other independent advisers to review and help us assess the information that we have received. Our goal is to assure that you receive quality investment management services for a reasonable fee.
I trust the measures outlined above provide assurance that you have a worthy advocate when it comes to choosing the Invesco Funds. On behalf of the Board, we look forward to continuing to represent your interests and serving your needs.
Sincerely,
Bruce L. Crockett
Independent Chair
Invesco Funds Board of Trustees
3Invesco Real Estate Fund

Management's Discussion of Fund Performance
Performance summary
For the fiscal year ended February 29, 2020, Class A shares of Invesco Real Estate Fund (the Fund), at net asset value (NAV), outperformed the Fund's style-specific benchmark, the FTSE Nareit All Equity REITs Index.
Your Fund's long-term performance appears later in this report.
Fund vs. Indexes
Total returns, 2/28/19 to 2/29/20, at net asset value (NAV). Performance shown does not include applicable contingent deferred sales charges (CDSC) or front-end sales charges, which would have reduced performance.
Class A Shares | 8.11% |
Class C Shares | 7.25 |
Class R Shares | 7.78 |
Class Y Shares | 8.33 |
Investor Class Shares | 8.06 |
Class R5 Shares | 8.47 |
Class R6 Shares | 8.60 |
S&P 500 Index (Broad Market Index) | 8.19 |
FTSE Nareit All Equity REITs Index (Style-Specific Index) | 7.98 |
Lipper Real Estate Funds Index (Peer Group) | 6.77 |
Source(s): RIMES Technologies Corp.; Lipper Inc.
now speculate that key central banks will in- troduce further stimulus to support economic confidence and boost markets. Listed real estate companies are mid-way through re- porting year-end financial results. There have been few surprises so far. Retail has been weak, with declines in asset values and some emerging re-purposing strategies to meet the challenges of excess mall capacity. Elsewhere, across most property types, results have been positive, showing asset value and earn- ings growth. Management teams continue to show cautious optimism, with a willingness to continue to acquire and develop assets. Per- formance dispersion among REIT sectors was wide over the fiscal year. Lodging and retail focused REITs showed the greatest weakness. Top-performing sectors included the high growth data center and infrastructure sec- tors, as well as manufactured housing and single-family housing.
During the fiscal year, the Fund's over- weight exposure to infrastructure, manufac- tured housing and single family homes con- tributed to performance relative to its style-
Market conditions and your Fund
At the close of the fiscal year, equity markets reacted strongly to the prospect of dimin- ished global growth as a result of the impact of the Coronavirus (COVID-19). At the close of the fiscal year, global GDP growth esti- mates for 2020 were cut, as economic growth around the world is expected to be materially impacted by the virus outbreak. US Treasury yields fell amid risk aversion and in anticipation of future interest rate cuts from key central banks, including the US Federal Reserve. Completion of phase one of a trade deal between China and the US had previ- ously offered some positive news to capital markets following much uncertainty during 2019. Negotiations on future trade terms will likely continue. The fiscal year ended with US consumer confidence rising for four consecu-
Portfolio Composition
By property type | % of total net assets |
Infrastructure REITs | 18.56% |
Health Care | | 9.95 |
Office | | 9.69 |
Industrial | | 8.14 |
Single Family Homes | | 7.57 |
Diversified | | 7.54 |
Apartments | | 7.27 |
Data Centers | | 7.02 |
Manufactured Homes | | 4.10 |
Regional Malls | | 3.75 |
Specialty | | 3.21 |
Lodging Resorts | | 2.90 |
Self Storage | | 2.62 |
Free Standing | | 2.53 |
Timber REITs | | 2.39 |
Shopping Centers | | 1.85 |
Money Market Funds Plus Other | |
Assets Less Liabilities | | 0.91 |
tive months and was accompanied by in- creases in housing starts and non-farm pay- rolls. However, areas of caution remain in the US, as industrial production and retail sales reported slight declines. The magnitude and duration of the impact of the coronavirus is still far from clear, with weakness expected to be evident in second quarter 2020 economic data and corporate earnings.
US Real Estate Investment Trusts (REITs) offered positive absolute performance over the fiscal year driven by a combination of supportive fundamental and macro-related factors. US REITs generally outperformed other risk assets through the late period mar- ket sell-off, reflecting underlying income secu- rity, as markets tended to reward predictable growth and well-covered dividends during a period of falling bond yields and slowing global growth. We believe the market may
Top 10 Equity Holdings*
% of total net assets
1. | American Tower Corp. | 8.67% |
2. | Crown Castle International | |
| Corp. | 6.33 |
3. | Boston Properties, Inc. | 5.34 |
4. | AvalonBay Communities, Inc. | 4.40 |
5. | Equinix, Inc. | 3.82 |
6. | SBA Communications Corp., | |
| Class A | 3.56 |
7. | VEREIT, Inc. | 3.30 |
8. | Ventas, Inc. | 3.26 |
9. | UDR, Inc. | 3.26 |
10. | Healthpeak Properties, Inc. | 2.94 |
specific index, as did an underweight allocation to regional malls and security selec- tion in apartments. Conversely, relative de- tractors included security selection in health care and regional malls and an allocation to cash. Although the portfolio held a small amount of ancillary cash, it detracted as mar- kets gained through much of the fiscal year.
Top individual absolute contributors to the Fund's performance during the fiscal year included infrastructure REITs, American Tower and Crown Castle International. American Tower is expected to see an accel- eration in cash flow growth in 2020 as under- lying demand characteristics remain quite strong. Crown Castle has been building out small cell nodes for 5G deployment and is ex- periencing tailwinds from current 4G demand,
The Fund's holdings are subject to change, and there is no assurance that the Fund will continue to hold any particular security.
*Excluding money market fund holdings, if any.
Data presented here are as of February 29, 2020.
4Invesco Real Estate Fund

with future demand potential from 5Gexpan- sion. Carrier spending remains robust domes- tically and international trends are expected to improve. The portfolio is overweight the infrastructure sector, which is primarily com- prised of cell tower REITs.
Top individual absolute detractors from Fund performance during the fiscal year in- cluded two positions in the challenged retail sector, Simon Property Group and Macerich. Simon Property Group is the largest mall owner in the US. The company has a strong management team and a track record of pre- dictable cash flow growth, strong asset alloca- tion and attractive reinvestment returns. Macerich is a regional mall operator that owns high quality properties in the US. The company offered a discounted valuation and the prospect of stabilized operating results.
Relative to its style-specific benchmark, at the end of the fiscal year, the Fund was over- weight the residential, infrastructure, office and specialty REIT sectors. Conversely, the Fund was underweight the retail, self-storage and industrial REIT sectors. Positioning is fo- cused on sectors and market exposures that support rental growth, as well as companies that can generate growth from attractive capital deployment opportunities.
At the end of the fiscal year, real estate continued to offer investors tangible asset exposure, with rents that can adjust upwards (or downwards) over time with economic strength and inflation. Listed real estate com- panies were generally maintaining financial discipline. Falling credit costs were improving cash flows modestly, and absolute levels of debt remained in check. Many companies had the ability to utilize attractively priced new equity and debt to complete accretive acquisi- tions and enhance their growth rate. While recognizing the need to maintain attractive yield characteristics in an income starved world, our overall portfolio maintains a bias toward companies with higher quality assets, supply constrained real estate market expo- sure, generally lower leveraged balance sheets and most importantly, above average earnings and asset value growth.
We thank you for your continued invest- ment in Invesco Real Estate Fund.
Portfolio managers:
Mark Blackburn
James Cowen
Paul Curbo - Lead
Grant Jackson - Lead
Joe Rodriguez, Jr. - Lead
Darin Turner
Ping-Ying Wang
The views and opinions expressed in management's discussion of Fund performance are those of Invesco Advisers, Inc. These views and opinions are subject to change at any time based on factors such as market and economic conditions. These views and opinions may not be relied upon as investment advice or recommendations, or as an offer for a particular security. The information is not a complete analysis of every aspect of any
market, country, industry, security or the Fund. Statements of fact are from sources considered reliable, but Invesco Advisers, Inc. makes no representation or warranty as to their completeness or accuracy. Although historical performance is no guarantee of future results, these insights may help you understand our investment management philosophy.
See important Fund and, if applicable, index disclosures later in this report.
5Invesco Real Estate Fund
Your Fund's Long-Term Performance
Results of a $10,000 Investment — Oldest Share Class(es)
Fund and index data from 2/28/10
$40,000
35,000 | | |
| $32,918 | S&P 500 Index1 |
30,000 | $30,860 | FTSE Nareit All Equity REITs Index1 |
| $27,691 Lipper Real Estate Funds Index2 |
25,000 | $24,963 | Invesco Real Estate Fund — Class C Shares |
20,000 | | |
15,000
10,000
5,000
2/28/10 | 2/11 | 2/12 | 2/13 | 2/14 | 2/15 | 2/16 | 2/17 | 2/18 | 2/19 | 2/20 |
1Source: RIMES Technologies Corp.
2 Source: Lipper Inc.
Past performance cannot guarantee future results.
The data shown in the chart include rein- vested distributions, applicable sales charges and Fund expenses including management
fees. Index results include reinvested divi- dends, but they do not reflect sales charges. Performance of the peer group, if applicable, reflects fund expenses and management fees;
performance of a market index does not. Per- formance shown in the chart does not reflect deduction of taxes a shareholder would pay on Fund distributions or sale of Fund shares.
6Invesco Real Estate Fund

Average Annual Total Returns
As of 2/29/20, including maximum applicable sales charges
Class A Shares
Inception (12/31/96) | 8.94% |
10 Years | 9.79 |
5 | Years | 4.22 |
1 | Year | 2.16 |
Class C Shares | |
Inception (5/1/95) | 10.06% |
10 Years | 9.58 |
5 | Years | 4.60 |
1 | Year | 6.26 |
Class R Shares | |
Inception (4/30/04) | 9.00% |
10 Years | 10.13 |
5 | Years | 5.13 |
1 | Year | 7.78 |
Class Y Shares | |
Inception (10/3/08) | 8.67% |
10 Years | 10.69 |
5 | Years | 5.66 |
1 | Year | 8.33 |
Investor Class Shares | |
Inception (9/30/03) | 9.43% |
10 Years | 10.41 |
5 | Years | 5.41 |
1 | Year | 8.06 |
Class R5 Shares | |
Inception (4/30/04) | 9.72% |
10 Years | 10.84 |
5 | Years | 5.79 |
1 | Year | 8.47 |
Class R6 Shares | |
10 Years | 10.79% |
5 | Years | 5.89 |
1 | Year | 8.60 |
Class R6 shares incepted on September 24, 2012. Performance shown prior to that date is that of Class A shares and includes the 12b-1 fees applicable to Class A shares.
The performance data quoted represent past performance and cannot guarantee future results; current performance may be lower or higher. Please visit invesco.com/ performance for the most recent month- end performance. Performance figures re- flect reinvested distributions, changes in net asset value and the effect of the maxi- mum sales charge unless otherwise stated. Performance figures do not reflect deduc- tion of taxes a shareholder would pay on Fund distributions or sale of Fund shares. Investment return and principal value will fluctuate so that you may have a gain or loss when you sell shares.
Class A share performance reflects the maximum 5.50% sales charge, and Class C share performance reflects the applicable contingent deferred sales charge (CDSC)
for the period involved. The CDSC on
Class C shares is 1% for the first year after purchase. Class R, Class Y, Investor Class, Class R5 and Class R6 shares do not have a front-end sales charge or a CDSC; there- fore, performance is at net asset value.
The performance of the Fund's share classes will differ primarily due to different sales charge structures and class expenses. Fund performance reflects any applicable
fee waivers and/or expense reimburse- ments. Had the adviser not waived fees and/or reimbursed expenses currently or in the past, returns would have been lower. See current prospectus for more informa- tion.
7Invesco Real Estate Fund

Invesco Real Estate Fund's investment objective is total return through growth of capital and current income.
Unless otherwise stated, information presented in this report is as of February 29, 2020, and is based on total net assets.
Unless otherwise noted, all data provided by Invesco.
To access your Fund's reports/prospectus, visit invesco.com/fundreports.
About indexes used in this report
The S&P 500® Index is an unmanaged index considered representative of the US stock market.
The FTSE Nareit All Equity REITs Index is an unmanaged index considered repre- sentative of US REITs.
The Lipper Real Estate Funds Index is an unmanaged index considered representa- tive of real estate funds tracked by Lipper.
The Fund is not managed to track the per- formance of any particular index, including the index(es) described here, and conse- quently, the performance of the Fund may deviate significantly from the performance of the index(es).
A direct investment cannot be made in an index. Unless otherwise indicated, index results include reinvested dividends, and they do not reflect sales charges. Perfor- mance of the peer group, if applicable, reflects fund expenses; performance of a market index does not.
Other information
Property type classifications used in this report are generally according to the FTSE National Association of Real Estate Invest- ment Trusts Nareit) Equity All REITs Index, which is exclusively owned by Nareit.
This report must be accompanied or preceded by a currently effective Fund prospectus, which contains more complete information, including sales charges and expenses. Investors should read it carefully before investing.
NOT FDIC INSURED | MAY LOSE VALUE | NO BANK GUARANTEE
8Invesco Real Estate Fund

Schedule of Investments(a)
February 29, 2020
SharesValue
Common Stocks & Other Equity Interests–99.09%
Apartments–7.27% | | | |
AvalonBay Communities, | | | |
Inc. | 313,477 | $ | 62,880,351 |
Equity Residential | 253,897 | | 19,067,665 |
Essex Property Trust, Inc. | 4,444 | | 1,259,252 |
Mid-America Apartment | | | |
Communities, Inc. | 160,348 | | 20,726,582 |
| | | 103,933,850 |
Data Centers–7.02% | | | |
CyrusOne, Inc. | 280,652 | | 17,001,898 |
Digital Realty Trust, Inc. | 118,007 | | 14,173,821 |
Equinix, Inc. | 95,352 | | 54,617,626 |
QTS Realty Trust, Inc., | | | |
Class A | 257,662 | | 14,472,874 |
| | | 100,266,219 |
Diversified–7.54% | | | |
American Assets Trust, | | | |
Inc. | 210,858 | | 8,740,064 |
BGP Holdings PLC(b)(c)(d) | 3,547,941 | | 0 |
VEREIT, Inc. | 5,436,340 | | 47,078,705 |
VICI Properties, Inc. | 1,432,385 | | 35,895,568 |
Vornado Realty Trust | 299,242 | | 16,033,386 |
| | | 107,747,723 |
Free Standing–2.53% | | | |
Agree Realty Corp. | 295,623 | | 21,231,644 |
Essential Properties | | | |
Realty Trust, Inc. | 358,428 | | 8,211,585 |
Four Corners Property | | | |
Trust, Inc. | 189,584 | | 5,439,165 |
Realty Income Corp. | 18,190 | | 1,316,774 |
| | | 36,199,168 |
Health Care–9.95% | | | |
CareTrust REIT, Inc. | 560,669 | | 11,701,162 |
Healthpeak Properties, | | | |
Inc. | 1,329,059 | | 42,051,427 |
Medical Properties Trust, | | | |
Inc. | 692,842 | | 14,639,751 |
Omega Healthcare | | | |
Investors, Inc. | 471,912 | | 18,687,715 |
Ventas, Inc. | 866,596 | | 46,596,867 |
Welltower, Inc. | 113,095 | | 8,461,768 |
| | | 142,138,690 |
Industrial–8.14% | | | |
Americold Realty Trust | 577,676 | | 17,717,323 |
EastGroup Properties, | | | |
Inc. | 90,419 | | 11,368,381 |
Exeter Industrial Value | | | |
Fund L.P., (Acquired | | | |
11/06/2007-04/18/2011; | | | |
Cost $3,554,748)(b)(c)(d)(e) | 4,185,000 | | 263,538 |
Prologis, Inc. | 455,519 | | 38,391,141 |
Rexford Industrial Realty, | | | |
Inc. | 417,631 | | 19,532,602 |
STAG Industrial, Inc. | 590,037 | | 16,509,235 |
| Shares | Value |
Industrial–(continued) | | |
Terreno Realty Corp. | 228,543 | $ 12,540,155 |
| | 116,322,375 |
Infrastructure REITs–18.56% | | |
American Tower Corp. | 546,100 | 123,855,480 |
Crown Castle International Corp. | 631,442 | 90,479,324 |
SBA Communications Corp., Class A | 192,162 | 50,940,225 |
| | 265,275,029 |
Lodging Resorts–2.90% | | |
Park Hotels & Resorts, Inc. | 576,000 | 10,517,760 |
Pebblebrook Hotel Trust | 822,488 | 16,622,483 |
Sunstone Hotel Investors, Inc. | 1,303,292 | 14,271,047 |
| | 41,411,290 |
Manufactured Homes–4.10% | | |
Camden Property Trust | 252,448 | 26,754,439 |
Sun Communities, Inc. | 208,227 | 31,833,744 |
| | 58,588,183 |
Office–9.69% | | |
Alexandria Real Estate Equities, Inc. | 128,153 | 19,463,877 |
Boston Properties, Inc. | 591,770 | 76,302,824 |
Empire State Realty Trust, Inc., | | |
Class A | 131,617 | 1,539,919 |
Hudson Pacific Properties, Inc. | 1,162,421 | 37,522,950 |
Kilroy Realty Corp. | 49,281 | 3,582,236 |
| | 138,411,806 |
Regional Malls–3.75% | | |
Macerich Co. (The) | 628,469 | 12,833,337 |
Simon Property Group, Inc. | 331,624 | 40,816,282 |
| | 53,649,619 |
Self Storage–2.62% | | |
Extra Space Storage, Inc. | 70,314 | 7,056,713 |
Public Storage | 145,026 | 30,327,837 |
| | 37,384,550 |
Shopping Centers–1.85% | | |
Federal Realty Investment Trust | 137,048 | 15,944,165 |
Regency Centers Corp. | 33,262 | 1,910,569 |
Retail Opportunity Investments | | |
Corp. | 568,412 | 8,526,180 |
| | 26,380,914 |
Single Family Homes–7.57% | | |
American Homes 4 Rent, Class A | 873,745 | 22,621,258 |
Invitation Homes, Inc. | 1,359,076 | 38,991,890 |
UDR, Inc. | 1,035,173 | 46,562,082 |
| | 108,175,230 |
Specialty–3.21% | | |
EPR Properties | 279,576 | 16,562,082 |
Gaming and Leisure Properties, Inc. | 366,351 | 16,364,899 |
Lamar Advertising Co., Class A | 154,350 | 12,925,269 |
| | 45,852,250 |
See accompanying Notes to Financial Statements which are an integral part of the financial statements.
9Invesco Real Estate Fund
| Shares | | Value |
Timber REITs–2.39% | | | |
PotlatchDeltic Corp. | 87,368 | $ | 3,209,900 |
Rayonier, Inc. | 263,248 | | 6,983,970 |
Weyerhaeuser Co. | 923,813 | | 24,000,662 |
| | | 34,194,532 |
Total Common Stocks & Other Equity Interests | | |
(Cost $1,144,075,425) | | | 1,415,931,428 |
Money Market Funds–1.31%
Invesco Government & Agency | | |
Portfolio, Institutional Class, | | |
1.50%(f) | 6,694,798 | 6,694,798 |
Investment Abbreviations:
REIT – Real Estate Investment Trust
Notes to Schedule of Investments:
| | Shares | | Value |
| Money Market Funds–(continued) | | | |
Invesco Liquid Assets Portfolio, | | | | |
| Institutional Class, 1.64%(f) | 4,400,118 | $ | 4,402,318 | |
Invesco Treasury Portfolio, | | | | |
| Institutional Class, 1.48%(f) | 7,651,197 | | 7,651,197 | |
| Total Money Market Funds (Cost $18,747,702) | | 18,748,313 | |
TOTAL INVESTMENTS IN SECURITIES–100.40% | | | |
| (Cost $1,162,823,127) | | | 1,434,679,741 | |
OTHER ASSETS LESS LIABILITIES–(0.40)% | | | (5,702,129) |
NET ASSETS–100.00% | | $1,428,977,612 | |
(a)Property type classifications used in this report are generally according to FSTE National Association of Real Estate Investment Trusts ("NAREIT") Equity REITs Index, which is exclusively owned by NAREIT.
(b)Security purchased or received in a transaction exempt from registration under the Securities Act of 1933, as amended (the "1933 Act"). The security may be resold pursuant to an exemption from registration under the 1933 Act, typically to qualified institutional buyers. The aggregate value of these securities at February 29, 2020 was $263,538, which represented less than 1% of the Fund's Net Assets.
(c)Non-income producing security.
(d)Security valued using significant unobservable inputs (Level 3). See Note 3.
(e)The Fund has a remaining commitment to purchase additional interests, which are subject to the terms of the limited partnership agreements for the following securities:
| Remaining | Percent |
Security | Commitment | Ownership |
Exeter Industrial Value Fund L.P. | $315,000 | 1.26% |
| | |
(f)The money market fund and the Fund are affiliated by having the same investment adviser. The rate shown is the 7-day SEC standardized yield as of February 29, 2020.
See accompanying Notes to Financial Statements which are an integral part of the financial statements.
10 | Invesco Real Estate Fund |
Statement of Assets and Liabilities
February 29, 2020
Assets: | |
Investments in securities, at value | |
(Cost $1,144,075,425) | $1,415,931,428 |
Investments in affiliated money market funds, at value | |
(Cost $18,747,702) | 18,748,313 |
Foreign currencies, at value (Cost $223) | 201 |
Receivable for: | |
Investments sold | 72,269,881 |
Fund shares sold | 1,581,993 |
Dividends | 1,021,964 |
Investment for trustee deferred compensation and | |
retirement plans | 322,922 |
Other assets | 31,821 |
Total assets | 1,509,908,523 |
Liabilities: | |
Payable for: | |
Investments purchased | 71,385,629 |
Fund shares reacquired | 8,287,135 |
Accrued fees to affiliates | 794,462 |
Accrued trustees' and officers' fees and benefits | 4,311 |
Accrued other operating expenses | 103,207 |
Trustee deferred compensation and retirement plans | 356,167 |
Total liabilities | 80,930,911 |
Net assets applicable to shares outstanding | $1,428,977,612 |
Net assets consist of: | |
Shares of beneficial interest | $1,090,658,711 |
Distributable earnings | 338,318,901 |
| $1,428,977,612 |
Net Assets: | | |
Class A | $ | 627,197,019 |
Class C | $ | 27,928,410 |
Class R | $ | 60,629,638 |
Class Y | $ | 204,950,774 |
Investor Class | $ | 37,537,265 |
Class R5 | $ | 268,267,469 |
Class R6 | $ | 202,467,037 |
Shares outstanding, no par value, with an unlimited number of shares authorized:
Class A | | 30,273,091 |
Class C | | 1,358,264 |
Class R | | 2,922,636 |
Class Y | | 9,894,287 |
Investor Class | | 1,817,376 |
Class R5 | | 12,953,450 |
Class R6 | | 9,778,026 |
Class A: | | |
Net asset value per share | $ | 20.72 |
Maximum offering price per share | | |
(Net asset value of $20.72 ÷ 94.50%) | $ | 21.93 |
Class C: | | |
Net asset value and offering price per share | $ | 20.56 |
Class R: | | |
Net asset value and offering price per share | $ | 20.74 |
Class Y: | | |
Net asset value and offering price per share | $ | 20.71 |
Investor Class: | | |
Net asset value and offering price per share | $ | 20.65 |
Class R5: | | |
Net asset value and offering price per share | $ | 20.71 |
Class R6: | | |
Net asset value and offering price per share | $ | 20.71 |
See accompanying Notes to Financial Statements which are an integral part of the financial statements.
11 | Invesco Real Estate Fund |
Statement of Operations
For the year ended February 29, 2020
Investment income: | | | | |
Dividends | $ | 38,610,302 | |
Dividends from affiliated money market funds | | 410,735 | | |
Total investment income | | 39,021,037 | |
Expenses: | | | | |
Advisory fees | | 11,140,042 | |
Administrative services fees | | 217,045 | | |
Custodian fees | | 16,938 | | |
Distribution fees: | | | | |
Class A | | 1,703,656 | |
Class C | | 348,845 | | |
Class R | | 354,323 | | |
Investor Class | | 95,385 | | |
Transfer agent fees — A, C, R, Y and Investor | | 2,225,017 | |
Transfer agent fees — R5 | | 283,321 | | |
Transfer agent fees — R6 | | 33,449 | | |
Trustees' and officers' fees and benefits | | 38,132 | | |
Registration and filing fees | | 124,676 | | |
Reports to shareholders | | 103,846 | | |
Professional services fees | | 51,978 | | |
Other | | 29,687 | | |
Total expenses | | 16,766,340 | |
Less: Fees waived and/or expense offset arrangement(s) | | (32,699) |
Net expenses | | 16,733,641 | |
Net investment income | | 22,287,396 | |
Realized and unrealized gain (loss) from: | | | | |
Net realized gain from investment securities | | 154,774,685 | |
Change in net unrealized appreciation (depreciation) of: | | | | |
Investment securities | | (58,588,746) |
| | | |
Foreign currencies | | (12) |
| | | |
| | (58,588,758) |
Net realized and unrealized gain | | 96,185,927 | |
Net increase in net assets resulting from operations | $118,473,323 | |
See accompanying Notes to Financial Statements which are an integral part of the financial statements.
12 | Invesco Real Estate Fund |
Statement of Changes in Net Assets
For the years ended February 29, 2020 and February 28, 2019
| | 2020 | | 2019 | | |
Operations: | | | | | | |
Net investment income | $ | 22,287,396 | $ | 23,353,356 | |
Net realized gain | | 154,774,685 | | 75,802,591 | |
Change in net unrealized appreciation (depreciation) | | (58,588,758) | | 112,154,898 | |
Net increase in net assets resulting from operations | | 118,473,323 | | 211,310,845 | |
Distributions to shareholders from distributable earnings: | | | | | | |
Class A | | (56,826,231) | | (42,212,217) |
| | | | | |
Class C | | (2,461,328) | | (3,925,756) |
| | | | | |
Class R | | (5,707,071) | | (4,474,585) |
| | | | | |
Class Y | | (18,979,045) | | (12,761,563) |
| | | | | |
Investor Class | | (3,406,311) | | (2,096,895) |
| | | | | |
Class R5 | | (25,153,977) | | (18,064,948) |
| | | | | |
Class R6 | | (17,676,934) | | (10,546,805) |
| | | | | |
Total distributions from distributable earnings | | (130,210,897) | | (94,082,769) |
Share transactions–net: | | | | | | |
Class A | | (30,974,296) | | (54,230,870) |
| | | | | |
Class C | | (11,223,202) | | (43,568,230) |
| | | | | |
Class R | | (8,276,671) | | (11,593,453) |
| | | | | |
Class Y | | 18,547,348 | | (17,239,710) |
| | | | | |
Investor Class | | 5,637,507 | | (3,084,456) |
| | | | | |
Class R5 | | 12,121,611 | | (21,635,603) |
Class R6 | | 46,331,139 | | 48,498,088 | |
Net increase (decrease) in net assets resulting from share transactions | | 32,163,436 | | (102,854,234) |
Net increase in net assets | | 20,425,862 | | 14,373,842 | |
Net assets: | | | | | | |
Beginning of year | | 1,408,551,750 | | 1,394,177,908 | |
End of year | $ | 1,428,977,612 | $1,408,551,750 | |
See accompanying Notes to Financial Statements which are an integral part of the financial statements.
13 | Invesco Real Estate Fund |
Financial Highlights
The following schedule presents financial highlights for a share of the Fund outstanding throughout the periods indicated.
| | | | | | | | | | | Ratio of | Ratio of | | |
| | | | | | | | | | | expenses | expenses | | |
| | | Net gains | | | | | | | | to average | to average net | | |
| | | (losses) | | | | | | | | net assets | assets without | Ratio of net | |
| Net asset | | on securities | | Dividends | Distributions | | | | | with fee waivers | fee waivers | investment | |
| value, | Net | (both | Total from | from net | from net | | Net asset | | Net assets, | and/or | and/or | income | |
| beginning | investment | realized and | investment | investment | realized | Total | value, end | Total | end ofperiod | expenses | expenses | to average | Portfolio |
| ofperiod | income(a) | unrealized) | operations | income | gains | distributions | ofperiod | return (b) | (000's omitted) | absorbed | absorbed | net assets | turnover (c) |
Class A | | | | | | | | | | | 1.23%(d) | 1.23%(d) | 1.33%(d) | |
Year ended 02/29/20 | $20.94 | $0.30 | $ 1.44 | $ 1.74 | $(0.35) | $(1.61) | $(1.96) | $20.72 | 8.11% | $ 627,197 | 59% |
Year ended 02/28/19 | 19.32 | 0.32 | 2.70 | 3.02 | (0.28) | (1.12) | (1.40) | 20.94 | 15.98 | 661,325 | 1.27 | 1.27 | 1.54 | 47 |
Year ended 02/28/18 | 21.64 | 0.30 | (1.35) | (1.05) | (0.25) | (1.02) | (1.27) | 19.32 | (5.38) | 659,464 | 1.27 | 1.27 | 1.38 | 44 |
Year ended 02/28/17 | 21.76 | 0.31 | 2.97 | 3.28 | (0.41) | (2.99) | (3.40) | 21.64 | 15.74 | 922,255 | 1.24 | 1.24 | 1.31 | 52 |
Year ended 02/29/16 | 27.02 | 0.39 | (1.75) | (1.36) | (0.29) | (3.61) | (3.90) | 21.76 | (5.26) | 1,043,135 | 1.25 | 1.25 | 1.57 | 80 |
Class C | | | | | | | | | | | 1.98(d) | 1.98(d) | 0.58(d) | 59 |
Year ended 02/29/20 | 20.80 | 0.13 | 1.42 | 1.55 | (0.18) | (1.61) | (1.79) | 20.56 | 7.25 | 27,928 |
Year ended 02/28/19 | 19.20 | 0.16 | 2.68 | 2.84 | (0.12) | (1.12) | (1.24) | 20.80 | 15.10 | 38,515 | 2.02 | 2.02 | 0.79 | 47 |
Year ended 02/28/18 | 21.50 | 0.14 | (1.34) | (1.20) | (0.08) | (1.02) | (1.10) | 19.20 | (6.04) | 76,811 | 2.02 | 2.02 | 0.63 | 44 |
Year ended 02/28/17 | 21.64 | 0.13 | 2.95 | 3.08 | (0.23) | (2.99) | (3.22) | 21.50 | 14.84 | 117,090 | 1.99 | 1.99 | 0.56 | 52 |
Year ended 02/29/16 | 26.89 | 0.21 | (1.76) | (1.55) | (0.09) | (3.61) | (3.70) | 21.64 | (5.98) | 126,592 | 2.00 | 2.00 | 0.82 | 80 |
Class R | | | | | | | | | | | 1.48(d) | 1.48(d) | 1.08(d) | 59 |
Year ended 02/29/20 | 20.97 | 0.24 | 1.43 | 1.67 | (0.29) | (1.61) | (1.90) | 20.74 | 7.78 | 60,630 |
Year ended 02/28/19 | 19.35 | 0.27 | 2.70 | 2.97 | (0.23) | (1.12) | (1.35) | 20.97 | 15.67 | 68,733 | 1.52 | 1.52 | 1.29 | 47 |
Year ended 02/28/18 | 21.66 | 0.24 | (1.34) | (1.10) | (0.19) | (1.02) | (1.21) | 19.35 | (5.56) | 74,367 | 1.52 | 1.52 | 1.13 | 44 |
Year ended 02/28/17 | 21.78 | 0.25 | 2.97 | 3.22 | (0.35) | (2.99) | (3.34) | 21.66 | 15.43 | 102,102 | 1.49 | 1.49 | 1.06 | 52 |
Year ended 02/29/16 | 27.04 | 0.33 | (1.76) | (1.43) | (0.22) | (3.61) | (3.83) | 21.78 | (5.50) | 103,196 | 1.50 | 1.50 | 1.32 | 80 |
Class Y | | | | | | | | | | | 0.98(d) | 0.98(d) | 1.58(d) | |
Year ended 02/29/20 | 20.94 | 0.36 | 1.42 | 1.78 | (0.40) | (1.61) | (2.01) | 20.71 | 8.33 | 204,951 | 59 |
Year ended 02/28/19 | 19.32 | 0.37 | 2.70 | 3.07 | (0.33) | (1.12) | (1.45) | 20.94 | 16.28 | 188,940 | 1.02 | 1.02 | 1.79 | 47 |
Year ended 02/28/18 | 21.63 | 0.35 | (1.34) | (0.99) | (0.30) | (1.02) | (1.32) | 19.32 | (5.09) | 191,203 | 1.02 | 1.02 | 1.63 | 44 |
Year ended 02/28/17 | 21.76 | 0.37 | 2.96 | 3.33 | (0.47) | (2.99) | (3.46) | 21.63 | 15.98 | 201,330 | 0.99 | 0.99 | 1.56 | 52 |
Year ended 02/29/16 | 27.02 | 0.46 | (1.75) | (1.29) | (0.36) | (3.61) | (3.97) | 21.76 | (5.02) | 171,879 | 1.00 | 1.00 | 1.82 | 80 |
Investor Class | | | | | | | | | 8.06(e) | 37,537 | 1.22(d)(e) | 1.22(d)(e) | 1.34(d)(e) | 59 |
Year ended 02/29/20 | 20.89 | 0.30 | 1.42 | 1.72 | (0.35) | (1.61) | (1.96) | 20.65 |
Year ended 02/28/19 | 19.27 | 0.32 | 2.70 | 3.02 | (0.28) | (1.12) | (1.40) | 20.89 | 16.05(e) | 32,447 | 1.23(e) | 1.23(e) | 1.58(e) | 47 |
Year ended 02/28/18 | 21.58 | 0.30 | (1.34) | (1.04) | (0.25) | (1.02) | (1.27) | 19.27 | (5.33)(e) | 32,868 | 1.23(e) | 1.23(e) | 1.42(e) | 44 |
Year ended 02/28/17 | 21.71 | 0.31 | 2.96 | 3.27 | (0.41) | (2.99) | (3.40) | 21.58 | 15.73(e) | 41,961 | 1.23(e) | 1.23(e) | 1.32(e) | 52 |
Year ended 02/29/16 | 26.97 | 0.39 | (1.75) | (1.36) | (0.29) | (3.61) | (3.90) | 21.71 | (5.27) | 43,435 | 1.25 | 1.25 | 1.57 | 80 |
Class R5 | | | | | | | | | | | 0.87(d) | 0.87(d) | 1.69(d) | |
Year ended 02/29/20 | 20.94 | 0.38 | 1.43 | 1.81 | (0.43) | (1.61) | (2.04) | 20.71 | 8.47 | 268,267 | 59 |
Year ended 02/28/19 | 19.32 | 0.40 | 2.69 | 3.09 | (0.35) | (1.12) | (1.47) | 20.94 | 16.41 | 258,447 | 0.88 | 0.88 | 1.93 | 47 |
Year ended 02/28/18 | 21.63 | 0.38 | (1.34) | (0.96) | (0.33) | (1.02) | (1.35) | 19.32 | (4.96) | 258,599 | 0.89 | 0.89 | 1.76 | 44 |
Year ended 02/28/17 | 21.76 | 0.39 | 2.96 | 3.35 | (0.49) | (2.99) | (3.48) | 21.63 | 16.12 | 345,558 | 0.89 | 0.89 | 1.66 | 52 |
Year ended 02/29/16 | 27.02 | 0.49 | (1.75) | (1.26) | (0.39) | (3.61) | (4.00) | 21.76 | (4.89) | 380,119 | 0.87 | 0.87 | 1.95 | 80 |
Class R6 | | | | | | | | | | | 0.79(d) | 0.79(d) | 1.77(d) | 59 |
Year ended 02/29/20 | 20.93 | 0.40 | 1.44 | 1.84 | (0.45) | (1.61) | (2.06) | 20.71 | 8.60 | 202,467 |
Year ended 02/28/19 | 19.31 | 0.41 | 2.70 | 3.11 | (0.37) | (1.12) | (1.49) | 20.93 | 16.52 | 160,145 | 0.80 | 0.80 | 2.01 | 47 |
Year ended 02/28/18 | 21.63 | 0.40 | (1.35) | (0.95) | (0.35) | (1.02) | (1.37) | 19.31 | (4.93) | 100,866 | 0.80 | 0.80 | 1.85 | 44 |
Year ended 02/28/17 | 21.75 | 0.41 | 2.97 | 3.38 | (0.51) | (2.99) | (3.50) | 21.63 | 16.28 | 111,069 | 0.80 | 0.80 | 1.75 | 52 |
Year ended 02/29/16 | 27.02 | 0.51 | (1.76) | (1.25) | (0.41) | (3.61) | (4.02) | 21.75 | (4.85) | 99,691 | 0.78 | 0.78 | 2.04 | 80 |
(a)Calculated using average shares outstanding.
(b)Includes adjustments in accordance with accounting principles generally accepted in the United States of America and as such, the net asset value for financial reporting purposes and the returns based upon those net asset values may differ from the net asset value and returns for shareholder transactions. Does not include sales charges and is not annualized for periods less than one year, if applicable.
(c)Portfolio turnover is calculated at the fund level and is not annualized for periods less than one year, if applicable.
(d)Ratios are based on average daily net assets (000's omitted) of $681,462, $34,885, $70,865, $215,776, $39,409, $285,797 and $194,729 for Class A, Class C, Class R, Class Y, Investor Class, Class R5 and Class R6 shares, respectively.
(e)The total return, ratio of expenses to average net assets and ratio of net investment income to average net assets reflect actual 12b-1 fees of 0.24%, 0.21%, 0.21% and 0.24% for the years ended February 29, 2020, February 28, 2019, February 28, 2018 and February 28, 2017, respectively.
See accompanying Notes to Financial Statements which are an integral part of the financial statements.
14 | Invesco Real Estate Fund |
Notes to Financial Statements
February 29, 2020
NOTE 1—Significant Accounting Policies
Invesco Real Estate Fund (the "Fund"), is a series portfolio of AIM Investment Securities Funds (Invesco Investment Securities Funds) (the "Trust"). The Trust is organized as a Delaware statutory trust and is registered under the Investment Company Act of 1940, as amended (the "1940 Act"), as an open-end series management investment company authorized to issue an unlimited number of shares of beneficial interest. Information presented in these financial statements pertains only to the Fund. Matters affecting the Fund or each class will be voted on exclusively by the shareholders of the Fund or each class.
The Fund's investment objective is total return through growth of capital and current income.
The Fund currently consists of seven different classes of shares: Class A, Class C, Class R, Class Y, Investor Class, Class R5 and Class R6. Class Y and Investor Class shares are available only to certain investors. Class A shares are sold with a front-end sales charge unless certain waiver criteria are met. Under certain circumstances, load waived shares may be subject to contingent deferred sales charges ("CDSC"). Class C shares are sold with a CDSC. Class R, Class Y, Investor Class, Class R5 and Class R6 shares are sold at net asset value. Class C shares held for ten years after purchase are eligible for automatic conversion into Class A shares of the same Fund (the "Conversion Feature"). The automatic conversion pursuant to the Conversion Feature will generally occur at the end of the month following the tenth anniversary after a purchase of Class C shares.
The Fund is an investment company and accordingly follows the investment company accounting and reporting guidance in accordance with Financial Accounting Standards Board Accounting Standards Codification Topic 946, Financial Services – Investment Companies.
The following is a summary of the significant accounting policies followed by the Fund in the preparation of its financial statements.
A.Security Valuations — Securities, including restricted securities, are valued according to the following policy.
A security listed or traded on an exchange (except convertible securities) is valued at its last sales price or official closing price as of the close of the customary trading session on the exchange where the security is principally traded, or lacking any sales or official closing price on a particular day, the security may be valued at the closing bid price on that day. Securities traded in the over-the-counter market are valued based on prices furnished by independent pricing services or market makers. When such securities are valued by an independent pricing service they may be considered fair valued. Futures contracts are valued at the final settlement price set by an exchange on which they are principally traded. Listed options are valued at the mean between the last bid and asked prices from the exchange on which they are principally traded. Options not listed on an exchange are valued by an independent source at the mean between the last bid and asked prices. For purposes of determining net asset value ("NAV") per share, futures and option contracts generally are valued 15 minutes after the close of the customary trading session of the New York Stock Exchange ("NYSE").
Investments in open-end and closed-end registered investment companies that do not trade on an exchange are valued at the end-of-day net asset value per share. Investments in open-end and closed-end registered investment companies that trade on an exchange are valued at the last sales price or official closing price as of the close of the customary trading session on the exchange where the security is principally traded.
Debt obligations (including convertible securities) and unlisted equities are fair valued using an evaluated quote provided by an independent pricing service. Evaluated quotes provided by the pricing service may be determined without exclusive reliance on quoted prices, and may reflect appropriate factors such as institution-size trading in similar groups of securities, developments related to specific securities, dividend rate (for unlisted equities), yield (for debt obligations), quality, type of issue, coupon rate (for debt obligations), maturity (for debt obligations), individual trading characteristics and other market data. Pricing services generally value debt obligations assuming orderly transactions of institutional round lot size, but a fund may hold or transact in the same securities in smaller, odd lot sizes. Odd lots often trade at lower prices than institutional round lots. Debt obligations are subject to interest rate and credit risks. In addition, all debt obligations involve some risk of default with respect to interest and/or principal payments.
Foreign securities' (including foreign exchange contracts) prices are converted into U.S. dollar amounts using the applicable exchange rates as of the close of the NYSE. If market quotations are available and reliable for foreign exchange-traded equity securities, the securities will be valued at the market quotations. Because trading hours for certain foreign securities end before the close of the NYSE, closing market quotations may become unreliable. If between the time trading ends on a particular security and the close of the customary trading session on the NYSE, events occur that the investment adviser determines are significant and make the closing price unreliable, the Fund may fair value the security. If the event is likely to have affected the closing price of the security, the security will be valued at fair value in good faith using procedures approved by the Board of Trustees. Adjustments to closing prices to reflect fair value may also be based on a screening process of an independent pricing service to indicate the degree of certainty, based on historical data, that the closing price in the principal market where a foreign security trades is not the current value as of the close of the NYSE. Foreign securities' prices meeting the approved degree of certainty that the price is not reflective of current value will be priced at the indication of fair value from the independent pricing service. Multiple factors may be considered by the independent pricing service in determining adjustments to reflect fair value and may include information relating to sector indices, American Depositary Receipts and domestic and foreign index futures. Foreign securities may have additional risks including exchange rate changes, potential for sharply devalued currencies and high inflation, political and economic upheaval, the relative lack of issuer information, relatively low market liquidity and the potential lack of strict financial and accounting controls and standards.
Securities for which market prices are not provided by any of the above methods may be valued based upon quotes furnished by independent sources. The last bid price may be used to value equity securities. The mean between the last bid and asked prices is used to value debt obligations, including corporate loans.
Securities for which market quotations are not readily available or became unreliable are valued at fair value as determined in good faith by or under the supervision of the Trust's officers following procedures approved by the Board of Trustees. Issuer specific events, market trends, bid/asked quotes of brokers and information providers and other market data may be reviewed in the course of making a good faith determination of a security's fair value.
The Fund may invest in securities that are subject to interest rate risk, meaning the risk that the prices will generally fall as interest rates rise and, conversely, the prices will generally rise as interest rates fall. Specific securities differ in their sensitivity to changes in interest rates depending on their individual characteristics. Changes in interest rates may result in increased market volatility, which may affect the value and/or liquidity of certain Fund investments.
Valuations change in response to many factors including the historical and prospective earnings of the issuer, the value of the issuer's assets, general economic conditions, interest rates, investor perceptions and market liquidity. Because of the inherent uncertainties of valuation, the values reflected in the financial statements may materially differ from the value received upon actual sale of those investments.
B.Securities Transactions and Investment Income – Securities transactions are accounted for on a trade date basis. Realized gains or losses on sales are computed on the basis of specific identification of the securities sold. Interest income (net of withholding tax, if any) is recorded on an accrual basis from settlement date. Dividend income (net of withholding tax, if any) is recorded on the ex-dividend date.
The Fund may periodically participate in litigation related to Fund investments. As such, the Fund may receive proceeds from litigation settlements. Any proceeds received are included in the Statement of Operations as realized gain (loss) for investments no longer held and as unrealized gain (loss) for investments still held.
Brokerage commissions and mark ups are considered transaction costs and are recorded as an increase to the cost basis of securities purchased and/or a reduction of proceeds on a sale of securities. Such transaction costs are included in the determination of net realized and unrealized gain (loss) from investment securities reported in the Statement of Operations and the Statement of Changes in Net Assets and the net realized and unrealized gains (losses) on securities per share in the Financial Highlights. Transaction costs are included in the calculation of the Fund's net asset value and, accordingly, they reduce the Fund's total
15 | Invesco Real Estate Fund |
returns. These transaction costs are not considered operating expenses and are not reflected in net investment income reported in the Statement of Operations and the Statement of Changes in Net Assets, or the net investment income per share and the ratios of expenses and net investment income reported in the Financial Highlights, nor are they limited by any expense limitation arrangements between the Fund and the investment adviser.
The Fund allocates income and realized and unrealized capital gains and losses to a class based on the relative net assets of each class.
The Fund recharacterizes distributions received from REIT investments based on information provided by the REIT into the following categories: ordinary income, long-term and short-term capital gains, and return of capital. If information is not available on a timely basis from the REIT, the recharacterization will be based on available information which may include the previous year's allocation. If new or additional information becomes available from the REIT at a later date, a recharacterization will be made in the following year. The Fund records as dividend income the amount recharacterized as ordinary income and as realized gain the amount recharacterized as capital gain in the Statement of Operations, and the amount recharacterized as return of capital as a reduction of the cost of the related investment. These recharacterizations are reflected in the accompanying financial statements.
C.Country Determination — For the purposes of making investment selection decisions and presentation in the Schedule of Investments, the investment adviser may determine the country in which an issuer is located and/or credit risk exposure based on various factors. These factors include the laws of the country under which the issuer is organized, where the issuer maintains a principal office, the country in which the issuer derives 50% or more of its total revenues and the country that has the primary market for the issuer's securities, as well as other criteria. Among the other criteria that may be evaluated for making this determination are the country in which the issuer maintains 50% or more of its assets, the type of security, financial guarantees and enhancements, the nature of the collateral and the sponsor organization. Country of issuer and/or credit risk exposure has been determined to be the United States of America, unless otherwise noted.
D.Distributions - Distributions from net investment income, if any, are declared and paid quarterly and are recorded on the ex-dividend date. Distributions from net realized capital gain, if any, are generally declared and paid annually and recorded on the ex-dividend date. The Fund may elect to treat a portion of the proceeds from redemptions as distributions for federal income tax purposes.
E.Federal Income Taxes – The Fund intends to comply with the requirements of Subchapter M of the Internal Revenue Code of 1986, as amended (the "Internal Revenue Code"), necessary to qualify as a regulated investment company and to distribute substantially all of the Fund's taxable earnings to shareholders. As such, the Fund will not be subject to federal income taxes on otherwise taxable income (including net realized capital gain) that is distributed to shareholders. Therefore, no provision for federal income taxes is recorded in the financial statements.
The Fund recognizes the tax benefits of uncertain tax positions only when the position is more likely than not to be sustained. Management has analyzed the Fund's uncertain tax positions and concluded that no liability for unrecognized tax benefits should be recorded related to uncertain tax positions. Management is not aware of any tax positions for which it is reasonably possible that the total amounts of unrecognized tax benefits will change materially in the next 12 months.
The Fund files tax returns in the U.S. Federal jurisdiction and certain other jurisdictions. Generally, the Fund is subject to examinations by such taxing authorities for up to three years after the filing of the return for the tax period.
F.Expenses – Fees provided for under the Rule 12b-1 plan of a particular class of the Fund are charged to the operations of such class. Transfer agency fees and expenses and other shareholder recordkeeping fees and expenses attributable to Class R5 and Class R6 are allocated to each share class based on relative net assets. Sub-accounting fees attributable to Class R5 are charged to the operations of the class. Transfer agency fees and expenses and other shareholder recordkeeping fees and expenses relating to all other classes are allocated among those classes based on relative net assets. All other expenses are allocated among the classes based on relative net assets.
G.Accounting Estimates – The preparation of financial statements in conformity with accounting principles generally accepted in the United States of America ("GAAP") requires management to make estimates and assumptions that affect the reported amounts of assets and liabilities at the date of the financial statements and the reported amounts of revenues and expenses during the reporting period including estimates and assumptions related to taxation. Actual results could differ from those estimates by a significant amount. In addition, the Fund monitors for material events or transactions that may occur or become known after the period-end date and before the date the financial statements are released to print.
H.Indemnifications – Under the Trust's organizational documents, each Trustee, officer, employee or other agent of the Trust is indemnified against certain liabilities that may arise out of the performance of their duties to the Fund. Additionally, in the normal course of business, the Fund enters into contracts, including the Fund's servicing agreements, that contain a variety of indemnification clauses. The Fund's maximum exposure under these arrangements is unknown as this would involve future claims that may be made against the Fund that have not yet occurred. The risk of material loss as a result of such indemnification claims is considered remote.
I.Foreign Currency Translations — Foreign currency is valued at the close of the NYSE based on quotations posted by banks and major currency dealers. Portfolio securities and other assets and liabilities denominated in foreign currencies are translated into U.S. dollar amounts at the date of valuation. Purchases and sales of portfolio securities (net of foreign taxes withheld on disposition) and income items denominated in foreign currencies are translated into U.S. dollar amounts on the respective dates of such transactions. The Fund does not separately account for the portion of the results of operations resulting from changes in foreign exchange rates on investments and the fluctuations arising from changes in market prices of securities held. The combined results of changes in foreign exchange rates and the fluctuation of market prices on investments (net of estimated foreign tax withholding) are included with the net realized and unrealized gain or loss from investments in the Statement of Operations. Reported net realized foreign currency gains or losses arise from (1) sales of foreign currencies, (2) currency gains or losses realized between the trade and settlement dates on securities transactions, and (3) the difference between the amounts of dividends, interest, and foreign withholding taxes recorded on the Fund's books and the U.S. dollar equivalent of the amounts actually received or paid. Net unrealized foreign currency gains and losses arise from changes in the fair values of assets and liabilities, other than investments in securities at fiscal period end, resulting from changes in exchange rates.
The Fund may invest in foreign securities, which may be subject to foreign taxes on income, gains on investments or currency repatriation, a portion of which may be recoverable. Foreign taxes, if any, are recorded based on the tax regulations and rates that exist in the foreign markets in which the Fund invests and are shown in the Statement of Operations.
J.Forward Foreign Currency Contracts — The Fund may engage in foreign currency transactions either on a spot (i.e. for prompt delivery and settlement) basis, or through forward foreign currency contracts, to manage or minimize currency or exchange rate risk.
The Fund may also enter into forward foreign currency contracts for the purchase or sale of a security denominated in a foreign currency in order to "lock in" the U.S. dollar price of that security, or the Fund may also enter into forward foreign currency contracts that do not provide for physical settlement of the two currencies, but instead are settled by a single cash payment calculated as the difference between the agreed upon exchange rate and the spot rate at settlement based upon an agreed upon notional amount (non-deliverable forwards). The Fund will set aside liquid assets in an amount equal to the daily mark-to-market obligation for forward foreign currency contracts.
A forward foreign currency contract is an obligation between two parties ("Counterparties") to purchase or sell a specific currency for an agreed-upon price at a future date. The use of forward foreign currency contracts does not eliminate fluctuations in the price of the underlying securities the Fund owns or intends to acquire but establishes a rate of exchange in advance. Fluctuations in the value of these contracts are measured by the difference in the contract date and reporting date exchange rates and are recorded as unrealized appreciation (depreciation) until the contracts are closed. When the contracts are closed, realized gains (losses) are recorded. Realized and unrealized gains (losses) on the contracts are included in the Statement of Operations. The primary risks associated with forward foreign currency contracts include failure of the Counterparty to meet the terms of the contract and the value of the foreign currency changing unfavorably. These risks may be in excess of the amounts reflected in the Statement of Assets and Liabilities.
16 | Invesco Real Estate Fund |
K.Other Risks - The Fund's investments are concentrated in a comparatively narrow segment of the economy. Consequently, the Fund may tend to be more volatile than other mutual funds, and the value of the Fund's investments may tend to rise and fall more rapidly.
Because the Fund concentrates its assets in the real estate industry, an investment in the Fund will be closely linked to the performance of the real estate markets. Property values may fall due to increasing vacancies or declining rents resulting from economic, legal, cultural or technological developments. Emerging markets (also referred to as developing markets) are generally subject to greater market volatility, political, social and economic instability, uncertainty regarding the existence of trading markets and more governmental limitations on foreign investment than more developed markets. In addition, companies operating in emerging markets may be subject to lower trading volume and greater price fluctuations than companies in more developed markets. Securities law in many emerging market countries is relatively new and unsettled. Therefore, laws regarding foreign investment in emerging market securities, securities regulation, title to securities, and shareholder rights may change quickly and unpredictably. In addition, the enforcement of systems of taxation at federal, regional and local levels in emerging market countries may be inconsistent, and subject to sudden change. Other risks of investing in emerging markets securities may include additional transaction costs, delays in settlement procedures, and lack of timely information.
NOTE 2—Advisory Fees and Other Fees Paid to Affiliates
The Trust has entered into a master investment advisory agreement with Invesco Advisers, Inc. (the "Adviser" or "Invesco"). Under the terms of the investment advisory agreement, the Fund accrues daily and pays monthly an advisory fee to the Adviser based on the annual rate of the Fund's average daily net assets as follows:
Average Daily Net Assets | Rate |
First $250 million | 0.750% |
| |
Next $250 million | 0.740% |
Next $500 million | 0.730% |
Next $1.5 billion | 0.720% |
| |
Next $2.5 billion | 0.710% |
Next $2.5 billion | 0.700% |
Next $2.5 billion | 0.690% |
| |
Over $10 billion | 0.680% |
For the year ended February 29, 2020, the effective advisory fee rate incurred by the Fund was 0.73%.
Under the terms of a master sub-advisory agreement between the Adviser and each of Invesco Asset Management Deutschland GmbH, Invesco Asset Management Limited, Invesco Asset Management (Japan) Limited, Invesco Hong Kong Limited, Invesco Senior Secured Management, Inc. and Invesco Canada Ltd. (collectively, the "Affiliated Sub-Advisers") the Adviser, not the Fund, will pay 40% of the fees paid to the Adviser to any such Affiliated Sub-Adviser(s) that provide(s) discretionary investment management services to the Fund based on the percentage of assets allocated to such Affiliated Sub-Adviser(s).
The Adviser has contractually agreed, through at least June 30, 2020, to waive advisory fees and/or reimburse expenses of all shares to the extent necessary to limit total annual fund operating expenses after fee waiver and/or expense reimbursement (excluding certain items discussed below) of Class A, Class C, Class R, Class Y, Investor Class, Class R5 and Class R6 shares to 2.00%, 2.75%, 2.25%, 1.75%, 2.00%, 1.75% and 1.75%, respectively, of the Fund's average daily net assets (the "expense limits"). In determining the Adviser's obligation to waive advisory fees and/or reimburse expenses, the following expenses are not taken into account, and could cause the total annual fund operating expenses after fee waiver and/or reimbursement to exceed the numbers reflected above: (1) interest; (2) taxes; (3) dividend expense on short sales; (4) extraordinary or non-routine items, including litigation expenses; and (5) expenses that the Fund has incurred but did not actually pay because of an expense offset arrangement. Unless Invesco continues the fee waiver agreement, it will terminate on June 30, 2020. During its term, the fee waiver agreement cannot be terminated or amended to increase the expense limits or reduce the advisory fee waivers without approval of the Board of Trustees. The Adviser did not waive fees and/or reimburse expenses during the period under this expense limit.
The Adviser has contractually agreed, through at least June 30, 2021, to waive the advisory fee payable by the Fund in an amount equal to 100% of the net advisory fees the Adviser receives from the affiliated money market funds on investments by the Fund of uninvested cash in such affiliated money market funds.
For the year ended February 29, 2020, the Adviser waived advisory fees of $23,314.
The Trust has entered into a master administrative services agreement with Invesco pursuant to which the Fund has agreed to pay Invesco for certain administrative costs incurred in providing accounting services to the Fund. For the year ended February 29, 2020, expenses incurred under the agreement are shown in the Statement of Operations as Administrative services fees. Invesco has entered into a sub-administration agreement whereby State Street Bank and Trust Company ("SSB") serves as fund accountant and provides certain administrative services to the Fund. Pursuant to a custody agreement with the Trust on behalf of the Fund, SSB also serves as the Fund's custodian.
The Trust has entered into a transfer agency and service agreement with Invesco Investment Services, Inc. ("IIS") pursuant to which the Fund has agreed to pay IIS a fee for providing transfer agency and shareholder services to the Fund and reimburse IIS for certain expenses incurred by IIS in the course of providing such services. IIS may make payments to intermediaries that provide omnibus account services, sub-accounting services and/or networking services. All fees payable by IIS to intermediaries that provide omnibus account services or sub-accounting services are charged back to the Fund, subject to certain limitations approved by the Trust's Board of Trustees. For the year ended February 29, 2020, expenses incurred under the agreement are shown in the Statement of Operations as Transfer agent fees.
The Trust has entered into master distribution agreements with Invesco Distributors, Inc. ("IDI") to serve as the distributor for the Class A, Class C, Class R, Class Y, Investor Class, Class R5 and Class R6 shares of the Fund. The Trust has adopted plans pursuant to Rule 12b-1 under the 1940 Act with respect to the Fund's Class A, Class C, Class R and Investor Class shares (collectively, the "Plans"). The Fund, pursuant to the Plans, pays IDI compensation at the annual rate of 0.25% of the Fund's average daily net assets of Class A shares, 1.00% of the average daily net assets of Class C shares and 0.50% of the average daily net assets of Class R shares. The Fund, pursuant to the Investor Class Plan, reimburses IDI for its allocated share of expenses incurred pursuant to the Investor Class Plan for the period, up to a maximum annual rate of 0.25% of the average daily net assets of Investor Class shares. Of the Plan payments, up to 0.25% of the average daily net assets of each class of shares may be paid to furnish continuing personal shareholder services to customers who purchase and own shares of such classes. Any amounts not paid as a service fee under the Plans would constitute an asset-based sales charge. Rules of the Financial Industry Regulatory Authority ("FINRA") impose a cap on the total sales charges, including asset-based sales charges, that may be paid by any class of shares of the Fund. For the year ended February 29, 2020, expenses incurred under the Plans are shown in the Statement of Operations as Distribution fees.
Front-end sales commissions and CDSC (collectively, the "sales charges") are not recorded as expenses of the Fund. Front-end sales commissions are deducted from proceeds from the sales of Fund shares prior to investment in Class A shares of the Fund. CDSC are deducted from redemption proceeds prior to remittance to the shareholder. During the year ended February 29, 2020, IDI advised the Fund that IDI retained $61,167 in front-end sales commissions from the sale of Class A shares and $1,622 and $1,180 from Class A and Class C shares, respectively, for CDSC imposed upon redemptions by shareholders.
Certain officers and trustees of the Trust are officers and directors of the Adviser, IIS and/or IDI.
17 | Invesco Real Estate Fund |

NOTE 3—Additional Valuation Information
GAAP defines fair value as the price that would be received to sell an asset or paid to transfer a liability in an orderly transaction between market participants at the measurement date, under current market conditions. GAAP establishes a hierarchy that prioritizes the inputs to valuation methods, giving the highest priority to readily available unadjusted quoted prices in an active market for identical assets (Level 1) and the lowest priority to significant unobservable inputs (Level 3), generally when market prices are not readily available or are unreliable. Based on the valuation inputs, the securities or other investments are tiered into one of three levels. Changes in valuation methods may result in transfers in or out of an investment's assigned level:
Level 1 – Prices are determined using quoted prices in an active market for identical assets.
Level 2 – Prices are determined using other significant observable inputs. Observable inputs are inputs that other market participants may use in pricing a security. These may include quoted prices for similar securities, interest rates, prepayment speeds, credit risk, yield curves, loss severities, default rates, discount rates, volatilities and others.
Level 3 – Prices are determined using significant unobservable inputs. In situations where quoted prices or observable inputs are unavailable (for example, when there is little or no market activity for an investment at the end of the period), unobservable inputs may be used. Unobservable inputs reflect the Fund's own assumptions about the factors market participants would use in determining fair value of the securities or instruments and would be based on the best available information.
The following is a summary of the tiered valuation input levels, as of February 29, 2020. The level assigned to the securities valuations may not be an indication of the risk or liquidity associated with investing in those securities. Because of the inherent uncertainties of valuation, the values reflected in the financial statements may materially differ from the value received upon actual sale of those investments.
| Level 1 | Level 2 | Level 3 | Total |
Investments in Securities | | | | |
Common Stocks & Other Equity Interests | $1,415,667,890 | $— | $263,538 | $1,415,931,428 |
Money Market Funds | 18,748,313 | — | — | 18,748,313 |
Total Investments | $1,434,416,203 | $— | $263,538 | $1,434,679,741 |
NOTE 4—Expense Offset Arrangement(s)
The expense offset arrangement is comprised of transfer agency credits which result from balances in demand deposit accounts used by the transfer agent for clearing shareholder transactions. For the year ended February 29, 2020, the Fund received credits from this arrangement, which resulted in the reduction of the Fund's total expenses of $9,385.
NOTE 5—Trustees' and Officers' Fees and Benefits
Trustees' and Officers' Fees and Benefits include amounts accrued by the Fund to pay remuneration to certain Trustees and Officers of the Fund. Trustees have the option to defer compensation payable by the Fund, and Trustees' and Officers' Fees and Benefits also include amounts accrued by the Fund to fund such deferred compensation amounts. Those Trustees who defer compensation have the option to select various Invesco Funds in which their deferral accounts shall be deemed to be invested. Finally, certain current Trustees were eligible to participate in a retirement plan that provided for benefits to be paid upon retirement to Trustees over a period of time based on the number of years of service. The Fund may have certain former Trustees who also participate in a retirement plan and receive benefits under such plan. Trustees' and Officers' Fees and Benefits include amounts accrued by the Fund to fund such retirement benefits. Obligations under the deferred compensation and retirement plans represent unsecured claims against the general assets of the Fund.
NOTE 6—Cash Balances
The Fund is permitted to temporarily carry a negative or overdrawn balance in its account with SSB, the custodian bank. Such balances, if any at period-end, are shown in the Statement of Assets and Liabilities under the payable caption Amount due custodian. To compensate the custodian bank for such overdrafts, the overdrawn Fund may either (1) leave funds as a compensating balance in the account so the custodian bank can be compensated by earning the additional interest; or (2) compensate by paying the custodian bank at a rate agreed upon by the custodian bank and Invesco, not to exceed the contractually agreed upon rate. The Fund may not purchase additional securities when any borrowings from banks or broker-dealers exceed 5% of the Fund's total assets, or when any borrowings from an Invesco Fund are outstanding.
NOTE 7—Distributions to Shareholders and Tax Components of Net Assets
Tax Character of Distributions to Shareholders Paid During the Fiscal Years Ended February 29, 2020 and February 28, 2019:
| | | 2020 | | 2019 | | |
Ordinary income | $ | 39,459,554 | | $22,075,021 | |
| | | | | | |
Long-term capital gain | | 90,751,343 | | 72,007,747 | |
| | | | | |
Total distributions | $130,210,897 | | $94,082,768 | |
| | | | | | | |
Tax Components of Net Assets at Period-End: | | | | | | |
| | | | | 2020 | | |
Undistributed ordinary income | | | $ | 2,438,058 | |
| | | | | |
Undistributed long-term capital gain | | | | 71,092,831 | |
Net unrealized appreciation — investments | | | | 265,091,549 | |
Net unrealized appreciation (depreciation) - foreign currencies | | | | (22) |
| | | | | |
Temporary book/tax differences | | | | (303,515) |
| | | | | |
Shares of beneficial interest | | | | 1,090,658,711 | |
Total net assets | | | $1,428,977,612 | |
| | | | | | | |
18 | Invesco Real Estate Fund |

The difference between book-basis and tax-basis unrealized appreciation (depreciation) is due to differences in the timing of recognition of gains and losses on investments for tax and book purposes. The Fund's net unrealized appreciation (depreciation) difference is attributable primarily to wash sales and partnerships.
The temporary book/tax differences are a result of timing differences between book and tax recognition of income and/or expenses. The Fund's temporary book/tax differences are the result of the trustee deferral of compensation and retirement plan benefits.
Capital loss carryforward is calculated and reported as of a specific date. Results of transactions and other activity after that date may affect the amount of capital loss carryforward actually available for the Fund to utilize. The ability to utilize capital loss carryforward in the future may be limited under the Internal Revenue Code and related regulations based on the results of future transactions.
The Fund does not have a capital loss carryforward as of February 29, 2020.
NOTE 8—Investment Transactions
The aggregate amount of investment securities (other than short-term securities, U.S. Treasury obligations and money market funds, if any) purchased and sold by the Fund during the year ended February 29, 2020 was $872,542,392 and $936,595,846, respectively. Cost of investments, including any derivatives, on a tax basis includes the adjustments for financial reporting purposes as of the most recently completed federal income tax reporting period-end.
Unrealized Appreciation (Depreciation) of Investments on a Tax Basis
Aggregate unrealized appreciation of investments | $334,889,262 | |
Aggregate unrealized (depreciation) of investments | (69,797,713) |
Net unrealized appreciation of investments | $265,091,549 | |
Cost of investments for tax purposes is $1,169,588,192.
NOTE 9—Reclassification of Permanent Differences
Primarily as a result of differing book/tax treatment of real estate investment trust distributions, on February 29, 2020, undistributed net investment income was increased by $209,578 and undistributed net realized gain was decreased by $209,578. This reclassification had no effect on the net assets or the distributable earnings of the Fund.
NOTE 10—Share Information
| | Summary of Share Activity | |
| Year ended | Year ended |
| February 29, 2020(a) | | February 28, 2019 |
| Shares | Amount | Shares | Amount |
Sold: | | | | | |
Class A | 4,184,405 | $ 94,583,732 | 5,516,816 | $ 112,951,191 |
Class C | 321,511 | 7,167,575 | 364,831 | 7,407,773 |
Class R | 586,165 | 13,268,701 | 481,532 | 9,920,030 |
Class Y | 3,147,958 | 70,191,718 | 2,649,740 | 54,659,398 |
Investor Class | 422,712 | 9,346,776 | 124,211 | 2,551,399 |
Class R5 | 3,397,673 | 76,641,504 | 2,228,100 | 45,641,704 |
Class R6 | 4,564,112 | 103,313,563 | 3,583,299 | 72,626,666 |
Issued as reinvestment of dividends: | | | | | |
Class A | 2,537,733 | 54,142,757 | 1,956,863 | 39,351,502 |
Class C | 106,556 | 2,251,419 | 182,565 | 3,641,313 |
Class R | 267,268 | 5,707,041 | 222,352 | 4,474,460 |
Class Y | 603,160 | 12,860,778 | 482,628 | 9,699,268 |
Investor Class | 153,236 | 3,258,842 | 100,591 | 2,017,643 |
Class R5 | 1,174,200 | 25,070,905 | 895,302 | 18,004,816 |
Class R6 | 813,623 | 17,365,275 | 512,770 | 10,309,979 |
Automatic conversion of Class C shares to Class A shares: | | | | | |
Class A | 390,499 | 8,967,960 | - | - |
Class C | (392,920) | (8,967,960) | - | - |
19 | Invesco Real Estate Fund |
| | | Summary of Share Activity | | |
| Year ended | | Year ended |
| February 29, 2020(a) | | | February 28, 2019 | |
| Shares | | Amount | | Shares | Amount |
Reacquired: | | | | | | | | |
Class A | (8,417,407) | $(188,668,745) | (10,022,050) | $(206,533,563) |
| | | | | | |
Class C | (528,815) | | (11,674,236) | (2,695,706) | (54,617,316) |
| | | | | | |
Class R | (1,208,801) | | (27,252,413) | (1,269,952) | (25,987,943) |
| | | | | | |
Class Y | (2,880,174) | | (64,505,148) | (4,004,981) | (81,598,376) |
| | | | | | |
Investor Class | (311,921) | | (6,968,111) | (376,735) | (7,653,498) |
| | | | | | |
Class R5 | (3,962,056) | | (89,590,798) | (4,166,477) | (85,282,123) |
| | | | | | |
Class R6 | (3,249,980) | | (74,347,699) | (1,668,339) | (34,438,557) |
| | | | | | |
Net increase (decrease) in share activity | 1,718,737 | $ | 32,163,436 | (4,902,640) | $(102,854,234) |
| | | | | | | | |
(a)There are entities that are record owners of more than 5% of the outstanding shares of the Fund and in the aggregate own 18% of the outstanding shares of the Fund. IDI has an agreement with these entities to sell Fund shares. The Fund, Invesco and/or Invesco affiliates may make payments to these entities, which are considered to be related to the Fund, for providing services to the Fund, Invesco and/or Invesco affiliates including but not limited to services such as securities brokerage, distribution, third party record keeping and account servicing. The Fund has no knowledge as to whether all or any portion of the shares owned of record by these entities are also owned beneficially.
NOTE 11—Significant Event
The Board of Trustees of the Fund unanimously approved an Agreement and Plan of Reorganization (the "Agreement") pursuant to which the Fund would acquire all of the assets and liabilities of Invesco Oppenheimer Real Estate Fund (the "Target Fund") in exchange for shares of the Fund.
The reorganization was consummated on April 17, 2020. Upon closing of the reorganization, shareholders of the Target Fund received shares of the Fund in exchange for their shares of the Target Fund, and the Target Fund liquidated and ceased operations.
NOTE 12—Subsequent Event
During the first quarter of 2020, the World Health Organization declared the coronavirus (COVID-19) to be a public health emergency. COVID-19 has led to increased short-term market volatility and may have adverse long-term effects on U.S. and world economies and markets in general. COVID-19 may adversely impact the Fund's ability to achieve its investment objective. Because of the uncertainties on valuation, the global economy and business operations, values reflected in these financial statements may materially differ from the value received upon actual sales of those investments.
The Coronavirus Aid, Relief, and Economic Security Act, commonly referred to as the "CARES Act," was signed into law on March 27, 2020 by President Trump. The Adviser is assessing the components of the Act, and the impacts to the Fund should be immaterial.
20 | Invesco Real Estate Fund |
Report of Independent Registered Public Accounting Firm
To the Board of Trustees of AIM Investment Securities Funds (Invesco Investment Securities Funds) and Shareholders of Invesco Real Estate Fund
Opinion on the Financial Statements
We have audited the accompanying statement of assets and liabilities, including the schedule of investments, of Invesco Real Estate Fund (one of the funds constituting AIM Investment Securities Funds (Invesco Investment Securities Funds), hereafter referred to as the "Fund") as of February 29, 2020, the related statement of operations for the year ended February 29, 2020, the statement of changes in net assets for each of the two years in the period ended February 29, 2020, including the related notes, and the financial highlights for each of the five years in the period ended February 29, 2020 (collectively referred to as the financial statements). In our opinion, the financial statements present fairly, in all material respects, the financial position of the Fund as of February 29, 2020, the results of its operations for the year then ended, the changes in its net assets for each of the two years in the period ended February 29, 2020 and the financial highlights financial highlights for each of the five years in the period ended February 29, 2020 in conformity with accounting principles generally accepted in the United States of America.
Basis for Opinion
These financial statements are the responsibility of the Fund's management. Our responsibility is to express an opinion on the Fund's financial statements based on our audits. We are a public accounting firm registered with the Public Company Accounting Oversight Board (United States) (PCAOB) and are required to be independent with respect to the Fund in accordance with the U.S. federal securities laws and the applicable rules and regulations of the Securities and Exchange Commission and the
PCAOB.
We conducted our audits of these financial statements in accordance with the standards of the PCAOB. Those standards require that we plan and perform the audit to obtain reasonable assurance about whether the financial statements are free of material misstatement, whether due to error or fraud.
Our audits included performing procedures to assess the risks of material misstatement of the financial statements, whether due to error or fraud, and performing procedures that respond to those risks. Such procedures included examining, on a test basis, evidence regarding the amounts and disclosures in the financial statements. Our audits also included evaluating the accounting principles used and significant estimates made by management, as well as evaluating the overall presentation of the financial statements. Our procedures included confirmation of securities owned as of February 29, 2020 by correspondence with the custodian, transfer agent and brokers; when replies were not received from brokers, we performed other auditing procedures. We believe that our audits provide a reasonable basis for our opinion.
/s/PricewaterhouseCoopers LLP
Houston, Texas
April 28, 2020
We have served as the auditor of one or more of the investment companies in the Invesco group of investment companies since at least 1995. We have not been able to determine the specific year we began serving as auditor.
21 | Invesco Real Estate Fund |
Calculating your ongoing Fund expenses
Example
As a shareholder of the Fund, you incur two types of costs: (1) transaction costs, which may include sales charges (loads) on purchase payments or contingent deferred sales charges on redemptions, if any; and (2) ongoing costs, including management fees, distribution and/or service (12b-1) fees, and other Fund expenses. This example is intended to help you understand your ongoing costs (in dollars) of investing in the Fund and to compare these costs with ongoing costs of investing in other mutual funds. The example is based on an investment of $1,000 invested at the beginning of the period and held for the entire period September 1, 2019 through February 29, 2020.
Actual expenses
The table below provides information about actual account values and actual expenses. You may use the information in this table, together with the amount you invested, to estimate the expenses that you paid over the period. Simply divide your account value by $1,000 (for example, an $8,600 account value divided by $1,000 = 8.6), then multiply the result by the number in the table under the heading entitled "Actual Expenses Paid During Period" to estimate the expenses you paid on your account during this period.
Hypothetical example for comparison purposes
The table below also provides information about hypothetical account values and hypothetical expenses based on the Fund's actual expense ratio and an assumed rate of return of 5% per year before expenses, which is not the Fund's actual return.
The hypothetical account values and expenses may not be used to estimate the actual ending account balance or expenses you paid for the period. You may use this information to compare the ongoing costs of investing in the Fund and other funds. To do so, compare this 5% hypothetical example with the 5% hypothetical examples that appear in the shareholder reports of the other funds.
Please note that the expenses shown in the table are meant to highlight your ongoing costs only and do not reflect any transaction costs, such as sales charges (loads) on purchase payments or contingent deferred sales charges on redemptions, if any. Therefore, the hypothetical information is useful in comparing ongoing costs only, and will not help you determine the relative total costs of owning different funds. In addition, if these transaction costs were included, your costs would have been higher.
| | | | | HYPOTHETICAL | |
| | | | | (5% annual return before | |
| | | ACTUAL | | expenses) | |
| Beginning | Ending | | Expenses | Ending | | Expenses | Annualized |
| Account Value | Account Value | | Paid During | Account Value | | Paid During | Expense |
| (09/01/19) | (02/29/20)1 | | Period2 | (02/29/20) | | Period2 | Ratio |
Class A | $1,000.00 | $956.40 | | $5.89 | $1,018.85 | | $6.07 | 1.21% |
| | | | | | | | |
Class C | 1,000.00 | 952.70 | | 9.52 | 1,015.12 | | 9.82 | 1.96 |
| | | | | | | | |
Class R | 1,000.00 | 954.70 | | 7.10 | 1,017.60 | | 7.32 | 1.46 |
| | | | | | | | |
Class Y | 1,000.00 | 957.20 | | 4.67 | 1,020.09 | | 4.82 | 0.96 |
Investor Class | 1,000.00 | 955.90 | | 5.93 | 1,018.80 | | 6.12 | 1.22 |
| | | | | | | | |
Class R5 | 1,000.00 | 958.10 | | 4.24 | 1,020.54 | | 4.37 | 0.87 |
| | | | | | | | |
Class R6 | 1,000.00 | 958.50 | | 3.85 | 1,020.93 | | 3.97 | 0.79 |
| | | | | | | | |
1The actual ending account value is based on the actual total return of the Fund for the period September 1, 2019 through February 29, 2020, after actual expenses and will differ from the hypothetical ending account value which is based on the Fund's expense ratio and a hypothetical annual return of 5% before expenses.
2Expenses are equal to the Fund's annualized expense ratio as indicated above multiplied by the average account value over the period, multiplied by 182/366 to reflect the most recent fiscal half year.
22 | Invesco Real Estate Fund |
Tax Information
Form 1099-DIV, Form 1042-S and other year–end tax information provide shareholders with actual calendar year amounts that should be included in their tax returns. Shareholders should consult their tax advisers.
The following distribution information is being provided as required by the Internal Revenue Code or to meet a specific state's requirement.
The Fund designates the following amounts or, if subsequently determined to be different, the maximum amount allowable for its fiscal year ended February 29, 2020:
Federal and State Income Tax
Long-Term Capital Gain Distributions | $90,751,343 |
Qualified Dividend Income* | 2.70% |
Qualified Business Income* | 69.80% |
Corporate Dividends Received Deduction* | 0.16% |
U.S. Treasury Obligations* | 0.00% |
* The above percentages are based on ordinary income dividends paid to shareholders during the Fund's fiscal year.
23 | Invesco Real Estate Fund |
Trustees and Officers
The address of each trustee and officer is AIM Investment Securities Funds (Invesco Investment Securities Funds) (the "Trust"), 11 Greenway Plaza, Suite 1000, Houston, Texas 77046-1173. The trustees serve for the life of the Trust, subject to their earlier death, incapacitation, resignation, retirement or removal as more specifically provided in the Trust's organizational documents. Each officer serves for a one year term or until their successors are elected and qualified. Column two below includes length of time served with predecessor entities, if any.
| Trustee | | Number of | Other |
Name, Year of Birth and | | Funds in | Directorship(s) |
and/or | | Fund Complex | Held by Trustee |
Position(s) | Officer | Principal Occupation(s) | Overseen by | During Past 5 |
Held with the Trust | Since | During Past 5 Years | Trustee | Years |
Interested Trustee | | | | |
Martin L. Flanagan1 — 1960 | 2007 | Executive Director, Chief Executive Officer and President, Invesco Ltd. | 229 | None |
Trustee and Vice Chair | | (ultimate parent of Invesco and a global investment management firm); | | |
| | Trustee and Vice Chair, The Invesco Funds; Vice Chair, Investment Company | | |
| | Institute; and Member of Executive Board, SMU Cox School of Business | | |
| | Formerly: Advisor to the Board, Invesco Advisers, Inc. (formerly known as | | |
| | Invesco Institutional (N.A.), Inc.); Chairman and Chief Executive Officer, | | |
| | Invesco Advisers, Inc. (registered investment adviser); Director, Chairman, | | |
| | Chief Executive Officer and President, Invesco Holding Company (US), Inc. | | |
| | (formerly IVZ Inc.) (holding company), Invesco Group Services, Inc. (service | | |
| | provider) and Invesco North American Holdings, Inc. (holding company); | | |
| | Director, Chief Executive Officer and President, Invesco Holding Company | | |
| | Limited (parent of Invesco and a global investment management firm); | | |
| | Director, Invesco Ltd.; Chairman, Investment Company Institute and President, | | |
| | Co-Chief Executive Officer, Co-President, Chief Operating Officer and Chief | | |
| | Financial Officer, Franklin Resources, Inc. (global investment management | | |
| | organization) | | |
1Mr. Flanagan is considered an interested person (within the meaning of Section 2(a)(19) of the 1940 Act) of the Trust because he is an officer of the Adviser to the Trust, and an officer and a director of Invesco Ltd., ultimate parent of the Adviser.
| | | Number of | |
| | | Funds | Other |
| Trustee | | in | Directorship(s) |
Name, Year of Birth and | and/or | | Fund Complex | Held by Trustee |
Position(s) | Officer | Principal Occupation(s) | Overseen by | During Past 5 |
Held with the Trust | Since | During Past 5 Years | Trustee | Years |
Independent Trustees | | | | |
Bruce L. Crockett – 1944 | 1992 | Chairman, Crockett Technologies Associates (technology consulting company) | 229 | Director and |
Trustee and Chair | | Formerly: Director, Captaris (unified messaging provider); Director, President | | Chairman of the |
| | | Audit Committee, |
| | and Chief Executive Officer, COMSAT Corporation; Chairman, Board of | |
| | | ALPS (Attorneys |
| | Governors of INTELSAT (international communications company); ACE Limited | |
| | | Liability |
| | (insurance company); Independent Directors Council and Investment Company | |
| | | Protection |
| | Institute: Member of the Audit Committee, Investment Company Institute; | |
| | | Society) |
| | Member of the Executive Committee and Chair of the Governance Committee, | |
| | | (insurance |
| | Independent Directors Council | |
| | | company); |
| | | |
| | | | Director and |
| | | | Member of the |
| | | | Audit Committee |
| | | | and |
| | | | Compensation |
| | | | Committee, |
| | | | Ferroglobe PLC |
| | | | (metallurgical |
| | | | company) |
David C. Arch – 1945 | 2010 | Chairman of Blistex Inc. (consumer health care products manufacturer); | 229 | Board member of |
Trustee | | Member, World Presidents' Organization | | the Illinois |
| | | | Manufacturers' |
| | | | Association |
Beth Ann Brown – 1968 | 2019 | Independent Consultant | 229 | Director, Board of |
Trustee | | Formerly: Head of Intermediary Distribution, Managing Director, Strategic | | Directors of |
| | | Caron |
| | Relations, Managing Director, Head of National Accounts, Senior Vice | |
| | | Engineering Inc.; |
| | President, National Account Manager and Senior Vice President, Key Account | |
| | | Advisor, Board of |
| | Manager, Columbia Management Investment Advisers LLC; Vice President, Key | |
| | | Advisors of Caron |
| | Account Manager, Liberty Funds Distributor, Inc.; and Trustee of certain | |
| | | Engineering Inc.; |
| | Oppenheimer Funds | |
| | | President and |
| | | |
| | | | Director, Acton |
| | | | Shapleigh Youth |
| | | | Conservation |
| | | | Corps (non - |
| | | | profit); and Vice |
| | | | President and |
| | | | Director of |
| | | | Grahamtastic |
| | | | Connection (non- |
| | | | profit) |
| | | | |
T-1 | Invesco Real Estate Fund |

Trustees and Officers—(continued)
| | | Number of | |
| | | Funds | Other |
| Trustee | | in | Directorship(s) |
Name, Year of Birth and | and/or | | Fund Complex | Held by Trustee |
Position(s) | Officer | Principal Occupation(s) | Overseen by | During Past 5 |
Held with the Trust | Since | During Past 5 Years | Trustee | Years |
Independent Trustees—(continued) | | | |
Jack M. Fields – 1952 | 1997 | Chief Executive Officer, Twenty First Century Group, Inc. (government affairs | 229 | Member, Board of Directors of |
Trustee | | company); and Chairman, Discovery Learning Alliance (non-profit) | | Baylor College of Medicine |
| | Formerly: Owner and Chief Executive Officer, Dos Angeles Ranch L.P. (cattle, | | |
| | hunting, corporate entertainment); Director, Insperity, Inc. (formerly known as | | |
| | Administaff) (human resources provider); Chief Executive Officer, Texana | | |
| | Timber LP (sustainable forestry company); Director of Cross Timbers Quail | | |
| | Research Ranch (non-profit); and member of the U.S. House of Representatives | | |
Cynthia Hostetler —1962 | 2017 | Non-Executive Director and Trustee of a number of public and private business | 229 | Vulcan Materials |
Trustee | | corporations | | Company |
| | Formerly: Director, Aberdeen Investment Funds (4 portfolios); Head of | | (construction |
| | | materials |
| | Investment Funds and Private Equity, Overseas Private Investment | |
| | | company); Trilinc |
| | Corporation; President, First Manhattan Bancorporation, Inc.; Attorney, | |
| | | Global Impact |
| | Simpson Thacher & Bartlett LLP | |
| | | Fund; Genesee & |
| | | |
| | | | Wyoming, Inc. |
| | | | (railroads); Artio |
| | | | Global Investment |
| | | | LLC (mutual fund |
| | | | complex); Edgen |
| | | | Group, Inc. |
| | | | (specialized |
| | | | energy and |
| | | | infrastructure |
| | | | products |
| | | | distributor); |
| | | | Investment |
| | | | Company Institute |
| | | | (professional |
| | | | organization); |
| | | | Independent |
| | | | Directors Council |
| | | | (professional |
| | | | organization) |
Eli Jones – 1961 | 2016 | Professor and Dean, Mays Business School - Texas A&M University | 229 | Insperity, Inc. |
Trustee | | Formerly: Professor and Dean, Walton College of Business, University of | | (formerly known |
| | | as Administaff) |
| | Arkansas and E.J. Ourso College of Business, Louisiana State University; | |
| | | (human resources |
| | Director, Arvest Bank | |
| | | provider) |
| | | |
Elizabeth Krentzman – 1959 | 2019 | Formerly: Principal and Chief Regulatory Advisor for Asset Management | 229 | Trustee of the |
Trustee | | Services and U.S. Mutual Fund Leader of Deloitte & Touche LLP; General | | University of |
| | Counsel of the Investment Company Institute (trade association); National | | Florida National |
| | Director of the Investment Management Regulatory Consulting Practice, | | Board Foundation |
| | Principal, Director and Senior Manager of Deloitte & Touche LLP; Assistant | | and Audit |
| | Director of the Division of Investment Management - Office of Disclosure and | | Committee |
| | Investment Adviser Regulation of the U.S. Securities and Exchange | | Member; Member |
| | Commission and various positions with the Division of Investment Management | | of the Cartica |
| | – Office of Regulatory Policy of the U.S. Securities and Exchange Commission; | | Funds Board of |
| | Associate at Ropes & Gray LLP; Advisory Board Member of the Securities and | | Directors (private |
| | Exchange Commission Historical Society; and Trustee of certain Oppenheimer | | investment |
| | Funds | | funds); Member |
| | | | of the University |
| | | | of Florida Law |
| | | | Center |
| | | | Association, Inc. |
| | | | Board of Trustees |
| | | | and Audit |
| | | | Committee |
| | | | Member |
Anthony J. LaCava, Jr. – 1956 | 2019 | Formerly: Director and Member of the Audit Committee, Blue Hills Bank | 229 | Blue Hills Bank; |
Trustee | | (publicly traded financial institution) and Managing Partner, KPMG LLP | | Chairman, |
| | | | Bentley |
| | | | University; |
| | | | Member, |
| | | | Business School |
| | | | Advisory Council; |
| | | | and Nominating |
| | | | Committee |
| | | | KPMG LLP |
Prema Mathai-Davis – 1950 | 1998 | Retired | 229 | None |
Trustee | | Co-Owner & Partner of Quantalytics Research, LLC, (a FinTech Investment | | |
| | | |
Research Platform for the Self-Directed Investor)
T-2 | Invesco Real Estate Fund |

Trustees and Officers—(continued)
| | | Number of | |
| | | Funds | Other |
| Trustee | | in | Directorship(s) |
Name, Year of Birth and | and/or | | Fund Complex | Held by Trustee |
Position(s) | Officer | Principal Occupation(s) | Overseen by | During Past 5 |
Held with the Trust | Since | During Past 5 Years | Trustee | Years |
Independent Trustees—(continued) | | | |
Joel W. Motley – 1952 | 2019 | Director of Office of Finance, Federal Home Loan Bank System; Member of the | 229 | Member of Board |
Trustee | | Vestry of Trinity Wall Street; Managing Director of Carmona Motley Inc. | | of Greenwall |
| | (privately held financial advisor); Member of the Council on Foreign Relations | | Foundation |
| | and its Finance and Budget Committee; Chairman Emeritus of Board of Human | | (bioethics research |
| | Rights Watch and Member of its Investment Committee; and Member of | | foundation) and |
| | Investment Committee and Board of Historic Hudson Valley (non-profit cultural | | its Investment |
| | organization) | | Committee; |
| | Formerly: Managing Director of Public Capital Advisors, LLC (privately held | | Member of Board of |
| | | Friends of the LRC |
| | financial advisor); Managing Director of Carmona Motley Hoffman, Inc. | |
| | | (non-profit |
| | (privately held financial advisor); Trustee of certain Oppenheimer Funds; and | |
| | | legal advocacy); |
| | Director of Columbia Equity Financial Corp. (privately held financial advisor) | |
| | | Board Member |
| | | |
| | | | and Investment |
| | | | Committee |
| | | | Member of |
| | | | Pulizer Center for |
| | | | Crisis Reporting |
| | | | (non-profit |
| | | | journalism) |
Teresa M. Ressel — 1962 | 2017 | Non-executive director and trustee of a number of public and private business | 229 | Atlantic Power |
Trustee | | corporations | | Corporation |
| | Formerly: Chief Financial Officer, Olayan America, The Olayan Group | | (power generation |
| | | company); ON |
| | (international investor/commercial/industrial); Chief Executive Officer, UBS | |
| | | Semiconductor |
| | Securities LLC; Group Chief Operating Officer, Americas, UBS AG; Assistant | |
| | | Corp. |
| | Secretary for Management & Budget and CFO, US Department of the Treasury | |
| | | (semiconductor |
| | | |
| | | | supplier) |
| | | | |
Ann Barnett Stern – 1957 | 2017 | President and Chief Executive Officer, Houston Endowment Inc. (private | 229 | Federal Reserve |
Trustee | | philanthropic institution) | | Bank of Dallas |
| | Formerly: Executive Vice President and General Counsel, Texas Children's | | |
| | Hospital; Attorney, Beck, Redden and Secrest, LLP; Business Law Instructor, | | |
| | University of St. Thomas; Attorney, Andrews & Kurth LLP | | |
Robert C. Troccoli – 1949 | 2016 | Retired | 229 | None |
Trustee | | Formerly: Adjunct Professor, University of Denver – Daniels College of | | |
| | | |
| | Business; Senior Partner, KPMG LLP | | |
| | | | |
Daniel S. Vandivort –1954 | 2019 | Treasurer, Chairman of the Audit and Finance Committee, and Trustee, Board | 229 | Chairman and |
Trustee | | of Trustees, Huntington Disease Foundation of America; and President, Flyway | | Lead Independent |
| | Advisory Services LLC (consulting and property management) | | Director, |
| | Formerly: Trustee and Governance Chair, of certain Oppenheimer Funds | | Chairman of the |
| | | Audit Committee, |
| | | |
| | | | and Director, |
| | | | Board of |
| | | | Directors, Value |
| | | | Line Funds |
James D. Vaughn – 1945 | 2019 | Retired | 229 | Board member |
Trustee | | Formerly: Managing Partner, Deloitte & Touche LLP; Trustee and Chairman of | | and Chairman of |
| | | Audit Committee |
| | the Audit Committee, Schroder Funds; Board Member, Mile High United Way, | |
| | | of AMG National |
| | Boys and Girls Clubs, Boy Scouts, Colorado Business Committee for the Arts, | |
| | | Trust Bank; |
| | Economic Club of Colorado and Metro Denver Network (economic development | |
| | | Trustee and |
| | corporation); and Trustee of certain Oppenheimer Funds | |
| | | Investment |
| | | |
| | | | Committee |
| | | | member, |
| | | | University of |
| | | | South Dakota |
| | | | Foundation; |
| | | | Board member, |
| | | | Audit Committee |
| | | | Member and past |
| | | | Board Chair, |
| | | | Junior |
| | | | Achievement |
| | | | (non-profit) |
Christopher L. Wilson - | 2017 | Retired | 229 | ISO New |
1957 | | Formerly: Director, TD Asset Management USA Inc. (mutual fund complex) (22 | | England, Inc. |
Trustee, Vice Chair and Chair | | | (non-profit |
| portfolios); Managing Partner, CT2, LLC (investing and consulting firm); | |
Designate | | | organization |
| President/Chief Executive Officer, Columbia Funds, Bank of America | |
| | | |
| Corporation; President/Chief Executive Officer, CDC IXIS Asset Management | managing |
| regional electricity |
| Services, Inc.; Principal & Director of Operations, Scudder Funds, Scudder, |
| market) |
| Stevens & Clark, Inc.; Assistant Vice President, Fidelity Investments |
| |
T-3 | Invesco Real Estate Fund |
Trustees and Officers—(continued)
| | | Number of | Other |
| Trustee | | Funds in | Directorship(s) |
Name, Year of Birth and | and/or | | Fund Complex | Held by Trustee |
Position(s) | Officer | Principal Occupation(s) | Overseen by | During Past 5 |
Held with the Trust | Since | During Past 5 Years | Trustee | Years |
Officers | | | | |
Sheri Morris — 1964 | 1999 | Head of Global Fund Services, Invesco Ltd.; President, Principal Executive | N/A | N/A |
President, Principal Executive | | Officer and Treasurer, The Invesco Funds; Vice President, Invesco Advisers, | | |
Officer and Treasurer | | Inc. (formerly known as Invesco Institutional (N.A.), Inc.) (registered | | |
| | investment adviser); and Vice President, Invesco Exchange-Traded Fund Trust, | | |
| | Invesco Exchange-Traded Fund Trust II, Invesco India Exchange-Traded Fund | | |
| | Trust, Invesco Actively Managed Exchange-Traded Fund Trust, Invesco Actively | | |
| | Managed Exchange-Traded Commodity Fund Trust and Invesco | | |
| | Exchange-Traded Self-Indexed Fund Trust; and Vice President, | | |
| | OppenheimerFunds, Inc. | | |
| | Formerly: Vice President and Principal Financial Officer, The Invesco Funds; | | |
| | Vice President, Invesco AIM Advisers, Inc., Invesco AIM Capital Management, | | |
| | Inc. and Invesco AIM Private Asset Management, Inc.; Assistant Vice President | | |
| | and Assistant Treasurer, The Invesco Funds and Assistant Vice President, | | |
| | Invesco Advisers, Inc., Invesco AIM Capital Management, Inc. and Invesco AIM | | |
| | Private Asset Management, Inc.; and Treasurer, Invesco Exchange-Traded | | |
| | Fund Trust, Invesco Exchange-Traded Fund Trust II, Invesco India | | |
| | Exchange-Traded Fund Trust and Invesco Actively Managed Exchange-Traded | | |
| | Fund Trust | | |
Russell C. Burk — 1958 | 2005 | Senior Vice President and Senior Officer, The Invesco Funds | N/A | N/A |
Senior Vice President and Senior | | | | |
Officer | | | | |
Jeffrey H. Kupor – 1968 | 2018 | Head of Legal of the Americas, Invesco Ltd.; Senior Vice President and | N/A | N/A |
Senior Vice President, Chief Legal | | Secretary, Invesco Advisers, Inc. (formerly known as Invesco Institutional | | |
Officer and Secretary | | (N.A.), Inc.) (registered investment adviser); Senior Vice President and | | |
| | Secretary, Invesco Distributors, Inc. (formerly known as Invesco AIM | | |
| | Distributors, Inc.); Vice President and Secretary, Invesco Investment Services, | | |
| | Inc. (formerly known as Invesco AIM Investment Services, Inc.) Senior Vice | | |
| | President, Chief Legal Officer and Secretary, The Invesco Funds; Secretary and | | |
| | General Counsel, Invesco Investment Advisers LLC (formerly known as Van | | |
| | Kampen Asset Management); Secretary and General Counsel, Invesco Capital | | |
| | Markets, Inc. (formerly known as Van Kampen Funds Inc.) and Chief Legal | | |
| | Officer, Invesco Exchange-Traded Fund Trust, Invesco Exchange-Traded Fund | | |
| | Trust II, Invesco India Exchange-Traded Fund Trust, Invesco Actively Managed | | |
| | Exchange-Traded Fund Trust, Invesco Actively Managed Exchange-Traded | | |
| | Commodity Fund Trust and Invesco Exchange-Traded Self-Indexed Fund Trust; | | |
| | Secretary, Invesco Indexing LLC; Secretary, W.L. Ross & Co., LLC | | |
| | Formerly: Secretary and Vice President, Jemstep, Inc.; Head of Legal, | | |
| | Worldwide Institutional, Invesco Ltd.; Secretary and General Counsel, INVESCO | | |
| | Private Capital Investments, Inc.; Senior Vice President, Secretary and General | | |
| | Counsel, Invesco Management Group, Inc. (formerly known as Invesco AIM | | |
| | Management Group, Inc.); Assistant Secretary, INVESCO Asset Management | | |
| | (Bermuda) Ltd.; Secretary and General Counsel, Invesco Private Capital, Inc.; | | |
| | Assistant Secretary and General Counsel, INVESCO Realty, Inc.; Secretary and | | |
| | General Counsel, Invesco Senior Secured Management, Inc.; and Secretary, | | |
| | Sovereign G./P. Holdings Inc. | | |
Andrew R. Schlossberg – 1974 | 2019 | Head of the Americas and Senior Managing Director, Invesco Ltd.; Director and | N/A | N/A |
Senior Vice President | | Senior Vice President, Invesco Advisers, Inc. (formerly known as Invesco | | |
| | Institutional (N.A.), Inc.) (registered investment adviser); Director and | | |
| | Chairman, Invesco Investment Services, Inc. (formerly known as Invesco AIM | | |
| | Investment Services, Inc.) (registered transfer agent); Senior Vice President, | | |
| | The Invesco Funds; Director, Invesco Investment Advisers LLC (formerly known | | |
| | as Van Kampen Asset Management); Director, President and Chairman, Invesco | | |
| | Insurance Agency, Inc. | | |
| | Formerly: Director, Invesco UK Limited; Director and Chief Executive, Invesco | | |
| | Asset Management Limited and Invesco Fund Managers Limited; Assistant Vice | | |
| | President, The Invesco Funds; Senior Vice President, Invesco Advisers, Inc. | | |
| | (formerly known as Invesco Institutional (N.A.), Inc.) (registered investment | | |
| | adviser); Director and Chief Executive, Invesco Administration Services Limited | | |
| | and Invesco Global Investment Funds Limited; Director, Invesco Distributors, | | |
| | Inc.; Head of EMEA, Invesco Ltd.; President, Invesco Actively Managed | | |
| | Exchange-Traded Commodity Fund Trust, Invesco Actively Managed | | |
| | Exchange-Traded Fund Trust, Invesco Exchange-Traded Fund Trust, Invesco | | |
| | Exchange-Traded Fund Trust II and Invesco India Exchange-Traded Fund Trust; | | |
| | Managing Director and Principal Executive Officer, Invesco Capital | | |
| | Management LLC | | |
T-4 | Invesco Real Estate Fund |
Trustees and Officers—(continued)
| | | Number of | Other |
| Trustee | | Funds in | Directorship(s) |
Name, Year of Birth and | and/or | | Fund Complex | Held by Trustee |
Position(s) | Officer | Principal Occupation(s) | Overseen by | During Past 5 |
Held with the Trust | Since | During Past 5 Years | Trustee | Years |
Officers—(continued) | | | | |
John M. Zerr — 1962 | 2006 | Chief Operating Officer of the Americas; Senior Vice President, Invesco | N/A | N/A |
Senior Vice President | | Advisers, Inc. (formerly known as Invesco Institutional (N.A.), Inc.) (registered | | |
| | investment adviser); Senior Vice President, Invesco Distributors, Inc. (formerly | | |
| | known as Invesco AIM Distributors, Inc.); Director and Vice President, Invesco | | |
| | Investment Services, Inc. (formerly known as Invesco AIM Investment | | |
| | Services, Inc.) Senior Vice President, The Invesco Funds; Managing Director, | | |
| | Invesco Capital Management LLC; Director, Invesco Investment Advisers LLC | | |
| | (formerly known as Van Kampen Asset Management); Senior Vice President, | | |
| | Invesco Capital Markets, Inc. (formerly known as Van Kampen Funds Inc.); | | |
| | Manager, Invesco Indexing LLC; Manager, Invesco Specialized Products, LLC; | | |
| | Director and Senior Vice President, Invesco Insurance Agency, Inc.; Member, | | |
| | Invesco Canada Funds Advisory Board; Director, President and Chief Executive | | |
| | Officer, Invesco Corporate Class Inc. (corporate mutual fund company); and | | |
| | Director, Chairman, President and Chief Executive Officer, Invesco Canada Ltd. | | |
| | (formerly known as Invesco Trimark Ltd./Invesco Trimark Ltèe) (registered | | |
| | investment adviser and registered transfer agent); President, Invesco, Inc. | | |
| | Formerly: Director and Senior Vice President, Invesco Management Group, Inc. | | |
| | (formerly known as Invesco AIM Management Group, Inc.); Secretary and | | |
| | General Counsel, Invesco Management Group, Inc. (formerly known as Invesco | | |
| | AIM Management Group, Inc.); Secretary, Invesco Investment Services, Inc. | | |
| | (formerly known as Invesco AIM Investment Services, Inc.); Chief Legal Officer | | |
| | and Secretary, The Invesco Funds; Secretary and General Counsel, Invesco | | |
| | Investment Advisers LLC (formerly known as Van Kampen Asset Management); | | |
| | Secretary and General Counsel, Invesco Capital Markets, Inc. (formerly known | | |
| | as Van Kampen Funds Inc.); Chief Legal Officer, Invesco Exchange-Traded Fund | | |
| | Trust, Invesco Exchange-Traded Fund Trust II, Invesco India Exchange-Traded | | |
| | Fund Trust, Invesco Actively Managed Exchange-Traded Fund Trust, Invesco | | |
| | Actively Managed Exchange-Traded Commodity Fund Trust and Invesco | | |
| | Exchange-Traded Self-Indexed Fund Trust; Secretary, Invesco Indexing LLC; | | |
| | Director, Secretary, General Counsel and Senior Vice President, Van Kampen | | |
| | Exchange Corp.; Director, Vice President and Secretary, IVZ Distributors, Inc. | | |
| | (formerly known as INVESCO Distributors, Inc.); Director and Vice President, | | |
| | INVESCO Funds Group, Inc.; Director and Vice President, Van Kampen | | |
| | Advisors Inc.; Director, Vice President, Secretary and General Counsel, Van | | |
| | Kampen Investor Services Inc.;Director and Secretary, Invesco Distributors, | | |
| | Inc. (formerly known as Invesco AIM Distributors, Inc.); Director, Senior Vice | | |
| | President, General Counsel and Secretary, Invesco AIM Advisers, Inc. and Van | | |
| | Kampen Investments Inc.; Director, Vice President and Secretary, Fund | | |
| | Management Company; Director, Senior Vice President, Secretary, General | | |
| | Counsel and Vice President, Invesco AIM Capital Management, Inc.; Chief | | |
| | Operating Officer and General Counsel, Liberty Ridge Capital, Inc. (an | | |
| | investment adviser) | | |
Gregory G. McGreevey - 1962 | 2012 | Senior Managing Director, Invesco Ltd.; Director, Chairman, President, and | N/A | N/A |
Senior Vice President | | Chief Executive Officer, Invesco Advisers, Inc. (formerly known as Invesco | | |
| | Institutional (N.A.), Inc.) (registered investment adviser); Director, Invesco | | |
| | Mortgage Capital, Inc. and Invesco Senior Secured Management, Inc.; and | | |
| | Senior Vice President, The Invesco Funds; and President, SNW Asset | | |
| | Management Corporation and Invesco Managed Accounts, LLC | | |
| | Formerly: Senior Vice President, Invesco Management Group, Inc. and Invesco | | |
| | Advisers, Inc.; Assistant Vice President, The Invesco Funds | | |
Kelli Gallegos – 1970 | 2008 | Principal Financial and Accounting Officer – Investments Pool, Invesco | N/A | N/A |
Vice President, Principal Financial | | Specialized Products, LLC; Vice President, Principal Financial Officer and | | |
Officer and Assistant Treasurer | | Assistant Treasurer, The Invesco Funds; Principal Financial and Accounting | | |
| | Officer – Pooled Investments, Invesco Capital Management LLC; Vice President | | |
| | and Treasurer, Invesco Exchange-Traded Fund Trust, Invesco Exchange-Traded | | |
| | Fund Trust II, Invesco India Exchange-Traded Fund Trust, Invesco Actively | | |
| | Managed Exchange-Traded Fund Trust, Invesco Actively Managed | | |
| | Exchange-Traded Commodity Fund Trust and Invesco Exchange-Traded | | |
| | Self-Indexed Fund Trust; Vice President, Invesco Advisers, Inc. | | |
| | Formerly: Assistant Treasurer, Invesco Specialized Products, LLC; Assistant | | |
| | Treasurer, Invesco Exchange-Traded Fund Trust, Invesco Exchange-Traded | | |
| | Fund Trust II, Invesco India Exchange-Traded Fund Trust, Invesco Actively | | |
| | Managed Exchange-Traded Fund Trust, Invesco Actively Managed | | |
| | Exchange-Traded Commodity Fund Trust and Invesco Exchange-Traded | | |
| | Self-Indexed Fund Trust; Assistant Treasurer, Invesco Capital | | |
| | Management LLC; Assistant Vice President, The Invesco Funds | | |
Crissie M. Wisdom – 1969 | 2013 | Anti-Money Laundering and OFAC Compliance Officer for Invesco U.S. entities | N/A | N/A |
Anti-Money Laundering | | including: Invesco Advisers, Inc. and its affiliates, Invesco Capital Markets, | | |
Compliance Officer | | Inc., Invesco Distributors, Inc., Invesco Investment Services, Inc., The Invesco | | |
| | Funds, Invesco Capital Management, LLC, Invesco Trust Company; | | |
| | OppenheimerFunds Distributor, Inc., and Fraud Prevention Manager for | | |
| | Invesco Investment Services, Inc. | | |
T-5 | Invesco Real Estate Fund |
Trustees and Officers—(continued)
| | | Number of | Other |
| Trustee | | Funds in | Directorship(s) |
Name, Year of Birth and | and/or | | Fund Complex | Held by Trustee |
Position(s) | Officer | Principal Occupation(s) | Overseen by | During Past 5 |
Held with the Trust | Since | During Past 5 Years | Trustee | Years |
Officers—(continued) | | | | |
Robert R. Leveille – 1969 | 2016 | Chief Compliance Officer, Invesco Advisers, Inc. (registered investment | N/A | N/A |
Chief Compliance Officer | | adviser); and Chief Compliance Officer, The Invesco Funds | | |
| | Formerly: Chief Compliance Officer, Putnam Investments and the Putnam | | |
| | Funds | | |
The Statement of Additional Information of the Trust includes additional information about the Fund's Trustees and is available upon request, without charge, by calling 1.800.959.4246. Please refer to the Fund's Statement of Additional Information for information on the Fund's sub-advisers.
Office of the Fund | Investment Adviser | Distributor | Auditors |
11 Greenway Plaza, Suite 1000 | Invesco Advisers, Inc. | Invesco Distributors, Inc. | PricewaterhouseCoopers LLP |
Houston, TX 77046-1173 | 1555 Peachtree Street, N.E. | 11 Greenway Plaza, Suite 1000 | 1000 Louisiana Street, Suite 5800 |
| Atlanta, GA 30309 | Houston, TX 77046-1173 | Houston, TX 77002-5678 |
Counsel to the Fund | Counsel to the Independent Trustees | Transfer Agent | Custodian |
Stradley Ronon Stevens & Young, LLP | Goodwin Procter LLP | Invesco Investment Services, Inc. | State Street Bank and Trust Company |
2005 Market Street, Suite 2600 | 901 New York Avenue, N.W. | 11 Greenway Plaza, Suite 1000 | 225 Franklin Street |
Philadelphia, PA 19103-7018 | Washington, D.C. 20001 | Houston, TX 77046-1173 | Boston, MA 02110-2801 |
T-6 | Invesco Real Estate Fund |
(This page intentionally left blank)
(This page intentionally left blank)

Go paperless with eDelivery
Visit invesco.com/edelivery to enjoy the convenience and security of anytime electronic access to your investment documents.
With eDelivery, you can elect to have any or all of the following materials delivered straight to your inbox to download, save and print from your own computer:
•Fund reports and prospectuses
•Quarterly statements
•Daily confirmations
•Tax forms
Invesco mailing information
Send general correspondence to Invesco Investment Services, Inc., P.O. Box 219078, Kansas City, MO 64121-9078.
Important notice regarding delivery of security holder documents
To reduce Fund expenses, only one copy of most shareholder documents may be mailed to shareholders with multiple accounts at the same address (Householding). Mailing of your shareholder documents may be householded indefinitely unless you instruct us otherwise. If you do not want the mailing of these documents to be combined with those for other members of your household, please contact Invesco Investment Services, Inc. at 800 959 4246 or contact your financial institution. We will begin sending you individual copies for each account within 30 days after receiving your request.
Fund holdings and proxy voting information
The Fund provides a complete list of its holdings four times in each fiscal year, at the quarter-ends. For the second and fourth quarters, the list appears in the Fund's semiannual and annual reports to shareholders. For the first and third quarters, the Fund files the lists with the Securities and Exchange Commission (SEC) as an exhibit to its reports on Form N-PORT. The most recent list of portfolio holdings is available at invesco.com/completeqtrholdings. Shareholders can also look up the Fund's Form N-PORT filings on the SEC website, sec.gov. The SEC file numbers for the Fund are shown below.
A description of the policies and procedures that the Fund uses to determine how to vote proxies relating to portfolio secu- rities is available without charge, upon request, from our Client Services department at 800 959 4246, or at invesco.com/ proxyguidelines. The information is also available on the SEC website, sec.gov.
Information regarding how the Fund voted proxies related to its portfolio securities during the most
recent 12-month period ended June 30 is available at invesco.com/proxysearch. This information is also available on the SEC website, sec.gov.
Invesco Advisers, Inc. is an investment adviser; it provides investment advisory services to individual and institutional clients and does not sell securities. Invesco Distributors, Inc. is the US distributor for Invesco Ltd.'s retail mutual funds, exchange-traded funds and institutional money market funds. Both are wholly owned, indirect subsidiaries of Invesco Ltd.
SEC file numbers: 811-05686 and 033-39519 | Invesco Distributors, Inc. | REA-AR-1 |
Annual Report to Shareholders | February 29, 2020 |
Invesco Short Duration Inflation Protected Fund
Nasdaq:
A: LMTAX A2: SHTIX Y: LMTYX R5: ALMIX R6: SDPSX
Beginning on January 1, 2021, as permitted by regulations adopted by the Securities and Exchange Commission, paper copies of the Fund's shareholder reports will no longer be sent by mail, unless you specifically request paper copies of the reports from the Fund or from your financial intermediary, such as a broker-dealer or bank. Instead, the reports will be made available on the Fund's web- site, and you will be notified by mail each time a report is posted and provided with a website link to access the report.
If you already elected to receive shareholder reports electronically, you will not be affected by this change and you need not take any action. You may elect to receive shareholder reports and other communications from the Fund electronically by contacting your financial intermediary (such as a broker-dealer or bank) or, if you are a direct investor, by enrolling at invesco.com/edelivery.
You may elect to receive all future reports in paper free of charge. If you invest through a financial intermediary, you can contact your financial intermediary to request that you continue to receive paper copies of your shareholder reports. If you invest directly with the Fund, you can call (800) 959-4246 to let the Fund know you wish to continue receiving paper copies of your shareholder reports. Your election to receive reports in paper will apply to all funds held with your financial intermediary or all funds held with the fund complex if you invest directly with the Fund.
Andrew Schlossberg
Letters to Shareholders
Dear Shareholders:
This annual report includes information about your Fund, including performance data and a complete list of its investments as of the close of the reporting period. Inside is a discussion of how your Fund was managed and the factors that affected its performance during the reporting period.
The reporting period proved to be another tumultuous time for both global equities and fixed-income secu- rities. In early 2019, global equity markets were buoyed by a more accommodative stance from central banks and optimism about a potential US-China trade deal. In May, US-China trade concerns and slowing global growth led to a global equity sell-off and rally in US Treasuries. Despite the May sell-off, domestic equity mar- kets rallied in June in anticipation of a US Federal Reserve (the Fed) interest rate cut and closed the second quarter with modest gains. Continued US-China trade worries and signs of slowing global economic growth led to increased market volatility in August. The US Treasury yield curve inverted several times as fears of a US recession increased. As a result, global equity markets were largely flat for the third quarter. In the final
months of 2019, geopolitical and macroeconomic issues largely abated. This combined with better-than-expected third quarter corporate earnings and initial agreement of the phase one US-China trade deal provided a favorable backdrop for equities and impressive fourth quar- ter global equity returns.
As the new year began, US equities were largely buoyed in January by the signing of the phase one trade agreement and strong eco- nomic data although returns were dampened by the spread of the Coronavirus (COVID-19). Concerns over the virus had a greater impact on international equities, which were largely lower for the month. As the virus spread outside of China and the number of cases increased, fears of diminished global growth led to a sharp global equity sell-off at the end of February 2020 and sent the yield on the US 10-year Treasury to a new all-time low.
Throughout 2019, central banks continued to be accommodative, providing sources of liquidity. In July, the Fed lowered interest rates for the first time in 11 years. It again lowered rates in September and once again in October. During the rest of the year, the Fed left rates unchanged. Overseas, the European Central Bank left its policy rate unchanged and continued its bond purchasing program. In 2020, with the increased spread of the coronavirus, the Fed shifted from a more neutral policy to the possibility of further rate cuts in the new year. As 2020 unfolds, we'll see how the interplay of interest rates, economic data, geopolitics and a host of other factors affect US and overseas equity and fixed income markets.
Investor uncertainty and market volatility, such as we witnessed during the reporting period, are unfortunate facts of life when it comes to investing. That's why Invesco encourages investors to work with a professional financial adviser who can stress the importance of starting to save and invest early and the importance of adhering to a disciplined investment plan. A financial adviser who knows your unique finan- cial situation, investment goals and risk tolerance can be an invaluable partner as you seek to achieve your financial goals. Financial advis- ers can also offer a long-term perspective when markets are volatile and time-tested advice and guidance when your financial situation or investment goals change.
Visit our website for more information on your investments
Our website, invesco.com/us, offers a wide range of market insights and investment perspectives. On the website, you'll find detailed infor- mation about our funds, including performance, holdings and portfolio manager commentaries. You can access information about your account by completing a simple, secure online registration. To do so, select "Log In" on the right side of the homepage, and then select "Register for Individual Account Access."
In addition to the resources accessible on our website and through our mobile app, you can obtain timely updates to help you stay informed about the markets and the economy by connecting with Invesco on Twitter, LinkedIn or Facebook. You can access our blog at blog.invesco.us.com. Our goal is to provide you the information you want, when and where you want it.
Finally, I'm pleased to share with you Invesco's commitment to both the Principles for Responsible Investment and to considering environ- mental, social and governance issues in our robust investment process. I invite you to learn more at invesco.com/esg.
Have questions?
For questions about your account, contact an Invesco client services representative at 800 959 4246.
All of us at Invesco look forward to serving your investment management needs. Thank you for investing with us.
Sincerely,
Andrew Schlossberg
Head of the Americas,
Senior Managing Director, Invesco Ltd.
2Invesco Short Duration Inflation Protected Fund
Bruce Crockett
Dear Shareholders:
Among the many important lessons I've learned in more than 40 years in a variety of business endeavors is the value of a trusted advocate.
As independent chair of the Invesco Funds Board, I can assure you that the members of the Board are strong advocates for the interests of investors in Invesco's mutual funds. We work hard to represent your interests through oversight of the quality of the investment management services your funds receive and other matters important to your investment, including but not limited to:
Ensuring that Invesco offers a diverse lineup of mutual funds that your financial adviser can use to strive to meet your financial needs as your investment goals change over time.
Monitoring how the portfolio management teams of the Invesco funds are performing in light of changing economic and market conditions.
Assessing each portfolio management team's investment performance within the context of the investment strategy described in the fund's prospectus.
Monitoring for potential conflicts of interests that may impact the nature of the services that your funds receive.
We believe one of the most important services we provide our fund shareholders is the annual review of the funds' advisory and sub-
advisory contracts with Invesco Advisers and its affiliates. This review is required by the Investment Company Act of 1940 and focuses on the nature and quality of the services Invesco provides as the adviser to the Invesco funds and the reasonableness of the fees that it charges for those services. Each year, we spend months carefully reviewing information received from Invesco and a variety of independent sources, such as performance and fee data prepared by Lipper, Inc. (a subsidiary of Broadridge Financial Solutions, Inc.), an independent, third-party firm widely recognized as a leader in its field. We also meet with our independent legal counsel and other independent advisers to review and help us assess the information that we have received. Our goal is to assure that you receive quality investment management services for a reasonable fee.
I trust the measures outlined above provide assurance that you have a worthy advocate when it comes to choosing the Invesco Funds. On behalf of the Board, we look forward to continuing to represent your interests and serving your needs.
Sincerely,
Bruce L. Crockett
Independent Chair
Invesco Funds Board of Trustees
3Invesco Short Duration Inflation Protected Fund

Management's Discussion of Fund Performance
Performance summary
For the fiscal year ended February 29, 2020, Class A shares of Invesco Short Du- ration Inflation Protected Fund (the Fund), at net asset value (NAV), underper- formed the Fund's broad market/style-specific benchmark, the ICE BofAML
1-5 Year US Inflation-Linked Treasury Index.
Your Fund's long-term performance appears later in this report.
Fund vs. Indexes
Total returns, February 28, 2019 to February 29, 2020, at net asset value (NAV). Performance shown does not include applicable contingent deferred sales charges (CDSC) or front-end sales charges, which would have reduced performance.
Class A Shares | 4.61% |
Class A2 Shares | 4.81 |
Class Y Shares | 4.86 |
Class R5 Shares | 4.91 |
Class R6 Shares | 4.92 |
ICE BofAML 1-5 Year US Inflation-Linked Treasury Index (Broad Market/Style- | |
Specifc Index) | 5.27 |
Lipper Inflation Protected Bond Funds Index (Peer Group Index) | 8.23 |
Source(s): RIMES Technologies Corp.; Lipper Inc.
basis point is one one-hundredth of a percent- age point.)
During the fiscal year, annual inflation, as measured by the Consumer Price Index (CPI), declined to a low of 1.6% in June 2019.4 However, the CPI subsequently increased steadily and ended the fiscal year at 2.3%.4 This increase was partly attributed to higher shelter and food costs.
Shorter-term US Treasury inflation pro- tected securities (TIPS) posted positive re- turns for the fiscal year as the ICE BofAML 1–5 Year US Inflation-Linked Treasury Index returned 5.27%. Considerably lower yields across maturities were the primary drivers of positive returns. The average yield on the broad market/style-specific index decreased 95 basis points and ended the fiscal year at -0.34% as TIPS prices increased in 2019 against a backdrop of lower interest rates.5 Shorter-term TIPS underperformed their nominal US Treasury counterparts on a maturity-matched basis as yields on nominal US Treasuries fell more than real yields for
Market conditions and your Fund
The fiscal year began with heightened volatil- ity as investors feared that the US Federal Reserve (the Fed) had gone too far in its monetary policy tightening and that the ef- fects would lead to a synchronized global eco- nomic growth slowdown. That uncertainty was quickly alleviated when the Fed changed its course and all but promised no rate hikes in 2019. The renewed risk appetite was fur- ther inspired by dovish central banks globally.
This trend continued throughout the fiscal year until February 2020, when investors began to fear that the spread of the Corona-
Portfolio Composition
By U.S. Treasury Securities
as of February 29, 2020
| Coupon | % of Total |
Maturity Date | Rate | Net Assets |
4/15/2021 | 0.12% | 7.81% |
7/15/2021 | 0.62 | 6.63 |
1/15/2022 | 0.13 | 7.55 |
4/15/2022 | 0.13 | 7.52 |
7/15/2022 | 0.13 | 7.44 |
1/15/2023 | 0.13 | 7.39 |
4/15/2023 | 0.62 | 8.01 |
7/15/2023 | 0.37 | 7.44 |
1/15/2024 | 0.62 | 7.50 |
4/15/2024 | 0.50 | 5.43 |
7/15/2024 | 0.13 | 7.23 |
10/15/2024 | 0.13 | 5.79 |
1/15/2025 | 2.37 | 6.92 |
1/15/2025 | 0.25 | 7.33 |
Other Assets Less | | |
Liabilities | | 0.01 |
The Fund's holdings are subject to change, and there is no assurance that the Fund will continue to hold any particular security.
Data presented here are as of February 29, 2020.
virus (COVID-19) would lead to a global eco- nomic slowdown.
The Fed cut interest rates three times dur- ing the fiscal year to a range of 1.50% to 1.75%.1 The European Central Bank also cut rates at the end of 2019 to -0.50%.2 This, coupled with easier fiscal and monetary policy in China and the continued economic woes plaguing the European Union, led to easier financial conditions globally, which, in turn, drove interest rates lower across maturities. The 10-year US Treasury yield ended the fis- cal year at 1.13%, 160 basis points lower than at the beginning of the fiscal year.3 (A
TIPS during the fiscal year. The difference between yields on a maturity-matched basis and nominal yields on US Treasuries and TIPS is a measure of inflation expectations, also known as breakeven inflation (the amount of inflation needed for TIPS to break even with nominal Treasuries).
We seek to replicate the risk and return characteristics of the Fund's broad market/ style-specific index, the ICE BofAML 1–5 Year US Inflation-Linked Treasury Index, by gener- ally investing in the component securities of the index in their respective weightings. For the fiscal year, the Fund generated positive returns and underperformed its broad
4Invesco Short Duration Inflation Protected Fund

market/style-specific benchmark. The Fund's performance will typically lag its index due to fees, as was the case this fiscal year.
We wish to remind you that the Fund is subject to real interest rate risk, meaning the values of inflation-indexed securities generally fluctuate in response to changes in real inter- est rates. However, the Fund invests in shorter-duration inflation-indexed securities, which tend to have less real interest rate risk. Inflation-indexed securities typically provide principal and interest payments that are ad- justed over time to reflect a rise (inflation) or a drop (deflation) in the general price level for goods and services. However, at maturity, the value of TIPS cannot fall below their par value. Real interest rates are tied to the rela- tionship between nominal interest rates and the rate of inflation. If nominal interest rates increase at a faster rate than inflation, real interest rates might rise, leading to a de- crease in value of inflation-indexed securities. Conversely, if inflation rises at a faster rate than nominal interest rates, real interest rates might decline, leading to an increase in value of inflation-indexed securities. The Fund's income from its investments in inflation- indexed securities is likely to fluctuate consid- erably more than the income distributions of its investments in more traditional fixed- income securities.
We are monitoring real interest rates and the market, as well as economic and geopoliti- cal factors that may impact the direction, speed and magnitude of changes to real inter- est rates across the maturity spectrum, in- cluding the potential impact of monetary policy changes by the Fed and certain foreign central banks. If real interest rates rise or fall faster than expected, inflation-indexed secu- rity markets may experience increased volatil- ity, which may affect the value and/or liquidity of the Fund's investments.
Thank you for investing in Invesco Short Duration Inflation Protected Fund and for sharing our long-term investment horizon.
1 Source: US Federal Reserve
2 Source: European Central Bank
3Source: US Department of the Treasury
4 Source: US Bureau of Labor Statistics
5 Source: Bloomberg
Portfolio Manager:
Robert Young
The views and opinions expressed in management's discussion of Fund performance are those of Invesco Advisers, Inc. These views and opinions are subject to change at any time based on factors such as market and economic conditions. These views and opinions may not be relied upon as investment advice or recommendations, or as an offer for a particular security. The information is not a complete analysis of every aspect of any market, country, industry, security or the Fund. Statements of fact are from sources considered reliable, but Invesco Advisers, Inc. makes no representation or warranty as to their completeness or accuracy. Although historical performance is no guarantee of future results,
these insights may help you understand our investment management philosophy.
See important Fund and, if applicable, index disclosures later in this report.
5Invesco Short Duration Inflation Protected Fund
Your Fund's Long-Term Performance
Results of a $10,000 Investment — Oldest Share Class(es)
Fund and index data from 2/28/10
$15,000
12,000
9,000
2/28/10 | 2/11 | 2/12 | 2/13 | 2/14 | 2/15 | 2/16 | 2/17 | 2/18 | 2/19 | 2/20 |
$13,548 Lipper Inflation Protected Bond Funds Index1
$11,901 ICE BofAML 1-5 Year US Inflation-Linked Treasury Index2
$11,068 Invesco Short Duration Inflation Protected Fund — Class R5 Shares*
$10,844 Invesco Short Duration Inflation Protected Fund — Class A2 Shares*
1 Source: Lipper Inc.
2 Source: RIMES Technologies Corp.
*The Fund's oldest share class (Class R5) does not have a sales charge. Therefore, the second-oldest share class, which has a sales charge (Class A2), is also included in the chart.
Past performance cannot guarantee future results.
The data shown in the chart include rein- vested distributions, applicable sales charges and Fund expenses including management
fees. Index results include reinvested divi- dends, but they do not reflect sales charges. Performance of the peer group, if applicable, reflects fund expenses and management fees; performance of a market index does not. Per-
formance shown in the chart and table(s) does not reflect deduction of taxes a share- holder would pay on Fund distributions or sale of Fund shares.
6Invesco Short Duration Inflation Protected Fund

Average Annual Total Returns
As of 2/29/20, including maximum applicable sales charges
Class A Shares
Inception (10/31/02) | 1.37% |
10 Years | 0.59 |
5 | Years | 1.03 |
1 | Year | 2.00 |
Class A2 Shares | |
Inception (12/15/87) | 3.72% |
10 Years | 0.81 |
5 | Years | 1.46 |
1 | Year | 3.79 |
Class Y Shares | |
Inception (10/3/08) | 1.11% |
10 Years | 1.00 |
5 | Years | 1.79 |
1 | Year | 4.86 |
Class R5 Shares | |
Inception (7/13/87) | 3.97% |
10 Years | 1.02 |
5 | Years | 1.80 |
1 | Year | 4.91 |
Class R6 Shares | |
10 Years | 0.98% |
5 | Years | 1.81 |
1 | Year | 4.92 |
Class R6 shares incepted on December 31, 2015. Performance shown prior to that date is that of Class A2 shares and in- cludes the 12b-1 fees applicable to Class A2 shares.
The performance data quoted represent past performance and cannot guarantee future results; current performance may be lower or higher. Please visit invesco.com/ performance for the most recent month- end performance. Performance figures re- flect reinvested distributions, changes in net asset value and the effect of the maxi- mum sales charge unless otherwise stated. Performance figures do not reflect deduc- tion of taxes a shareholder would pay on Fund distributions or sale of Fund shares. Investment return and principal value will fluctuate so that you may have a gain or loss when you sell shares.
Class A share performance reflects the maximum 2.50% sales charge. Class A2 share performance reflects the maximum 1.00% sales charge. Class Y, Class R5 and Class R6 shares do not have a front-end sales charge or a CDSC; therefore, perfor- mance is at net asset value.
The performance of the Fund's share classes will differ primarily due to different sales charge structures and class expenses. Fund performance reflects any applicable
fee waivers and/or expense reimburse- ments. Had the adviser not waived fees and/or reimbursed expenses currently or in
the past, returns would have been lower. See current prospectus for more informa- tion.
7Invesco Short Duration Inflation Protected Fund

Invesco Short Duration Inflation Protected Fund's investment objective is to provide protection from the negative effects of unanticipated inflation.
Unless otherwise stated, information presented in this report is as of February 29, 2020, and is based on total net assets.
Unless otherwise noted, all data provided by Invesco.
To access your Fund's reports/prospectus, visit invesco.com/fundreports.
About indexes used in this report
The ICE BofAML 1-5 Year US Inflation- Linked Treasury Index is composed of US Treasury inflation-protected securities with maturities between one and five years.
The Lipper Inflation Protected Bond Funds Index is an unmanaged index con- sidered representative of inflation pro- tected bond funds tracked by Lipper.
A direct investment cannot be made in an index. Unless otherwise indicated, index results include reinvested dividends, and they do not reflect sales charges. Perfor- mance of the peer group, if applicable, reflects fund expenses; performance of a market index does not.
This report must be accompanied or preceded by a currently effective Fund prospectus, which contains more complete information, including sales charges and expenses. Investors should read it carefully before investing.
NOT FDIC INSURED | MAY LOSE VALUE | NO BANK GUARANTEE
8Invesco Short Duration Inflation Protected Fund
Schedule of Investments
February 29, 2020 | | Principal | |
| | |
Interest | Maturity | Amount | |
Rate | Date | (000) | Value |
U.S. Treasury Securities–99.99%
U.S. Treasury Inflation — Indexed Notes–99.99%(a)
U.S. Treasury Inflation - Indexed Notes | 0.12% | 04/15/2021 | $42,853 | $ | 42,897,262 |
U.S. Treasury Inflation - Indexed Notes | 0.62% | 07/15/2021 | 35,938 | | 36,444,873 |
U.S. Treasury Inflation - Indexed Notes | 0.13% | 01/15/2022 | 41,214 | | 41,492,772 |
U.S. Treasury Inflation - Indexed Notes | 0.13% | 04/15/2022 | 41,015 | | 41,288,660 |
U.S. Treasury Inflation - Indexed Notes | 0.13% | 07/15/2022 | 40,293 | | 40,843,146 |
U.S. Treasury Inflation - Indexed Notes | 0.13% | 01/15/2023 | 40,138 | | 40,615,178 |
U.S. Treasury Inflation - Indexed Notes | 0.62% | 04/15/2023 | 42,790 | | 43,972,681 |
U.S. Treasury Inflation - Indexed Notes | 0.37% | 07/15/2023 | 39,815 | | 40,889,169 |
U.S. Treasury Inflation - Indexed Notes | 0.62% | 01/15/2024 | 39,693 | | 41,180,760 |
U.S. Treasury Inflation - Indexed Notes | 0.50% | 04/15/2024 | 28,861 | | 29,831,532 |
U.S. Treasury Inflation - Indexed Notes | 0.13% | 07/15/2024 | 38,759 | | 39,722,857 |
U.S. Treasury Inflation - Indexed Notes | 0.13% | 10/15/2024 | 30,998 | | 31,808,846 |
U.S. Treasury Inflation - Indexed Notes | 2.37% | 01/15/2025 | 33,538 | | 38,035,465 |
U.S. Treasury Inflation - Indexed Notes | 0.25% | 01/15/2025 | 39,059 | | 40,239,714 |
TOTAL INVESTMENTS IN SECURITIES–99.99% (Cost $539,481,582) | | | | | 549,262,915 |
OTHER ASSETS LESS LIABILITIES–0.01% | | | | | 67,477 |
NET ASSETS–100.00% | | | | $549,330,392 |
Notes to Schedule of Investments:
(a)Principal amount of security and interest payments are adjusted for inflation. See Note 1H.
See accompanying Notes to Financial Statements which are an integral part of the financial statements.
9Invesco Short Duration Inflation Protected Fund
Statement of Assets and Liabilities
February 29, 2020
Assets: | | |
Investments in securities, at value | | |
(Cost $539,481,582) | $549,262,915 | |
Receivable for: | | |
Fund shares sold | 366,766 | |
Dividends | 85 | |
Interest | 426,326 | |
Investment for trustee deferred compensation and | | |
retirement plans | 103,573 | |
Other assets | 29,219 | |
Total assets | 550,188,884 | |
Liabilities: | | |
Payable for: | | |
Fund shares reacquired | 152,338 | |
Amount due custodian | 405,093 | |
Accrued fees to affiliates | 35,445 | |
Accrued trustees' and officers' fees and benefits | 3,008 | |
Accrued other operating expenses | 149,707 | |
Trustee deferred compensation and retirement plans | 112,901 | |
Total liabilities | 858,492 | |
Net assets applicable to shares outstanding | $549,330,392 | |
Net assets consist of: | | |
Shares of beneficial interest | $563,248,107 | |
Distributable earnings (loss) | (13,917,715) |
| $549,330,392 | |
Net Assets: | | |
Class A | $ | 45,382,739 |
Class A2 | $ | 16,640,929 |
Class Y | $ | 17,905,914 |
Class R5 | $ | 2,340,178 |
Class R6 | $ | 467,060,632 |
Shares outstanding, no par value, with an unlimited number of shares authorized:
Class A | | 4,349,313 |
Class A2 | | 1,593,137 |
Class Y | | 1,713,654 |
Class R5 | | 224,113 |
Class R6 | | 44,711,256 |
Class A: | | |
Net asset value per share | $ | 10.43 |
Maximum offering price per share | | |
(Net asset value of $10.43 ÷ 97.50%) | $ | 10.70 |
Class A2: | | |
Net asset value per share | $ | 10.45 |
Maximum offering price per share | | |
(Net asset value of $10.45 ÷ 99.00%) | $ | 10.56 |
Class Y: | | |
Net asset value and offering price per share | $ | 10.45 |
Class R5: | | |
Net asset value and offering price per share | $ | 10.44 |
Class R6: | | |
Net asset value and offering price per share | $ | 10.45 |
See accompanying Notes to Financial Statements which are an integral part of the financial statements.
10 | Invesco Short Duration Inflation Protected Fund |
Statement of Operations
For the year ended February 29, 2020
Investment income: | | | |
Treasury Inflation-Protected Securities inflation adjustments | $12,753,438 | |
Interest | 2,597,903 | |
Dividends from affiliated money market funds | 4,505 | | |
Total investment income | 15,355,846 | |
Expenses: | | | |
Advisory fees | 1,111,190 | |
Administrative services fees | 80,204 | | |
Custodian fees | 15,903 | | |
Distribution fees: | | | |
Class A | 112,153 | | |
Class A2 | 25,342 | | |
Transfer agent fees — A, A2, and Y | 114,124 | | |
Transfer agent fees — R5 | 701 | | |
Transfer agent fees — R6 | 5,609 | | |
Trustees' and officers' fees and benefits | 26,350 | | |
Registration and filing fees | 83,937 | | |
Licensing fees | 112,707 | | |
Reports to shareholders | 9,375 | | |
Professional services fees | 14,016 | | |
Other | 14,255 | | |
Total expenses | 1,725,866 | | |
Less: Fees waived, expenses reimbursed and/or expense offset arrangement(s) | (84,728) |
Net expenses | 1,641,138 | | |
Net investment income | 13,714,708 | |
Realized and unrealized gain (loss) from: | | | |
Net realized gain (loss) from investment securities | (4,699,221) |
Change in net unrealized appreciation of investment securities | 18,466,453 | |
Net realized and unrealized gain | 13,767,232 | |
Net increase in net assets resulting from operations | $27,481,940 | |
See accompanying Notes to Financial Statements which are an integral part of the financial statements.
11 | Invesco Short Duration Inflation Protected Fund |
Statement of Changes in Net Assets
For the years ended February 29, 2020 and February 28, 2019
| | 2020 | | 2019 | | |
Operations: | | | | | | |
Net investment income | $ | 13,714,708 | $ | 16,501,187 |
Net realized gain (loss) | | (4,699,221) | | (11,033,375) |
Change in net unrealized appreciation | | 18,466,453 | | 5,604,084 |
Net increase in net assets resulting from operations | | 27,481,940 | | 11,071,896 |
Distributions to shareholders from distributable earnings: | | | | | | |
Class A | | (716,900) | | (1,168,210) |
| | | | | | |
Class A2 | | (284,986) | | (482,204) |
| | | | | | |
Class Y | | (217,029) | | (330,480) |
| | | | | | |
Class R5 | | (50,696) | | (23,473) |
| | | | | | |
Class R6 | | (9,505,471) | | (18,389,116) |
| | | | | | |
Total distributions from distributable earnings | | (10,775,082) | | (20,393,483) |
Return of capital: | | | | | | |
Class A | | (127,457) | | — | |
Class A2 | | (50,667) | | — | |
Class Y | | (38,586) | | — | |
Class R5 | | (9,013) | | — | |
Class R6 | | (1,689,975) | | — | |
Total return of capital | | (1,915,698) | | — | |
Total distributions | | (12,690,780) | | — |
Share transactions–net: | | | | | | |
Class A | | (2,181,523) | | 1,393,651 |
Class A2 | | (1,059,533) | | (2,333,195) |
| | | | | |
Class Y | | 7,695,748 | | (2,770,274) |
Class R5 | | (709,349) | | 2,240,559 |
Class R6 | | (170,261,367) | | (76,491,971) |
| | | | | |
Net increase (decrease) in net assets resulting from share transactions | | (166,516,024) | | (77,961,230) |
| | | | | |
Net increase (decrease) in net assets | | (151,724,864) | | (87,282,817) |
Net assets: | | | | | | |
Beginning of year | | 701,055,256 | | 788,338,073 |
End of year | $ | 549,330,392 | $701,055,256 |
See accompanying Notes to Financial Statements which are an integral part of the financial statements.
12 | Invesco Short Duration Inflation Protected Fund |
Financial Highlights
The following schedule presents financial highlights for a share of the Fund outstanding throughout the periods indicated.
| | | | | | | | | | | Ratio of | Ratio of | | | |
| | | | | | | | | | | expenses | expenses | | | |
| | | Net gains | | | | | | | | to average | to average net | Ratio of net | | |
| | | (losses) | | | | | | | | net assets | assets without | investment | | |
| Net asset | Net | on securities | | Dividends | | | | | | with fee waivers | fee waivers | income | | |
| value, | investment | (both | Total from | from net | | | Net asset | | Net assets, | and/or | and/or | (loss) | | |
| beginning | income | realized and | investment | investment | Return of | Total | value, end | Total | end ofperiod | expenses | expenses | to average | | Portfolio |
| ofperiod | (loss)(a) | unrealized) | operations | income | capital | distributions | ofperiod | return (b) | (000's omitted) | absorbed | absorbed | net assets | turnover (c) |
Class A | | | | | | | | | | | 0.55%(d) | 0.66%(d) | 2.17%(d) | |
Year ended 02/29/20 | $10.16 | $ 0.22 | $ 0.24 | $ 0.46 | $(0.16) | $(0.03) | $(0.19) | $10.43 | 4.61% | $ 45,383 | 45% |
Year ended 02/28/19 | 10.29 | 0.20 | (0.08) | 0.12 | (0.25) | — | (0.25) | 10.16 | 1.23 | 46,384 | 0.55 | 0.67 | 1.97 | | 37 |
Year ended 02/28/18 | 10.58 | 0.20 | (0.29) | (0.09) | (0.20) | — | (0.20) | 10.29 | (0.86) | 45,609 | 0.55 | 0.65 | 2.02 | | 48 |
Year ended 02/28/17 | 10.50 | 0.13 | 0.08 | 0.21 | (0.12) | (0.01) | (0.13) | 10.58 | 2.04 | 39,978 | 0.55 | 0.70 | 1.18 | | 41 |
Year ended 02/29/16 | 10.42 | (0.05) | 0.14 | 0.09 | (0.01) | — | (0.01) | 10.50 | 0.83 | 34,373 | 0.52 | 0.90 | (0.52) | | 199 |
Class A2 | | | | | | | | | | | 0.45(d) | 0.56(d) | 2.27(d) | | 45 |
Year ended 02/29/20 | 10.17 | 0.23 | 0.25 | 0.48 | (0.17) | (0.03) | (0.20) | 10.45 | 4.81 | 16,641 | |
Year ended 02/28/19 | 10.30 | 0.21 | (0.08) | 0.13 | (0.26) | — | (0.26) | 10.17 | 1.33 | 17,255 | 0.45 | 0.57 | 2.07 | | 37 |
Year ended 02/28/18 | 10.59 | 0.22 | (0.30) | (0.08) | (0.21) | — | (0.21) | 10.30 | (0.76) | 19,826 | 0.45 | 0.55 | 2.12 | | 48 |
Year ended 02/28/17 | 10.51 | 0.13 | 0.09 | 0.22 | (0.13) | (0.01) | (0.14) | 10.59 | 2.14 | 22,234 | 0.45 | 0.60 | 1.28 | | 41 |
Year ended 02/29/16 | 10.42 | (0.05) | 0.15 | 0.10 | (0.01) | — | (0.01) | 10.51 | 0.92 | 24,851 | 0.50 | 0.80 | (0.50) | | 199 |
Class Y | | | | | | | | | | | 0.30(d) | 0.41(d) | 2.42(d) | | 45 |
Year ended 02/29/20 | 10.18 | 0.25 | 0.24 | 0.49 | (0.19) | (0.03) | (0.22) | 10.45 | 4.86 | 17,906 | |
Year ended 02/28/19 | 10.31 | 0.23 | (0.08) | 0.15 | (0.28) | — | (0.28) | 10.18 | 1.48 | 9,843 | 0.30 | 0.42 | 2.22 | | 37 |
Year ended 02/28/18 | 10.59 | 0.24 | (0.29) | (0.05) | (0.23) | — | (0.23) | 10.31 | (0.51) | 12,778 | 0.30 | 0.40 | 2.27 | | 48 |
Year ended 02/28/17 | 10.51 | 0.15 | 0.09 | 0.24 | (0.14) | (0.02) | (0.16) | 10.59 | 2.30 | 9,656 | 0.30 | 0.45 | 1.43 | | 41 |
Year ended 02/29/16 | 10.42 | (0.05) | 0.15 | 0.10 | (0.01) | — | (0.01) | 10.51 | 0.92 | 10,471 | 0.48 | 0.65 | (0.48) | | 199 |
Class R5 | | | | | | | | | | | 0.29(d) | 0.29(d) | 2.43(d) | | |
Year ended 02/29/20 | 10.18 | 0.25 | 0.23 | 0.48 | (0.19) | (0.03) | (0.22) | 10.44 | 4.81 | 2,340 | | 45 |
Year ended 02/28/19 | 10.31 | 0.23 | (0.08) | 0.15 | (0.28) | — | (0.28) | 10.18 | 1.50 | 2,976 | 0.28 | 0.28 | 2.24 | | 37 |
Year ended 02/28/18 | 10.59 | 0.24 | (0.29) | (0.05) | (0.23) | — | (0.23) | 10.31 | (0.50) | 723 | 0.29 | 0.29 | 2.28 | | 48 |
Year ended 02/28/17 | 10.52 | 0.15 | 0.08 | 0.23 | (0.14) | (0.02) | (0.16) | 10.59 | 2.21 | 783 | 0.30 | 0.32 | 1.43 | | 41 |
Year ended 02/29/16 | 10.43 | (0.05) | 0.15 | 0.10 | (0.01) | — | (0.01) | 10.52 | 0.95 | 608 | 0.48 | 0.59 | (0.48) | | 199 |
Class R6 | | | | | | | | | | | 0.26(d) | 0.26(d) | 2.46(d) | | 45 |
Year ended 02/29/20 | 10.18 | 0.25 | 0.24 | 0.49 | (0.19) | (0.03) | (0.22) | 10.45 | 4.92 | 467,061 | |
Year ended 02/28/19 | 10.31 | 0.23 | (0.08) | 0.15 | (0.28) | — | (0.28) | 10.18 | 1.52 | 624,598 | 0.27 | 0.27 | 2.25 | | 37 |
Year ended 02/28/18 | 10.59 | 0.24 | (0.29) | (0.05) | (0.23) | — | (0.23) | 10.31 | (0.48) | 709,402 | 0.26 | 0.26 | 2.31 | | 48 |
Year ended 02/28/17 | 10.51 | 0.15 | 0.09 | 0.24 | (0.14) | (0.02) | (0.16) | 10.59 | 2.32 | 718,865 | 0.29 | 0.29 | 1.44 | | 41 |
Year ended 02/29/16(e) | 10.40 | (0.01) | 0.12 | 0.11 | — | — | — | 10.51 | 1.06 | 36,414 | 0.30(f) | 0.46(f) | (0.30)(f) | | 199 |
(a)Calculated using average shares outstanding.
(b)Includes adjustments in accordance with accounting principles generally accepted in the United States of America and as such, the net asset value for financial reporting purposes and the returns based upon those net asset values may differ from the net asset value and returns for shareholder transactions. Does not include sales charges and is not annualized for periods less than one year, if applicable.
(c)Portfolio turnover is calculated at the fund level and is not annualized for periods less than one year, if applicable.
(d)Ratios are based on average daily net assets (000's omitted) of $44,861, $16,895, $13,713 , $2,649 and $485,419 for Class A, Class A2, Class Y, Class R5 and Class R6 shares, respectively.
(e)Commencement date of December 31, 2015.
(f)Annualized.
See accompanying Notes to Financial Statements which are an integral part of the financial statements.
13 | Invesco Short Duration Inflation Protected Fund |
Notes to Financial Statements
February 29, 2020
NOTE 1—Significant Accounting Policies
Invesco Short Duration Inflation Protected Fund (the "Fund"), is a series portfolio of AIM Investment Securities Funds (Invesco Investment Securities Funds) (the "Trust"). The Trust is organized as a Delaware statutory trust and is registered under the Investment Company Act of 1940, as amended (the "1940 Act"), as an open-end series management investment company authorized to issue an unlimited number of shares of beneficial interest. Information presented in these financial statements pertains only to the Fund. Matters affecting the Fund or each class will be voted on exclusively by the shareholders of the Fund or each class.
The Fund's investment objective is to provide protection from the negative effects of unanticipated inflation.
The Fund currently consists of five different classes of shares: Class A, Class A2, Class Y, Class R5 and Class R6. Class A and Class A2 shares are sold with a front-end sales charge unless certain waiver criteria are met. Under certain circumstances, load waived shares may be subject to contingent deferred sales charges ("CDSC"). Class Y, Class R5 and Class R6 shares are sold at net asset value.
As of the close of business on October 30, 2002, Class A2 shares are closed to new investors.
The Fund is an investment company and accordingly follows the investment company accounting and reporting guidance in accordance with Financial Accounting Standards Board Accounting Standards Codification Topic 946, Financial Services – Investment Companies.
The following is a summary of the significant accounting policies followed by the Fund in the preparation of its financial statements.
A.Security Valuations – Securities, including restricted securities, are valued according to the following policy.
Securities are fair valued using an evaluated quote provided by an independent pricing service approved by the Board of Trustees. Evaluated quotes provided by the pricing service may be determined without exclusive reliance on quoted prices and may reflect appropriate factors such as institution-size trading in similar groups of securities, yield, quality, coupon rate, maturity, type of issue, individual trading characteristics and other market data. Pricing services generally value debt obligations assuming orderly transactions of institutional round lot size, but a fund may hold or transact in the same securities in smaller, odd lot sizes. Odd lots often trade at lower prices than institutional round lots. Debt securities are subject to interest rate and credit risks. In addition, all debt securities involve some risk of default with respect to interest and principal payments.
Securities for which market quotations either are not readily available or became unreliable are valued at fair value as determined in good faith by or under the supervision of the Trust's officers following procedures approved by the Board of Trustees. Some of the factors which may be considered in determining fair value are fundamental analytical data relating to the investment; the nature and duration of any restrictions on transferability or disposition; trading in similar securities by the same issuer or comparable companies; relevant political, economic or issuer specific news; and other relevant factors under the circumstances.
The Fund may invest in securities that are subject to interest rate risk, meaning the risk that the prices will generally fall as interest rates rise and, conversely, the prices will generally rise as interest rates fall. Specific securities differ in their sensitivity to changes in interest rates depending on their individual characteristics. Changes in interest rates may result in increased market volatility, which may affect the value and/or liquidity of certain Fund investments.
Valuations change in response to many factors including the historical and prospective earnings of the issuer, the value of the issuer's assets, general economic conditions, interest rates, investor perceptions and market liquidity. Because of the inherent uncertainties of valuation, the values reflected in the financial statements may materially differ from the value received upon actual sale of those investments.
B.Securities Transactions and Investment Income – Securities transactions are accounted for on a trade date basis. Realized gains or losses on sales are computed on the basis of specific identification of the securities sold. Interest income (net of withholding tax, if any) is recorded on an accrual basis from settlement date. Bond premiums and discounts are amortized and/or accreted over the lives of the respective securities. Pay-in-kind interest income and non-cash dividend income received in the form of securities in-lieu of cash are recorded at the fair value of the securities received.
The Fund may periodically participate in litigation related to Fund investments. As such, the Fund may receive proceeds from litigation settlements. Any proceeds received are included in the Statement of Operations as realized gain (loss) for investments no longer held and as unrealized gain (loss) for investments still held.
Brokerage commissions and mark ups are considered transaction costs and are recorded as an increase to the cost basis of securities purchased and/or a reduction of proceeds on a sale of securities. Such transaction costs are included in the determination of net realized and unrealized gain (loss) from investment securities reported in the Statement of Operations and the Statement of Changes in Net Assets and the net realized and unrealized gains (losses) on securities per share in the Financial Highlights. Transaction costs are included in the calculation of the Fund's net asset value and, accordingly, they reduce the Fund's total returns. These transaction costs are not considered operating expenses and are not reflected in net investment income reported in the Statement of Operations and the Statement of Changes in Net Assets, or the net investment income per share and the ratios of expenses and net investment income reported in the Financial Highlights, nor are they limited by any expense limitation arrangements between the Fund and the investment adviser.
The Fund allocates realized and unrealized capital gains and losses to a class based on the relative net assets of each class. The Fund allocates income to a class based on the relative value of the settled shares of each class.
C.Distributions - Distributions from net investment income, if any, are declared and paid quarterly and are recorded on the ex-dividend date. Distributions from net realized capital gain, if any, are generally declared and paid annually and recorded on the ex-dividend date. The Fund may elect to treat a portion of the proceeds from redemptions as distributions for federal income tax purposes.
D.Federal Income Taxes – The Fund intends to comply with the requirements of Subchapter M of the Internal Revenue Code of 1986, as amended (the "Internal Revenue Code"), necessary to qualify as a regulated investment company and to distribute substantially all of the Fund's taxable earnings to shareholders. As such, the Fund will not be subject to federal income taxes on otherwise taxable income (including net realized capital gain) that is distributed to shareholders. Therefore, no provision for federal income taxes is recorded in the financial statements.
The Fund recognizes the tax benefits of uncertain tax positions only when the position is more likely than not to be sustained. Management has analyzed the Fund's uncertain tax positions and concluded that no liability for unrecognized tax benefits should be recorded related to uncertain tax positions. Management is not aware of any tax positions for which it is reasonably possible that the total amounts of unrecognized tax benefits will change materially in the next 12 months.
The Fund files tax returns in the U.S. Federal jurisdiction and certain other jurisdictions. Generally, the Fund is subject to examinations by such taxing authorities for up to three years after the filing of the return for the tax period.
E.Expenses – Fees provided for under the Rule 12b-1 plan of a particular class of the Fund are charged to the operations of such class. Transfer agency fees and expenses and other shareholder recordkeeping fees and expenses attributable to Class R5 and Class R6 are allocated to each share class based on relative net assets. Sub-accounting fees attributable to Class R5 are charged to the operations of the class. Transfer agency fees and expenses and other shareholder recordkeeping fees and expenses relating to all other classes are allocated among those classes based on relative net assets. All other expenses are allocated among the classes based on relative net assets.
F.Accounting Estimates – The preparation of financial statements in conformity with accounting principles generally accepted in the United States of America ("GAAP") requires management to make estimates and assumptions that affect the reported amounts of assets and liabilities at the date of the financial statements and the reported amounts of revenues and expenses during the reporting period including estimates and assumptions related to taxation. Actual results could differ from those estimates by a significant amount. In addition, the Fund monitors for material events or transactions that may occur or become known after the period-end date and before the date the financial statements are released to print.
14 | Invesco Short Duration Inflation Protected Fund |
G.Indemnifications – Under the Trust's organizational documents, each Trustee, officer, employee or other agent of the Trust is indemnified against certain liabilities that may arise out of the performance of their duties to the Fund. Additionally, in the normal course of business, the Fund enters into contracts, including the Fund's servicing agreements, that contain a variety of indemnification clauses. The Fund's maximum exposure under these arrangements is unknown as this would involve future claims that may be made against the Fund that have not yet occurred. The risk of material loss as a result of such indemnification claims is considered remote.
H.Treasury Inflation-Protected Securities — The Fund may invest in Treasury Inflation-Protected Securities ("TIPS"). TIPS are fixed income securities whose principal value is periodically adjusted to the rate of inflation. The principal value of TIPS will be adjusted upward or downward, and any increase or decrease in the principal amount of TIPS will be shown as Treasury Inflation-Protected Securities inflation adjustments in the Statement of Operations, even though investors do not receive their principal until maturity.
NOTE 2—Advisory Fees and Other Fees Paid to Affiliates
The Trust has entered into a master investment advisory agreement with Invesco Advisers, Inc. (the "Adviser" or "Invesco"). Under the terms of the investment advisory agreement, the Fund accrues daily and pays monthly an advisory fee to the Adviser based on the annual rate of the Fund's average daily net assets as follows:
Average Daily Net Assets | Rate |
First $500 million | 0.200% |
Over $500 million | 0.175% |
| |
For the year ended February 29, 2020, the effective advisory fee rate incurred by the Fund was 0.20%.
Under the terms of a master sub-advisory agreement between the Adviser and each of Invesco Asset Management Deutschland GmbH, Invesco Asset Management Limited, Invesco Asset Management (Japan) Limited, Invesco Hong Kong Limited, Invesco Senior Secured Management, Inc. and Invesco Canada Ltd. (collectively, the "Affiliated Sub-Advisers") the Adviser, not the Fund, will pay 40% of the fees paid to the Adviser to any such Affiliated Sub-Adviser(s) that provide(s) discretionary investment management services to the Fund based on the percentage of assets allocated to such Affiliated Sub-Adviser(s).
The Adviser has contractually agreed, through at least June 30, 2020, to waive advisory fees and/or reimburse expenses of all shares to the extent necessary to limit total annual fund operating expenses after fee waiver and/or expense reimbursement (excluding certain items discussed below) of Class A, Class A2, Class Y, Class R5 and Class R6 shares to 0.55%, 0.45%, 0.30%, 0.30% and 0.30%, respectively, of average daily net assets (the "expense limits"). In determining the Adviser's obligation to waive advisory fees and/or reimburse expenses, the following expenses are not taken into account, and could cause the total annual fund operating expenses after fee waiver and/or expense reimbursement to exceed the numbers reflected above: (1) interest; (2) taxes; (3) dividend expense on short sales; (4) extraordinary or non-routine items, including litigation expenses; and (5) expenses that the Fund has incurred but did not actually pay because of an expense offset arrangement. Unless Invesco continues the fee waiver agreement, it will terminate on June 30, 2020. During its term, the fee waiver agreement cannot be terminated or amended to increase the expense limits or reduce the advisory fee waiver without approval of the Board of Trustees.
The Adviser has contractually agreed, through at least June 30, 2021, to waive the advisory fee payable by the Fund in an amount equal to 100% of the net advisory fees the Adviser receives from the affiliated money market funds on investments by the Fund of uninvested cash in such affiliated money market funds.
For the year ended February 29, 2020, the Adviser waived advisory fees of $306 and reimbursed class level expenses of $49,424, $18,614, $15,107, $0 and $0 of Class A, Class A2, Class Y, Class R5 and Class R6 shares, respectively.
The Trust has entered into a master administrative services agreement with Invesco pursuant to which the Fund has agreed to pay Invesco for certain administrative costs incurred in providing accounting services to the Fund. For the year ended February 29, 2020, expenses incurred under the agreement are shown in the Statement of Operations as Administrative services fees. Invesco has entered into a sub-administration agreement whereby State Street Bank and Trust Company ("SSB") serves as fund accountant and provides certain administrative services to the Fund. Pursuant to a custody agreement with the Trust on behalf of the Fund, SSB also serves as the Fund's custodian.
The Trust has entered into a transfer agency and service agreement with Invesco Investment Services, Inc. ("IIS") pursuant to which the Fund has agreed to pay IIS a fee for providing transfer agency and shareholder services to the Fund and reimburse IIS for certain expenses incurred by IIS in the course of providing such services. IIS may make payments to intermediaries that provide omnibus account services, sub-accounting services and/or networking services. All fees payable by IIS to intermediaries that provide omnibus account services or sub-accounting services are charged back to the Fund, subject to certain limitations approved by the Trust's Board of Trustees. For the year ended February 29, 2020, expenses incurred under the agreement are shown in the Statement of Operations as Transfer agent fees.
The Trust has entered into master distribution agreements with Invesco Distributors, Inc. ("IDI") to serve as the distributor for the Class A, Class A2, Class Y, Class R5 and Class R6 shares of the Fund. The Trust has adopted plans pursuant to Rule 12b-1 under the 1940 Act with respect to the Fund's Class A and Class A2 shares (collectively, the "Plans"). The Fund, pursuant to the Plans, pays IDI compensation at the annual rate of 0.25% of the average daily net assets of Class A shares and 0.15% of the Fund's average daily net assets of Class A2 shares. The fees are accrued daily and paid monthly. Of the Plan payments, up to 0.25% of the average daily net assets of each class of shares may be paid to furnish continuing personal shareholder services to customers who purchase and own shares of such classes. Any amounts not paid as a service fee under the Plans would constitute an asset-based sales charge. Rules of the Financial Industry Regulatory Authority ("FINRA") also impose a cap on the total sales charges, including asset-based sales charges, that may be paid by any class of shares of the Fund. For the year ended February 29, 2020, expenses incurred under the Plans are shown in the Statement of Operations as Distribution fees.
Front-end sales commissions and CDSC (collectively, the "sales charges") are not recorded as expenses of the Fund. Front-end sales commissions are deducted from proceeds from the sales of Fund shares prior to investment in Class A and Class A2 shares of the Fund. CDSC are deducted from redemption proceeds prior to remittance to the shareholder. During the year ended February 29, 2020, IDI advised the Fund that IDI retained $7,068 and $141 in front-end sales commissions from the sale of Class A and Class A2 shares, respectively, and $4,444 and $0 from Class A and Class A2 shares, respectively, for CDSC was imposed upon redemptions by shareholders.
Certain officers and trustees of the Trust are officers and directors of the Adviser, IIS and/or IDI.
NOTE 3—Additional Valuation Information
GAAP defines fair value as the price that would be received to sell an asset or paid to transfer a liability in an orderly transaction between market participants at the measurement date, under current market conditions. GAAP establishes a hierarchy that prioritizes the inputs to valuation methods, giving the highest priority to readily available unadjusted quoted prices in an active market for identical assets (Level 1) and the lowest priority to significant unobservable inputs (Level 3), generally when market prices are not readily available or are unreliable. Based on the valuation inputs, the securities or other investments are tiered into one of three levels. Changes in valuation methods may result in transfers in or out of an investment's assigned level:
Level 1 — Prices are determined using quoted prices in an active market for identical assets.
Level 2 — Prices are determined using other significant observable inputs. Observable inputs are inputs that other market participants may use in pricing a security. These may include quoted prices for similar securities, interest rates, prepayment speeds, credit risk, yield curves, loss severities, default rates, discount rates, volatilities and others.
15 | Invesco Short Duration Inflation Protected Fund |

Level 3 — Prices are determined using significant unobservable inputs. In situations where quoted prices or observable inputs are unavailable (for example, when there is little or no market activity for an investment at the end of the period), unobservable inputs may be used. Unobservable inputs reflect the Fund's own assumptions about the factors market participants would use in determining fair value of the securities or instruments and would be based on the best available information.
As of February 29, 2020, all of the securities in this Fund were valued based on Level 2 inputs (see the Schedule of Investments for security categories). The level assigned to the securities valuations may not be an indication of the risk or liquidity associated with investing in those securities. Because of the inherent uncertainties of valuation, the values reflected in the financial statements may materially differ from the value received upon actual sale of those investments.
NOTE 4—Expense Offset Arrangement(s)
The expense offset arrangement is comprised of transfer agency credits which result from balances in demand deposit accounts used by the transfer agent for clearing shareholder transactions. For the year ended February 29, 2020, the Fund received credits from this arrangement, which resulted in the reduction of the Fund's total expenses of $1,277.
NOTE 5—Trustees' and Officers' Fees and Benefits
Trustees' and Officers' Fees and Benefits include amounts accrued by the Fund to pay remuneration to certain Trustees and Officers of the Fund. Trustees have the option to defer compensation payable by the Fund, and Trustees' and Officers' Fees and Benefits also include amounts accrued by the Fund to fund such deferred compensation amounts. Those Trustees who defer compensation have the option to select various Invesco Funds in which their deferral accounts shall be deemed to be invested. Finally, certain current Trustees were eligible to participate in a retirement plan that provided for benefits to be paid upon retirement to Trustees over a period of time based on the number of years of service. The Fund may have certain former Trustees who also participate in a retirement plan and receive benefits under such plan. Trustees' and Officers' Fees and Benefits include amounts accrued by the Fund to fund such retirement benefits. Obligations under the deferred compensation and retirement plans represent unsecured claims against the general assets of the Fund.
NOTE 6—Cash Balances
The Fund may borrow for leveraging in an amount up to 5% of the Fund's total assets (excluding the amount borrowed) at the time the borrowing is made. In doing so, the Fund is permitted to temporarily carry a negative or overdrawn balance in its account with SSB, the custodian bank. Such balances, if any at period end, are shown in the Statement of Assets and Liabilities under the payable caption Amount due custodian. To compensate the custodian bank for such overdrafts, the overdrawn Fund may either (1) leave funds as a compensating balance in the account so the custodian bank can be compensated by earning the additional interest; or (2) compensate by paying the custodian bank at a rate agreed upon by the custodian bank and Invesco, not to exceed the contractually agreed upon rate. The Fund may not purchase additional securities when any borrowings from banks or broker-dealers exceed 5% of the Fund's total assets, or when any borrowings from an Invesco Fund are outstanding.
NOTE 7—Distributions to Shareholders and Tax Components of Net Assets
Tax Character of Distributions to Shareholders Paid During the Fiscal Years Ended February 29, 2020 and February 28, 2019:
| | 2020 | 2019 | | |
Ordinary income | $10,775,082 | $20,393,483 | |
Return of capital | 1,915,698 | — |
| | | | |
Total distributions | $12,690,780 | $20,393,483 | |
Tax Components of Net Assets at Period-End: | | | | |
| | | 2020 | | |
Net unrealized appreciation — investments | | $ 8,399,888 | |
Temporary book/tax differences | | (94,787) |
| | | |
Late-Year ordinary loss deferral | | (565,161) |
| | | |
Capital loss carryforward | | (21,657,655) |
Shares of beneficial interest | | 563,248,107 | |
| | | |
Total net assets | | $549,330,392 | |
The difference between book-basis and tax-basis unrealized appreciation (depreciation) is due to differences in the timing of recognition of gains and losses on investments for tax and book purposes. The Fund's net unrealized appreciation (depreciation) difference is attributable primarily to TIPS and wash sales.
The temporary book/tax differences are a result of timing differences between book and tax recognition of income and/or expenses. The Fund's temporary book/tax differences are the result of the trustee deferral of compensation and retirement plan benefits.
Capital loss carryforward is calculated and reported as of a specific date. Results of transactions and other activity after that date may affect the amount of capital loss carryforward actually available for the Fund to utilize. The ability to utilize capital loss carryforward in the future may be limited under the Internal Revenue Code and related regulations based on the results of future transactions.
The Fund has a capital loss carryforward as of February 29, 2020, as follows:
Capital Loss Carryforward*
Expiration | Short-Term | Long-Term | Total |
Not subject to expiration | $1,826,279 | $19,831,376 | $21,657,655 |
*Capital loss carryforward is reduced for limitations, if any, to the extent required by the Internal Revenue Code and may be further limited depending upon a variety of factors, including the realization of net unrealized gains or losses as of the date of any reorganization.
16 | Invesco Short Duration Inflation Protected Fund |

NOTE 8—Investment Transactions
The aggregate amount of long-term U.S. government obligations (other than short-term securities and money market funds, if any) purchased and sold by the Fund during the year ended February 29, 2020 was $255,604,810 and $432,032,063, respectively. Cost of investments, including any derivatives, on a tax basis includes the adjustments for financial reporting purposes as of the most recently completed federal income tax reporting period-end.
Unrealized Appreciation (Depreciation) of Investments on a Tax Basis
Aggregate unrealized appreciation of investments | $8,705,633 | |
Aggregate unrealized (depreciation) of investments | (305,745) |
Net unrealized appreciation of investments | $8,399,888 | |
Cost of investments for tax purposes is $540,863,027.
NOTE 9—Reclassification of Permanent Differences
Primarily as a result of differing book/tax treatment of return of capital, on February 29, 2020, undistributed net investment income was increased by $1,917,885, undistributed net realized gain (loss) was decreased by $2,187 and shares of beneficial interest was decreased by $1,915,698. This reclassification had no effect on the net assets of the Fund.
NOTE 10—Share Information
Summary of Share Activity
| Year ended | Year ended |
| February 29, 2020(a) | | February 28, 2019 | |
| Shares | | Amount | Shares | | Amount |
Sold: | | | | | | | | | |
Class A | 1,706,717 | $ | 17,580,951 | 3,347,554 | $ | 34,257,861 | |
Class A2 | 15,427 | | 158,707 | 21,865 | | 224,603 | | |
Class Y | 1,750,771 | | 18,092,154 | 719,407 | | 7,410,177 | | |
Class R5 | 49,765 | | 510,746 | 227,117 | | 2,290,484 | |
Class R6 | 2,149,948 | | 22,180,815 | 2,770,866 | | 28,410,115 | |
Issued as reinvestment of dividends: | | | | | | | | | |
Class A | 72,327 | | 742,797 | 103,160 | | 1,048,727 | | |
Class A2 | 28,207 | | 289,967 | 41,506 | | 422,514 | | |
Class Y | 21,461 | | 220,733 | 29,914 | | 304,595 | | |
Class R5 | 1,106 | | 11,382 | 592 | | 6,003 | | |
Class R6 | 1,089,631 | | 11,193,032 | 1,805,587 | | 18,386,854 | |
Reacquired: | | | | | | | | | |
Class A | (1,993,431) | | (20,505,271) | (3,317,813) | | (33,912,937) |
| | | | | | | |
Class A2 | (146,446) | | (1,508,207) | (291,586) | | (2,980,312) |
| | | | | | | |
Class Y | (1,025,733) | | (10,617,139) | (1,021,967) | | (10,485,046) |
| | | | | | | |
Class R5 | (119,124) | | (1,231,477) | (5,492) | | (55,928) |
| | | | | | | |
Class R6 | (19,895,701) | | (203,635,214) | (12,029,764) | | (123,288,940) |
| | | | | | | |
Net increase (decrease) in share activity | (16,295,075) | $ | (166,516,024) | (7,599,054) | $ | (77,961,230) |
| | | | | | | | | |
(a)There are entities that are record owners of more than 5% of the outstanding shares of the Fund and in the aggregate own 77% of the outstanding shares of the Fund. IDI has an agreement with these entities to sell Fund shares. The Fund, Invesco and/or Invesco affiliates may make payments to these entities, which are considered to be related to the Fund, for providing services to the Fund, Invesco and/or Invesco affiliates including but not limited to services such as securities brokerage, distribution, third party record keeping and account servicing. The Fund has no knowledge as to whether all or any portion of the shares owned of record by these entities are also owned beneficially.
NOTE 11—Subsequent Event
During the first quarter of 2020, the World Health Organization declared the coronavirus (COVID-19) to be a public health emergency. COVID-19 has led to increased short-term market volatility and may have adverse long-term effects on U.S. and world economies and markets in general. COVID-19 may adversely impact the Fund's ability to achieve its investment objective. Because of the uncertainties on valuation, the global economy and business operations, values reflected in these financial statements may materially differ from the value received upon actual sales of those investments.
The Coronavirus Aid, Relief, and Economic Security Act, commonly referred to as the "CARES Act," was signed into law on March 27, 2020 by President Trump. The Adviser is assessing the components of the Act, and the impacts to the Fund should be immaterial.
17 | Invesco Short Duration Inflation Protected Fund |
Report of Independent Registered Public Accounting Firm
To the Board of Trustees of AIM Investment Securities Funds (Invesco Investment Securities Funds) and Shareholders of Invesco Short Duration Inflation Protected Fund
Opinion on the Financial Statements
We have audited the accompanying statement of assets and liabilities, including the schedule of investments, of Invesco Short Duration Inflation Protected Fund (one of the funds constituting AIM Investment Securities Funds (Invesco Investment Securities Funds), hereafter referred to as the "Fund") as of February 29, 2020, the related statement of operations for the year ended February 29, 2020, the statement of changes in net assets for each of the two years in the period ended February 29, 2020, including the related notes, and the financial highlights for each of the periods indicated therein (collectively referred to as the financial statements). In our opinion, the financial statements present fairly, in all material respects, the financial position of the Fund as of February 29, 2020, the results of its operations for the year then ended, the changes in its net assets for each of the two years in the period ended February 29, 2020 and the financial highlights financial highlights for each of the periods indicated therein in conformity with accounting principles generally accepted in the United States of America.
Basis for Opinion
These financial statements are the responsibility of the Fund's management. Our responsibility is to express an opinion on the Fund's financial statements based on our audits. We are a public accounting firm registered with the Public Company Accounting Oversight Board (United States) (PCAOB) and are required to be independent with respect to the Fund in accordance with the U.S. federal securities laws and the applicable rules and regulations of the Securities and Exchange Commission and the
PCAOB.
We conducted our audits of these financial statements in accordance with the standards of the PCAOB. Those standards require that we plan and perform the audit to obtain reasonable assurance about whether the financial statements are free of material misstatement, whether due to error or fraud.
Our audits included performing procedures to assess the risks of material misstatement of the financial statements, whether due to error or fraud, and performing procedures that respond to those risks. Such procedures included examining, on a test basis, evidence regarding the amounts and disclosures in the financial statements. Our audits also included evaluating the accounting principles used and significant estimates made by management, as well as evaluating the overall presentation of the financial statements. Our procedures included confirmation of securities owned as of February 29, 2020 by correspondence with the custodian. We believe that our audits provide a reasonable basis for our opinion.
/s/PricewaterhouseCoopers LLP
Houston, Texas
April 28, 2020
We have served as the auditor of one or more of the investment companies in the Invesco group of investment companies since at least 1995. We have not been able to determine the specific year we began serving as auditor.
18 | Invesco Short Duration Inflation Protected Fund |
Calculating your ongoing Fund expenses
Example
As a shareholder of the Fund, you incur two types of costs: (1) transaction costs, which may include sales charges (loads) on purchase payments or contingent deferred sales charges on redemptions, if any; and (2) ongoing costs, including management fees, distribution and/or service (12b-1) fees, and other Fund expenses. This example is intended to help you understand your ongoing costs (in dollars) of investing in the Fund and to compare these costs with ongoing costs of investing in other mutual funds. The example is based on an investment of $1,000 invested at the beginning of the period and held for the entire period September 1, 2019 through February 29, 2020.
Actual expenses
The table below provides information about actual account values and actual expenses. You may use the information in this table, together with the amount you invested, to estimate the expenses that you paid over the period. Simply divide your account value by $1,000 (for example, an $8,600 account value divided by $1,000 = 8.6), then multiply the result by the number in the table under the heading entitled "Actual Expenses Paid During Period" to estimate the expenses you paid on your account during this period.
Hypothetical example for comparison purposes
The table below also provides information about hypothetical account values and hypothetical expenses based on the Fund's actual expense ratio and an assumed rate of return of 5% per year before expenses, which is not the Fund's actual return.
The hypothetical account values and expenses may not be used to estimate the actual ending account balance or expenses you paid for the period. You may use this information to compare the ongoing costs of investing in the Fund and other funds. To do so, compare this 5% hypothetical example with the 5% hypothetical examples that appear in the shareholder reports of the other funds.
Please note that the expenses shown in the table are meant to highlight your ongoing costs only and do not reflect any transaction costs, such as sales charges (loads) on purchase payments or contingent deferred sales charges on redemptions, if any. Therefore, the hypothetical information is useful in comparing ongoing costs only, and will not help you determine the relative total costs of owning different funds. In addition, if these transaction costs were included, your costs would have been higher.
| | | | | HYPOTHETICAL | |
| | | | | (5% annual return before | |
| | | ACTUAL | | expenses) | |
| Beginning | Ending | | Expenses | Ending | | Expenses | Annualized |
| Account Value | Account Value | | Paid During | Account Value | | Paid During | Expense |
| (09/01/19) | (02/29/20)1 | | Period2 | (02/29/20) | | Period2 | Ratio |
Class A | $1,000.00 | $1,015.60 | | $2.76 | $1,022.13 | | $2.77 | 0.55% |
| | | | | | | | |
Class A2 | 1,000.00 | 1,017.10 | | 2.26 | 1,022.63 | | 2.26 | 0.45 |
| | | | | | | | |
Class Y | 1,000.00 | 1,017.80 | | 1.51 | 1,023.37 | | 1.51 | 0.30 |
| | | | | | | | |
Class R5 | 1,000.00 | 1,017.10 | | 1.55 | 1,023.32 | | 1.56 | 0.31 |
Class R6 | 1,000.00 | 1,017.20 | | 1.30 | 1,023.57 | | 1.31 | 0.26 |
| | | | | | | | |
1The actual ending account value is based on the actual total return of the Fund for the period September 1, 2019 through February 29, 2020, after actual expenses and will differ from the hypothetical ending account value which is based on the Fund's expense ratio and a hypothetical annual return of 5% before expenses.
2Expenses are equal to the Fund's annualized expense ratio as indicated above multiplied by the average account value over the period, multiplied by 182/366 to reflect the most recent fiscal half year.
19 | Invesco Short Duration Inflation Protected Fund |
Tax Information
Form 1099-DIV, Form 1042-S and other year–end tax information provide shareholders with actual calendar year amounts that should be included in their tax returns. Shareholders should consult their tax advisers.
The following distribution information is being provided as required by the Internal Revenue Code or to meet a specific state's requirement.
The Fund designates the following amounts or, if subsequently determined to be different, the maximum amount allowable for its fiscal year ended February 29, 2020:
Federal and State Income Tax
Ordinary Income | $10,775,082 |
Qualified Dividend Income* | 0.00% |
Corporate Dividends Received Deduction* | 0.00% |
U.S. Treasury Obligations* | 100.00% |
* The above percentages are based on ordinary income dividends paid to shareholders during the Fund's fiscal year.
20 | Invesco Short Duration Inflation Protected Fund |
Trustees and Officers
The address of each trustee and officer is AIM Investment Securities Funds (Invesco Investment Securities Funds) (the "Trust"), 11 Greenway Plaza, Suite 1000, Houston, Texas 77046-1173. The trustees serve for the life of the Trust, subject to their earlier death, incapacitation, resignation, retirement or removal as more specifically provided in the Trust's organizational documents. Each officer serves for a one year term or until their successors are elected and qualified. Column two below includes length of time served with predecessor entities, if any.
| Trustee | | Number of | Other |
Name, Year of Birth and | | Funds in | Directorship(s) |
and/or | | Fund Complex | Held by Trustee |
Position(s) | Officer | Principal Occupation(s) | Overseen by | During Past 5 |
Held with the Trust | Since | During Past 5 Years | Trustee | Years |
Interested Trustee | | | | |
Martin L. Flanagan1 — 1960 | 2007 | Executive Director, Chief Executive Officer and President, Invesco Ltd. | 229 | None |
Trustee and Vice Chair | | (ultimate parent of Invesco and a global investment management firm); | | |
| | Trustee and Vice Chair, The Invesco Funds; Vice Chair, Investment Company | | |
| | Institute; and Member of Executive Board, SMU Cox School of Business | | |
| | Formerly: Advisor to the Board, Invesco Advisers, Inc. (formerly known as | | |
| | Invesco Institutional (N.A.), Inc.); Chairman and Chief Executive Officer, | | |
| | Invesco Advisers, Inc. (registered investment adviser); Director, Chairman, | | |
| | Chief Executive Officer and President, Invesco Holding Company (US), Inc. | | |
| | (formerly IVZ Inc.) (holding company), Invesco Group Services, Inc. (service | | |
| | provider) and Invesco North American Holdings, Inc. (holding company); | | |
| | Director, Chief Executive Officer and President, Invesco Holding Company | | |
| | Limited (parent of Invesco and a global investment management firm); | | |
| | Director, Invesco Ltd.; Chairman, Investment Company Institute and President, | | |
| | Co-Chief Executive Officer, Co-President, Chief Operating Officer and Chief | | |
| | Financial Officer, Franklin Resources, Inc. (global investment management | | |
| | organization) | | |
1Mr. Flanagan is considered an interested person (within the meaning of Section 2(a)(19) of the 1940 Act) of the Trust because he is an officer of the Adviser to the Trust, and an officer and a director of Invesco Ltd., ultimate parent of the Adviser.
T-1 | Invesco Short Duration Inflation Protected Fund |
Trustees and Officers—(continued)
| | | Number of | |
| | | Funds | Other |
| Trustee | | in | Directorship(s) |
Name, Year of Birth and | and/or | | Fund Complex | Held by Trustee |
Position(s) | Officer | Principal Occupation(s) | Overseen by | During Past 5 |
Held with the Trust | Since | During Past 5 Years | Trustee | Years |
Independent Trustees | | | | |
Bruce L. Crockett – 1944 | 1992 | Chairman, Crockett Technologies Associates (technology consulting company) | 229 | Director and |
Trustee and Chair | | Formerly: Director, Captaris (unified messaging provider); Director, President | | Chairman of the |
| | | Audit Committee, |
| | and Chief Executive Officer, COMSAT Corporation; Chairman, Board of | |
| | | ALPS (Attorneys |
| | Governors of INTELSAT (international communications company); ACE Limited | |
| | | Liability |
| | (insurance company); Independent Directors Council and Investment Company | |
| | | Protection |
| | Institute: Member of the Audit Committee, Investment Company Institute; | |
| | | Society) |
| | Member of the Executive Committee and Chair of the Governance Committee, | |
| | | (insurance |
| | Independent Directors Council | |
| | | company); |
| | | |
| | | | Director and |
| | | | Member of the |
| | | | Audit Committee |
| | | | and |
| | | | Compensation |
| | | | Committee, |
| | | | Ferroglobe PLC |
| | | | (metallurgical |
| | | | company) |
David C. Arch – 1945 | 2010 | Chairman of Blistex Inc. (consumer health care products manufacturer); | 229 | Board member of |
Trustee | | Member, World Presidents' Organization | | the Illinois |
| | | | Manufacturers' |
| | | | Association |
Beth Ann Brown – 1968 | 2019 | Independent Consultant | 229 | Director, Board of |
Trustee | | Formerly: Head of Intermediary Distribution, Managing Director, Strategic | | Directors of |
| | | Caron |
| | Relations, Managing Director, Head of National Accounts, Senior Vice | |
| | | Engineering Inc.; |
| | President, National Account Manager and Senior Vice President, Key Account | |
| | | Advisor, Board of |
| | Manager, Columbia Management Investment Advisers LLC; Vice President, Key | |
| | | Advisors of Caron |
| | Account Manager, Liberty Funds Distributor, Inc.; and Trustee of certain | |
| | | Engineering Inc.; |
| | Oppenheimer Funds | |
| | | President and |
| | | |
| | | | Director, Acton |
| | | | Shapleigh Youth |
| | | | Conservation |
| | | | Corps (non - |
| | | | profit); and Vice |
| | | | President and |
| | | | Director of |
| | | | Grahamtastic |
| | | | Connection (non- |
| | | | profit) |
Jack M. Fields – 1952 | 1997 | Chief Executive Officer, Twenty First Century Group, Inc. (government affairs | 229 | Member, Board of Directors of |
Trustee | | company); and Chairman, Discovery Learning Alliance (non-profit) | | Baylor College of Medicine |
| | Formerly: Owner and Chief Executive Officer, Dos Angeles Ranch L.P. (cattle, | | |
| | hunting, corporate entertainment); Director, Insperity, Inc. (formerly known as | | |
| | Administaff) (human resources provider); Chief Executive Officer, Texana | | |
| | Timber LP (sustainable forestry company); Director of Cross Timbers Quail | | |
| | Research Ranch (non-profit); and member of the U.S. House of Representatives | | |
| | | | |
T-2 | Invesco Short Duration Inflation Protected Fund |

Trustees and Officers—(continued)
| | | Number of | |
| | | Funds | Other |
| Trustee | | in | Directorship(s) |
Name, Year of Birth and | and/or | | Fund Complex | Held by Trustee |
Position(s) | Officer | Principal Occupation(s) | Overseen by | During Past 5 |
Held with the Trust | Since | During Past 5 Years | Trustee | Years |
Independent Trustees—(continued) | | | |
Cynthia Hostetler —1962 | 2017 | Non-Executive Director and Trustee of a number of public and private business | 229 | Vulcan Materials |
Trustee | | corporations | | Company |
| | Formerly: Director, Aberdeen Investment Funds (4 portfolios); Head of | | (construction |
| | | materials |
| | Investment Funds and Private Equity, Overseas Private Investment | |
| | | company); Trilinc |
| | Corporation; President, First Manhattan Bancorporation, Inc.; Attorney, | |
| | | Global Impact |
| | Simpson Thacher & Bartlett LLP | |
| | | Fund; Genesee & |
| | | |
| | | | Wyoming, Inc. |
| | | | (railroads); Artio |
| | | | Global Investment |
| | | | LLC (mutual fund |
| | | | complex); Edgen |
| | | | Group, Inc. |
| | | | (specialized |
| | | | energy and |
| | | | infrastructure |
| | | | products |
| | | | distributor); |
| | | | Investment |
| | | | Company Institute |
| | | | (professional |
| | | | organization); |
| | | | Independent |
| | | | Directors Council |
| | | | (professional |
| | | | organization) |
Eli Jones – 1961 | 2016 | Professor and Dean, Mays Business School - Texas A&M University | 229 | Insperity, Inc. |
Trustee | | Formerly: Professor and Dean, Walton College of Business, University of | | (formerly known |
| | | as Administaff) |
| | Arkansas and E.J. Ourso College of Business, Louisiana State University; | |
| | | (human resources |
| | Director, Arvest Bank | |
| | | provider) |
| | | |
Elizabeth Krentzman – 1959 | 2019 | Formerly: Principal and Chief Regulatory Advisor for Asset Management | 229 | Trustee of the |
Trustee | | Services and U.S. Mutual Fund Leader of Deloitte & Touche LLP; General | | University of |
| | Counsel of the Investment Company Institute (trade association); National | | Florida National |
| | Director of the Investment Management Regulatory Consulting Practice, | | Board Foundation |
| | Principal, Director and Senior Manager of Deloitte & Touche LLP; Assistant | | and Audit |
| | Director of the Division of Investment Management - Office of Disclosure and | | Committee |
| | Investment Adviser Regulation of the U.S. Securities and Exchange | | Member; Member |
| | Commission and various positions with the Division of Investment Management | | of the Cartica |
| | – Office of Regulatory Policy of the U.S. Securities and Exchange Commission; | | Funds Board of |
| | Associate at Ropes & Gray LLP; Advisory Board Member of the Securities and | | Directors (private |
| | Exchange Commission Historical Society; and Trustee of certain Oppenheimer | | investment |
| | Funds | | funds); Member |
| | | | of the University |
| | | | of Florida Law |
| | | | Center |
| | | | Association, Inc. |
| | | | Board of Trustees |
| | | | and Audit |
| | | | Committee |
| | | | Member |
Anthony J. LaCava, Jr. – 1956 | 2019 | Formerly: Director and Member of the Audit Committee, Blue Hills Bank | 229 | Blue Hills Bank; |
Trustee | | (publicly traded financial institution) and Managing Partner, KPMG LLP | | Chairman, |
| | | | Bentley |
| | | | University; |
| | | | Member, |
| | | | Business School |
| | | | Advisory Council; |
| | | | and Nominating |
| | | | Committee |
| | | | KPMG LLP |
Prema Mathai-Davis – 1950 | 1998 | Retired | 229 | None |
Trustee | | Co-Owner & Partner of Quantalytics Research, LLC, (a FinTech Investment | | |
| | | |
Research Platform for the Self-Directed Investor)
T-3 | Invesco Short Duration Inflation Protected Fund |

Trustees and Officers—(continued)
| | | Number of | |
| | | Funds | Other |
| Trustee | | in | Directorship(s) |
Name, Year of Birth and | and/or | | Fund Complex | Held by Trustee |
Position(s) | Officer | Principal Occupation(s) | Overseen by | During Past 5 |
Held with the Trust | Since | During Past 5 Years | Trustee | Years |
Independent Trustees—(continued) | | | |
Joel W. Motley – 1952 | 2019 | Director of Office of Finance, Federal Home Loan Bank System; Member of the | 229 | Member of Board |
Trustee | | Vestry of Trinity Wall Street; Managing Director of Carmona Motley Inc. | | of Greenwall |
| | (privately held financial advisor); Member of the Council on Foreign Relations | | Foundation |
| | and its Finance and Budget Committee; Chairman Emeritus of Board of Human | | (bioethics research |
| | Rights Watch and Member of its Investment Committee; and Member of | | foundation) and |
| | Investment Committee and Board of Historic Hudson Valley (non-profit cultural | | its Investment |
| | organization) | | Committee; |
| | Formerly: Managing Director of Public Capital Advisors, LLC (privately held | | Member of Board of |
| | | Friends of the LRC |
| | financial advisor); Managing Director of Carmona Motley Hoffman, Inc. | |
| | | (non-profit |
| | (privately held financial advisor); Trustee of certain Oppenheimer Funds; and | |
| | | legal advocacy); |
| | Director of Columbia Equity Financial Corp. (privately held financial advisor) | |
| | | Board Member |
| | | |
| | | | and Investment |
| | | | Committee |
| | | | Member of |
| | | | Pulizer Center for |
| | | | Crisis Reporting |
| | | | (non-profit |
| | | | journalism) |
Teresa M. Ressel — 1962 | 2017 | Non-executive director and trustee of a number of public and private business | 229 | Atlantic Power |
Trustee | | corporations | | Corporation |
| | Formerly: Chief Financial Officer, Olayan America, The Olayan Group | | (power generation |
| | | company); ON |
| | (international investor/commercial/industrial); Chief Executive Officer, UBS | |
| | | Semiconductor |
| | Securities LLC; Group Chief Operating Officer, Americas, UBS AG; Assistant | |
| | | Corp. |
| | Secretary for Management & Budget and CFO, US Department of the Treasury | |
| | | (semiconductor |
| | | |
| | | | supplier) |
| | | | |
Ann Barnett Stern – 1957 | 2017 | President and Chief Executive Officer, Houston Endowment Inc. (private | 229 | Federal Reserve |
Trustee | | philanthropic institution) | | Bank of Dallas |
| | Formerly: Executive Vice President and General Counsel, Texas Children's | | |
| | Hospital; Attorney, Beck, Redden and Secrest, LLP; Business Law Instructor, | | |
| | University of St. Thomas; Attorney, Andrews & Kurth LLP | | |
Robert C. Troccoli – 1949 | 2016 | Retired | 229 | None |
Trustee | | Formerly: Adjunct Professor, University of Denver – Daniels College of | | |
| | | |
| | Business; Senior Partner, KPMG LLP | | |
| | | | |
Daniel S. Vandivort –1954 | 2019 | Treasurer, Chairman of the Audit and Finance Committee, and Trustee, Board | 229 | Chairman and |
Trustee | | of Trustees, Huntington Disease Foundation of America; and President, Flyway | | Lead Independent |
| | Advisory Services LLC (consulting and property management) | | Director, |
| | Formerly: Trustee and Governance Chair, of certain Oppenheimer Funds | | Chairman of the |
| | | Audit Committee, |
| | | |
| | | | and Director, |
| | | | Board of |
| | | | Directors, Value |
| | | | Line Funds |
James D. Vaughn – 1945 | 2019 | Retired | 229 | Board member |
Trustee | | Formerly: Managing Partner, Deloitte & Touche LLP; Trustee and Chairman of | | and Chairman of |
| | | Audit Committee |
| | the Audit Committee, Schroder Funds; Board Member, Mile High United Way, | |
| | | of AMG National |
| | Boys and Girls Clubs, Boy Scouts, Colorado Business Committee for the Arts, | |
| | | Trust Bank; |
| | Economic Club of Colorado and Metro Denver Network (economic development | |
| | | Trustee and |
| | corporation); and Trustee of certain Oppenheimer Funds | |
| | | Investment |
| | | |
| | | | Committee |
| | | | member, |
| | | | University of |
| | | | South Dakota |
| | | | Foundation; |
| | | | Board member, |
| | | | Audit Committee |
| | | | Member and past |
| | | | Board Chair, |
| | | | Junior |
| | | | Achievement |
| | | | (non-profit) |
Christopher L. Wilson - | 2017 | Retired | 229 | ISO New |
1957 | | Formerly: Director, TD Asset Management USA Inc. (mutual fund complex) (22 | | England, Inc. |
Trustee, Vice Chair and Chair | | | (non-profit |
| portfolios); Managing Partner, CT2, LLC (investing and consulting firm); | |
Designate | | | organization |
| President/Chief Executive Officer, Columbia Funds, Bank of America | |
| | | |
| Corporation; President/Chief Executive Officer, CDC IXIS Asset Management | managing |
| regional electricity |
| Services, Inc.; Principal & Director of Operations, Scudder Funds, Scudder, |
| market) |
| Stevens & Clark, Inc.; Assistant Vice President, Fidelity Investments |
| |
T-4 | Invesco Short Duration Inflation Protected Fund |
Trustees and Officers—(continued)
| | | Number of | Other |
| Trustee | | Funds in | Directorship(s) |
Name, Year of Birth and | and/or | | Fund Complex | Held by Trustee |
Position(s) | Officer | Principal Occupation(s) | Overseen by | During Past 5 |
Held with the Trust | Since | During Past 5 Years | Trustee | Years |
Officers | | | | |
Sheri Morris — 1964 | 1999 | Head of Global Fund Services, Invesco Ltd.; President, Principal Executive | N/A | N/A |
President, Principal Executive | | Officer and Treasurer, The Invesco Funds; Vice President, Invesco Advisers, | | |
Officer and Treasurer | | Inc. (formerly known as Invesco Institutional (N.A.), Inc.) (registered | | |
| | investment adviser); and Vice President, Invesco Exchange-Traded Fund Trust, | | |
| | Invesco Exchange-Traded Fund Trust II, Invesco India Exchange-Traded Fund | | |
| | Trust, Invesco Actively Managed Exchange-Traded Fund Trust, Invesco Actively | | |
| | Managed Exchange-Traded Commodity Fund Trust and Invesco | | |
| | Exchange-Traded Self-Indexed Fund Trust; and Vice President, | | |
| | OppenheimerFunds, Inc. | | |
| | Formerly: Vice President and Principal Financial Officer, The Invesco Funds; | | |
| | Vice President, Invesco AIM Advisers, Inc., Invesco AIM Capital Management, | | |
| | Inc. and Invesco AIM Private Asset Management, Inc.; Assistant Vice President | | |
| | and Assistant Treasurer, The Invesco Funds and Assistant Vice President, | | |
| | Invesco Advisers, Inc., Invesco AIM Capital Management, Inc. and Invesco AIM | | |
| | Private Asset Management, Inc.; and Treasurer, Invesco Exchange-Traded | | |
| | Fund Trust, Invesco Exchange-Traded Fund Trust II, Invesco India | | |
| | Exchange-Traded Fund Trust and Invesco Actively Managed Exchange-Traded | | |
| | Fund Trust | | |
Russell C. Burk — 1958 | 2005 | Senior Vice President and Senior Officer, The Invesco Funds | N/A | N/A |
Senior Vice President and Senior | | | | |
Officer | | | | |
Jeffrey H. Kupor – 1968 | 2018 | Head of Legal of the Americas, Invesco Ltd.; Senior Vice President and | N/A | N/A |
Senior Vice President, Chief Legal | | Secretary, Invesco Advisers, Inc. (formerly known as Invesco Institutional | | |
Officer and Secretary | | (N.A.), Inc.) (registered investment adviser); Senior Vice President and | | |
| | Secretary, Invesco Distributors, Inc. (formerly known as Invesco AIM | | |
| | Distributors, Inc.); Vice President and Secretary, Invesco Investment Services, | | |
| | Inc. (formerly known as Invesco AIM Investment Services, Inc.) Senior Vice | | |
| | President, Chief Legal Officer and Secretary, The Invesco Funds; Secretary and | | |
| | General Counsel, Invesco Investment Advisers LLC (formerly known as Van | | |
| | Kampen Asset Management); Secretary and General Counsel, Invesco Capital | | |
| | Markets, Inc. (formerly known as Van Kampen Funds Inc.) and Chief Legal | | |
| | Officer, Invesco Exchange-Traded Fund Trust, Invesco Exchange-Traded Fund | | |
| | Trust II, Invesco India Exchange-Traded Fund Trust, Invesco Actively Managed | | |
| | Exchange-Traded Fund Trust, Invesco Actively Managed Exchange-Traded | | |
| | Commodity Fund Trust and Invesco Exchange-Traded Self-Indexed Fund Trust; | | |
| | Secretary, Invesco Indexing LLC; Secretary, W.L. Ross & Co., LLC | | |
| | Formerly: Secretary and Vice President, Jemstep, Inc.; Head of Legal, | | |
| | Worldwide Institutional, Invesco Ltd.; Secretary and General Counsel, INVESCO | | |
| | Private Capital Investments, Inc.; Senior Vice President, Secretary and General | | |
| | Counsel, Invesco Management Group, Inc. (formerly known as Invesco AIM | | |
| | Management Group, Inc.); Assistant Secretary, INVESCO Asset Management | | |
| | (Bermuda) Ltd.; Secretary and General Counsel, Invesco Private Capital, Inc.; | | |
| | Assistant Secretary and General Counsel, INVESCO Realty, Inc.; Secretary and | | |
| | General Counsel, Invesco Senior Secured Management, Inc.; and Secretary, | | |
| | Sovereign G./P. Holdings Inc. | | |
Andrew R. Schlossberg – 1974 | 2019 | Head of the Americas and Senior Managing Director, Invesco Ltd.; Director and | N/A | N/A |
Senior Vice President | | Senior Vice President, Invesco Advisers, Inc. (formerly known as Invesco | | |
| | Institutional (N.A.), Inc.) (registered investment adviser); Director and | | |
| | Chairman, Invesco Investment Services, Inc. (formerly known as Invesco AIM | | |
| | Investment Services, Inc.) (registered transfer agent); Senior Vice President, | | |
| | The Invesco Funds; Director, Invesco Investment Advisers LLC (formerly known | | |
| | as Van Kampen Asset Management); Director, President and Chairman, Invesco | | |
| | Insurance Agency, Inc. | | |
| | Formerly: Director, Invesco UK Limited; Director and Chief Executive, Invesco | | |
| | Asset Management Limited and Invesco Fund Managers Limited; Assistant Vice | | |
| | President, The Invesco Funds; Senior Vice President, Invesco Advisers, Inc. | | |
| | (formerly known as Invesco Institutional (N.A.), Inc.) (registered investment | | |
| | adviser); Director and Chief Executive, Invesco Administration Services Limited | | |
| | and Invesco Global Investment Funds Limited; Director, Invesco Distributors, | | |
| | Inc.; Head of EMEA, Invesco Ltd.; President, Invesco Actively Managed | | |
| | Exchange-Traded Commodity Fund Trust, Invesco Actively Managed | | |
| | Exchange-Traded Fund Trust, Invesco Exchange-Traded Fund Trust, Invesco | | |
| | Exchange-Traded Fund Trust II and Invesco India Exchange-Traded Fund Trust; | | |
| | Managing Director and Principal Executive Officer, Invesco Capital | | |
| | Management LLC | | |
T-5 | Invesco Short Duration Inflation Protected Fund |
Trustees and Officers—(continued)
| | | Number of | Other |
| Trustee | | Funds in | Directorship(s) |
Name, Year of Birth and | and/or | | Fund Complex | Held by Trustee |
Position(s) | Officer | Principal Occupation(s) | Overseen by | During Past 5 |
Held with the Trust | Since | During Past 5 Years | Trustee | Years |
Officers—(continued) | | | | |
John M. Zerr — 1962 | 2006 | Chief Operating Officer of the Americas; Senior Vice President, Invesco | N/A | N/A |
Senior Vice President | | Advisers, Inc. (formerly known as Invesco Institutional (N.A.), Inc.) (registered | | |
| | investment adviser); Senior Vice President, Invesco Distributors, Inc. (formerly | | |
| | known as Invesco AIM Distributors, Inc.); Director and Vice President, Invesco | | |
| | Investment Services, Inc. (formerly known as Invesco AIM Investment | | |
| | Services, Inc.) Senior Vice President, The Invesco Funds; Managing Director, | | |
| | Invesco Capital Management LLC; Director, Invesco Investment Advisers LLC | | |
| | (formerly known as Van Kampen Asset Management); Senior Vice President, | | |
| | Invesco Capital Markets, Inc. (formerly known as Van Kampen Funds Inc.); | | |
| | Manager, Invesco Indexing LLC; Manager, Invesco Specialized Products, LLC; | | |
| | Director and Senior Vice President, Invesco Insurance Agency, Inc.; Member, | | |
| | Invesco Canada Funds Advisory Board; Director, President and Chief Executive | | |
| | Officer, Invesco Corporate Class Inc. (corporate mutual fund company); and | | |
| | Director, Chairman, President and Chief Executive Officer, Invesco Canada Ltd. | | |
| | (formerly known as Invesco Trimark Ltd./Invesco Trimark Ltèe) (registered | | |
| | investment adviser and registered transfer agent); President, Invesco, Inc. | | |
| | Formerly: Director and Senior Vice President, Invesco Management Group, Inc. | | |
| | (formerly known as Invesco AIM Management Group, Inc.); Secretary and | | |
| | General Counsel, Invesco Management Group, Inc. (formerly known as Invesco | | |
| | AIM Management Group, Inc.); Secretary, Invesco Investment Services, Inc. | | |
| | (formerly known as Invesco AIM Investment Services, Inc.); Chief Legal Officer | | |
| | and Secretary, The Invesco Funds; Secretary and General Counsel, Invesco | | |
| | Investment Advisers LLC (formerly known as Van Kampen Asset Management); | | |
| | Secretary and General Counsel, Invesco Capital Markets, Inc. (formerly known | | |
| | as Van Kampen Funds Inc.); Chief Legal Officer, Invesco Exchange-Traded Fund | | |
| | Trust, Invesco Exchange-Traded Fund Trust II, Invesco India Exchange-Traded | | |
| | Fund Trust, Invesco Actively Managed Exchange-Traded Fund Trust, Invesco | | |
| | Actively Managed Exchange-Traded Commodity Fund Trust and Invesco | | |
| | Exchange-Traded Self-Indexed Fund Trust; Secretary, Invesco Indexing LLC; | | |
| | Director, Secretary, General Counsel and Senior Vice President, Van Kampen | | |
| | Exchange Corp.; Director, Vice President and Secretary, IVZ Distributors, Inc. | | |
| | (formerly known as INVESCO Distributors, Inc.); Director and Vice President, | | |
| | INVESCO Funds Group, Inc.; Director and Vice President, Van Kampen | | |
| | Advisors Inc.; Director, Vice President, Secretary and General Counsel, Van | | |
| | Kampen Investor Services Inc.;Director and Secretary, Invesco Distributors, | | |
| | Inc. (formerly known as Invesco AIM Distributors, Inc.); Director, Senior Vice | | |
| | President, General Counsel and Secretary, Invesco AIM Advisers, Inc. and Van | | |
| | Kampen Investments Inc.; Director, Vice President and Secretary, Fund | | |
| | Management Company; Director, Senior Vice President, Secretary, General | | |
| | Counsel and Vice President, Invesco AIM Capital Management, Inc.; Chief | | |
| | Operating Officer and General Counsel, Liberty Ridge Capital, Inc. (an | | |
| | investment adviser) | | |
Gregory G. McGreevey - 1962 | 2012 | Senior Managing Director, Invesco Ltd.; Director, Chairman, President, and | N/A | N/A |
Senior Vice President | | Chief Executive Officer, Invesco Advisers, Inc. (formerly known as Invesco | | |
| | Institutional (N.A.), Inc.) (registered investment adviser); Director, Invesco | | |
| | Mortgage Capital, Inc. and Invesco Senior Secured Management, Inc.; and | | |
| | Senior Vice President, The Invesco Funds; and President, SNW Asset | | |
| | Management Corporation and Invesco Managed Accounts, LLC | | |
| | Formerly: Senior Vice President, Invesco Management Group, Inc. and Invesco | | |
| | Advisers, Inc.; Assistant Vice President, The Invesco Funds | | |
Kelli Gallegos – 1970 | 2008 | Principal Financial and Accounting Officer – Investments Pool, Invesco | N/A | N/A |
Vice President, Principal Financial | | Specialized Products, LLC; Vice President, Principal Financial Officer and | | |
Officer and Assistant Treasurer | | Assistant Treasurer, The Invesco Funds; Principal Financial and Accounting | | |
| | Officer – Pooled Investments, Invesco Capital Management LLC; Vice President | | |
| | and Treasurer, Invesco Exchange-Traded Fund Trust, Invesco Exchange-Traded | | |
| | Fund Trust II, Invesco India Exchange-Traded Fund Trust, Invesco Actively | | |
| | Managed Exchange-Traded Fund Trust, Invesco Actively Managed | | |
| | Exchange-Traded Commodity Fund Trust and Invesco Exchange-Traded | | |
| | Self-Indexed Fund Trust; Vice President, Invesco Advisers, Inc. | | |
| | Formerly: Assistant Treasurer, Invesco Specialized Products, LLC; Assistant | | |
| | Treasurer, Invesco Exchange-Traded Fund Trust, Invesco Exchange-Traded | | |
| | Fund Trust II, Invesco India Exchange-Traded Fund Trust, Invesco Actively | | |
| | Managed Exchange-Traded Fund Trust, Invesco Actively Managed | | |
| | Exchange-Traded Commodity Fund Trust and Invesco Exchange-Traded | | |
| | Self-Indexed Fund Trust; Assistant Treasurer, Invesco Capital | | |
| | Management LLC; Assistant Vice President, The Invesco Funds | | |
Crissie M. Wisdom – 1969 | 2013 | Anti-Money Laundering and OFAC Compliance Officer for Invesco U.S. entities | N/A | N/A |
Anti-Money Laundering | | including: Invesco Advisers, Inc. and its affiliates, Invesco Capital Markets, | | |
Compliance Officer | | Inc., Invesco Distributors, Inc., Invesco Investment Services, Inc., The Invesco | | |
| | Funds, Invesco Capital Management, LLC, Invesco Trust Company; | | |
| | OppenheimerFunds Distributor, Inc., and Fraud Prevention Manager for | | |
| | Invesco Investment Services, Inc. | | |
T-6 | Invesco Short Duration Inflation Protected Fund |
Trustees and Officers—(continued)
| | | Number of | Other |
| Trustee | | Funds in | Directorship(s) |
Name, Year of Birth and | and/or | | Fund Complex | Held by Trustee |
Position(s) | Officer | Principal Occupation(s) | Overseen by | During Past 5 |
Held with the Trust | Since | During Past 5 Years | Trustee | Years |
Officers—(continued) | | | | |
Robert R. Leveille – 1969 | 2016 | Chief Compliance Officer, Invesco Advisers, Inc. (registered investment | N/A | N/A |
Chief Compliance Officer | | adviser); and Chief Compliance Officer, The Invesco Funds | | |
| | Formerly: Chief Compliance Officer, Putnam Investments and the Putnam | | |
| | Funds | | |
The Statement of Additional Information of the Trust includes additional information about the Fund's Trustees and is available upon request, without charge, by calling 1.800.959.4246. Please refer to the Fund's Statement of Additional Information for information on the Fund's sub-advisers.
Office of the Fund | Investment Adviser | Distributor | Auditors |
11 Greenway Plaza, Suite 1000 | Invesco Advisers, Inc. | Invesco Distributors, Inc. | PricewaterhouseCoopers LLP |
Houston, TX 77046-1173 | 1555 Peachtree Street, N.E. | 11 Greenway Plaza, Suite 1000 | 1000 Louisiana Street, Suite 5800 |
| Atlanta, GA 30309 | Houston, TX 77046-1173 | Houston, TX 77002-5678 |
Counsel to the Fund | Counsel to the Independent Trustees | Transfer Agent | Custodian |
Stradley Ronon Stevens & Young, LLP | Goodwin Procter LLP | Invesco Investment Services, Inc. | State Street Bank and Trust Company |
2005 Market Street, Suite 2600 | 901 New York Avenue, N.W. | 11 Greenway Plaza, Suite 1000 | 225 Franklin Street |
Philadelphia, PA 19103-7018 | Washington, D.C. 20001 | Houston, TX 77046-1173 | Boston, MA 02110-2801 |
T-7 | Invesco Short Duration Inflation Protected Fund |

Go paperless with eDelivery
Visit invesco.com/edelivery to enjoy the convenience and security of anytime electronic access to your investment documents.
With eDelivery, you can elect to have any or all of the following materials delivered straight to your inbox to download, save and print from your own computer:
•Fund reports and prospectuses
•Quarterly statements
•Daily confirmations
•Tax forms
Invesco mailing information
Send general correspondence to Invesco Investment Services, Inc., P.O. Box 219078, Kansas City, MO 64121-9078.
Important notice regarding delivery of security holder documents
To reduce Fund expenses, only one copy of most shareholder documents may be mailed to shareholders with multiple accounts at the same address (Householding). Mailing of your shareholder documents may be householded indefinitely unless you instruct us otherwise. If you do not want the mailing of these documents to be combined with those for other members of your household, please contact Invesco Investment Services, Inc. at 800 959 4246 or contact your financial institution. We will begin sending you individual copies for each account within 30 days after receiving your request.
Fund holdings and proxy voting information
The Fund provides a complete list of its holdings four times in each fiscal year, at the quarter-ends. For the second and fourth quarters, the list appears in the Fund's semiannual and annual reports to shareholders. For the first and third quarters, the Fund files the lists with the Securities and Exchange Commission (SEC) as an exhibit to its reports on Form N-PORT. The most recent list of portfolio holdings is available at invesco.com/completeqtrholdings. Shareholders can also look up the Fund's Form N-PORT filings on the SEC website, sec.gov. The SEC file numbers for the Fund are shown below.
A description of the policies and procedures that the Fund uses to determine how to vote proxies relating to portfolio secu- rities is available without charge, upon request, from our Client Services department at 800 959 4246, or at invesco.com/ proxyguidelines. The information is also available on the SEC website, sec.gov.
Information regarding how the Fund voted proxies related to its portfolio securities during the most
recent 12-month period ended June 30 is available at invesco.com/proxysearch. This information is also available on the SEC website, sec.gov.
Invesco Advisers, Inc. is an investment adviser; it provides investment advisory services to individual and institutional clients and does not sell securities. Invesco Distributors, Inc. is the US distributor for Invesco Ltd.'s retail mutual funds, exchange-traded funds and institutional money market funds. Both are wholly owned, indirect subsidiaries of Invesco Ltd.
SEC file numbers: 811-05686 and 003-39519 | Invesco Distributors, Inc. | SDIP-AR-1 |
Annual Report to Shareholders | February 29, 2020 |
Invesco Short Term Bond Fund
Nasdaq:
A: STBAX C: STBCX R: STBRX Y: STBYX R5: ISTBX R6: ISTFX
Beginning on January 1, 2021, as permitted by regulations adopted by the Securities and Exchange Commission, paper copies of the Fund's shareholder reports will no longer be sent by mail, unless you specifically request paper copies of the reports from the Fund or from your financial intermediary, such as a broker-dealer or bank. Instead, the reports will be made available on the Fund's web- site, and you will be notified by mail each time a report is posted and provided with a website link to access the report.
If you already elected to receive shareholder reports electronically, you will not be affected by this change and you need not take any action. You may elect to receive shareholder reports and other communications from the Fund electronically by contacting your financial intermediary (such as a broker-dealer or bank) or, if you are a direct investor, by enrolling at invesco.com/edelivery.
You may elect to receive all future reports in paper free of charge. If you invest through a financial intermediary, you can contact your financial intermediary to request that you continue to receive paper copies of your shareholder reports. If you invest directly with the Fund, you can call (800) 959-4246 to let the Fund know you wish to continue receiving paper copies of your shareholder reports. Your election to receive reports in paper will apply to all funds held with your financial intermediary or all funds held with the fund complex if you invest directly with the Fund.
Andrew Schlossberg
Letters to Shareholders
Dear Shareholders:
This annual report includes information about your Fund, including performance data and a complete list of its investments as of the close of the reporting period. Inside is a discussion of how your Fund was managed and the factors that affected its performance during the reporting period.
The reporting period proved to be another tumultuous time for both global equities and fixed-income secu- rities. In early 2019, global equity markets were buoyed by a more accommodative stance from central banks and optimism about a potential US-China trade deal. In May, US-China trade concerns and slowing global growth led to a global equity sell-off and rally in US Treasuries. Despite the May sell-off, domestic equity mar- kets rallied in June in anticipation of a US Federal Reserve (the Fed) interest rate cut and closed the second quarter with modest gains. Continued US-China trade worries and signs of slowing global economic growth led to increased market volatility in August. The US Treasury yield curve inverted several times as fears of a US recession increased. As a result, global equity markets were largely flat for the third quarter. In the final
months of 2019, geopolitical and macroeconomic issues largely abated. This combined with better-than-expected third quarter corporate earnings and initial agreement of the phase one US-China trade deal provided a favorable backdrop for equities and impressive fourth quar- ter global equity returns.
As the new year began, US equities were largely buoyed in January by the signing of the phase one trade agreement and strong eco- nomic data although returns were dampened by the spread of the Coronavirus (COVID-19). Concerns over the virus had a greater impact on international equities, which were largely lower for the month. As the virus spread outside of China and the number of cases increased, fears of diminished global growth led to a sharp global equity sell-off at the end of February 2020 and sent the yield on the US 10-year Treasury to a new all-time low.
Throughout 2019, central banks continued to be accommodative, providing sources of liquidity. In July, the Fed lowered interest rates for the first time in 11 years. It again lowered rates in September and once again in October. During the rest of the year, the Fed left rates unchanged. Overseas, the European Central Bank left its policy rate unchanged and continued its bond purchasing program. In 2020, with the increased spread of the coronavirus, the Fed shifted from a more neutral policy to the possibility of further rate cuts in the new year. As 2020 unfolds, we'll see how the interplay of interest rates, economic data, geopolitics and a host of other factors affect US and overseas equity and fixed income markets.
Investor uncertainty and market volatility, such as we witnessed during the reporting period, are unfortunate facts of life when it comes to investing. That's why Invesco encourages investors to work with a professional financial adviser who can stress the importance of starting to save and invest early and the importance of adhering to a disciplined investment plan. A financial adviser who knows your unique finan- cial situation, investment goals and risk tolerance can be an invaluable partner as you seek to achieve your financial goals. Financial advis- ers can also offer a long-term perspective when markets are volatile and time-tested advice and guidance when your financial situation or investment goals change.
Visit our website for more information on your investments
Our website, invesco.com/us, offers a wide range of market insights and investment perspectives. On the website, you'll find detailed infor- mation about our funds, including performance, holdings and portfolio manager commentaries. You can access information about your account by completing a simple, secure online registration. To do so, select "Log In" on the right side of the homepage, and then select "Register for Individual Account Access."
In addition to the resources accessible on our website and through our mobile app, you can obtain timely updates to help you stay informed about the markets and the economy by connecting with Invesco on Twitter, LinkedIn or Facebook. You can access our blog at blog.invesco.us.com. Our goal is to provide you the information you want, when and where you want it.
Finally, I'm pleased to share with you Invesco's commitment to both the Principles for Responsible Investment and to considering environ- mental, social and governance issues in our robust investment process. I invite you to learn more at invesco.com/esg.
Have questions?
For questions about your account, contact an Invesco client services representative at 800 959 4246.
All of us at Invesco look forward to serving your investment management needs. Thank you for investing with us.
Sincerely,
Andrew Schlossberg
Head of the Americas,
Senior Managing Director, Invesco Ltd.
2Invesco Short Term Bond Fund
Bruce Crockett
Dear Shareholders:
Among the many important lessons I've learned in more than 40 years in a variety of business endeavors is the value of a trusted advocate.
As independent chair of the Invesco Funds Board, I can assure you that the members of the Board are strong advocates for the interests of investors in Invesco's mutual funds. We work hard to represent your interests through oversight of the quality of the investment management services your funds receive and other matters important to your investment, including but not limited to:
Ensuring that Invesco offers a diverse lineup of mutual funds that your financial adviser can use to strive to meet your financial needs as your investment goals change over time.
Monitoring how the portfolio management teams of the Invesco funds are performing in light of changing economic and market conditions.
Assessing each portfolio management team's investment performance within the context of the investment strategy described in the fund's prospectus.
Monitoring for potential conflicts of interests that may impact the nature of the services that your funds receive.
We believe one of the most important services we provide our fund shareholders is the annual review of the funds' advisory and sub-
advisory contracts with Invesco Advisers and its affiliates. This review is required by the Investment Company Act of 1940 and focuses on the nature and quality of the services Invesco provides as the adviser to the Invesco funds and the reasonableness of the fees that it charges for those services. Each year, we spend months carefully reviewing information received from Invesco and a variety of independent sources, such as performance and fee data prepared by Lipper, Inc. (a subsidiary of Broadridge Financial Solutions, Inc.), an independent, third-party firm widely recognized as a leader in its field. We also meet with our independent legal counsel and other independent advisers to review and help us assess the information that we have received. Our goal is to assure that you receive quality investment management services for a reasonable fee.
I trust the measures outlined above provide assurance that you have a worthy advocate when it comes to choosing the Invesco Funds. On behalf of the Board, we look forward to continuing to represent your interests and serving your needs.
Sincerely,
Bruce L. Crockett
Independent Chair
Invesco Funds Board of Trustees
3Invesco Short Term Bond Fund

Management's Discussion of Fund Performance
Performance summary
For the fiscal year ended February 29, 2020, Class A shares of Invesco Short Term Bond Fund (the Fund), at net asset value (NAV), outperformed the Fund's style- specific benchmark, the Bloomberg Barclays 1-3 Year Government/Credit Index.
Your Fund's long-term performance appears later in this report.
Fund vs. Indexes
Total returns, February 28, 2019 to February 29, 2020, at net asset value (NAV). Performance shown does not include applicable contingent deferred sales charges (CDSC) or front-end sales charges, which would have reduced performance.
Class A Shares | 5.08% |
Class C Shares | 4.71 |
Class R Shares | 4.70 |
Class Y Shares | 5.11 |
Class R5 Shares | 5.20 |
Class R6 Shares | 5.23 |
Bloomberg Barclays U.S. Aggregate Bond Index (Broad Market Index) | 11.68 |
Bloomberg Barclays 1-3 Year Government/Credit Index (Style-Specific Index) | 4.88 |
Lipper Short Investment Grade Debt Funds Index (Peer Group Index) | 4.80 |
Source(s): RIMES Technologies Corp.; Lipper Inc.
15% of the portfolio, on average, had a final maturity of less than one year; this provided sufficient liquidity and an important buffer against credit market volatility. The Fund did not use any credit derivatives during the fiscal year.
The Fund may use active duration and yield curve positioning for risk management and for generating alpha versus its style-specific benchmark. (Alpha is a measure of perfor- mance on a risk adjusted basis.) Duration measures a portfolio's price sensitivity to in- terest rate changes, with a shorter duration portfolio tending to be less sensitive to these changes. Duration of the portfolio was main- tained near the style-specific benchmark, on average, and the timing of changes and the degree of variance from the Fund's style- specific benchmark during the fiscal year had a minimal impact on relative Fund returns. Yield curve positioning, obtained by over- weight exposure to longer maturities and un- derweight exposure to shorter-term maturi- ties, benefited the Fund during the fiscal year.
Market conditions and your Fund
During the fiscal year, US Treasury yields fell considerably, especially in February 2020, as concerns regarding the spread of the corona- virus took hold. The Bloomberg Barclays
1-3 Year Government/Credit Index ended the fiscal year with a strong return of 4.88%. US investment grade bonds and US high yield bonds posted gains for the fiscal year, as well. The short-term, investment grade US credit market also performed strongly. Short-term credit spreads tightened for most of the fiscal year, but with worries stemming from the Coronavirus (COVID-19), spreads widened in the final month of the fiscal year. With spreads roughly unchanged over the past
12 months, the primary driver of returns was the decline in US Treasury yields. In particu- lar, the three-year US Treasury yield fell from 2.50% at the beginning of the fiscal year to 0.85% as of February 29, 2020.1
During the fiscal year, the US Federal Re- serve (the Fed) cut interest rates three times: in July, September and October 2019, for a total decrease of 75 basis points.2 (A basis point is one one-hundredth of a percent- age point.) As a result, the federal funds tar- get rate stood at a range of 1.50% to 1.75% on October 31, 2019, as well as at the end of the fiscal year.2 In addition to the decline in
Portfolio Composition
By security type | % of total net assets |
U.S. Dollar Denominated Bonds & |
Notes | 61.23% |
Asset-Backed Securities | 28.12 |
U.S. Treasury Securities | 7.42 |
Security Types Each Less Than |
1% of Portfolio | 0.64 |
Money Market Funds Plus Other |
Assets Less Liabilities | 2.59 |
the federal funds target rate, US Treasury rates fell across all maturities.
The Fund, at NAV, generated positive abso- lute returns for the fiscal year and outper- formed its style-specific benchmark, the Bloomberg Barclays 1-3 Year Government/ Credit Index.
The Fund's overweight allocation to and security selection in the investment grade corporate credit sector was the primary driver of Fund performance relative to the style-specific benchmark during the fiscal year. In particular, overweight allocation to and security selection in the industrials, tech- nology, media and telecom, and consumer non-cyclical sectors contributed the most to the Fund's relative performance. Out-of-index exposure to high yield credit securities and non-agency mortgage-backed securities boosted relative performance, as well. Our overall duration positioning during the fiscal year was in line with the Fund's style-specific benchmark and, as a result, did not have an impact on relative performance. The Fund's cash position detracted from relative perfor- mance as most fixed income sectors outper- formed liquidity instruments for the fiscal year.
During the fiscal year, we used several strategies in seeking to manage overall risk in the Fund and manage liquidity needs. Throughout the fiscal year, approximately
Top Five Debt Holdings
% of total net assets
1. U.S. Treasury Notes | 3.2% |
2. U.S. Treasury Notes | 3.2 |
3. Morgan Stanley | 1.9 |
4. Continental Resources, Inc. | 1.9 |
5. Cigna Corp. | 1.5 |
Buying and selling US Treasury futures was an important tool used for the management of interest rate risk and to maintain our tar- geted portfolio duration.
Please note that our strategy may be implemented using derivative instruments, including futures, forward foreign currency contracts, swaps and options. Therefore, a portion of the performance of the strategy, both positive and negative, can be attributed to these instruments. Derivatives can be a cost-effective way to gain or hedge exposure to certain risks. However, derivatives may amplify traditional investment risks through the creation of leverage and may be less liq- uid than traditional securities.
We wish to remind you that the Fund is subject to interest rate risk, meaning when interest rates rise, the value of fixed income securities tends to fall. The risk may be greater in the current market environment because interest rates are near historic lows. The degree to which the value of fixed income securities may decline due to rising interest rates may vary depending on the speed and magnitude of the increase in interest rates, as well as individual security characteristics, such as price, maturity, duration and coupon and market forces, such as supply and de- mand for like similar securities. We are moni- toring interest rates, and the market, eco- nomic and geopolitical factors that may
The Fund's holdings are subject to change, and there is no assurance that the Fund will continue to hold any particular security.
Data presented here are as of February 29, 2020.
4Invesco Short Term Bond Fund

impact the direction, speed and magnitude of changes to interest rates across the maturity spectrum, including the potential impact of monetary policy changes by the Fed and cer- tain foreign central banks. If interest rates rise or fall faster than expected, markets may experience increased volatility, which may affect the value and/or liquidity of certain of the Fund's investments.
Thank you for investing in Invesco Short Term Bond Fund and for sharing our long- term investment horizon.
1Source: US Department of the Treasury
2 Source: US Federal Reserve
Portfolio Managers:
Matt Brill
Chuck Burge
Michael Hyman
The views and opinions expressed in management's discussion of Fund performance are those of Invesco Advisers, Inc. These views and opinions are subject to change at any time based on factors such as market and economic conditions. These views and opinions may not be relied upon as investment advice or recommendations, or as an offer for a particular security. The information is not a complete analysis of every aspect of any market, country, industry, security or the Fund. Statements of fact are from sources considered reliable, but Invesco Advisers, Inc. makes no representation or warranty as to their completeness or accuracy. Although historical performance is no guarantee of future results, these insights may help you understand our investment management philosophy.
See important Fund and, if applicable, index disclosures later in this report.
5Invesco Short Term Bond Fund
Your Fund's Long-Term Performance
Results of a $10,000 Investment — Oldest Share Class(es)
Fund and index data from 2/28/10
$15,000
$14,707 Bloomberg Barclays U.S. Aggregate Bond Index1
$12,392 Lipper Short Investment Grade Debt Funds Index2
$12,052 Invesco Short Term Bond Fund — Class A Shares
12,000 
 $11,951 Invesco Short Term Bond Fund — Class C Shares
  $11,697 Bloomberg Barclays 1-3 Year Government/Credit Index1
9,000
2/28/10 | 2/11 | 2/12 | 2/13 | 2/14 | 2/15 | 2/16 | 2/17 | 2/18 | 2/19 | 2/20 |
1Source: RIMES Technologies Corp.
2 Source: Lipper Inc.
Past performance cannot guarantee future results.
The data shown in the chart include rein- vested distributions, applicable sales charges and Fund expenses including management
fees. Index results include reinvested divi- dends, but they do not reflect sales charges. Performance of the peer group, if applicable, reflects fund expenses and management fees; performance of a market index does not. Per-
formance shown in the chart and table(s) does not reflect deduction of taxes a share- holder would pay on Fund distributions or sale of Fund shares.
6Invesco Short Term Bond Fund

Average Annual Total Returns
As of 2/29/20, including maximum applicable sales charges
Class A Shares
Inception (4/30/04) | 1.97% |
10 Years | 1.88 |
5 | Years | 1.73 |
1 | Year | 2.42 |
Class C Shares | |
Inception (8/30/02) | 2.06% |
10 Years | 1.80 |
5 | Years | 1.89 |
1 | Year | 4.71 |
Class R Shares | |
Inception (4/30/04) | 1.84% |
10 Years | 1.80 |
5 | Years | 1.91 |
1 | Year | 4.70 |
Class Y Shares | |
Inception (10/3/08) | 2.49% |
10 Years | 2.30 |
5 | Years | 2.40 |
1 | Year | 5.11 |
Class R5 Shares | |
Inception (4/30/04) | 2.38% |
10 Years | 2.35 |
5 | Years | 2.51 |
1 | Year | 5.20 |
Class R6 Shares | |
10 Years | 2.25% |
5 | Years | 2.52 |
1 | Year | 5.23 |
Class R6 shares incepted on September 24, 2012. Performance shown prior to that date is that of Class C shares and includes the 12b-1 fees applicable to Class C shares.
The performance data quoted represent past performance and cannot guarantee future results; current performance may be lower or higher. Please visit invesco.com/ performance for the most recent month- end performance. Performance figures re- flect reinvested distributions, changes in net asset value and the effect of the maxi- mum sales charge unless otherwise stated. Performance figures do not reflect deduc- tion of taxes a shareholder would pay on Fund distributions or sale of Fund shares. Investment return and principal value will fluctuate so that you may have a gain or loss when you sell shares.
Class A share performance reflects the maximum 2.50% sales charge. Class C shares have no upfront or contingent de- ferred sales charges; therefore, perfor- mance shown is at net asset value. Class R, Class Y, Class R5 and Class R6 shares do not have a front-end sales charge or a CDSC; therefore, performance is at net asset value.
The performance of the Fund's share classes will differ primarily due to different sales charge structures and class expenses. Fund performance reflects any applicable
fee waivers and/or expense reimburse- ments. Had the adviser not waived fees and/or reimbursed expenses currently or in the past, returns would have been lower. See current prospectus for more informa- tion.
7Invesco Short Term Bond Fund

Invesco Short Term Bond Fund's investment objective is total return, comprised of current income and capital appreciation.
Unless otherwise stated, information presented in this report is as of February 29, 2020, and is based on total net assets.
Unless otherwise noted, all data provided by Invesco.
To access your Fund's reports/prospectus, visit invesco.com/fundreports.
About indexes used in this report
The Bloomberg Barclays 1-3 Year Government/Credit Index is an unman- aged index considered representative of short-term US corporate bonds and US government bonds with maturities of one to three years.
The Bloomberg Barclays U.S. Aggregate Bond Index is an unmanaged index con- sidered representative of the US invest- ment grade, fixed-rate bond market.
The Lipper Short Investment Grade Debt Funds Index is an unmanaged index con- sidered representative of short investment grade debt funds tracked by Lipper.
The Fund is not managed to track the per- formance of any particular index, including the index(es) described here, and conse- quently, the performance of the Fund may deviate significantly from the performance of the index(es).
A direct investment cannot be made in an index. Unless otherwise indicated, index results include reinvested dividends, and they do not reflect sales charges. Perfor- mance of the peer group, if applicable, reflects fund expenses; performance of a market index does not.
This report must be accompanied or preceded by a currently effective Fund prospectus, which contains more complete information, including sales charges and expenses. Investors should read it carefully before investing.
NOT FDIC INSURED | MAY LOSE VALUE | NO BANK GUARANTEE
8Invesco Short Term Bond Fund

Schedule of Investments(a)
February 29, 2020
Principal
AmountValue
U.S. Dollar Denominated Bonds & Notes–61.23%
Aerospace & Defense–0.96% | | | |
Boeing Co. (The), 2.22%, | | | |
11/17/2020(b) | $10,010,000 | $ | 9,866,741 |
Rockwell Collins, Inc., 2.80%, | | | |
03/15/2022 | 5,414,000 | | 5,567,778 |
| | | 15,434,519 |
Agricultural & Farm Machinery–0.83% | | |
John Deere Capital Corp., | | | |
2.95%, 04/01/2022 | 5,000,000 | | 5,173,922 |
2.05%, 01/09/2025 | 8,000,000 | | 8,248,536 |
| | | 13,422,458 |
Airlines–3.92% | | | |
American Airlines Group, Inc., | | | |
5.00%, 06/01/2022(b) | 5,332,000 | | 5,351,995 |
American Airlines Pass Through Trust, | | | |
Series 2016-3, Class B, 3.75%, | | | |
10/15/2025 | 2,398,077 | | 2,495,700 |
Series 2017-2, Class B, 3.70%, | | | |
10/15/2025 | 2,561,989 | | 2,650,471 |
Series 2019-1, Class B, 3.85%, | | | |
02/15/2028 | 4,172,308 | | 4,377,998 |
Avianca Holdings S.A. (Colombia), | | | |
9.00%, 05/10/2023(b) | 1,757,000 | | 1,489,058 |
British Airways Pass Through Trust | | | |
(United Kingdom), Series 2019-1, | | | |
Class A, 3.35%, 06/15/2029(b) | 2,478,000 | | 2,641,739 |
Delta Air Lines Pass Through Trust, | | | |
Series 2019-1, Class A, 3.40%, | | | |
04/25/2024 | 1,852,000 | | 1,972,368 |
Series 2019-1, Class AA, 3.20%, | | | |
04/25/2024 | 3,568,000 | | 3,793,603 |
Delta Air Lines, Inc., | | | |
2.88%, 03/13/2020 | 15,951,000 | | 15,953,305 |
3.40%, 04/19/2021 | 2,426,000 | | 2,471,248 |
3.63%, 03/15/2022 | 4,138,000 | | 4,263,901 |
Norwegian Air Shuttle ASA Pass | | | |
Through Trust (Norway), | | | |
Series 2016-1, Class B, 7.50%, | | | |
11/10/2023(b) | 6,111,072 | | 6,481,480 |
United Airlines Pass Through Trust, | | | |
Series 2016-2, Class B, 3.65%, | | | |
10/07/2025 | 2,885,546 | | 3,012,627 |
Series 2018-1, Class B, 4.60%, | | | |
03/01/2026 | 3,427,242 | | 3,622,054 |
Series 2019-2, Class B, 3.50%, | | | |
05/01/2028 | 2,513,000 | | 2,607,417 |
| | | 63,184,964 |
Aluminum–0.31% | | | |
PT Indonesia Asahan Aluminium | | | |
(Persero) (Indonesia), 5.23%, | | | |
11/15/2021(b) | 4,800,000 | | 5,028,467 |
Apparel Retail–0.21% | | | |
L Brands, Inc., 5.63%, | | | |
02/15/2022 | 3,185,000 | | 3,342,275 |
| | Principal | | |
| | Amount | | Value |
Automobile Manufacturers–7.13% | | | |
American Honda Finance Corp., | | | | |
Series 2019-B, Class A2B, | | | | |
2.24% (3 mo. USD LIBOR + | | | | |
0.35%), 06/11/2021(c) | $ | 6,094,000 | $ | 6,094,000 |
Ford Motor Credit Co. LLC, | | | | |
5.09%, 01/07/2021 | | 4,968,000 | | 5,098,027 |
2.73%, (3 mo. USD LIBOR + | | | | |
0.88%), 10/12/2021(c) | | 6,243,000 | | 6,175,569 |
3.81%, 10/12/2021 | | 8,654,000 | | 8,831,393 |
5.60%, 01/07/2022 | | 4,592,000 | | 4,846,440 |
3.35%, 11/01/2022 | | 4,991,000 | | 5,040,118 |
3.09%, 01/09/2023 | | 8,285,000 | | 8,312,438 |
4.06%, 11/01/2024 | | 1,000,000 | | 1,019,655 |
General Motors Financial Co., Inc., | | | | |
2.73%, (3 mo. USD LIBOR + | | | | |
0.85%), 04/09/2021(c) | | 2,420,000 | | 2,428,481 |
3.20%, 07/06/2021 | | 2,613,000 | | 2,644,196 |
4.20%, 11/06/2021 | | 9,339,000 | | 9,653,312 |
3.55%, 07/08/2022 | | 4,018,000 | | 4,148,883 |
Hyundai Capital America, | | | | |
3.95%, 02/01/2022(b) | | 16,000,000 | | 16,651,258 |
2.85%, 11/01/2022(b) | | 6,667,000 | | 6,838,781 |
2.38%, 02/10/2023(b) | | 2,995,000 | | 3,022,752 |
4.30%, 02/01/2024(b) | | 6,601,000 | | 7,112,954 |
2.65%, 02/10/2025(b) | | 3,960,000 | | 4,039,347 |
Toyota Motor Credit Corp., 2.05% | | | | |
(SOFR + 0.40%), 10/23/2020(c) | | 10,000,000 | | 10,010,632 |
Volkswagen Group of America | | | | |
Finance LLC (Germany), 2.65% (3 | | | | |
mo. USD LIBOR + 0.94%), | | | | |
11/12/2021(b)(c) | | 2,867,000 | | 2,896,402 |
| | | | 114,864,638 |
Biotechnology–2.68% | | | | |
AbbVie, Inc., | | | | |
3.38%, 11/14/2021 | | 6,061,000 | | 6,246,002 |
2.15%, 11/19/2021(b) | | 21,785,000 | | 21,996,245 |
2.30%, 11/21/2022(b) | | 6,030,000 | | 6,133,477 |
2.60%, 11/21/2024(b) | | 8,476,000 | | 8,764,806 |
| | | | 43,140,530 |
Brewers–0.19% | | | | |
Anheuser-Busch InBev Worldwide, | | | | |
Inc. (Belgium), 4.15%, | | | | |
01/23/2025 | | 2,803,000 | | 3,120,930 |
Broadcasting–0.08% | | | | |
Fox Corp., 4.03%, 01/25/2024(b) | | 1,180,000 | | 1,276,902 |
Cable & Satellite–1.23% | | | | |
Charter Communications | | | | |
Operating LLC/Charter | | | | |
Communications Operating | | | | |
Capital Corp., 3.58%, | | | | |
07/23/2020 | | 19,795,000 | | 19,906,618 |
Construction Machinery & Heavy Trucks–0.20% | | |
Caterpillar Financial Services Corp., | | | | |
2.17% (3 mo. USD LIBOR + | | | | |
0.28%), 09/07/2021(c) | | 3,250,000 | | 3,258,220 |
See accompanying Notes to Financial Statements which are an integral part of the financial statements.
9Invesco Short Term Bond Fund
| | Principal | | |
| | Amount | | Value |
Construction Materials–0.43% | | | | |
Carrier Global Corp., | | | | |
1.92%, 02/15/2023(b) | $ | 3,659,000 | $ | 3,708,891 |
2.24%, 02/15/2025(b) | | 3,169,000 | | 3,227,845 |
| | | | 6,936,736 |
Data Processing & Outsourced Services–0.33% | | |
PayPal Holdings, Inc., 2.20%, | | | | |
09/26/2022 | | 5,231,000 | | 5,308,423 |
Diversified Banks–4.85% | | | | |
Banco del Estado de Chile (Chile), | | | | |
2.70%, 01/09/2025(b) | | 6,415,000 | | 6,495,187 |
Banco do Brasil S.A. (Brazil), | | | | |
8.50%(b)(d) | | 1,893,000 | | 1,935,015 |
8.50%(b)(d) | | 5,000,000 | | 5,110,975 |
Barclays Bank PLC (United Kingdom), | | | | |
5.14%, 10/14/2020 | | 1,195,000 | | 1,220,771 |
10.18%, 06/12/2021(b) | | 6,000,000 | | 6,602,731 |
Barclays PLC (United Kingdom), | | | | |
3.12% (3 mo. USD LIBOR + | | | | |
1.43%), 02/15/2023(c) | | 5,954,000 | | 6,043,146 |
BBVA Bancomer S.A. (Mexico), | | | | |
7.25%, 04/22/2020(b) | | 592,000 | | 594,930 |
Citigroup, Inc., Series V, 4.70%(c)(d) | | 1,880,000 | | 1,857,675 |
Danske Bank A/S (Denmark), | | | | |
3.00%, (3 mo. USD LIBOR + | | | | |
1.25%), 09/20/2022(b)(c) | | 3,281,000 | | 3,330,443 |
2.95%, (3 mo. USD LIBOR + | | | | |
1.06%), 09/12/2023(b)(c) | | 5,898,000 | | 5,936,580 |
Federation des caisses Desjardins du | | | | |
Quebec (Canada), 2.05%, | | | | |
02/10/2025(b) | | 4,334,000 | | 4,389,824 |
Global Bank Corp. (Panama), 4.50%, | | | | |
10/20/2021(b) | | 6,500,000 | | 6,672,250 |
Industrial & Commercial Bank of | | | | |
China Ltd. (China), 2.96%, | | | | |
11/08/2022 | | 905,000 | | 932,483 |
ING Groep N.V. (Netherlands), | | | | |
6.00%(d) | | 3,735,000 | | 3,734,626 |
JPMorgan Chase & Co., | | | | |
Series HH, 4.60% (SOFR + | | | | |
3.13%)(c)(d) | | 2,735,000 | | 2,752,094 |
Series I, 5.24% (3 mo. USD LIBOR | | | | |
+ 3.47%)(c)(d) | | 1,956,000 | | 1,955,501 |
Series V, 5.23% (3 mo. USD | | | | |
LIBOR + 3.32%)(c)(d) | | 1,390,000 | | 1,385,476 |
PNC Bank NA, 2.32% (3 mo. USD | | | | |
LIBOR + 0.43%), 12/09/2022(c) | | 8,000,000 | | 8,041,143 |
Skandinaviska Enskilda Banken AB | | | | |
(Sweden), 2.53% (3 mo. USD | | | | |
LIBOR + 0.65%), | | | | |
12/12/2022(b)(c) | | 5,559,000 | | 5,601,219 |
Standard Chartered PLC (United | | | | |
Kingdom), 2.97% (3 mo. USD | | | | |
LIBOR + 1.15%), | | | | |
01/20/2023(b)(c) | | 1,379,000 | | 1,390,610 |
Wells Fargo & Co., Series K, 5.66% | | | | |
(3 mo. USD LIBOR + 3.77%)(c)(d) | | 2,150,000 | | 2,152,688 |
| | | | 78,135,367 |
Diversified Capital Markets–0.43% | | | |
Credit Suisse Group AG | | | | |
(Switzerland), 3.57%, | | | | |
01/09/2023(b) | | 6,700,000 | | 6,929,457 |
| Principal | | |
| Amount | | Value |
Electric Utilities–0.75% | | | |
Exelon Corp., | | | |
2.85%, 06/15/2020 | $ 4,285,000 | $ | 4,295,344 |
3.50%, 06/01/2022 | 3,678,000 | | 3,818,036 |
Georgia Power Co., 2.85%, | | | |
05/15/2022 | 3,781,000 | | 3,904,053 |
| | | 12,017,433 |
Financial Exchanges & Data–0.32% | | |
Moody's Corp., 3.25%, | | | |
06/07/2021 | 5,081,000 | | 5,191,696 |
Food Retail–0.18% | | | |
Albertson's Cos., Inc./Safeway, | | | |
Inc./New Albertson's | | | |
L.P./Albertson's LLC, 3.50%, | | | |
02/15/2023(b) | 2,922,000 | | 2,932,958 |
Health Care Distributors–1.03% | | | |
Cardinal Health, Inc., 2.62%, | | | |
06/15/2022 | 4,999,000 | | 5,120,551 |
McKesson Corp., 3.65%, | | | |
11/30/2020 | 11,340,000 | | 11,520,761 |
| | | 16,641,312 |
Health Care Equipment–0.72% | | | |
Becton, Dickinson and Co., 2.40%, | | | |
06/05/2020 | 5,358,000 | | 5,368,698 |
Zimmer Biomet Holdings, Inc., | | | |
2.65% (3 mo. USD LIBOR + | | | |
0.75%), 03/19/2021(c) | 6,250,000 | | 6,251,240 |
| | | 11,619,938 |
Health Care Services–2.47% | | | |
Cigna Corp., | | | |
3.20%, 09/17/2020 | 24,000,000 | | 24,182,443 |
3.40%, 09/17/2021 | 7,772,000 | | 7,975,735 |
3.75%, 07/15/2023 | 3,696,000 | | 3,937,147 |
CVS Health Corp., 3.70%, | | | |
03/09/2023 | 3,516,000 | | 3,717,615 |
| | | 39,812,940 |
Hotels, Resorts & Cruise Lines–0.54% | | |
Marriott International, Inc., Series Y, | | | |
2.18% (3 mo. USD LIBOR + | | | |
0.60%), 12/01/2020(c) | 8,718,000 | | 8,739,069 |
Insurance Brokers–0.18% | | | |
Marsh & McLennan Cos., Inc., | | | |
3.88%, 03/15/2024 | 2,665,000 | | 2,899,466 |
Integrated Oil & Gas–1.63% | | | |
Occidental Petroleum Corp., 2.60%, | | | |
08/13/2021 | 2,192,000 | | 2,220,546 |
Saudi Arabian Oil Co. (Saudi Arabia), | | | |
2.75%, 04/16/2022(b) | 14,633,000 | | 14,870,738 |
2.88%, 04/16/2024(b) | 8,952,000 | | 9,201,086 |
| | | 26,292,370 |
Integrated Telecommunication Services–0.45% | | |
AT&T, Inc., | | | |
2.45%, 06/30/2020 | 4,426,000 | | 4,430,494 |
3.07%, (3 mo. USD LIBOR + | | | |
1.18%), 06/12/2024(c) | 2,732,000 | | 2,765,887 |
| | | 7,196,381 |
See accompanying Notes to Financial Statements which are an integral part of the financial statements.
10 | Invesco Short Term Bond Fund |
| Principal | | |
| Amount | | Value |
Interactive Media & Services–0.92% | | |
Tencent Holdings Ltd. (China), | | | |
2.99%, 01/19/2023(b) | $ 4,039,000 | $ | 4,177,265 |
3.28%, 04/11/2024(b) | 10,000,000 | | 10,591,610 |
| | | 14,768,875 |
Internet & Direct Marketing Retail–0.09% | | |
QVC, Inc., 4.75%, 02/15/2027 | 1,475,000 | | 1,453,551 |
Investment Banking & Brokerage–2.93% | | |
Cantor Fitzgerald L.P., 6.50%, | | | |
06/17/2022(b) | 4,519,000 | | 4,953,316 |
Goldman Sachs Group, Inc. (The), | | | |
5.38%, 03/15/2020 | 10,000,000 | | 10,012,469 |
2.97%, (3 mo. USD LIBOR + | | | |
1.16%), 04/23/2020(c) | 2,092,000 | | 2,093,070 |
Morgan Stanley, 2.38% (SOFR + | | | |
0.83%), 06/10/2022(c) | 30,000,000 | | 30,164,637 |
| | | 47,223,492 |
Leisure Products–0.25% | | | |
Hasbro, Inc., 2.60%, 11/19/2022 | 3,860,000 | | 3,973,467 |
Life & Health Insurance–2.53% | | | |
AIG Global Funding, 2.70%, | | | |
12/15/2021(b) | 7,047,000 | | 7,176,070 |
New York Life Global Funding, | | | |
2.01% (3 mo. USD LIBOR + | | | |
0.28%), 01/10/2023(b)(c) | 20,000,000 | | 20,023,951 |
Protective Life Global Funding, | | | |
2.16%, 09/25/2020(b) | 5,000,000 | | 5,018,844 |
Reliance Standard Life Global | | | |
Funding II, 2.50%, | | | |
10/30/2024(b) | 8,350,000 | | 8,634,330 |
| | | 40,853,195 |
Managed Health Care–0.45% | | | |
UnitedHealth Group, Inc., 2.38%, | | | |
08/15/2024 | 7,000,000 | | 7,234,715 |
Marine Ports & Services–0.12% | | | |
Adani Abbot Point Terminal Pty. Ltd. | | | |
(Australia), 4.45%, | | | |
12/15/2022(b) | 1,916,000 | | 1,954,390 |
Multi-Utilities–1.00% | | | |
CenterPoint Energy, Inc., 2.50%, | | | |
09/01/2024 | 2,960,000 | | 3,058,430 |
Dominion Energy, Inc., 2.72%, | | | |
08/15/2021(e) | 8,214,000 | | 8,347,507 |
WEC Energy Group, Inc., 3.10%, | | | |
03/08/2022 | 4,620,000 | | 4,767,954 |
| | | 16,173,891 |
Office REITs–0.31% | | | |
SL Green Operating Partnership L.P., | | | |
2.67% (3 mo. USD LIBOR + | | | |
0.98%), 08/16/2021(c) | 5,000,000 | | 5,001,079 |
Oil & Gas Exploration & Production–1.84% | | |
Continental Resources, Inc., 5.00%, | | | |
09/15/2022 | 29,710,000 | | 29,676,721 |
Oil & Gas Refining & Marketing–0.14% | | |
Phillips 66, 2.25% (3 mo. USD | | | |
LIBOR + 0.60%), 02/26/2021(c) | 2,264,000 | | 2,264,219 |
| Principal | | |
| Amount | | Value |
Oil & Gas Storage & Transportation–3.18% | | |
DCP Midstream Operating L.P., | | | |
5.35%, 03/15/2020(b) | $ 4,285,000 | $ | 4,290,437 |
Energy Transfer Operating L.P., | | | |
2.90%, 05/15/2025 | 4,079,000 | | 4,165,760 |
Enterprise Products Operating LLC, | | | |
3.50%, 02/01/2022 | 5,000,000 | | 5,211,326 |
Series D, 4.88%, 08/16/2077(c) | 8,270,000 | | 8,119,031 |
MPLX L.P., | | | |
2.79%, (3 mo. USD LIBOR + | | | |
0.90%), 09/09/2021(c) | 7,864,000 | | 7,887,362 |
2.99%, (3 mo. USD LIBOR + | | | |
1.10%), 09/09/2022(c) | 5,687,000 | | 5,708,401 |
Plains All American Pipeline L.P./PAA | | | |
Finance Corp., 5.00%, | | | |
02/01/2021 | 3,300,000 | | 3,360,334 |
Western Midstream Operating L.P., | | | |
2.70%, (3 mo. USD LIBOR + | | | |
0.85%), 01/13/2023(c) | 4,411,000 | | 4,395,605 |
3.10%, 02/01/2025 | 1,764,000 | | 1,764,813 |
Williams Cos., Inc. (The), 4.13%, | | | |
11/15/2020 | 6,233,000 | | 6,297,294 |
| | | 51,200,363 |
Other Diversified Financial Services–0.12% | | |
USAA Capital Corp., 2.45%, | | | |
08/01/2020(b) | 2,000,000 | | 2,010,317 |
Pharmaceuticals–1.76% | | | |
Allergan Funding S.C.S., 3.14% (3 | | | |
mo. USD LIBOR + 1.26%), | | | |
03/12/2020(c) | 9,600,000 | | 9,602,952 |
Bristol-Myers Squibb Co., | | | |
2.88%, 02/19/2021(b) | 3,500,000 | | 3,545,639 |
2.60%, 05/16/2022(b) | 10,690,000 | | 10,969,847 |
GlaxoSmithKline Capital PLC (United | | | |
Kingdom), 2.88%, 06/01/2022 | 4,214,000 | | 4,339,093 |
| | | 28,457,531 |
Property & Casualty Insurance–0.55% | | |
Suncorp-Metway Ltd. (Australia), | | | |
2.35%, 04/27/2020(b) | 8,805,000 | | 8,814,972 |
Regional Banks–2.39% | | | |
Citizens Financial Group, Inc., | | | |
Series A, 5.50%(d) | 3,900,000 | | 3,881,299 |
First Niagara Financial Group, Inc., | | | |
7.25%, 12/15/2021 | 750,000 | | 821,596 |
KeyBank N.A., 2.50%, 11/22/2021 | 4,023,000 | | 4,105,503 |
Synovus Financial Corp., 5.75% (3 | | | |
mo. USD LIBOR + 4.18%), | | | |
12/15/2025(c) | 7,885,000 | | 8,124,822 |
Truist Bank, 2.25%, 06/01/2020 | 6,720,000 | | 6,728,325 |
Zions Bancorporation N.A., | | | |
3.50%, 08/27/2021 | 9,550,000 | | 9,817,406 |
3.35%, 03/04/2022 | 4,861,000 | | 5,013,373 |
| | | 38,492,324 |
Semiconductors–2.30% | | | |
Analog Devices, Inc., 2.50%, | | | |
12/05/2021 | 4,825,000 | | 4,905,499 |
Broadcom Corp./Broadcom Cayman | | | |
Finance Ltd., 3.00%, | | | |
01/15/2022 | 15,000,000 | | 15,299,256 |
See accompanying Notes to Financial Statements which are an integral part of the financial statements.
11 | Invesco Short Term Bond Fund |
| Principal | | |
| Amount | | Value |
Semiconductors–(continued) | | | |
Broadcom, Inc., | | | |
3.13%, 04/15/2021(b) | $ 4,800,000 | $ | 4,875,319 |
3.13%, 10/15/2022(b) | 6,600,000 | | 6,821,393 |
NXP B.V./NXP Funding LLC | | | |
(Netherlands), 4.13%, | | | |
06/01/2021(b) | 5,000,000 | | 5,140,832 |
| | | 37,042,299 |
Soft Drinks–0.29% | | | |
Keurig Dr Pepper, Inc., 3.55%, | | | |
05/25/2021 | 4,604,000 | | 4,715,452 |
Specialized Finance–0.13% | | | |
Park Aerospace Holdings Ltd. | | | |
(Ireland), 5.25%, | | | |
08/15/2022(b) | 2,000,000 | | 2,129,119 |
Specialized REITs–0.60% | | | |
Equinix, Inc., 2.63%, 11/18/2024 | 9,480,000 | | 9,755,157 |
Specialty Chemicals–0.19% | | | |
International Flavors & Fragrances, | | | |
Inc., 3.40%, 09/25/2020 | 3,000,000 | | 3,025,335 |
Steel–1.54% | | | |
POSCO (South Korea), | | | |
2.38%, 01/17/2023(b) | 9,145,000 | | 9,295,429 |
2.50%, 01/17/2025(b) | 4,990,000 | | 5,059,559 |
Steel Dynamics, Inc., 5.50%, | | | |
10/01/2024 | 10,096,000 | | 10,401,404 |
| | | 24,756,392 |
Systems Software–0.65% | | | |
VMware, Inc., | | | |
2.30%, 08/21/2020 | 6,705,000 | | 6,713,328 |
2.95%, 08/21/2022 | 3,604,000 | | 3,710,303 |
| | | 10,423,631 |
Technology Hardware, Storage & Peripherals–0.30% | |
Dell International LLC/EMC Corp., | | | |
4.00%, 07/15/2024(b) | 4,545,000 | | 4,871,524 |
Tobacco–0.72% | | | |
Altria Group, Inc., 3.49%, | | | |
02/14/2022 | 7,017,000 | | 7,270,079 |
BAT Capital Corp. (United Kingdom), | | | |
2.79%, 09/06/2024 | 4,148,000 | | 4,267,838 |
| | | 11,537,917 |
Trucking–2.27% | | | |
Aviation Capital Group LLC, 2.44% | | | |
(3 mo. USD LIBOR + 0.67%), | | | |
07/30/2021(b)(c) | 1,860,000 | | 1,867,182 |
Avolon Holdings Funding Ltd. | | | |
(Ireland), 3.63%, | | | |
05/01/2022(b) | 2,760,000 | | 2,826,714 |
DAE Funding LLC (United Arab | | | |
Emirates), 4.00%, | | | |
08/01/2020(b) | 3,192,000 | | 3,205,207 |
Penske Truck Leasing Co. L.P./PTL | | | |
Finance Corp., | | | |
3.20%, 07/15/2020(b) | 2,374,000 | | 2,385,365 |
3.65%, 07/29/2021(b) | 21,478,000 | | 22,068,931 |
| Principal | | |
| Amount | | Value |
Trucking–(continued) | | | |
Ryder System, Inc., 2.50%, | | | |
09/01/2024 | $ 4,100,000 | $ | 4,210,935 |
| | | 36,564,334 |
Wireless Telecommunication Services–1.61% | | |
America Movil S.A.B. de C.V. | | | |
(Mexico), 5.00%, 03/30/2020 | 541,000 | | 542,314 |
Sprint Spectrum Co. LLC/Sprint | | | |
Spectrum Co. II LLC/Sprint Spectrum | | | |
Co. III LLC, | | | |
Class A-1, 3.36%, | | | |
09/20/2021(b) | 7,745,063 | | 7,817,479 |
4.74%, 03/20/2025(b) | 12,282,000 | | 13,176,928 |
VEON Holdings B.V. (Netherlands), | | | |
4.00%, 04/09/2025(b) | 4,343,000 | | 4,462,432 |
| | | 25,999,153 |
Total U.S. Dollar Denominated Bonds & Notes | | |
(Cost $969,657,982) | | | 987,007,482 |
Asset-Backed Securities–28.12% | | |
ALM VII Ltd., Series 2012-7A, | | | |
Class A1A2, 3.00% (3 mo. USD | | | |
LIBOR + 1.17%), | | | |
07/15/2029(b)(c) | 2,230,600 | | 2,231,898 |
Alternative Loan Trust, | | | |
Series 2004-8CB, Class A, | | | |
2.20% (1 mo. USD LIBOR + | | | |
0.27%), 06/25/2034(c) | 210,528 | | 212,181 |
Americold LLC Trust, Series 2010- | | | |
ARTA, Class A1, 3.85%, | | | |
01/14/2029(b) | 795,277 | | 800,201 |
Angel Oak Mortgage Trust, | | | |
Series 2019-3, Class A1, 2.93%, | | | |
05/25/2059(b)(f) | 8,492,014 | | 8,570,874 |
Series 2020-1, Class A1, 2.47%, | | | |
12/25/2059(b)(f) | 2,209,851 | | 2,222,700 |
Angel Oak Mortgage Trust I LLC, | | | |
Series 2018-1, Class A1, 3.26%, | | | |
04/27/2048(b)(f) | 2,709,998 | | 2,729,993 |
Series 2018-3, Class A1, 3.65%, | | | |
09/25/2048(b)(f) | 5,316,954 | | 5,420,243 |
Series 2019-2, Class A1, 3.63%, | | | |
03/25/2049(b)(f) | 7,017,900 | | 7,152,115 |
Angel Oak Mortgage Trust LLC, | | | |
Series 2017-1, Class A1, 2.81%, | | | |
01/25/2047(b)(f) | 557,134 | | 558,866 |
Series 2017-3, Class A1, 2.71%, | | | |
11/25/2047(b)(f) | 696,349 | | 698,874 |
Apex Credit CLO Ltd., | | | |
Series 2017-1A, Class AF, | | | |
3.60%, 04/24/2029(b) | 3,432,300 | | 3,436,064 |
Banc of America Mortgage Trust, | | | |
Series 2004-D, Class 2A2, | | | |
4.81%, 05/25/2034(f) | 33,011 | | 33,525 |
Bear Stearns Adjustable Rate | | | |
Mortgage Trust, Series 2003-6, | | | |
Class 1A3, 4.03%, | | | |
08/25/2033(f) | 67,185 | | 68,733 |
CarMax Auto Owner Trust, | | | |
Series 2018-3, Class A3, 3.13%, | | | |
06/15/2023 | 11,500,000 | | 11,742,425 |
Castlelake Aircraft Structured Trust, | | | |
Series 2019-1A, Class A, 3.97%, | | | |
04/15/2039(b) | 3,935,892 | | 4,050,214 |
See accompanying Notes to Financial Statements which are an integral part of the financial statements.
12 | Invesco Short Term Bond Fund |
| Principal | | |
| Amount | | Value |
Asset-Backed Securities–(continued) | | |
CGDBB Commercial Mortgage Trust, | | | |
Series 2017-BIOC, Class A, | | | |
2.45% (1 mo. USD LIBOR + | | | |
0.79%), 07/15/2032(b)(c) | $ 5,595,453 | $ | 5,600,032 |
Series 2017-BIOC, Class C, | | | |
2.71% (1 mo. USD LIBOR + | | | |
1.05%), 07/15/2032(b)(c) | 3,608,496 | | 3,608,227 |
Series 2017-BIOC, Class D, | | | |
3.26% (1 mo. USD LIBOR + | | | |
1.60%), 07/15/2032(b)(c) | 2,204,380 | | 2,208,515 |
Chase Home Lending Mortgage Trust, | | | |
Series 2019-ATR2, Class A3, | | | |
3.50%, 07/25/2049(b)(f) | 9,300,255 | | 9,564,969 |
Citigroup Mortgage Loan Trust, | | | |
Series 2019-IMC1, Class A1, | | | |
2.72%, 07/25/2049(b)(f) | 7,952,740 | | 8,026,650 |
Citigroup Mortgage Loan Trust, Inc., | | | |
Series 2004-UST1, Class A4, | | | |
3.93%, 08/25/2034(f) | 149,023 | | 147,794 |
COLT Mortgage Loan Trust, | | | |
Class 2020-1, Class A1, 2.49%, | | | |
02/25/2050(b)(f) | 5,157,661 | | 5,228,319 |
Class 2020-1, Class A2, 2.69%, | | | |
02/25/2050(b)(f) | 2,663,976 | | 2,679,974 |
Credit Suisse Mortgage Trust, | | | |
Series 2020-AFC1, Class A1, | | | |
2.24%, 02/25/2050(b)(f) | 7,455,371 | | 7,545,076 |
CSWF, Series 2018-TOP, Class B, | | | |
2.96% (1 mo. USD LIBOR + | | | |
1.30%), 08/15/2035(b)(c) | 4,415,832 | | 4,418,721 |
DB Master Finance LLC, | | | |
Series 2019-1A, Class A2I, | | | |
3.79%, 05/20/2049(b) | 8,932,500 | | 9,274,458 |
Deephaven Residential Mortgage Trust, | | | |
Series 2017-2A, Class A2, | | | |
2.61%, 06/25/2047(b)(f) | 243,651 | | 244,845 |
Series 2017-2A, Class A3, | | | |
2.71%, 06/25/2047(b)(f) | 265,274 | | 266,637 |
Series 2017-3A, Class A1, | | | |
2.58%, 10/25/2047(b)(f) | 1,488,057 | | 1,493,018 |
Series 2017-3A, Class A2, | | | |
2.71%, 10/25/2047(b)(f) | 435,051 | | 436,507 |
Series 2017-3A, Class A3, | | | |
2.81%, 10/25/2047(b)(f) | 1,459,901 | | 1,464,701 |
Series 2018-2A, Class A1, | | | |
3.48%, 04/25/2058(b)(f) | 5,730,550 | | 5,736,050 |
Deephaven Residential Mortgage | | | |
Trust , Series 2019-4A, Class A1, | | | |
2.79%, 10/25/2059(b)(f) | 3,417,521 | | 3,446,760 |
DT Auto Owner Trust, | | | |
Series 2019-3A, Class C, 2.74%, | | | |
04/15/2025(b) | 2,890,000 | | 2,938,229 |
Series 2019-3A, Class D, 2.96%, | | | |
04/15/2025(b) | 4,146,000 | | 4,229,332 |
Galton Funding Mortgage Trust, | | | |
Series 2018-2, Series A41, | | | |
4.50%, 10/25/2058(b)(f) | 3,367,876 | | 3,456,270 |
Series 2019-H1, Class A1, | | | |
2.66%, 10/25/2059(b)(f) | 4,063,212 | | 4,105,886 |
GCAT Trust, | | | |
Series 2019-NQM2, Class A1, | | | |
2.86%, 09/25/2059(b)(e)(f) | 5,297,547 | | 5,367,168 |
Series 2019-NQM3, Class A1, | | | |
2.69%, 11/25/2059(b)(f) | 9,509,173 | | 9,665,127 |
| | Principal | | |
| | Amount | | Value |
| Asset-Backed Securities–(continued) | | |
Goldentree Loan Management US | | | |
| CLO 2 Ltd., Series 2017-2A, | | | |
| Class A, 2.97% (3 mo. USD LIBOR | | | |
| + 1.15%), 11/28/2030(b)(c) | $ 6,022,000 | $ | 6,029,527 |
Golub Capital Partners CLO 35(B) | | | |
| Ltd., Class 2017-35A, Class AR, | | | |
| 3.01% (3 mo. USD LIBOR + | | | |
| 1.19%), 07/20/2029(b)(c) | 9,000,000 | | 9,010,525 |
GS Mortgage Securities Trust, | | | |
| Series 2012-GC6, Class AS, | | | |
| 4.95%, 01/10/2045(b) | 2,500,000 | | 2,628,947 |
| Series 2015-GC30, Class A2, | | | |
| 2.73%, 05/10/2050 | 741,962 | | 741,940 |
Hertz Vehicle Financing II L.P., | | | |
| Series 2015-1A, Class A, 2.73%, | | | |
| 03/25/2021(b) | 7,000,000 | | 7,004,735 |
| Series 2015-1A, Class B, 3.52%, | | | |
| 03/25/2021(b) | 7,260,000 | | 7,267,065 |
| Series 2018-1A, Class A, 3.29%, | | | |
| 02/25/2024(b) | 3,360,000 | | 3,517,881 |
| Series 2019-1A, Class A, 3.71%, | | | |
| 03/25/2023(b) | 11,000,000 | | 11,487,852 |
| Series 2019-2A, Class A, 3.42%, | | | |
| 05/25/2025(b) | 6,300,000 | | 6,703,797 |
Hilton Grand Vacations Trust, | �� | | |
| Series 2019 AA, Class A, 2.34%, | | | |
| 07/25/2033(b) | 4,139,066 | | 4,226,928 |
Home Partners of America Trust, | | | |
| Series 2018-1, Class A, 2.56% | | | |
| (1 mo. USD LIBOR + 0.90%), | | | |
| 07/17/2037(b)(c) | 2,348,164 | | 2,345,838 |
| Series 2018-1, Class B, 2.76% | | | |
| (1 mo. USD LIBOR + 1.10%), | | | |
| 07/17/2037(b)(c) | 2,970,000 | | 2,951,733 |
| Series 2018-1, Class C, 2.91% | | | |
| (1 mo. USD LIBOR + 1.25%), | | | |
| 07/17/2037(b)(c) | 1,350,000 | | 1,341,388 |
Homeward Opportunities Fund I | | | |
| Trust, Series 2019-1, Class A1, | | | |
| 3.45%, 01/25/2059(b)(f) | 8,269,485 | | 8,383,425 |
Horizon Aircraft Finance III Ltd., | | | |
| Series 2019-2, Class A, 3.43%, | | | |
| 11/15/2039(b) | 5,107,143 | | 5,156,565 |
ICG US CLO Ltd., Series 2016-1A, | | | |
| Class A1R, 2.91% (3 mo. USD | | | |
| LIBOR + 1.14%), | | | |
| 07/29/2028(b)(c) | 3,000,000 | | 2,999,430 |
Invitation Homes Trust, | | | |
| Series 2017-SFR2, Class A, | | | |
| 2.51% (1 mo. USD LIBOR + | | | |
| 0.85%), 12/17/2036(b)(c) | 2,545,661 | | 2,535,850 |
| Series 2017-SFR2, Class B, | | | |
| 2.81% (1 mo. USD LIBOR + | | | |
| 1.15%), 12/17/2036(b)(c) | 1,441,000 | | 1,440,261 |
| Series 2017-SFR2, Class C, | | | |
| 3.11% (1 mo. USD LIBOR + | | | |
| 1.45%), 12/17/2036(b)(c) | 2,758,000 | | 2,740,309 |
| Series 2017-SFR2, Class D, | | | |
| 3.46% (1 mo. USD LIBOR + | | | |
| 1.80%), 12/17/2036(b)(c) | 2,101,916 | | 2,094,290 |
Jimmy Johns Funding LLC, | | | |
| Series 2017-1A, Class A2I, | | | |
| 3.61%, 07/30/2047(b) | 9,980,227 | | 10,112,229 |
JOL Air Ltd., Series 2019-1, | | | |
| Class A, 3.97%, 04/15/2044(b) | 6,154,257 | | 6,335,351 |
See accompanying Notes to Financial Statements which are an integral part of the financial statements.
13 | Invesco Short Term Bond Fund |
| Principal | | |
| Amount | | Value |
Asset-Backed Securities–(continued) | | |
JPMBB Commercial Mortgage Securities | | | |
Trust, | | | |
Series 2015-C28, Class A2, | | | |
2.77%, 10/15/2048 | $ 1,273,469 | $ | 1,273,161 |
Series 2015-C29, Class A2, | | | |
2.92%, 05/15/2048 | 704,957 | | 705,430 |
KNDL Mortgage Trust, | | | |
Series 2019-KNSQ, Class A, | | | |
2.46% (1 mo. USD LIBOR + | | | |
0.80%), 05/15/2036(b)(c) | 7,750,000 | | 7,770,088 |
Series 2019-KNSQ, Class C, | | | |
2.71% (1 mo. USD LIBOR + | | | |
1.05%), 05/15/2036(b)(c) | 4,250,000 | | 4,253,099 |
Master Credit Card Trust II, | | | |
Series 2020-1A, Class A, 1.99%, | | | |
09/21/2024(b) | 15,000,000 | | 15,282,636 |
Mercedes-Benz Auto Lease Trust, | | | |
Series 2019-A, Class A2, 3.01%, | | | |
02/16/2021 | 2,643,321 | | 2,648,465 |
Series 2019-A, Class A3, 3.10%, | | | |
11/15/2021 | 4,500,000 | | 4,553,849 |
Merrill Lynch Mortgage Investors | | | |
Trust, Series 2005-3, Class 3A, | | | |
4.01% (1 mo. USD LIBOR + | | | |
0.25%), 11/25/2035(c) | 757,014 | | 763,070 |
Morgan Stanley Bank of America | | | |
Merrill Lynch Trust, | | | |
Series 2015-C23, Class A2, | | | |
2.98%, 07/15/2050 | 404,785 | | 405,151 |
Morgan Stanley Capital I Trust, | | | |
Series 2017-CLS, Class A, 2.36% | | | |
(1 mo. USD LIBOR + 0.70%), | | | |
11/15/2034(b)(c) | 8,028,000 | | 8,030,384 |
Series 2017-CLS, Class B, 2.51% | | | |
(1 mo. USD LIBOR + 0.85%), | | | |
11/15/2034(b)(c) | 3,944,000 | | 3,942,784 |
Series 2017-CLS, Class C, 2.66% | | | |
(1 mo. USD LIBOR + 1.00%), | | | |
11/15/2034(b)(c) | 2,676,000 | | 2,675,181 |
MVW LLC, Series 2019-2A, Class A, | | | |
2.22%, 10/20/2038(b) | 4,488,894 | | 4,563,742 |
MVW Owner Trust, | | | |
Series 2013-1A, Class A, 2.15%, | | | |
04/22/2030(b) | 3,258,575 | | 3,258,751 |
Series 2019-1A, Class A, 2.89%, | | | |
11/20/2036(b) | 4,156,056 | | 4,322,263 |
Neuberger Berman CLO Ltd., | | | |
Series 2017-24A, Class AR, | | | |
1.00% (3 mo. USD LIBOR + | | | |
1.02%), 04/19/2030(b)(c) | 3,738,000 | | 3,736,318 |
New Residential Mortgage Loan Trust, | | | |
Series 2019-NQM4, Class A1, | | | |
2.49%, 09/25/2059(b)(f) | 3,820,442 | | 3,880,202 |
Series 2020-NQM1, Series A1, | | | |
2.46%, 01/26/2060(b)(f) | 5,099,469 | | 5,144,904 |
OBX Trust, Series 2019-EXP1, | | | |
Class 1A3, 4.00%, | | | |
01/25/2059(b)(f) | 2,680,662 | | 2,760,819 |
OHA Loan Funding Ltd., | | | |
Series 2016-1A, Class AR, | | | |
2.99% (3 mo. USD LIBOR + | | | |
1.26%), 01/20/2033(b)(c) | 3,766,110 | | 3,763,019 |
| | Principal | | |
| | Amount | | Value |
| Asset-Backed Securities–(continued) | | |
PPM CLO 3 Ltd. (Cayman Islands), | | | |
| Series 2019-3A, Class A, 3.24% | | | |
| (3 mo. USD LIBOR + 1.40%), | | | |
| 07/17/2030(b)(c) | $ 3,874,000 | $ | 3,881,022 |
| Series 2019-3A, Class B, 3.79% | | | |
| (3 mo. USD LIBOR + 1.95%), | | | |
| 07/17/2030(b)(c) | 2,711,000 | | 2,715,194 |
Residential Mortgage Loan Trust, | | | |
| Series 2019-3, Class A1, 2.63%, | | | |
| 09/25/2059(b)(f) | 2,198,164 | | 2,215,588 |
| Series 2020-1, Class A1, 2.38%, | | | |
| 02/25/2024(b)(f) | 2,036,775 | | 2,058,215 |
Sequoia Mortgage Trust, | | | |
| Series 2013-3, Class A1, 2.00%, | | | |
| 03/25/2043(f) | 1,744,668 | | 1,704,956 |
| Series 2013-4, Class A3, 1.55%, | | | |
| 04/25/2043(f) | 1,344,970 | | 1,321,933 |
| Series 2013-6, Class A2, 3.00%, | | | |
| 05/25/2043(f) | 2,390,921 | | 2,463,361 |
| Series 2013-7, Class A2, 3.00%, | | | |
| 06/25/2043(f) | 1,539,393 | | 1,569,881 |
Sierra Timeshare Receivables | | | |
| Funding LLC, | | | |
| Series 2016-1A, Class A, 3.08%, | | | |
| 03/21/2033(b) | 2,742,951 | | 2,765,353 |
| Series 2019-3A, Class A, 2.34%, | | | |
| 08/20/2036(b) | 6,275,325 | | 6,320,449 |
Starwood Waypoint Homes Trust, | | | |
| Series 2017-1, Class D, 3.61% | | | |
| (1 mo. USD LIBOR + 1.95%), | | | |
| 01/17/2035(b)(c) | 7,700,000 | | 7,705,516 |
Taconic Park CLO Ltd., | | | |
| Series 2016-1A, Class A1R, | | | |
| 1.00% (3 mo. USD LIBOR + | | | |
| 1.00%), 01/20/2029(b)(c) | 6,053,000 | | 6,050,276 |
TICP CLO XV Ltd. (Cayman Islands), | | | |
| Series 2020-15A, Class A, | | | |
| 2.89% (3 mo. USD LIBOR + | | | |
| 1.28%), 04/20/2033(b)(c) | 3,555,000 | | 3,557,335 |
| Series 2020-15A, Class B, | | | |
| 3.31% (3 mo. USD LIBOR + | | | |
| 1.70%), 04/20/2033(b)(c) | 1,456,000 | | 1,454,323 |
Towd Point Mortgage Trust, | | | |
| Series 2016-3, Class A1, 2.25%, | | | |
| 04/25/2056(b)(f) | 1,116,003 | | 1,125,297 |
| Series 2017-2, Class A1, 2.75%, | | | |
| 04/25/2057(b)(f) | 4,194,351 | | 4,266,507 |
Triton Container Finance VI LLC, | | | |
| Series 2018-2A, Class A, 4.19%, | | | |
| 06/22/2043(b) | 3,363,333 | | 3,401,733 |
Verus Securitization Trust, | | | |
| Series 2017-SG1A, Class A1, | | | |
| 2.69%, 11/25/2047(b)(f) | 3,452,761 | | 3,457,940 |
| Series 2018-3, Class A1, 4.11%, | | | |
| 10/25/2058(b)(f) | 6,832,964 | | 6,956,170 |
| Series 2019-1, Class A1, 3.84%, | | | |
| 02/25/2059(b)(f) | 5,498,897 | | 5,588,066 |
| Series 2019-2, Class A1, 3.21%, | | | |
| 05/25/2059(b)(f) | 13,543,434 | | 13,702,548 |
| Series 2020-1, Class A1, 2.42%, | | | |
| 01/25/2060(b)(f) | 6,216,577 | | 6,284,708 |
Wells Fargo Commercial Mortgage | | | |
| Trust, Series 2015-NXS1, | | | |
| Class A2, 2.63%, 05/15/2048 | 262,605 | | 262,447 |
See accompanying Notes to Financial Statements which are an integral part of the financial statements.
14 | Invesco Short Term Bond Fund |

| Principal | | |
| Amount | | Value |
Asset-Backed Securities–(continued) | | |
Wells Fargo Re-REMIC Trust, | | | |
Series 2011-RR1, Class 1A, | | | |
4.81%, 09/17/2047(b)(f) | $ 8,041,090 | $ | 8,184,794 |
Wendy's Funding LLC, | | | |
Series 2019-1A, Class A2I, | | | |
3.78%, 06/15/2049(b) | 6,965,000 | | 7,285,320 |
WFRBS Commercial Mortgage Trust, | | | |
IO, Series 2012-C10, Class XA, | | | |
1.54%, 12/15/2045(b)(f) | 3,441,477 | | 126,826 |
IO, Series 2012-C6, Class XA, | | | |
2.06%, 04/15/2045(b)(f) | 2,057,750 | | 56,657 |
Series 2013-C16, Class B, | | | |
5.03%, 09/15/2046(f) | 4,500,000 | | 4,947,823 |
Total Asset-Backed Securities | | | |
(Cost $447,321,697) | | | 453,301,591 |
U.S. Treasury Securities–7.42% | | |
U.S. Treasury Bills–0.08% | | | |
1.50% - 1.52%, | | | |
04/09/2020(g)(h) | 1,385,000 | | 1,382,723 |
U.S. Treasury Notes–7.34% | | | |
1.38%, 01/31/2022 | 51,518,200 | | 51,981,059 |
1.38%, 02/15/2023 | 49,781,200 | | 50,510,417 |
1.38%, 01/31/2025 | 15,443,200 | | 15,781,623 |
| | | 118,273,099 |
Total U.S. Treasury Securities | | | |
(Cost $118,116,784) | | | 119,655,822 |
Agency Credit Risk Transfer Notes–0.31% | | |
Freddie MacSeries 2019-HQA2, | | | |
Class M1, STACR®, 2.33% (1 mo. | | | |
USD LIBOR + 0.70%), | | | |
04/25/2049(b)(c) | 1,119,666 | | 1,119,573 |
Freddie Mac Series 2015-HQA2, | | | |
Class M2. STACR®, 4.43% (1 mo. | | | |
USD LIBOR + 2.80%), | | | |
05/25/2028(c) | 3,861,168 | | 3,878,328 |
Total Agency Credit Risk Transfer Notes | | |
(Cost $5,051,720) | | | 4,997,901 |
U.S. Government Sponsored Agency Mortgage-Backed |
Securities–0.21% | | | |
Collateralized Mortgage Obligations–0.01% | | |
Fannie Mae REMICs, 2.11% (1 mo. | | | |
USD LIBOR + 0.45%), | | | |
02/25/2047(c) | 78,584 | | 78,557 |
Freddie Mac REMICs, | | | |
7.50%, 09/15/2029 | 88,858 | | 104,102 |
2.66%, (1 mo. USD LIBOR + | | | |
1.00%), 12/15/2031(c) | 24,635 | | 25,301 |
2.61%, (1 mo. USD LIBOR + | | | |
0.95%), 01/15/2032(c) | 14,654 | | 14,809 |
| | | 222,769 |
Federal Home Loan Mortgage Corp. (FHLMC)–0.04% |
6.00%, 03/01/2023 | 56,855 | | 59,037 |
8.50%, 05/01/2024 to | | | |
08/17/2026 | 75,004 | | 77,250 |
7.00%, 10/25/2024 to | | | |
10/01/2034 | 347,964 | | 385,149 |
Principal
AmountValue
Federal Home Loan Mortgage Corp. (FHLMC)–(continued)
ARM, | | | | |
3.50%, (6 mo. USD LIBOR + | | | | |
1.62%), 07/01/2036(c) | $ | 27,843 | $ | 29,032 |
4.58%, (1 yr. USD LIBOR + | | | | |
2.07%), 02/01/2037(c) | | 8,973 | | 9,612 |
4.08%, (1 yr. USD LIBOR + | | | | |
2.01%), 01/01/2038(c) | | 7,561 | | 7,978 |
| | | | 568,058 |
Federal National Mortgage Association (FNMA)–0.11% |
7.50%, 01/01/2021 to | | | | |
02/01/2031 | | 115,504 | | 133,770 |
6.50%, 11/01/2023 to | | | | |
10/01/2035 | | 168,348 | | 190,415 |
7.00%, 11/01/2025 to | | | | |
08/01/2036 | | 958,430 | | 1,050,427 |
8.00%, 09/01/2026 to | | | | |
07/01/2032 | | 131,366 | | 135,005 |
9.00%, 01/01/2030 | | 56,220 | | 62,388 |
8.50%, 05/01/2030 to | | | | |
07/01/2030 | | 133,407 | | 152,163 |
ARM, | | | | |
4.10%, (1 yr. U.S. Treasury Yield | | | | |
Curve Rate + 2.22%), | | | | |
11/01/2032(c) | | 19,676 | | 20,790 |
4.36%, (1 yr. U.S. Treasury Yield | | | | |
Curve Rate + 2.21%), | | | | |
05/01/2035(c) | | 55,057 | | 58,200 |
4.35%, (1 yr. USD LIBOR + | | | | |
1.72%), 03/01/2038(c) | | 11,890 | | 12,542 |
| | | | 1,815,700 |
Government National Mortgage Association (GNMA)–0.05% |
7.75%, 02/15/2021 | | 4,553 | | 4,565 |
6.50%, 07/15/2023 to | | | | |
02/15/2034 | | 629,476 | | 698,856 |
7.50%, 12/20/2025 | | 12,707 | | 14,337 |
7.00%, 10/15/2026 to | | | | |
06/15/2032 | | 48,102 | | 50,602 |
8.50%, 07/20/2027 | | 43,932 | | 49,411 |
| | | | 817,771 |
Total U.S. Government Sponsored Agency | | |
Mortgage-Backed Securities | | | | |
(Cost $3,129,999) | | | | 3,424,298 |
Preferred Stocks–0.12% | | Shares | | |
| | | |
Regional Banks–0.12% | | | | |
PNC Financial Services Group, Inc. (The), | | | | |
6.13%, Series P, Pfd. | | | | |
(Cost $1,875,000) | | 75,000 | | 1,994,250 |
Total Preferred Stocks (Cost $1,875,000) | | 1,994,250 |
Money Market Funds–2.46% | | | | |
Invesco Government & Agency Portfolio, | | | | |
Institutional Class, 1.50%(i) | | 13,406,487 | | 13,406,487 |
Invesco Liquid Assets Portfolio, | | | | |
Institutional Class, 1.64%(i) | | 10,876,827 | | 10,882,266 |
See accompanying Notes to Financial Statements which are an integral part of the financial statements.
15 | Invesco Short Term Bond Fund |

| | Shares | | Value |
Money Market Funds–(continued) | | |
Invesco Treasury Portfolio, Institutional | | | |
Class, 1.48%(i) | 15,321,700 | $ | 15,321,700 |
Total Money Market Funds (Cost $39,609,013) | | 39,610,453 |
TOTAL INVESTMENTS IN SECURITIES–99.87% | | |
(Cost $1,584,762,195) | | | 1,609,991,797 |
OTHER ASSETS LESS LIABILITIES—0.13% | | | 2,035,556 |
NET ASSETS–100.00% | | $1,612,027,353 |
Investment Abbreviations: | | | |
ARM | – Adjustable Rate Mortgage | | | |
CLO | – Collateralized Loan Obligation | | | |
IO | – Interest Only | | | |
LIBOR | – London Interbank Offered Rate | | | |
Pfd. | – Preferred | | | |
REIT | – Real Estate Investment Trust | | | |
REMICs | – Real Estate Mortgage Investment Conduits | | |
SOFR | – Secured Overnight Financing Rate | | |
STACR® – Structured Agency Credit Risk | | | |
USD | – U.S. Dollar | | | |
Notes to Schedule of Investments:
(a)Industry and/or sector classifications used in this report are generally according to the Global Industry Classification Standard, which was developed by and is the exclusive property and a service mark of MSCI Inc. and Standard & Poor's.
(b)Security purchased or received in a transaction exempt from registration under the Securities Act of 1933, as amended (the "1933 Act"). The security may be resold pursuant to an exemption from registration under the 1933 Act, typically to qualified institutional buyers. The aggregate value of these securities at February 29, 2020 was $805,542,583, which represented 49.97% of the Fund's Net Assets.
(c)Interest or dividend rate is redetermined periodically. Rate shown is the rate in effect on February 29, 2020.
(d)Perpetual bond with no specified maturity date.
(e)Step coupon bond. The interest rate represents the coupon rate at which the bond will accrue at a specified future date.
(f)Interest rate is redetermined periodically based on the cash flows generated by the pool of assets backing the security, less any applicable fees. The rate shown is the rate in effect on February 29, 2020.
(g)All or a portion of the value was pledged as collateral to cover margin requirements for open futures contracts. See Note 1I.
(h)Security traded on a discount basis. The interest rate shown represents the discount rate at the time of purchase by the Fund.
(i)The money market fund and the Fund are affiliated by having the same investment adviser. The rate shown is the 7-day SEC standardized yield as of February 29, 2020.
Open Futures Contracts
| | | | | Unrealized |
Long Futures Contracts | Number of | Expiration | Notional | | Appreciation |
Contracts | Month | Value | Value | (Depreciation) |
Interest Rate Risk | | | | | | |
U.S. Treasury 2 Year Notes | 2,785 | June-2020 | $ 608,043,831 | $ 2,794,407 | $ 2,794,407 | |
| | | | | | |
Short Futures Contracts | | | | | | |
Interest Rate Risk | | | | | | |
U.S. Treasury 5 Year Notes | 825 | June-2020 | (101,268,750) | (949,127) | (949,127) |
| | | | | | |
U.S. Treasury 10 Year Notes | 299 | June-2020 | (40,290,250) | (463,642) | (463,642) |
| | | | | | |
Subtotal—Short Futures Contracts | | | | (1,412,769) | (1,412,769) |
| | | | | | |
Total Futures Contracts | | | | $ 1,381,638 | $ 1,381,638 | |
| | | | | | |
See accompanying Notes to Financial Statements which are an integral part of the financial statements.
16 | Invesco Short Term Bond Fund |
Statement of Assets and Liabilities
February 29, 2020
Assets: | |
Investments in securities, at value | |
(Cost $1,547,853,182) | $1,570,381,344 |
Investments in affiliated money market funds, at value | |
(Cost $36,909,013) | 39,610,453 |
Other investments: | |
Variation margin receivable — futures contracts | 672,615 |
Cash | 1,839 |
Receivable for: | |
Fund shares sold | 7,349,822 |
Dividends | 64,341 |
Interest | 9,302,318 |
Principal paydowns | 174 |
Investment for trustee deferred compensation and | |
retirement plans | 139,166 |
Other assets | 35,025 |
Total assets | 1,627,557,097 |
Liabilities: | |
Payable for: | |
Investments purchased | 9,814,419 |
Dividends | 415,250 |
Fund shares reacquired | 4,659,238 |
Accrued fees to affiliates | 368,757 |
Accrued trustees' and officers' fees and benefits | 4,252 |
Accrued other operating expenses | 114,401 |
Trustee deferred compensation and retirement plans | 153,427 |
Total liabilities | 15,529,744 |
Net assets applicable to shares outstanding | $1,612,027,353 |
Net assets consist of: | |
Shares of beneficial interest | $1,604,435,671 |
Distributable earnings | 7,591,682 |
| $1,612,027,353 |
Net Assets: | | |
Class A | $ | 655,357,162 |
Class C | $ | 158,967,968 |
Class R | $ | 6,209,580 |
Class Y | $ | 146,158,808 |
Class R5 | $ | 495,628 |
Class R6 | $ | 644,838,207 |
Shares outstanding, no par value, with an unlimited number of shares authorized:
Class A | | 75,656,156 |
Class C | | 18,361,089 |
Class R | | 715,570 |
Class Y | | 16,868,029 |
Class R5 | | 57,304 |
Class R6 | | 74,345,696 |
Class A: | | |
Net asset value per share | $ | 8.66 |
Maximum offering price per share | | |
(Net asset value of $8.66 ÷ 97.50%) | $ | 8.88 |
Class C: | | |
Net asset value and offering price per share | $ | 8.66 |
Class R: | | |
Net asset value and offering price per share | $ | 8.68 |
Class Y: | | |
Net asset value and offering price per share | $ | 8.66 |
Class R5: | | |
Net asset value and offering price per share | $ | 8.65 |
Class R6: | | |
Net asset value and offering price per share | $ | 8.67 |
See accompanying Notes to Financial Statements which are an integral part of the financial statements.
17 | Invesco Short Term Bond Fund |
Statement of Operations
For the year ended February 29, 2020
Investment income: | | |
Interest | $49,505,588 | |
Dividends from affiliated money market funds | 750,703 | |
Dividends | 114,844 | |
Total investment income | 50,371,135 | |
Expenses: | | |
Advisory fees | 5,002,603 | |
Administrative services fees | 219,787 | |
Custodian fees | 30,407 | |
Distribution fees: | | |
Class A | 914,910 | |
Class C | 928,242 | |
Class R | 29,470 | |
Transfer agent fees — A, C, R and Y | 1,152,051 | |
Transfer agent fees — R5 | 252 | |
Transfer agent fees — R6 | 25,617 | |
Trustees' and officers' fees and benefits | 37,862 | |
Registration and filing fees | 167,592 | |
Reports to shareholders | 107,587 | |
Professional services fees | 77,932 | |
Other | 36,825 | |
Total expenses | 8,731,137 | |
Less: Fees waived and/or expense offset arrangement(s) | (260,949) |
Net expenses | 8,470,188 | |
Net investment income | 41,900,947 | |
Realized and unrealized gain (loss) from: | | |
Net realized gain (loss) from: | | |
Investment securities | 5,586,084 | |
Futures contracts | (635,922) |
| 4,950,162 | |
Change in net unrealized appreciation of: | | |
Investment securities | 29,431,322 | |
Futures contracts | 1,219,453 | |
| 30,650,775 | |
Net realized and unrealized gain | 35,600,937 | |
Net increase in net assets resulting from operations | $77,501,884 | |
See accompanying Notes to Financial Statements which are an integral part of the financial statements.
18 | Invesco Short Term Bond Fund |
Statement of Changes in Net Assets
For the years ended February 29, 2020 and February 28, 2019
| | 2020 | | 2019 | | | |
Operations: | | | | | | | |
Net investment income | $ | 41,900,947 | $ | 36,167,883 | |
Net realized gain (loss) | | 4,950,162 | | (8,914,678) |
Change in net unrealized appreciation | | 30,650,775 | | 4,037,385 | |
Net increase in net assets resulting from operations | | 77,501,884 | | 31,290,590 | |
Distributions to shareholders from distributable earnings: | | | | | | | |
Class A | | (16,160,643) | | (11,159,392) |
| | | | | | |
Class C | | (3,285,936) | | (7,048,505) |
| | | | | | |
Class R | | (135,343) | | (109,232) |
| | | | | | |
Class Y | | (3,995,040) | | (3,014,274) |
| | | | | | |
Class R5 | | (26,897) | | (50,764) |
| | | | | | |
Class R6 | | (18,708,844) | | (16,494,319) |
| | | | | | |
Total distributions from distributable earnings | | (42,312,703) | | (37,876,486) |
Return of capital: | | | | | | | |
Class A | | (535,685) | | — | |
Class C | | (125,484) | | — | |
Class R | | (5,167) | | — | |
Class Y | | (125,179) | | — | |
Class R5 | | (808) | | — | |
Class R6 | | (561,735) | | — | |
Total return of capital | | (1,354,058) | | — | |
Total distributions | | (43,666,761) | | — |
Share transactions–net: | | | | | | | |
Class A | | 50,529,808 | | 196,519,794 | |
Class C | | 15,578,415 | | (249,045,046) |
Class R | | 1,051,000 | | 364,320 | |
Class Y | | 8,664,195 | | 5,814,588 | |
Class R5 | | (1,300,316) | | 73,673 | |
Class R6 | | 66,689,262 | | (8,735,798) |
| | | | | |
Net increase (decrease) in net assets resulting from share transactions | | 141,212,364 | | (55,008,469) |
| | | | | |
Net increase (decrease) in net assets | | 175,047,487 | | (61,594,365) |
Net assets: | | | | | | | |
Beginning of year | | 1,436,979,866 | | 1,498,574,231 | |
End of year | $1,612,027,353 | $ | 1,436,979,866 | |
See accompanying Notes to Financial Statements which are an integral part of the financial statements.
19 | Invesco Short Term Bond Fund |
Financial Highlights
The following schedule presents financial highlights for a share of the Fund outstanding throughout the periods indicated.
| | | | | | | | | | | Ratio of | Ratio of | | |
| | | | | | | | | | | expenses | expenses | | |
| | | Net gains | | | | | | | | to average | to average net | | |
| | | (losses) | | | | | | | | net assets | assets without | Ratio of net | |
| Net asset | | on securities | | Dividends | | | | | | with fee waivers | fee waivers | investment | |
| value, | Net | (both | Total from | from net | | | Net asset | | Net assets, | and/or | and/or | income | |
| beginning | investment | realized and | investment | investment | Return of | Total | value, end | Total | end ofperiod | expenses | expenses | to average | Portfolio |
| ofperiod | income(a) | unrealized) | operations | income | capital | distributions | ofperiod | return (b) | (000's omitted) | absorbed | absorbed | net assets | turnover (c) |
Class A | | | | | | | | | | | 0.65%(d) | 0.65%(d) | 2.62%(d) | |
Year ended 02/29/20 | $8.47 | $0.23 | $ 0.20 | $ 0.43 | $(0.23) | $(0.01) | $(0.24) | $8.66 | 5.08% | $655,357 | 155% |
Year ended 02/28/19 | 8.51 | 0.21 | (0.03) | 0.18 | (0.22) | — | (0.22) | 8.47 | 2.19 | 591,443 | 0.64 | 0.65 | 2.52 | 176 |
Year ended 02/28/18 | 8.61 | 0.17 | (0.10) | 0.07 | (0.17) | — | (0.17) | 8.51 | 0.79 | 395,766 | 0.65 | 0.66 | 1.98 | 198 |
Year ended 02/28/17 | 8.47 | 0.14 | 0.15 | 0.29 | (0.15) | — | (0.15) | 8.61 | 3.39 | 435,592 | 0.65 | 0.66 | 1.59 | 294 |
Year ended 02/29/16 | 8.65 | 0.15 | (0.16) | (0.01) | (0.17) | — | (0.17) | 8.47 | (0.12) | 379,091 | 0.68 | 0.68 | 1.72 | 200 |
Class C | | | | | | | | | | | 1.00(d) | 1.15(d) | 2.27(d) | 155 |
Year ended 02/29/20 | 8.47 | 0.19 | 0.21 | 0.40 | (0.20) | (0.01) | (0.21) | 8.66 | 4.71 | 158,968 |
Year ended 02/28/19 | 8.51 | 0.18 | (0.03) | 0.15 | (0.19) | — | (0.19) | 8.47 | 1.83 | 140,247 | 0.99 | 1.15 | 2.17 | 176 |
Year ended 02/28/18 | 8.61 | 0.14 | (0.10) | 0.04 | (0.14) | — | (0.14) | 8.51 | 0.44 | 391,791 | 1.00 | 1.16 | 1.63 | 198 |
Year ended 02/28/17 | 8.47 | 0.11 | 0.15 | 0.26 | (0.12) | — | (0.12) | 8.61 | 3.03 | 451,018 | 1.00 | 1.16 | 1.24 | 294 |
Year ended 02/29/16 | 8.65 | 0.12 | (0.16) | (0.04) | (0.14) | — | (0.14) | 8.47 | (0.47) | 443,163 | 1.03 | 1.18 | 1.37 | 200 |
Class R | | | | | | | | | | | 1.00(d) | 1.00(d) | 2.27(d) | 155 |
Year ended 02/29/20 | 8.49 | 0.20 | 0.20 | 0.40 | (0.20) | (0.01) | (0.21) | 8.68 | 4.70 | 6,210 |
Year ended 02/28/19 | 8.53 | 0.18 | (0.03) | 0.15 | (0.19) | — | (0.19) | 8.49 | 1.84 | 5,035 | 0.99 | 1.00 | 2.17 | 176 |
Year ended 02/28/18 | 8.62 | 0.14 | (0.09) | 0.05 | (0.14) | — | (0.14) | 8.53 | 0.55 | 4,693 | 1.00 | 1.01 | 1.63 | 198 |
Year ended 02/28/17 | 8.49 | 0.11 | 0.14 | 0.25 | (0.12) | — | (0.12) | 8.62 | 2.90 | 6,466 | 1.00 | 1.01 | 1.24 | 294 |
Year ended 02/29/16 | 8.66 | 0.12 | (0.15) | (0.03) | (0.14) | — | (0.14) | 8.49 | (0.35) | 4,068 | 1.03 | 1.03 | 1.37 | 200 |
Class Y | | | | | | | | | | | 0.50(d) | 0.50(d) | 2.77(d) | |
Year ended 02/29/20 | 8.48 | 0.24 | 0.19 | 0.43 | (0.24) | (0.01) | (0.25) | 8.66 | 5.11 | 146,159 | 155 |
Year ended 02/28/19 | 8.52 | 0.23 | (0.03) | 0.20 | (0.24) | — | (0.24) | 8.48 | 2.35 | 134,272 | 0.49 | 0.50 | 2.67 | 176 |
Year ended 02/28/18 | 8.61 | 0.18 | (0.09) | 0.09 | (0.18) | — | (0.18) | 8.52 | 1.06 | 128,874 | 0.50 | 0.51 | 2.13 | 198 |
Year ended 02/28/17 | 8.48 | 0.15 | 0.14 | 0.29 | (0.16) | — | (0.16) | 8.61 | 3.42 | 129,794 | 0.50 | 0.51 | 1.74 | 294 |
Year ended 02/29/16 | 8.65 | 0.16 | (0.15) | 0.01 | (0.18) | — | (0.18) | 8.48 | 0.15 | 56,237 | 0.53 | 0.53 | 1.87 | 200 |
Class R5 | | | | | | | | | | | 0.40(d) | 0.40(d) | 2.87(d) | 155 |
Year ended 02/29/20 | 8.47 | 0.25 | 0.18 | 0.43 | (0.24) | (0.01) | (0.25) | 8.65 | 5.20 | 496 |
Year ended 02/28/19 | 8.51 | 0.23 | (0.03) | 0.20 | (0.24) | — | (0.24) | 8.47 | 2.45 | 1,765 | 0.39 | 0.40 | 2.77 | 176 |
Year ended 02/28/18 | 8.60 | 0.19 | (0.09) | 0.10 | (0.19) | — | (0.19) | 8.51 | 1.17 | 1,699 | 0.38 | 0.39 | 2.25 | 198 |
Year ended 02/28/17 | 8.47 | 0.16 | 0.14 | 0.30 | (0.17) | — | (0.17) | 8.60 | 3.54 | 1,220 | 0.39 | 0.40 | 1.85 | 294 |
Year ended 02/29/16 | 8.64 | 0.17 | (0.15) | 0.02 | (0.19) | — | (0.19) | 8.47 | 0.26 | 1,165 | 0.43 | 0.43 | 1.97 | 200 |
Class R6 | | | | | | | | | | | 0.37(d) | 0.37(d) | 2.90(d) | |
Year ended 02/29/20 | 8.49 | 0.25 | 0.19 | 0.44 | (0.25) | (0.01) | (0.26) | 8.67 | 5.23 | 644,838 | 155 |
Year ended 02/28/19 | 8.53 | 0.24 | (0.03) | 0.21 | (0.25) | — | (0.25) | 8.49 | 2.46 | 564,219 | 0.38 | 0.39 | 2.78 | 176 |
Year ended 02/28/18 | 8.62 | 0.19 | (0.09) | 0.10 | (0.19) | — | (0.19) | 8.53 | 1.17 | 575,750 | 0.38 | 0.39 | 2.25 | 198 |
Year ended 02/28/17 | 8.48 | 0.16 | 0.15 | 0.31 | (0.17) | — | (0.17) | 8.62 | 3.66 | 499,674 | 0.39 | 0.40 | 1.85 | 294 |
Year ended 02/29/16 | 8.66 | 0.17 | (0.16) | 0.01 | (0.19) | — | (0.19) | 8.48 | 0.14 | 63,201 | 0.42 | 0.42 | 1.98 | 200 |
(a)Calculated using average shares outstanding.
(b)Includes adjustments in accordance with accounting principles generally accepted in the United States of America and as such, the net asset value for financial reporting purposes and the returns based upon those net asset values may differ from the net asset value and returns for shareholder transactions. Does not include sales charges and is not annualized for periods less than one year, if applicable.
(c)Portfolio turnover is calculated at the fund level and is not annualized for periods less than one year, if applicable.
(d)Ratios are based on average daily net assets (000's omitted) of $609,940, $142,806, $5,894, $142,539, $917 and $640,438 for Class A, Class C, Class R, Class Y, Class R5 and Class R6 shares, respectively.
See accompanying Notes to Financial Statements which are an integral part of the financial statements.
20 | Invesco Short Term Bond Fund |
Notes to Financial Statements
February 29, 2020
NOTE 1—Significant Accounting Policies
Invesco Short Term Bond Fund (the "Fund"), is a series portfolio of AIM Investment Securities Funds (Invesco Investment Securities Funds) (the "Trust"). The Trust is organized as a Delaware statutory trust and is registered under the Investment Company Act of 1940, as amended (the "1940 Act"), as an open-end series management investment company authorized to issue an unlimited number of shares of beneficial interest. Information presented in these financial statements pertains only to the Fund. Matters affecting the Fund or each class will be voted on exclusively by the shareholders of the Fund or each class.
The Fund's investment objective is total return, comprised of current income and capital appreciation.
The Fund currently consists of six different classes of shares: Class A, Class C, Class R, Class Y, Class R5 and Class R6. Class Y shares are available only to certain investors. Class A shares are sold with a front-end sales charge unless certain waiver criteria are met. Under certain circumstances, load waived shares may be subject to contingent deferred sales charges ("CDSC"). Class C, Class R, Class Y, Class R5 and Class R6 shares are sold at net asset value. Class C shares are not normally subject to a CDSC. However, if Class C shares were acquired through an exchange, and the shares originally purchased were subject to a CDSC, the shares acquired as a result of the exchange will continue to be subject to that same CDSC.
The Fund is an investment company and accordingly follows the investment company accounting and reporting guidance in accordance with Financial Accounting Standards Board Accounting Standards Codification Topic 946, Financial Services – Investment Companies.
The following is a summary of the significant accounting policies followed by the Fund in the preparation of its financial statements.
A.Security Valuations – Securities, including restricted securities, are valued according to the following policy.
Debt obligations (including convertible securities) and unlisted equities are fair valued using an evaluated quote provided by an independent pricing service. Evaluated quotes provided by the pricing service may be determined without exclusive reliance on quoted prices, and may reflect appropriate factors such as institution-size trading in similar groups of securities, developments related to specific securities, dividend rate (for unlisted equities), yield (for debt obligations), quality, type of issue, coupon rate (for debt obligations), maturity (for debt obligations), individual trading characteristics and other market data. Pricing services generally value debt obligations assuming orderly transactions of institutional round lot size, but a fund may hold or transact in the same securities in smaller, odd lot sizes. Odd lots often trade at lower prices than institutional round lots. Debt obligations are subject to interest rate and credit risks. In addition, all debt obligations involve some risk of default with respect to interest and/or principal payments.
A security listed or traded on an exchange (except convertible securities) is valued at its last sales price or official closing price as of the close of the customary trading session on the exchange where the security is principally traded, or lacking any sales or official closing price on a particular day, the security may be valued at the closing bid price on that day. Securities traded in the over-the-counter market are valued based on prices furnished by independent pricing services or market makers. When such securities are valued by an independent pricing service they may be considered fair valued. Futures contracts are valued at the final settlement price set by an exchange on which they are principally traded. Listed options are valued at the mean between the last bid and asked prices from the exchange on which they are principally traded. Options not listed on an exchange are valued by an independent source at the mean between the last bid and asked prices. For purposes of determining net asset value ("NAV") per share, futures and option contracts generally are valued 15 minutes after the close of the customary trading session of the New York Stock Exchange ("NYSE").
Investments in open-end and closed-end registered investment companies that do not trade on an exchange are valued at the end-of-day net asset value per share. Investments in open-end and closed-end registered investment companies that trade on an exchange are valued at the last sales price or official closing price as of the close of the customary trading session on the exchange where the security is principally traded.
Foreign securities' (including foreign exchange contracts) prices are converted into U.S. dollar amounts using the applicable exchange rates as of the close of the NYSE. If market quotations are available and reliable for foreign exchange-traded equity securities, the securities will be valued at the market quotations. Because trading hours for certain foreign securities end before the close of the NYSE, closing market quotations may become unreliable. If between the time trading ends on a particular security and the close of the customary trading session on the NYSE, events occur that the investment adviser determines are significant and make the closing price unreliable, the Fund may fair value the security. If the event is likely to have affected the closing price of the security, the security will be valued at fair value in good faith using procedures approved by the Board of Trustees. Adjustments to closing prices to reflect fair value may also be based on a screening process of an independent pricing service to indicate the degree of certainty, based on historical data, that the closing price in the principal market where a foreign security trades is not the current value as of the close of the NYSE. Foreign securities' prices meeting the approved degree of certainty that the price is not reflective of current value will be priced at the indication of fair value from the independent pricing service. Multiple factors may be considered by the independent pricing service in determining adjustments to reflect fair value and may include information relating to sector indices, American Depositary Receipts and domestic and foreign index futures. Foreign securities may have additional risks including exchange rate changes, potential for sharply devalued currencies and high inflation, political and economic upheaval, the relative lack of issuer information, relatively low market liquidity and the potential lack of strict financial and accounting controls and standards.
Securities for which market prices are not provided by any of the above methods may be valued based upon quotes furnished by independent sources. The last bid price may be used to value equity securities. The mean between the last bid and asked prices is used to value debt obligations, including corporate loans.
Securities for which market quotations are not readily available or became unreliable are valued at fair value as determined in good faith by or under the supervision of the Trust's officers following procedures approved by the Board of Trustees. Issuer specific events, market trends, bid/asked quotes of brokers and information providers and other market data may be reviewed in the course of making a good faith determination of a security's fair value.
The Fund may invest in securities that are subject to interest rate risk, meaning the risk that the prices will generally fall as interest rates rise and, conversely, the prices will generally rise as interest rates fall. Specific securities differ in their sensitivity to changes in interest rates depending on their individual characteristics. Changes in interest rates may result in increased market volatility, which may affect the value and/or liquidity of certain Fund investments.
Valuations change in response to many factors including the historical and prospective earnings of the issuer, the value of the issuer's assets, general economic conditions, interest rates, investor perceptions and market liquidity. Because of the inherent uncertainties of valuation, the values reflected in the financial statements may materially differ from the value received upon actual sale of those investments.
B.Securities Transactions and Investment Income – Securities transactions are accounted for on a trade date basis. Realized gains or losses on sales are computed on the basis of specific identification of the securities sold. Interest income (net of withholding tax, if any) is recorded on an accrual basis from settlement date. Bond premiums and discounts are amortized and/or accreted over the lives of the respective securities. Pay-in-kind interest income and non-cash dividend income received in the form of securities in-lieu of cash are recorded at the fair value of the securities received. Paydown gains and losses on mortgage and asset-backed securities are recorded as adjustments to interest income. Dividend income (net of withholding tax, if any) is recorded on the ex-dividend date.
The Fund may periodically participate in litigation related to Fund investments. As such, the Fund may receive proceeds from litigation settlements. Any proceeds received are included in the Statement of Operations as realized gain (loss) for investments no longer held and as unrealized gain (loss) for investments still held.
Brokerage commissions and mark ups are considered transaction costs and are recorded as an increase to the cost basis of securities purchased and/or a reduction of proceeds on a sale of securities. Such transaction costs are included in the determination of net realized and unrealized gain (loss) from investment securities reported in the Statement of Operations and the Statement of Changes in Net Assets and the net realized and unrealized gains (losses) on securities per
21 | Invesco Short Term Bond Fund |
share in the Financial Highlights. Transaction costs are included in the calculation of the Fund's net asset value and, accordingly, they reduce the Fund's total returns. These transaction costs are not considered operating expenses and are not reflected in net investment income reported in the Statement of Operations and the Statement of Changes in Net Assets, or the net investment income per share and the ratios of expenses and net investment income reported in the Financial Highlights, nor are they limited by any expense limitation arrangements between the Fund and the investment adviser.
The Fund allocates realized and unrealized capital gains and losses to a class based on the relative net assets of each class. The Fund allocates income to a class based on the relative value of the settled shares of each class.
C.Country Determination — For the purposes of making investment selection decisions and presentation in the Schedule of Investments, the investment adviser may determine the country in which an issuer is located and/or credit risk exposure based on various factors. These factors include the laws of the country under which the issuer is organized, where the issuer maintains a principal office, the country in which the issuer derives 50% or more of its total revenues and the country that has the primary market for the issuer's securities, as well as other criteria. Among the other criteria that may be evaluated for making this determination are the country in which the issuer maintains 50% or more of its assets, the type of security, financial guarantees and enhancements, the nature of the collateral and the sponsor organization. Country of issuer and/or credit risk exposure has been determined to be the United States of America, unless otherwise noted.
D.Distributions – Distributions from net investment income, if any, are declared daily and paid monthly. Distributions from net realized capital gain, if any, are generally declared and paid annually and recorded on the ex-dividend date. The Fund may elect to treat a portion of the proceeds from redemptions as distributions for federal income tax purposes.
E.Federal Income Taxes – The Fund intends to comply with the requirements of Subchapter M of the Internal Revenue Code of 1986, as amended (the "Internal Revenue Code"), necessary to qualify as a regulated investment company and to distribute substantially all of the Fund's taxable earnings to shareholders. As such, the Fund will not be subject to federal income taxes on otherwise taxable income (including net realized capital gain) that is distributed to shareholders. Therefore, no provision for federal income taxes is recorded in the financial statements.
The Fund recognizes the tax benefits of uncertain tax positions only when the position is more likely than not to be sustained. Management has analyzed the Fund's uncertain tax positions and concluded that no liability for unrecognized tax benefits should be recorded related to uncertain tax positions. Management is not aware of any tax positions for which it is reasonably possible that the total amounts of unrecognized tax benefits will change materially in the next 12 months.
The Fund files tax returns in the U.S. Federal jurisdiction and certain other jurisdictions. Generally, the Fund is subject to examinations by such taxing authorities for up to three years after the filing of the return for the tax period.
F.Expenses – Fees provided for under the Rule 12b-1 plan of a particular class of the Fund are charged to the operations of such class. Transfer agency fees and expenses and other shareholder recordkeeping fees and expenses attributable to Class R5 and Class R6 are allocated to each share class based on relative net assets. Sub-accounting fees attributable to Class R5 are charged to the operations of the class. Transfer agency fees and expenses and other shareholder recordkeeping fees and expenses relating to all other classes are allocated among those classes based on relative net assets. All other expenses are allocated among the classes based on relative net assets.
G.Accounting Estimates – The preparation of financial statements in conformity with accounting principles generally accepted in the United States of America ("GAAP") requires management to make estimates and assumptions that affect the reported amounts of assets and liabilities at the date of the financial statements and the reported amounts of revenues and expenses during the reporting period including estimates and assumptions related to taxation. Actual results could differ from those estimates by a significant amount. In addition, the Fund monitors for material events or transactions that may occur or become known after the period-end date and before the date the financial statements are released to print.
H.Indemnifications – Under the Trust's organizational documents, each Trustee, officer, employee or other agent of the Trust is indemnified against certain liabilities that may arise out of the performance of their duties to the Fund. Additionally, in the normal course of business, the Fund enters into contracts, including the Fund's servicing agreements, that contain a variety of indemnification clauses. The Fund's maximum exposure under these arrangements is unknown as this would involve future claims that may be made against the Fund that have not yet occurred. The risk of material loss as a result of such indemnification claims is considered remote.
I.Futures Contracts — The Fund may enter into futures contracts to manage exposure to interest rate, equity and market price movements and/or currency risks. A futures contract is an agreement between two parties ("Counterparties") to purchase or sell a specified underlying security, currency or commodity (or delivery of a cash settlement price, in the case of an index future) for a fixed price at a future date. The Fund currently invests only in exchange-traded futures and they are standardized as to maturity date and underlying financial instrument. Initial margin deposits required upon entering into futures contracts are satisfied by the segregation of specific securities or cash as collateral at the futures commission merchant (broker). During the period the futures contracts are open, changes in the value of the contracts are recognized as unrealized gains or losses by recalculating the value of the contracts on a daily basis. Subsequent or variation margin payments are received or made depending upon whether unrealized gains or losses are incurred. These amounts are reflected as receivables or payables on the Statement of Assets and Liabilities. When the contracts are closed or expire, the Fund recognizes a realized gain or loss equal to the difference between the proceeds from, or cost of, the closing transaction and the Fund's basis in the contract. The net realized gain (loss) and the change in unrealized gain (loss) on futures contracts held during the period is included on the Statement of Operations. The primary risks associated with futures contracts are market risk and the absence of a liquid secondary market. If the Fund were unable to liquidate a futures contract and/or enter into an offsetting closing transaction, the Fund would continue to be subject to market risk with respect to the value of the contracts and continue to be required to maintain the margin deposits on the futures contracts. Futures contracts have minimal Counterparty risk since the exchange's clearinghouse, as Counterparty to all exchange-traded futures, guarantees the futures against default. Risks may exceed amounts recognized in the Statement of Assets and Liabilities.
J.Other Risks - Active trading of portfolio securities may result in added expenses, a lower return and increased tax liability.
K.Collateral —To the extent the Fund has designated or segregated a security as collateral and that security is subsequently sold, it is the Fund's practice to replace such collateral no later than the next business day.
NOTE 2—Advisory Fees and Other Fees Paid to Affiliates
The Trust has entered into a master investment advisory agreement with Invesco Advisers, Inc. (the "Adviser" or "Invesco"). Under the terms of the investment advisory agreement, the Fund accrues daily and pays monthly an advisory fee to the Adviser based on the annual rate of the Fund's average daily net assets as follows:
Average Daily Net Assets | Rate |
First $500 million | 0.350% |
| |
Next $500 million | 0.325% |
Next $1.5 billion | 0.300% |
Next $2.5 billion | 0.290% |
| |
Over $5 billion | 0.280% |
For the year ended February 29, 2020, the effective advisory fee rate incurred by the Fund was 0.32%.
22 | Invesco Short Term Bond Fund |
Under the terms of a master sub-advisory agreement between the Adviser and each of Invesco Asset Management Deutschland GmbH, Invesco Asset Management Limited, Invesco Asset Management (Japan) Limited, Invesco Hong Kong Limited, Invesco Senior Secured Management, Inc. and Invesco Canada Ltd. (collectively, the "Affiliated Sub-Advisers") the Adviser, not the Fund, will pay 40% of the fees paid to the Adviser to any such Affiliated Sub-Adviser(s) that provide(s) discretionary investment management services to the Fund based on the percentage of assets allocated to such Affiliated Sub-Adviser(s).
The Adviser has contractually agreed, through at least June 30, 2020, to waive advisory fees and/or reimburse expenses of all shares to the extent necessary to limit total annual fund operating expenses after fee waiver and/or expense reimbursement (excluding certain items discussed below) of Class A, Class C, Class R, Class Y, Class R5 and Class R6 shares to 1.40%, 1.75% (after 12b-1 fee waivers), 1.75%, 1.25%, 1.25% and 1.25%, respectively, of average daily net assets (the "expense limits"). In determining the Adviser's obligation to waive advisory fees and/or reimburse expenses, the following expenses are not taken into account, and could cause the total annual fund operating expenses after fee waiver and/or expense reimbursement to exceed the numbers reflected above: (1) interest; (2) taxes;
(3)dividend expense on short sales; (4) extraordinary items or non-routine items, including litigation expenses; and (5) expenses that the Fund has incurred but did not actually pay because of an expense offset arrangement. Unless Invesco continues the fee waiver agreement, it will terminate on June 30, 2020. During its term, the fee waiver agreement cannot be terminated or amended to increase the expense limits or reduce the advisory fee waiver without approval of the Board of Trustees.
Further, the Adviser has contractually agreed, through at least June 30, 2021, to waive the advisory fee payable by the Fund in an amount equal to 100% of the net advisory fees the Adviser receives from the affiliated money market funds on investments by the Fund of uninvested cash in such affiliated money market funds.
For the year ended February 29, 2020, the Adviser waived advisory fees of $43,659.
The Trust has entered into a master administrative services agreement with Invesco pursuant to which the Fund has agreed to pay Invesco for certain administrative costs incurred in providing accounting services to the Fund. For the year ended February 29, 2020, expenses incurred under the agreement are shown in the Statement of Operations as Administrative services fees. Invesco has entered into a sub-administration agreement whereby State Street Bank and Trust Company ("SSB") serves as fund accountant and provides certain administrative services to the Fund. Pursuant to a custody agreement with the Trust on behalf of the Fund, SSB also serves as the Fund's custodian.
The Trust has entered into a transfer agency and service agreement with Invesco Investment Services, Inc. ("IIS") pursuant to which the Fund has agreed to pay IIS a fee for providing transfer agency and shareholder services to the Fund and reimburse IIS for certain expenses incurred by IIS in the course of providing such services. IIS may make payments to intermediaries that provide omnibus account services, sub-accounting services and/or networking services. All fees payable by IIS to intermediaries that provide omnibus account services or sub-accounting services are charged back to the Fund, subject to certain limitations approved by the Trust's Board of Trustees. For the year ended February 29, 2020, expenses incurred under the agreement are shown in the Statement of Operations as Transfer agent fees.
The Trust has entered into master distribution agreements with Invesco Distributors, Inc. ("IDI") to serve as the distributor for the Class A, Class C, Class R, Class Y, Class R5 and Class R6 shares of the Fund. The Trust has adopted plans pursuant to Rule 12b-1 under the 1940 Act with respect to the Fund's Class A, Class C and Class R shares (collectively, the "Plans"). The Fund, pursuant to the Plans, pays IDI compensation at the annual rate of 0.15% of the Fund's average daily net assets of Class A shares, 0.65% of the average daily net assets of Class C shares and 0.50% of the average daily net assets of Class R shares. The fees are accrued daily and paid monthly. Of the Plan payments, up to 0.25% of the average daily net assets of each class of shares may be paid to furnish continuing personal shareholder services to customers who purchase and own shares of such classes. Any amounts not paid as a service fee under the Plans would constitute an asset-based sales charge. Rules of the Financial Industry Regulatory Authority ("FINRA") impose a cap on the total sales charges, including asset-based sales charges, that may be paid by any class of shares of the Fund. IDI has contractually agreed, through at least June 30, 2020, to waive 12b-1 fees for Class C shares to the extent necessary to limit 12b-1 fees to 0.50% of average daily net assets. 12b-1 fees before fee waivers under this agreement are shown as Distribution fees in the Statement of Operations. For the year ended February 29, 2020, 12b-1 fees incurred for Class C shares were $714,032 after fee waivers of $214,210.
Front-end sales commissions and CDSC (collectively, the "sales charges") are not recorded as expenses of the Fund. Front-end sales commissions are deducted from proceeds from the sales of Fund shares prior to investment in Class A shares of the Fund. CDSC are deducted from redemption proceeds prior to remittance to the shareholder. During the year ended February 29, 2020, IDI advised the Fund that IDI retained $106,031 in front-end sales commissions from the sale of Class A shares and $92,725 and $425 from Class A and Class C shares, respectively, for CDSC imposed upon redemptions by shareholders.
Certain officers and trustees of the Trust are officers and directors of the Adviser, IIS and/or IDI.
NOTE 3—Additional Valuation Information
GAAP defines fair value as the price that would be received to sell an asset or paid to transfer a liability in an orderly transaction between market participants at the measurement date, under current market conditions. GAAP establishes a hierarchy that prioritizes the inputs to valuation methods, giving the highest priority to readily available unadjusted quoted prices in an active market for identical assets (Level 1) and the lowest priority to significant unobservable inputs (Level 3), generally when market prices are not readily available or are unreliable. Based on the valuation inputs, the securities or other investments are tiered into one of three levels. Changes in valuation methods may result in transfers in or out of an investment's assigned level:
Level 1 – Prices are determined using quoted prices in an active market for identical assets.
Level 2 – Prices are determined using other significant observable inputs. Observable inputs are inputs that other market participants may use in pricing a security. These may include quoted prices for similar securities, interest rates, prepayment speeds, credit risk, yield curves, loss severities, default rates, discount rates, volatilities and others.
Level 3 – Prices are determined using significant unobservable inputs. In situations where quoted prices or observable inputs are unavailable (for example, when there is little or no market activity for an investment at the end of the period), unobservable inputs may be used. Unobservable inputs reflect the Fund's own assumptions about the factors market participants would use in determining fair value of the securities or instruments and would be based on the best available information.
The following is a summary of the tiered valuation input levels, as of February 29, 2020. The level assigned to the securities valuations may not be an indication of the risk or liquidity associated with investing in those securities. Because of the inherent uncertainties of valuation, the values reflected in the financial statements may materially differ from the value received upon actual sale of those investments.
| | Level 1 | Level 2 | Level 3 | Total |
Investments in Securities | | | | | |
U.S. Dollar Denominated Bonds & Notes | $ | — | $ 987,007,482 | $— | $ 987,007,482 |
Asset-Backed Securities | | — | 453,301,591 | — | 453,301,591 |
U.S. Treasury Securities | | — | 119,655,822 | — | 119,655,822 |
Agency Credit Risk Transfer Notes | | — | 4,997,901 | — | 4,997,901 |
U.S. Government Sponsored Agency Mortgage-Backed Securities | | — | 3,424,298 | — | 3,424,298 |
Preferred Stocks | | 1,994,250 | — | — | 1,994,250 |
Money Market Funds | | 39,610,453 | — | — | 39,610,453 |
Total Investments in Securities | | 41,604,703 | 1,568,387,094 | — | 1,609,991,797 |
23 | Invesco Short Term Bond Fund |
| | Level 1 | | Level 2 | Level 3 | | Total |
Other Investments - Assets* | | | | | | | | |
Futures Contracts | $ | 2,794,407 | $ | — | $— | $ | 2,794,407 | |
Other Investments - Liabilities* | | | | | | | | |
Futures Contracts | | (1,412,769) | | — | — | | (1,412,769) |
Total Other Investments | | 1,381,638 | | — | — | | 1,381,638 | |
Total Investments | $ | 42,986,341 | $1,568,387,094 | $— | $1,611,373,435 | |
*Unrealized appreciation (depreciation).
NOTE 4—Derivative Investments
The Fund may enter into an International Swaps and Derivatives Association Master Agreement ("ISDA Master Agreement") under which a fund may trade OTC derivatives. An OTC transaction entered into under an ISDA Master Agreement typically involves a collateral posting arrangement, payment netting provisions and close-out netting provisions. These netting provisions allow for reduction of credit risk through netting of contractual obligations. The enforceability of the netting provisions of the ISDA Master Agreement depends on the governing law of the ISDA Master Agreement, among other factors.
For financial reporting purposes, the Fund does not offset OTC derivative assets or liabilities that are subject to ISDA Master Agreements in the Statement of Assets and Liabilities.
Value of Derivative Investments at Period-End
The table below summarizes the value of the Fund's derivative investments, detailed by primary risk exposure, held as of February 29, 2020:
| | | Value | |
| | | Interest |
Derivative Assets | | | Rate Risk | |
Unrealized appreciation on futures contracts — Exchange-Traded(a) | $ | 2,794,407 | |
Derivatives not subject to master netting agreements | | | (2,794,407) |
Total Derivative Assets subject to master netting agreements | $ | - | | |
| | | | |
| | | Value | |
| | | Interest |
Derivative Liabilities | | | Rate Risk | |
Unrealized depreciation on futures contracts — Exchange-Traded(a) | $ | (1,412,769) |
Derivatives not subject to master netting agreements | | | 1,412,769 | | |
| | | | |
Total Derivative Liabilities subject to master netting agreements | $ | - | | |
(a)The daily variation margin receivable (payable) at period-end is recorded in the Statement of Assets and Liabilities.
Effect of Derivative Investments for the year ended February 29, 2020
The table below summarizes the gains (losses) on derivative investments, detailed by primary risk exposure, recognized in earnings during the period:
| Location of Gain (Loss) on |
| Statement of Operations |
| | Interest |
| | Rate Risk |
Realized Gain (Loss): | | |
Futures contracts | $ | (635,922) |
| | |
Change in Net Unrealized Appreciation: | | |
Futures contracts | | 1,219,453 |
| | |
Total | $ | 583,531 |
The table below summarizes the average notional value of derivatives held during the period. | | |
| | Futures |
| | Contracts |
Average notional value | | $619,228,123 |
NOTE 5—Expense Offset Arrangement(s)
The expense offset arrangement is comprised of transfer agency credits which result from balances in demand deposit accounts used by the transfer agent for clearing shareholder transactions. For the year ended February 29, 2020, the Fund received credits from this arrangement, which resulted in the reduction of the Fund's total expenses of $3,080.
NOTE 6—Trustees' and Officers' Fees and Benefits
Trustees' and Officers' Fees and Benefits include amounts accrued by the Fund to pay remuneration to certain Trustees and Officers of the Fund. Trustees have the option to defer compensation payable by the Fund, and Trustees' and Officers' Fees and Benefits also include amounts accrued by the Fund to fund such deferred compensation amounts. Those Trustees who defer compensation have the option to select various Invesco Funds in which their deferral accounts shall be deemed to be invested. Finally, certain current Trustees were eligible to participate in a retirement plan that provided for benefits to be paid upon retirement to Trustees over a
24 | Invesco Short Term Bond Fund |

period of time based on the number of years of service. The Fund may have certain former Trustees who also participate in a retirement plan and receive benefits under such plan. Trustees' and Officers' Fees and Benefits include amounts accrued by the Fund to fund such retirement benefits. Obligations under the deferred compensation and retirement plans represent unsecured claims against the general assets of the Fund.
NOTE 7—Cash Balances
The Fund may borrow for leveraging in an amount up to 5% of the Fund's total assets (excluding the amount borrowed) at the time the borrowing is made. In doing so, the Fund is permitted to temporarily carry a negative or overdrawn balance in its account with SSB, the custodian bank. Such balances, if any at period end, are shown in the Statement of Assets and Liabilities under the payable caption Amount due custodian. To compensate the custodian bank for such overdrafts, the overdrawn Fund may either (1) leave funds as a compensating balance in the account so the custodian bank can be compensated by earning the additional interest; or (2) compensate by paying the custodian bank at a rate agreed upon by the custodian bank and Invesco, not to exceed the contractually agreed upon rate. The Fund may not purchase additional securities when any borrowings from banks or broker-dealers exceed 5% of the Fund's total assets, or when any borrowings from an Invesco Fund are outstanding.
NOTE 8—Distributions to Shareholders and Tax Components of Net Assets
Tax Character of Distributions to Shareholders Paid During the Fiscal Years Ended February 29, 2020 and February 28, 2019:
| | 2020 | 2019 | | |
Ordinary income | $42,312,703 | $37,876,486 | |
| | | | |
Return of capital | 1,354,058 | — |
| | | | |
Total distributions | $43,666,761 | $37,876,486 | |
| | | | | |
Tax Components of Net Assets at Period-End: | | | | |
| | | 2020 | | |
Net unrealized appreciation — investments | | $ 24,858,709 | |
| | | |
Temporary book/tax differences | | (129,353) |
| | | |
Capital loss carryforward | | (17,137,674) |
Shares of beneficial interest | | 1,604,435,671 | |
| | | |
Total net assets | | $1,612,027,353 | |
The difference between book-basis and tax-basis unrealized appreciation (depreciation) is due to differences in the timing of recognition of gains and losses on investments for tax and book purposes. The Fund's net unrealized appreciation (depreciation) difference is attributable primarily to straddle contracts, futures contracts and wash sales.
The temporary book/tax differences are a result of timing differences between book and tax recognition of income and/or expenses. The Fund's temporary book/tax differences are the result of the trustee deferral of compensation and retirement plan benefits.
Capital loss carryforward is calculated and reported as of a specific date. Results of transactions and other activity after that date may affect the amount of capital loss carryforward actually available for the Fund to utilize. The ability to utilize capital loss carryforward in the future may be limited under the Internal Revenue Code and related regulations based on the results of future transactions.
The Fund has a capital loss carryforward as of February 29, 2020, as follows:
Capital Loss Carryforward*
Expiration | Short-Term | Long-Term | Total |
Not subject to expiration | $1,996,807 | $15,140,867 | $17,137,674 |
| | | |
*Capital loss carryforward is reduced for limitations, if any, to the extent required by the Internal Revenue Code and may be further limited depending upon a variety of factors, including the realization of net unrealized gains or losses as of the date of any reorganization.
NOTE 9—Investment Transactions
The aggregate amount of investment securities (other than short-term securities, U.S. Treasury obligations and money market funds, if any) purchased and sold by the Fund during the year ended February 29, 2020 was $981,414,648 and $671,064,494, respectively. During the same period, purchases and sales of U.S. Treasury obligations were $1,519,288,422 and $1,537,328,619, respectively. Cost of investments, including any derivatives, on a tax basis includes the adjustments for financial reporting purposes as of the most recently completed federal income tax reporting period-end.
Unrealized Appreciation (Depreciation) of Investments on a Tax Basis
Aggregate unrealized appreciation of investments | $28,018,026 | |
Aggregate unrealized (depreciation) of investments | (3,159,317) |
Net unrealized appreciation of investments | $24,858,709 | |
Cost of investments for tax purposes is $1,586,514,726.
NOTE 10—Reclassification of Permanent Differences
Primarily as a result of differing book/tax treatment of return of capital distribution, paydowns and partnership reclasses, on February 29, 2020, undistributed net investment income was increased by $1,778,631, undistributed net realized gain (loss) was decreased by $404,152 and shares of beneficial interest was decreased by $1,374,479. This reclassification had no effect on the net assets of the Fund.
25 | Invesco Short Term Bond Fund |

NOTE 11—Share Information
Summary of Share Activity
| | Year ended | | Year ended |
| | February 29, 2020(a) | | | February 28, 2019 | |
| | Shares | Amount | | Shares | | Amount |
Sold: | | | | | | | | | | |
Class A | 32,376,390 | $ 278,032,431 | 55,495,796 | $ | 469,022,984 | |
Class C | 9,715,952 | 83,413,841 | 12,220,047 | | 103,385,054 | |
Class R | 387,350 | 3,330,963 | 217,199 | | 1,840,559 | | |
Class Y | 13,106,059 | 112,222,859 | 13,247,995 | | 112,068,635 | |
Class R5 | 34,651 | 295,779 | 16,027 | | 135,644 | | |
Class R6 | 17,128,603 | 146,435,536 | 11,295,823 | | 95,842,910 | |
Issued as reinvestment of dividends: | | | | | | | | | | |
Class A | 1,637,769 | 14,070,280 | 1,159,688 | | 9,816,461 | | |
Class C | 323,868 | 2,780,819 | 696,858 | | 5,897,397 | | |
Class R | 16,109 | 138,633 | 12,750 | | 108,102 | | |
Class Y | 297,910 | 2,559,622 | 211,075 | | 1,786,650 | | |
Class R5 | 2,837 | 24,269 | 5,913 | | 50,018 | | |
Class R6 | 2,213,330 | 19,039,098 | 1,929,521 | | 16,356,711 | |
Automatic conversion of Class C shares to Class A shares: | | | | | | | | | | |
Class A | 1,433,718 | 12,281,863 | - | | - | | |
Class C | (1,434,559) | (12,281,863) | - | | - | | |
Reacquired: | | | | | | | | | | |
Class A | (29,583,975) | (253,854,766) | (33,346,510) | | (282,319,651) |
| | | | | | |
Class C | (6,802,635) | (58,334,382) | (42,386,790) | | (358,327,497) |
| | | | | | |
Class R | (280,988) | (2,418,596) | (187,098) | | (1,584,341) |
| | | | | | |
Class Y | (12,376,838) | (106,118,286) | (12,752,177) | | (108,040,697) |
| | | | | | |
Class R5 | (188,630) | (1,620,364) | (13,257) | | (111,989) |
| | | | | | |
Class R6 | (11,488,662) | (98,785,372) | (14,268,445) | | (120,935,419) |
| | | | | | |
Net increase (decrease) in share activity | 16,518,259 | $ 141,212,364 | (6,445,585) | $ | (55,008,469) |
| | | | | | | | | | |
(a)There are entities that are record owners of more than 5% of the outstanding shares of the Fund and in the aggregate own 62% of the outstanding shares of the Fund. IDI has an agreement with these entities to sell Fund shares. The Fund, Invesco and/or Invesco affiliates may make payments to these entities, which are considered to be related to the Fund, for providing services to the Fund, Invesco and/or Invesco affiliates including but not limited to services such as securities brokerage, distribution, third party record keeping and account servicing. The Fund has no knowledge as to whether all or any portion of the shares owned of record by these entities are also owned beneficially.
NOTE 12—Significant Event
The Board of Trustees of the Fund unanimously approved an Agreement and Plan of Reorganization (the "Agreement") pursuant to which the Fund would transfer all of its assets and liabilities of Invesco Oppenheimer Limited-Term Bond Fund (the "Target Fund") in exchange for shares of the Fund.
The reorganization is expected to be consummated on May 15, 2020. Upon closing of the reorganization, shareholders of the Target Fund will receive shares of the Fund in exchange for their shares of the Target Fund, and the Target Fund will liquidate and cease operations.
NOTE 13—Subsequent Event
During the first quarter of 2020, the World Health Organization declared the coronavirus (COVID-19) to be a public health emergency. COVID-19 has led to increased short-term market volatility and may have adverse long-term effects on U.S. and world economies and markets in general. COVID-19 may adversely impact the Fund's ability to achieve its investment objective. Because of the uncertainties on valuation, the global economy and business operations, values reflected in these financial statements may materially differ from the value received upon actual sales of those investments.
The Coronavirus Aid, Relief, and Economic Security Act, commonly referred to as the "CARES Act," was signed into law on March 27, 2020 by President Trump. The Adviser is assessing the components of the Act, and the impacts to the Fund should be immaterial.
26 | Invesco Short Term Bond Fund |
Report of Independent Registered Public Accounting Firm
To the Board of Trustees of AIM Investment Securities Funds (Invesco Investment Securities Funds) and Shareholders of Invesco Short Term Bond Fund
Opinion on the Financial Statements
We have audited the accompanying statement of assets and liabilities, including the schedule of investments, of Invesco Short Term Bond Fund (one of the funds constituting AIM Investment Securities Funds (Invesco Investment Securities Funds), hereafter referred to as the "Fund") as of February 29, 2020, the related statement of operations for the year ended February 29, 2020, the statement of changes in net assets for each of the two years in the period ended February 29, 2020, including the related notes, and the financial highlights for each of the five years in the period ended February 29, 2020 (collectively referred to as the financial statements). In our opinion, the financial statements present fairly, in all material respects, the financial position of the Fund as of February 29, 2020, the results of its operations for the year then ended, the changes in its net assets for each of the two years in the period ended February 29, 2020 and the financial highlights financial highlights for each of the five years in the period ended February 29, 2020 in conformity with accounting principles generally accepted in the United States of America.
Basis for Opinion
These financial statements are the responsibility of the Fund's management. Our responsibility is to express an opinion on the Fund's financial statements based on our audits. We are a public accounting firm registered with the Public Company Accounting Oversight Board (United States) (PCAOB) and are required to be independent with respect to the Fund in accordance with the U.S. federal securities laws and the applicable rules and regulations of the Securities and Exchange Commission and the
PCAOB.
We conducted our audits of these financial statements in accordance with the standards of the PCAOB. Those standards require that we plan and perform the audit to obtain reasonable assurance about whether the financial statements are free of material misstatement, whether due to error or fraud.
Our audits included performing procedures to assess the risks of material misstatement of the financial statements, whether due to error or fraud, and performing procedures that respond to those risks. Such procedures included examining, on a test basis, evidence regarding the amounts and disclosures in the financial statements. Our audits also included evaluating the accounting principles used and significant estimates made by management, as well as evaluating the overall presentation of the financial statements. Our procedures included confirmation of securities owned as of February 29, 2020 by correspondence with the custodian, transfer agent and brokers; when replies were not received from brokers, we performed other auditing procedures. We believe that our audits provide a reasonable basis for our opinion.
/s/PricewaterhouseCoopers LLP
Houston, Texas
April 28, 2020
We have served as the auditor of one or more of the investment companies in the Invesco group of investment companies since at least 1995. We have not been able to determine the specific year we began serving as auditor.
27 | Invesco Short Term Bond Fund |
Calculating your ongoing Fund expenses
Example
As a shareholder of the Fund, you incur two types of costs: (1) transaction costs, which may include sales charges (loads) on purchase payments or contingent deferred sales charges on redemptions, if any; and (2) ongoing costs, including management fees, distribution and/or service (12b-1) fees, and other Fund expenses. This example is intended to help you understand your ongoing costs (in dollars) of investing in the Fund and to compare these costs with ongoing costs of investing in other mutual funds. The example is based on an investment of $1,000 invested at the beginning of the period and held for the entire period September 1, 2019 through February 29, 2020.
Actual expenses
The table below provides information about actual account values and actual expenses. You may use the information in this table, together with the amount you invested, to estimate the expenses that you paid over the period. Simply divide your account value by $1,000 (for example, an $8,600 account value divided by $1,000 = 8.6), then multiply the result by the number in the table under the heading entitled "Actual Expenses Paid During Period" to estimate the expenses you paid on your account during this period.
Hypothetical example for comparison purposes
The table below also provides information about hypothetical account values and hypothetical expenses based on the Fund's actual expense ratio and an assumed rate of return of 5% per year before expenses, which is not the Fund's actual return.
The hypothetical account values and expenses may not be used to estimate the actual ending account balance or expenses you paid for the period. You may use this information to compare the ongoing costs of investing in the Fund and other funds. To do so, compare this 5% hypothetical example with the 5% hypothetical examples that appear in the shareholder reports of the other funds.
Please note that the expenses shown in the table are meant to highlight your ongoing costs only and do not reflect any transaction costs, such as sales charges (loads) on purchase payments or contingent deferred sales charges on redemptions, if any. Therefore, the hypothetical information is useful in comparing ongoing costs only, and will not help you determine the relative total costs of owning different funds. In addition, if these transaction costs were included, your costs would have been higher.
| | | | | HYPOTHETICAL | |
| | | | | (5% annual return before | |
| | | ACTUAL | | expenses) | |
| Beginning | Ending | | Expenses | Ending | | Expenses | Annualized |
| Account Value | Account Value | | Paid During | Account Value | | Paid During | Expense |
| (09/01/19) | (02/29/20)1 | | Period2 | (02/29/20) | | Period2 | Ratio |
Class A | $1,000.00 | $1,018.20 | | $3.16 | $1,021.73 | | $3.17 | 0.63% |
| | | | | | | | |
Class C | 1,000.00 | 1,016.50 | | 4.91 | 1,019.99 | | 4.92 | 0.98 |
| | | | | | | | |
Class R | 1,000.00 | 1,016.40 | | 4.91 | 1,019.99 | | 4.92 | 0.98 |
| | | | | | | | |
Class Y | 1,000.00 | 1,019.00 | | 2.41 | 1,022.48 | | 2.41 | 0.48 |
Class R5 | 1,000.00 | 1,019.30 | | 2.21 | 1,022.68 | | 2.21 | 0.44 |
| | | | | | | | |
Class R6 | 1,000.00 | 1,019.60 | | 1.86 | 1,023.02 | | 1.86 | 0.37 |
1The actual ending account value is based on the actual total return of the Fund for the period September 1, 2019 through February 29, 2020, after actual expenses and will differ from the hypothetical ending account value which is based on the Fund's expense ratio and a hypothetical annual return of 5% before expenses.
2Expenses are equal to the Fund's annualized expense ratio as indicated above multiplied by the average account value over the period, multiplied by 182/366 to reflect the most recent fiscal half year.
28 | Invesco Short Term Bond Fund |
Tax Information
Form 1099-DIV, Form 1042-S and other year–end tax information provide shareholders with actual calendar year amounts that should be included in their tax returns. Shareholders should consult their tax advisers.
The following distribution information is being provided as required by the Internal Revenue Code or to meet a specific state's requirement.
The Fund designates the following amounts or, if subsequently determined to be different, the maximum amount allowable for its fiscal year ended February 29, 2020:
Federal and State Income Tax
Qualified Dividend Income* | 4.15% |
Corporate Dividends Received Deduction* | 4.15% |
U.S. Treasury Obligations* | 3.15% |
* The above percentages are based on ordinary income dividends paid to shareholders during the Fund's fiscal year.
29 | Invesco Short Term Bond Fund |
Trustees and Officers
The address of each trustee and officer is AIM Investment Securities Funds (Invesco Investment Securities Funds) (the "Trust"), 11 Greenway Plaza, Suite 1000, Houston, Texas 77046-1173. The trustees serve for the life of the Trust, subject to their earlier death, incapacitation, resignation, retirement or removal as more specifically provided in the Trust's organizational documents. Each officer serves for a one year term or until their successors are elected and qualified. Column two below includes length of time served with predecessor entities, if any.
| Trustee | | Number of | Other |
Name, Year of Birth and | | Funds in | Directorship(s) |
and/or | | Fund Complex | Held by Trustee |
Position(s) | Officer | Principal Occupation(s) | Overseen by | During Past 5 |
Held with the Trust | Since | During Past 5 Years | Trustee | Years |
Interested Trustee | | | | |
Martin L. Flanagan1 — 1960 | 2007 | Executive Director, Chief Executive Officer and President, Invesco Ltd. | 229 | None |
Trustee and Vice Chair | | (ultimate parent of Invesco and a global investment management firm); | | |
| | Trustee and Vice Chair, The Invesco Funds; Vice Chair, Investment Company | | |
| | Institute; and Member of Executive Board, SMU Cox School of Business | | |
| | Formerly: Advisor to the Board, Invesco Advisers, Inc. (formerly known as | | |
| | Invesco Institutional (N.A.), Inc.); Chairman and Chief Executive Officer, | | |
| | Invesco Advisers, Inc. (registered investment adviser); Director, Chairman, | | |
| | Chief Executive Officer and President, Invesco Holding Company (US), Inc. | | |
| | (formerly IVZ Inc.) (holding company), Invesco Group Services, Inc. (service | | |
| | provider) and Invesco North American Holdings, Inc. (holding company); | | |
| | Director, Chief Executive Officer and President, Invesco Holding Company | | |
| | Limited (parent of Invesco and a global investment management firm); | | |
| | Director, Invesco Ltd.; Chairman, Investment Company Institute and President, | | |
| | Co-Chief Executive Officer, Co-President, Chief Operating Officer and Chief | | |
| | Financial Officer, Franklin Resources, Inc. (global investment management | | |
| | organization) | | |
1Mr. Flanagan is considered an interested person (within the meaning of Section 2(a)(19) of the 1940 Act) of the Trust because he is an officer of the Adviser to the Trust, and an officer and a director of Invesco Ltd., ultimate parent of the Adviser.
T-1 | Invesco Short Term Bond Fund |
Trustees and Officers—(continued)
| | | Number of | |
| | | Funds | Other |
| Trustee | | in | Directorship(s) |
Name, Year of Birth and | and/or | | Fund Complex | Held by Trustee |
Position(s) | Officer | Principal Occupation(s) | Overseen by | During Past 5 |
Held with the Trust | Since | During Past 5 Years | Trustee | Years |
Independent Trustees | | | | |
Bruce L. Crockett – 1944 | 1992 | Chairman, Crockett Technologies Associates (technology consulting company) | 229 | Director and |
Trustee and Chair | | Formerly: Director, Captaris (unified messaging provider); Director, President | | Chairman of the |
| | | Audit Committee, |
| | and Chief Executive Officer, COMSAT Corporation; Chairman, Board of | |
| | | ALPS (Attorneys |
| | Governors of INTELSAT (international communications company); ACE Limited | |
| | | Liability |
| | (insurance company); Independent Directors Council and Investment Company | |
| | | Protection |
| | Institute: Member of the Audit Committee, Investment Company Institute; | |
| | | Society) |
| | Member of the Executive Committee and Chair of the Governance Committee, | |
| | | (insurance |
| | Independent Directors Council | |
| | | company); |
| | | |
| | | | Director and |
| | | | Member of the |
| | | | Audit Committee |
| | | | and |
| | | | Compensation |
| | | | Committee, |
| | | | Ferroglobe PLC |
| | | | (metallurgical |
| | | | company) |
David C. Arch – 1945 | 2010 | Chairman of Blistex Inc. (consumer health care products manufacturer); | 229 | Board member of |
Trustee | | Member, World Presidents' Organization | | the Illinois |
| | | | Manufacturers' |
| | | | Association |
Beth Ann Brown – 1968 | 2019 | Independent Consultant | 229 | Director, Board of |
Trustee | | Formerly: Head of Intermediary Distribution, Managing Director, Strategic | | Directors of |
| | | Caron |
| | Relations, Managing Director, Head of National Accounts, Senior Vice | |
| | | Engineering Inc.; |
| | President, National Account Manager and Senior Vice President, Key Account | |
| | | Advisor, Board of |
| | Manager, Columbia Management Investment Advisers LLC; Vice President, Key | |
| | | Advisors of Caron |
| | Account Manager, Liberty Funds Distributor, Inc.; and Trustee of certain | |
| | | Engineering Inc.; |
| | Oppenheimer Funds | |
| | | President and |
| | | |
| | | | Director, Acton |
| | | | Shapleigh Youth |
| | | | Conservation |
| | | | Corps (non - |
| | | | profit); and Vice |
| | | | President and |
| | | | Director of |
| | | | Grahamtastic |
| | | | Connection (non- |
| | | | profit) |
Jack M. Fields – 1952 | 1997 | Chief Executive Officer, Twenty First Century Group, Inc. (government affairs | 229 | Member, Board of Directors of |
Trustee | | company); and Chairman, Discovery Learning Alliance (non-profit) | | Baylor College of Medicine |
| | Formerly: Owner and Chief Executive Officer, Dos Angeles Ranch L.P. (cattle, | | |
| | hunting, corporate entertainment); Director, Insperity, Inc. (formerly known as | | |
| | Administaff) (human resources provider); Chief Executive Officer, Texana | | |
| | Timber LP (sustainable forestry company); Director of Cross Timbers Quail | | |
| | Research Ranch (non-profit); and member of the U.S. House of Representatives | | |
| | | | |
T-2 | Invesco Short Term Bond Fund |

Trustees and Officers—(continued)
| | | Number of | |
| | | Funds | Other |
| Trustee | | in | Directorship(s) |
Name, Year of Birth and | and/or | | Fund Complex | Held by Trustee |
Position(s) | Officer | Principal Occupation(s) | Overseen by | During Past 5 |
Held with the Trust | Since | During Past 5 Years | Trustee | Years |
Independent Trustees—(continued) | | | |
Cynthia Hostetler —1962 | 2017 | Non-Executive Director and Trustee of a number of public and private business | 229 | Vulcan Materials |
Trustee | | corporations | | Company |
| | Formerly: Director, Aberdeen Investment Funds (4 portfolios); Head of | | (construction |
| | | materials |
| | Investment Funds and Private Equity, Overseas Private Investment | |
| | | company); Trilinc |
| | Corporation; President, First Manhattan Bancorporation, Inc.; Attorney, | |
| | | Global Impact |
| | Simpson Thacher & Bartlett LLP | |
| | | Fund; Genesee & |
| | | |
| | | | Wyoming, Inc. |
| | | | (railroads); Artio |
| | | | Global Investment |
| | | | LLC (mutual fund |
| | | | complex); Edgen |
| | | | Group, Inc. |
| | | | (specialized |
| | | | energy and |
| | | | infrastructure |
| | | | products |
| | | | distributor); |
| | | | Investment |
| | | | Company Institute |
| | | | (professional |
| | | | organization); |
| | | | Independent |
| | | | Directors Council |
| | | | (professional |
| | | | organization) |
Eli Jones – 1961 | 2016 | Professor and Dean, Mays Business School - Texas A&M University | 229 | Insperity, Inc. |
Trustee | | Formerly: Professor and Dean, Walton College of Business, University of | | (formerly known |
| | | as Administaff) |
| | Arkansas and E.J. Ourso College of Business, Louisiana State University; | |
| | | (human resources |
| | Director, Arvest Bank | |
| | | provider) |
| | | |
Elizabeth Krentzman – 1959 | 2019 | Formerly: Principal and Chief Regulatory Advisor for Asset Management | 229 | Trustee of the |
Trustee | | Services and U.S. Mutual Fund Leader of Deloitte & Touche LLP; General | | University of |
| | Counsel of the Investment Company Institute (trade association); National | | Florida National |
| | Director of the Investment Management Regulatory Consulting Practice, | | Board Foundation |
| | Principal, Director and Senior Manager of Deloitte & Touche LLP; Assistant | | and Audit |
| | Director of the Division of Investment Management - Office of Disclosure and | | Committee |
| | Investment Adviser Regulation of the U.S. Securities and Exchange | | Member; Member |
| | Commission and various positions with the Division of Investment Management | | of the Cartica |
| | – Office of Regulatory Policy of the U.S. Securities and Exchange Commission; | | Funds Board of |
| | Associate at Ropes & Gray LLP; Advisory Board Member of the Securities and | | Directors (private |
| | Exchange Commission Historical Society; and Trustee of certain Oppenheimer | | investment |
| | Funds | | funds); Member |
| | | | of the University |
| | | | of Florida Law |
| | | | Center |
| | | | Association, Inc. |
| | | | Board of Trustees |
| | | | and Audit |
| | | | Committee |
| | | | Member |
Anthony J. LaCava, Jr. – 1956 | 2019 | Formerly: Director and Member of the Audit Committee, Blue Hills Bank | 229 | Blue Hills Bank; |
Trustee | | (publicly traded financial institution) and Managing Partner, KPMG LLP | | Chairman, |
| | | | Bentley |
| | | | University; |
| | | | Member, |
| | | | Business School |
| | | | Advisory Council; |
| | | | and Nominating |
| | | | Committee |
| | | | KPMG LLP |
Prema Mathai-Davis – 1950 | 1998 | Retired | 229 | None |
Trustee | | Co-Owner & Partner of Quantalytics Research, LLC, (a FinTech Investment | | |
| | | |
Research Platform for the Self-Directed Investor)
T-3 | Invesco Short Term Bond Fund |

Trustees and Officers—(continued)
| | | Number of | |
| | | Funds | Other |
| Trustee | | in | Directorship(s) |
Name, Year of Birth and | and/or | | Fund Complex | Held by Trustee |
Position(s) | Officer | Principal Occupation(s) | Overseen by | During Past 5 |
Held with the Trust | Since | During Past 5 Years | Trustee | Years |
Independent Trustees—(continued) | | | |
Joel W. Motley – 1952 | 2019 | Director of Office of Finance, Federal Home Loan Bank System; Member of the | 229 | Member of Board |
Trustee | | Vestry of Trinity Wall Street; Managing Director of Carmona Motley Inc. | | of Greenwall |
| | (privately held financial advisor); Member of the Council on Foreign Relations | | Foundation |
| | and its Finance and Budget Committee; Chairman Emeritus of Board of Human | | (bioethics research |
| | Rights Watch and Member of its Investment Committee; and Member of | | foundation) and |
| | Investment Committee and Board of Historic Hudson Valley (non-profit cultural | | its Investment |
| | organization) | | Committee; |
| | Formerly: Managing Director of Public Capital Advisors, LLC (privately held | | Member of Board of |
| | | Friends of the LRC |
| | financial advisor); Managing Director of Carmona Motley Hoffman, Inc. | |
| | | (non-profit |
| | (privately held financial advisor); Trustee of certain Oppenheimer Funds; and | |
| | | legal advocacy); |
| | Director of Columbia Equity Financial Corp. (privately held financial advisor) | |
| | | Board Member |
| | | |
| | | | and Investment |
| | | | Committee |
| | | | Member of |
| | | | Pulizer Center for |
| | | | Crisis Reporting |
| | | | (non-profit |
| | | | journalism) |
Teresa M. Ressel — 1962 | 2017 | Non-executive director and trustee of a number of public and private business | 229 | Atlantic Power |
Trustee | | corporations | | Corporation |
| | Formerly: Chief Financial Officer, Olayan America, The Olayan Group | | (power generation |
| | | company); ON |
| | (international investor/commercial/industrial); Chief Executive Officer, UBS | |
| | | Semiconductor |
| | Securities LLC; Group Chief Operating Officer, Americas, UBS AG; Assistant | |
| | | Corp. |
| | Secretary for Management & Budget and CFO, US Department of the Treasury | |
| | | (semiconductor |
| | | |
| | | | supplier) |
| | | | |
Ann Barnett Stern – 1957 | 2017 | President and Chief Executive Officer, Houston Endowment Inc. (private | 229 | Federal Reserve |
Trustee | | philanthropic institution) | | Bank of Dallas |
| | Formerly: Executive Vice President and General Counsel, Texas Children's | | |
| | Hospital; Attorney, Beck, Redden and Secrest, LLP; Business Law Instructor, | | |
| | University of St. Thomas; Attorney, Andrews & Kurth LLP | | |
Robert C. Troccoli – 1949 | 2016 | Retired | 229 | None |
Trustee | | Formerly: Adjunct Professor, University of Denver – Daniels College of | | |
| | | |
| | Business; Senior Partner, KPMG LLP | | |
| | | | |
Daniel S. Vandivort –1954 | 2019 | Treasurer, Chairman of the Audit and Finance Committee, and Trustee, Board | 229 | Chairman and |
Trustee | | of Trustees, Huntington Disease Foundation of America; and President, Flyway | | Lead Independent |
| | Advisory Services LLC (consulting and property management) | | Director, |
| | Formerly: Trustee and Governance Chair, of certain Oppenheimer Funds | | Chairman of the |
| | | Audit Committee, |
| | | |
| | | | and Director, |
| | | | Board of |
| | | | Directors, Value |
| | | | Line Funds |
James D. Vaughn – 1945 | 2019 | Retired | 229 | Board member |
Trustee | | Formerly: Managing Partner, Deloitte & Touche LLP; Trustee and Chairman of | | and Chairman of |
| | | Audit Committee |
| | the Audit Committee, Schroder Funds; Board Member, Mile High United Way, | |
| | | of AMG National |
| | Boys and Girls Clubs, Boy Scouts, Colorado Business Committee for the Arts, | |
| | | Trust Bank; |
| | Economic Club of Colorado and Metro Denver Network (economic development | |
| | | Trustee and |
| | corporation); and Trustee of certain Oppenheimer Funds | |
| | | Investment |
| | | |
| | | | Committee |
| | | | member, |
| | | | University of |
| | | | South Dakota |
| | | | Foundation; |
| | | | Board member, |
| | | | Audit Committee |
| | | | Member and past |
| | | | Board Chair, |
| | | | Junior |
| | | | Achievement |
| | | | (non-profit) |
Christopher L. Wilson - | 2017 | Retired | 229 | ISO New |
1957 | | Formerly: Director, TD Asset Management USA Inc. (mutual fund complex) (22 | | England, Inc. |
Trustee, Vice Chair and Chair | | | (non-profit |
| portfolios); Managing Partner, CT2, LLC (investing and consulting firm); | |
Designate | | | organization |
| President/Chief Executive Officer, Columbia Funds, Bank of America | |
| | | |
| Corporation; President/Chief Executive Officer, CDC IXIS Asset Management | managing |
| regional electricity |
| Services, Inc.; Principal & Director of Operations, Scudder Funds, Scudder, |
| market) |
| Stevens & Clark, Inc.; Assistant Vice President, Fidelity Investments |
| |
T-4 | Invesco Short Term Bond Fund |
Trustees and Officers—(continued)
| | | Number of | Other |
| Trustee | | Funds in | Directorship(s) |
Name, Year of Birth and | and/or | | Fund Complex | Held by Trustee |
Position(s) | Officer | Principal Occupation(s) | Overseen by | During Past 5 |
Held with the Trust | Since | During Past 5 Years | Trustee | Years |
Officers | | | | |
Sheri Morris — 1964 | 1999 | Head of Global Fund Services, Invesco Ltd.; President, Principal Executive | N/A | N/A |
President, Principal Executive | | Officer and Treasurer, The Invesco Funds; Vice President, Invesco Advisers, | | |
Officer and Treasurer | | Inc. (formerly known as Invesco Institutional (N.A.), Inc.) (registered | | |
| | investment adviser); and Vice President, Invesco Exchange-Traded Fund Trust, | | |
| | Invesco Exchange-Traded Fund Trust II, Invesco India Exchange-Traded Fund | | |
| | Trust, Invesco Actively Managed Exchange-Traded Fund Trust, Invesco Actively | | |
| | Managed Exchange-Traded Commodity Fund Trust and Invesco | | |
| | Exchange-Traded Self-Indexed Fund Trust; and Vice President, | | |
| | OppenheimerFunds, Inc. | | |
| | Formerly: Vice President and Principal Financial Officer, The Invesco Funds; | | |
| | Vice President, Invesco AIM Advisers, Inc., Invesco AIM Capital Management, | | |
| | Inc. and Invesco AIM Private Asset Management, Inc.; Assistant Vice President | | |
| | and Assistant Treasurer, The Invesco Funds and Assistant Vice President, | | |
| | Invesco Advisers, Inc., Invesco AIM Capital Management, Inc. and Invesco AIM | | |
| | Private Asset Management, Inc.; and Treasurer, Invesco Exchange-Traded | | |
| | Fund Trust, Invesco Exchange-Traded Fund Trust II, Invesco India | | |
| | Exchange-Traded Fund Trust and Invesco Actively Managed Exchange-Traded | | |
| | Fund Trust | | |
Russell C. Burk — 1958 | 2005 | Senior Vice President and Senior Officer, The Invesco Funds | N/A | N/A |
Senior Vice President and Senior | | | | |
Officer | | | | |
Jeffrey H. Kupor – 1968 | 2018 | Head of Legal of the Americas, Invesco Ltd.; Senior Vice President and | N/A | N/A |
Senior Vice President, Chief Legal | | Secretary, Invesco Advisers, Inc. (formerly known as Invesco Institutional | | |
Officer and Secretary | | (N.A.), Inc.) (registered investment adviser); Senior Vice President and | | |
| | Secretary, Invesco Distributors, Inc. (formerly known as Invesco AIM | | |
| | Distributors, Inc.); Vice President and Secretary, Invesco Investment Services, | | |
| | Inc. (formerly known as Invesco AIM Investment Services, Inc.) Senior Vice | | |
| | President, Chief Legal Officer and Secretary, The Invesco Funds; Secretary and | | |
| | General Counsel, Invesco Investment Advisers LLC (formerly known as Van | | |
| | Kampen Asset Management); Secretary and General Counsel, Invesco Capital | | |
| | Markets, Inc. (formerly known as Van Kampen Funds Inc.) and Chief Legal | | |
| | Officer, Invesco Exchange-Traded Fund Trust, Invesco Exchange-Traded Fund | | |
| | Trust II, Invesco India Exchange-Traded Fund Trust, Invesco Actively Managed | | |
| | Exchange-Traded Fund Trust, Invesco Actively Managed Exchange-Traded | | |
| | Commodity Fund Trust and Invesco Exchange-Traded Self-Indexed Fund Trust; | | |
| | Secretary, Invesco Indexing LLC; Secretary, W.L. Ross & Co., LLC | | |
| | Formerly: Secretary and Vice President, Jemstep, Inc.; Head of Legal, | | |
| | Worldwide Institutional, Invesco Ltd.; Secretary and General Counsel, INVESCO | | |
| | Private Capital Investments, Inc.; Senior Vice President, Secretary and General | | |
| | Counsel, Invesco Management Group, Inc. (formerly known as Invesco AIM | | |
| | Management Group, Inc.); Assistant Secretary, INVESCO Asset Management | | |
| | (Bermuda) Ltd.; Secretary and General Counsel, Invesco Private Capital, Inc.; | | |
| | Assistant Secretary and General Counsel, INVESCO Realty, Inc.; Secretary and | | |
| | General Counsel, Invesco Senior Secured Management, Inc.; and Secretary, | | |
| | Sovereign G./P. Holdings Inc. | | |
Andrew R. Schlossberg – 1974 | 2019 | Head of the Americas and Senior Managing Director, Invesco Ltd.; Director and | N/A | N/A |
Senior Vice President | | Senior Vice President, Invesco Advisers, Inc. (formerly known as Invesco | | |
| | Institutional (N.A.), Inc.) (registered investment adviser); Director and | | |
| | Chairman, Invesco Investment Services, Inc. (formerly known as Invesco AIM | | |
| | Investment Services, Inc.) (registered transfer agent); Senior Vice President, | | |
| | The Invesco Funds; Director, Invesco Investment Advisers LLC (formerly known | | |
| | as Van Kampen Asset Management); Director, President and Chairman, Invesco | | |
| | Insurance Agency, Inc. | | |
| | Formerly: Director, Invesco UK Limited; Director and Chief Executive, Invesco | | |
| | Asset Management Limited and Invesco Fund Managers Limited; Assistant Vice | | |
| | President, The Invesco Funds; Senior Vice President, Invesco Advisers, Inc. | | |
| | (formerly known as Invesco Institutional (N.A.), Inc.) (registered investment | | |
| | adviser); Director and Chief Executive, Invesco Administration Services Limited | | |
| | and Invesco Global Investment Funds Limited; Director, Invesco Distributors, | | |
| | Inc.; Head of EMEA, Invesco Ltd.; President, Invesco Actively Managed | | |
| | Exchange-Traded Commodity Fund Trust, Invesco Actively Managed | | |
| | Exchange-Traded Fund Trust, Invesco Exchange-Traded Fund Trust, Invesco | | |
| | Exchange-Traded Fund Trust II and Invesco India Exchange-Traded Fund Trust; | | |
| | Managing Director and Principal Executive Officer, Invesco Capital | | |
| | Management LLC | | |
T-5 | Invesco Short Term Bond Fund |
Trustees and Officers—(continued)
| | | Number of | Other |
| Trustee | | Funds in | Directorship(s) |
Name, Year of Birth and | and/or | | Fund Complex | Held by Trustee |
Position(s) | Officer | Principal Occupation(s) | Overseen by | During Past 5 |
Held with the Trust | Since | During Past 5 Years | Trustee | Years |
Officers—(continued) | | | | |
John M. Zerr — 1962 | 2006 | Chief Operating Officer of the Americas; Senior Vice President, Invesco | N/A | N/A |
Senior Vice President | | Advisers, Inc. (formerly known as Invesco Institutional (N.A.), Inc.) (registered | | |
| | investment adviser); Senior Vice President, Invesco Distributors, Inc. (formerly | | |
| | known as Invesco AIM Distributors, Inc.); Director and Vice President, Invesco | | |
| | Investment Services, Inc. (formerly known as Invesco AIM Investment | | |
| | Services, Inc.) Senior Vice President, The Invesco Funds; Managing Director, | | |
| | Invesco Capital Management LLC; Director, Invesco Investment Advisers LLC | | |
| | (formerly known as Van Kampen Asset Management); Senior Vice President, | | |
| | Invesco Capital Markets, Inc. (formerly known as Van Kampen Funds Inc.); | | |
| | Manager, Invesco Indexing LLC; Manager, Invesco Specialized Products, LLC; | | |
| | Director and Senior Vice President, Invesco Insurance Agency, Inc.; Member, | | |
| | Invesco Canada Funds Advisory Board; Director, President and Chief Executive | | |
| | Officer, Invesco Corporate Class Inc. (corporate mutual fund company); and | | |
| | Director, Chairman, President and Chief Executive Officer, Invesco Canada Ltd. | | |
| | (formerly known as Invesco Trimark Ltd./Invesco Trimark Ltèe) (registered | | |
| | investment adviser and registered transfer agent); President, Invesco, Inc. | | |
| | Formerly: Director and Senior Vice President, Invesco Management Group, Inc. | | |
| | (formerly known as Invesco AIM Management Group, Inc.); Secretary and | | |
| | General Counsel, Invesco Management Group, Inc. (formerly known as Invesco | | |
| | AIM Management Group, Inc.); Secretary, Invesco Investment Services, Inc. | | |
| | (formerly known as Invesco AIM Investment Services, Inc.); Chief Legal Officer | | |
| | and Secretary, The Invesco Funds; Secretary and General Counsel, Invesco | | |
| | Investment Advisers LLC (formerly known as Van Kampen Asset Management); | | |
| | Secretary and General Counsel, Invesco Capital Markets, Inc. (formerly known | | |
| | as Van Kampen Funds Inc.); Chief Legal Officer, Invesco Exchange-Traded Fund | | |
| | Trust, Invesco Exchange-Traded Fund Trust II, Invesco India Exchange-Traded | | |
| | Fund Trust, Invesco Actively Managed Exchange-Traded Fund Trust, Invesco | | |
| | Actively Managed Exchange-Traded Commodity Fund Trust and Invesco | | |
| | Exchange-Traded Self-Indexed Fund Trust; Secretary, Invesco Indexing LLC; | | |
| | Director, Secretary, General Counsel and Senior Vice President, Van Kampen | | |
| | Exchange Corp.; Director, Vice President and Secretary, IVZ Distributors, Inc. | | |
| | (formerly known as INVESCO Distributors, Inc.); Director and Vice President, | | |
| | INVESCO Funds Group, Inc.; Director and Vice President, Van Kampen | | |
| | Advisors Inc.; Director, Vice President, Secretary and General Counsel, Van | | |
| | Kampen Investor Services Inc.;Director and Secretary, Invesco Distributors, | | |
| | Inc. (formerly known as Invesco AIM Distributors, Inc.); Director, Senior Vice | | |
| | President, General Counsel and Secretary, Invesco AIM Advisers, Inc. and Van | | |
| | Kampen Investments Inc.; Director, Vice President and Secretary, Fund | | |
| | Management Company; Director, Senior Vice President, Secretary, General | | |
| | Counsel and Vice President, Invesco AIM Capital Management, Inc.; Chief | | |
| | Operating Officer and General Counsel, Liberty Ridge Capital, Inc. (an | | |
| | investment adviser) | | |
Gregory G. McGreevey - 1962 | 2012 | Senior Managing Director, Invesco Ltd.; Director, Chairman, President, and | N/A | N/A |
Senior Vice President | | Chief Executive Officer, Invesco Advisers, Inc. (formerly known as Invesco | | |
| | Institutional (N.A.), Inc.) (registered investment adviser); Director, Invesco | | |
| | Mortgage Capital, Inc. and Invesco Senior Secured Management, Inc.; and | | |
| | Senior Vice President, The Invesco Funds; and President, SNW Asset | | |
| | Management Corporation and Invesco Managed Accounts, LLC | | |
| | Formerly: Senior Vice President, Invesco Management Group, Inc. and Invesco | | |
| | Advisers, Inc.; Assistant Vice President, The Invesco Funds | | |
Kelli Gallegos – 1970 | 2008 | Principal Financial and Accounting Officer – Investments Pool, Invesco | N/A | N/A |
Vice President, Principal Financial | | Specialized Products, LLC; Vice President, Principal Financial Officer and | | |
Officer and Assistant Treasurer | | Assistant Treasurer, The Invesco Funds; Principal Financial and Accounting | | |
| | Officer – Pooled Investments, Invesco Capital Management LLC; Vice President | | |
| | and Treasurer, Invesco Exchange-Traded Fund Trust, Invesco Exchange-Traded | | |
| | Fund Trust II, Invesco India Exchange-Traded Fund Trust, Invesco Actively | | |
| | Managed Exchange-Traded Fund Trust, Invesco Actively Managed | | |
| | Exchange-Traded Commodity Fund Trust and Invesco Exchange-Traded | | |
| | Self-Indexed Fund Trust; Vice President, Invesco Advisers, Inc. | | |
| | Formerly: Assistant Treasurer, Invesco Specialized Products, LLC; Assistant | | |
| | Treasurer, Invesco Exchange-Traded Fund Trust, Invesco Exchange-Traded | | |
| | Fund Trust II, Invesco India Exchange-Traded Fund Trust, Invesco Actively | | |
| | Managed Exchange-Traded Fund Trust, Invesco Actively Managed | | |
| | Exchange-Traded Commodity Fund Trust and Invesco Exchange-Traded | | |
| | Self-Indexed Fund Trust; Assistant Treasurer, Invesco Capital | | |
| | Management LLC; Assistant Vice President, The Invesco Funds | | |
Crissie M. Wisdom – 1969 | 2013 | Anti-Money Laundering and OFAC Compliance Officer for Invesco U.S. entities | N/A | N/A |
Anti-Money Laundering | | including: Invesco Advisers, Inc. and its affiliates, Invesco Capital Markets, | | |
Compliance Officer | | Inc., Invesco Distributors, Inc., Invesco Investment Services, Inc., The Invesco | | |
| | Funds, Invesco Capital Management, LLC, Invesco Trust Company; | | |
| | OppenheimerFunds Distributor, Inc., and Fraud Prevention Manager for | | |
| | Invesco Investment Services, Inc. | | |
T-6 | Invesco Short Term Bond Fund |
Trustees and Officers—(continued)
| | | Number of | Other |
| Trustee | | Funds in | Directorship(s) |
Name, Year of Birth and | and/or | | Fund Complex | Held by Trustee |
Position(s) | Officer | Principal Occupation(s) | Overseen by | During Past 5 |
Held with the Trust | Since | During Past 5 Years | Trustee | Years |
Officers—(continued) | | | | |
Robert R. Leveille – 1969 | 2016 | Chief Compliance Officer, Invesco Advisers, Inc. (registered investment | N/A | N/A |
Chief Compliance Officer | | adviser); and Chief Compliance Officer, The Invesco Funds | | |
| | Formerly: Chief Compliance Officer, Putnam Investments and the Putnam | | |
| | Funds | | |
The Statement of Additional Information of the Trust includes additional information about the Fund's Trustees and is available upon request, without charge, by calling 1.800.959.4246. Please refer to the Fund's Statement of Additional Information for information on the Fund's sub-advisers.
Office of the Fund | Investment Adviser | Distributor | Auditors |
11 Greenway Plaza, Suite 1000 | Invesco Advisers, Inc. | Invesco Distributors, Inc. | PricewaterhouseCoopers LLP |
Houston, TX 77046-1173 | 1555 Peachtree Street, N.E. | 11 Greenway Plaza, Suite 1000 | 1000 Louisiana Street, Suite 5800 |
| Atlanta, GA 30309 | Houston, TX 77046-1173 | Houston, TX 77002-5678 |
Counsel to the Fund | Counsel to the Independent Trustees | Transfer Agent | Custodian |
Stradley Ronon Stevens & Young, LLP | Goodwin Procter LLP | Invesco Investment Services, Inc. | State Street Bank and Trust Company |
2005 Market Street, Suite 2600 | 901 New York Avenue, N.W. | 11 Greenway Plaza, Suite 1000 | 225 Franklin Street |
Philadelphia, PA 19103-7018 | Washington, D.C. 20001 | Houston, TX 77046-1173 | Boston, MA 02110-2801 |
T-7 | Invesco Short Term Bond Fund |
(This page intentionally left blank)
(This page intentionally left blank)
(This page intentionally left blank)

Go paperless with eDelivery
Visit invesco.com/edelivery to enjoy the convenience and security of anytime electronic access to your investment documents.
With eDelivery, you can elect to have any or all of the following materials delivered straight to your inbox to download, save and print from your own computer:
•Fund reports and prospectuses
•Quarterly statements
•Daily confirmations
•Tax forms
Invesco mailing information
Send general correspondence to Invesco Investment Services, Inc., P.O. Box 219078, Kansas City, MO 64121-9078.
Important notice regarding delivery of security holder documents
To reduce Fund expenses, only one copy of most shareholder documents may be mailed to shareholders with multiple accounts at the same address (Householding). Mailing of your shareholder documents may be householded indefinitely unless you instruct us otherwise. If you do not want the mailing of these documents to be combined with those for other members of your household, please contact Invesco Investment Services, Inc. at 800 959 4246 or contact your financial institution. We will begin sending you individual copies for each account within 30 days after receiving your request.
Fund holdings and proxy voting information
The Fund provides a complete list of its holdings four times in each fiscal year, at the quarter-ends. For the second and fourth quarters, the list appears in the Fund's semiannual and annual reports to shareholders. For the first and third quarters, the Fund files the lists with the Securities and Exchange Commission (SEC) as an exhibit to its reports on Form N-PORT. The most recent list of portfolio holdings is available at invesco.com/completeqtrholdings. Shareholders can also look up the Fund's Form N-PORT filings on the SEC website, sec.gov. The SEC file numbers for the Fund are shown below.
A description of the policies and procedures that the Fund uses to determine how to vote proxies relating to portfolio secu- rities is available without charge, upon request, from our Client Services department at 800 959 4246, or at invesco.com/ proxyguidelines. The information is also available on the SEC website, sec.gov.
Information regarding how the Fund voted proxies related to its portfolio securities during the most
recent 12-month period ended June 30 is available at invesco.com/proxysearch. This information is also available on the SEC website, sec.gov.
Invesco Advisers, Inc. is an investment adviser; it provides investment advisory services to individual and institutional clients and does not sell securities. Invesco Distributors, Inc. is the US distributor for Invesco Ltd.'s retail mutual funds, exchange-traded funds and institutional money market funds. Both are wholly owned, indirect subsidiaries of Invesco Ltd.
SEC file numbers: 811-05686 and 033-39519 | Invesco Distributors, Inc. | STB-AR-1 |
Shareholder Report for the
Nine Months Ended 2/29/2020
Invesco
High Yield Bond Factor Fund*
Beginning on January 1, 2021, as permitted by regulations adopted by the Securities and Exchange Commission, paper copies of the Fund's shareholder reports will no longer be sent by mail, unless you specifically request paper copies of the reports from the Fund or from your financial intermediary, such as a broker-dealer or bank. Instead, the reports will be made available on the Fund's website, and you will be notified by mail each time a report is posted and provided with a website link to access the report.
If you already elected to receive shareholder reports electronically, you will not be affected by this change and you need not take any action. You may elect to receive shareholder reports and other communications from the Fund electronically by contacting your financial intermediary (such as a broker-dealer or bank) or, if you are a direct investor, by enrolling at invesco. com/edelivery.
You may elect to receive all future reports in paper free of charge. If you invest through a financial intermediary, you can contact your financial intermediary to request that you continue to receive paper copies of your shareholder reports. If you invest directly with the Fund, you can call 800 959 4246 to let the Fund know you wish to continue receiving paper copies of your shareholder reports. Your election to receive reports in paper will apply to all funds held with your financial intermediary or all funds held with the fund complex if you invest directly with the Fund.
*Prior to the close of business on February 28, 2020, the Fund's name was Invesco Oppenheimer Global High Yield Fund and prior to the close of business on May 24, 2019, the Fund's name was Oppenheimer Global High Yield Fund. See Important Update on the following page for more information.
Important Update
On October 18, 2018, Massachusetts Mutual Life Insurance Company, an indirect corporate parent of OppenheimerFunds, Inc. and its subsidiaries OFI Global Asset Management, Inc., OFI SteelPath, Inc. and OFI Advisors, LLC, announced that it had entered into an agreement whereby Invesco Ltd., a global investment management company would acquire OppenheimerFunds and its subsidiaries (together, "OppenheimerFunds"). After the close of business on May 24, 2019 Invesco Ltd. completed the acquisition of OppenheimerFunds. This Fund was included in that acquisition and as of that date, became part of the Invesco family of funds. Please visit invesco.com for more information or call Invesco's Client Services team at 800-959-4246.

Table of Contents | |
Fund Performance Discussion | 5 |
Top Holdings and Allocations | 8 |
Fund Expenses | 12 |
Consolidated Schedule of Investments | 14 |
Consolidated Statement of Assets and Liabilities | 27 |
Consolidated Statement of Operations | 29 |
Consolidated Statement of Changes in Net Assets | 31 |
Consolidated Financial Highlights | 32 |
Notes to Consolidated Financial Statements | 44 |
Report of Independent Registered Public Accounting Firm | 66 |
Tax Information | 68 |
Portfolio Proxy Voting Policies and Guidelines; Updates to | |
Schedule of Investments | 69 |
Trustees and Officers | 70 |
Invesco Privacy Notice | 82 |
Class A Shares
AVERAGE ANNUAL TOTAL RETURNS AT 2/29/20 | | |
| | | |
| Class A Shares of the Fund | Bloomberg Barclays | |
| | | |
| Without Sales Charge | With Sales Charge | U.S. Corporate High | JPMorgan Global High |
| Yield 2% Issuer | Yield Index |
| | |
| | | Capped Index1 | |
1-Year | 5.11% | 0.64% | 6.10% | 6.42% |
5-Year | 3.59 | 2.70 | 5.20 | 5.60 |
Since | | | | |
Inception | 3.45 | 2.74 | 5.23 | 5.38 |
(11/8/13) |
1.Effective February 28, 2020, the Fund changed its benchmark index from the JPMorgan Global High Yield Index to the Bloomberg Barclays U.S. Corporate High Yield 2% Issuer Capped Index. These changes were made in connection with repositioning the Fund as a factor-based high yield bond fund.
Performance quoted is past performance and cannot guarantee future results; current performance may be lower or higher. Visit invesco.com for the most recent month-end performance. Performance figures reflect reinvested distributions and changes in net asset value (NAV). Investment return and principal value will vary so that you may have a gain or a loss when you sell shares. Fund returns include changes in share price, reinvested distributions and a 4.25% maximum applicable sales charge except where "without sales charge" is indicated. Returns for periods of less than one year are cumulative and not annualized. As the result of a
3 INVESCO HIGH YIELD BOND FACTOR FUND
reorganization after the close of business on May 24, 2019, the returns of the Fund for periods on or prior to May 24, 2019 reflect performance of the Oppenheimer predecessor fund. Share class returns will differ from those of the predecessor fund because they have different expenses. Returns do not consider capital gains or income taxes on an individual's investment. See Fund prospectus and summary prospectus for more information on share classes, sales charges and new fee agreements, if any. Fund literature is available at invesco.com.
4 INVESCO HIGH YIELD BOND FACTOR FUND
Fund Performance Discussion
For the fiscal year ended February 29, 2020, high yield bond returns were positive. The fiscal year
began with heightened volatility as investors feared that the US Federal Reserve (the Fed) had gone too far in its monetary policy tightening and that the effects would lead to a synchronized global economic growth slowdown. That uncertainty was quickly alleviated when the Fed changed its course and all but promised no rate hikes in 2019. The renewed risk appetite was further inspired by dovish central banks globally.
This expansionary monetary policy trend continued throughout the fiscal year until February 2020, when investors began to fear that the spread of the COVID-19 virus would lead to a global economic slowdown. Despite the uptick in volatility late in the fiscal year, defaults continued to stay below the long- term average of about 2.91%.1 In particular, the par-weighted high yield default rate
ended the fiscal year at 2.30%.1
The Fed cut interest rates three times during the fiscal year to a range of 1.50% to 1.75% as of October 31, 2019, as well as at the end of the fiscal year.2 The European Central Bank also cuts rates at the end of 2019 at -0.5%.3 This, coupled with easier fiscal and monetary
COMPARISON OF CHANGE IN VALUE OF $10,000 HYPOTHETICAL INVESTMENTS IN:
Invesco High Yield Bond Factor Fund (Class A shares with sales charge) Bloomberg Barclays U.S. Corporate High Yield 2% Issuer Capped Index* JPMorgan Global High Yield Index
$15,000
10,000
5,000
0 | | | | | | | | | | | |
| | | | | | | | | | | | | | | | | | |
11/8/13 | 2/28/14 | 2/28/15 | 2/29/16 | 2/28/17 | 2/28/18 | 2/28/19 | 2/29/20 |
*Effective February 28, 2020, the Fund changed its benchmark index from the JPMorgan Global High Yield Index to the Bloomberg Barclays U.S. Corporate High Yield 2% Issuer Capped Index. These changes were made in connection with repositioning the Fund as a factor-based high yield bond fund.
5 INVESCO HIGH YIELD BOND FACTOR FUND
policy in China and the continued economic woes plaguing the European Union, drove interest rates lower across maturities.
Against this backdrop, the high yield market produced positive monthly returns in ten of the 12 months of the fiscal year. By quality, BB-rated bonds led the way during the fiscal year. By sector, housing and automotive had the strongest returns, while the energy sector had the weakest performance for the fiscal year.
During the fiscal year, the Fund benefited from its positioning in banking and paper sub- industries. The Fund's underweight allocation to energy was also beneficial to relative to the Fund's index performance during the fiscal year.
The largest detractors from the Fund's performance during the fiscal year were positions in technology and media and entertainment. Moreover, security selection in pharmaceuticals was a minor drag on relative to the Fund's index performance.
At the close of the fiscal year, despite the uptick in volatility experienced during this time, we believed solid company fundamentals and low defaults could provide a solid foundation for 2020. We note recent macroeconomic events, namely the coronavirus and the oil price war initiated by Saudi Arabia and Russia, have caused
a material widening in credit spreads. It is unclear when both issues will be resolved, but it is our view that they will both have
a negative effect on second-quarter gross domestic product. That said, we also firmly believe that central banks will provide liquidity in an effort to avoid stressed financial conditions in a macroeconomic environment where company level revenues may suffer
a short-term negative impact. In terms of new issue supply, many companies have already accessed the market to refinance, thereby pushing out maturities. We believe there may be an increase in default activity in challenged sectors like energy, but we also recognize many of the companies have attractive hedges in place through year end 2020, thereby providing good visibility into near term revenues. We expect continued challenges in the wireline and retail industries as fundamental challenges threaten many companies in each sector. Given current uncertainties surrounding company level revenues, we are likely to see companies focus on preserving the strength of their balance sheets, as opposed to deliberately adding new debt. While we remain cautious, it is our opinion that the recent credit spread widening will create investment opportunities that we have not seen during the last few months of the fiscal year.
On February 28, 2020, the Invesco Oppenheimer Global High Yield Fund was repositioned. The Fund was renamed the Invesco High Yield Bond Factor Fund with an investment goal to seek a total return by targeting securities with characteristics that research suggests will have higher returns over a market cycle while using a factor- based strategy. In practice, this means the
6 INVESCO HIGH YIELD BOND FACTOR FUND
Fund will have higher allocation than its benchmark to value bonds (bonds that have higher spreads relative to other securities of similar credit quality and sector); low volatility bonds (bonds that have lower levels of price volatility); and high carry bonds (bonds with higher spreads relative to the broad market). The Fund will invest primarily in high-yield, below-investment grade, fixed-income securities (also referred to as "junk" bonds).
1. Source: JP Morgan
2. Source: US Federal Reserve
3. Source: European Central Bank
Portfolio Managers: Jay Raol, James Ong, Noelle Corum and Sash Sarangi
7 INVESCO HIGH YIELD BOND FACTOR FUND
Top Holdings and Allocations
PORTFOLIO ALLOCATION
Non-Convertible Corporate Bonds | 89.8% |
and Notes |
Investment Companies | 7.5 |
Foreign Government Obligations | 1.8 |
Asset-Backed Securities | 0.8 |
Corporate Loans | 0.1 |
Common Stocks | —* |
Preferred Stocks | —* |
* Represents a value of less than 0.05%.
Portfolio holdings and allocations are subject to change. Percentages are as of February 29, 2020, and are based on the total market value of investments.
For more current Fund holdings, please visit invesco.com.
TOP TEN GEOGRAPHICAL HOLDINGS
United States | 57.9% |
Brazil | 6.0 |
Mexico | 5.7 |
Canada | 4.4 |
Netherlands | 2.5 |
Ukraine | 2.2 |
Ireland | 2.0 |
China | 1.7 |
Luxembourg | 1.6 |
Portugal | 1.5 |
Portfolio holdings and allocations are subject to change. Percentages are as of February 29, 2020, and are based on total market value of investments.
8 INVESCO HIGH YIELD BOND FACTOR FUND

REGIONAL ALLOCATION
U.S./Canada | 62.3% |
Latin & South America | 14.0 |
Europe | 12.1 |
Asia/Pacific | 5.3 |
Middle East/Africa | 4.1 |
Emerging Europe | 2.2 |
Portfolio holdings and allocation are subject to change. Percentages are as of February 29, 2020, and are based on total market value of investments.
| NRSRO |
| ONLY |
CREDIT RATING BREAKDOWN | TOTAL |
BBB | 4.9% |
BB | 37.8 |
B | 42.4 |
CCC | 10.8 |
CC | 0.1 |
D | 0.4 |
Unrated | 3.6 |
Total | 100.0% |
The percentages above are based on the market value of the Fund's securities as of February 29, 2020 and are subject to change. Except for securities labeled "Unrated," all securities have been rated by at least one Nationally Recognized Statistical Rating Organization ("NRSRO"), such as Standard & Poor's ("S&P"). For securities rated only by an NRSRO other than S&P, Invesco Advisers, Inc. (the "Adviser") converts that rating to the equivalent S&P rating. If two or more NRSROs have assigned a rating to a security, the highest S&P equivalent rating is used. For securities not rated by an NRSRO, the Adviser uses its own credit analysis to assign ratings in categories similar to those of S&P. The use of similar categories is not an indication that the Adviser's credit analysis process is consistent or comparable with any NRSRO's process were that NRSRO to rate the same security. Fund assets invested in Invesco Government & Agency Portfolio are assigned that fund's S&P rating, which is currently AAA. For the purposes of this table, "investment-grade" securities are securities rated within the NRSROs' four highest rating categories (AAA, AA, A and BBB). Unrated securities do not necessarily indicate low credit quality and may or may not be the equivalent of investment-grade. Please consult the Fund's prospectus and Statement of Additional Information for further information.
9 INVESCO HIGH YIELD BOND FACTOR FUND
Share Class Performance
AVERAGE ANNUAL TOTAL RETURNS WITHOUT SALES CHARGE AS OF 2/29/20
| | Inception | | | Since |
| | Date | 1-Year | 5-Year | Inception |
Class A (OGYAX) | 11/8/13 | 5.11% | 3.59% | 3.45% |
Class C (OGYCX) | 11/8/13 | 4.26 | 2.85 | 2.72 |
Class R (OGYNX) | 11/8/13 | 4.85 | 3.34 | 3.20 |
Class Y (OGYYX) | 11/8/13 | 5.42 | 3.90 | 3.76 |
Class R5 | (GBHYX)1 | 5/24/19 | 5.29 | 3.62 | 3.47 |
Class R6 | (OGYIX)2 | 11/8/13 | 5.35 | 3.95 | 3.80 |
AVERAGE ANNUAL TOTAL RETURNS WITH SALES CHARGE AS OF 2/29/20 |
| | | | | |
| | Inception | | | Since |
| | Date | 1-Year | 5-Year | Inception |
Class A (OGYAX) | 11/8/13 | 0.64% | 2.70% | 2.74% |
Class C (OGYCX) | 11/8/13 | 3.26 | 2.85 | 2.72 |
Class R (OGYNX) | 11/8/13 | 4.85 | 3.34 | 3.20 |
Class Y (OGYYX) | 11/8/13 | 5.42 | 3.90 | 3.76 |
Class R5 | (GBHYX)1 | 5/24/19 | 5.29 | 3.62 | 3.47 |
Class R6 | (OGYIX)2 | 11/8/13 | 5.35 | 3.95 | 3.80 |
1.Class R5 shares' performance shown prior to the inception date is that of the predecessor fund's Class A shares at net asset value (NAV) and includes the 12b-1 fees applicable to Class A shares. Class A shares' performance reflects any applicable fee waivers and/or expense reimbursements.
2.Pursuant to the closing of the transaction described in the Notes to Consolidated Financial Statements, after the close of business on May 24, 2019, Class I shares were reorganized as Class R6 shares.
Performance quoted is past performance and cannot guarantee future results; current performance may be lower or higher. Visit invesco.com for the most recent month-end performance. Performance figures reflect reinvested distributions and changes in net asset value (NAV). Investment return and principal value will vary so that you may have a gain or a loss when you sell shares. Performance shown at NAV does not include the applicable front-end sales charge, which would have reduced the performance. The current maximum initial sales charge for Class A shares is 4.25%, and the contingent deferred sales charge for Class C shares is 1% for the 1-year period. Class R, Class Y, Class R5 and Class R6 shares have no sales charge; therefore, performance is at NAV. Effective after the close of business on May 24, 2019, Class A, Class C, Class I, Class R and Class Y shares of the predecessor fund were reorganized into Class A, Class C, Class R6, Class R and Class Y respectively, of the Fund. Class R5 shares' performance shown prior to the inception date is that of the predecessor fund's Class A shares at NAV and includes the 12b-1 fees applicable to Class A shares. Class A shares' performance reflects any applicable fee waivers and/or expense reimbursements. Returns shown for Class A, Class C, Class R, Class Y, Class R5, and Class R6 shares are blended returns of the predecessor fund and the Fund. Share class returns will differ from those of the predecessor fund because of different expenses. See Fund prospectuses and summary prospectuses for more information on share classes, sales charges and new fee agreements, if any. Fund literature is available at invesco.com.
10 INVESCO HIGH YIELD BOND FACTOR FUND
The Fund's performance is compared to the performance of the JPMorgan Global High Yield Index, which is designed to mirror the investable universe of the U.S. dollar global high yield corporate debt market, including domestic and international issues. Effective February 28, 2020, the Fund's new index is the Bloomberg Barclays benchmark because it more closely reflects the performance of the types of securities in which the Fund invests following its repositioning as a factor-based high yield bond fund. The Bloomberg Barclays U.S. Corporate High Yield 2% Issuer Capped Index is an unmanaged index representative of the US high- yield, fixed-rate corporate bond market. Index weights for each issuer are capped at 2%. The Index is unmanaged and cannot be purchased directly by investors. While index comparisons may be useful to provide a benchmark for the Fund's performance, it must be noted that the Fund's investments are not limited to the investments comprising the Index. Index performance includes reinvestment of income, but does not reflect transaction costs, fees, expenses or taxes. Index performance is shown for illustrative purposes only as a benchmark for the Fund's performance and does not predict or depict performance of the Fund. The Fund's performance reflects the effects of the Fund's business and operating expenses.
The views and opinions expressed in management's discussion of Fund performance are those of Invesco Advisers, Inc. These views and opinions are subject to change at any time based on factors such as market and economic conditions. These views and opinions may not be relied upon as investment advice or recommendations, or as an offer for a particular security. The information is not a complete analysis of every aspect of any market, country, industry, security or the Fund. Statements of fact are from sources considered reliable, but Invesco Advisers, Inc. makes no representation or warranty as to their completeness or accuracy. Although historical performance is no guarantee of future results, these insights may help you understand our investment management philosophy.
Before investing, investors should carefully read the prospectus and/or summary prospectus and carefully consider the investment objectives, risks, charges and expenses. For this and more complete information about the fund(s), investors should ask their advisors for a prospectus/summary prospectus or visit invesco. com/fundprospectus.
Shares of Invesco funds are not deposits or obligations of any bank, are not guaranteed by any bank, are not insured by the FDIC or any other agency, and involve investment risks, including the possible loss of the principal amount invested.
11 INVESCO HIGH YIELD BOND FACTOR FUND
Fund Expenses
Fund Expenses. As a shareholder of the Fund, you incur two types of costs: (1) transaction costs, which may include sales charges (loads) on purchase payments and/or contingent deferred sales charges on redemptions; and (2) ongoing costs, including management fees; distribution and service fees; and other Fund expenses. These examples are intended to help you understand your ongoing costs (in dollars) of investing in the Fund and to compare these costs with the ongoing costs of investing in other mutual funds.
The examples are based on an investment of $1,000.00 invested at the beginning of the period and held for the entire 6-month period ended February 29, 2020.
Actual Expenses. The first section of the table provides information about actual account values and actual expenses. You may use the information in this section for the class of shares you hold, together with the amount you invested, to estimate the expense that you paid over the period. Simply divide your account value by $1,000.00 (for example, an $8,600.00 account value divided by $1,000.00 = 8.60), then multiply the result by the number in the first section under the heading entitled "Expenses Paid During 6 Months Ended February 29, 2020" to estimate the expenses you paid on your account during this period.
Hypothetical Example for Comparison Purposes. The second section of the table provides information about hypothetical account values and hypothetical expenses based on the Fund's actual expense ratio for each class of shares, and an assumed rate of return of 5% per year for each class before expenses, which is not the Fund's actual return. The hypothetical account values and expenses may not be used to estimate the actual ending account balance or expenses you paid for the period. You may use this information to compare the ongoing costs of investing in the Fund and other funds. To do so, compare this 5% hypothetical example for the class of shares you hold with the 5% hypothetical examples that appear in the shareholder reports of the other funds.
Please note that the expenses shown in the table are meant to highlight your ongoing costs only and do not reflect any transactional costs, such as front-end or contingent deferred sales charges (loads). Therefore, the "hypothetical" section of the table is useful in comparing ongoing costs only, and will not help you determine the relative total costs of owning different funds. In addition, if these transactional costs were included, your costs would have been higher.
12 INVESCO HIGH YIELD BOND FACTOR FUND
| Beginning | Ending | Expenses |
| Account | Account | Paid During |
| Value | Value | 6 Months Ended |
Actual | September 1, 2019 | February 29, 2020 | February 29, 2020 |
Class A | $ 1,000.00 | $ 1,015.50 | $ | 5.73 |
Class C | 1,000.00 | 1,012.00 | | 9.30 |
Class R | 1,000.00 | 1,014.20 | | 6.93 |
Class Y | 1,000.00 | 1,017.00 | | 4.37 |
Class R5 | 1,000.00 | 1,017.10 | | 4.32 |
Class R6 | 1,000.00 | 1,016.20 | | 4.17 |
Hypothetical | | | | |
(5% return before expenses) | | | | |
Class A | 1,000.00 | 1,019.19 | | 5.74 |
Class C | 1,000.00 | 1,015.66 | | 9.31 |
Class R | 1,000.00 | 1,018.00 | | 6.95 |
Class Y | 1,000.00 | 1,020.54 | | 4.38 |
Class R5 | 1,000.00 | 1,020.59 | | 4.33 |
Class R6 | 1,000.00 | 1,020.74 | | 4.18 |
Expenses are equal to the Fund's annualized expense ratio for that class, multiplied by the average account value over the period, multiplied by 182/366 (to reflect the one-half year period). Those annualized expense ratios, excluding indirect expenses from affiliated funds, based on the 6-month period ended February 29, 2020 are as follows:
Class | Expense Ratios |
Class A | 1.14% |
Class C | 1.85 |
Class R | 1.38 |
| |
Class Y | 0.87 |
Class R5 | 0.86 |
Class R6 | 0.83 |
The expense ratios reflect voluntary and/or contractual waivers and/or reimbursements of expenses by the Fund's Adviser. Some of these undertakings may be modified or terminated at any time, as indicated in the Fund's prospectus. The "Consolidated Financial Highlights" tables in the Fund's financial statements, included in this report, also show the gross expense ratios, without such waivers or reimbursements and reduction to custodian expenses, if applicable.
13 INVESCO HIGH YIELD BOND FACTOR FUND

CONSOLIDATED
SCHEDULE OF INVESTMENTS February 29, 2020
| | Principal Amount | | Value |
Asset-Backed Security—0.8% | | | | |
Madison Park Funding XI Ltd., Series 2013-11A, Cl. DR, | | | | |
5.18% [US0003M+325], 7/23/291,2 (Cost $244,425) | $ | 250,000 | $ | 249,684 |
| | | | |
Foreign Government Obligations—1.8% | | | | |
Argentine Republic, 6.875% Sr. Unsec. Nts., 1/26/27 | | 300,000 | | 129,422 |
Ghana Government International Bond, 7.875% Sr. Unsec. | | | | |
Nts., 2/11/351 | | 280,000 | | 277,340 |
Ukraine, 7.75% Sr. Unsec. Nts., 9/1/201 | | 205,000 | | 208,853 |
Total Foreign Government Obligations (Cost $661,151) | | | | 615,615 |
| | | | |
Corporate Loans—0.1% | | | | |
Claire's Stores, Inc., Sr. Sec., Term B, 8.421% [US0001M + | | | | |
650] 12/18/263,4 | | 12,581 | | 12,135 |
Murray Energy Corp., Sr. Sec. Credit Facilities 1st Lien Term | | | | |
Loan, Tranche B2, 9.354% [LIBOR4 + 725], 10/17/223,4,5 | | 138,002 | | 24,298 |
Total Corporate Loans (Cost $142,997) | | | | 36,433 |
| | | | |
Corporate Bonds and Notes—91.4% | | | | |
Consumer Discretionary—19.4% | | | | |
Auto Components—0.8% | | | | |
Dana, Inc., 5.375% Sr. Unsec. Nts., 11/15/27 | | 50,000 | | 50,625 |
Loxam SAS, 5.75% Sr. Sub. Nts., 7/15/271 | EUR | 215,000 | | 229,106 |
| | | | 279,731 |
| | | | |
Automobiles—0.6% | | | | |
JB Poindexter & Co., Inc., 7.125% Sr. Unsec. Nts., 4/15/261 | | 185,000 | | 195,805 |
| | | | |
Distributors—0.5% | | | | |
Core & Main Holdings LP, 9.375% PIK Rate, 8.625% Cash | | | | |
Rate, 8.625% Sr. Unsec. Nts., 9/15/241,6 | | 165,000 | | 171,669 |
| | | | |
Entertainment—1.2% | | | | |
AMC Entertainment Holdings, Inc., 6.125% Sr. Sub. Nts., | | | | |
5/15/27 | | 185,000 | | 148,467 |
Netflix, Inc., 3.625% Sr. Unsec. Nts., 5/15/27 | EUR | 125,000 | | 145,612 |
WMG Acquisition Corp., 3.625% Sr. Sec. Nts., 10/15/261 | EUR | 100,000 | | 115,265 |
| | | | 409,344 |
| | | | |
Hotels, Restaurants & Leisure—4.6% | | | | |
Boyd Gaming Corp., 6.375% Sr. Unsec. Nts., 4/1/26 | | 160,000 | | 167,096 |
CEC Entertainment, Inc., 8.00% Sr. Unsec. Nts., 2/15/22 | | 40,000 | | 38,912 |
Downstream Development Authority of the Quapaw Tribe of | | | | |
Oklahoma, 10.50% Sr. Sec. Nts., 2/15/231 | | 90,000 | | 91,162 |
ESH Hospitality, Inc., 4.625% Sr. Unsec. Nts., 10/1/271 | | 140,000 | | 136,759 |
Golden Nugget, Inc., 8.75% Sr. Sub. Nts., 10/1/251 | | 95,000 | | 95,637 |
Melco Resorts Finance Ltd., 5.625% Sr. Unsec. Nts., 7/17/271 | | 235,000 | | 246,344 |
MGM Resorts International: | | | | |
6.00% Sr. Unsec. Nts., 3/15/23 | | 125,000 | | 134,792 |
14 INVESCO HIGH YIELD BOND FACTOR FUND
| | | Principal Amount | | | Value |
Hotels, Restaurants & Leisure (Continued) | | | | | | |
MGM Resorts International: (Continued) | | | | | | |
7.75% Sr. Unsec. Nts., 3/15/22 | | $ | 115,000 | $ | 126,130 |
Penn National Gaming, Inc., 5.625% Sr. Unsec. Nts., 1/15/271 | | | 215,000 | | | 223,137 |
Scientific Games International, Inc.: | | | | | | |
6.625% Sr. Sub. Nts., 5/15/21 | | | 65,000 | | | 65,107 |
8.25% Sr. Unsec. Nts., 3/15/261 | | | 65,000 | | | 67,234 |
Yum! Brands, Inc.: | | | | | | |
3.875% Sr. Unsec. Nts., 11/1/23 | | | 70,000 | | | 72,022 |
4.75% Sr. Unsec. Nts., 1/15/301 | | | 60,000 | | | 62,368 |
| | | | | | 1,526,700 |
| | | | | | |
Household Durables—2.1% | | | | | | |
Beazer Homes USA, Inc., 6.75% Sr. Unsec. Nts., 3/15/25 | | | 70,000 | | | 71,779 |
Lennar Corp., 4.75% Sr. Unsec. Nts., 11/15/22 | | | 303,000 | | | 317,611 |
Mattamy Group Corp., 5.25% Sr. Unsec. Nts., 12/15/271 | | | 52,000 | | | 53,950 |
Taylor Morrison Communities, Inc.: | | | | | | |
5.875% Sr. Unsec. Nts., 1/31/251 | | | 49,000 | | | 50,378 |
5.875% Sr. Unsec. Nts., 6/15/271 | | | 130,000 | | | 145,902 |
6.00% Sr. Unsec. Nts., 9/1/231 | | | 45,000 | | | 46,622 |
| | | | | | 686,242 |
| | | | | | |
Interactive Media & Services—0.6% | | | | | | |
Diamond Sports Group LLC/Diamond Sports Finance Co.: | | | | | | |
5.375% Sr. Sec. Nts., 8/15/261 | | | 110,000 | | | 101,628 |
6.625% Sr. Unsec. Nts., 8/15/271 | | | 135,000 | | | 109,600 |
| | | | | | 211,228 |
| | | | | | |
Media—6.0% | | | | | | |
Affinion Group, Inc., 14% PIK Rate, 12.5% Cash Rate, | | | | | | |
12.50% Sr. Unsec. Nts., 11/10/221,6 | | | 54,312 | | | 32,587 |
Altice Financing SA, 7.50% Sr. Sec. Nts., 5/15/261 | | | 265,000 | | | 279,416 |
Cablevision Systems Corp., 5.875% Sr. Unsec. Nts., 9/15/22 | | | 135,000 | | | 142,010 |
CCO Holdings LLC/CCO Holdings Capital Corp., 5.75% Sr. | | | | | | |
Unsec. Nts., 2/15/261 | | | 175,000 | | | 182,271 |
Clear Channel Worldwide Holdings, Inc., 9.25% Sr. Sub. Nts., | | | | | | |
2/15/241 | | | 135,000 | | | 143,719 |
CSC Holdings LLC, 6.50% Sr. Unsec. Nts., 2/1/291 | | | 225,000 | | | 248,203 |
DISH DBS Corp.: | | | | | | |
5.875% Sr. Unsec. Nts., 11/15/24 | | | 40,000 | | | 41,113 |
7.75% Sr. Unsec. Nts., 7/1/26 | | | 220,000 | | | 236,810 |
Hughes Satellite Systems Corp., 7.625% Sr. Unsec. Nts., | | | | | | |
6/15/21 | | | 125,000 | | | 131,860 |
iHeartCommunications, Inc.: | | | | | | |
5.25% Sr. Sec. Nts., 8/15/271 | | | 125,000 | | | 129,144 |
8.375% Sr. Unsec. Nts., 5/1/27 | | | 64,671 | | | 70,349 |
IPD 3 BV, 4.50% [EUR003M+450] Sr. Sec. Nts., 7/15/221,2 | EUR | | 170,000 | | | 188,537 |
Lamar Media Corp., 5.75% Sr. Unsec. Nts., 2/1/26 | | | 110,000 | | | 114,609 |
15 INVESCO HIGH YIELD BOND FACTOR FUND
CONSOLIDATED
SCHEDULE OF INVESTMENTS Continued
| | Principal Amount | | | Value |
Media (Continued) | | | | | |
Telenet Finance Luxembourg Notes Sarl, 5.50% Sr. Sec. Nts., | | | | | |
3/1/281 | $ | 70,000 | $ | 74,270 |
| | | | | 2,014,898 |
| | | | | |
Specialty Retail—2.6% | | | | | |
Capitol Investment Merger Sub 2 LLC, 10.00% Sec. Nts., | | | | | |
8/1/241 | | 135,000 | | | 135,731 |
Hillman Group, Inc. (The), 6.375% Sr. Unsec. Nts., 7/15/221 | | 70,000 | | | 62,978 |
Lithia Motors, Inc., 5.25% Sr. Unsec. Nts., 8/1/251 | | 135,000 | | | 141,131 |
Michaels Stores, Inc., 8.00% Sr. Unsec. Nts., 7/15/271 | | 170,000 | | | 142,026 |
PetSmart, Inc.: | | | | | |
5.875% Sr. Sec. Nts., 6/1/251 | | 111,000 | | | 111,977 |
8.875% Sr. Unsec. Nts., 6/1/251 | | 140,000 | | | 139,650 |
Tendam Brands SAU, 5.25% [EUR003M+525] Sr. Sec. Nts., | | | | | |
9/15/241,2 | EUR | 140,000 | | | 152,140 |
| | | | | 885,633 |
| | | | | |
Textiles, Apparel & Luxury Goods—0.4% | | | | | |
Eagle Intermediate Global Holding BV/Ruyi US Finance LLC, | | | | | |
7.50% Sr. Sec. Nts., 5/1/251 | | 175,000 | | | 123,010 |
| | | | | |
Consumer Staples—5.3% | | | | | |
Beverages—0.9% | | | | | |
Darling Global Finance BV, 3.625% Sr. Unsec. Nts., 5/15/261 | EUR | 170,000 | | | 195,394 |
Sunshine Mid BV, 6.50% Sr. Sec. Nts., 5/15/261 | EUR | 100,000 | | | 109,152 |
| | | | | 304,546 |
| | | | | |
Food & Staples Retailing—0.7% | | | | | |
Albertsons Cos., Inc./Safeway, Inc./New Albertsons LP/Albertson's LLC: | | | | |
4.625% Sr. Unsec. Nts., 1/15/271 | | 73,000 | | | 72,040 |
6.625% Sr. Unsec. Nts., 6/15/24 | | 145,000 | | | 149,349 |
| | | | | 221,389 |
| | | | | |
Food Products—2.2% | | | | | |
Albertsons Cos., Inc./Safeway, Inc./New Albertsons LP/ | | | | | |
Albertson's LLC, 5.875% Sr. Unsec. Nts., 2/15/281 | | 80,000 | | | 83,292 |
JBS USA LUX SA/JBS USA Food Co./JBS USA Finance, Inc., | | | | | |
5.50% Sr. Unsec. Nts., 1/15/301 | | 130,000 | | | 137,431 |
Pilgrim's Pride Corp., 5.875% Sr. Unsec. Nts., 9/30/271 | | 140,000 | | | 145,341 |
Post Holdings, Inc.: | | | | | |
4.625% Sr. Unsec. Nts., 4/15/301 | | 60,000 | | | 59,285 |
5.00% Sr. Unsec. Nts., 8/15/261 | | 115,000 | | | 117,513 |
5.625% Sr. Unsec. Nts., 1/15/281 | | 101,000 | | | 105,753 |
Simmons Foods, Inc., 7.75% Sr. Sec. Nts., 1/15/241 | | 65,000 | | | 69,089 |
| | | | | 717,704 |
| | | | | |
Household Products—0.6% | | | | | |
Energizer Holdings, Inc., 5.50% Sr. Unsec. Nts., 6/15/251 | | 70,000 | | | 71,182 |
16 INVESCO HIGH YIELD BOND FACTOR FUND
| | | Principal Amount | | | Value |
Household Products (Continued) | | | | | | |
Spectrum Brands, Inc., 5.75% Sr. Unsec. Nts., 7/15/25 | $ | 140,000 | $ | 143,849 |
| | | | | | 215,031 |
| | | | | | |
Personal Products—0.2% | | | | | | |
Edgewell Personal Care Co., 4.70% Sr. Unsec. Nts., 5/24/22 | | 65,000 | | | 66,714 |
| | | | | | |
Tobacco—0.7% | | | | | | |
Vector Group Ltd., 6.125% Sr. Sec. Nts., 2/1/25 | | 243,000 | | | 233,885 |
| | | | | | |
Energy—12.0% | | | | | | |
Energy Equipment & Services—1.5% | | | | | | |
ADES International Holding plc, 8.625% Sr. Sec. Nts., | | | | | |
4/24/241 | | | 350,000 | | | 360,500 |
Basic Energy Services, Inc., 10.75% Sr. Sec. Nts., 10/15/231 | | 25,000 | | | 16,125 |
Calfrac Holdings LP, 10.875% Sec. Nts., 3/15/261 | | 15,950 | | | 14,435 |
Diamond Offshore Drilling, Inc., 4.875% Sr. Unsec. Nts., | | | | | |
11/1/43 | | | 25,000 | | | 10,164 |
Ensign Drilling, Inc., 9.25% Sr. Unsec. Nts., 4/15/241 | | 70,000 | | | 63,088 |
SESI LLC, 7.75% Sr. Unsec. Nts., 9/15/24 | | | 50,000 | | | 24,271 |
Transocean, Inc., 7.50% Sr. Unsec. Nts., 4/15/31 | | 20,000 | | | 11,951 |
| | | | | | 500,534 |
| | | | | |
Oil, Gas & Consumable Fuels—10.5% | | | | | |
Antero Midstream Partners LP/Antero Midstream Finance | | | | | |
Corp., 5.375% Sr. Unsec. Nts., 9/15/24 | | | 155,000 | | | 117,412 |
Ascent Resources Utica Holdings LLC/ARU Finance Corp., | | | | | |
10.00% Sr. Unsec. Nts., 4/1/221 | | | 88,000 | | | 75,215 |
Calfrac Holdings LP, 8.50% Sr. Unsec. Nts., 6/15/261 | | 31,000 | | | 8,293 |
California Resources Corp., 8.00% Sec. Nts., 12/15/221 | | 32,000 | | | 7,440 |
Calumet Specialty Products Partners LP/Calumet Finance | | | | | |
Corp., 7.625% Sr. Unsec. Nts., 1/15/22 | | | 200,000 | | | 198,378 |
Centennial Resource Production LLC, 6.875% Sr. Unsec. Nts., | | | | | |
4/1/271 | | | 80,000 | | | 71,786 |
Comstock Resources, Inc., 9.75% Sr. Unsec. Nts., 8/15/26 | | 15,000 | | | 12,598 |
Cosan Luxembourg SA, 7.00% Sr. Unsec. Nts., 1/20/271 | | 200,000 | | | 214,070 |
Denbury Resources, Inc.: | | | | | | |
9.00% Sec. Nts., 5/15/211 | | | 35,000 | | | 30,704 |
9.25% Sec. Nts., 3/31/221 | | | 60,000 | | | 48,169 |
Energy Transfer Operating LP, 5.875% Sr. Unsec. Nts., 1/15/24 | | 140,000 | | | 157,032 |
EP Energy LLC/Everest Acquisition Finance, Inc., 8.00% Sr. | | | | | |
Sec. Nts., 11/29/241 | | | 135,000 | | | 57,375 |
Geopark Ltd., 5.50% Sr. Unsec. Nts., 1/17/271 | | 200,000 | | | 188,252 |
Gulfport Energy Corp., 6.375% Sr. Unsec. Nts., 5/15/25 | | 135,000 | | | 43,256 |
HighPoint Operating Corp., 8.75% Sr. Unsec. Nts., 6/15/25 | | 16,000 | | | 13,520 |
Hilcorp Energy I LP/Hilcorp Finance Co., 6.25% Sr. Unsec. | | | | | |
Nts., 11/1/28 | | | 325,000 | | | 237,369 |
Holly Energy Partners LP/Holly Energy Finance Corp., 5.00% | | | | | |
Sr. Unsec. Nts., 2/1/281 | | | 28,000 | | | 28,227 |
Murphy Oil USA, Inc., 4.75% Sr. Unsec. Nts., 9/15/29 | | 84,000 | | | 88,255 |
17 | INVESCO HIGH YIELD BOND FACTOR FUND | | | |
CONSOLIDATED
SCHEDULE OF INVESTMENTS Continued
| | | Principal Amount | | | Value |
Oil, Gas & Consumable Fuels (Continued) | | | | | | |
Murray Energy Corp., 3% PIK Rate, 9% Cash Rate, 12.00% | | | | | | |
Sec. Nts., 4/15/241,5,6 | | $ | 130,760 | $ | 165 |
NAK Naftogaz Ukraine via Kondor Finance plc, 7.625% Sr. | | | | | | |
Unsec. Nts., 11/8/261 | | | 200,000 | | | 210,830 |
Oasis Petroleum, Inc., 6.875% Sr. Unsec. Nts., 3/15/22 | | | 55,000 | | | 43,312 |
Parkland Fuel Corp., 6.00% Sr. Unsec. Nts., 4/1/261 | | | 195,000 | | | 204,136 |
Petrobras Global Finance BV: | | | | | | |
7.25% Sr. Unsec. Nts., 3/17/44 | | | 85,000 | | | 105,156 |
8.375% Sr. Unsec. Nts., 5/23/21 | | | 370,000 | | | 395,863 |
Petroleos Mexicanos, 5.95% Sr. Unsec. Nts., 1/28/311 | | | 385,000 | | | 377,300 |
Puma International Financing SA, 5.00% Sr. Unsec. Nts., | | | | | | |
1/24/261 | | | 200,000 | | | 187,202 |
QEP Resources, Inc., 5.625% Sr. Unsec. Nts., 3/1/26 | | | 65,000 | | | 52,164 |
Range Resources Corp., 5.875% Sr. Unsec. Nts., 7/1/22 | | | 110,000 | | | 94,016 |
SM Energy Co., 6.625% Sr. Unsec. Nts., 1/15/27 | | | 45,000 | | | 34,980 |
Southwestern Energy Co., 7.75% Sr. Unsec. Nts., 10/1/27 | | | 40,000 | | | 30,401 |
Targa Resources Partners LP/Targa Resources Partners Finance | | | | | | |
Corp., 5.875% Sr. Unsec. Nts., 4/15/26 | | | 125,000 | | | 128,997 |
Whiting Petroleum Corp.: | | | | | | |
6.25% Sr. Unsec. Nts., 4/1/23 | | | 60,000 | | | 27,150 |
6.625% Sr. Unsec. Nts., 1/15/26 | | | 80,000 | | | 29,402 |
| | | | | | 3,518,425 |
| | | | | | |
Financials—14.7% | | | | | | |
Capital Markets—1.1% | | | | | | |
RegionalCare Hospital Partners Holdings, Inc., 8.25% Sr. Sec. | | | | | | |
Nts., 5/1/231 | | | 140,000 | | | 146,512 |
UBS Group AG, 5.75% [EUSA5+528.7] Jr. Sub. Perpetual | | | | | | |
Bonds1,2,7 | EUR | | 200,000 | | | 236,509 |
| | | | | | 383,021 |
| | | | | | |
Commercial Banks—4.5% | | | | | | |
Australia & New Zealand Banking Group Ltd. (United | | | | | | |
Kingdom), 6.75% [USISDA05+516.8] Jr. Sub. Perpetual | | | | | | |
Bonds1,2,7 | | | 40,000 | | | 45,183 |
Banco Comercial Portugues SA, 9.25% [EUSA5+941.4] Jr. | | | | | | |
Sub. Perpetual Bonds1,2,7 | EUR | | 200,000 | | | 243,776 |
Banco do Brasil SA (Cayman), 5.875% Sub. Nts., 1/26/221 | | | 260,000 | | | 272,163 |
Banco Mercantil del Norte SA (Grand Cayman), 7.50% | | | | | | |
[H15T10Y+547] Jr. Sub. Perpetual Bonds1,2,7 | | | 160,000 | | | 181,002 |
BBVA Bancomer SA, 6.75% Sub. Nts., 9/30/221 | | | 245,000 | | | 265,894 |
Ibercaja Banco SA, 5.00% [EUSA5+455.1] Sub. Nts., | | | | | | |
7/28/251,2 | EUR | | 200,000 | | | 224,302 |
Itau Unibanco Holding SA (Cayman Island), 5.65% Sub. Nts., | | | | | | |
3/19/221 | | | 255,000 | | | 266,036 |
| | | | | | 1,498,356 |
18 INVESCO HIGH YIELD BOND FACTOR FUND
| | | | Principal Amount | | | Value |
Consumer Finance—0.3% | | | | | | | |
Ally Financial, Inc., 4.125% Sr. Unsec. Nts., 3/30/20 | | $ | 110,000 | $ | 110,331 |
| | | | | | | |
Diversified Financial Services—5.6% | | | | | | | |
Alpha Holding SA de CV, 9.00% Sr. Unsec. Nts., 2/10/251 | | | 710,000 | | | 711,775 |
Caixa Geral de Depositos SA, 10.75% [EUSA5+1092.5] Jr. | | | | | | |
Sub. Perpetual Bonds1,2,7 | | EUR | | 200,000 | | | 255,726 |
eG Global Finance plc, 4.375% Sr. Sec. Nts., 2/7/251 | EUR | | 190,000 | | | 195,813 |
Greenko Mauritius Ltd., 6.25% Sr. Unsec. Nts., 2/21/231 | | | 250,000 | | | 257,746 |
LPL Holdings, Inc., 5.75% Sr. Unsec. Nts., 9/15/251 | | | 100,000 | | | 103,999 |
Operadora de Servicios Mega S.A. de CV Sofom ER, 8.25% Sr. | | | | | | |
Unsec. Nts., 2/11/251 | | | | 200,000 | | | 202,750 |
Tempo Acquisition LLC/Tempo Acquisition Finance Corp., | | | | | | |
6.75% Sr. Unsec. Nts., 6/1/251 | | | | 140,000 | | | 139,693 |
| | | | | | | 1,867,502 |
| | | | | | |
Real Estate Investment Trusts (REITs)—1.5% | | | | | | |
CoreCivic, Inc., 4.625% Sr. Unsec. Nts., 5/1/23 | | | 192,000 | | | 192,902 |
Equinix, Inc., 2.875% Sr. Unsec. Nts., 10/1/25 | EUR | | 200,000 | | | 226,346 |
VICI Properties LP/VICI Note Co., Inc.: | | | | | | | |
3.50% Sr. Unsec. Nts., 2/15/251 | | | | 27,000 | | | 27,093 |
3.75% Sr. Unsec. Nts., 2/15/271 | | | | 27,000 | | | 26,848 |
4.125% Sr. Unsec. Nts., 8/15/301 | | | | 27,000 | | | 27,084 |
| | | | | | | 500,273 |
| | | | | | |
Real Estate Management & Development—1.7% | | | | | | |
Agile Group Holdings Ltd., 9.00% Sr. Sec. Nts., 5/21/201 | | | 150,000 | | | 152,255 |
ATF Netherlands BV, 3.75% [EUSA5+437.5] Jr. Sub. Perpetual | | | | | | |
Bonds1,2,7 | | EUR | | 100,000 | | | 116,490 |
Times China Holdings Ltd., 7.85% Sr. Sec. Nts., 6/4/211 | | | 300,000 | | | 305,818 |
| | | | | | | 574,563 |
| | | | | | | |
Health Care—5.5% | | | | | | | |
Health Care Providers & Services—3.9% | | | | | | |
CHS/Community Health Systems, Inc., 8.00% Sr. Sec. Nts., | | | | | | |
3/15/261 | | | | 85,000 | | | 87,939 |
Envision Healthcare Corp., 8.75% Sr. Unsec. Nts., 10/15/261 | | | 90,000 | | | 47,894 |
HCA, Inc.: | | | | | | | |
5.50% Sr. Sec. Nts., 6/15/47 | | | | 65,000 | | | 77,378 |
5.875% Sr. Unsec. Nts., 2/15/26 | | | | 65,000 | | | 73,497 |
7.50% Sr. Unsec. Nts., 2/15/22 | | | | 250,000 | | | 276,745 |
MEDNAX, Inc., 6.25% Sr. Unsec. Nts., 1/15/27 | | | 186,000 | | | 179,020 |
MPH Acquisition Holdings LLC, 7.125% Sr. Unsec. Nts., | | | | | | |
6/1/241 | | | | 75,000 | | | 69,953 |
Omnicare, Inc., 4.75% Sr. Unsec. Nts., 12/1/22 | | | 30,000 | | | 32,201 |
Polaris Intermediate Corp., 9.25% PIK Rate, 8.50% Cash | | | | | | |
Rate, 8.50% Sr. Unsec. Nts., 12/1/221,6 | | | | 75,000 | | | 63,945 |
Surgery Center Holdings, Inc., 10.00% Sr. Unsec. Nts., | | | | | | |
4/15/271 | | | | 100,000 | | | 109,535 |
19 | INVESCO HIGH YIELD BOND FACTOR FUND | | | |
CONSOLIDATED
SCHEDULE OF INVESTMENTS Continued
| | Principal Amount | | | Value |
Health Care Providers & Services (Continued) | | | | | |
Tenet Healthcare Corp., 8.125% Sr. Unsec. Nts., 4/1/22 | $ | 265,000 | $ | 287,586 |
| | | | | 1,305,693 |
| | | | | |
Pharmaceuticals—1.6% | | | | | |
Bausch Health Americas, Inc., 8.50% Sr. Unsec. Nts., 1/31/271 | | 115,000 | | | 126,400 |
Bausch Health Cos., Inc.: | | | | | |
5.875% Sr. Unsec. Nts., 5/15/231 | | 6,000 | | | 6,026 |
9.00% Sr. Unsec. Nts., 12/15/251 | | 60,000 | | | 66,958 |
HLF Financing Sarl LLC/Herbalife International, Inc., 7.25% Sr. | | | | | |
Unsec. Nts., 8/15/261 | | 70,000 | | | 70,787 |
Par Pharmaceutical, Inc., 7.50% Sr. Sec. Nts., 4/1/271 | | 70,000 | | | 74,097 |
Teva Pharmaceutical Finance Netherlands II BV, 6.00% Sr. | | | | | |
Unsec. Nts., 1/31/251 | EUR | 100,000 | | | 115,499 |
Teva Pharmaceutical Finance Netherlands III BV, 4.10% Sr. | | | | | |
Unsec. Nts., 10/1/46 | | 100,000 | | | 78,010 |
| | | | | 537,777 |
| | | | | |
Industrials—11.5% | | | | | |
Aerospace & Defense—2.1% | | | | | |
Bombardier, Inc.: | | | | | |
5.75% Sr. Unsec. Nts., 3/15/221 | | 70,000 | | | 71,525 |
7.875% Sr. Unsec. Nts., 4/15/271 | | 140,000 | | | 139,303 |
8.75% Sr. Unsec. Nts., 12/1/211 | | 165,000 | | | 175,027 |
Signature Aviation US Holdings, Inc., 5.375% Sr. Unsec. Nts., | | | | | |
5/1/261 | | 120,000 | | | 122,721 |
Spirit AeroSystems, Inc., 4.60% Sr. Unsec. Nts., 6/15/28 | | 28,000 | | | 27,823 |
Triumph Group, Inc., 7.75% Sr. Unsec. Nts., 8/15/25 | | 170,000 | | | 168,796 |
| | | | | 705,195 |
| | | | | |
Airlines—0.6% | | | | | |
Air Canada, 7.75% Sr. Unsec. Nts., 4/15/211 | | 180,000 | | | 188,172 |
| | | | | |
Building Products—0.1% | | | | | |
Advanced Drainage Systems, Inc., 5.00% Sr. Unsec. Nts., | | | | | |
9/30/271 | | 17,000 | | | 17,622 |
| | | | | |
Commercial Services & Supplies—1.5% | | | | | |
Brink's Co. (The), 4.625% Sr. Unsec. Nts., 10/15/271 | | 100,000 | | | 102,732 |
Core & Main LP, 6.125% Sr. Unsec. Nts., 8/15/251 | | 125,000 | | | 126,886 |
GFL Environmental, Inc., 5.625% Sr. Unsec. Nts., 5/1/221 | | 130,000 | | | 131,991 |
Intrum AB, 2.75%, 7/15/221 | EUR | 90,000 | | | 98,779 |
Pitney Bowes, Inc., 5.20% Sr. Unsec. Nts., 4/1/23 | | 28,000 | | | 28,082 |
| | | | | 488,470 |
| | | | | |
Electrical Equipment—0.1% | | | | | |
EnerSys, 4.375% Sr. Unsec. Nts., 12/15/271 | | 47,000 | | | 47,646 |
| | | | | |
Machinery—3.7% | | | | | |
Cleaver-Brooks, Inc., 7.875% Sr. Sec. Nts., 3/1/231 | | 150,000 | | | 148,187 |
20 INVESCO HIGH YIELD BOND FACTOR FUND
| | Principal Amount | | | Value |
Machinery (Continued) | | | | | |
Colfax Corp.: | | | | | |
3.25% Sr. Unsec. Nts., 5/15/251 | EUR | 170,000 | $ | 190,205 |
6.00% Sr. Unsec. Nts., 2/15/241 | | 65,000 | | | 67,512 |
EnPro Industries, Inc., 5.75% Sr. Unsec. Nts., 10/15/26 | 145,000 | | | 154,476 |
IHS Netherlands Holdco BV, 8.00% Sr. Unsec. Nts., 9/18/271 | 200,000 | | | 216,176 |
Meritor, Inc., 6.25% Sr. Unsec. Nts., 2/15/24 | 165,000 | | | 169,424 |
Mueller Industries, Inc., 6.00% Sub. Nts., 3/1/27 | 165,000 | | | 167,120 |
Titan International, Inc., 6.50% Sr. Sec. Nts., 11/30/23 | 185,000 | | | 139,289 |
| | | | | 1,252,389 |
| | | | | |
Road & Rail—0.4% | | | | | |
Kenan Advantage Group, Inc. (The), 7.875% Sr. Unsec. Nts., | | | | |
7/31/231 | | 130,000 | | | 128,429 |
| | | | |
Trading Companies & Distributors—3.0% | | | | |
AerCap Global Aviation Trust, 6.50% [US0003M+430] Jr. Sub. | | | | |
Nts., 6/15/451,2 | | 200,000 | | | 215,520 |
BMC East LLC, 5.50% Sr. Sec. Nts., 10/1/241 | 145,000 | | | 149,773 |
Fly Leasing Ltd., 5.25% Sr. Unsec. Nts., 10/15/24 | 245,000 | | | 251,839 |
Herc Holdings, Inc., 5.50% Sr. Unsec. Nts., 7/15/271 | 130,000 | | | 135,190 |
United Rentals North America, Inc., 6.50% Sr. Unsec. Nts., | | | | |
12/15/26 | | 240,000 | | | 256,356 |
| | �� | | | 1,008,678 |
| | | | | |
Information Technology—2.3% | | | | | |
Communications Equipment—0.3% | | | | | |
CommScope Technologies LLC, 6.00% Sr. Unsec. Nts., | | | | |
6/15/251 | | 115,000 | | | 108,388 |
| | | | |
Electronic Equipment, Instruments, & Components—0.6% | | | | |
Itron, Inc., 5.00% Sr. Unsec. Nts., 1/15/261 | | 145,000 | | | 149,662 |
MTS Systems Corp., 5.75% Sr. Unsec. Nts., 8/15/271 | 50,000 | | | 51,017 |
| | | | | 200,679 |
| | | | | |
IT Services—0.7% | | | | | |
Cardtronics, Inc./Cardtronics USA, Inc., 5.50% Sr. Unsec. Nts., | | | | |
5/1/251 | | 220,000 | | | 226,141 |
| | | | |
Technology Hardware, Storage & Peripherals—0.7% | | | | |
Everi Payments, Inc., 7.50% Sr. Unsec. Nts., 12/15/251 | 54,000 | | | 56,722 |
Western Digital Corp., 4.75% Sr. Unsec. Nts., 2/15/26 | 170,000 | | | 175,844 |
| | | | | 232,566 |
| | | | | |
Materials—13.0% | | | | | |
Chemicals—2.1% | | | | | |
Braskem Idesa SAPI, 7.45% Sr. Sec. Nts., 11/15/291 | 200,000 | | | 200,348 |
OCI NV, 6.625% Sr. Sec. Nts., 4/15/231 | | 200,000 | | | 207,900 |
PQ Corp., 6.75% Sr. Sec. Nts., 11/15/221 | | 80,000 | | | 81,899 |
21 | INVESCO HIGH YIELD BOND FACTOR FUND | | | |
CONSOLIDATED
SCHEDULE OF INVESTMENTS Continued
| | Principal Amount | | | Value |
Chemicals (Continued) | | | | | |
Unigel Luxembourg SA, 8.75% Sr. Unsec. Nts., 10/1/261 | $ | 200,000 | $ | 200,475 |
| | | | | 690,622 |
| | | | | |
Construction Materials—0.4% | | | | | |
Maxeda DIY Holding BV, 6.125% Sr. Sec. Nts., 7/15/221 | EUR | 130,000 | | | 128,933 |
| | | | | |
Containers & Packaging—3.6% | | | | | |
Ardagh Packaging Finance plc/Ardagh Holdings USA, Inc.: | | | | | |
4.25% Sr. Sec. Nts., 9/15/22 | | 200,000 | | | 199,803 |
6.00% Sr. Unsec. Nts., 2/15/251 | | 265,000 | | | 276,925 |
Cascades, Inc./Cascades USA, Inc., 5.125% Sr. Unsec. Nts., | | | | | |
1/15/261 | | 243,000 | | | 252,112 |
OI European Group BV, 4.00% Sr. Unsec. Nts., 3/15/231 | | 240,000 | | | 243,399 |
Trivium Packaging Finance BV, 5.50% Sr. Sec. Nts., 8/15/261 | | 220,000 | | | 228,388 |
| | | | | 1,200,627 |
| | | | | |
Metals & Mining—5.5% | | | | | |
Alcoa Nederland Holding BV, 6.125% Sr. Unsec. Nts., | | | | | |
5/15/281 | | 215,000 | | | 221,052 |
CSN Islands XI Corp., 6.75% Sr. Unsec. Nts., 1/28/281 | | 400,000 | | | 363,100 |
First Quantum Minerals Ltd., 7.25% Sr. Unsec. Nts., 4/1/231 | | 200,000 | | | 192,417 |
Freeport-McMoRan, Inc.: | | | | | |
3.55% Sr. Unsec. Nts., 3/1/22 | | 222,000 | | | 224,371 |
5.40% Sr. Unsec. Nts., 11/14/34 | | 70,000 | | | 68,438 |
Hudbay Minerals, Inc., 7.625% Sr. Unsec. Nts., 1/15/251 | | 125,000 | | | 120,677 |
Metinvest BV, 7.75% Sr. Unsec. Nts., 10/17/291 | | 320,000 | | | 323,168 |
SunCoke Energy Partners LP/SunCoke Energy Partners Finance | | | | | |
Corp., 7.50% Sr. Unsec. Nts., 6/15/251 | | 155,000 | | | 139,886 |
Vedanta Resources Ltd., 8.25% Sr. Unsec. Nts., 6/7/211 | | 200,000 | | | 202,036 |
| | | | | 1,855,145 |
| | | | | |
Paper & Forest Products—1.4% | | | | | |
Norbord, Inc., 5.75% Sr. Sec. Nts., 7/15/271 | | 70,000 | | | 73,524 |
Schweitzer-Mauduit International, Inc., 6.875% Sr. Unsec. | | | | | |
Nts., 10/1/261 | | 150,000 | | | 161,302 |
Suzano Austria GmbH, 5.75% Sr. Unsec. Nts., 7/14/261 | | 200,000 | | | 226,070 |
| | | | | 460,896 |
| | | | | |
Telecommunication Services—5.8% | | | | | |
Diversified Telecommunication Services—2.4% | | | | | |
Altice France SA, 7.375% Sr. Sec. Nts., 5/1/261 | | 75,000 | | | 78,791 |
CenturyLink, Inc., Series Y, 7.50% Sr. Unsec. Nts., 4/1/24 | | 190,000 | | | 213,354 |
CommScope, Inc., 5.50% Sr. Sec. Nts., 3/1/241 | | 80,000 | | | 81,325 |
Frontier Communications Corp., 10.50% Sr. Unsec. Nts., | | | | | |
9/15/22 | | 257,000 | | | 117,336 |
HTA Group Ltd. (Mauritius), 9.125% Sr. Unsec. Nts., 3/8/221 | | 120,000 | | | 123,247 |
Intelsat Jackson Holdings SA, 9.75% Sr. Unsec. Nts., 7/15/251 | | 70,000 | | | 62,096 |
Telecom Italia Capital SA: | | | | | |
7.20% Sr. Unsec. Nts., 7/18/36 | | 50,000 | | | 62,043 |
22 INVESCO HIGH YIELD BOND FACTOR FUND

| | | Principal Amount | | | Value |
| Diversified Telecommunication Services (Continued) | | | | | |
| Telecom Italia Capital SA: (Continued) | | | | | |
| 7.721% Sr. Unsec. Nts., 6/4/38 | $ | 55,000 | $ | 71,368 |
| | | | | | 809,560 |
| | | | | | |
Wireless Telecommunication Services—3.4% | | | | | |
Intelsat Jackson Holdings SA, 8.50% Sr. Unsec. Nts., | | | | | |
10/15/241 | | 155,000 | | | 135,948 |
Intelsat Luxembourg SA, 7.75% Sr. Unsec. Nts., 6/1/21 | | 75,000 | | | 56,812 |
SoftBank Group Corp.: | | | | | |
4.00% Sr. Unsec. Nts., 4/20/231 | EUR | 180,000 | | | 210,726 |
5.00% Sr. Unsec. Nts., 4/15/281 | EUR | 100,000 | | | 121,495 |
Sprint Capital Corp.: | | | | | |
6.875% Sr. Unsec. Nts., 11/15/28 | | 45,000 | | | 53,676 |
8.75% Sr. Unsec. Nts., 3/15/32 | | 15,000 | | | 20,878 |
Sprint Corp., 7.625% Sr. Unsec. Nts., 2/15/25 | | 145,000 | | | 168,563 |
T-Mobile USA, Inc., 6.375% Sr. Unsec. Nts., 3/1/25 | | 360,000 | | | 370,877 |
| | | | | | 1,138,975 |
| | | | | | |
Utilities—1.9% | | | | | |
Electric Utilities—0.1% | | | | | |
DPL, Inc., 4.35% Sr. Unsec. Nts., 4/15/291 | | 44,000 | | | 41,156 |
| | | | | |
Gas Utilities—0.5% | | | | | |
AmeriGas Partners LP/AmeriGas Finance Corp., 5.875% Sr. | | | | | |
Unsec. Nts., 8/20/26 | | 165,000 | | | 171,496 |
| | | | |
Independent Power and Renewable Electricity Producers—1.3% | | | | |
AES Corp., 4.50%, 3/15/23 | | 188,000 | | | 187,456 |
YPF Energia Electrica SA, 10.00% Sr. Unsec. Nts., 7/25/261 | | 275,000 | | | 242,655 |
| | | | | | 430,111 |
Total Corporate Bonds and Notes (Cost $31,136,890) | | | | | 30,591,900 |
| | | Shares | | | |
| Preferred Stock—0.0% | | | | | |
| Claire's Holdings LLC, 0.00%, Series A8 (Cost $3,125) | | 5 | | | 875 |
| | | | | |
| Common Stocks—0.0% | | | | | |
Claire's Holdings LLC8 | | 20 | | | 11,000 |
Quicksilver Resources, Inc.8,9 | | 155,000 | | | — |
Total Common Stocks (Cost $138,389) | | | | | 11,000 |
| | | Units | | | |
| Rights, Warrants and Certificates—0.0% | | | | | |
| Agro Holdings, Inc. Wts., Exp. 4/10/248,9 (Cost $0) | | 39 | | | — |
| | | Shares | | | |
| Investment Companies—7.6% | | | | | |
| Invesco Government & Agency Portfolio, Institutional Class, 1.50%10 | 2,423,448 | | | 2,423,448 |
23 INVESCO HIGH YIELD BOND FACTOR FUND
CONSOLIDATED
SCHEDULE OF INVESTMENTS Continued
| Shares | | Value |
Investment Companies (Continued) | | | |
SPDR Bloomberg Barclays Short Term High Yield Bond ETF | 5,000 | $ | 132,350 |
Total Investment Companies (Cost $2,557,248) | | | 2,555,798 |
| | | |
Total Investments, at Value (Cost $34,884,225) | 101.7% | | 34,061,305 |
Net Other Assets (Liabilities)
Net Assets
(1.7) | (574,179) |
100.0% $ | 33,487,126 |
| |
Footnotes to Consolidated Schedule of Investments
1.Security purchased or received in a transaction exempt from registration under the Securities Act of 1933, as amended (the "1933 Act"). The security may be resold pursuant to an exemption from registration under the 1933
Act, typically to qualified institutional buyers. The aggregate value of these securities at February 29, 2020 was $21,743,893, which represented 64.93% of the Fund's Net Assets.
2.Represents the current interest rate for a variable or increasing rate security, which may be fixed for a predetermined period. The interest rate is, or will be as of an established date, determined as [Referenced Rate + Basis-point spread].
3.Variable rate senior loan interests are, at present, not readily marketable, not registered under the Securities Act of 1933, as amended (the "1933 Act"), and may be subject to contractual and legal restrictions on sale. Variable rate senior loan interests in the Fund's portfolio generally have variable rates which adjust to a base, such as the London Interbank Offered Rate ("LIBOR"), on set dates, typically every 30 days but not greater than one year; and/ or have interest rates that float at a margin above a widely recognized base lending rate such as the Prime Rate of a designated U.S. bank.
4.Variable rate senior loan interests often require prepayments from excess cash flow or permit the borrower to repay at its election. The degree to which borrowers repay, whether as a contractual requirement or at their election, cannot be predicted with accuracy. As a result, the actual remaining maturity may be substantially less than the stated maturities shown. However, it is anticipated that the variable rate senior loan interests will have an expected average life of three to five year.
5.This security is not accruing income because its issuer has missed or is expected to miss interest and/or principal payments. The rate shown is the contractual interest rate.
6.Interest or dividend is paid-in-kind, when applicable.
7.This bond has no contractual maturity date, is not redeemable and contractually pays an indefinite stream of interest.
8.Non-income producing security.
9.The value of this security was determined using significant unobservable inputs. See Note 3 of the accompanying
Consolidated Notes.
10.The money market fund and the Fund are affiliated by having the same investment adviser. The rate shown is the
7-day SEC standardized yield as of February 29, 2020.
The following issuer is or was an affiliate, as defined in the Investment Company Act of 1940, as amended, at or during the period, by virtue of the Fund owning at least 5% of the voting securities of the issuer or as a result of the Fund and the issuer having the same investment adviser. There were no affiliated securities held by the Fund at period end. Transactions during the period in which the issuer was an affiliate are as follows:
| Shares | Gross | Gross | Shares |
| May 31, 2019 | Additions | ReductionsFebruary 29, 2020 |
Common Stock | | | | |
Hexion Holdings Corp., Cl. B | — | 1,943 | 1,943 | — |
24 INVESCO HIGH YIELD BOND FACTOR FUND
| | | Change in |
| | Realized | Unrealized |
Value | Income | Gain (Loss) | Gain (Loss) |
Common Stock | | | | | | |
Hexion Holdings Corp., Cl. B | $ | — $ | — $ | (16,252) | $ | — |
Total | $ | — $ | — $ | (16,252) | $ | — |
| | | | | | |
Distribution of investments representing geographic holdings, as a percentage of total investments at value, is as follows:
Geographic Holdings | | Value | Percent |
United States | $ | 19,711,747 | 57.9% |
Brazil | | 2,042,932 | 6.0 |
Mexico | | 1,939,068 | 5.7 |
Canada | | 1,496,233 | 4.4 |
Netherlands | | 862,909 | 2.5 |
Ukraine | | 742,851 | 2.2 |
Ireland | | 667,162 | 2.0 |
China | | 581,083 | 1.7 |
Luxembourg | | 534,273 | 1.6 |
Portugal | | 499,502 | 1.5 |
India | | 459,782 | 1.3 |
Spain | | 376,442 | 1.1 |
Argentina | | 372,077 | 1.1 |
Saudi Arabia | | 360,500 | 1.1 |
Nigeria | | 339,423 | 1.0 |
Japan | | 332,221 | 1.0 |
France | | 307,897 | 0.9 |
Ghana | | 277,340 | 0.8 |
Cayman Islands | | 249,684 | 0.7 |
Hong Kong | | 246,344 | 0.7 |
Switzerland | | 236,509 | 0.7 |
United Kingdom | | 195,813 | 0.6 |
Israel | | 193,509 | 0.6 |
Zambia | | 192,417 | 0.6 |
Colombia | | 188,252 | 0.5 |
Singapore | | 187,202 | 0.5 |
Italy | | 133,411 | 0.4 |
Germany | | 116,490 | 0.3 |
Sweden | | 98,779 | 0.3 |
Belgium | | 74,270 | 0.2 |
Australia | | 45,183 | 0.1 |
Total | $ | 34,061,305 | 100.0% |
| | | |
| Forward Currency Exchange Contracts as of February 29, 2020 | | | | |
Counter | Settlement | | Currency | | Currency Sold | | Unrealized | | Unrealized |
-party | Month(s) | Purchased (000's) | | (000's) | | Appreciation | | Depreciation |
CITNA-B | 05/2020 | USD | 273 | CAD | 367 | $ | 64 | $ | — |
RBC | 05/2020 | USD | 3,592 | EUR | 3,243 | | — | | (3,947) |
| | | 25 | INVESCO HIGH YIELD BOND FACTOR FUND | | | |
CONSOLIDATED
SCHEDULE OF INVESTMENTS Continued
Forward Currency Exchange Contracts (Continued) | | | | | | |
Counter | Settlement | | Currency | Currency Sold | | Unrealized | | Unrealized |
-party | Month(s) | Purchased (000's) | (000's) | | Appreciation | | Depreciation |
RBC | 05/2020 | USD | 371 GBP | 289 | $ | — $ | (35) |
Total Unrealized Appreciation and Depreciation | | $ | 64 | $ | (3,982) |
| | | | | | |
| | | | | | |
Futures Contracts as of February 29, 2020 | | | | | | |
| | | | | | | | | Unrealized |
| Expiration | NumberNotional Amount | | | | | Appreciation/ |
Description | Buy/Sell | Date | of Contracts | (000's) | | Value | | (Depreciation) |
Euro-BOBL | Sell | 3/6/20 | 3 | EUR 445 $ | | 449,286 $ | | (4,774) |
Euro-BUND | Sell | 3/6/20 | 2 | EUR 382 | | 391,814 | | | (10,226) |
Euro-Schatz | Sell | 3/6/20 | 6 | EUR 742 | | 743,941 | | | (2,294) |
United States | | | | | | | | | |
Treasury Nts., 10 yr. | Buy | 6/19/20 | 11 | USD 1,464 | | 1,482,250 | | | 17,938 |
United States | | | | | | | | | |
Treasury Nts., 5 yr. | Buy | 6/30/20 | 15 | USD 1,824 | | 1,841,250 | | | 16,845 |
United States Ultra | | | | | | | | | |
Bonds, 10 yr. | Buy | 6/19/20 | 2 | USD 296 | | 300,438 | | | 4,433 |
| | | | | | $ | | 21,922 |
Glossary: | | | | | | | | | |
| | | | | | | | |
Counterparty Abbreviations | | | | | | | | |
CITNA-B | Citibank NA | | | | | | | | |
RBC | RBC Dominion Securities | | | | | | | |
Currency abbreviations indicate amounts reporting in currencies | | | | | |
CAD | Canadian Dollar | | | | | | | |
EUR | Euro | | | | | | | | |
GBP | British Pound Sterling | | | | | | | |
Definitions | | | | | | | | | |
BOBL | German Federal Obligation | | | | | | |
BUND | German Federal Obligation | | | | | | |
ETF | Exchange Traded Fund | | | | | | | |
EUR003M | Euro Interbank Offered Rate 3 Month ACT/360 | | | | | |
EUSA5 | EUR Swap Annual 5 Year | | | | | | | |
H15T10Y | US Treasury Yield Curve Rate T Note Constant Maturity 10 Year | | | | | |
LIBOR4 | London Interbank Offered Rate-Quarterly | | | | | | |
US0001M | Intercontinental Exchange London Interbank Offered Rate USD 1 Month | | |
US0003M | Intercontinental Exchange London Interbank Offered Rate USD 3 Month | | |
USISDA05 | USD Intercontinental Exchange Swap Rate 11:00am NY 5 Year | | | | | |
See accompanying Notes to Consolidated Financial Statements.
26 INVESCO HIGH YIELD BOND FACTOR FUND

CONSOLIDATED STATEMENT OF
ASSETS AND LIABILITIES February 29, 2020
Assets | | |
Investments, at value—see accompanying consolidated schedule of investments: | | |
Unaffiliated companies (cost $32,460,777) | $ | 31,637,857 |
Affiliated companies (cost $2,423,448) | | 2,423,448 |
| | 34,061,305 |
Cash | | 404,929 |
Cash—foreign currencies (cost $705,421) | | 698,945 |
Unrealized appreciation on forward currency exchange contracts | | 64 |
Receivables and other assets: | | |
Interest and dividends | | 513,655 |
Shares of beneficial interest sold | | 182,263 |
Investments sold | | 82,111 |
Variation margin receivable - futures contracts | | 75,555 |
Other | | 92,498 |
Total assets | | 36,111,325 |
| | |
Liabilities | | |
Unrealized depreciation on forward currency exchange contracts | | 3,982 |
Payables and other liabilities: | | |
Investments purchased | | 2,186,025 |
Shares of beneficial interest redeemed | | 128,614 |
Shareholder communications | | 32,434 |
Transfer and shareholder servicing agent fees | | 24,766 |
Trustees' compensation | | 17,631 |
Distribution and service plan fees | | 10,239 |
Dividends | | 7,295 |
Advisory fees | | 859 |
Administration fees | | 39 |
Other | | 212,315 |
Total liabilities | | 2,624,199 |
| | |
Net Assets | $ | 33,487,126 |
| | |
| | |
Composition of Net Assets | | |
Shares of beneficial interest | $ | 38,118,157 |
Total accumulated loss | | (4,631,031) |
Net Assets | $ | 33,487,126 |
| | |
27 INVESCO HIGH YIELD BOND FACTOR FUND

CONSOLIDATED STATEMENT OF
ASSETS AND LIABILITIES Continued
Net Asset Value Per Share | |
Class A Shares: | |
Net asset value and redemption price per share (based on net assets of $23,444,537 and | |
2,608,784 shares of beneficial interest outstanding) | $8.99 |
Maximum offering price per share (net asset value plus sales charge of 4.25% of offering price) | $9.39 |
| |
Class C Shares: | |
Net asset value, redemption price (excludes applicable contingent deferred sales charge) and | |
offering price per share (based on net assets of $5,718,924 and 636,671 shares of beneficial | |
interest outstanding) | $8.98 |
| |
Class R Shares: | |
Net asset value, redemption price and offering price per share (based on net assets of | |
$3,098,398 and 344,696 shares of beneficial interest outstanding) | $8.99 |
| |
Class Y Shares: | |
Net asset value, redemption price and offering price per share (based on net assets of | |
$1,105,054 and 122,918 shares of beneficial interest outstanding) | $8.99 |
| |
Class R5 Shares: | |
Net asset value, redemption price and offering price per share (based on net assets of $9,966 | |
and 1,109 shares of beneficial interest outstanding) | $8.99 |
| |
Class R6 Shares: | |
Net asset value, redemption price and offering price per share (based on net assets of $110,247 | |
and 12,256 shares of beneficial interest outstanding) | $9.00 |
See accompanying Notes to Consolidated Financial Statements.
28 INVESCO HIGH YIELD BOND FACTOR FUND

CONSOLIDATED STATEMENT OF
OPERATIONS
| | Nine Months Ended | | Year Ended |
| | February 29, 2020 | | May 31, 2019 |
Investment Income | | | | |
Interest (net of foreign withholding taxes of $3,864 and 2,520, | | | | |
respectively) | $ | 1,438,240 | $ | 2,558,169 |
Dividends: | | | | |
Unaffiliated companies | | 2,297 | | 1,473 |
Affiliated companies | | 35,929 | | 32,607 |
| | | | |
Total investment income | | 1,476,466 | | 2,592,249 |
| | | | |
Expenses | | | | |
Advisory fees | | 186,758 | | 291,828 |
Administration fees | | 3,604 | | 51 |
Distribution and service plan fees: | | | | |
Class A | | 40,766 | | 50,671 |
Class C | | 43,820 | | 64,517 |
Class R | | 11,204 | | 11,890 |
Transfer and shareholder servicing agent fees: | | | | |
Class A | | 64,806 | | 37,266 |
Class C | | 16,210 | | 11,193 |
Class R | | 8,298 | | 4,216 |
Class Y | | 3,284 | | 2,434 |
Class R5 | | 3 | | — |
Class R6 | | 9 | | 1,933 |
Shareholder communications: | | | | |
Class A | | 22,038 | | 20,561 |
Class C | | 5,483 | | 7,779 |
Class R | | 2,840 | | 6,459 |
Class Y | | 1,085 | | 604 |
Class R5 | | 10 | | — |
Class R6 | | 95 | | 122 |
Legal, auditing and other professional fees | | 85,642 | | 113,925 |
Registration fees | | 45,845 | | 4,688 |
Custodian fees and expenses | | 45,666 | | 59,221 |
Trustees' compensation | | 23,426 | | 19,264 |
Borrowing fees | | — | | 1,157 |
Other | | 29,377 | | 1,406 |
Total expenses | | 640,269 | | 711,185 |
Less waivers and reimbursements of expenses | | (317,337) | | (247,074) |
Net expenses | | 322,932 | | 464,111 |
| | | | |
Net Investment Income | | 1,153,534 | | 2,128,138 |
29 INVESCO HIGH YIELD BOND FACTOR FUND
CONSOLIDATED STATEMENT OF
OPERATIONS Continued
| | Nine Months Ended | | Year Ended |
| | February 29, 2020 | | May 31, 2019 |
Realized and Unrealized Gain (Loss) | | | | |
Net realized gain (loss) on: | | | | |
Investment transactions in: | | | | |
Unaffiliated companies | $ | 139,781 | $ | (1,166,379) |
Affiliated companies | | (16,252) | | — |
Futures contracts | | 92,875 | | — |
Foreign currency transactions | | (81,149) | | — |
Forward currency exchange contracts | | 926 | | — |
Swap contracts | | (7,497) | | 6,800 |
Swaption contracts written | | 2,465 | | — |
Net realized gain (loss) | | 131,149 | | (1,159,579) |
| | | | |
Net change in unrealized appreciation/(depreciation) on: | | | | |
Investment transactions in unaffiliated companies | | (22,225) | | 128,199 |
Translation of assets and liabilities denominated in foreign currencies | | (6,432) | | — |
Forward currency exchange contracts | | (3,918) | | — |
Futures contracts | | 21,922 | | — |
Net change in unrealized appreciation/(depreciation) | | (10,653) | | 128,199 |
| | | | |
Net Increase in Net Assets Resulting from Operations | $ | 1,274,030 | $ | 1,096,758 |
| | | | |
See accompanying Notes to Consolidated Financial Statements.
30 INVESCO HIGH YIELD BOND FACTOR FUND
CONSOLIDATED STATEMENT OF CHANGES IN NET ASSETS
| Nine Months Ended | | Year Ended | | Year Ended |
| | February 29, 2020 | | May 31, 2019 | | May 31, 2018 |
Operations | | | | | | |
Net investment income | $ | 1,153,534 | $ | 2,128,138 | $ | 2,432,145 |
| | | | | | |
Net realized gain (loss) | | 131,149 | | (1,159,579) | | 7,914 |
| | | | | | |
Net change in unrealized appreciation/(depreciation) | | (10,653) | | 128,199 | | (1,687,719) |
Net increase in net assets resulting from operations | | 1,274,030 | | 1,096,758 | | 752,340 |
| | | | | | |
Dividends and/or Distributions to Shareholders | | | | | | |
Distributions to shareholders from distributable | | | | | | |
earnings: | | | | | | |
Class A | | (808,286) | | (1,229,430) | | (1,200,696) |
Class C | | (172,968) | | (323,053) | | (325,880) |
Class R | | (98,117) | | (132,581) | | (94,006) |
Class Y | | (43,829) | | (84,453) | | (109,242) |
Class R5 | | (371) | | (5) | | — |
Class R6 | | (3,852) | | (391,557) | | (723,071) |
Total distributions from distributable earnings | | | | | | |
| (1,127,423) | | (2,161,079) | | (2,452,895) |
| | | | | | |
Tax return of capital distribution: | | | | | | |
Class A | | (42,363) | | — | | — |
Class C | | (9,065) | | — | | — |
Class R | | (5,142) | | — | | — |
Class Y | | (2,297) | | — | | — |
Class R5 | | (19) | | — | | — |
Class R6 | | (202) | | — | | — |
| | | | | | |
Total return of capital distribution | | (59,088) | | — | | — |
| | | | | |
Beneficial Interest Transactions | | | | | | |
Net increase (decrease) in net assets resulting from | | | | | | |
beneficial interest transactions: | | | | | | |
Class A | | 611,835 | | 1,660,139 | | (4,911,855) |
Class C | | (796,976) | | (331,917) | | 173,441 |
Class R | | 254,611 | | 703,228 | | 716,623 |
Class Y | | (408,281) | | 7,237 | | (636,985) |
Class R5 | | — | | 10,000 | | — |
Class R6 | | (13,627) | | (12,756,849) | | 3,817,547 |
Total beneficial interest transactions | | (352,438) | | (10,708,162) | | (841,229) |
| | | | | | |
Net Assets | | | | | | |
Total decrease | | (264,919) | | (11,772,483) | | (2,541,784) |
Beginning of period | | 33,752,045 | | 45,524,528 | | 48,066,312 |
End of period | | | | | | |
$ | 33,487,126 | $ | 33,752,045 | $ | 45,524,528 |
| | | | | | |
See accompanying Notes to Consolidated Financial Statements.
31 INVESCO HIGH YIELD BOND FACTOR FUND
CONSOLIDATED FINANCIAL HIGHLIGHTS
| Nine Months | | | | | |
| Ended | Year Ended | Year Ended | Year Ended | Year Ended | Year Ended |
Class A | February 29, | May 31, | May 31, | May 31, | May 31, | May 29, |
2020 | 2019 | 2018 | 2017 | 2016 | 20151 |
Per Share Operating Data | | | | | | |
Net asset value, beginning of | | | | | | |
period | $8.96 | $9.17 | $9.51 | $9.07 | $9.75 | $10.25 |
Income (loss) from investment | | | | | | |
operations: | | | | | | |
Net investment income2 | 0.32 | 0.51 | 0.49 | 0.45 | 0.44 | 0.49 |
Net realized and unrealized | | | | | | |
gain (loss) | 0.04 | (0.21) | (0.34) | 0.45 | (0.67) | (0.50) |
Total from investment | | | | | | |
operations | 0.36 | 0.30 | 0.15 | 0.90 | (0.23) | (0.01) |
Dividends and/or distributions | | | | | | |
to shareholders: | | | | | | |
Dividends from net investment | | | | | | |
income | (0.31) | (0.51) | (0.49) | (0.46) | (0.45) | (0.49) |
Tax return of capital | | | | | | |
distribution | (0.02) | 0.00 | 0.00 | 0.00 | 0.00 | 0.00 |
Total dividends and/or | | | | | | |
distributions to shareholders | (0.33) | (0.51) | (0.49) | (0.46) | (0.45) | (0.49) |
Net asset value, end of period | $8.99 | $8.96 | $9.17 | $9.51 | $9.07 | $9.75 |
| | | | | | |
| | | | | | |
Total Return, at Net Asset | | | | | | |
Value3 | 4.04% | 3.42% | 1.61% | 10.08% | (2.22)% | (0.07)% |
| | | | | | |
Ratios/Supplemental Data | | | | | | |
Net assets, end of period (in | | | | | | |
thousands) | $23,445 | $22,791 | $21,669 | $27,376 | $28,286 | $31,973 |
Average net assets (in | | | | | | |
thousands) | $23,415 | $21,629 | $22,936 | $29,041 | $28,307 | $31,185 |
Ratios to average net assets:4 | | | | | | |
Net investment income | 4.72% | 5.61% | 5.19% | 4.85% | 4.90% | 4.94% |
Expenses excluding specific | | | | | | |
expenses listed below | 2.40% | 1.78% | 1.68% | 1.59% | 1.56% | 1.40% |
Interest and fees from | | | | | | |
borrowings | 0.00% | 0.00%5 | 0.00%5 | 0.00%5 | 0.00%5 | 0.00% |
Total expenses | 2.40%6 | 1.78%6 | 1.68%6 | 1.59%6 | 1.56%6 | 1.40% |
Expenses after payments, | | | | | | |
waivers and/or | | | | | | |
reimbursements and reduction | | | | | | |
to custodian expenses | 1.15% | 1.15% | 1.06% | 1.21% | 1.24% | 1.15% |
Portfolio turnover rate7 | 127% | 56% | 71% | 89% | 54% | 67% |
32 INVESCO HIGH YIELD BOND FACTOR FUND
1.Represents the last business day of the Fund's reporting period.
2.Calculated based on the average shares outstanding during the period.
3.Includes adjustments in accordance with accounting principles generally accepted in the United States of America and as such, the net asset value for financial reporting purposes and the returns based upon those net asset values may differ from the net asset value and returns for shareholder transactions. Does not include sales charges and is not annualized for periods less than one year, if applicable.
4.Annualized for periods less than one full year.
5.Less than 0.005%.
6.Total expenses including indirect expenses from fund fees and expenses were as follows:
Nine Months Ended February 29, 2020 | 2.41% |
Year Ended May 31, 2019 | 1.78% |
Year Ended May 31, 2018 | 1.68% |
Year Ended May 31, 2017 | 1.59% |
Year Ended May 31, 2016 | 1.57% |
7.Portfolio turnover is calculated at the fund level and is not annualized for periods less than one year, if applicable.
See accompanying Notes to Consolidated Financial Statements.
33 INVESCO HIGH YIELD BOND FACTOR FUND
CONSOLIDATED FINANCIAL HIGHLIGHTS Continued
| Nine Months | | | | | |
| Ended | Year Ended | Year Ended | Year Ended | Year Ended | Year Ended |
Class C | February 29, | May 31, | May 31, | May 31, | May 31, | May 29, |
2020 | 2019 | 2018 | 2017 | 2016 | 20151 |
Per Share Operating Data | | | | | | |
Net asset value, beginning of | | | | | | |
period | $8.96 | $9.16 | $9.50 | $9.06 | $9.75 | $10.25 |
Income (loss) from investment | | | | | | |
operations: | | | | | | |
Net investment income2 | 0.27 | 0.44 | 0.42 | 0.39 | 0.38 | 0.42 |
Net realized and unrealized | | | | | | |
gain (loss) | 0.03 | (0.19) | (0.33) | 0.44 | (0.68) | (0.50) |
Total from investment | | | | | | |
operations | 0.30 | 0.25 | 0.09 | 0.83 | (0.30) | (0.08) |
Dividends and/or distributions | | | | | | |
to shareholders: | | | | | | |
Dividends from net investment | | | | | | |
income | (0.27) | (0.45) | (0.43) | (0.39) | (0.39) | (0.42) |
Tax return of capital | | | | | | |
distribution | (0.01) | 0.00 | 0.00 | 0.00 | 0.00 | 0.00 |
Total dividends and/or | | | | | | |
distributions to shareholders | (0.28) | (0.45) | (0.43) | (0.39) | (0.39) | (0.42) |
Net asset value, end of period | $8.98 | $8.96 | $9.16 | $9.50 | $9.06 | $9.75 |
| | | | | | |
| | | | | | |
Total Return, at Net Asset | | | | | | |
Value3 | 3.39% | 2.81% | 0.90% | 9.33% | (3.00)% | (0.76)% |
| | | | | | |
Ratios/Supplemental Data | | | | | | |
Net assets, end of period (in | | | | | | |
thousands) | $5,719 | $6,484 | $6,972 | $7,070 | $4,458 | $3,876 |
Average net assets (in | | | | | | |
thousands) | $5,850 | $6,498 | $7,161 | $6,056 | $4,083 | $2,632 |
Ratios to average net assets:4 | | | | | | |
Net investment income | 4.02% | 4.91% | 4.50% | 4.18% | 4.21% | 4.24% |
Expenses excluding specific | | | | | | |
expenses listed below | 3.17% | 2.57% | 2.47% | 2.55% | 2.59% | 2.56% |
Interest and fees from | | | | | | |
borrowings | 0.00% | 0.00%5 | 0.00%5 | 0.00%5 | 0.00%5 | 0.00% |
Total expenses | 3.17%6 | 2.57%6 | 2.47%6 | 2.55%6 | 2.59%6 | 2.56% |
Expenses after payments, | | | | | | |
waivers and/or | | | | | | |
reimbursements and reduction | | | | | | |
to custodian expenses | 1.86% | 1.85% | 1.76% | 1.91% | 1.94% | 1.85% |
Portfolio turnover rate7 | 127% | 56% | 71% | 89% | 54% | 67% |
34 INVESCO HIGH YIELD BOND FACTOR FUND
1.Represents the last business day of the Fund's reporting period.
2.Calculated based on the average shares outstanding during the period.
3.Includes adjustments in accordance with accounting principles generally accepted in the United States of America and as such, the net asset value for financial reporting purposes and the returns based upon those net asset values may differ from the net asset value and returns for shareholder transactions. Does not include sales charges and is not annualized for periods less than one year, if applicable.
4.Annualized for periods less than one full year.
5.Less than 0.005%.
6.Total expenses including indirect expenses from fund fees and expenses were as follows:
Nine Months Ended February 29, 2020 | 3.18% |
Year Ended May 31, 2019 | 2.57% |
Year Ended May 31, 2018 | 2.47% |
Year Ended May 31, 2017 | 2.55% |
Year Ended May 31, 2016 | 2.60% |
7.Portfolio turnover is calculated at the fund level and is not annualized for periods less than one year, if applicable.
See accompanying Notes to Consolidated Financial Statements.
35 INVESCO HIGH YIELD BOND FACTOR FUND
CONSOLIDATED FINANCIAL HIGHLIGHTS Continued
| Nine Months | | | | | |
| Ended | Year Ended | Year Ended | Year Ended | Year Ended | Year Ended |
Class R | February 29, | May 31, | May 31, | May 31, | May 31, | May 29, |
2020 | 2019 | 2018 | 2017 | 2016 | 20151 |
Per Share Operating Data | | | | | | |
Net asset value, beginning of | | | | | | |
period | $8.96 | $9.17 | $9.51 | $9.07 | $9.75 | $10.25 |
Income (loss) from investment | | | | | | |
operations: | | | | | | |
Net investment income2 | 0.31 | 0.48 | 0.47 | 0.44 | 0.42 | 0.46 |
Net realized and unrealized | | | | | | |
gain (loss) | 0.03 | (0.20) | (0.34) | 0.43 | (0.67) | (0.50) |
Total from investment | | | | | | |
operations | 0.34 | 0.28 | 0.13 | 0.87 | (0.25) | (0.04) |
Dividends and/or distributions | | | | | | |
to shareholders: | | | | | | |
Dividends from net investment | | | | | | |
income | (0.29) | (0.49) | (0.47) | (0.43) | (0.43) | (0.46) |
Tax return of capital | | | | | | |
distribution | (0.02) | 0.00 | 0.00 | 0.00 | 0.00 | 0.00 |
Total dividends and/or | | | | | | |
distributions to shareholders | (0.31) | (0.49) | (0.47) | (0.43) | (0.43) | (0.46) |
Net asset value, end of period | $8.99 | $8.96 | $9.17 | $9.51 | $9.07 | $9.75 |
| | | | | | |
| | | | | | |
Total Return, at Net Asset | | | | | | |
Value3 | 3.85% | 3.17% | 1.36% | 9.81% | (2.46)% | (0.31)% |
| | | | | | |
Ratios/Supplemental Data | | | | | | |
Net assets, end of period (in | | | | | | |
thousands) | $3,098 | $2,839 | $2,185 | $1,542 | $554 | $379 |
Average net assets (in | | | | | | |
thousands) | $3,001 | $2,445 | $1,873 | $908 | $447 | $234 |
Ratios to average net assets:4 | | | | | | |
Net investment income | 4.48% | 5.36% | 4.96% | 4.66% | 4.65% | 4.68% |
Expenses excluding specific | | | | | | |
expenses listed below | 2.67% | 2.20% | 2.07% | 2.39% | 2.37% | 2.45% |
Interest and fees from | | | | | | |
borrowings | 0.00% | 0.00%5 | 0.00%5 | 0.00%5 | 0.00%5 | 0.00% |
Total expenses | 2.67%6 | 2.20%6 | 2.07%6 | 2.39%6 | 2.37%6 | 2.45% |
Expenses after payments, | | | | | | |
waivers and/or | | | | | | |
reimbursements and reduction | | | | | | |
to custodian expenses | 1.40% | 1.40% | 1.31% | 1.46% | 1.49% | 1.39% |
Portfolio turnover rate7 | 127% | 56% | 71% | 89% | 54% | 67% |
E on
36 INVESCO HIGH YIELD BOND FACTOR FUND
1.Represents the last business day of the Fund's reporting period.
2.Calculated based on the average shares outstanding during the period.
3.Includes adjustments in accordance with accounting principles generally accepted in the United States of America and as such, the net asset value for financial reporting purposes and the returns based upon those net asset values may differ from the net asset value and returns for shareholder transactions. Does not include sales charges and is not annualized for periods less than one year, if applicable.
4.Annualized for periods less than one full year.
5.Less than 0.005%.
6.Total expenses including indirect expenses from fund fees and expenses were as follows:
Nine Months Ended February 29, 2020 | 2.68% |
Year Ended May 31, 2019 | 2.20% |
Year Ended May 31, 2018 | 2.07% |
Year Ended May 31, 2017 | 2.39% |
Year Ended May 31, 2016 | 2.38% |
7.Portfolio turnover is calculated at the fund level and is not annualized for periods less than one year, if applicable.
See accompanying Notes to Consolidated Financial Statements.
37 INVESCO HIGH YIELD BOND FACTOR FUND
CONSOLIDATED FINANCIAL HIGHLIGHTS Continued
| Nine Months | | | | | |
| Ended | Year Ended | Year Ended | Year Ended | Year Ended | Year Ended |
Class Y | February 29, | May 31, | May 31, | May 31, | May 31, | May 29, |
2020 | 2019 | 2018 | 2017 | 2016 | 20151 |
Per Share Operating Data | | | | | | |
Net asset value, beginning of | | | | | | |
period | $8.97 | $9.17 | $9.51 | $9.07 | $9.75 | $10.25 |
Income (loss) from investment | | | | | | |
operations: | | | | | | |
Net investment income2 | 0.34 | 0.53 | 0.52 | 0.48 | 0.47 | 0.52 |
Net realized and unrealized | | | | | | |
gain (loss) | 0.03 | (0.19) | (0.34) | 0.45 | (0.67) | (0.50) |
Total from investment | | | | | | |
operations | 0.37 | 0.34 | 0.18 | 0.93 | (0.20) | 0.02 |
Dividends and/or distributions | | | | | | |
to shareholders: | | | | | | |
Dividends from net investment | | | | | | |
income | (0.33) | (0.54) | (0.52) | (0.49) | (0.48) | (0.52) |
Tax return of capital | | | | | | |
distribution | (0.02) | 0.00 | 0.00 | 0.00 | 0.00 | 0.00 |
Total dividends and/or | | | | | | |
distributions to shareholders | (0.35) | (0.54) | (0.52) | (0.49) | (0.48) | (0.52) |
Net asset value, end of period | $8.99 | $8.97 | $9.17 | $9.51 | $9.07 | $9.75 |
| | | | | | |
| | | | | | |
Total Return, at Net Asset | | | | | | |
Value3 | 4.16% | 3.85% | 1.92% | 10.41% | (1.92)% | 0.23% |
| | | | | | |
Ratios/Supplemental Data | | | | | | |
Net assets, end of period (in | | | | | | |
thousands) | $1,105 | $1,505 | $1,534 | $2,235 | $657 | $1,132 |
Average net assets (in | | | | | | |
thousands) | $1,185 | $1,411 | $1,976 | $1,068 | $707 | $724 |
Ratios to average net assets:4 | | | | | | |
Net investment income | 5.01% | 5.91% | 5.50% | 5.18% | 5.18% | 5.25% |
Expenses excluding specific | | | | | | |
expenses listed below | 2.17% | 1.50% | 1.44% | 1.42% | 1.50% | 1.50% |
Interest and fees from | | | | | | |
borrowings | 0.00% | 0.00%5 | 0.00%5 | 0.00%5 | 0.00%5 | 0.00% |
Total expenses | 2.17%6 | 1.50%6 | 1.44%6 | 1.42%6 | 1.50%6 | 1.50% |
Expenses after payments, | | | | | | |
waivers and/or | | | | | | |
reimbursements and reduction | | | | | | |
to custodian expenses | 0.87% | 0.85% | 0.76% | 0.91% | 0.94% | 0.84% |
Portfolio turnover rate7 | 127% | 56% | 71% | 89% | 54% | 67% |
38 INVESCO HIGH YIELD BOND FACTOR FUND
1.Represents the last business day of the Fund's reporting period.
2.Calculated based on the average shares outstanding during the period.
3.Includes adjustments in accordance with accounting principles generally accepted in the United States of America and as such, the net asset value for financial reporting purposes and the returns based upon those net asset values may differ from the net asset value and returns for shareholder transactions. Does not include sales charges and is not annualized for periods less than one year, if applicable.
4.Annualized for periods less than one full year.
5.Less than 0.005%.
6.Total expenses including indirect expenses from fund fees and expenses were as follows:
Nine Months Ended February 29, 2020 | 2.18% |
Year Ended May 31, 2019 | 1.50% |
Year Ended May 31, 2018 | 1.44% |
Year Ended May 31, 2017 | 1.42% |
Year Ended May 31, 2016 | 1.51% |
7.Portfolio turnover is calculated at the fund level and is not annualized for periods less than one year, if applicable.
See accompanying Notes to Consolidated Financial Statements.
39 INVESCO HIGH YIELD BOND FACTOR FUND
CONSOLIDATED FINANCIAL HIGHLIGHTS Continued
| Nine Months | |
| Ended | Period |
Class R5 | February 29, | Ended |
2020 May 31, 20191 |
Per Share Operating Data | | |
Net asset value, beginning of | | |
period | $8.97 | $9.02 |
Income (loss) from investment | | |
operations: | | |
Net investment income2 | 0.34 | 0.01 |
Net realized and unrealized | | |
gain (loss) | 0.03 | (0.06) |
Total from investment | | |
operations | 0.37 | (0.05) |
Dividends and/or distributions | | |
to shareholders: | | |
Dividends from net investment | | |
income | (0.33) | (0.00)3 |
Tax return of capital | | |
distribution | (0.02) | 0.00 |
Total dividends and/or | | |
distributions to shareholders | (0.35) | (0.00)3 |
Net asset value, end of period | $8.99 | $8.97 |
| | |
| | |
Total Return, at Net Asset | | |
Value4 | 4.16% | 3.48% |
| | |
Ratios/Supplemental Data | | |
Net assets, end of period (in | | |
thousands) | $10 | $10 |
Average net assets (in | | |
thousands) | $10 | $10 |
Ratios to average net assets:5 | | |
Net investment income | 5.02% | 5.91% |
Expenses excluding specific | | |
expenses listed below | 1.84% | 1.22% |
Interest and fees from | | |
borrowings | 0.00% | 0.00% |
Total expenses6 | 1.84% | 1.22% |
Expenses after payments, | | |
waivers and/or | | |
reimbursements and reduction | | |
to custodian expenses | 0.85% | 0.85% |
Portfolio turnover rate7 | 127% | 56% |
40 INVESCO HIGH YIELD BOND FACTOR FUND
1.For the period from after the close of business on May 24, 2019 (inception of offering) to May 31, 2019.
2.Calculated based on the average shares outstanding during the period.
3.Less than $0.005 per share.
4.Includes adjustments in accordance with accounting principles generally accepted in the United States of America and as such, the net asset value for financial reporting purposes and the returns based upon those net asset values may differ from the net asset value and returns for shareholder transactions. Does not include sales charges and is not annualized for periods less than one year, if applicable.
5.Annualized for periods less than one full year.
6.Total expenses including indirect expenses from fund fees and expenses were as follows:
Nine Months Ended February 29, 2020 | 1.85% |
Period Ended May 31, 2019 | 1.22% |
7.Portfolio turnover is calculated at the fund level and is not annualized for periods less than one year, if applicable.
See accompanying Notes to Consolidated Financial Statements.
41 INVESCO HIGH YIELD BOND FACTOR FUND
CONSOLIDATED FINANCIAL HIGHLIGHTS Continued
| Nine Months | | | | | |
| Ended | Year Ended | Year Ended | Year Ended | Year Ended | Year Ended |
Class R6 | February 29, | May 31, | May 31, | May 31, | May 31, | May 29, |
2020 | 2019 | 2018 | 2017 | 2016 | 20151 |
Per Share Operating Data | | | | | | |
Net asset value, beginning of | | | | | | |
period | $8.97 | $9.16 | $9.50 | $9.07 | $9.75 | $10.25 |
Income (loss) from investment | | | | | | |
operations: | | | | | | |
Net investment income2 | 0.35 | 0.54 | 0.52 | 0.48 | 0.47 | 0.49 |
Net realized and unrealized | | | | | | |
gain (loss) | 0.04 | (0.19) | (0.33) | 0.44 | (0.67) | (0.47) |
Total from investment | | | | | | |
operations | 0.39 | 0.35 | 0.19 | 0.92 | (0.20) | 0.02 |
Dividends and/or distributions | | | | | | |
to shareholders: | | | | | | |
Dividends from net investment | | | | | | |
income | (0.34) | (0.54) | (0.53) | (0.49) | (0.48) | (0.52) |
Tax return of capital | | | | | | |
distribution | (0.02) | 0.00 | 0.00 | 0.00 | 0.00 | 0.00 |
Total dividends and/or | | | | | | |
distributions to shareholders | (0.36) | (0.54) | (0.53) | (0.49) | (0.48) | (0.52) |
Net asset value, end of period | $9.00 | $8.97 | $9.16 | $9.50 | $9.07 | $9.75 |
| | | | | | |
| | | | | | |
Total Return, at Net Asset | | | | | | |
Value3 | 4.32% | 3.98% | 1.97% | 10.34% | (1.87)% | 0.28% |
| | | | | | |
Ratios/Supplemental Data | | | | | | |
Net assets, end of period (in | | | | | | |
thousands) | $110 | $123 | $13,165 | $9,843 | $22,186 | $15,272 |
Average net assets (in | | | | | | |
thousands) | $103 | $6,395 | $12,892 | $16,472 | $20,034 | $7,400 |
Ratios to average net assets:4 | | | | | | |
Net investment income | 5.05% | 5.96% | 5.56% | 5.12% | 5.26% | 5.13% |
Expenses excluding specific | | | | | | |
expenses listed below | 1.81% | 1.31% | 1.24% | 1.18% | 1.27% | 1.07% |
Interest and fees from | | | | | | |
borrowings | 0.00% | 0.00%5 | 0.00%5 | 0.00%5 | 0.00%5 | 0.00% |
Total expenses | 1.81%6 | 1.31%6 | 1.24%6 | 1.18%6 | 1.27%6 | 1.07% |
Expenses after payments, | | | | | | |
waivers and/or | | | | | | |
reimbursements and reduction | | | | | | |
to custodian expenses | 0.82% | 0.80% | 0.71% | 0.86% | 0.89% | 0.80% |
Portfolio turnover rate7 | 127% | 56% | 71% | 89% | 54% | 67% |
42 INVESCO HIGH YIELD BOND FACTOR FUND
1.Represents the last business day of the Fund's reporting period.
2.Calculated based on the average shares outstanding during the period.
3.Includes adjustments in accordance with accounting principles generally accepted in the United States of America and as such, the net asset value for financial reporting purposes and the returns based upon those net asset values may differ from the net asset value and returns for shareholder transactions. Does not include sales charges and is not annualized for periods less than one year, if applicable.
4.Annualized for periods less than one full year.
5.Less than 0.005%.
6.Total expenses including indirect expenses from fund fees and expenses were as follows:
Nine Months Ended February 29, 2020 | 1.82% |
Year Ended May 31, 2019 | 1.31% |
Year Ended May 31, 2018 | 1.24% |
Year Ended May 31, 2017 | 1.18% |
Year Ended May 31, 2016 | 1.28% |
7.Portfolio turnover is calculated at the fund level and is not annualized for periods less than one year, if applicable.
See accompanying Notes to Consolidated Financial Statements.
43 INVESCO HIGH YIELD BOND FACTOR FUND
NOTES TO
CONSOLIDATED FINANCIAL STATEMENTS February 29, 2020
Note 1 - Significant Accounting Policies
Invesco High Yield Bond Factor Fund (the "Fund"), formerly Invesco Oppenheimer Global High Yield Fund is a series portfolio of AIM Investment Securities Funds (Invesco Investment Securities Funds) (the "Trust"). The Trust is a Delaware statutory trust registered under the Investment Company Act of 1940, as amended (the "1940 Act"), as an open-end series management investment company authorized to issue an unlimited number of shares of beneficial interest. Information presented in these consolidated financial statements pertains only to the Fund. Matters affecting the Fund or each class will be voted on exclusively by the shareholders of such Fund or each class.
Prior to the close of business on May 24, 2019, the Fund operated as Oppenheimer Global High Yield Fund (the "Acquired Fund" or "Predecessor Fund"). The Acquired Fund was reorganized after the close of business on May 24, 2019 (the "Reorganization Date") through the transfer of all of its assets and liabilities to the Fund (the "Reorganization").
Prior to February 28, 2020, the Fund sought to gain exposure to Regulation S securities primarily through investments in the Invesco Oppenheimer Global High Yield Fund (Cayman) Ltd. (the "Subsidiary"), a wholly-owned and controlled subsidiary by the Fund organized under the laws of the Cayman Islands. The Subsidiary was organized by the Fund to invest in Regulation S securities. The Fund may invest up to 25% of its total assets in the Subsidiary under its previous strategy. Effective February 28, 2020 the Fund no longer invests in Regulation S securities or the Subsidiary, and the Subsidiary was liquidated.
Effective August 31, 2019 the Fund's fiscal year end changed from May 31 to the last day of February.
The Fund's investment objective is to seek total return.
The Fund currently consists of six different classes of shares: Class A, Class C, Class R, Class Y, Class R5 and Class R6. Class Y shares are available only to certain investors. Class A shares are sold with a front-end sales charge unless certain waiver criteria are met and under certain circumstances load waived shares may be subject to contingent deferred sales charges ("CDSC"). Class C shares are sold with a CDSC. Class R, Class Y, Class R5 and Class R6 shares are sold at net asset value. Class C shares held for ten years after purchase are eligible for automatic conversion into Class A shares of the same Fund (the "Conversion Feature"). The automatic conversion pursuant to the Conversion Feature will generally occur at the end of the month following the tenth anniversary after a purchase of Class C shares.
The Fund is an investment company and accordingly follows the investment company accounting and reporting guidance in accordance with Financial Accounting Standards Board Accounting Standards Codification Topic 946, Financial Services – Investment Companies.
The following is a summary of the significant accounting policies followed by the Fund in the preparation of its consolidated financial statements.
A. Security Valuations - Securities, including restricted securities, are valued according to the following policy.
Debt obligations (including convertible securities) and unlisted equities are fair valued using an evaluated quote provided by an independent pricing service. Evaluated quotes provided by the pricing service may be determined without exclusive reliance on quoted
44 INVESCO HIGH YIELD BOND FACTOR FUND
prices, and may reflect appropriate factors such as institution-size trading in similar groups of securities, developments related to specific securities, dividend rate (for unlisted equities), yield (for debt obligations), quality, type of issue, coupon rate (for debt obligations), maturity (for debt obligations), individual trading characteristics and other market data. Pricing services generally value debt obligations assuming orderly transactions of institutional round lot size, but a fund may hold or transact in the same securities in smaller, odd lot sizes. Odd lots often trade at lower prices than institutional round lots. Debt obligations are subject to interest rate and credit risks. In addition, all debt obligations involve some risk of default with respect to interest and/or principal payments.
A security listed or traded on an exchange (except convertible securities) is valued at its last sales price or official closing price as of the close of the customary trading session on the exchange where the security is principally traded, or lacking any sales or official closing price on a particular day, the security may be valued at the closing bid price on that day. Securities traded in the over-the-counter market are valued based on prices furnished by independent pricing services or market makers. When such securities are valued by an independent pricing service they may be considered fair valued. Futures contracts are valued at the final settlement price set by an exchange on which they are principally traded. Listed options are valued at the mean between the last bid and asked prices from the exchange on which they are principally traded. Options not listed on an exchange are valued by an independent source at the mean between the last bid and asked prices. For purposes of determining net asset value ("NAV") per share, futures and option contracts generally are valued 15 minutes after the close of the customary trading session of the New York Stock Exchange ("NYSE").
Investments in open-end and closed-end registered investment companies that do not trade on an exchange are valued at the end-of-day net asset value per share. Investments in open-end and closed-end registered investment companies that trade on an exchange are valued at the last sales price or official closing price as of the close of the customary trading session on the exchange where the security is principally traded.
Swap agreements are fair valued using an evaluated quote, if available, provided by an independent pricing service. Evaluated quotes provided by the pricing service are valued based on a model which may include end-of-day net present values, spreads, ratings, industry, company performance and returns of referenced assets. Centrally cleared swap agreements are valued at the daily settlement price determined by the relevant exchange or clearinghouse.
Foreign securities' (including foreign exchange contracts) prices are converted into U.S. dollar amounts using the applicable exchange rates as of the close of the NYSE. If market quotations are available and reliable for foreign exchange-traded equity securities, the securities will be valued at the market quotations. Because trading hours for certain foreign securities end before the close of the NYSE, closing market quotations may become unreliable. If between the time trading ends on a particular security and the close of the customary trading session on the NYSE, events occur that the investment adviser determines are significant and make the closing price unreliable, the Fund may fair value the security. If the event is likely to have affected the closing price of the security, the
45 INVESCO HIGH YIELD BOND FACTOR FUND
NOTES TO
CONSOLIDATED FINANCIAL STATEMENTS Continued
security will be valued at fair value in good faith using procedures approved by the Board of Trustees. Adjustments to closing prices to reflect fair value may also be based on a screening process of an independent pricing service to indicate the degree of certainty, based on historical data, that the closing price in the principal market where a foreign security trades is not the current value as of the close of the NYSE. Foreign securities' prices meeting the approved degree of certainty that the price is not reflective of current value will be priced at the indication of fair value from the independent pricing service. Multiple factors may be considered by the independent pricing service in determining adjustments to reflect fair value and may include information relating to sector indices, American Depositary Receipts and domestic and foreign index futures. Foreign securities may have additional risks including exchange rate changes, potential for sharply devalued currencies and high inflation, political and economic upheaval, the relative lack of issuer information, relatively low market liquidity and the potential lack of strict financial and accounting controls and standards.
Securities for which market prices are not provided by any of the above methods may be valued based upon quotes furnished by independent sources. The last bid price may be used to value equity securities. The mean between the last bid and asked prices is used to value debt obligations, including corporate loans.
Securities for which market quotations are not readily available or became unreliable are valued at fair value as determined in good faith by or under the supervision of the Trust's officers following procedures approved by the Board of Trustees. Issuer specific events, market trends, bid/asked quotes of brokers and information providers and other market data may be reviewed in the course of making a good faith determination of a security's fair value.
The Fund may invest in securities that are subject to interest rate risk, meaning the risk that the prices will generally fall as interest rates rise and, conversely, the prices will generally rise as interest rates fall. Specific securities differ in their sensitivity to changes in interest rates depending on their individual characteristics. Changes in interest rates may result in increased market volatility, which may affect the value and/or liquidity of certain Fund investments.
Valuations change in response to many factors including the historical and prospective earnings of the issuer, the value of the issuer's assets, general economic conditions, interest rates, investor perceptions and market liquidity. Because of the inherent uncertainties of valuation, the values reflected in the consolidated financial statements may materially differ from the value received upon actual sale of those investments.
B. Securities Transactions and Investment Income - Securities transactions are accounted for on a trade date basis. Realized gains or losses on sales are computed on the basis of specific identification of the securities sold. Interest income (net of withholding tax, if any) is recorded on the accrual basis from settlement date. Bond premiums and discounts are amortized and/or accreted over the lives of the respective securities. Pay-in-kind interest income and non-cash dividend income received in the form of securities in-lieu of cash are recorded at the fair value of the securities received. Paydown gains and losses on mortgage and asset-backed securities are recorded as adjustments to interest income. Dividend
46 INVESCO HIGH YIELD BOND FACTOR FUND
income (net of withholding tax, if any) is recorded on the ex-dividend date.
The Fund may periodically participate in litigation related to Fund investments. As such, the Fund may receive proceeds from litigation settlements. Any proceeds received are included in the Consolidated Statement of Operations as realized gain (loss) for investments no longer held and as unrealized gain (loss) for investments still held.
Brokerage commissions and mark ups are considered transaction costs and are recorded as an increase to the cost basis of securities purchased and/or a reduction of proceeds on a sale of securities. Such transaction costs are included in the determination of net realized and unrealized gain (loss) from investment transactions reported in the Consolidated Statement of Operations and the Consolidated Statement of Changes in Net Assets and the net realized and unrealized gains (losses) on securities per share in the Consolidated Financial Highlights. Transaction costs are included in the calculation of the Fund's net asset value and, accordingly, they reduce the Fund's total returns. These transaction costs are not considered operating expenses and are not reflected in net investment income reported
in the Consolidated Statement of Operations and the Consolidated Statement of Changes in Net Assets, or the net investment income per share and the ratios of expenses and net investment income reported in the Consolidated Financial Highlights, nor are they limited by any expense limitation arrangements between the Fund and the investment adviser.
The Fund allocates income and realized and unrealized capital gains and losses to a class based on the relative net assets of each class.
C. Country Determination - For the purposes of making investment selection decisions and presentation in the Consolidated Schedule of Investments, the investment adviser may determine the country in which an issuer is located and/or credit risk exposure based on various factors. These factors include the laws of the country under which the issuer is organized, where the issuer maintains a principal office, the country in which the issuer derives 50% or more of its total revenues and the country that has the primary market for the issuer's securities, as well as other criteria. Among the other criteria that may be evaluated for making this determination are the country in which the issuer maintains 50% or more of its assets, the type of security, financial guarantees and enhancements, the nature of the collateral and the sponsor organization.
D. Distributions - Dividends and distributions to shareholders, which are determined in accordance with income tax regulations and may differ from accounting principles generally accepted in the United States of America ("GAAP"), are recorded on the ex-dividend date. Income distributions, if any, are declared and paid monthly. Capital gain distributions, if any, are declared and paid annually or at other times as determined necessary by the Adviser.
E. Federal Income Taxes - The Fund intends to comply with the requirements of Subchapter M of the Internal Revenue Code of 1986, as amended (the "Internal Revenue Code"), necessary to qualify as a regulated investment company and to distribute substantially all of the Fund's taxable earnings to shareholders. As such, the Fund will not be subject to federal income taxes on otherwise taxable income (including net realized capital gain) that is distributed to shareholders. Therefore, no provision for federal income taxes is recorded in the consolidated financial statements.
The Fund recognizes the tax benefits of uncertain tax positions only when the position is
47 INVESCO HIGH YIELD BOND FACTOR FUND
NOTES TO
CONSOLIDATED FINANCIAL STATEMENTS Continued
more likely than not to be sustained. Management has analyzed the Fund's uncertain tax positions and concluded that no liability for unrecognized tax benefits should be recorded related to uncertain tax positions. Management is not aware of any tax positions for which it is reasonably possible that the total amounts of unrecognized tax benefits will change materially in the next 12 months.
The Subsidiary is classified as a controlled foreign corporation under Subchapter N of the Internal Revenue Code. Therefore, the Fund is required to increase its taxable income by its share of the Subsidiary's income. Net investment losses of the Subsidiary cannot be deducted by the Fund in the current period nor carried forward to offset taxable income in future periods.
F. Expenses - Fees provided for under the Rule 12b-1 plan of a particular class of the Fund are charged to the operations of such class. Transfer agency fees and expenses and other shareholder recordkeeping fees and expenses attributable to Class R5 and Class R6 are allocated to each share class based on relative net assets. Sub-accounting fees attributable to Class R5 are charged to the operations of the class. Transfer agency fees and expenses and other shareholder recordkeeping fees and expenses relating to all other classes are allocated among those classes based on relative net assets. All other expenses are allocated among the classes based on relative net assets.
G. Accounting Estimates - The consolidated financial statements are prepared on a basis in conformity with GAAP, which requires management to make estimates and assumptions that affect the reported amounts of assets and liabilities at the date of the consolidated financial statements and the reported amounts of revenues and expenses during the reporting period including estimates and assumptions related to taxation. Actual results could differ from those estimates by a significant amount. The accompanying consolidated financial statements reflect the financial position of the Fund and its Subsidiary and the results of operations on a consolidated basis. All inter-company accounts and transactions have been eliminated in consolidation. In addition, the Fund monitors for material events or transactions that may occur or become known after the period-end date and before the date the consolidated financial statements are released to print.
H. Indemnifications - Under the Trust's organizational documents, each Trustee, officer, employee or other agent of the Trust, and under the Subsidiary's organizational documents, the directors and officers of the Subsidiary, are indemnified against certain liabilities
that may arise out of the performance of their duties to the Fund and/or the Subsidiary, respectively. Additionally, in the normal course of business, the Fund enters into contracts, including the Fund's servicing agreements, that contain a variety of indemnification clauses. The Fund's maximum exposure under these arrangements is unknown as this would involve future claims that may be made against the Fund that have not yet occurred. The risk of material loss as a result of such indemnification claims is considered remote.
I. Foreign Currency Translations - Foreign currency is valued at the close of the NYSE based on quotations posted by banks and major currency dealers. Portfolio securities and other assets and liabilities denominated in foreign currencies are translated into U.S. dollar amounts at the date of valuation. Purchases and sales of portfolio securities (net of foreign taxes withheld on disposition) and income items denominated in foreign currencies
48 INVESCO HIGH YIELD BOND FACTOR FUND
are translated into U.S. dollar amounts on the respective dates of such transactions. The Fund does not separately account for the portion of the results of operations resulting from changes in foreign exchange rates on investments and the fluctuations arising from changes in market prices of securities held. The combined results of changes in foreign exchange rates and the fluctuation of market prices on investments (net of estimated foreign tax withholding) are included with the net realized and unrealized gain or loss from investments in the Consolidated Statement of Operations. Reported net realized foreign currency gains or losses arise from (1) sales of foreign currencies, (2) currency gains or losses realized between the trade and settlement dates on securities transactions, and
(3)the difference between the amounts of dividends, interest, and foreign withholding
taxes recorded on the Fund's books and the U.S. dollar equivalent of the amounts actually received or paid. Net unrealized foreign currency gains and losses arise from changes in the fair values of assets and liabilities, other than investments in securities at fiscal period end, resulting from changes in exchange rates. The Fund may invest in foreign securities, which may be subject to foreign taxes on income, gains on investments or currency repatriation, a portion of which may be recoverable. Foreign taxes, if any, are recorded based on the tax regulations and rates that exist in the foreign markets in which the Fund invests and are shown in the Consolidated Statement of Operations.
J.Forward Foreign Currency Contracts - The Fund may engage in foreign currency transactions either on a spot (i.e. for prompt delivery and settlement) basis, or through forward foreign currency contracts, to manage or minimize currency or exchange rate risk.
The Fund may also enter into forward foreign currency contracts for the purchase or sale of a security denominated in a foreign currency in order to "lock in" the U.S. dollar price of that security, or the Fund may also enter into forward foreign currency contracts that do not provide for physical settlement of the two currencies, but instead are settled by a single cash payment calculated as the difference between the agreed upon exchange rate and the spot rate at settlement based upon an agreed upon notional amount (non-deliverable forwards). The Fund will set aside liquid assets in an amount equal to the daily mark-to- market obligation for forward foreign currency contracts.
A forward foreign currency contract is an obligation between two parties
("Counterparties") to purchase or sell a specific currency for an agreed-upon price at a future date. The use of forward foreign currency contracts does not eliminate fluctuations in the price of the underlying securities the Fund owns or intends to acquire but establishes a rate of exchange in advance. Fluctuations in the value of these contracts are measured by the difference in the contract date and reporting date exchange rates and are recorded as unrealized appreciation (depreciation) until the contracts are closed. When the contracts are closed, realized gains (losses) are recorded. Realized and unrealized gains (losses) on the contracts are included in the Consolidated Statement of Operations. The primary risks associated with forward foreign currency contracts include failure of the Counterparty to meet the terms of the contract and the value of the foreign currency changing unfavorably.
These risks may be in excess of the amounts reflected in the Consolidated Statement of
Assets and Liabilities.
K.Futures - The Fund may enter into futures contracts to manage exposure to interest
49 INVESCO HIGH YIELD BOND FACTOR FUND
NOTES TO
CONSOLIDATED FINANCIAL STATEMENTS Continued
rate, equity and market price movements and/or currency risks. A futures contract is an agreement between Counterparties to purchase or sell a specified underlying security, currency or commodity (or delivery of a cash settlement price, in the case of an index future) for a fixed price at a future date. The Fund currently invests only in exchange-traded futures and they are standardized as to maturity date and underlying financial instrument. Initial margin deposits required upon entering into futures contracts are satisfied by the segregation of specific securities or cash as collateral at the futures commission merchant (broker). During the period the futures contracts are open, changes in the value of the contracts are recognized as unrealized gains or losses by recalculating the value of the contracts on a daily basis. Subsequent or variation margin payments are received or made depending upon whether unrealized gains or losses are incurred. These amounts are reflected as receivables or payables on the Consolidated Statement of Assets and Liabilities. When the contracts are closed or expire, the Fund recognizes a realized gain or loss equal to the difference between the proceeds from, or cost of, the closing transaction and the Fund's basis in the contract. The net realized gain (loss) and the change in unrealized gain (loss) on futures contracts held during the period is included on the Consolidated Statement of Operations. The primary risks associated with futures contracts are market risk and
the absence of a liquid secondary market. If the Fund were unable to liquidate a futures contract and/or enter into an offsetting closing transaction, the Fund would continue to be subject to market risk with respect to the value of the contracts and continue to be required to maintain the margin deposits on the futures contracts. Futures contracts have minimal Counterparty risk since the exchange's clearinghouse, as Counterparty to all exchange-traded futures, guarantees the futures against default. Risks may exceed amounts recognized in the Consolidated Statement of Assets and Liabilities.
L. Swap Agreements - The Fund may enter into various swap transactions, including interest rate, total return, index, currency and credit default swap contracts ("CDS") for investment purposes or to manage interest rate, currency or credit risk. Such transactions are agreements between Counterparties. A swap agreement may be negotiated bilaterally and traded over-the-counter ("OTC") between two parties ("uncleared/OTC") or, in some instances, must be transacted through a future commission merchant ("FCM") and cleared through a clearinghouse that serves as a central Counterparty ("centrally cleared swap"). These agreements may contain among other conditions, events of default and termination events, and various covenants and representations such as provisions that require the Fund to maintain a pre-determined level of net assets, and/or provide limits regarding the decline of the Fund's NAV over specific periods of time. If the Fund were to trigger such provisions and have open derivative positions at that time, the Counterparty may be able to terminate such agreement and request immediate payment in an amount equal to the net liability positions, if any.
Interest rate, total return, index, and currency swap agreements are two-party contracts entered into primarily to exchange the returns (or differentials in rates of returns) earned or realized on particular predetermined investments or instruments. The gross returns to be exchanged or "swapped" between the parties are calculated with respect to a notional amount, i.e., the return on or increase in value of a particular dollar amount invested at a
50 INVESCO HIGH YIELD BOND FACTOR FUND
particular interest rate or return of an underlying asset, in a particular foreign currency, or in a "basket" of securities representing a particular index.
In a centrally cleared swap, the Fund's ultimate Counterparty is a central clearinghouse. The Fund initially will enter into centrally cleared swaps through an executing broker. When a fund enters into a centrally cleared swap, it must deliver to the central Counterparty (via the FCM) an amount referred to as "initial margin." Initial margin requirements are determined by the central Counterparty, but an FCM may require additional initial margin above the amount required by the central Counterparty. Initial margin deposits required upon entering into centrally cleared swaps are satisfied by cash or securities as collateral at the FCM. Securities deposited as initial margin are designated on the Consolidated Schedule of Investments and cash deposited is recorded on the Consolidated Statement of Assets and Liabilities. During the term of a cleared swap agreement, a "variation margin" amount may be required to be paid by the Fund or may be received by the Fund, based on the daily change in price of the underlying reference instrument subject to the swap agreement and is recorded as a receivable or payable for variation margin
in the Consolidated Statement of Assets and Liabilities until the centrally cleared swap is terminated at which time a realized gain or loss is recorded.
A CDS is an agreement between Counterparties to exchange the credit risk of an issuer. A buyer of a CDS is said to buy protection by paying a fixed payment over the life of the agreement and in some situations an upfront payment to the seller of the CDS. If a defined credit event occurs (such as payment default or bankruptcy), the Fund as a protection buyer would cease paying its fixed payment, the Fund would deliver eligible bonds issued by the reference entity to the seller, and the seller would pay the full notional value, or the "par value", of the referenced obligation to the Fund. A seller of a CDS is said to sell protection and thus would receive a fixed payment over the life of the agreement and an upfront payment, if applicable. If a credit event occurs, the Fund as a protection seller would cease to receive the fixed payment stream, the Fund would pay the buyer "par value" or the
full notional value of the referenced obligation, and the Fund would receive the eligible bonds issued by the reference entity. In turn, these bonds may be sold in order to realize a recovery value. Alternatively, the seller of the CDS and its Counterparty may agree to net the notional amount and the market value of the bonds and make a cash payment equal to the difference to the buyer of protection. If no credit event occurs, the Fund receives the fixed payment over the life of the agreement. As the seller, the Fund would effectively add leverage to its portfolio because, in addition to its total net assets, the Fund would be subject to investment exposure on the notional amount of the CDS. In connection with these agreements, cash and securities may be identified as collateral in accordance with the terms of the respective swap agreements to provide assets of value and recourse in the event of default under the swap agreement or bankruptcy/insolvency of a party to the swap agreement. If a Counterparty becomes bankrupt or otherwise fails to perform its obligations due to financial difficulties, the Fund may experience significant delays in obtaining any recovery in a bankruptcy or other reorganization proceeding. The Fund may obtain only limited recovery or may obtain no recovery in such circumstances. The Fund's maximum risk of loss from Counterparty risk, either as the protection seller or as the protection buyer, is
51 INVESCO HIGH YIELD BOND FACTOR FUND
NOTES TO
CONSOLIDATED FINANCIAL STATEMENTS Continued
the value of the contract. The risk may be mitigated by having a master netting arrangement between the Fund and the Counterparty and by the designation of collateral by the Counterparty to cover the Fund's exposure to the Counterparty.
Implied credit spreads represent the current level at which protection could be bought or sold given the terms of the existing CDS contract and serve as an indicator of the current status of the payment/performance risk of the CDS. An implied spread that has widened or increased since entry into the initial contract may indicate a deteriorating credit profile and increased risk of default for the reference entity. A declining or narrowing spread may indicate an improving credit profile or decreased risk of default for the reference entity. Alternatively, credit spreads may increase or decrease reflecting the general tolerance for risk in the credit markets.
An interest rate swap is an agreement between Counterparties pursuant to which the parties exchange a floating rate payment for a fixed rate payment based on a specified notional amount.
Changes in the value of centrally cleared and OTC swap agreements are recognized as unrealized gains (losses) in the Consolidated Statement of Operations by "marking to market" on a daily basis to reflect the value of the swap agreement at the end of each trading day. Payments received or paid at the beginning of the agreement are reflected as such on the Consolidated Statement of Assets and Liabilities and may be referred to as upfront payments. The Fund accrues for the fixed payment stream and amortizes upfront payments, if any, on swap agreements on a daily basis with the net amount, recorded as a component of realized gain (loss) on the Consolidated Statement of Operations. A liquidation payment received or made at the termination of a swap agreement is recorded as realized gain (loss) on the Consolidated Statement of Operations. The Fund segregates cash or liquid securities having a value at least equal to the amount of the potential obligation of a Fund under any swap transaction. Cash held as collateral is recorded as deposits with brokers on the Consolidated Statement of Assets and Liabilities. Entering into these agreements involves, to varying degrees, lack of liquidity and elements of credit, market, and Counterparty risk in excess of amounts recognized on the Consolidated Statement of Assets and Liabilities. Such risks involve the possibility that a swap is difficult to sell or liquidate; the Counterparty does not honor its obligations under the agreement and unfavorable interest rates and market fluctuations. It is possible that developments in the swaps market, including potential government regulation, could adversely affect the Fund's ability to terminate existing swap agreements or to realize amounts to be received under such agreements. A short position in a security poses more risk than holding the same security long. As there is no limit on how much the price of the security can increase, the Fund's exposure is unlimited.
M. Put Options Purchased and Written - The Fund may purchase and write put options including options on securities indexes, or foreign currency and/or futures contracts. By purchasing a put option, the Fund obtains the right (but not the obligation) to sell the option's underlying instrument at a fixed strike price. In return for this right, the Fund pays an option premium. The option's underlying instrument may be a security, securities index, or a futures contract.
52 INVESCO HIGH YIELD BOND FACTOR FUND
Additionally, the Fund may enter into an option on a swap agreement, also called a "swaption". A swaption is an option that gives the buyer the right, but not the obligation, to enter into a swap on a future date in exchange for paying a market-based premium. A receiver swaption gives the owner the right to receive the total return of a specified asset, reference rate or index. Swaptions also include options that allow an existing swap to be terminated or extended by one of the Counterparties.
Put options may be used by the Fund to hedge securities it owns by locking in a minimum price at which the Fund can sell. If security prices fall, the put option could be exercised to offset all or a portion of the Fund's resulting losses. At the same time, because the maximum the Fund has at risk is the cost of the option, purchasing put options does not eliminate the potential for the Fund to profit from an increase in the value of the underlying portfolio securities. The Fund may write put options to earn additional income in the form of option premiums if it expects the price of the underlying instrument to remain stable
or rise during the option period so that the option will not be exercised. The risk in this strategy is that the price of the underlying securities may decline by an amount greater than the premium received. Put options written are reported as a liability in the Consolidated Statement of Assets and Liabilities. Realized and unrealized gains and losses on put options purchased and put options written are included in the Consolidated Statement
of Operations as Net realized gain (loss) from and Change in net unrealized appreciation (depreciation) of Investment securities and Option contracts written, respectively. A risk in buying an option is that the Fund pays a premium whether or not the option is exercised. In addition, there can be no assurance that a liquid secondary market will exist for any option purchased.
N. Call Options Purchased and Written - The Fund may write call options and/or buy call options. A covered call option gives the purchaser of such option the right to buy, and the writer the obligation to sell, the underlying security or foreign currency at the stated exercise price during the option period. An uncovered call option exists without the ownership of the underlying security. Options written by the Fund normally will have expiration dates between three and nine months from the date written. The exercise price of a call option may be below, equal to, or above the current market value of the underlying security at the time the option is written.
Additionally, the Fund may enter into an option on a swap agreement, also called a "swaption". A swaption is an option that gives the buyer the right, but not the obligation, to enter into a swap on a future date in exchange for paying a market-based premium. A receiver swaption gives the owner the right to receive the total return of a specified asset, reference rate or index. Swaptions also include options that allow an existing swap to be terminated or extended by one of the Counterparties.
When the Fund writes a covered call option, an amount equal to the premium received by the Fund is recorded as an asset and an equivalent liability in the Consolidated Statement of Assets and Liabilities. The amount of the liability is subsequently "marked- to-market" to reflect the current market value of the option written. If a written covered call option expires on the stipulated expiration date, or if the Fund enters into a closing purchase transaction, the Fund realizes a gain (or a loss if the closing purchase transaction
53 INVESCO HIGH YIELD BOND FACTOR FUND
NOTES TO
CONSOLIDATED FINANCIAL STATEMENTS Continued
exceeds the premium received when the option was written) without regard to any unrealized gain or loss on the underlying security, and the liability related to such option is extinguished. If a written covered call option is exercised, the Fund realizes a gain or a loss from the sale of the underlying security and the proceeds of the sale are increased by the premium originally received. Realized and unrealized gains and losses on call options written are included in the Consolidated Statement of Operations as Net realized gain (loss) from and Change in net unrealized appreciation (depreciation) of Option contracts written. A risk in writing a covered call option is that the Fund gives up the opportunity for profit if the market price of the security increases and the option is exercised. The risk in writing an uncovered call option is that the Fund may incur significant losses if the value of the written security exceeds the exercise price of the option.
When the Fund buys a call option, an amount equal to the premium paid by the Fund is recorded as an investment on the Consolidated Statement of Assets and Liabilities. The amount of the investment is subsequently "marked-to-market" to reflect the current value of the option purchased. Realized and unrealized gains and losses on call options purchased are included in the Consolidated Statement of Operations as Net realized gain (loss) from and Change in net unrealized appreciation (depreciation) of Investment securities. A risk in buying an option is that the Fund pays a premium whether or not the option is exercised. In addition, there can be no assurance that a liquid secondary market will exist for any option purchased.
O. Securities on a When-Issued or Delayed Delivery Basis - The Fund may purchase securities on a "when-issued" basis, and may purchase or sell securities on a "delayed delivery" basis, with payment and delivery scheduled for a future date. No income accrues to the Fund on the securities in connection with such transactions prior to the date the Fund actually takes delivery of the securities. These transactions are subject to market fluctuations and are subject to the risk that the value at delivery may be more or less than the trade date purchase price. Although the Fund will generally purchase these securities with the intention on acquiring such securities, they may sell such securities prior to the settlement date.
P. Other Risks - The Fund may invest in lower-quality debt securities, i.e., "junk bonds". Investments in lower-rated securities or unrated securities of comparable quality tend to be more sensitive to economic conditions than higher rated securities. Junk bonds involve a greater risk of default by the issuer because such securities are generally unsecured and are often subordinated to other creditors' claim. Prior to its repositioning, the Fund gained exposure to Regulation S securities primarily through an investment in the Subsidiary. Regulation S securities may be relatively less liquid as a result of legal or contractual restrictions on resale. The Fund is indirectly exposed to the risks associated with the Subsidiary's investments.
Q. Leverage Risk - Leverage exists when the Fund can lose more than it originally invests because it purchases or sells an instrument or enters into a transaction without investing an amount equal to the full economic exposure of the instrument or transaction.
54 INVESCO HIGH YIELD BOND FACTOR FUND
Note 2 - Advisory Fees and Other Fees Paid to Affiliates
The Trust has entered into a master investment advisory agreement with Invesco Advisers, Inc. (the "Adviser" or "Invesco"). Under the terms of the investment advisory agreement, the Fund accrues daily and pays monthly an advisory fee to the Adviser based on the annual rate of the Fund's average daily net assets as follows:
Fee Schedule Through February 29, 2020* | | Fee Schedule Effective February 28, 2020* |
Up to $500 million | 0.75% | | Up to $2 billion | 0.37% |
Next $500 million | 0.70 | | Over $2 billion | 0.35 |
Next $3 billion | 0.65 | | | |
Over $4 billion | 0.60 | | | |
*The advisory fee paid by the Fund shall be reduced by any amounts paid by the Fund under the administrative services agreement with the Adviser.
For the nine months ended February 29, 2020, the effective advisory fee rate incurred by the Fund was 0.74%.
The Subsidiary entered into a separate contract with the Adviser whereby the Adviser provided investment advisory and other services to the Subsidiary. In consideration of these services, the Subsidiary paid an advisory fee to the Adviser based on the annual rate of the Subsidiary's average daily net assets as set forth in the table above through February 28, 2020. Effective February 28, 2020 the contract between the Subsidiary and the Adviser was terminated.
Under the terms of a master sub-advisory agreement between the Adviser and each of Invesco Asset Management Deutschland GmbH, Invesco Asset Management Limited, Invesco Asset Management (Japan) Limited, Invesco Hong Kong Limited, Invesco Senior Secured Management, Inc. and Invesco Canada Ltd. and separate sub-advisory agreements with Invesco Capital Management LLC, and Invesco Asset Management (India) Private Limited (collectively, the "Affiliated Sub-Advisers") the Adviser, not the Fund, will pay 40% of the fees paid to the Adviser to any such Affiliated Sub-Adviser(s) that provide(s) discretionary investment management services to the Fund based on the percentage of assets allocated to such Affiliated Sub-Adviser(s). Invesco has also entered into a Sub-Advisory Agreement with OppenheimerFunds, Inc. to provide discretionary management services to the Fund.
Effective on the Reorganization Date, the Adviser has contractually agreed, through May 31, 2021, to waive advisory fees and/or reimburse expenses of all shares to the extent necessary to limit the total annual fund operating expenses after fee waiver and/or expense reimbursement (excluding certain items discussed below) of Class A, Class C, Class R, Class Y, Class R5 and Class R6 shares to 1.15%, 1.85%, 1.40%, 0.85%, 0.85% and 0.80%, respectively, of the Fund's average daily net assets (the "expense limits"). Effective February 28, 2020, the Fund's expense limitation agreement was amended to reflect a reduction to the Fund's existing expense limits. Under the amended expense limitation agreement, the Adviser has contractually agreed to waive advisory fees and/or reimburse expenses to the extent necessary to limit the Fund's Total Annual Fund Operating Expenses After Fee Waiver and/or
55 INVESCO HIGH YIELD BOND FACTOR FUND
NOTES TO
CONSOLIDATED FINANCIAL STATEMENTS Continued
Expense Reimbursement of Class A, Class C, Class R, Class Y, Class R5 and Class R6 shares to 0.64%, 1.39%, 0.89%, 0.39%, 0.39% and 0.39%, respectively, of the Fund's average daily net assets (the "expense limits") from February 28, 2020 through May 31, 2021. In determining the Adviser's obligation to waive advisory fees and/or reimburse expenses, the following expenses are not taken into account, and could cause total annual fund operating expenses after fee waivers and/or expense reimbursement to exceed the numbers reflected above: (1) interest; (2) taxes; (3) dividend expenses on short sales; (4) extraordinary or non- routine items, including litigation expenses; and (5) expenses that the Fund has incurred but did not actually pay because of an expense offset arrangement. Unless Invesco continues the fee waiver agreement, it will terminate on May 31, 2021. During its term, the fee waiver agreement cannot be terminated or amended to increase the expense limits or reduce the advisory fee waiver without approval of the Board of Trustees.
Further, the Adviser has contractually agreed, through at least June 30, 2021, to waive the advisory fee payable by the Fund in an amount equal to 100% of the net advisory fees the Adviser receives from the affiliated money market funds on investments by the Fund of uninvested cash in such affiliated money market funds.
For the nine months ended February 29, 2020, the Adviser waived advisory fees of $4,496 and reimbursed fund expenses of $215,889, $56,625, $28,168, $11,337, $74 and $748 for Class A, Class C, Class R, Class Y, Class R5 and Class R6, respectively.
The Trust has entered into a master administrative services agreement with Invesco pursuant to which the Fund has agreed to pay Invesco for certain administrative costs incurred in providing accounting services to the Fund. For the nine months ended February 29, 2020, expenses incurred under the agreement are shown in the Consolidated Statement of Operations as Administration fees. Additionally, Invesco has entered into service agreements whereby JPMorgan Chase Bank serves as custodian to the Fund. Prior to the Reorganization, the Acquired Fund paid administrative fees to OFI Global Asset Management, Inc.
The Trust has entered into a transfer agency and service agreement with Invesco Investment Services, Inc. ("IIS") pursuant to which the Fund has agreed to pay IIS a fee for providing transfer agency and shareholder services to the Fund and reimburse IIS for certain expenses incurred by IIS in the course of providing such services. IIS may make payments to intermediaries that provide omnibus account services, sub-accounting services and/or networking services. All fees payable by IIS to intermediaries that provide omnibus account services or sub-accounting services are charged back to the Fund, subject to certain limitations approved by the Trust's Board of Trustees. For the nine months ended February 29, 2020, expenses incurred under these agreements are shown in the Consolidated Statement of Operations as Transfer and shareholder servicing agent fees.
The Trust has entered into master distribution agreements with Invesco Distributors, Inc. ("IDI") to serve as the distributor for the Class A, Class C, Class R, Class Y, Class R5 and Class R6 shares of the Fund. The Trust has adopted plans pursuant to Rule 12b-1 under the 1940 Act with respect to the Fund's Class A, Class C and Class R shares (collectively the "Plan"). The Fund, pursuant to the Class A Plan, reimbursed IDI in an amount up to an annual rate of 0.25% of the average daily net assets of Class A shares. The Fund pursuant to the Class C and Class R Plan, pays IDI compensation at the annual rate of 1.00% of the average daily net
56 INVESCO HIGH YIELD BOND FACTOR FUND
assets of Class C and 0.50% of the average daily net assets of Class R shares. The fees are accrued daily and paid monthly. Of the Plan payments, up to 0.25% of the average daily net assets of each class of shares may be paid to furnish continuing personal shareholder services to customers who purchase and own shares of such classes. Any amounts not paid as a service fee under the Plan would constitute an asset-based sales charge. Rules of the Financial Industry Regulatory Authority ("FINRA") impose a cap on the total sales charges, including asset-based sales charges, that may be paid by any class of shares of the Fund plans. Prior to the Reorganization, the Acquired Fund paid distribution fees to OppenheimerFunds Distributor, Inc. For the nine months ended February 29, 2020, expenses incurred under the plans are shown in the Consolidated Statement of Operations as Distribution and service plan fees.
Front-end sales commissions and CDSC (collectively, the "sales charges") are not recorded as expenses of the Fund. Front-end sales commissions are deducted from proceeds from the sales of Fund shares prior to investment in Class A shares of the Fund. CDSC are deducted from redemption proceeds prior to remittance to the shareholder. During the nine months ended February 29, 2020, IDI advised the Fund that IDI retained $5,174 in front-end sales commissions from the sale of Class A shares and $153 from Class C shares for CDSC imposed on redemptions by shareholders.
Certain officers and trustees of the Trust are officers and directors of the Adviser, IIS and/or IDI.
Note 3 - Additional Valuation Information
GAAP defines fair value as the price that would be received to sell an asset or paid to transfer a liability in an orderly transaction between market participants at the measurement date, under current market conditions. GAAP establishes a hierarchy that prioritizes the inputs
to valuation methods, giving the highest priority to readily available unadjusted quoted prices in an active market for identical assets (Level 1) and the lowest priority to significant unobservable inputs (Level 3), generally when market prices are not readily available or are unreliable. Based on the valuation inputs, the securities or other investments are tiered into one of three levels. Changes in valuation methods may result in transfers in or out of an investment's assigned level:
Level 1 — Prices are determined using quoted prices in an active market for identical assets.
Level 2 — Prices are determined using other significant observable inputs. Observable inputs are inputs that other market participants may use in pricing a security. These may include quoted prices for similar securities, interest rates, prepayment speeds, credit risk, yield curves, loss severities, default rates, discount rates, volatilities and others.
Level 3 — Prices are determined using significant unobservable inputs. In situations where quoted prices or observable inputs are unavailable (for example, when there is little or no market activity for an investment at the end of the period), unobservable inputs may be used. Unobservable inputs reflect the Fund's own assumptions about the factors market participants would use in determining fair value of the securities or instruments and would be based on the best available information.
57 INVESCO HIGH YIELD BOND FACTOR FUND
NOTES TO
CONSOLIDATED FINANCIAL STATEMENTS Continued
The following is a summary of the tiered valuation input levels, as of February 29, 2020. The level assigned to the securities valuations may not be an indication of the risk or liquidity associated with investing in those securities. Because of the inherent uncertainties of valuation, the values reflected in the consolidated financial statements may materially differ from the value received upon actual sale of those investments.
| | | | | | Level 3— | |
| | Level 1— | | Level 2— | | Significant | |
| | Unadjusted | | Other Significant | | Unobservable | |
| | Quoted Prices | | Observable Inputs | | Inputs | Value |
Assets Table | | | | | | | |
Investments, at Value: | | | | | | | |
Asset-Backed Security | $ | — $ | 249,684 | $ | — $ | 249,684 |
Foreign Government Obligations | | — | | 615,615 | | — | 615,615 |
Corporate Loans | | — | | 36,433 | | — | 36,433 |
Corporate Bonds and Notes | | — | | 30,591,900 | | — | 30,591,900 |
Preferred Stock | | — | | 875 | | — | 875 |
Common Stocks | | — | | 11,000 | | — | 11,000 |
Rights, Warrants and Certificates | | — | | — | | — | — |
Investment Companies | | 2,555,798 | | — | | — | 2,555,798 |
Total Investments, at Value | | 2,555,798 | | 31,505,507 | | — | 34,061,305 |
Other Financial Instruments: | | | | | | | |
Futures contracts | | 39,216 | | — | | — | 39,216 |
Forward currency exchange contracts | | — | | 64 | | — | 64 |
Total Assets | $ | 2,595,014 | $ | 31,505,571 | $ | — $ | 34,100,585 |
Liabilities Table | | | | | | | |
Other Financial Instruments: | | | | | | | |
Futures contracts | $ | (17,294) | $ | — $ | — $ | (17,294) |
Forward currency exchange contracts | | — | | (3,982) | | — | (3,982) |
Total Liabilities | $ | (17,294) | $ | (3,982) | $ | — $ | (21,276) |
Forward currency exchange contracts and futures contracts, if any, are reported at their unrealized appreciation/depreciation at measurement date, which represents the change in the contract's value from trade date. All additional assets and liabilities included in the above table are reported at their market value at measurement date.
Note 4 - Derivative Investments
The Fund may enter into an International Swaps and Derivatives Association Master Agreement ("ISDA Master Agreement") under which a fund may trade OTC derivatives. An OTC transaction entered into under an ISDA Master Agreement typically involves a collateral posting arrangement, payment netting provisions and close-out netting provisions. These netting provisions allow for reduction of credit risk through netting of contractual obligations. The enforceability of the netting provisions of the ISDA Master Agreement depends on the governing law of the ISDA Master Agreement, among other factors. For financial reporting purposes, the Fund does not offset OTC derivative assets or liabilities that are subject to ISDA Master Agreements in the Consolidated Statement of Assets and Liabilities.
58 INVESCO HIGH YIELD BOND FACTOR FUND
Offsetting Assets and Liabilities
The table below reflects the Fund's exposure to Counterparties subject to either an ISDA Master Agreement or other agreement for OTC derivative asset transactions as of February 29, 2020:
| | | Gross Amounts Not Offset in the Consolidated | |
| | | | Statement of Assets & Liabilities | |
| | Gross Amounts | | | | | | |
| Not Offset in the | | | | | | |
| | Consolidated | | Financial | Financial | | | |
| | Statement | | Instruments | Instruments | | | |
| | of Assets & | | Available for | Collateral Cash Collateral | |
Counterparty | | Liabilities* | | Offset | Received** | Received** | Net Amount |
Citibank NA. | $ | 64 | $ | – $ | – $ | – $ | 64 |
*OTC derivatives are reported gross on the Consolidated Statement of Assets and Liabilities. Exchange traded options and margin related to centrally cleared swaps and futures, if any, are excluded from these reported amounts. **Reported collateral posted for the benefit of the Fund within this table is limited to the net outstanding amount due from an individual counterparty. The collateral posted for the benefit of the Fund may exceed these amounts.
The table below reflects the Fund's exposure to Counterparties subject to either an ISDA Master Agreement or other agreement for OTC derivative liability transactions as of February 29, 2020:
| | | Gross Amounts Not Offset in the Consolidated | |
| | | | Statement of Assets & Liabilities | |
| | Gross Amounts | | | | | | |
| Not Offset in the | | | | | | |
| | Consolidated | | Financial | Financial | | | |
| | Statement | | Instruments | Instruments | | | |
| | of Assets & | | Available for | Collateral Cash Collateral | |
Counterparty | | Liabilities* | | Offset | Pledged** | Pledged** | Net Amount |
RBC Dominion | | | | | | | | |
Securities | $ | (3,982) | $ | – $ | – $ | – $ | (3,982) |
*OTC derivatives are reported gross on the Consolidated Statement of Assets and Liabilities. Exchange traded options and margin related to centrally cleared swaps and futures, if any, are excluded from these reported amounts. **Reported collateral pledged within this table is limited to the net outstanding amount due from the Fund. The securities pledged as collateral by the Fund as reported on the Consolidated Schedule of Investments may exceed these amounts.
Value of Derivative Instruments at Period-End
The table below summarizes the value of the Fund's derivative investments, detailed by primary risk exposure, held as of February 29, 2020:
59 INVESCO HIGH YIELD BOND FACTOR FUND
NOTES TO
CONSOLIDATED FINANCIAL STATEMENTS Continued
| Asset Derivatives | | | | Liability Derivatives | | |
| Consolidated | | | | Consolidated | | |
| Statement of Assets | | | | Statement of Assets | | |
| and Liabilities Location | | Value | | and Liabilities Location | | Value |
Interest rate contracts Futures contracts | $ | 39,216* | | Futures contracts | $ | 17,294* |
| Unrealized appreciation on | | | | Unrealized depreciation on | | |
Forward currency | forward currency exchange | | | | forward currency exchange | | |
exchange contracts | contracts | | 64 | | contracts | | 3,982 |
Derivative Assets/ | | | | | | | |
Liabilities not subject | | | | | | | |
to master netting | | | | | | | |
agreements | | | (39,216) | | | | (17,294) |
Total Derivative | | | | | | | |
Assets/Liabilities | | | | | | | |
subject to master | | $ | 64 | | | $ | 3,982 |
netting agreements | | | |
| | | | | | | |
*Includes only the current day's variation margin. Prior variation margin movements have been reflected in cash on the Consolidated Statement of Assets and Liabilities upon receipt or payment.
Effect of Derivative Investments for the Nine Months Ended February 29, 2020
The tables below summarize the gains (losses) on derivative investments, detailed by primary risk exposure, recognized in earnings during the period:
Amount of Realized Gain or (Loss) Recognized on Derivatives
Derivatives | | | | Investment | | | | |
Not Accounted | | | | transactions | | Swaption | | |
for as Hedging | | | | in unaffiliated | | contracts | | Futures |
Instruments | | | | companies* | | written | | contracts |
Credit contracts | $ | (5,365) | $ | 2,465 | $ | — |
Forward currency | | | | | | | | |
exchange contracts | | | | — | | — | | — |
Interest rate contracts | | | | — | | — | | 92,875 |
Total | $ | (5,365) | $ | 2,465 | $ | 92,875 |
| | | | | |
| | | | | |
| Amount of Realized Gain or (Loss) Recognized on Derivatives | | |
Derivatives | | | | Forward | | | | |
Not Accounted | | | | currency | | | | |
for as Hedging | | | | exchange | | | | |
Instruments | | | | contracts Swap contracts | | Total |
Credit contracts | $ | — | $ | (7,497) | $ | (10,397) |
Forward currency | | | | | | | | |
exchange contracts | | | | 926 | | — | | 926 |
Interest rate contracts | | | | — | | — | | 92,875 |
Total | $ | 926 | $ | (7,497) | $ | 83,404 |
| | | | | | | | |
| | | | | | | | |
60 INVESCO HIGH YIELD BOND FACTOR FUND
Amount of Change in Unrealized Gain or (Loss) Recognized on Derivatives
Derivatives | | | | Forward | | |
Not Accounted | | | | currency | | |
for as Hedging | | Futures | | exchange | | |
Instruments | | contracts | | contracts | | Total |
Forward currency | | | | | | |
exchange contracts | $ | — | $ | (3,918) | $ | (3,918) |
Interest rate contracts | | 21,922 | | — | | 21,922 |
Total | $ | 21,922 | $ | (3,918) | $ | 18,004 |
| | | | | | |
*Includes purchased option contracts and purchased swaption contracts, if any.
The table below summarizes the two months ended average notional value of forward foreign currency contracts, five months ended average notional value of futures contracts, four months ended average notional value of swap agreements and the three months ended average notional value of swaptions purchased and written during the period.
| | Forward | | | | | | | | |
| | foreign | | | | | | | | |
| | currency | | Futures | | | | Swaptions | | Swaptions |
| | contracts | | contracts | | Swaps | | written | | purchased |
Average notional | $ | | | | | | | | | 2,900,000 |
amount | 2,186,914 | $ | 5,254,496 | $ | 917,250 | $ | 2,900,000 | $ |
Note 5 - Trustee and Officer Fees and Benefits
Certain Trustees have executed Deferred Compensation Agreement(s) pursuant to which they have the option to elect to defer receipt of all or a portion of the annual compensation they are entitled to receive from the Fund. For purposes of determining the amount owed to the Trustees under the plan(s), deferred amounts are treated as though equal dollar amounts had been invested in shares of the Fund or in other Invesco and/or Invesco Oppenheimer funds selected by the Trustees. The Fund purchases shares of the funds selected for deferral by the Trustees in amounts equal to his or her deemed investment, resulting in a Fund asset equal to the deferred compensation liability. Such assets are included as a component of "Other" within the asset section of the Consolidated Statement of Assets and Liabilities. Deferral
of Trustees' fees under the plan(s) will not affect the net assets of the Fund and will not materially affect the Fund's assets, liabilities or net investment income per share. Amounts will be deferred until distributed in accordance with the Deferred Compensation Agreement(s).
Note 6 - Cash Balances
The Fund is permitted to temporarily carry a negative or overdrawn balance in its account with JPMorgan Chase Bank, the custodian bank. Such balances, if any at period-end, are shown in the Consolidated Statement of Assets and Liabilities under the payable caption Amount due custodian. To compensate the custodian bank for such overdrafts, the overdrawn Fund may either (1) leave funds as a compensating balance in the account so the custodian bank
61 INVESCO HIGH YIELD BOND FACTOR FUND

NOTES TO
CONSOLIDATED FINANCIAL STATEMENTS Continued
can be compensated by earning the additional interest; or (2) compensate by paying the custodian bank at a rate agreed upon by the custodian bank and Invesco, not to exceed the contractually agreed upon rate.
Note 7 - Distributions to Shareholders and Tax Components of Net Assets
Tax Character of Distributions to Shareholders for the Nine Months Ended February 29, 2020 and the Fiscal Years Ended May 31, 2019 and May 31, 2018:
| | February 29, | | | | |
| | 2020 | | May 31, 2019 | | May 31, 2018 |
Ordinary income | $ | 1,127,423 | $ | 2,161,079 | $ | 2,452,895 |
Return of capital | | 59,088 | | — | | — |
Total | $ | 1,186,511 | $ | 2,161,079 | $ | 2,452,895 |
| | | | | | |
Tax Components of Net Assets at Period-End:
| | 2020 |
Net unrealized appreciation (depreciation) - investments | $ | (854,751) |
Net unrealized appreciation (depreciation) - foreign currencies | | (6,476) |
Temporary book/tax differences | | (12,329) |
Capital loss carryforward | | (3,757,474) |
Shares of beneficial interest | | 38,118,156 |
Total net assets | $ | 33,487,126 |
| | |
The difference between book-basis and tax-basis unrealized appreciation (depreciation) is due to differences in the timing of recognition of gains and losses on investments for tax and book purposes. The Fund's net unrealized appreciation (depreciation) difference is attributable primarily to derivative investments, wash sales and paid-in-kind securities.
The temporary book/tax differences are a result of timing differences between book and tax recognition of income and/or expenses. The Fund's temporary book/tax differences are the result of the trustee deferral of compensation and retirement plan benefits.
Capital loss carryforward is calculated and reported as of a specific date. Results of transactions and other activity after that date may affect the amount of capital loss carryforward actually available for the Fund to utilize. The ability to utilize capital loss carryforwards in the future may be limited under the Internal Revenue Code and related regulations based on the results of future transactions.
The Fund has a capital loss carryforward as of February 29, 2020, which expires as follows:
Capital Loss Carryforward*
Expiration | Short-Term | | Long-Term | | Total |
Not subject to expiration $ | 1,134,049 | $ | 2,623,425 | $ | 3,757,474 |
*Capital loss carryforward is reduced for limitations, if any, to the extent required by the Internal Revenue Code and may be further limited depending upon a variety of factors, including the realization of net unrealized gains or losses as of the date of any reorganization.
62 INVESCO HIGH YIELD BOND FACTOR FUND
Note 8 - Investment Transactions
The aggregate amount of investment securities (other than short-term securities, U.S. Treasury obligations and money market funds, if any) purchased and sold by the Fund during the nine months ended February 29, 2020 was $40,569,384 and $40,082,447, respectively. Cost of investments, including any derivatives, on a tax basis includes the adjustments for financial reporting purposes as of the most recently completed federal income tax reporting period-end.
Unrealized Appreciation (Depreciation) of Investments on a Tax Basis
Aggregate unrealized appreciation of investments | $ | 447,411 |
Aggregate unrealized (depreciation) of investments | | (1,308,638) |
Net unrealized depreciation of investments | $ | (861,227) |
| | |
Cost of investments for tax purposes is $37,656,501.
Note 9 - Reclassification of Permanent Differences
Primarily as a result of differing book/tax treatment of foreign currency transactions, income from the subsidiary, return of capital distributions and swap agreements income, on February 29, 2020, undistributed net investment loss was decreased by $67,456, undistributed net realized loss was decreased by $10,506 and shares of beneficial interest was decreased by $77,962. This reclassification had no effect on the net assets of the Fund.
Note 10 - Share Information
Transactions in shares of beneficial interest were as follows:
| | Nine Months Ended | Year Ended May 31, 20192 | Year Ended May 31, 2018 |
| | February 29, 20201 |
| | | | | | | |
| | Shares | | Amount | Shares | | Amount | Shares | | Amount |
| Class A | | | | | | | | | |
| Sold | 422,846 | $ | 3,857,665 | 729,132 | $ | 6,596,376 | 857,228 | $ | 8,111,482 |
| Automatic | | | | | | | | | |
| Conversion | | | | | | | | | |
| Class C | | | | | | | | | |
| to Class A | | | | | | | | | |
| Shares | 88,060 | | 804,928 | — | | — | — | | — |
| Dividends | | | | | | | | | |
| and/or | | | | | | | | | |
| distributions | | | | | | | | | |
| reinvested | 84,797 | | 771,421 | 127,447 | | 1,146,812 | 111,259 | | 1,046,849 |
| Redeemed | (529,837) | | (4,822,179) | (677,300) | | (6,083,049) | (1,484,461) | | (14,070,186) |
| Net increase | 65,866 | $ | 611,835 | 179,279 | $ | 1,660,139 | (515,974) | $ | (4,911,855) |
| (decrease) |
| | | | | | | | | |
| | | | | | | | | | |
63 INVESCO HIGH YIELD BOND FACTOR FUND
NOTES TO
CONSOLIDATED FINANCIAL STATEMENTS Continued
| | Nine Months Ended | Year Ended May 31, 20192 | Year Ended May 31, 2018 |
| | February 29, 20201 |
| | | | | | | |
| | Shares | | Amount | Shares | | Amount | Shares | | Amount |
| Class C | | | | | | | | | |
| Sold | 95,431 | $ | 869,158 | 244,929 | $ | 2,206,607 | 247,079 | $ | 2,333,787 |
| Dividends | | | | | | | | | |
| and/or | | | | | | | | | |
| distributions | | | | | | | | | |
| reinvested | 19,060 | | 173,379 | 34,682 | | 312,156 | 33,599 | | 315,893 |
| Automatic | | | | | | | | | |
| Conversion | (88,146) | | (804,928) | — | | — | — | | — |
| Class C | | | |
| to Class A | | | | | | | | | |
| Shares | | | | | | | | | |
| Redeemed | (113,532) | | (1,034,585) | (316,686) | | (2,850,680) | (263,832) | | (2,476,239) |
| Net increase | (87,187) | $ | (796,976) | (37,075) | $ | (331,917) | 16,846 | $ | 173,441 |
| (decrease) |
| | | | | | | | | |
| | | | | | | | | | |
| | | | | | | | | | |
| Class R | | | | | | | | | |
| Sold | 78,933 | $ | 719,034 | 111,688 | $ | 1,004,611 | 108,686 | $ | 1,023,948 |
| Dividends | | | | | | | | | |
| and/or | | | | | | | | | |
| distributions | | | | | | | | | |
| reinvested | 11,232 | | 102,255 | 14,608 | | 131,453 | 9,869 | | 92,780 |
| Redeemed | (62,196) | | (566,678) | (47,888) | | (432,836) | (42,489) | | (400,105) |
| Net increase | 27,969 | $ | 254,611 | 78,408 | $ | 703,228 | 76,066 | $ | 716,623 |
| (decrease) |
| | | | | | | | | |
| | | | | | | | | | |
| | | | | | | | | | |
| Class Y | | | | | | | | | |
| Sold | 39,704 | $ | 362,919 | 48,786 | $ | 440,005 | 121,034 | $ | 1,149,347 |
| Dividends | | | | | | | | | |
| and/or | | | | | | | | | |
| distributions | | | | | | | | | |
| reinvested | 4,971 | | 45,278 | 9,355 | | 84,298 | 11,527 | | 108,676 |
| Redeemed | (89,562) | | (816,478) | (57,586) | | (517,066) | (200,347) | | (1,895,008) |
| Net increase | (44,887) | $ | (408,281) | 555 | $ | 7,237 | (67,786) | $ | (636,985) |
| (decrease) |
| | | | | | | | | |
| | | | | | | | | | |
| | | | | | | | | | |
| Class R53 | | | | | | | | | |
| Sold | — | $ | — | 1,109 | $ | 10,000 | — | $ | — |
| Dividends | | | | | | | | | |
| and/or | | | | | | | | | |
| distributions | | | | | | | | | |
| reinvested | — | | — | — | | — | — | | — |
| Redeemed | — | | — | — | | — | — | | — |
| Net increase | — | $ | — | 1,109 | $ | 10,000 | — | $ | — |
| (decrease) |
| | | | | | | | | |
| | | | | | | | | | |
64 INVESCO HIGH YIELD BOND FACTOR FUND
| | Nine Months Ended | Year Ended May 31, 20192 | Year Ended May 31, 2018 |
| | February 29, 20201 |
| | | | | | | |
| | Shares | | Amount | Shares | | Amount | Shares | | Amount |
| Class R6 | | | | | | | | | |
| Sold | 5,734 | $ | 52,385 | 13,344 | $ | 121,038 | 399,752 | $ | 3,793,311 |
| Dividends | | | | | | | | | |
| and/or | | | | | | | | | |
| distributions | | | | | | | | | |
| reinvested | 445 | | 4,054 | 41,562 | | 373,633 | 76,854 | | 722,544 |
| Redeemed | (7,678) | | (70,066) | (1,477,674) | | (13,251,520) | (75,738) | | (698,308) |
| Net increase | (1,499) | $ | (13,627) | (1,422,768) | $ | (12,756,849) | 400,868 | $ | 3,817,547 |
| (decrease) |
| | | | | | | | | |
| | | | | | | | | | |
1.There are entities that are record owners of more than 5% of the outstanding shares of the Fund and own 21% of the outstanding shares of the Fund. IDI has an agreement with these entities to sell Fund shares. The Fund, Invesco and/or Invesco affiliates may make payments to these entities, which are considered to be related to the Fund, for providing services to the Fund, Invesco and/or Invesco affiliates, including but not limited to services such as securities brokerage, distribution, third party record keeping and account servicing. The Fund has no knowledge as to whether all or any portion of the shares owned of record by these entities are also owned beneficially.
2.There are entities that are record owners of more than 5% of the outstanding shares of the Fund and own 21% of the outstanding shares of the Fund. IDI has an agreement with these entities to sell Fund shares. The Fund, Invesco and/or Invesco affiliates may make payments to these entities, which are considered to be related to the Fund, for providing services to the Fund, Invesco and/or Invesco affiliates, including but not limited to services such as securities brokerage, distribution, third party record keeping and account servicing. The Fund has no knowledge as to whether all or any portion of the shares owned of record by these entities are also owned beneficially.
3.Commencement date after the close of business on May 24, 2019.
Note 11 - Subsequent Event
During the first quarter of 2020, the World Health Organization declared the Coronavirus (COVID-19) to be a public health emergency. COVID-19 has led to increased short-term market volatility and may have adverse long-term effects on U.S. and world economies and markets in general. COVID-19 may adversely impact the Funds' ability to achieve their investment objectives. Because of the uncertainties on valuation, the global economy and business operations, values reflected in these financial statements may materially differ from the value received upon actual sales of those investments.
The Coronavirus Aid, Relief, and Economic Security Act, commonly referred to as the "CARES Act," was signed into law on March 27, 2020 by President Trump. The Act is a $2 trillion stimulus package to help individuals, businesses and hospitals in response to the economic distress caused by the COVID-19 crisis. The Adviser is assessing the components of the Act and the impacts to the Fund should be immaterial.
65 INVESCO HIGH YIELD BOND FACTOR FUND
REPORT OF INDEPENDENT REGISTERED PUBLIC ACCOUNTING FIRM
To the Board of Trustees of AIM Investment Securities Funds (Invesco Investment Securities Funds) and Shareholders of Invesco High Yield Bond Factor Fund
Opinion on the Consolidated Financial Statements
We have audited the accompanying consolidated statement of assets and liabilities, including the consolidated schedule of investments, of Invesco High Yield Bond Factor Fund and its subsidiary, formerly Invesco Oppenheimer Global High Yield Fund, (one of the funds constituting AIM Investment Securities Funds (Invesco Investment Securities Funds), referred to hereafter as the "Fund") as of February 29, 2020, the related consolidated statements of operations and of changes in net assets, including the related notes, and the consolidated financial highlights for each of the periods indicated in the table below (collectively referred to as the "consolidated financial statements"). In our opinion, the consolidated financial statements present fairly, in all material respects, the financial position of the Fund as of February 29, 2020, the results of its operations, the changes in its net assets and the financial highlights for each of the periods indicated in the table below, in conformity with accounting principles generally accepted in the United States of America.
Consolidated Statement of Operations and | |
Consolidated Statement of Changes in Net | |
Assets | Consolidated Financial Highlights |
| |
For the period from June 1, 2019 through February | For the period from June 1, 2019 through February |
29, 2020 and the year ended May 31, 2019 | 29, 2020 and the year ended May 31, 2019 for |
| Class A, Class C, Class R, Class Y and Class R6 |
| For the period from June 1, 2019 through February |
| 29, 2020 and the period from May 24, 2019 |
| (inception of offering) through May 31, 2019 for |
| Class R5 |
The consolidated financial statements of Invesco High Yield Bond Factor Fund (formerly Oppenheimer Global High Yield Fund) as of and for the year ended May 31, 2018 and the consolidated financial highlights for each of the periods ended on or prior to May 31, 2018 (not presented herein, other than the consolidated statement of changes in net assets and the consolidated financial highlights) were audited by other auditors whose report dated July 25, 2018 expressed an unqualified opinion on those consolidated financial statements and consolidated financial highlights.
Basis for Opinion
These consolidated financial statements are the responsibility of the Fund's management. Our responsibility is to express an opinion on the Fund's consolidated financial statements based on our audits. We are a public accounting firm registered with the Public Company Accounting Oversight Board (United States) (PCAOB) and are required to be independent with respect to the Fund in accordance with the U.S. federal securities laws and the applicable rules and regulations of the Securities and Exchange Commission and the PCAOB.
We conducted our audits of these consolidated financial statements in accordance with the standards of the PCAOB. Those standards require that we plan and perform the audit to obtain reasonable
66 INVESCO HIGH YIELD BOND FACTOR FUND
assurance about whether the consolidated financial statements are free of material misstatement, whether due to error or fraud.
Our audits included performing procedures to assess the risks of material misstatement of the consolidated financial statements, whether due to error or fraud, and performing procedures that respond to those risks. Such procedures included examining, on a test basis, evidence regarding the amounts and disclosures in the consolidated financial statements. Our audits also included evaluating the accounting principles used and significant estimates made by management, as well as evaluating the overall presentation of the consolidated financial statements. Our procedures included confirmation of securities owned as of February 29, 2020 by correspondence with the custodian, transfer agent and brokers; when replies were not received from brokers, we performed other auditing procedures. We believe that our audits provide a reasonable basis for our opinion.
/s/PricewaterhouseCoopers LLP Houston, Texas
April 28, 2020
We have served as the auditor of one or more investment companies in the Invesco group of investment companies since at least 1995. We have not been able to determine the specific year we began serving as auditor.
67 INVESCO HIGH YIELD BOND FACTOR FUND
TAX INFORMATION Unaudited
Form 1099-DIV, Form 1042-S and other year–end tax information provide shareholders with actual calendar year amounts that should be included in their tax returns. Shareholders should consult their tax advisers.
The following distribution information is being provided as required by the Internal Revenue Code or to meet a specific state's requirement.
The Fund designates the following amounts or, if subsequently determined to be different, the maximum amount allowable for its nine months ended February 29, 2020:
Federal and State Income Tax | |
Qualified Dividend Income* | 0.81 % |
Corporate Dividends Received Deduction* | 0.13 % |
Qualified Business Income | 0.00 % |
U.S. Treasury Obligations* | 0.00 % |
Tax-Exempt Interest Dividends* | 0.00 % |
* The above percentages are based on ordinary income dividends paid to shareholders during the Fund's fiscal year.
68 INVESCO HIGH YIELD BOND FACTOR FUND

PORTFOLIO PROXY VOTING POLICIES AND GUIDELINES; UPDATES TO SCHEDULE OF INVESTMENTS Unaudited
Go paperless with eDelivery
Visit invesco.com/edelivery to enjoy the convenience and security of anytime electronic access to your investment documents.
With eDelivery, you can elect to have any or all of the following materials delivered straight to your inbox to download, save and print from your own computer:
•Fund reports and prospectuses
•Quarterly statements
•Daily confirmations
•Tax forms
Invesco mailing information
Send general correspondence to Invesco Investment Services, Inc., P.O. Box 219078, Kansas City, MO 64121-9078.
Important notice regarding delivery of security holder documents
To reduce Fund expenses, only one copy of most shareholder documents may be mailed to shareholders with multiple accounts at the same address (Householding). Mailing of your shareholder documents may be householded indefinitely unless you instruct us otherwise. If you do not want the mailing of these documents to be combined with those for other members of your household, please contact Invesco Investment Services, Inc. at 800 959 4246 or contact your financial institution. We will begin sending you individual copies for each account within 30 days after receiving your request.
Fund holdings and proxy voting information
The Fund provides a complete list of its holdings four times in each fiscal year, at the quarter ends. For the second and fourth quarters, the lists appear in the Fund's semiannual and annual reports to shareholders. For the first and third quarters, the Fund files the lists with the Securities and Exchange Commission (SEC) as an exhibit to its reports on Form N-PORT. The most recent list of portfolio holdings is available at invesco.com/completeqtrholdings. Shareholders can also look up the Fund's Forms N-PORT on the SEC website at sec.gov.
A description of the policies and procedures that the Fund uses to determine how to vote proxies relating to portfolio securities is available without charge, upon request, from our Client Services department at 800 959 4246 or at invesco.com/proxyguidelines. The information is also available on the SEC website, sec.gov.
Information regarding how the Fund voted proxies related to its portfolio securities during the most recent 12-month period ended June 30 is available at invesco.com/proxysearch. The information is also available on the SEC website, sec.gov.
Invesco Advisers, Inc. is an investment adviser; it provides investment advisory services to individual and institutional clients and does not sell securities. Invesco Distributors, Inc. is the US distributor for Invesco Ltd.'s retail mutual funds, exchange-traded funds and institutional money market funds. Both are wholly owned, indirect subsidiaries of Invesco Ltd.
69 INVESCO HIGH YIELD BOND FACTOR FUND

TRUSTEES AND OFFICERS Unaudited
The address of each trustee and officer is AIM Investment Securities Funds (Invesco Investment Securities Funds) (the "Trust"), 11 Greenway Plaza, Suite 1000, Houston, Texas 77046-1173. The trustees serve for the life of the Trust, subject to their earlier death, incapacitation, resignation, retirement or removal as more specifically provided in the Trust's organizational documents. Each officer serves for a one year term or until their successors are elected and qualified. Column two below includes length of time served with predecessor entities, if any.
Name, Year of Birth and | Trustee | Principal Occupation(s) | Number of Funds | Other Directorship(s) |
Position(s) Held with the Trust | and/or | During Past 5 Years | in Fund Complex | Held by Trustee During |
| Officer | | Overseen by Trustee | Past 5 Years |
| Since | | | |
| | | | |
INTERESTED TRUSTEE | | | | |
| | | | |
Martin L. Flanagan 1 — 1960 | 2007 | Executive Director, Chief Executive Officer and | 229 | None |
Trustee and Vice Chair | | President, Invesco Ltd. (ultimate parent of | | |
| | Invesco and a global investment management | | |
| | firm); Trustee and Vice Chair, The Invesco | | |
| | Funds; Vice Chair, Investment Company | | |
| | Institute; and Member of Executive Board, | | |
| | SMU Cox School of Business | | |
Formerly: Advisor to the Board, Invesco Advisers, Inc. (formerly known as Invesco Institutional (N.A.), Inc.); Chairman and Chief Executive Officer, Invesco Advisers, Inc. (registered investment adviser); Director, Chairman, Chief Executive Officer and President, Invesco Holding Company (US), Inc. (formerly IVZ Inc.) (holding company), Invesco Group Services, Inc. (service provider) and Invesco North American Holdings, Inc. (holding company); Director, Chief Executive Officer and President, Invesco Holding Company Limited (parent of Invesco and a global investment management firm); Director, Invesco Ltd.; Chairman, Investment Company Institute and President, Co-Chief Executive Officer, Co-President, Chief Operating Officer and Chief Financial Officer, Franklin Resources, Inc. (global investment management organization)
1 Mr. Flanagan is considered an interested person (within the meaning of Section 2(a)(19) of the 1940 Act) of the Trust because he is an officer of the Adviser to the Trust, and an officer and a director of Invesco Ltd., ultimate parent of the Adviser.
70 INVESCO HIGH YIELD BOND FACTOR FUND
Name, Year of Birth and | Trustee | Principal Occupation(s) | Number of Funds | Other Directorship(s) |
Position(s) Held with the Trust | and/or | During Past 5 Years | in Fund Complex | Held by Trustee During |
| Officer | | Overseen by Trustee | Past 5 Years |
| Since | | | |
INDEPENDENT TRUSTEES
Bruce L. Crockett – 1944 | 2003 Chairman, Crockett Technologies Associates |
Trustee and Chair | (technology consulting company) |
| Formerly: Director, Captaris (unified |
| messaging provider); Director, President and |
| Chief Executive Officer, COMSAT Corporation; |
| Chairman, Board of Governors of INTELSAT |
| (international communications company); ACE |
| Limited (insurance company); Independent |
| Directors Council and Investment Company |
| Institute: Member of the Audit Committee, |
| Investment Company Institute; Member of |
| the Executive Committee and Chair of the |
| Governance Committee, Independent Directors |
| Council |
229Director and
Chairman of the
Audit Committee,
ALPS (Attorneys
Liability Protection Society) (insurance company); Director and Member of the Audit Committee and Compensation
Committee, Ferroglobe
PLC (metallurgical
company)
David C. Arch – 1945 | 2010 Chairman of Blistex Inc. (consumer health | 229 | Board member of the |
Trustee | care products manufacturer); Member, World | | Illinois Manufacturers' |
| Presidents' Organization | | Association |
| | | |
Beth Ann Brown – 1968 | 2019 Independent Consultant | 229 | Director, Board of |
Trustee | Formerly: Head of Intermediary Distribution, | | Directors of Caron |
| | Engineering Inc.; |
| Managing Director, Strategic Relations, | | Advisor, Board of |
| Managing Director, Head of National | | Advisors of Caron |
| Accounts, Senior Vice President, National | | Engineering Inc.; |
| Account Manager and Senior Vice President, | | President and |
| Key Account Manager, Columbia Management | | Director, of Acton |
| Investment Advisers LLC; Vice President, Key | | Shapleigh Youth |
| Account Manager, Liberty Funds Distributor, | | Conservation Corps |
| Inc.; and Trustee of certain Oppenheimer | | (non -profit); and |
| Funds | | President and Director |
| | | of Grahamtastic |
| | | Connection (non- |
| | | profit) |
Jack M. Fields – 1952 | 2003 Chief Executive Officer, Twenty First Century |
Trustee | Group, Inc. (government affairs company); |
| and Chairman, Discovery Learning Alliance |
| (non-profit) |
| Formerly: Owner and Chief Executive Officer, |
| Dos Angeles Ranch L.P. (cattle, hunting, |
| corporate entertainment); Director, Insperity, |
| Inc. (formerly known as Administaff) (human |
| resources provider); Chief Executive Officer, |
| Texana Timber LP (sustainable forestry |
| company); Director of Cross Timbers Quail |
| Research Ranch (non-profit); and member of |
| the U.S. House of Representatives |
229Member, Board of Directors of Baylor
College of Medicine
71 INVESCO HIGH YIELD BOND FACTOR FUND
TRUSTEES AND OFFICERS Unaudited / Continued
Name, Year of Birth and | Trustee | Principal Occupation(s) | Number of Funds | Other Directorship(s) |
Position(s) Held with the Trust | and/or | During Past 5 Years | in Fund Complex | Held by Trustee During |
| Officer | | Overseen by Trustee | Past 5 Years |
| Since | | | |
INDEPENDENT TRUSTEES (CONTINUED)
Cynthia Hostetler —1962 | 2017 Non-Executive Director and Trustee of a |
Trustee | number of public and private business |
| corporations |
| Formerly: Director, Aberdeen Investment |
| Funds (4 portfolios); Head of Investment |
| Funds and Private Equity, Overseas Private |
| Investment Corporation; President, First |
| Manhattan Bancorporation, Inc.; Attorney, |
| Simpson Thacher & Bartlett LLP |
229Vulcan Materials
Company
(construction materials
company); Trilinc Global Impact Fund; Genesee & Wyoming, Inc. (railroads); Artio Global Investment LLC (mutual
fund complex);
Edgen Group, Inc. (specialized energy and infrastructure products distributor); Investment Company Institute (professional organization); Independent Directors Council (professional organization)
Eli Jones – 1961 | 2016 Professor and Dean, Mays Business School - | 229 | Insperity, Inc. (formerly |
Trustee | Texas A&M University | | known as Administaff) |
| Formerly: Professor and Dean, Walton College | | (human resources |
| | provider) |
| of Business, University of Arkansas and E.J. | | |
| Ourso College of Business, Louisiana State | | |
| University; Director, Arvest Bank | | |
Elizabeth Krentzman – 1959 | 2019 Formerly: Principal and Chief Regulatory |
Trustee | Advisor for Asset Management Services and |
| U.S. Mutual Fund Leader of Deloitte & Touche |
| LLP; General Counsel of the Investment |
| Company Institute (trade association); |
| National Director of the Investment |
| Management Regulatory Consulting Practice, |
| Principal, Director and Senior Manager of |
| Deloitte & Touche LLP; Assistant Director of |
| the Division of Investment Management - |
| Office of Disclosure and Investment Adviser |
| Regulation of the U.S. Securities and Exchange |
| Commission and various positions with the |
| Division of Investment Management – Office |
| of Regulatory Policy of the U.S. Securities and |
| Exchange Commission; Associate at Ropes & |
| Gray LLP.; and Trustee of certain Oppenheimer |
| Funds |
229Trustee of the
University of Florida
National Board
Foundation; Member of the Cartica Funds Board of Directors (private investment funds); Member of the University of Florida Law Center
Association, Inc. Board
of Trustees and Audit
Committee Member
72 INVESCO HIGH YIELD BOND FACTOR FUND
Name, Year of Birth and | Trustee | Principal Occupation(s) | Number of Funds | Other Directorship(s) |
Position(s) Held with the Trust | and/or | During Past 5 Years | in Fund Complex | Held by Trustee During |
| Officer | | Overseen by Trustee | Past 5 Years |
| Since | | | |
INDEPENDENT TRUSTEES (CONTINUED)
Anthony J. LaCava, Jr. – 1956 2019 | Formerly: Director and Member of the Audit |
Trustee | Committee, Blue Hills Bank (publicly traded |
| financial institution) and Managing Partner, |
| KPMG LLP |
229Blue Hills Bank;
Chairman of Bentley University; Member, Business School Advisory Council; and Nominating
Committee, KPMG LLP
Prema Mathai-Davis – 1950 2003 Retired229None Trustee
Formerly; Co-Founder & Partner of Quantalytics Research, LLC, (a FinTech Investment Research Platform for the Self- Directed Investor)
Joel W. Motley – 1952 | 2019 Director of Office of Finance, Federal Home |
Trustee | Loan Bank System; Member of the Vestry |
| of Trinity Wall Street; Managing Director of |
| Carmona Motley Hoffman, Inc. (privately held |
| financial advisor); Member of the Council |
| on Foreign Relations and its Finance and |
| Budget Committee; Chairman Emeritus of |
| Board of Human Rights Watch and Member |
| of its Investment Committee; and Member |
| of Investment Committee and Board of |
| Historic Hudson Valley (non-profit cultural |
| organization). |
| Formerly: Managing Director of Public Capital |
| Advisors, LLC (privately held financial advisor); |
| Managing Director of Carmona Motley |
| Hoffman, Inc. (privately held financial advisor); |
| Trustee of certain Oppenheimer Funds; and |
| Director of Columbia Equity Financial Corp. |
| (privately held financial advisor) |
229Member of Board of Greenwall Foundation (bioethics research foundation) and
its Investment
Committee; Member of Board of Friends of the LRC (non-profit legal advocacy); Board Member and Investment Committee Member of Pulitzer Center for Crisis
Reporting (non-profit
journalism)
Teresa M. Ressel — 1962 | 2017 Non-executive director and trustee of a |
Trustee | number of public and private business |
| corporations |
| Formerly: Chief Financial Officer, Olayan |
| America, The Olayan Group (international |
| investor/commercial/industrial); Chief |
| Executive Officer, UBS Securities LLC; Group |
| Chief Operating Officer, Americas, UBS AG; |
| Assistant Secretary for Management & Budget |
| and CFO, US Department of the Treasury |
229Atlantic Power
Corporation (power
generation company); ON Semiconductor Corp. (semiconductor supplier)
73 INVESCO HIGH YIELD BOND FACTOR FUND
TRUSTEES AND OFFICERS Unaudited / Continued
Name, Year of Birth and | Trustee | Principal Occupation(s) | Number of Funds | Other Directorship(s) |
Position(s) Held with the Trust | and/or | During Past 5 Years | in Fund Complex | Held by Trustee During |
| Officer | | Overseen by Trustee | Past 5 Years |
| Since | | | |
| | | | |
INDEPENDENT TRUSTEES | | | | |
(CONTINUED) | | | | |
| | | | |
Ann Barnett Stern – 1957 | 2017 | President and Chief Executive Officer, Houston | 229 | Federal Reserve Bank |
Trustee | | Endowment Inc. (private philanthropic | | of Dallas |
| | institution) | | |
| | Formerly: Executive Vice President and | | |
| | General Counsel, Texas Children's Hospital; | | |
| | Attorney, Beck, Redden and Secrest, LLP; | | |
| | Business Law Instructor, University of St. | | |
| | Thomas; Attorney, Andrews & Kurth LLP | | |
| | | | |
Robert C. Troccoli – 1949 | 2016 | Retired | 229 | None |
Trustee | | Formerly: Adjunct Professor, University of | | |
| | | |
| | Denver – Daniels College of Business, Senior | | |
| | Partner, KPMG LLP | | |
Daniel S. Vandivort –1954 | 2019 Treasurer, Chairman of the Audit and Finance |
Trustee | Committee, and Trustee, Board of Trustees, |
| Huntington Disease Foundation of America; |
| and President, Flyway Advisory Services LLC |
| (consulting and property management). |
| Formerly: Trustee and Governance Chair, of |
| certain Oppenheimer Funds |
229Chairman and Lead Independent Director, Chairman of the Audit Committee, and Director, Board of Directors, Value Line Funds
James D. Vaughn – 1945 | 2019 Retired |
Trustee | Formerly: Managing Partner, Deloitte & Touche |
|
| LLP; Trustee and Chairman of the Audit |
| Committee, Schroder Funds; Board Member, |
| Mile High United Way, Boys and Girls Clubs, |
| Boy Scouts, Colorado Business Committee |
| for the Arts, Economic Club of Colorado |
| and Metro Denver Network (economic |
| development corporation); and Trustee of |
| certain Oppenheimer Funds |
229Board member
and Chairman of Audit Committee
of AMG National Trust Bank; Trustee and Investment Committee member, University of South Dakota Foundation; Board member, Audit Committee Member and past Board Chair, Junior Achievement (non-profit)
Christopher L. Wilson – | 2017 Retired |
1957 | Formerly: Director, TD Asset Management USA |
Trustee, Vice Chair and Chair |
Designate | Inc. (mutual fund complex) (22 portfolios); |
| Managing Partner, CT2, LLC (investing and |
| consulting firm); President/Chief Executive |
| Officer, Columbia Funds, Bank of America |
| Corporation; President/Chief Executive Officer, |
| CDC IXIS Asset Management Services, Inc.; |
229ISO New England,
Inc. (non-profit
organization
managing regional electricity market)
74 INVESCO HIGH YIELD BOND FACTOR FUND
Name, Year of Birth and | Trustee | Principal Occupation(s) | Number of Funds | Other Directorship(s) |
Position(s) Held with the Trust | and/or | During Past 5 Years | in Fund Complex | Held by Trustee During |
| Officer | | Overseen by Trustee | Past 5 Years |
| | | |
| Since | | | |
| | | | |
INDEPENDENT TRUSTEES | | | | |
(CONTINUED) | | | | |
| | | | |
Christopher L. Wilson | | Principal & Director of Operations, Scudder | | |
Continued | | Funds, Scudder, Stevens & Clark, Inc.; Assistant | | |
| | Vice President, Fidelity Investments | | |
| | | | |
75 INVESCO HIGH YIELD BOND FACTOR FUND

TRUSTEES AND OFFICERS Unaudited / Continued
Name, Year of Birth and | Trustee | Principal Occupation(s) | Number of Funds | Other Directorship(s) |
Position(s) Held with the Trust | and/or | During Past 5 Years | in Fund Complex | Held by Trustee During |
| Officer | | Overseen by Trustee | Past 5 Years |
| Since | | | |
| | | | |
OFFICERS | | | | |
| | | | |
Sheri Morris — 1964 | 2003 | Head of Global Fund Services, Invesco Ltd.; | N/A | N/A |
President, Principal Executive | | President, Principal Executive Officer and | | |
Officer and Treasurer | | Treasurer, The Invesco Funds; Vice President, | | |
| | Invesco Advisers, Inc. (formerly known as | | |
| | Invesco Institutional (N.A.), Inc.) (registered | | |
| | investment adviser); and Vice President, | | |
| | Invesco Exchange-Traded Fund Trust, Invesco | | |
| | Exchange-Traded Fund Trust II, Invesco India | | |
| | Exchange-Traded Fund Trust, Invesco Actively | | |
| | Managed Exchange-Traded Fund Trust, | | |
| | Invesco Actively Managed Exchange-Traded | | |
| | Commodity Fund Trust and Invesco Exchange- | | |
| | Traded Self-Indexed Fund Trust, and Vice | | |
| | President, OppenheimerFunds, Inc. | | |
| | Formerly: Vice President and Principal | | |
| | Financial Officer, The Invesco Funds; Vice | | |
| | President, Invesco AIM Advisers, Inc., Invesco | | |
| | AIM Capital Management, Inc. and Invesco | | |
| | AIM Private Asset Management, Inc.; Assistant | | |
| | Vice President and Assistant Treasurer, The | | |
| | Invesco Funds and Assistant Vice President, | | |
| | Invesco Advisers, Inc., Invesco AIM Capital | | |
| | Management, Inc. and Invesco AIM Private | | |
| | Asset Management, Inc.; and Treasurer, | | |
| | Invesco Exchange-Traded Fund Trust, Invesco | | |
| | Exchange-Traded Fund Trust II, Invesco India | | |
| | Exchange-Traded Fund Trust and Invesco | | |
| | Actively Managed Exchange-Traded Fund Trust | | |
| | | | |
Russell C. Burk — 1958 | 2005 | Senior Vice President and Senior Officer, The | N/A | N/A |
Senior Vice President and | | Invesco Funds | | |
Senior Officer | | | | |
| | | | |
Jeffrey H. Kupor – 1968 | 2018 | Head of Legal of the Americas, Invesco | N/A | N/A |
Senior Vice President, Chief | | Ltd.; Senior Vice President and Secretary, | | |
Legal Officer and Secretary | | Invesco Advisers, Inc. (formerly known as | | |
| | Invesco Institutional (N.A.), Inc.) (registered | | |
| | investment adviser); Senior Vice President | | |
| | and Secretary, Invesco Distributors, Inc. | | |
| | (formerly known as Invesco AIM Distributors, | | |
| | Inc.); Vice President and Secretary, Invesco | | |
| | Investment Services, Inc. (formerly known | | |
| | as Invesco AIM Investment Services, Inc.) | | |
| | Senior Vice President, Chief Legal Officer and | | |
| | Secretary, The Invesco Funds; Secretary and | | |
| | General Counsel, Invesco Investment Advisers | | |
| | LLC (formerly known as Van Kampen Asset | | |
| | Management); Secretary and General Counsel, | | |
| | Invesco Capital Markets, Inc. (formerly known | | |
| | as Van Kampen Funds Inc.) and Chief Legal | | |
| | | | |
76 INVESCO HIGH YIELD BOND FACTOR FUND

Name, Year of Birth and | Trustee | Principal Occupation(s) | Number of Funds | Other Directorship(s) |
Position(s) Held with the Trust | and/or | During Past 5 Years | in Fund Complex | Held by Trustee During |
| Officer | | Overseen by Trustee | Past 5 Years |
| Since | | | |
| | | | |
OFFICERS (CONTINUED) | | | | |
| | | | |
Jeffrey H. Kupor (Continued) | | Officer, Invesco Exchange-Traded Fund Trust, | | |
| | Invesco Exchange-Traded Fund Trust II, Invesco | | |
| | India Exchange-Traded Fund Trust, Invesco | | |
| | Actively Managed Exchange-Traded Fund | | |
| | Trust, Invesco Actively Managed Exchange- | | |
| | Traded Commodity Fund Trust and Invesco | | |
| | Exchange-Traded Self-Indexed Fund Trust; | | |
| | Secretary, Invesco Indexing LLC; Secretary, W.L. | | |
| | Ross & Co., LLC | | |
| | Formerly: Secretary and Vice President, | | |
| | Jemstep, Inc.; Head of Legal, Worldwide | | |
| | Institutional, Invesco Ltd.; Secretary and | | |
| | General Counsel, INVESCO Private Capital | | |
| | Investments, Inc.; Senior Vice President, | | |
| | Secretary and General Counsel, Invesco | | |
| | Management Group, Inc. (formerly known | | |
| | as Invesco AIM Management Group, | | |
| | Inc.); Assistant Secretary, INVESCO Asset | | |
| | Management (Bermuda) Ltd.; Secretary and | | |
| | General Counsel, Invesco Private Capital, Inc.; | | |
| | Assistant Secretary and General Counsel, | | |
| | INVESCO Realty, Inc.; Secretary and General | | |
| | Counsel, Invesco Senior Secured Management, | | |
| | Inc.; and Secretary, Sovereign G./P. Holdings | | |
| | Inc. | | |
| | | | |
Andrew R. Schlossberg – | 2019 | Head of the Americas and Senior Managing | N/A | N/A |
1974 | | Director, Invesco Ltd.; Director and Senior | | |
Senior Vice President | | Vice President, Invesco Advisers, Inc. (formerly | | |
| | known as Invesco Institutional (N.A.), Inc.) | | |
| | (registered investment adviser); Director and | | |
| | Chairman, Invesco Investment Services, Inc. | | |
| | (formerly known as Invesco AIM Investment | | |
| | Services, Inc.) (registered transfer agent); | | |
| | Senior Vice President, The Invesco Funds; | | |
| | Director, Invesco Investment Advisers LLC | | |
| | (formerly known as Van Kampen Asset | | |
| | Management); Director, President and | | |
| | Chairman, Invesco Insurance Agency, Inc. | | |
| | Formerly: Director, Invesco UK Limited; | | |
| | Director and Chief Executive, Invesco Asset | | |
| | Management Limited and Invesco Fund | | |
| | Managers Limited; Assistant Vice President, | | |
| | The Invesco Funds; Senior Vice President, | | |
| | Invesco Advisers, Inc. (formerly known as | | |
| | Invesco Institutional (N.A.), Inc.) (registered | | |
| | investment adviser); Director and Chief | | |
| | Executive, Invesco Administration Services | | |
| | | | |
77 INVESCO HIGH YIELD BOND FACTOR FUND

TRUSTEES AND OFFICERS Unaudited / Continued
Name, Year of Birth and | Trustee | Principal Occupation(s) | Number of Funds | Other Directorship(s) |
Position(s) Held with the Trust | and/or | During Past 5 Years | in Fund Complex | Held by Trustee During |
| Officer | | Overseen by Trustee | Past 5 Years |
| Since | | | |
| | | | |
OFFICERS (CONTINUED) | | | | |
| | | | |
Andrew R. Schlossberg | | Limited and Invesco Global Investment | | |
(Continued) | | Funds Limited; Director, Invesco Distributors, | | |
| | Inc.; Head of EMEA, Invesco Ltd.; President, | | |
| | Invesco Actively Managed Exchange-Traded | | |
| | Commodity Fund Trust, Invesco Actively | | |
| | Managed Exchange-Traded Fund Trust, | | |
| | Invesco Exchange-Traded Fund Trust, Invesco | | |
| | Exchange-Traded Fund Trust II and Invesco | | |
| | India Exchange-Traded Fund Trust; Managing | | |
| | Director and Principal Executive Officer, | | |
| | Invesco Capital Management LLC | | |
| | | | |
John M. Zerr — 1962 | 2006 | Chief Operating Officer of the Americas; | N/A | N/A |
Senior Vice President | | Senior Vice President, Invesco Advisers, Inc. | | |
| | (formerly known as Invesco Institutional | | |
| | (N.A.), Inc.) (registered investment adviser); | | |
| | Senior Vice President, Invesco Distributors, Inc. | | |
| | (formerly known as Invesco AIM Distributors, | | |
| | Inc.); Director and Vice President, Invesco | | |
| | Investment Services, Inc. (formerly known as | | |
| | Invesco AIM Investment Services, Inc.) Senior | | |
| | Vice President, The Invesco Funds; Managing | | |
| | Director, Invesco Capital Management LLC; | | |
| | Director, Invesco Investment Advisers LLC | | |
| | (formerly known as Van Kampen Asset | | |
| | Management); Senior Vice President, Invesco | | |
| | Capital Markets, Inc. (formerly known as | | |
| | Van Kampen Funds Inc.); Manager, Invesco | | |
| | Indexing LLC; Manager, Invesco Specialized | | |
| | Products, LLC; Director and Senior Vice | | |
| | President, Invesco Insurance Agency, Inc.; | | |
| | Member, Invesco Canada Funds Advisory | | |
| | Board; Director, President and Chief Executive | | |
| | Officer, Invesco Corporate Class Inc. (corporate | | |
| | mutual fund company); and Director, | | |
| | Chairman, President and Chief Executive | | |
| | Officer, Invesco Canada Ltd. (formerly known | | |
| | as Invesco Trimark Ltd./Invesco Trimark Ltèe) | | |
| | (registered investment adviser and registered | | |
| | transfer agent) | | |
| | Formerly: Director and Senior Vice President, | | |
| | Invesco Management Group, Inc. (formerly | | |
| | known as Invesco AIM Management Group, | | |
| | Inc.); Secretary and General Counsel, Invesco | | |
| | Management Group, Inc. (formerly known | | |
| | as Invesco AIM Management Group, Inc.); | | |
| | Secretary, Invesco Investment Services, Inc. | | |
| | (formerly known as Invesco AIM Investment | | |
| | Services, Inc.); Chief Legal Officer and | | |
| | | | |
78 INVESCO HIGH YIELD BOND FACTOR FUND

Name, Year of Birth and | Trustee | Principal Occupation(s) | Number of Funds | Other Directorship(s) |
Position(s) Held with the Trust | and/or | During Past 5 Years | in Fund Complex | Held by Trustee During |
| Officer | | Overseen by Trustee | Past 5 Years |
| Since | | | |
| | | | |
OFFICERS (CONTINUED) | | | | |
| | | | |
John M. Zerr (Continued) | | Secretary, The Invesco Funds; Secretary and | | |
| | General Counsel, Invesco Investment Advisers | | |
| | LLC (formerly known as Van Kampen Asset | | |
| | Management); Secretary and General Counsel, | | |
| | Invesco Capital Markets, Inc. (formerly known | | |
| | as Van Kampen Funds Inc.); Chief Legal | | |
| | Officer, Invesco Exchange-Traded Fund Trust, | | |
| | Invesco Exchange-Traded Fund Trust II, Invesco | | |
| | India Exchange-Traded Fund Trust, Invesco | | |
| | Actively Managed Exchange-Traded Fund | | |
| | Trust, Invesco Actively Managed Exchange- | | |
| | Traded Commodity Fund Trust and Invesco | | |
| | Exchange-Traded Self-Indexed Fund Trust; | | |
| | Secretary, Invesco Indexing LLC; Director, | | |
| | Secretary, General Counsel and Senior Vice | | |
| | President, Van Kampen Exchange Corp.; | | |
| | Director, Vice President and Secretary, IVZ | | |
| | Distributors, Inc. (formerly known as INVESCO | | |
| | Distributors, Inc.); Director and Vice President, | | |
| | INVESCO Funds Group, Inc.; Director and Vice | | |
| | President, Van Kampen Advisors Inc.; Director, | | |
| | Vice President, Secretary and General Counsel, | | |
| | Van Kampen Investor Services Inc.; Director | | |
| | and Secretary, Invesco Distributors, Inc. | | |
| | (formerly known as Invesco AIM Distributors, | | |
| | Inc.); Director, Senior Vice President, General | | |
| | Counsel and Secretary, Invesco AIM Advisers, | | |
| | Inc. and Van Kampen Investments Inc.; | | |
| | Director, Vice President and Secretary, Fund | | |
| | Management Company; Director, Senior Vice | | |
| | President, Secretary, General Counsel and Vice | | |
| | President, Invesco AIM Capital Management, | | |
| | Inc.; Chief Operating Officer and General | | |
| | Counsel, Liberty Ridge Capital, Inc. (an | | |
| | investment adviser) | | |
| | | | |
Gregory G. McGreevey - 1962 | 2012 | Senior Managing Director, Invesco Ltd.; | N/A | N/A |
Senior Vice President | | Director, Chairman, President, and Chief | | |
| | Executive Officer, Invesco Advisers, Inc. | | |
| | (formerly known as Invesco Institutional | | |
| | (N.A.), Inc.) (registered investment adviser); | | |
| | Director, Invesco Mortgage Capital, Inc. and | | |
| | Invesco Senior Secured Management, Inc.; | | |
| | and Senior Vice President, The Invesco Funds; | | |
| | and President, SNW Asset Management | | |
| | Corporation and Invesco Managed Accounts, | | |
| | LLC | | |
| | Formerly: Senior Vice President, Invesco | | |
| | | | |
79 INVESCO HIGH YIELD BOND FACTOR FUND

TRUSTEES AND OFFICERS Unaudited / Continued
Name, Year of Birth and | Trustee | Principal Occupation(s) | Number of Funds | Other Directorship(s) |
Position(s) Held with the Trust | and/or | During Past 5 Years | in Fund Complex | Held by Trustee During |
| Officer | | Overseen by Trustee | Past 5 Years |
| Since | | | |
| | | | |
OFFICERS (CONTINUED) | | | | |
| | | | |
Gregory G. McGreevey | | Management Group, Inc. and Invesco Advisers, | | |
(Continued) | | Inc.; Assistant Vice President, The Invesco | | |
| | Funds | | |
| | | | |
Kelli Gallegos – 1970 | 2008 | Principal Financial and Accounting Officer | N/A | N/A |
Vice President, Principal | | – Investments Pool, Invesco Specialized | | |
Financial Officer and Assistant | | Products, LLC; Vice President, Principal | | |
Treasurer | | Financial Officer and Assistant Treasurer, | | |
| | The Invesco Funds; Principal Financial and | | |
| | Accounting Officer – Pooled Investments, | | |
| | Invesco Capital Management LLC; Vice | | |
| | President and Treasurer, Invesco Exchange- | | |
| | Traded Fund Trust, Invesco Exchange-Traded | | |
| | Fund Trust II, Invesco India Exchange-Traded | | |
| | Fund Trust, Invesco Actively Managed | | |
| | Exchange-Traded Fund Trust, Invesco Actively | | |
| | Managed Exchange-Traded Commodity Fund | | |
| | Trust and Invesco Exchange-Traded Self- | | |
| | Indexed Fund Trust; Vice President, Invesco | | |
| | Advisers, Inc. | | |
| | Formerly: Assistant Treasurer, Invesco | | |
| | Specialized Products, LLC; Assistant Treasurer, | | |
| | Invesco Exchange-Traded Fund Trust, Invesco | | |
| | Exchange-Traded Fund Trust II, Invesco India | | |
| | Exchange-Traded Fund Trust, Invesco Actively | | |
| | Managed Exchange-Traded Fund Trust, | | |
| | Invesco Actively Managed Exchange-Traded | | |
| | Commodity Fund Trust and Invesco Exchange- | | |
| | Traded Self-Indexed Fund Trust; Assistant | | |
| | Treasurer, Invesco Capital Management LLC; | | |
| | Assistant Vice President, The Invesco Funds | | |
| | | | |
Crissie M. Wisdom – 1969 | 2013 | Anti-Money Laundering and OFAC Compliance | N/A | N/A |
Anti-Money Laundering | | Officer for Invesco U.S. entities including; | | |
Compliance Officer | | Invesco Advisers, Inc. and its affiliates, Invesco | | |
| | Capital Markets, Inc., Invesco Distributors, Inc., | | |
| | Invesco Investment Services, Inc., The Invesco | | |
| | Funds, Invesco Capital Management, LLC, | | |
| | Invesco Trust Company; and Fraud Prevention | | |
| | Manager for Invesco Investment Services, Inc. | | |
| | | | |
Robert R. Leveille – 1969 | 2016 | Chief Compliance Officer, Invesco Advisers, | N/A | N/A |
Chief Compliance Officer | | Inc. (registered investment adviser); and Chief | | |
| | Compliance Officer, The Invesco Funds | | |
| | Formerly: Chief Compliance Officer, Putnam | | |
| | Investments and the Putnam Funds | | |
| | | | |
80 INVESCO HIGH YIELD BOND FACTOR FUND
The Statement of Additional Information of the Trust includes additional information about the Fund's Trustees and is available upon request, without charge, by calling 1.800.959.4246. Please refer to the Fund's Statement of Additional Information for information on the Fund's sub-advisers.
Office of the Fund | Investment Adviser | Distributor | Auditors |
11 Greenway Plaza, | Invesco Advisers, Inc. | Invesco Distributors, Inc. | PricewaterhouseCoopers |
Suite 1000 | 1555 Peachtree Street, N.E. | 11 Greenway Plaza, | LLP |
Houston, TX 77046-1173 | Atlanta, GA 30309 | Suite 1000 | 1000 Louisiana Street, |
| | Houston, TX | Suite 5800 |
| | 77046-1173 | Houston, TX 77002-5021 |
Counsel to the Fund | Counsel to the | Transfer Agent | Custodian |
Stradley Ronon Stevens & Young, | Independent Trustees | Invesco Investment | JPMorgan Chase Bank |
LLP | Goodwin Procter LLP | Services, Inc. | 4 Chase Metro Tech |
2005 Market Street, | 901 New York Avenue, N.W. | 11 Greenway Plaza, | Center |
Suite 2600 | Washington, D.C. 20001 | Suite 1000 | Brooklyn, NY 11245 |
Philadelphia, PA 19103-7018 | | Houston, TX | |
| | 77046-1173 | |
81 INVESCO HIGH YIELD BOND FACTOR FUND
INVESCO PRIVACY NOTICE
Invesco recognizes the importance of protecting your personal and financial information when you visit our website located at www.invesco.com (the "Website"). The following information is designed to help you understand the information collection practices at this Website. We will not sell, share or rent your personally identifiable information to others in contravention of this Privacy Policy. When we refer to ourselves as "we" or "Invesco" in this Privacy Policy, we mean our entire company including our affiliates, such as subsidiaries.
By visiting this Website, you are accepting the practices described in this Privacy Policy. If you do not agree to this policy, you may not use this Website. This Privacy Policy is subject to change without notice, from time to time in our sole discretion. You acknowledge that by accessing the Website after we have posted changes to this Privacy Policy, you are agreeing to this Privacy Policy as modified. Please review
the Terms of Use1 to learn of other terms and conditions applicable to your use of the Website.
Please note that this Privacy Policy is not an exclusive statement of our privacy principles across all products and services. Other privacy principles or policies may apply depending on the products or services you obtain from Invesco, or the jurisdiction in which you transact with Invesco.
This Privacy Policy was last updated on May 6, 2018.
Information We Collect and Use
We collect personal information you choose to submit to the Website in order to process transactions requested by you and meet our contractual obligations. For example, you can choose to provide your name, contact information, social security number, or tax identification number in connection with accessing your account, or you can choose to provide your personal information when you fill out a secure account question form. Any information collected about you from the Website can, from time to time, be associated with other identifying information we have about you.
In addition, we may gather information about you automatically through your use of the Website, e.g. your IP address, how you navigate the Website, the organization from which you are accessing the Website, and the websites that you access before and after you visit the Website.
When you access the Website, we may also collect information such as unique device identifiers, your screen resolution and other device settings, information about your location, and analytical information about how you use the device from which you are viewing the Website. Where applicable, we may ask your permission before collecting certain information, such as precise geolocation information.
From time to time, we use or augment the personal information we have about you with information obtained from third parties. For example, we use third party information to confirm contact or financial information or to better understand your interests by associating demographic information from third parties with the information you have provided.
How We Use Personal Information
We use your personal information to respond to your inquiries and provide the products and services you request. We also use your information from time to time to deliver the content and services we believe
1NTD
82 INVESCO HIGH YIELD BOND FACTOR FUND
you will find the most relevant and to provide customer service and support.
We also use the information you provide to further develop and improve our products and services. We aggregate and/or de-identify data about visitors to the Website for various business purposes including product and service development and improvement activities.
How We Share Personal Information
We collaborate with other companies and individuals to perform services for us and on our behalf and we collaborate with our affiliates, other companies and individuals with respect to particular products or services ("Providers"). Examples of Providers include data analysis firms, customer service and support providers, email and SMS vendors, and web-hosting and development companies. Some Providers collect information for us or on our behalf on our Website. These Providers can be provided with access to personal information needed to perform their functions.
We reserve the right to disclose your personal information as required by law, when we believe disclosure is necessary to comply with a regulatory requirement, judicial proceeding, court order or legal process served on us, to protect the safety, rights or property of our customers, the public or Invesco or to enforce the Terms of Use.
If we sell or transfer a business unit (such as a subsidiary) or an asset (such as a website) to another company, we will share your personal information with such company. You will receive notice of such an event and the new entity will inform you of any changes to the practices in this Privacy Policy. If the new entity wishes to make additional use of your information, you have the right to decline such use at that time.
We occasionally disclose aggregate or de-identified data that is not personally identifiable with third parties.
Cookies and Other Tools
Invesco and its Providers collect information about you by using cookies, tracking pixels and other technologies. We use this information to better understand, customize and improve user experience with our websites, services and offerings as well as to manage our advertising. For example, we use web analytics services that use these technologies to gather information to help us understand how visitors engage with and navigate our Website, e.g., how and when pages in a site are visited and by how many visitors. We are also able to offer our visitors a more customized, relevant experience on our sites using these technologies by delivering content and functionality based on your preferences and interests.
Depending on their purpose, some cookies will only operate for the length of a single browsing session, while others have a longer life span to ensure that they fulfill their longer-term purposes. Your web browser can be set to allow you to control whether you will accept cookies or reject cookies, to notify you each time a cookie is sent to your browser, or to delete cookies that have already been set. If your browser is set to reject cookies, certain aspects of the Website that are cookie-enabled will not recognize you when you return to the website, and some Website functionality may be lost. The "Help" section of your browser may tell you how to prevent your browser from accepting cookies. To find out more about cookies, visit www.aboutcookies.org.
83 INVESCO HIGH YIELD BOND FACTOR FUND
INVESCO PRIVACY NOTICE Continued
Security
No data transmission over the internet can be 100% secure, so Invesco cannot ensure or warrant the security of any information you submit to us on this Website. However, Invesco seeks to protect your personal information from unauthorized access or use when you transact business on our Website using technical, administrative and procedural measures. Invesco makes no representation as to the reasonableness, efficacy, or appropriateness of the measures we use to safeguard such information.
Users are responsible for maintaining the secrecy of their own passwords. If you have reason to believe that your interaction with us is no longer secure (for example, if you feel that the security of any account you might have with us has been compromised), please immediately notify us by contacting us as specified below.
Transfer of Data to Other Countries
Any information you provide to Invesco through use of the Website may be stored and processed, transferred between and accessed from the United States, Canada and other countries which do not guarantee the same level of protection of personal information as the one in which you reside. However, Invesco will handle your personal information in accordance with this Privacy Policy regardless of where your personal information is stored/accessed.
Children's Privacy
We are committed to protecting the privacy of children. We do not knowingly collect personal information from children under the age of 18. If you are under the age of 18, do not provide us with any personal information.
Contact Us
Please contact us if you have any questions or concerns about your personal information or require assistance in managing your choices.
Invesco Ltd.
1555 Peachtree St. NE Atlanta, GA 30309 By phone:
(404)439-3236 By fax:
(404)962-8288 By email: Anne.Gerry@invesco.com
Please update your account information by logging in or contact us by email or telephone as specified above to update your account information whenever such information ceases to be complete or accurate.
You may also contact us to:
84 INVESCO HIGH YIELD BOND FACTOR FUND
•Request that we amend, rectify, delete or update the personal data we hold about you;
•Where possible (e.g. in relation to marketing) amend or update your choices around processing;
•Request a copy of personal data held by us.
Disclaimer
Where the Website contains links to third-party websites/content/services that are not owned or controlled by Invesco, Invesco is not responsible for how these properties operate or treat your personal information so we recommend that you read the privacy policies and terms associated with these third party properties carefully.
85 INVESCO HIGH YIELD BOND FACTOR FUND
THIS PAGE INTENTIONALLY LEFT BLANK.
THIS PAGE INTENTIONALLY LEFT BLANK.
Explore High-Conviction Investing with Invesco
Go paperless with eDelivery
Visit invesco.com/edelivery to enjoy the convenience and security of anytime electronic access to your investment documents.
With eDelivery, you can elect to have any or all of the following materials delivered straight to your inbox to download, save and print from your own computer:
Fund reports and prospectuses
Quarterly statements
Daily confirmations
Tax forms
Invesco mailing information
Send general correspondence to Invesco Investment Services, Inc., P.O. Box 219078, Kansas City, MO 64121-9078.
| | | | |
| | | | |
| | | | |
Invesco Distributors, Inc. | O-GLHY-AR-1 04272020 |
Shareholder Report for the
Seven Months Ended 2/29/2020
Invesco
Intermediate Bond
Factor Fund*
Beginning on January 1, 2021, as permitted by regulations adopted by the Securities and Exchange Commission, paper copies of the Fund's shareholder reports will no longer be sent by mail, unless you specifically request paper copies of the reports from the Fund or from your financial intermediary, such as a broker-dealer or bank. Instead, the reports will be made available on the Fund's website, and you will be notified by mail each time a report is posted and provided with a website link to access the report.
If you already elected to receive shareholder reports electronically, you will not be affected by this change and you need not take any action. You may elect to receive shareholder reports and other communications from the Fund electronically by contacting your financial intermediary (such as a broker-dealer or bank) or, if you are a direct investor, by enrolling at invesco. com/edelivery.
You may elect to receive all future reports in paper free of charge. If you invest through a financial intermediary, you can contact your financial intermediary to request that you continue to receive paper copies of your shareholder reports. If you invest directly with the Fund, you can call 800 959 4246 to let the Fund know you wish to continue receiving paper copies of your shareholder reports. Your election to receive reports in paper will apply to all funds held with your financial intermediary or all funds held with the fund complex if you invest directly with the Fund.
*Prior to the close of business on February 28, 2020, the Fund's name was Invesco Oppenheimer Intermediate Income Fund, and prior to the close of business on May 24, 2019, the Fund's name was Oppenheimer Intermediate Income Fund. See Important Update on the following page for more information.
Important Update
On October 18, 2018, Massachusetts Mutual Life Insurance Company, an indirect corporate parent of OppenheimerFunds, Inc. and its subsidiaries OFI Global Asset Management, Inc., OFI SteelPath, Inc. and OFI Advisors, LLC, announced that it had entered into an agreement whereby Invesco Ltd., a global investment management company would acquire OppenheimerFunds and its subsidiaries (together, "OppenheimerFunds"). After the close of business on May 24, 2019 Invesco Ltd. completed the acquisition of OppenheimerFunds. This Fund was included in that acquisition and as of that date, became part of the Invesco family of funds. Please visit invesco.com for more information or call Invesco's Client Services team at 800-959-4246.

Table of Contents | |
Fund Performance Discussion | 5 |
Top Holdings and Allocations | 7 |
Fund Expenses | 10 |
Schedule of Investments | 12 |
Statement of Assets and Liabilities | 28 |
Statement of Operations | 30 |
Statement of Changes in Net Assets | 32 |
Financial Highlights | 33 |
Notes to Financial Statements | 44 |
Report of Independent Registered Public Accounting Firm | 62 |
Tax Information | 64 |
Portfolio Proxy Voting Policies and Guidelines; Updates to | |
Schedule of Investments | 65 |
Trustees and Officers | 66 |
Invesco's Privacy Notice | 78 |
Class A Shares
AVERAGE ANNUAL TOTAL RETURNS AT 2/29/20 | | |
| | |
| Class A Shares of the Fund | |
| | | Bloomberg Barclays |
| Without Sales Charge | With Sales Charge | U.S. Aggregate Bond |
| | | Index |
1-Year | 11.39% | 6.67% | 11.68% |
5-Year | 3.34 | 2.45 | 3.58 |
Since Inception (8/2/10) | 5.02 | 4.55 | 3.66 |
Performance quoted is past performance and cannot guarantee comparable future results; current performance may be lower or higher. Visit invesco.com for the most recent month-end performance. Performance figures reflect reinvested distributions and changes in net asset value (NAV). Investment return and principal value will vary so that you may have a gain or a loss when you sell shares. Fund returns include changes in share price, reinvested distributions and a 4.25% maximum applicable sales charge except where "without sales charge" is indicated. As the result of a reorganization after the close of business on May 24, 2019, the returns of the Fund for periods on or prior to May 24, 2019 reflect performance of the Oppenheimer predecessor fund. Share class returns will differ from those of the predecessor fund because they have different expenses. Returns for periods of less than one year are not annualized. Returns do not consider capital gains or income taxes on an individual's investment. See Fund prospectus and
3 INVESCO INTERMEDIATE BOND FACTOR FUND
summary prospectus for more information on share classes, sales charges and new fee agreements, if any. Fund literature is available at invesco.com.
4 INVESCO INTERMEDIATE BOND FACTOR FUND
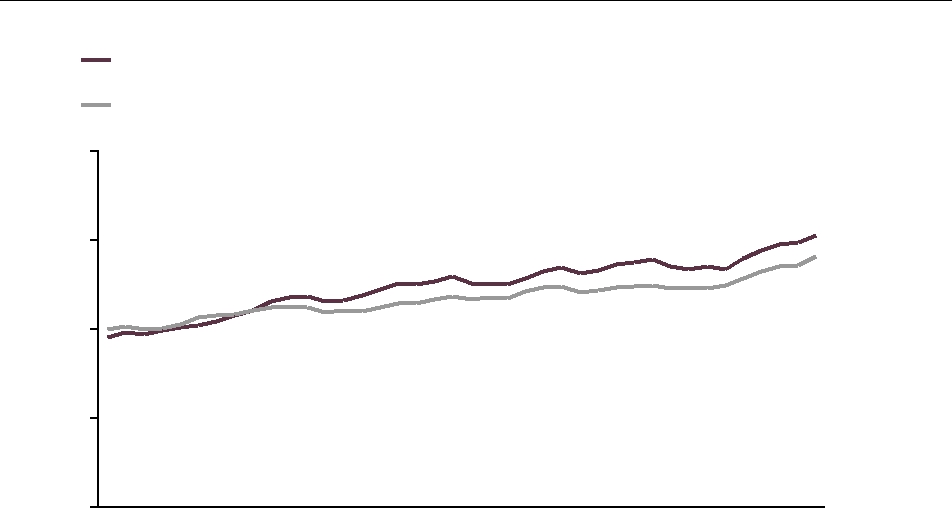
Fund Performance Discussion
MARKET OVERVIEW
During the fiscal year ended February 29, 2020, US Treasury yields fell considerably, especially in February as concerns regarding the spread of the coronavirus took hold. The US credit market performed strongly over the fiscal year, with returns above 15%. Investment grade credit spreads tightened for most of the fiscal year, but with worries stemming from the coronavirus, spreads widened in the last two months of the fiscal year. With spreads roughly unchanged over the past 12 months, the primary driver of performance was the decline in US Treasury yields. In particular, the 10-year US Treasury fell to 1.13% at the end of the fiscal year from 2.73% in February 2019.
Over the past 12 months, the US Federal Reserve (the Fed) cut interest rates three times: in July, September and October 2019 -- for a total of 75 basis points. (A basis point is one one-hundredth of a percentage point.) As a result, the federal funds target rate stood at a range of 1.50% to 1.75% as of October 31, 2019, as well as at the end of the fiscal year. Moreover, US Treasury rates fell across all maturities. The out-of-benchmark US high yield sector posted a positive return for the fiscal year, as did emerging markets credit.
COMPARISON OF CHANGE IN VALUE OF $10,000 HYPOTHETICAL INVESTMENTS IN:
Invesco Intermediate Bond Factor Fund (Class A shares with sales charge)
Bloomberg Barclays U.S. Aggregate Bond Index
$20,000
15,000 | | | | | | | | | | $15,309 |
| | | | | | | | | $14,105 |
| | | | | | | | | |
10,000 | | | | | | | | | | |
5,000 | | | | | | | | | | |
0 | | | | | | | | | | | | | | | | | | | | | |
8/2/10 | 2/28/11 | 2/29/12 | 2/28/13 | 2/28/14 | 2/28/15 | 2/29/16 | 2/28/17 | 2/28/18 | 2/28/19 | 2/29/20 |
5 INVESCO INTERMEDIATE BOND FACTOR FUND
FUND REVIEW
Against this backdrop, the Fund's Class A shares (without sales charge) produced a return of 11.39% this reporting period, underperforming the Bloomberg Barclays U.S. Aggregate Bond Index's (the "Index") return of 11.68%.
During the year, the Fund performed well due to its exposure to corporate bonds, including investment grade as well as an off-benchmark position in high yield. The allocation to structured securities was a minor drag due to the lower duration associated with these positions
On February 28, 2020, the Invesco Oppenheimer Intermediate Income Fund was repositioned. The Fund was renamed the Invesco Intermediate Bond Factor Fund with an investment goal to seek a total return by targeting securities with characteristics that research suggests will have higher returns over a market cycle while using a factor- based strategy. In practice, this means the Fund will have higher allocation than its benchmark to value bonds (bonds that have higher spreads relative to other securities of similar credit quality and/or sector); low volatility bonds (bonds that have lower levels of price volatility); and high carry bonds (bonds with higher absolute yield or spread). The Fund may invest in investment grade debt securities, including corporate and government bonds, mortgage-related securities, asset-backed securities, notes and debentures and other types of debt securities.
It may also invest a portion of its assets in foreign debt securities.
Portfolio Managers: Jay Raol, James Ong, Noelle Corum and Sash Sarangi
6 INVESCO INTERMEDIATE BOND FACTOR FUND
Top Holdings and Allocations
CORPORATE BONDS & NOTES - TOP TEN INDUSTRIES
| Commercial Banks | 8.1% |
| Oil, Gas & Consumable Fuels | 4.5 |
| Capital Markets | 3.3 |
| Electric Utilities | 2.9 |
| Real Estate Investment Trusts | 1.9 |
| (REITs) |
| |
| Media | 1.8 |
| Food Products | 1.8 |
| Automobiles | 1.7 |
| Insurance | 1.7 |
| Beverages | 1.6 |
Holdings and allocations are subject to change and are not buy/sell recommendations. Percentages are as of February 29, 2020, and are based on net assets.
For more current Fund holdings, please visit invesco.com.
PORTFOLIO ALLOCATION
Non-Convertible Corporate Bonds | 49.9% |
and Notes |
U.S. Government Obligations | 21.3 |
Investment Companies | 18.6 |
Mortgage-Backed Obligations | |
Agency | 1.9 |
CMOs | 3.1 |
Non-Agency | 2.8 |
Preferred Stocks | 1.9 |
Asset-Backed Securities | 0.5 |
Portfolio holdings and allocations are subject to change. Percentages are as of February 29, 2020, and are based on the total market value of investments.
7 INVESCO INTERMEDIATE BOND FACTOR FUND
Share Class Performance
AVERAGE ANNUAL TOTAL RETURNS WITHOUT SALES CHARGE AS OF 2/29/20 | |
| | | | | |
| | Inception | | | Since |
| | Date | 1-Year | 5-Year | Inception |
Class A (OFIAX) | 8/2/10 | 11.39% | 3.34% | 5.02% |
Class C (OFICX) | 8/2/10 | 10.33 | 2.54 | 4.18 |
Class R (OFINX) | 8/2/10 | 10.87 | 3.05 | 4.71 |
Class Y (OFIYX) | 8/2/10 | 11.78 | 3.64 | 5.26 |
Class R5 | (IOTEX)1 | 5/24/19 | 11.51 | 3.36 | 5.03 |
Class R6 | (OFIIX)2 | 11/28/12 | 11.76 | 3.78 | 4.16 |
AVERAGE ANNUAL TOTAL RETURNS WITH SALES CHARGE AS OF 2/29/20 | |
| | | | | |
| | Inception | | | Since |
| | Date | 1-Year | 5-Year | Inception |
Class A (OFIAX) | 8/2/10 | 6.67% | 2.45% | 4.55% |
Class C (OFICX) | 8/2/10 | 9.33 | 2.54 | 4.18 |
Class R (OFINX) | 8/2/10 | 10.87 | 3.05 | 4.71 |
Class Y (OFIYX) | 8/2/10 | 11.78 | 3.64 | 5.26 |
Class R5 | (IOTEX)1 | 5/24/19 | 11.51 | 3.36 | 5.03 |
Class R6 | (OFIIX)2 | 11/28/12 | 11.76 | 3.78 | 4.16 |
1.Class R5 shares' performance shown prior to the inception date is that of the predecessor fund's Class A shares at net asset value (NAV) and includes the 12b-1 fees applicable to Class A shares. Class A shares' performance reflects any applicable fee waivers and/or expense reimbursements.
2.Pursuant to the closing of the transaction described in the Notes to Financial Statements, after the close of business on May 24, 2019, Class I shares were reorganized as Class R6 shares.
Performance quoted is past performance and cannot guarantee comparable future results; current performance may be lower or higher. Visit invesco.com for the most recent month-end performance. Performance figures reflect reinvested distributions and changes in net asset value (NAV). Investment return and principal value will vary so that you may have a gain or a loss when you sell shares. Performance shown at NAV does not include the applicable front-end sales charge, which would have reduced the performance. The current maximum initial sales charge for Class A shares is 4.25%, and the contingent deferred sales charge for Class C shares is 1% for the 1-year period. Class R, Class Y, Class R5 and Class R6 shares have no sales charge; therefore, performance is at NAV. Effective after the close of business on May 24, 2019, Class A, Class C, Class R, Class Y, and Class I shares of the predecessor fund were reorganized into Class A, Class C, Class R, Class Y, and Class R6 shares, respectively, of the Fund. Class R5 shares' performance shown prior to the inception date is that of the predecessor fund's Class A shares at NAV and includes the 12b-1 fees applicable to Class A shares. Class A shares' performance reflects any applicable fee waivers and/or expense reimbursements. Returns shown for Class A, Class C, Class R, Class Y, Class R5, and Class R6 shares are blended returns of the predecessor fund and the Fund. Share class returns will differ from those of the predecessor fund because of different expenses. See Fund prospectuses and summary prospectuses for more information on share classes, sales charges and new fee agreements, if any. Fund literature is available at invesco.com.
8 INVESCO INTERMEDIATE BOND FACTOR FUND
The Bloomberg Barclays U.S. Aggregate Bond Index is an index of U.S dollar-denominated, investment-grade U.S. corporate government and mortgage-backed securities The Index
is unmanaged and cannot be purchased directly by investors. While index comparisons may be useful to provide a benchmark for the Fund's performance, it must be noted that the Fund's investments are not limited to the investments comprising the Index. Index performance includes reinvestment of income, but does not reflect transaction costs, fees, expenses or taxes. Index performance is shown for illustrative purposes only as a benchmark for the Fund's performance, and does not predict or depict performance of the Fund. The Fund's performance reflects the effects of the Fund's business and operating expenses.
The views and opinions expressed in management's discussion of Fund performance are those of Invesco Advisers, Inc. These views and opinions are subject to change at any time based on factors such as market and economic conditions. These views and opinions may not be relied upon as investment advice or recommendations, or as an offer for a particular security. The information is not a complete analysis of every aspect of any market, country, industry, security or the Fund. Statements of fact are from sources considered reliable, but Invesco Advisers, Inc. makes no representation or warranty as to their completeness or accuracy. Although historical performance is no guarantee of future results, these insights may help you understand our investment management philosophy.
Before investing, investors should carefully read the prospectus and/or summary prospectus and carefully consider the investment objectives, risks, charges and expenses. For this and more complete information about the fund(s), investors should ask their advisors for a prospectus/summary prospectus or visit invesco. com/fundprospectus.
Shares of Invesco funds are not deposits or obligations of any bank, are not guaranteed by any bank, are not insured by the FDIC or any other agency, and involve investment risks, including the possible loss of the principal amount invested.
9 INVESCO INTERMEDIATE BOND FACTOR FUND
Fund Expenses
Fund Expenses. As a shareholder of the Fund, you incur two types of costs: (1) transaction costs, which may include sales charges (loads) on purchase payments and/or contingent deferred sales charges on redemptions; and (2) ongoing costs, including management fees; distribution and service fees; and other Fund expenses. These examples are intended to help you understand your ongoing costs (in dollars) of investing in the Fund and to compare these costs with the ongoing costs of investing in other mutual funds.
The examples are based on an investment of $1,000.00 invested at the beginning of the period and held for the entire 6-month period ended February 29, 2020.
Actual Expenses. The first section of the table provides information about actual account values and actual expenses. You may use the information in this section for the class of shares you hold, together with the amount you invested, to estimate the expense that you paid over the period. Simply divide your account value by $1,000.00 (for example, an $8,600.00 account value divided by $1,000.00 = 8.60), then multiply the result by the number in the first section under the heading entitled "Expenses Paid During 6 Months Ended February 29, 2020" to estimate the expenses you paid on your account during this period.
Hypothetical Example for Comparison Purposes. The second section of the table provides information about hypothetical account values and hypothetical expenses based on the Fund's actual expense ratio for each class of shares, and an assumed rate of return of 5% per year for each class before expenses, which is not the Fund's actual return. The hypothetical account values and expenses may not be used to estimate the actual ending account balance or expenses you paid for the period. You may use this information to compare the ongoing costs of investing in the Fund and other funds. To do so, compare this 5% hypothetical example for the class of shares you hold with the 5% hypothetical examples that appear in the shareholder reports of the other funds.
Please note that the expenses shown in the table are meant to highlight your ongoing costs only and do not reflect any transactional costs, such as front-end or contingent deferred sales charges (loads). Therefore, the "hypothetical" section of the table is useful in comparing ongoing costs only, and will not help you determine the relative total costs of owning different funds. In addition, if these transactional costs were included, your costs would have been higher.
10 INVESCO INTERMEDIATE BOND FACTOR FUND
| Beginning | Ending | Expenses |
| Account | Account | Paid During |
| Value | Value | 6 Months Ended |
Actual | September 1, 2019 | February 29, 2020 | February 29, 2020 |
Class A | $ 1,000.00 | $ 1,029.70 | $ | 3.69 |
Class C | 1,000.00 | 1,026.00 | | 8.24 |
Class R | 1,000.00 | 1,028.60 | | 5.72 |
Class Y | 1,000.00 | 1,032.10 | | 2.17 |
Class R5 | 1,000.00 | 1,031.10 | | 2.22 |
Class R6 | 1,000.00 | 1,031.40 | | 1.97 |
Hypothetical | | | | |
(5% return before expenses) | | | | |
Class A | 1,000.00 | 1,021.23 | | 3.68 |
Class C | 1,000.00 | 1,016.76 | | 8.21 |
Class R | 1,000.00 | 1,019.24 | | 5.69 |
Class Y | 1,000.00 | 1,022.73 | | 2.16 |
Class R5 | 1,000.00 | 1,022.68 | | 2.22 |
Class R6 | 1,000.00 | 1,022.92 | | 1.96 |
Expenses are equal to the Fund's annualized expense ratio for that class, multiplied by the average account value over the period, multiplied by 182/366 (to reflect the one-half year period). Those annualized expense ratios, excluding indirect expenses from affiliated funds, based on the 6-month period ended February 29, 2020 are as follows:
Class | Expense Ratios |
Class A | 0.73% |
Class C | 1.63 |
Class R | 1.13 |
| |
Class Y | 0.43 |
Class R5 | 0.44 |
Class R6 | 0.39 |
The expense ratios reflect voluntary and/or contractual waivers and/or reimbursements of expenses by the Fund's Adviser. Some of these undertakings may be modified or terminated at any time, as indicated in the Fund's prospectus. The "Financial Highlights" tables in the Fund's financial statements, included in this report, also show the gross expense ratios, without such waivers or reimbursements and reduction to custodian expenses, if applicable.
11 INVESCO INTERMEDIATE BOND FACTOR FUND
SCHEDULE OF INVESTMENTS February 29, 2020
AL
| | | Principal Amount | | | Value |
Asset-Backed Securities—0.5% | | | | | | |
DT Auto Owner Trust, Series 2017-1A, Cl. E, 5.79%, 2/15/241 | $ | 750,000 | $ | 776,590 |
Navistar Financial Dealer Note Master Owner Trust II: | | | | | |
Series 2019-1, Cl. C, 2.577% [US0001M+95], 5/25/241,2 | | 70,000 | | | 70,150 |
Series 2019-1, Cl. D, 3.077% [US0001M+145], 5/25/241,2 | | 65,000 | | | 65,111 |
Total Asset-Backed Securities (Cost $897,952) | | | | | 911,851 |
| | | | | |
Mortgage-Backed Obligations—8.0% | | | | | |
Banc of America Mortgage Trust, Series 2007-1, Cl. 1A24, | | | | | |
6.00%, 3/25/37 | | | 24,628 | | | 24,801 |
BANK, Interest-Only Stripped Mtg.-Backed Security, Series | | | | | |
2019-BN16, Cl. XA, 10.962%, 2/15/523 | | | 2,387,423 | | | 171,417 |
Citigroup Commercial Mortgage Trust, Interest-Only | | | | | |
Commercial Mtg. Pass-Through Certificates, Series 2017-C4, | | | | | |
Cl. XA, 0.00%, 10/12/503,4 | | | 6,408,289 | | | 408,002 |
COMM Mortgage Trust: | | | | | | |
Series 2014-UBS4, Cl. AM, 3.968%, 8/10/47 | | 407,000 | | | 441,391 |
Series 2014-UBS6, Cl. AM, 4.048%, 12/10/47 | | 900,000 | | | 975,813 |
Connecticut Avenue Securities: | | | | | | |
Series 2013-C01, Cl. M2, 6.877% [US0001M+525], | | | | | |
10/25/232 | | | 464,838 | | | 512,280 |
Series 2014-C01, Cl. M2, 6.027% [US0001M+440], 1/25/242 | | 786,169 | | | 849,324 |
Series 2014-C02, Cl. 1M2, 4.227% [US0001M+260], | | | | | |
5/25/242 | | | 340,089 | | | 352,697 |
Series 2014-C03, Cl. 1M2, 4.627% [US0001M+300], | | | | | |
7/25/242 | | | 739,594 | | | 778,545 |
Series 2014-C03, Cl. 2M2, 4.527% [US0001M+290], | | | | | |
7/25/242 | | | 94,629 | | | 98,379 |
Series 2014-C04, Cl. 2M2, 6.627% [US0001M+500], | | | | | |
11/25/242 | | | 340,313 | | | 365,562 |
Series 2016-C01, Cl. 1M2, 8.377% [US0001M+675], | | | | | |
8/25/282 | | | 205,194 | | | 224,772 |
Series 2016-C02, Cl. 1M2, 7.627% [US0001M+600], | | | | | |
9/25/282 | | | 368,462 | | | 397,762 |
Series 2016-C05, Cl. 2M2, 6.077% [US0001M+445], | | | | | |
1/25/292 | | | 254,118 | | | 267,828 |
Series 2016-C06, Cl. 1M2, 5.877% [US0001M+425], | | | | | |
4/25/292 | | | 360,000 | | | 382,200 |
Connecticut Avenue Securities Trust: | | | | | | |
Series 2018-R07, Cl. 1M2, 4.027% [US0001M+240], | | | | | |
4/25/311,2 | | | 384,182 | | | 387,344 |
Series 2019-R01, Cl. 2M1, 2.477% [US0001M+85], | | | | | |
7/25/311,2 | | | 32,218 | | | 32,221 |
Series 2019-R02, Cl. 1M2, 3.927% [US0001M+230], | | | | | |
8/25/311,2 | | | 192,228 | | | 193,626 |
Series 2019-R03, Cl. 1M2, 3.777% [US0001M+215], | | | | | |
9/25/311,2 | | | 190,417 | | | 191,521 |
Federal Home Loan Mortgage Corp., Interest-Only Stripped | | | | | |
Mtg.-Backed Security, Series 304, Cl. C45, 9.092%, 12/15/273 | | 163,878 | | | 10,510 |
12 | INVESCO INTERMEDIATE BOND FACTOR FUND | | | |
| | | Principal Amount | | Value |
Mortgage-Backed Obligations (Continued) | | | | |
Federal Home Loan Mortgage Corp., Multifamily Structured Pass-Through Certificates, Interest-Only Stripped Mtg.- |
Backed Security: | | | | | |
Series K093, Cl. X1, 0.00%, 5/25/293,4 | | $ | 2,557,008 | $ | 198,206 |
Series K734, Cl. X1, 0.00%, 2/25/263,4 | | | 3,067,733 | | 105,252 |
Series K735, Cl. X1, 0.00%, 5/25/263,4 | | | 3,238,215 | | 175,223 |
Series KC03, Cl. X1, 0.00%, 11/25/243,4 | | | 4,164,922 | | 89,398 |
Federal Home Loan Mortgage Corp., Real Estate Mtg. | | | | |
Investment Conduit Multiclass Pass-Through Certificates, | | | | |
Interest-Only Stripped Mtg.-Backed Security, Series 4316, Cl. | | | | |
JS, 0.00%, 1/15/443,4 | | | 431,006 | | 50,436 |
Federal Home Loan Mortgage Corp., STACR Trust: | | | | |
Series 2019-HQA1, Cl. M1, 2.527% [US0001M+90], | | | | |
2/25/491,2 | | | 13,361 | | 13,363 |
Series 2019-HRP1, Cl. M2, 3.027% [US0001M+140], | | | | |
2/25/491,2 | | | 190,000 | | 189,588 |
Federal National Mortgage Assn., Alternative Credit | | | | |
Enhancement Securities, Interest-Only Stripped Mtg.-Backed | | | | |
Security, Series 2012-M18, Cl. X, 0.00%, 12/25/223,4 | | 20,993,233 | | 127,712 |
Federal National Mortgage Assn., Real Estate Mtg. Investment Conduit Multiclass Pass-Through Certificates, Interest- |
Only Stripped Mtg.-Backed Security: | | | | | |
Series 2015-57, Cl. LI, 6.038%, 8/25/353 | | 435,512 | | 54,582 |
Series 2016-45, Cl. MI, 7.867%, 7/25/463 | | 119,617 | | 22,642 |
Series 2017-60, Cl. LI, 0.00%, 8/25/473,4 | | 259,924 | | 18,238 |
Series 2017-66, Cl. AS, 2.92%, 9/25/473 | | | 1,517,577 | | 212,791 |
FREMF Mortgage Trust: | | | | | |
Series 2012-K23, Cl. C, 3.656%, 10/25/451,5 | | 395,000 | | 410,659 |
Series 2013-K28, Cl. C, 3.49%, 6/25/461,5 | | 390,000 | | 408,384 |
Series 2013-K29, Cl. C, 3.476%, 5/25/461,5 | | 220,000 | | 230,345 |
Series 2013-K32, Cl. C, 3.537%, 10/25/461,5 | | 450,000 | | 472,445 |
Series 2014-K36, Cl. C, 4.364%, 12/25/461,5 | | 500,000 | | 535,106 |
Series 2014-K38, Cl. B, 4.222%, 6/25/471,5 | | 280,000 | | 306,282 |
Series 2014-K714, Cl. C, 3.909%, 1/25/471,5 | | 215,000 | | 217,316 |
Series 2016-K54, Cl. C, 4.051%, 4/25/481,5 | | 290,000 | | 310,854 |
Government National Mortgage Assn., Interest-Only Stripped | | | | |
Mtg.-Backed Security, Series 2017-149, Cl. GS, 4.264%, | | | | |
10/16/473 | | | 832,829 | | 134,630 |
JPMBB Commercial Mortgage Securities Trust, Series 2014- | | | | |
C24, Cl. AS, 3.914%, 11/15/475 | | | 200,000 | | 215,976 |
Morgan Stanley Bank of America Merrill Lynch Trust, Series | | | | |
2013-C9, Cl. AS, 3.456%, 5/15/46 | | | 770,000 | | 811,348 |
STACR Trust, Series 2018-HRP1, Cl. M2, 3.277% | | | | |
[US0001M+165], 4/25/431,2 | | | 556,403 | | 557,602 |
Structured Agency Credit Risk Debt Nts.: | | | | | |
Series 2013-DN2, Cl. M2, 5.877% [US0001M+425], | | | | |
11/25/232 | | | 348,714 | | 377,949 |
Series 2014-DN2, Cl. M3, 5.227% [US0001M+360], | | | | |
4/25/242 | | | 515,000 | | 545,790 |
Series 2014-DN3, Cl. M3, 5.627% [US0001M+400], | | | | |
8/25/242 | | | 468,010 | | 497,316 |
13 | INVESCO INTERMEDIATE BOND FACTOR FUND | | |

SCHEDULE OF INVESTMENTS Continued
| | Principal Amount | | | Value |
Mortgage-Backed Obligations (Continued) | | | | | |
Structured Agency Credit Risk Debt Nts.: (Continued) | | | | | |
Series 2016-DNA2, Cl. M3, 6.277% [US0001M+465], | | | | | |
10/25/282 | $ | 222,682 | $ | 237,825 |
Series 2018-HQA1, Cl. M2, 3.927% [US0001M+230], | | | | | |
9/25/302 | | 175,000 | | | 176,819 |
WaMu Mortgage Pass-Through Certificates Trust, Series 2005- | | | | | |
AR14, Cl. 1A4, 3.838%, 12/25/355 | | 37,682 | | | 38,316 |
WF-RBS Commercial Mortgage Trust, Series 2014-LC14, Cl. | | | | | |
AS, 4.351%, 3/15/475 | | 450,000 | | | 489,335 |
Total Mortgage-Backed Obligations (Cost $14,997,623) | | | | | 15,297,723 |
| | | | | |
U.S. Government Obligations—22.0% | | | | | |
United States Treasury Bond, 2.375%, 11/15/49 | | 1,037,600 | | | 1,211,540 |
United States Treasury Nts.: | | | | | |
1.125%, 2/28/22 | | 9,800,000 | | | 9,845,937 |
1.375%, 1/31/22-1/31/25 | | 16,902,000 | | | 17,263,103 |
1.50%, 8/15/26-2/15/30 | | 13,091,400 | | | 13,486,381 |
Total U.S. Government Obligations (Cost $40,680,261) | | | | | 41,806,961 |
| | | | | |
Corporate Bonds and Notes—51.3% | | | | | |
Consumer Discretionary—7.8% | | | | | |
Auto Components—0.3% | | | | | |
Goodyear Tire & Rubber Co. (The), 5.125% Sr. Unsec. Nts., | | | | | |
11/15/23 | | 495,000 | | | 492,372 |
| | | | | |
Automobiles—1.7% | | | | | |
Daimler Finance North America LLC, 2.55% Sr. Unsec. Nts., | | | | | |
8/15/221 | | 481,000 | | | 489,521 |
Ford Motor Credit Co. LLC: | | | | | |
3.087% Sr. Unsec. Nts., 1/9/23 | | 385,000 | | | 386,275 |
5.584% Sr. Unsec. Nts., 3/18/24 | | 325,000 | | | 347,944 |
General Motors Co., 6.25% Sr. Unsec. Nts., 10/2/43 | | 403,000 | | | 458,598 |
General Motors Financial Co., Inc., 4.20% Sr. Unsec. Nts., | | | | | |
11/6/21 | | 262,000 | | | 270,818 |
Harley-Davidson Financial Services, Inc., 2.55% Sr. Unsec. | | | | | |
Nts., 6/9/221 | | 475,000 | | | 483,697 |
Hyundai Capital America, 4.30% Sr. Unsec. Nts., 2/1/241 | | 350,000 | | | 377,145 |
Volkswagen Group of America Finance LLC, 4.00% Sr. Unsec. | | | | | |
Nts., 11/12/211 | | 482,000 | | | 501,979 |
| | | | | 3,315,977 |
| | | | | |
Diversified Consumer Services—0.3% | | | | | |
Service Corp. International, 4.625% Sr. Unsec. Nts., 12/15/27 | | 492,000 | | | 516,513 |
| | | | | |
Entertainment—0.4% | | | | | |
Discovery Communications LLC, 4.125% Sr. Unsec. Nts., | | | | | |
5/15/29 | | 289,000 | | | 318,029 |
14 INVESCO INTERMEDIATE BOND FACTOR FUND
| | Principal Amount | | | Value |
Entertainment (Continued) | | | | | |
Netflix, Inc., 5.50% Sr. Unsec. Nts., 2/15/22 | $ | 484,000 | $ | 508,660 |
| | | | | 826,689 |
| | | | | |
Hotels, Restaurants & Leisure—0.6% | | | | | |
Aramark Services, Inc., 5.00% Sr. Unsec. Nts., 4/1/251 | | 479,000 | | | 495,760 |
International Game Technology plc, 6.50% Sr. Sec. Nts., | | | | | |
2/15/251 | | 470,000 | | | 509,945 |
McDonald's Corp., 3.625% Sr. Unsec. Nts., 9/1/49 | | 111,000 | | | 119,833 |
| | | | | 1,125,538 |
| | | | | |
Household Durables—0.9% | | | | | |
Lennar Corp., 4.75% Sr. Unsec. Nts., 5/30/25 | | 413,000 | | | 447,161 |
MDC Holdings, Inc., 3.85% Sr. Unsec. Nts., 1/15/30 | | 369,000 | | | 369,692 |
Toll Brothers Finance Corp.: | | | | | |
4.375% Sr. Unsec. Nts., 4/15/23 | | 619,000 | | | 645,564 |
4.875% Sr. Unsec. Nts., 3/15/27 | | 175,000 | | | 191,413 |
| | | | | 1,653,830 |
| | | | | |
Internet & Catalog Retail—0.4% | | | | | |
QVC, Inc., 4.45% Sr. Sec. Nts., 2/15/25 | | 825,000 | | | 839,541 |
| | | | | |
Media—1.8% | | | | | |
Charter Communications Operating LLC/Charter | | | | | |
Communications Operating Capital, 5.125% Sr. Sec. Nts., | | | | | |
7/1/49 | | 130,000 | | | 146,472 |
Comcast Corp., 2.65% Sr. Unsec. Nts., 2/1/30 | | 135,000 | | | 141,728 |
Interpublic Group of Cos., Inc. (The), 4.20% Sr. Unsec. Nts., | | | | | |
4/15/24 | | 534,000 | | | 586,813 |
Lamar Media Corp., 5.75% Sr. Unsec. Nts., 2/1/26 | | 460,000 | | | 479,274 |
Time Warner Cable LLC, 4.50% Sr. Sec. Nts., 9/15/42 | | 420,000 | | | 437,950 |
ViacomCBS, Inc.: | | | | | |
4.20% Sr. Unsec. Nts., 6/1/29 | | 239,000 | | | 268,317 |
4.375% Sr. Unsec. Nts., 3/15/43 | | 500,000 | | | 538,234 |
WPP Finance 2010, 3.75% Sr. Unsec. Nts., 9/19/24 | | 840,000 | | | 904,144 |
| | | | | 3,502,932 |
| | | | | |
Specialty Retail—1.1% | | | | | |
Advance Auto Parts, Inc., 4.50% Sr. Unsec. Nts., 12/1/23 | | 450,000 | | | 494,849 |
Gap, Inc. (The), 5.95% Sr. Unsec. Nts., 4/12/21 | | 470,000 | | | 478,812 |
Home Depot, Inc. (The), 2.95% Sr. Unsec. Nts., 6/15/29 | | 280,000 | | | 302,929 |
Ross Stores, Inc., 3.375% Sr. Unsec. Nts., 9/15/24 | | 697,000 | | | 749,738 |
| | | | | 2,026,328 |
| | | | | |
Textiles, Apparel & Luxury Goods—0.3% | | | | | |
Hanesbrands, Inc., 4.875% Sr. Unsec. Nts., 5/15/261 | | 515,000 | | | 540,415 |
15 INVESCO INTERMEDIATE BOND FACTOR FUND
SCHEDULE OF INVESTMENTS Continued
| | Principal Amount | | | Value |
Consumer Staples—4.1% | | | | | |
Beverages—1.6% | | | | | |
Anheuser-Busch InBev Worldwide, Inc., 8.20% Sr. Unsec. Nts., | | | | | |
1/15/39 | $ | 650,000 | $ | 1,071,820 |
Bacardi Ltd., 4.70% Sr. Unsec. Nts., 5/15/281 | | 811,000 | | | 928,895 |
Keurig Dr Pepper, Inc., 4.597% Sr. Unsec. Nts., 5/25/28 | | 805,000 | | | 929,408 |
Molson Coors Beverage Co., 4.20% Sr. Unsec. Nts., 7/15/46 | | 140,000 | | | 145,659 |
| | | | | 3,075,782 |
| | | | | |
Food & Staples Retailing—0.2% | | | | | |
Kroger Co. (The), 4.45% Sr. Unsec. Nts., 2/1/47 | | 350,000 | | | 397,260 |
| | | | | |
Food Products—1.8% | | | | | |
Bunge Ltd. Finance Corp., 3.25% Sr. Unsec. Nts., 8/15/26 | | 810,000 | | | 838,516 |
Conagra Brands, Inc., 5.40% Sr. Unsec. Nts., 11/1/48 | | 400,000 | | | 506,862 |
Experian Finance plc, 2.75% Sr. Unsec. Nts., 3/8/301 | | 497,000 | | | 525,477 |
Lamb Weston Holdings, Inc., 4.875% Sr. Unsec. Nts., 11/1/261 | | 489,000 | | | 508,266 |
Smithfield Foods, Inc.: | | | | | |
3.35% Sr. Unsec. Nts., 2/1/221 | | 287,000 | | | 292,864 |
5.20% Sr. Unsec. Nts., 4/1/291 | | 377,000 | | | 430,500 |
Tyson Foods, Inc., 5.10% Sr. Unsec. Nts., 9/28/48 | | 261,000 | | | 340,828 |
| | | | | 3,443,313 |
| | | | | |
Tobacco—0.5% | | | | | |
Altria Group, Inc., 3.875% Sr. Unsec. Nts., 9/16/46 | | 355,000 | | | 346,055 |
BAT Capital Corp., 3.557% Sr. Unsec. Nts., 8/15/27 | | 485,000 | | | 512,393 |
| | | | | 858,448 |
| | | | | |
Energy—4.7% | | | | | |
Energy Equipment & Services—0.2% | | | | | |
Enterprise Products Operating LLC, 4.20% Sr. Unsec. Nts., | | | | | |
1/31/50 | | 173,000 | | | 184,468 |
Plains All American Pipeline LP/PAA Finance Corp., 3.55% Sr. | | | | | |
Unsec. Nts., 12/15/29 | | 231,000 | | | 227,718 |
| | | | | 412,186 |
| | | | | |
Oil, Gas & Consumable Fuels—4.5% | | | | | |
Apache Corp., 4.375% Sr. Unsec. Nts., 10/15/28 | | 382,000 | | | 402,080 |
Boardwalk Pipelines LP, 4.95% Sr. Unsec. Nts., 12/15/24 | | 445,000 | | | 487,660 |
Cenovus Energy, Inc., 4.25% Sr. Unsec. Nts., 4/15/27 | | 285,000 | | | 305,737 |
Cimarex Energy Co., 4.375% Sr. Unsec. Nts., 3/15/29 | | 236,000 | | | 245,154 |
Continental Resources, Inc., 4.375% Sr. Unsec. Nts., 1/15/28 | | 265,000 | | | 257,659 |
DCP Midstream Operating LP, 5.125% Sr. Unsec. Nts., | | | | | |
5/15/29 | | 475,000 | | | 467,566 |
Devon Energy Corp., 4.75% Sr. Unsec. Nts., 5/15/42 | | 170,000 | | | 171,782 |
Energy Transfer Operating LP: | | | | | |
4.25% Sr. Unsec. Nts., 3/15/23 | | 435,000 | | | 460,993 |
5.30% Sr. Unsec. Nts., 4/15/47 | | 389,000 | | | 404,125 |
6.625% [US0003M+415.5] Jr. Sub. Perpetual Bonds2,6 | | 97,000 | | | 86,742 |
EnLink Midstream LLC, 5.375% Sr. Unsec. Nts., 6/1/29 | | 500,000 | | | 432,601 |
16 INVESCO INTERMEDIATE BOND FACTOR FUND
| | | Principal Amount | | | Value |
Oil, Gas & Consumable Fuels (Continued) | | | | | |
Enterprise Products Operating LLC, 3.95% Sr. Unsec. Nts., | | | | | |
1/31/60 | | $ | 81,000 | $ | 79,694 |
EQT Corp., 3.00% Sr. Unsec. Nts., 10/1/22 | | 267,000 | | | 224,280 |
Kinder Morgan, Inc., 5.20% Sr. Unsec. Nts., 3/1/48 | | 242,000 | | | 287,239 |
Marathon Petroleum Corp., 4.50% Sr. Unsec. Nts., 4/1/48 | | 105,000 | | | 120,026 |
MPLX LP: | | | | | | |
2.985% [US0003M+110] Sr. Unsec. Nts., 9/9/222 | | 225,000 | | | 225,847 |
4.25% Sr. Unsec. Nts., 12/1/271 | | | 239,000 | | | 260,467 |
Newfield Exploration Co., 5.625% Sr. Unsec. Nts., 7/1/24 | | 425,000 | | | 462,960 |
Occidental Petroleum Corp.: | | | | | | |
2.90% Sr. Unsec. Nts., 8/15/24 | | | 519,000 | | | 526,359 |
3.50% Sr. Unsec. Nts., 8/15/29 | | | 237,000 | | | 239,319 |
4.50% Sr. Unsec. Nts., 7/15/44 | | | 226,000 | | | 216,156 |
ONEOK, Inc., 4.35% Sr. Unsec. Nts., 3/15/29 | | 236,000 | | | 263,396 |
Rockies Express Pipeline LLC, 4.95% Sr. Unsec. Nts., 7/15/291 | | 244,000 | | | 242,683 |
Sabine Pass Liquefaction LLC, 4.20% Sr. Sec. Nts., 3/15/28 | | 705,000 | | | 745,444 |
Targa Resources Partners LP/Targa Resources Partners Finance | | | | | |
Corp., 6.50% Sr. Unsec. Nts., 7/15/27 | | | 500,000 | | | 521,250 |
Valero Energy Corp., 4.00% Sr. Unsec. Nts., 4/1/29 | | 230,000 | | | 250,220 |
Western Midstream Operating LP, 3.10% Sr. Unsec. Nts., | | | | | |
2/1/25 | | | 164,000 | | | 164,076 |
| | | | | | 8,551,515 |
| | | | | | |
Financials—16.5% | | | | | | |
Capital Markets—3.3% | | | | | | |
Apollo Management Holdings LP, 4.95% [H15T5Y+326.6] | | | | | |
Sub. Nts., 1/14/501,2 | | | 350,000 | | | 352,293 |
Brookfield Asset Management, Inc., 4.00% Sr. Unsec. Nts., | | | | | |
1/15/25 | | | 96,000 | | | 105,368 |
Carlyle Finance Subsidiary LLC, 3.50% Sr. Unsec. Nts., | | | | | |
9/19/291 | | | 238,000 | | | 256,054 |
Charles Schwab Corp. (The), 5.00% [US0003M+257.5] Jr. | | | | | |
Sub. Perpetual Bonds2,6 | | | 200,000 | | | 209,163 |
Credit Suisse Group AG: | | | | | | |
3.869% [US0003M+141] Sr. Unsec. Nts., 1/12/291,2 | | 189,000 | | | 205,566 |
7.125% [USSW5+510.8] Jr. Sub. Perpetual Bonds1,2,6 | | 200,000 | | | 211,348 |
Goldman Sachs Group, Inc. (The): | | | | | | |
2.60% Sr. Unsec. Nts., 2/7/30 | | | 2,000,000 | | | 2,037,269 |
3.50% Sr. Unsec. Nts., 11/16/26 | | | 301,000 | | | 323,840 |
5.00% [US0003M+287.4] Jr. Sub. Perpetual Bonds2,6 | | 150,000 | | | 147,489 |
5.15% Sub. Nts., 5/22/45 | | | 200,000 | | | 258,412 |
Macquarie Group Ltd., 3.763% [US0003M+137.2] Sr. Unsec. | | | | | |
Nts., 11/28/281,2 | | | 251,000 | | | 276,859 |
Morgan Stanley: | | | | | | |
3.875% Sr. Unsec. Nts., 1/27/26 | | | 415,000 | | | 459,302 |
5.00% Sub. Nts., 11/24/25 | | | 424,000 | | | 489,560 |
Northern Trust Corp., 3.375% [US0003M+113.1] Sub. Nts., | | | | | |
5/8/322 | | | 137,000 | | | 148,060 |
17 | INVESCO INTERMEDIATE BOND FACTOR FUND | | | |
SCHEDULE OF INVESTMENTS Continued
| | Principal Amount | | | Value |
Capital Markets (Continued) | | | | | |
Raymond James Financial, Inc., 3.625% Sr. Unsec. Nts., | | | | | |
9/15/26 | $ | 195,000 | $ | 215,044 |
State Street Corp., 5.625% [US0003M+253.9] Jr. Sub. | | | | | |
Perpetual Bonds2,6 | | 135,000 | | | 141,311 |
UBS Group AG: | | | | | |
4.125% Sr. Unsec. Nts., 9/24/251 | | 250,000 | | | 278,807 |
7.00% [USSW5+434.4] Jr. Sub. Perpetual Bonds1,2,6 | | 125,000 | | | 133,837 |
| | | | | 6,249,582 |
| | | | | |
Commercial Banks—8.1% | | | | | |
Australia & New Zealand Banking Group Ltd., 2.95% | | | | | |
[H15T5Y+128.8] Sub. Nts., 7/22/301,2 | | 233,000 | | | 238,327 |
Bank of America Corp.: | | | | | |
4.271% [US0003M+131] Sr. Unsec. Nts., 7/23/292 | | 188,000 | | | 216,487 |
6.30% [US0003M+455.3] Jr. Sub. Perpetual Bonds2,6 | | 257,000 | | | 290,195 |
7.75% Sub. Nts., 5/14/38 | | 271,000 | | | 438,816 |
Bank of Ireland Group plc, 4.50% Sr. Unsec. Nts., 11/25/231 | | 239,000 | | | 258,901 |
Bank of Montreal, Series E, 3.30% Sr. Unsec. Nts., 2/5/24 | | 299,000 | | | 318,666 |
Barclays plc: | | | | | |
7.875% [USSW5+677.2] Jr. Sub. Perpetual Bonds1,2,6 | | 75,000 | | | 79,346 |
8.00% [H15T5Y+567.2] Jr. Sub. Perpetual Bonds2,6 | | 94,000 | | | 103,465 |
BBVA USA, 2.50% Sr. Unsec. Nts., 8/27/24 | | 388,000 | | | 397,061 |
BNP Paribas SA: | | | | | |
4.375% [USSW5+148.3] Sub. Nts., 3/1/331,2 | | 205,000 | | | 226,758 |
7.625% [USSW5+631.4] Jr. Sub. Perpetual Bonds1,2,6 | | 260,000 | | | 269,587 |
BPCE SA, 4.50% Sub. Nts., 3/15/251 | | 195,000 | | | 212,350 |
CIT Group, Inc., 5.80% [US0003M+397.2] Jr. Sub. Perpetual | | | | | |
Bonds2,6 | | 185,000 | | | 183,207 |
Citigroup, Inc.: | | | | | |
3.668% [US0003M+139] Sr. Unsec. Nts., 7/24/282 | | 300,000 | | | 328,823 |
4.45% Sub. Nts., 9/29/27 | | 300,000 | | | 339,296 |
5.00% [SOFRRATE+381.3] Jr. Sub. Perpetual Bonds2,6 | | 373,000 | | | 382,398 |
5.95% [US0003M+390.5] Jr. Sub. Perpetual Bonds2,6 | | 225,000 | | | 242,594 |
Citizens Bank NA (Providence RI), 2.65% Sr. Unsec. Nts., | | | | | |
5/26/22 | | 232,000 | | | 238,329 |
Citizens Financial Group, Inc., 6.00% [US0003M+300.3] Jr. | | | | | |
Sub. Perpetual Bonds2,6 | | 91,000 | | | 92,428 |
Cooperatieve Rabobank UA, 2.75% Sr. Unsec. Nts., 1/10/23 | | 330,000 | | | 342,719 |
Credit Agricole SA: | | | | | |
4.375% Sub. Nts., 3/17/251 | | 355,000 | | | 388,244 |
8.125% [USSW5+618.5] Jr. Sub. Perpetual Bonds1,2,6 | | 257,000 | | | 304,130 |
Danske Bank AS, 3.244% [US0003M+159.1] Sr. Unsec. Nts., | | | | | |
12/20/251,2 | | 206,000 | | | 216,614 |
Fifth Third Bancorp, 5.10% [US0003M+303.33] Jr. Sub. | | | | | |
Perpetual Bonds2,6 | | 95,000 | | | 94,238 |
Fifth Third Bank (Cincinnati OH), 3.85% Sub. Nts., 3/15/26 | | 150,000 | | | 165,227 |
HSBC Holdings plc: | | | | | |
3.95% [US0003M+98.72] Sr. Unsec. Nts., 5/18/242 | | 100,000 | | | 106,519 |
4.583% [US0003M+153.46] Sr. Unsec. Nts., 6/19/292 | | 165,000 | | | 187,543 |
18 INVESCO INTERMEDIATE BOND FACTOR FUND
| | | Principal Amount | | | Value |
Commercial Banks (Continued) | | | | | | |
Huntington Bancshares, Inc., 5.70% [US0003M+288] Jr. Sub. | | | | | |
Perpetual Bonds2,6 | | $ | 95,000 | $ | 95,284 |
ING Groep NV, 6.875% [USSW5+512.4] Jr. Sub. Perpetual | | | | | |
Bonds1,2,6 | | | 270,000 | | | 283,838 |
JPMorgan Chase & Co.: | | | | | | |
3.54% [US0003M+138] Sr. Unsec. Nts., 5/1/282 | | 263,000 | | | 287,561 |
3.782% [US0003M+133.7] Sr. Unsec. Nts., 2/1/282 | | 524,000 | | | 580,559 |
3.797% [US0003M+89] Sr. Unsec. Nts., 7/23/242 | | 258,000 | | | 275,919 |
6.10% [US0003M+333] Jr. Sub. Perpetual Bonds2,6 | | 135,000 | | | 144,356 |
6.125% [US0003M+333] Jr. Sub. Perpetual Bonds2,6 | | 223,000 | | | 238,626 |
KeyBank NA (Cleveland OH), 3.40% Sub. Nts., 5/20/26 | | 230,000 | | | 248,457 |
Lloyds Bank plc, 2.25% Sr. Unsec. Nts., 8/14/22 | | 385,000 | | | 390,641 |
Lloyds Banking Group plc, 6.657% [US0003M+127] Jr. Sub. | | | | | |
Perpetual Bonds1,2,6 | | | 445,000 | | | 551,660 |
Macquarie Bank Ltd. (London), 6.125% [USSW5+370.3] Jr. | | | | | |
Sub. Perpetual Bonds1,2,6 | | | 220,000 | | | 232,559 |
Mitsubishi UFJ Financial Group, Inc., 3.741% Sr. Unsec. Nts., | | | | | |
3/7/29 | | | 291,000 | | | 326,521 |
National Australia Bank Ltd., 3.933% [H15T5Y+188] Sub. | | | | | |
Nts., 8/2/341,2 | | | 230,000 | | | 251,617 |
Nordea Bank Abp: | | | | | | |
4.625% [USSW5+169] Sub. Nts., 9/13/331,2 | | 205,000 | | | 234,717 |
6.625% [H15T5Y+411] Jr. Sub. Perpetual Bonds1,2,6 | | 200,000 | | | 221,667 |
PNC Bank NA, 4.05% Sub. Nts., 7/26/28 | | 438,000 | | | 497,750 |
Royal Bank of Canada, 3.70% Sr. Unsec. Nts., 10/5/23 | | 306,000 | | | 329,030 |
Santander Holdings USA, Inc., 3.50% Sr. Unsec. Nts., 6/7/24 | | 388,000 | | | 408,270 |
Societe Generale SA: | | | | | | |
3.875% Sr. Unsec. Nts., 3/28/241 | | | 374,000 | | | 401,238 |
7.375% [USSW5+623.8] Jr. Sub. Perpetual Bonds1,2,6 | | 265,000 | | | 277,528 |
Synovus Financial Corp., 3.125% Sr. Unsec. Nts., 11/1/22 | | 185,000 | | | 189,931 |
Truist Bank: | | | | | | |
2.636% [H15T5Y+115] Sub. Nts., 9/17/292 | | 584,000 | | | 593,971 |
3.30% Sub. Nts., 5/15/26 | | | 115,000 | | | 124,370 |
4.05% Sr. Unsec. Nts., 11/3/25 | | | 144,000 | | | 162,237 |
Truist Financial Corp., 5.125% [US0003M+278.6] Jr. Sub. | | | | | |
Perpetual Bonds2,6 | | | 191,000 | | | 198,796 |
US Bancorp, 3.10% Sub. Nts., 4/27/26 | | | 160,000 | | | 172,621 |
Wachovia Capital Trust III, 5.57% [US0003M+93] Jr. Sub. | | | | | |
Perpetual Bonds2,6 | | | 190,000 | | | 190,526 |
Wells Fargo & Co.: | | | | | | |
3.584% [US0003M+131] Sr. Unsec. Nts., 5/22/282 | | 223,000 | | | 242,607 |
4.75% Sub. Nts., 12/7/46 | | | 183,000 | | | 230,201 |
5.90% [US0003M+311] Jr. Sub. Perpetual Bonds, Series S2,6 | | 185,000 | | | 198,515 |
Zions Bancorp NA, 3.25% Sub. Nts., 10/29/29 | | 265,000 | | | 277,952 |
| | | | | | 15,521,793 |
| | | | | | |
Consumer Finance—0.9% | | | | | | |
American Express Co.: | | | | | | |
3.125% Sr. Unsec. Nts., 5/20/26 | | | 289,000 | | | 314,147 |
19 | INVESCO INTERMEDIATE BOND FACTOR FUND | | | |
SCHEDULE OF INVESTMENTS Continued
| | Principal Amount | | | Value |
Consumer Finance (Continued) | | | | | |
American Express Co.: (Continued) | | | | | |
4.90% [US0003M+328.5] Jr. Sub. Perpetual Bonds2,6 | $ | 374,000 | $ | 372,553 |
Capital One Financial Corp.: | | | | | |
3.20% Sr. Unsec. Nts., 2/5/25 | | 130,000 | | | 137,582 |
3.80% Sr. Unsec. Nts., 1/31/28 | | 135,000 | | | 147,424 |
Credit Acceptance Corp., 5.125% Sr. Unsec. Nts., 12/31/241 | | 120,000 | | | 123,900 |
Discover Financial Services, 3.75% Sr. Unsec. Nts., 3/4/25 | | 142,000 | | | 152,889 |
Synchrony Financial, 4.25% Sr. Unsec. Nts., 8/15/24 | | 360,000 | | | 387,260 |
| | | | | 1,635,755 |
| | | | | |
Diversified Financial Services—0.5% | | | | | |
Avolon Holdings Funding Ltd., 3.25% Sr. Unsec. Nts., | | | | | |
2/15/271 | | 265,000 | | | 266,145 |
Blackstone Holdings Finance Co. LLC, 3.15% Sr. Unsec. Nts., | | | | | |
10/2/271 | | 125,000 | | | 134,863 |
Credit Suisse Group Funding Guernsey Ltd., 3.80% Sr. Unsec. | | | | | |
Nts., 6/9/23 | | 300,000 | | | 318,913 |
Equitable Holdings, Inc., 4.35% Sr. Unsec. Nts., 4/20/28 | | 171,000 | | | 192,431 |
| | | | | 912,352 |
| | | | | |
Insurance—1.7% | | | | | |
Athene Global Funding, 2.95% Sec. Nts., 11/12/261 | | 455,000 | | | 479,594 |
Brighthouse Financial, Inc., 3.70% Sr. Unsec. Nts., 6/22/27 | | 246,000 | | | 250,305 |
CNA Financial Corp., 3.45% Sr. Unsec. Nts., 8/15/27 | | 252,000 | | | 273,267 |
Hartford Financial Services Group, Inc. (The), 3.817% | | | | | |
[US0003M+212.5] Jr. Sub. Nts., 2/12/471,2 | | 108,000 | | | 102,789 |
Lincoln National Corp., 3.80% Sr. Unsec. Nts., 3/1/28 | | 198,000 | | | 221,950 |
Manulife Financial Corp., 4.061% [USISDA05+164.7] Sub. | | | | | |
Nts., 2/24/322 | | 167,000 | | | 179,770 |
Marsh & McLennan Cos., Inc., 4.35% Sr. Unsec. Nts., 1/30/47 | | 121,000 | | | 147,385 |
MetLife, Inc., 5.875% [US0003M+295.9] Jr. Sub. Perpetual | | | | | |
Bonds2,6 | | 100,000 | | | 111,582 |
Principal Financial Group, Inc., 3.70% Sr. Unsec. Nts., 5/15/29 | | 284,000 | | | 323,338 |
Prudential Financial, Inc.: | | | | | |
3.70% Sr. Unsec. Nts., 3/13/51 | | 224,000 | | | 237,417 |
5.20% [US0003M+304] Jr. Sub. Nts., 3/15/442 | | 225,000 | | | 240,553 |
5.375% [US0003M+303.1] Jr. Sub. Nts., 5/15/452 | | 135,000 | | | 147,639 |
Reliance Standard Life Global Funding II, 2.75% Sec. Nts., | | | | | |
1/21/271 | | 441,000 | | | 460,894 |
Willis North America, Inc., 3.875% Sr. Unsec. Nts., 9/15/49 | | 113,000 | | | 121,588 |
| | | | | 3,298,071 |
| | | | | |
Real Estate Investment Trusts (REITs)—1.9% | | | | | |
American Tower Corp., 3.60% Sr. Unsec. Nts., 1/15/28 | | 830,000 | | | 897,608 |
Brixmor Operating Partnership LP, 4.125% Sr. Unsec. Nts., | | | | | |
5/15/29 | | 244,000 | | | 272,644 |
Equinix, Inc., 3.20% Sr. Unsec. Nts., 11/18/29 | | 160,000 | | | 167,758 |
Essex Portfolio LP, 3.00% Sr. Unsec. Nts., 1/15/30 | | 223,000 | | | 236,643 |
20 INVESCO INTERMEDIATE BOND FACTOR FUND
| | Principal Amount | | | Value |
Real Estate Investment Trusts (REITs) (Continued) | | | | | |
Healthcare Trust of America Holdings LP, 3.50% Sr. Unsec. | | | | | |
Nts., 8/1/26 | $ | 329,000 | $ | 356,767 |
Healthpeak Properties, Inc., 3.00% Sr. Unsec. Nts., 1/15/30 | | 306,000 | | | 321,939 |
Host Hotels & Resorts LP, 3.375% Sr. Unsec. Nts., 12/15/29 | | 75,000 | | | 78,190 |
Kite Realty Group LP, 4.00% Sr. Unsec. Nts., 10/1/26 | | 326,000 | | | 338,917 |
Regency Centers LP, 2.95% Sr. Unsec. Nts., 9/15/29 | | 340,000 | | | 360,680 |
Spirit Realty LP, 3.20% Sr. Unsec. Nts., 1/15/27 | | 314,000 | | | 330,774 |
Welltower, Inc., 2.70% Sr. Unsec. Nts., 2/15/27 | | 210,000 | | | 218,269 |
| | | | | 3,580,189 |
| | | | | |
Thrifts & Mortgage Finance—0.1% | | | | | |
Nationwide Building Society, 3.96% [US0003M+185.5] Sr. | | | | | |
Unsec. Nts., 7/18/301,2 | | 229,000 | | | 253,581 |
| | | | | |
Health Care—3.1% | | | | | |
Biotechnology—0.9% | | | | | |
AbbVie, Inc.: | | | | | |
2.95% Sr. Unsec. Nts., 11/21/261 | | 117,000 | | | 122,757 |
3.20% Sr. Unsec. Nts., 11/21/291 | | 553,000 | | | 584,461 |
3.60% Sr. Unsec. Nts., 5/14/25 | | 383,000 | | | 413,406 |
4.05% Sr. Unsec. Nts., 11/21/391 | | 133,000 | | | 147,143 |
4.875% Sr. Unsec. Nts., 11/14/48 | | 205,000 | | | 252,655 |
Amgen, Inc., 4.563% Sr. Unsec. Nts., 6/15/48 | | 140,000 | | | 167,436 |
| | | | | 1,687,858 |
| | | | | |
Health Care Equipment & Supplies—0.4% | | | | | |
Becton Dickinson & Co., 3.70% Sr. Unsec. Nts., 6/6/27 | | 267,000 | | | 295,114 |
Hologic, Inc., 4.375% Sr. Unsec. Nts., 10/15/251 | | 508,000 | | | 518,432 |
| | | | | 813,546 |
| | | | | |
Health Care Providers & Services—0.9% | | | | | |
Cigna Corp., 4.375% Sr. Unsec. Nts., 10/15/28 | | 378,000 | | | 430,286 |
CVS Health Corp., 5.05% Sr. Unsec. Nts., 3/25/48 | | 302,000 | | | 372,219 |
Fresenius Medical Care US Finance II, Inc., 5.875% Sr. Unsec. | | | | | |
Nts., 1/31/221 | | 425,000 | | | 456,575 |
HCA, Inc., 5.375% Sr. Unsec. Nts., 2/1/25 | | 460,000 | | | 509,489 |
| | | | | 1,768,569 |
| | | | | |
Life Sciences Tools & Services—0.3% | | | | | |
IQVIA, Inc., 5.00% Sr. Unsec. Nts., 10/15/261 | | 490,000 | | | 506,625 |
| | | | | |
Pharmaceuticals—0.6% | | | | | |
Elanco Animal Health, Inc., 5.65% Sr. Unsec. Nts., 8/28/28 | | 356,000 | | | 408,078 |
Mylan, Inc., 3.125% Sr. Unsec. Nts., 1/15/231 | | 470,000 | | | 487,666 |
Takeda Pharmaceutical Co. Ltd., 5.00% Sr. Unsec. Nts., | | | | | |
11/26/28 | | 247,000 | | | 300,936 |
| | | | | 1,196,680 |
21 INVESCO INTERMEDIATE BOND FACTOR FUND
SCHEDULE OF INVESTMENTS Continued
| | Principal Amount | | | Value |
Industrials—4.1% | | | | | |
Aerospace & Defense—0.8% | | | | | |
BAE Systems Holdings, Inc., 3.85% Sr. Unsec. Nts., 12/15/251 | $ | 373,000 | $ | 410,401 |
Northrop Grumman Corp., 4.75% Sr. Unsec. Nts., 6/1/43 | | 450,000 | | | 584,987 |
United Technologies Corp., 4.625% Sr. Unsec. Nts., 11/16/48 | | 405,000 | | | 544,614 |
| | | | | 1,540,002 |
| | | | | |
Airlines—0.4% | | | | | |
Delta Air Lines, Inc., 2.90% Sr. Unsec. Nts., 10/28/24 | | 615,000 | | | 620,340 |
United Airlines Pass Through Trust, Series 2019-2, 2.70%, | | | | | |
5/1/32 | | 224,000 | | | 240,218 |
| | | | | 860,558 |
| | | | | |
Building Products—0.4% | | | | | |
Fortune Brands Home & Security, Inc.: | | | | | |
3.25% Sr. Unsec. Nts., 9/15/29 | | 231,000 | | | 244,372 |
4.00% Sr. Unsec. Nts., 9/21/23 | | 473,000 | | | 512,257 |
| | | | | 756,629 |
| | | | | |
Industrial Conglomerates—0.4% | | | | | |
GE Capital International Funding Co. Unlimited Co., 3.373% | | | | | |
Sr. Unsec. Nts., 11/15/25 | | 252,000 | | | 268,823 |
General Electric Co., 2.70% Sr. Unsec. Nts., 10/9/22 | | 480,000 | | | 490,708 |
| | | | | 759,531 |
| | | | | |
Machinery—0.5% | | | | | |
nVent Finance Sarl, 4.55% Sr. Unsec. Nts., 4/15/28 | | 832,000 | | | 916,549 |
| | | | | |
Professional Services—0.2% | | | | | |
IHS Markit Ltd., 4.125% Sr. Unsec. Nts., 8/1/23 | | 326,000 | | | 349,462 |
| | | | | |
Road & Rail—0.7% | | | | | |
Penske Truck Leasing Co. LP/PTL Finance Corp., 3.40% Sr. | | | | | |
Unsec. Nts., 11/15/261 | | 759,000 | | | 802,823 |
United Rentals North America, Inc., 4.625% Sr. Unsec. Nts., | | | | | |
10/15/25 | | 515,000 | | | 522,939 |
| | | | | 1,325,762 |
| | | | | |
Trading Companies & Distributors—0.7% | | | | | |
AerCap Ireland Capital DAC/AerCap Global Aviation Trust, | | | | | |
3.50% Sr. Unsec. Nts., 5/26/22 | | 443,000 | | | 455,580 |
Air Lease Corp., 3.00% Sr. Unsec. Nts., 2/1/30 | | 560,000 | | | 554,005 |
GATX Corp., 3.50% Sr. Unsec. Nts., 3/15/28 | | 249,000 | | | 266,186 |
| | | | | 1,275,771 |
| | | | | |
Information Technology—2.7% | | | | | |
Communications Equipment—0.5% | | | | | |
Motorola Solutions, Inc., 4.60% Sr. Unsec. Nts., 2/23/28 | | 799,000 | | | 902,990 |
22 INVESCO INTERMEDIATE BOND FACTOR FUND
| | | Principal Amount | | | Value |
Electronic Equipment, Instruments, & Components—0.3% | | | | | |
Corning, Inc., 5.35% Sr. Unsec. Nts., 11/15/48 | $ | 400,000 | $ | 517,359 |
| | | | | | |
IT Services—1.0% | | | | | | |
DXC Technology Co., 4.75% Sr. Unsec. Nts., 4/15/27 | | 379,000 | | | 414,996 |
Fiserv, Inc., 3.50% Sr. Unsec. Nts., 7/1/29 | | 347,000 | | | 380,014 |
Global Payments, Inc., 3.20% Sr. Unsec. Nts., 8/15/29 | | 230,000 | | | 244,623 |
ILFC E-Capital Trust I, 3.90% [30YR CMT+155], 12/21/651,2 | | 185,000 | | | 146,473 |
VeriSign, Inc.: | | | | | | |
4.75% Sr. Unsec. Nts., 7/15/27 | | | 495,000 | | | 516,547 |
5.25% Sr. Unsec. Nts., 4/1/25 | | | 271,000 | | | 294,329 |
| | | | | | 1,996,982 |
| | | | | |
Semiconductors & Semiconductor Equipment—0.2% | | | | | |
NXP BV/NXP Funding LLC/NXP USA, Inc., 4.30% Sr. Unsec. | | | | | |
Nts., 6/18/291 | | | 370,000 | | | 415,242 |
| | | | | | |
Software—0.4% | | | | | | |
Autodesk, Inc., 4.375% Sr. Unsec. Nts., 6/15/25 | | 430,000 | | | 485,969 |
VMware, Inc., 3.90% Sr. Unsec. Nts., 8/21/27 | | 251,000 | | | 270,194 |
| | | | | | 756,163 |
| | | | | |
Technology Hardware, Storage & Peripherals—0.3% | | | | | |
Dell International LLC/EMC Corp., 5.30% Sr. Sec. Nts., | | | | | |
10/1/291 | | | 467,000 | | | 538,414 |
| | | | | | |
Materials—3.3% | | | | | | |
Chemicals—0.3% | | | | | | |
CF Industries, Inc., 3.45% Sr. Unsec. Nts., 6/1/23 | | 139,000 | | | 141,086 |
Dow Chemical Co. (The), 3.625% Sr. Unsec. Nts., 5/15/26 | | 316,000 | | | 344,265 |
Nutrien Ltd., 5.00% Sr. Unsec. Nts., 4/1/49 | | 126,000 | | | 157,053 |
| | | | | | 642,404 |
| | | | | | |
Construction Materials—0.5% | | | | | | |
Martin Marietta Materials, Inc., 3.50% Sr. Unsec. Nts., | | | | | |
12/15/27 | | | 771,000 | | | 846,062 |
| | | | | | |
Containers & Packaging—1.4% | | | | | | |
Ball Corp., 4.875% Sr. Unsec. Nts., 3/15/26 | | 485,000 | | | 534,397 |
International Paper Co., 4.80% Sr. Unsec. Nts., 6/15/44 | | 280,000 | | | 333,729 |
Packaging Corp. of America, 3.65% Sr. Unsec. Nts., 9/15/24 | | 223,000 | | | 241,961 |
Sealed Air Corp., 5.50% Sr. Unsec. Nts., 9/15/251 | | 425,000 | | | 466,614 |
Silgan Holdings, Inc., 4.75% Sr. Unsec. Nts., 3/15/25 | | 660,000 | | | 669,626 |
WRKCo, Inc., 3.90% Sr. Unsec. Nts., 6/1/28 | | 289,000 | | | 318,532 |
| | | | | | 2,564,859 |
| | | | | | |
Metals & Mining—0.7% | | | | | | |
Anglo American Capital plc, 3.625% Sr. Unsec. Nts., 9/11/241 | | 356,000 | | | 380,786 |
ArcelorMittal SA, 4.25% Sr. Unsec. Nts., 7/16/29 | | 240,000 | | | 250,105 |
Newmont Corp., 2.80% Sr. Unsec. Nts., 10/1/29 | | 231,000 | | | 240,686 |
23 | INVESCO INTERMEDIATE BOND FACTOR FUND | | | |
SCHEDULE OF INVESTMENTS Continued
| | Principal Amount | | | Value |
Metals & Mining (Continued) | | | | | |
Steel Dynamics, Inc., 4.125% Sr. Unsec. Nts., 9/15/25 | $ | 524,000 | $ | 538,061 |
| | | | | 1,409,638 |
| | | | | |
Paper & Forest Products—0.4% | | | | | |
Louisiana-Pacific Corp., 4.875% Sr. Unsec. Nts., 9/15/24 | | 811,000 | | | 829,584 |
| | | | | |
Telecommunication Services—1.5% | | | | | |
Diversified Telecommunication Services—1.3% | | | | | |
AT&T, Inc., 4.50% Sr. Unsec. Nts., 3/9/48 | | 545,000 | | | 622,316 |
Qwest Corp., 6.75% Sr. Unsec. Nts., 12/1/21 | | 470,000 | | | 497,171 |
T-Mobile USA, Inc., 6.50% Sr. Unsec. Nts., 1/15/26 | | 445,000 | | | 469,319 |
Verizon Communications, Inc., 4.522% Sr. Unsec. Nts., | | | | | |
9/15/48 | | 717,000 | | | 925,634 |
| | | | | 2,514,440 |
| | | | | |
Wireless Telecommunication Services—0.2% | | | | | |
Vodafone Group plc: | | | | | |
6.15% Sr. Unsec. Nts., 2/27/37 | | 150,000 | | | 202,934 |
7.00% [USSW5+487.3] Jr. Sub. Nts., 4/4/792 | | 217,000 | | | 250,806 |
| | | | | 453,740 |
| | | | | |
Utilities—3.5% | | | | | |
Electric Utilities—2.9% | | | | | |
AEP Texas, Inc., 3.95% Sr. Unsec. Nts., 6/1/281 | | 806,000 | | | 920,720 |
Berkshire Hathaway Energy Co., 3.80% Sr. Unsec. Nts., | | | | | |
7/15/48 | | 368,000 | | | 423,216 |
EDP Finance BV, 3.625% Sr. Unsec. Nts., 7/15/241 | | 349,000 | | | 372,980 |
Exelon Corp., 4.45% Sr. Unsec. Nts., 4/15/46 | | 146,000 | | | 177,119 |
FirstEnergy Corp., 3.90% Sr. Unsec. Nts., 7/15/27 | | 560,000 | | | 620,636 |
Fortis, Inc., 3.055% Sr. Unsec. Nts., 10/4/26 | | 186,000 | | | 197,515 |
ITC Holdings Corp., 5.30% Sr. Unsec. Nts., 7/1/43 | | 323,000 | | | 438,453 |
NextEra Energy Capital Holdings, Inc., 5.65% | | | | | |
[US0003M+315.6] Jr. Sub. Nts., 5/1/792 | | 403,000 | | | 458,130 |
NextEra Energy Operating Partners LP, 4.25% Sr. Unsec. Nts., | | | | | |
9/15/241 | | 514,000 | | | 518,515 |
PPL WEM Ltd./Western Power Distribution plc, 5.375% Sr. | | | | | |
Unsec. Nts., 5/1/211 | | 500,000 | | | 516,045 |
Virginia Electric & Power Co., 4.45% Sr. Unsec. Nts., 2/15/44 | | 325,000 | | | 402,861 |
Vistra Operations Co. LLC, 5.625% Sr. Unsec. Nts., 2/15/271 | | 460,000 | | | 472,351 |
| | | | | 5,518,541 |
| | | | | |
Independent Power and Renewable Electricity Producers—0.1% | | | | | |
NRG Energy, Inc., 4.45% Sr. Sec. Nts., 6/15/291 | | 242,000 | | | 261,845 |
| | | | | |
Multi-Utilities—0.5% | | | | | |
Ameren Corp., 2.50% Sr. Unsec. Nts., 9/15/24 | | 314,000 | | | 323,683 |
CenterPoint Energy, Inc., 4.25% Sr. Unsec. Nts., 11/1/28 | | 215,000 | | | 246,324 |
24 INVESCO INTERMEDIATE BOND FACTOR FUND
| | | Principal Amount | | | Value |
Multi-Utilities (Continued) | | | | | | |
Sempra Energy, 3.40% Sr. Unsec. Nts., 2/1/28 | $ | 265,000 | $ | 286,067 |
| | | | | | 856,074 |
Total Corporate Bonds and Notes (Cost $90,334,228) | | | | | 97,811,841 |
| | | Shares | | | |
Preferred Stocks—2.0% | | | | | | |
Allstate Corp. (The), 5.625% Non-Cum., Series G, Non-Vtg. | | 4,150 | | | 108,688 |
American Homes 4 Rent, 6.35% Cum., Non-Vtg. | | 3,600 | | | 93,168 |
Arch Capital Group Ltd., 5.25% Non-Cum., Non-Vtg. | | 4,025 | | | 100,665 |
AT&T, Inc., 5.625% Sr. Unsec. | | | 3,625 | | | 94,395 |
Citigroup Capital XIII, 8.14% Cum., Non-Vtg., | | | | | |
[US0003M+637]2 | | | 6,850 | | | 185,840 |
Citizens Financial Group, Inc., 6.35% Non-Cum., Series D, | | | | | |
Non-Vtg., [US0003M+364.2]2 | | | 5,689 | | | 153,091 |
CMS Energy Corp., 5.875% Jr. Sub. | | | 3,600 | | | 94,248 |
Digital Realty Trust, Inc., 5.25% Cum., Series J, Non-Vtg. | | 4,450 | | | 112,451 |
DTE Energy Co., 5.375% Jr. Sub., Non-Vtg. | | 3,725 | | | 93,311 |
Duke Energy Corp., 5.125% Jr. Sub. | | | 3,775 | | | 94,677 |
eBay, Inc., 6.00% Sr. Unsec. | | | 3,500 | | | 90,265 |
Entergy Louisiana LLC , 5.25% Sec. | | | 3,750 | | | 93,450 |
Entergy Texas, Inc., 5.625% First Mortgage Sec. | | 3,550 | | | 90,205 |
Fifth Third Bancorp, 6.625% Non-Cum., Non-Vtg. | | | | | |
[US0003M+371]2 | | | 3,325 | | | 89,775 |
GMAC Capital Trust I, 7.477% Jr. Sub., Non-Vtg.,[US000 | | | | | |
3M+578.5]2 | | | 7,150 | | | 182,325 |
Goldman Sachs Group, Inc. (The), 6.30% Non-Cum., Series | | | | | |
N, Non-Vtg. | | | 7,000 | | | 180,670 |
Huntington Bancshares, Inc., 6.25% Non-Cum., Non-Vtg. | | 5,500 | | | 141,570 |
JPMorgan Chase & Co., 6.00% Non-Cum., Series EE, | | | | | |
Non-Vtg. | | | 3,900 | | | 104,286 |
KeyCorp, 6.125% Non-Cum., Series E, Non-Vtg. | | | | | |
[US0003M+389.2]2 | | | 5,300 | | | 141,563 |
Morgan Stanley, 5.85% Non-Cum., Non-Vtg. | | | | | |
[US0003M+349.1]2 | | | 4,475 | | | 118,856 |
Morgan Stanley, 6.375% Non-Cum., Non-Vtg. | | | | | |
[US0003M+370.8]2 | | | 6,850 | | | 186,183 |
NiSource, Inc., 6.50% Cum., Series B, Non-Vtg. | | | | | |
[H15T5Y+363.2]2 | | | 3,575 | | | 93,987 |
PNC Financial Services Group, Inc. (The), 6.125% Non-Cum., | | | | | |
Series P, Non-Vtg. [US0003M+406.7]2 | | | 5,200 | | | 138,268 |
PPL Capital Funding, Inc., 5.90% Jr. Sub., Series B | | 3,650 | | | 91,287 |
Prudential Financial, Inc., 5.75% Jr. Sub. | | | 3,750 | | | 95,100 |
Public Storage, 5.20% Cum., Series X, Non-Vtg. | | 4,350 | | | 109,838 |
Qwest Corp., 7.00% Sr. Unsec. | | | 4,250 | | | 110,160 |
Regions Financial Corp., 5.70% Non-Cv., Series C, Non-Vtg. | | | | | |
[US0003M+314.8]2 | | | 3,700 | | | 101,454 |
Synovus Financial Corp., 5.875% Non-Cum., Series E, Non- | | | | | |
Vtg., 5.875% [H15T5Y+412.7]2 | | | 3,900 | | | 101,283 |
Synovus Financial Corp., 6.30% Non-Cum., Series D, Non- | | | | | |
Vtg., [US0003M+335.2]2 | | | 3,675 | | | 95,183 |
25 | INVESCO INTERMEDIATE BOND FACTOR FUND | | | |
SCHEDULE OF INVESTMENTS Continued
| Shares | | | Value |
Preferred Stocks (Continued) | | | | |
US Bancorp, 6.50% Non-Cum., Series F, Non-Vtg. | | | | |
[US0003M+446.8]2 | 6,825 | $ | 181,204 |
Vornado Realty Trust, 5.70% Cum., Series B, Non-Vtg. | 3,700 | | | 93,092 |
Wells Fargo & Co., 6.625% Non-Cum., Non-Vtg. | | | | |
[US0003M+369]2 | 3,350 | | | 91,891 |
Total Preferred Stocks (Cost $3,819,229) | | | | 3,852,429 |
| | | | |
Investment Companies—19.1% | | | | |
Invesco Liquid Assets Portfolio, Institutional Class, 1.64%7 (Cost | | | | |
$36,479,123) | 36,463,571 | | | 36,463,571 |
Total Investments, at Value (Cost $187,208,416) | 102.9% | | | 196,144,376 |
Net Other Assets (Liabilities) | (2.9) | | | (5,455,760) |
Net Assets | 100.0% | $ | 190,688,616 |
| | | | |
Footnotes to Schedule of Investments
1.Security purchased or received in a transaction exempt from registration under the Securities Act of 1933, as amended (the "1933 Act"). The security may be resold pursuant to an exemption from registration under the 1933
Act, typically to qualified institutional buyers. The aggregate value of these securities at February 29, 2020 was $29,188,598, which represented 15.31% of the Fund's Net Assets.
2.Represents the current interest rate for a variable or increasing rate security, which may be fixed for a predetermined period. The interest rate is, or will be as of an established date, determined as [Referenced Rate + Basis-point spread].
3.Interest-Only Strips represent the right to receive the monthly interest payments on an underlying pool of mortgage loans. These securities typically decline in price as interest rates decline. Most other fixed income securities increase in price when interest rates decline. The principal amount of the underlying pool represents the notional amount on which current interest is calculated. The price of these securities is typically more sensitive to changes in prepayment rates than traditional mortgage-backed securities (for example, GNMA pass-throughs). Interest rates disclosed represent current yields based upon the current cost basis and estimated timing and amount of future cash flows. These securities amount to $1,779,040 or 0.93% of the Fund's net assets at period end.
4.Interest rate is less than 0.0005%.
5.This interest rate resets periodically. Interest rate shown reflects the rate in effect at period end. The rate on this variable rate security is not based on a published reference rate and spread but is determined by the issuer or agent based on current market conditions.
6.This bond has no contractual maturity date, is not redeemable and contractually pays an indefinite stream of interest.
7.The money market fund and the Fund are affiliated by having the same investment adviser. The rate shown is the
7-day SEC standardized yield as of February 29, 2020.
This security was an affiliate, as defined in the Investment Company Act of 1940, as amended, at or during the reporting period, by virtue of the Fund owning at least 5% of the voting securities of the issuer or as a result of the Fund and the issuer having the same investment adviser. There were no affiliate securities held by the Fund at period end. Transactions during the reporting period in which the issuer was an affiliate are as follows:
26 INVESCO INTERMEDIATE BOND FACTOR FUND
Footnotes to Schedule of Investments (Continued)
| | | | Shares |
| Shares | Gross | Gross | February 29, |
| July 31, 2019 | Additions | Reductions | 2020 |
Investment Company | | | | |
Invesco Oppenheimer Master Loan | | | | |
Fund | 590,695 | 2,817 | 593,512 | — |
| | | | | | | | | Change in |
| | | | Investment | | Realized | | | Unrealized |
| | | Value | Income | Gain (Loss) | | | Gain (Loss) |
Investment Company | | | | | | | | | |
Invesco Oppenheimer Master Loan | $ | — $ | | | | | | | |
Fund | | 232,679 | $ | (341,755) | $ | | (332,931) | |
| | | | | | | |
Futures Contracts as of February 29, 2020 | | | | | | | |
| | | | | | | | | Unrealized |
| | Expiration | Number Notional Amount | | | | Appreciation/ |
Description | Buy/Sell | Date | of Contracts | (000's) | Value | (Depreciation) |
United States | | | | | | | | | | |
Treasury Long | | | | | | | | | | |
Bonds | Buy | 6/19/20 | 173 | USD 28,864 | 29,453,250 | | 588,906 | |
United States | | | | | | | | | | |
Treasury Nts., 10 yr. | Sell | 6/19/20 | 229 | USD 30,503 | 30,857,750 | | (355,097) | |
United States | | | | | | | | | | |
Treasury Nts., 2 yr. | Buy | 6/30/20 | 115 | USD 24,984 | 25,107,734 | | 123,758 | |
United States | | | | | | | | | | |
Treasury Nts., 5 yr. | Sell | 6/30/20 | 10 | USD 1,216 | 1,227,500 | | (11,504) | |
United States Ultra | | | | | | | | | | |
Bonds | Buy | 6/19/20 | 14 | USD 2,828 | 2,905,000 | | 76,750 | |
| | | | | | | $ | 422,813 | |
Definitions | | | | | | | | | | |
| | | | | | | | | |
30YR CMT | 30 Year Constant Maturity Treasury | | | | | | | |
H15T5Y | US Treasury Yield Curve Rate T Note Constant Maturity 5 Year | | | | | |
ICE LIBOR | Intercontinental Exchange London Interbank Offered Rate | | | | | |
SOFRRATE | United States Overnight Secured Financing | | | | | | | |
US0001M | ICE LIBOR USD 1 Month | | | | | | | | |
US0003M | ICE LIBOR USD 3 Month | | | | | | | | |
USISDA05 | USD ICE Swap Rate 11:00am NY 5 Year | | | | | | | |
USSW5 | USD Swap Semi 30/360 5 Year | | | | | | | |
See accompanying Notes to Financial Statements.
27 INVESCO INTERMEDIATE BOND FACTOR FUND
STATEMENT OF ASSETS AND LIABILITIES February 29, 2020
Assets | | |
Investments, at value—see accompanying schedule of investments: | | |
Unaffiliated companies (cost $150,729,293) | $ | 159,680,805 |
Affiliated companies (cost $36,479,123) | | 36,463,571 |
| | 196,144,376 |
Cash | | 500,004 |
Receivables and other assets: | | |
Shares of beneficial interest sold | | 2,757,138 |
Interest and dividends | | 1,232,414 |
Variation margin receivable - futures contracts | | 796,305 |
Other | | 133,998 |
Total assets | | 201,564,235 |
| | |
Liabilities | | |
Payables and other liabilities: | | |
Investments purchased | | 9,847,828 |
Shares of beneficial interest redeemed | | 583,766 |
Transfer and shareholder servicing agent fees | | 101,886 |
Advisory fees | | 57,401 |
Distribution and service plan fees | | 49,200 |
Shareholder communications | | 38,599 |
Trustees' compensation | | 28,333 |
Administration fees | | 2,276 |
Dividends | | 1,211 |
Other | | 165,119 |
Total liabilities | | 10,875,619 |
| | |
Net Assets | $ | 190,688,616 |
| | |
| | |
Composition of Net Assets | | |
Shares of beneficial interest | $ | 182,615,502 |
Total distributable earnings | | 8,073,114 |
Net Assets | $ | 190,688,616 |
| | |
28 INVESCO INTERMEDIATE BOND FACTOR FUND
Net Asset Value Per Share
Class A Shares: | |
Net asset value and redemption price per share (based on net assets of $122,371,141 and | |
10,861,035 shares of beneficial interest outstanding) | $11.27 |
Maximum offering price per share (net asset value plus sales charge of 4.25% of offering price) | $11.77 |
| |
Class C Shares: | |
Net asset value, redemption price (excludes applicable contingent deferred sales charge) | |
and offering price per share (based on net assets of $23,113,955 and 2,052,635 shares of | |
beneficial interest outstanding) | $11.26 |
| |
Class R Shares: | |
Net asset value, redemption price and offering price per share (based on net assets of | |
$20,366,326 and 1,806,681 shares of beneficial interest outstanding) | $11.27 |
| |
Class Y Shares: | |
Net asset value, redemption price and offering price per share (based on net assets of | |
$19,031,887 and 1,690,126 shares of beneficial interest outstanding) | $11.26 |
| |
Class R5 Shares: | |
Net asset value, redemption price and offering price per share (based on net assets of $10,559 | |
and 937 shares of beneficial interest outstanding) | $11.27 |
| |
Class R6 Shares: | |
Net asset value, redemption price and offering price per share (based on net assets of | |
$5,794,748 and 514,354 shares of beneficial interest outstanding) | $11.27 |
See accompanying Notes to Financial Statements.
29 INVESCO INTERMEDIATE BOND FACTOR FUND

STATEMENT
OF OPERATIONS
| Seven Months Ended | | Year Ended |
| | February 29, 2020 | | July 31, 2019 |
Investment Income | | | | |
Interest: | | | | |
Unaffiliated companies | $ | 3,483,958 | $ | 7,030,711 |
Affiliated companies | | 145,599 | | — |
Dividends: | | | | |
Unaffiliated companies | | 130,176 | | 89,144 |
Affiliated companies | | 160,614 | | 235,865 |
| | | | |
Total investment income | | 3,920,347 | | 7,355,720 |
| | | | |
Expenses | | | | |
Advisory fees | | 427,133 | | 812,097 |
Administration fees | | 16,017 | | 2,259 |
Distribution and service plan fees: | | | | |
Class A | | 169,255 | | 277,311 |
Class C | | 133,709 | | 280,803 |
Class R | | 60,189 | | 98,368 |
Transfer and shareholder servicing agent fees: | | | | |
Class A | | 184,173 | | 213,539 |
Class C | | 35,010 | | 52,327 |
Class R | | 31,522 | | 37,360 |
Class Y | | 31,356 | | 43,583 |
Class R5 | | 4 | | 1 |
Class R6 | | 1,223 | | 2,188 |
Shareholder communications: | | | | |
Class A | | 28,531 | | 23,378 |
Class C | | 5,397 | | 6,654 |
Class R | | 4,878 | | 4,679 |
Class Y | | 4,800 | | 6,893 |
Class R5 | | 2 | | 1 |
Class R6 | | 1,392 | | 1,019 |
Legal, auditing and other professional fees | | 38,357 | | 105,184 |
Custodian fees and expenses | | 19,740 | | 30,304 |
Trustees' compensation | | 10,283 | | 14,147 |
Borrowing fees | | — | | 4,561 |
Other | | 50,010 | | 20,039 |
Total expenses | | 1,252,981 | | 2,036,695 |
Less waivers and reimbursements of expenses | | (319,953) | | (347,536) |
Net expenses | | 933,028 | | 1,689,159 |
| | | | |
Net Investment Income | | 2,987,319 | | 5,666,561 |
30 INVESCO INTERMEDIATE BOND FACTOR FUND
| Seven Months Ended | | Year Ended |
| | February 29, 2020 | | July 31, 2019 |
Realized and Unrealized Gain (Loss) | | | | |
Net realized gain (loss) on: | | | | |
Investment transactions in: | | | | |
Unaffiliated companies | $ | 2,036,454 | $ | (2,238,072) |
Affiliated companies | | (342,008) | | (259,077) |
Futures contracts | | 2,570,477 | | 697,947 |
Swap contracts | | (803,274) | | 55,232 |
Net realized gain (loss) | | 3,461,649 | | (1,743,970) |
| | | | |
Net change in unrealized appreciation/(depreciation) on: | | | | |
Investment transactions in: | | | | |
Unaffiliated companies | | 3,363,532 | | 8,975,554 |
Affiliated companies | | (348,483) | | 543,799 |
Futures contracts | | (367,064) | | 622,145 |
Swap contracts | | 632,630 | | (632,630) |
Net change in unrealized appreciation/(depreciation) | | 3,280,615 | | 9,508,868 |
| | | | |
Net Increase in Net Assets Resulting from Operations | $ | 9,729,583 | $ | 13,431,459 |
| | | | |
See accompanying Notes to Financial Statements.
31 INVESCO INTERMEDIATE BOND FACTOR FUND
STATEMENT OF CHANGES IN NET ASSETS
| | Seven Months | | | | |
| | Ended | | Year Ended | | Year Ended |
| | February 29, 2020 | | July 31, 2019 | | July 31, 2018 |
Operations | | | | | | |
Net investment income | $ | 2,987,319 | $ | 5,666,561 | $ | 5,872,996 |
| | | | | | |
Net realized gain (loss) | | 3,461,649 | | (1,743,970) | | (343,007) |
| | | | | | |
Net change in unrealized appreciation/(depreciation) | | 3,280,615 | | 9,508,868 | | (9,492,140) |
Net increase (decrease) in net assets resulting from | | | | | | |
operations | | 9,729,583 | | 13,431,459 | | (3,962,151) |
| | | | | | |
Dividends and/or Distributions to Shareholders | | | | | | |
Distributions to shareholders from distributable | | | | | | |
earnings: | | | | | | |
Class A | | (2,103,408) | | (3,454,780) | | (3,761,706) |
Class C | | (268,610) | | (618,547) | | (711,506) |
Class R | | (296,036) | | (537,255) | | (480,402) |
Class Y | | (408,127) | | (780,401) | | (749,702) |
Class R5 | | (189) | | (57) | | — |
Class R6 | | (114,051) | | (240,155) | | (186,507) |
Total distributions from distributable earnings | | | | | | |
| (3,190,421) | | (5,631,195) | | (5,889,823) |
| | | | | | |
Beneficial Interest Transactions | | | | | | |
Net increase (decrease) in net assets resulting from | | | | | | |
beneficial interest transactions: | | | | | | |
Class A | | (1,109,919) | | (4,592,048) | | (4,812,097) |
Class C | | (1,180,162) | | (8,897,146) | | (637,324) |
Class R | | (866,522) | | 251,717 | | 4,944,820 |
Class Y | | (2,535,892) | | (7,267,938) | | 10,822,468 |
Class R5 | | — | | 10,000 | | — |
Class R6 | | (67,919) | | (2,393,472) | | 5,873,003 |
Total beneficial interest transactions | | | | | | |
| (5,760,414) | | (22,888,887) | | 16,190,870 |
| | | | | | |
Net Assets | | | | | | |
Total increase (decrease) | | 778,748 | | (15,088,623) | | 6,338,896 |
| | | | | | |
Beginning of period | | 189,909,868 | | 204,998,491 | | 198,659,595 |
End of period | | | | | | |
$ | 190,688,616 | $ | 189,909,868 | $ | 204,998,491 |
| | | | | | |
See accompanying Notes to Financial Statements.
32 INVESCO INTERMEDIATE BOND FACTOR FUND
Seven Months Ended
February 29, Year Ended Year Ended Year Ended Year Ended Year Ended 2020 July 31, 2019 July 31, 2018 July 31, 2017 July 31, 2016 July 31, 2015
Per Share Operating Data | | | | | | |
Net asset value, beginning of | | | | | | |
period | $10.88 | $10.43 | $10.92 | $11.03 | $10.66 | $10.90 |
Income (loss) from investment | | | | | | |
operations: | | | | | | |
Net investment income1 | 0.18 | 0.32 | 0.31 | 0.29 | 0.30 | 0.33 |
Net realized and unrealized | | | | | | |
gain (loss) | 0.40 | 0.45 | (0.49) | (0.10) | 0.37 | (0.24) |
Total from investment | | | | | | |
operations | 0.58 | 0.77 | (0.18) | 0.19 | 0.67 | 0.09 |
Dividends and/or distributions | | | | | | |
to shareholders: | | | | | | |
Dividends from net investment | | | | | | |
income | (0.19) | (0.32) | (0.31) | (0.30) | (0.30) | (0.33) |
Net asset value, end of period | $11.27 | $10.88 | $10.43 | $10.92 | $11.03 | $10.66 |
| | | | | | |
| | | | | | |
Total Return, at Net Asset | | | | | | |
Value2 | 5.39% | 7.52% | (1.67)% | 1.82% | 6.45% | 0.84% |
| | | | | | |
Ratios/Supplemental Data | | | | | | |
Net assets, end of period (in | | | | | | |
thousands) | $122,371 | $119,300 | $119,119 | $129,985 | $139,018 | $103,315 |
Average net assets (in | | | | | | |
thousands) | $120,943 | $113,850 | $129,767 | $132,043 | $125,116 | $101,748 |
Ratios to average net assets:3,4 | | | | | | |
Net investment income | 2.80% | 3.07% | 2.89% | 2.68% | 2.83% | 3.07% |
Expenses excluding specific | | | | | | |
expenses listed below | 1.05% | 0.97% | 0.97% | 1.00% | 1.02% | 1.01% |
Interest and fees from | | | | | | |
borrowings | 0.00% | 0.00%5 | 0.00%5 | 0.00%5 | 0.00%5 | 0.00%5 |
Total expenses6 | 1.05% | 0.97% | 0.97% | 1.00% | 1.02% | 1.01% |
Expenses after payments, | | | | | | |
waivers and/or | | | | | | |
reimbursements and reduction | | | | | | |
to custodian expenses | 0.73% | 0.75% | 0.95% | 0.97% | 1.00% | 1.00% |
Portfolio turnover rate7 | 64%8 | 108%8 | 57% | 80% | 73% | 100% |
33 INVESCO INTERMEDIATE BOND FACTOR FUND
FINANCIAL HIGHLIGHTS Continued
1.Calculated based on the average shares outstanding during the period.
2.Includes adjustments in accordance with accounting principles generally accepted in the United States of America and as such, the net asset value for financial reporting purposes and the returns based upon those net asset values may differ from the net asset value and returns for shareholder transactions. Does not include sales charges and is not annualized for periods less than one year, if applicable.
3.Annualized for periods less than one full year.
4.Includes the Fund's share of the allocated expenses and/or net investment income from the master funds.
5.Less than 0.005%.
6.Total expenses including indirect expenses from fund fees and expenses were as follows:
Seven Months Ended February 29, 2020 | 1.07% |
Year Ended July 31, 2019 | 0.99% |
Year Ended July 31, 2018 | 0.99% |
Year Ended July 31, 2017 | 1.02% |
Year Ended July 31, 2016 | 1.03% |
Year Ended July 31, 2015 | 1.02% |
7.Portfolio turnover is calculated at the fund level and is not annualized for periods less than one year, if applicable.
8.The portfolio turnover rate excludes purchase and sale transactions of To Be Announced (TBA) mortgage-related securities as follows:
| Purchase Transactions | Sale Transactions |
Seven Months Ended February 29, 2020 | $11,531,839 | $13,476,801 |
Year Ended July 31, 2019 | $129,169,490 | $127,412,648 |
See accompanying Notes to Financial Statements.
34 INVESCO INTERMEDIATE BOND FACTOR FUND
Seven Months Ended
February 29, Year Ended Year Ended Year Ended Year Ended Year Ended 2020 July 31, 2019 July 31, 2018 July 31, 2017 July 31, 2016 July 31, 2015
Per Share Operating Data | | | | | | |
Net asset value, beginning of | | | | | | |
period | $10.87 | $10.43 | $10.91 | $11.03 | $10.65 | $10.89 |
Income (loss) from investment | | | | | | |
operations: | | | | | | |
Net investment income1 | 0.12 | 0.23 | 0.23 | 0.21 | 0.22 | 0.25 |
Net realized and unrealized | | | | | | |
gain (loss) | 0.40 | 0.44 | (0.48) | (0.11) | 0.38 | (0.24) |
Total from investment | | | | | | |
operations | 0.52 | 0.67 | (0.25) | 0.10 | 0.60 | 0.01 |
Dividends and/or distributions | | | | | | |
to shareholders: | | | | | | |
Dividends from net investment | | | | | | |
income | (0.13) | (0.23) | (0.23) | (0.22) | (0.22) | (0.25) |
Net asset value, end of period | $11.26 | $10.87 | $10.43 | $10.91 | $11.03 | $10.65 |
| | | | | | |
| | | | | | |
Total Return, at Net Asset | | | | | | |
Value2 | 4.80% | 6.52% | (2.32)% | 0.97% | 5.76% | 0.08% |
| | | | | | |
Ratios/Supplemental Data | | | | | | |
Net assets, end of period (in | | | | | | |
thousands) | $23,114 | $23,487 | $31,250 | $33,420 | $38,261 | $27,706 |
Average net assets (in | | | | | | |
thousands) | $22,977 | $28,132 | $33,138 | $35,836 | $31,800 | $24,595 |
Ratios to average net assets:3,4 | | | | | | |
Net investment income | 1.90% | 2.17% | 2.14% | 1.92% | 2.07% | 2.32% |
Expenses excluding specific | | | | | | |
expenses listed below | 1.81% | 1.72% | 1.72% | 1.75% | 1.77% | 1.78% |
Interest and fees from | | | | | | |
borrowings | 0.00% | 0.00%5 | 0.00%5 | 0.00%5 | 0.00%5 | 0.00%5 |
Total expenses6 | 1.81% | 1.72% | 1.72% | 1.75% | 1.77% | 1.78% |
Expenses after payments, | | | | | | |
waivers and/or | | | | | | |
reimbursements and reduction | | | | | | |
to custodian expenses | 1.63% | 1.65% | 1.70% | 1.72% | 1.75% | 1.75% |
Portfolio turnover rate7 | 64%8 | 108%8 | 57% | 80% | 73% | 100% |
35 INVESCO INTERMEDIATE BOND FACTOR FUND
FINANCIAL HIGHLIGHTS Continued
1.Calculated based on the average shares outstanding during the period.
2.Includes adjustments in accordance with accounting principles generally accepted in the United States of America and as such, the net asset value for financial reporting purposes and the returns based upon those net asset values may differ from the net asset value and returns for shareholder transactions. Does not include sales charges and is not annualized for periods less than one year, if applicable.
3.Annualized for periods less than one full year.
4.Includes the Fund's share of the allocated expenses and/or net investment income from the master funds.
5.Less than 0.005%.
6.Total expenses including indirect expenses from fund fees and expenses were as follows:
Seven Months Ended February 29, 2020 | 1.83% |
Year Ended July 31, 2019 | 1.74% |
Year Ended July 31, 2018 | 1.74% |
Year Ended July 31, 2017 | 1.77% |
Year Ended July 31, 2016 | 1.78% |
Year Ended July 31, 2015 | 1.79% |
7.Portfolio turnover is calculated at the fund level and is not annualized for periods less than one year, if applicable.
8.The portfolio turnover rate excludes purchase and sale transactions of To Be Announced (TBA) mortgage-related securities as follows:
| Purchase Transactions | Sale Transactions |
Seven Months Ended February 29, 2020 | $11,531,839 | $13,476,801 |
Year Ended July 31, 2019 | $129,169,490 | $127,412,648 |
See accompanying Notes to Financial Statements.
36 INVESCO INTERMEDIATE BOND FACTOR FUND
Seven Months Ended
February 29, Year Ended Year Ended Year Ended Year Ended Year Ended 2020 July 31, 2019 July 31, 2018 July 31, 2017 July 31, 2016 July 31, 2015
Per Share Operating Data | | | | | | |
Net asset value, beginning of | | | | | | |
period | $10.88 | $10.44 | $10.93 | $11.04 | $10.66 | $10.90 |
Income (loss) from investment | | | | | | |
operations: | | | | | | |
Net investment income1 | 0.15 | 0.28 | 0.28 | 0.26 | 0.27 | 0.31 |
Net realized and unrealized | | | | | | |
gain (loss) | 0.40 | 0.44 | (0.49) | (0.09) | 0.39 | (0.24) |
Total from investment | | | | | | |
operations | 0.55 | 0.72 | (0.21) | 0.17 | 0.66 | 0.07 |
Dividends and/or distributions | | | | | | |
to shareholders: | | | | | | |
Dividends from net investment | | | | | | |
income | (0.16) | (0.28) | (0.28) | (0.28) | (0.28) | (0.31) |
Net asset value, end of period | $11.27 | $10.88 | $10.44 | $10.93 | $11.04 | $10.66 |
| | | | | | |
| | | | | | |
Total Return, at Net Asset | | | | | | |
Value2 | 5.09% | 7.06% | (1.91)% | 1.58% | 6.29% | 0.59% |
| | | | | | |
Ratios/Supplemental Data | | | | | | |
Net assets, end of period (in | | | | | | |
thousands) | $20,366 | $20,511 | $19,416 | $15,318 | $11,736 | $6,189 |
Average net assets (in | | | | | | |
thousands) | $20,690 | $19,919 | $18,041 | $13,530 | $8,432 | $5,572 |
Ratios to average net assets:3,4 | | | | | | |
Net investment income | 2.40% | 2.67% | 2.65% | 2.45% | 2.55% | 2.82% |
Expenses excluding specific | | | | | | |
expenses listed below | 1.31% | 1.22% | 1.21% | 1.25% | 1.27% | 1.27% |
Interest and fees from | | | | | | |
borrowings | 0.00% | 0.00%5 | 0.00%5 | 0.00%5 | 0.00%5 | 0.00%5 |
Total expenses6 | 1.31% | 1.22% | 1.21% | 1.25% | 1.27% | 1.27% |
Expenses after payments, | | | | | | |
waivers and/or | | | | | | |
reimbursements and reduction | | | | | | |
to custodian expenses | 1.13% | 1.15% | 1.19% | 1.22% | 1.25% | 1.25% |
Portfolio turnover rate7 | 64%8 | 108%8 | 57% | 80% | 73% | 100% |
37 INVESCO INTERMEDIATE BOND FACTOR FUND
FINANCIAL HIGHLIGHTS Continued
1.Calculated based on the average shares outstanding during the period.
2.Includes adjustments in accordance with accounting principles generally accepted in the United States of America and as such, the net asset value for financial reporting purposes and the returns based upon those net asset values may differ from the net asset value and returns for shareholder transactions. Does not include sales charges and is not annualized for periods less than one year, if applicable.
3.Annualized for periods less than one full year.
4.Includes the Fund's share of the allocated expenses and/or net investment income from the master funds.
5.Less than 0.005%.
6.Total expenses including indirect expenses from fund fees and expenses were as follows:
Seven Months Ended February 29, 2020 | 1.33% |
Year Ended July 31, 2019 | 1.24% |
Year Ended July 31, 2018 | 1.23% |
Year Ended July 31, 2017 | 1.27% |
Year Ended July 31, 2016 | 1.28% |
Year Ended July 31, 2015 | 1.28% |
7.Portfolio turnover is calculated at the fund level and is not annualized for periods less than one year, if applicable.
8.The portfolio turnover rate excludes purchase and sale transactions of To Be Announced (TBA) mortgage-related securities as follows:
| Purchase Transactions | Sale Transactions |
Seven Months Ended February 29, 2020 | $11,531,839 | $13,476,801 |
Year Ended July 31, 2019 | $129,169,490 | $127,412,648 |
See accompanying Notes to Financial Statements.
38 INVESCO INTERMEDIATE BOND FACTOR FUND
Seven Months Ended
February 29, Year Ended Year Ended Year Ended Year Ended Year Ended 2020 July 31, 2019 July 31, 2018 July 31, 2017 July 31, 2016 July 31, 2015
Per Share Operating Data | | | | | | |
Net asset value, beginning of | | | | | | |
period | $10.88 | $10.43 | $10.91 | $11.03 | $10.65 | $10.89 |
Income (loss) from investment | | | | | | |
operations: | | | | | | |
Net investment income1 | 0.20 | 0.35 | 0.33 | 0.32 | 0.32 | 0.36 |
Net realized and unrealized | | | | | | |
gain (loss) | 0.40 | 0.45 | (0.47) | (0.11) | 0.39 | (0.24) |
Total from investment | | | | | | |
operations | 0.60 | 0.80 | (0.14) | 0.21 | 0.71 | 0.12 |
Dividends and/or distributions | | | | | | |
to shareholders: | | | | | | |
Dividends from net investment | | | | | | |
income | (0.22) | (0.35) | (0.34) | (0.33) | (0.33) | (0.36) |
Net asset value, end of period | $11.26 | $10.88 | $10.43 | $10.91 | $11.03 | $10.65 |
| | | | | | |
| | | | | | |
Total Return, at Net Asset | | | | | | |
Value2 | 5.55% | 7.81% | (1.35)% | 1.98% | 6.82% | 1.09% |
| | | | | | |
Ratios/Supplemental Data | | | | | | |
Net assets, end of period (in | | | | | | |
thousands) | $19,032 | $20,940 | $27,430 | $17,748 | $11,013 | $5,413 |
Average net assets (in | | | | | | |
thousands) | $20,480 | $23,481 | $23,728 | $12,709 | $6,857 | $4,275 |
Ratios to average net assets:3,4 | | | | | | |
Net investment income | 3.09% | 3.37% | 3.14% | 2.95% | 3.04% | 3.35% |
Expenses excluding specific | | | | | | |
expenses listed below | 0.81% | 0.73% | 0.72% | 0.75% | 0.77% | 0.77% |
Interest and fees from | | | | | | |
borrowings | 0.00% | 0.00%5 | 0.00%5 | 0.00%5 | 0.00%5 | 0.00%5 |
Total expenses6 | 0.81% | 0.73% | 0.72% | 0.75% | 0.77% | 0.77% |
Expenses after payments, | | | | | | |
waivers and/or | | | | | | |
reimbursements and reduction | | | | | | |
to custodian expenses | 0.43% | 0.45% | 0.70% | 0.72% | 0.75% | 0.75% |
Portfolio turnover rate7 | 64%8 | 108%8 | 57% | 80% | 73% | 100% |
39 INVESCO INTERMEDIATE BOND FACTOR FUND
FINANCIAL HIGHLIGHTS Continued
1.Calculated based on the average shares outstanding during the period.
2.Includes adjustments in accordance with accounting principles generally accepted in the United States of America and as such, the net asset value for financial reporting purposes and the returns based upon those net asset values may differ from the net asset value and returns for shareholder transactions. Does not include sales charges and is not annualized for periods less than one year, if applicable.
3.Annualized for periods less than one full year.
4.Includes the Fund's share of the allocated expenses and/or net investment income from the master funds.
5.Less than 0.005%.
6.Total expenses including indirect expenses from fund fees and expenses were as follows:
Seven Months Ended February 29, 2020 | 0.83% |
Year Ended July 31, 2019 | 0.75% |
Year Ended July 31, 2018 | 0.74% |
Year Ended July 31, 2017 | 0.77% |
Year Ended July 31, 2016 | 0.78% |
Year Ended July 31, 2015 | 0.78% |
7.Portfolio turnover is calculated at the fund level and is not annualized for periods less than one year, if applicable.
8.The portfolio turnover rate excludes purchase and sale transactions of To Be Announced (TBA) mortgage-related securities as follows:
| Purchase Transactions | Sale Transactions |
Seven Months Ended February 29, 2020 | $11,531,839 | $13,476,801 |
Year Ended July 31, 2019 | $129,169,490 | $127,412,648 |
See accompanying Notes to Financial Statements.
40 INVESCO INTERMEDIATE BOND FACTOR FUND

| Seven Months | |
| Ended | Period |
Class R5 | February 29, | Ended |
2020 July 31, 20191 |
Per Share Operating Data | | |
Net asset value, beginning of period | $10.87 | $10.67 |
Income (loss) from investment operations: | | |
Net investment income2 | 0.20 | 0.07 |
Net realized and unrealized gain | 0.40 | 0.19 |
Total from investment operations | 0.60 | 0.26 |
Dividends and/or distributions to shareholders: | | |
Dividends from net investment income | (0.20) | (0.06) |
Net asset value, end of period | $11.27 | $10.87 |
| | |
| | |
Total Return, at Net Asset Value3 | 5.59% | 2.44% |
| | |
Ratios/Supplemental Data | | |
Net assets, end of period (in thousands) | $11 | $10 |
Average net assets (in thousands) | $10 | $10 |
Ratios to average net assets:4,5 | | |
Net investment income | 3.09% | 3.39% |
Expenses excluding specific | | |
expenses listed below | 0.60% | 0.62% |
Interest and fees from | | |
borrowings | 0.00% | 0.00% |
Total expenses6 | 0.60% | 0.62% |
Expenses after payments, | | |
waivers and/or | | |
reimbursements and reduction | | |
to custodian expenses | 0.44% | 0.43% |
Portfolio turnover rate7,8 | 64% | 108% |
1.For the period from after the close of business on May 24, 2019 (inception of offering) to July 31, 2019.
2.Calculated based on the average shares outstanding during the period.
3.Includes adjustments in accordance with accounting principles generally accepted in the United States of America and as such, the net asset value for financial reporting purposes and the returns based upon those net asset values may differ from the net asset value and returns for shareholder transactions. Does not include sales charges and is not annualized for periods less than one year, if applicable.
4.Annualized for periods less than one full year.
5.Includes the Fund's share of the allocated expenses and/or net investment income from the master funds.
6.Total expenses including indirect expenses from fund fees and expenses were as follows:
Seven Months Ended February 29, 2020 | 0.62% |
Period Ended July 31, 2019 | 0.64% |
7.Portfolio turnover is calculated at the fund level and is not annualized for periods less than one year, if applicable.
8.The portfolio turnover rate excludes purchase and sale transactions of To Be Announced (TBA) mortgage-related securities as follows:
| Purchase Transactions | Sale Transactions |
Seven Months Ended February 29, 2020 | $11,531,839 | $13,476,801 |
Year Ended July 31, 2019 | $129,169,490 | $127,412,648 |
See accompanying Notes to Financial Statements.
41 INVESCO INTERMEDIATE BOND FACTOR FUND
FINANCIAL HIGHLIGHTS Continued
Seven Months Ended
February 29, Year Ended Year Ended Year Ended Year Ended Year Ended 2020 July 31, 2019 July 31, 2018 July 31, 2017 July 31, 2016 July 31, 2015
Per Share Operating Data | | | | | | |
Net asset value, beginning of | | | | | | |
period | $10.88 | $10.44 | $10.92 | $11.03 | $10.65 | $10.89 |
Income (loss) from investment | | | | | | |
operations: | | | | | | |
Net investment income1 | 0.20 | 0.36 | 0.35 | 0.35 | 0.35 | 0.38 |
Net realized and unrealized | | | | | | |
gain (loss) | 0.40 | 0.43 | (0.48) | (0.11) | 0.38 | (0.24) |
Total from investment | | | | | | |
operations | 0.60 | 0.79 | (0.13) | 0.24 | 0.73 | 0.14 |
Dividends and/or distributions | | | | | | |
to shareholders: | | | | | | |
Dividends from net investment | | | | | | |
income | (0.21) | (0.35) | (0.35) | (0.35) | (0.35) | (0.38) |
Net asset value, end of period | $11.27 | $10.88 | $10.44 | $10.92 | $11.03 | $10.65 |
| | | | | | |
| | | | | | |
Total Return, at Net Asset | | | | | | |
Value2 | 5.60% | 7.80% | (1.18)% | 2.27% | 7.03% | 1.29% |
| | | | | | |
Ratios/Supplemental Data | | | | | | |
Net assets, end of period (in | | | | | | |
thousands) | $5,795 | $5,662 | $7,783 | $2,189 | $80 | $110 |
Average net assets (in | | | | | | |
thousands) | $5,884 | $7,053 | $5,612 | $563 | $110 | $105 |
Ratios to average net assets:3,4 | | | | | | |
Net investment income | 3.14% | 3.41% | 3.30% | 3.23% | 3.28% | 3.52% |
Expenses excluding specific | | | | | | |
expenses listed below | 0.58% | 0.56% | 0.56% | 0.56% | 0.57% | 0.56% |
Interest and fees from | | | | | | |
borrowings | 0.00% | 0.00%5 | 0.00%5 | 0.00%5 | 0.00%5 | 0.00%5 |
Total expenses6 | 0.58% | 0.56% | 0.56% | 0.56% | 0.57% | 0.56% |
Expenses after payments, | | | | | | |
waivers and/or | | | | | | |
reimbursements and reduction | | | | | | |
to custodian expenses | 0.39% | 0.41% | 0.54% | 0.54% | 0.55% | 0.55% |
Portfolio turnover rate7 | 64%8 | 108%8 | 57% | 80% | 73% | 100% |
42 INVESCO INTERMEDIATE BOND FACTOR FUND
1.Calculated based on the average shares outstanding during the period.
2.Includes adjustments in accordance with accounting principles generally accepted in the United States of America and as such, the net asset value for financial reporting purposes and the returns based upon those net asset values may differ from the net asset value and returns for shareholder transactions. Does not include sales charges and is not annualized for periods less than one year, if applicable.
3.Annualized for periods less than one full year.
4.Includes the Fund's share of the allocated expenses and/or net investment income from the master funds.
5.Less than 0.005%.
6.Total expenses including indirect expenses from fund fees and expenses were as follows:
Seven Months Ended February 29, 2020 | 0.60% |
Year Ended July 31, 2019 | 0.58% |
Year Ended July 31, 2018 | 0.58% |
Year Ended July 31, 2017 | 0.58% |
Year Ended July 31, 2016 | 0.58% |
Year Ended July 31, 2015 | 0.57% |
7.Portfolio turnover is calculated at the fund level and is not annualized for periods less than one year, if applicable.
8.The portfolio turnover rate excludes purchase and sale transactions of To Be Announced (TBA) mortgage-related securities as follows:
| Purchase Transactions | Sale Transactions |
Seven Months Ended February 29, 2020 | $11,531,839 | $13,476,801 |
Year Ended July 31, 2019 | $129,169,490 | $127,412,648 |
See accompanying Notes to Financial Statements.
43 INVESCO INTERMEDIATE BOND FACTOR FUND
NOTES TO FINANCIAL STATEMENTS February 29, 2020
Note 1 - Significant Accounting Policies
Invesco Intermediate Bond Factor Fund (the "Fund"), formerly Invesco Oppenheimer Intermediate Income Fund, is a series portfolio of AIM Investment Securities Funds (Invesco Investment Securities Funds) (the "Trust"),. The Trust is a Delaware statutory trust registered under the Investment Company Act of 1940, as amended (the "1940 Act"), as an open-end series management investment company authorized to issue an unlimited number of shares of beneficial interest. Information presented in these financial statements pertains only to the Fund. Matters affecting the Fund or each class will be voted on exclusively by the shareholders of such Fund or each class.
Prior to the close of business on May 24, 2019, the Fund operated as Oppenheimer Intermediate Income Fund (the "Acquired Fund" or "Predecessor Fund"). The Acquired Fund was reorganized after the close of business on May 24, 2019 (the "Reorganization Date") through the transfer of all of its assets and liabilities to the Fund (the "Reorganization").
Upon closing of the Reorganization, holders of the Acquired Fund's Class A, Class C, Class R, and Class Y shares received the corresponding class of shares of the Fund and holders of the Acquired Fund's Class I shares received Class R6 shares of the Fund. Information for the Acquired Fund's Class I shares prior to the Reorganization is included with Class R6 shares throughout this report. Class R5 shares commenced operations on the Reorganization Date.
Effective August 31, 2019, the Fund's fiscal year end changed from July 31 to the last day in February.
The Fund's investment objective is to seek total return.
The Fund currently consists of six different classes of shares: Class A, Class C, Class R, Class Y, Class R5 and Class R6. Class Y shares are available only to certain investors. Class A shares are sold with a front-end sales charge unless certain waiver criteria are met and under certain circumstances load waived shares may be subject to contingent deferred sales charges ("CDSC"). Class C shares are sold with a CDSC. Class R, Class Y, Class R5 and Class R6 shares are sold at net asset value. Class C shares held for ten years after purchase are eligible for automatic conversion into Class A shares of the same Fund (the "Conversion Feature"). The automatic conversion pursuant to the Conversion Feature will generally occur at the end of the month following the tenth anniversary after a purchase of Class C shares.
The Fund is an investment company and accordingly follows the investment company accounting and reporting guidance in accordance with Financial Accounting Standards Board Accounting Standards Codification Topic 946, "Financial Services – Investment Companies".
The following is a summary of the significant accounting policies followed by the Fund in the preparation of its financial statements.
A. Security Valuations - Securities, including restricted securities, are valued according to the following policy.
Debt obligations (including convertible securities) and unlisted equities are fair valued using an evaluated quote provided by an independent pricing service. Evaluated quotes provided by the pricing service may be determined without exclusive reliance on quoted prices, and may reflect appropriate factors such as institution-size trading in similar groups of securities, developments related to specific securities, dividend rate (for unlisted equities),
44 INVESCO INTERMEDIATE BOND FACTOR FUND
yield (for debt obligations), quality, type of issue, coupon rate (for debt obligations), maturity (for debt obligations), individual trading characteristics and other market data. Pricing services generally value debt obligations assuming orderly transactions of institutional round lot size, but a fund may hold or transact in the same securities in smaller, odd lot sizes. Odd lots often trade at lower prices than institutional round lots. Debt obligations are subject to interest rate and credit risks. In addition, all debt obligations involve some risk of default with respect to interest and/or principal payments.
A security listed or traded on an exchange (except convertible securities) is valued at its last sales price or official closing price as of the close of the customary trading session on the exchange where the security is principally traded, or lacking any sales or official closing price on a particular day, the security may be valued at the closing bid price on that day. Securities traded in the over-the-counter market are valued based on prices furnished by independent pricing services or market makers. When such securities are valued by an independent pricing service they may be considered fair valued. Futures contracts are valued at the final settlement price set by an exchange on which they are principally traded. Listed options are valued at the mean between the last bid and asked prices from the exchange on which they are principally traded. Options not listed on an exchange are valued by an independent source at the mean between the last bid and asked prices. For purposes of determining net asset value ("NAV") per share, futures and option contracts generally are valued 15 minutes after the close of the customary trading session of the New York Stock Exchange ("NYSE").
Investments in open-end and closed-end registered investment companies that do not trade on an exchange are valued at the end-of-day net asset value per share. Investments in open-end and closed-end registered investment companies that trade on an exchange are valued at the last sales price or official closing price as of the close of the customary trading session on the exchange where the security is principally traded.
Swap agreements are fair valued using an evaluated quote, if available, provided by an independent pricing service. Evaluated quotes provided by the pricing service are valued based on a model which may include end-of-day net present values, spreads, ratings, industry, company performance and returns of referenced assets. Centrally cleared swap agreements are valued at the daily settlement price determined by the relevant exchange or clearinghouse.
Foreign securities' (including foreign exchange contracts) prices are converted into U.S. dollar amounts using the applicable exchange rates as of the close of the NYSE. If market quotations are available and reliable for foreign exchange-traded equity securities, the securities will be valued at the market quotations. Because trading hours for certain foreign securities end before the close of the NYSE, closing market quotations may become unreliable. If between the time trading ends on a particular security and the close of the customary trading session on the NYSE, events occur that the investment adviser determines are significant and make the closing price unreliable, the Fund may fair value the security. If the event is likely to have affected the closing price of the security, the security will be valued at fair value in good faith using procedures approved by the Board of Trustees. Adjustments to closing prices to reflect fair value may also be based on a
45 INVESCO INTERMEDIATE BOND FACTOR FUND
NOTES TO FINANCIAL STATEMENTS Continued
screening process of an independent pricing service to indicate the degree of certainty, based on historical data, that the closing price in the principal market where a foreign security trades is not the current value as of the close of the NYSE. Foreign securities' prices meeting the approved degree of certainty that the price is not reflective of current value will be priced at the indication of fair value from the independent pricing service. Multiple factors may be considered by the independent pricing service in determining adjustments to reflect fair value and may include information relating to sector indices, American Depositary Receipts and domestic and foreign index futures. Foreign securities may have additional risks including exchange rate changes, potential for sharply devalued currencies and high inflation, political and economic upheaval, the relative lack of issuer information, relatively low market liquidity and the potential lack of strict financial and accounting controls and standards.
Securities for which market prices are not provided by any of the above methods may be valued based upon quotes furnished by independent sources. The last bid price may be used to value equity securities. The mean between the last bid and asked prices is used to value debt obligations, including corporate loans.
Securities for which market quotations are not readily available or became unreliable are valued at fair value as determined in good faith by or under the supervision of the Trust's officers following procedures approved by the Board of Trustees. Issuer specific events, market trends, bid/asked quotes of brokers and information providers and other market data may be reviewed in the course of making a good faith determination of a security's fair value.
The Fund may invest in securities that are subject to interest rate risk, meaning the risk that the prices will generally fall as interest rates rise and, conversely, the prices will generally rise as interest rates fall. Specific securities differ in their sensitivity to changes in interest rates depending on their individual characteristics. Changes in interest rates may result in increased market volatility, which may affect the value and/or liquidity of certain Fund investments.
Valuations change in response to many factors including the historical and prospective earnings of the issuer, the value of the issuer's assets, general economic conditions, interest rates, investor perceptions and market liquidity. Because of the inherent uncertainties of valuation, the values reflected in the financial statements may materially differ from the value received upon actual sale of those investments.
B. Securities Transactions and Investment Income - Securities transactions are accounted for on a trade date basis. Realized gains or losses on sales are computed on the basis of specific identification of the securities sold. Interest income (net of withholding tax, if any) is recorded on the accrual basis from settlement date. Bond premiums and discounts are amortized and/or accreted over the lives of the respective securities. Pay-in-kind interest income and non-cash dividend income received in the form of securities in-lieu of cash are recorded at the fair value of the securities received. Paydown gains and losses on mortgage and asset-backed securities are recorded as adjustments to interest income. Dividend income (net of withholding tax, if any) is recorded on the ex-dividend date.
The Fund may periodically participate in litigation related to Fund investments. As such,
46 INVESCO INTERMEDIATE BOND FACTOR FUND
the Fund may receive proceeds from litigation settlements. Any proceeds received are included in the Statement of Operations as realized gain (loss) for investments no longer held and as unrealized gain (loss) for investments still held.
Brokerage commissions and mark ups are considered transaction costs and are recorded as an increase to the cost basis of securities purchased and/or a reduction of proceeds on a sale of securities. Such transaction costs are included in the determination of net realized and unrealized gain (loss) from investment transactions reported in the Statement of Operations and the Statement of Changes in Net Assets and the net realized and unrealized gains (losses) on securities per share in the Financial Highlights. Transaction costs are included in the calculation of the Fund's net asset value and, accordingly, they reduce the Fund's total returns. These transaction costs are not considered operating expenses and are not reflected in net investment income reported in the Statement of Operations and the Statement of Changes in Net Assets, or the net investment income per share and the ratios of expenses and net investment income reported in the Financial Highlights, nor are they limited by any expense limitation arrangements between the Fund and the investment adviser.
The Fund allocates income and realized and unrealized capital gains and losses to a class based on the relative net assets of each class.
C. Country Determination - For the purposes of making investment selection decisions and presentation in the Schedule of Investments, the investment adviser may determine the country in which an issuer is located and/or credit risk exposure based on various factors. These factors include the laws of the country under which the issuer is organized, where the issuer maintains a principal office, the country in which the issuer derives 50% or more of its total revenues and the country that has the primary market for the issuer's securities, as well as other criteria. Among the other criteria that may be evaluated for making this determination are the country in which the issuer maintains 50% or more of its assets, the type of security, financial guarantees and enhancements, the nature of the collateral and the sponsor organization.
D. Distributions - Dividends and distributions to shareholders, which are determined in accordance with income tax regulations and may differ from accounting principles generally accepted in the United States of America ("GAAP"), are recorded on the ex-dividend date. Income distributions, if any, are declared and paid monthly. Capital gain distributions, if any, are declared and paid annually or at other times as determined necessary by the Adviser.
E. Federal Income Taxes - The Fund intends to comply with the requirements of Subchapter M of the Internal Revenue Code of 1986, as amended (the "Internal Revenue Code"), necessary to qualify as a regulated investment company and to distribute substantially all of the Fund's taxable earnings to shareholders. As such, the Fund will not be subject to federal income taxes on otherwise taxable income (including net realized capital gain) that is distributed to shareholders. Therefore, no provision for federal income taxes is recorded in the financial statements.
The Fund recognizes the tax benefits of uncertain tax positions only when the position is more likely than not to be sustained. Management has analyzed the Fund's uncertain tax positions and concluded that no liability for unrecognized tax benefits should be recorded
47 INVESCO INTERMEDIATE BOND FACTOR FUND
NOTES TO FINANCIAL STATEMENTS Continued
related to uncertain tax positions. Management is not aware of any tax positions for which it is reasonably possible that the total amounts of unrecognized tax benefits will change materially in the next 12 months.
The Fund files tax returns in the U.S. Federal jurisdiction and certain other jurisdictions. Generally, the Fund is subject to examinations by such taxing authorities for up to three years after the filing of the return for the tax period.
F. Expenses - Fees provided for under the Rule 12b-1 plan of a particular class of the Fund are charged to the operations of such class. Transfer agency fees and expenses and other shareholder recordkeeping fees and expenses attributable to Class R5 and Class R6 are allocated to each share class based on relative net assets. Sub-accounting fees attributable to Class R5 are charged to the operations of the class. Transfer agency fees and expenses and other shareholder recordkeeping fees and expenses relating to all other classes are allocated among those classes based on relative net assets. All other expenses are allocated among the classes based on relative net assets.
G. Accounting Estimates - The financial statements are prepared on a basis in conformity with GAAP, which requires management to make estimates and assumptions that affect the reported amounts of assets and liabilities at the date of the financial statements and the reported amounts of revenues and expenses during the reporting period including estimates and assumptions related to taxation. Actual results could differ from those estimates by a significant amount. In addition, the Fund monitors for material events or transactions that may occur or become known after the period-end date and before the date the financial statements are released to print.
H. Indemnifications - Under the Trust's organizational documents, each Trustee, officer, employee or other agent of the Trust is indemnified against certain liabilities that may arise out of the performance of their duties to the Fund. Additionally, in the normal course of business, the Fund enters into contracts, including the Fund's servicing agreements, that contain a variety of indemnification clauses. The Fund's maximum exposure under these arrangements is unknown as this would involve future claims that may be made against the Fund that have not yet occurred. The risk of material loss as a result of such indemnification claims is considered remote.
I. Dollar Rolls and Forward Commitment Transactions - The Fund may enter into dollar roll transactions to enhance the Fund's performance. The Fund executes its dollar roll transactions in the to be announced ("TBA") market whereby the Fund makes a forward commitment to purchase a security and, instead of accepting delivery, the position is offset by the sale of the security with a simultaneous agreement to repurchase at a future date.
The Fund accounts for dollar roll transactions as purchases and sales and realizes gains and losses on these transactions. The Fund will segregate liquid assets in an amount equal to its dollar roll commitments. Dollar roll transactions involve the risk that a Counterparty to the transaction may fail to complete the transaction. If this occurs, the Fund may lose the opportunity to purchase or sell the security at the agreed upon price. Dollar roll transactions also involve the risk that the value of the securities retained by the Fund may decline below the price of the securities that the Fund has sold but is obligated to purchase under the agreement. Dollar roll transactions covered in this manner are not treated as senior
48 INVESCO INTERMEDIATE BOND FACTOR FUND
securities for purposes of a Fund's fundamental investment limitation on senior securities and borrowings.
J. Futures Contracts - The Fund may enter into futures contracts to manage exposure to interest rate, equity and market price movements and/or currency risks. A futures contract is an agreement between Counterparties to purchase or sell a specified underlying security, currency or commodity (or delivery of a cash settlement price, in the case of an index future) for a fixed price at a future date. The Fund currently invests only in exchange-traded futures and they are standardized as to maturity date and underlying financial instrument. Initial margin deposits required upon entering into futures contracts are satisfied by the segregation of specific securities or cash as collateral at the futures commission merchant (broker). During the period the futures contracts are open, changes in the value of the contracts are recognized as unrealized gains or losses by recalculating the value of the contracts on a daily basis. Subsequent or variation margin payments are received or made depending upon whether unrealized gains or losses are incurred. These amounts are reflected as receivables or payables on the Statement of Assets and Liabilities. When the contracts are closed or expire, the Fund recognizes a realized gain or loss equal to the difference between the proceeds from, or cost of, the closing transaction and the Fund's basis in the contract. The net realized gain (loss) and the change in unrealized gain (loss) on futures contracts held during the period is included on the Statement of Operations. The primary risks associated with futures contracts are market risk and the absence of a liquid secondary market. If the Fund were unable to liquidate a futures contract and/or enter into an offsetting closing transaction, the Fund would continue to be subject to market risk with respect to the value of the contracts and continue to be required to maintain the margin deposits on the futures contracts. Futures contracts have minimal Counterparty risk since the exchange's clearinghouse, as Counterparty to all exchange-traded futures, guarantees the futures against default. Risks may exceed amounts recognized in the Statement of Assets and Liabilities.
K. Swap Agreements - The Fund may enter into various swap transactions, including interest rate, total return, index, currency and credit default swap contracts ("CDS") for investment purposes or to manage interest rate, currency or credit risk. Such transactions are agreements between Counterparties. A swap agreement may be negotiated bilaterally and traded over-the-counter ("OTC") between two parties ("uncleared/OTC") or, in some instances, must be transacted through a future commission merchant ("FCM") and cleared through a clearinghouse that serves as a central Counterparty ("centrally cleared swap"). These agreements may contain among other conditions, events of default and termination events, and various covenants and representations such as provisions that require the Fund to maintain a pre-determined level of net assets, and/or provide limits regarding the decline of the Fund's NAV over specific periods of time. If the Fund were to trigger such provisions and have open derivative positions at that time, the Counterparty may be able to terminate such agreement and request immediate payment in an amount equal to the net liability positions, if any.
Interest rate, total return, index, and currency swap agreements are two-party contracts entered into primarily to exchange the returns (or differentials in rates of returns) earned
49 INVESCO INTERMEDIATE BOND FACTOR FUND
NOTES TO FINANCIAL STATEMENTS Continued
or realized on particular predetermined investments or instruments. The gross returns to be exchanged or "swapped" between the parties are calculated with respect to a notional amount, i.e., the return on or increase in value of a particular dollar amount invested at a particular interest rate or return of an underlying asset, in a particular foreign currency, or in a "basket" of securities representing a particular index.
In a centrally cleared swap, the Fund's ultimate Counterparty is a central clearinghouse. The Fund initially will enter into centrally cleared swaps through an executing broker. When a fund enters into a centrally cleared swap, it must deliver to the central Counterparty (via the FCM) an amount referred to as "initial margin." Initial margin requirements are determined by the central Counterparty, but an FCM may require additional initial margin above the amount required by the central Counterparty. Initial margin deposits required upon entering into centrally cleared swaps are satisfied by cash or securities as collateral at the FCM. Securities deposited as initial margin are designated on the Schedule of Investments and cash deposited is recorded on the Statement of Assets and Liabilities. During the term of a cleared swap agreement, a "variation margin" amount may be required to be paid by the Fund or may be received by the Fund, based on the daily change in price of the underlying reference instrument subject to the swap agreement and is recorded as a receivable or payable for variation margin in the Statement of Assets and Liabilities until the centrally cleared swap is terminated at which time a realized gain or loss is recorded.
A CDS is an agreement between Counterparties to exchange the credit risk of an issuer. A buyer of a CDS is said to buy protection by paying a fixed payment over the life of the agreement and in some situations an upfront payment to the seller of the CDS. If a defined credit event occurs (such as payment default or bankruptcy), the Fund as a protection buyer would cease paying its fixed payment, the Fund would deliver eligible bonds issued by the reference entity to the seller, and the seller would pay the full notional value, or the "par value", of the referenced obligation to the Fund. A seller of a CDS is said to sell protection and thus would receive a fixed payment over the life of the agreement and an upfront payment, if applicable. If a credit event occurs, the Fund as a protection seller would cease to receive the fixed payment stream, the Fund would pay the buyer "par value" or the
full notional value of the referenced obligation, and the Fund would receive the eligible bonds issued by the reference entity. In turn, these bonds may be sold in order to realize a recovery value. Alternatively, the seller of the CDS and its Counterparty may agree to net the notional amount and the market value of the bonds and make a cash payment equal to the difference to the buyer of protection. If no credit event occurs, the Fund receives the fixed payment over the life of the agreement. As the seller, the Fund would effectively add leverage to its portfolio because, in addition to its total net assets, the Fund would be subject to investment exposure on the notional amount of the CDS. In connection with these agreements, cash and securities may be identified as collateral in accordance with the terms of the respective swap agreements to provide assets of value and recourse in the event of default under the swap agreement or bankruptcy/insolvency of a party to the swap agreement. If a Counterparty becomes bankrupt or otherwise fails to perform its obligations due to financial difficulties, the Fund may experience significant delays in obtaining any
50 INVESCO INTERMEDIATE BOND FACTOR FUND
recovery in a bankruptcy or other reorganization proceeding. The Fund may obtain only limited recovery or may obtain no recovery in such circumstances. The Fund's maximum risk of loss from Counterparty risk, either as the protection seller or as the protection buyer, is the value of the contract. The risk may be mitigated by having a master netting arrangement between the Fund and the Counterparty and by the designation of collateral by the Counterparty to cover the Fund's exposure to the Counterparty.
Implied credit spreads represent the current level at which protection could be bought or sold given the terms of the existing CDS contract and serve as an indicator of the current status of the payment/performance risk of the CDS. An implied spread that has widened or increased since entry into the initial contract may indicate a deteriorating credit profile and increased risk of default for the reference entity. A declining or narrowing spread may indicate an improving credit profile or decreased risk of default for the reference entity. Alternatively, credit spreads may increase or decrease reflecting the general tolerance for risk in the credit markets.
An interest rate swap is an agreement between Counterparties pursuant to which the parties exchange a floating rate payment for a fixed rate payment based on a specified notional amount.
Changes in the value of centrally cleared and OTC swap agreements are recognized as unrealized gains (losses) in the Statement of Operations by "marking to market" on a daily basis to reflect the value of the swap agreement at the end of each trading day. Payments received or paid at the beginning of the agreement are reflected as such on the Statement of Assets and Liabilities and may be referred to as upfront payments. The Fund accrues for the fixed payment stream and amortizes upfront payments, if any, on swap agreements on a daily basis with the net amount, recorded as a component of realized gain (loss) on the Statement of Operations. A liquidation payment received or made at the termination of a swap agreement is recorded as realized gain (loss) on the Statement of Operations. The Fund segregates cash or liquid securities having a value at least equal to the amount of the potential obligation of a Fund under any swap transaction. Cash held as collateral is recorded as deposits with brokers on the Statement of Assets and Liabilities. Entering into these agreements involves, to varying degrees, lack of liquidity and elements of credit, market, and Counterparty risk in excess of amounts recognized on the Statement of Assets and Liabilities. Such risks involve the possibility that a swap is difficult to sell or liquidate; the Counterparty does not honor its obligations under the agreement and unfavorable interest rates and market fluctuations. It is possible that developments in the swaps market, including potential government regulation, could adversely affect the Fund's ability to terminate existing swap agreements or to realize amounts to be received under such agreements. A short position in a security poses more risk than holding the same security long. As there is no limit on how much the price of the security can increase, the Fund's exposure is unlimited.
Note 2 - Advisory Fees and Other Fees Paid to Affiliates
51 INVESCO INTERMEDIATE BOND FACTOR FUND
NOTES TO FINANCIAL STATEMENTS Continued
The Trust has entered into a master investment advisory agreement with Invesco Advisers, Inc. (the "Adviser" or "Invesco"). Under the terms of the investment advisory agreement, the Fund accrues daily and pays monthly an advisory fee to the Adviser based on the annual rate of the Fund's average daily net assets as follows:
Fee Schedule Through February 28, 2020* | | Fee Schedule Effective February 29, 2020* |
Up to $500 million | 0.40% | | Up to $2 billion | 0.25% |
Next $500 million | 0.35 | | Over $2 billion | 0.23 |
Next $4 billion | 0.33 | | | |
Over $5 billion | 0.31 | | | |
*The advisory fee paid by the Fund shall be reduced by any amounts paid by the Fund under the administrative services agreement with the Adviser.
For the seven months ended February 29, 2020, the effective advisory fee rate incurred by the Fund was 0.38%.
Under the terms of a master sub-advisory agreement between the Adviser and each of Invesco Asset Management Deutschland GmbH, Invesco Asset Management Limited, Invesco Asset Management (Japan) Limited, Invesco Hong Kong Limited, Invesco Senior Secured Management, Inc. and Invesco Canada Ltd. and separate sub-advisory agreements with Invesco Capital Management LLC and Invesco Asset Management (India) Private Limited (collectively, the "Affiliated Sub-Advisers") the Adviser, not the Fund, will pay 40% of the fees paid to the Adviser to any such Affiliated Sub-Adviser(s) that provide(s) discretionary investment management services to the Fund based on the percentage of assets allocated to such Affiliated Sub-Adviser(s). Invesco has also entered into a Sub-Advisory Agreement with OppenheimerFunds, Inc. to provide discretionary management services to the Fund.
Effective on the Reorganization Date, the Adviser has contractually agreed, through May 31, 2021, to waive advisory fees and/or reimburse expenses of all shares to the extent necessary to limit the total annual fund operating expenses after fee waiver and/or expense reimbursement (excluding certain items discussed below) of Class A, Class C, Class R, Class Y, Class R5 and Class R6 shares to 0.75%, 1.65%, 1.15%, 0.45%, 0.46% and 0.41%, respectively, of the Fund's average daily net assets. Effective February 28, 2020, the Fund's expense limitation agreement was amended to reflect a reduction to the Fund's existing expense limits. Under the amended expense limitation agreement, the Adviser has contractually agreed to waive advisory fees and/or reimburse expenses to the extent necessary to limit the Fund's Total Annual Fund Operating Expenses After Fee Waiver and/or Expense Reimbursement of Class A, Class C, Class R, Class Y, Class R5 and Class R6 shares to 0.52%, 1.27%, 0.77%, 0.27%, 0.27% and 0.27%, respectively, of the Fund's average daily net assets (the "expense limits") through May 31, 2021. In determining the Adviser's obligation to waive advisory fees and/or reimburse expenses, the following expenses are not taken into account, and could cause total annual fund operating expenses after fee waivers and/or expense reimbursement to exceed the numbers reflected above: (1) interest; (2) taxes; (3) dividend expenses on short sales; (4) extraordinary or non-routine items, including litigation expenses; and (5) expenses that the Fund has incurred but did not actually pay because of an expense
52 INVESCO INTERMEDIATE BOND FACTOR FUND
offset arrangement. Unless Invesco continues the fee waiver agreement, it will terminate on May 31, 2021. During its term, the fee waiver agreement cannot be terminated or amended to increase the expense limits or reduce the advisory fee waiver without approval of the Board of Trustees.
Further, the Adviser has contractually agreed, through at least June 30, 2021, to waive the advisory fee payable by the Fund in an amount equal to 100% of the net advisory fees the Adviser receives from the affiliated money market funds on investments by the Fund of uninvested cash in such affiliated money market funds.
For the seven months ended February 29, 2020, the Adviser waived advisory fees of $18,870 and reimbursed fund expenses of $211,474, $21,536, $19,417, $42,716, $9, and $5,931 for Class A, Class C, Class R, Class Y, Class R5 and Class R6, respectively.
The Trust has entered into a master administrative services agreement with Invesco pursuant to which the Fund has agreed to pay Invesco for certain administrative costs incurred in providing accounting services to the Fund. For the seven months ended February 29, 2020, expenses incurred under the agreement are shown in the Statement of Operations as Administration fees. Additionally, Invesco has entered into service agreements whereby JPMorgan Chase Bank serves as custodian to the Fund. Prior to the Reorganization, the Acquired Fund paid administrative fees to OFI Global Asset Management, Inc.
The Trust has entered into a transfer agency and service agreement with Invesco Investment Services, Inc. ("IIS") pursuant to which the Fund has agreed to pay IIS a fee for providing transfer agency and shareholder services to the Fund and reimburse IIS for certain expenses incurred by IIS in the course of providing such services. IIS may make payments to intermediaries that provide omnibus account services, sub-accounting services and/or networking services. All fees payable by IIS to intermediaries that provide omnibus account services or sub-accounting services are charged back to the Fund, subject to certain limitations approved by the Trust's Board of Trustees. Prior to the Reorganization, the Acquired Fund paid transfer agent fees to OFI Global Asset Management, Inc. and Shareholder Services, Inc. For the seven months ended February 29, 2020, expenses incurred under these agreements are shown in the Statement of Operations as Transfer and shareholder servicing agent fees.
The Trust has entered into master distribution agreements with Invesco Distributors, Inc. ("IDI") to serve as the distributor for the Class A, Class C, Class R, Class Y, Class R5 and Class R6 shares of the Fund. The Trust has adopted plans pursuant to Rule 12b-1 under the 1940 Act with respect to the Fund's Class A, Class C and Class R shares (collectively the "Plan"). The Fund, pursuant to the Class A Plan, reimbursed IDI in an amount up to an annual rate of 0.25% of the average daily net assets of Class A shares. The Fund pursuant to the Class C and Class R Plan, pays IDI compensation at the annual rate of 1.00% of the average daily net assets of Class C and 0.50% of the average daily net assets of Class R shares. The fees are accrued daily and paid monthly. Of the Plan payments, up to 0.25% of the average daily net assets of each class of shares may be paid to furnish continuing personal shareholder services to customers who purchase and own shares of such classes. Any amounts not paid as a service fee under the Plan would constitute an asset-based sales charge. Rules of the Financial Industry Regulatory Authority ("FINRA") impose a cap on the total sales charges, including asset-based sales charges, that may be paid by any class of shares of the Fund plans. Prior to
53 INVESCO INTERMEDIATE BOND FACTOR FUND
NOTES TO FINANCIAL STATEMENTS Continued
the Reorganization, the Acquired Fund paid distribution fees to OppenheimerFunds Distributor, Inc. For the seven months ended February 29, 2020, expenses incurred under the plans are shown in the Statement of Operations as Distribution and service plan fees.
Front-end sales commissions and CDSC (collectively, the "sales charges") are not recorded as expenses of the Fund. Front-end sales commissions are deducted from proceeds from the sales of Fund shares prior to investment in Class A shares of the Fund. CDSC are deducted from redemption proceeds prior to remittance to the shareholder. During the seven months ended February 29, 2020, IDI advised the Fund that IDI retained $14,289 in front-end sales commissions from the sale of Class A shares and $1,662 and $339 from Class A and Class C shares, respectively, for CDSC imposed on redemptions by shareholders.
Certain officers and trustees of the Trust are officers and directors of the Adviser, IIS and/or IDI.
Note 3 - Additional Valuation Information
GAAP defines fair value as the price that would be received to sell an asset or paid to transfer a liability in an orderly transaction between market participants at the measurement date, under current market conditions. GAAP establishes a hierarchy that prioritizes the inputs
to valuation methods, giving the highest priority to readily available unadjusted quoted prices in an active market for identical assets (Level 1) and the lowest priority to significant unobservable inputs (Level 3), generally when market prices are not readily available or are unreliable. Based on the valuation inputs, the securities or other investments are tiered into one of three levels. Changes in valuation methods may result in transfers in or out of an investment's assigned level:
Level 1 — Prices are determined using quoted prices in an active market for identical assets.
Level 2 — Prices are determined using other significant observable inputs. Observable inputs are inputs that other market participants may use in pricing a security. These may include quoted prices for similar securities, interest rates, prepayment speeds, credit risk, yield curves, loss severities, default rates, discount rates, volatilities and others.
Level 3 — Prices are determined using significant unobservable inputs. In situations where quoted prices or observable inputs are unavailable (for example, when there is little or no market activity for an investment at the end of the period), unobservable inputs may be used. Unobservable inputs reflect the Fund's own assumptions about the factors market participants would use in determining fair value of the securities or instruments and would be based on the best available information.
The following is a summary of the tiered valuation input levels, as of February 29, 2020. The level assigned to the securities valuations may not be an indication of the risk or liquidity associated with investing in those securities. Because of the inherent uncertainties of valuation, the values reflected in the financial statements may materially differ from the value received upon actual sale of those investments.
54 INVESCO INTERMEDIATE BOND FACTOR FUND
| | | | | | Level 3— | |
| | Level 1— | | Level 2— | | Significant | |
| | Unadjusted | | Other Significant | | Unobservable | |
| | Quoted Prices | | Observable Inputs | | Inputs | Value |
Assets Table | | | | | | | |
Investments, at Value: | | | | | | | |
Asset-Backed Securities | $ | — $ | 911,851 | $ | — $ | 911,851 |
Mortgage-Backed Obligations | | — | | 15,297,723 | | — | 15,297,723 |
U.S. Government Obligations | | — | | 41,806,961 | | — | 41,806,961 |
Corporate Bonds and Notes | | — | | 97,811,841 | | — | 97,811,841 |
Preferred Stocks | | 3,852,429 | | — | | — | 3,852,429 |
Investment Companies | | 36,463,571 | | — | | — | 36,463,571 |
Total Investments, at Value | | 40,316,000 | | 155,828,376 | | — | 196,144,376 |
Other Financial Instruments: | | | | | | | |
Futures contracts | | 789,414 | | — | | — | 789,414 |
Total Assets | $ | 41,105,414 | $ | 155,828,376 | $ | — $ | 196,933,790 |
Liabilities Table | | | | | | | |
Other Financial Instruments: | | | | | | | |
Futures contracts | $ | (366,601) | $ | — $ | — $ | (366,601) |
Total Liabilities | $ | (366,601) | $ | — $ | — $ | (366,601) |
Forward currency exchange contracts and futures contracts, if any, are reported at their unrealized appreciation/depreciation at measurement date, which represents the change in the contract's value from trade date. All additional assets and liabilities included in the above table are reported at their market value at measurement date.
Note 4 - Derivative Investments
The Fund may enter into an International Swaps and Derivatives Association Master Agreement ("ISDA Master Agreement") under which a fund may trade OTC derivatives. An OTC transaction entered into under an ISDA Master Agreement typically involves a collateral posting arrangement, payment netting provisions and close-out netting provisions. These netting provisions allow for reduction of credit risk through netting of contractual obligations. The enforceability of the netting provisions of the ISDA Master Agreement depends on the governing law of the ISDA Master Agreement, among other factors. For financial reporting purposes, the Fund does not offset OTC derivative assets or liabilities that are subject to ISDA Master Agreements in the Statement of Assets and Liabilities.
Value of Derivative Instruments at Period-End
The table below summarizes the value of the Fund's derivative investments, detailed by primary risk exposure, held as of February 29, 2020:
| Asset Derivatives | | | | Liability Derivatives | | |
| Statement of Assets | | | | Statement of Assets | | |
| and Liabilities Location | | Value | | and Liabilities Location | | Value |
Interest rate contracts Futures contracts | $ | 789,4141 | | Futures contracts | $ | 366,601 1 |
55 INVESCO INTERMEDIATE BOND FACTOR FUND
NOTES TO FINANCIAL STATEMENTS Continued
| Asset Derivatives | | | Liability Derivatives | |
Derivative Assets/ | | | | | |
Liabilities not subject | | | | | |
to master netting | | | | | |
agreements | $ | (789,414) | $ | (366,601) |
Total Derivative | | | | | |
Assets/Liabilities not | | | | | |
subject to master | | | | | |
netting agreements | $ | — | $ | — |
1.The daily variation margin receivable (payable) at period end is recorded in the Statement of Assets and Liabilities.
Effect of Derivative Investments for the Seven Months Ended February 29, 2020
The tables below summarize the gains (losses) on derivative investments, detailed by primary risk exposure, recognized in earnings during the period:
Amount of Realized Gain or (Loss) Recognized on Derivatives
Derivatives | | | | | | | |
Not Accounted | | | | | | | |
for as Hedging | | Futures | | | | | |
Instruments | | contracts Swap contracts | | Total |
Credit contracts | $ | — | $ | (803,274) | $ | (803,274) | |
Interest rate contracts | | 2,570,477 | | — | | 2,570,477 | |
Total | $ | 2,570,477 | $ | (803,274) | $ | 1,767,203 | |
| | | |
Amount of Change in Unrealized Gain or (Loss) Recognized on Derivatives | | |
Derivatives | | | | | | | |
Not Accounted | | | | | | | |
for as Hedging | | Futures | | | | | |
Instruments | | contracts Swap contracts | | Total |
Credit contracts | $ | — | $ | 632,630 | $ | 632,630 | |
Interest rate contracts | | (367,064) | | — | | (367,064) | |
Total | $ | (367,064) | $ | 632,630 | $ | 265,566 | |
| | | | | | | |
The table below summarizes the seven month ended average notional value of futures contracts and one month ended average notional value of swap agreements during the period.
| | Futures | | Swap |
| | contracts | | Arrangements |
| | | | |
Average notional | | | | 7,847,680 |
amount | $ | 92,863,192 | $ |
Note 5 - Trustee and Officer Fees and Benefits
Certain Trustees have executed Deferred Compensation Agreement(s) pursuant to which they have the option to elect to defer receipt of all or a portion of the annual compensation they
56 INVESCO INTERMEDIATE BOND FACTOR FUND
are entitled to receive from the Fund. For purposes of determining the amount owed to the Trustees under the plan(s), deferred amounts are treated as though equal dollar amounts had been invested in shares of the Fund or in other Invesco and/or Invesco Oppenheimer funds selected by the Trustees. The Fund purchases shares of the funds selected for deferral by the Trustees in amounts equal to his or her deemed investment, resulting in a Fund asset equal to the deferred compensation liability. Such assets are included as a component of "Other" within the asset section of the Statement of Assets and Liabilities. Deferral of Trustees' fees under the plan(s) will not affect the net assets of the Fund and will not materially affect the Fund's assets, liabilities or net investment income per share. Amounts will be deferred until distributed in accordance with the Deferred Compensation Agreement(s).
Note 6 - Cash Balances
The Fund is permitted to temporarily carry a negative or overdrawn balance in its account with JPMorgan Chase Bank, the custodian bank. Such balances, if any at period-end, are shown in the Statement of Assets and Liabilities under the payable caption Amount due custodian. To compensate the custodian bank for such overdrafts, the overdrawn Fund may either (1) leave funds as a compensating balance in the account so the custodian bank can be compensated by earning the additional interest; or (2) compensate by paying the custodian bank at a rate agreed upon by the custodian bank and Invesco, not to exceed the contractually agreed upon rate.
Note 7 - Distributions to Shareholders and Tax Components of Net Assets
Tax Character of Distributions to Shareholders for the Seven Months Ended February 29, 2020 and the Fiscal Years Ended July 31, 2019 and July 31, 2018:
| | 2020 | | 2019 | | 2018 |
Ordinary income | $ | 3,190,421 | $ | 5,631,195 | $ | 5,889,823 |
Tax Components of Net Assets at Period-End:
| | 2020 |
Undistributed ordinary income | $ | 533,176 |
Net unrealized appreciation - investments | | 8,875,821 |
Temporary book/tax differences | | (25,371) |
Capital loss carryforward | | (1,310,512) |
Shares of beneficial interest | | 182,615,502 |
Total net assets | $ | 190,688,616 |
The difference between book-basis and tax-basis unrealized appreciation (depreciation) is due to differences in the timing of recognition of gains and losses on investments for tax and book purposes. The Fund's net unrealized appreciation (depreciation) difference is attributable primarily to futures contracts.
The temporary book/tax differences are a result of timing differences between book and tax recognition of income and/or expenses. The Fund's temporary book/tax differences are the
57 INVESCO INTERMEDIATE BOND FACTOR FUND

NOTES TO FINANCIAL STATEMENTS Continued
result of the trustee deferral of compensation and retirement plan benefits.
Capital loss carryforward is calculated and reported as of a specific date. Results of transactions and other activity after that date may affect the amount of capital loss carryforward actually available for the Fund to utilize. Capital losses generated in years beginning after December 22, 2010 can be carried forward for an unlimited period, whereas previous losses expire in eight tax years. Capital losses with an expiration period may not be used to offset capital gains until all net capital losses without an expiration date have been utilized. Capital loss carryforwards with no expiration date will retain their character as either short-term or long-term capital losses instead of as short-term capital losses as under prior law. The ability to utilize capital loss carryforwards in the future may be limited under the Internal Revenue Code and related regulations based on the results of future transactions.
The Fund has a capital loss carryforward as of February 29, 2020, which expires as follows:
Capital Loss Carryforward*
Expiration | Short-Term | | Long-Term | | Total |
Not subject to expiration $ | 1,302,983 | $ | 7,529 | $ | 1,310,512 |
*Capital loss carryforward as of the date listed above is reduced for limitations, if any, to the extent required by the Internal Revenue Code and may be further limited depending upon a variety of factors, including the realization of net unrealized gains or losses as of the date of any reorganization.
Note 8 - Investment Transactions
The aggregate amount of investment securities (other than short-term securities, U.S. Treasury obligations and money market funds, if any) purchased and sold by the Fund during the seven months ended February 29, 2020 was $43,674,834 and $87,462,621, respectively. During the same period, purchases and sales of U.S. Treasury obligations were $67,942,650 and $36,957,982, respectively. Cost of investments, including any derivatives, on a tax basis includes the adjustments for financial reporting purposes as of the most recently completed federal income tax reporting period-end.
Unrealized Appreciation (Depreciation) of Investments on a Tax Basis
Aggregate unrealized appreciation of investments | $ | 9,545,302 |
Aggregate unrealized (depreciation) of investments | | (669,481) |
Net unrealized appreciation of investments | $ | 8,875,821 |
Cost of investments for tax purposes is $212,649,290.
Note 9 - Reclassification of Permanent Differences
Primarily as a result of differing book/tax treatment of partnership transactions, on February 29, 2020, undistributed net investment income was increased by $446,604, undistributed net realized loss was increased by $337,530 and shares of beneficial interest was decreased by $109,074. This reclassification had no effect on the net assets of the Fund.
58 INVESCO INTERMEDIATE BOND FACTOR FUND
Note 10 - Share Information
Transactions in shares of beneficial interest were as follows:
| | Seven Months Ended | Year Ended July 31, 20192 | Year Ended July 31, 2018 |
| | February 29, 20201 |
| | | | | | | |
| | Shares | | Amount | Shares | | Amount | Shares | | Amount |
| Class A | | | | | | | | | |
| Sold | 1,037,571 | $ | 11,455,611 | 2,475,679 | $ | 25,977,722 | 3,081,751 | $ | 33,249,682 |
| Automatic | | | | | | | | | |
| Conversion | | | | | | | | | |
| Class C | | | | | | | | | |
| to Class A | | | | | | | | | |
| Shares | 29,570 | | 327,243 | — | | — | — | | — |
| Dividends | | | | | | | | | |
| and/or | | | | | | | | | |
| distributions | | | | | | | | | |
| reinvested | 188,737 | | 2,087,920 | 327,284 | | 3,426,438 | 347,885 | | 3,718,015 |
| Redeemed | (1,357,418) | | (14,980,693) | (3,256,200) | | (33,996,208) | (3,916,504) | | (41,779,794) |
| Net increase | (101,540) | $ | (1,109,919) | (453,237) | $ | (4,592,048) | (486,868) | $ | (4,812,097) |
| (decrease) |
| | | | | | | | | |
| | | | | | | | | | |
| | | | | | | | | | |
| Class C | | | | | | | | | |
| Sold | 277,867 | $ | 3,072,852 | 445,362 | $ | 4,635,606 | 761,628 | $ | 8,205,750 |
| Dividends | | | | | | | | | |
| and/or | | | | | | | | | |
| distributions | | | | | | | | | |
| reinvested | 23,926 | | 264,633 | 58,108 | | 606,705 | 65,858 | | 703,140 |
| Automatic | | | | | | | | | |
| Conversion | | | | | | | | | |
| Class C | | | | | | | | | |
| to Class A | | | | | | | | | |
| Shares | (29,586) | | (327,243) | — | | — | — | | — |
| Redeemed | (380,085) | | (4,190,404) | (1,339,404) | | (14,139,457) | (893,084) | | (9,546,214) |
| Net increase | (107,878) | $ | (1,180,162) | (835,934) | $ | (8,897,146) | (65,598) | $ | (637,324) |
| (decrease) |
| | | | | | | | | |
| | | | | | | | | | |
| | | | | | | | | | |
| Class R | | | | | | | | | |
| Sold | 257,804 | $ | 2,845,463 | 486,574 | $ | 5,075,703 | 805,312 | $ | 8,642,719 |
| Dividends | | | | | | | | | |
| and/or | | | | | | | | | |
| distributions | | | | | | | | | |
| reinvested | 26,491 | | 289,089 | 50,674 | | 530,456 | 44,376 | | 473,617 |
| Redeemed | (362,485) | | (4,001,074) | (512,103) | | (5,354,442) | (391,867) | | (4,171,516) |
| Net increase | (78,190) | $ | (866,522) | 25,145 | $ | 251,717 | 457,821 | $ | 4,944,820 |
| (decrease) |
| | | | | | | | | |
| | | | | | | | | | |
| | | | | | | | | | |
| Class Y | | | | | | | | | |
| Sold | 683,759 | $ | 7,590,469 | 2,309,644 | $ | 23,802,066 | 2,173,981 | $ | 23,259,291 |
| Dividends | | | | | | | | | |
| and/or | | | | | | | | | |
| distributions | | | | | | | | | |
| reinvested | 36,654 | | 405,459 | 74,462 | | 777,216 | 70,154 | | 746,080 |
| Redeemed | (954,407) | | (10,531,820) | (3,090,351) | | (31,847,220) | (1,240,110) | | (13,182,903) |
59 INVESCO INTERMEDIATE BOND FACTOR FUND
NOTES TO FINANCIAL STATEMENTS Continued
| | Seven Months Ended | Year Ended July 31, 20192 | Year Ended July 31, 2018 |
| | February 29, 20201 |
| | | | | | | |
| | Shares | | Amount | Shares | | Amount | Shares | | Amount |
| Net increase | (233,994) | $ | (2,535,892) | (706,245) | $ | (7,267,938) | 1,004,025 | $ | 10,822,468 |
| (decrease) |
| | | | | | | | | |
| | | | | | | | | | |
| | | | | | | | | | |
| Class R53 | | | | | | | | | |
| Sold | — | $ | — | 937 | $ | 10,000 | — | $ | — |
| Dividends | | | | | | | | | |
| and/or | | | | | | | | | |
| distributions | | | | | | | | | |
| reinvested | — | | — | — | | — | — | | — |
| Redeemed | — | | — | — | | — | — | | — |
| Net increase | — | $ | — | 937 | $ | 10,000 | — | $ | — |
| (decrease) |
| | | | | | | | | |
| | | | | | | | | | |
| | | | | | | | | | |
| Class R6 | | | | | | | | | |
| Sold | 126,736 | $ | 1,393,303 | 238,957 | $ | 2,496,305 | 682,796 | $ | 7,331,314 |
| Dividends | | | | | | | | | |
| and/or | | | | | | | | | |
| distributions | | | | | | | | | |
| reinvested | 9,987 | | 110,563 | 22,775 | | 238,146 | 17,497 | | 185,853 |
| Redeemed | (142,659) | | (1,571,785) | (487,266) | | (5,127,923) | (154,954) | | (1,644,164) |
| Net increase | (5,936) | $ | (67,919) | (225,534) | $ | (2,393,472) | 545,339 | $ | 5,873,003 |
| (decrease) |
| | | | | | | | | |
| | | | | | | | | | |
1.There are entities that are record owners of more than 5% of the outstanding shares of the Fund and own 13% of the outstanding shares of the Fund. IDI has an agreement with these entities to sell Fund shares. The Fund, Invesco and/or Invesco affiliates may make payments to these entities, which are considered to be related to the Fund, for providing services to the Fund, Invesco and/or Invesco affiliates, including but not limited to services such as securities brokerage, distribution, third party record keeping and account servicing. The Fund has no knowledge as to whether all or any portion of the shares owned of record by these entities are also owned beneficially.
2.There are entities that are record owners of more than 5% of the outstanding shares of the Fund and own 12% of the outstanding shares of the Fund. IDI has an agreement with these entities to sell Fund shares. The Fund, Invesco and/or Invesco affiliates may make payments to these entities, which are considered to be related to the Fund, for providing services to the Fund, Invesco and/or Invesco affiliates, including but not limited to services such as securities brokerage, distribution, third party record keeping and account servicing. The Fund has no knowledge as to whether all or any portion of the shares owned of record by these entities are also owned beneficially.
3.Commencement date after the close of business on May 24, 2019.
Note 11 - Borrowings
Joint Credit Facility. A number of mutual funds managed by the Adviser participated in a $1.95 billion revolving credit facility (the "Facility") intended to provide short-term financing, if necessary, subject to certain restrictions in connection with atypical redemption activity. Expenses and fees related to the Facility are paid by the participating funds and are disclosed separately or as other expenses on the Statement of Operations. The Fund did not utilize the Facility during the reporting period. The Facility terminated May 24, 2019.
Note 12 - Subsequent Event
60 INVESCO INTERMEDIATE BOND FACTOR FUND
During the first quarter of 2020, the World Health Organization declared the coronavirus (COVID-19) to be a public health emergency. COVID-19 has led to increased short-term market volatility and may have adverse long-term effects on U.S. and world economies and markets in general. COVID-19 may adversely impact the Fund's ability to achieve its investment objective. Because of the uncertainties on valuation, the global economy and business operations, values reflected in these financial statements may materially differ from the value received upon actual sales of those investments.
The Coronavirus Aid, Relief, and Economic Security Act, commonly referred to as the "CARES Act," was signed into law on March 27, 2020 by President Trump. The Act is a $2 trillion stimulus package to help individuals, businesses and hospitals in response to the economic distress caused by the COVID-19 crisis. The Adviser is assessing the components of the Act and the impacts to the Fund should be immaterial.
61 INVESCO INTERMEDIATE BOND FACTOR FUND
REPORT OF INDEPENDENT REGISTERED PUBLIC ACCOUNTING FIRM
To the Board of Trustees of AIM Investment Securities Funds (Invesco Investment Securities Funds) and Shareholders of Invesco Intermediate Bond Factor Fund
Opinion on the Financial Statements
We have audited the accompanying statement of assets and liabilities, including the schedule of investments, of Invesco Intermediate Bond Factor Fund, formerly Invesco Oppenheimer Intermediate Income Fund, (one of the funds constituting AIM Investment Securities Funds (Invesco Investment Securities Funds), referred to hereafter as the "Fund") as of February 29, 2020, the related statements of operations and of changes in net assets, including the related notes, and the financial highlights for each of the periods indicated in the table below (collectively referred to as the "financial statements"). In our opinion, the financial statements present fairly, in all material respects, the financial position of the Fund as of February 29, 2020, the results of its operations, the changes in its net assets and the financial highlights for each of the periods indicated in the table below, in conformity with accounting principles generally accepted in the United States of America.
Statement of Operations and Statement of | |
Changes in Net Assets | Financial Highlights |
| |
For the period from August 1, 2019 through | For the period from August 1, 2019 through |
February 29, 2020 and the year ended July 31, | February 29, 2020 and the year ended July 31, |
2019 | 2019 for Class A, Class C, Class R, Class Y and |
| Class R6 |
| For the period from August 1, 2019 through |
| February 29, 2020 and the period from May 24, |
| 2019 (inception of offering) through July 31, |
| 2019 for Class R5 |
| |
The financial statements of Invesco Intermediate Bond Factor Fund (formerly Oppenheimer Intermediate Income Fund) as of and for the year ended July 31, 2018 and the financial highlights for each of the periods ended on or prior to July 31, 2018 (not presented herein, other than the statement of changes in net assets and the financial highlights) were audited by other auditors whose report dated September 26, 2018 expressed an unqualified opinion on those financial statements and financial highlights.
Basis for Opinion
These financial statements are the responsibility of the Fund's management. Our responsibility is to express an opinion on the Fund's financial statements based on our audits. We are a public accounting firm registered with the Public Company Accounting Oversight Board (United States) (PCAOB) and are required to be independent with respect to the Fund in accordance with the U.S. federal securities laws and the applicable rules and regulations of the Securities and Exchange Commission and the PCAOB.
62 INVESCO INTERMEDIATE BOND FACTOR FUND
We conducted our audits of these financial statements in accordance with the standards of the PCAOB. Those standards require that we plan and perform the audit to obtain reasonable assurance about whether the financial statements are free of material misstatement, whether due to error or fraud.
Our audits included performing procedures to assess the risks of material misstatement of the financial statements, whether due to error or fraud, and performing procedures that respond to those risks. Such procedures included examining, on a test basis, evidence regarding the amounts and disclosures in the financial statements. Our audits also included evaluating the accounting principles used and significant estimates made by management, as well as evaluating the overall presentation of the financial statements. Our procedures included confirmation of securities owned as of February 29, 2020 by correspondence with the custodian, transfer agent and brokers; when replies were not received from brokers, we performed other auditing procedures. We believe that our audits provide a reasonable basis for our opinion.
/s/PricewaterhouseCoopers LLP Houston, Texas
April 28, 2020
We have served as the auditor of one or more investment companies in the Invesco group of investment companies since at least 1995. We have not been able to determine the specific year we began serving as auditor.
63 INVESCO INTERMEDIATE BOND FACTOR FUND
TAX INFORMATION
Form 1099-DIV, Form 1042-S and other year–end tax information provide shareholders with actual calendar year amounts that should be included in their tax returns. Shareholders should consult their tax advisers.
The following distribution information is being provided as required by the Internal Revenue Code or to meet a specific state's requirement.
The Fund designates the following amounts or, if subsequently determined to be different, the maximum amount allowable for its seven month ended February 29, 2020:
Federal and State Income Tax | |
Qualified Dividend Income* | 7.11 % |
Corporate Dividends Received Deduction* | 1.84 % |
Qualified Business Income | 0.00 % |
U.S. Treasury Obligations* | 6.21 % |
Tax-Exempt Interest Dividends* | 0.00 % |
* The above percentages are based on ordinary income dividends paid to shareholders during the Fund's fiscal year.
64 INVESCO INTERMEDIATE BOND FACTOR FUND

PORTFOLIO PROXY VOTING POLICIES AND GUIDELINES; UPDATES TO SCHEDULE OF INVESTMENTS
Go paperless with eDelivery
Visit invesco.com/edelivery to enjoy the convenience and security of anytime electronic access to your investment documents.
With eDelivery, you can elect to have any or all of the following materials delivered straight to your inbox to download, save and print from your own computer:
•Fund reports and prospectuses
•Quarterly statements
•Daily confirmations
•Tax forms
Invesco mailing information
Send general correspondence to Invesco Investment Services, Inc., P.O. Box 219078, Kansas City, MO 64121-9078.
Important notice regarding delivery of security holder documents
To reduce Fund expenses, only one copy of most shareholder documents may be mailed to shareholders with multiple accounts at the same address (Householding). Mailing of your shareholder documents may be householded indefinitely unless you instruct us otherwise. If you do not want the mailing of these documents to be combined with those for other members of your household, please contact Invesco Investment Services, Inc. at 800 959 4246 or contact your financial institution. We will begin sending you individual copies for each account within 30 days after receiving your request.
Fund holdings and proxy voting information
The Fund provides a complete list of its holdings four times in each fiscal year, at the quarter ends. For the second and fourth quarters, the lists appear in the Fund's semiannual and annual reports to shareholders. For the first and third quarters, the Fund files the lists with the Securities and Exchange Commission (SEC) as an exhibit to its reports on Form N-PORT. The most recent list of portfolio holdings is available at invesco.com/completeqtrholdings. Shareholders can also look up the Fund's Forms N-PORT on the SEC website at sec.gov.
A description of the policies and procedures that the Fund uses to determine how to vote proxies relating to portfolio securities is available without charge, upon request, from our Client Services department at 800 959 4246 or at invesco.com/proxyguidelines. The information is also available on the SEC website, sec.gov.
Information regarding how the Fund voted proxies related to its portfolio securities during the most recent 12-month period ended June 30 is available at invesco.com/proxysearch. The information is also available on the SEC website, sec.gov.
Invesco Advisers, Inc. is an investment adviser; it provides investment advisory services to individual and institutional clients and does not sell securities. Invesco Distributors, Inc. is the US distributor for Invesco Ltd.'s retail mutual funds, exchange-traded funds and institutional money market funds. Both are wholly owned, indirect subsidiaries of Invesco Ltd.
65 INVESCO INTERMEDIATE BOND FACTOR FUND

TRUSTEES AND OFFICERS
The address of each trustee and officer is AIM Investment Securities Funds (Invesco Investment Securities Funds) (the "Trust"), 11 Greenway Plaza, Suite 1000, Houston, Texas 77046-1173. The trustees serve for the life of the Trust, subject to their earlier death, incapacitation, resignation, retirement or removal as more specifically provided in the Trust's organizational documents. Each officer serves for a one year term or until their successors are elected and qualified. Column two below includes length of time served with predecessor entities, if any.
Name, Year of Birth and | Trustee | Principal Occupation(s) | Number of Funds | Other Directorship(s) |
Position(s) Held with the Trust | and/or | During Past 5 Years | in Fund Complex | Held by Trustee During |
| Officer | | Overseen by Trustee | Past 5 Years |
| Since | | | |
| | | | |
INTERESTED TRUSTEE | | | | |
| | | | |
Martin L. Flanagan 1 — 1960 | 2007 | Executive Director, Chief Executive Officer and | 229 | None |
Trustee and Vice Chair | | President, Invesco Ltd. (ultimate parent of | | |
| | Invesco and a global investment management | | |
| | firm); Trustee and Vice Chair, The Invesco | | |
| | Funds; Vice Chair, Investment Company | | |
| | Institute; and Member of Executive Board, | | |
| | SMU Cox School of Business | | |
Formerly: Advisor to the Board, Invesco Advisers, Inc. (formerly known as Invesco Institutional (N.A.), Inc.); Chairman and Chief Executive Officer, Invesco Advisers, Inc. (registered investment adviser); Director, Chairman, Chief Executive Officer and President, Invesco Holding Company (US), Inc. (formerly IVZ Inc.) (holding company), Invesco Group Services, Inc. (service provider) and Invesco North American Holdings, Inc. (holding company); Director, Chief Executive Officer and President, Invesco Holding Company Limited (parent of Invesco and a global investment management firm); Director, Invesco Ltd.; Chairman, Investment Company Institute and President, Co-Chief Executive Officer, Co-President, Chief Operating Officer and Chief Financial Officer, Franklin Resources, Inc. (global investment management organization)
1 Mr. Flanagan is considered an interested person (within the meaning of Section 2(a)(19) of the 1940 Act) of the Trust because he is an officer of the Adviser to the Trust, and an officer and a director of Invesco Ltd., ultimate parent of the Adviser.
66 INVESCO INTERMEDIATE BOND FACTOR FUND
Name, Year of Birth and | Trustee | Principal Occupation(s) | Number of Funds | Other Directorship(s) |
Position(s) Held with the Trust | and/or | During Past 5 Years | in Fund Complex | Held by Trustee During |
| Officer | | Overseen by Trustee | Past 5 Years |
| Since | | | |
INDEPENDENT TRUSTEES
Bruce L. Crockett – 1944 | 2003 Chairman, Crockett Technologies Associates |
Trustee and Chair | (technology consulting company) |
| Formerly: Director, Captaris (unified |
| messaging provider); Director, President and |
| Chief Executive Officer, COMSAT Corporation; |
| Chairman, Board of Governors of INTELSAT |
| (international communications company); ACE |
| Limited (insurance company); Independent |
| Directors Council and Investment Company |
| Institute: Member of the Audit Committee, |
| Investment Company Institute; Member of |
| the Executive Committee and Chair of the |
| Governance Committee, Independent Directors |
| Council |
229Director and
Chairman of the
Audit Committee,
ALPS (Attorneys
Liability Protection Society) (insurance company); Director and Member of the Audit Committee and Compensation
Committee, Ferroglobe
PLC (metallurgical
company)
David C. Arch – 1945 | 2010 Chairman of Blistex Inc. (consumer health | 229 | Board member of the |
Trustee | care products manufacturer); Member, World | | Illinois Manufacturers' |
| Presidents' Organization | | Association |
| | | |
Beth Ann Brown – 1968 | 2019 Independent Consultant | 229 | Director, Board of |
Trustee | Formerly: Head of Intermediary Distribution, | | Directors of Caron |
| | Engineering Inc.; |
| Managing Director, Strategic Relations, | | Advisor, Board of |
| Managing Director, Head of National | | Advisors of Caron |
| Accounts, Senior Vice President, National | | Engineering Inc.; |
| Account Manager and Senior Vice President, | | President and |
| Key Account Manager, Columbia Management | | Director, of Acton |
| Investment Advisers LLC; Vice President, Key | | Shapleigh Youth |
| Account Manager, Liberty Funds Distributor, | | Conservation Corps |
| Inc.; and Trustee of certain Oppenheimer | | (non -profit); and |
| Funds | | President and Director |
| | | of Grahamtastic |
| | | Connection (non- |
| | | profit) |
Jack M. Fields – 1952 | 2003 Chief Executive Officer, Twenty First Century |
Trustee | Group, Inc. (government affairs company); |
| and Chairman, Discovery Learning Alliance |
| (non-profit) |
| Formerly: Owner and Chief Executive Officer, |
| Dos Angeles Ranch L.P. (cattle, hunting, |
| corporate entertainment); Director, Insperity, |
| Inc. (formerly known as Administaff) (human |
| resources provider); Chief Executive Officer, |
| Texana Timber LP (sustainable forestry |
| company); Director of Cross Timbers Quail |
| Research Ranch (non-profit); and member of |
| the U.S. House of Representatives |
229Member, Board of Directors of Baylor
College of Medicine
67 INVESCO INTERMEDIATE BOND FACTOR FUND
TRUSTEES AND OFFICERS Continued
Name, Year of Birth and | Trustee | Principal Occupation(s) | Number of Funds | Other Directorship(s) |
Position(s) Held with the Trust | and/or | During Past 5 Years | in Fund Complex | Held by Trustee During |
| Officer | | Overseen by Trustee | Past 5 Years |
| Since | | | |
INDEPENDENT TRUSTEES (CONTINUED)
Cynthia Hostetler —1962 | 2017 Non-Executive Director and Trustee of a |
Trustee | number of public and private business |
| corporations |
| Formerly: Director, Aberdeen Investment |
| Funds (4 portfolios); Head of Investment |
| Funds and Private Equity, Overseas Private |
| Investment Corporation; President, First |
| Manhattan Bancorporation, Inc.; Attorney, |
| Simpson Thacher & Bartlett LLP |
229Vulcan Materials
Company
(construction materials
company); Trilinc Global Impact Fund; Genesee & Wyoming, Inc. (railroads); Artio Global Investment LLC (mutual
fund complex);
Edgen Group, Inc. (specialized energy and infrastructure products distributor); Investment Company Institute (professional organization); Independent Directors Council (professional organization)
Eli Jones – 1961 | 2016 Professor and Dean, Mays Business School - | 229 | Insperity, Inc. (formerly |
Trustee | Texas A&M University | | known as Administaff) |
| Formerly: Professor and Dean, Walton College | | (human resources |
| | provider) |
| of Business, University of Arkansas and E.J. | | |
| Ourso College of Business, Louisiana State | | |
| University; Director, Arvest Bank | | |
Elizabeth Krentzman – 1959 | 2019 Formerly: Principal and Chief Regulatory |
Trustee | Advisor for Asset Management Services and |
| U.S. Mutual Fund Leader of Deloitte & Touche |
| LLP; General Counsel of the Investment |
| Company Institute (trade association); |
| National Director of the Investment |
| Management Regulatory Consulting Practice, |
| Principal, Director and Senior Manager of |
| Deloitte & Touche LLP; Assistant Director of |
| the Division of Investment Management - |
| Office of Disclosure and Investment Adviser |
| Regulation of the U.S. Securities and Exchange |
| Commission and various positions with the |
| Division of Investment Management – Office |
| of Regulatory Policy of the U.S. Securities and |
| Exchange Commission; Associate at Ropes & |
| Gray LLP.; and Trustee of certain Oppenheimer |
| Funds |
229Trustee of the
University of Florida
National Board
Foundation; Member of the Cartica Funds Board of Directors (private investment funds); Member of the University of Florida Law Center
Association, Inc. Board
of Trustees and Audit
Committee Member
68 INVESCO INTERMEDIATE BOND FACTOR FUND
Name, Year of Birth and | Trustee | Principal Occupation(s) | Number of Funds | Other Directorship(s) |
Position(s) Held with the Trust | and/or | During Past 5 Years | in Fund Complex | Held by Trustee During |
| Officer | | Overseen by Trustee | Past 5 Years |
| Since | | | |
INDEPENDENT TRUSTEES (CONTINUED)
Anthony J. LaCava, Jr. – 1956 2019 | Formerly: Director and Member of the Audit |
Trustee | Committee, Blue Hills Bank (publicly traded |
| financial institution) and Managing Partner, |
| KPMG LLP |
229Blue Hills Bank;
Chairman of Bentley University; Member, Business School Advisory Council; and Nominating
Committee, KPMG LLP
Prema Mathai-Davis – 1950 2003 Retired229None Trustee
Formerly; Co-Founder & Partner of Quantalytics Research, LLC, (a FinTech Investment Research Platform for the Self- Directed Investor)
Joel W. Motley – 1952 | 2019 Director of Office of Finance, Federal Home |
Trustee | Loan Bank System; Member of the Vestry |
| of Trinity Wall Street; Managing Director of |
| Carmona Motley Hoffman, Inc. (privately held |
| financial advisor); Member of the Council |
| on Foreign Relations and its Finance and |
| Budget Committee; Chairman Emeritus of |
| Board of Human Rights Watch and Member |
| of its Investment Committee; and Member |
| of Investment Committee and Board of |
| Historic Hudson Valley (non-profit cultural |
| organization). |
| Formerly: Managing Director of Public Capital |
| Advisors, LLC (privately held financial advisor); |
| Managing Director of Carmona Motley |
| Hoffman, Inc. (privately held financial advisor); |
| Trustee of certain Oppenheimer Funds; and |
| Director of Columbia Equity Financial Corp. |
| (privately held financial advisor) |
229Member of Board of Greenwall Foundation (bioethics research foundation) and
its Investment
Committee; Member of Board of Friends of the LRC (non-profit legal advocacy); Board Member and Investment Committee Member of Pulitzer Center for Crisis
Reporting (non-profit
journalism)
Teresa M. Ressel — 1962 | 2017 Non-executive director and trustee of a |
Trustee | number of public and private business |
| corporations |
| Formerly: Chief Financial Officer, Olayan |
| America, The Olayan Group (international |
| investor/commercial/industrial); Chief |
| Executive Officer, UBS Securities LLC; Group |
| Chief Operating Officer, Americas, UBS AG; |
| Assistant Secretary for Management & Budget |
| and CFO, US Department of the Treasury |
229Atlantic Power
Corporation (power
generation company); ON Semiconductor Corp. (semiconductor supplier)
69 INVESCO INTERMEDIATE BOND FACTOR FUND
TRUSTEES AND OFFICERS Continued
Name, Year of Birth and | Trustee | Principal Occupation(s) | Number of Funds | Other Directorship(s) |
Position(s) Held with the Trust | and/or | During Past 5 Years | in Fund Complex | Held by Trustee During |
| Officer | | Overseen by Trustee | Past 5 Years |
| Since | | | |
| | | | |
INDEPENDENT TRUSTEES | | | | |
(CONTINUED) | | | | |
| | | | |
Ann Barnett Stern – 1957 | 2017 | President and Chief Executive Officer, Houston | 229 | Federal Reserve Bank |
Trustee | | Endowment Inc. (private philanthropic | | of Dallas |
| | institution) | | |
| | Formerly: Executive Vice President and | | |
| | General Counsel, Texas Children's Hospital; | | |
| | Attorney, Beck, Redden and Secrest, LLP; | | |
| | Business Law Instructor, University of St. | | |
| | Thomas; Attorney, Andrews & Kurth LLP | | |
| | | | |
Robert C. Troccoli – 1949 | 2016 | Retired | 229 | None |
Trustee | | Formerly: Adjunct Professor, University of | | |
| | | |
| | Denver – Daniels College of Business, Senior | | |
| | Partner, KPMG LLP | | |
Daniel S. Vandivort –1954 | 2019 Treasurer, Chairman of the Audit and Finance |
Trustee | Committee, and Trustee, Board of Trustees, |
| Huntington Disease Foundation of America; |
| and President, Flyway Advisory Services LLC |
| (consulting and property management). |
| Formerly: Trustee and Governance Chair, of |
| certain Oppenheimer Funds |
229Chairman and Lead Independent Director, Chairman of the Audit Committee, and Director, Board of Directors, Value Line Funds
James D. Vaughn – 1945 | 2019 Retired |
Trustee | Formerly: Managing Partner, Deloitte & Touche |
|
| LLP; Trustee and Chairman of the Audit |
| Committee, Schroder Funds; Board Member, |
| Mile High United Way, Boys and Girls Clubs, |
| Boy Scouts, Colorado Business Committee |
| for the Arts, Economic Club of Colorado |
| and Metro Denver Network (economic |
| development corporation); and Trustee of |
| certain Oppenheimer Funds |
229Board member
and Chairman of Audit Committee
of AMG National Trust Bank; Trustee and Investment Committee member, University of South Dakota Foundation; Board member, Audit Committee Member and past Board Chair, Junior Achievement (non-profit)
Christopher L. Wilson – | 2017 Retired |
1957 | Formerly: Director, TD Asset Management USA |
Trustee, Vice Chair and Chair |
Designate | Inc. (mutual fund complex) (22 portfolios); |
| Managing Partner, CT2, LLC (investing and |
| consulting firm); President/Chief Executive |
| Officer, Columbia Funds, Bank of America |
| Corporation; President/Chief Executive Officer, |
| CDC IXIS Asset Management Services, Inc.; |
229ISO New England,
Inc. (non-profit
organization
managing regional electricity market)
70 INVESCO INTERMEDIATE BOND FACTOR FUND
Name, Year of Birth and | Trustee | Principal Occupation(s) | Number of Funds | Other Directorship(s) |
Position(s) Held with the Trust | and/or | During Past 5 Years | in Fund Complex | Held by Trustee During |
| Officer | | Overseen by Trustee | Past 5 Years |
| | | |
| Since | | | |
| | | | |
INDEPENDENT TRUSTEES | | | | |
(CONTINUED) | | | | |
| | | | |
Christopher L. Wilson | | Principal & Director of Operations, Scudder | | |
Continued | | Funds, Scudder, Stevens & Clark, Inc.; Assistant | | |
| | Vice President, Fidelity Investments | | |
| | | | |
71 INVESCO INTERMEDIATE BOND FACTOR FUND

TRUSTEES AND OFFICERS Continued
Name, Year of Birth and | Trustee | Principal Occupation(s) | Number of Funds | Other Directorship(s) |
Position(s) Held with the Trust | and/or | During Past 5 Years | in Fund Complex | Held by Trustee During |
| Officer | | Overseen by Trustee | Past 5 Years |
| Since | | | |
| | | | |
OFFICERS | | | | |
| | | | |
Sheri Morris — 1964 | 2003 | Head of Global Fund Services, Invesco Ltd.; | N/A | N/A |
President, Principal Executive | | President, Principal Executive Officer and | | |
Officer and Treasurer | | Treasurer, The Invesco Funds; Vice President, | | |
| | Invesco Advisers, Inc. (formerly known as | | |
| | Invesco Institutional (N.A.), Inc.) (registered | | |
| | investment adviser); and Vice President, | | |
| | Invesco Exchange-Traded Fund Trust, Invesco | | |
| | Exchange-Traded Fund Trust II, Invesco India | | |
| | Exchange-Traded Fund Trust, Invesco Actively | | |
| | Managed Exchange-Traded Fund Trust, | | |
| | Invesco Actively Managed Exchange-Traded | | |
| | Commodity Fund Trust and Invesco Exchange- | | |
| | Traded Self-Indexed Fund Trust, and Vice | | |
| | President, OppenheimerFunds, Inc. | | |
| | Formerly: Vice President and Principal | | |
| | Financial Officer, The Invesco Funds; Vice | | |
| | President, Invesco AIM Advisers, Inc., Invesco | | |
| | AIM Capital Management, Inc. and Invesco | | |
| | AIM Private Asset Management, Inc.; Assistant | | |
| | Vice President and Assistant Treasurer, The | | |
| | Invesco Funds and Assistant Vice President, | | |
| | Invesco Advisers, Inc., Invesco AIM Capital | | |
| | Management, Inc. and Invesco AIM Private | | |
| | Asset Management, Inc.; and Treasurer, | | |
| | Invesco Exchange-Traded Fund Trust, Invesco | | |
| | Exchange-Traded Fund Trust II, Invesco India | | |
| | Exchange-Traded Fund Trust and Invesco | | |
| | Actively Managed Exchange-Traded Fund Trust | | |
| | | | |
Russell C. Burk — 1958 | 2005 | Senior Vice President and Senior Officer, The | N/A | N/A |
Senior Vice President and | | Invesco Funds | | |
Senior Officer | | | | |
| | | | |
Jeffrey H. Kupor – 1968 | 2018 | Head of Legal of the Americas, Invesco | N/A | N/A |
Senior Vice President, Chief | | Ltd.; Senior Vice President and Secretary, | | |
Legal Officer and Secretary | | Invesco Advisers, Inc. (formerly known as | | |
| | Invesco Institutional (N.A.), Inc.) (registered | | |
| | investment adviser); Senior Vice President | | |
| | and Secretary, Invesco Distributors, Inc. | | |
| | (formerly known as Invesco AIM Distributors, | | |
| | Inc.); Vice President and Secretary, Invesco | | |
| | Investment Services, Inc. (formerly known | | |
| | as Invesco AIM Investment Services, Inc.) | | |
| | Senior Vice President, Chief Legal Officer and | | |
| | Secretary, The Invesco Funds; Secretary and | | |
| | General Counsel, Invesco Investment Advisers | | |
| | LLC (formerly known as Van Kampen Asset | | |
| | Management); Secretary and General Counsel, | | |
| | Invesco Capital Markets, Inc. (formerly known | | |
| | as Van Kampen Funds Inc.) and Chief Legal | | |
| | | | |
72 INVESCO INTERMEDIATE BOND FACTOR FUND

Name, Year of Birth and | Trustee | Principal Occupation(s) | Number of Funds | Other Directorship(s) |
Position(s) Held with the Trust | and/or | During Past 5 Years | in Fund Complex | Held by Trustee During |
| Officer | | Overseen by Trustee | Past 5 Years |
| Since | | | |
| | | | |
OFFICERS (CONTINUED) | | | | |
| | | | |
Jeffrey H. Kupor (Continued) | | Officer, Invesco Exchange-Traded Fund Trust, | | |
| | Invesco Exchange-Traded Fund Trust II, Invesco | | |
| | India Exchange-Traded Fund Trust, Invesco | | |
| | Actively Managed Exchange-Traded Fund | | |
| | Trust, Invesco Actively Managed Exchange- | | |
| | Traded Commodity Fund Trust and Invesco | | |
| | Exchange-Traded Self-Indexed Fund Trust; | | |
| | Secretary, Invesco Indexing LLC; Secretary, W.L. | | |
| | Ross & Co., LLC | | |
| | Formerly: Secretary and Vice President, | | |
| | Jemstep, Inc.; Head of Legal, Worldwide | | |
| | Institutional, Invesco Ltd.; Secretary and | | |
| | General Counsel, INVESCO Private Capital | | |
| | Investments, Inc.; Senior Vice President, | | |
| | Secretary and General Counsel, Invesco | | |
| | Management Group, Inc. (formerly known | | |
| | as Invesco AIM Management Group, | | |
| | Inc.); Assistant Secretary, INVESCO Asset | | |
| | Management (Bermuda) Ltd.; Secretary and | | |
| | General Counsel, Invesco Private Capital, Inc.; | | |
| | Assistant Secretary and General Counsel, | | |
| | INVESCO Realty, Inc.; Secretary and General | | |
| | Counsel, Invesco Senior Secured Management, | | |
| | Inc.; and Secretary, Sovereign G./P. Holdings | | |
| | Inc. | | |
| | | | |
Andrew R. Schlossberg – | 2019 | Head of the Americas and Senior Managing | N/A | N/A |
1974 | | Director, Invesco Ltd.; Director and Senior | | |
Senior Vice President | | Vice President, Invesco Advisers, Inc. (formerly | | |
| | known as Invesco Institutional (N.A.), Inc.) | | |
| | (registered investment adviser); Director and | | |
| | Chairman, Invesco Investment Services, Inc. | | |
| | (formerly known as Invesco AIM Investment | | |
| | Services, Inc.) (registered transfer agent); | | |
| | Senior Vice President, The Invesco Funds; | | |
| | Director, Invesco Investment Advisers LLC | | |
| | (formerly known as Van Kampen Asset | | |
| | Management); Director, President and | | |
| | Chairman, Invesco Insurance Agency, Inc. | | |
| | Formerly: Director, Invesco UK Limited; | | |
| | Director and Chief Executive, Invesco Asset | | |
| | Management Limited and Invesco Fund | | |
| | Managers Limited; Assistant Vice President, | | |
| | The Invesco Funds; Senior Vice President, | | |
| | Invesco Advisers, Inc. (formerly known as | | |
| | Invesco Institutional (N.A.), Inc.) (registered | | |
| | investment adviser); Director and Chief | | |
| | Executive, Invesco Administration Services | | |
| | | | |
73 INVESCO INTERMEDIATE BOND FACTOR FUND

TRUSTEES AND OFFICERS Continued
Name, Year of Birth and | Trustee | Principal Occupation(s) | Number of Funds | Other Directorship(s) |
Position(s) Held with the Trust | and/or | During Past 5 Years | in Fund Complex | Held by Trustee During |
| Officer | | Overseen by Trustee | Past 5 Years |
| Since | | | |
| | | | |
OFFICERS (CONTINUED) | | | | |
| | | | |
Andrew R. Schlossberg | | Limited and Invesco Global Investment | | |
(Continued) | | Funds Limited; Director, Invesco Distributors, | | |
| | Inc.; Head of EMEA, Invesco Ltd.; President, | | |
| | Invesco Actively Managed Exchange-Traded | | |
| | Commodity Fund Trust, Invesco Actively | | |
| | Managed Exchange-Traded Fund Trust, | | |
| | Invesco Exchange-Traded Fund Trust, Invesco | | |
| | Exchange-Traded Fund Trust II and Invesco | | |
| | India Exchange-Traded Fund Trust; Managing | | |
| | Director and Principal Executive Officer, | | |
| | Invesco Capital Management LLC | | |
| | | | |
John M. Zerr — 1962 | 2006 | Chief Operating Officer of the Americas; | N/A | N/A |
Senior Vice President | | Senior Vice President, Invesco Advisers, Inc. | | |
| | (formerly known as Invesco Institutional | | |
| | (N.A.), Inc.) (registered investment adviser); | | |
| | Senior Vice President, Invesco Distributors, Inc. | | |
| | (formerly known as Invesco AIM Distributors, | | |
| | Inc.); Director and Vice President, Invesco | | |
| | Investment Services, Inc. (formerly known as | | |
| | Invesco AIM Investment Services, Inc.) Senior | | |
| | Vice President, The Invesco Funds; Managing | | |
| | Director, Invesco Capital Management LLC; | | |
| | Director, Invesco Investment Advisers LLC | | |
| | (formerly known as Van Kampen Asset | | |
| | Management); Senior Vice President, Invesco | | |
| | Capital Markets, Inc. (formerly known as | | |
| | Van Kampen Funds Inc.); Manager, Invesco | | |
| | Indexing LLC; Manager, Invesco Specialized | | |
| | Products, LLC; Director and Senior Vice | | |
| | President, Invesco Insurance Agency, Inc.; | | |
| | Member, Invesco Canada Funds Advisory | | |
| | Board; Director, President and Chief Executive | | |
| | Officer, Invesco Corporate Class Inc. (corporate | | |
| | mutual fund company); and Director, | | |
| | Chairman, President and Chief Executive | | |
| | Officer, Invesco Canada Ltd. (formerly known | | |
| | as Invesco Trimark Ltd./Invesco Trimark Ltèe) | | |
| | (registered investment adviser and registered | | |
| | transfer agent) | | |
| | Formerly: Director and Senior Vice President, | | |
| | Invesco Management Group, Inc. (formerly | | |
| | known as Invesco AIM Management Group, | | |
| | Inc.); Secretary and General Counsel, Invesco | | |
| | Management Group, Inc. (formerly known | | |
| | as Invesco AIM Management Group, Inc.); | | |
| | Secretary, Invesco Investment Services, Inc. | | |
| | (formerly known as Invesco AIM Investment | | |
| | Services, Inc.); Chief Legal Officer and | | |
| | | | |
74 INVESCO INTERMEDIATE BOND FACTOR FUND

Name, Year of Birth and | Trustee | Principal Occupation(s) | Number of Funds | Other Directorship(s) |
Position(s) Held with the Trust | and/or | During Past 5 Years | in Fund Complex | Held by Trustee During |
| Officer | | Overseen by Trustee | Past 5 Years |
| Since | | | |
| | | | |
OFFICERS (CONTINUED) | | | | |
| | | | |
John M. Zerr (Continued) | | Secretary, The Invesco Funds; Secretary and | | |
| | General Counsel, Invesco Investment Advisers | | |
| | LLC (formerly known as Van Kampen Asset | | |
| | Management); Secretary and General Counsel, | | |
| | Invesco Capital Markets, Inc. (formerly known | | |
| | as Van Kampen Funds Inc.); Chief Legal | | |
| | Officer, Invesco Exchange-Traded Fund Trust, | | |
| | Invesco Exchange-Traded Fund Trust II, Invesco | | |
| | India Exchange-Traded Fund Trust, Invesco | | |
| | Actively Managed Exchange-Traded Fund | | |
| | Trust, Invesco Actively Managed Exchange- | | |
| | Traded Commodity Fund Trust and Invesco | | |
| | Exchange-Traded Self-Indexed Fund Trust; | | |
| | Secretary, Invesco Indexing LLC; Director, | | |
| | Secretary, General Counsel and Senior Vice | | |
| | President, Van Kampen Exchange Corp.; | | |
| | Director, Vice President and Secretary, IVZ | | |
| | Distributors, Inc. (formerly known as INVESCO | | |
| | Distributors, Inc.); Director and Vice President, | | |
| | INVESCO Funds Group, Inc.; Director and Vice | | |
| | President, Van Kampen Advisors Inc.; Director, | | |
| | Vice President, Secretary and General Counsel, | | |
| | Van Kampen Investor Services Inc.; Director | | |
| | and Secretary, Invesco Distributors, Inc. | | |
| | (formerly known as Invesco AIM Distributors, | | |
| | Inc.); Director, Senior Vice President, General | | |
| | Counsel and Secretary, Invesco AIM Advisers, | | |
| | Inc. and Van Kampen Investments Inc.; | | |
| | Director, Vice President and Secretary, Fund | | |
| | Management Company; Director, Senior Vice | | |
| | President, Secretary, General Counsel and Vice | | |
| | President, Invesco AIM Capital Management, | | |
| | Inc.; Chief Operating Officer and General | | |
| | Counsel, Liberty Ridge Capital, Inc. (an | | |
| | investment adviser) | | |
| | | | |
Gregory G. McGreevey - 1962 | 2012 | Senior Managing Director, Invesco Ltd.; | N/A | N/A |
Senior Vice President | | Director, Chairman, President, and Chief | | |
| | Executive Officer, Invesco Advisers, Inc. | | |
| | (formerly known as Invesco Institutional | | |
| | (N.A.), Inc.) (registered investment adviser); | | |
| | Director, Invesco Mortgage Capital, Inc. and | | |
| | Invesco Senior Secured Management, Inc.; | | |
| | and Senior Vice President, The Invesco Funds; | | |
| | and President, SNW Asset Management | | |
| | Corporation and Invesco Managed Accounts, | | |
| | LLC | | |
| | Formerly: Senior Vice President, Invesco | | |
| | | | |
75 INVESCO INTERMEDIATE BOND FACTOR FUND

TRUSTEES AND OFFICERS Continued
Name, Year of Birth and | Trustee | Principal Occupation(s) | Number of Funds | Other Directorship(s) |
Position(s) Held with the Trust | and/or | During Past 5 Years | in Fund Complex | Held by Trustee During |
| Officer | | Overseen by Trustee | Past 5 Years |
| Since | | | |
| | | | |
OFFICERS (CONTINUED) | | | | |
| | | | |
Gregory G. McGreevey | | Management Group, Inc. and Invesco Advisers, | | |
(Continued) | | Inc.; Assistant Vice President, The Invesco | | |
| | Funds | | |
| | | | |
Kelli Gallegos – 1970 | 2008 | Principal Financial and Accounting Officer | N/A | N/A |
Vice President, Principal | | – Investments Pool, Invesco Specialized | | |
Financial Officer and Assistant | | Products, LLC; Vice President, Principal | | |
Treasurer | | Financial Officer and Assistant Treasurer, | | |
| | The Invesco Funds; Principal Financial and | | |
| | Accounting Officer – Pooled Investments, | | |
| | Invesco Capital Management LLC; Vice | | |
| | President and Treasurer, Invesco Exchange- | | |
| | Traded Fund Trust, Invesco Exchange-Traded | | |
| | Fund Trust II, Invesco India Exchange-Traded | | |
| | Fund Trust, Invesco Actively Managed | | |
| | Exchange-Traded Fund Trust, Invesco Actively | | |
| | Managed Exchange-Traded Commodity Fund | | |
| | Trust and Invesco Exchange-Traded Self- | | |
| | Indexed Fund Trust; Vice President, Invesco | | |
| | Advisers, Inc. | | |
| | Formerly: Assistant Treasurer, Invesco | | |
| | Specialized Products, LLC; Assistant Treasurer, | | |
| | Invesco Exchange-Traded Fund Trust, Invesco | | |
| | Exchange-Traded Fund Trust II, Invesco India | | |
| | Exchange-Traded Fund Trust, Invesco Actively | | |
| | Managed Exchange-Traded Fund Trust, | | |
| | Invesco Actively Managed Exchange-Traded | | |
| | Commodity Fund Trust and Invesco Exchange- | | |
| | Traded Self-Indexed Fund Trust; Assistant | | |
| | Treasurer, Invesco Capital Management LLC; | | |
| | Assistant Vice President, The Invesco Funds | | |
| | | | |
Crissie M. Wisdom – 1969 | 2013 | Anti-Money Laundering and OFAC Compliance | N/A | N/A |
Anti-Money Laundering | | Officer for Invesco U.S. entities including; | | |
Compliance Officer | | Invesco Advisers, Inc. and its affiliates, Invesco | | |
| | Capital Markets, Inc., Invesco Distributors, Inc., | | |
| | Invesco Investment Services, Inc., The Invesco | | |
| | Funds, Invesco Capital Management, LLC, | | |
| | Invesco Trust Company; and Fraud Prevention | | |
| | Manager for Invesco Investment Services, Inc. | | |
| | | | |
Robert R. Leveille – 1969 | 2016 | Chief Compliance Officer, Invesco Advisers, | N/A | N/A |
Chief Compliance Officer | | Inc. (registered investment adviser); and Chief | | |
| | Compliance Officer, The Invesco Funds | | |
| | Formerly: Chief Compliance Officer, Putnam | | |
| | Investments and the Putnam Funds | | |
| | | | |
76 INVESCO INTERMEDIATE BOND FACTOR FUND
The Statement of Additional Information of the Trust includes additional information about the Fund's Trustees and is available upon request, without charge, by calling 1.800.959.4246. Please refer to the Fund's Statement of Additional Information for information on the Fund's sub-advisers.
Office of the Fund | Investment Adviser | Distributor | Auditors |
11 Greenway Plaza, | Invesco Advisers, Inc. | Invesco Distributors, Inc. | PricewaterhouseCoopers |
Suite 1000 | 1555 Peachtree Street, N.E. | 11 Greenway Plaza, | LLP |
Houston, TX 77046-1173 | Atlanta, GA 30309 | Suite 1000 | 1000 Louisiana Street, |
| | Houston, TX | Suite 5800 |
| | 77046-1173 | Houston, TX 77002-5021 |
Counsel to the Fund | Counsel to the | Transfer Agent | Custodian |
Stradley Ronon Stevens & Young, | Independent Trustees | Invesco Investment | JPMorgan Chase Bank |
LLP | Goodwin Procter LLP | Services, Inc. | 4 Chase Metro Tech |
2005 Market Street, | 901 New York Avenue, N.W. | 11 Greenway Plaza, | Center |
Suite 2600 | Washington, D.C. 20001 | Suite 1000 | Brooklyn, NY 11245 |
Philadelphia, PA 19103-7018 | | Houston, TX | |
| | 77046-1173 | |
77 INVESCO INTERMEDIATE BOND FACTOR FUND
INVESCO'S PRIVACY NOTICE
Invesco recognizes the importance of protecting your personal and financial information when you visit our website located at www.invesco.com (the "Website"). The following information is designed to help you understand the information collection practices at this Website. We will not sell, share or rent your personally identifiable information to others in contravention of this Privacy Policy. When we refer to ourselves as "we" or "Invesco" in this Privacy Policy, we mean our entire company including our affiliates, such as subsidiaries.
By visiting this Website, you are accepting the practices described in this Privacy Policy. If you do not agree to this policy, you may not use this Website. This Privacy Policy is subject to change without notice, from time to time in our sole discretion. You acknowledge that by accessing the Website after we have posted changes to this Privacy Policy, you are agreeing to this Privacy Policy as modified. Please review
the Terms of Use1 to learn of other terms and conditions applicable to your use of the Website.
Please note that this Privacy Policy is not an exclusive statement of our privacy principles across all products and services. Other privacy principles or policies may apply depending on the products or services you obtain from Invesco, or the jurisdiction in which you transact with Invesco.
This Privacy Policy was last updated on May 6, 2018.
Information We Collect and Use
We collect personal information you choose to submit to the Website in order to process transactions requested by you and meet our contractual obligations. For example, you can choose to provide your name, contact information, social security number, or tax identification number in connection with accessing your account, or you can choose to provide your personal information when you fill out a secure account question form. Any information collected about you from the Website can, from time to time, be associated with other identifying information we have about you.
In addition, we may gather information about you automatically through your use of the Website, e.g. your IP address, how you navigate the Website, the organization from which you are accessing the Website, and the websites that you access before and after you visit the Website.
When you access the Website, we may also collect information such as unique device identifiers, your screen resolution and other device settings, information about your location, and analytical information about how you use the device from which you are viewing the Website. Where applicable, we may ask your permission before collecting certain information, such as precise geolocation information.
From time to time, we use or augment the personal information we have about you with information obtained from third parties. For example, we use third party information to confirm contact or financial information or to better understand your interests by associating demographic information from third parties with the information you have provided.
How We Use Personal Information
We use your personal information to respond to your inquiries and provide the products and services you request. We also use your information from time to time to deliver the content and services we believe
1NTD
78 INVESCO INTERMEDIATE BOND FACTOR FUND
you will find the most relevant and to provide customer service and support.
We also use the information you provide to further develop and improve our products and services. We aggregate and/or de-identify data about visitors to the Website for various business purposes including product and service development and improvement activities.
How We Share Personal Information
We collaborate with other companies and individuals to perform services for us and on our behalf and we collaborate with our affiliates, other companies and individuals with respect to particular products or services ("Providers"). Examples of Providers include data analysis firms, customer service and support providers, email and SMS vendors, and web-hosting and development companies. Some Providers collect information for us or on our behalf on our Website. These Providers can be provided with access to personal information needed to perform their functions.
We reserve the right to disclose your personal information as required by law, when we believe disclosure is necessary to comply with a regulatory requirement, judicial proceeding, court order or legal process served on us, to protect the safety, rights or property of our customers, the public or Invesco or to enforce the Terms of Use.
If we sell or transfer a business unit (such as a subsidiary) or an asset (such as a website) to another company, we will share your personal information with such company. You will receive notice of such an event and the new entity will inform you of any changes to the practices in this Privacy Policy. If the new entity wishes to make additional use of your information, you have the right to decline such use at that time.
We occasionally disclose aggregate or de-identified data that is not personally identifiable with third parties.
Cookies and Other Tools
Invesco and its Providers collect information about you by using cookies, tracking pixels and other technologies. We use this information to better understand, customize and improve user experience with our websites, services and offerings as well as to manage our advertising. For example, we use web analytics services that use these technologies to gather information to help us understand how visitors engage with and navigate our Website, e.g., how and when pages in a site are visited and by how many visitors. We are also able to offer our visitors a more customized, relevant experience on our sites using these technologies by delivering content and functionality based on your preferences and interests.
Depending on their purpose, some cookies will only operate for the length of a single browsing session, while others have a longer life span to ensure that they fulfill their longer-term purposes. Your web browser can be set to allow you to control whether you will accept cookies or reject cookies, to notify you each time a cookie is sent to your browser, or to delete cookies that have already been set. If your browser is set to reject cookies, certain aspects of the Website that are cookie-enabled will not recognize you when you return to the website, and some Website functionality may be lost. The "Help" section of your browser may tell you how to prevent your browser from accepting cookies. To find out more about cookies, visit www.aboutcookies.org.
79 INVESCO INTERMEDIATE BOND FACTOR FUND
INVESCO'S PRIVACY NOTICE Continued
Security
No data transmission over the internet can be 100% secure, so Invesco cannot ensure or warrant the security of any information you submit to us on this Website. However, Invesco seeks to protect your personal information from unauthorized access or use when you transact business on our Website using technical, administrative and procedural measures. Invesco makes no representation as to the reasonableness, efficacy, or appropriateness of the measures we use to safeguard such information.
Users are responsible for maintaining the secrecy of their own passwords. If you have reason to believe that your interaction with us is no longer secure (for example, if you feel that the security of any account you might have with us has been compromised), please immediately notify us by contacting us as specified below.
Transfer of Data to Other Countries
Any information you provide to Invesco through use of the Website may be stored and processed, transferred between and accessed from the United States, Canada and other countries which do not guarantee the same level of protection of personal information as the one in which you reside. However, Invesco will handle your personal information in accordance with this Privacy Policy regardless of where your personal information is stored/accessed.
Children's Privacy
We are committed to protecting the privacy of children. We do not knowingly collect personal information from children under the age of 18. If you are under the age of 18, do not provide us with any personal information.
Contact Us
Please contact us if you have any questions or concerns about your personal information or require assistance in managing your choices.
Invesco Ltd.
1555 Peachtree St. NE Atlanta, GA 30309 By phone:
(404)439-3236 By fax:
(404)962-8288 By email: Anne.Gerry@invesco.com
Please update your account information by logging in or contact us by email or telephone as specified above to update your account information whenever such information ceases to be complete or accurate.
You may also contact us to:
80 INVESCO INTERMEDIATE BOND FACTOR FUND
•Request that we amend, rectify, delete or update the personal data we hold about you;
•Where possible (e.g. in relation to marketing) amend or update your choices around processing;
•Request a copy of personal data held by us.
Disclaimer
Where the Website contains links to third-party websites/content/services that are not owned or controlled by Invesco, Invesco is not responsible for how these properties operate or treat your personal information so we recommend that you read the privacy policies and terms associated with these third party properties carefully.
81 INVESCO INTERMEDIATE BOND FACTOR FUND
THIS PAGE INTENTIONALLY LEFT BLANK.
THIS PAGE INTENTIONALLY LEFT BLANK.
THIS PAGE INTENTIONALLY LEFT BLANK.
THIS PAGE INTENTIONALLY LEFT BLANK.
THIS PAGE INTENTIONALLY LEFT BLANK.
THIS PAGE INTENTIONALLY LEFT BLANK.
Explore High-Conviction Investing with Invesco
Go paperless with eDelivery
Visit invesco.com/edelivery to enjoy the convenience and security of anytime electronic access to your investment documents.
With eDelivery, you can elect to have any or all of the following materials delivered straight to your inbox to download, save and print from your own computer:
Fund reports and prospectuses
Quarterly statements
Daily confirmations
Tax forms
Invesco mailing information
Send general correspondence to Invesco Investment Services, Inc., P.O. Box 219078, Kansas City, MO 64121-9078.
| | | | |
| | | | |
| | | | |
Invesco Distributors, Inc. | O-INTI-AR-1 04302020 |
ITEM 2. CODE OF ETHICS.
There were no amendments to the Code of Ethics (the "Code") that applies to the Registrant's Principal Executive Officer ("PEO") and Principal Financial Officer ("PFO") during the period covered by the report. The Registrant did not grant any waivers, including implicit waivers, from any provisions of the Code to the PEO or PFO during the period covered by this report.
ITEM 3. AUDIT COMMITTEE FINANCIAL EXPERT.
The Board of Trustees has determined that the Registrant has at least one audit committee financial expert serving on its Audit Committee. The Audit Committee financial experts are David C. Arch, Bruce L. Crockett, Cynthia Hostetler, Elizabeth Krentzman, Anthony J. LaCava, Jr., Teresa M. Ressel, Jr., Robert C. Troccoli and James Vaughn. David C. Arch, Bruce L. Crockett, Cynthia Hostetler, Elizabeth Krentzman, Anthony J. LaCava, Jr., Teresa M. Ressel, Jr., Robert C. Troccoli and James Vaughn are "independent" within the meaning of that term as used in Form N-CSR.
ITEM 4. PRINCIPAL ACCOUNTANT FEES AND SERVICES.
During the reporting period, PricewaterhouseCoopers LLC ("PwC") advised the Audit Committee of the following matters for consideration under the SEC's auditor independence rules. PwC advised the Audit Committee that a PwC Director, a PwC Manager and a PwC Senior Associate each held financial interests in investment companies within the Invesco Fund Complex that were inconsistent with the requirements of Rule 2-01(c)(1) of Regulation S-X. PwC noted, among other things, that during the time of its audit, the engagement team was not aware of the investments, (or with respect to the PwC Senior Associate was not aware until after the investments were confirmed as SEC exceptions), the individuals were not in the chain of command of the audit or the audit partners of Invesco or the affiliate of the Registrant, the services each individual provided were not relied upon by the audit engagement team with respect to the audit of the Registrant or its affiliates (or with respect to the PwC Senior Associate, the services were performed by an individual who did not have decision-making responsibility for matters that materially affected the audit and were reviewed by team members at least two levels higher than the PwC Senior Associate), and the investments were not material to the net worth of each individual or their respective immediate family members which PwC considered in reaching its conclusion. PwC advised the Audit Committee that it believes its objectivity and impartiality had not been adversely affected by these matters as they related to the audit of the Registrant.
On May 24, 2019, certain investment advisor subsidiaries of Invesco Ltd. assumed management responsibility from Oppenheimer Funds, Inc. ("OFI") for 83 open-end mutual funds and 20 exchange- traded funds (collectively, the "Oppenheimer Funds"). Assumption of management responsibility for the Oppenheimer Funds was accomplished through the reorganization of each Oppenheimer Fund into a new Invesco shell fund (collectively, the "New Invesco Funds") that did not have pre-existing assets (together, the "Reorganizations"). The Reorganizations were part of the acquisition by Invesco Ltd. (together with its subsidiaries, "Invesco") of the asset management business of OFI (including the Oppenheimer Funds) from Massachusetts Mutual Life Insurance Company ("MassMutual"), which was also consummated on May 24, 2019 (the "Acquisition"). Subsequent to the Acquisition, MassMutual became a significant shareholder of Invesco, and the Invesco Ltd. board of directors expanded by one director with the addition of a director selected by MassMutual.
Prior to the consummation of the Acquisition and the Reorganizations on May 24, 2019, PwC completed an independence assessment to evaluate the services and relationships with OFI and its affiliates, which became affiliates of Invesco upon the closing of the Acquisition. The assessment identified the following relationship and services that are inconsistent with the auditor independence rules under Rule 2-01 of
Regulation S-X ("Rule 2-01") if provided to an affiliate of an audit client. A retired PwC partner who receives a benefit from PwC that is not fully funded, served as a member of Audit Committee of the Boards of Trustees of certain Oppenheimer Funds prior to the Acquisition (the "Pre-Reorganization Relationship"). Additionally, PwC provided certain non-audit services including, expert legal services to one Oppenheimer Fund, custody of client assets in connection with payroll services, a non-audit service performed pursuant to a success-based fee, non-audit services in which PwC acted as an advocate on behalf of a MassMutual foreign affiliate and certain employee activities undertaken in connection with the provision of non-audit services for MassMutual and certain MassMutual foreign affiliates (collectively, the "Pre-Reorganization Services").
PwC and the Audit Committees of the New Invesco Funds each considered the impact that the Pre- Reorganization Relationship and Services have on PwC's independence with respect to the New Invesco Funds. On the basis of the nature of the relationship and services performed, and in particular the mitigating factors described below, PwC concluded that a reasonable investor, possessing knowledge of all the relevant facts and circumstances regarding the Pre-Reorganization Relationship and Services, would conclude that the Pre-Reorganization Relationship and Services do not impair PwC's ability to exhibit the requisite objectivity and impartiality to report on the financial statements of the New Invesco Funds for the years ending May 31, 2019 – April 30, 2020 ("PwC's Conclusion").
The Audit Committees of the Boards of Trustees of the New Invesco Funds, based upon PwC's Conclusion and the concurrence of Invesco, considered the relevant facts and circumstances including the mitigating factors described below and, after careful consideration, concluded that PwC is capable of exercising objective and impartial judgment in connection with its audits of the financial statements of the New Invesco Funds that the respective Boards of Trustees oversees.
Mitigating factors that PwC and the Audit Committees considered in reaching their respective conclusions included, among others, the following factors:
∙none of the Pre-Reorganization Relationship or Services created a mutuality of interest between PwC and the New Invesco Funds;
∙PwC will not act in a management or employee capacity for the New Invesco Funds or their affiliates during any portion of PwC's professional engagement period;
∙other than the expert legal services, Pre-Reorganization Services that have been provided to OFI, MassMutual and their affiliates do not have any impact on the financial statements of the New Invesco Funds;
∙as it relates to the expert legal services, while the service provided by PwC related to litigation involving one Oppenheimer Fund, the impact of the litigation on the Oppenheimer Fund's financial statements was based upon OFI's decision, and OFI management represented that the PwC service was not considered a significant component of its decision;
∙while certain employees of OFI who were involved in the financial reporting process of the Oppenheimer Funds will be employed by Invesco subsequent to the Reorganizations, existing officers of other Invesco Funds will serve as Principal Executive Officer and Principal Financial Officer or equivalent roles for the New Invesco Funds, and are ultimately responsible for the accuracy of all financial statement assertions for the entirety of the financial reporting periods for the New Invesco Funds;
∙the Pre-Reorganization Services giving rise to the lack of independence were provided to, or entered into with, OFI, MassMutual and their affiliates at a time when PwC had no independence restriction with respect to these entities;
∙with the exception of the expert legal service provided to one Oppenheimer Fund, none of the Pre- Reorganization Services affected the operations or financial reporting of the New Invesco Funds;
∙the Pre-Reorganization Services provided by PwC to OFI, MassMutual and their affiliates were performed by persons who were not, and will not be, part of the audit engagement team for the New Invesco Funds; and
∙the fees associated with the Pre-Reorganization Services were not material to MassMutual, Invesco or PwC.
(a) to (d)
Fees Billed by PwC Related to the Registrant
PwC billed the Registrant aggregate fees for services rendered to the Registrant for the last two fiscal years as shown in the following table. The Audit Committee pre-approved all audit and non-audit services provided to the Registrant.
| | | Fees Billed for | Fees Billed for |
| Services Rendered to | Services Rendered to |
| | the Registrant for | the Registrant for |
| fiscal year end 2020 | fiscal year end 2019 |
Audit Fees | $ | 376,805 | $ | 293,575 |
Audit-Related Fees(1) | $ | 6,200 | $ | 0 | |
Tax Fees(2) | $ | 219,598 | $ | 60,350 |
All Other Fees | | $ | 0 | | | $ | 0 |
| | | | | | | | |
Total Fees | | $ | 602,603 | $ | 353,925 |
(1)Audit-Related Fees for the fiscal year end February 29, 2020 includes fees billed for reviewing regulatory filings.
(2)Tax Fees for the fiscal year end February 29, 2020 includes fees billed for preparation of U.S. Tax Returns and Taxable Income calculations, including excise tax and year-to-date estimates for various book-to-tax differences. Tax fees for fiscal year end February 28, 2019 includes fees billed for reviewing tax returns and/or services related to tax compliance.
Fees Billed by PwC Related to Invesco and Invesco Affiliates
PwC billed Invesco Advisers, Inc. ("Invesco"), the Registrant's adviser, and any entity controlling, controlled by or under common control with Invesco that provides ongoing services to the Registrant ("Invesco Affiliates") aggregate fees for pre-approved non-audit services rendered to Invesco and Invesco Affiliates for the last two fiscal years as shown in the following table. The Audit Committee pre-approved all non-audit services provided to Invesco and Invesco Affiliates that were required to be pre-approved.
| Fees Billed for Non- | | | | |
| Audit Services | Fees Billed for Non-Audit |
| Rendered to Invesco | Services Rendered to |
| and Invesco Affiliates | Invesco and Invesco |
| for fiscal year end | Affiliates for fiscal year |
| 2020 That Were | end 2019 That Were |
| | | Required | | | Required |
| to be Pre-Approved | to be Pre-Approved |
| by the Registrant's | by the Registrant's |
| Audit Committee | Audit Committee |
| | | | | | | | |
Audit-Related Fees(1) | $ | 690,000 | $ | 690,000 | |
Tax Fees | $ | 0 | | $ | 0 |
All Other Fees | | $ | 0 | | | $ | 0 |
| | | | | | | | |
Total Fees | $ | 690,000 | $ | 690,000 |
(1)Audit-Related Fees for the fiscal years ended 2020 and 2019 include fees billed related to reviewing controls at a service organization.
(e)(1)
PRE-APPROVAL OF AUDIT AND NON-AUDIT SERVICES
POLICIES AND PROCEDURES As adopted by the Audit Committees of the Invesco Funds (the "Funds")
Last Amended March 29, 2017
I.Statement of Principles
The Audit Committees (the "Audit Committee") of the Boards of Trustees of the Funds (the "Board") have adopted these policies and procedures (the "Procedures") with respect to the pre- approval of audit and non-audit services to be provided by the Funds' independent auditor (the "Auditor") to the Funds, and to the Funds' investment adviser(s) and any entity controlling, controlled by, or under common control with the investment adviser(s) that provides ongoing services to the Funds (collectively, "Service Affiliates").
Under Section 202 of the Sarbanes-Oxley Act of 2002, all audit and non-audit services provided to the Funds by the Auditor must be preapproved by the Audit Committee. Rule 2-01 of Regulation S-X requires that the Audit Committee also pre-approve a Service Affiliate's engagement of the Auditor for non-audit services if the engagement relates directly to the operations and financial reporting of the Funds (a "Service Affiliate's Covered Engagement").
These Procedures set forth the procedures and the conditions pursuant to which the Audit Committee may pre-approve audit and non-audit services for the Funds and a Service Affiliate's Covered Engagement pursuant to rules and regulations of the Securities and Exchange Commission ("SEC") and other organizations and regulatory bodies applicable to the Funds
("Applicable Rules").1 They address both general pre-approvals without consideration of specific case-by-case services ("general pre-approvals") and pre-approvals on a case-by-case basis ("specific pre-approvals"). Any services requiring pre-approval that are not within the scope of general pre-approvals hereunder are subject to specific pre-approval. These Procedures also address the delegation by the Audit Committee of pre-approval authority to the Audit Committee Chair or Vice Chair.
II.Pre-Approval of Fund Audit Services
The annual Fund audit services engagement, including terms and fees, is subject to specific pre- approval by the Audit Committee. Audit services include the annual financial statement audit and other procedures required to be performed by an independent auditor to be able to form an opinion on the Funds' financial statements. The Audit Committee will receive, review and consider sufficient information concerning a proposed Fund audit engagement to make a reasonable evaluation of the Auditor's qualifications and independence. The Audit Committee will oversee the Fund audit services engagement as necessary, including approving any changes in terms, audit scope, conditions and fees.
In addition to approving the Fund audit services engagement at least annually and specifically approving any changes, the Audit Committee may generally or specifically pre-approve engagements for other audit services, which are those services that only an independent auditor reasonably can provide. Other audit services may include services associated with SEC registration statements, periodic reports and other documents filed with the SEC.
III.General and Specific Pre-Approval of Non-Audit Fund Services
The Audit Committee will consider, at least annually, the list of General Pre-Approved Non- Audit Services which list may be terminated or modified at any time by the Audit Committee. To inform the Audit Committee's review and approval of General Pre-Approved Non-Audit Services, the Funds' Treasurer (or his or her designee) and Auditor shall provide such information regarding independence or other matters as the Audit Committee may request.
Any services or fee ranges that are not within the scope of General Pre-Approved Non-Audit Services have not received general pre-approval and require specific pre-approval. Each request for specific pre-approval by the Audit Committee for services to be provided by the Auditor to the Funds must be submitted to the Audit Committee by the Funds' Treasurer (or his or her designee) and must include detailed information about the services to be provided, the fees or fee ranges to be charged, and other relevant information sufficient to allow the Audit Committee to consider whether to pre-approve such engagement, including evaluating whether the provision of such services will impair the independence of the Auditor and is otherwise consistent with Applicable Rules.
1Applicable Rules include, for example, New York Stock Exchange ("NYSE") rules applicable to closed-end funds managed by Invesco and listed on NYSE.
IV. Non-Audit Service Types
The Audit Committee may provide either general or specific pre-approval of audit-related, tax or other services, each as described in more detail below.
a.Audit-Related Services
"Audit-related services" are assurance and related services that are reasonably related to the performance of the audit or review of the Fund's financial statements or that are traditionally performed by an independent auditor. Audit-related services include, among others, accounting consultations related to accounting, financial reporting or disclosure matters not classified as "Audit services"; assistance with understanding and implementing new accounting and financial reporting guidance from rulemaking authorities; services related to mergers, acquisitions or dispositions; compliance with ratings agency requirements and interfund lending activities; and assistance with internal control reporting requirements.
b.Tax Services
"Tax services" include, but are not limited to, the review and signing of the Funds' federal tax returns, the review of required distributions by the Funds and consultations regarding tax matters such as the tax treatment of new investments or the impact of new regulations. The Audit Committee will not approve proposed services of the Auditor which the Audit Committee believes are to be provided in connection with a service or transaction initially recommended by the Auditor, the sole business purpose of which may be tax avoidance and the tax treatment of which may not be supported in the Internal Revenue Code and related regulations. The Audit Committee will consult with the Funds' Treasurer (or his or her designee) and may consult with outside counsel or advisers as necessary to ensure the consistency of tax services rendered by the Auditor with the foregoing policy. The Auditor shall not represent any Fund or any Service Affiliate before a tax court, district court or federal court of claims.
Each request to provide tax services under either the general or specific pre-approval of the Audit Committee will include a description from the Auditor in writing of (i) the scope of the service, the fee structure for the engagement, and any side letter or other amendment to the engagement letter, or any other agreement (whether oral, written, or otherwise) between the Auditor and the Funds, relating to the service; and (ii) any compensation arrangement or other agreement, such as a referral agreement, a referral fee or fee-sharing arrangement, between the Auditor (or an affiliate of the Auditor) and any person (other than the Funds or Service Affiliates receiving the services) with respect to the promoting, marketing, or recommending of a transaction covered by the service. The Auditor will also discuss with the Audit Committee the potential effects of the services on the independence of the Auditor, and document the substance of its discussion with the Audit Committee.
c.Other Services
The Audit Committee may pre-approve other non-audit services so long as the Audit Committee believes that the service will not impair the independence of the Auditor. Appendix I includes a list of services that the Auditor is prohibited from performing by the SEC rules. Appendix I also
includes a list of services that would impair the Auditor's independence unless the Audit Committee reasonably concludes that the results of the services will not be subject to audit procedures during an audit of the Funds' financial statements.
V.Pre-Approval of Service Affiliate's Covered Engagements
Rule 2-01 of Regulation S-X requires that the Audit Committee pre-approve a Service Affiliate's engagement of the Auditor for non-audit services if the engagement relates directly to the operations and financial reporting of the Funds, defined above as a "Service Affiliate's Covered Engagement".
The Audit Committee may provide either general or specific pre-approval of any Service Affiliate's Covered Engagement, including for audit-related, tax or other services, as described above, if the Audit Committee believes that the provision of the services to a Service Affiliate will not impair the independence of the Auditor with respect to the Funds. Any Service Affiliate's Covered Engagements that are not within the scope of General Pre-Approved Non- Audit Services have not received general pre-approval and require specific pre-approval.
Each request for specific pre-approval by the Audit Committee of a Service Affiliate's Covered Engagement must be submitted to the Audit Committee by the Funds' Treasurer (or his or her designee) and must include detailed information about the services to be provided, the fees or fee ranges to be charged, a description of the current status of the pre-approval process involving other audit committees in the Invesco investment company complex (as defined in Rule 2-201 of Regulation S-X) with respect to the proposed engagement, and other relevant information sufficient to allow the Audit Committee to consider whether the provision of such services will impair the independence of the Auditor from the Funds. Additionally, the Funds' Treasurer (or his or her designee) and the Auditor will provide the Audit Committee with a statement that the proposed engagement requires pre-approval by the Audit Committee, the proposed engagement, in their view, will not impair the independence of the Auditor and is consistent with Applicable Rules, and the description of the proposed engagement provided to the Audit Committee is consistent with that presented to or approved by the Invesco audit committee.
Information about all Service Affiliate engagements of the Auditor for non-audit services, whether or not subject to pre-approval by the Audit Committee, shall be provided to the Audit Committee at least quarterly, to allow the Audit Committee to consider whether the provision of such services is compatible with maintaining the Auditor's independence from the Funds. The Funds' Treasurer and Auditor shall provide the Audit Committee with sufficiently detailed information about the scope of services provided and the fees for such services, to ensure that the Audit Committee can adequately consider whether the provision of such services is compatible with maintaining the Auditor's independence from the Funds.
VI. Pre-Approved Fee Levels or Established Amounts
Pre-approved fee levels or ranges for audit and non-audit services to be provided by the Auditor to the Funds, and for a Service Affiliate's Covered Engagement, under general pre-approval or specific pre-approval will be set periodically by the Audit Committee. Any proposed fees
exceeding 110% of the maximum pre-approved fee levels or ranges for such services or engagements will be promptly presented to the Audit Committee and will require specific pre- approval by the Audit Committee before payment of any additional fees is made.
VII. Delegation
The Audit Committee hereby delegates, subject to the dollar limitations set forth below, specific authority to its Chair, or in his or her absence, Vice Chair, to pre-approve audit and non-audit services proposed to be provided by the Auditor to the Funds and/or a Service Affiliate's Covered Engagement, between Audit Committee meetings. Such delegation does not preclude the Chair or Vice Chair from declining, on a case by case basis, to exercise his or her delegated authority and instead convening the Audit Committee to consider and pre-approve any proposed services or engagements.
Notwithstanding the foregoing, the Audit Committee must pre-approve: (a) any non-audit services to be provided to the Funds for which the fees are estimated to exceed $500,000; (b) any Service Affiliate's Covered Engagement for which the fees are estimated to exceed $500,000; or
(c)any cost increase to any previously approved service or engagement that exceeds the greater of $250,000 or 50% of the previously approved fees up to a maximum increase of $500,000.
VIII. Compliance with Procedures
Notwithstanding anything herein to the contrary, failure to pre-approve any services or engagements that are not required to be pre-approved pursuant to the de minimis exception provided for in Rule 2-01(c)(7)(i)(C) of Regulation S-X shall not constitute a violation of these Procedures. The Audit Committee has designated the Funds' Treasurer to ensure services and engagements are pre-approved in compliance with these Procedures. The Funds' Treasurer will immediately report to the Chair of the Audit Committee, or the Vice Chair in his or her absence, any breach of these Procedures that comes to the attention of the Funds' Treasurer or any services or engagements that are not required to be pre-approved pursuant to the de minimis exception provided for in Rule 2-01(c)(7)(i)(C) of Regulation S-X.
On at least an annual basis, the Auditor will provide the Audit Committee with a summary of all non-audit services provided to any entity in the investment company complex (as defined in section 2-01(f)(14) of Regulation S-X, including the Funds and Service Affiliates) that were not pre-approved, including the nature of services provided and the associated fees.
IX. Amendments to Procedures
All material amendments to these Procedures must be approved in advance by the Audit Committee. Non-material amendments to these Procedures may be made by the Legal and Compliance Departments and will be reported to the Audit Committee at the next regularly scheduled meeting of the Audit Committee.
Appendix I
Non-Audit Services That May Impair the Auditor's Independence
The Auditor is not independent if, at any point during the audit and professional engagement, the Auditor provides the following non-audit services:
∙Management functions;
∙Human resources;
∙Broker-dealer, investment adviser, or investment banking services ;
∙Legal services;
∙Expert services unrelated to the audit;
∙Any service or product provided for a contingent fee or a commission;
∙Services related to marketing, planning, or opining in favor of the tax treatment of confidential transactions or aggressive tax position transactions, a significant purpose of which is tax avoidance;
∙Tax services for persons in financial reporting oversight roles at the Fund; and
∙Any other service that the Public Company Oversight Board determines by regulation is impermissible.
An Auditor is not independent if, at any point during the audit and professional engagement, the Auditor provides the following non-audit services unless it is reasonable to conclude that the results of the services will not be subject to audit procedures during an audit of the Funds' financial statements:
∙Bookkeeping or other services related to the accounting records or financial statements of the audit client;
∙Financial information systems design and implementation;
∙Appraisal or valuation services, fairness opinions, or contribution-in-kind reports;
∙Actuarial services; and
∙Internal audit outsourcing services.
(e)(2) There were no amounts that were pre-approved by the Audit Committee pursuant to the de minimus exception under Rule 2-01 of Regulation S-X.
(f)Not applicable.
(g)In addition to the amounts shown in the tables above, PwC billed Invesco and Invesco Affiliates aggregate fees of $4,089,000 for the fiscal year ended February 29, 2020 and $3,550,000 for the fiscal year ended February 28, 2019 for non-audit services not required to be pre-approved by the Registrant's Audit Committee. In total, PwC billed the Registrant, Invesco and Invesco Affiliates aggregate non-audit fees of $4,998,598 for the fiscal year ended February 29, 2020 and $4,300,350 for the fiscal year ended February 28, 2019.
PwC provided audit services to the Investment Company complex of approximately $33 million.
(h)The Audit Committee also has considered whether the provision of non-audit services that were rendered to Invesco and Invesco Affiliates that were not required to be pre-approved pursuant to SEC regulations, if any, is compatible with maintaining PwC's independence.
ITEM 5. AUDIT COMMITTEE OF LISTED REGISTRANTS.
Not applicable.
ITEM 6. SCHEDULE OF INVESTMENTS.
Investments in securities of unaffiliated issuers is included as part of the reports to stockholders filed under Item 1 of this Form.
ITEM 7. DISCLOSURE OF PROXY VOTING POLICIES AND PROCEDURES FOR CLOSED- END MANAGEMENT INVESTMENT COMPANIES.
Not applicable.
ITEM 8. PORTFOLIO MANAGERS OF CLOSED-END MANAGEMENT COMPANIES.
Not applicable.
ITEM 9. PURCHASES OF EQUITY SECURITIES BY CLOSED-END MANAGEMENT INVESTMENT COMPANY AND AFFILIATED PURCHASERS.
Not applicable.
ITEM 10. SUBMISSION OF MATTERS TO A VOTE OF SECURITY HOLDERS.
None
ITEM 11. CONTROLS AND PROCEDURES.
(a)As of April 14, 2020, an evaluation was performed under the supervision and with the participation of the officers of the Registrant, including the PEO and PFO, to assess the effectiveness of the Registrant's disclosure controls and procedures, as that term is defined in Rule 30a-3(c) under the Investment Company Act of 1940 (the "Act"), as amended. Based on that evaluation, the Registrant's officers, including the PEO and PFO, concluded that, as of April 14, 2020, the Registrant's disclosure controls and procedures were reasonably designed to ensure:
(1)that information required to be disclosed by the Registrant on Form N-CSR is recorded, processed, summarized and reported within the time periods specified by the rules and forms of the Securities and Exchange Commission; and (2) that material information relating to the Registrant is made known to the PEO and PFO as appropriate to allow timely decisions regarding required disclosure.
(b)There have been no changes in the Registrant's internal control over financial reporting (as defined in Rule 30a-3(d) under the Act) that occurred during the period covered by this report that have materially affected, or are reasonably likely to materially affect, the Registrant's internal control over financial reporting.
ITEM 12. DISCLOSURE OF SECURITIES LENDING ACTIVITIES FOR CLOSED-END MANAGEMENT INVESTMENT COMPANIES.
Not applicable.
SIGNATURES
Pursuant to the requirements of the Securities Exchange Act of 1934 and the Investment Company Act of 1940, the Registrant has duly caused this report to be signed on its behalf by the undersigned, thereunto duly authorized.
Registrant: AIM Investment Securities Funds (Invesco Investment Securities Funds)
By: | /s/ Sheri Morris |
| Sheri Morris |
| Principal Executive Officer |
Date: | May 6, 2020 |
Pursuant to the requirements of the Securities and Exchange Act of 1934 and the Investment Company Act of 1940, this report has been signed below by the following persons on behalf of the Registrant and in the capacities and on the dates indicated.
By: | /s/ Sheri Morris |
| Sheri Morris |
| Principal Executive Officer |
Date: | May 6, 2020 |
By: | /s/ Kelli Gallegos |
| Kelli Gallegos |
| Principal Financial Officer |
Date: | May 6, 2020 |