| UNITED STATES | ||
| SECURITIES AND EXCHANGE COMMISSION | ||
| Washington, D.C. 20549 | ||
| FORM N-CSR | ||
| CERTIFIED SHAREHOLDER REPORT OF REGISTERED | ||
| MANAGEMENT INVESTMENT COMPANIES | ||
| Investment Company Act file number: (811- 02742) | ||
| Exact name of registrant as specified in charter: Putnam Europe Equity Fund | ||
| Address of principal executive offices: One Post Office Square, Boston, Massachusetts 02109 | ||
| Name and address of agent for service: | Beth S. Mazor, Vice President | |
| One Post Office Square | ||
| Boston, Massachusetts 02109 | ||
| Copy to: | John W. Gerstmayr, Esq. | |
| Ropes & Gray LLP | ||
| One International Place | ||
| Boston, Massachusetts 02110 | ||
| Registrant’s telephone number, including area code: | (617) 292-1000 | |
| Date of fiscal year end: June 30, 2008 | ||
| Date of reporting period: July 1, 2007— June 30, 2008 | ||
Item 1. Report to Stockholders:
The following is a copy of the report transmitted to stockholders pursuant to Rule 30e-1 under the Investment Company Act of 1940:
What makes Putnam different?
A time-honored tradition in money management
Since 1937, our values have been rooted in a profound sense of responsibility for the money entrusted to us.
A prudent approach to investing
We use a research-driven team approach to seek consistent, dependable, superior investment results over time, although there is no guarantee a fund will meet its objectives.
Funds for every investment goal
We offer a broad range of mutual funds and other financial products so investors and their financial representatives can build diversified portfolios.
A commitment to doing what’s right for investors
With a focus on investment performance, below-average expenses, and in-depth information about our funds, we put the interests of investors first and seek to set the standard for integrity and service.
Industry-leading service
We help investors, along with their financial representatives, make informed investment decisions with confidence.

In 1830, Massachusetts Supreme Judicial Court Justice Samuel Putnam established The Prudent Man Rule, a legal foundation for responsible money management.
THE PRUDENT MAN RULE
All that can be required of a trustee to invest is that he shall conduct himself faithfully and exercise a sound discretion. He is to observe how men of prudence, discretion, and intelligence manage their own affairs, not in regard to speculation, but in regard to the permanent disposition of their funds, considering the probable income, as well as the probable safety of the capital to be invested.

Putnam
Europe Equity
Fund
6 | 30 | 08
Annual Report
| Message from the Trustees | 1 |
| About the fund | 2 |
| Performance and portfolio snapshots | 4 |
| Interview with your fund’s Portfolio Team | 5 |
| Performance in depth | 9 |
| Expenses | 11 |
| Portfolio turnover | 13 |
| Risk | 13 |
| Your fund’s management | 14 |
| Terms and definitions | 15 |
| Trustee approval of management contract | 16 |
| Other information for shareholders | 19 |
| Financial statements | 20 |
| Federal tax information | 32 |
| Brokerage commissions | 32 |
| About the Trustees | 33 |
| Officers | 36 |
Cover photograph: © Marco Cristofori
Message from the Trustees
Dear Fellow Shareholder:
The past several months have presented the economy with a serious set of challenges, and financial markets have responded with losses across a wide range of sectors globally. It is always unsettling to see the markets and one’s investment returns declining. Times like these are a reminder of why it is important to keep a long-term perspective, to ensure that your portfolio is well diversified, and to seek the counsel of your financial representative.
At Putnam, we continually strive to offer the best investment returns, innovative products, and award-winning service to our shareholders. In keeping with this tradition, we have some important and exciting news to share with you. We are pleased to announce that Robert L. Reynolds, a well-known leader and visionary in the mutual fund industry, has joined the Putnam leadership team as President and Chief Executive Officer of Putnam Investments, effective July 1, 2008. Charles E. Haldeman, former President and CEO, will take on the role of Chairman of Putnam Investment Management, LLC, the firm’s fund management company.
Mr. Reynolds brings to Putnam substantial industry experience and an outstanding record of success. He was Vice Chairman and Chief Operating Officer at Fidelity Investments from 2000 to 2007, and President of Fidelity’s Institutional Retirement Group from 1996 to 2000. We look forward to working with Bob as we continue to position Putnam to exceed our shareholders’ expectations.
Starting this month, we have changed the portfolio manager’s commentary in this report to a question-and-answer format. We feel this new approach makes the information more accessible and readable, and we hope you think so as well.
We would also like to take this opportunity to welcome new shareholders to the fund and to thank all of our investors for your continued confidence in Putnam.

About the fund
Pursuing growth in European markets
As a shareholder of Putnam Europe Equity Fund, you are positioning some of your money to potentially benefit from opportunities in one of the world’s most advanced economies.
While international investing involves additional risks, Europe has a long history of capitalism and stock investing, and the region continues to evolve. Today, the 27 member states of the European Union, with approximately 500 million people, form a large, integrated economy that exports more goods and services than any nation in the world.
With these advantages, it is not surprising that European companies are leaders in many business sectors, including health care, telecommunications, and basic materials. If you look at the products or services you use every day — from pharmaceuticals to cell phones to household products — you are likely to find many items made by European companies.
At the macroeconomic level, European stocks can offer diversification to U.S. investors because Europe can follow a different business cycle than the United States. In Europe, interest rates and monetary policy are not set by the U.S. Federal Reserve Board, but by the European Central Bank, the Bank of England, and other central banks. While different economic systems, political developments, and currencies like the euro, the British pound, and the Swiss franc can add risk, they also provide diversification for U.S.-based investors. Though international markets can experience downturns, investing internationally gives you a chance to keep building wealth even if U.S. stocks struggle.
For over 17 years, Putnam Europe Equity Fund has served investors by seeking to invest in attractively valued companies across European markets. Pursuing Putnam’s “blend” strategy, the fund’s management team targets stocks believed to be worth more than their current stock prices indicate, and seeks to perform well when either growth- or value-style stocks lead international markets. The team selects stocks and determines market and sector weightings by relying in part on the proprietary research of Putnam analysts and team members based in both Boston and London.
International investing involves certain risks, such as currency fluctuations, economic instability, and political developments. Additional risks may be associated with emerging-market securities, including illiquidity and volatility. The fund invests some or all of its assets in small and/or midsize companies. Such investments increase the risk of fluctuations in the value of your investment. The fund concentrates its investments by region and involves more risk than a fund that invests more broadly. While diversification can help protect your returns from excessive volatility, it cannot protect against market losses.
In-depth analysis is key to successful stock selection.
Drawing on the expertise of a dedicated team of stock analysts, the fund’s management team seeks stocks that are believed to be underpriced by the market. Once a stock is selected for the portfolio, it is regularly assessed by members of the team to ensure that it continues to meet their criteria, including:
Quality They look for high-quality companies, seeking characteristics such as solid management teams and sound business models that create strong cash flows.
Valuation They carefully consider how each stock is valued, seeking stocks whose valuations are attractive relative to the company’s growth potential and capital requirements.
Cash flow They examine each company’s financials, particularly the amount of cash a company generates relative to the earnings that it reports, believing this is a better way to compare stocks.
Changes in the world and Europe’s regional economy have added to the investment
potential of European companies since Putnam Europe Equity Fund launched in 1990.

Performance and portfolio snapshots
Average annual total return (%) comparison as of 6/30/08
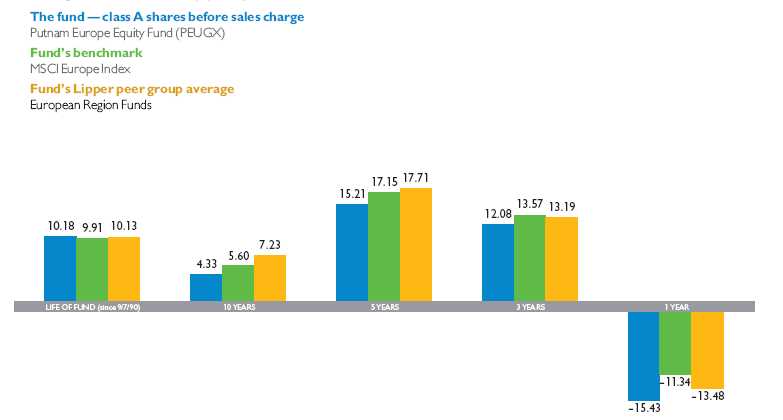
Current performance may be lower or higher than the quoted past performance, which cannot guarantee future results. Share price, principal value, and return will fluctuate, and you may have a gain or a loss when you sell your shares. Performance of class A shares assumes reinvestment of distributions and does not account for taxes. Fund returns in the bar chart do not reflect asales charge of 5.75%; had they, returns would have been lower. See pages 5 and 9–10 for additional performance information. For a portion of the periods, this fund may have limited expenses, without which returns would have been lower. A 1% short-term trading fee may apply. To obtain the most recent month-end performance, visit www.putnam.com.
“A more defensive portfolio positioning and
improved stock selection by our team led to a
substantial improvement in relative results in
the second half of the fiscal year.”
Joshua Byrne, Portfolio Leader, Putnam Europe Equity Fund
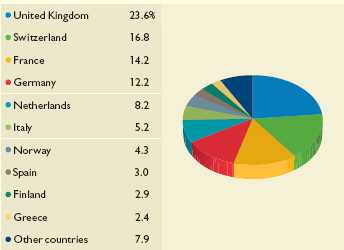
The top 10 country allocations represent 92.8% of the portfolio’s net assets and will vary over time. The remaining net assets are allocated among 6 other countries.
Country allocations as of 6/30/08
4

Josh, European markets have experienced significant turmoil over the past 12 months. How has the fund performed?
The fund posted a loss of 15.43% during the period. This was disappointing relative to the benchmark, which declined 11.34%, but we are encouraged that the fund’s relative performance significantly improved in the second half of the year, as our stock selections have provided better results. Foreign currency exposure helped absolute results as the dollar weakened, but results versus the benchmark were hurt by the fund’s currency overlay strategy, which included hedges against the euro and the Swiss franc, both of which strengthened during the period.
What challenges existed in European markets during the fiscal period?
The credit crisis that began in the United States in 2007 has caused severe and recurring market dislocations for Europe. In July and August 2007, investors began to realize that the U.S. subprime mortgage crisis would pose a threat to the worldwide financial system. European financial companies with significant holdings in U.S. mortgage-backed securities were among the first to suffer. As a consequence, many investors fled risky stocks and crowded into a handful of high-quality, large-cap companies with strong earnings momentum, regardless of their valuation. This was a particular problem for our strategy, because valuation signals are at the core of our investment process.
How did you manage the fund in response to this situation?
We continued the process of shifting to the more defensive stance that we had begun in the first half of 2007. We incrementally increased the portfolio’s positions in those companies with larger market capitalizations that offered attractive valuations. In executing our investment process, we gave greater consideration to each company’s balance sheet strength and earnings quality. The latter metric addresses, among other things, how much of a company’s earnings comes from ongoing business operations rather than one-time financial transactions. It was precisely what the market was looking for during the period: stocks whose earnings were relatively
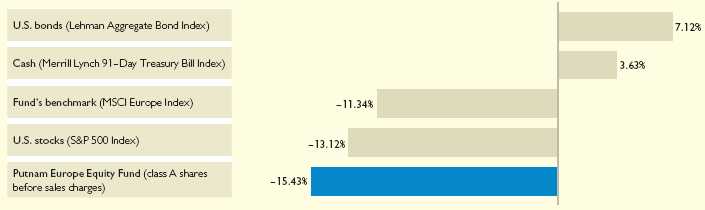
Broad market index and fund performance
This comparison shows your fund’s performance in the context of broad market indexes for the 12 months ended 6/30/08. See the previous page and pages 9–10 for additional fund performance information. Index descriptions can be found on page 15.
5
safe from recessionary pressures and weak consumer spending.
Sam, did those adjustments affect the fund’s sector and market positioning?
The portfolio had overweight positions in the energy, health-care, and transportation sectors, relative to the benchmark, and underweights in the consumer cyclicals and financials sectors. In terms of markets, the portfolio had an overweight position in Switzerland, where we favored health-care stocks, and in Norway, which contributed to the energy overweight. We maintained an underweight to the United Kingdom, though we have selectively added to U.K. stocks recently. We reduced an earlier overweight to Germany because many of our holdings there were vulnerable to the slowdown in the economic cycle in Europe and in emerging markets.
How did the fund perform following these adjustments?
The fund was well positioned in the second half of the period, benefiting from favoring large- and mega-cap stocks, and from sector positioning, especially the overweight to energy and the underweights to financials and consumer cyclicals. The direction of international markets has generally been negative over the second half of the fiscal year, and though the fund’s absolute returns have been negative as well, our shift to a more defensive stance led to a substantial improvement in results relative to the fund’s benchmark and peer group.
Josh, what are some examples of stocks that helped performance?
Among the largest contributors to fund performance were energy stocks such as StatoilHydro of Norway and Lukoil of Russia. The fund had overweight positions in both companies relative to the benchmark, and they benefited from the rapid increase in energy prices during the period. Lukoil also announced a dividend increase. In the basic materials sector, an overweight to mining company BHP Billiton of the United Kingdom was a top contributor. Prices of metals and minerals rose significantly during the period thanks to robust demand in developing markets. BHP Billiton has achieved record levels of production of iron ore, used in the manufacture of steel for infrastructure projects in the world’s emerging markets. The fund’s overweight position in Suez, a French power generation and water utility, also contributed positively to performance. The company posted strong earnings growth, and the stock is also benefiting as Suez undertakes a merger with Gaz de France, a natural gas company.
Top 10 holdings
This table shows the fund’s top 10 holdings and the percentage of the fund’s net assets that each represented as of 6/30/08. Holdings will vary over time.
| HOLDING (percentage of fund’s net assets) | COUNTRY | SECTOR/INDUSTRY |
| BP PLC (4.7%) | United Kingdom | Energy/Oil and gas |
| Total SA (4.5%) | France | Energy/Oil and gas |
| Roche Holding AG (3.5%) | Switzerland | Health care/Pharmaceuticals |
| Novartis AG (3.5%) | Switzerland | Health care/Pharmaceuticals |
| Nestle SA (3.1%) | Switzerland | Consumer staples/Food |
| Banco Santander Central Hispano SA (3.0%) | Spain | Financials/Banking |
| Suez SA (2.9%) | France | Utilities and power/Electric utilities |
| GlaxoSmithKline PLC (2.9%) | United Kingdom | Health care/Pharmaceuticals |
| Nokia OYJ (2.9%) | Finland | Technology/Communications equipment |
| Allianz SE (2.8%) | Germany | Financials/Insurance |
6
Which stocks were less successful?
Relative to the benchmark, the fund had an overweight position in Ericsson, the Swedish networking equipment manufacturer. The stock detracted from returns and exemplified the trend we described earlier. The stock had attractive valuations, but the company did not meet earnings expectations and was penalized substantially by the market. We sold Ericsson to protect the fund from potential further price declines. Another detractor was French automaker Renault, which faced an increasingly adverse environment as consumer spending weakened and fuel prices rose. The sector struggled as auto sales in Europe decelerated while costs, such as steel, have been rising. In the financial-industry sector, Allied Irish Banks, also an overweight position, declined as Ireland’s ec onomy and real estate markets deteriorated. In the United Kingdom, the fund held Barratt Developments, a home builder that has struggled as the nation’s housing market has entered a slump. Though the stock remained attractively valued, we sold it and helped the fund avoid further price declines.
Sam, how is the portfolio currently positioned?
We are continuing a defensive posture by maintaining an overweight exposure to large-cap stocks and positioning the fund for a period of slower economic growth in Europe. From a sector perspective relative to the benchmark, the portfolio is overweight to the health-care and energy sectors, while consumer cyclicals, financials, and capital goods are the largest underweights. By country, the portfolio’s overweights are to Switzerland and Norway, and its largest underweight is to the United Kingdom. It’s important to remember that the fund’s sector and country overweights, as always, are by-products of our bottom-up stock-selection process, rather than the result of imposed top-down views.
I N T H E N E W S
In a July update to its 2008 outlook, the International Monetary Fund (IMF) revised its forecast for worldwide economic growth to 4.1%. For the 15 nations that use the euro currency, the IMF projects growth of 1.7%, down from 2.6% in 2007. In the United Kingdom, the IMF foresees growth slowing from 3.1% in 2007 to 1.8% this year. The report cites deteriorating business and consumer sentiment, weaker industrial production, and the squeeze on credit availability as the drags on growth. The IMF, which was founded after World War II and now includes 185 member countries, seeks to promote international monetary cooperation.
Josh, what is the team’s outlook for the fund in the coming fiscal year?
Overall, economic growth in Europe is slowing and the markets are reflecting that slowdown. Traditionally, Europe follows the U.S. economic cycle with a lag, so the slowing U.S. economy is a major concern for Europe. Additionally, growth in Europe continues to be driven by Germany, which in turn is supported by exports to emerging markets. Emerging markets face the threat of central banks taking actions to dampen growth and stem inflationary pressures from increased food and energy prices. Also, within Europe, the European Central Bank’s focus on fighting inflation and the strength of the euro together may create a headwind for European exporters and a risk for stocks. Therefore, we believe a cautious outlook is necessary in these uncertain times. That said, we are still cognizant of the benefits that European markets offer U.S. investors. For example, Europe offers access to world-leading companies, particularly in the health-care and basic materials sectors. Many industries in Europe can unlock value through restructuring and
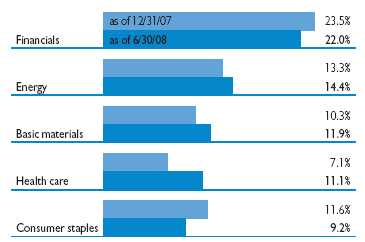
Comparison of top sector weightings
This chart shows how the fund’s top weightings have changed over the past six months. Weightings are shown as a percentage of net assets. Holdings will vary over time.
7
placing greater emphasis on rewarding shareholders. Lastly, I would cite the enlargement of the European Union and positive immigration trends in Europe’s developed markets as two factors that, in our view, give Europe attractive long-term economic growth opportunities.
In managing the fund to pursue such opportunities, we continue to focus on investing predominantly in stocks that lie within the positive intersection of our fundamental and quantitative security research, and which have a track record of adding value over the long term. Across Europe, we continue to favor undervalued companies that are achieving growth through structural avenues such as market-share gains, margin improvements, or more competitive business models.
Thank you, Josh and Sam, for your time and insights today.
The views expressed in this report are exclusively those of Putnam Management. They are not meant as investment advice.
Please note that the holdings discussed in this report may not have been held by the fund for the entire period. Portfolio composition is subject to review in accordance with the fund’s investment strategy and may vary in the future.
8
Your fund’s performance
This section shows your fund’s performance, price, and distribution information for periods ended June 30, 2008, the end of its most recent fiscal year. In accordance with regulatory requirements for mutual funds, we also include expense information taken from the fund’s current prospectus. Performance should always be considered in light of a fund’s investment strategy. Data represents past performance. Past performance does not guarantee future results. More recent returns may be less or more than those shown. Investment return and principal value will fluctuate, and you may have a gain or a loss when you sell your shares. Performance information does not reflect any deduction for taxes a shareholder may owe on fund distributions or on the redemption of fund shares. For the most recent month-end performance, please visit the Individual Investors section of www.putnam.com or call Putnam at 1-800-225-1581. Class Y shares are generally only available to corporate and institutional clients and clients in other approved programs. See the Terms and Definitions section in this report for definitions of the share classes offered by your fund.
Fund performance Total return for periods ended 6/30/08
| Class A | Class B | Class C | Class M | Class R | Class Y | |||||
| (inception dates) | (9/7/90) | (2/1/94) | (7/26/99) | (12/1/94) | (12/1/03) | (10/4/05) | ||||
| NAV | POP | NAV | CDSC | NAV | CDSC | NAV | POP | NAV | NAV | |
| Annual average (life of fund) | 10.18% | 9.81% | 9.36% | 9.36% | 9.36% | 9.36% | 9.66% | 9.44% | 9.92% | 10.22% |
| 10 years | 52.73 | 43.97 | 41.83 | 41.83 | 41.78 | 41.78 | 45.54 | 40.46 | 49.40 | 53.80 |
| Annual average | 4.33 | 3.71 | 3.56 | 3.56 | 3.55 | 3.55 | 3.82 | 3.46 | 4.10 | 4.40 |
| 5 years | 103.02 | 91.30 | 95.59 | 93.59 | 95.52 | 95.52 | 98.04 | 91.13 | 101.01 | 104.44 |
| Annual average | 15.21 | 13.85 | 14.36 | 14.12 | 14.35 | 14.35 | 14.64 | 13.83 | 14.99 | 15.38 |
| 3 years | 40.81 | 32.70 | 37.74 | 34.74 | 37.75 | 37.75 | 38.78 | 33.90 | 40.10 | 41.79 |
| Annual average | 12.08 | 9.89 | 11.26 | 10.45 | 11.27 | 11.27 | 11.54 | 10.22 | 11.90 | 12.34 |
| 1 year | –15.43 | –20.29 | –16.04 | –19.50 | –16.04 | –16.73 | –15.85 | –18.80 | –15.63 | –15.22 |
Current performance may be lower or higher than the quoted past performance, which cannot guarantee future results. After sales charge returns (public offering price, or POP) for class A and M shares reflect a maximum 5.75% and 3.50% load, respectively, as of 1/2/08. Class B share returns reflect the applicable contingent deferred sales charge (CDSC), which is 5% in the first year, declining to 1% in the sixth year, and is eliminated thereafter. Class C shares reflect a 1% CDSC for the first year that is eliminated thereafter. Class R and Y shares have no initial sales charge or CDSC. Performance for class B, C, M, R, and Y shares before their inception is derived from the historical performance of class A shares, adjusted for the applicable sales charge (or CDSC) and, except for class Y shares, the higher operating expenses for such shares.
For a portion of the periods, this fund may have limited expenses, without which returns would have been lower.
A 1% short-term trading fee may be applied to shares exchanged or sold within 90 days of purchase.
Change in the value of a $10,000 investment ($9,425 after sales charge)
Cumulative total return from 6/30/98 to 6/30/08
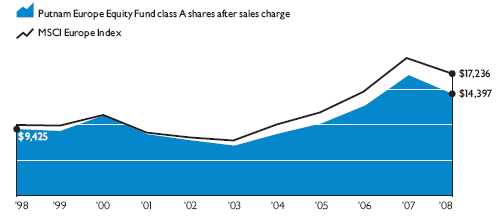
Past performance does not indicate future results. At the end of the same time period, a $10,000 investment in the fund’s class B and class C shares would have been valued at $14,183 and $14.178, respectively, and no contingent deferred sales charges would apply. A $10,000 investment in the fund’s class M shares ($9,650 after sales charge) would have been valued at $14,046 at public offering price. A $10,000 investment in the fund’s class R and class Y shares would have been valued at $14,940 and $15,380, respectively. See first page of performance section for performance calculation method.
9
Comparative index returns For periods ended 6/30/08
| Lipper European Region | ||
| MSCI Europe Index | Funds category average* | |
| Annual average (life of fund) | 9.91% | 10.13% |
| 10 years | 72.36 | 108.58 |
| Annual average | 5.60 | 7.23 |
| 5 years | 120.62 | 129.99 |
| Annual average | 17.15 | 17.71 |
| 3 years | 46.48 | 45.55 |
| Annual average | 13.57 | 13.19 |
| 1 year | –11.34 | –13.48 |
Index and Lipper results should be compared to fund performance at net asset value.
* Over the 1-year, 3-year, 5-year, 10-year, and life-of-fund periods ended 6/30/08, there were 107, 95, 85, 38, and 9 funds, respectively, in this Lipper category.
Fund price and distribution information For the 12-month period ended 6/30/08
| Distributions: | Class A | Class B | Class C | Class M | Class R | Class Y | ||
| Number | 1 | 1 | 1 | 1 | 1 | 1 | ||
| Income | $0.5422 | $0.1842 | $0.2912 | $0.3242 | $0.5142 | $0.6252 | ||
| Capital gains — Long-term | 2.4943 | 2.4943 | 2.4943 | 2.4943 | 2.4943 | 2.4943 | ||
| Capital gains — Short-term | 2.5774 | 2.5774 | 2.5774 | 2.5774 | 2.5774 | 2.5774 | ||
| Total | $5.6139 | $5.2559 | $5.3629 | $5.3959 | $5.5859 | $5.6969 | ||
| Share value: | NAV | POP | NAV | NAV | NAV | POP | NAV | NAV |
| 6/30/07 | $33.47 | $35.51* | $32.34 | $33.11 | $33.23 | $34.44* | $33.30 | $33.53 |
| 6/30/08 | 23.20 | 24.62 | 22.39 | 22.94 | 23.07 | 23.91 | 23.02 | 23.24 |
The classification of distributions, if any, is an estimate. Final distribution information will appear on your year-end tax forms.
* Reflects an increase in sales charges that took effect on 1/2/08.
Fund’s annual operating expenses For the fiscal year ended 6/30/07
| Class A | Class B | Class C | Class M | Class R | Class Y | |
| Total annual fund operating expenses | 1.48% | 2.23% | 2.23% | 1.98% | 1.73% | 1.23% |
Expense information in this table is taken from the most recent prospectus, is subject to change, and may differ from that shown in the next section and in the financial highlights of this report. Expenses are shown as a percentage of average net assets.
10
Your fund’s expenses
As a mutual fund investor, you pay ongoing expenses, such as management fees, distribution fees (12b-1 fees), and other expenses. In the most recent six-month period, your fund limited these expenses; had it not done so, expenses would have been higher. Using the following information, you can estimate how these expenses affect your investment and compare them with the expenses of other funds. You may also pay one-time transaction expenses, including sales charges (loads) and redemption fees, which are not shown in this section and would have resulted in higher total expenses. For more information, see your fund’s prospectus or talk to your financial representative.
Review your fund’s expenses
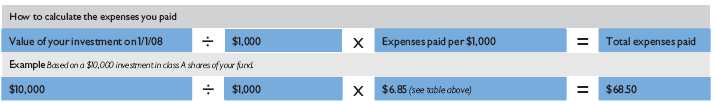
The following table shows the expenses you would have paid on a $1,000 investment in Putnam Europe Equity Fund from January 1, 2008, to June 30, 2008. It also shows how much a $1,000 investment would be worth at the close of the period, assuming actual returns and expenses.
| Class A | Class B | Class C | Class M | Class R | Class Y | |
| Expenses paid per $1,000* | $6.85 | $10.35 | $10.35 | $9.19 | $8.02 | $5.68 |
| Ending value (after expenses) | $887.20 | $883.90 | $884.00 | $885.30 | $886.10 | $888.40 |
* Expenses for each share class are calculated using the fund’s annualized expense ratio for each class, which represents the ongoing expenses as a percentage of average net assets for the six months ended 6/30/08. The expense ratio may differ for each share class (see the last table in this section). Expenses are calculated by multiplying the expense ratio by the average account value for the period; then multiplying the result by the number of days in the period; and then dividing that result by the number of days in the year.
Estimate the expenses you paid
To estimate the ongoing expenses you paid for the six months ended June 30, 2008, use the following calculation method. To find the value of your investment on January 1, 2008, call Putnam at 1-800-225-1581.
Compare expenses using the SEC’s method
The Securities and Exchange Commission (SEC) has established guidelines to help investors assess fund expenses. Per these guidelines, the table below shows your fund’s expenses based on a $1,000 investment, assuming a hypothetical 5% annualized return. You can use this information to compare the ongoing expenses (but not transaction expenses or total costs) of investing in the fund with those of other funds. All mutual fund shareholder reports will provide this information to help you make this comparison. Please note that you cannot use this information to estimate your actual ending account balance and expenses paid during the period.
| Class A | Class B | Class C | Class M | Class R | Class Y | |
| Expenses paid per $1,000* | $7.32 | $11.07 | $11.07 | $9.82 | $8.57 | $6.07 |
| Ending value (after expenses) | $1,017.60 | $1,013.87 | $1,013.87 | $1,015.12 | $1,016.36 | $1,018.85 |
* Expenses for each share class are calculated using the fund’s annualized expense ratio for each class, which represents the ongoing expenses as a percentage of average net assets for the six months ended 6/30/08. The expense ratio may differ for each share class (see the last table in this section). Expenses are calculated by multiplying the expense ratio by the average account value for the period; then multiplying the result by the number of days in the period; and then dividing that result by the number of days in the year.
11
Compare expenses using industry averages
You can also compare your fund’s expenses with the average of its peer group, as defined by Lipper, an independent fund-rating agency that ranks funds relative to others that Lipper considers to have similar investment styles or objectives. The expense ratio for each share class shown below indicates how much of your fund’s average net assets have been used to pay ongoing expenses during the period.
| Class A | Class B | Class C | Class M | Class R | Class Y | |
| Your fund’s annualized expense ratio* | 1.46% | 2.21% | 2.21% | 1.96% | 1.71% | 1.21% |
| Average annualized expense ratio for Lipper peer group† | 1.48% | 2.23% | 2.23% | 1.98% | 1.73% | 1.23% |
* For the fund’s most recent fiscal half year; may differ from expense ratios based on one-year data in the financial highlights.
† Putnam keeps fund expenses below the Lipper peer group average expense ratio by limiting our fund expenses if they exceed the Lipper average. The Lipper average is a simple average of front-end load funds in the peer group that excludes 12b-1 fees as well as any expense offset and brokerage service arrangements that may reduce fund expenses. To facilitate the comparison in this presentation, Putnam has adjusted the Lipper average to reflect 12b-1 fees. Investors should note that the other funds in the peer group may be significantly smaller or larger than the fund, and that an asset-weighted average would likely be lower than the simple average. Also, the fund and Lipper report expense data at different times; the fund’s expense ratio shown here is annualized data for the most recent six-month period, while the quarterly updated Lipper average is based on the most recent fiscal-year end data available for the peer group funds as of 6/30/08.
12
Your fund’s portfolio turnover and Morningstar® Risk
Putnam funds are actively managed by teams of experts who buy and sell securities based on intensive analysis of companies, industries, economies, and markets. Portfolio turnover is a measure of how often a fund’s managers buy and sell securities for your fund. A portfolio turnover of 100%, for example, means that the managers sold and replaced securities valued at 100% of a fund’s average portfolio value within a given period. Funds with high turnover may be more likely to generate capital gains that must be distributed to shareholders as taxable income. High turnover may also cause a fund to pay more brokerage commissions and other transaction costs, which may detract from performance.
You can use the following table to compare your fund’s turnover with the average turnover for funds in its Lipper category.
Turnover comparisons
Percentage of holdings that change every year
| 2008 | 2007 | 2006 | 2005 | 2004 | |
| Putnam Europe Equity Fund | 77% | 106% | 81% | 56% | 82% |
| Lipper European Region Funds category average | 97% | 103% | 111% | 113% | 139% |
Turnover data for the fund is calculated based on the fund’s fiscal-year period, which ends on June 30. Turnover data for the fund’s Lipper category is calculated based on the average of the turnover of each fund in the category for its fiscal year ended during the indicated year. Fiscal years vary across funds in the Lipper category, which may limit the comparability of the fund’s portfolio turnover rate to the Lipper average. Comparative data for 2008 is based on information available as of 6/30/08.
Your fund’s Morningstar® Risk
This risk comparison is designed to help you understand how your fund compares with other funds. The comparison utilizes a risk measure developed by Morningstar, an independent fund-rating agency. This risk measure is referred to as the fund’s Morningstar Risk.
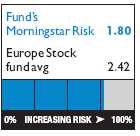
Your fund’s Morningstar Risk is shown alongside that of the average fund in its Morningstar category. The risk bar broadens the comparison by translating the fund’s Morningstar Risk into a percentile, which is based on the fund’s ranking among all funds rated by Morningstar as of June 30, 2008. A higher Morningstar Risk generally indicates that a fund’s monthly returns have varied more widely.
Morningstar determines a fund’s Morningstar Risk by assessing variations in the fund’s monthly returns — with an emphasis on downside variations — over a 3-year period, if available. Those measures are weighted and averaged to produce the fund’s Morningstar Risk. The information shown is provided for the fund’s class A shares only; information for other classes may vary. Morningstar Risk is based on historical data and does not indicate future results. Morningstar does not purport to measure the risk associated with a current investment in a fund, either on an absolute basis or on a relative basis. Low Morningstar Risk does not mean that you cannot lose money on an investment in a fund. Copyright 2008 Morningstar, Inc. All Rights Reserved. The information contained herein (1) is proprietary to Morningstar and/or its content providers; (2) may not be copied or distributed; and (3) is not warranted to be accurate, complete, or timely. Neither Morningstar nor its content providers are responsible for any damages or losses arising from any use of this information.
13
Your fund’s management
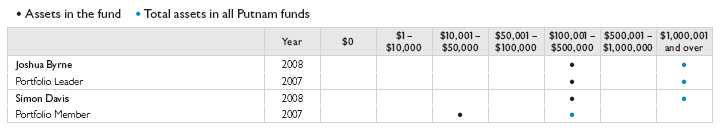
Your fund is managed by the members of the Putnam International Core Team. Joshua Byrne is the Portfolio Leader and Simon Davis is a Portfolio Member of your fund. The Portfolio Leader and Portfolio Member coordinate the team’s management of the fund.
For a complete listing of the members of the Putnam International Core Team, including those who are not Portfolio Leaders or Portfolio Members of your fund, please visit the Individual Investors section of www.putnam.com.
Trustee and Putnam employee fund ownership
As of June 30, 2008, all of the Trustees of the Putnam funds owned fund shares. The following table shows the approximate value of investments in the fund and all Putnam funds as of that date by the Trustees and Putnam employees. These amounts include investments by the Trustees’ and employees’ immediate family members and investments through retirement and deferred compensation plans.
| Assets in | Total assets in | ||
| the fund | all Putnam funds | ||
| Trustees | $253,000 | $85,000,000 | |
| Putnam employees | $4,426,000 | $602,000,000 | |
Other Putnam funds managed by the Portfolio Leader and Portfolio Member
Joshua Byrne is also a Portfolio Leader of Putnam International Equity Fund.
Simon Davis is also a Portfolio Leader of Putnam International Equity Fund.
Joshua Byrne and Simon Davis may also manage other accounts and variable trust funds advised by Putnam Management or an affiliate.
Investment team fund ownership
The following table shows how much the fund’s current Portfolio Leader and Portfolio Member have invested in the fund and in all Putnam mutual funds (in dollar ranges). Information shown is as of June 30, 2008, and June 30, 2007.
14
Terms and definitions
Important terms
Total return shows how the value of the fund’s shares changed over time, assuming you held the shares through the entire period and reinvested all distributions in the fund.
Net asset value (NAV) is the price, or value, of one share of a mutual fund, without a sales charge. NAVs fluctuate with market conditions. NAV is calculated by dividing the net assets of each class of shares by the number of outstanding shares in the class.
Public offering price (POP) is the price of a mutual fund share plus the maximum sales charge levied at the time of purchase. POP performance figures shown here assume the 5.75% maximum sales charge for class A shares and 3.50% for class M shares.
Contingent deferred sales charge (CDSC) is generally a charge applied at the time of the redemption of class B or C shares and assumes redemption at the end of the period. Your fund’s class B CDSC declines from a 5% maximum during the first year to 1% during the sixth year. After the sixth year, the CDSC no longer applies. The CDSC for class C shares is 1% for one year after purchase.
Share classes
Class A shares are generally subject to an initial sales charge and no CDSC (except on certain redemptions of shares bought without an initial sales charge).
Class B shares are not subject to an initial sales charge. They may be subject to a CDSC.
Class C shares are not subject to an initial sales charge and are subject to a CDSC only if the shares are redeemed during the first year.
Class M shares have a lower initial sales charge and a higher 12b-1 fee than class A shares and no CDSC (except on certain redemptions of shares bought without an initial sales charge).
Class R shares are not subject to an initial sales charge or CDSC and are available only to certain defined contribution plans.
Class Y shares are not subject to an initial sales charge or CDSC, and carry no 12b-1 fee. They are generally only available to corporate and institutional clients and clients in other approved programs.
Comparative indexes
Lehman Aggregate Bond Index is an unmanaged index of U.S. investment-grade fixed-income securities.
Merrill Lynch 91-Day Treasury Bill Index is an unmanaged index that seeks to measure the performance of U.S. Treasury bills available in the marketplace.
Morgan Stanley Capital International (MSCI) Europe Index is an unmanaged index of Western European equity securities.
S&P 500 Index is an unmanaged index of common stock performance.
Indexes assume reinvestment of all distributions and do not account for fees. Securities and performance of a fund and an index will differ. You cannot invest directly in an index.
Lipper is a third-party industry-ranking entity that ranks mutual funds. Its rankings do not reflect sales charges. Lipper rankings are based on total return at net asset value relative to other funds that have similar current investment styles or objectives as determined by Lipper. Lipper may change a fund’s category assignment at its discretion. Lipper category averages reflect performance trends for funds within a category.
15
Trustee approval of management contract
General conclusions
The Board of Trustees of the Putnam funds oversees the management of each fund and, as required by law, determines annually whether to approve the continuance of your fund’s management contract with Put-nam Investment Management (“Putnam Management”) and the sub-management contract, in respect of your fund, between Putnam Management’s affiliate, Putnam Investments Limited (“PIL”), and Putnam Management. In May 2008, the Board of Trustees also approved a new sub-advisory contract among Putnam Management, PIL and another affiliate, The Putnam Advisory Company (“PAC”), in respect of your fund. In this regard, the Board of Trustees, with the assistance of its Contract Committee consisting solely of Trustees who are not “interested persons” (as such term is defined in the Investment Company Act of 1940, as amended) of the Putnam funds (the “Independent Trustees”), requests and evaluates all information it deems reaso nably necessary under the circumstances. Over the course of several months ending in June 2008, the Contract Committee met several times to consider the information provided by Putnam Management and other information developed with the assistance of the Board’s independent counsel and independent staff. The Contract Committee reviewed and discussed key aspects of this information with all of the Independent Trustees. The Contract Committee recommended, and the Independent Trustees approved, the continuance of your fund’s management, sub-management and sub-advisory contracts, effective July 1, 2008. (Because PIL and PAC are affiliates of Putnam Management and Putnam Management remains fully responsible for all services provided by PIL and PAC, the Trustees have not evaluated PIL and PAC as separate entities, except as otherwise indicated below, and all subsequent references to Putnam Management below should be deemed to include reference to PIL and PAC as necessary or appropriate in the context.)
The Independent Trustees’ approval was based on the following conclusions:
• That the fee schedule in effect for your fund represented reasonable compensation in light of the nature and quality of the services being provided to the fund, the fees paid by competitive funds and the costs incurred by Putnam Management in providing such services, and
• That this fee schedule represented an appropriate sharing between fund shareholders and Putnam Management of such economies of scale as may exist in the management of the fund at current asset levels.
These conclusions were based on a comprehensive consideration of all information provided to the Trustees, were subject to the continued application of certain expense reductions and waivers and other considerations noted below, and were not the result of any single factor. Some of the factors that figured particularly in the Trustees’ deliberations and how the Trustees considered these factors are described below, although individual Trustees may have evaluated the information presented differently, giving different weights to various factors. It is also important to recognize that the fee arrangements for your fund and the other Putnam funds are the result of many years of review and discussion between the Independent Trustees and Putnam Management, that certain aspects of such arrangements may receive greater scrutiny in some years than others, and that the Trustees’ conclusions may be based, in part, on their consideration of these same arrangements in prio r years.
Management fee schedules and categories; total expenses
The Trustees reviewed the management fee schedules in effect for all Putnam funds, including fee levels and breakpoints, and the assignment of funds to particular fee categories. In reviewing fees and expenses, the Trustees generally focused their attention on material changes in circumstances — for example, changes in a fund’s size or investment style, changes in Putnam Management’s operating costs or responsibilities, or changes in competitive practices in the mutual fund industry — that suggest that consideration of fee changes might be warranted. The Trustees concluded that the circumstances did not warrant changes to the management fee structure of your fund, which had been carefully developed over the years, re-examined on many occasions and adjusted where appropriate. In this regard, the Trustees also noted that shareholders of your fund voted in 2007 to approve new management contracts containing an identical fee structure. The Trustees focused on two areas of particular interest, as discussed further below:
• Competitiveness. The Trustees reviewed comparative fee and expense information for competitive funds, which indicated that, in a custom peer group of competitive funds selected by Lipper Inc., your fund ranked in the 31st percentile in management fees and in the 56th percentile in total expenses (less any applicable 12b-1 fees) as of December 31, 2007 (the first percentile being the least expensive funds and the 100th percentile being the most expensive funds) (Because the fund’s custom peer group is smaller than the fund’s broad Lipper Inc. peer group, this expense information may differ from the Lipper peer expense information found elsewhere in this report.) The Trustees noted that expense ratios for a number of Putnam funds, which show the percentage of fund assets used to pay for management and administrative services, distribution (12b-1) fees a nd other expenses, had been increasing recently as a result of declining net assets and the natural operation of fee breakpoints.
The Trustees noted that the expense ratio increases described above were currently being controlled by expense limitations initially implemented in January 2004. The Trustees have received a commitment from Putnam Management and its parent company to continue this program through at least June 30, 2009. These expense limitations give effect to a commitment by Putnam Management that the expense
16
ratio of each open-end fund would be no higher than the average expense ratio of the competitive funds included in the fund’s relevant Lipper universe (exclusive of any applicable 12b-1 charges in each case). The Trustees observed that this commitment to limit fund expenses has served shareholders well since its inception.
In order to ensure that the expenses of the Putnam funds continue to meet evolving competitive standards, the Trustees requested, and Putnam Management agreed, to extend for the twelve months beginning July 1, 2008, an additional expense limitation for certain funds at an amount equal to the average expense ratio (exclusive of 12b-1 charges) of a custom peer group of competitive funds selected by Lipper to correspond to the size of the fund. This additional expense limitation will be applied to those open-end funds that had above-average expense ratios (exclusive of 12b-1 charges) based on the custom peer group data for the period ended December 31, 2007. This additional expense limitation will be applied to your fund.
In addition, the Trustees devoted particular attention to analyzing the Putnam funds’ fees and expenses relative to those of competitors in fund complexes of comparable size and with a comparable mix of asset categories. The Trustees concluded that this analysis did not reveal any matters requiring further attention at the current time.
• Economies of scale. Your fund currently has the benefit of breakpoints in its management fee that provide shareholders with significant economies of scale, which means that the effective management fee rate of the fund (as a percentage of fund assets) declines as the fund grows in size and crosses specified asset thresholds. Conversely, if the fund shrinks in size — as has been the case for many Putnam funds in recent years — these breakpoints result in increasing fee levels. In recent years, the Trustees have examined the operation of the existing breakpoint structure during periods of both growth and decline in asset levels. The Trustees concluded that the fee schedule in effect for your fund represented an appropriate sharing of economies of scale at current asset levels.
In connection with their review of the management fees and total expenses of the Putnam funds, the Trustees also reviewed the costs of the services to be provided and profits to be realized by Putnam Management and its affiliates from the relationship with the funds. This information included trends in revenues, expenses and profitability of Putnam Management and its affiliates relating to the investment management and distribution services provided to the funds. In this regard, the Trustees also reviewed an analysis of Putnam Management’s revenues, expenses and profitability with respect to the funds’ managementcontracts, allocated on a fund-by-fund basis.
Investment performance
The quality of the investment process provided by Putnam Management represented a major factor in the Trustees’ evaluation of the quality of services provided by Putnam Management under your fund’s management contract. The Trustees were assisted in their review of the Putnam funds’ investment process and performance by the work of the Investment Oversight Coordinating Committee of the Trustees and the Investment Oversight Committees of the Trustees, which had met on a regular monthly basis with the funds’ portfolio teams throughout the year. The Trustees concluded that Putnam Management generally provides a high-quality investment process — as measured by the experience and skills of the individuals assigned to the management of fund portfolios, the resources made available to such personnel, and in general the ability of Putnam Management to attract and retain high-quality personnel — but also recognized that this does not guarantee favorab le investment results for every fund in every time period. The Trustees considered the investment performance of each fund over multiple time periods and considered information comparing each fund’s performance with various benchmarks and with the performance of competitive funds.
While the Trustees noted the satisfactory investment performance of certain Putnam funds, they considered the disappointing investment performance of many funds in recent periods, particularly over periods in 2007 and 2008. They discussed with senior management of Putnam Management the factors contributing to such underperfor-mance and actions being taken to improve performance. The Trustees recognized that, in recent years, Putnam Management has taken steps to strengthen its investment personnel and processes to address areas of underperformance, including recent efforts to further centralize Putnam Management’s equity research function. In this regard, the Trustees took into consideration efforts by Putnam Management to improve its ability to assess and mitigate investment risk in individual funds, across asset classes, and across the complex as a whole. The Trustees indicated their intention to continue to monitor performance trends to assess the effectiveness of these efforts and to evaluate whether additional changes to address areas of underperformance are warranted.
In the case of your fund, the Trustees considered that your fund’s class A share cumulative total return performance at net asset value was in the following percentiles of its Lipper Inc. peer group (Lipper European Region Funds) for the one-year, three-year and five-year periods ended December 31, 2007 (the first percentile being the best-performing funds and the 100th percentile being the worst-performing funds):
| One-year period | 77th | ||
| Three-year period | 74th | ||
| Five-year period | 72nd | ||
(Because of the passage of time, these performance results may differ from the performance results for more recent periods shown elsewhere in this report.) Over the one-year, three-year and five-year periods ended December 31, 2007, there
17
were 103, 92, and 84 funds, respectively, in your fund’s Lipper peer group.* Past performance is no guarantee of future returns.
The Trustees noted the disappointing performance for your fund for the one-year period ended December 31, 2007. In this regard, the Trustees considered that Putnam Management continues to have confidence in the investment process for your fund given its stronger longer-term record, recognizing the tendency for short-term variability over a market cycle. The Trustees also considered Putnam Management’s belief that the Large Cap Equities team’s leadership changes and the research centralization efforts underway in the equity space at Putnam Management more generally will strengthen the fund’s investment process, which focuses on a blend of quantitative techniques and fundamental analysis, and enhance its performance potential.
As a general matter, the Trustees believe that cooperative efforts between the Trustees and Putnam Management represent the most effective way to address investment performance problems. The Trustees noted that investors in the Putnam funds have, in effect, placed their trust in the Putnam organization, under the oversight of the funds’ Trustees, to make appropriate decisions regarding the management of the funds. Based on the responsiveness of Putnam Management in the recent past to Trustee concerns about investment performance, the Trustees concluded that it is preferable to seek change within Putnam Management to address performance shortcomings. In the Trustees’ view, the alternative of engaging a new investment adviser for an underperforming fund would entail significant disruptions and would not provide any greater assurance of improved investment performance.
Brokerage and soft-dollar allocations; other benefits
The Trustees considered various potential benefits that Putnam Management may receive in connection with the services it provides under the management contract with your fund. These include benefits related to brokerage and soft-dollar allocations, whereby a portion of the commissions paid by a fund for brokerage may be used to acquire research services that may be useful to Putnam Management in managing the assets of the fund and of other clients. The Trustees considered changes made in 2008, at Putnam Management’s request, to the Putnam funds’ brokerage allocation policy, which expanded the permitted categories of brokerage and research services payable with soft dollars and increased the permitted soft dollar allocation to third-party services over what had been authorized in previous years. The Trustees indicated their continued intent to monitor the potential benefits associated with the allocation of fund brokerage and trends in industry practice to ensur e that the principle of seeking “best price and execution” remains paramount in the portfolio trading process.
The Trustees’ annual review of your fund’s management contract arrangements also included the review of its distributor’s contract and distribution plan with Putnam Retail Management Limited Partnership and the investor servicing agreement with Putnam Fiduciary Trust Company (“PFTC”), each of which provides benefits to affiliates of Putnam Management. In the case of the investor servicing agreement, the Trustees considered that certain shareholder servicing functions were shifted to a third-party service provider by PFTC in 2007.
Comparison of retail and institutional fee schedules
The information examined by the Trustees as part of their annual contract review has included for many years information regarding fees charged by Putnam Management and its affiliates to institutional clients such as defined benefit pension plans, college endowments, etc. This information included comparisons of such fees with fees charged to the funds, as well as a detailed assessment of the differences in the services provided to these two types of clients. The Trustees observed, in this regard, that the differences in fee rates between institutional clients and mutual funds are by no means uniform when examined by individual asset sectors, suggesting that differences in the pricing of investment management services to these types of clients reflect to a substantial degree historical competitive forces operating in separate market places. The Trustees considered the fact that fee rates across different asset classes are typically higher o n average for mutual funds than for institutional clients, as well as the differences between the services that Putnam Management provides to the Putnam funds and those that it provides to institutional clients of the firm, but did not rely on such comparisons to any significant extent in concluding that the management fees paid by your fund are reasonable.
Approval of the Sub-Advisory Contract among Putnam Management, Putnam Investments Limited andThe Putnam Advisory Company
In May 2008, the Trustees approved a new sub-advisory contract among Putnam Management, PIL and PAC in respect of your fund, under which PAC’s Singapore branch would begin providing discretionary investment management services for your fund. The Contract Committee reviewed information provided by Putnam Management and PAC and, upon completion of this review, recommended, and the Independent Trustees and the full Board of Trustees approved, the sub-advisory contract in respect of your fund, effective October 30, 2008.
* The percentile rankings for your fund’s class A share annualized total return performance in the Lipper European Region Funds category for the one-year, five-year and ten-year periods ended June 30, 2008 were 64%, 68%, and 75%, respectively. Over the one-year, five-year, and ten-year periods ended June 30, 2008, your fund ranked 69th out of 107, 58th out of 85, and 29th out of 38 funds, respectively. Note that this more recent information was not available when the Trustees approved the continuance of your fund’s management contract.
18
The Trustees considered numerous factors they believed relevant in approving your fund’s sub-advisory contract, including Putnam Management’s belief that the interest of shareholders would be best served by utilizing investment professionals in PAC’s Singapore office to manage a portion of your fund’s assets and PAC’s expertise in managing assets invested in Asian markets. The Trustees also considered that applicable securities laws require a sub-advisory relationship among Putnam Management, PIL and PAC in order for Putnam’s investment professionals in Singapore to be involved in the management of your fund. The Trustees noted that Putnam Management and/ or PIL, but not your fund, would pay the sub-advisory fee to PAC for its services and that the sub-advisory relationship with PAC will not reduce the nature, quality or overall level of service provided to your fund.
Other information for shareholders
Putnam’s policy on confidentiality
In order to conduct business with our shareholders, we must obtain certain personal information such as account holders’ addresses, telephone numbers, Social Security numbers, and the names of their financial representatives. We use this information to assign an account number and to help us maintain accurate records of transactions and account balances. It is our policy to protect the confidentiality of your information, whether or not you currently own shares of our funds, and, in particular, not to sell information about you or your accounts to outside marketing firms. We have safeguards in place designed to prevent unauthorized access to our computer systems and procedures to protect personal information from unauthorized use. Under certain circumstances, we share this information with outside vendors who provide services to us, such as mailing and proxy solicitation. In those cases, the service providers enter into confidentiality agreements with us, and we provide only the information necessary to process transactions and perform other services related to your account. We may also share this information with our Putnam affiliates to service your account or provide you with information about other Putnam products or services. It is also our policy to share account information with your financial representative, if you’ve listed one on your Putnam account. If you would like clarification about our confidentiality policies or have any questions or concerns, please don’t hesitate to contact us at 1-800-225-1581, Monday through Friday, 8:30 a.m. to 7:00 p.m., or Saturdays from 9:00 a.m. to 5:00 p.m. Eastern Time.
Proxy voting
Putnam is committed to managing our mutual funds in the best interests of our shareholders. The Putnam funds’ proxy voting guidelines and procedures, as well as information regarding how your fund voted proxies relating to portfolio securities during the 12-month period ended June 30, 2008, are available in the Individual Investors section of www.putnam.com, and on the SEC’s Web site, www.sec.gov. If you have questions about finding forms on the SEC’s Web site, you may call the SEC at 1-800-SEC-0330. You may also obtain the Putnam funds’ proxy voting guidelines and procedures at no charge by calling Putnam’s Shareholder Services at 1-800-225-1581.
Fund portfolio holdings
The fund will file a complete schedule of its portfolio holdings with the SEC for the first and third quarters of each fiscal year on Form N-Q. Shareholders may obtain the fund’s Forms N-Q on the SEC’s Web site at www.sec.gov. In addition, the fund’s Forms N-Q may be reviewed and copied at the SEC’s Public Reference Room in Washington, D.C. You may call the SEC at 1-800-SEC-0330 for information about the SEC’s Web site or the operation of the Public Reference Room.
19
Financial statements
These sections of the report, as well as the accompanying Notes, preceded by the Report of Independent Registered Public Accounting Firm, constitute the fund’s financial statements.
The fund’s portfolio lists all the fund’s investments and their values as of the last day of the reporting period. Holdings are organized by asset type and industry sector, country, or state to show areas of concentration and diversification.
Statement of assets and liabilities shows how the fund’s net assets and share price are determined. All investment and noninvestment assets are added together. Any unpaid expenses and other liabilities are subtracted from this total. The result is divided by the number of shares to determine the net asset value per share, which is calculated separately for each class of shares. (For funds with preferred shares, the amount subtracted from total assets includes the liquidation preference of preferred shares.)
Statement of operations shows the fund’s net investment gain or loss. This is done by first adding up all the fund’s earnings — from dividends and interest income — and subtracting its operating expenses to determine net investment income (or loss). Then, any net gain or loss the fund realized on the sales of its holdings — as well as any unrealized gains or losses over the period — is added to or subtracted from the net investment result to determine the fund’s net gain or loss for the fiscal year.
Statement of changes in net assets shows how the fund’s net assets were affected by the fund’s net investment gain or loss, by distributions to shareholders, and by changes in the number of the fund’s shares. It lists distributions and their sources (net investment income or realized capital gains) over the current reporting period and the most recent fiscal year-end. The distributions listed here may not match the sources listed in the Statement of operations because the distributions are determined on a tax basis and may be paid in a different period from the one in which they were earned.
Financial highlights provide an overview of the fund’s investment results, per-share distributions, expense ratios, net investment income ratios, and portfolio turnover in one summary table, reflecting the five most recent reporting periods. In a semi-annual report, the highlight table also includes the current reporting period.
20
Report of Independent Registered Public Accounting Firm
To the Trustees and Shareholders of
Putnam Europe Equity Fund:
In our opinion, the accompanying statement of assets and liabilities, including the fund’s portfolio, and the related statements of operations and of changes in net assets and the financial highlights present fairly, in all material respects, the financial position of Putnam Europe Equity Fund (the “fund”) at June 30, 2008, and the results of its operations, the changes in its net assets and the financial highlights for each of the periods indicated, in conformity with accounting principles generally accepted in the United States of America. These financial statements and financial highlights (hereafter referred to as “financial statements”) are the responsibility of the fund’s management. Our responsibility is to express an opinion on these financial statements based on our audits. We conducted our audits of these financial statements in accordance with the standards of the Public Company Accounting Oversight Board (United States). Those standards require that we plan and perform the audit to obtain reasonable assurance about whether the financial statements are free of material misstatement. An audit includes examining, on a test basis, evidence supporting the amounts and disclosures in the financial statements, assessing the accounting principles used and significant estimates made by management, and evaluating the overall financial statement presentation. We believe that our audits, which included confirmation of investments owned at June 30, 2008 by correspondence with the custodian and brokers, provide a reasonable basis for our opinion.
PricewaterhouseCoopers LLP
Boston, Massachusetts
August 13, 2008
21
The fund’s portfolio 6/30/08
| COMMON STOCKS (98.6%)* | Shares | Value |
| Austria (0.6%) | ||
| Telekom Austria AG | 111,415 | $2,411,687 |
| 2,411,687 | ||
| Finland (2.9%) | ||
| Nokia OYJ | 477,185 | 11,692,536 |
| 11,692,536 | ||
| France (14.2%) | ||
| Air France-KLM | 155,722 | 3,712,030 |
| BNP Paribas SA | 118,576 | 10,626,527 |
| Renault SA | 30,215 | 2,472,722 |
| Suez SA | 173,806 | 11,807,505 |
| Total SA | 211,158 | 18,006,532 |
| Vivendi SA | 267,992 | 10,148,327 |
| 56,773,643 | ||
| Germany (12.2%) | ||
| Allianz SE | 62,756 | 11,030,087 |
| BASF SE | 119,227 | 8,213,231 |
| Bayerische Motoren Werke (BMW) AG | 109,000 | 5,232,360 |
| Deutsche Post AG | 138,610 | 3,617,017 |
| Merck KGaA | 14,480 | 2,056,672 |
| Merck KGaA 144A | 18,718 | 2,658,617 |
| Praktiker Bau- und Heimwerkermaerkte AG | 68,290 | 1,436,193 |
| RWE AG | 56,502 | 7,129,736 |
| Salzgitter AG | 14,838 | 2,712,220 |
| Tognum AG | 182,942 | 4,906,654 |
| 48,992,787 | ||
| Greece (2.4%) | ||
| EFG Eurobank Ergasias | 117,430 | 2,772,070 |
| Hellenic Telecommunication Organization | ||
| (OTE) SA | 158,340 | 3,930,501 |
| National Bank of Greece SA | 65,125 | 2,934,279 |
| 9,636,850 | ||
| Ireland (1.7%) | ||
| Allied Irish Banks PLC | 438,757 | 6,765,026 |
| 6,765,026 | ||
| Italy (5.2%) | ||
| Enel SpA | 947,876 | 8,996,546 |
| Finmeccanica SpA | 149,945 | 3,921,795 |
| Saras SpA | 518,416 | 2,944,241 |
| UniCredito Italiano SpA | 843,009 | 5,136,686 |
| 20,999,268 | ||
| Luxembourg (1.7%) | ||
| Arcelor Mittal | 69,788 | 6,890,918 |
| 6,890,918 | ||
| Netherlands (8.2%) | ||
| Akzo Nobel NV | 79,649 | 5,454,495 |
| ASML Holding NV | 102,646 | 2,500,671 |
| COMMON STOCKS (98.6%)* cont. | Shares | Value |
| Netherlands cont. | ||
| ING Groep NV | 221,069 | $6,988,192 |
| Koninklijke (Royal) KPN NV | 551,252 | 9,426,462 |
| Koninklijke Ahold NV | 637,538 | 8,542,746 |
| 32,912,566 | ||
| Norway (4.3%) | ||
| DnB Holdings ASA | 342,400 | 4,346,456 |
| Petroleum Geo-Services ASA | 104,450 | 2,555,029 |
| StatoilHydro ASA | 273,600 | 10,228,439 |
| 17,129,924 | ||
| Russia (1.3%) | ||
| Lukoil | 32,800 | 3,222,593 |
| Lukoil ADR | 18,600 | 1,836,750 |
| 5,059,343 | ||
| Spain (3.0%) | ||
| Banco Santander Central Hispano SA | 654,458 | 11,944,741 |
| 11,944,741 | ||
| Sweden (0.5%) | ||
| Modern Times Group AB Class B | 36,050 | 2,114,894 |
| 2,114,894 | ||
| Switzerland (16.8%) | ||
| Credit Suisse Group | 88,702 | 4,032,056 |
| Nestle SA | 275,480 | 12,440,023 |
| Novartis AG | 255,261 | 14,023,021 |
| Roche Holding AG | 78,258 | 14,068,158 |
| Swisscom AG | 26,768 | 8,916,356 |
| Xstrata PLC | 57,597 | 4,580,587 |
| Zurich Financial Services AG | 35,211 | 9,007,007 |
| 67,067,208 | ||
| United Kingdom (23.6%) | ||
| BAE Systems PLC | 1,012,528 | 8,917,984 |
| BHP Billiton PLC | 281,195 | 10,807,825 |
| BP PLC | 1,615,244 | 18,751,324 |
| Britvic PLC | 697,055 | 4,000,993 |
| Davis Service Group PLC | 344,633 | 3,058,175 |
| GKN PLC | 798,868 | 3,543,626 |
| GlaxoSmithKline PLC | 530,226 | 11,726,507 |
| Lloyds TSB Group PLC | 823,404 | 5,049,709 |
| Premier Foods PLC | 1,736,246 | 3,281,839 |
| Prudential PLC | 711,532 | 7,541,522 |
| Reckitt Benckiser PLC | 171,603 | 8,695,111 |
| Rio Tinto PLC | 73,470 | 9,014,147 |
| 94,388,762 | ||
| Total common stocks (cost $382,915,609) | $394,780,153 | |
| SHORT-TERM INVESTMENTS (2.1%)* | Principal amount/shares | Value |
| U.S. Treasury Bills for an effective yield of 1.39%, September 18, 2008 # | $375,000 | $373,865 |
| Putnam Prime Money Market Fund e | 8,035,495 | 8,035,495 |
| Total short-term investments (cost $8,409,360) | $8,409,360 | |
| TOTAL INVESTMENTS | ||
| Total investments (cost $391,324,969) | $403,189,513 | |
22
* Percentages indicated are based on net assets of $400,276,097.
# This security was pledged and segregated with the custodian to cover margin requirements for futures contracts at June 30, 2008.
e See Note 5 to the financial statements regarding investments in Putnam Prime Money Market Fund.
At June 30, 2008, liquid assets totaling $4,351,749 have been designated as collateral for open forward contracts and futures contracts.
144A after the name of an issuer represents securities exempt from registration under Rule 144A under the Securities Act of 1933, as amended. These securities may be resold in transactions exempt from registration, normally to qualified institutional buyers.
ADR after the name of a foreign holding stands for American Depository Receipts, representing ownership of foreign securities on deposit with a custodian bank.
The fund had the following industry concentrations greater than 10% at June 30, 2008 (as a percentage of net assets):
| Oil and gas | 13.7% | ||||
| Banking | 12.4 | ||||
| Pharmaceuticals | 11.1 |
| FORWARD CURRENCY CONTRACTS TO BUY at 6/30/08 | Aggregate | Delivery | Unrealized | ||
| (aggregate face value $105,180,124) | Value | face value | date | appreciation | |
| British Pound | $54,451,722 | $53,386,230 | 9/17/08 | $1,065,492 | |
| Euro | 15,646,334 | 15,444,736 | 9/17/08 | 201,598 | |
| Norwegian Krone | 15,286,015 | 15,178,590 | 9/17/08 | 107,425 | |
| Swedish Krona | 8,356,719 | 8,327,115 | 9/17/08 | 29,604 | |
| Swiss Franc | 13,132,828 | 12,843,453 | 9/17/08 | 289,375 | |
| Total | $1,693,494 | ||||
| FORWARD CURRENCY CONTRACTS TO SELL at 6/30/08 | Aggregate | Delivery | Unrealized | ||
| (aggregate face value $101,188,101) | Value | face value | date | depreciation | |
| British Pound | $2,908,760 | $2,892,340 | 9/17/08 | $(16,420) | |
| Euro | 54,142,963 | 53,538,933 | 9/17/08 | (604,030) | |
| Norwegian Krone | 1,111,676 | 1,098,536 | 9/17/08 | (13,140) | |
| Swedish Krona | 8,910,445 | 8,896,960 | 9/17/08 | (13,485) | |
| Swiss Franc | 35,605,491 | 34,761,332 | 9/17/08 | (844,159) | |
| Total | $(1,491,234) | ||||
| FUTURES CONTRACTS OUTSTANDING at 6/30/08 | Number of | Expiration | Unrealized | ||
| contracts | Value | date | depreciation | ||
| Dow Jones Euro Stoxx 50 Index (Long) | 42 | $2,235,728 | Sep-08 | $(137,621) | |
| FTSE 100 Index (Long) | 17 | 1,913,791 | Sep-08 | (58,182) | |
| Total | $(195,803) | ||||
The accompanying notes are an integral part of these financial statements.
23
Statement of assets and liabilities 6/30/08
| ASSETS | |
| Investment in securities, at value, (Note 1): | |
| Unaffiliated issuers (identified cost $383,289,474) | $395,154,018 |
| Affiliated issuers (identified cost $8,035,495) (Note 5) | 8,035,495 |
| Cash | 1,057,445 |
| Dividends, interest and other receivables | 368,551 |
| Receivable for shares of the fund sold | 27,029 |
| Receivable for securities sold | 3,835,347 |
| Receivable for variation margin (Note 1) | 41,330 |
| Receivable for open forward currency contracts (Note 1) | 1,712,875 |
| Receivable for closed forward currency contracts (Note 1) | 128,356 |
| Foreign tax reclaim receivable | 717,592 |
| Total assets | 411,078,038 |
| LIABILITIES | |
| Payable to custodian (Note 2) | 375,716 |
| Payable for securities purchased | 5,758,917 |
| Payable for shares of the fund repurchased | 1,163,014 |
| Payable for compensation of Manager (Notes 2 and 5) | 873,794 |
| Payable for investor servicing fees (Note 2) | 97,360 |
| Payable for custodian fees (Note 2) | 25,184 |
| Payable for Trustee compensation and expenses (Note 2) | 166,936 |
| Payable for administrative services (Note 2) | 1,656 |
| Payable for distribution fees (Note 2) | 272,183 |
| Payable for open forward currency contracts (Note 1) | 1,510,615 |
| Payable for closed forward currency contracts (Note 1) | 391,628 |
| Other accrued expenses | 164,938 |
| Total liabilities | 10,801,941 |
| Net assets | $400,276,097 |
| REPRESENTED BY | |
| Paid-in capital (Unlimited shares authorized) (Notes 1 and 4) | $397,977,788 |
| Distributions in excess of net investment income (Note 1) | (3,934,656) |
| Accumulated net realized loss on investments | |
| and foreign currency transactions (Note 1) | (5,651,244) |
| Net unrealized appreciation of investments | |
| and assets and liabilities in foreign currencies | 11,884,209 |
| Total — Representing net assets applicable | |
| to capital shares outstanding | $400,276,097 |
| COMPUTATION OF NET ASSET VALUE AND OFFERING PRICE | |
| Net asset value and redemption price per class A share | |
| ($346,191,573 divided by 14,918,850 shares) | $23.20 |
| Offering price per class A share (100/94.25 of $23.20)* | $24.62 |
| Net asset value and offering price per class B share | |
| ($32,359,731 divided by 1,445,465 shares)** | $22.39 |
| Net asset value and offering price per class C share | |
| ($4,912,307 divided by 214,152 shares)** | $22.94 |
| Net asset value and redemption price per class M share | |
| ($7,551,371 divided by 327,343 shares) | $23.07 |
| Offering price per class M share (100/96.50 of $23.07)* | $23.91 |
| Net asset value, offering price and redemption price | |
| per class R share ($107,467 divided by 4,668 shares) | $23.02 |
| Net asset value, offering price and redemption price | |
| per class Y share ($9,153,648 divided by 393,827 shares) | $23.24 |
* On single retail sales of less than $50,000. On sales of $50,000 or more the offering price is reduced.
** Redemption price per share is equal to net asset value less any applicable contingent deferred sales charge.
The accompanying notes are an integral part of these financial statements.
24
Statement of operations Year ended 6/30/08
| INVESTMENT INCOME | |
| Dividends (net of foreign tax of $1,830,606) | $14,754,669 |
| Interest (including interest income of $370,885 | |
| from investments in affiliated issuers) (Note 5) | 365,459 |
| Securities lending | 555 |
| Total investment income | 15,120,683 |
| EXPENSES | |
| Compensation of Manager (Note 2) | 3,960,412 |
| Investor servicing fees (Note 2) | 1,412,222 |
| Custodian fees (Note 2) | 82,135 |
| Trustee compensation and expenses (Note 2) | 36,546 |
| Administrative services (Note 2) | 25,253 |
| Distribution fees — Class A (Note 2) | 1,044,302 |
| Distribution fees — Class B (Note 2) | 534,813 |
| Distribution fees — Class C (Note 2) | 60,653 |
| Distribution fees — Class M (Note 2) | 80,733 |
| Distribution fees — Class R (Note 2) | 563 |
| Other | 273,285 |
| Non-recurring costs (Notes 2 and 6) | 937 |
| Costs assumed by Manager (Notes 2 and 6) | (937) |
| Fees waived and reimbursed by Manager (Note 5) | (6,841) |
| Total expenses | 7,504,076 |
| Expense reduction (Note 2) | (176,215) |
| Net expenses | 7,327,861 |
| Net investment income | 7,792,822 |
| Net realized gain on investments (Notes 1 and 3) | 13,961,864 |
| Net realized loss on futures contracts (Note 1) | (1,980,416) |
| Net realized loss on foreign currency transactions (Note 1) | (10,675,237) |
| Net unrealized depreciation of assets and liabilities | |
| in foreign currencies during the year | (552,077) |
| Net unrealized depreciation of investments | |
| and futures contracts during the year | (91,108,446) |
| Net loss on investments | (90,354,312) |
| Net decrease in net assets resulting from operations | $(82,561,490) |
Statement of changes in net assets
| INCREASE (DECREASE) IN NET ASSETS | ||
| Year ended | Year ended | |
| 6/30/08 | 6/30/07 | |
| Operations: | ||
| Net investment income | $7,792,822 | $5,676,717 |
| Net realized gain on investments | ||
| and foreign currency transactions | 1,306,211 | 109,538,078 |
| Net unrealized appreciation (depreciation) | ||
| of investments and assets and liabilities | ||
| in foreign currencies | (91,660,523) | 41,512,519 |
| Net increase (decrease) in net assets | ||
| resulting from operations | (82,561,490) | 156,727,314 |
| Distributions to shareholders (Note 1): | ||
| From ordinary income | ||
| Net investment income | ||
| Class A | (7,382,534) | (7,740,217) |
| Class B | (328,521) | (1,021,986) |
| Class C | (58,076) | (73,354) |
| Class M | (109,853) | (171,893) |
| Class R | (2,023) | (981) |
| Class Y | (228,660) | (177,109) |
| Net realized short-term gain on investments | ||
| Class A | (35,148,812) | — |
| Class B | (4,649,811) | — |
| Class C | (514,229) | — |
| Class M | (873,206) | — |
| Class R | (10,141) | — |
| Class Y | (942,616) | — |
| From net realized long-term gain on investments | ||
| Class A | (34,015,628) | (1,280,755) |
| Class B | (4,499,903) | (348,232) |
| Class C | (497,651) | (19,172) |
| Class M | (845,054) | (41,507) |
| Class R | (9,814) | (151) |
| Class Y | (912,227) | (26,239) |
| Redemption fees (Note 1) | 18,636 | 39,062 |
| Decrease from capital share | ||
| transactions (Note 4) | (12,085,501) | (53,669,220) |
| Total increase (decrease) in net assets | (185,657,114) | 92,195,560 |
| NET ASSETS | ||
| Beginning of year | 585,933,211 | 493,737,651 |
| End of year (including distributions in excess | ||
| of net investment income of $3,934,656 | ||
| and undistributed net investment income | ||
| of $6,180,131, respectively) | $400,276,097 | $585,933,211 |
The accompanying notes are an integral part of these financial statements.
25
Financial highlights (For a common share outstanding throughout the period)
| INVESTMENT OPERATIONS: | LESS DISTRIBUTIONS: | RATIOS AND SUPPLEMENTAL DATA: | ||||||||||||
| Ratio of net | ||||||||||||||
| Net asset value, | Net realized and | Total from | From net | Total return | Net assets, | Ratio of expenses | investment income | |||||||
| beginning | Net investment | unrealized gain (loss) | investment | From net | realized gain on | Total | Redemption | Net asset value, | at net asset | end of period | to average net assets | (loss) to average | Portfolio turnover | |
| Period ended | of period | income (loss) a,d | on investments | operations | investment income | investments | distributions | fees e | end of period | value (%) b | (in thousands) | (%) c,d | net assets (%) d | (%) |
| Class A | ||||||||||||||
| June 30, 2008 | $33.47 | .48 | (5.14) | (4.66) | (.54) | (5.07) | (5.61) | — | $23.20 | (15.43) | $346,192 | 1.41 | 1.70 | 76.88 |
| June 30, 2007 | 25.58 | .37 | 8.17 | 8.54 | (.56) | (.09) | (.65) | — | 33.47 | 33.69 | 476,598 | 1.48 | 1.26 | 106.13 |
| June 30, 2006 | 20.79 | .48 g,h | 4.59 | 5.07 | (.28) | — | (.28) | — | 25.58 | 24.54 g | 341,155 | 1.46 g | 2.04 g,h | 80.51 |
| June 30, 2005 | 18.05 | .22 f | 2.78 | 3.00 | (.26) | — | (.26) | — | 20.79 | 16.66 f | 328,279 | 1.44 | 1.13 f | 56.35 |
| June 30, 2004 | 14.84 | .12 | 3.37 | 3.49 | (.28) | — | (.28) | — | 18.05 | 23.59 | 313,766 | 1.44 | .69 | 82.35 |
| Class B | ||||||||||||||
| June 30, 2008 | $32.34 | .16 | (4.85) | (4.69) | (.19) | (5.07) | (5.26) | — | $22.39 | (16.04) | $32,360 | 2.16 | .58 | 76.88 |
| June 30, 2007 | 24.68 | .05 | 7.97 | 8.02 | (.27) | (.09) | (.36) | — | 32.34 | 32.68 | 77,315 | 2.23 | .17 | 106.13 |
| June 30, 2006 | 20.03 | .21 g,h | 4.52 | 4.73 | (.08) | — | (.08) | — | 24.68 | 23.65 g | 126,764 | 2.21 g | .99 g,h | 80.51 |
| June 30, 2005 | 17.40 | .04 f | 2.70 | 2.74 | (.11) | — | (.11) | — | 20.03 | 15.73 f | 177,711 | 2.19 | .23 f | 56.35 |
| June 30, 2004 | 14.31 | — e | 3.24 | 3.24 | (.15) | — | (.15) | — | 17.40 | 22.69 | 229,608 | 2.19 | (.04) | 82.35 |
| Class C | ||||||||||||||
| June 30, 2008 | $33.11 | .25 | (5.06) | (4.81) | (.29) | (5.07) | (5.36) | — | $22.94 | (16.04) | $4,912 | 2.16 | .89 | 76.88 |
| June 30, 2007 | 25.33 | .14 | 8.08 | 8.22 | (.35) | (.09) | (.44) | — | 33.11 | 32.68 | 6,983 | 2.23 | .48 | 106.13 |
| June 30, 2006 | 20.58 | .30 g,h | 4.56 | 4.86 | (.11) | — | (.11) | — | 25.33 | 23.66 g | 5,455 | 2.21 g | 1.29 g,h | 80.51 |
| June 30, 2005 | 17.88 | .06 f | 2.75 | 2.81 | (.11) | — | (.11) | — | 20.58 | 15.73 f | 5,182 | 2.19 | .33 f | 56.35 |
| June 30, 2004 | 14.68 | (.01) | 3.33 | 3.32 | (.12) | — | (.12) | — | 17.88 | 22.65 | 5,482 | 2.19 | (.06) | 82.35 |
| Class M | ||||||||||||||
| June 30, 2008 | $33.23 | .27 | (5.03) | (4.76) | (.33) | (5.07) | (5.40) | — | $23.07 | (15.85) | $7,551 | 1.91 | .96 | 76.88 |
| June 30, 2007 | 25.38 | .19 | 8.13 | 8.32 | (.38) | (.09) | (.47) | — | 33.23 | 33.02 | 14,075 | 1.98 | .66 | 106.13 |
| June 30, 2006 | 20.61 | .34 g,h | 4.58 | 4.92 | (.15) | — | (.15) | — | 25.38 | 23.97 g | 14,097 | 1.96 g | 1.49 g,h | 80.51 |
| June 30, 2005 | 17.84 | .09 f | 2.77 | 2.86 | (.09) | — | (.09) | — | 20.61 | 16.05 f | 15,227 | 1.94 | .46 f | 56.35 |
| June 30, 2004 | 14.68 | (.01) | 3.37 | 3.36 | (.20) | — | (.20) | — | 17.84 | 22.97 | 24,410 | 1.94 | .01 | 82.35 |
| Class R | ||||||||||||||
| June 30, 2008 | $33.30 | .44 | (5.13) | (4.69) | (.52) | (5.07) | (5.59) | — | $23.02 | (15.63) | $107 | 1.66 | 1.60 | 76.88 |
| June 30, 2007 | 25.55 | .60 | 7.84 | 8.44 | (.60) | (.09) | (.69) | — | 33.30 | 33.36 | 89 | 1.73 | 1.94 | 106.13 |
| June 30, 2006 | 20.75 | .67 g,h | 4.39 | 5.06 | (.26) | — | (.26) | — | 25.55 | 24.52 g | 6 | 1.71 g | 2.69 g,h | 80.51 |
| June 30, 2005 | 18.03 | .20 f | 2.75 | 2.95 | (.23) | — | (.23) | — | 20.75 | 16.38 f | 2 | 1.69 | 1.03 f | 56.35 |
| June 30, 2004 † | 16.95 | .04 | 1.32 | 1.36 | (.28) | — | (.28) | — | 18.03 | 8.08 * | 1 | .99 * | .26 * | 82.35 |
| Class Y | ||||||||||||||
| June 30, 2008 | $33.53 | .57 | (5.16) | (4.59) | (.63) | (5.07) | (5.70) | — | $23.24 | (15.22) | $9,154 | 1.16 | 2.05 | 76.88 |
| June 30, 2007 | 25.62 | .48 | 8.14 | 8.62 | (.62) | (.09) | (.71) | — | 33.53 | 34.00 | 10,873 | 1.23 | 1.59 | 106.13 |
| June 30, 2006 †† | 22.46 | .53 g,h | 2.92 | 3.45 | (.29) | — | (.29) | — | 25.62 | 15.52 *g | 6,261 | .89 *g | 2.19 *g,h | 80.51 |
*Not annualized.
†For the period December 1, 2003 (commencement of operations) to June 30, 2004.
†† For the period October 4, 2005 (commencement of operations) to June 30, 2006.
a Per share net investment income (loss) has been determined on the basis of the weighted average number of shares outstanding during the period.
b Total return assumes dividend reinvestment and does not reflect the effect of sales charges.
c Includes amounts paid through expense offset and brokerage/service arrangements (Note 2).
d Reflects an involuntary contractual expense limitation and/or waivers of certain fund expenses in connection with investments in Putnam Prime Money Market Fund in effect during the period. As a result of such limitation and/ or waivers, the expenses of each class reflect a reduction of the following amounts (Notes 2 and 5):
| Percentage of average net assets | |||
| June 30, 2008 | <0.01% | ||
| June 30, 2007 | <0.01 | ||
| June 30, 2006 | <0.01 | ||
| June 30, 2005 | 0.05 | ||
| June 30, 2004 | 0.03 | ||
e Amount represents less than $0.01 per share.
f Reflects a non-recurring accrual related to Putnam Management’s settlement with the SEC regarding brokerage allocation practices, which amounted to the following amounts:
| Percentage | |||
| of average | |||
| Per share | net assets | ||
| Class A | $0.01 | 0.04% | |
| Class B | 0.01 | 0.03 | |
| Class C | 0.01 | 0.04 | |
| Class M | 0.01 | 0.03 | |
| Class R | 0.01 | 0.04 | |
g Reflects a non-recurring reimbursement from Putnam Investments relating to the calculation of certain amounts paid by the fund to Putnam in previous years for transfer agent services, which amounted to $0.01 per share and 0.02% of average net assets for the period ended June 30, 2006.
h Reflects a special dividend received by the fund which amounted to the following amounts:
| Percentage | |||
| of average | |||
| Per share | net assets | ||
| Class A | $0.23 | 0.96% | |
| Class B | 0.20 | 0.87 | |
| Class C | 0.22 | 0.95 | |
| Class M | 0.23 | 0.97 | |
| Class R | 0.31 | 1.27 | |
| Class Y | 0.23 | 0.94 | |
The accompanying notes are an integral part of these financial statements.
| 26 | 27 |
Notes to financial statements 6/30/08
Note 1: Significant accounting policies
Putnam Europe Equity Fund (the “fund”), a Massachusetts business trust, is registered under the Investment Company Act of 1940, as amended, as a diversified, open-end management investment company. The fund seeks capital appreciation by investing primarily in common stocks and other securities of European companies.
The fund offers class A, class B, class C, class M, class R and class Y shares. Class A and class M shares are sold with a maximum front-end sales charge of 5.75% and 3.50%, respectively, and generally do not pay a contingent deferred sales charge. Class B shares, which convert to class A shares after approximately eight years, do not pay a front-end sales charge and are subject to a contingent deferred sales charge, if those shares are redeemed within six years of purchase. Class C shares have a one-year 1.00% contingent deferred sales charge and do not convert to class A shares. Class R shares, which are offered to qualified employee-benefit plans, are sold at net asset value. The expenses for class A, class B, class C, class M and class R shares may differ based on the distribution fee of each class, which is identified in Note 2. Class Y shares, which are sold at net asset value, are generally subject to the same expenses as class A, class B, class C, class M an d class R shares, but do not bear a distribution fee. Class Y shares are generally only available to corporate and institutional clients and clients in other approved programs.
A 1.00% redemption fee may apply on any shares that are redeemed (either by selling or exchanging into another fund) within 90 days of purchase. The redemption fee is accounted for as an addition to paid-in-capital.
Investment income, realized and unrealized gains and losses and expenses of the fund are borne pro-rata based on the relative net assets of each class to the total net assets of the fund, except that each class bears expenses unique to that class (including the distribution fees applicable to such classes). Each class votes as a class only with respect to its own distribution plan or other matters on which a class vote is required by law or determined by the Trustees. If the fund were liquidated, shares of each class would receive their pro-rata share of the net assets of the fund. In addition, the Trustees declare separate dividends on each class of shares.
In the normal course of business, the fund enters into contracts that may include agreements to indemnify another party under given circumstances. The fund’s maximum exposure under these arrangements is unknown as this would involve future claims that may be, but have not yet been, made against the fund. However, the fund’s management team expects the risk of material loss to be remote.
The following is a summary of significant accounting policies consistently followed by the fund in the preparation of its financial statements. The preparation of financial statements is in conformity with accounting principles generally accepted in the United States of America and requires management to make estimates and assumptions that affect the reported amounts of assets and liabilities in the financial statements and the reported amounts of increases and decreases in net assets from operations during the reporting period. Actual results could differ from those estimates.
A) Security valuation Investments for which market quotations are readily available are valued at the last reported sales price on their principal exchange, or official closing price for certain markets. If no sales are reported — as in the case of some securities traded over-the-counter — a security is valued at its last reported bid price. Many securities markets and exchanges outside the U.S. close prior to the close of the New York Stock Exchange and therefore the closing prices for securities in such markets or on such exchanges may not fully reflect events that occur after such close but before the close of the New York Stock Exchange. Accordingly, on certain days, the fund will fair value foreign equity securities taking into account multiple factors, including movements in the U.S. securities markets. The number of days on which fair value prices will be used will depend on market activity and it is possib le that fair value prices will be used by the fund to a significant extent. At June 30, 2008, fair value pricing was used for certain foreign securities in the portfolio. Securities quoted in foreign currencies, if any, are translated into U.S. dollars at the current exchange rate. Certain investments, including certain restricted securities and derivatives, are also valued at fair value following procedures approved by the Trustees. Such valuations and procedures are reviewed periodically by the Trustees. The fair value of securities is generally determined as the amount that the fund could reasonably expect to realize from an orderly disposition of such securities over a reasonable period of time. By its nature, a fair value price is a good faith estimate of the value of a security at a given point in time and does not reflect an actual market price, which may be different by a material amount.
B) Joint trading account Pursuant to an exemptive order from the Securities and Exchange Commission (the “SEC”), the fund may transfer uninvested cash balances, including cash collateral received under security lending arrangements, into a joint trading account along with the cash of other registered investment companies and certain other accounts managed by Putnam Investment Management, LLC (“Putnam Management”), the fund’s manager, a wholly-owned subsidiary of Putnam, LLC. These balances may be invested in issues of short-term investments having maturities of up to 397 days for collateral received under security lending arrangements and up to 90 days for other cash investments.
C) Repurchase agreements The fund, or any joint trading account, through its custodian, receives delivery of the underlying securities, the market value of which at the time of purchase is required to be in an amount at least equal to the resale price, including accrued interest. Collateral for certain tri-party repurchase agreements is held at the counterparty’s custodian in a segregated account for the benefit of the fund and the counterparty. Putnam Management is responsible for determining that the value of these underlying securities is at all times at least equal to the resale price, including accrued interest.
D) Security transactions and related investment income Security transactions are recorded on the trade date (the date the order to buy or sell is executed). Gains or losses on securities sold are determined on the identified cost basis.
Interest income is recorded on the accrual basis. Dividend income, net of applicable withholding taxes, is recognized on the ex-dividend date except that certain dividends from foreign securities, if any, are recognized as soon as the fund is informed of the ex-dividend date. Non-cash dividends, if any, are recorded at the fair market value of the securities received. Dividends representing a return of capital or capital gains, if any, are reflected as a reduction of cost and/or as a realized gain.
E) Foreign currency translation The accounting records of the fund are maintained in U.S. dollars. The market value of foreign securities, currency holdings, and other assets and liabilities is recorded in the books and records of the fund after translation to U.S. dollars based on the exchange rates on that day. The cost of each security is determined using historical exchange rates. Income and withholding taxes are translated at prevailing exchange rates when earned or incurred. The fund does not isolate that portion of realized or unrealized gains or losses resulting from changes in the foreign exchange rate on investments from fluctuations arising from changes in the market prices of the securities. Such gains and losses are included with the net realized and unrealized gain or loss on investments. Net realized gains and losses on foreign currency transactions represent net realized exchange gains or losses on closed fo rward currency contracts, disposition of foreign currencies, currency gains and losses realized between the trade and settlement dates on securities transactions and the difference between the amount of investment income and foreign withholding taxes recorded on the fund’s books and the U.S. dollar equivalent amounts actually received or paid. Net unrealized appreciation and depreciation of assets and liabilities in foreign currencies arise from changes in the value of open forward currency contracts and assets and liabilities other than investments at the period end, resulting from changes in the exchange rate. Investments in foreign securities involve certain risks, including those related to economic instability,
28
unfavorable political developments, and currency fluctuations, not present with domestic investments.
F) Forward currency contracts The fund may buy and sell forward currency contracts, which are agreements between two parties to buy and sell currencies at a set price on a future date. These contracts are used to protect against a decline in value relative to the U.S. dollar of the currencies in which its portfolio securities are denominated or quoted (or an increase in the value of a currency in which securities a fund intends to buy are denominated, when a fund holds cash reserves and short-term investments), or for other investment purposes. The U.S. dollar value of forward currency contracts is determined using current forward currency exchange rates supplied by a quotation service. The market value of the contract will fluctuate with changes in currency exchange rates. The contract is marked-to-market daily and the change in market value is recorded as an unrealized gain or loss. When the contract is closed, the fund r ecords a realized gain or loss equal to the difference between the value of the contract at the time it was opened and the value at the time it was closed. The fund could be exposed to risk if the value of the currency changes unfavorably, if the counterparties to the contracts are unable to meet the terms of their contracts or if the fund is unable to enter into a closing position. Risks may exceed amounts recognized on the Statement of assets and liabilities. Forward currency contracts outstanding at period end, if any, are listed after the fund’s portfolio.
G) Futures and options contracts The fund may use futures and options contracts to hedge against changes in the values of securities the fund owns, owned or expects to purchase, or for other investment purposes. The fund may also write options on swaps or securities it owns or in which it may invest to increase its current returns.
The potential risk to the fund is that the change in value of futures and options contracts may not correspond to the change in value of the hedged instruments. In addition, losses may arise from changes in the value of the underlying instruments, if there is an illiquid secondary market for the contracts, or if the counterparty to the contract is unable to perform. Risks may exceed amounts recognized on the Statement of assets and liabilities. When the contract is closed, the fund records a realized gain or loss equal to the difference between the value of the contract at the time it was opened and the value at the time it was closed. Realized gains and losses on purchased options are included in realized gains and losses on investment securities. If a written call option is exercised, the premium originally received is recorded as an addition to sales proceeds. If a written put option is exercised, the premium originally received is recorded as a reduction to the cost of investments.
Futures contracts are valued at the quoted daily settlement prices established by the exchange on which they trade. The fund and the broker agree to exchange an amount of cash equal to the daily fluctuation in the value of the futures contract. Such receipts or payments are known as “variation margin.” Exchange traded options are valued at the last sale price or, if no sales are reported, the last bid price for purchased options and the last ask price for written options. Options traded over-the-counter are valued using prices supplied by dealers. Futures and written option contracts outstanding at period end, if any, are listed after the fund’s portfolio.
H) Securities lending The fund may lend securities, through its agents, to qualified borrowers in order to earn additional income. The loans are collateralized by cash and/or securities in an amount at least equal to the market value of the securities loaned. The market value of securities loaned is determined daily and any additional required collateral is allocated to the fund on the next business day. The risk of borrower default will be borne by the fund’s agents; the fund will bear the risk of loss with respect to the investment of the cash collateral. Income from securities lending is included in investment income on the Statement of operations. At June 30, 2008, the fund had no securities out on loan.
I) Federal taxes It is the policy of the fund to distribute all of its taxable income within the prescribed time and otherwise comply with the provisions of the Internal Revenue Code of 1986, as amended (the “Code”), applicable to regulated investment companies. It is also the intention of the fund to distribute an amount sufficient to avoid imposition of any excise tax under Section 4982 of the Code. Therefore, no provision has been made for federal taxes on income, capital gains or unrealized appreciation on securities held nor for excise tax on income and capital gains.
Pursuant to federal income tax regulations applicable to regulated investment companies, the fund has elected to defer to its fiscal year ending June 30, 2009 $6,941,626 of losses recognized during the period November 1, 2007 to June 30, 2008.
J) Distributions to shareholders Distributions to shareholders from net investment income are recorded by the fund on the ex-dividend date. Distributions from capital gains, if any, are recorded on the ex-dividend date and paid at least annually. The amount and character of income and gains to be distributed are determined in accordance with income tax regulations, which may differ from generally accepted accounting principles. These differences include temporary and/or permanent differences of losses on wash sale transactions, foreign currency gains and losses, post-October loss deferrals, tax equalization and taxable dividend adjustment. Reclassifications are made to the fund’s capital accounts to reflect income and gains available for distribution (or available capital loss carryovers) under income tax regulations. For the year ended June 30, 2008, the fund reclassified $9,797,942 to decrease undistributed net inves tment income and $913,860 to increase paid-in-capital, with a decrease to accumulated net realized loss of $8,884,082.
The tax basis components of distributable earnings and the federal tax cost as of June 30, 2008 were as follows:
| Unrealized appreciation | $46,523,131 | ||
| Unrealized depreciation | (37,100,603) | ||
| Net unrealized appreciation | 9,422,528 | ||
| Post-October loss | (6,941,626) | ||
| Cost for federal income tax purposes | $393,766,985 | ||
Note 2: Management fee, administrative services and other transactions
The fund pays Putnam Management for management and investment advisory services quarterly based on the average net assets of the fund. Such fee is based on the following annual rates: 0.80% of the first $500 million of average net assets, 0.70% of the next $500 million, 0.65% of the next $500 million, 0.60% of the next $5 billion, 0.575% of the next $5 billion, 0.555% of the next $5 billion, 0.54% of the next $5 billion and 0.53% thereafter.
Putnam Management has agreed to waive fees and reimburse expenses of the fund through June 30, 2009, to the extent necessary to ensure that the fund’s expenses do not exceed the simple average of the expenses of all front-end load funds viewed by Lipper, Inc. as having the same investment classification or objective as the fund. The expense reimbursement is based on a comparison of the fund’s expenses with the average annualized operating expenses of the funds in its Lipper peer group for each calendar quarter during the fund’s last fiscal year, excluding 12b-1 fees and without giving effect to any expense offset and brokerage service arrangements that may reduce fund expenses.
Putnam Management has further agreed to waive fees and reimburse expenses of the fund for the period from July 1, 2008 through June 30, 2009, to the extent necessary to ensure that the fund’s expenses do not exceed the simple average of the expenses of a custom group of competitive funds selected by Lipper, Inc. based on the size of the fund. The expense reimbursement is based on a comparison of the fund’s total expenses with the average operating expenses of the funds in this Lipper custom peer group for their respective 2007 fiscal years, excluding 12b-1 fees and after adjustment
29
for certain expense offset and brokerage service arrangements that reduced expenses of the fund.
For the year ended June 30, 2008, the fund’s expenses were limited to the lower of the limits specified above and accordingly, Putnam Management did not waive any of its management fee from the fund.
Putnam Investments Limited (“PIL”), an affiliate of Putnam Management, is authorized by the Trustees to manage a separate portion of the assets of the fund as determined by Putnam Management from time to time. Putnam Management pays a quarterly sub-management fee to PIL for its services at an annual rate of 0.35% of the average net assets of the portion of the fund managed by PIL.
For the year ended June 30, 2008, Putnam Management has assumed $937 of legal, shareholder servicing and communication, audit and Trustee fees incurred by the fund in connection with certain legal and regulatory matters (including those described in Note 6).
The fund reimburses Putnam Management an allocated amount for the compensation and related expenses of certain officers of the fund and their staff who provide administrative services to the fund. The aggregate amount of all such reimbursements is determined annually by the Trustees.
Custodial services for the fund’s assets were provided by Putnam Fiduciary Trust Company (“PFTC”), an affiliate of Putnam Management, and by State Street Bank and Trust Company (“State Street”). Custody fees are based on the fund’s asset level, the number of its security holdings, transaction volumes and with respect to PFTC, certain fees related to the transition of assets to State Street. Putnam Investor Services, a division of PFTC, provided investor servicing agent functions to the fund. Putnam Investor Services received fees for investor servicing, subject to certain limitations, based on the number of shareholder accounts in the fund and the level of defined contribution plan assets in the fund. During the year ended June 30, 2008, the fund incurred $1,412,574 for custody and investor servicing agent functions provided by PFTC.
Under the custodian contract between the fund and State Street, the custodian bank has a lien on the securities of the fund to the extent permitted by the fund’s investment restrictions to cover any advances made by the custodian bank for the settlement of securities purchased by the fund. At June 30, 2008, the payable to the custodian bank represents the amount due for cash advanced for the settlement of securities purchased.
The fund has entered into expense offset arrangements with PFTC and State Street whereby PFTC’s and State Street’s fees are reduced by credits allowed on cash balances. The fund also reduced expenses through brokerage/service arrangements. For the year ended June 30, 2008, the fund’s expenses were reduced by $34,479 under the expense offset arrangements and by $141,736 under the brokerage/service arrangements.
Each independent Trustee of the fund receives an annual Trustee fee, of which $368, as a quarterly retainer, has been allocated to the fund, and an additional fee for each Trustees meeting attended. Trustees receive additional fees for attendance at certain committee meetings and industry seminars and for certain compliance-related matters. Trustees also are reimbursed for expenses they incur relating to their services as Trustees.
The fund has adopted a Trustee Fee Deferral Plan (the “Deferral Plan”) which allows the Trustees to defer the receipt of all or a portion of Trustees fees payable on or after July 1, 1995. The deferred fees remain invested in certain Putnam funds until distribution in accordance with the Deferral Plan.
The fund has adopted an unfunded noncontributory defined benefit pension plan (the “Pension Plan”) covering all Trustees of the fund who have served as a Trustee for at least five years and were first elected prior to 2004. Benefits under the Pension Plan are equal to 50% of the Trustee’s average annual attendance and retainer fees for the three years ended December 31, 2005. The retirement benefit is payable during a Trustee’s lifetime, beginning the year following retirement, for the number of years of service through December 31, 2006. Pension expense for the fund is included in Trustee compensation and expenses in the Statement of operations. Accrued pension liability is included in Payable for Trustee compensation and expenses in the Statement of assets and liabilities. The Trustees have terminated the Pension Plan with respect to any Trustee first elected after 2003.
The fund has adopted distribution plans (the “Plans”) with respect to its class A, class B, class C, class M and class R shares pursuant to Rule 12b-1 under the Investment Company Act of 1940. The purpose of the Plans is to compensate Putnam Retail Management Limited Partnership, a wholly-owned subsidiary of Putnam, LLC and Putnam Retail Management GP, Inc., for services provided and expenses incurred in distributing shares of the fund. The Plans provide for payments by the fund to Putnam Retail Management Limited Partnership at an annual rate of up to 0.35%, 1.00%, 1.00%, 1.00% and 1.00% of the average net assets attributable to class A, class B, class C, class M and class R shares, respectively. The Trustees have approved payment by the fund at an annual rate of 0.25%, 1.00%, 1.00%, 0.75% and 0.50% of the average net assets attributable to class A, class B, class C, class M and class R shares, respectively.
For the year ended June 30, 2008, Putnam Retail Management Limited Partnership, acting as underwriter, received net commissions of $19,977 and $5,107 from the sale of class A and class M shares, respectively, and received $43,240 and $1,096 in contingent deferred sales charges from redemptions of class B and class C shares, respectively. A deferred sales charge of up to 1.00% and 0.65% is assessed on certain redemptions of class A and class M shares, respectively. For the year ended June 30, 2008, Putnam Retail Management Limited Partnership, acting as underwriter, received $40 and no monies on class A and class M redemptions, respectively.
Note 3: Purchases and sales of securities
During the year ended June 30, 2008, cost of purchases and proceeds from sales of investment securities other than short-term investments aggregated $379,972,636 and $490,499,087, respectively. There were no purchases or sales of U.S. government securities.
Note 4: Capital shares
At June 30, 2008, there was an unlimited number of shares of beneficial interest authorized. Transactions in capital shares were as follows:
| Year ended 6/30/08 | Year ended 6/30/07 | |||
| Class A | Shares | Amount | Shares | Amount |
| Shares sold | 1,562,557 | $44,856,942 | 3,773,123 | $109,801,279 |
| Shares issued in | 2,762,061 | 70,460,184 | 276,678 | 8,253,272 |
| connection with | ||||
| reinvestment of | ||||
| distributions | ||||
| 4,324,618 | 115,317,126 | 4,049,801 | 118,054,551 | |
| Shares | (3,645,500) | (100,153,103) | (3,145,225) | (93,267,836) |
| repurchased | ||||
| Net increase | 679,118 | $15,164,023 | 904,576 | $24,786,715 |
30
| Year ended 6/30/08 | Year ended 6/30/07 | |||
| Class B | Shares | Amount | Shares | Amount |
| Shares sold | 116,001 | $3,277,199 | 357,643 | $10,065,961 |
| Shares issued in | 359,541 | 8,884,251 | 44,081 | 1,275,720 |
| connection with | ||||
| reinvestment of | ||||
| distributions | ||||
| 475,542 | 12,161,450 | 401,724 | 11,341,681 | |
| Shares | (1,420,649) | (38,759,542) | (3,146,862) | (88,329,779) |
| repurchased | ||||
| Net decrease | (945,107) | $(26,598,092) | (2,745,138) | $(76,988,098) |
| Year ended 6/30/08 | Year ended 6/30/07 | |||
| Class C | Shares | Amount | Shares | Amount |
| Shares sold | 27,151 | $787,794 | 48,386 | $1,445,504 |
| Shares issued in | 34,848 | 882,368 | 2,494 | 73,881 |
| connection with | ||||
| reinvestment of | ||||
| distributions | ||||
| 61,999 | 1,670,162 | 50,880 | 1,519,385 | |
| Shares | (58,740) | (1,620,372) | (55,292) | (1,604,738) |
| repurchased | ||||
| Net increase | ||||
| 3,259 | $49,790 | (4,412) | $(85,353) | |
| (decrease) | ||||
| Year ended 6/30/08 | Year ended 6/30/07 | |||
| Class M | Shares | Amount | Shares | Amount |
| Shares sold | 36,674 | $1,152,128 | 90,337 | $2,659,028 |
| Shares issued in | 48,746 | 1,239,616 | 4,873 | 144,707 |
| connection with | ||||
| reinvestment of | ||||
| distributions | ||||
| 85,420 | 2,391,744 | 95,210 | 2,803,735 | |
| Shares | (181,655) | (5,292,546) | (227,023) | (6,593,041) |
| repurchased | ||||
| Net decrease | (96,235) | $(2,900,802) | (131,813) | $(3,789,306) |
| Year ended 6/30/08 | Year ended 6/30/07 | |||
| Class R | Shares | Amount | Shares | Amount |
| Shares sold | 3,363 | $93,466 | 2,752 | $83,204 |
| Shares issued in | 867 | 21,978 | 36 | 1,084 |
| connection with | ||||
| reinvestment of | ||||
| distributions | ||||
| 4,230 | 115,444 | 2,788 | 84,288 | |
| Shares | (2,236) | (56,032) | (355) | (11,179) |
| repurchased | ||||
| Net increase | 1,994 | $59,412 | 2,433 | $73,109 |
| Year ended 6/30/08 | Year ended 6/30/07 | |||
| Class Y | Shares | Amount | Shares�� | Amount |
| Shares sold | 113,939 | $3,493,792 | 126,419 | $3,717,200 |
| Shares issued in | 81,561 | 2,081,442 | 6,828 | 203,348 |
| connection with | ||||
| reinvestment of | ||||
| distributions | ||||
| 195,500 | 5,575,234 | 133,247 | 3,920,548 | |
| Shares | (125,965) | (3,435,066) | (53,373) | (1,586,835) |
| repurchased | ||||
| Net increase | 69,535 | $2,140,168 | 79,874 | $2,333,713 |
Note 5: Investment in Putnam Prime Money Market Fund
The fund invests in Putnam Prime Money Market Fund, an open-end management investment company managed by Putnam Management. Investments in Putnam Prime Money Market Fund are valued at its closing net asset value each business day. Management fees paid by the fund are reduced by an amount equal to the management fees paid by Putnam Prime Money Market Fund with respect to assets invested by the fund in Putnam Prime Money Market Fund. For the year ended June 30, 2008, management fees paid were reduced by $6,841 relating to the fund’s investment in Putnam Prime Money Market Fund. Income distributions earned by the fund are recorded as income in the Statement of operations and totaled $370,885 for the year ended June 30, 2008. During the year ended June 30, 2008, cost of purchases and proceeds of sales of investments in Putnam Prime Money Market Fund aggregated $215,516,962 and $209,770,376, respectively.
Note 6: Regulatory matters and litigation
In late 2003 and 2004, Putnam Management settled charges brought by the SEC and the Massachusetts Securities Division in connection with excessive short-term trading in Putnam funds. Distribution of payments from Putnam Management to certain open-end Putnam funds and their shareholders is expected to be completed in the next several months. These allegations and related matters have served as the general basis for certain lawsuits, including purported class action lawsuits against Putnam Management and, in a limited number of cases, some Putnam funds. Putnam Management believes that these lawsuits will have no material adverse effect on the funds or on Putnam Management’s ability to provide investment management services. In addition, Putnam Management has agreed to bear any costs incurred by the Putnam funds as a result of these matters.
Note 7: New accounting pronouncements
In June 2006, the Financial Accounting Standards Board (“FASB”) issued Interpretation No. 48, Accounting for Uncertainty in Income Taxes (the “Interpretation”). The Interpretation prescribes a minimum threshold for financial statement recognition of the benefit of a tax position taken or expected to be taken by a filer in the filer’s tax return. Upon adoption, the Interpretation did not have a material effect on the fund’s financial statements. However, the conclusions regarding the Interpretation may be subject to review and adjustment at a later date based on factors including, but not limited to, further implementation guidance expected from the FASB, and on-going analysis of tax laws, regulations and interpretations thereof.
In September 2006, the FASB issued Statement of Financial Accounting Standards No. 157, Fair Value Measurements (the “Standard”). The Standard defines fair value, sets out a framework for measuring fair value and expands disclosures about fair value measurements. The Standard applies to fair value measurements already required or permitted by existing standards. The Standard is effective for fiscal years beginning after November 15, 2007 and interim periods within those fiscal years. Putnam Management does not believe the adoption of the Standard will impact the amounts reported in the financial statements; however, additional disclosures will be required about the inputs used to develop the measurements of fair value.
In March 2008, Statement of Financial Accounting Standards No. 161, Disclosures about Derivative Instruments and Hedging Activities (“SFAS 161”) — an amendment of FASB Statement No. 133 (“SFAS 133”), was issued and is effective for fiscal years beginning after November 15, 2008. SFAS 161 requires enhanced disclosures about how and why an entity uses derivative instruments and how derivative instruments affect an entity’s financial position. Putnam Management is currently evaluating the impact the adoption of SFAS 161 will have on the fund’s financial statement disclosures.
31
Federal tax information and brokerage commissions (unaudited)
Federal tax information
Pursuant to Section 852 of the Internal Revenue Code, as amended, the fund hereby designates $17,455,710 as long-term capital gain, for its taxable year ended June 30, 2008.
For the period, interest and dividends from foreign countries were $16,585,275 or $0.958 per share for all classes of shares. Taxes paid to foreign countries were $1,830,606 or $0.106 per share for all classes of shares.
For its tax year ended June 30, 2008, the fund hereby designates 100%, or the maximum amount allowable, of its taxable ordinary income distributions as qualified dividends taxed at the individual net capital gain rates.
The Form 1099 you receive in January 2009 will show the tax status of all distributions paid to your account in calendar 2008.
Brokerage commissions are paid to firms that execute trades on behalf of your fund. When choosing these firms, Putnam is required by law to seek the best execution of the trades, taking all relevant factors into consideration, including expected quality of execution and commission rate. Listed below are the largest relationships based upon brokerage commissions for your fund and the other funds in Putnam’s International group for the year ended June 30, 2008. The other Putnam mutual funds in this group are Putnam Global Equity Fund, Putnam International Capital Opportunities Fund, Putnam International Equity Fund, Putnam International Growth and Income Fund, Putnam International New Opportunities Fund, Putnam VT Global Equity Fund, Putnam VT International Equity Fund, Putnam VT International Growth and Income Fund, and Putnam VT International New Opportunities Fund.
The top five firms that received brokerage commissions for trades executed for the International group are (in descending order)
Credit Suisse First Boston, Goldman, Sachs & Co., Deutsche Bank Securities, Citigroup Global Markets, and Merrill, Lynch, Pierce, Fenner. Commissions paid to these firms together represented approximately 49% of the total brokerage commissions paid for the year ended June 30, 2008.
Commissions paid to the next 10 firms together represented approximately 34% of the total brokerage commissions paid during the period. These firms are (in alphabetical order) ABN AMRO, Inc., Bernstein (Sanford C.) & Co., Cazenove Incorporated, CLSA Limited, Dresdner Kleinwort Securities, Lehman Brothers Inc., Macquarie Securities (USA) Inc., Morgan (J.P.) Securities Inc., Morgan Stanley & Co. Incorporated, and UBS Securities L.L.C.
Commission amounts do not include “mark-ups” paid on bond or derivative trades made directly with a dealer. Additional information about brokerage commissions is available on the Securities and Exchange Commission (SEC) Web site at www.sec.gov. Putnam funds disclose commissions by firm to the SEC in semiannual filings on Form N-SAR.
32
About the Trustees
Jameson A. Baxter
Trustee since 1994 and
Vice Chairman since 2005
Ms. Baxter is the President of Baxter Associates, Inc., a private investment firm.
Ms. Baxter serves as a Director of ASHTA Chemicals, Inc., and the Mutual Fund Directors Forum.
Until 2007, she was a Director of Banta Corporation (a printing and supply chain management company), Ryerson, Inc. (a metals service corporation), and Advocate Health Care. Until 2004, she was a Director of BoardSource (formerly the National Center for Nonprofit Boards); and until 2002, she was a Director of Intermatic Corporation (a manufacturer of energy control products). She is Chairman Emeritus of the Board of Trustees, Mount Holyoke College, having served as Chairman for five years.
Ms. Baxter has held various positions in investment banking and corporate finance, including Vice President of and Consultant to First Boston Corporation and Vice President and Principal of the Regency Group. She is a graduate of Mount Holyoke College.
Charles B. Curtis
Trustee since 2001
Mr. Curtis is President and Chief Operating Officer of the Nuclear Threat Initiative (a private foundation dealing with national security issues), and serves as Senior Advisor to the United Nations Foundation.
Mr. Curtis is a member of the Council on Foreign Relations and serves as Director of Edison International and Southern California Edison. Until 2006, Mr. Curtis served as a member of the Trustee Advisory Council of the Applied Physics Laboratory, Johns Hopkins University. Until 2003, Mr. Curtis was a member of the Electric Power Research Institute Advisory Council and the University of Chicago Board of Governors for Argonne National Laboratory. Prior to 2002, Mr. Curtis was a member of the Board of Directors of the Gas Technology Institute and the Board of Directors of the Environment and Natural Resources Program Steering Committee, John F. Kennedy School of Government, Harvard University. Until 2001, Mr. Curtis was a member of the Department of Defense Policy Board and Director of EG&G Technical Services, Inc. (a fossil energy research and development support company).
From August 1997 to December 1999, Mr. Curtis was a Partner at Hogan & Hartson LLP, an international law firm headquartered in Washington, D.C. Prior to May 1997, Mr. Curtis was Deputy Secretary of Energy and Under Secretary of the U.S. Department of Energy. He served as Chairman of the Federal Energy Regulatory Commission from 1977 to 1981 and has held positions on the staff of the U.S. House of Representatives, the U.S. Treasury Department, and the SEC.
Robert J. Darretta
Trustee since 2007
Mr. Darretta serves as Director of United-Health Group, a diversified health-care company.
Until April 2007, Mr. Darretta was Vice Chairman of the Board of Directors of Johnson & Johnson, one of the world’s largest and most broadly based health-care companies. Prior to 2007, he had responsibility for Johnson & Johnson’s finance, investor relations, information technology, and procurement function. He served as Johnson & Johnson Chief Financial Officer for a decade, prior to which he spent two years as Treasurer of the corporation and over ten years leading various Johnson & Johnson operating companies.
Mr. Darretta received a B.S. in Economics from Villanova University.
Myra R. Drucker
Trustee since 2004
Ms. Drucker is Chair of the Board of Trustees of Commonfund (a not-for-profit firm specializing in managing assets for educational endowments and foundations), Vice Chair of the Board of Trustees of Sarah Lawrence College, and a member of the Investment Committee of the Kresge Foundation (a charitable trust). She is also a Director of New York Stock Exchange LLC (a wholly-owned subsidiary of NYSE Euronext), and a Director of Interactive Data Corporation (a provider of financial market data and analytics to financial institutions and investors).
Ms. Drucker is an ex-officio member of the New York Stock Exchange (NYSE) Pension Managers Advisory Committee, having served as Chair for seven years. She serves as an advisor to RCM Capital Management (an investment management firm) and to the Employee Benefits Investment Committee of The Boeing Company (an aerospace firm).
From November 2001 until August 2004, Ms. Drucker was Managing Director and a member of the Board of Directors of General Motors Asset Management and Chief Investment Officer of General Motors Trust Bank. From December 1992 to November 2001, Ms. Drucker served as Chief Investment Officer of Xerox Corporation (a document company). Prior to December 1992, Ms. Drucker was Staff Vice President and Director of Trust Investments for International Paper (a paper and packaging company).
Ms. Drucker received a B.A. degree in Literature and Psychology from Sarah Lawrence College and pursued graduate studies in economics, statistics, and portfolio theory at Temple University.
Charles E. Haldeman, Jr.*
Trustee since 2004 and
President of the Funds since 2007
Mr. Haldeman is Chairman of Putnam Investment Management, LLC and President of the Putnam Funds. Prior to July 2008, he was President and Chief Executive Officer of Putnam, LLC (“Putnam Investments”). Prior to November 2003, Mr. Haldeman served as Co-Head of Putnam Investments’ Investment Division.
33
Prior to joining Putnam Investments in 2002, Mr. Haldeman held executive positions in the investment management industry. He previously served as Chief Executive Officer of Delaware Investments and President and Chief Operating Officer of United Asset Management. Mr. Haldeman was also a Partner and Director of Cooke & Bieler, Inc. (an investment management firm).
Mr. Haldeman currently serves on the Board of Governors of the Investment Company Institute and as Chair of the Board of Trustees of Dartmouth College. He also serves on the Partners HealthCare Investment Committee, the Tuck School of Business Overseers, and the Harvard Business School Board of Dean’s Advisors. He is a graduate of Dartmouth College, Harvard Law School, and Harvard Business School. Mr. Haldeman is also a Chartered Financial Analyst (CFA) charterholder.
John A. Hill
Trustee since 1985 and Chairman since 2000
John A. Hill is founder and Vice-Chairman of First Reserve Corporation, the leading private equity buyout firm specializing in the worldwide energy industry, with offices in Greenwich, Connecticut; Houston, Texas; London, England; and Shanghai, China. The firm’s investments on behalf of some of the nation’s largest pension and endowment funds are currently concentrated in 26 companies with annual revenues in excess of $13 billion, which employ over 100,000 people in 23 countries.
Mr. Hill is Chairman of the Board of Trustees of the Putnam Mutual Funds, a Director of Devon Energy Corporation and various private companies owned by First Reserve, and serves as a Trustee of Sarah Lawrence College where he chairs the Investment Committee.
Prior to forming First Reserve in 1983, Mr. Hill served as President of F. Eberstadt and Company, an investment banking and investment management firm. Between 1969 and 1976, Mr. Hill held various senior positions in Washington, D.C. with the federal government, including Deputy Associate Director of the Office of Management and Budget and Deputy Administrator of the Federal Energy Administration during the Ford Administration.
Mr. Hill was born and raised in Midland, Texas; received his B.A. in Economics from Southern Methodist University; and pursued graduate studies as a Woodrow Wilson Fellow.
Paul L. Joskow
Trustee since 1997
Dr. Joskow is an economist and President of the Alfred P. Sloan Foundation (a philanthropic institution focused primarily on research and education on issues related to science, technology, and economic performance). He is on leave from his position as the Elizabeth and James Killian Professor of Economics and Management at the Massachusetts Institute of Technology (MIT), where he has been on the faculty since 1972. Dr. Joskow was the Director of the Center for Energy and Environmental Policy Research at MIT from 1999 through 2007.
Dr. Joskow serves as a Trustee of Yale University, as a Director of TransCanada Corporation (an energy company focused on natural gas transmission and power services) and of Exelon Corporation (an energy company focused on power services), and as a member of the Board of Overseers of the Boston Symphony Orchestra. Prior to August 2007, he served as a Director of National Grid (a UK-based holding company with interests in electric and gas transmission and distribution and telecommunications infrastructure). Prior to July 2006, he served as President of the Yale University Council and continues to serve as a member of the Council. Prior to February 2005, he served on the board of the Whitehead Institute for Biomedical Research (a non-profit research institution). Prior to February 2002, he was a Director of State Farm Indemnity Company (an automobile insurance company), and prior to March 2000, he was a Director of New England Electric System (a public utility holding comp any).
Dr. Joskow has published six books and numerous articles on industrial organization, government regulation of industry, and competition policy. He is active in industry restructuring, environmental, energy, competition, and privatization policies —serving as an advisor to governments and corporations worldwide. Dr. Joskow holds a Ph.D. and MPhil from Yale University and a B.A. from Cornell University.
Elizabeth T. Kennan
Trustee since 1992
Dr. Kennan is a Partner of Cambus-Kenneth Farm (thoroughbred horse and cattle breeding). She is President Emeritus of Mount Holyoke College.
Dr. Kennan served as Chairman and is now Lead Director of Northeast Utilities. She is a Trustee of the National Trust for Historic Preservation, of Centre College, and of Midway College in Midway, Kentucky. Until 2006, she was a member of The Trustees of Reservations. Prior to 2001, Dr. Kennan served on the oversight committee of the Folger Shakespeare Library. Prior to June 2005, she was a Director of Talbots, Inc., and she has served as Director on a number of other boards, including Bell Atlantic, Chastain Real Estate, Shawmut Bank, Berkshire Life Insurance, and Kentucky Home Life Insurance. Dr. Kennan has also served as President of Five Colleges Incorporated and as a Trustee of Notre Dame University, and is active in various educational and civic associations.
As a member of the faculty of Catholic University for twelve years, until 1978, Dr. Kennan directed the post-doctoral program in Patristic and Medieval Studies, taught history, and published numerous articles and two books. Dr. Kennan holds a Ph.D. from the University of Washington in Seattle, an M.S. from St. Hilda’s College at Oxford University, and an A.B. from Mount Holyoke College. She holds several honorary doctorates.
34
Kenneth R. Leibler
Trustee since 2006
Mr. Leibler is a Founding Partner and former Chairman of the Boston Options Exchange, an electronic marketplace for the trading of derivative securities.
Mr. Leibler currently serves as a Trustee of Beth Israel Deaconess Hospital in Boston. He is also Lead Director of Ruder Finn Group, a global communications and advertising firm, and a Director of Northeast Utilities, which operates New England’s largest energy delivery system. Prior to December 2006, he served as a Director of the Optimum Funds group. Prior to October 2006, he served as a Director of ISO New England, the organization responsible for the operation of the electric generation system in the New England states. Prior to 2000, Mr. Leibler was a Director of the Investment Company Institute in Washington, D.C.
Prior to January 2005, Mr. Leibler served as Chairman and Chief Executive Officerof the Boston Stock Exchange. Prior to January 2000, he served as President and Chief Executive Officer of Liberty Financial Companies, a publicly traded diversified asset management organization. Prior to June 1990, Mr. Leibler served as President and Chief Operating Officer of the American Stock Exchange (AMEX), and at the time was the youngest person in AMEX history to hold the title of President. Prior to serving as AMEX President, he held the position of Chief Financial Officer, and headed its management and marketing operations. Mr. Leibler graduated magna cum laude with a degree in Economics from Syracuse University, where he was elected Phi Beta Kappa.
Robert E. Patterson
Trustee since 1984
Mr. Patterson is Senior Partner of Cabot Properties, LP and Chairman of Cabot Properties, Inc. (a private equity firm investing in commercial real estate).
Mr. Patterson serves as Chairman Emeritus and Trustee of the Joslin Diabetes Center. Prior to June 2003, he was a Trustee of Sea Education Association. Prior to December 2001, Mr. Patterson was President and Trustee of Cabot Industrial Trust (a publicly traded real estate investment trust). Prior to February 1998, he was Executive Vice President and Director of Acquisitions of Cabot Partners Limited Partnership (a registered investment adviser involved in institutional real estate investments). Prior to 1990, he served as Executive Vice President of Cabot, Cabot & Forbes Realty Advisors, Inc. (the predecessor company of Cabot Partners).
Mr. Patterson practiced law and held various positions in state government, and was the founding Executive Director of the Massachusetts Industrial Finance Agency. Mr. Patterson is a graduate of Harvard College and Harvard Law School.
George Putnam, III
Trustee since 1984
Mr. Putnam is Chairman of New Generation Research, Inc. (a publisher of financial advisory and other research services), and President of New Generation Advisers, Inc. (a registered investment adviser to private funds). Mr. Putnam founded the New Generation companies in 1986.
Mr. Putnam is a Director of The Boston Family Office, LLC (a registered investment adviser). He is a Trustee of St. Mark’s School and a Trustee of the Marine Biological Laboratory in Woods Hole, Massachusetts. Until 2006, he was a Trustee of Shore Country Day School, and until 2002, was a Trustee of the Sea Education Association.
Mr. Putnam previously worked as an attorney with the law firm of Dechert LLP (formerly known as Dechert Price & Rhoads) in Philadelphia. He is a graduate of Harvard College, Harvard Business School, and Harvard Law School.
Richard B.Worley
Trustee since 2004
Mr. Worley is Managing Partner of Permit Capital LLC, an investment management firm.
Mr. Worley serves as a Trustee of the University of Pennsylvania Medical Center, The Robert Wood Johnson Foundation (a philanthropic organization devoted to health-care issues), and the National Constitution Center. He is also a Director of The Colonial Williamsburg Foundation (a historical preservation organization), and the Philadelphia Orchestra Association. Mr. Worley also serves on the investment committees of Mount Holyoke College and World Wildlife Fund (a wildlife conservation organization).
Prior to joining Permit Capital LLC in 2002, Mr. Worley served as President, Chief Executive Officer, and Chief Investment Officer of Morgan Stanley Dean Witter Investment Management and as a Managing Director of Morgan Stanley, a financial services firm. Mr. Worley also was the Chairman of Miller Anderson & Sherrerd, an investment management firm that was acquired by Morgan Stanley in 1996.
Mr. Worley holds a B.S. degree from the University of Tennessee and pursued graduate studies in economics at the University of Texas.
The address of each Trustee is One Post Office Square, Boston, MA 02109.
As of June 30, 2008, there were 99 Putnam funds. All Trustees serve as Trustees of all Putnam funds.
Each Trustee serves for an indefinite term, until his or her resignation, retirement at age 72, death, or removal.
* Trustee who is an “interested person” (as defined in the Investment Company Act of 1940) of the fund, Putnam Management, and/or Putnam Retail Management. Mr. Haldeman is the President of your fund and each of the other Putnam funds and Chairman of Putnam Investment Management LLC, and prior to July 2008 was President and Chief Executive Officer of Putnam Investments.
35
Officers
In addition to Charles E. Haldeman, Jr., the other officers of the fund are shown below:
| Charles E. Porter (Born 1938) | James P. Pappas (Born 1953) | Wanda M. McManus (Born 1947) |
| Executive Vice President, Principal Executive | Vice President | Vice President, Senior Associate Treasurer |
| Officer, Associate Treasurer, and | Since 2004 | and Assistant Clerk |
| Compliance Liaison | Since 2005 | |
| Since 1989 | Managing Director, Putnam Investments and | |
| Putnam Management. During 2002, Chief | Nancy E. Florek (Born 1957) | |
| Jonathan S. Horwitz (Born 1955) | Operating Officer, Atalanta/Sosnoff | Vice President, Assistant Clerk, Assistant |
| Senior Vice President and Treasurer | Management Corporation | Treasurer and Proxy Manager |
| Since 2004 | Since 2005 | |
| Francis J. McNamara, III (Born 1955) | ||
| Prior to 2004, Managing Director, | Vice President and Chief Legal Officer | |
| Putnam Investments | Since 2004 | |
| Steven D. Krichmar (Born 1958) | Senior Managing Director, Putnam | |
| Vice President and Principal Financial Officer | Investments, Putnam Management | |
| Since 2002 | and Putnam Retail Management. Prior | |
| to 2004, General Counsel, State Street | ||
| Senior Managing Director, | Research & Management Company | |
| Putnam Investments | ||
| Robert R. Leveille (Born 1969) | ||
| Janet C. Smith (Born 1965) | Vice President and Chief Compliance Officer | |
| Vice President, Principal Accounting Officer | Since 2007 | |
| and Assistant Treasurer | ||
| Since 2007 | Managing Director, Putnam Investments | |
| Putnam Management, and Putnam Retail | ||
| Managing Director, Putnam Investments and | Management. Prior to 2004, member of | |
| Putnam Management | Bell Boyd & Lloyd LLC. Prior to 2003, | |
| Vice President and Senior Counsel, | ||
| Susan G. Malloy (Born 1957) | Liberty Funds Group LLC | |
| Vice President and Assistant Treasurer , | ||
| Since 2007 | Mark C. Trenchard (Born 1962) | |
| Vice President and BSA Compliance Officer | ||
| Managing Director, Putnam Investments | Since 2002 | |
| Beth S. Mazor (Born 1958) | Managing Director, Putnam Investments | |
| Vice President | ||
| Since 2002 | Judith Cohen (Born 1945) | |
| Vice President, Clerk and Assistant Treasurer | ||
| Managing Director, Putnam Investments | Since 1993 | |
The address of each Officer is One Post Office Square, Boston, MA 02109.
36
Fund information
Founded over 70 years ago, Putnam Investments was built around the concept that a balance between risk and reward is the hallmark of a well-rounded financial program. We manage nearly 100 mutual funds in growth, value, blend, fixed income, and international.
| Investment Manager | Officers | Wanda M. McManus |
| Putnam Investment | Charles E. Haldeman, Jr. | Vice President, Senior Associate Treasurer |
| Management, LLC | President | and Assistant Clerk |
| One Post Office Square | ||
| Boston, MA 02109 | Charles E. Porter | Nancy E. Florek |
| Executive Vice President, Principal | Vice President, Assistant Clerk, | |
| Investment Sub-Manager | Executive Officer, Associate Treasurer | Assistant Treasurer and Proxy Manager |
| Putnam Investments Limited | and Compliance Liaison | |
| 57-59 St. James’s Street | ||
| London, England SW1A 1LD | Jonathan S. Horwitz | |
| Senior Vice President and Treasurer | ||
| Marketing Services | ||
| Putnam Retail Management | Steven D. Krichmar | |
| One Post Office Square | Vice President and Principal Financial Officer | |
| Boston, MA 02109 | ||
| Janet C. Smith | ||
| Custodian | Vice President, Principal Accounting Officer | |
| State Street Bank and Trust Company | and Assistant Treasurer | |
| Legal Counsel | Susan G. Malloy | |
| Ropes & Gray LLP | Vice President and Assistant Treasurer | |
| Independent Registered Public | Beth S. Mazor | |
| Accounting Firm | Vice President | |
| PricewaterhouseCoopers LLP | ||
| James P. Pappas | ||
| Trustees | Vice President | |
| John A. Hill, Chairman | ||
| Jameson Adkins Baxter, Vice Chairman | Francis J. McNamara, III | |
| Charles B. Curtis | Vice President and Chief Legal Officer | |
| Robert J. Darretta | ||
| Myra R. Drucker | Robert R. Leveille | |
| Charles E. Haldeman, Jr. | Vice President and Chief Compliance Officer | |
| Paul L. Joskow | ||
| Elizabeth T. Kennan | Mark C. Trenchard | |
| Kenneth R. Leibler | Vice President and BSA Compliance Officer | |
| Robert E. Patterson | ||
| George Putnam, III | Judith Cohen | |
| Richard B. Worley | Vice President, Clerk and Assistant Treasurer | |
This report is for the information of shareholders of Putnam Europe Equity Fund. It may also be used as sales literature when preceded or accompanied by the current prospectus, the most recent copy of Putnam’s Quarterly Performance Summary, and Putnam’s Quarterly Ranking Summary. For more recent performance, please visit www.putnam.com. Investors should carefully consider the investment objective, risks, charges, and expenses of a fund, which are described in its prospectus. For this and other information or to request a prospectus, call 1-800-225-1581 toll free. Please read the prospectus carefully before investing. The fund’s Statement of Additional Information contains additional information about the fund and is available without charge upon request by calling 1-800-225-1581.

Item 2. Code of Ethics:
(a) The fund’s principal executive, financial and accounting officers are employees of Putnam Investment Management, LLC, the Fund's investment manager. As such they are subject to a comprehensive Code of Ethics adopted and administered by Putnam Investments which is designed to protect the interests of the firm and its clients. The Fund has adopted a Code of Ethics which incorporates the Code of Ethics of Putnam Investments with respect to all of its officers and Trustees who are employees of Putnam Investment Management, LLC. For this reason, the Fund has not adopted a separate code of ethics governing its principal executive, financial and accounting officers.
(c) In May 2008, the Code of Ethics of Putnam Investment Management, LLC was updated in its entirety to include the amendments adopted in August 2007 as well as a several additional technical, administrative and non-substantive changes.
Item 3. Audit Committee Financial Expert:
The Funds' Audit and Compliance Committee is comprised solely of Trustees who are "independent" (as such term has been defined by the Securities and Exchange Commission ("SEC") in regulations implementing Section 407 of the Sarbanes-Oxley Act (the "Regulations")). The Trustees believe that each of the members of the Audit and Compliance Committee also possess a combination of knowledge and experience with respect to financial accounting matters, as well as other attributes, that qualify them for service on the Committee. In addition, the Trustees have determined that each of Mr. Patterson, Mr. Leibler, Mr. Hill and Mr. Darretta meets the financial literacy requirements of the New York Stock Exchange's rules and qualifies as an "audit committee financial expert" (as such term has been defined by the Regulations) based on their review of his pertinent experience and education. Certain other Trustees, although not on the Audit and Compliance Committee, would also quali fy as "audit committee financial experts." The SEC has stated that the designation or identification of a person as an audit committee financial expert pursuant to this Item 3 of Form N-CSR does not impose on such person any duties, obligations or liability that are greater than the duties, obligations and liability imposed on such person as a member of the Audit and Compliance Committee and the Board of Trustees in the absence of such designation or identification.
Item 4. Principal Accountant Fees and Services:
The following table presents fees billed in each of the last two fiscal years for services rendered to the fund by the fund’s independent auditor:
| Fiscal | Audit- | |||
| year | Audit | Related | Tax | All Other |
| ended | Fees | Fees | Fees | Fees |
| June 30, 2008 | $82,622 | $-- | $5,245 | $161* |
| June 30, 2007 | $72,729 | $84 | $4,928 | $676* |
* Includes fees of $161 and $626 billed by the fund’s independent auditor to the fund for procedures necessitated by regulatory and litigation matters for the fiscal years ended June 30, 2008 and June 30, 2007, respectively. These fees were reimbursed to the fund by Putnam Investment Management, LLC (“Putnam Management”).
For the fiscal years ended June 30, 2008 and June 30, 2007, the fund’s independent auditor billed aggregate non-audit fees in the amounts of $52,468 and $135,905 respectively, to the fund, Putnam Management and any entity controlling, controlled by or under common control with Putnam Management that provides ongoing services to the fund.
Audit Fees represent fees billed for the fund's last two fiscal years relating to the audit and review of the financial statements included in annual reports and registration statements, and other services that are normally provided in connection with statutory and regulatory filings or engagements.
Audit-Related Fees represent fees billed in the fund’s last two fiscal years for services traditionally performed by the fund’s auditor, including accounting consultation for proposed transactions or concerning financial accounting and reporting standards and other audit or attest services not required by statute or regulation.
Tax Fees represent fees billed in the fund’s last two fiscal years for tax compliance, tax planning and tax advice services. Tax planning and tax advice services include assistance with tax audits, employee benefit plans and requests for rulings or technical advice from taxing authorities.
All Other Fees represent fees billed for services relating to an analysis of recordkeeping fees and procedures necessitated by regulatory and litigation matters.
Pre-Approval Policies of the Audit and Compliance Committee. The Audit and Compliance Committee of the Putnam funds has determined that, as a matter of policy, all work performed for the funds by the funds’ independent auditors will be pre-approved by the Committee itself and thus will generally not be subject to pre-approval procedures.
The Audit and Compliance Committee also has adopted a policy to pre-approve the engagement by Putnam Management and certain of its affiliates of the funds’ independent auditors, even in circumstances where pre-approval is not required by applicable law. Any such requests by Putnam Management or certain of its affiliates are typically submitted in writing to the Committee and explain, among other things, the nature of the proposed engagement, the estimated fees, and why this work should be performed by that particular audit firm as opposed to another one. In reviewing such requests, the Committee considers, among other things, whether the provision of such services by the audit firm are compatible with the independence of the audit firm.
The following table presents fees billed by the fund’s independent auditor for services required to be approved pursuant to paragraph (c)(7)(ii) of Rule 2-01 of Regulation S-X.
| Fiscal | Audit- | All | Total | |
| year | Related | Tax | Other | Non-Audit |
| ended | Fees | Fees | Fees | Fees |
| June 30, 2008 | $ - | $ 15,000 | $ - | $ - |
| June 30, 2007 | $ - | $ 41,129 | $ - | $ - |
Item 5. Audit Committee of Listed Registrants
Not applicable
Item 6. Schedule of Investments:
The registrant’s schedule of investments in unaffiliated issuers is included in the report to shareholders in Item 1 above.
Item 7. Disclosure of Proxy Voting Policies and Procedures For Closed-End Management Investment Companies:
Not applicable
Item 8. Portfolio Managers of Closed-End Investment Companies
Not Applicable
Item 9. Purchases of Equity Securities by Closed-End Management Investment Companies and Affiliated Purchasers:
Not applicable
Item 10. Submission of Matters to a Vote of Security Holders:
Not applicable
Item 11. Controls and Procedures:
(a) The registrant's principal executive officer and principal financial officer have concluded, based on their evaluation of the effectiveness of the design and operation of the registrant's disclosure controls and procedures as of a date within 90 days of the filing date of this report, that the design and operation of such procedures are generally effective to provide reasonable assurance that information required to be disclosed by the registrant in this report is recorded, processed, summarized and reported within the time periods specified in the Commission's rules and forms.
(b) Changes in internal control over financial reporting: Not applicable
Item 12. Exhibits:
(a)(1) The Code of Ethics of The Putnam Funds, which incorporates the Code of Ethics of Putnam Investments, is filed herewith.
(a)(2) Separate certifications for the principal executive officer and principal financial officer of the registrant as required by Rule 30a-2(a) under the Investment Company Act of 1940, as amended, are filed herewith.
(b) The certifications required by Rule 30a-2(b) under the Investment Company Act of 1940, as amended, are filed herewith.
SIGNATURES
Pursuant to the requirements of the Securities Exchange Act of 1934 and the Investment Company Act of 1940, the registrant has duly caused this report to be signed on its behalf by the undersigned, thereunto duly authorized.
Putnam Europe Equity Fund
By (Signature and Title):
/s/Janet C. Smith
Janet C. Smith
Principal Accounting Officer
Date: August 28, 2008
Pursuant to the requirements of the Securities Exchange Act of 1934 and the Investment Company Act of 1940, this report has been signed below by the following persons on behalf of the registrant and in the capacities and on the dates indicated.
By (Signature and Title):
/s/Charles E. Porter
Charles E. Porter
Principal Executive Officer
Date: August 28, 2008
By (Signature and Title):
/s/Steven D. Krichmar
Steven D. Krichmar
Principal Financial Officer
Date: August 28, 2008