| UNITED STATES | ||
| SECURITIES AND EXCHANGE COMMISSION | ||
| Washington, D.C. 20549 | ||
| FORM N-CSR | ||
| CERTIFIED SHAREHOLDER REPORT OF REGISTERED | ||
| MANAGEMENT INVESTMENT COMPANIES | ||
| Investment Company Act file number: (811-05693) | ||
| Exact name of registrant as specified in charter: | Putnam Europe Equity Fund | |
| Address of principal executive offices: One Post Office Square, Boston, Massachusetts 02109 | ||
| Name and address of agent for service: | Beth S. Mazor, Vice President | |
| One Post Office Square | ||
| Boston, Massachusetts 02109 | ||
| Copy to: | John W. Gerstmayr, Esq. | |
| Ropes & Gray LLP | ||
| One International Place | ||
| Boston, Massachusetts 02110 | ||
| Registrant’s telephone number, including area code: | (617) 292-1000 | |
| Date of fiscal year end: June 30, 2010 | ||
| Date of reporting period: July 1, 2009 — June 30, 2010 | ||
Item 1. Report to Stockholders:
The following is a copy of the report transmitted to stockholders pursuant to Rule 30e-1 under the Investment Company Act of 1940:
Putnam
Europe Equity
Fund
Annual report
6 | 30 | 10
| Message from the Trustees | 1 | |
| About the fund | 2 | |
| Performance snapshot | 4 | |
| Interview with your fund’s portfolio manager | 5 | |
| Your fund’s performance | 10 | |
| Your fund’s expenses | 12 | |
| Terms and definitions | 14 | |
| Trustee approval of management contract | 15 | |
| Other information for shareholders | 20 | |
| Financial statements | 21 | |
| Federal tax information | 41 | |
| Shareholder meeting results | 42 | |
| About the Trustees | 44 | |
| Officers | 46 | |
Message from the Trustees
Dear Fellow Shareholder:
A number of developments weighed on U.S. and global markets in the second quarter. European debt woes, hints of an economic slowdown in China, and skepticism over the durability of the U.S. recovery have caused unwelcome volatility.
Compared with 2009’s sharp rebound, today’s investment environment requires a greater degree of investment skill, innovation, and expertise. We believe these attributes form the very core of Putnam’s analytic, active-management approach. It is important to recognize that volatility is not new to the markets. Patient investors know that these periods often present opportunities for market advances. With this in mind, we encourage you to focus on portfolio diversification and rely on the expertise of your financial advisor.
In other developments, Barbara M. Baumann has been elected to the Board of Trustees of the Putnam Funds, effective July 1, 2010. Ms. Baumann is president and owner of Cross Creek Energy Corporation of Denver, Colorado, a strategic consultant to domestic energy firms and direct investor in energy assets. We also want to thank Elizabeth T. Kennan, who recently retired from the Board of Trustees, for her many years of dedicated and thoughtful leadership.
Lastly, we would like to take this opportunity to welcome new shareholders to the fund and to thank all of our investors for your continued confidence in Putnam.

About the fund
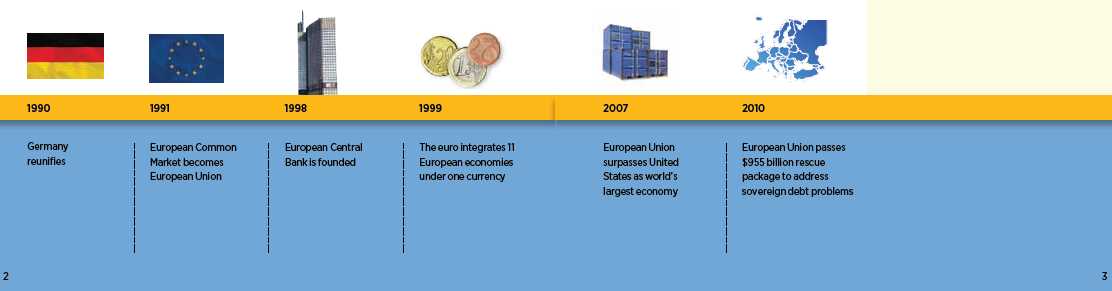
Pursuing growth in European markets since 1990
As a shareholder of Putnam Europe Equity Fund, you are seeking to benefit from opportunities in one of the world’s most developed economic regions. While international investing involves additional risks, Europe has a long history of capitalism and stock investing, and the region continues to evolve. Today, the 27 member states of the European Union, with approximately 500 million people, form a large, integrated economy that exports more goods and services than any nation in the world.
With these advantages, it is not surprising that European companies are leaders in many business sectors, including financials, health care, and telecommunications. If you look at the products or services you use every day — from cars and cell phones to household products — you are likely to find many items made by European companies.
At the macroeconomic level, European stocks can offer diversification to U.S. investors because Europe can follow a different business cycle than that of the United States. In Europe, interest rates and monetary policy are set by the European Central Bank, the Bank of England, and other central banks.
While different economic systems, political developments, and currencies like the euro, the British pound, and the Swiss franc can add risk, they also provide diversification for U.S.-based investors. Though international markets can experience downturns, investing internationally gives investors a chance to keep building wealth even if U.S. stocks struggle.
Since 1990, Putnam Europe Equity Fund has served investors by seeking to invest in attractively valued companies across European markets. Pursuing Putnam’s “blend” strategy, the fund’s manager targets stocks believed to be worth more than their current stock prices indicate, and seeks to perform well whether growth- or value-style stocks are leading international markets. The manager selects stocks and determines market and sector weightings relying in part on the proprietary research of Putnam analysts based in Boston and London.
Consider these risks before investing: International investing involves certain risks, such as currency fluctuations, economic instability, and political developments. Additional risks may be associated with emerging-market securities, including illiquidity and volatility. The fund invests some or all of its assets in small and/or midsize companies. Such investments increase the risk of fluctuations in the value of your investment. The fund concentrates its investments by region and involves more risk than a fund that invests more broadly. The use of derivatives involves special risks and may result in losses. While diversification can help protect your returns from excessive volatility, it cannot protect against market losses.
In-depth analysis is key to successful stock selection.
Drawing on the expertise of a dedicated team of stock analysts, the fund’s portfolio manager seeks stocks that are believed to be underpriced by the market. Once a stock is selected for the portfolio, it is regularly assessed to ensure that it continues to be attractive. Criteria include:
Valuation The manager carefully considers how each stock is valued, seeking stocks whose valuations are attractive relative to the company’s growth potential and capital requirements.
Cash flow The manager examines each company’s financials, particularly the amount of cash a company generates relative to the earnings that it reports, and projects its ability to generate cash returns going forward.
Quality The manager evaluates high-quality companies with characteristics such as solid management teams and sound business models.
Developments and events that have affected European markets
Current performance may be lower or higher than the quoted past performance, which cannot guarantee future results. Share price, principal value, and return will fluctuate, and you may have a gain or a loss when you sell your shares. Performance of class A shares assumes reinvestment of distributions and does not account for taxes. Fund returns in the bar chart do not reflect a sales charge of 5.75%; had they, returns would have been lower. See pages 5 and 10–12 for additional performance information. For a portion of the periods, the fund had expense limitations, without which returns would have been lower. A short-term trading fee of 1% may apply to redemptions or exchanges from certain funds within the time period specified in the fund’s prospectus. To obtain the most recent month-end performance, visit putnam.com.
4
Interview with your
fund’s portfolio manager
Simon (Sam) Davis
How did Putnam Europe Equity Fund perform during the 12-month period?
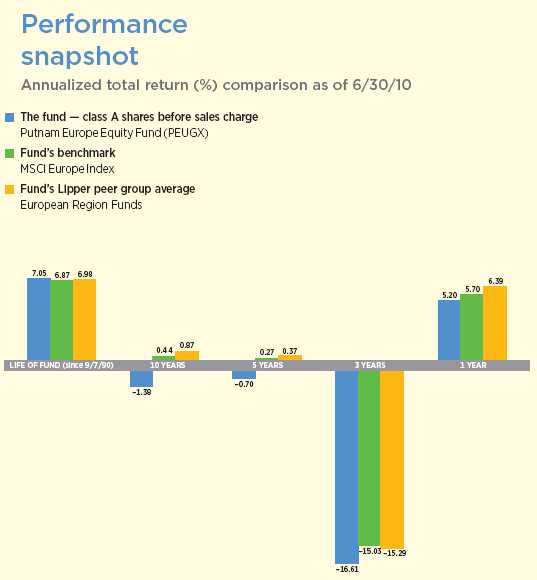
Despite the sharp correction in stock prices this past spring, the fund had a significant tail wind going into the correction, which contributed to positive returns for the fiscal year. For the fiscal year ended June 30, 2010, the fund’s class A shares rose 5.20% at net asset value, while the fund’s benchmark, the MSCI Europe Index, climbed 5.70%. The average return for the fund’s Lipper peer group, European Region Funds, was 6.39% for the same period.
What were stock market conditions like across Europe for the period?
During the second half of 2009, which coincided with the first half of the fund’s 2010 fiscal year, European stocks rallied strongly in response to accommodative monetary and fiscal policies that kept interest rates low and bolstered growth. During this time, lower-quality stocks that had been aggressively sold off in the prior correction outperformed higher-quality stocks as investors demonstrated a willingness to take on more risk. However, sovereign risk in Europe became more worrisome when Greece’s national debt was downgraded in December. By the spring of 2010, it became clear that Portugal, Italy, Ireland, and Spain were also facing difficulty in meeting their debt obligations. European stocks tumbled sharply on concerns that the crisis would spread throughout Europe. With investors exiting equities in favor of safe haven investments, global stocks followed suit on fears that the world economy was hea ded for a double-dip recession.
Efforts by the European Central Bank [ECB] and the International Monetary Fund [IMF] to address challenges across the eurozone, particularly the establishment of a $900+ billion bailout fund for Greece and other

This comparison shows your fund’s performance in the context of broad market indexes for the 12 months ended 6/30/10. See pages 4 and 10–12 for additional fund performance information. Index descriptions can be found on page 14.
5
debt-laden European Monetary Union [EMU] countries, helped to assuage fears and removed the specter of immediate systemic risk. Nevertheless, during the second quarter of 2010, European stocks posted a loss of 15.2% as measured by the MSCI Europe Index — making this three-month period the worst quarter since the final three months of 2008 when the global financial crisis destabilized world markets.
What investments influenced fund performance?
Stock picking in energy, technology, and metals and mining within the materials sector was positive for performance. Our decision to sell BP at its peak in late April and add the stock back to the portfolio in late May at a depressed price was especially beneficial. Aixtron, the German-based technology company that manufactures equipment for the semiconductor and LED industries, and Vedanta Resources, the iron ore and copper producer, also generated positive performance. Aixtron was sold in April to lock in profits.
Not holding Novo Nordisk, which is a world leader in diabetes care, or iron ore and coal producer Rio Tinto detracted from the fund’s performance. This past March, we realigned the metals and mining exposure by selling positions in BHP and Eurasian Natural Resources and reinvesting the proceeds in Rio Tinto, which offered a better balance of risk and potential return. However, the fund’s biggest disappointment was Gartmore Group, which we bought when it came to market in an initial public offering during the period. When trading irregularities came to light, we held the stock until its price recovered a b it and subsequently sold it. Finally, the French video software manufacturer Ubisoft Entertainment detracted from performance and was sold this spring when its performance failed to measure up to our expectations.
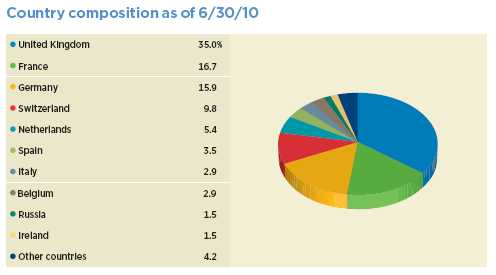
The top 10 country allocations represent 95.1% of the fund’s net assets. The remaining balance of the fund’s portfolio is invested in five other countries. Data excludes exposure to some countries achieved through various derivative instruments. Weightings will vary over time. Due to rounding, percentages may not equal 100%.
6
“Global growth is likely to continue,
but the recovery will be slow and
uneven with the emerging markets
leading the developed markets.”
Sam Davis
How did you adjust the fund’s investment strategy in light of the volatile market conditions?
During the first half of the period, when markets were rallying, our stock selection in the basic materials, information technology, and consumer cyclicals sectors was favorable. Many companies were benefiting from improving economic conditions, including the fund’s investments in copper producer Kazakhmys. With strong demand from China, copper prices rose and ultimately pushed the company’s stock price higher.
Midway through the fiscal year, however, we became concerned that some areas of the market had moved ahead of themselves. Consequently, we took profits by selling positions in these companies. We also increased the fund’s exposure to defensive companies that had lagged in the rally and that offered strong earnings potential and sustainable growth, and were well positioned to gain market share. The fund’s investments in the contract catering company Compass Group exemplifies our strategy here.
How has the sovereign debt crisis affected the value of the euro?
The European debt crisis has had a dampening effect on the value of the euro, which is a key barometer of confidence in Europe’s economy. The euro dropped to its lowest point since the first quarter of 2006 on June 7, falling 20.8% against the U.S. dollar since its most recent peak on December 3, 2009. The euro has since rebounded but has not recouped all its losses since the sovereign debt crisis began.
The fall in the euro has increased the relative competitiveness of exporters across the eurozone, giving a boost to economic
Top 10 holdings
| HOLDING (percentage of fund’s net assets) | COUNTRY | SECTOR/INDUSTRY |
| Royal Dutch Shell PLC (4.4%) | United Kingdom | Energy/Oil and gas |
| Roche Holding AG (3.8%) | Switzerland | Health care/Pharmaceuticals |
| GlaxoSmithKline PLC (3.6%) | United Kingdom | Health care/Pharmaceuticals |
| Sanofi-Aventis (3.2%) | France | Health care/Pharmaceuticals |
| BNP Paribas SA (2.7%) | France | Financials/Banking |
| Nestle SA (2.4%) | Switzerland | Consumer staples/Food |
| Total SA (2.3%) | France | Energy/Oil and gas |
| Reckitt Benckiser Group PLC (2.3%) | United Kingdom | Consumer staples/Consumer goods |
| Zurich Financial Services AG (2.2%) | Switzerland | Financials/Insurance |
| Rio Tinto PLC (2.1%) | United Kingdom | Basic materials/Metals |
This table shows the fund’s top 10 holdings and the percentage of the fund’s net assets that each represented as of 6/30/10. Short-term holdings are excluded. Holdings will vary over time.
7
growth, especially in Germany’s large manufacturing and export base. Fund holding MTU Aero Engines, which is a leading aircraft engine manufacturer based in Germany and a provider of commercial engine maintenance services, was a top performer. While several members of the EMU face significant fiscal problems, in its aggregate, we think the overall fiscal situation of the eurozone appears stronger than that of the United States. This may provide support for the euro versus the dollar as markets move to focus on this issue over time.
Concern over the sustainability of sovereign debt in the eurozone has contributed to turmoil in the global markets and speculation that the future of the monetary union may be in jeopardy. While the common currency was created to bring nations together, the global recession has highlighted some of the flaws in the EMU’s structure. Not least, it is a monetary union with a common central bank setting monetary policy for the entire region, but it has limited control over fiscal policy, and member nations have pursued divergent strategies over the past decade that were often inconsistent with ECB monetary settings.
The bailout package for troubled eurozone members may have a positive effect in the short term, but long-term structural issues remain, such as the ability of troubled countries to maintain fiscal discipline in the face of social unrest while also boosting employment and productivity. Thus, it’s fair to say that the probability that the structure of the EMU might change in the future has risen considerably given the sovereign debt crisis.
How have the EMU’s challenges affected investment decisions for the fund?
The fund’s positioning has taken into account the vulnerability of various economies within the EMU that have the potential to cause broader ripple effects. We have preferred to invest in countries with relatively stronger fiscal discipline, especially in the financials sector where funding costs are tied to the borrowing costs of governments. We’re also exploiting opportunities among companies benefiting from the weakness in the euro. As of June 30, 2010, the United Kingdom, which is not a member of the EMU, made up the largest percentage of fund holdings by country,
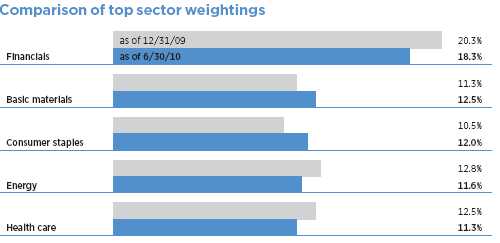
This chart shows how the fund’s top weightings have changed over the past six months. Weightings are shown as a percentage of net assets. Holdings will vary over time.
8
followed by France, Germany, and Switzerland, which also has a separate currency.
What is your outlook for European stocks?
Just a few weeks into the fund’s new fiscal year, European markets have shown signs of stabilizing, given growing confidence that Europe’s sovereign debt issues will be resolved, the relatively strong performance of Germany’s economy, and the strong economic data coming out of the emerging markets.
We believe that global growth is likely to continue, but the recovery will be slow and uneven with the emerging markets leading the developed markets, which are in the process of unraveling government stimulus programs. With their healthier fiscal position and much stronger domestic demand, emerging markets should remain robust and help fuel global economic growth. We believe that central banks are likely to keep interest rates low for the foreseeable future to foster stronger growth, and corporate profitability should continue to recover. In this challenging environment, we will be looking to invest in stable, well-capitalized companies that pay an attractive dividend, as well as businesses that can grow through innovation, technology, and an increase in market share. Valuation will remain a key part of our investment process, and we will also pay close attention to sustainability of earnings growth.
Thank you, Sam, for your time and insights today.
The views expressed in this report are exclusively those of Putnam Management. They are not meant as investment advice.
Please note that the holdings discussed in this report may not have been held by the fund for the entire period. Portfolio composition is subject to review in accordance with the fund’s investment strategy and may vary in the future. Current and future portfolio holdings are subject to risk.

Portfolio Manager Simon Davis is Head of International Large Cap Equities at Putnam. He has a B.A. from Oxford University. Simon joined Putnam in 2000 and has been in the investment industry since 1988.
IN THE NEWS
The International Monetary Fund (IMF) recently boosted its forecast for global growth this year to 4.6%, up from 4.2% projected in April. The world’s economy grew strongly during the first half of 2010, propelled by rapid growth in Asia, including 11% GDP growth in China. Western economies maintained a modest, but steady recovery. Despite the positive trend, the IMF warned that risks to further growth have risen and that there have been setbacks in progress toward global financial stability. Government debt loads in Europe, notably in Greece, Portugal, and Spain, were particularly troublesome, in the agency’s view.
9
Your fund’s performance
This section shows your fund’s performance, price, and distribution information for periods ended June 30, 2010, the end of its most recent fiscal year. In accordance with regulatory requirements for mutual funds, we also include expense information taken from the fund’s current prospectus. Performance should always be considered in light of a fund’s investment strategy. Data represents past performance. Past performance does not guarantee future results. More recent returns may be less or more than those shown. Investment return and principal value will fluctuate, and you may have a gain or a loss when you sell your shares. Performance information does not reflect any deduction for taxes a shareholder may owe on fund distributions or on the redemption of fund shares. For the most recent month-end performance, please visit the Individual Investors section at putnam.com or call Putnam at 1-800-225-1581. Class Y shares are generally only a vailable to corporate and institutional clients and clients in other approved programs. See the Terms and Definitions section in this report for definitions of the share classes offered by your fund.
Fund performance Total return for periods ended 6/30/10
| Class A | Class B | Class C | Class M | Class R | Class Y | |||||
| (inception dates) | (9/7/90) | (2/1/94) | (7/26/99) | (12/1/94) | (12/1/03) | (10/4/05) | ||||
| NAV | POP | NAV | CDSC | NAV | CDSC | NAV | POP | NAV | NAV | |
| Annual average | ||||||||||
| (life of fund) | 7.05% | 6.73% | 6.25% | 6.25% | 6.25% | 6.25% | 6.54% | 6.35% | 6.80% | 7.11% |
| 10 years | –13.00 | –18.00 | –19.32 | –19.32 | –19.24 | –19.24 | –17.30 | –20.19 | –14.85 | –11.96 |
| Annual average | –1.38 | –1.96 | –2.12 | –2.12 | –2.11 | –2.11 | –1.88 | –2.23 | –1.59 | –1.27 |
| 5 years | –3.46 | –9.02 | –6.98 | –8.49 | –6.92 | –6.92 | –5.83 | –9.14 | –4.36 | –2.31 |
| Annual average | –0.70 | –1.87 | –1.44 | –1.76 | –1.42 | –1.42 | –1.19 | –1.90 | –0.89 | –0.47 |
| 3 years | –42.02 | –45.35 | –43.30 | –44.71 | –43.27 | –43.27 | –42.90 | –44.90 | –42.41 | –41.59 |
| Annual average | –16.61 | –18.24 | –17.23 | –17.92 | –17.22 | –17.22 | –17.04 | –18.02 | –16.80 | –16.41 |
| 1 year | 5.20 | –0.83 | 4.42 | –0.58 | 4.45 | 3.45 | 4.64 | 0.99 | 4.97 | 5.41 |
Current performance may be lower or higher than the quoted past performance, which cannot guarantee future results. After-sales-charge returns (public offering price, or POP) for class A and M shares reflect a maximum 5.75% and 3.50% load, respectively. Class B share returns reflect the applicable contingent deferred sales charge (CDSC), which is 5% in the first year, declining to 1% in the sixth year, and is eliminated thereafter. Class C shares reflect a 1% CDSC for the first year that is eliminated thereafter. Class R and Y shares have no initial sales charge or CDSC. Performance for class B, C, M, R, and Y shares before their inception is derived from the historical performance of class A shares, adjusted for the applicable sales charge (or CDSC) and, except for class Y shares, the higher operating expenses for such shares.
Class B share performance does not assume conversion to class A shares.
For a portion of the periods, the fund had expense limitations, without which returns would have been lower.
A short-term trading fee of 1% may apply to redemptions or exchanges from certain funds within the time period specified in the fund’s prospectus.
10
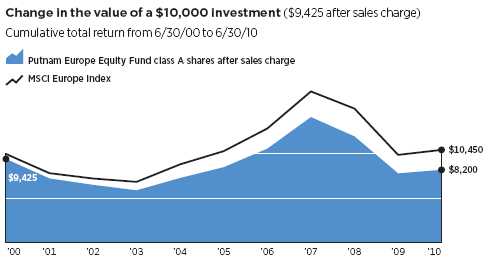
Past performance does not indicate future results. At the end of the same time period, a $10,000 investment in the fund’s class B and class C shares would have been valued at $8,068 and $8,076, respectively, and no contingent deferred sales charges would apply. A $10,000 investment in the fund’s class M shares ($9,650 after sales charge) would have been valued at $7,981 at public offering price. A $10,000 investment in the fund’s class R and class Y shares would have been valued at $8,515 and $8,804, respectively.
Comparative index returns For periods ended 6/30/10
| Lipper European Region Funds | ||
| MSCI Europe Index | category average* | |
| Annual average | ||
| (life of fund) | 6.87% | 6.98% |
| 10 years | 4.50 | 14.95 |
| Annual average | 0.44 | 0.87 |
| 5 years | 1.36 | 3.04 |
| Annual average | 0.27 | 0.37 |
| 3 years | –38.65 | –38.82 |
| Annual average | –15.03 | –15.29 |
| 1 year | 5.70 | 6.39 |
Index and Lipper results should be compared to fund performance at net asset value.
* Over the 1-year, 3-year, 5-year, 10-year, and life-of-fund periods ended 6/30/10, there were 108, 95, 87, 58, and 8 funds, respectively, in this Lipper category.
11
Fund price and distribution information For the 12-month period ended 6/30/10
| Distributions | Class A | Class B | Class C | Class M | Class R | Class Y | ||
| Number | 1 | — | — | 1 | 1 | 1 | ||
| Income | $0.090 | — | — | $0.005 | $0.064 | $0.131 | ||
| Capital gains | — | — | — | — | — | — | ||
| Total | $0.090 | — | — | $0.005 | $0.064 | $0.131 | ||
| Share value | NAV | POP | NAV | NAV | NAV | POP | NAV | NAV |
| 6/30/09 | $15.12 | $16.04 | $14.48 | $14.84 | $14.96 | $15.50 | $14.97 | $15.19 |
| 6/30/10 | 15.83 | 16.80 | 15.12 | 15.50 | 15.65 | 16.22 | 15.66 | 15.90 |
The classification of distributions, if any, is an estimate. Final distribution information will appear on your year-end tax forms.
Your fund’s expenses
As a mutual fund investor, you pay ongoing expenses, such as management fees, distribution fees (12b-1 fees), and other expenses. Using the following information, you can estimate how these expenses affect your investment and compare them with the expenses of other funds. You may also pay one-time transaction expenses, including sales charges (loads) and redemption fees, which are not shown in this section and would have resulted in higher total expenses. For more information, see your fund’s prospectus or talk to your financial representative.
Expense ratios
| Class A | Class B | Class C | Class M | Class R | Class Y | |
| Total annual operating expenses for the fiscal year | ||||||
| ended 6/30/09* | 1.57% | 2.32% | 2.32% | 2.07% | 1.82% | 1.32% |
| Annualized expense ratio for the six-month period | ||||||
| ended 6/30/10† | 1.46% | 2.21% | 2.21% | 1.96% | 1.71% | 1.21% |
Fiscal-year expense information in this table is taken from the most recent prospectus, is subject to change, and may differ from that shown for the annualized expense ratio and in the financial highlights of this report. Expenses are shown as a percentage of average net assets.
* Annual operating expenses have been revised to reflect projected expenses based on a new expense arrangement and the fund’s 6/30/09 asset level.
† For the fund’s most recent fiscal half year; may differ from expense ratios based on one-year data in the financial highlights.
12
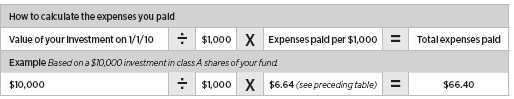
Expenses per $1,000
The following table shows the expenses you would have paid on a $1,000 investment in Putnam Europe Equity Fund from January 1, 2010, to June 30, 2010. It also shows how much a $1,000 investment would be worth at the close of the period, assuming actual returns and expenses.
| Class A | Class B | Class C | Class M | Class R | Class Y | |
| Expenses paid per $1,000*† | $6.64 | $10.03 | $10.03 | $8.90 | $7.77 | $5.50 |
| Ending value (after expenses) | $833.20 | $830.30 | $829.80 | $830.70 | $832.10 | $833.80 |
* Expenses for each share class are calculated using the fund’s annualized expense ratio for each class, which represents the ongoing expenses as a percentage of average net assets for the six months ended 6/30/10. The expense ratio may differ for each share class.
† Expenses are calculated by multiplying the expense ratio by the average account value for the period; then multiplying the result by the number of days in the period; and then dividing that result by the number of days in the year.
Estimate the expenses you paid
To estimate the ongoing expenses you paid for the six months ended June 30, 2010, use the following calculation method. To find the value of your investment on January 1, 2010, call Putnam at 1-800-225-1581.
Compare expenses using the SEC’s method
The Securities and Exchange Commission (SEC) has established guidelines to help investors assess fund expenses. Per these guidelines, the following table shows your fund’s expenses based on a $1,000 investment, assuming a hypothetical 5% annualized return. You can use this information to compare the ongoing expenses (but not transaction expenses or total costs) of investing in the fund with those of other funds. All mutual fund shareholder reports will provide this information to help you make this comparison. Please note that you cannot use this information to estimate your actual ending account balance and expenses paid during the period.
| Class A | Class B | Class C | Class M | Class R | Class Y | |
| Expenses paid per $1,000*† | $7.30 | $11.03 | $11.03 | $9.79 | $8.55 | $6.06 |
| Ending value (after expenses) | $1,017.55 | $1,013.84 | $1,013.84 | $1,015.08 | $1,016.31 | $1,018.79 |
* Expenses for each share class are calculated using the fund’s annualized expense ratio for each class, which represents the ongoing expenses as a percentage of average net assets for the six months ended 6/30/10. The expense ratio may differ for each share class.
† Expenses are calculated by multiplying the expense ratio by the average account value for the period; then multiplying the result by the number of days in the period; and then dividing that result by the number of days in the year.
13
Terms and definitions
Important terms
Total return shows how the value of the fund’s shares changed over time, assuming you held the shares through the entire period and reinvested all distributions in the fund.
Net asset value (NAV) is the price, or value, of one share of a mutual fund, without a sales charge. NAVs fluctuate with market conditions. NAV is calculated by dividing the net assets of each class of shares by the number of outstanding shares in the class.
Public offering price (POP) is the price of a mutual fund share plus the maximum sales charge levied at the time of purchase. POP performance figures shown here assume the 5.75% maximum sales charge for class A shares and 3.50% for class M shares.
Contingent deferred sales charge (CDSC) is generally a charge applied at the time of the redemption of class B or C shares and assumes redemption at the end of the period. Your fund’s class B CDSC declines from a 5% maximum during the first year to 1% during the sixth year. After the sixth year, the CDSC no longer applies. The CDSC for class C shares is 1% for one year after purchase.
Share classes
Class A shares are generally subject to an initial sales charge and no CDSC (except on certain redemptions of shares bought without an initial sales charge).
Class B shares are not subject to an initial sales charge. They may be subject to a CDSC.
Class C shares are not subject to an initial sales charge and are subject to a CDSC only if the shares are redeemed during the first year.
Class M shares have a lower initial sales charge and a higher 12b-1 fee than class A shares and no CDSC (except on certain redemptions of shares bought without an initial sales charge).
Class R shares are not subject to an initial sales charge or CDSC and are available only to certain defined contribution plans.
Class Y shares are not subject to an initial sales charge or CDSC, and carry no 12b-1 fee. They are generally only available to corporate and institutional clients and clients in other approved programs.
Comparative indexes
Barclays Capital Aggregate Bond Index is an unmanaged index of U.S. investment-grade fixed-income securities.
BofA (Bank of America) Merrill Lynch U.S. 3-Month Treasury Bill Index is an unmanaged index that seeks to measure the performance of U.S. Treasury bills available in the marketplace.
Morgan Stanley Capital International (MSCI) Europe Index is an unmanaged index of Western European equity securities.
S&P 500 Index is an unmanaged index of common stock performance.
Indexes assume reinvestment of all distributions and do not account for fees. Securities and performance of a fund and an index will differ. You cannot invest directly in an index.
Lipper is a third-party industry-ranking entity that ranks mutual funds. Its rankings do not reflect sales charges. Lipper rankings are based on total return at net asset value relative to other funds that have similar current investment styles or objectives as determined by Lipper. Lipper may change a fund’s category assignment at its discretion. Lipper category averages reflect performance trends for funds within a category.
14
Trustee approval of management contract
General conclusions
The Board of Trustees of the Putnam funds oversees the management of each fund and, as required by law, determines annually whether to approve the continuance of your fund’s management contract with Putnam Investment Management (“Putnam Management”), the sub-management contract with respect to your fund between Putnam Management and its affiliate, Putnam Investments Limited (“PIL”), and the sub-advisory contract with respect to your fund among Putnam Management, PIL, and another affiliate, Putnam Advisory Company (“PAC”).
In this regard, the Board of Trustees, with the assistance of its Contract Committee consisting solely of Trustees who are not “interested persons” (as this term is defined in the Investment Company Act of 1940, as amended) of the Putnam funds (the “Independent Trustees”), requests and evaluates all information it deems reasonably necessary under the circumstances. Over the course of several months ending in June 2010, the Contract Committee met several times with representatives of Putnam Management and in executive session to consider the information provided by Putnam Management and other information developed with the assistance of the Board’s independent counsel and independent staff. The Contract Committee reviewed and discussed key aspects of this information with all of the Independent Trustees. At the Trustees’ June 11, 2010 meeting, the Contract Committee recommended, and the Independent Trustees approved, the co ntinuance of your fund’s management, sub-management and sub-advisory contracts, effective July 1, 2010. (Because PIL and PAC are affiliates of Putnam Management and Putnam Management remains fully responsible for all services provided by PIL and PAC, the Trustees have not evaluated PIL or PAC as separate entities, and all subsequent references to Putnam Management below should be deemed to include reference to PIL and PAC as necessary or appropriate in the context.)
The Independent Trustees’ approval was based on the following conclusions:
• That the fee schedule in effect for your fund represented reasonable compensation in light of the nature and quality of the services being provided to the fund, the fees paid by competitive funds, and the costs incurred by Putnam Management in providing such services, and
• That the fee schedule represented an appropriate sharing between fund shareholders and Putnam Management of such economies of scale as may exist in the management of the fund at current asset levels.
These conclusions were based on a comprehensive consideration of all information provided to the Trustees and were not the result of any single factor. Some of the factors that figured particularly in the Trustees’ deliberations and how the Trustees considered these factors are described below, although individual Trustees may have evaluated the information presented differently, giving different weights to various factors. It is also important to recognize that the fee arrangements for your fund and the other Putnam funds are the result of many years of review and discussion between the Independent Trustees and Putnam Management, that certain aspects of the arrangements may receive greater scrutiny in some years than others, and that the Trustees’ conclusions may be based, in part, on their consideration of fee arrangements in prior years.
Consideration of implementation of strategic pricing initiative
The Trustees were mindful that new management contracts had been implemented for all but
15
a few funds at the beginning of 2010 as part of Putnam Management’s strategic pricing initiative. These new management contracts reflected the implementation of more competitive fee levels for many funds, complex-wide breakpoints for the open-end funds and performance fees for certain funds. The Trustees had approved these new management contracts on July 10, 2009 and submitted them to shareholder meetings of the affected funds in late 2009, where the contracts were in all cases approved by overwhelming majorities of the shares voted.
Because the management contracts had been implemented only recently, the Contract Committee had limited practical experience with the operation of the new fee structures. The financial data available to the Committee reflected actual operations under the prior contracts; information was also available on a pro forma basis, adjusted to reflect the fees payable under the new management contracts. In light of the limited information available regarding operations under the new management contracts, in recommending the continuation of the new management contracts in June 2010, the Contract Committee relied to a considerable extent on its review of the financial information and analysis that formed the basis of the Board’s approval of the new management contracts on July 10, 2009.
Management fee schedules and categories; total expenses
The Trustees reviewed the management fee schedules in effect for all Putnam funds, including fee levels and breakpoints. In reviewing management fees, the Trustees generally focus their attention on material changes in circumstances — for example, changes in assets under management or investment style, changes in Putnam Management’s operating costs, or changes in competitive practices in the mutual fund industry — that suggest that consideration of fee changes might be warranted. The Trustees concluded that the circumstances did not warrant changes to the management fee structure of your fund.
As in the past, the Trustees continued to focus on the competitiveness of the total expense ratio of each fund. In order to ensure that expenses of the Putnam funds continue to meet evolving competitive standards, the Trustees and Putnam Management agreed in 2009 to implement: (i) a contractual expense limitation applicable to all retail open-end funds of 37.5 basis points on investor servicing fees and expenses and (ii) a contractual expense limitation applicable to all open-end funds of 20 basis points on so-called “other expenses” (i.e., all expenses exclusive of management fees, investor servicing fees, distribution fees, taxes, brokerage commissions and extraordinary expenses). These expense limitations serve in particular to maintain competitive expense levels for funds with large numbers of small shareholder accounts and funds with relatively small net asset s.
The Trustees reviewed comparative fee and expense information for competitive funds, which indicated that, in a custom peer group of competitive funds selected by Lipper Inc., your fund ranked in the 25th percentile in effective management fees (determined for your fund and the other funds in the custom peer group based on fund asset size and the applicable contractual management fee schedule) and in the 31st percentile in total expenses (less any applicable 12b-1 fees) as of December 31, 2009 (the first percentile representing the least expensive funds and the 100th percentile the most expensive funds). The Trustees also considered that your fund ranked in the 1st percentile in effective management fees, on a pro forma basis adjusted to reflect the impact of the strategic pricing initiative discussed above, as of December 31, 2009.
16
Your fund currently has the benefit of breakpoints in its management fee that provide shareholders with significant economies of scale in the form of reduced fee levels as assets under management in the Putnam family of funds increase. The Contract Committee observed that the complex-wide breakpoints of the open-end funds have only been in place for a short while, and the Trustees will examine the operation of this new breakpoint structure in future years in light of actual experience.
In connection with their review of the management fees and total expenses of the Putnam funds, the Trustees also reviewed the costs of the services provided and profits realized by Putnam Management and its affiliates from their contractual relationships with the funds. This information included trends in revenues, expenses and profitability of Putnam Management and its affiliates relating to the investment management, investor servicing and distribution services provided to the funds. In this regard, the Trustees also reviewed an analysis of Putnam Management’s revenues, expenses and profitability, allocated on a fund-by-fund basis, with respect to the funds’ management, distribution, and investor servicing contracts. For each fund, the analysis presented information about revenues, expenses and profitability for each of the agreements separately and for the agreements taken together on a combined basis. The Trustees concluded that, at curre nt asset levels, the fee schedules currently in place represented an appropriate sharing of economies of scale at that time.
The information examined by the Trustees as part of their annual contract review for the Putnam funds has included for many years information regarding fees charged by Putnam Management and its affiliates to institutional clients such as defined benefit pension plans, college endowments, and the like. This information included comparisons of such fees with fees charged to the funds, as well as a detailed assessment of the differences in the services provided to these two types of clients. The Trustees observed, in this regard, that the differences in fee rates between institutional clients and mutual funds are by no means uniform when examined by individual asset sectors, suggesting that differences in the pricing of investment management services to these types of clients may reflect historical competitive forces operating in separate market places. The Trustees considered the fact that fee rates across different as set classes are typically higher on average for mutual funds than for institutional clients, as well as the differences between the services that Putnam Management provides to the Putnam funds and those that it provides to institutional clients of the firm, and did not rely on these comparisons to any significant extent in concluding that the management fees paid by your fund are reasonable.
Investment performance
The quality of the investment process provided by Putnam Management represented a major factor in the Trustees’ evaluation of the quality of services provided by Putnam Management under your fund’s management contract. The Trustees were assisted in their review of the Putnam funds’ investment process and performance by the work of the Investment Oversight Coordinating Committee of the Trustees and the Investment Oversight Committees of the Trustees, which met on a regular monthly basis with the funds’ portfolio teams throughout the year. The Trustees concluded that Putnam Management generally provides a high-quality investment process — as measured by the experience and skills of the individuals assigned to the management of fund portfolios, the resources made available to such personnel, and in general the ability of Putnam Management to attract and retain high-quality personnel — but also recognized that this does not gu arantee favorable investment results for
17
every fund in every time period. The Trustees considered the investment performance of each fund over multiple time periods and considered information comparing each fund’s performance with various benchmarks and with the performance of competitive funds.
The Committee noted the substantial improvement in the performance of most Putnam funds during 2009. The Committee also noted the disappointing investment performance of a number of the funds for periods ended December 31, 2009 and considered information provided by Putnam Management regarding the factors contributing to the underperformance and actions being taken to improve performance. The Trustees recognized that, in recent years, Putnam Management has taken steps to strengthen its investment personnel and processes to address areas of underperformance, including Putnam Management’s continuing efforts to strengthen the equity research function, recent changes in portfolio managers, increased accountability of individual managers rather than teams, recent changes in Putnam Management’s approach to incentive compensation, including emphasis on top quartile performance over a rolling three-year period, and the recent arrival of a new chief i nvestment officer. The Trustees indicated their intention to continue to monitor performance trends to assess the effectiveness of these efforts and to evaluate whether additional changes to address areas of underperformance are warranted.
In the case of your fund, the Trustees considered that your fund’s class A share cumulative total return performance at net asset value was in the following percentiles of its Lipper Inc. peer group (Lipper European Region Funds) for the one-year, three-year and five-year periods ended December 31, 2009 (the first percentile representing the best-performing funds and the 100th percentile the worst-performing funds):
| One-year period | 34th | ||
| Three-year period | 62nd | ||
| Five-year period | 70th | ||
Over the one-year, three-year and five-year periods ended December 31, 2009, there were 108, 97 and 87 funds, respectively, in your fund’s Lipper peer group. (When considering performance information, shareholders should be mindful that past performance is not a guarantee of future results.)
Brokerage and soft-dollar allocations; investor servicing; distribution
The Trustees considered various potential benefits that Putnam Management may receive in connection with the services it provides under the management contract with your fund. These include benefits related to brokerage and soft-dollar allocations, whereby a portion of the commissions paid by a fund for brokerage may be used to acquire research services that are expected to be useful to Putnam Management in managing the assets of the fund and of other clients. The Trustees considered a change made, at Putnam Management’s request, to the Putnam funds’ brokerage allocation policies commencing in 2010, which increased the permitted soft dollar allocation to third-party services over what had been authorized in previous years. The Trustees noted that a portion of available soft dollars continues to be allocated to the payment of fund expenses. The Trustees indicated their continued intent to monitor regulatory developments in this area with the a ssistance of their Brokerage Committee and also indicated their continued intent to monitor the potential benefits associated with fund brokerage and soft-dollar allocations and trends in industry practices to ensure that the principle of seeking best price and execution remains paramount in the portfolio trading process.
Putnam Management may also receive benefits from payments that the funds make
18
to Putnam Management’s affiliates for investor or distribution services. In conjunction with the annual review of your fund’s management contract, the Trustees reviewed your fund’s investor servicing agreement with Putnam Investor Services, Inc. (“PSERV”) and its distributor’s contracts and distribution plans with Putnam Retail Management Limited Partnership (“PRM”), both of which are affiliates of Putnam Management. The Trustees concluded that the fees payable by the funds to PSERV and PRM, as applicable, for such services are reasonable in relation to the nature and quality of such services.
19
Other information for shareholders
Important notice regarding Putnam’s privacy policy
In order to conduct business with our shareholders, we must obtain certain personal information such as account holders’ names, addresses, Social Security numbers, and dates of birth. Using this information, we are able to maintain accurate records of accounts and transactions.
It is our policy to protect the confidentiality of our shareholder information, whether or not a shareholder currently owns shares of our funds. In particular, it is our policy not to sell information about you or your accounts to outside marketing firms. We have safeguards in place designed to prevent unauthorized access to our computer systems and procedures to protect personal information from unauthorized use.
Under certain circumstances, we must share account information with outside vendors who provide services to us, such as mailings and proxy solicitations. In these cases, the service providers enter into confidentiality agreements with us, and we provide only the information necessary to process transactions and perform other services related to your account. Finally, it is our policy to share account information with your financial representative, if you’ve listed one on your Putnam account.
Proxy voting
Putnam is committed to managing our mutual funds in the best interests of our shareholders. The Putnam funds’ proxy voting guidelines and procedures, as well as information regarding how your fund voted proxies relating to portfolio securities during the 12-month period ended June 30, 2010, are available in the Individual Investors section at putnam.com, and on the SEC’s Web site, www.sec.gov. If you have questions about finding forms on the SEC’s Web site, you may call the SEC at 1-800-SEC-0330. You may also obtain the Putnam funds’ proxy voting guidelines and procedures at no charge by calling Putnam’s Shareholder Services at 1-800-225-1581.
Fund portfolio holdings
The fund will file a complete schedule of its portfolio holdings with the SEC for the first and third quarters of each fiscal year on Form N-Q. Shareholders may obtain the fund’s Forms N-Q on the SEC’s Web site at www.sec.gov. In addition, the fund’s Forms N-Q may be reviewed and copied at the SEC’s Public Reference Room in Washington, D.C. You may call the SEC at 1-800-SEC-0330 for information about the SEC’s Web site or the operation of the Public Reference Room.
Trustee and employee fund ownership
Putnam employees and members of the Board of Trustees place their faith, confidence, and, most importantly, investment dollars in Putnam mutual funds. As of June 30, 2010, Putnam employees had approximately $302,000,000 and the Trustees had approximately $56,000,000 invested in Putnam mutual funds. These amounts include investments by the Trustees’ and employees’ immediate family members as well as investments through retirement and deferred compensation plans.
20
Financial statements
These sections of the report, as well as the accompanying Notes, preceded by the Report of Independent Registered Public Accounting Firm, constitute the fund’s financial statements.
The fund’s portfolio lists all the fund’s investments and their values as of the last day of the reporting period. Holdings are organized by asset type and industry sector, country, or state to show areas of concentration and diversification.
Statement of assets and liabilities shows how the fund’s net assets and share price are determined. All investment and non-investment assets are added together. Any unpaid expenses and other liabilities are subtracted from this total. The result is divided by the number of shares to determine the net asset value per share, which is calculated separately for each class of shares. (For funds with preferred shares, the amount subtracted from total assets includes the liquidation preference of preferred shares.)
Statement of operations shows the fund’s net investment gain or loss. This is done by first adding up all the fund’s earnings — from dividends and interest income — and subtracting its operating expenses to determine net investment income (or loss). Then, any net gain or loss the fund realized on the sales of its holdings — as well as any unrealized gains or losses over the period — is added to or subtracted from the net investment result to determine the fund’s net gain or loss for the fiscal year.
Statement of changes in net assets shows how the fund’s net assets were affected by the fund’s net investment gain or loss, by distributions to shareholders, and by changes in the number of the fund’s shares. It lists distributions and their sources (net investment income or realized capital gains) over the current reporting period and the most recent fiscal year-end. The distributions listed here may not match the sources listed in the Statement of operations because the distributions are determined on a tax basis and may be paid in a different period from the one in which they were earned.
Financial highlights provide an overview of the fund’s investment results, per-share distributions, expense ratios, net investment income ratios, and portfolio turnover in one summary table, reflecting the five most recent reporting periods. In a semiannual report, the highlights table also includes the current reporting period.
21
Report of Independent Registered Public Accounting Firm
To the Trustees and Shareholders of
Putnam Europe Equity Fund:
In our opinion, the accompanying statement of assets and liabilities, including the portfolio, and the related statements of operations and of changes in net assets and the financial highlights present fairly, in all material respects, the financial position of Putnam Europe Equity Fund (the “fund”) at June 30, 2010, and the results of its operations, the changes in its net assets and the financial highlights for each of the periods indicated, in conformity with accounting principles generally accepted in the United States of America. These financial statements and financial highlights (hereafter referred to as “financial statements”) are the responsibility of the fund’s management. Our responsibility is to express an opinion on these financial statements based on our audits. We conducted our audits of these financial statements in accordance with the standards of the Public Company Accounting Oversight Board (United States). T hose standards require that we plan and perform the audit to obtain reasonable assurance about whether the financial statements are free of material misstatement. An audit includes examining, on a test basis, evidence supporting the amounts and disclosures in the financial statements, assessing the accounting principles used and significant estimates made by management, and evaluating the overall financial statement presentation. We believe that our audits, which included confirmation of investments owned at June 30, 2010 by correspondence with the custodian, provide a reasonable basis for our opinion.
PricewaterhouseCoopers LLP
Boston, Massachusetts
August 12, 2010
22
The fund’s portfolio 6/30/10
| COMMON STOCKS (99.3%)* | Shares | Value |
| Belgium (2.9%) | ||
| Anheuser-Busch InBev NV | 74,647 | $3,589,699 |
| Telenet Group Holding NV † | 52,970 | 1,392,680 |
| 4,982,379 | ||
| Brazil (0.8%) | ||
| Petroleo Brasileiro SA ADR (Preference) | 44,300 | 1,320,140 |
| 1,320,140 | ||
| France (16.7%) | ||
| Alstom SA S | 35,349 | 1,595,873 |
| AXA SA | 130,696 | 1,984,390 |
| BNP Paribas SA S | 88,193 | 4,714,405 |
| Christian Dior SA | 38,332 | 3,646,376 |
| GDF Suez | 83,106 | 2,353,976 |
| Gemalto NV | 40,441 | 1,514,616 |
| Sanofi-Aventis | 91,914 | 5,549,026 |
| Societe Generale | 41,555 | 1,692,340 |
| Technip SA | 29,065 | 1,656,797 |
| Total SA | 87,664 | 3,905,909 |
| 28,613,708 | ||
| Germany (15.9%) | ||
| BASF SE | 62,402 | 3,408,337 |
| Biotest AG (Preference) | 26,269 | 1,080,865 |
| Brenntag AG † | 21,859 | 1,378,325 |
| Deutsche Post AG | 225,770 | 3,278,790 |
| HeidelbergCement AG | 25,674 | 1,224,266 |
| Henkel AG & Co. KGaA | 55,759 | 2,715,662 |
| Kabel Deutschland Holding AG † | 63,363 | 1,799,814 |
| Lanxess AG | 47,319 | 1,996,529 |
| Metro AG | 41,324 | 2,103,302 |
| MTU Aero Engines Holding AG | 42,381 | 2,361,007 |
| Porsche Automobil Holding SE (Preference) | 34,218 | 1,461,395 |
| Siemens AG | 35,078 | 3,142,616 |
| Wincor Nixdorf AG | 23,808 | 1,333,622 |
| 27,284,530 | ||
| Ireland (1.5%) | ||
| Kerry Group PLC Class A | 90,462 | 2,508,738 |
| 2,508,738 | ||
| Italy (2.9%) | ||
| Fiat SpA | 159,649 | 1,644,954 |
| Mediaset SpA | 203,030 | 1,157,319 |
| Prysmian SpA | 153,251 | 2,204,063 |
| 5,006,336 | ||
| Luxembourg (0.9%) | ||
| ArcelorMittal | 59,059 | 1,572,537 |
| 1,572,537 | ||
| Netherlands (5.4%) | ||
| Akzo Nobel NV | 38,517 | 1,994,692 |
| ING Groep NV † | 330,742 | 2,458,400 |
| Koninklijke (Royal) KPN NV | 216,185 | 2,763,594 |
| Koninklijke Philips Electronics NV | 69,565 | 2,075,924 |
| 9,292,610 | ||
23
| COMMON STOCKS (99.3%)* cont. | Shares | Value |
| Norway (0.9%) | ||
| DnB NOR ASA | 166,736 | $1,606,538 |
| 1,606,538 | ||
| Russia (1.5%) | ||
| Mobile Telesystems ADR | 64,317 | 1,232,314 |
| Sberbank RF | 541,777 | 1,299,437 |
| 2,531,751 | ||
| Spain (3.5%) | ||
| Banco Santander Central Hispano SA | 339,523 | 3,571,787 |
| Endesa SA S | 58,404 | 1,241,920 |
| Obrascon Huarte Lain SA | 52,710 | 1,160,073 |
| 5,973,780 | ||
| Sweden (0.9%) | ||
| SKF AB Class B | 90,305 | 1,620,161 |
| 1,620,161 | ||
| Switzerland (9.8%) | ||
| Credit Suisse Group | 62,834 | 2,362,195 |
| Nestle SA | 84,890 | 4,097,081 |
| Roche Holding AG | 47,651 | 6,545,429 |
| Zurich Financial Services AG | 17,190 | 3,774,444 |
| 16,779,149 | ||
| Turkey (0.7%) | ||
| Turkiye Garanti Bankasi AS | 302,540 | 1,255,102 |
| 1,255,102 | ||
| United Kingdom (35.0%) | ||
| Autonomy Corp. PLC † | 67,305 | 1,818,447 |
| Barclays PLC | 820,492 | 3,256,451 |
| BG Group PLC | 188,838 | 2,798,474 |
| BP PLC | 203,876 | 980,241 |
| Britvic PLC | 239,913 | 1,697,586 |
| Britvic PLC 144A | 38,077 | 269,427 |
| BT Group PLC | 1,250,399 | 2,390,451 |
| Cairn Energy PLC † | 264,464 | 1,619,832 |
| Centrica PLC | 590,345 | 2,602,524 |
| Compass Group PLC | 436,608 | 3,316,201 |
| Eurasian Natural Resources Corp. | 74,552 | 949,333 |
| GlaxoSmithKline PLC | 367,655 | 6,237,592 |
| HSBC Holdings PLC | 202,625 | 1,850,596 |
| Kingfisher PLC | 600,023 | 1,864,149 |
| Prudential PLC | 208,341 | 1,563,263 |
| Reckitt Benckiser Group PLC | 84,148 | 3,896,699 |
| Rio Tinto PLC | 84,214 | 3,689,258 |
| Royal Dutch Shell PLC Class A | 301,403 | 7,619,875 |
| Smiths Group PLC | 148,987 | 2,360,619 |
| Telecity Group PLC † | 261,168 | 1,557,258 |
| TUI Travel PLC | 396,537 | 1,231,469 |
| Vedanta Resources PLC | 60,358 | 1,901,394 |
| WPP PLC | 259,077 | 2,438,993 |
| Xstrata PLC | 168,867 | 2,214,829 |
| 60,124,961 | ||
| Total common stocks (cost $173,240,839) | $170,472,420 | |
24
| SHORT-TERM INVESTMENTS (1.7%)* | Principal amount | Value |
| Short-term investment held as collateral for loaned | ||
| securities with a yield of 0.01%, due July 1,2010 d | $2,975,563 | $2,975,562 |
| Total short-term investments (cost $2,975,562) | $2,975,562 | |
| TOTAL INVESTMENTS | ||
| Total investments (cost $176,216,401) | $173,447,982 | |
Key to holding’s abbreviations
| ADR | American Depository Receipts |
Notes to the fund’s portfolio
Unless noted otherwise, the notes to the fund’s portfolio are for the close of the fund’s reporting period, which ran from July 1, 2009 through June 30, 2010 (the reporting period).
* Percentages indicated are based on net assets of $171,598,112.
† Non-income-producing security.
d See Note 1 to the financial statements regarding securities lending.
S Securities on loan, in part or in entirety, at the close of the reporting period.
144A after the name of an issuer represents securities exempt from registration under Rule 144A under the Securities Act of 1933, as amended. These securities may be resold in transactions exempt from registration, normally to qualified institutional buyers.
ADR after the name of a foreign holding represents ownership of foreign securities on deposit with a custodian bank.
The fund had the following industry concentrations greater than 10% at the close of the reporting period (as a percentage of net assets):
| Oil and gas | 11.6% |
| Banking | 11.2 |
| Pharmaceuticals | 10.7 |
25
Accounting Standards Codification ASC 820 Fair Value Measurements and Disclosures (ASC 820) establishes a three-level hierarchy for disclosure of fair value measurements. The valuation hierarchy is based upon the transparency of inputs to the valuation of the fund’s investments. The three levels are defined as follows:
Level 1 — Valuations based on quoted prices for identical securities in active markets.
Level 2 — Valuations based on quoted prices in markets that are not active or for which all significant inputs are observable, either directly or indirectly.
Level 3 — Valuations based on inputs that are unobservable and significant to the fair value measurement.
The following is a summary of the inputs used to value the fund’s net assets as of the close of the reporting period:
| Valuation inputs | ||||
| Investments in securities: | Level 1 | Level 2 | Level 3 | |
| Common stocks: | ||||
| Belgium | $— | $4,982,379 | $— | |
| Brazil | 1,320,140 | — | — | |
| France | — | 28,613,708 | — | |
| Germany | — | 27,284,530 | — | |
| Ireland | — | 2,508,738 | — | |
| Italy | — | 5,006,336 | — | |
| Luxembourg | — | 1,572,537 | — | |
| Netherlands | — | 9,292,610 | — | |
| Norway | — | 1,606,538 | — | |
| Russia | 1,232,314 | 1,299,437 | — | |
| Spain | — | 5,973,780 | — | |
| Sweden | — | 1,620,161 | — | |
| Switzerland | — | 16,779,149 | — | |
| Turkey | — | 1,255,102 | — | |
| United Kingdom | — | 60,124,961 | — | |
| Total common stocks | 2,552,454 | 167,919,966 | — | |
| Short-term investments | — | 2,975,562 | — | |
| Totals by level | $2,552,454 | $170,895,528 | $— | |
The accompanying notes are an integral part of these financial statements.
26
Statement of assets and liabilities 6/30/10
| ASSETS | |
| Investment in securities, at value, including $2,830,989 of securities on loan (Note 1): | |
| Unaffiliated issuers (identified cost $176,216,401) | $173,447,982 |
| Dividends, interest and other receivables | 317,287 |
| Receivable for shares of the fund sold | 281,510 |
| Receivable for investments sold | 1,101,795 |
| Foreign tax reclaim | 433,840 |
| Total assets | 175,582,414 |
| LIABILITIES | |
| Payable to custodian (Note 2) | 366,711 |
| Payable for shares of the fund repurchased | 148,969 |
| Payable for compensation of Manager (Note 2) | 103,651 |
| Payable for investor servicing fees (Note 2) | 51,091 |
| Payable for custodian fees (Note 2) | 19,039 |
| Payable for Trustee compensation and expenses (Note 2) | 144,916 |
| Payable for administrative services (Note 2) | 574 |
| Payable for distribution fees (Note 2) | 115,279 |
| Collateral on securities loaned, at value (Note 1) | 2,975,562 |
| Other accrued expenses | 58,510 |
| Total liabilities | 3,984,302 |
| Net assets | $171,598,112 |
| REPRESENTED BY | |
| Paid-in capital (Unlimited shares authorized) (Notes 1 and 4) | $293,137,878 |
| Undistributed net investment income (Note 1) | 854,444 |
| Accumulated net realized loss on investments and foreign currency transactions (Note 1) | (119,632,560) |
| Net unrealized depreciation of investments and assets and liabilities in foreign currencies | (2,761,650) |
| Total — Representing net assets applicable to capital shares outstanding | $171,598,112 |
| COMPUTATION OF NET ASSET VALUE AND OFFERING PRICE | |
| Net asset value and redemption price per class A share | |
| ($151,328,669 divided by 9,559,406 shares) | $15.83 |
| Offering price per class A share (100/94.25 of $15.83)* | $16.80 |
| Net asset value and offering price per class B share ($6,670,659 divided by 441,316 shares)** | $15.12 |
| Net asset value and offering price per class C share ($1,859,037 divided by 119,945 shares)** | $15.50 |
| Net asset value and redemption price per class M share ($3,250,461 divided by 207,649 shares) | $15.65 |
| Offering price per class M share (100/96.50 of $15.65)* | $16.22 |
| Net asset value, offering price and redemption price per class R share | |
| ($133,217 divided by 8,507 shares) | $15.66 |
| Net asset value, offering price and redemption price per class Y share | |
| ($8,356,069 divided by 525,379 shares) | $15.90 |
* On single retail sales of less than $50,000. On sales of $50,000 or more the offering price is reduced.
** Redemption price per share is equal to net asset value less any applicable contingent deferred sales charge.
The accompanying notes are an integral part of these financial statements.
27
Statement of operations Year ended 6/30/10
| INVESTMENT INCOME | |
| Dividends (net of foreign tax of $627,899) | $5,710,164 |
| Interest (including interest income of $2,059 from investments in affiliated issuers) (Note 6) | 2,171 |
| Securities lending | 195,790 |
| Total investment income | 5,908,125 |
| EXPENSES | |
| Compensation of Manager (Note 2) | 1,610,820 |
| Investor servicing fees (Note 2) | 810,586 |
| Custodian fees (Note 2) | 51,005 |
| Trustee compensation and expenses (Note 2) | 17,342 |
| Administrative services (Note 2) | 9,889 |
| Distribution fees — Class A (Note 2) | 467,081 |
| Distribution fees — Class B (Note 2) | 98,125 |
| Distribution fees — Class C (Note 2) | 24,767 |
| Distribution fees — Class M (Note 2) | 30,700 |
| Distribution fees — Class R (Note 2) | 664 |
| Other | 261,081 |
| Fees waived and reimbursed by Manager (Note 2) | (40,424) |
| Total expenses | 3,341,636 |
| Expense reduction (Note 2) | (12,701) |
| Net expenses | 3,328,935 |
| Net investment income | 2,579,190 |
| Net realized gain on investments (Notes 1 and 3) | 7,750,872 |
| Net realized gain on futures contracts (Note 1) | 61,660 |
| Net realized loss on foreign currency transactions (Note 1) | (166,634) |
| Net unrealized depreciation of assets and liabilities in foreign currencies during the year | (13,556) |
| Net unrealized appreciation of investments and receivable purchase agreement during the year | 3,254,569 |
| Net gain on investments | 10,886,911 |
| Net increase in net assets resulting from operations | $13,466,101 |
The accompanying notes are an integral part of these financial statements.
28
Statement of changes in net assets
| DECREASE IN NET ASSETS | Year ended 6/30/10 | Year ended 6/30/09 |
| Operations: | ||
| Net investment income | $2,579,190 | $6,021,421 |
| Net realized gain (loss) on investments and | ||
| foreign currency transactions | 7,645,898 | (126,077,808) |
| Net unrealized appreciation (depreciation) of investments | ||
| and assets and liabilities in foreign currencies | 3,241,013 | (17,886,872) |
| Net increase (decrease) in net assets resulting from operations | 13,466,101 | (137,943,259) |
| Distributions to shareholders (Note 1): | ||
| From ordinary income | ||
| Net investment income | ||
| Class A | (944,351) | — |
| Class M | (1,135) | — |
| Class R | (467) | — |
| Class Y | (73,122) | — |
| Increase in capital from settlement payments | 908,927 | 749,230 |
| Redemption fees (Note 1) | 3,045 | 3,491 |
| Decrease from capital share transactions (Note 4) | (36,710,567) | (68,135,878) |
| Total decrease in net assets | (23,351,569) | (205,326,416) |
| NET ASSETS | ||
| Beginning of year | 194,949,681 | 400,276,097 |
| End of year (including undistributed net investment income of | ||
| $854,444 and accumulated net investment loss of | ||
| $1,934,009, respectively) | $171,598,112 | $194,949,681 |
The accompanying notes are an integral part of these financial statements.
29
Financial highlights (For a common share outstanding throughout the period)
| INVESTMENT OPERATIONS: | LESS DISTRIBUTIONS: | RATIOS AND SUPPLEMENTAL DATA: | |||||||||||||
| Net realized | Ratio | Ratio of net | |||||||||||||
| Net asset | Net | and | From net | of expenses | investment | ||||||||||
| value, | investment | unrealized | Total from | From net | realized | Non-recurring | Net asset | Total return | Net assets, | to average | income (loss) | ||||
| beginning | income | gain (loss) on | investment | investment | gain on | Total | Redemption | reimburse- | value, end | of at net asset | end of period | net assets | to average | Portfolio | |
| Period ended | of period | (loss) a | investments | operations | income | investments | distributions | fees e | ments | period | value (%) b | (in thousands) | (%) c,d | net assets (%) d | turnover (%) |
| Class A | |||||||||||||||
| June 30, 2010 | $15.12 | .23 | .49 | .72 | (.09) | — | (.09) | — | .08 f | $15.83 | 5.20 | $151,329 | 1.52 | 1.25 | 113.25 |
| June 30, 2009 | 23.20 | .42 | (8.56) | (8.14) | — | — | — | — | .06 i,j | 15.12 | (34.83) | 169,467 | 1.47 | 2.65 | 78.96 |
| June 30, 2008 | 33.47 | .48 | (5.14) | (4.66) | (.54) | (5.07) | (5.61) | — | — | 23.20 | (15.43) | 346,192 | 1.41 | 1.70 | 76.88 |
| June 30, 2007 | 25.58 | .37 | 8.17 | 8.54 | (.56) | (.09) | (.65) | — | — | 33.47 | 33.69 | 476,598 | 1.48 | 1.26 | 106.13 |
| June 30, 2006 | 20.79 | .48 g,h | 4.59 | 5.07 | (.28) | — | (.28) | — | — | 25.58 | 24.54 g | 341,155 | 1.46 g | 2.04 g,h | 80.51 |
| Class B | |||||||||||||||
| June 30, 2010 | $14.48 | .06 | .50 | .56 | — | — | — | — | .08 f | $15.12 | 4.42 | $6,671 | 2.27 | .37 | 113.25 |
| June 30, 2009 | 22.39 | .27 | (8.24) | (7.97) | — | — | — | — | .06 i,j | 14.48 | (35.33) | 10,391 | 2.22 | 1.74 | 78.96 |
| June 30, 2008 | 32.34 | .16 | (4.85) | (4.69) | (.19) | (5.07) | (5.26) | — | — | 22.39 | (16.04) | 32,360 | 2.16 | .58 | 76.88 |
| June 30, 2007 | 24.68 | .05 | 7.97 | 8.02 | (.27) | (.09) | (.36) | — | — | 32.34 | 32.68 | 77,315 | 2.23 | .17 | 106.13 |
| June 30, 2006 | 20.03 | .21 g,h | 4.52 | 4.73 | (.08) | — | (.08) | — | — | 24.68 | 23.65 g | 126,764 | 2.21 g | .99 g,h | 80.51 |
| Class C | |||||||||||||||
| June 30, 2010 | $14.84 | .09 | .49 | .58 | — | — | — | — | .08 f | $15.50 | 4.45 | $1,859 | 2.27 | .48 | 113.25 |
| June 30, 2009 | 22.94 | .30 | (8.46) | (8.16) | — | — | — | — | .06 i,j | 14.84 | (35.31) | 2,325 | 2.22 | 1.90 | 78.96 |
| June 30, 2008 | 33.11 | .25 | (5.06) | (4.81) | (.29) | (5.07) | (5.36) | — | — | 22.94 | (16.04) | 4,912 | 2.16 | .89 | 76.88 |
| June 30, 2007 | 25.33 | .14 | 8.08 | 8.22 | (.35) | (.09) | (.44) | — | — | 33.11 | 32.68 | 6,983 | 2.23 | .48 | 106.13 |
| June 30, 2006 | 20.58 | .30 g,h | 4.56 | 4.86 | (.11) | — | (.11) | — | — | 25.33 | 23.66 g | 5,455 | 2.21 g | 1.29 g,h | 80.51 |
| Class M | |||||||||||||||
| June 30, 2010 | $14.96 | .13 | .49 | .62 | (.01) | — | (.01) | — | .08 f | $15.65 | 4.64 | $3,250 | 2.02 | .75 | 113.25 |
| June 30, 2009 | 23.07 | .34 | (8.51) | (8.17) | — | — | — | — | .06 i,j | 14.96 | (35.15) | 3,683 | 1.97 | 2.19 | 78.96 |
| June 30, 2008 | 33.23 | .27 | (5.03) | (4.76) | (.33) | (5.07) | (5.40) | — | — | 23.07 | (15.85) | 7,551 | 1.91 | .96 | 76.88 |
| June 30, 2007 | 25.38 | .19 | 8.13 | 8.32 | (.38) | (.09) | (.47) | — | — | 33.23 | 33.02 | 14,075 | 1.98 | .66 | 106.13 |
| June 30, 2006 | 20.61 | .34 g,h | 4.58 | 4.92 | (.15) | — | (.15) | — | — | 25.38 | 23.97 g | 14,097 | 1.96 g | 1.49 g,h | 80.51 |
| Class R | |||||||||||||||
| June 30, 2010 | $14.97 | .21 | .46 | .67 | (.06) | — | (.06) | — | .08 f | $15.66 | 4.97 | $133 | 1.77 | 1.20 | 113.25 |
| June 30, 2009 | 23.02 | .42 | (8.53) | (8.11) | — | — | — | — | .06 i,j | 14.97 | (34.97) | 97 | 1.72 | 2.80 | 78.96 |
| June 30, 2008 | 33.30 | .44 | (5.13) | (4.69) | (.52) | (5.07) | (5.59) | — | — | 23.02 | (15.63) | 107 | 1.66 | 1.60 | 76.88 |
| June 30, 2007 | 25.55 | .60 | 7.84 | 8.44 | (.60) | (.09) | (.69) | — | — | 33.30 | 33.36 | 89 | 1.73 | 1.94 | 106.13 |
| June 30, 2006 | 20.75 | .67 g,h | 4.39 | 5.06 | (.26) | — | (.26) | — | — | 25.55 | 24.52 g | 6 | 1.71 g | 2.69 g,h | 80.51 |
| Class Y | |||||||||||||||
| June 30, 2010 | $15.19 | .27 | .49 | .76 | (.13) | — | (.13) | — | .08 f | $15.90 | 5.41 | $8,356 | 1.27 | 1.52 | 113.25 |
| June 30, 2009 | 23.24 | .52 | (8.63) | (8.11) | — | — | — | — | .06 i,j | 15.19 | (34.64) | 8,987 | 1.22 | 3.50 | 78.96 |
| June 30, 2008 | 33.53 | .57 | (5.16) | (4.59) | (.63) | (5.07) | (5.70) | — | — | 23.24 | (15.22) | 9,154 | 1.16 | 2.05 | 76.88 |
| June 30, 2007 | 25.62 | .48 | 8.14 | 8.62 | (.62) | (.09) | (.71) | — | — | 33.53 | 34.00 | 10,873 | 1.23 | 1.59 | 106.13 |
| June 30, 2006† | 22.46 | .53 g,h | 2.92 | 3.45 | (.29) | — | (.29) | — | — | 25.62 | 15.52 *g | 6,261 | .89 *g | 2.19 *g,h | 80.51 |
See notes to financial highlights at the end of this section.
The accompanying notes are an integral part of these financial statements.
| 30 | 31 |
Financial highlights (Continued)
* Not annualized.
† For the period October 4, 2005 (commencement of operations) to June 30, 2006.
a Per share net investment income (loss) has been determined on the basis of the weighted average number of shares outstanding during the period.
b Total return assumes dividend reinvestment and does not reflect the effect of sales charges.
c Includes amounts paid through expense offset and brokerage/service arrangements (Note 2).
d Reflects an involuntary contractual expense limitation in effect during the period. For periods prior to June 30, 2010 certain fund expenses were waived in connection with the fund’s investment in Putnam Prime Money Market Fund. As a result of such limitation and/or waivers, the expenses of each class reflect a reduction of the following amounts (Note 2):
| Percentage of | |
| average net assets | |
| June 30, 2010 | 0.02% |
| June 30, 2009 | 0.14 |
| June 30, 2008 | <0.01 |
| June 30, 2007 | <0.01 |
| June 30, 2006 | <0.01 |
e Amount represents less than $0.01 per share.
f Reflects a non-recurring reimbursement pursuant to a settlement between the Securities and Exchange Commission (SEC) and Prudential Securities, Inc., which amounted to $0.08 per share outstanding as of March 30, 2010.
g Reflects a non-recurring reimbursement from Putnam Investments relating to the calculation of certain amounts paid by the fund to Putnam in previous years for transfer agent services, which amounted to $0.01 per share and 0.02% of average net assets for the period ended June 30, 2006.
h Reflects a special dividend received by the fund which amounted to the following amounts:
| Percentage of | ||
| Per share | average net assets | |
| Class A | $0.23 | 0.96% |
| Class B | 0.20 | 0.87 |
| Class C | 0.22 | 0.95 |
| Class M | 0.23 | 0.97 |
| Class R | 0.31 | 1.27 |
| Class Y | 0.23 | 0.94 |
i Reflects a non-recurring reimbursement pursuant to a settlement between the SEC and Millennium Partners, L.P., Millennium Management, L.L.C., and Millennium International Management, L.L.C., which amounted to $0.03 per share outstanding as of June 23, 2009.
j Reflects a non-recurring reimbursement pursuant to a settlement between the SEC and Bear, Stearns & Co., Inc. and Bear, Stearns Securities Corp., which amounted to $0.03 per share outstanding as of May 21, 2009.
The accompanying notes are an integral part of these financial statements.
32
Notes to financial statements 6/30/10 (Unaudited)
Note 1: Significant accounting policies
Putnam Europe Equity Fund (the fund), is a Massachusetts business trust, which is registered under the Investment Company Act of 1940, as amended, as a diversified, open-end management investment company. The fund seeks capital appreciation by investing primarily in common stocks and other securities of European companies.
The fund offers class A, class B, class C, class M, class R and class Y shares. Class A and class M shares are sold with a maximum front-end sales charge of 5.75% and 3.50%, respectively, and generally do not pay a contingent deferred sales charge. Class B shares, which convert to class A shares after approximately eight years, do not pay a front-end sales charge and are subject to a contingent deferred sales charge, if those shares are redeemed within six years of purchase. Class C shares have a one-year 1.00% contingent deferred sales charge and do not convert to class A shares. Class R shares, which are offered to qualified employee-benefit plans, are sold at net asset value. The expenses for class A, class B, class C, class M and class R shares may differ based on the distribution fee of each class, which is identified in Note 2. Class Y shares, which are sold at net asset value, are generally subject to the same expenses as class A, class B, class C, class M and class R shares, but do not bear a distribution fee. Class Y shares are generally only available to corporate and institutional clients and clients in other approved programs.
A 1.00% redemption fee may apply on any shares that are redeemed (either by selling or exchanging into another fund) within 90 days of purchase. The redemption fee is accounted for as an addition to paid-in-capital.
Investment income, realized and unrealized gains and losses and expenses of the fund are borne pro-rata based on the relative net assets of each class to the total net assets of the fund, except that each class bears expenses unique to that class (including the distribution fees applicable to such classes). Each class votes as a class only with respect to its own distribution plan or other matters on which a class vote is required by law or determined by the Trustees. If the fund were liquidated, shares of each class would receive their pro-rata share of the net assets of the fund. In addition, the Trustees declare separate dividends on each class of shares.
In the normal course of business, the fund enters into contracts that may include agreements to indemnify another party under given circumstances. The fund’s maximum exposure under these arrangements is unknown as this would involve future claims that may be, but have not yet been, made against the fund. However, the fund’s management team expects the risk of material loss to be remote.
The following is a summary of significant accounting policies consistently followed by the fund in the preparation of its financial statements. The preparation of financial statements is in conformity with accounting principles generally accepted in the United States of America and requires management to make estimates and assumptions that affect the reported amounts of assets and liabilities in the financial statements and the reported amounts of increases and decreases in net assets from operations during the period from July 1, 2009 through June 30, 2010 (the reporting period). Actual results could differ from those estimates. Subsequent events after the Statement of assets and liabilities date through the date that the financial statements were issued have been evaluated in the preparation of the financial statements.
A) Security valuation Investments for which market quotations are readily available are valued at the last reported sales price on their principal exchange, or official closing price for certain markets and are classified as Level 1 securities. If no sales are reported — as in the case of some securities traded over-the-counter — a security is valued at its last reported bid price and is generally categorized as a Level 2 security.
Many securities markets and exchanges outside the U.S. close prior to the close of the New York Stock Exchange and therefore the closing prices for securities in such markets or on such exchanges may not fully reflect events that occur after such close but before the close of the New York Stock Exchange. Accordingly, on certain days, the fund will fair value foreign equity securities taking into account multiple factors including movements in the U.S. securities markets, currency valuations and comparisons to the valuation of American Depository Receipts, exchange-traded funds and futures contracts. These securities, which will generally represent a transfer from a Level 1 to a Level 2 security, will be classified as Level 2. The number of days on which fair value prices will be used will depend on market activity and it is possible that fair value prices will be used by the fund to a significant extent. At the close of the reporting period, fair value pricing was used for certain foreign securities in the portfolio. Securities quoted in foreign currencies, if any, are translated into U.S. dollars at the current exchange rate.
To the extent a pricing service or dealer is unable to value a security or provides a valuation that Putnam Investment Management, LLC (Putnam Management), the fund’s manager, an indirect wholly-owned subsidiary of Putnam
33
Investments, LLC, does not believe accurately reflects the security’s fair value, the security will be valued at fair value by Putnam Management. Certain investments, including certain restricted and illiquid securities and derivatives, are also valued at fair value following procedures approved by the Trustees. These valuations consider such factors as significant market or specific security events such as interest rate or credit quality changes, various relationships with other securities, discount rates, U.S. Treasury, U.S. swap and credit yields, index levels, convexity exposures and recovery rates. These securities are classified as Level 2 or as Level 3 depending on the priority of the significant inputs.
Such valuations and procedures are reviewed periodically by the Trustees. The fair value of securities is generally determined as the amount that the fund could reasonably expect to realize from an orderly disposition of such securities over a reasonable period of time. By its nature, a fair value price is a good faith estimate of the value of a security in a current sale and does not reflect an actual market price, which may be different by a material amount.
B) Joint trading account Pursuant to an exemptive order from the Securities and Exchange Commission (the SEC), the fund may transfer uninvested cash balances, including cash collateral received under security lending arrangements, into a joint trading account along with the cash of other registered investment companies and certain other accounts managed by Putnam Management. These balances may be invested in issues of short-term investments having maturities of up to 397 days for collateral received under security lending arrangements and up to 90 days for other cash investments.
C) Security transactions and related investment income Security transactions are recorded on the trade date (the date the order to buy or sell is executed). Gains or losses on securities sold are determined on the identified cost basis.
Interest income is recorded on the accrual basis. Dividend income, net of applicable withholding taxes, is recognized on the ex-dividend date except that certain dividends from foreign securities, if any, are recognized as soon as the fund is informed of the ex-dividend date. Non-cash dividends, if any, are recorded at the fair market value of the securities received. Dividends representing a return of capital or capital gains, if any, are reflected as a reduction of cost and/or as a realized gain. All premiums/discounts are amortized/accreted on a yield-to-maturity basis.
D) Foreign currency translation The accounting records of the fund are maintained in U.S. dollars. The market value of foreign securities, currency holdings, and other assets and liabilities is recorded in the books and records of the fund after translation to U.S. dollars based on the exchange rates on that day. The cost of each security is determined using historical exchange rates. Income and withholding taxes are translated at prevailing exchange rates when earned or incurred. The fund does not isolate that portion of realized or unrealized gains or losses resulting from changes in the foreign exchange rate on investments from fluctuations arising from changes in the market prices of the securities. Such gains and losses are included with the net realized and unrealized gain or loss on investments. Net realized gains and losses on foreign currency transactions represent net realized exchange gains or losse s on closed forward currency contracts, disposition of foreign currencies, currency gains and losses realized between the trade and settlement dates on securities transactions and the difference between the amount of investment income and foreign withholding taxes recorded on the fund’s books and the U.S. dollar equivalent amounts actually received or paid. Net unrealized appreciation and depreciation of assets and liabilities in foreign currencies arise from changes in the value of open forward currency contracts and assets and liabilities other than investments at the period end, resulting from changes in the exchange rate. Investments in foreign securities involve certain risks, including those related to economic instability, unfavorable political developments, and currency fluctuations, not present with domestic investments.
E) Securities lending The fund may lend securities, through its agents, to qualified borrowers in order to earn additional income. The loans are collateralized by cash and/or securities in an amount at least equal to the market value of the securities loaned. The market value of securities loaned is determined daily and any additional required collateral is allocated to the fund on the next business day. The risk of borrower default will be borne by the fund’s agents; the fund will bear the risk of loss with respect to the investment of the cash collateral. Income from securities lending is included in investment income on the Statement of operations. At the close of the reporting period, the value of securities loaned amounted to $2,830,989. The fund received cash collateral of $2,975,562 which is pooled with collateral of other Putnam funds into the following issue of short-term investment:
| Repurchase agreement |
| Deutsche Bank AG, effective yield 0.01%, due July 1, 2010 |
34
F) Futures and options contracts The fund may use futures and options contracts to hedge against changes in the values of securities the fund owns, owned or expects to purchase, or for other investment purposes. The fund may also write options on swaps or securities it owns or in which it may invest to increase its current returns.
The potential risk to the fund is that the change in value of futures and options contracts may not correspond to the change in value of the hedged instruments. In addition, losses may arise from changes in the value of the underlying instruments, if there is an illiquid secondary market for the contracts, if interest or exchange rates move unexpectedly or if the counterparty to the contract is unable to perform. With futures, there is minimal counterparty credit risk to the fund since futures are exchange traded and the exchange’s clearinghouse, as counterparty to all exchange traded futures, guarantees the futures against default. Risks may exceed amounts recognized on the Statement of assets and liabilities. When the contract is closed, the fund records a realized gain or loss equal to the difference between the value of the contract at the time it was opened and the value at the time it was closed. Realized gains and losses on purchased option s are included in realized gains and losses on investment securities. If a written call option is exercised, the premium originally received is recorded as an addition to sales proceeds. If a written put option is exercised, the premium originally received is recorded as a reduction to the cost of investments.
Futures contracts are valued at the quoted daily settlement prices established by the exchange on which they trade. The fund and the broker agree to exchange an amount of cash equal to the daily fluctuation in the value of the futures contract. Such receipts or payments are known as “variation margin.” Exchange traded options are valued at the last sale price or, if no sales are reported, the last bid price for purchased options and the last ask price for written options. Options traded over-the-counter are valued using prices supplied by dealers. Futures and written option contracts outstanding at period end, if any, are listed after the fund’s portfolio. The fund did not have any activity on purchased options contracts nor written options contracts during the reporting period. For the reporting period, the transaction volume of futures contracts was minimal.
G) Federal taxes It is the policy of the fund to distribute all of its taxable income within the prescribed time period and otherwise comply with the provisions of the Internal Revenue Code of 1986, as amended (the Code), applicable to regulated investment companies. It is also the intention of the fund to distribute an amount sufficient to avoid imposition of any excise tax under Section 4982 of the Code. The fund is subject to the provisions of Accounting Standards Codification ASC 740 Income Taxes (ASC 740). ASC 740 sets forth a minimum threshold for financial statement recognition of the benefit of a tax position taken or expected to be taken in a tax return. The fund did not have any unrecognized tax benefits in the accompanying financial statements. No provision has been made for federal taxes on income, capital gains or unrea lized appreciation on securities held nor for excise tax on income and capital gains. Each of the fund’s federal tax returns for the prior three fiscal years remains subject to examination by the Internal Revenue Service.
At June 30, 2010, the fund had a capital loss carryover of $110,876,175 available to the extent allowed by the Code to offset future net capital gain, if any. The amounts of the carryovers and the expiration dates are:
| Loss Carryover | Expiration | |
| $52,502,507 | June 30, 2017 | |
| 58,373,668 | June 30, 2018 | |
Pursuant to federal income tax regulations applicable to regulated investment companies, the fund has elected to defer to its fiscal year ending June 30, 2011 $4,341,890 of losses recognized during the period November 1, 2009 to June 30, 2010.
H) Distributions to shareholders Distributions to shareholders from net investment income are recorded by the fund on the ex-dividend date. Distributions from capital gains, if any, are recorded on the ex-dividend date and paid at least annually. The amount and character of income and gains to be distributed are determined in accordance with income tax regulations, which may differ from generally accepted accounting principles. These differences include temporary and/or permanent differences of losses on wash sale transactions, foreign currency gains and losses, post-October loss deferrals, and restitution payments. Reclassifications are made to the fund’s capital accounts to reflect income and gains available for distribution (or available capital loss carryovers) under income tax regulations. For the reporting period ended, the fund reclassified $1,228,338 to decrease distributions in excess of net inve stment income and $908,927 to decrease paid-in-capital, with an increase to accumulated net realized loss of $319,411.
35
The tax basis components of distributable earnings and the federal tax cost as of the close of the reporting period were as follows:
| Unrealized appreciation | $13,604,626 |
| Unrealized depreciation | (20,787,540) |
| Net unrealized depreciation | (7,182,914) |
| Undistributed ordinary income | 854,444 |
| Capital loss carryforward | (110,876,175) |
| Post-October loss | (4,341,890) |
| Cost for federal income tax purposes | $180,630,896 |
Note 2: Management fee, administrative services and other transactions
Effective January 1, 2010, the fund pays Putnam Management a management fee (base fee) (based on the fund’s average net assets and computed and paid monthly) at annual rates that may vary based on the average of the aggregate net assets of most open-end funds, as defined in the fund’s management contract, sponsored by Putnam Management. Such annual rates may vary as follows: 0.85% of the first $5 billion, 0.80% of the next $5 billion, 0.75% of the next $10 billion, 0.70% of the next $10 billion, 0.65% of the next $50 billion, 0.63% of the next $50 billion, 0.62% of the next $100 billion, and 0.615% of any excess thereafter.
In addition, beginning with the fund’s thirteenth complete calendar month of operation under the new management contract, the monthly management fee will consist of the monthly base fee plus or minus a performance adjustment for the month. The performance adjustment will be determined based on performance over the thirty-six month period then ended or, if the new management contract has not yet been effective for thirty-six complete calendar months, the period from the date the new management contract became effective to the end of the month for which the fee adjustment is being computed. Each month, the performance adjustment will be calculated by multiplying the performance adjustment rate and the fund’s average net assets over the performance period and the result will be divided by twelve. The resulting dollar amount will be added to, or subtracted from, the base fee for that month. The performance adjustment rate is equal to 0.03 multipl ied by the difference between the fund’s annualized performance (measured by the fund’s class A shares) and the annualized performance of the MSCI Europe Index (Net Dividends), each measured over the performance period. The maximum annualized performance adjustment rates are +/-0.15%. The monthly base fee is determined based on the fund’s average net assets for the month, while the performance adjustment will be determined based on the fund’s average net assets over the performance period of up to thirty-six months. This means it is possible that, if the fund underperforms significantly over the performance period, and the fund’s assets have declined significantly over that period, the negative performance adjustment may exceed the base fee. In this event, Putnam Management would make a payment to the fund.
Prior to January 1, 2010, the fund paid Putnam Management for management and investment advisory services quarterly based on the average net assets of the fund. Such fee was based on the following annual rates: 0.80% of the first $500 million of average net assets, 0.70% of the next $500 million, 0.65% of the next $500 million, 0.60% of the next $5 billion, 0.575% of the next $5 billion, 0.555% of the next $5 billion, 0.54% of the next $5 billion and 0.53% thereafter.
Putnam Management had agreed to waive fees and reimburse expenses of the fund through July 31, 2009 to the extent necessary to ensure that the fund’s expenses did not exceed the simple average of the expenses of all front-end load funds viewed by Lipper, Inc. as having the same investment classification or objective as the fund. The expense reimbursement was based on a comparison of the fund’s expenses with the average annualized operating expenses of the funds in its Lipper peer group for each calendar quarter during the fund’s last fiscal year, excluding 12b-1 fees and without giving effect to any expense offset and brokerage/service arrangements that may reduce fund expenses.
Putnam Management had further agreed to waive fees and reimburse expenses of the fund for the period from July 1, 2008 through July 31, 2009 to the extent necessary to ensure that the fund’s expenses did not exceed the simple average of the expenses of a custom group of competitive funds selected by Lipper, Inc. based on the size of the fund. The expense reimbursement was based on a comparison of the fund’s total expenses with the average operating expenses of the funds in this Lipper custom peer group for their respective 2007 fiscal years, excluding 12b-1 fees and after adjustment for certain expense offset and brokerage/service arrangements that reduced expenses of the fund.
During the reporting period, the fund’s expenses were reduced by $40,424 as a result of the lower of the limits specified above.
36
Effective August 1, 2009 through June 30, 2011, Putnam Management has also contractually agreed to reimburse the fund’s expenses to the extent necessary to limit the cumulative expenses of the fund, exclusive of brokerage, interest, taxes, investment-related expenses, extraordinary expenses and payments under the fund’s investor servicing contract, investment management contract and distribution plans, on a fiscal year-to-date basis (or from August 1, 2009 through the fund’s next fiscal year end, as applicable), to an annual rate of 0.20% of the fund’s average net assets over such fiscal year-to-date period (or since August 1, 2009, as applicable). During the reporting period, the fund’s expenses were not reduced as a result of this limit.
Putnam Investments Limited (PIL), an affiliate of Putnam Management, is authorized by the Trustees to manage a separate portion of the assets of the fund as determined by Putnam Management from time to time. Putnam Management pays a quarterly sub-management fee to PIL for its services at an annual rate of 0.35% of the average net assets of the portion of the fund managed by PIL.
The Putnam Advisory Company, LLC (PAC), an affiliate of Putnam Management, is authorized by the Trustees to manage a separate portion of the assets of the fund, as designated from time to time by Putnam Management or PIL. Putnam Management or PIL, as applicable, pays a quarterly sub-advisory fee to PAC for its services at the annual rate of 0.35% of the average net assets of the portion of the fund’s assets for which PAC is engaged as sub-adviser.
On September 15, 2008, the fund terminated its outstanding derivatives contracts with Lehman Brothers Special Financing, Inc. (LBSF) in connection with the bankruptcy filing of LBSF’s parent company, Lehman Brothers Holdings, Inc. On September 26, 2008, the fund entered into a receivable purchase agreement (Agreement) with another registered investment company (the Purchaser) managed by Putnam Management. Under the Agreement, the fund sold to the Purchaser the fund’s right to receive, in the aggregate, $84,811 in net payments from LBSF in connection with certain terminated derivatives transactions (the Receivable), in exchange for an initial payment plus (or minus) additional amounts based on the applicable Purchaser’s ultimate realized gain (or loss) on the Receivable. The fund received $26,362 (exclusive of the initial payment) from the Purchaser in accordance with the terms of the Agreement.
The fund reimburses Putnam Management an allocated amount for the compensation and related expenses of certain officers of the fund and their staff who provide administrative services to the fund. The aggregate amount of all such reimbursements is determined annually by the Trustees.
Custodial functions for the fund’s assets are provided by State Street Bank and Trust Company (State Street). Custody fees are based on the fund’s asset level, the number of its security holdings and transaction volumes.
Putnam Investor Services, Inc., an affiliate of Putnam Management, provides investor servicing agent functions to the fund. Putnam Investor Services, Inc. received fees for investor servicing, subject to certain limitations, based on the fund’s retail asset level, the number of shareholder accounts in the fund and the level of defined contribution plan assets in the fund. The amounts incurred for investor servicing agent functions during the reporting period are included in Investor servicing fees in the Statement of operations.
Under the custodian contract between the fund and State Street, the custodian bank has a lien on the securities of the fund to the extent permitted by the fund’s investment restrictions to cover any advances made by the custodian bank for the settlement of securities purchased by the fund. At the close of the reporting period, the payable to the custodian bank represents the amount due for cash advanced for the settlement of securities purchased.
The fund has entered into expense offset arrangements with Putnam Investor Services, Inc. and State Street whereby Putnam Investor Services, Inc.’s and State Street’s fees are reduced by credits allowed on cash balances. The fund also reduced expenses through brokerage/service arrangements. For the reporting period, the fund’s expenses were reduced by $314 under the expense offset arrangements and by $12,387 under the brokerage/service arrangements.
Each independent Trustee of the fund receives an annual Trustee fee, of which $151, as a quarterly retainer, has been allocated to the fund, and an additional fee for each Trustees meeting attended. Trustees also are reimbursed for expenses they incur relating to their services as Trustees.
The fund has adopted a Trustee Fee Deferral Plan (the Deferral Plan) which allows the Trustees to defer the receipt of all or a portion of Trustees fees payable on or after July 1, 1995. The deferred fees remain invested in certain Putnam funds until distribution in accordance with the Deferral Plan.
The fund has adopted an unfunded noncontributory defined benefit pension plan (the Pension Plan) covering all Trustees of the fund who have served as a Trustee for at least five years and were first elected prior to 2004. Benefits under the Pension Plan are equal to 50% of the Trustee’s average annual attendance and retainer fees for the three years ended December 31, 2005. The retirement benefit is payable during a Trustee’s lifetime, beginning the year
37
following retirement, for the number of years of service through December 31, 2006. Pension expense for the fund is included in Trustee compensation and expenses in the Statement of operations. Accrued pension liability is included in Payable for Trustee compensation and expenses in the Statement of assets and liabilities. The Trustees have terminated the Pension Plan with respect to any Trustee first elected after 2003.
The fund has adopted distribution plans (the Plans) with respect to its class A, class B, class C, class M and class R shares pursuant to Rule 12b-1 under the Investment Company Act of 1940. The purpose of the Plans is to compensate Putnam Retail Management Limited Partnership, a wholly-owned subsidiary of Putnam Investments, LLC and Putnam Retail Management GP, Inc., for services provided and expenses incurred in distributing shares of the fund. The Plans provide for payments by the fund to Putnam Retail Management Limited Partnership at an annual rate of up to 0.35%, 1.00%, 1.00%, 1.00% and 1.00% of the average net assets attributable to class A, class B, class C, class M and class R shares, respectively. The Trustees have approved payment by the fund at an annual rate of 0.25%, 1.00%, 1.00%, 0.75% and 0.50% of the average net assets attributable to class A, class B, class C, class M and class R shares, respectively.
For the reporting period, Putnam Retail Management Limited Partnership, acting as underwriter, received net commissions of $10,022 and $6,026 from the sale of class A and class M shares, respectively, and received $8,596 and no monies in contingent deferred sales charges from redemptions of class B and class C shares, respectively.
A deferred sales charge of up to 1.00% and 0.65% is assessed on certain redemptions of class A and class M shares, respectively. For the reporting period, Putnam Retail Management Limited Partnership, acting as underwriter, received no monies on class A and class M redemptions.
Note 3: Purchases and sales of securities
During the reporting period, cost of purchases and proceeds from sales of investment securities other than short-term investments aggregated $235,409,351 and $269,051,172, respectively. There were no purchases or proceeds from sales of long-term U.S. government securities.
Note 4: Capital shares
At the close of the reporting period, there was an unlimited number of shares of beneficial interest authorized. Transactions in capital shares were as follows:
| Year ended 6/30/10 | Year ended 6/30/09 | |||||
| Class A | Shares | Amount | Shares | Amount | ||
| Shares sold | 426,160 | $7,612,420 | 685,462 | $10,673,894 | ||
| Shares issued in connection with | ||||||
| reinvestment of distributions | 46,891 | 874,991 | — | — | ||
| 473,051 | 8,487,411 | 685,462 | 10,673,894 | |||
| Shares repurchased | (2,122,049) | (37,900,074) | (4,395,908) | (67,562,971) | ||
| Net decrease | (1,648,998) | $(29,412,663) | (3,710,446) | $(56,889,077) | ||
| Year ended 6/30/10 | Year ended 6/30/09 | |||||
| Class B | Shares | Amount | Shares | Amount | ||
| Shares sold | 31,593 | $547,606 | 40,772 | $599,904 | ||
| Shares issued in connection with | ||||||
| reinvestment of distributions | — | — | — | — | ||
| 31,593 | 547,606 | 40,772 | 599,904 | |||
| Shares repurchased | (308,026) | (5,248,366) | (768,488) | (11,882,743) | ||
| Net decrease | (276,433) | $(4,700,760) | (727,716) | $(11,282,839) | ||
38
| Year ended 6/30/10 | Year ended 6/30/09 | |||||
| Class C | Shares | Amount | Shares | Amount | ||
| Shares sold | 7,154 | $121,125 | 6,033 | $90,446 | ||
| Shares issued in connection with | ||||||
| reinvestment of distributions | — | — | — | — | ||
| 7,154 | 121,125 | 6,033 | 90,446 | |||
| Shares repurchased | (43,839) | (755,933) | (63,555) | (993,464) | ||
| Net decrease | (36,685) | $(634,808) | (57,522) | $(903,018) | ||
| Year ended 6/30/10 | Year ended 6/30/09 | |||||
| Class M | Shares | Amount | Shares | Amount | ||
| Shares sold | 68,329 | $1,199,681 | 3,099 | $44,586 | ||
| Shares issued in connection with | ||||||
| reinvestment of distributions | 41 | 753 | — | — | ||
| 68,370 | 1,200,434 | 3,099 | 44,586 | |||
| Shares repurchased | (106,955) | (1,927,966) | (84,208) | (1,367,303) | ||
| Net decrease | (38,585) | $(727,532) | (81,109) | $(1,322,717) | ||
| Year ended 6/30/10 | Year ended 6/30/09 | |||||
| Class R | Shares | Amount | Shares | Amount | ||
| Shares sold | 3,095 | $54,418 | 3,539 | $52,525 | ||
| Shares issued in connection with | ||||||
| reinvestment of distributions | 25 | 467 | — | — | ||
| 3,120 | 54,885 | 3,539 | 52,525 | |||
| Shares repurchased | (1,063) | (18,484) | (1,757) | (28,327) | ||
| Net increase | 2,057 | $36,401 | 1,782 | $24,198 | ||
| Year ended 6/30/10 | Year ended 6/30/09 | |||||
| Class Y | Shares | Amount | Shares | Amount | ||
| Shares sold | 75,517 | $1,284,888 | 367,672 | $5,071,490 | ||
| Shares issued in connection with | ||||||
| reinvestment of distributions | 3,780 | 70,757 | — | — | ||
| 79,297 | 1,355,645 | 367,672 | 5,071,490 | |||
| Shares repurchased | (145,742) | (2,626,850) | (169,675) | (2,833,915) | ||
| Net increase (decrease) | (66,445) | $(1,271,205) | 197,997 | $2,237,575 | ||
Note 5: Summary of derivative activity
As of the close of the reporting period, the fund did not hold any derivative instruments.
The following is a summary of realized gains or losses of derivative instruments on the Statement of operations for the reporting period (see Note 1):
Amount of realized gain or (loss) on derivatives recognized in net gain or (loss) on investments
| Derivatives not accounted for as | ||
| hedging instruments under ASC 815 | Futures | Total |
| Equity contracts | $61,660 | $61,660 |
| Total | $61,660 | $61,660 |
39
Note 6: Investment in Putnam Money Market Liquidity Fund
The fund invested in Putnam Money Market Liquidity Fund, an open-end management investment company managed by Putnam Management. Investments in Putnam Money Market Liquidity Fund are valued at its closing net asset value each business day. Income distributions earned by the fund are recorded as interest income in the Statement of operations and totaled $2,059 for the reporting period. During the reporting period, cost of purchases and proceeds of sales of investments in Putnam Money Market Liquidity Fund aggregated $60,553,477 and $60,553,477, respectively. Management fees charged to Putnam Money Market Liquidity Fund have been waived by Putnam Management.
Note 7: Regulatory matters and litigation
In late 2003 and 2004, Putnam Management settled charges brought by the SEC and the Massachusetts Securities Division in connection with excessive short-term trading in Putnam funds. Distribution of payments from Putnam Management to certain open-end Putnam funds and their shareholders is expected to be completed in the next several months. These allegations and related matters have served as the general basis for certain lawsuits, including purported class action lawsuits against Putnam Management and, in a limited number of cases, some Putnam funds. Putnam Management believes that these lawsuits will have no material adverse effect on the funds or on Putnam Management’s ability to provide investment management services. In addition, Putnam Management has agreed to bear any costs incurred by the Putnam funds as a result of these matters.
Note 8: Market and credit risk
In the normal course of business, the fund trades financial instruments and enters into financial transactions where risk of potential loss exists due to changes in the market (market risk) or failure of the contracting party to the transaction to perform (credit risk). The fund may be exposed to additional credit risk that an institution or other entity with which the fund has unsettled or open transactions will default.
40
Federal tax information (Unaudited)
For the period, interest and dividends from foreign countries were $6,338,063 or $0.583 per share (for all classes of shares). Taxes paid to foreign countries were $627,899 or $0.058 per share (for all classes of shares).
For its tax year ended June 30, 2010, the fund hereby designates 100%, or the maximum amount allowable, of its taxable ordinary income distributions as qualified dividends taxed at the individual net capital gain rates.
The Form 1099 that will be mailed to you in January 2011 will show the tax status of all distributions paid to your account in calendar 2010.
41
Shareholder meeting results (Unaudited)
December 18, 2009 meeting
At the meeting, each of the nominees for Trustees was elected, as follows:
| Votes for | Votes withheld | ||
| Ravi Akhoury | 8,054,546 | 455,222 | |
| Jameson A. Baxter | 8,062,067 | 447,701 | |
| Charles B. Curtis | 8,042,291 | 467,477 | |
| Robert J. Darretta | 8,058,947 | 450,821 | |
| Myra R. Drucker | 8,057,090 | 452,678 | |
| John A. Hill | 8,048,320 | 461,448 | |
| Paul L. Joskow | 8,053,136 | 456,632 | |
| Elizabeth T. Kennan* | 8,041,328 | 468,440 | |
| Kenneth R. Leibler | 8,052,362 | 457,406 | |
| Robert E. Patterson | 8,052,602 | 457,166 | |
| George Putnam, III | 8,039,967 | 469,801 | |
| Robert L. Reynolds | 8,065,054 | 444,714 | |
| W. Thomas Stephens | 8,052,100 | 457,668 | |
| Richard B. Worley | 8,057,437 | 452,331 | |
* Dr. Kennan retired from the Board of Trustees of the Putnam funds effective June 30, 2010.
A proposal to approve a new management contract between the fund and Putnam Management with both Fund Family breakpoints and performance fees was approved as follows:
| Votes | Votes | Broker | |
| for | against | Abstentions | non-votes |
| 5,970,685 | 423,052 | 248,862 | 1,867,169 |
A proposal to approve a new management contract between the fund and Putnam Management with Fund Family breakpoints only was approved as follows:
| Votes | Votes | Broker | |
| for | against | Abstentions | non-votes |
| 6,026,014 | 352,765 | 263,820 | 1,867,169 |
A proposal to approve a new management contract between the fund and Putnam Management with performance fees only was approved as follows:
| Votes | Votes | Broker | |
| for | against | Abstentions | non-votes |
| 5,986,937 | 404,230 | 251,433 | 1,867,168 |
A proposal to amend the fundamental investment restriction with respect to diversification of investments was approved as follows:
| Votes | Votes | Broker | |
| for | against | Abstentions | non-votes |
| 6,084,913 | 300,096 | 257,590 | 1,867,169 |
42
Shareholder meeting results (Unaudited) (Continued)
A proposal to amend the fundamental investment restriction with respect to borrowing was approved as follows:
| Votes | Votes | Broker | |
| for | against | Abstentions | non-votes |
| 5,883,858 | 488,845 | 269,896 | 1,867,169 |
A proposal to amend the fundamental investment restriction with respect to making loans was approved as follows:
| Votes | Votes | Broker | |
| for | against | Abstentions | non-votes |
| 5,881,505 | 489,023 | 272,072 | 1,867,168 |
All tabulations are rounded to the nearest whole number.
43
About the Trustees
| Name | ||
| Year of birth | ||
| Position held | Principal occupations during past five years | Other directorships |
| Ravi Akhoury | Advisor to New York Life Insurance Company. Trustee of | Jacob Ballas Capital |
| Born 1947 | American India Foundation and of the Rubin Museum. | India, a non-banking |
| Trustee since 2009 | From 1992 to 2007, was Chairman and CEO of MacKay | finance company |
| Shields, a multi-product investment management firm | focused on private | |
| with over $40 billion in assets under management. | equity advisory services | |
| Barbara M. Baumann | President and Owner of Cross Creek Energy Corporation, | SM Energy Company, |
| Born 1955 | a strategic consultant to domestic energy firms and direct | a publicly held energy |
| Trustee since 2010 | investor in energy assets. Trustee, and Co-Chair of the | company focused on |
| Finance Committee, of Mount Holyoke College. Former | natural gas and crude | |
| Chair and current board member of Girls Incorporated of | oil in the United States; | |
| Metro Denver. Member of the Finance Committee, The | Unisource Energy | |
| Children’s Hospital. | Corporation, a publicly | |
| held provider of natural | ||
| gas and electric service | ||
| across Arizona; Cody | ||
| Resources Management, | ||
| LLP (a privately held | ||
| energy, ranching, and | ||
| commercial real estate | ||
| company) | ||
| Jameson A. Baxter | President of Baxter Associates, Inc., a private investment | ASHTA Chemicals, Inc. |
| Born 1943 | firm. Chairman of Mutual Fund Directors Forum. | |
| Trustee since 1994 and | Chairman Emeritus of the Board of Trustees of Mount | |
| Vice Chairman since 2005 | Holyoke College. | |
| Charles B. Curtis | President Emeritus of the Nuclear Threat Initiative, a | Edison International; |
| Born 1940 | private foundation dealing with national security issues. | Southern California |
| Trustee since 2001 | Senior Advisor to the United Nations Foundation. Senior | Edison |
| Advisor to the Center for Strategic and International | ||
| Studies. Member of the Council on Foreign Relations and | ||
| the National Petroleum Council. | ||
| Robert J. Darretta | Health Care Industry Advisor to Permira, a global private | United-Health |
| Born 1946 | equity firm. Until April 2007, was Vice Chairman of the | Group, a diversified |
| Trustee since 2007 | Board of Directors of Johnson & Johnson. Served as | health-care company |
| Johnson & Johnson’s Chief Financial Officer for a decade. | ||
| Myra R. Drucker | Vice Chair of the Board of Trustees of Sarah Lawrence | Interactive Data |
| Born 1948 | College, and a member of the Investment Committee | Corporation, a provider |
| Trustee since 2004 | of the Kresge Foundation, a charitable trust. Retired in | of financial market |
| 2009 as Chair of the Board of Trustees of Commonfund, | data and analytics to | |
| a not-for-profit firm that manages assets for educational | financial institutions and | |
| endowments and foundations. Advisor to RCM Capital | investors | |
| Management, an investment management firm, and to | ||
| the Employee Benefits Investment Committee of The | ||
| Boeing Company. | ||
| John A. Hill | Founder and Vice-Chairman of First Reserve | Devon Energy |
| Born 1942 | Corporation, the leading private equity buyout firm | Corporation, a leading |
| Trustee since 1985 and | focused on the worldwide energy industry. Serves as a | independent natural gas |
| Chairman since 2000 | Trustee and Chairman of the Board of Trustees of Sarah | and oil exploration and |
| Lawrence College. Also a member of the Advisory Board | production company | |
| of the Millstein Center for Corporate Governance and | ||
| Performance at the Yale School of Management. | ||
44
| Name | ||
| Year of birth | ||
| Position held | Principal occupations during past five years | Other directorships |
| Paul L. Joskow | Economist and President of the Alfred P. Sloan | TransCanada |
| Born 1947 | Foundation, a philanthropic institution focused primarily | Corporation, an energy |
| Trustee since 1997 | on research and education on issues related to science, | company focused on |
| technology, and economic performance. Currently | natural gas transmission | |
| on leave from his position as the Elizabeth and James | and power services; | |
| Killian Professor of Economics and Management at the | Exelon Corporation, an | |
| Massachusetts Institute of Technology. Prior to 2007, | energy company focused | |
| served as the Director of the Center for Energy and | on power services | |
| Environmental Policy Research at MIT. | ||
| Kenneth R. Leibler | Founder and former Chairman of Boston Options | Ruder Finn Group, a |
| Born 1949 | Exchange, an electronic marketplace for the trading | global communications |
| Trustee since 2006 | of derivative securities. Vice Chairman of the Board of | and advertising firm; |
| Trustees of Beth Israel Deaconess Hospital in Boston, | Northeast Utilities, | |
| Massachusetts. | which operates New | |
| England’s largest energy | ||
| delivery system | ||
| Robert E. Patterson | Senior Partner of Cabot Properties, LP and Chairman of | None |
| Born 1945 | Cabot Properties, Inc., a private equity firm investing in | |
| Trustee since 1984 | commercial real estate. Past Chairman and Trustee of the | |
| Joslin Diabetes Center. | ||
| George Putnam, III | Chairman of New Generation Research, Inc., a publisher | None |
| Born 1951 | of financial advisory and other research services, and | |
| Trustee since 1984 | founder and President of New Generation Advisors, LLC, | |
| a registered investment advisor to private funds. | ||
| Director of The Boston Family Office, LLC, a registered | ||
| investment advisor. | ||
| Robert L. Reynolds* | President and Chief Executive Officer of Putnam | None |
| Born 1952 | Investments since 2008. Prior to joining Putnam | |
| Trustee since 2008 and | Investments, served as Vice Chairman and Chief | |
| President of the Putnam | Operating Officer of Fidelity Investments from | |
| Funds since July 2009 | 2000 to 2007. | |
| W. Thomas Stephens | Retired as Chairman and Chief Executive Officer of Boise | TransCanada |
| Born 1942 | Cascade, LLC, a paper, forest products, and timberland | Corporation, an energy |
| Trustee from 1997 to | assets company, in December 2008. | company focused on |
| 2008 and since 2009 | natural gas transmission | |
| and power services | ||
| Richard B. Worley | Managing Partner of Permit Capital LLC, an investment | Neuberger Berman, |
| Born 1945 | management firm. Serves as a Trustee of the University of | an investment |
| Trustee since 2004 | Pennsylvania Medical Center, the Robert Wood Johnson | management firm |
| Foundation, a philanthropic organization devoted to | ||
| health-care issues, and the National Constitution Center. | ||
| Also serves as a Director of the Colonial Williamsburg | ||
| Foundation, a historical preservation organization, and as | ||
| Chairman of the Philadelphia Orchestra Association. | ||
The address of each Trustee is One Post Office Square, Boston, MA 02109.
As of June 30, 2010, there were 105 Putnam funds. All Trustees serve as Trustees of all Putnam funds.
Each Trustee serves for an indefinite term, until his or her resignation, retirement at age 72, removal, or death.
* Mr. Reynolds is an “interested person” (as defined in the Investment Company Act of 1940) of the fund, Putnam Management, and/or Putnam Retail Management. He is President and Chief Executive Officer of Putnam Investments, as well as the President of your fund and each of the other Putnam funds.
45
Officers
In addition to Robert L. Reynolds, the other officers of the fund are shown below:
| Jonathan S. Horwitz (Born 1955) | Francis J. McNamara, III (Born 1955) |
| Executive Vice President, Principal Executive | Vice President and Chief Legal Officer |
| Officer, Treasurer and Compliance Liaison | Since 2004 |
| Since 2004 | Senior Managing Director, Putnam Investments, |
| Putnam Management and Putnam Retail | |
| Steven D. Krichmar (Born 1958) | Management |
| Vice President and Principal Financial Officer | |
| Since 2002 | Robert R. Leveille (Born 1969) |
| Senior Managing Director, Putnam Investments | Vice President and Chief Compliance Officer |
| Since 2007 | |
| Janet C. Smith (Born 1965) | Managing Director, Putnam Investments, |
| Vice President, Principal Accounting Officer and | Putnam Management and Putnam |
| Assistant Treasurer | Retail Management |
| Since 2007 | |
| Managing Director, Putnam Investments and | Mark C. Trenchard (Born 1962) |
| Putnam Management | Vice President and BSA Compliance Officer |
| Since 2002 | |
| Susan G. Malloy (Born 1957) | Managing Director, Putnam Investments |
| Vice President and Assistant Treasurer | |
| Since 2007 | Judith Cohen (Born 1945) |
| Managing Director, Putnam Investments | Vice President, Clerk and Assistant Treasurer |
| Since 1993 | |
| Beth S. Mazor (Born 1958) | |
| Vice President | Nancy E. Florek (Born 1957) |
| Since 2002 | Vice President, Assistant Clerk, |
| Managing Director, Putnam Investments | Assistant Treasurer and Proxy Manager |
| Since 2005 | |
| James P. Pappas (Born 1953) | |
| Vice President | |
| Since 2004 | |
| Managing Director, Putnam Investments and | |
| Putnam Management |
The principal occupations of the officers for the past five years have been with the employers as shown above although in some cases, they have held different positions with such employers. The address of each Officer is One Post Office Square, Boston, MA 02109.
46
The Putnam family of funds
The following is a list of Putnam’s open-end mutual funds offered to the public. Investors should carefully consider the investment objective, risks, charges, and expenses of a fund before investing. For a prospectus, or a summary prospectus if available, containing this and other information for any Putnam fund or product, call your financial advisor at 1-800-225-1581 and ask for a prospectus. Please read the prospectus carefully before investing.
| Growth | Value |
| Growth Opportunities Fund | Convertible Income-Growth Trust |
| International Growth Fund* ** | Equity Income Fund |
| New Opportunities Fund | The George Putnam Fund of Boston |
| Small Cap Growth Fund* | The Putnam Fund for Growth and Income |
| Vista Fund | International Value Fund* †† |
| Voyager Fund | Mid Cap Value Fund |
| Small Cap Value Fund* | |
| Blend | |
| Asia Pacific Equity Fund* | Income |
| Capital Opportunities Fund* | American Government Income Fund |
| Capital Spectrum Fund‡ | Diversified Income Trust |
| Emerging Markets Equity Fund* | Floating Rate Income Fund |
| Equity Spectrum Fund‡ | Global Income Trust* |
| Europe Equity Fund* | High Yield Advantage Fund* |
| Global Equity Fund* | High Yield Trust* |
| International Capital Opportunities Fund* | Income Fund |
| International Equity Fund* | Money Market Fund† |
| Investors Fund | U.S. Government Income Trust |
| Research Fund |
* A 1% redemption fee on total assets redeemed or exchanged within 90 days of purchase may be imposed for all share classes of these funds.
† An investment in a money market fund is not insured or guaranteed by the Federal Deposit Insurance Corporation or any other government agency. Although the fund seeks to preserve the value of your investment at $1.00 per share, it is possible to lose money by investing in the fund.
** Prior to January 1, 2010, the fund was known as Putnam International New Opportunities Fund.
Prior to January 1, 2010, the fund was known as Putnam International Growth and Income Fund.
47
| Tax-free income | Asset allocation |
| AMT-Free Municipal Fund | Income Strategies Fund |
| Tax Exempt Income Fund | Putnam Asset Allocation Funds — three invest- |
| Tax Exempt Money Market Fund† | ment portfolios that spread your money across |
| Tax-Free High Yield Fund | a variety of stocks, bonds, and money market |
| investments. | |
| State tax-free income funds: | |
| Arizona, California, Massachusetts, Michigan, | The three portfolios: |
| Minnesota, New Jersey, New York, Ohio, | Asset Allocation: Balanced Portfolio |
| and Pennsylvania | Asset Allocation: Conservative Portfolio |
| Asset Allocation: Growth Portfolio | |
| Absolute Return | |
| Absolute Return 100 Fund | Putnam RetirementReady® |
| Absolute Return 300 Fund | Putnam RetirementReady Funds — 10 |
| Absolute Return 500 Fund | investment portfolios that offer diversifi- |
| Absolute Return 700 Fund | cation among stocks, bonds, and money |
| market instruments and adjust to become | |
| Global Sector* | more conservative over time based on a |
| Global Consumer Fund | target date for withdrawing assets. |
| Global Energy Fund | |
| Global Financials Fund | The 10 funds: |
| Global Health Care Fund | Putnam RetirementReady 2050 Fund |
| Global Industrials Fund | Putnam RetirementReady 2045 Fund |
| Global Natural Resources Fund | Putnam RetirementReady 2040 Fund |
| Global Sector Fund | Putnam RetirementReady 2035 Fund |
| Global Technology Fund | Putnam RetirementReady 2030 Fund |
| Global Telecommunications Fund | Putnam RetirementReady 2025 Fund |
| Global Utilities Fund | Putnam RetirementReady 2020 Fund |
| Putnam RetirementReady 2015 Fund | |
| Putnam RetirementReady 2010 Fund | |
| Putnam RetirementReady Maturity Fund |
‡ A 1% redemption fee on total assets redeemed or exchanged within 30 days of purchase may be imposed for all share classes of these funds.
A short-term trading fee of 1% may apply to redemptions or exchanges from certain funds within the time period specified in the fund's prospectus.
Check your account balances and the most recent month-end performance in the Individual Investors section at putnam.com.
48
Fund information
Founded over 70 years ago, Putnam Investments was built around the concept that a balance between risk and reward is the hallmark of a well-rounded financial program. We manage over 100 funds across income, value, blend, growth, asset allocation, absolute return, and global sector categories.
| Investment Manager | Trustees | Janet C. Smith |
| Putnam Investment | John A. Hill, Chairman | Vice President, Principal |
| Management, LLC | Jameson A. Baxter, | Accounting Officer and |
| One Post Office Square | Vice Chairman | Assistant Treasurer |
| Boston, MA 02109 | Ravi Akhoury | |
| Barbara M. Baumann | Susan G. Malloy | |
| Investment Sub-Manager | Charles B. Curtis | Vice President and |
| Putnam Investments Limited | Robert J. Darretta | Assistant Treasurer |
| 57–59 St James’s Street | Myra R. Drucker | |
| London, England SW1A 1LD | Paul L. Joskow | Beth S. Mazor |
| Kenneth R. Leibler | Vice President | |
| Investment Sub-Advisor | Robert E. Patterson | |
| The Putnam Advisory | George Putnam, III | James P. Pappas |
| Company, LLC | Robert L. Reynolds | Vice President |
| One Post Office Square | W. Thomas Stephens | |
| Richard B. Worley | Francis J. McNamara, III | |
| Boston, MA 02109 | Vice President and | |
| Marketing Services | Officers | Chief Legal Officer |
| Putnam Retail Management | Robert L. Reynolds | |
| One Post Office Square | President | Robert R. Leveille |
| Boston, MA 02109 | Vice President and | |
| Jonathan S. Horwitz | Chief Compliance Officer | |
| Custodian | Executive Vice President, | |
| State Street Bank | Principal Executive Officer, | Mark C. Trenchard |
| and Trust Company | Treasurer and | Vice President and BSA |
| Compliance Liaison | Compliance Officer | |
| Legal Counsel | ||
| Ropes & Gray LLP | Steven D. Krichmar | Judith Cohen |
| Vice President and Principal | Vice President, Clerk and | |
| Independent Registered | Financial Officer | Assistant Treasurer |
| Public Accounting Firm | ||
| PricewaterhouseCoopers LLP | Nancy E. Florek | |
| Vice President, Assistant Clerk, | ||
| Assistant Treasurer and | ||
| Proxy Manager |
This report is for the information of shareholders of Putnam Europe Equity Fund. It may also be used as sales literature when preceded or accompanied by the current prospectus, the most recent copy of Putnam’s Quarterly Performance Summary, and Putnam’s Quarterly Ranking Summary. For more recent performance, please visit putnam.com. Investors should carefully consider the investment objective, risks, charges, and expenses of a fund, which are described in its prospectus. For this and other information or to request a prospectus, or a summary prospectus if available, call 1-800-225-1581 toll free. Please read the prospectus carefully before investing. The fund’s Statement of Additional Information contains additional information about the fund’s Trustees and is available without charge upon request by calling 1-800-225-1581.
Item 2. Code of Ethics:
(a) The fund’s principal executive, financial and accounting officers are employees of Putnam Investment Management, LLC, the Fund's investment manager. As such they are subject to a comprehensive Code of Ethics adopted and administered by Putnam Investments which is designed to protect the interests of the firm and its clients. The Fund has adopted a Code of Ethics which incorporates the Code of Ethics of Putnam Investments with respect to all of its officers and Trustees who are employees of Putnam Investment Management, LLC. For this reason, the Fund has not adopted a separate code of ethics governing its principal executive, financial and accounting officers.
(c) In May 2008, the Code of Ethics of Putnam Investment Management, LLC was updated in its entirety to include the amendments adopted in August 2007 as well as a several additional technical, administrative and non-substantive changes. In May of 2009, the Code of Ethics of Putnam Investment Management, LLC was amended to reflect that all employees will now be subject to a 90-day blackout restriction on holding Putnam open-end funds, except for portfolio managers and their supervisors (and each of their immediate family members), who will be subject to a one-year blackout restriction on the funds that they manage or supervise. In June 2010, the Code of Ethics of Putnam Investments was updated in its entirety to include the amendments adopted in May of 2009 and to change certain rules and limits contained in the Code of Ethics. In addition, the updated Code of Ethics included numerous technical, administrative and non - -substantive changes, which were intended primarily to make the document easier to navigate and understand.
Item 3. Audit Committee Financial Expert:
The Funds' Audit and Compliance Committee is comprised solely of Trustees who are “independent” (as such term has been defined by the Securities and Exchange Commission ("SEC") in regulations implementing Section 407 of the Sarbanes-Oxley Act (the "Regulations")). The Trustees believe that each of the members of the Audit and Compliance Committee also possess a combination of knowledge and experience with respect to financial accounting matters, as well as other attributes, that qualify them for service on the Committee. In addition, the Trustees have determined that each of Mr. Patterson, Mr. Leibler, Mr. Hill, Mr. Darretta and Ms. Baumann qualifies as an “audit committee financial expert” (as such term has been defined by the Regulations) based on their review of his or her pertinent experience and education. The SEC has stated that the designation or identification of a person as an audit committee financial expert pursuant to th is Item 3 of Form N-CSR does not impose on such person any duties, obligations or liability that are greater than the duties, obligations and liability imposed on such person as a member of the Audit and Compliance Committee and the Board of Trustees in the absence of such designation or identification.
Item 4. Principal Accountant Fees and Services:
The following table presents fees billed in each of the last two fiscal years for services rendered to the fund by the fund’s independent auditor:
| Fiscal | Audit- | |||
| year | Audit | Related | Tax | All Other |
| ended | Fees | Fees | Fees | Fees |
| June 30, 2010 | $63,628 | $-- | $4,879 | $298* |
| June 30, 2009 | $83,907 | $-- | $5,532 | $400* |
* Includes fees of $298 and $400 billed by the fund’s independent auditor to the fund for procedures necessitated by regulatory and litigation matters for the fiscal years ended June 30, 2010 and June 30, 2009, respectively. These fees were reimbursed to the fund by Putnam Investment Management, LLC (“Putnam Management”).
For the fiscal years ended June 30, 2010 and June 30, 2009, the fund’s independent auditor billed aggregate non-audit fees in the amounts of $ 379,336 and $472,757 respectively, to the fund, Putnam Management and any entity controlling, controlled by or under common control with Putnam Management that provides ongoing services to the fund.
Audit Fees represent fees billed for the fund's last two fiscal years relating to the audit and review of the financial statements included in annual reports and registration statements, and other services that are normally provided in connection with statutory and regulatory filings or engagements.
Audit-Related Fees represent fees billed in the fund’s last two fiscal years for services traditionally performed by the fund’s auditor, including accounting consultation for proposed transactions or concerning financial accounting and reporting standards and other audit or attest services not required by statute or regulation.
Tax Fees represent fees billed in the fund’s last two fiscal years for tax compliance, tax planning and tax advice services. Tax planning and tax advice services include assistance with tax audits, employee benefit plans and requests for rulings or technical advice from taxing authorities.
All Other Fees represent fees billed for services relating to an analysis of the proposed market timing distribution.
Pre-Approval Policies of the Audit and Compliance Committee. The Audit and Compliance Committee of the Putnam funds has determined that, as a matter of policy, all work performed for the funds by the funds’ independent auditors will be pre-approved by the Committee itself and thus will generally not be subject to pre-approval procedures.
The Audit and Compliance Committee also has adopted a policy to pre-approve the engagement by Putnam Management and certain of its affiliates of the funds’ independent auditors, even in circumstances where pre-approval is not required by applicable law. Any such requests by Putnam Management or certain of its affiliates are typically submitted in writing to the Committee and explain, among other things, the nature of the proposed engagement, the estimated fees, and why this work should be performed by that particular audit firm as opposed to another one. In reviewing such requests, the Committee considers, among other things, whether the provision of such services by the audit firm are compatible with the independence of the audit firm.
The following table presents fees billed by the fund’s independent auditor for services required to be approved pursuant to paragraph (c)(7)(ii) of Rule 2-01 of Regulation S-X.
| Fiscal | Audit- | All | Total | |
| year | Related | Tax | Other | Non-Audit |
| ended | Fees | Fees | Fees | Fees |
| June 30, 2010 | $ - | $ 218,107 | $ - | $ - |
| June 30, 2009 | $ - | $ 400,741 | $ - | $ - |
Item 5. Audit Committee of Listed Registrants
Not applicable
Item 6. Schedule of Investments:
The registrant’s schedule of investments in unaffiliated issuers is included in the report to shareholders in Item 1 above.
Item 7. Disclosure of Proxy Voting Policies and Procedures For Closed- End Management Investment Companies:
Not applicable
Item 8. Portfolio Managers of Closed- End Investment Companies
Not Applicable
Item 9. Purchases of Equity Securities by Closed-End Management Investment Companies and Affiliated Purchasers:
Not applicable
Item 10. Submission of Matters to a Vote of Security Holders:
Not applicable
Item 11. Controls and Procedures:
(a) The registrant's principal executive officer and principal financial officer have concluded, based on their evaluation of the effectiveness of the design and operation of the registrant's disclosure controls and procedures as of a date within 90 days of the filing date of this report, that the design and operation of such procedures are generally effective to provide reasonable assurance that information required to be disclosed by the registrant in this report is recorded, processed, summarized and reported within the time periods specified in the Commission's rules and forms.
(b) Changes in internal control over financial reporting: Not applicable
Item 12. Exhibits:
(a)(1) The Code of Ethics of The Putnam Funds, which incorporates the Code of Ethics of Putnam Investments, is filed herewith.
(a)(2) Separate certifications for the principal executive officer and principal financial officer of the registrant as required by Rule 30a-2(a) under the Investment Company Act of 1940, as amended, are filed herewith.
(b) The certifications required by Rule 30a-2(b) under the Investment Company Act of 1940, as amended, are filed herewith.
SIGNATURES
Pursuant to the requirements of the Securities Exchange Act of 1934 and the Investment Company Act of 1940, the registrant has duly caused this report to be signed on its behalf by the undersigned, thereunto duly authorized.
Putnam Europe Equity Fund
By (Signature and Title):
/s/Janet C. Smith
Janet C. Smith
Principal Accounting Officer
Date: August 27, 2010
Pursuant to the requirements of the Securities Exchange Act of 1934 and the Investment Company Act of 1940, this report has been signed below by the following persons on behalf of the registrant and in the capacities and on the dates indicated.
By (Signature and Title):
/s/Jonathan S. Horwitz
Jonathan S. Horwitz
Principal Executive Officer
Date: August 27, 2010
By (Signature and Title):
/s/Steven D. Krichmar
Steven D. Krichmar
Principal Financial Officer
Date: August 27, 2010