| UNITED STATES | |||
| SECURITIES AND EXCHANGE COMMISSION | |||
| Washington, D.C. 20549 | |||
| FORM N-CSR | |||
| CERTIFIED SHAREHOLDER REPORT OF REGISTERED | |||
| MANAGEMENT INVESTMENT COMPANIES | |||
| Investment Company Act file number: (811-05693) | |||
| Exact name of registrant as specified in charter: | Putnam Europe Equity Fund | ||
| Address of principal executive offices: One Post Office Square, Boston, Massachusetts 02109 | |||
| Name and address of agent for service: | Beth S. Mazor, Vice President | ||
| One Post Office Square | |||
| Boston, Massachusetts 02109 | |||
| Copy to: | John W. Gerstmayr, Esq. | ||
| Ropes & Gray LLP | |||
| 800 Boylston Street | |||
| Boston, Massachusetts 02199-3600 | |||
| Registrant’s telephone number, including area code: | (617) 292-1000 | ||
| Date of fiscal year end: June 30, 2011 | |||
| Date of reporting period: July 1, 2010 — December 31, 2010 | |||
Item 1. Report to Stockholders:
The following is a copy of the report transmitted to stockholders pursuant to Rule 30e-1 under the Investment Company Act of 1940:
Putnam
Europe Equity
Fund
Semiannual report
12 | 31 | 10
| Message from the Trustees | 1 | ||
| About the fund | 2 | ||
| Performance snapshot | 4 | ||
| Interview with your fund’s portfolio manager | 5 | ||
| Your fund’s performance | 11 | ||
| Your fund’s expenses | 13 | ||
| Terms and definitions | 15 | ||
| Other information for shareholders | 16 | ||
| Financial statements | 17 | ||
Message from the Trustees
Dear Fellow Shareholder:
The global recovery continued to solidify in the final months of 2010, with economies around the world experiencing economic growth. In the United States, corporations are emerging from the Great Recession in strong financial health. Putnam’s investment team believes the outlook for U.S. equities is further bolstered by low short-term interest rates and the extension of current tax rates. Another sign of the positive outlook for equities was that traditionally safe-haven U.S. Treasuries experienced their first setback in several years, as investors sought higher potential returns in riskier assets.
Although the global recovery continues, a range of fiscal and monetary circumstances around the world contributes to a global investment mosaic that is more varied than in recent years. Europe struggles with debt issues at a time when emerging markets are striving to dampen inflationary growth. This divergence may well lead to future market volatility. However, we believe it may also lead to additional opportunities for active, research-focused managers like Putnam.
In developments affecting oversight of your fund, we wish to thank Richard B. Worley and Myra R. Drucker, who have retired from the Board of Trustees, for their many years of dedicated and thoughtful leadership.
Lastly, we would like to take this opportunity to welcome new shareholders to the fund and to thank all of our investors for your continued confidence in Putnam.

About the fund
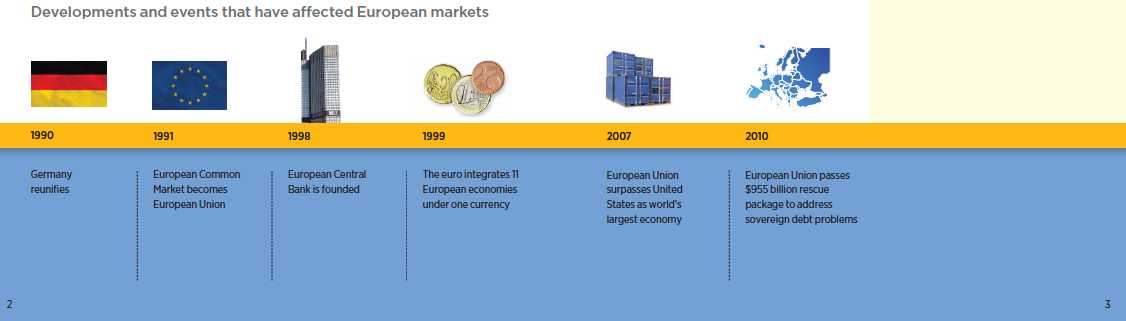
Pursuing growth in European markets since 1990
As a shareholder of Putnam Europe Equity Fund, you are seeking to benefit from opportunities in one of the world’s most developed economic regions. While international investing involves additional risks, Europe has a long history of capitalism and stock investing, and the region continues to evolve. Today, the 27 member states of the European Union, with approximately 500 million people, form a large, integrated economy that exports more goods and services than any nation in the world.
With these advantages, it is not surprising that European companies are leaders in many business sectors, including financials, health care, and telecommunications. If you look at the products or services you use every day — from cars and cell phones to household products — you are likely to find many items made by European companies.
At the macroeconomic level, European stocks can offer diversification to U.S. investors because Europe can follow a different business cycle than that of the United States. In Europe, interest rates and monetary policy are set by the European Central Bank, the Bank of England, and other central banks.
While different economic systems, political developments, and currencies like the euro, the British pound, and the Swiss franc can add risk, they also provide diversification for U.S.-based investors. Though international markets can experience downturns, investing internationally gives investors a chance to keep building wealth even if U.S. stocks struggle.
Since 1990, Putnam Europe Equity Fund has served investors by seeking to invest in attractively valued companies across European markets. Pursuing Putnam’s “blend” strategy, the fund’s manager targets stocks believed to be worth more than their current prices indicate, and seeks to position the fund to perform well whether growth- or value-style stocks are leading international markets. The manager selects stocks and determines market and sector weightings relying in part on the proprietary research of Putnam analysts based in Boston and London.
Consider these risks before investing: International investing involves certain risks, such as currency fluctuations, economic instability, and political developments. Additional risks may be associated with emerging-market securities, including illiquidity and volatility. The fund concentrates its investments by region or sector, and involves more risk than a fund that invests more broadly. The use of derivatives involves special risks and may result in losses. Growth stocks may be more susceptible to earnings disappointments, and value stocks may fail to rebound. The market may not favor growth- or value-style investing.
In-depth analysis is key to successful stock selection.
Drawing on the expertise of a dedicated team of stock analysts, the fund’s portfolio manager seeks stocks that are believed to be underpriced by the market. Once a stock is selected for the portfolio, it is regularly assessed to ensure that it continues to be attractive. Areas of focus include:
Valuation The manager carefully considers how each stock is valued, seeking stocks whose valuations are attractive relative to the company’s growth potential and capital requirements.
Cash flow The manager examines each company’s financials, particularly the amount of cash a company generates relative to the earnings that it reports, and projects its ability to generate cash returns going forward.
Quality The manager evaluates high-quality companies with characteristics such as solid management teams and sound business models.
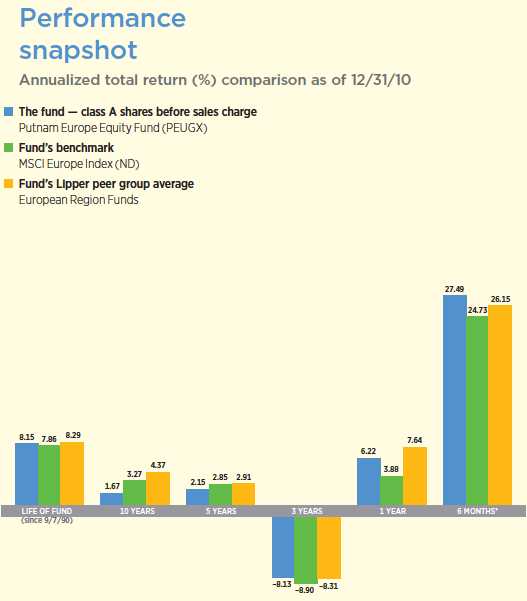
Current performance may be lower or higher than the quoted past performance, which cannot guarantee future results. Share price, principal value, and return will fluctuate, and you may have a gain or a loss when you sell your shares. Performance of class A shares assumes reinvestment of distributions and does not account for taxes. Fund returns in the bar chart do not reflect a sales charge of 5.75%; had they, returns would have been lower. See pages 5 and 11–12 for additional performance information. For a portion of the periods, the fund had expense limitations, without which returns would have been lower. A short-term trading fee of 1% may apply to redemptions or exchanges from certain funds within the time period specified in the fund’s prospectus. To obtain the most recent month-end performance, visit putnam.com.
* Returns for the six-month period are not annualized, but cumulative.
4
Interview with your fund’s portfolio manager
Simon [Sam] Davis
European stocks rallied strongly in the second half of 2010. How did Putnam European Equity Fund perform?
The six-month period ended December 31, 2010, was very favorable for the fund, which outperformed both its benchmark and Lipper peer group average. Effective stock selection and positive sector allocation strategies contributed to this result. The fund’s class A shares increased 27.49% at net asset value while the MSCI Europe Index (ND) climbed 24.73%. The average return for the 111 European Region Funds tracked by Lipper was 26.15% for the same period.
The sovereign debt crisis does not appear to have held European stocks back during the period.
Despite numerous risks, European equities moved up on the back of a continued recovery in corporate earnings and attractive valuations. Furthermore, the European economy is showing signs of recovery in response to a highly accommodative monetary policy and fiscal stimulus. However, the recovery is uneven, with northern European economies displaying relative strength as the euro’s weakness has supported their export activity, and consumption has improved on the back of robust employment. This progress has been offset to some extent by deterioration in peripheral economies, including Greece, Ireland, Italy, Portugal, and Spain, where concerns about unemployment and the announcement of fiscal austerity measures have depressed consumer sentiment and economic activity.
How have you positioned the portfolio in light of these developments?
We continue to identify attractive opportunities on a stock-by-stock basis with

This comparison shows your fund’s performance in the context of broad market indexes for the six months ended 12/31/10. See pages 4 and 11–12 for additional fund performance information. Index descriptions can be found on page 15.
5
a strong emphasis on valuation. We expect that corporate restructuring and consolidation will continue to be an important driver of returns as European companies reassess their prospects amid increased regional and global competition and challenging economic conditions. Furthermore, with liquidity plentiful and monetary authorities cautious about withdrawing stimulus, we think the economic recovery will continue but is unlikely to be stellar. Against this backdrop, we favor companies with strong market positions and limited refinancing risk, which can help create sustainable growth.
The portfolio is positioned to take advantage of undervalued cyclical names, which are likely to benefit from a continued recovery, such as Siemens, a large-cap stock that we believe has the potential to continue to perform well as the recovery progresses. The fund also holds a number of smaller-cap companies offering secular growth prospects, including Warsaw Stock Exchange, which is exposed to the development of the Polish economy and the ongoing privatization of state-owned businesses. Finally, the portfolio is invested in a number of defensive companies that offer dividend yield support and attractive valuations relative to their quality, market position, and financial strength. Royal Dutch Shell , which pays a high and growing dividend, exemplifies our strategy here.
What investments contributed positively to the fund’s performance?
The fund’s greater-than-benchmark exposure to consumer cyclicals, consumer staples, and basic materials was positive for the fund since these sectors are leading the economic recovery. Demand from emerging markets for products in these sectors is particularly noteworthy, as they are not suffering the sluggish growth and debt deleveraging that are affecting developed markets. To gain exposure to this potent growth, we are looking for undervalued European companies that are positioned to profit from consumer demand
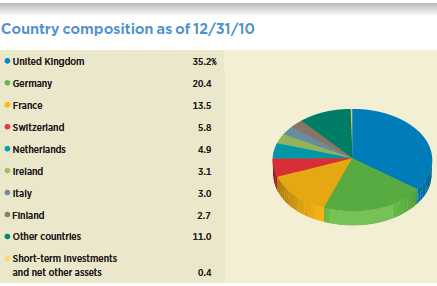
Country allocations are shown as a percentage of the fund’s net assets. Summary information may differ from the portfolio schedule included in the financial statements due to the inclusion of derivative securities and the exclusion of as-of trades, if any, and the use of different classifications of securities for presentation purposes. Weightings will vary over time.
6
in emerging markets. The luxury brand designer Christian Dior, which has exposure to several premier global brands through its shareholding in LVMH Group, is such a company. During the period, the stock rallied on news that LVMH was buying a significant stake in family-owned Hermes.
Elsewhere in the consumer discretionary arena, auto stocks performed very well. The stock price of Fiat rose as investors gained confidence in management’s plan to split the conglomerate into Fiat Industrial and Fiat Auto, thereby revealing greater value for shareholders. Also in the auto sector, Porsche’s merger with Volkswagen is now looking more likely after overcoming significant legal obstacles; consequently, investors bid up Porsche’s share price. Kabel Deutschland, Germany’s largest cable company, is experiencing increased profits by cross-selling its products to its customer base. Investors have been pleased with the company’s cash generation and its ability to reduce its debt obligations.
In the consumer staples sector, the German global retailer Metro is benefiting from robust demand within Germany and from its expansion plans in the emerging markets of Eastern Europe. Investors have been pleased by management’s restructuring efforts to improve its earnings growth and expand sales potential. With global agricultural commodity prices rising, the German-based sugar manufacturer Suedzucker profited from the rise in the global sugar price, which has led to reduced imports and competition in Europe and better prices for its products.
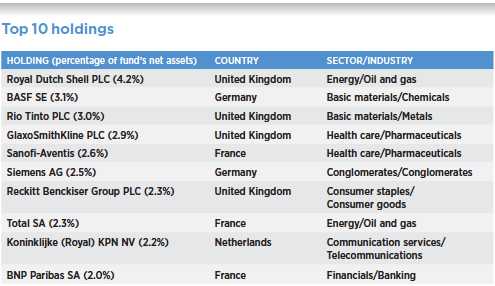
This table shows the fund’s top 10 holdings and the percentage of the fund’s net assets that each represented as of 12/31/10. Short-term holdings are excluded. Holdings will vary over time.
7
An overweight exposure to the materials sector was also beneficial, given the economic expansion in developing markets. The German chemical maker LANXESS is a leading manufacturer of synthetic rubber, which is experiencing increased demand from the automotive industry as adverse weather and limited investment in natural rubber have constrained the supply of the natural alternative. Similarly, the copper and coal producer Xstrata and copper and iron ore producer Rio Tinto have benefited from rising commodity prices.
What holdings detracted from performance?
The stock of French drug maker Sanofi-Aventis came under pressure because of concerns about its offer to buy the U.S. biotechnology company Genzyme. While many analysts think Sanofi-Aventis will ultimately win its bid, others are concerned that the company is paying too much for Genzyme, which is struggling with manufacturing problems and questions about its drug pipeline. We remain committed to the French drug maker, because of its low valuation and attractive growth opportunities in emerging markets.
Given sovereign debt issues in Ireland, the fund’s investment in Bank of Ireland was disappointing. We bought the stock last July, because we thought the bank would be a survivor in a more consolidated marketplace. However, we underestimated the problems facing the Irish economy and the ability of the government to resolve issues concerning their banking system, and sold the position during the fall.
Did the fund have any currency exposure?
We do not engage in currency hedging strategies, but the fund gains currency exposure indirectly through stocks held in the various currencies across Europe. The fund’s investments in any given country can

This chart shows how the fund’s top weightings have changed over the past six months. Weightings are shown as a percentage of net assets. Summary information may differ from the portfolio schedule included in the financial statements due to the inclusion of derivative securities and the exclusion of as-of trades, if any, and the use of different classifications of securities for presentation purposes. Holdings will vary over time.
Data in the chart reflect a new calculation methodology placed in effect within the past six months.
8
impact results if that country’s corresponding currency appreciates or depreciates.
For the six-month period, the portfolio’s currency exposures detracted from performance. The fund’s underweighting in the Swiss franc and Swedish krona detracted from results since these two currencies appreciated versus the U.S. dollar. The fund’s overweighting in the British pound and euro, resulting from the portfolio’s considerable investments in the United Kingdom, Germany, and France, detracted from performance since these two currencies depreciated relative to the U.S. dollar.
What is your outlook for European stocks in 2011?
In the short term, given the upward move in stock prices, markets may be more vulnerable to a correction given the high level of bond issuance planned by peripheral European countries in the first quarter of 2011 and the risks that this entails. However, the euro has weakened versus the U.S. dollar in response to sovereign risk concerns, bolstering key areas of the economy. Monetary policy is likely to remain loose for some time, as the European Central Bank wants to make sure the nascent recovery continues. This should create a benign environment for equities, barring an inflation surprise.
Longer term, notwithstanding myriad uncertainties, we believe that European stock valuations remain attractive, especially relative to low-yielding bond investments, and that corporate earnings will continue to grow in 2011. We also think it is reasonable to expect an acceleration in corporate investment through increased capital investment, share buyback programs, and merger and acquisition activity — all of which would help support the equity markets. Earnings growth should continue to be a prominent driver of market and individual equity returns, which underscores the importance of our bottom-up investment process. We are focused on the potential of individual stocks, even if the country of domicile may also influence returns from a top-down, macroeconomic perspective for the foreseeable future.
Thank you, Sam, for your time and insights today.
The views expressed in this report are exclusively those of Putnam Management. They are not meant as investment advice.
Please note that the holdings discussed in this report may not have been held by the fund for the entire period. Portfolio composition is subject to review in accordance with the fund’s investment strategy and may vary in the future. Current and future portfolio holdings are subject to risk.

Portfolio Manager Simon Davis is Head of International Equities at Putnam. He has a B.A. from Oxford University. Simon joined Putnam in 2000 and has been in the investment industry since 1988.
9
IN THE NEWS
The World Bank expects developing nations to continue to lead global growth in 2011. In its Global Economic Prospects report, the World Bank projects that the global economy is moving to a slower, but solid growth trajectory for the coming year. Global GDP is estimated to slow to 3.3% in 2011, down from 3.9% in 2010. The bank also estimates a 6% growth rate for developing countries, compared with 2.4% for “high-income countries.” Still, the bank cites risks to developing-nation growth, including volatility in commodity prices and capital inflows, and European sovereign debt issues.
10
Your fund’s performance
This section shows your fund’s performance, price, and distribution information for periods ended December 31, 2010, the end of the first half of its current fiscal year. In accordance with regulatory requirements for mutual funds, we also include expense information taken from the fund’s current prospectus. Performance should always be considered in light of a fund’s investment strategy. Data represent past performance. Past performance does not guarantee future results. More recent returns may be less or more than those shown. Investment return and principal value will fluctuate, and you may have a gain or a loss when you sell your shares. Performance information does not reflect any deduction for taxes a shareholder may owe on fund distributions or on the redemption of fund shares. For the most recent month-end performance, please visit the Individual Investors section at putnam.com or call Putnam at 1-800-225-1581. Class R and class& nbsp;Y shares are not available to all investors. See the Terms and Definitions section in this report for definitions of the share classes offered by your fund.
Fund performance Total return for periods ended 12/31/10
| Class A | Class B | Class C | Class M | Class R | Class Y | |||||
| (inception dates) | (9/7/90) | (2/1/94) | (7/26/99) | (12/1/94) | (12/1/03) | (10/4/05) | ||||
| NAV | POP | NAV | CDSC | NAV | CDSC | NAV | POP | NAV | NAV | |
| Annual average | ||||||||||
| (life of fund) | 8.15% | 7.84% | 7.34% | 7.34% | 7.35% | 7.35% | 7.64% | 7.45% | 7.90% | 8.22% |
| 10 years | 18.04 | 11.27 | 9.41 | 9.41 | 9.56 | 9.56 | 12.22 | 8.29 | 15.53 | 19.63 |
| Annual average | 1.67 | 1.07 | 0.90 | 0.90 | 0.92 | 0.92 | 1.16 | 0.80 | 1.45 | 1.81 |
| 5 years | 11.21 | 4.80 | 7.07 | 5.35 | 7.19 | 7.19 | 8.53 | 4.73 | 10.04 | 12.65 |
| Annual average | 2.15 | 0.94 | 1.38 | 1.05 | 1.40 | 1.40 | 1.65 | 0.93 | 1.93 | 2.41 |
| 3 years | –22.45 | –26.92 | –24.23 | –26.48 | –24.14 | –24.14 | –23.58 | –26.26 | –22.97 | –21.85 |
| Annual average | –8.13 | –9.93 | –8.83 | –9.75 | –8.80 | –8.80 | –8.57 | –9.66 | –8.33 | –7.89 |
| 1 year | 6.22 | 0.11 | 5.40 | 0.40 | 5.39 | 4.39 | 5.69 | 2.00 | 5.97 | 6.46 |
| 6 months | 27.49 | 20.13 | 26.94 | 21.94 | 27.01 | 26.01 | 27.23 | 22.76 | 27.35 | 27.69 |
Current performance may be lower or higher than the quoted past performance, which cannot guarantee future results. After-sales-charge returns (public offering price, or POP) for class A and M shares reflect a maximum 5.75% and 3.50% load, respectively. Class B share returns reflect the applicable contingent deferred sales charge (CDSC), which is 5% in the first year, declining over time to 1% in the sixth year, and is eliminated thereafter. Class C shares reflect a 1% CDSC for the first year that is eliminated thereafter. Class R and Y shares have no initial sales charge or CDSC. Performance for class B, C, M, R, and Y shares before their inception is derived from the historical performance of class A shares, adjusted for the applicable sales charge (or CDSC) and the higher operating expenses for such shares, except for class Y shares, for which 12b-1 fees are not applicable.
Class B share performance does not reflect conversion to class A shares.
For a portion of the periods, the fund had expense limitations, without which returns would have been lower.
A short-term trading fee of 1% may apply to redemptions or exchanges from certain funds within the time period specified in the fund’s prospectus.
11
Comparative index returns For periods ended 12/31/10
| Lipper European Region Funds | ||
| MSCI Europe Index (ND) | category average* | |
| Annual average (life of fund) | 7.86% | 8.29% |
| 10 years | 37.90 | 62.56 |
| Annual average | 3.27 | 4.37 |
| 5 years | 15.10 | 16.67 |
| Annual average | 2.85 | 2.91 |
| 3 years | –24.40 | –22.33 |
| Annual average | –8.90 | –8.31 |
| 1 year | 3.88 | 7.64 |
| 6 months | 24.73 | 26.15 |
Index and Lipper results should be compared to fund performance at net asset value.
* Over the 6-month, 1-year, 3-year, 5-year, 10-year, and life-of-fund periods ended 12/31/10, there were 111, 109, 95, 88, 63, and 9 funds, respectively, in this Lipper category.
Fund price and distribution information For the six-month period ended 12/31/10
| Distributions | Class A | Class B | Class C | Class M | Class R | Class Y | ||
| Number | 1 | 1 | 1 | 1 | 1 | 1 | ||
| Income | $0.367 | $0.191 | $0.214 | $0.268 | $0.329 | $0.417 | ||
| Capital gains | — | — | — | — | — | — | ||
| Total | $0.367 | $0.191 | $0.214 | $0.268 | $0.329 | $0.417 | ||
| Share value | NAV | POP | NAV | NAV | NAV | POP | NAV | NAV |
| 6/30/10 | $15.83 | $16.80 | $15.12 | $15.50 | $15.65 | $16.22 | $15.66 | $15.90 |
| 12/31/10 | 19.81 | 21.02 | 19.00 | 19.47 | 19.64 | 20.35 | 19.61 | 19.88 |
The classification of distributions, if any, is an estimate. Final distribution information will appear on your year-end tax forms.
12
Your fund’s expenses
As a mutual fund investor, you pay ongoing expenses, such as management fees, distribution fees (12b-1 fees), and other expenses. Using the following information, you can estimate how these expenses affect your investment and compare them with the expenses of other funds. You may also pay one-time transaction expenses, including sales charges (loads) and redemption fees, which are not shown in this section and would have resulted in higher total expenses. For more information, see your fund’s prospectus or talk to your financial representative.
Expense ratios
| Class A | Class B | Class C | Class M | Class R | Class Y | |
| Total annual operating expenses for the fiscal year | ||||||
| ended 6/30/10* | 1.47% | 2.22% | 2.22% | 1.97% | 1.72% | 1.22% |
| Annualized expense ratio for the six-month period | ||||||
| ended 12/31/10 | 1.39% | 2.14% | 2.14% | 1.89% | 1.64% | 1.14% |
Fiscal-year expense information in this table is taken from the most recent prospectus, is subject to change, and may differ from that shown for the annualized expense ratio and in the financial highlights of this report. Expenses are shown as a percentage of average net assets.
* Restated to reflect projected expenses under a new management contract effective 1/1/10.
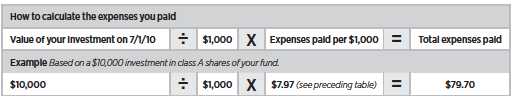
Expenses per $1,000
The following table shows the expenses you would have paid on a $1,000 investment in the fund from July 1, 2010, to December 31, 2010. It also shows how much a $1,000 investment would be worth at the close of the period, assuming actual returns and expenses.
| Class A | Class B | Class C | Class M | Class R | Class Y | |
| Expenses paid per $1,000*† | $7.97 | $12.24 | $12.24 | $10.82 | $9.40 | $6.54 |
| Ending value (after expenses) | $1,274.90 | $1,269.40 | $1,270.10 | $1,272.30 | $1,273.50 | $1,276.90 |
* Expenses for each share class are calculated using the fund’s annualized expense ratio for each class, which represents the ongoing expenses as a percentage of average net assets for the six months ended 12/31/10. The expense ratio may differ for each share class.
† Expenses are calculated by multiplying the expense ratio by the average account value for the period; then multiplying the result by the number of days in the period; and then dividing that result by the number of days in the year.
13
Estimate the expenses you paid
To estimate the ongoing expenses you paid for the six months ended December 31, 2010, use the following calculation method. To find the value of your investment on July 1, 2010, call Putnam at 1-800-225-1581.
Compare expenses using the SEC’s method
The Securities and Exchange Commission (SEC) has established guidelines to help investors assess fund expenses. Per these guidelines, the following table shows your fund’s expenses based on a $1,000 investment, assuming a hypothetical 5% annualized return. You can use this information to compare the ongoing expenses (but not transaction expenses or total costs) of investing in the fund with those of other funds. All mutual fund shareholder reports will provide this information to help you make this comparison. Please note that you cannot use this information to estimate your actual ending account balance and expenses paid during the period.
| Class A | Class B | Class C | Class M | Class R | Class Y | |
| Expenses paid per $1,000*† | $7.07 | $10.87 | $10.87 | $9.60 | $8.34 | $5.80 |
| Ending value (after expenses) | $1,018.20 | $1,014.42 | $1,014.42 | $1,015.68 | $1,016.94 | $1,019.46 |
* Expenses for each share class are calculated using the fund’s annualized expense ratio for each class, which represents the ongoing expenses as a percentage of average net assets for the six months ended 12/31/10. The expense ratio may differ for each share class.
† Expenses are calculated by multiplying the expense ratio by the average account value for the period; then multiplying the result by the number of days in the period; and then dividing that result by the number of days in the year.
14
Terms and definitions
Important terms
Total return shows how the value of the fund’s shares changed over time, assuming you held the shares through the entire period and reinvested all distributions in the fund.
Net asset value (NAV) is the price, or value, of one share of a mutual fund, without a sales charge. NAVs fluctuate with market conditions. NAV is calculated by dividing the net assets of each class of shares by the number of outstanding shares in the class.
Public offering price (POP) is the price of a mutual fund share plus the maximum sales charge levied at the time of purchase. POP performance figures shown here assume the 5.75% maximum sales charge for class A shares and 3.50% for class M shares.
Contingent deferred sales charge (CDSC) is generally a charge applied at the time of the redemption of class B or C shares and assumes redemption at the end of the period. Your fund’s class B CDSC declines over time from a 5% maximum during the first year to 1% during the sixth year. After the sixth year, the CDSC no longer applies. The CDSC for class C shares is 1% for one year after purchase.
Share classes
Class A shares are generally subject to an initial sales charge and no CDSC (except on certain redemptions of shares bought without an initial sales charge).
Class B shares are not subject to an initial sales charge. They may be subject to a CDSC.
Class C shares are not subject to an initial sales charge and are subject to a CDSC only if the shares are redeemed during the first year.
Class M shares have a lower initial sales charge and a higher 12b-1 fee than class A shares and no CDSC (except on certain redemptions of shares bought without an initial sales charge).
Class R shares are not subject to an initial sales charge or CDSC and are available only to certain defined contribution plans.
Class Y shares are not subject to an initial sales charge or CDSC, and carry no 12b-1 fee. They are generally only available to corporate and institutional clients and clients in other approved programs.
Comparative indexes
Barclays Capital Aggregate Bond Index is an unmanaged index of U.S. investment-grade fixed-income securities.
BofA (Bank of America) Merrill Lynch U.S. 3-Month Treasury Bill Index is an unmanaged index that seeks to measure the performance of U.S. Treasury bills available in the marketplace.
MSCI Europe Index (ND) is an unmanaged index of Western European equity securities.
S&P 500 Index is an unmanaged index of common stock performance.
Indexes assume reinvestment of all distributions and do not account for fees. Securities and performance of a fund and an index will differ. You cannot invest directly in an index.
Lipper is a third-party industry-ranking entity that ranks mutual funds. Its rankings do not reflect sales charges. Lipper rankings are based on total return at net asset value relative to other funds that have similar current investment styles or objectives as determined by Lipper. Lipper may change a fund’s category assignment at its discretion. Lipper category averages reflect performance trends for funds within a category.
15
Other information for shareholders
Important notice regarding delivery of shareholder documents
In accordance with SEC regulations, Putnam sends a single copy of annual and semiannual shareholder reports, prospectuses, and proxy statements to Putnam shareholders who share the same address, unless a shareholder requests otherwise. If you prefer to receive your own copy of these documents, please call Putnam at 1-800-225-1581, and Putnam will begin sending individual copies within 30 days.
Proxy voting
Putnam is committed to managing our mutual funds in the best interests of our shareholders. The Putnam funds’ proxy voting guidelines and procedures, as well as information regarding how your fund voted proxies relating to portfolio securities during the 12-month period ended June 30, 2010, are available in the Individual Investors section of putnam.com, and on the SEC’s Web site, www.sec.gov. If you have questions about finding forms on the SEC’s Web site, you may call the SEC at 1-800-SEC-0330. You may also obtain the Putnam funds’ proxy voting guidelines and procedures at no charge by calling Putnam’s Shareholder Services at 1-800-225-1581.
Fund portfolio holdings
The fund will file a complete schedule of its portfolio holdings with the SEC for the first and third quarters of each fiscal year on Form N-Q. Shareholders may obtain the fund’s Forms N-Q on the SEC’s Web site at www.sec.gov. In addition, the fund’s Forms N-Q may be reviewed and copied at the SEC’s Public Reference Room in Washington, D.C. You may call the SEC at 1-800-SEC-0330 for information about the SEC’s Web site or the operation of the Public Reference Room.
Trustee and employee fund ownership
Putnam employees and members of the Board of Trustees place their faith, confidence, and, most importantly, investment dollars in Putnam mutual funds. As of December 31, 2010, Putnam employees had approximately $345,000,000 and the Trustees had approximately $67,000,000 invested in Putnam mutual funds. These amounts include investments by the Trustees’ and employees’ immediate family members as well as investments through retirement and deferred compensation plans.
16
Financial statements
A guide to financial statements
These sections of the report, as well as the accompanying Notes, constitute the fund’s financial statements.
The fund’s portfolio lists all the fund’s investments and their values as of the last day of the reporting period. Holdings are organized by asset type and industry sector, country, or state to show areas of concentration and diversification.
Statement of assets and liabilities shows how the fund’s net assets and share price are determined. All investment and non-investment assets are added together. Any unpaid expenses and other liabilities are subtracted from this total. The result is divided by the number of shares to determine the net asset value per share, which is calculated separately for each class of shares. (For funds with preferred shares, the amount subtracted from total assets includes the liquidation preference of preferred shares.)
Statement of operations shows the fund’s net investment gain or loss. This is done by first adding up all the fund’s earnings — from dividends and interest income — and subtracting its operating expenses to determine net investment income (or loss). Then, any net gain or loss the fund realized on the sales of its holdings — as well as any unrealized gains or losses over the period — is added to or subtracted from the net investment result to determine the fund’s net gain or loss for the fiscal period.
Statement of changes in net assets shows how the fund’s net assets were affected by the fund’s net investment gain or loss, by distributions to shareholders, and by changes in the number of the fund’s shares. It lists distributions and their sources (net investment income or realized capital gains) over the current reporting period and the most recent fiscal year-end. The distributions listed here may not match the sources listed in the Statement of operations because the distributions are determined on a tax basis and may be paid in a different period from the one in which they were earned. Dividend sources are estimated at the time of declaration. Actual results may vary. Any non-taxable return of capital cannot be determined until final tax calculations are completed after the end of the fund’s fiscal year.
Financial highlights provide an overview of the fund’s investment results, per-share distributions, expense ratios, net investment income ratios, and portfolio turnover in one summary table, reflecting the five most recent reporting periods. In a semiannual report, the highlights table also includes the current reporting period.
17
The fund’s portfolio 12/31/10 (Unaudited)
| COMMON STOCKS (99.6%)* | Shares | Value |
| Belgium (2.7%) | ||
| Anheuser-Busch InBev NV | 59,462 | $3,403,011 |
| Telenet Group Holding NV † | 48,922 | 1,928,465 |
| 5,331,476 | ||
| Brazil (0.7%) | ||
| Petroleo Brasileiro SA ADR (Preference) | 41,800 | 1,428,306 |
| 1,428,306 | ||
| China (0.9%) | ||
| Ping An Insurance (Group) Co. of China, Ltd. | 153,500 | 1,716,088 |
| 1,716,088 | ||
| Denmark (0.9%) | ||
| Pandora A/S † | 31,369 | 1,890,682 |
| 1,890,682 | ||
| Finland (2.7%) | ||
| Fortum OYJ | 53,360 | 1,607,523 |
| Metso OYJ | 36,125 | 2,019,130 |
| Nokia OYJ | 171,071 | 1,770,506 |
| 5,397,159 | ||
| France (13.5%) | ||
| AXA SA | 144,147 | 2,399,690 |
| BNP Paribas SA | 63,313 | 4,030,614 |
| Christian Dior SA | 26,360 | 3,767,934 |
| Sanofi-Aventis | 81,832 | 5,235,826 |
| Schneider Electric SA | 16,747 | 2,508,044 |
| Societe Generale | 35,737 | 1,921,942 |
| Technip SA | 25,705 | 2,375,067 |
| Total SA | 87,994 | 4,665,266 |
| 26,904,383 | ||
| Germany (20.4%) | ||
| Allianz SE | 21,161 | 2,516,313 |
| BASF SE | 76,275 | 6,088,870 |
| Biotest AG (Preference) | 23,107 | 1,431,791 |
| Deutsche Post AG | 234,699 | 3,985,613 |
| Henkel AG & Co. KGaA | 59,066 | 3,675,339 |
| Kabel Deutschland Holding AG † | 66,612 | 3,106,324 |
| LANXESS AG | 34,377 | 2,716,662 |
| Metro AG | 41,643 | 3,000,197 |
| MTU Aero Engines Holding AG | 38,882 | 2,631,268 |
| Porsche Automobil Holding SE (Preference) | 34,848 | 2,779,977 |
| Siemens AG | 39,520 | 4,898,654 |
| Suedzucker AG | 66,700 | 1,777,069 |
| Wincor Nixdorf AG | 25,875 | 2,110,870 |
| 40,718,947 | ||
| Ireland (3.1%) | ||
| Kerry Group PLC Class A | 95,680 | 3,194,625 |
| WPP PLC | 237,014 | 2,918,270 |
| 6,112,895 | ||
| Italy (3.0%) | ||
| Fiat SpA | 188,694 | 3,893,177 |
| Mediaset SpA | 340,427 | 2,060,927 |
| 5,954,104 | ||
18
| COMMON STOCKS (99.6%)* cont. | Shares | Value |
| Netherlands (4.9%) | ||
| Gemalto NV | 39,222 | $1,670,133 |
| ING Groep NV † | 384,909 | 3,746,878 |
| Koninklijke (Royal) KPN NV | 300,509 | 4,387,936 |
| 9,804,947 | ||
| Norway (0.8%) | ||
| DnB NOR ASA | 111,772 | 1,571,308 |
| 1,571,308 | ||
| Poland (0.7%) | ||
| Warsaw Stock Exchange † | 88,399 | 1,459,885 |
| 1,459,885 | ||
| Portugal (0.4%) | ||
| Zon Multimedia Servicos de Telecomunicacoes e Multimedia | ||
| SGPS SA | 194,745 | 882,767 |
| 882,767 | ||
| Russia (2.1%) | ||
| Aeroflot — Russian Airlines OJSC | 210,000 | 546,000 |
| Lukoil OAO ADR | 17,637 | 996,491 |
| Sberbank OJSC † | 557,076 | 1,897,958 |
| Synergy Co. † | 13,151 | 657,550 |
| 4,097,999 | ||
| Spain (1.8%) | ||
| Banco Santander Central Hispano SA | 342,291 | 3,628,601 |
| 3,628,601 | ||
| Sweden (—%) | ||
| SKF AB Class B | 286 | 8,166 |
| 8,166 | ||
| Switzerland (5.8%) | ||
| Actelion NV † | 19,781 | 1,084,471 |
| Credit Suisse Group | 63,541 | 2,563,004 |
| Nestle SA | 49,750 | 2,916,600 |
| Novartis AG | 37,402 | 2,200,707 |
| Syngenta AG | 9,420 | 2,758,721 |
| 11,523,503 | ||
| United Kingdom (35.2%) | ||
| Barclays PLC | 629,168 | 2,567,359�� |
| BG Group PLC | 193,711 | 3,915,242 |
| BP PLC | 336,053 | 2,439,908 |
| Britvic PLC | 255,864 | 1,888,622 |
| Carillion PLC | 503,751 | 3,019,942 |
| Centrica PLC | 677,646 | 3,504,424 |
| Compass Group PLC | 328,865 | 2,979,841 |
| GlaxoSmithKline PLC | 299,265 | 5,787,312 |
| HSBC Holdings PLC | 193,192 | 1,961,716 |
| Kingfisher PLC | 751,447 | 3,086,835 |
| Lloyds Banking Group PLC † | 1,891,920 | 1,938,507 |
| Prudential PLC | 173,850 | 1,811,133 |
| Reckitt Benckiser Group PLC | 84,883 | 4,666,370 |
| Rio Tinto PLC | 84,333 | 5,900,713 |
| Royal Dutch Shell PLC Class A | 249,602 | 8,324,471 |
| Smiths Group PLC | 109,684 | 2,129,668 |
| Telecity Group PLC † | 256,580 | 1,882,302 |
19
| COMMON STOCKS (99.6%)* cont. | Shares | Value |
| United Kingdom cont. | ||
| TUI Travel PLC | 561,205 | $2,154,810 |
| Tullow Oil PLC | 49,011 | 963,847 |
| Vedanta Resources PLC | 46,346 | 1,819,260 |
| Vodafone Group PLC | 891,055 | 2,304,031 |
| Whitbread PLC | 66,303 | 1,850,911 |
| Xstrata PLC | 145,920 | 3,426,059 |
| 70,323,283 | ||
| Total common stocks (cost $168,588,335) | $198,754,499 | |
| SHORT-TERM INVESTMENTS (0.4%)* | Shares | Value |
| Putnam Money Market Liquidity Fund 0.15% e | 768,825 | $768,825 |
| Total short-term investments (cost $768,825) | $768,825 | |
| TOTAL INVESTMENTS | ||
| Total investments (cost $169,357,160) | $199,523,324 | |
Key to holding’s abbreviations
| ADR | American Depository Receipts |
| OJSC | Open Joint Stock Company |
Notes to the fund’s portfolio
Unless noted otherwise, the notes to the fund’s portfolio are for the close of the fund’s reporting period, which ran from July 1, 2010 through December 31, 2010 (the reporting period).
* Percentages indicated are based on net assets of $199,501,112.
† Non-income-producing security.
e See Note 5 to the financial statements regarding investments in Putnam Money Market Liquidity Fund. The rate quoted in the security description is the annualized 7-day yield of the fund at the close of the reporting period.
ADR after the name of a foreign holding represents ownership of foreign securities on deposit with a custodian bank.
The fund had the following industry concentration greater than 10% at the close of the reporting period (as a percentage of net assets):
| Oil and gas | 12.6% |
20
Accounting Standards Codification ASC 820 Fair Value Measurements and Disclosures (ASC 820) establishes a three-level hierarchy for disclosure of fair value measurements. The valuation hierarchy is based upon the transparency of inputs to the valuation of the fund’s investments. The three levels are defined as follows:
Level 1 — Valuations based on quoted prices for identical securities in active markets.
Level 2 — Valuations based on quoted prices in markets that are not active or for which all significant inputs are observable, either directly or indirectly.
Level 3 — Valuations based on inputs that are unobservable and significant to the fair value measurement.
The following is a summary of the inputs used to value the fund’s net assets as of the close of the reporting period:
| Valuation inputs | ||||
| Investments in securities: | Level 1 | Level 2 | Level 3 | |
| Common stocks: | ||||
| Belgium | $5,331,476 | $— | $— | |
| Brazil | 1,428,306 | — | — | |
| China | 1,716,088 | — | — | |
| Denmark | 1,890,682 | — | — | |
| Finland | 5,397,159 | — | — | |
| France | 26,904,383 | — | — | |
| Germany | 40,718,947 | — | — | |
| Ireland | 6,112,895 | — | — | |
| Italy | 5,954,104 | — | — | |
| Netherlands | 9,804,947 | — | — | |
| Norway | 1,571,308 | — | — | |
| Poland | 1,459,885 | — | — | |
| Portugal | 882,767 | — | — | |
| Russia | 4,097,999 | — | — | |
| Spain | 3,628,601 | — | — | |
| Sweden | 8,166 | — | — | |
| Switzerland | 11,523,503 | — | — | |
| United Kingdom | 70,323,283 | — | — | |
| Total common stocks | 198,754,499 | — | — | |
| Short-term investments | 768,825 | — | — | |
| Totals by level | $199,523,324 | $— | $— | |
The accompanying notes are an integral part of these financial statements.
21
Statement of assets and liabilities 12/31/10 (Unaudited)
| ASSETS | |
| Investment in securities, at value (Note 1): | |
| Unaffiliated issuers (identified cost $168,588,335) | $198,754,499 |
| Affiliated issuers (identified cost $768,825) (Note 5) | 768,825 |
| Cash | 128,505 |
| Foreign currency (cost $3,061) (Note 1) | 3,108 |
| Dividends, interest and other receivables | 327,989 |
| Receivable for shares of the fund sold | 35,274 |
| Receivable for investments sold | 201,916 |
| Foreign Tax reclaim | 244,060 |
| Total assets | 200,464,176 |
| LIABILITIES | |
| Payable for investments purchased | 215,539 |
| Payable for shares of the fund repurchased | 210,129 |
| Payable for compensation of Manager (Note 2) | 119,351 |
| Payable for investor servicing fees (Note 2) | 50,610 |
| Payable for custodian fees (Note 2) | 14,582 |
| Payable for Trustee compensation and expenses (Note 2) | 160,346 |
| Payable for administrative services (Note 2) | 869 |
| Payable for distribution fees (Note 2) | 123,782 |
| Other accrued expenses | 67,856 |
| Total liabilities | 963,064 |
| Net assets | $199,501,112 |
| REPRESENTED BY | |
| Paid-in capital (Unlimited shares authorized) (Notes 1 and 4) | $278,551,138 |
| Distributions in excess of net investment income (Note 1) | (2,663,879) |
| Accumulated net realized loss on investments and foreign currency transactions (Note 1) | (106,578,027) |
| Net unrealized appreciation of investments and assets and liabilities in foreign currencies | 30,191,880 |
| Total — Representing net assets applicable to capital shares outstanding | $199,501,112 |
| COMPUTATION OF NET ASSET VALUE AND OFFERING PRICE | |
| Net asset value and redemption price per class A share | |
| ($177,257,877 divided by 8,948,156 shares) | $19.81 |
| Offering price per class A share (100/94.25 of $19.81)* | $21.02 |
| Net asset value and offering price per class B share ($6,730,880 divided by 354,190 shares)** | $19.00 |
| Net asset value and offering price per class C share ($2,159,073 divided by 110,901 shares)** | $19.47 |
| Net asset value and redemption price per class M share ($3,762,611 divided by 191,627 shares) | $19.64 |
| Offering price per class M share (100/96.50 of $19.64)* | $20.35 |
| Net asset value, offering price and redemption price per class R share | |
| ($174,228 divided by 8,886 shares) | $19.61 |
| Net asset value, offering price and redemption price per class Y share | |
| ($9,416,443 divided by 473,687 shares) | $19.88 |
* On single retail sales of less than $50,000. On sales of $50,000 or more the offering price is reduced.
** Redemption price per share is equal to net asset value less any applicable contingent deferred sales charge.
The accompanying notes are an integral part of these financial statements.
22
Statement of operations Six months ended 12/31/10 (Unaudited)
| INVESTMENT INCOME | |
| Dividends (net of foreign tax of $105,036) | $1,474,560 |
| Interest (including interest income of $688 from investments in affiliated issuers) (Note 5) | 913 |
| Securities lending (including interest income of $17,437 from investments in | |
| affiliated issuers) (Note 1) | 20,295 |
| Total investment income | 1,495,768 |
| EXPENSES | |
| Compensation of Manager (Note 2) | 694,959 |
| Investor servicing fees (Note 2) | 343,988 |
| Custodian fees (Note 2) | 17,912 |
| Trustee compensation and expenses (Note 2) | 9,644 |
| Administrative services (Note 2) | 3,186 |
| Distribution fees — Class A (Note 2) | 219,310 |
| Distribution fees — Class B (Note 2) | 35,270 |
| Distribution fees — Class C (Note 2) | 10,629 |
| Distribution fees — Class M (Note 2) | 13,700 |
| Distribution fees — Class R (Note 2) | 413 |
| Other | 62,494 |
| Total expenses | 1,411,505 |
| Expense reduction (Note 2) | (411) |
| Net expenses | 1,411,094 |
| Net investment income | 84,674 |
| Net realized gain on investments (Notes 1 and 3) | 13,073,795 |
| Net realized loss on foreign currency transactions (Note 1) | (19,262) |
| Net unrealized appreciation of assets and liabilities in foreign currencies during the period | 18,947 |
| Net unrealized appreciation of investments during the period | 32,934,583 |
| Net gain on investments | 46,008,063 |
| Net increase in net assets resulting from operations | $46,092,737 |
The accompanying notes are an integral part of these financial statements.
23
Statement of changes in net assets
| INCREASE (DECREASE) IN NET ASSETS | Six months ended 12/31/10* | Year ended 6/30/10 |
| Operations: | ||
| Net investment income | $84,674 | $2,579,190 |
| Net realized gain on investments and foreign currency transactions | 13,054,533 | 7,645,898 |
| Net unrealized appreciation of investments and assets and | ||
| liabilities in foreign currencies | 32,953,530 | 3,241,013 |
| Net increase in net assets resulting from operations | 46,092,737 | 13,466,101 |
| Distributions to shareholders (Note 1): | ||
| From ordinary income | ||
| Net investment income | ||
| Class A | (3,264,474) | (944,351) |
| Class B | (67,158) | — |
| Class C | (23,605) | — |
| Class M | (51,043) | (1,135) |
| Class R | (2,834) | (467) |
| Class Y | (193,883) | (73,122) |
| Increase in capital from settlement payments | 33,446 | 908,927 |
| Redemption fees (Note 1) | 2,935 | 3,045 |
| Decrease from capital share transactions (Note 4) | (14,623,121) | (36,710,567) |
| Total increase (decrease) in net assets | 27,903,000 | (23,351,569) |
| NET ASSETS | ||
| Beginning of period | 171,598,112 | 194,949,681 |
| End of period (including distributions in excess of net investment | ||
| income of $2,663,879 and undistributed net investment income of | ||
| $854,444, respectively) | $199,501,112 | $171,598,112 |
* Unaudited
The accompanying notes are an integral part of these financial statements.
24
| This page left blank intentionally. |
25
Financial highlights (For a common share outstanding throughout the period)
| INVESTMENT OPERATIONS: | LESS DISTRIBUTIONS: | RATIOS AND SUPPLEMENTAL DATA: | |||||||||||||
| Ratio | |||||||||||||||
| Net asset | Net realized | Ratio | of net investment | ||||||||||||
| value, | and unrealized | Total from | From | From | Total return | Net assets, | of expenses | income (loss) | |||||||
| beginning | Net investment | gain (loss) | investment | net investment | net realized gain | Total | Redemption | Non-recurring | Net asset value, | at net asset | end of period | to average | to average | Portfolio | |
| Period ended | of period | income (loss) a | on investments | operations | income | on investments | distributions | fees e | reimbursements | end of period | value (%) b | (in thousands) | net assets (%) c | net assets (%) | turnover (%) |
| Class A | |||||||||||||||
| December 31, 2010** | $15.83 | .01 | 4.34 | 4.35 | (.37) | — | (.37) | — | — e,k | $19.81 | 27.49 * | $177,258 | .70* | .06* | 39.36* |
| June 30, 2010 | 15.12 | .23 | .49 | .72 | (.09) | — | (.09) | — | .08 f | 15.83 | 5.20 | 151,329 | 1.52 d | 1.25 d | 113.25 |
| June 30, 2009 | 23.20 | .42 | (8.56) | (8.14) | — | — | — | — | .06 i,j | 15.12 | (34.83) | 169,467 | 1.47 d | 2.65 d | 78.96 |
| June 30, 2008 | 33.47 | .48 | (5.14) | (4.66) | (.54) | (5.07) | (5.61) | — | — | 23.20 | (15.43) | 346,192 | 1.41 d | 1.70 d | 76.88 |
| June 30, 2007 | 25.58 | .37 | 8.17 | 8.54 | (.56) | (.09) | (.65) | — | — | 33.47 | 33.69 | 476,598 | 1.48 d | 1.26 d | 106.13 |
| June 30, 2006 | 20.79 | .48 g,h | 4.59 | 5.07 | (.28) | — | (.28) | — | — | 25.58 | 24.54 g | 341,155 | 1.46 d,g | 2.04 d,g,h | 80.51 |
| Class B | |||||||||||||||
| December 31, 2010** | $15.12 | (.06) | 4.13 | 4.07 | (.19) | — | (.19) | — | — e,k | $19.00 | 26.94 * | $6,731 | 1.08* | (.31)* | 39.36* |
| June 30, 2010 | 14.48 | .06 | .50 | .56 | — | — | — | — | .08 f | 15.12 | 4.42 | 6,671 | 2.27 d | .37 d | 113.25 |
| June 30, 2009 | 22.39 | .27 | (8.24) | (7.97) | — | — | — | — | .06 i,j | 14.48 | (35.33) | 10,391 | 2.22 d | 1.74 d | 78.96 |
| June 30, 2008 | 32.34 | .16 | (4.85) | (4.69) | (.19) | (5.07) | (5.26) | — | — | 22.39 | (16.04) | 32,360 | 2.16 d | .58 d | 76.88 |
| June 30, 2007 | 24.68 | .05 | 7.97 | 8.02 | (.27) | (.09) | (.36) | — | — | 32.34 | 32.68 | 77,315 | 2.23 d | .17 d | 106.13 |
| June 30, 2006 | 20.03 | .21 g,h | 4.52 | 4.73 | (.08) | — | (.08) | — | — | 24.68 | 23.65 g | 126,764 | 2.21 d,g | .99 d,g,h | 80.51 |
| Class C | |||||||||||||||
| December 31, 2010** | $15.50 | (.06) | 4.24 | 4.18 | (.21) | — | (.21) | — | — e,k | $19.47 | 27.01 * | $2,159 | 1.08* | (.32)* | 39.36* |
| June 30, 2010 | 14.84 | .09 | .49 | .58 | — | — | — | — | .08 f | 15.50 | 4.45 | 1,859 | 2.27 d | .48 d | 113.25 |
| June 30, 2009 | 22.94 | .30 | (8.46) | (8.16) | — | — | — | — | .06 i,j | 14.84 | (35.31) | 2,325 | 2.22 d | 1.90 d | 78.96 |
| June 30, 2008 | 33.11 | .25 | (5.06) | (4.81) | (.29) | (5.07) | (5.36) | — | — | 22.94 | (16.04) | 4,912 | 2.16 d | .89 d | 76.88 |
| June 30, 2007 | 25.33 | .14 | 8.08 | 8.22 | (.35) | (.09) | (.44) | — | — | 33.11 | 32.68 | 6,983 | 2.23 d | .48 d | 106.13 |
| June 30, 2006 | 20.58 | .30 g,h | 4.56 | 4.86 | (.11) | — | (.11) | — | — | 25.33 | 23.66 g | 5,455 | 2.21 d,g | 1.29 d,g,h | 80.51 |
| Class M | |||||||||||||||
| December 31, 2010** | $15.65 | (.04) | 4.30 | 4.26 | (.27) | — | (.27) | — | — e,k | $19.64 | 27.23 * | $3,763 | .96* | (.19)* | 39.36* |
| June 30, 2010 | 14.96 | .13 | .49 | .62 | (.01) | — | (.01) | — | .08 f | 15.65 | 4.64 | 3,250 | 2.02 d | .75 d | 113.25 |
| June 30, 2009 | 23.07 | .34 | (8.51) | (8.17) | — | — | — | — | .06 i,j | 14.96 | (35.15) | 3,683 | 1.97 d | 2.19 d | 78.96 |
| June 30, 2008 | 33.23 | .27 | (5.03) | (4.76) | (.33) | (5.07) | (5.40) | — | — | 23.07 | (15.85) | 7,551 | 1.91 d | .96 d | 76.88 |
| June 30, 2007 | 25.38 | .19 | 8.13 | 8.32 | (.38) | (.09) | (.47) | — | — | 33.23 | 33.02 | 14,075 | 1.98 d | .66 d | 106.13 |
| June 30, 2006 | 20.61 | .34 g,h | 4.58 | 4.92 | (.15) | — | (.15) | — | — | 25.38 | 23.97 g | 14,097 | 1.96 d,g | 1.49 d,g,h | 80.51 |
| Class R | |||||||||||||||
| December 31, 2010** | $15.66 | (.01) | 4.29 | 4.28 | (.33) | — | (.33) | — | — e,k | $19.61 | 27.35 * | $174 | .83* | (.07)* | 39.36* |
| June 30, 2010 | 14.97 | .21 | .46 | .67 | (.06) | — | (.06) | — | .08 f | 15.66 | 4.97 | 133 | 1.77 d | 1.20 d | 113.25 |
| June 30, 2009 | 23.02 | .42 | (8.53) | (8.11) | — | — | — | — | .06 i,j | 14.97 | (34.97) | 97 | 1.72 d | 2.80 d | 78.96 |
| June 30, 2008 | 33.30 | .44 | (5.13) | (4.69) | (.52) | (5.07) | (5.59) | — | — | 23.02 | (15.63) | 107 | 1.66 d | 1.60 d | 76.88 |
| June 30, 2007 | 25.55 | .60 | 7.84 | 8.44 | (.60) | (.09) | (.69) | — | — | 33.30 | 33.36 | 89 | 1.73 d | 1.94 d | 106.13 |
| June 30, 2006 | 20.75 | .67 g,h | 4.39 | 5.06 | (.26) | — | (.26) | — | — | 25.55 | 24.52 g | 6 | 1.71 d,g | 2.69 d,g,h | 80.51 |
| Class Y | |||||||||||||||
| December 31, 2010** | $15.90 | .04 | 4.36 | 4.40 | (.42) | — | (.42) | — | — e,k | $19.88 | 27.69 * | $9,416 | .58* | .19* | 39.36* |
| June 30, 2010 | 15.19 | .27 | .49 | .76 | (.13) | — | (.13) | — | .08 f | 15.90 | 5.41 | 8,356 | 1.27 d | 1.52 d | 113.25 |
| June 30, 2009 | 23.24 | .52 | (8.63) | (8.11) | — | — | — | — | .06 i,j | 15.19 | (34.64) | 8,987 | 1.22 d | 3.50 d | 78.96 |
| June 30, 2008 | 33.53 | .57 | (5.16) | (4.59) | (.63) | (5.07) | (5.70) | — | — | 23.24 | (15.22) | 9,154 | 1.16 d | 2.05 d | 76.88 |
| June 30, 2007 | 25.62 | .48 | 8.14 | 8.62 | (.62) | (.09) | (.71) | — | — | 33.53 | 34.00 | 10,873 | 1.23 d | 1.59 d | 106.13 |
| June 30, 2006† | 22.46 | .53 g,h | 2.92 | 3.45 | (.29) | — | (.29) | — | — | 25.62 | 15.52 *g | 6,261 | .89*d,g | 2.19*d,g,h | 80.51 |
See notes to financial highlights at the end of this section.
The accompanying notes are an integral part of these financial statements.
| 26 | 27 |
Financial highlights (Continued)
* Not annualized.
** Unaudited.
† For the period October 4, 2005 (commencement of operations) to June 30, 2006.
a Per share net investment income (loss) has been determined on the basis of the weighted average number of shares outstanding during the period.
b Total return assumes dividend reinvestment and does not reflect the effect of sales charges.
c Includes amounts paid through expense offset and brokerage/service arrangements (Note 2).
d Reflects an involuntary contractual expense limitation in effect during the period. For periods prior to June 30, 2010 certain fund expenses were waived in connection with the fund’s investment in Putnam Prime Money Market Fund.
As a result of such limitation and/or waivers, the expenses of each class reflect a reduction of the following amounts:
| Percentage of | |
| average net assets | |
| June 30, 2010 | 0.02% |
| June 30, 2009 | 0.14 |
| June 30, 2008 | <0.01 |
| June 30, 2007 | <0.01 |
| June 30, 2006 | <0.01 |
e Amount represents less than $0.01 per share.
f Reflects a non-recurring reimbursement pursuant to a settlement between the Securities and Exchange Commission (SEC) and Prudential Securities, Inc., which amounted to $0.08 per share outstanding as of March 30, 2010.
g Reflects a non-recurring reimbursement from Putnam Investments relating to the calculation of certain amounts paid by the fund to Putnam in previous years for transfer agent services, which amounted to $0.01 per share and 0.02% of average net assets for the period ended June 30, 2006.
h Reflects a special dividend received by the fund which amounted to the following amounts:
| Percentage of | ||
| Per share | average net assets | |
| Class A | $0.23 | 0.96% |
| Class B | 0.20 | 0.87 |
| Class C | 0.22 | 0.95 |
| Class M | 0.23 | 0.97 |
| Class R | 0.31 | 1.27 |
| Class Y | 0.23 | 0.94 |
i Reflects a non-recurring reimbursement pursuant to a settlement between the SEC and Millennium Partners, L.P., Millennium Management, L.L.C., and Millennium International Management, L.L.C., which amounted to $0.03 per share outstanding as of June 23, 2009.
j Reflects a non-recurring reimbursement pursuant to a settlement between the SEC and Bear, Stearns & Co., Inc. and Bear, Stearns Securities Corp., which amounted to $0.03 per share outstanding as of May 21, 2009.
k Reflects a non-recurring reimbursement pursuant to a settlement between the SEC and Zurich Capital Markets, Inc., which amounted to less than $0.01 per share outstanding on December 21, 2010.
The accompanying notes are an integral part of these financial statements.
28
Notes to financial statements 12/31/10 (Unaudited)
Note 1: Significant accounting policies
Putnam Europe Equity Fund (the fund), is a Massachusetts business trust, which is registered under the Investment Company Act of 1940, as amended, as a diversified, open-end management investment company. The fund seeks capital appreciation by investing primarily in common stocks and other securities of European companies.
The fund offers class A, class B, class C, class M, class R and class Y shares. Class A and class M shares are sold with a maximum front-end sales charge of 5.75% and 3.50%, respectively, and generally do not pay a contingent deferred sales charge. Class B shares, which convert to class A shares after approximately eight years, do not pay a front-end sales charge and are subject to a contingent deferred sales charge if those shares are redeemed within six years of purchase. Class C shares have a one-year 1.00% contingent deferred sales charge and do not convert to class A shares. Class R shares, which are not available to all investors, are sold at net asset value. The expenses for class A, class B, class C, class M and class R shares may differ based on the distribution fee of each class, which is identified in Note 2. Class Y shares, which are sold at net asset value, are generally subject to the same expenses as class A, class B, class C, class M an d class R shares, but do not bear a distribution fee. Class Y shares are not available to all investors.
A 1.00% redemption fee may apply on any shares that are redeemed (either by selling or exchanging into another fund) within 90 days of purchase. The redemption fee is accounted for as an addition to paid-in-capital.
Investment income, realized and unrealized gains and losses and expenses of the fund are borne pro-rata based on the relative net assets of each class to the total net assets of the fund, except that each class bears expenses unique to that class (including the distribution fees applicable to such classes). Each class votes as a class only with respect to its own distribution plan or other matters on which a class vote is required by law or determined by the Trustees. If the fund were liquidated, shares of each class would receive their pro-rata share of the net assets of the fund. In addition, the Trustees declare separate dividends on each class of shares.
In the normal course of business, the fund enters into contracts that may include agreements to indemnify another party under given circumstances. The fund’s maximum exposure under these arrangements is unknown as this would involve future claims that may be, but have not yet been, made against the fund. However, the fund’s management team expects the risk of material loss to be remote.
The following is a summary of significant accounting policies consistently followed by the fund in the preparation of its financial statements. The preparation of financial statements is in conformity with accounting principles generally accepted in the United States of America and requires management to make estimates and assumptions that affect the reported amounts of assets and liabilities in the financial statements and the reported amounts of increases and decreases in net assets from operations. Actual results could differ from those estimates. Subsequent events after the Statement of assets and liabilities date through the date that the financial statements were issued have been evaluated in the preparation of the financial statements. Unless otherwise noted, the “reporting period” represents the period from July 1, 2010 through December 31, 2010.
A) Security valuation Investments for which market quotations are readily available are valued at the last reported sales price on their principal exchange, or official closing price for certain markets, and are classified as Level 1 securities. If no sales are reported — as in the case of some securities traded over-the-counter — a security is valued at its last reported bid price and is generally categorized as a Level 2 security.
Many securities markets and exchanges outside the U.S. close prior to the close of the New York Stock Exchange and therefore the closing prices for securities in such markets or on such exchanges may not fully reflect events that occur after such close but before the close of the New York Stock Exchange. Accordingly, on certain days, the fund will fair value foreign equity securities taking into account multiple factors including movements in the U.S. securities markets, currency valuations and comparisons to the valuation of American Depository Receipts, exchange-traded funds and futures contracts. These securities, which will generally represent a transfer from a Level 1 to a Level 2 security, will be classified as Level 2. The number of days on which fair value prices will be used will depend on market activity and it is possible that fair value prices will be used by the fund to a significant extent. Securities quoted in foreign currencies, if any, are translated into U.S. dollars at the current exchange rate.
To the extent a pricing service or dealer is unable to value a security or provides a valuation that Putnam Investment Management, LLC (Putnam Management), the fund’s manager, an indirect wholly-owned subsidiary of Putnam Investments, LLC, does not believe accurately reflects the security’s fair value, the security will be valued at fair
29
value by Putnam Management. Certain investments, including certain restricted and illiquid securities and derivatives, are also valued at fair value following procedures approved by the Trustees. These valuations consider such factors as significant market or specific security events such as interest rate or credit quality changes, various relationships with other securities, discount rates, U.S. Treasury, U.S. swap and credit yields, index levels, convexity exposures and recovery rates. These securities are classified as Level 2 or as Level 3 depending on the priority of the significant inputs.
Such valuations and procedures are reviewed periodically by the Trustees. The fair value of securities is generally determined as the amount that the fund could reasonably expect to realize from an orderly disposition of such securities over a reasonable period of time. By its nature, a fair value price is a good faith estimate of the value of a security in a current sale and does not reflect an actual market price, which may be different by a material amount.
B) Joint trading account Pursuant to an exemptive order from the Securities and Exchange Commission (the SEC), the fund may transfer uninvested cash balances, including cash collateral received under security lending arrangements, into a joint trading account along with the cash of other registered investment companies and certain other accounts managed by Putnam Management. These balances may be invested in issues of short-term investments having maturities of up to 397 days for collateral received under security lending arrangements and up to 90 days for other cash investments.
C) Security transactions and related investment income Security transactions are recorded on the trade date (the date the order to buy or sell is executed). Gains or losses on securities sold are determined on the identified cost basis.
Interest income is recorded on the accrual basis. Dividend income, net of applicable withholding taxes, is recognized on the ex-dividend date except that certain dividends from foreign securities, if any, are recognized as soon as the fund is informed of the ex-dividend date. Non-cash dividends, if any, are recorded at the fair market value of the securities received. Dividends representing a return of capital or capital gains, if any, are reflected as a reduction of cost and/or as a realized gain.
D) Foreign currency translation The accounting records of the fund are maintained in U.S. dollars. The market value of foreign securities, currency holdings, and other assets and liabilities is recorded in the books and records of the fund after translation to U.S. dollars based on the exchange rates on that day. The cost of each security is determined using historical exchange rates. Income and withholding taxes are translated at prevailing exchange rates when earned or incurred. The fund does not isolate that portion of realized or unrealized gains or losses resulting from changes in the foreign exchange rate on investments from fluctuations arising from changes in the market prices of the securities. Such gains and losses are included with the net realized and unrealized gain or loss on investments. Net realized gains and losses on foreign currency transactions represent net realized exchange gains or losses on closed forward curr ency contracts, disposition of foreign currencies, currency gains and losses realized between the trade and settlement dates on securities transactions and the difference between the amount of investment income and foreign withholding taxes recorded on the fund’s books and the U.S. dollar equivalent amounts actually received or paid. Net unrealized appreciation and depreciation of assets and liabilities in foreign currencies arise from changes in the value of open forward currency contracts and assets and liabilities other than investments at the period end, resulting from changes in the exchange rate. Investments in foreign securities involve certain risks, including those related to economic instability, unfavorable political developments, and currency fluctuations, not present with domestic investments.
E) Securities lending The fund may lend securities, through its agent, to qualified borrowers in order to earn additional income. The loans are collateralized by cash in an amount at least equal to the market value of the securities loaned. The market value of securities loaned is determined daily and any additional required collateral is allocated to the fund on the next business day. The risk of borrower default will be borne by the fund’s agent; the fund will bear the risk of loss with respect to the investment of the cash collateral. Income from securities lending is included in investment income on the Statement of operations. Effective August 2010, cash collateral is invested in Putnam Cash Collateral Pool, LLC, a limited liability company managed by an affiliate of Putnam Management, and is valued at its closing net asset value each business day. There are no management fees charged by Putnam Cash Collateral Pool, LLC. At the close of the reporting period, the fund had no securities out on loan.
F) Interfund lending Effective July 2010, the fund, along with other Putnam funds, may participate in an inter-fund lending program pursuant to an exemptive order issued by the SEC. This program allows the fund to borrow from or lend to other Putnam funds that permit such transactions. Interfund lending transactions are subject to each fund’s investment policies and borrowing and lending limits. Interest earned or paid on the interfund lending
30
transaction will be based on the average of certain current market rates. During the reporting period, the fund did not utilize the program.
G) Line of credit Effective July 2010, the fund participates, along with other Putnam funds, in a $285 million unsecured committed line of credit and a $165 million unsecured uncommitted line of credit, both provided by State Street Bank and Trust Company (State Street). Borrowings may be made for temporary or emergency purposes, including the funding of shareholder redemption requests and trade settlements. Interest is charged to the fund based on the fund’s borrowing at a rate equal to the Federal Funds rate plus 1.25% for the committed line of credit and the Federal Funds rate plus 1.30% for the uncommitted line of credit. A closing fee equal to 0.03% of the committed line of credit and $100,000 for the uncommitted line of credit has been paid by the participating funds. In addition, a commitment fee of 0.15% per annum on any unutilized portion of the committed line of credit is allocated to the partic ipating funds based on their relative net assets and paid quarterly. During the reporting period, the fund had no borrowings against these arrangements.
H) Federal taxes It is the policy of the fund to distribute all of its taxable income within the prescribed time period and otherwise comply with the provisions of the Internal Revenue Code of 1986, as amended (the Code), applicable to regulated investment companies. It is also the intention of the fund to distribute an amount sufficient to avoid imposition of any excise tax under Section 4982 of the Code. The fund is subject to the provisions of Accounting Standards Codification ASC 740 Income Taxes (ASC 740). ASC 740 sets forth a minimum threshold for financial statement recognition of the benefit of a tax position taken or expected to be taken in a tax return. The fund did not have a liability to record for any unrecognized tax benefits in the accompanying financial statements. No provision has been made for federal taxes on inco me, capital gains or unrealized appreciation on securities held nor for excise tax on income and capital gains. Each of the fund’s federal tax returns for the prior three fiscal years remains subject to examination by the Internal Revenue Service.
At June 30, 2010, the fund had a capital loss carryover of $110,876,175 available to the extent allowed by the Code to offset future net capital gain, if any. The amounts of the carryovers and the expiration dates are:
| Loss carryover | Expiration | |
| $52,502,507 | June 30, 2017 | |
| 58,373,668 | June 30, 2018 | |
Pursuant to federal income tax regulations applicable to regulated investment companies, the fund has elected to defer to its fiscal year ending June 30, 2011 $4,341,890 of losses recognized during the period November 1, 2009 to June 30, 2010.
The aggregate identified cost on a tax basis is $173,771,655, resulting in gross unrealized appreciation and depreciation of $31,763,742 and $6,012,073, respectively, or net unrealized appreciation of $25,751,669.
I) Distributions to shareholders Distributions to shareholders from net investment income are recorded by the fund on the ex-dividend date. Distributions from capital gains, if any, are recorded on the ex-dividend date and paid at least annually. The amount and character of income and gains to be distributed are determined in accordance with income tax regulations, which may differ from generally accepted accounting principles. Dividend sources are estimated at the time of declaration. Actual results may vary. Any non-taxable return of capital cannot be determined until final tax calculations are completed after the end of the fund’s fiscal year. Reclassifications are made to the fund’s capital accounts to reflect income and gains available for distribution (or available capital loss carryovers) under income tax regulations.
Note 2: Management fee, administrative services and other transactions
The fund pays Putnam Management a management fee (base fee) (based on the fund’s average net assets and computed and paid monthly) at annual rates that may vary based on the average of the aggregate net assets of most open-end funds, as defined in the fund’s management contract, sponsored by Putnam Management. Such annual rates may vary as follows: 0.850% of the first $5 billion, 0.800% of the next $5 billion, 0.750% of the next $10 billion, 0.700% of the next $10 billion, 0.650% of the next $50 billion, 0.630% of the next $50 billion, 0.620% of the next $100 billion, and 0.615% of any excess thereafter.
In addition, beginning with the fund’s thirteenth complete calendar month of operation under the management contract (January 2011), the monthly management fee will consist of the monthly base fee plus or minus a performance adjustment for the month. The performance adjustment will be determined based on performance
31
over the thirty-six month period then ended or, if the management contract has not yet been effective for thirty-six complete calendar months, the period from the date the management contract became effective to the end of the month for which the fee adjustment is being computed. Each month, the performance adjustment will be calculated by multiplying the performance adjustment rate and the fund’s average net assets over the performance period and the result will be divided by twelve. The resulting dollar amount will be added to, or subtracted from, the base fee for that month. The performance adjustment rate is equal to 0.03 multiplied by the difference between the fund’s annualized performance (measured by the fund’s class A shares) and the annualized performance of the MSCI Europe Index (Net Dividends), each measured over the performance period. The maximum annualized performance adjustment rates are +/-0.15%. The monthly base fee is determined based on the fu nd’s average net assets for the month, while the performance adjustment will be determined based on the fund’s average net assets over the performance period of up to thirty-six months. This means it is possible that, if the fund underperforms significantly over the performance period, and the fund’s assets have declined significantly over that period, the negative performance adjustment may exceed the base fee. In this event, Putnam Management would make a payment to the fund.
Putnam Management has contractually agreed, through June 30, 2011, to waive fees or reimburse the fund’s expenses to the extent necessary to limit the cumulative expenses of the fund, exclusive of brokerage, interest, taxes, investment-related expenses, extraordinary expenses and payments under the fund’s investor servicing contract, investment management contract and distribution plans, on a fiscal year-to-date basis to an annual rate of 0.20% of the fund’s average net assets over such fiscal year-to-date period. During the reporting period, the fund’s expenses were not reduced as a result of this limit.
Putnam Investments Limited (PIL), an affiliate of Putnam Management, is authorized by the Trustees to manage a separate portion of the assets of the fund as determined by Putnam Management from time to time. Putnam Management pays a quarterly sub-management fee to PIL for its services at an annual rate of 0.35% of the average net assets of the portion of the fund managed by PIL.
The Putnam Advisory Company, LLC (PAC), an affiliate of Putnam Management, is authorized by the Trustees to manage a separate portion of the assets of the fund, as designated from time to time by Putnam Management or PIL. Putnam Management or PIL, as applicable, pays a quarterly sub-advisory fee to PAC for its services at the annual rate of 0.35% of the average net assets of the portion of the fund’s assets for which PAC is engaged as sub-adviser.
The fund reimburses Putnam Management an allocated amount for the compensation and related expenses of certain officers of the fund and their staff who provide administrative services to the fund. The aggregate amount of all such reimbursements is determined annually by the Trustees.
Custodial functions for the fund’s assets are provided by State Street. Custody fees are based on the fund’s asset level, the number of its security holdings and transaction volumes.
Putnam Investor Services, Inc., an affiliate of Putnam Management, provides investor servicing agent functions to the fund. Putnam Investor Services, Inc. received fees for investor servicing based on the fund’s retail asset level, the number of shareholder accounts in the fund and the level of defined contribution plan assets in the fund. Investor servicing fees will not exceed an annual rate of 0.375% of the fund’s average net assets. The amounts incurred for investor servicing agent functions during the reporting period are included in Investor servicing fees in the Statement of operations.
The fund has entered into expense offset arrangements with Putnam Investor Services, Inc. and State Street whereby Putnam Investor Services, Inc.’s and State Street’s fees are reduced by credits allowed on cash balances. For the reporting period, the fund’s expenses were reduced by $411 under the expense offset arrangements.
Each independent Trustee of the fund receives an annual Trustee fee, of which $138, as a quarterly retainer, has been allocated to the fund, and an additional fee for each Trustees meeting attended. Trustees also are reimbursed for expenses they incur relating to their services as Trustees.
The fund has adopted a Trustee Fee Deferral Plan (the Deferral Plan) which allows the Trustees to defer the receipt of all or a portion of Trustees fees payable on or after July 1, 1995. The deferred fees remain invested in certain Putnam funds until distribution in accordance with the Deferral Plan.
The fund has adopted an unfunded noncontributory defined benefit pension plan (the Pension Plan) covering all Trustees of the fund who have served as a Trustee for at least five years and were first elected prior to 2004. Benefits under the Pension Plan are equal to 50% of the Trustee’s average annual attendance and retainer fees for the three years ended December 31, 2005. The retirement benefit is payable during a Trustee’s lifetime, beginning
32
the year following retirement, for the number of years of service through December 31, 2006. Pension expense for the fund is included in Trustee compensation and expenses in the Statement of operations. Accrued pension liability is included in Payable for Trustee compensation and expenses in the Statement of assets and liabilities. The Trustees have terminated the Pension Plan with respect to any Trustee first elected after 2003.
The fund has adopted distribution plans (the Plans) with respect to its class A, class B, class C, class M and class R shares pursuant to Rule 12b-1 under the Investment Company Act of 1940. The purpose of the Plans is to compensate Putnam Retail Management Limited Partnership, a wholly-owned subsidiary of Putnam Investments, LLC and Putnam Retail Management GP, Inc., for services provided and expenses incurred in distributing shares of the fund. The Plans provide for payments by the fund to Putnam Retail Management Limited Partnership at an annual rate of up to 0.35%, 1.00%, 1.00%, 1.00% and 1.00% of the average net assets attributable to class A, class B, class C, class M and class R shares, respectively. The Trustees have approved payment by the fund at an annual rate of 0.25%, 1.00%, 1.00%, 0.75% and 0.50% of the average net assets attributable to class A, class B, class C, class M and class R shares, respectively.
For the reporting period, Putnam Retail Management Limited Partnership, acting as underwriter, received net commissions of $2,618 and $317 from the sale of class A and class M shares, respectively, and received $3,370 and no monies in contingent deferred sales charges from redemptions of class B and class C shares, respectively.
A deferred sales charge of up to 1.00% and 0.65% is assessed on certain redemptions of class A and class M shares, respectively. For the reporting period, Putnam Retail Management Limited Partnership, acting as underwriter, received no monies on class A and class M redemptions.
Note 3: Purchases and sales of securities
During the reporting period, cost of purchases and proceeds from sales of investment securities other than short-term investments aggregated $74,641,125 and $92,367,424, respectively. There were no purchases or proceeds from sales of long-term U.S. government securities.
Note 4: Capital shares
At the close of the reporting period, there was an unlimited number of shares of beneficial interest authorized. Transactions in capital shares were as follows:
| Six months ended 12/31/10 | Year ended 6/30/10 | |||
| Class A | Shares | Amount | Shares | Amount |
| Shares sold | 212,624 | $3,763,316 | 426,160 | $7,612,420 |
| Shares issued in connection with | ||||
| reinvestment of distributions | 149,849 | 2,934,044 | 46,891 | 874,991 |
| 362,473 | 6,697,360 | 473,051 | 8,487,411 | |
| Shares repurchased | (973,723) | (18,365,680) | (2,122,049) | (37,900,074) |
| Net decrease | (611,250) | $(11,668,320) | (1,648,998) | $(29,412,663) |
| Six months ended 12/31/10 | Year ended 6/30/10 | |||
| Class B | Shares | Amount | Shares | Amount |
| Shares sold | 7,862 | $141,310 | 31,593 | $547,606 |
| Shares issued in connection with | ||||
| reinvestment of distributions | 3,406 | 63,996 | — | — |
| 11,268 | 205,306 | 31,593 | 547,606 | |
| Shares repurchased | (98,394) | (1,765,818) | (308,026) | (5,248,366) |
| Net decrease | (87,126) | $(1,560,512) | (276,433) | $(4,700,760) |
33
| Six months ended 12/31/10 | Year ended 6/30/10 | |||
| Class C | Shares | Amount | Shares | Amount |
| Shares sold | 1,669 | $30,368 | 7,154 | $121,125 |
| Shares issued in connection with | ||||
| reinvestment of distributions | 1,022 | 19,682 | — | — |
| 2,691 | 50,050 | 7,154 | 121,125 | |
| Shares repurchased | (11,735) | (215,288) | (43,839) | (755,933) |
| Net decrease | (9,044) | $(165,238) | (36,685) | $(634,808) |
| Six months ended 12/31/10 | Year ended 6/30/10 | |||
| Class M | Shares | Amount | Shares | Amount |
| Shares sold | 4,028 | $74,041 | 68,329 | $1,199,681 |
| Shares issued in connection with | ||||
| reinvestment of distributions | 1,779 | 34,536 | 41 | 753 |
| 5,807 | 108,577 | 68,370 | 1,200,434 | |
| Shares repurchased | (21,829) | (395,618) | (106,955) | (1,927,966) |
| Net decrease | (16,022) | $(287,041) | (38,585) | $(727,532) |
| Six months ended 12/31/10 | Year ended 6/30/10 | |||
| Class R | Shares | Amount | Shares | Amount |
| Shares sold | 1,276 | $23,315 | 3,095 | $54,418 |
| Shares issued in connection with | ||||
| reinvestment of distributions | 146 | 2,834 | 25 | 467 |
| 1,422 | 26,149 | 3,120 | 54,885 | |
| Shares repurchased | (1,043) | (20,252) | (1,063) | (18,484) |
| Net increase | 379 | $5,897 | 2,057 | $36,401 |
| Six months ended 12/31/10 | Year ended 6/30/10 | |||
| Class Y | Shares | Amount | Shares | Amount |
| Shares sold | 20,109 | $383,672 | 75,517 | $1,284,888 |
| Shares issued in connection with | ||||
| reinvestment of distributions | 9,405 | 184,813 | 3,780 | 70,757 |
| 29,514 | 568,485 | 79,297 | 1,355,645 | |
| Shares repurchased | (81,206) | (1,516,392) | (145,742) | (2,626,850) |
| Net decrease | (51,692) | $(947,907) | (66,445) | $(1,271,205) |
Note 5: Investment in Putnam Money Market Liquidity Fund
The fund invested in Putnam Money Market Liquidity Fund, an open-end management investment company managed by Putnam Management. Investments in Putnam Money Market Liquidity Fund are valued at its closing net asset value each business day. Income distributions earned by the fund are recorded as interest income in the Statement of operations and totaled $688 for the reporting period. During the reporting period, cost of purchases and proceeds of sales of investments in Putnam Money Market Liquidity Fund aggregated $31,975,402 and $31,206,577, respectively. Management fees charged to Putnam Money Market Liquidity Fund have been waived by Putnam Management.
34
Note 6: Regulatory matters and litigation
In late 2003 and 2004, Putnam Management settled charges brought by the SEC and the Massachusetts Securities Division in connection with excessive short-term trading in Putnam funds. Distribution of payments from Putnam Management to certain open-end Putnam funds and their shareholders is expected to be completed in the next several months. These allegations and related matters have served as the general basis for certain lawsuits, including purported class action lawsuits against Putnam Management and, in a limited number of cases, some Putnam funds. Putnam Management believes that these lawsuits will have no material adverse effect on the funds or on Putnam Management’s ability to provide investment management services. In addition, Putnam Management has agreed to bear any costs incurred by the Putnam funds as a result of these matters.
Note 7: Market and credit risk
In the normal course of business, the fund trades financial instruments and enters into financial transactions where risk of potential loss exists due to changes in the market (market risk) or failure of the contracting party to the transaction to perform (credit risk). The fund may be exposed to additional credit risk that an institution or other entity with which the fund has unsettled or open transactions will default.
35
Services for shareholders
Investor services
Systematic investment plan Tell us how much you wish to invest regularly — weekly, semimonthly, or monthly — and the amount you choose will be transferred automatically from your checking or savings account. There’s no additional fee for this service, and you can suspend it at any time. This plan may be a great way to save for college expenses or to plan for your retirement.
Please note that regular investing does not guarantee a profit or protect against loss in a declining market. Before arranging a systematic investment plan, consider your financial ability to continue making purchases in periods when prices are low.
Systematic exchange You can make regular transfers from one Putnam fund to another Putnam fund. There are no additional fees for this service, and you can cancel or change your options at any time.
Dividends PLUS You can choose to have the dividend distributions from one of your Putnam funds automatically reinvested in another Putnam fund at no additional charge.
Free exchange privilege You can exchange money between Putnam funds free of charge, as long as they are the same class of shares. A signature guarantee is required if you are exchanging more than $500,000. The fund reserves the right to revise or terminate the exchange privilege.
Reinstatement privilege If you’ve sold Putnam shares or received a check for a dividend or capital gain, you may reinvest the proceeds with Putnam within 90 days of the transaction and they will be reinvested at the fund’s current net asset value — with no sales charge. However, reinstatement of class B shares may have special tax consequences. Ask your financial or tax representative for details.
Check-writing service You have ready access to many Putnam accounts. It’s as simple as writing a check, and there are no special fees or service charges. For more information about the check-writing service, call Putnam or visit our Web site.
Dollar cost averaging When you’re investing for long-term goals, it’s time, not timing, that counts. Investing on a systematic basis is a better strategy than trying to figure out when the markets will go up or down. This means investing the same amount of money regularly over a long period. This method of investing is called dollar cost averaging. When a fund’s share price declines, your investment dollars buy more shares at lower prices. When it increases, they buy fewer shares. Over time, you will pay a lower average price per share.
For more information
Visit the Individual Investors section at putnam.com A secure section of our Web site contains complete information on your account, including balances and transactions, updated daily. You may also conduct transactions, such as exchanges, additional investments, and address changes. Log on today to get your password.
Call us toll free at 1-800-225-1581 Ask a helpful Putnam representative or your financial advisor for details about any of these or other services, or see your prospectus.
36
Fund information
Founded over 70 years ago, Putnam Investments was built around the concept that a balance between risk and reward is the hallmark of a well-rounded financial program. We manage over 100 funds across income, value, blend, growth, asset allocation, absolute return, and global sector categories.
| Investment Manager | Barbara M. Baumann | Robert R. Leveille |
| Putnam Investment | Charles B. Curtis | Vice President and |
| Management, LLC | Robert J. Darretta | Chief Compliance Officer |
| One Post Office Square | Paul L. Joskow | |
| Boston, MA 02109 | Kenneth R. Leibler | Mark C. Trenchard |
| Robert E. Patterson | Vice President and | |
| Investment Sub-Manager | George Putnam, III | BSA Compliance Officer |
| Putnam Investments Limited | Robert L. Reynolds | |
| 57–59 St James’s Street | W. Thomas Stephens | Francis J. McNamara, III |
| London, England SW1A 1LD | Vice President and | |
| Officers | Chief Legal Officer | |
| Investment Sub-Advisor | Robert L. Reynolds | |
| The Putnam Advisory | President | James P. Pappas |
| Company, LLC | Vice President | |
| One Post Office Square | Jonathan S. Horwitz | |
| Boston, MA 02109 | Executive Vice President, | Judith Cohen |
| Principal Executive Officer, | Vice President, Clerk and | |
| Marketing Services | Treasurer and | Assistant Treasurer |
| Putnam Retail Management | Compliance Liaison | |
| One Post Office Square | Michael Higgins | |
| Boston, MA 02109 | Steven D. Krichmar | Vice President, Senior Associate |
| Vice President and | Treasurer and Assistant Clerk | |
| Custodian | Principal Financial Officer | |
| State Street Bank | Nancy E. Florek | |
| and Trust Company | Janet C. Smith | Vice President, Assistant Clerk, |
| Vice President, Assistant | Assistant Treasurer and | |
| Legal Counsel | Treasurer and Principal | Proxy Manager |
| Ropes & Gray LLP | Accounting Officer | |
| Susan G. Malloy | ||
| Trustees | Beth S. Mazor | Vice President and |
| John A. Hill, Chairman | Vice President | Assistant Treasurer |
| Jameson A. Baxter, | ||
| Vice Chairman | ||
| Ravi Akhoury |
This report is for the information of shareholders of Putnam Europe Equity Fund. It may also be used as sales literature when preceded or accompanied by the current prospectus, the most recent copy of Putnam’s Quarterly Performance Summary, and Putnam’s Quarterly Ranking Summary. For more recent performance, please visit putnam.com. Investors should carefully consider the investment objective, risks, charges, and expenses of a fund, which are described in its prospectus. For this and other information or to request a prospectus, or a summary prospectus if available, call 1-800-225-1581 toll free. Please read the prospectus carefully before investing. The fund’s Statement of Additional Information contains additional information about the fund’s Trustees and is available without charge upon request by calling 1-800-225-1581.
Item 2. Code of Ethics:
Not applicable
Item 3. Audit Committee Financial Expert:
Not applicable
Item 4. Principal Accountant Fees and Services:
Not applicable
Item 5. Audit Committee of Listed Registrants
Not applicable
Item 6. Schedule of Investments:
The registrant’s schedule of investments in unaffiliated issuers is included in the report to shareholders in Item 1 above.
Item 7. Disclosure of Proxy Voting Policies and Procedures For Closed-End Management Investment Companies:
Not applicable
Item 8. Portfolio Managers of Closed-End Investment Companies
Not Applicable
Item 9. Purchases of Equity Securities by Closed-End Management Investment Companies and Affiliated Purchasers:
Not applicable
Item 10. Submission of Matters to a Vote of Security Holders:
Not applicable
Item 11. Controls and Procedures:
(a) The registrant's principal executive officer and principal financial officer have concluded, based on their evaluation of the effectiveness of the design and operation of the registrant's disclosure controls and procedures as of a date within 90 days of the filing date of this report, that the design and operation of such procedures are generally effective to provide reasonable assurance that information required to be disclosed by the registrant in this report is recorded, processed, summarized and reported within the time periods specified in the Commission's rules and forms.
(b) Changes in internal control over financial reporting: Not applicable
Item 12. Exhibits:
(a)(1) Not applicable
(a)(2) Separate certifications for the principal executive officer and principal financial officer of the registrant as required by Rule 30a-2(a) under the Investment Company Act of 1940, as amended, are filed herewith.
(b) The certifications required by Rule 30a-2(b) under the Investment Company Act of 1940, as amended, are filed herewith.
Putnam Europe Equity Fund
By (Signature and Title):
/s/Janet C. Smith
Janet C. Smith
Principal Accounting Officer
Date: February 28, 2011
Pursuant to the requirements of the Securities Exchange Act of 1934 and the Investment Company Act of 1940, this report has been signed below by the following persons on behalf of the registrant and in the capacities and on the dates indicated.
By (Signature and Title):
/s/Jonathan S. Horwitz
Jonathan S. Horwitz
Principal Executive Officer
Date: February 28, 2011
By (Signature and Title):
/s/Steven D. Krichmar
Steven D. Krichmar
Principal Financial Officer
Date: February 28, 2011