| UNITED STATES SECURITIES AND EXCHANGE COMMISSION | ||
| Washington, D.C. 20549 | ||
FORM N-CSR | ||
| CERTIFIED SHAREHOLDER REPORT OF REGISTERED MANAGEMENT INVESTMENT COMPANIES | ||
| Investment Company Act file number: | (811-05693) |
| Exact name of registrant as specified in charter: | Putnam Europe Equity Fund |
| Address of principal executive offices: | One Post Office Square, Boston, Massachusetts 02109 |
| Name and address of agent for service: | Robert T. Burns, Vice President One Post Office Square Boston, Massachusetts 02109 |
| Copy to: | John W. Gerstmayr, Esq. Ropes & Gray LLP 800 Boylston Street Boston, Massachusetts 02199-3600 |
| Registrant’s telephone number, including area code: | (617) 292-1000 |
| Date of fiscal year end: | June 30, 2013 |
| Date of reporting period: | July 1, 2012 — December 31, 2012 |
Item 1. Report to Stockholders: |
| The following is a copy of the report transmitted to stockholders pursuant to Rule 30e-1 under the Investment Company Act of 1940: | |||
Putnam
Europe Equity
Fund
Semiannual report
12 | 31 | 12
| Message from the Trustees | 1 | ||
| About the fund | 2 | ||
| Performance snapshot | 4 | ||
| Interview with your fund’s portfolio manager | 5 | ||
| Your fund’s performance | 10 | ||
| Your fund’s expenses | 12 | ||
| Terms and definitions | 14 | ||
| Other information for shareholders | 15 | ||
| Financial statements | 16 | ||
Consider these risks before investing: International investing involves certain risks, such as currency fluctuations, economic instability, and political developments. Additional risks may be associated with emerging-market securities, including illiquidity and volatility. Investments in small and/or midsize companies increase the risk of greater price fluctuations. The fund invests in fewer issuers or concentrates its investments by region or sector, and involves more risk than a fund that invests more broadly. In addition, events in any one country within the region may impact the other countries or the region as a whole. Derivatives also involve the risk, in the case of many over-the-counter instruments, of the potential inability to terminate or sell derivatives positions and the potential failure of the other party to the instrument to meet its obligations. Growth stocks may be more susceptible to earnings disappointments, and value stocks may fail to rebound. The prices of stocks in the fund’s portfolio may fall or fail to rise over extended periods of time for a variety of reasons, including both general financial market conditions and factors related to a specific company or industry.
Message from the Trustees
Dear Fellow Shareholder:
With the uncertainty around the U.S. “fiscal cliff” diminished, investors now have some measure of clarity heading into 2013. Of course, challenges remain, including the upcoming debate over the debt ceiling at the end of March. Still, the significant risks — the fiscal cliff, a “hard landing” in China, and the dissolution of the European Union — have abated in the past few months.
Clarity and greater certainty are positive developments for investors. Markets worldwide are starting to recognize that macroeconomic data are beginning to stabilize and even exhibit nascent signs of growth. As the investment climate slowly improves, it is important for you to rely on the expertise of your financial advisor, who can help you work toward your financial goals.
We would like to take this opportunity to announce the arrival of two new Trustees, Liaquat Ahamed and Katinka Domotorffy, CFA, to your fund’s Board of Trustees. Mr. Ahamed, who in 2010 won the Pulitzer Prize for History with his book, Lords of Finance: The Bankers Who Broke the World, also serves on the Board of Aspen Insurance and the Board of the Rohatyn Group, an emerging-market fund complex that manages money for institutional investors.
Ms. Domotorffy, who until year-end 2011 was a Partner, Chief Investment Officer, and Global Head of Quantitative Investment Strategies at Goldman Sachs Asset Management, currently serves as a member of the Anne Ray Charitable Trust’s Investment Committee, Margaret A. Cargill Philanthropies, and director for Reach Out and Read of Greater New York, an organization dedicated to promoting early childhood literacy.
We would also like to extend a welcome to new shareholders of the fund and to thank all of our investors for your continued confidence in Putnam.

About the fund
Pursuing growth in European markets since 1990
As a shareholder of Putnam Europe Equity Fund, you are seeking to benefit from opportunities in one of the world’s most developed economic regions. Europe has a long history of capitalism and stock investing, and the region continues to evolve. Today, the 27 member states of the European Union form a large, integrated economy that exports more goods and services than any nation in the world, and that has demonstrated its resilience to difficult economic conditions through the recent sovereign debt crisis.
European companies continue to rank among global leaders in many business sectors, including financials, health care, and telecommunications. If you look at the products or services you use every day — from cars and cell phones to household products — you are likely to find many items made by European companies.
European stocks can offer diversification to U.S. investors because Europe can follow a different business cycle than that of the United States. Though international markets can experience downturns, investing internationally gives investors a chance to keep building wealth even if U.S. stocks struggle.
Since 1990, the fund has sought attractively valued companies across European markets. Pursuing Putnam’s “blend” strategy, the fund’s manager targets stocks believed to be worth more than their current prices indicate, and seeks to position the fund to perform well whether growth- or value-style stocks are leading international markets. The manager selects stocks and determines market and sector weightings relying in part on the proprietary research of Putnam analysts based in Boston and London.
In-depth analysis is key to successful stock selection.
Drawing on the expertise of a dedicated team of stock analysts, the fund’s portfolio manager seeks stocks that are believed to be underpriced by the market. Once a stock is selected for the portfolio, it is regularly assessed to ensure that it continues to be attractive. Areas of focus include:
Valuation The manager carefully considers how each stock is valued, seeking stocks whose valuations are attractive relative to the company’s growth potential and capital requirements.
Cash flow The manager examines each company’s financials, particularly the amount of cash a company generates relative to the earnings that it reports, and projects its ability to generate cash returns going forward.
Quality The manager evaluates high-quality companies with characteristics such as solid management teams and sound business models.


Current performance may be lower or higher than the quoted past performance, which cannot guarantee future results. Share price, principal value, and return will fluctuate, and you may have a gain or a loss when you sell your shares. Performance of class A shares assumes reinvestment of distributions and does not account for taxes. Fund returns in the bar chart do not reflect a sales charge of 5.75%; had they, returns would have been lower. See pages 5 and 10–11 for additional performance information. For a portion of the periods, the fund had expense limitations, without which returns would have been lower. A short-term trading fee of 1.00% may apply to redemptions (including by exchange into another fund) of shares purchased before January 2, 2013. For shares purchased on or after January 2, 2013, this short-term trading fee no longer applies. To obtain the most recent month-end performance, visit putnam.com.
* Returns for the six-month period are not annualized, but cumulative.
| 4 | Europe Equity Fund |
Interview with your fund’s portfolio manager

The fund’s results exceeded that of the benchmark during the six months ended December 31, 2012. What accounts for this result?
Our stock selection was the key factor that drove this result, and the portfolio’s combination of attractively valued stocks, stocks that we expect to grow over long periods of time, and a core of defensive holdings helped the fund to outperform its benchmark index. Equities generally performed strongly as significant policy support helped drive a rally in European markets.
The strong results for international stocks occurred despite macro uncertainty in Europe, China, and the United States. Was this a surprise?
Headwinds to markets were definitely present, in the form of uncertainty over sovereign debt and fiscal stability issues, so it was something of a surprise that markets were able to make a strong advance. Nevertheless, markets were cheered by the European Central Bank’s [ECB’s] purchases of European sovereign bonds, or outright monetary transactions [OMTs], which were first introduced in June and have enabled the ECB to provide an effective backstop to government debt markets. This had the
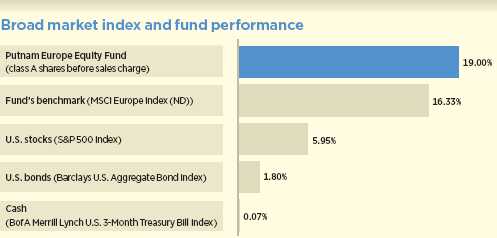
This comparison shows your fund’s performance in the context of broad market indexes for the six months ended 12/31/12. See pages 4 and 10–11 for additional fund performance information. Index descriptions can be found on page 14.
| Europe Equity Fund | 5 |
effect of removing much of the perceived tail risk of European sovereign defaults, and the market consequently rallied despite other areas of concern, such as the U.S. “fiscal cliff.” European stock markets also sold off sharply prior to the introduction of OMTs, such that valuations achieved very inexpensive levels. This helped boost the market’s performance, as did some better-than-expected economic data from China and the United States.
Do you think the rally in European stocks may continue?
There is a lot of talk now about how fixed-income assets are stretched while equity investments are more attractive by comparison. That has helped funnel some investor capital back into equities. In addition, the ongoing recovery in China and in the United States, if national fiscal issues are resolved, will be supportive for markets and could contribute to a better focus on fundamentals. However, while I am positive on the outlook for equity markets, which have performed well since mid-June 2012, risks remain. Ongoing fiscal policy debates and issues in the United States will remain sources of uncertainty for markets, and we should not forget Europe’s ability to surprise negatively, either economically or politically.
Were there specific pockets of sector or regional strength or weakness that were especially notable?
Given the rally in equity markets, cyclical sectors performed best in the fourth calendar quarter, led by consumer discretionary and technology stocks. In terms of countries, again it was the more cyclically exposed countries (for example, countries on the periphery of Europe) that led the rally. Safer markets like Switzerland and Norway generally struggled in the final months of the year.
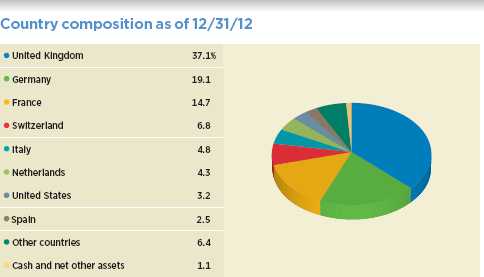
Country allocations are shown as a percentage of the fund’s net assets. Summary information may differ from the portfolio schedule included in the financial statements due to the inclusion of derivative securities and the exclusion of as-of trades, if any. Weightings will vary over time.
| 6 | Europe Equity Fund |
Which holdings were key contributors to the fund’s results?
The stock of Deutsche Lufthansa, the German airline, gained ground on rising passenger volume, on investors’ belief that its current corporate restructuring is progressing well, and as a result of a rising tide for the market in general.
Barclays and Societe Generale, the U.K. and French banks, respectively, benefited from the fact that the ECB soothed market fears over a breakup of the eurozone, and because the banks appeared to be repairing their balance sheets and staying on track to meet new regulatory requirements. Investors thus gained a new comfort level with European financials, particularly banking stocks, which had sold off significantly by the middle of 2012, the start of the fund’s fiscal period.
U.K.-based TUI Travel performed well during the period because it executed its strategy well. The travel and leisure company shifted away from providing packaged tours to offering customized travel deals, for which it can command a higher price and thus achieve higher profit margins. TUI Travel has also shed underperforming businesses and was given a boost as one of its main competitors experienced financial difficulties during the period.
Which holdings held fund performance back?
Detractors from performance for the period included U.K.-based BG Group. This integrated natural gas company and global leader in

This table shows the fund’s top 10 holdings by percentage of the fund’s net assets as of 12/31/12. Short-term holdings are excluded. Holdings will vary over time.
| Europe Equity Fund | 7 |
liquefied natural gas production revised its production numbers lower during the period, which caused a significant sell-off in the stock. Although we have trimmed the position, we believe the company has attractive natural gas assets in Brazil, Australia, and the United States, and we are confident that it will deliver above-industry growth in the coming quarters.
Mining giant Rio Tinto, which is also based in the United Kingdom, performed poorly as declining demand for iron ore put pressure on the stock. We believe the slowdown in China is largely to blame for this situation, as the country is the key driver of global iron ore consumption. Toward the end of 2012, we sold our position in Rio and established a position in another U.K. firm, BHP Billiton, a more diversified metals and mining company focused on coal, copper, iron ore, and other natural resources.
What is your outlook for international markets and the fund?
In 2012, markets endured numerous episodes of economic and political uncertainty, but equity markets managed to generate strong returns on the back of accommodative monetary policy, attractive valuations, and improving macro data in the United States and China. For the coming months, we are cautiously optimistic that European equities may continue to perform well, although valuations in aggregate have ticked up since their mid-year 2012 lows. Political and economic risks have not gone away entirely, but on the whole 2013 seems to have a more favorable starting point than 2012 had in this regard.
Given the sharp run-up in equity markets, we believe the investment environment will call for increased investor vigilance and that stock selection, active management, and the core features of our investment approach will become all the more important. We feel

This chart shows the fund’s largest allocation shifts, by percentage, over the past six months. Allocations are shown as a percentage of net assets. Current period summary information may differ from the portfolio schedule included in the financial statements due to the inclusion of derivative securities, the exclusion of as-of trades, if any, and the use of different classifications of securities for presentation purposes. Holdings and allocations will vary over time.
| 8 | Europe Equity Fund |
confident that our abilities in these areas will continue to put the fund in good stead.
Thank you, Sam, for this update on the fund.
The views expressed in this report are exclusively those of Putnam Management and are subject to change. They are not meant as investment advice. Please note that the holdings discussed in this report may not have been held by the fund for the entire period.
Portfolio composition is subject to review in accordance with the fund’s investment strategy and may vary in the future. Current and future portfolio holdings are subject to risk.
Portfolio Manager Simon Davis is Co-Head of International Equities at Putnam. He has a B.A. from Oxford University. Simon joined Putnam in 2000 and has been in the investment industry since 1988.
IN THE NEWS
The Japanese yen has weakened considerably in the past few months and recently fell to its lowest level since June 2010. This has led to a robust rally in Japanese stocks as new Japanese Prime Minister Shinzō Abe’s government attempts to “reflate” the country’s moribund economy by adding stimulus and pressing the Bank of Japan to ease monetary policy. In early January, Japan’s new government unveiled a $117 billion economic stimulus package, which includes billions in government spending on public works and infrastructure programs. The goal of the stimulus program is to boost the real GDP growth rate to 2% and create 600,000 jobs in the world’s third-largest economy. The weaker yen has been particularly beneficial for Japan’s export companies. In the fourth quarter of 2012, Japan’s stock market increased 17.56%, as measured by the MSCI Japan Index, although this outsize gain was offset by the yen’s decline versus major global currencies. As of January 31, 2013, it was up 9.42% year to date.
| Europe Equity Fund | 9 |
Your fund’s performance
This section shows your fund’s performance, price, and distribution information for periods ended December 31, 2012, the end of the first half of its current fiscal year. In accordance with regulatory requirements for mutual funds, we also include expense information taken from the fund’s current prospectus. Performance should always be considered in light of a fund’s investment strategy. Data represent past performance. Past performance does not guarantee future results. More recent returns may be less or more than those shown. Investment return and principal value will fluctuate, and you may have a gain or a loss when you sell your shares. Performance information does not reflect any deduction for taxes a shareholder may owe on fund distributions or on the redemption of fund shares. For the most recent month-end performance, please visit the Individual Investors section at putnam.com or call Putnam at 1-800-225-1581. Class R and class Y shares are not available to all investors. See the Terms and Definitions section in this report for definitions of the share classes offered by your fund.
Fund performance Total return for periods ended 12/31/12
| Class A | Class B | Class C | Class M | Class R | Class Y | |||||
| (inception dates) | (9/7/90) | (2/1/94) | (7/26/99) | (12/1/94) | (12/1/03) | (10/4/05) | ||||
| Before | After | Before | After | Net | Net | |||||
| sales | sales | Before | After | Before | After | sales | sales | asset | asset | |
| charge | charge | CDSC | CDSC | CDSC | CDSC | charge | charge | value | value | |
| Annual average | ||||||||||
| (life of fund) | 7.88% | 7.60% | 7.08% | 7.08% | 7.08% | 7.08% | 7.37% | 7.19% | 7.63% | 7.97% |
| 10 years | 110.27 | 98.24 | 95.07 | 95.07 | 95.07 | 95.07 | 100.10 | 93.07 | 105.78 | 114.12 |
| Annual average | 7.72 | 7.08 | 6.91 | 6.91 | 6.91 | 6.91 | 7.18 | 6.80 | 7.48 | 7.91 |
| 5 years | –14.25 | –19.19 | –17.44 | –19.00 | –17.39 | –17.39 | –16.34 | –19.28 | –15.27 | –13.17 |
| Annual average | –3.03 | –4.17 | –3.76 | –4.13 | –3.75 | –3.75 | –3.51 | –4.19 | –3.26 | –2.78 |
| 3 years | 17.46 | 10.70 | 14.83 | 11.83 | 14.76 | 14.76 | 15.69 | 11.66 | 16.56 | 18.29 |
| Annual average | 5.51 | 3.45 | 4.72 | 3.80 | 4.70 | 4.70 | 4.98 | 3.74 | 5.24 | 5.76 |
| 1 year | 25.40 | 18.19 | 24.44 | 19.44 | 24.40 | 23.40 | 24.76 | 20.36 | 25.10 | 25.68 |
| 6 months | 19.00 | 12.19 | 18.49 | 13.49 | 18.52 | 17.52 | 18.69 | 14.51 | 18.86 | 19.09 |
Current performance may be lower or higher than the quoted past performance, which cannot guarantee future results. After-sales-charge returns for class A and M shares reflect the deduction of the maximum 5.75% and 3.50% sales charge, respectively, levied at the time of purchase. Class B share returns after contingent deferred sales charge (CDSC) reflect the applicable CDSC, which is 5% in the first year, declining over time to 1% in the sixth year, and is eliminated thereafter. Class C share returns after CDSC reflect a 1% CDSC for the first year that is eliminated thereafter. Class R and Y shares have no initial sales charge or CDSC. Performance for class B, C, M, R, and Y shares before their inception is derived from the historical performance of class A shares, adjusted for the applicable sales charge (or CDSC) and the higher operating expenses for such shares, except for class Y shares, for which 12b-1 fees are not applicable.
Recent performance may have benefitted from one or more legal settlements.
For a portion of the periods, the fund had expense limitations, without which returns would have been lower.
Class B share performance does not reflect conversion to class A shares.
A short-term trading fee of 1.00% may apply to redemptions (including by exchange into another fund) of shares purchased before January 2, 2013. For shares purchased on or after January 2, 2013, this short-term trading fee no longer applies.
| 10 | Europe Equity Fund |
Comparative index returns For periods ended 12/31/12
| Lipper European Region Funds | ||
| MSCI Europe Index (ND) | category average* | |
| Annual average (life of fund) | 7.41% | 7.85% |
| 10 years | 123.46 | 151.76 |
| Annual average | 8.37 | 9.29 |
| 5 years | –19.90 | –16.65 |
| Annual average | –4.34 | –3.77 |
| 3 years | 10.06 | 15.31 |
| Annual average | 3.25 | 4.72 |
| 1 year | 19.12 | 22.24 |
| 6 months | 16.33 | 17.11 |
Index and Lipper results should be compared with fund performance before sales charge, before CDSC, or at net asset value.
* Over the 6-month, 1-year, 3-year, 5-year, 10-year, and life-of-fund periods ended 12/31/12, there were 120, 111, 97, 86, 71, and 9 funds, respectively, in this Lipper category.
Fund price and distribution information For the six-month period ended 12/31/12
| Distributions | Class A | Class B | Class C | Class M | Class R | Class Y | ||
| Number | 1 | 1 | 1 | 1 | 1 | 1 | ||
| Income | $0.306 | $0.151 | $0.168 | $0.208 | $0.239 | $0.356 | ||
| Capital gains | — | — | — | — | — | — | ||
| Total | $0.306 | $0.151 | $0.168 | $0.208 | $0.239 | $0.356 | ||
| Before | After | Net | Net | Before | After | Net | Net | |
| sales | sales | asset | asset | sales | sales | asset | asset | |
| Share value | charge | charge | value | value | charge | charge | value | value |
| 6/30/12 | $17.45 | $18.51 | $16.72 | $17.11 | $17.27 | $17.90 | $17.23 | $17.53 |
| 12/31/12 | 20.46 | 21.71 | 19.66 | 20.11 | 20.29 | 21.03 | 20.24 | 20.52 |
The classification of distributions, if any, is an estimate. Before-sales-charge share value and current dividend rate for class A and M shares, if applicable, do not take into account any sales charge levied at the time of purchase. After-sales-charge share value, current dividend rate, and current 30-day SEC yield, if applicable, are calculated assuming that the maximum sales charge (5.75% for class A shares and 3.50% for class M shares) was levied at the time of purchase. Final distribution information will appear on your year-end tax forms.
| Europe Equity Fund | 11 |
Your fund’s expenses
As a mutual fund investor, you pay ongoing expenses, such as management fees, distribution fees (12b-1 fees), and other expenses. Using the following information, you can estimate how these expenses affect your investment and compare them with the expenses of other funds. You may also pay one-time transaction expenses, including sales charges (loads) and redemption fees, which are not shown in this section and would have resulted in higher total expenses. For more information, see your fund’s prospectus or talk to your financial representative.
Expense ratios
| Class A | Class B | Class C | Class M | Class R | Class Y | |
| Total annual operating expenses | ||||||
| for the fiscal year ended 6/30/12 | 1.45% | 2.20% | 2.20% | 1.95% | 1.70% | 1.20% |
| Annualized expense ratio for | ||||||
| the six-month period ended | ||||||
| 12/31/12* | 1.49% | 2.24% | 2.24% | 1.99% | 1.74% | 1.24% |
Fiscal-year expense information in this table is taken from the most recent prospectus, is subject to change, and may differ from that shown for the annualized expense ratio and in the financial highlights of this report. Expenses are shown as a percentage of average net assets.
* Includes an increase of 0.07% from annualizing the performance fee adjustment for the six months ended 12/31/12.
Expenses per $1,000
The following table shows the expenses you would have paid on a $1,000 investment in the fund from July 1, 2012, to December 31, 2012. It also shows how much a $1,000 investment would be worth at the close of the period, assuming actual returns and expenses.
| Class A | Class B | Class C | Class M | Class R | Class Y | |
| Expenses paid per $1,000*† | $8.22 | $12.34 | $12.34 | $10.97 | $9.60 | $6.85 |
| Ending value (after expenses) | $1,190.00 | $1,184.90 | $1,185.20 | $1,186.90 | $1,188.60 | $1,190.90 |
* Expenses for each share class are calculated using the fund’s annualized expense ratio for each class, which represents the ongoing expenses as a percentage of average net assets for the six months ended 12/31/12. The expense ratio may differ for each share class.
† Expenses are calculated by multiplying the expense ratio by the average account value for the period; then multiplying the result by the number of days in the period; and then dividing that result by the number of days in the year.
| 12 | Europe Equity Fund |
Estimate the expenses you paid
To estimate the ongoing expenses you paid for the six months ended December 31, 2012, use the following calculation method. To find the value of your investment on July 1, 2012, call Putnam at 1-800-225-1581.

Compare expenses using the SEC’s method
The Securities and Exchange Commission (SEC) has established guidelines to help investors assess fund expenses. Per these guidelines, the following table shows your fund’s expenses based on a $1,000 investment, assuming a hypothetical 5% annualized return. You can use this information to compare the ongoing expenses (but not transaction expenses or total costs) of investing in the fund with those of other funds. All mutual fund shareholder reports will provide this information to help you make this comparison. Please note that you cannot use this information to estimate your actual ending account balance and expenses paid during the period.
| Class A | Class B | Class C | Class M | Class R | Class Y | |
| Expenses paid per $1,000*† | $7.58 | $11.37 | $11.37 | $10.11 | $8.84 | $6.31 |
| Ending value (after expenses) | $1,017.69 | $1,013.91 | $1,013.91 | $1,015.17 | $1,016.43 | $1,018.95 |
* Expenses for each share class are calculated using the fund’s annualized expense ratio for each class, which represents the ongoing expenses as a percentage of average net assets for the six months ended 12/31/12. The expense ratio may differ for each share class.
† Expenses are calculated by multiplying the expense ratio by the average account value for the period; then multiplying the result by the number of days in the period; and then dividing that result by the number of days in the year.
| Europe Equity Fund | 13 |
Terms and definitions
Important terms
Total return shows how the value of the fund’s shares changed over time, assuming you held the shares through the entire period and reinvested all distributions in the fund.
Before sales charge, or net asset value, is the price, or value, of one share of a mutual fund, without a sales charge. Before-sales-charge figures fluctuate with market conditions, and are calculated by dividing the net assets of each class of shares by the number of outstanding shares in the class.
After sales charge is the price of a mutual fund share plus the maximum sales charge levied at the time of purchase. After-sales-charge performance figures shown here assume the 5.75% maximum sales charge for class A shares and 3.50% for class M shares.
Contingent deferred sales charge (CDSC) is generally a charge applied at the time of the redemption of class B or C shares and assumes redemption at the end of the period. Your fund’s class B CDSC declines over time from a 5% maximum during the first year to 1% during the sixth year. After the sixth year, the CDSC no longer applies. The CDSC for class C shares is 1% for one year after purchase.
Share classes
Class A shares are generally subject to an initial sales charge and no CDSC (except on certain redemptions of shares bought without an initial sales charge).
Class B shares are not subject to an initial sales charge. They may be subject to a CDSC.
Class C shares are not subject to an initial sales charge and are subject to a CDSC only if the shares are redeemed during the first year.
Class M shares have a lower initial sales charge and a higher 12b-1 fee than class A shares and no CDSC (except on certain redemptions of shares bought without an initial sales charge).
Class R shares are not subject to an initial sales charge or CDSC and are available only to certain defined contribution plans.
Class Y shares are not subject to an initial sales charge or CDSC, and carry no 12b-1 fee. They are generally only available to corporate and institutional clients and clients in other approved programs.
Comparative indexes
Barclays U.S. Aggregate Bond Index is an unmanaged index of U.S. investment-grade fixed-income securities.
BofA (Bank of America) Merrill Lynch U.S. 3-Month Treasury Bill Index is an unmanaged index that seeks to measure the performance of U.S. Treasury bills available in the marketplace.
MSCI Europe Index (ND) is an unmanaged index of Western European equity securities.
S&P 500 Index is an unmanaged index of common stock performance.
Indexes assume reinvestment of all distributions and do not account for fees. Securities and performance of a fund and an index will differ. You cannot invest directly in an index.
Lipper is a third-party industry-ranking entity that ranks mutual funds. Its rankings do not reflect sales charges. Lipper rankings are based on total return at net asset value relative to other funds that have similar current investment styles or objectives as determined by Lipper. Lipper may change a fund’s category assignment at its discretion. Lipper category averages reflect performance trends for funds within a category.
| 14 | Europe Equity Fund |
Other information for shareholders
Important notice regarding delivery of shareholder documents
In accordance with Securities and Exchange Commission (SEC) regulations, Putnam sends a single copy of annual and semiannual shareholder reports, prospectuses, and proxy statements to Putnam shareholders who share the same address, unless a shareholder requests otherwise. If you prefer to receive your own copy of these documents, please call Putnam at 1-800-225-1581, and Putnam will begin sending individual copies within 30 days.
Proxy voting
Putnam is committed to managing our mutual funds in the best interests of our shareholders. The Putnam funds’ proxy voting guidelines and procedures, as well as information regarding how your fund voted proxies relating to portfolio securities during the 12-month period ended June 30, 2012, are available in the Individual Investors section of putnam.com, and on the SEC’s website, www.sec.gov. If you have questions about finding forms on the SEC’s website, you may call the SEC at 1-800-SEC-0330. You may also obtain the Putnam funds’ proxy voting guidelines and procedures at no charge by calling Putnam’s Shareholder Services at 1-800-225-1581.
Fund portfolio holdings
The fund will file a complete schedule of its portfolio holdings with the SEC for the first and third quarters of each fiscal year on Form N-Q. Shareholders may obtain the fund’s Forms N-Q on the SEC’s website at www.sec.gov. In addition, the fund’s Forms N-Q may be reviewed and copied at the SEC’s Public Reference Room in Washington, D.C. You may call the SEC at 1-800-SEC-0330 for information about the SEC’s website or the operation of the Public Reference Room.
Trustee and employee fund ownership
Putnam employees and members of the Board of Trustees place their faith, confidence, and, most importantly, investment dollars in Putnam mutual funds. As of December 31, 2012, Putnam employees had approximately $348,000,000 and the Trustees had approximately $84,000,000 invested in Putnam mutual funds. These amounts include investments by the Trustees’ and employees’ immediate family members as well as investments through retirement and deferred compensation plans.
| Europe Equity Fund | 15 |
Financial statements
A guide to financial statements
These sections of the report, as well as the accompanying Notes, constitute the fund’s financial statements.
The fund’s portfolio lists all the fund’s investments and their values as of the last day of the reporting period. Holdings are organized by asset type and industry sector, country, or state to show areas of concentration and diversification.
Statement of assets and liabilities shows how the fund’s net assets and share price are determined. All investment and non-investment assets are added together. Any unpaid expenses and other liabilities are subtracted from this total. The result is divided by the number of shares to determine the net asset value per share, which is calculated separately for each class of shares. (For funds with preferred shares, the amount subtracted from total assets includes the liquidation preference of preferred shares.)
Statement of operations shows the fund’s net investment gain or loss. This is done by first adding up all the fund’s earnings — from dividends and interest income — and subtracting its operating expenses to determine net investment income (or loss). Then, any net gain or loss the fund realized on the sales of its holdings — as well as any unrealized gains or losses over the period — is added to or subtracted from the net investment result to determine the fund’s net gain or loss for the fiscal period.
Statement of changes in net assets shows how the fund’s net assets were affected by the fund’s net investment gain or loss, by distributions to shareholders, and by changes in the number of the fund’s shares. It lists distributions and their sources (net investment income or realized capital gains) over the current reporting period and the most recent fiscal year-end. The distributions listed here may not match the sources listed in the Statement of operations because the distributions are determined on a tax basis and may be paid in a different period from the one in which they were earned. Dividend sources are estimated at the time of declaration. Actual results may vary. Any non-taxable return of capital cannot be determined until final tax calculations are completed after the end of the fund’s fiscal year.
Financial highlights provide an overview of the fund’s investment results, per-share distributions, expense ratios, net investment income ratios, and portfolio turnover in one summary table, reflecting the five most recent reporting periods. In a semiannual report, the highlights table also includes the current reporting period.
| 16 | Europe Equity Fund |
The fund’s portfolio 12/31/12 (Unaudited)
| COMMON STOCKS (99.0%)* | Shares | Value |
| Austria (0.8%) | ||
| Erste Group Bank AG † | 40,289 | $1,288,262 |
| 1,288,262 | ||
| Belgium (1.2%) | ||
| Solvay SA | 13,002 | 1,871,652 |
| 1,871,652 | ||
| France (14.7%) | ||
| Christian Dior SA | 19,074 | 3,297,619 |
| European Aeronautic Defense and Space Co. NV | 45,565 | 1,785,844 |
| Pernod-Ricard SA | 21,057 | 2,476,025 |
| Sanofi | 60,013 | 5,691,346 |
| SCOR SE | 44,473 | 1,199,187 |
| Societe Generale SA † | 79,569 | 2,992,927 |
| Valeo SA | 53,126 | 2,693,827 |
| Vivendi | 127,713 | 2,876,054 |
| 23,012,829 | ||
| Germany (19.1%) | ||
| BASF SE | 46,194 | 4,341,835 |
| Bayer AG | 32,546 | 3,090,650 |
| Biotest AG-Vorzugsaktien (Preference) | 23,612 | 1,543,389 |
| Continental AG | 15,480 | 1,791,110 |
| Deutsche Lufthansa AG | 152,397 | 2,864,521 |
| Deutsche Post AG | 147,191 | 3,227,506 |
| Henkel AG & Co. KGaA (Preference) | 26,136 | 2,146,372 |
| Kabel Deutschland Holding AG | 38,007 | 2,842,100 |
| Lanxess AG | 15,740 | 1,376,567 |
| Merck KGaA | 10,794 | 1,424,138 |
| MTU Aero Engines Holding AG | 23,496 | 2,135,694 |
| Siemens AG | 29,363 | 3,191,453 |
| 29,975,335 | ||
| Ireland (1.5%) | ||
| Kerry Group PLC Class A | 44,334 | 2,353,293 |
| 2,353,293 | ||
| Italy (4.8%) | ||
| ENI SpA | 152,886 | 3,771,627 |
| Fiat Industrial SpA | 111,697 | 1,224,700 |
| Fiat SpA † | 217,794 | 1,100,109 |
| Luxottica Group SpA | 33,688 | 1,399,774 |
| 7,496,210 | ||
| Netherlands (4.3%) | ||
| ASML Holding NV | 19,076 | 1,234,974 |
| Gemalto NV | 15,046 | 1,362,206 |
| ING Groep NV GDR † | 317,005 | 3,031,421 |
| Ziggo NV | 34,428 | 1,112,677 |
| 6,741,278 | ||
| Russia (1.9%) | ||
| Magnit OJSC GDR | 30,937 | 1,252,695 |
| Sberbank of Russia ADR | 134,686 | 1,674,183 |
| 2,926,878 | ||
| Europe Equity Fund | 17 |
| COMMON STOCKS (99.0%)* cont. | Shares | Value |
| Spain (2.5%) | ||
| Amadeus IT Holding SA Class A | 75,438 | $1,893,062 |
| Banco Bilbao Vizcaya Argentaria SA (BBVA) | 215,464 | 1,978,034 |
| 3,871,096 | ||
| Sweden (1.0%) | ||
| Volvo AB Class B | 110,280 | 1,520,728 |
| 1,520,728 | ||
| Switzerland (6.8%) | ||
| Nestle SA | 108,096 | 7,045,061 |
| Partners Group Holding AG | 5,463 | 1,261,797 |
| UBS AG | 153,595 | 2,415,462 |
| 10,722,320 | ||
| United Kingdom (37.2%) | ||
| Aggreko PLC | 27,917 | 800,615 |
| Associated British Foods PLC | 96,663 | 2,460,456 |
| Barclays PLC | 755,693 | 3,263,371 |
| BG Group PLC | 151,919 | 2,547,418 |
| BHP Billiton PLC | 76,574 | 2,690,772 |
| Centrica PLC | 570,316 | 3,098,181 |
| Compass Group PLC | 181,041 | 2,141,129 |
| HSBC Holdings, PLC | 143,578 | 1,518,600 |
| Kingfisher PLC | 535,002 | 2,471,114 |
| Lloyds Banking Group PLC † | 2,155,846 | 1,727,432 |
| Persimmon PLC | 201,968 | 2,667,231 |
| Prudential PLC | 267,481 | 3,732,238 |
| Royal Dutch Shell PLC Class A | 211,318 | 7,466,822 |
| Shire PLC | 42,419 | 1,302,814 |
| SSE PLC | 108,020 | 2,496,459 |
| Standard Chartered PLC | 93,331 | 2,365,816 |
| TalkTalk Telecom Group PLC | 298,026 | 1,154,319 |
| Telecity Group PLC | 161,262 | 2,114,044 |
| TUI Travel PLC | 433,636 | 2,018,017 |
| Virgin Media, Inc. | 44,233 | 1,625,563 |
| Vodafone Group PLC | 1,816,482 | 4,568,209 |
| WPP PLC | 175,040 | 2,544,604 |
| Xstrata PLC | 91,956 | 1,635,536 |
| 58,410,760 | ||
| United States (3.2%) | ||
| Covidien PLC | 26,000 | 1,501,240 |
| KKR & Co. LP | 82,700 | 1,259,521 |
| Monsanto Co. | 12,000 | 1,135,800 |
| Schlumberger, Ltd. | 16,700 | 1,157,143 |
| 5,053,704 | ||
| Total common stocks (cost $127,632,335) | $155,244,345 | |
| 18 | Europe Equity Fund |
| SHORT-TERM INVESTMENTS (1.2%)* | Shares | Value |
| Putnam Money Market Liquidity Fund 0.14% L | 1,955,737 | $1,955,737 |
| Total short-term investments (cost $1,955,737) | $1,955,737 | |
| TOTAL INVESTMENTS | ||
| Total investments (cost $129,588,072) | $157,200,082 | |
Key to holding’s abbreviations
ADR American Depository Receipts: represents ownership of foreign securities on deposit with a custodian bank
GDR Global Depository Receipts: represents ownership of foreign securities on deposit with a custodian bank
OJSC Open Joint Stock Company
Notes to the fund’s portfolio
Unless noted otherwise, the notes to the fund’s portfolio are for the close of the fund’s reporting period, which ran from July 1, 2012 through December 31, 2012 (the reporting period). Within the following notes to the portfolio, references to “ASC 820” represent Accounting Standards Codification ASC 820 Fair Value Measurements and Disclosures.
* Percentages indicated are based on net assets of $156,807,682.
† Non-income-producing security.
L Affiliated company (Note 6). The rate quoted in the security description is the annualized 7-day yield of the fund at the close of the reporting period.
The fund had the following sector concentrations greater than 10% at the close of the reporting period (as a percentage of net assets):
| Financials | 18.9% |
| Consumer discretionary | 17.0 |
| Consumer staples | 11.3 |
| Industrials | 10.7 |
FORWARD CURRENCY CONTRACTS at 12/31/12 (aggregate face value $7,263,013) (Unaudited)
| Unrealized | ||||||
| Contract | Delivery | Aggregate | appreciation/ | |||
| Counterparty | Currency | type | date | Value | face value | (depreciation) |
| Credit Suisse International | ||||||
| Euro | Sell | 1/16/13 | $3,682,543 | $3,642,213 | $(40,330) | |
| Swiss Franc | Buy | 1/16/13 | 3,663,502 | 3,620,800 | 42,702 | |
| Total | $2,372 | |||||
| Europe Equity Fund | 19 |
ASC 820 establishes a three-level hierarchy for disclosure of fair value measurements. The valuation hierarchy is based upon the transparency of inputs to the valuation of the fund’s investments. The three levels are defined as follows:
Level 1: Valuations based on quoted prices for identical securities in active markets.
Level 2: Valuations based on quoted prices in markets that are not active or for which all significant inputs are observable, either directly or indirectly.
Level 3: Valuations based on inputs that are unobservable and significant to the fair value measurement.
The following is a summary of the inputs used to value the fund’s net assets as of the close of the reporting period:
| Valuation inputs | ||||
| Investments in securities: | Level 1 | Level 2 | Level 3 | |
| Common stocks: | ||||
| Austria | $— | $1,288,262 | $— | |
| Belgium | — | 1,871,652 | — | |
| France | — | 23,012,829 | — | |
| Germany | — | 29,975,335 | — | |
| Ireland | — | 2,353,293 | — | |
| Italy | — | 7,496,210 | — | |
| Netherlands | — | 6,741,278 | — | |
| Russia | — | 2,926,878 | — | |
| Spain | — | 3,871,096 | — | |
| Sweden | — | 1,520,728 | — | |
| Switzerland | — | 10,722,320 | — | |
| United Kingdom | 1,625,563 | 56,785,197 | — | |
| United States | 5,053,704 | — | — | |
| Total common stocks | 6,679,267 | 148,565,078 | — | |
| Short-term investments | 1,955,737 | — | — | |
| Totals by level | $8,635,004 | $148,565,078 | $— | |
| Valuation inputs | ||||
| Other financial instruments: | Level 1 | Level 2 | Level 3 | |
| Forward currency contracts | $— | $2,372 | $— | |
| Totals by level | $— | $2,372 | $— | |
The accompanying notes are an integral part of these financial statements.
| 20 | Europe Equity Fund |
Statement of assets and liabilities 12/31/12 (Unaudited)
| ASSETS | |
| Investment in securities, at value (Note 1): | |
| Unaffiliated issuers (identified cost $127,632,335) | $155,244,345 |
| Affiliated issuers (identified cost $1,955,737) (Notes 1 and 6) | 1,955,737 |
| Dividends, interest and other receivables | 218,799 |
| Foreign Tax reclaim | 124,188 |
| Receivable for shares of the fund sold | 24,252 |
| Unrealized appreciation on forward currency contracts (Note 1) | 42,702 |
| Total assets | 157,610,023 |
| LIABILITIES | |
| Payable for shares of the fund repurchased | 237,815 |
| Payable for compensation of Manager (Note 2) | 103,954 |
| Payable for custodian fees (Note 2) | 9,946 |
| Payable for investor servicing fees (Note 2) | 39,264 |
| Payable for Trustee compensation and expenses (Note 2) | 164,712 |
| Payable for administrative services (Note 2) | 1,590 |
| Payable for distribution fees (Note 2) | 93,609 |
| Payable for reports to shareholders | 44,888 |
| Unrealized depreciation on forward currency contracts (Note 1) | 40,330 |
| Other accrued expenses | 66,233 |
| Total liabilities | 802,341 |
| Net assets | $156,807,682 |
| REPRESENTED BY | |
| Paid-in capital (Unlimited shares authorized) (Notes 1 and 4) | $231,374,769 |
| Distributions in excess of net investment income (Note 1) | (2,253,516) |
| Accumulated net realized loss on investments and foreign currency transactions (Note 1) | (99,929,006) |
| Net unrealized appreciation of investments and assets and liabilities in foreign currencies | 27,615,435 |
| Total — Representing net assets applicable to capital shares outstanding | $156,807,682 |
| COMPUTATION OF NET ASSET VALUE AND OFFERING PRICE | |
| Net asset value and redemption price per class A share ($140,183,781 divided by 6,852,060 shares) | $20.46 |
| Offering price per class A share (100/94.25 of $20.46)* | $21.71 |
| Net asset value and offering price per class B share ($3,262,856 divided by 165,953 shares)** | $19.66 |
| Net asset value and offering price per class C share ($1,750,933 divided by 87,051 shares)** | $20.11 |
| Net asset value and redemption price per class M share ($2,826,296 divided by 139,297 shares) | $20.29 |
| Offering price per class M share (100/96.50 of $20.29)* | $21.03 |
| Net asset value, offering price and redemption price per class R share | |
| ($165,438 divided by 8,175 shares) | $20.24 |
| Net asset value, offering price and redemption price per class Y share | |
| ($8,618,378 divided by 419,957 shares) | $20.52 |
* On single retail sales of less than $50,000. On sales of $50,000 or more the offering price is reduced.
** Redemption price per share is equal to net asset value less any applicable contingent deferred sales charge.
The accompanying notes are an integral part of these financial statements.
| Europe Equity Fund | 21 |
Statement of operations Six months ended 12/31/12 (Unaudited)
| INVESTMENT INCOME | |
| Dividends (net of foreign tax of $67,476) | $1,162,442 |
| Interest (including interest income of $1,422 from investments in affiliated issuers) (Note 6) | 12,154 |
| Securities lending (Note 1) | 35,381 |
| Total investment income | 1,209,977 |
| EXPENSES | |
| Compensation of Manager (Note 2) | 592,777 |
| Investor servicing fees (Note 2) | 226,746 |
| Custodian fees (Note 2) | 9,792 |
| Trustee compensation and expenses (Note 2) | 8,186 |
| Distribution fees (Note 2) | 206,682 |
| Administrative services (Note 2) | 2,779 |
| Other | 109,969 |
| Total expenses | 1,156,931 |
| Expense reduction (Note 2) | (262) |
| Net expenses | 1,156,669 |
| Net investment income | 53,308 |
| Net realized gain on investments (Notes 1 and 3) | 1,559,148 |
| Net realized loss on foreign currency transactions (Note 1) | (22,444) |
| Net unrealized appreciation of assets and liabilities in foreign currencies during the period | 6,764 |
| Net unrealized appreciation of investments during the period | 24,792,603 |
| Net gain on investments | 26,336,071 |
| Net increase in net assets resulting from operations | $26,389,379 |
The accompanying notes are an integral part of these financial statements.
| 22 | Europe Equity Fund |
Statement of changes in net assets
| INCREASE (DECREASE) IN NET ASSETS | Six months ended 12/31/12* | Year ended 6/30/12 |
| Operations: | ||
| Net investment income | $53,308 | $2,762,501 |
| Net realized gain (loss) on investments | ||
| and foreign currency transactions | 1,536,704 | (7,249,029) |
| Net unrealized appreciation (depreciation) of investments | ||
| and assets and liabilities in foreign currencies | 24,799,367 | (28,576,191) |
| Net increase (decrease) in net assets resulting | ||
| from operations | 26,389,379 | (33,062,719) |
| Distributions to shareholders (Note 1): | ||
| From ordinary income | ||
| Net investment income | ||
| Class A | (2,081,383) | (6,452,868) |
| Class B | (24,925) | (148,090) |
| Class C | (14,521) | (63,645) |
| Class M | (29,115) | (122,510) |
| Class R | (1,914) | (8,664) |
| Class Y | (148,032) | (383,605) |
| From return of capital | ||
| Class A | — | (246,521) |
| Class B | — | (5,657) |
| Class C | — | (2,431) |
| Class M | — | (4,680) |
| Class R | — | (331) |
| Class Y | — | (14,655) |
| Increase in capital from settlement payments (Note 8) | — | 3,829,609 |
| Redemption fees (Note 1) | 1,709 | 65,863 |
| Decrease from capital share transactions (Note 4) | (12,554,989) | (17,190,001) |
| Total increase (decrease) in net assets | 11,536,209 | (53,810,905) |
| NET ASSETS | ||
| Beginning of period | 145,271,473 | 199,082,378 |
| End of period (including distributions in excess of net | ||
| investment income of $2,253,516 and $6,934, respectively) | $156,807,682 | $145,271,473 |
* Unaudited
The accompanying notes are an integral part of these financial statements.
| Europe Equity Fund | 23 |
Financial highlights (For a common share outstanding throughout the period)
| INVESTMENT OPERATIONS: | LESS DISTRIBUTIONS: | RATIOS AND SUPPLEMENTAL DATA: | ||||||||||||||
| Ratio | ||||||||||||||||
| Net asset | Net | Net realized | From | From | Ratio | of net investment | ||||||||||
| value, | investment | and unrealized | Total from | net | net realized | From | Net assets, | of expenses | income (loss) | |||||||
| beginning | income | gain (loss) | investment | investment | gain | return | Total | Redemption | Non-recurring | Net asset value, | Total return at net | end of period | to average | to average | Portfolio | |
| Period ended | of period | (loss)a | on investments | operations | income | on investments | of capital | distributions | fees | reimbursements | end of period | asset value (%)b | (in thousands) | net assets (%)c | net assets (%) | turnover (%) |
| Class A | ||||||||||||||||
| December 31, 2012** | $17.45 | .01 | 3.31 | 3.32 | (.31) | — | — | (.31) | —d | — | $20.46 | 19.00* | $140,184 | .75* | .04* | 25* |
| June 30, 2012 | 21.50 | .32 | (3.94) | (3.62) | (.84) | — | (.03) | (.87) | .01 | .43e,f,g | 17.45 | (14.38)e,g | 130,428 | 1.47 | 1.78 | 62 |
| June 30, 2011 | 15.83 | .31 | 5.72 | 6.03 | (.37) | — | — | (.37) | —d | .01h,i | 21.50 | 38.36 | 177,369 | 1.43 | 1.54 | 70 |
| June 30, 2010 | 15.12 | .23 | .49 | .72 | (.09) | — | — | (.09) | —d | .08j | 15.83 | 5.20 | 151,329 | 1.52k | 1.25k | 113 |
| June 30, 2009 | 23.20 | .42 | (8.56) | (8.14) | — | — | — | — | —d | .06l,m | 15.12 | (34.83) | 169,467 | 1.47k | 2.65k | 79 |
| June 30, 2008 | 33.47 | .48 | (5.14) | (4.66) | (.54) | (5.07) | — | (5.61) | —d | — | 23.20 | (15.43) | 346,192 | 1.41k | 1.70k | 77 |
| Class B | ||||||||||||||||
| December 31, 2012** | $16.72 | (.06) | 3.15 | 3.09 | (.15) | — | — | (.15) | —d | — | $19.66 | 18.49* | $3,263 | 1.13* | (.33)* | 25* |
| June 30, 2012 | 20.55 | .16 | (3.72) | (3.56) | (.66) | — | (.03) | (.69) | .01 | .41e,f,g | 16.72 | (14.98)e,g | 3,126 | 2.22 | .92 | 62 |
| June 30, 2011 | 15.12 | .12 | 5.49 | 5.61 | (.19) | — | — | (.19) | —d | .01h,i | 20.55 | 37.29 | 5,580 | 2.18 | .65 | 70 |
| June 30, 2010 | 14.48 | .06 | .50 | .56 | — | — | — | — | —d | .08j | 15.12 | 4.42 | 6,671 | 2.27 k | .37k | 113 |
| June 30, 2009 | 22.39 | .27 | (8.24) | (7.97) | — | — | — | — | —d | .06l,m | 14.48 | (35.33) | 10,391 | 2.22 k | 1.74k | 79 |
| June 30, 2008 | 32.34 | .16 | (4.85) | (4.69) | (.19) | (5.07) | — | (5.26) | —d | — | 22.39 | (16.04) | 32,360 | 2.16 k | .58k | 77 |
| Class C | ||||||||||||||||
| December 31, 2012** | $17.11 | (.06) | 3.23 | 3.17 | (.17) | — | — | (.17) | —d | — | $20.11 | 18.52* | $1,751 | 1.13* | (.34)* | 25* |
| June 30, 2012 | 21.05 | .18 | (3.84) | (3.66) | (.68) | — | (.03) | (.71) | .01 | .42e,f,g | 17.11 | (15.01)e,g | 1,502 | 2.22 | 1.01 | 62 |
| June 30, 2011 | 15.50 | .15 | 5.60 | 5.75 | (.21) | — | — | (.21) | —d | .01h,i | 21.05 | 37.32 | 2,217 | 2.18 | .80 | 70 |
| June 30, 2010 | 14.84 | .09 | .49 | .58 | — | — | — | — | —d | .08j | 15.50 | 4.45 | 1,859 | 2.27k | .48k | 113 |
| June 30, 2009 | 22.94 | .30 | (8.46) | (8.16) | — | — | — | — | —d | .06l,m | 14.84 | (35.31) | 2,325 | 2.22k | 1.90k | 79 |
| June 30, 2008 | 33.11 | .25 | (5.06) | (4.81) | (.29) | (5.07) | — | (5.36) | —d | — | 22.94 | (16.04) | 4,912 | 2.16k | .89k | 77 |
| Class M | ||||||||||||||||
| December 31, 2012** | $17.27 | (.04) | 3.27 | 3.23 | (.21) | — | — | (.21) | —d | — | $20.29 | 18.69* | $2,826 | 1.00* | (.21)* | 25* |
| June 30, 2012 | 21.26 | .22 | (3.87) | (3.65) | (.74) | — | (.03) | (.77) | .01 | .42 e,f,g | 17.27 | (14.80) e,g | 2,565 | 1.97 | 1.24 | 62 |
| June 30, 2011 | 15.65 | .21 | 5.66 | 5.87 | (.27) | — | — | (.27) | —d | .01 h,i | 21.26 | 37.72 | 3,751 | 1.93 | 1.06 | 70 |
| June 30, 2010 | 14.96 | .13 | .49 | .62 | (.01) | — | — | (.01) | —d | .08 j | 15.65 | 4.64 | 3,250 | 2.02 k | .75 k | 113 |
| June 30, 2009 | 23.07 | .34 | (8.51) | (8.17) | — | — | — | — | —d | .06 l,m | 14.96 | (35.15) | 3,683 | 1.97 k | 2.19 k | 79 |
| June 30, 2008 | 33.23 | .27 | (5.03) | (4.76) | (.33) | (5.07) | — | (5.40) | —d | — | 23.07 | (15.85) | 7,551 | 1.91 k | .96 k | 77 |
| Class R | ||||||||||||||||
| December 31, 2012** | $17.23 | (.01) | 3.26 | 3.25 | (.24) | — | — | (.24) | —d | — | $20.24 | 18.86* | $165 | .88* | (.07)* | 25* |
| June 30, 2012 | 21.25 | .27 | (3.89) | (3.62) | (.81) | — | (.03) | (.84) | .01 | .43e,f,g | 17.23 | (14.60) e,g | 168 | 1.72 | 1.51 | 62 |
| June 30, 2011 | 15.66 | .29 | 5.62 | 5.91 | (.33) | — | — | (.33) | —d | .01h,i | 21.25 | 38.00 | 219 | 1.68 | 1.49 | 70 |
| June 30, 2010 | 14.97 | .21 | .46 | .67 | (.06) | — | — | (.06) | —d | .08j | 15.66 | 4.97 | 133 | 1.77k | 1.20k | 113 |
| June 30, 2009 | 23.02 | .42 | (8.53) | (8.11) | — | — | — | — | —d | .06l,m | 14.97 | (34.97) | 97 | 1.72k | 2.80k | 79 |
| June 30, 2008 | 33.30 | .44 | (5.13) | (4.69) | (.52) | (5.07) | — | (5.59) | —d | — | 23.02 | (15.63) | 107 | 1.66k | 1.60k | 77 |
| Class Y | ||||||||||||||||
| December 31, 2012** | $17.53 | .03 | 3.32 | 3.35 | (.36) | — | — | (.36) | —d | — | $20.52 | 19.09* | $8,618 | .62* | .17* | 25* |
| June 30, 2012 | 21.60 | .37 | (3.95) | (3.58) | (.90) | — | (.03) | (.93) | .01 | .43e,f,g | 17.53 | (14.13) e,g | 7,484 | 1.22 | 2.04 | 62 |
| June 30, 2011 | 15.90 | .37 | 5.74 | 6.11 | (.42) | — | — | (.42) | —d | .01h,i | 21.60 | 38.73 | 9,947 | 1.18 | 1.84 | 70 |
| June 30, 2010 | 15.19 | .27 | .49 | .76 | (.13) | — | — | (.13) | —d | .08j | 15.90 | 5.41 | 8,356 | 1.27k | 1.52k | 113 |
| June 30, 2009 | 23.24 | .52 | (8.63) | (8.11) | — | — | — | — | —d | .06l,m | 15.19 | (34.64) | 8,987 | 1.22k | 3.50k | 79 |
| June 30, 2008 | 33.53 | .57 | (5.16) | (4.59) | (.63) | (5.07) | — | (5.70) | —d | — | 23.24 | (15.22) | 9,154 | 1.16k | 2.05k | 77 |
See notes to financial highlights at the end of this section.
The accompanying notes are an integral part of these financial statements.
| 24 | Europe Equity Fund | Europe Equity Fund | 25 |
Financial highlights (Continued)
* Not annualized.
** Unaudited.
a Per share net investment income (loss) has been determined on the basis of the weighted average number of shares outstanding during the period.
b Total return assumes dividend reinvestment and does not reflect the effect of sales charges.
c Includes amounts paid through expense offset and/or brokerage/service arrangements (Note 2).
d Amount represents less than $0.01 per share.
e Reflects a non-recurring reimbursement pursuant to a settlement between the Securities and Exchange Commission (the SEC) and Bank of America which amounted to the following amounts per share outstanding on December 15, 2011:
| Per share | |
| Class A | $0.15 |
| Class B | 0.14 |
| Class C | 0.15 |
| Class M | 0.15 |
| Class R | 0.15 |
| Class Y | 0.15 |
This payment resulted in an increase to total returns of 0.73% for the period ended June 30, 2012.
f Reflects a non-recurring reimbursement pursuant to a settlement between the SEC and Canadian Imperial Holdings, Inc. and CIBC World Markets Corp. which amounted to the following amounts per share outstanding on November 29, 2011:
| Per share | |
| Class A | $0.08 |
| Class B | 0.07 |
| Class C | 0.08 |
| Class M | 0.08 |
| Class R | 0.08 |
| Class Y | 0.08 |
g Reflects a non-recurring reimbursement related to restitution amounts in connection with a distribution plan approved by the SEC, which amounted to the following amounts per share outstanding on July 21, 2011 (Note 8):
| Per share | |
| Class A | $0.20 |
| Class B | 0.19 |
| Class C | 0.20 |
| Class M | 0.20 |
| Class R | 0.20 |
| Class Y | 0.20 |
This payment resulted in an increase to total returns of 0.98% for the period ended June 30, 2012.
h Reflects a non-recurring reimbursement related to short-term trading related lawsuits, which amounted to $0.01 per share outstanding on May 11, 2011.
i Reflects a non-recurring reimbursement pursuant to a settlement between the SEC and Zurich Capital Markets, Inc., which amounted to less than $0.01 per share outstanding on December 21, 2010.
The accompanying notes are an integral part of these financial statements.
| 26 | Europe Equity Fund |
Financial highlights (Continued)
j Reflects a non-recurring reimbursement pursuant to a settlement between the SEC and Prudential Securities, Inc., which amounted to $0.08 per share outstanding as of March 30, 2010.
k Reflects an involuntary contractual expense limitation in effect during the period. For periods prior to June 30, 2010 certain fund expenses were waived in connection with the fund’s investment in Putnam Prime Money Market Fund. As a result of such limitation and/or waivers, the expenses of each class reflect a reduction of the following amounts:
| Percentage of | |
| average net assets | |
| June 30, 2010 | 0.02% |
| June 30, 2009 | 0.14 |
| June 30, 2008 | <0.01 |
l Reflects a non-recurring reimbursement pursuant to a settlement between the SEC and Millennium Partners, L.P., Millennium Management, L.L.C., and Millennium International Management, L.L.C., which amounted to $0.03 per share outstanding as of June 23, 2009.
m Reflects a non-recurring reimbursement pursuant to a settlement between the SEC and Bear, Stearns & Co., Inc. and Bear, Stearns Securities Corp., which amounted to $0.03 per share outstanding as of May 21, 2009.
The accompanying notes are an integral part of these financial statements.
| Europe Equity Fund | 27 |
Notes to financial statements 12/31/12 (Unaudited)
Within the following Notes to financial statements, references to “State Street” represent State Street Bank and Trust Company, references to “the SEC” represent the Securities and Exchange Commission and references to “Putnam Management” represent Putnam Investment Management, LLC, the fund’s manager, an indirect wholly-owned subsidiary of Putnam Investments, LLC. Unless otherwise noted, the “reporting period” represents the period from July 1, 2012 through December 31, 2012.
Putnam Europe Equity Fund (the fund) is a Massachusetts business trust, which is registered under the Investment Company Act of 1940, as amended, as a diversified open-end management investment company. The investment objective of the fund is to seek capital appreciation by investing mainly in common stocks (growth or value stocks or both) of large and midsize European companies that Putnam Management believes have favorable investment potential. The fund invests mainly in developed countries, but may invest in emerging markets, such as those in Eastern Europe.
The fund offers class A, class B, class C, class M, class R, and class Y shares. Class A and class M shares are sold with a maximum front-end sales charge of 5.75% and 3.50%, respectively, and generally do not pay a contingent deferred sales charge. Class B shares, which convert to class A shares after approximately eight years, do not pay a front-end sales charge and are subject to a contingent deferred sales charge if those shares are redeemed within six years of purchase. Class C shares have a one-year 1.00% contingent deferred sales charge and do not convert to class A shares. Class R shares, which are not available to all investors, are sold at net asset value. The expenses for class A, class B, class C, class M and class R shares may differ based on the distribution fee of each class, which is identified in Note 2. Class Y shares, which are sold at net asset value, are generally subject to the same expenses as class A, class B, class C, class M and class R shares, but do not bear a distribution fee. Class Y shares are not available to all investors.
In the normal course of business, the fund enters into contracts that may include agreements to indemnify another party under given circumstances. The fund’s maximum exposure under these arrangements is unknown as this would involve future claims that may be, but have not yet been, made against the fund. However, the fund’s management team expects the risk of material loss to be remote.
Note 1: Significant accounting policies
The following is a summary of significant accounting policies consistently followed by the fund in the preparation of its financial statements. The preparation of financial statements is in conformity with accounting principles generally accepted in the United States of America and requires management to make estimates and assumptions that affect the reported amounts of assets and liabilities in the financial statements and the reported amounts of increases and decreases in net assets from operations. Actual results could differ from those estimates. Subsequent events after the Statement of assets and liabilities date through the date that the financial statements were issued have been evaluated in the preparation of the financial statements.
A short-term trading fee of 1.00% may apply to redemptions (including exchanges into another fund) of shares purchased before January 2, 2013. The short-term trading fee is accounted for as an addition to paid-in-capital. For shares purchased on or after January 2, 2013, this short-term trading fee no longer applies.
Investment income, realized and unrealized gains and losses and expenses of the fund are borne pro-rata based on the relative net assets of each class to the total net assets of the fund, except that each class bears expenses unique to that class (including the distribution fees applicable to such classes). Each class votes as a class only with respect to its own distribution plan or other matters on which a class vote is required by law or determined by the Trustees. If the fund were liquidated, shares of each class would receive their pro-rata share of the net assets of the fund. In addition, the Trustees declare separate dividends on each class of shares.
Security valuation Investments for which market quotations are readily available are valued at the last reported sales price on their principal exchange, or official closing price for certain markets, and are classified as Level 1 securities. If no sales are reported, as in the case of some securities traded over-the-counter, a security is valued at its last reported bid price and is generally categorized as a Level 2 security.
Investments in open-end investment companies (excluding exchange traded funds), if any, which can be classified as Level 1 or Level 2 securities, are based on their net asset value. The net asset value of such investment companies equals the total value of their assets less their liabilities and divided by the number of their outstanding shares.
| 28 | Europe Equity Fund |
Many securities markets and exchanges outside the U.S. close prior to the close of the New York Stock Exchange and therefore the closing prices for securities in such markets or on such exchanges may not fully reflect events that occur after such close but before the close of the New York Stock Exchange. Accordingly, on certain days, the fund will fair value foreign equity securities taking into account multiple factors including movements in the U.S. securities markets, currency valuations and comparisons to the valuation of American Depository Receipts, exchange-traded funds and futures contracts. These securities, which would generally be classified as Level 1 securities, will be transferred to Level 2 of the fair value hierarchy when they are valued at fair value. The number of days on which fair value prices will be used will depend on market activity and it is possible that fair value prices will be used by the fund to a significant extent. At the close of the reporting period, fair value pricing was used for certain foreign securities in the portfolio. Securities quoted in foreign currencies, if any, are translated into U.S. dollars at the current exchange rate.
To the extent a pricing service or dealer is unable to value a security or provides a valuation that Putnam Management does not believe accurately reflects the security’s fair value, the security will be valued at fair value by Putnam Management. Certain investments, including certain restricted and illiquid securities and derivatives, are also valued at fair value following procedures approved by the Trustees. These valuations consider such factors as significant market or specific security events such as interest rate or credit quality changes, various relationships with other securities, discount rates, U.S. Treasury, U.S. swap and credit yields, index levels, convexity exposures and recovery rates. These securities are classified as Level 2 or as Level 3 depending on the priority of the significant inputs.
Such valuations and procedures are reviewed periodically by the Trustees. The fair value of securities is generally determined as the amount that the fund could reasonably expect to realize from an orderly disposition of such securities over a reasonable period of time. By its nature, a fair value price is a good faith estimate of the value of a security in a current sale and does not reflect an actual market price, which may be different by a material amount.
Security transactions and related investment income Security transactions are recorded on the trade date (the date the order to buy or sell is executed). Gains or losses on securities sold are determined on the identified cost basis.
Interest income, net of any applicable withholding taxes, is recorded on the accrual basis. Dividend income, net of any applicable withholding taxes, is recognized on the ex-dividend date except that certain dividends from foreign securities, if any, are recognized as soon as the fund is informed of the ex-dividend date. Non-cash dividends, if any, are recorded at the fair market value of the securities received. Dividends representing a return of capital or capital gains, if any, are reflected as a reduction of cost and/or as a realized gain.
All premiums/discounts are amortized/accreted on a yield-to-maturity basis.
Foreign currency translation The accounting records of the fund are maintained in U.S. dollars. The market value of foreign securities, currency holdings, and other assets and liabilities is recorded in the books and records of the fund after translation to U.S. dollars based on the exchange rates on that day. The cost of each security is determined using historical exchange rates. Income and withholding taxes are translated at prevailing exchange rates when earned or incurred. The fund does not isolate that portion of realized or unrealized gains or losses resulting from changes in the foreign exchange rate on investments from fluctuations arising from changes in the market prices of the securities. Such gains and losses are included with the net realized and unrealized gain or loss on investments. Net realized gains and losses on foreign currency transactions represent net realized exchange gains or losses on closed forward currency contracts, disposition of foreign currencies, currency gains and losses realized between the trade and settlement dates on securities transactions and the difference between the amount of investment income and foreign withholding taxes recorded on the fund’s books and the U.S. dollar equivalent amounts actually received or paid. Net unrealized appreciation and depreciation of assets and liabilities in foreign currencies arise from changes in the value of open forward currency contracts and assets and liabilities other than investments at the period end, resulting from changes in the exchange rate.
Forward currency contracts The fund buys and sells forward currency contracts, which are agreements between two parties to buy and sell currencies at a set price on a future date. These contracts are used to hedge foreign exchange risk.
The U.S. dollar value of forward currency contracts is determined using current forward currency exchange rates supplied by a quotation service. The market value of the contract will fluctuate with changes in currency exchange rates. The contract is marked to market daily and the change in market value is recorded as an unrealized gain or loss. The fund records a realized gain or loss equal to the difference between the value of the contract at the time it was opened and the value at the time it was closed when the contract matures or by delivery of the currency. The
| Europe Equity Fund | 29 |
fund could be exposed to risk if the value of the currency changes unfavorably, if the counterparties to the contracts are unable to meet the terms of their contracts or if the fund is unable to enter into a closing position. Risks may exceed amounts recognized on the Statement of assets and liabilities.
Forward currency contracts outstanding at period end, if any, are listed after the fund’s portfolio. For the fund’s average contract amount, see Note 5.
Master agreements The fund is a party to ISDA (International Swaps and Derivatives Association, Inc.) Master Agreements (Master Agreements) with certain counterparties that govern over-the-counter derivative and foreign exchange contracts entered into from time to time. The Master Agreements may contain provisions regarding, among other things, the parties’ general obligations, representations, agreements, collateral requirements, events of default and early termination. With respect to certain counterparties, in accordance with the terms of the Master Agreements, collateral posted to the fund is held in a segregated account by the fund’s custodian and with respect to those amounts which can be sold or repledged, are presented in the fund’s portfolio.
Collateral pledged by the fund is segregated by the fund’s custodian and identified in the fund’s portfolio. Collateral can be in the form of cash or debt securities issued by the U.S. Government or related agencies or other securities as agreed to by the fund and the applicable counterparty. Collateral requirements are determined based on the fund’s net position with each counterparty.
Termination events applicable to the fund may occur upon a decline in the fund’s net assets below a specified threshold over a certain period of time. Termination events applicable to counterparties may occur upon a decline in the counterparty’s long-term and short-term credit ratings below a specified level. In each case, upon occurrence, the other party may elect to terminate early and cause settlement of all derivative and foreign exchange contracts outstanding, including the payment of any losses and costs resulting from such early termination, as reasonably determined by the terminating party. Any decision by one or more of the fund’s counterparties to elect early termination could impact the fund’s future derivative activity.
At the close of the reporting period, the fund did not have a net liability position on derivative contracts subject to the Master Agreements.
Securities lending The fund may lend securities, through its agent, to qualified borrowers in order to earn additional income. The loans are collateralized by cash in an amount at least equal to the market value of the securities loaned. The market value of securities loaned is determined daily and any additional required collateral is allocated to the fund on the next business day. The risk of borrower default will be borne by the fund’s agent; the fund will bear the risk of loss with respect to the investment of the cash collateral. Income from securities lending is included in investment income on the Statement of operations. Cash collateral is invested in Putnam Cash Collateral Pool, LLC, a limited liability company managed by an affiliate of Putnam Management. Investments in Putnam Cash Collateral Pool, LLC are valued at its closing net asset value each business day. There are no management fees charged to Putnam Cash Collateral Pool, LLC. At the close of the reporting period, the fund had no securities out on loan.
Interfund lending The fund, along with other Putnam funds, may participate in an interfund lending program pursuant to an exemptive order issued by the SEC. This program allows the fund to borrow from or lend to other Putnam funds that permit such transactions. Interfund lending transactions are subject to each fund’s investment policies and borrowing and lending limits. Interest earned or paid on the interfund lending transaction will be based on the average of certain current market rates. During the reporting period, the fund did not utilize the program.
Line of credit The fund participates, along with other Putnam funds, in a $315 million unsecured committed line of credit and a $185 million unsecured uncommitted line of credit, both provided by State Street. Borrowings may be made for temporary or emergency purposes, including the funding of shareholder redemption requests and trade settlements. Interest is charged to the fund based on the fund’s borrowing at a rate equal to the Federal Funds rate plus 1.25% for the committed line of credit and the Federal Funds rate plus 1.30% for the uncommitted line of credit. A closing fee equal to 0.02% of the committed line of credit and $50,000 for the uncommitted line of credit has been paid by the participating funds. In addition, a commitment fee of 0.11% per annum on any unutilized portion of the committed line of credit is allocated to the participating funds based on their relative net assets and paid quarterly. During the reporting period, the fund had no borrowings against these arrangements.
Federal taxes It is the policy of the fund to distribute all of its taxable income within the prescribed time period and otherwise comply with the provisions of the Internal Revenue Code of 1986, as amended (the Code), applicable to regulated investment companies. It is also the intention of the fund to distribute an amount sufficient to avoid imposition of any excise tax under Section 4982 of the Code.
| 30 | Europe Equity Fund |
The fund is subject to the provisions of Accounting Standards Codification ASC 740 Income Taxes (ASC 740). ASC 740 sets forth a minimum threshold for financial statement recognition of the benefit of a tax position taken or expected to be taken in a tax return. The fund did not have a liability to record for any unrecognized tax benefits in the accompanying financial statements. No provision has been made for federal taxes on income, capital gains or unrealized appreciation on securities held nor for excise tax on income and capital gains. Each of the fund’s federal tax returns for the prior three fiscal years remains subject to examination by the Internal Revenue Service.
The fund may also be subject to taxes imposed by governments of countries in which it invests. Such taxes are generally based on either income or gains earned or repatriated. The fund accrues and applies such taxes to net investment income, net realized gains and net unrealized gains as income and/or capital gains are earned. In some cases, the fund may be entitled to reclaim all or a portion of such taxes, and such reclaim amounts, if any, are reflected as an asset on the fund’s books. In many cases, however, the fund may not receive such amounts for an extended period of time, depending on the country of investment.
At June 30, 2012, the fund had a capital loss carryover of $96,345,126 available to the extent allowed by the Code to offset future net capital gain, if any. The amounts of the carryovers and the expiration dates are:
| Loss carryover | |||
| Short-term | Long-term | Total | Expiration |
| $3,647,473 | $— | $3,647,473 | * |
| 34,323,985 | N/A | 34,323,985 | June 30, 2017 |
| 58,373,668 | N/A | 58,373,668 | June 30, 2018 |
* Under the Regulated Investment Company Modernization Act of 2010, the fund will be permitted to carry forward capital losses incurred in taxable years beginning after December 22, 2010 for an unlimited period. However, any losses incurred will be required to be utilized prior to the losses incurred in pre-enactment tax years. As a result of this ordering rule, pre-enactment capital loss carryforwards may be more likely to expire unused. Additionally, post-enactment capital losses that are carried forward will retain their character as either short-term or long-term capital losses rather than being considered all short-term as under previous law.
Pursuant to federal income tax regulations applicable to regulated investment companies, the fund has elected to defer certain capital losses of $5,013,127 recognized during the period between November 1, 2011 and June 30, 2012 to its fiscal year ending June 30, 2013.
The aggregate identified cost on a tax basis is $129,695,529, resulting in gross unrealized appreciation and depreciation of $29,377,195 and $1,872,642, respectively, or net unrealized appreciation of $27,504,553.
Distributions to shareholders Distributions to shareholders from net investment income are recorded by the fund on the ex-dividend date. Distributions from capital gains, if any, are recorded on the ex-dividend date and paid at least annually. The amount and character of income and gains to be distributed are determined in accordance with income tax regulations, which may differ from generally accepted accounting principles. Dividend sources are estimated at the time of declaration. Actual results may vary. Any non-taxable return of capital cannot be determined until final tax calculations are completed after the end of the fund’s fiscal year. Reclassifications are made to the fund’s capital accounts to reflect income and gains available for distribution (or available capital loss carryovers) under income tax regulations.
Note 2: Management fee, administrative services and other transactions
The fund pays Putnam Management a management fee (base fee) (based on the fund’s average net assets and computed and paid monthly) at annual rates that may vary based on the average of the aggregate net assets of most open-end funds, as defined in the fund’s management contract, sponsored by Putnam Management. Such annual rates may vary as follows:
| 0.850% | of the first $5 billion, | 0.650% | of the next $50 billion, | |
| 0.800% | of the next $5 billion, | 0.630% | of the next $50 billion, | |
| 0.750% | of the next $10 billion, | 0.620% | of the next $100 billion and | |
| 0.700% | of the next $10 billion, | 0.615% | of any excess thereafter. | |
| Europe Equity Fund | 31 |
In addition, beginning with January 2011, the monthly management fee consists of the monthly base fee plus or minus a performance adjustment for the month. The performance adjustment is determined based on performance over the thirty-six month period then ended or, if shorter, the period from January 1, 2010 to the end of the month for which the fee adjustment is being computed. Each month, the performance adjustment is calculated by multiplying the performance adjustment rate and the fund’s average net assets over the performance period and the result is divided by twelve. The resulting dollar amount is added to, or subtracted from the base fee for that month. The performance adjustment rate is equal to 0.03 multiplied by the difference between the fund’s annualized performance (measured by the fund’s class A shares) and the annualized performance of the MSCI Europe Index (Net Dividends), each measured over the performance period. The maximum annualized performance adjustment rates are +/–0.15%. The monthly base fee is determined based on the fund’s average net assets for the month, while the performance adjustment is determined based on the fund’s average net assets over the performance period of up to thirty-six months. This means it is possible that, if the fund underperforms significantly over the performance period, and the fund’s assets have declined significantly over that period, the negative performance adjustment may exceed the base fee. In this event, Putnam Management would make a payment to the fund.
Because the performance adjustment is based on the fund’s performance relative to its applicable benchmark index, and not its absolute performance, the performance adjustment could increase Putnam Management’s fee even if the fund’s shares lose value during the performance period provided that the fund outperformed its benchmark index, and could decrease Putnam Management’s fee even if the fund’s shares increase in value during the performance period provided that the fund underperformed its benchmark index.
For the reporting period, the base fee represented an effective rate (excluding the impact from any expense waivers in effect) of 0.356% of the fund’s average net assets before an increase of $51,690 (0.034% of the fund’s average net assets) based on performance.
Putnam Management has contractually agreed, through June 30, 2013, to waive fees or reimburse the fund’s expenses to the extent necessary to limit the cumulative expenses of the fund, exclusive of brokerage, interest, taxes, investment-related expenses, extraordinary expenses, acquired fund fees and expenses and payments under the fund’s investor servicing contract, investment management contract and distribution plans, on a fiscal year-to-date basis to an annual rate of 0.20% of the fund’s average net assets over such fiscal year-to-date period. During the reporting period, the fund’s expenses were not reduced as a result of this limit.
Putnam Investments Limited (PIL), an affiliate of Putnam Management, is authorized by the Trustees to manage a separate portion of the assets of the fund as determined by Putnam Management from time to time. Putnam Management pays a quarterly sub-management fee to PIL for its services at an annual rate of 0.35% of the average net assets of the portion of the fund managed by PIL.
The Putnam Advisory Company, LLC (PAC), an affiliate of Putnam Management, is authorized by the Trustees to manage a separate portion of the assets of the fund, as designated from time to time by Putnam Management or PIL. Putnam Management or PIL, as applicable, pays a quarterly sub-advisory fee to PAC for its services at the annual rate of 0.35% of the average net assets of the portion of the fund’s assets for which PAC is engaged as sub-adviser.
The fund reimburses Putnam Management an allocated amount for the compensation and related expenses of certain officers of the fund and their staff who provide administrative services to the fund. The aggregate amount of all such reimbursements is determined annually by the Trustees.
Custodial functions for the fund’s assets are provided by State Street. Custody fees are based on the fund’s asset level, the number of its security holdings and transaction volumes.
Putnam Investor Services, Inc., an affiliate of Putnam Management, provides investor servicing agent functions to the fund. Putnam Investor Services, Inc. received fees for investor servicing based on the fund’s retail asset level, the number of shareholder accounts in the fund and the level of defined contribution plan assets in the fund. Investor servicing fees will not exceed an annual rate of 0.32% of the fund’s average net assets. Prior to March 1, 2012, investor servicing fees could not exceed an annual rate of 0.375% of the fund’s average net assets. During the reporting period, the class specific expenses related to investor servicing fees were as follows:
| Class A | $203,306 | Class R | 264 | |
| Class B | 4,738 | Class Y | 11,955 | |
| Class C | 2,429 | Total | $226,746 | |
| Class M | 4,054 | |||
| 32 | Europe Equity Fund |
The fund has entered into expense offset arrangements with Putnam Investor Services, Inc. and State Street whereby Putnam Investor Services, Inc.’s and State Street’s fees are reduced by credits allowed on cash balances. The fund also reduced expenses through brokerage/service arrangements. For the reporting period, the fund’s expenses were reduced by $262 under the expense offset arrangements.
Each independent Trustee of the fund receives an annual Trustee fee, of which $119, as a quarterly retainer, has been allocated to the fund, and an additional fee for each Trustees meeting attended. Trustees also are reimbursed for expenses they incur relating to their services as Trustees.
The fund has adopted a Trustee Fee Deferral Plan (the Deferral Plan) which allows the Trustees to defer the receipt of all or a portion of Trustees fees payable on or after July 1, 1995. The deferred fees remain invested in certain Putnam funds until distribution in accordance with the Deferral Plan.
The fund has adopted an unfunded noncontributory defined benefit pension plan (the Pension Plan) covering all Trustees of the fund who have served as a Trustee for at least five years and were first elected prior to 2004. Benefits under the Pension Plan are equal to 50% of the Trustee’s average annual attendance and retainer fees for the three years ended December 31, 2005. The retirement benefit is payable during a Trustee’s lifetime, beginning the year following retirement, for the number of years of service through December 31, 2006. Pension expense for the fund is included in Trustee compensation and expenses in the Statement of operations. Accrued pension liability is included in Payable for Trustee compensation and expenses in the Statement of assets and liabilities. The Trustees have terminated the Pension Plan with respect to any Trustee first elected after 2003.
The fund has adopted distribution plans (the Plans) with respect to its class A, class B, class C, class M and class R shares pursuant to Rule 12b–1 under the Investment Company Act of 1940. The purpose of the Plans is to compensate Putnam Retail Management Limited Partnership, an indirect wholly-owned subsidiary of Putnam Investments, LLC, for services provided and expenses incurred in distributing shares of the fund. The Plans provide for payments by the fund to Putnam Retail Management Limited Partnership at an annual rate of up to 0.35%, 1.00%, 1.00%, 1.00% and 1.00% of the average net assets attributable to class A, class B, class C, class M and class R shares, respectively. The Trustees have approved payment by the fund at an annual rate of 0.25%, 1.00%, 1.00%, 0.75% and 0.50% of the average net assets attributable to class A, class B, class C, class M and class R shares, respectively. During the reporting period, the class specific expenses related to distribution fees were as follows:
| Class A | $171,739 | Class M | 10,272 | |
| Class B | 16,009 | Class R | 448 | |
| Class C | 8,214 | Total | $206,682 | |
For the reporting period, Putnam Retail Management Limited Partnership, acting as underwriter, received net commissions of $2,539 and $11 from the sale of class A and class M shares, respectively, and received $1,388 and no monies in contingent deferred sales charges from redemptions of class B and class C shares, respectively.
A deferred sales charge of up to 1.00% and 0.65% is assessed on certain redemptions of class A and class M shares, respectively. For the reporting period, Putnam Retail Management Limited Partnership, acting as underwriter, received $20 and no monies on class A and class M redemptions, respectively.
Note 3: Purchases and sales of securities
During the reporting period, cost of purchases and proceeds from sales of investment securities other than short-term investments aggregated $37,008,560 and $50,977,007, respectively. There were no purchases or proceeds from sales of long-term U.S. government securities.
| Europe Equity Fund | 33 |
Note 4: Capital shares
At the close of the reporting period, there was an unlimited number of shares of beneficial interest authorized. Transactions in capital shares were as follows:
| Six months ended 12/31/12 | Year ended 6/30/12 | |||
| Class A | Shares | Amount | Shares | Amount |
| Shares sold | 82,354 | $1,597,669 | 739,742 | $13,711,894 |
| Shares issued in connection with | ||||
| reinvestment of distributions | 94,383 | 1,932,971 | 383,555 | 6,094,693 |
| 176,737 | 3,530,640 | 1,123,297 | 19,806,587 | |
| Shares repurchased | (797,063) | (15,373,889) | (1,901,285) | (34,011,138) |
| Net decrease | (620,326) | $(11,843,249) | (777,988) | $(14,204,551) |
| Six months ended 12/31/12 | Year ended 6/30/12 | |||
| Class B | Shares | Amount | Shares | Amount |
| Shares sold | 5,512 | $100,513 | 12,722 | $216,818 |
| Shares issued in connection with | ||||
| reinvestment of distributions | 1,236 | 24,325 | 9,719 | 148,406 |
| 6,748 | 124,838 | 22,441 | 365,224 | |
| Shares repurchased | (27,768) | (501,835) | (107,058) | (1,840,197) |
| Net decrease | (21,020) | $(376,997) | (84,617) | $(1,474,973) |
| Six months ended 12/31/12 | Year ended 6/30/12 | |||
| Class C | Shares | Amount | Shares | Amount |
| Shares sold | 3,350 | $63,757 | 3,837 | $65,794 |
| Shares issued in connection with | ||||
| reinvestment of distributions | 618 | 12,447 | 3,562 | 55,706 |
| 3,968 | 76,204 | 7,399 | 121,500 | |
| Shares repurchased | (4,671) | (90,207) | (24,954) | (439,458) |
| Net decrease | (703) | $(14,003) | (17,555) | $(317,958) |
| Six months ended 12/31/12 | Year ended 6/30/12 | |||
| Class M | Shares | Amount | Shares | Amount |
| Shares sold | 174 | $3,243 | 1,423 | $26,401 |
| Shares issued in connection with | ||||
| reinvestment of distributions | 976 | 19,824 | 5,482 | 86,389 |
| 1,150 | 23,067 | 6,905 | 112,790 | |
| Shares repurchased | (10,315) | (196,124) | (34,869) | (632,816) |
| Net decrease | (9,165) | $(173,057) | (27,964) | $(520,026) |
| Six months ended 12/31/12 | Year ended 6/30/12 | |||
| Class R | Shares | Amount | Shares | Amount |
| Shares sold | 1,049 | $19,607 | 3,317 | $59,511 |
| Shares issued in connection with | ||||
| reinvestment of distributions | 94 | 1,914 | 573 | 8,995 |
| 1,143 | 21,521 | 3,890 | 68,506 | |
| Shares repurchased | (2,697) | (50,116) | (4,477) | (81,078) |
| Net decrease | (1,554) | $(28,595) | (587) | $(12,572) |
| 34 | Europe Equity Fund |
| Six months ended 12/31/12 | Year ended 6/30/12 | |||
| Class Y | Shares | Amount | Shares | Amount |
| Shares sold | 25,414 | $483,134 | 39,189 | $715,000 |
| Shares issued in connection with | ||||
| reinvestment of distributions | 7,080 | 145,418 | 24,141 | 384,559 |
| 32,494 | 628,552 | 63,330 | 1,099,559 | |
| Shares repurchased | (39,505) | (747,640) | (96,843) | (1,759,480) |
| Net decrease | (7,011) | $(119,088) | (33,513) | $(659,921) |
Note 5: Summary of derivative activity
The average volume of activity for the reporting period for any derivative type that was held during the period is listed below and was as follows:
| Forwards (contract amount) | $9,200,000 |
The following is a summary of the market values of derivative instruments as of the close of the reporting period:
Market values of derivative instruments as of the close of the reporting period
| Asset derivatives | Liability derivatives | |||
| Derivatives not | ||||
| accounted for as | Statement of | Statement of | ||
| hedging instruments | assets and | assets and | ||
| under ASC 815 | liabilities location | Market value | liabilities location | Market value |
| Foreign exchange | ||||
| contracts | Receivables | $42,702 | Payables | $40,330 |
| Total | $42,702 | $40,330 | ||
The following is a summary of realized and change in unrealized gains or losses of derivative instruments on the Statement of operations for the reporting period (see Note 1):
Amount of realized gain or (loss) on derivatives recognized in net gain or (loss) on investments
| Derivatives not accounted for as hedging | Forward currency | |
| instruments under ASC 815 | contracts | Total |
| Foreign exchange contracts | $(31,670) | $(31,670) |
| Total | $(31,670) | $(31,670) |
Change in unrealized appreciation or (depreciation) on derivatives recognized in net gain or (loss) on investments
| Derivatives not accounted for as hedging | Forward currency | |
| instruments under ASC 815 | contracts | Total |
| Foreign exchange contracts | $5,294 | $5,294 |
| Total | $5,294 | $5,294 |
Note 6: Transactions with affiliated issuer
Transactions during the reporting period with Putnam Money Market Liquidity Fund, which is under common ownership and control, were as follows:
| Market value at | Market value | ||||
| the beginning | at the end of | ||||
| of the reporting | Investment | the reporting | |||
| Name of affiliate | period | Purchase cost | Sale proceeds | income | period |
| Putnam Money Market | |||||
| Liquidity Fund* | $3,703,055 | $15,495,453 | $17,242,771 | $1,422 | $1,955,737 |
* Management fees charged to Putnam Money Market Liquidity Fund have been waived by Putnam Management.
| Europe Equity Fund | 35 |
Note 7: Market, credit and other risks
In the normal course of business, the fund trades financial instruments and enters into financial transactions where risk of potential loss exists due to changes in the market (market risk) or failure of the contracting party to the transaction to perform (credit risk). The fund may be exposed to additional credit risk that an institution or other entity with which the fund has unsettled or open transactions will default. Investments in foreign securities involve certain risks, including those related to economic instability, unfavorable political developments, and currency fluctuations.
Note 8: Regulatory matters and litigation
In late 2003 and 2004, Putnam Management settled charges brought by the SEC and the Massachusetts Securities Division in connection with excessive short-term trading in Putnam funds. In July 2011, the fund recorded a receivable of $1,855,247 related to restitution amounts in connection with a distribution plan approved by the SEC. This amount, which was received by the fund in December 2011, is reported as part of Increase in capital from settlement payments on the Statement of changes in net assets. Putnam Management has agreed to bear any costs incurred by the Putnam funds as a result of this matter.
Note 9: New accounting pronouncement
In December 2011, the FASB issued ASU No. 2011–11 “Disclosures about Offsetting Assets and Liabilities”. The update creates new disclosure requirements requiring entities to disclose both gross and net information for derivatives and other financial instruments that are either offset in the Statement of assets and liabilities or subject to an enforceable master netting arrangement or similar agreement. The disclosure requirements are effective for annual reporting periods beginning on or after January 1, 2013 and interim periods within those annual periods. Putnam Management is currently evaluating the application of ASU 2011–11 and its impact, if any, on the fund’s financial statements.
| 36 | Europe Equity Fund |
Fund information
Founded 75 years ago, Putnam Investments was built around the concept that a balance between risk and reward is the hallmark of a well-rounded financial program. We manage over 100 funds across income, value, blend, growth, asset allocation, absolute return, and global sector categories.
| Investment Manager | Trustees | Robert R. Leveille |
| Putnam Investment | Jameson A. Baxter, Chair | Vice President and |
| Management, LLC | Liaquat Ahamed | Chief Compliance Officer |
| One Post Office Square | Ravi Akhoury | |
| Boston, MA 02109 | Barbara M. Baumann | Michael J. Higgins |
| Charles B. Curtis | Vice President and Treasurer | |
| Investment Sub-Manager | Robert J. Darretta | |
| Putnam Investments Limited | Katinka Domotorffy | Janet C. Smith |
| 57–59 St James’s Street | John A. Hill | Vice President, |
| London, England SW1A 1LD | Paul L. Joskow | Principal Accounting Officer, |
| Elizabeth T. Kennan | and Assistant Treasurer | |
| Investment Sub-Advisor | Kenneth R. Leibler | |
| The Putnam Advisory | Robert E. Patterson | Susan G. Malloy |
| Company, LLC | George Putnam, III | Vice President and |
| One Post Office Square | Robert L. Reynolds | Assistant Treasurer |
| Boston, MA 02109 | W. Thomas Stephens | |
| James P. Pappas | ||
| Marketing Services | Officers | Vice President |
| Putnam Retail Management | Robert L. Reynolds | |
| One Post Office Square | President | Mark C. Trenchard |
| Boston, MA 02109 | Vice President and | |
| Jonathan S. Horwitz | BSA Compliance Officer | |
| Custodian | Executive Vice President, | |
| State Street Bank | Principal Executive Officer, and | Judith Cohen |
| and Trust Company | Compliance Liaison | Vice President, Clerk, and |
| Associate Treasurer | ||
| Legal Counsel | Steven D. Krichmar | |
| Ropes & Gray LLP | Vice President and | Nancy E. Florek |
| Principal Financial Officer | Vice President, Proxy | |
| Manager, Assistant Clerk, and | ||
| Robert T. Burns | Associate Treasurer | |
| Vice President and | ||
| Chief Legal Officer |
This report is for the information of shareholders of Putnam Europe Equity Fund. It may also be used as sales literature when preceded or accompanied by the current prospectus, the most recent copy of Putnam’s Quarterly Performance Summary, and Putnam’s Quarterly Ranking Summary. For more recent performance, please visit putnam.com. Investors should carefully consider the investment objectives, risks, charges, and expenses of a fund, which are described in its prospectus. For this and other information or to request a prospectus or summary prospectus, call 1-800-225-1581 toll free. Please read the prospectus carefully before investing. The fund’s Statement of Additional Information contains additional information about the fund’s Trustees and is available without charge upon request by calling 1-800-225-1581.

| Item 2. Code of Ethics: |
| Not applicable |
| Item 3. Audit Committee Financial Expert: |
| Not applicable |
| Item 4. Principal Accountant Fees and Services: |
| Not applicable |
| Item 5. Audit Committee of Listed Registrants |
| Not applicable |
| Item 6. Schedule of Investments: |
| The registrant’s schedule of investments in unaffiliated issuers is included in the report to shareholders in Item 1 above. |
| Item 7. Disclosure of Proxy Voting Policies and Procedures For Closed-End Management Investment Companies: |
| Not applicable |
| Item 8. Portfolio Managers of Closed-End Investment Companies |
| Not Applicable |
| Item 9. Purchases of Equity Securities by Closed-End Management Investment Companies and Affiliated Purchasers: |
| Not applicable |
| Item 10. Submission of Matters to a Vote of Security Holders: |
| Not applicable |
| Item 11. Controls and Procedures: |
| (a) The registrant’s principal executive officer and principal financial officer have concluded, based on their evaluation of the effectiveness of the design and operation of the registrant’s disclosure controls and procedures as of a date within 90 days of the filing date of this report, that the design and operation of such procedures are generally effective to provide reasonable assurance that information required to be disclosed by the registrant in this report is recorded, processed, summarized and reported within the time periods specified in the Commission’s rules and forms. |
| (b) Changes in internal control over financial reporting: Not applicable |
| Item 12. Exhibits: |
| (a)(1) Not applicable |
| (a)(2) Separate certifications for the principal executive officer and principal financial officer of the registrant as required by Rule 30a-2(a) under the Investment Company Act of 1940, as amended, are filed herewith. |
| (b) The certifications required by Rule 30a-2(b) under the Investment Company Act of 1940, as amended, are filed herewith. |
| Putnam Europe Equity Fund |
| By (Signature and Title): |
| /s/Janet C. Smith Janet C. Smith Principal Accounting Officer |
| Date: February 28, 2013 |
| Pursuant to the requirements of the Securities Exchange Act of 1934 and the Investment Company Act of 1940, this report has been signed below by the following persons on behalf of the registrant and in the capacities and on the dates indicated. |
| By (Signature and Title): |
| /s/Jonathan S. Horwitz Jonathan S. Horwitz Principal Executive Officer |
| Date: February 28, 2013 |
| By (Signature and Title): |
| /s/Steven D. Krichmar Steven D. Krichmar Principal Financial Officer |
| Date: February 28, 2013 |