| UNITED STATES SECURITIES AND EXCHANGE COMMISSION | ||
| Washington, D.C. 20549 | ||
FORM N-CSR | ||
| CERTIFIED SHAREHOLDER REPORT OF REGISTERED MANAGEMENT INVESTMENT COMPANIES | ||
| Investment Company Act file number: | (811-05693) |
| Exact name of registrant as specified in charter: | Putnam Europe Equity Fund |
| Address of principal executive offices: | One Post Office Square, Boston, Massachusetts 02109 |
| Name and address of agent for service: | Robert T. Burns, Vice President One Post Office Square Boston, Massachusetts 02109 |
| Copy to: | Bryan Chegwidden, Esq. Ropes & Gray LLP 1211 Avenue of the Americas New York, New York 10036 |
| Registrant’s telephone number, including area code: | (617) 292-1000 |
| Date of fiscal year end: | June 30, 2015 |
| Date of reporting period: | July 1, 2014 – December 31, 2014 |
Item 1. Report to Stockholders: |
| The following is a copy of the report transmitted to stockholders pursuant to Rule 30e-1 under the Investment Company Act of 1940: | |||
Putnam
Europe Equity
Fund
Semiannual report
12 | 31 | 14
Message from the Trustees | 1 |
About the fund | 2 |
Performance snapshot | 4 |
Interview with your fund’s portfolio manager | 5 |
Your fund’s performance | 10 |
Your fund’s expenses | 12 |
Terms and definitions | 14 |
Other information for shareholders | 15 |
Financial statements | 16 |
Consider these risks before investing: International investing involves currency, economic, and political risks. Emerging-market securities carry illiquidity and volatility risks. Investments in small and/or midsize companies increase the risk of greater price fluctuations. Investments in a single region may be affected by common economic forces and other factors. In addition, events in any one country within the region may impact the other countries or the region as a whole. Growth stocks may be more susceptible to earnings disappointments, and value stocks may fail to rebound. Risks associated with derivatives include increased investment exposure (which may be considered leverage) and, in the case of over-the-counter instruments, the potential inability to terminate or sell derivatives positions and the potential failure of the other party to the instrument to meet its obligations. Stock prices may fall or fail to rise over time for several reasons, including general financial market conditions and factors related to a specific issuer or industry. You can lose money by investing in the fund.
Message from the Trustees
Dear Fellow Shareholder:
The falling price of oil has captured headlines in recent months and is having a sustained effect on markets and economies worldwide. Cheaper oil allows many consumers and businesses to shift spending to other priorities. At the same time, the decline reflects greater pessimism about global growth, and it is having a negative impact on the energy sector — not just in the United States, but wherever energy is a key export.
This change in the investing environment has contributed to an increase in market volatility. Although the U.S. economy continues to grow, economic challenges in Europe, China, and Japan are causing uncertainty.
Compared with recent years, we may see more tempered returns from equity and fixed-income markets. While a number of positive trends continue, including an improving housing market and a brighter employment situation, investors should also be alert to a possible increase in short-term interest rates that is widely expected to occur in 2015. History suggests that rising rates could generate headwinds for markets.
In all types of market conditions, Putnam offers a wide range of flexible strategies. Our experienced investment teams employ new ways of thinking about building portfolios for both the opportunities and risks in today’s markets. In this dynamic environment, it may be an opportune time for you to meet with your financial advisor to ensure that your portfolio is properly aligned with your goals and tolerance for risk.
As always, thank you for investing with Putnam.
Respectfully yours,

Robert L. Reynolds
President and Chief Executive Officer
Putnam Investments

Jameson A. Baxter
Chair, Board of Trustees
February 6, 2015


Performance
snapshot
Annualized total return (%) comparison as of 12/31/14
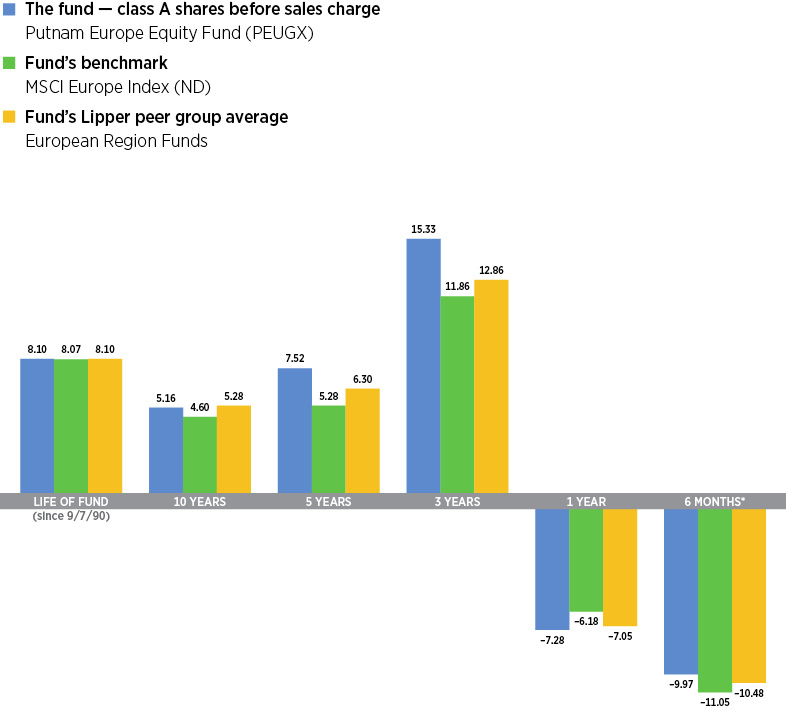
Current performance may be lower or higher than the quoted past performance, which cannot guarantee future results. Share price, principal value, and return will fluctuate, and you may have a gain or a loss when you sell your shares. Performance of class A shares assumes reinvestment of distributions and does not account for taxes. Fund returns in the bar chart do not reflect a sales charge of 5.75%; had they, returns would have been lower. See pages 5 and 10–11 for additional performance information. For a portion of the periods, the fund had expense limitations, without which returns would have been lower. To obtain the most recent month-end performance, visit putnam.com.
*Returns for the six-month period are not annualized, but cumulative.
4 Europe Equity Fund
Interview with your fund’s portfolio manager
|
Simon [Sam] Davis |

European markets struggled in the second half of 2014 while U.S. stocks generally made healthy gains. What drove this divergence?
While U.S. markets made gains on the strength of a relatively solid economic recovery, European markets declined in the face of more troubling macroeconomic conditions. This was the case for much of the period.
In general, Europe continued to struggle with its debt crisis. Deleveraging in both public and private sectors has resulted in increased reliance on central bank stimulus as the solution to the region’s financial troubles, and this stimulus has so far been less abundant than elsewhere. In addition, an economic slowdown in China and other emerging markets generated a fair amount of uncertainty for emerging-market companies as well as European exporters.
Geopolitically, a number of negative surprises inhibited European equity performance through year-end. Continued aggression by Russian president Vladimir Putin in Crimea and eastern Ukraine, and the escalation of tensions between Russia and the West, were challenges. Rising tensions in the Middle East also shook confidence across a number of non-U.S. regions, and appeared to bolster the case for safety in the minds of many investors.

Broad market index and fund performance
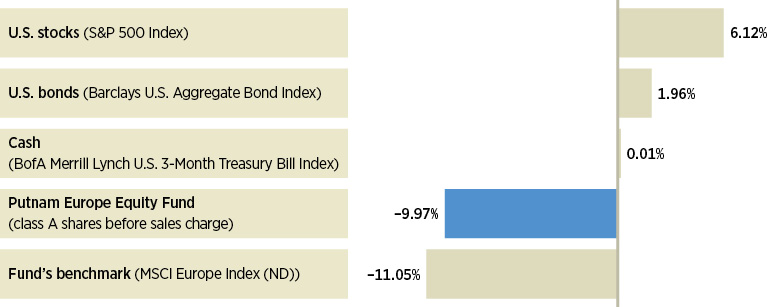
This comparison shows your fund’s performance in the context of broad market indexes for the six months ended 12/31/14. See pages 4 and 10–11 for additional fund performance information. Index descriptions can be found on page 14.
Europe Equity Fund 5
Did European leaders take any new steps to deal with the region’s debt problems during the period?
The European Central Bank [ECB] initiated an asset-quality review of European financial institutions; while this may build confidence in the financials sector over time, it proved to be a drag on the sector’s performance in the final months of the period. With a focus on their financial health, European banks arguably suppressed their lending activity, holding back the region’s economic recovery. Although policymakers have been doing what they can to aid the financial infrastructure and to stimulate inflation — which, at levels around 2%, can indicate a healthy economy — a number of European countries were in or very close to outright deflation as the year came to a close.
What do you see as some of the bright spots in European equity markets?
Across Europe, we think structural change is leading to increasingly compelling opportunities for investors. Consolidation among French telecoms, for example, has curtailed what had long been fierce industry competition and has greatly enhanced the return potential of a smaller number of key players. Similarly, Irish banking has undergone a process of consolidation that we believe enhances the return potential of a smaller group of lending institutions, particularly those who are positioned to benefit from improvements in the domestic commercial real estate market.
Which stocks or strategies helped relative performance?
The French cable company Numericable took over the number-two mobile
Country composition
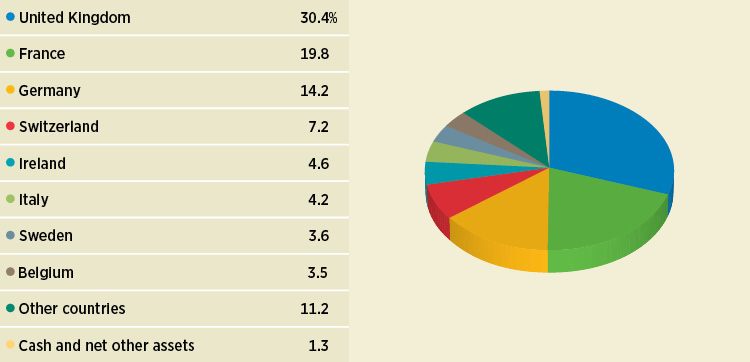
Allocations are shown as a percentage of the fund’s net assets as of 12/31/14. Cash and net other assets, if any, represent the market value weights of cash, derivatives, short-term securities, and other unclassified assets in the portfolio. Summary information may differ from the information in the portfolio schedule notes included in the financial statements due to the inclusion of derivative securities, any interest accruals, and the exclusion of as-of trades, if any. Holdings and allocations may vary over time.
6 Europe Equity Fund
“We believe that increased monetary
stimulus, weaker currencies, lower
oil prices, and the completion of the
asset quality review in Europe should
all become tailwinds for non-U.S.
stock performance.”
Sam Davis
telecommunications player in France, SFR, during the period, which helped drive Numericable’s stock appreciation. Numericable is a participant in the ongoing consolidation of the French telecom industry, and we believe the company is in a good position to benefit from more rationally priced mobile and data-delivery services. In addition, we see opportunities for the company to bundle telecommunication services for its customers and expand its market share, even as it has been realizing cost-cutting potential through a simplification of its business model.
International Consolidated Airlines Group (IAG), the parent of British Airways and Iberian Airlines, was also a strong contributor to relative performance. Airlines benefited from lower oil prices during the period, and IAG was no exception. The stock also appreciated on the perception that IAG will be able to maintain increased profit margins, particularly through restructuring of labor practices and reduction of labor costs at Iberian.
Another strong contributor was in the health-care sector — Shire PLC, which performed well for the fund throughout the period. The stock price received a boost when the company became the target of a takeover bid by the biopharmaceutical company AbbVie, after which we sold the stock. When the bid later collapsed and Shire’s stock price fell, we purchased the stock again and maintained the position at period-end. We like the company for a number of reasons, but particularly because we think the company’s

This table shows the fund’s top 10 holdings by percentage of the fund’s net assets as of 12/31/14. Short-term holdings and derivatives, if any, are excluded. Holdings may vary over time.
Europe Equity Fund 7
size makes it easy for it to grow organically and through strategic product and company acquisitions.
Which stocks or strategies hindered relative performance?
Between June and December, the price of a barrel of oil fell by approximately 50%. This substantial change led to lower energy prices around the globe — providing a boost to consumers — but it also negatively affected energy-related companies. Accordingly, the portfolio’s overweight or out-of-benchmark positions in the stocks of a number of companies, including Royal Dutch Shell (which we sold by period-end), Genel Energy, and BG Group, all detracted from relative returns.
Another detractor from returns was our decision to avoid the stock of the Swiss pharmaceutical company, Novartis. We felt satisfied with the portfolio’s exposure to other stocks in this industry — notably Shire, a strong performer for the fund during the period — but Novartis, a benchmark component, performed well, which was a drag on relative results.
Also, as I stated earlier, stocks in the financial sector faced what we believe is a temporary headwind in the ECB’s asset-quality review of financial institutions. In general, we think this sector may perform better in the months ahead, and we maintained conviction in the portfolio’s positions at period-end.
What is your outlook for international equity investing in 2015?
From here, while risks remain, we see an improved relative outlook for international markets. We believe that increased monetary stimulus, weaker currencies, lower
Comparison of top sector shifts
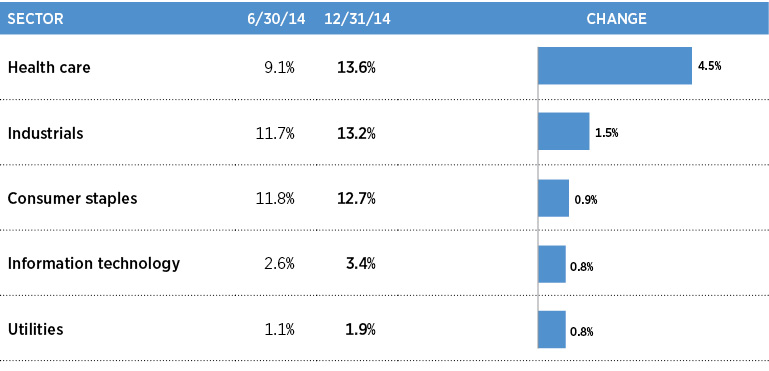
This chart shows the fund’s largest allocation shifts, by percentage, over the past six months. Allocations are shown as a percentage of the fund’s net assets. Current period summary information may differ from the portfolio schedule included in the financial statements due to the inclusion of derivative securities, any interest accruals, the exclusion of as-of trades, if any, and the use of different classifications of securities for presentation purposes. Holdings and allocations may vary over time.
8 Europe Equity Fund
oil prices, and the completion of the asset-quality review in Europe should all become tailwinds for non-U.S. stock performance. In addition, we believe continued strength in the United States and potentially increased fiscal stimulus in various regions may help lift the global economy and propel a market rebound.
Thank you, Sam, for this update on the fund.
The views expressed in this report are exclusively those of Putnam Management and are subject to change. They are not meant as investment advice.
Please note that the holdings discussed in this report may not have been held by the fund for the entire period. Portfolio composition is subject to review in accordance with the fund’s investment strategy and may vary in the future. Current and future portfolio holdings are subject to risk.
Portfolio Manager Simon Davis is Co-Head of International Equities at Putnam. He has a B.A. from Oxford University. Simon joined Putnam in 2000 and has been in the investment industry since 1988.
IN THE NEWS
Citing deteriorating economic conditions in the eurozone and emerging markets, the World Bank recently reduced its outlook for global economic growth. The Washington-based institution expects the global growth rate to rise moderately, by 3.0% in 2015, below its earlier forecast of 3.4%. World Bank economists see plummeting oil prices, down more than 50% since June 2014, as having a mixed effect around the world. For the United States, the drop in oil prices has boosted consumer spending. As such, the bank increased its U.S. growth estimate by 0.2%, to 3.2%. Meanwhile, the bank’s economists noted that the oil price plunge was failing to generate growth in Europe and Japan, while moving major oil-exporting countries toward recession.
Europe Equity Fund 9
Your fund’s performance |
This section shows your fund’s performance, price, and distribution information for periods ended December 31, 2014, the end of the first half of its current fiscal year. In accordance with regulatory requirements for mutual funds, we also include expense information taken from the fund’s current prospectus. Performance should always be considered in light of a fund’s investment strategy. Data represent past performance. Past performance does not guarantee future results. More recent returns may be less or more than those shown. Investment return and principal value will fluctuate, and you may have a gain or a loss when you sell your shares. Performance information does not reflect any deduction for taxes a shareholder may owe on fund distributions or on the redemption of fund shares. For the most recent month-end performance, please visit the Individual Investors section at putnam.com or call Putnam at 1-800-225-1581. Class R and Y shares are not available to all investors. See the Terms and Definitions section in this report for definitions of the share classes offered by your fund. |
Fund performance Total return for periods ended 12/31/14
Class A | Class B | Class C | Class M | Class R | Class Y | |||||
(inception dates) | (9/7/90) | (2/1/94) | (7/26/99) | (12/1/94) | (12/1/03) | (10/4/05) | ||||
Before sales charge | After sales charge | Before CDSC | After CDSC | Before CDSC | After CDSC | Before sales charge | After sales charge | Net | Net | |
Annual average | ||||||||||
(life of fund) | 8.10% | 7.84% | 7.83% | 7.83% | 7.30% | 7.30% | 7.59% | 7.43% | 7.85% | 8.21% |
10 years | 65.38 | 55.87 | 55.74 | 55.74 | 53.55 | 53.55 | 57.36 | 51.86 | 61.80 | 69.30 |
Annual average | 5.16 | 4.54 | 4.53 | 4.53 | 4.38 | 4.38 | 4.64 | 4.27 | 4.93 | 5.41 |
5 years | 43.69 | 35.43 | 38.40 | 36.40 | 38.36 | 38.36 | 40.17 | 35.26 | 41.86 | 45.48 |
Annual average | 7.52 | 6.25 | 6.72 | 6.41 | 6.71 | 6.71 | 6.99 | 6.23 | 7.24 | 7.79 |
3 years | 53.40 | 44.58 | 49.98 | 46.98 | 49.98 | 49.98 | 51.15 | 45.86 | 52.26 | 54.57 |
Annual average | 15.33 | 13.08 | 14.47 | 13.70 | 14.47 | 14.47 | 14.76 | 13.41 | 15.04 | 15.62 |
1 year | –7.28 | –12.61 | –7.97 | –12.54 | –7.96 | –8.87 | –7.72 | –10.95 | –7.52 | –7.02 |
6 months | –9.97 | –15.14 | –10.31 | –14.76 | –10.29 | –11.18 | –10.15 | –13.30 | –10.07 | –9.84 |
Current performance may be lower or higher than the quoted past performance, which cannot guarantee future results. After-sales-charge returns for class A and M shares reflect the deduction of the maximum 5.75% and 3.50% sales charge, respectively, levied at the time of purchase. Class B share returns after contingent deferred sales charge (CDSC) reflect the applicable CDSC, which is 5% in the first year, declining over time to 1% in the sixth year, and is eliminated thereafter. Class C share returns after CDSC reflect a 1% CDSC for the first year that is eliminated thereafter. Class R and Y shares have no initial sales charge or CDSC. Performance for class B, C, M, R, and Y shares before their inception is derived from the historical performance of class A shares, adjusted for the applicable sales charge (or CDSC) and the higher operating expenses for such shares, except for class Y shares, for which 12b-1 fees are not applicable.
Recent performance may have benefited from one or more legal settlements.
For a portion of the periods, the fund had expense limitations, without which returns would have been lower.
Class B share performance reflects conversion to class A shares after eight years.
10 Europe Equity Fund
Comparative index returns For periods ended 12/31/14
MSCI Europe Index (ND) | Lipper European Region Funds category average* | |
Annual average (life of fund) | 8.07% | 8.10% |
10 years | 56.78 | 71.27 |
Annual average | 4.60 | 5.28 |
5 years | 29.32 | 36.89 |
Annual average | 5.28 | 6.30 |
3 years | 39.96 | 44.16 |
Annual average | 11.86 | 12.86 |
1 year | –6.18 | –7.05 |
6 months | –11.05 | –10.48 |
Index and Lipper results should be compared with fund performance before sales charge, before CDSC, or at net asset value.
*Over the 6-month, 1-year, 3-year, 5-year, 10-year, and life-of-fund periods ended 12/31/14, there were 137, 121, 94, 85, 70, and 8 funds, respectively, in this Lipper category.
Fund price and distribution information For the six-month period ended 12/31/14
Distributions | Class A | Class B | Class C | Class M | Class R | Class Y | ||
Number | 1 | 1 | 1 | 1 | 1 | 1 | ||
Income | $0.355 | $0.182 | $0.180 | $0.214 | $0.295 | $0.418 | ||
Capital gains | — | — | — | — | — | — | ||
Total | $0.355 | $0.182 | $0.180 | $0.214 | $0.295 | $0.418 | ||
Share value | Before | After | Net asset | Net asset | Before | After | Net asset | Net asset |
6/30/14 | $27.57 | $29.25 | $26.37 | $26.83 | $27.26 | $28.25 | $27.19 | $27.70 |
12/31/14 | 24.47 | 25.96 | 23.47 | 23.89 | 24.28 | 25.16 | 24.16 | 24.56 |
The classification of distributions, if any, is an estimate. Before-sales-charge share value and current dividend rate for class A and M shares, if applicable, do not take into account any sales charge levied at the time of purchase. After-sales-charge share value, current dividend rate, and current 30-day SEC yield, if applicable, are calculated assuming that the maximum sales charge (5.75% for class A shares and 3.50% for class M shares) was levied at the time of purchase. Final distribution information will appear on your year-end tax forms.
Europe Equity Fund 11
Your fund’s expenses |
As a mutual fund investor, you pay ongoing expenses, such as management fees, distribution fees (12b-1 fees), and other expenses. Using the following information, you can estimate how these expenses affect your investment and compare them with the expenses of other funds. You may also pay one-time transaction expenses, including sales charges (loads) and redemption fees, which are not shown in this section and would have resulted in higher total expenses. For more information, see your fund’s prospectus or talk to your financial representative. |
Expense ratios
Class A | Class B | Class C | Class M | Class R | Class Y | |
Total annual operating expenses for the fiscal year ended 6/30/14 | 1.41% | 2.16% | 2.16% | 1.91% | 1.66% | 1.16% |
Annualized expense ratio for the six-month period ended 12/31/14* | 1.29% | 2.04% | 2.04% | 1.79% | 1.54% | 1.04% |
Fiscal-year expense information in this table is taken from the most recent prospectus, is subject to change, and may differ from that shown for the annualized expense ratio and in the financial highlights of this report.
Expenses are shown as a percentage of average net assets.
*Includes an increase of 0.06% from annualizing the performance fee adjustment for the six months ended 12/31/14.
Expenses per $1,000
The following table shows the expenses you would have paid on a $1,000 investment in the fund from July 1, 2014, to December 31, 2014. It also shows how much a $1,000 investment would be worth at the close of the period, assuming actual returns and expenses.
Class A | Class B | Class C | Class M | Class R | Class Y | |
Expenses paid per $1,000*† | $6.18 | $9.75 | $9.75 | $8.57 | $7.37 | $4.98 |
Ending value (after expenses) | $900.30 | $896.90 | $897.10 | $898.50 | $899.30 | $901.60 |
*Expenses for each share class are calculated using the fund’s annualized expense ratio for each class, which represents the ongoing expenses as a percentage of average net assets for the six months ended 12/31/14. The expense ratio may differ for each share class.
†Expenses are calculated by multiplying the expense ratio by the average account value for the period; then multiplying the result by the number of days in the period; and then dividing that result by the number of days in the year.
12 Europe Equity Fund
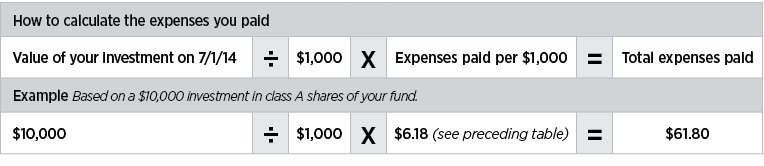
Estimate the expenses you paid |
To estimate the ongoing expenses you paid for the six months ended December 31, 2014, use the following calculation method. To find the value of your investment on July 1, 2014, call Putnam at 1-800-225-1581. |
|
Compare expenses using the SEC’s method
The Securities and Exchange Commission (SEC) has established guidelines to help investors assess fund expenses. Per these guidelines, the following table shows your fund’s expenses based on a $1,000 investment, assuming a hypothetical 5% annualized return. You can use this information to compare the ongoing expenses (but not transaction expenses or total costs) of investing in the fund with those of other funds. All mutual fund shareholder reports will provide this information to help you make this comparison. Please note that you cannot use this information to estimate your actual ending account balance and expenses paid during the period.
Class A | Class B | Class C | Class M | Class R | Class Y | |
Expenses paid per $1,000*† | $6.56 | $10.36 | $10.36 | $9.10 | $7.83 | $5.30 |
Ending value (after expenses) | $1,018.70 | $1,014.92 | $1,014.92 | $1,016.18 | $1,017.44 | $1,019.96 |
*Expenses for each share class are calculated using the fund’s annualized expense ratio for each class, which represents the ongoing expenses as a percentage of average net assets for the six months ended 12/31/14. The expense ratio may differ for each share class.
†Expenses are calculated by multiplying the expense ratio by the average account value for the six-month period; then multiplying the result by the number of days in the six-month period; and then dividing that result by the number of days in the year.
Europe Equity Fund 13
Terms and definitions
Important terms
Total return shows how the value of the fund’s shares changed over time, assuming you held the shares through the entire period and reinvested all distributions in the fund.
Before sales charge, or net asset value, is the price, or value, of one share of a mutual fund, without a sales charge. Before-sales-charge figures fluctuate with market conditions, and are calculated by dividing the net assets of each class of shares by the number of outstanding shares in the class.
After sales charge is the price of a mutual fund share plus the maximum sales charge levied at the time of purchase. After-sales-charge performance figures shown here assume the 5.75% maximum sales charge for class A shares and 3.50% for class M shares.
Contingent deferred sales charge (CDSC) is generally a charge applied at the time of the redemption of class B or C shares and assumes redemption at the end of the period. Your fund’s class B CDSC declines over time from a 5% maximum during the first year to 1% during the sixth year. After the sixth year, the CDSC no longer applies. The CDSC for class C shares is 1% for one year after purchase.
Share classes
Class A shares are generally subject to an initial sales charge and no CDSC (except on certain redemptions of shares bought without an initial sales charge).
Class B shares are not subject to an initial sales charge and may be subject to a CDSC.
Class C shares are not subject to an initial sales charge and are subject to a CDSC only if the shares are redeemed during the first year.
Class M shares have a lower initial sales charge and a higher 12b-1 fee than class A shares and no CDSC (except on certain redemptions of shares bought without an initial sales charge).
Class R shares are not subject to an initial sales charge or CDSC and are available only to certain employer-sponsored retirement plans.
Class Y shares are not subject to an initial sales charge or CDSC, and carry no 12b-1 fee. They are generally only available to corporate and institutional clients and clients in other approved programs.
Comparative indexes
Barclays U.S. Aggregate Bond Index is an unmanaged index of U.S. investment-grade fixed-income securities.
BofA Merrill Lynch U.S. 3-Month Treasury Bill Index is an unmanaged index that seeks to measure the performance of U.S. Treasury bills available in the marketplace.
MSCI Europe Index (ND) is an unmanaged index of Western European equity securities.
S&P 500 Index is an unmanaged index of common stock performance.
Indexes assume reinvestment of all distributions and do not account for fees. Securities and performance of a fund and an index will differ. You cannot invest directly in an index.
Lipper is a third-party industry-ranking entity that ranks mutual funds. Its rankings do not reflect sales charges. Lipper rankings are based on total return at net asset value relative to other funds that have similar current investment styles or objectives as determined by Lipper. Lipper may change a fund’s category assignment at its discretion. Lipper category averages reflect performance trends for funds within a category.
14 Europe Equity Fund
Other information for shareholders
Important notice regarding delivery of shareholder documents
In accordance with Securities and Exchange Commission (SEC) regulations, Putnam sends a single copy of annual and semiannual shareholder reports, prospectuses, and proxy statements to Putnam shareholders who share the same address, unless a shareholder requests otherwise. If you prefer to receive your own copy of these documents, please call Putnam at 1-800-225-1581, and Putnam will begin sending individual copies within 30 days.
Proxy voting
Putnam is committed to managing our mutual funds in the best interests of our shareholders. The Putnam funds’ proxy voting guidelines and procedures, as well as information regarding how your fund voted proxies relating to portfolio securities during the 12-month period ended June 30, 2014, are available in the Individual Investors section of putnam.com, and on the SEC’s website, www.sec.gov. If you have questions about finding forms on the SEC’s website, you may call the SEC at 1-800-SEC-0330. You may also obtain the Putnam funds’ proxy voting guidelines and procedures at no charge by calling Putnam’s Shareholder Services at 1-800-225-1581.
Fund portfolio holdings
The fund will file a complete schedule of its portfolio holdings with the SEC for the first and third quarters of each fiscal year on Form N-Q. Shareholders may obtain the fund’s Form N-Q on the SEC’s website at www.sec.gov. In addition, the fund’s Form N-Q may be reviewed and copied at the SEC’s Public Reference Room in Washington, D.C. You may call the SEC at 1-800-SEC-0330 for information about the SEC’s website or the operation of the Public Reference Room.
Trustee and employee fund ownership
Putnam employees and members of the Board of Trustees place their faith, confidence, and, most importantly, investment dollars in Putnam mutual funds. As of December 31, 2014, Putnam employees had approximately $483,000,000 and the Trustees had approximately $140,000,000 invested in Putnam mutual funds. These amounts include investments by the Trustees’ and employees’ immediate family members as well as investments through retirement and deferred compensation plans.
Europe Equity Fund 15
Financial statements
A guide to financial statements
These sections of the report, as well as the accompanying Notes, constitute the fund’s financial statements.
The fund’s portfolio lists all the fund’s investments and their values as of the last day of the reporting period. Holdings are organized by asset type and industry sector, country, or state to show areas of concentration and diversification.
Statement of assets and liabilities shows how the fund’s net assets and share price are determined. All investment and non-investment assets are added together. Any unpaid expenses and other liabilities are subtracted from this total. The result is divided by the number of shares to determine the net asset value per share, which is calculated separately for each class of shares. (For funds with preferred shares, the amount subtracted from total assets includes the liquidation preference of preferred shares.)
Statement of operations shows the fund’s net investment gain or loss. This is done by first adding up all the fund’s earnings — from dividends and interest income — and subtracting its operating expenses to determine net investment income (or loss). Then, any net gain or loss the fund realized on the sales of its holdings — as well as any unrealized gains or losses over the period — is added to or subtracted from the net investment result to determine the fund’s net gain or loss for the fiscal period.
Statement of changes in net assets shows how the fund’s net assets were affected by the fund’s net investment gain or loss, by distributions to shareholders, and by changes in the number of the fund’s shares. It lists distributions and their sources (net investment income or realized capital gains) over the current reporting period and the most recent fiscal year-end. The distributions listed here may not match the sources listed in the Statement of operations because the distributions are determined on a tax basis and may be paid in a different period from the one in which they were earned. Dividend sources are estimated at the time of declaration. Actual results may vary. Any non-taxable return of capital cannot be determined until final tax calculations are completed after the end of the fund’s fiscal year.
Financial highlights provide an overview of the fund’s investment results, per-share distributions, expense ratios, net investment income ratios, and portfolio turnover in one summary table, reflecting the five most recent reporting periods. In a semiannual report, the highlights table also includes the current reporting period.
16 Europe Equity Fund
The fund’s portfolio 12/31/14 (Unaudited)
COMMON STOCKS (99.1%)* | Shares | Value | |
Australia (1.2%) | |||
BHP Billiton PLC | 148,094 | $3,167,703 | |
3,167,703 | |||
Austria (1.0%) | |||
voestalpine AG | 67,964 | 2,679,188 | |
2,679,188 | |||
Belgium (3.5%) | |||
Anheuser-Busch InBev NV | 84,875 | 9,551,299 | |
9,551,299 | |||
France (19.9%) | |||
Air Liquide SA | 30,876 | 3,809,746 | |
Airbus Group NV | 71,923 | 3,572,215 | |
Alcatel-Lucent † | 778,009 | 2,762,069 | |
BNP Paribas SA | 108,696 | 6,387,443 | |
Eurazeo SA | 37,182 | 2,597,226 | |
Faurecia | 82,779 | 3,078,372 | |
Gaztransport Et Technigaz SA | 40,052 | 2,365,418 | |
Natixis SA | 630,086 | 4,143,339 | |
Numericable-SFR † | 94,639 | 4,666,676 | |
Sanofi | 77,449 | 7,058,386 | |
Total SA | 158,213 | 8,157,340 | |
Veolia Environnement SA | 292,693 | 5,197,799 | |
53,796,029 | |||
Germany (14.2%) | |||
Bayer AG | 47,250 | 6,459,520 | |
Biotest AG-Vorzugsaktien (Preference) | 20,573 | 2,332,650 | |
Deutsche Post AG | 189,301 | 6,193,671 | |
HeidelbergCement AG | 30,184 | 2,147,238 | |
Henkel AG & Co. KGaA (Preference) | 54,173 | 5,860,140 | |
Siemens AG | 63,018 | 7,146,885 | |
TUI AG † S | 224,369 | 3,605,425 | |
Wacker Chemie AG | 19,609 | 2,151,038 | |
Zalando SE † | 71,559 | 2,198,711 | |
Zalando SE (acquired 9/30/13, cost $313,871) (Private) † ΔΔ F | 13,090 | 363,518 | |
38,458,796 | |||
Ireland (4.6%) | |||
Bank of Ireland † | 7,406,452 | 2,761,507 | |
Hibernia REIT PLC † R | 1,879,507 | 2,461,220 | |
Kerry Group PLC Class A | 61,851 | 4,267,478 | |
Smurfit Kappa Group PLC | 132,858 | 2,983,392 | |
12,473,597 | |||
Italy (4.2%) | |||
Beni Stabili SpA R | 3,112,355 | 2,185,708 | |
Luxottica Group SpA | 63,324 | 3,466,840 | |
Telecom Italia SpA RSP | 3,686,931 | 3,081,666 | |
Unione di Banche Italiane ScpA | 369,527 | 2,630,429 | |
11,364,643 | |||
Netherlands (3.4%) | |||
Akzo Nobel NV | 38,133 | 2,644,320 | |
ING Groep NV GDR † | 501,642 | 6,495,065 | |
9,139,385 |
Europe Equity Fund 17
COMMON STOCKS (99.1%)* cont. | Shares | Value | |
Norway (1.4%) | |||
DNB ASA | 252,436 | $3,722,010 | |
3,722,010 | |||
Spain (3.4%) | |||
Atresmedia Corporacion de Medios de Comunicacion SA S | 198,755 | 2,795,488 | |
Banco de Sabadell SA | 829,625 | 2,173,405 | |
International Consolidated Airlines Group SA † | 551,167 | 4,118,969 | |
9,087,862 | |||
Sweden (3.6%) | |||
Assa Abloy AB Class B | 86,261 | 4,558,626 | |
Com Hem Holding AB † | 310,712 | 2,494,926 | |
Intrum Justita AB | 95,143 | 2,814,249 | |
9,867,801 | |||
Switzerland (7.2%) | |||
Barry Callebaut AG | 2,437 | 2,495,912 | |
Nestle SA | 61,536 | 4,510,684 | |
Partners Group Holding AG | 9,983 | 2,895,145 | |
Roche Holding AG-Genusschein | 35,809 | 9,705,688 | |
19,607,429 | |||
United Kingdom (30.5%) | |||
Admiral Group PLC | 104,517 | 2,140,367 | |
Associated British Foods PLC | 95,417 | 4,635,898 | |
AstraZeneca PLC | 113,592 | 7,990,704 | |
BAE Systems PLC | 256,184 | 1,870,151 | |
BG Group PLC | 245,932 | 3,273,535 | |
Britvic PLC | 293,457 | 3,057,967 | |
Compass Group PLC | 264,336 | 4,505,430 | |
Experian PLC | 168,577 | 2,843,510 | |
Fiat Chrysler Automobiles NV † | 211,264 | 2,424,349 | |
Genel Energy PLC † | 206,730 | 2,212,830 | |
HSBC Holdings PLC | 149,157 | 1,409,606 | |
Kingfisher PLC | 666,662 | 3,513,049 | |
Liberty Global PLC Ser. C | 53,000 | 2,560,430 | |
Metro Bank PLC (acquired 1/15/14, cost $611,361) (Private) † ΔΔ F | 28,721 | 595,928 | |
Persimmon PLC | 160,200 | 3,918,802 | |
Prudential PLC | 319,655 | 7,355,951 | |
Regus PLC S | 864,110 | 2,783,185 | |
Shire PLC | 48,411 | 3,425,236 | |
St James’s Place PLC | 199,480 | 2,506,917 | |
Telecity Group PLC | 313,859 | 3,933,005 | |
Thomas Cook Group PLC † | 1,247,690 | 2,456,495 | |
TSB Banking Group PLC † S | 615,165 | 2,659,330 | |
Vodafone Group PLC | 1,504,340 | 5,154,563 | |
WPP PLC | 257,504 | 5,342,228 | |
82,569,466 | |||
United States (1.0%) | |||
Google, Inc. Class C † | 5,014 | 2,639,370 | |
2,639,370 | |||
Total common stocks (cost $262,749,143) |
| ||
18 Europe Equity Fund
SHORT-TERM INVESTMENTS (4.9%)* | Shares | Value | |
Putnam Cash Collateral Pool, LLC 0.20% d | 9,057,728 | $9,057,728 | |
Putnam Short Term Investment Fund 0.10% L | 4,163,218 | 4,163,218 | |
Total short-term investments (cost $13,220,946) |
| ||
TOTAL INVESTMENTS | ||
Total investments (cost $275,970,089) | $281,345,524 |
| ||
GDR | Global Depository Receipts: represents ownership of foreign securities on deposit with a custodian bank | |
Notes to the fund’s portfolio | ||
Unless noted otherwise, the notes to the fund’s portfolio are for the close of the fund’s reporting period, which ran from July 1, 2014 through December 31, 2014 (the reporting period). Within the following notes to the portfolio, references to “ASC 820” represent Accounting Standards Codification 820 Fair Value Measurements and Disclosures and references to “OTC”, if any, represent over-the-counter. | ||
* | Percentages indicated are based on net assets of $270,693,605. | |
† | Non-income-producing security. | |
ΔΔ | Security is restricted with regard to public resale. The total fair value of this security and any other restricted securities (excluding 144A securities), if any, held at the close of the reporting period was $959,446, or 0.4% of net assets. | |
d | Affiliated company. See Note 1 to the financial statements regarding securities lending. The rate quoted in the security description is the annualized 7-day yield of the fund at the close of the reporting period. | |
F | Security is valued at fair value following procedures approved by the Trustees. Securities may be classified as Level 2 or Level 3 for ASC 820 based on the securities’ valuation inputs. At the close of the reporting period, fair value pricing was also used for certain foreign securities in the portfolio (Note 1). | |
L | Affiliated company (Note 1). The rate quoted in the security description is the annualized 7-day yield of the fund at the close of the reporting period. | |
R | Real Estate Investment Trust. | |
S | Security on loan, in part or in entirety, at the close of the reporting period (Note 1). | |
The fund had the following sector concentrations greater than 10% at the close of the reporting period (as a percentage of net assets): | ||
Financials | 20.4% | |
Consumer discretionary | 16.6 | |
Health care | 13.7 | |
Industrials | 13.3 | |
Consumer staples | 12.7 |
Europe Equity Fund 19
ASC 820 establishes a three-level hierarchy for disclosure of fair value measurements. The valuation hierarchy is based upon the transparency of inputs to the valuation of the fund’s investments. The three levels are defined as follows: | |
Level 1: Valuations based on quoted prices for identical securities in active markets. | |
Level 2: Valuations based on quoted prices in markets that are not active or for which all significant inputs are observable, either directly or indirectly. | |
Level 3: Valuations based on inputs that are unobservable and significant to the fair value measurement. | |
The following is a summary of the inputs used to value the fund’s net assets as of the close of the reporting period: |
Valuation inputs | ||||
Investments in securities: | Level 1 | Level 2 | Level 3 | |
Common stocks: | ||||
Australia | $— | $3,167,703 | $— | |
Austria | — | 2,679,188 | — | |
Belgium | — | 9,551,299 | — | |
France | — | 53,796,029 | — | |
Germany | 3,605,425 | 34,489,853 | 363,518 | |
Ireland | — | 12,473,597 | — | |
Italy | — | 11,364,643 | — | |
Netherlands | — | 9,139,385 | — | |
Norway | — | 3,722,010 | — | |
Spain | — | 9,087,862 | — | |
Sweden | — | 9,867,801 | — | |
Switzerland | — | 19,607,429 | — | |
United Kingdom | 2,560,430 | 79,413,108 | 595,928 | |
United States | 2,639,370 | — | — | |
Total common stocks | 8,805,225 | 258,359,907 | 959,446 | |
Short-term investments | 4,163,218 | 9,057,728 | — | |
Totals by level | $12,968,443 | $267,417,635 | $959,446 | |
During the reporting period, transfers within the fair value hierarchy, if any, (other than certain transfers involving non-U.S. equity securities as described in Note 1) did not represent, in the aggregate, more than 1% of the fund’s net assets measured as of the end of the period. | ||||
At the start and close of the reporting period, Level 3 investments in securities represented less than 1% of the fund’s net assets and were not considered a significant portion of the fund’s portfolio. | ||||
The accompanying notes are an integral part of these financial statements.
20 Europe Equity Fund
Statement of assets and liabilities 12/31/14 (Unaudited) | ||
ASSETS | ||
Investment in securities, at value, including $8,539,185 of securities on loan (Note 1): | ||
Unaffiliated issuers (identified cost $262,749,143) | $268,124,578 | |
Affiliated issuers (identified cost $13,220,946) (Notes 1 and 5) | 13,220,946 | |
Foreign currency (cost $151,162) (Note 1) | 151,162 | |
Foreign tax reclaim | 110,052 | |
Dividends, interest and other receivables | 294,711 | |
Receivable for shares of the fund sold | 212,344 | |
Prepaid assets | 56,892 | |
Total assets | 282,170,685 | |
LIABILITIES | ||
Payable for shares of the fund repurchased | 1,772,850 | |
Payable for compensation of Manager (Note 2) | 183,720 | |
Payable for custodian fees (Note 2) | 8,687 | |
Payable for investor servicing fees (Note 2) | 46,023 | |
Payable for Trustee compensation and expenses (Note 2) | 183,190 | |
Payable for administrative services (Note 2) | 1,836 | |
Payable for distribution fees (Note 2) | 152,523 | |
Collateral on securities loaned, at value (Note 1) | 9,057,728 | |
Other accrued expenses | 70,523 | |
Total liabilities | 11,477,080 | |
Net assets | $270,693,605 | |
REPRESENTED BY | ||
Paid-in capital (Unlimited shares authorized) (Notes 1 and 4) | $324,573,891 | |
Distributions in excess of net investment income (Note 1) | (1,944,990) | |
Accumulated net realized loss on investments and foreign currency transactions (Note 1) | (57,299,467) | |
Net unrealized appreciation of investments and assets and liabilities in foreign currencies | 5,364,171 | |
Total — Representing net assets applicable to capital shares outstanding | $270,693,605 | |
COMPUTATION OF NET ASSET VALUE AND OFFERING PRICE | ||
Net asset value and redemption price per class A share ($199,606,265 divided by 8,155,833 shares) | $24.47 | |
Offering price per class A share (100/94.25 of $24.47)* | $25.96 | |
Net asset value and offering price per class B share ($3,924,919 divided by 167,204 shares)** | $23.47 | |
Net asset value and offering price per class C share ($16,601,610 divided by 694,888 shares)** | $23.89 | |
Net asset value and redemption price per class M share ($2,841,003 divided by 117,030 shares) | $24.28 | |
Offering price per class M share (100/96.50 of $24.28)* | $25.16 | |
Net asset value, offering price and redemption price per class R share ($479,525 divided by 19,845 shares) | $24.16 | |
Net asset value, offering price and redemption price per class Y share ($47,240,283 divided by 1,923,589 shares) | $24.56 | |
* | On single retail sales of less than $50,000. On sales of $50,000 or more the offering price is reduced. | |
** | Redemption price per share is equal to net asset value less any applicable contingent deferred sales charge. | |
The accompanying notes are an integral part of these financial statements.
Europe Equity Fund 21
Statement of operations Six months ended 12/31/14 (Unaudited) | ||
INVESTMENT INCOME | ||
Dividends (net of foreign tax of $139,687) | $2,222,227 | |
Interest (including interest income of $1,366 from investments in affiliated issuers) (Note 5) | 1,366 | |
Securities lending (Note 1) | 67,880 | |
Total investment income | 2,291,473 | |
EXPENSES | ||
Compensation of Manager (Note 2) | 1,125,187 | |
Investor servicing fees (Note 2) | 296,488 | |
Custodian fees (Note 2) | 16,247 | |
Trustee compensation and expenses (Note 2) | 2,101 | |
Distribution fees (Note 2) | 393,769 | |
Administrative services (Note 2) | 4,281 | |
Other | 111,217 | |
Total expenses | 1,949,290 | |
Expense reduction (Note 2) | (429) | |
Net expenses | 1,948,861 | |
Net investment income | 342,612 | |
Net realized gain on investments (Notes 1 and 3) | 2,082,946 | |
Net realized loss on foreign currency transactions (Note 1) | (13,300) | |
Net unrealized depreciation of assets and liabilities in foreign currencies during the period | (27,329) | |
Net unrealized depreciation of investments during the period | (35,054,582) | |
Net loss on investments | (33,012,265) | |
Net decrease in net assets resulting from operations | $(32,669,653) |
The accompanying notes are an integral part of these financial statements.
22 Europe Equity Fund
Statement of changes in net assets | |||
INCREASE (DECREASE) IN NET ASSETS | Six months ended 12/31/14* | Year ended 6/30/14 | |
Operations: | |||
Net investment income | $342,612 | $2,971,570 | |
Net realized gain on investments and foreign currency transactions | 2,069,646 | 23,928,416 | |
Net unrealized appreciation (depreciation) of investments and assets and liabilities in foreign currencies | (35,081,911) | 22,339,604 | |
Net increase (decrease) in net assets resulting from operations | (32,669,653) | 49,239,590 | |
Distributions to shareholders (Note 1): | |||
From ordinary income | |||
Net investment income | |||
Class A | (2,956,768) | (1,479,046) | |
Class B | (30,141) | (6,573) | |
Class C | (126,130) | (81,048) | |
Class M | (24,954) | (11,855) | |
Class R | (5,727) | (2,492) | |
Class Y | (820,877) | (271,466) | |
Increase in capital from settlement payments | — | 56,290 | |
Increase (decrease) from capital share transactions (Note 4) | (6,630,523) | 105,090,212 | |
Total increase (decrease) in net assets | (43,264,773) | 152,533,612 | |
NET ASSETS | |||
Beginning of period | 313,958,378 | 161,424,766 | |
End of period (including distributions in excess of net investment income of $1,944,990 and undistributed net investment income of $1,676,995, respectively) | $270,693,605 | $313,958,378 | |
* | Unaudited. | ||
The accompanying notes are an integral part of these financial statements.
Europe Equity Fund 23
Financial highlights (For a common share outstanding throughout the period)
INVESTMENT OPERATIONS: | LESS DISTRIBUTIONS: | RATIOS AND SUPPLEMENTAL DATA: | |||||||||||||
Period ended | Net asset value, beginning of period | Net investment income (loss)a | Net realized and unrealized gain (loss) on investments | Total from investment operations | From | From | Total | Redemption | Non-recurring reimbursements | Net asset value, end of period | Total return at net asset value (%)b | Net assets, end of period (in thousands) | Ratio of expenses to average net assets (%)c | Ratio of net investment income (loss) to average net assets (%) | Portfolio turnover (%) |
Class A | |||||||||||||||
December 31, 2014** | $27.57 | .03 | (2.77) | (2.74) | (.36) | — | (.36) | — | — | $24.47 | (9.97) * | $199,606 | .65* | .12* | 31* |
June 30, 2014 | 21.73 | .31 | 5.74 | 6.05 | (.22) | — | (.22) | — | .01e | 27.57 | 27.93 | 226,016 | 1.41 | 1.20 | 64 |
June 30, 2013 | 17.45 | .29 | 4.30 | 4.59 | (.31) | — | (.31) | —d | — | 21.73 | 26.39 | 143,122 | 1.48 | 1.43 | 66 |
June 30, 2012 | 21.50 | .32 | (3.94) | (3.62) | (.84) | (.03) | (.87) | .01 | .43 f,g,h | 17.45 | (14.38)f,h | 130,428 | 1.47 | 1.78 | 62 |
June 30, 2011 | 15.83 | .31 | 5.72 | 6.03 | (.37) | — | (.37) | —d | .01i,j | 21.50 | 38.36 | 177,369 | 1.43 | 1.54 | 70 |
June 30, 2010 | 15.12 | .23 | .49 | .72 | (.09) | — | (.09) | —d | .08k | 15.83 | 5.20 | 151,329 | 1.52l | 1.25l | 113 |
Class B | |||||||||||||||
December 31, 2014** | $26.37 | (.06) | (2.66) | (2.72) | (.18) | — | (.18) | — | — | $23.47 | (10.31) * | $3,925 | 1.03* | (.26) * | 31* |
June 30, 2014 | 20.80 | .09 | 5.52 | 5.61 | (.05) | — | (.05) | — | .01e | 26.37 | 27.01 | 4,358 | 2.16 | .38 | 64 |
June 30, 2013 | 16.72 | .12 | 4.11 | 4.23 | (.15) | — | (.15) | —d | — | 20.80 | 25.36 | 2,907 | 2.23 | .60 | 66 |
June 30, 2012 | 20.55 | .16 | (3.72) | (3.56) | (.66) | (.03) | (.69) | .01 | .41 f,g,h | 16.72 | (14.98)f,h | 3,126 | 2.22 | .92 | 62 |
June 30, 2011 | 15.12 | .12 | 5.49 | 5.61 | (.19) | — | (.19) | —d | .01i,j | 20.55 | 37.29 | 5,580 | 2.18 | .65 | 70 |
June 30, 2010 | 14.48 | .06 | .50 | .56 | — | — | — | —d | .08k | 15.12 | 4.42 | 6,671 | 2.27l | .37l | 113 |
Class C | |||||||||||||||
December 31, 2014** | $26.83 | (.06) | (2.70) | (2.76) | (.18) | — | (.18) | — | — | $23.89 | (10.29) * | $16,602 | 1.03* | (.25) * | 31* |
June 30, 2014 | 21.28 | .22 | 5.50 | 5.72 | (.18) | — | (.18) | — | .01e | 26.83 | 27.00 | 19,165 | 2.16 | .85 | 64 |
June 30, 2013 | 17.11 | .18 | 4.16 | 4.34 | (.17) | — | (.17) | —d | — | 21.28 | 25.41 | 2,679 | 2.23 | .90 | 66 |
June 30, 2012 | 21.05 | .18 | (3.84) | (3.66) | (.68) | (.03) | (.71) | .01 | .42 f,g,h | 17.11 | (15.01)f,h | 1,502 | 2.22 | 1.01 | 62 |
June 30, 2011 | 15.50 | .15 | 5.60 | 5.75 | (.21) | — | (.21) | —d | .01i,j | 21.05 | 37.32 | 2,217 | 2.18 | .80 | 70 |
June 30, 2010 | 14.84 | .09 | .49 | .58 | — | — | — | —d | .08k | 15.50 | 4.45 | 1,859 | 2.27l | .48l | 113 |
Class M | |||||||||||||||
December 31, 2014** | $27.26 | (.03) | (2.74) | (2.77) | (.21) | — | (.21) | — | — | $24.28 | (10.15) * | $2,841 | .90* | (.13) * | 31* |
June 30, 2014 | 21.49 | .15 | 5.70 | 5.85 | (.09) | — | (.09) | — | .01e | 27.26 | 27.32 | 3,294 | 1.91 | .59 | 64 |
June 30, 2013 | 17.27 | .18 | 4.25 | 4.43 | (.21) | — | (.21) | —d | — | 21.49 | 25.71 | 2,795 | 1.98 | .92 | 66 |
June 30, 2012 | 21.26 | .22 | (3.87) | (3.65) | (.74) | (.03) | (.77) | .01 | .42 f,g,h | 17.27 | (14.80)f,h | 2,565 | 1.97 | 1.24 | 62 |
June 30, 2011 | 15.65 | .21 | 5.66 | 5.87 | (.27) | — | (.27) | —d | .01i,j | 21.26 | 37.72 | 3,751 | 1.93 | 1.06 | 70 |
June 30, 2010 | 14.96 | .13 | .49 | .62 | (.01) | — | (.01) | —d | .08k | 15.65 | 4.64 | 3,250 | 2.02l | .75l | 113 |
Class R | |||||||||||||||
December 31, 2014** | $27.19 | —d | (2.73) | (2.73) | (.30) | — | (.30) | — | — | $24.16 | (10.07) * | $480 | .78* | —*m | 31* |
June 30, 2014 | 21.46 | .32 | 5.59 | 5.91 | (.19) | — | (.19) | — | .01e | 27.19 | 27.64 | 546 | 1.66 | 1.22 | 64 |
June 30, 2013 | 17.23 | .25 | 4.22 | 4.47 | (.24) | — | (.24) | —d | — | 21.46 | 26.02 | 206 | 1.73 | 1.27 | 66 |
June 30, 2012 | 21.25 | .27 | (3.89) | (3.62) | (.81) | (.03) | (.84) | .01 | .43 f,g,h | 17.23 | (14.60)f,h | 168 | 1.72 | 1.51 | 62 |
June 30, 2011 | 15.66 | .29 | 5.62 | 5.91 | (.33) | — | (.33) | —d | .01i,j | 21.25 | 38.00 | 219 | 1.68 | 1.49 | 70 |
June 30, 2010 | 14.97 | .21 | .46 | .67 | (.06) | — | (.06) | —d | .08k | 15.66 | 4.97 | 133 | 1.77l | 1.20l | 113 |
Class Y | |||||||||||||||
December 31, 2014** | $27.70 | .06 | (2.78) | (2.72) | (.42) | — | (.42) | — | — | $24.56 | (9.84) * | $47,240 | .52* | .25* | 31* |
June 30, 2014 | 21.82 | .53 | 5.61 | 6.14 | (.27) | — | (.27) | — | .01e | 27.70 | 28.28 | 60,579 | 1.16 | 1.96 | 64 |
June 30, 2013 | 17.53 | .36 | 4.29 | 4.65 | (.36) | — | (.36) | —d | — | 21.82 | 26.63 | 9,714 | 1.23 | 1.77 | 66 |
June 30, 2012 | 21.60 | .37 | (3.95) | (3.58) | (.90) | (.03) | (.93) | .01 | .43 f,g,h | 17.53 | (14.13)f,h | 7,484 | 1.22 | 2.04 | 62 |
June 30, 2011 | 15.90 | .37 | 5.74 | 6.11 | (.42) | — | (.42) | —d | .01i,j | 21.60 | 38.73 | 9,947 | 1.18 | 1.84 | 70 |
June 30, 2010 | 15.19 | .27 | .49 | .76 | (.13) | — | (.13) | —d | .08k | 15.90 | 5.41 | 8,356 | 1.27l | 1.52l | 113 |
See notes to financial highlights at the end of this section.
The accompanying notes are an integral part of these financial statements.
24 | Europe Equity Fund | Europe Equity Fund | 25 |
Financial highlights (Continued)
* Not annualized.
** Unaudited.
a Per share net investment income (loss) has been determined on the basis of the weighted average number of shares outstanding during the period.
b Total return assumes dividend reinvestment and does not reflect the effect of sales charges.
c Includes amounts paid through expense offset and brokerage/service arrangements, if any (Note 2). Also excludes acquired fund fees and expenses, if any.
d Amount represents less than $0.01 per share.
e Reflects a non-recurring reimbursement pursuant to a settlement between the Securities and Exchange Commission (the SEC) and Morgan Stanley & Co. which amounted to $0.01 per share outstanding on November 27, 2013.
f Reflects a non-recurring reimbursement pursuant to a settlement between the SEC and Bank of America which amounted to the following amounts per share outstanding on December 15, 2011:
Per share | |
Class A | $0.15 |
Class B | 0.14 |
Class C | 0.15 |
Class M | 0.15 |
Class R | 0.15 |
Class Y | 0.15 |
This payment resulted in an increase to total returns of 0.73% for the period ended June 30, 2012.
g Reflects a non-recurring reimbursement pursuant to a settlement between the SEC and Canadian Imperial Holdings, Inc. and CIBC World Markets Corp. which amounted to the following amounts per share outstanding on November 29, 2011:
Per share | |
Class A | $0.08 |
Class B | 0.07 |
Class C | 0.08 |
Class M | 0.08 |
Class R | 0.08 |
Class Y | 0.08 |
h Reflects a non-recurring reimbursement related to restitution amounts in connection with a distribution plan approved by the SEC, which amounted to the following amounts per share outstanding on July 21, 2011:
Per share | |
Class A | $0.20 |
Class B | 0.19 |
Class C | 0.20 |
Class M | 0.20 |
Class R | 0.20 |
Class Y | 0.20 |
This payment resulted in an increase to total returns of 0.98% for the period ended June 30, 2012.
The accompanying notes are an integral part of these financial statements.
26 Europe Equity Fund
Financial highlights (Continued)
i Reflects a non-recurring reimbursement related to short-term trading related lawsuits, which amounted to $0.01 per share outstanding on May 11, 2011.
j Reflects a non-recurring reimbursement pursuant to a settlement between the SEC and Zurich Capital Markets, Inc., which amounted to less than $0.01 per share outstanding on December 21, 2010.
k Reflects a non-recurring reimbursement pursuant to a settlement between the SEC and Prudential Securities, Inc., which amounted to $0.08 per share outstanding as of March 30, 2010.
l Reflects an involuntary contractual expense limitation in effect during the period. As a result of such limitation, the expenses of each class reflect a reduction of 0.02% of average net assets as of June 30, 2010.
m Amount represents less than 0.01%.
The accompanying notes are an integral part of these financial statements.
Europe Equity Fund 27
Notes to financial statements 12/31/14 (Unaudited)
Within the following Notes to financial statements, references to “State Street” represent State Street Bank and Trust Company, references to “the SEC” represent the Securities and Exchange Commission, references to “Putnam Management” represent Putnam Investment Management, LLC, the fund’s manager, an indirect wholly-owned subsidiary of Putnam Investments, LLC and references to “OTC”, if any, represent over-the-counter. Unless otherwise noted, the “reporting period” represents the period from July 1, 2014 through December 31, 2014.
Putnam Europe Equity Fund (the fund) is a Massachusetts business trust, which is registered under the Investment Company Act of 1940, as amended, as a diversified open-end management investment company. The goal of the fund is to seek capital appreciation by investing mainly in common stocks (growth or value stocks or both) of large and midsize European companies that Putnam Management believes have favorable investment potential. For example, we may purchase stocks of companies with stock prices that reflect a value lower than that which we place on the company. Putnam Management also considers other factors that it believes will cause the stock price to rise. The fund invests mainly in developed countries, but may invest in emerging markets, such as those in Eastern Europe.
The fund offers class A, class B, class C, class M, class R and class Y shares. Class A and class M shares are sold with a maximum front-end sales charge of 5.75% and 3.50%, respectively, and generally do not pay a contingent deferred sales charge. Class B shares, which convert to class A shares after approximately eight years, do not pay a front-end sales charge and are subject to a contingent deferred sales charge if those shares are redeemed within six years of purchase. Class C shares have a one-year 1.00% contingent deferred sales charge and do not convert to class A shares. Class R shares, which are not available to all investors, are sold at net asset value. The expenses for class A, class B, class C, class M and class R shares may differ based on the distribution fee of each class, which is identified in Note 2. Class Y shares, which are sold at net asset value, are generally subject to the same expenses as class A, class B, class C, class M and class R shares, but do not bear a distribution fee. Class Y shares are not available to all investors.
In the normal course of business, the fund enters into contracts that may include agreements to indemnify another party under given circumstances. The fund’s maximum exposure under these arrangements is unknown as this would involve future claims that may be, but have not yet been, made against the fund. However, the fund’s management team expects the risk of material loss to be remote.
Note 1: Significant accounting policies
The following is a summary of significant accounting policies consistently followed by the fund in the preparation of its financial statements. The preparation of financial statements is in conformity with accounting principles generally accepted in the United States of America and requires management to make estimates and assumptions that affect the reported amounts of assets and liabilities in the financial statements and the reported amounts of increases and decreases in net assets from operations. Actual results could differ from those estimates. Subsequent events after the Statement of assets and liabilities date through the date that the financial statements were issued have been evaluated in the preparation of the financial statements.
Investment income, realized and unrealized gains and losses and expenses of the fund are borne pro-rata based on the relative net assets of each class to the total net assets of the fund, except that each class bears expenses unique to that class (including the distribution fees applicable to such classes). Each class votes as a class only with respect to its own distribution plan or other matters on which a class vote is required by law or determined by the Trustees. If the fund were liquidated, shares of each class would receive their pro-rata share of the net assets of the fund. In addition, the Trustees declare separate dividends on each class of shares.
Security valuation Portfolio securities and other investments are valued using policies and procedures adopted by the Board of Trustees. The Trustees have formed a Pricing Committee to oversee the implementation of these procedures and has delegated responsibility for valuing the fund’s assets in accordance with these procedures to Putnam Management. Putnam Management has established an internal Valuation Committee that is responsible for making fair value determinations, evaluating the effectiveness of the pricing policies of the fund and reporting to the Pricing Committee.
Investments for which market quotations are readily available are valued at the last reported sales price on their principal exchange, or official closing price for certain markets, and are classified as Level 1 securities under Accounting Standards Codification 820 Fair Value Measurements and Disclosures (ASC 820). If no sales are reported, as in the case of some securities that are traded OTC, a security is valued at its last reported bid price and is generally categorized as a Level 2 security.
28 Europe Equity Fund
Investments in open-end investment companies (excluding exchange traded funds), if any, which can be classified as Level 1 or Level 2 securities, are valued based on their net asset value. The net asset value of such investment companies equals the total value of their assets less their liabilities and divided by the number of their outstanding shares.
Many securities markets and exchanges outside the U.S. close prior to the close of the New York Stock Exchange and therefore the closing prices for securities in such markets or on such exchanges may not fully reflect events that occur after such close but before the close of the New York Stock Exchange. Accordingly, on certain days, the fund will fair value foreign equity securities taking into account multiple factors including movements in the U.S. securities markets, currency valuations and comparisons to the valuation of American Depository Receipts, exchange-traded funds and futures contracts. These securities, which would generally be classified as Level 1 securities, will be transferred to Level 2 of the fair value hierarchy when they are valued at fair value. The number of days on which fair value prices will be used will depend on market activity and it is possible that fair value prices will be used by the fund to a significant extent. At the close of the reporting period, fair value pricing was used for certain foreign securities in the portfolio. Securities quoted in foreign currencies, if any, are translated into U.S. dollars at the current exchange rate. Short-term securities with remaining maturities of 60 days or less may be valued at amortized cost, which approximates fair value and are classified as Level 2 securities.
To the extent a pricing service or dealer is unable to value a security or provides a valuation that Putnam Management does not believe accurately reflects the security’s fair value, the security will be valued at fair value by Putnam Management in accordance with policies and procedures approved by the Trustees. Certain investments, including certain restricted and illiquid securities and derivatives, are also valued at fair value following procedures approved by the Trustees. These valuations consider such factors as significant market or specific security events such as interest rate or credit quality changes, various relationships with other securities, discount rates, U.S. Treasury, U.S. swap and credit yields, index levels, convexity exposures, recovery rates, sales and other multiples and resale restrictions. These securities are classified as Level 2 or as Level 3 depending on the priority of the significant inputs.
To assess the continuing appropriateness of fair valuations, the Valuation Committee reviews and affirms the reasonableness of such valuations on a regular basis after considering all relevant information that is reasonably available. Such valuations and procedures are reviewed periodically by the Trustees. The fair value of securities is generally determined as the amount that the fund could reasonably expect to realize from an orderly disposition of such securities over a reasonable period of time. By its nature, a fair value price is a good faith estimate of the value of a security in a current sale and does not reflect an actual market price, which may be different by a material amount.
Security transactions and related investment income Security transactions are recorded on the trade date (the date the order to buy or sell is executed). Gains or losses on securities sold are determined on the identified cost basis.
Interest income, net of any applicable withholding taxes, is recorded on the accrual basis. Dividend income, net of any applicable withholding taxes, is recognized on the ex-dividend date except that certain dividends from foreign securities, if any, are recognized as soon as the fund is informed of the ex-dividend date. Non-cash dividends, if any, are recorded at the fair value of the securities received. Dividends representing a return of capital or capital gains, if any, are reflected as a reduction of cost and/or as a realized gain.
Foreign currency translation The accounting records of the fund are maintained in U.S. dollars. The fair value of foreign securities, currency holdings, and other assets and liabilities is recorded in the books and records of the fund after translation to U.S. dollars based on the exchange rates on that day. The cost of each security is determined using historical exchange rates. Income and withholding taxes are translated at prevailing exchange rates when earned or incurred. The fund does not isolate that portion of realized or unrealized gains or losses resulting from changes in the foreign exchange rate on investments from fluctuations arising from changes in the market prices of the securities. Such gains and losses are included with the net realized and unrealized gain or loss on investments. Net realized gains and losses on foreign currency transactions represent net realized exchange gains or losses on closed forward currency contracts, disposition of foreign currencies, currency gains and losses realized between the trade and settlement dates on securities transactions and the difference between the amount of investment income and foreign withholding taxes recorded on the fund’s books and the U.S. dollar equivalent amounts actually received or paid. Net unrealized appreciation and depreciation of assets and liabilities in foreign currencies arise from changes in the value of open forward currency contracts and assets and liabilities other than investments at the period end, resulting from changes in the exchange rate.
Securities lending The fund may lend securities, through its agent, to qualified borrowers in order to earn additional income. The loans are collateralized by cash in an amount at least equal to the fair value of the securities loaned. The
Europe Equity Fund 29
fair value of securities loaned is determined daily and any additional required collateral is allocated to the fund on the next business day. The risk of borrower default will be borne by the fund’s agent; the fund will bear the risk of loss with respect to the investment of the cash collateral. Income from securities lending is included in investment income on the Statement of operations. Cash collateral is invested in Putnam Cash Collateral Pool, LLC, a limited liability company managed by an affiliate of Putnam Management. Investments in Putnam Cash Collateral Pool, LLC are valued at its closing net asset value each business day. There are no management fees charged to Putnam Cash Collateral Pool, LLC. At the close of the reporting period, the fund received cash collateral of $9,057,728 and the value of securities loaned amounted to $8,539,185.
Interfund lending The fund, along with other Putnam funds, may participate in an interfund lending program pursuant to an exemptive order issued by the SEC. This program allows the fund to borrow from or lend to other Putnam funds that permit such transactions. Interfund lending transactions are subject to each fund’s investment policies and borrowing and lending limits. Interest earned or paid on the interfund lending transaction will be based on the average of certain current market rates. During the reporting period, the fund did not utilize the program.
Lines of credit The fund participates, along with other Putnam funds, in a $392.5 million unsecured committed line of credit and a $235.5 million unsecured uncommitted line of credit, both provided by State Street. Borrowings may be made for temporary or emergency purposes, including the funding of shareholder redemption requests and trade settlements. Interest is charged to the fund based on the fund’s borrowing at a rate equal to the Federal Funds rate plus 1.25% for the committed line of credit and the Federal Funds rate plus 1.30% for the uncommitted line of credit. A closing fee equal to 0.04% of the committed line of credit and 0.04% of the uncommitted line of credit has been paid by the participating funds. In addition, a commitment fee of 0.11% per annum on any unutilized portion of the committed line of credit is allocated to the participating funds based on their relative net assets and paid quarterly. During the reporting period, the fund had no borrowings against these arrangements.
Federal taxes It is the policy of the fund to distribute all of its taxable income within the prescribed time period and otherwise comply with the provisions of the Internal Revenue Code of 1986, as amended (the Code), applicable to regulated investment companies. It is also the intention of the fund to distribute an amount sufficient to avoid imposition of any excise tax under Section 4982 of the Code.
The fund is subject to the provisions of Accounting Standards Codification 740 Income Taxes (ASC 740). ASC 740 sets forth a minimum threshold for financial statement recognition of the benefit of a tax position taken or expected to be taken in a tax return. The fund did not have a liability to record for any unrecognized tax benefits in the accompanying financial statements. No provision has been made for federal taxes on income, capital gains or unrealized appreciation on securities held nor for excise tax on income and capital gains. Each of the fund’s federal tax returns for the prior three fiscal years remains subject to examination by the Internal Revenue Service.
The fund may also be subject to taxes imposed by governments of countries in which it invests. Such taxes are generally based on either income or gains earned or repatriated. The fund accrues and applies such taxes to net investment income, net realized gains and net unrealized gains as income and/or capital gains are earned. In some cases, the fund may be entitled to reclaim all or a portion of such taxes, and such reclaim amounts, if any, are reflected as an asset on the fund’s books. In many cases, however, the fund may not receive such amounts for an extended period of time, depending on the country of investment.
At June 30, 2014, the fund had a capital loss carryover of $59,168,743 available to the extent allowed by the Code to offset future net capital gain, if any. The amounts of the carryovers and the expiration dates are:
Loss carryover | |||
Short-term | Long-term | Total | Expiration |
$795,075 | N/A | $795,075 | June 30, 2017 |
58,373,668 | N/A | 58,373,668 | June 30, 2018 |
Under the Regulated Investment Company Modernization Act of 2010, the fund will be permitted to carry forward capital losses incurred in taxable years beginning after December 22, 2010 for an unlimited period. However, any losses incurred will be required to be utilized prior to the losses incurred in pre-enactment tax years. As a result of this ordering rule, pre-enactment capital loss carryforwards may be more likely to expire unused. Additionally, post-enactment capital losses that are carried forward will retain their character as either short-term or long-term capital losses rather than being considered all short-term as under previous law.
30 Europe Equity Fund
The aggregate identified cost on a tax basis is $276,170,459, resulting in gross unrealized appreciation and depreciation of $24,888,545 and $19,713,480, respectively, or net unrealized appreciation of $5,175,065.
Distributions to shareholders Distributions to shareholders from net investment income are recorded by the fund on the ex-dividend date. Distributions from capital gains, if any, are recorded on the ex-dividend date and paid at least annually. The amount and character of income and gains to be distributed are determined in accordance with income tax regulations, which may differ from generally accepted accounting principles. Dividend sources are estimated at the time of declaration. Actual results may vary. Any non-taxable return of capital cannot be determined until final tax calculations are completed after the end of the fund’s fiscal year. Reclassifications are made to the fund’s capital accounts to reflect income and gains available for distribution (or available capital loss carryovers) under income tax regulations.
Note 2: Management fee, administrative services and other transactions
The fund pays Putnam Management a management fee (base fee) (based on the fund’s average net assets and computed and paid monthly) at annual rates that may vary based on the average of the aggregate net assets of most open-end funds, as defined in the fund’s management contract, sponsored by Putnam Management. Such annual rates may vary as follows:
0.850% | of the first $5 billion, |
0.800% | of the next $5 billion, |
0.750% | of the next $10 billion, |
0.700% | of the next $10 billion, |
0.650% | of the next $50 billion, |
0.630% | of the next $50 billion, |
0.620% | of the next $100 billion and |
0.615% | of any excess thereafter. |
In addition, the monthly management fee consists of the monthly base fee plus or minus a performance adjustment for the month. The performance adjustment is determined based on performance over the thirty-six month period then ended. Each month, the performance adjustment is calculated by multiplying the performance adjustment rate and the fund’s average net assets over the performance period and the result is divided by twelve. The resulting dollar amount is added to, or subtracted from the base fee for that month. The performance adjustment rate is equal to 0.03 multiplied by the difference between the fund’s annualized performance (measured by the fund’s class A shares) and the annualized performance of the MSCI Europe Index (Net Dividends), each measured over the performance period. The maximum annualized performance adjustment rates are +/– 0.15%. The monthly base fee is determined based on the fund’s average net assets for the month, while the performance adjustment is determined based on the fund’s average net assets over the performance period of up to thirty-six months. This means it is possible that, if the fund underperforms significantly over the performance period, and the fund’s assets have declined significantly over that period, the negative performance adjustment may exceed the base fee. In this event, Putnam Management would make a payment to the fund.
Because the performance adjustment is based on the fund’s performance relative to its applicable benchmark index, and not its absolute performance, the performance adjustment could increase Putnam Management’s fee even if the fund’s shares lose value during the performance period provided that the fund outperformed its benchmark index, and could decrease Putnam Management’s fee even if the fund’s shares increase in value during the performance period provided that the fund underperformed its benchmark index.
For the reporting period, the base fee represented an effective rate (excluding the impact from any expense waivers in effect) of 0.347% of the fund’s average net assets before an increase of $93,258 (0.031% of the fund’s average net assets) based on performance.
Putnam Management has contractually agreed, through June 30, 2015, to waive fees or reimburse the fund’s expenses to the extent necessary to limit the cumulative expenses of the fund, exclusive of brokerage, interest, taxes, investment-related expenses, extraordinary expenses, acquired fund fees and expenses and payments under the fund’s investor servicing contract, investment management contract and distribution plans, on a fiscal year-to-date basis to an annual rate of 0.20% of the fund’s average net assets over such fiscal year-to-date period. During the reporting period, the fund’s expenses were not reduced as a result of this limit.
Putnam Investments Limited (PIL), an affiliate of Putnam Management, is authorized by the Trustees to manage a separate portion of the assets of the fund as determined by Putnam Management from time to time. Putnam Management pays a quarterly sub-management fee to PIL for its services at an annual rate of 0.35% of the average net assets of the portion of the fund managed by PIL.
Europe Equity Fund 31
The Putnam Advisory Company, LLC (PAC), an affiliate of Putnam Management, is authorized by the Trustees to manage a separate portion of the assets of the fund, as designated from time to time by Putnam Management or PIL. Putnam Management or PIL, as applicable, pays a quarterly sub-advisory fee to PAC for its services at the annual rate of 0.35% of the average net assets of the portion of the fund’s assets for which PAC is engaged as sub-adviser.
The fund reimburses Putnam Management an allocated amount for the compensation and related expenses of certain officers of the fund and their staff who provide administrative services to the fund. The aggregate amount of all such reimbursements is determined annually by the Trustees.
Custodial functions for the fund’s assets are provided by State Street. Custody fees are based on the fund’s asset level, the number of its security holdings and transaction volumes.
Putnam Investor Services, Inc., an affiliate of Putnam Management, provides investor servicing agent functions to the fund. Putnam Investor Services, Inc. received fees for investor servicing based on the fund’s retail asset level, the number of shareholder accounts in the fund and the level of defined contribution plan assets in the fund. Investor servicing fees will not exceed an annual rate of 0.32% of the fund’s average net assets. During the reporting period, the expenses for each class of shares related to investor servicing fees were as follows:
Class A | $215,106 |
Class B | 3,906 |
Class C | 17,728 |
Class M | 3,000 |
Class R | 502 |
Class Y | 56,246 |
Total | $296,488 |
The fund has entered into expense offset arrangements with Putnam Investor Services, Inc. and State Street whereby Putnam Investor Services, Inc.’s and State Street’s fees are reduced by credits allowed on cash balances. For the reporting period, the fund’s expenses were reduced by $429 under the expense offset arrangements.
Each Independent Trustee of the fund receives an annual Trustee fee, of which $176, as a quarterly retainer, has been allocated to the fund, and an additional fee for each Trustees meeting attended. Trustees also are reimbursed for expenses they incur relating to their services as Trustees.
The fund has adopted a Trustee Fee Deferral Plan (the Deferral Plan) which allows the Trustees to defer the receipt of all or a portion of Trustees fees payable on or after July 1, 1995. The deferred fees remain invested in certain Putnam funds until distribution in accordance with the Deferral Plan.
The fund has adopted an unfunded noncontributory defined benefit pension plan (the Pension Plan) covering all Trustees of the fund who have served as a Trustee for at least five years and were first elected prior to 2004. Benefits under the Pension Plan are equal to 50% of the Trustee’s average annual attendance and retainer fees for the three years ended December 31, 2005. The retirement benefit is payable during a Trustee’s lifetime, beginning the year following retirement, for the number of years of service through December 31, 2006. Pension expense for the fund is included in Trustee compensation and expenses in the Statement of operations. Accrued pension liability is included in Payable for Trustee compensation and expenses in the Statement of assets and liabilities. The Trustees have terminated the Pension Plan with respect to any Trustee first elected after 2003.
The fund has adopted distribution plans (the Plans) with respect to its class A, class B, class C, class M and class R shares pursuant to Rule 12b–1 under the Investment Company Act of 1940. The purpose of the Plans is to compensate Putnam Retail Management Limited Partnership, an indirect wholly-owned subsidiary of Putnam Investments, LLC, for services provided and expenses incurred in distributing shares of the fund. The Plans provide for payments by the fund to Putnam Retail Management Limited Partnership at an annual rate of up to 0.35%, 1.00%, 1.00%, 1.00% and 1.00% of the average net assets attributable to class A, class B, class C, class M and class R shares, respectively. The Trustees have approved payment by the fund at an annual rate of 0.25%, 1.00%, 1.00%, 0.75% and 0.50% of the average net assets attributable to class A, class B, class C, class M and class R shares, respectively. During the reporting period, the class specific expenses related to distribution fees were as follows:
Class A | $271,775 |
Class B | 19,757 |
Class C | 89,590 |
Class M | 11,377 |
Class R | 1,270 |
Total | $393,769 |
32 Europe Equity Fund
For the reporting period, Putnam Retail Management Limited Partnership, acting as underwriter, received net commissions of $14,342 and $10 from the sale of class A and class M shares, respectively, and received $1,045 and $260 in contingent deferred sales charges from redemptions of class B and class C shares, respectively.
A deferred sales charge of up to 1.00% and 0.65% is assessed on certain redemptions of class A and class M shares, respectively. For the reporting period, Putnam Retail Management Limited Partnership, acting as underwriter, received no monies on class A and class M redemptions.
Note 3: Purchase and sales of securities
During the reporting period, cost of purchases and proceeds from sales, excluding short-term investments were as follows:
Cost of purchases | Proceeds from sales | |
Investments in securities (Long-term) | $89,691,352 | $95,342,436 |
U.S. government securities (Long-term) | — | — |
Total | $89,691,352 | $95,342,436 |
Note 4: Capital shares
At the close of the reporting period, there were an unlimited number of shares of beneficial interest authorized. Transactions in capital shares were as follows:
Six months ended 12/31/14 | Year ended 6/30/14 | |||
Class A | Shares | Amount | Shares | Amount |
Shares sold | 1,417,908 | $37,110,072 | 2,724,826 | $72,375,021 |
Shares issued in connection with reinvestment of distributions | 93,934 | 2,316,407 | 53,617 | 1,384,383 |
1,511,842 | 39,426,479 | 2,778,443 | 73,759,404 | |
Shares repurchased | (1,553,537) | (39,574,142) | (1,168,095) | (30,599,359) |
Net increase (decrease) | (41,695) | $(147,663) | 1,610,348 | $43,160,045 |
Six months ended 12/31/14 | Year ended 6/30/14 | |||
Class B | Shares | Amount | Shares | Amount |
Shares sold | 24,821 | $603,555 | 67,034 | $1,694,423 |
Shares issued in connection with reinvestment of distributions | 1,148 | 27,167 | 256 | 6,337 |
25,969 | 630,722 | 67,290 | 1,700,760 | |
Shares repurchased | (24,027) | (585,688) | (41,763) | (1,028,572) |
Net increase | 1,942 | $45,034 | 25,527 | $672,188 |
Six months ended 12/31/14 | Year ended 6/30/14 | |||
Class C | Shares | Amount | Shares | Amount |
Shares sold | 125,856 | $3,146,013 | 652,371 | $16,634,655 |
Shares issued in connection with reinvestment of distributions | 4,522 | 108,885 | 2,859 | 72,132 |
130,378 | 3,254,898 | 655,230 | 16,706,787 | |
Shares repurchased | (149,793) | (3,659,613) | (66,831) | (1,726,857) |
Net increase (decrease) | (19,415) | $(404,715) | 588,399 | $14,979,930 |
Europe Equity Fund 33
Six months ended 12/31/14 | Year ended 6/30/14 | |||
Class M | Shares | Amount | Shares | Amount |
Shares sold | 1,110 | $28,913 | 3,777 | $102,291 |
Shares issued in connection with reinvestment of distributions | 707 | 17,282 | 312 | 7,987 |
1,817 | 46,195 | 4,089 | 110,278 | |
Shares repurchased | (5,601) | (140,588) | (13,316) | (343,992) |
Net decrease | (3,784) | $(94,393) | (9,227) | $(233,714) |
Six months ended 12/31/14 | Year ended 6/30/14 | |||
Class R | Shares | Amount | Shares | Amount |
Shares sold | 3,119 | $78,711 | 15,444 | $402,732 |
Shares issued in connection with reinvestment of distributions | 178 | 4,332 | 98 | 2,492 |
3,297 | 83,043 | 15,542 | 405,224 | |
Shares repurchased | (3,525) | (82,653) | (5,084) | (130,715) |
Net increase (decrease) | (228) | $390 | 10,458 | $274,509 |
Six months ended 12/31/14 | Year ended 6/30/14 | |||
Class Y | Shares | Amount | Shares | Amount |
Shares sold | 953,234 | $24,822,267 | 2,039,574 | $54,286,368 |
Shares issued in connection with reinvestment of distributions | 28,928 | 715,672 | 9,705 | 251,463 |
982,162 | 25,537,939 | 2,049,279 | 54,537,831 | |
Shares repurchased | (1,245,488) | (31,567,115) | (307,556) | (8,300,577) |
Net increase (decrease) | (263,326) | $(6,029,176) | 1,741,723 | $46,237,254 |
Note 5: Affiliated transactions
Transactions during the reporting period with Putnam Short Term Investment Fund, which is under common ownership and control, were as follows:
Name of affiliate | Fair value at the beginning of the reporting period | Purchase cost | Sale proceeds | Investment income | Fair value at the end of the reporting period |
Putnam Short Term Investment Fund* | $8,379,233 | $57,977,584 | $62,193,599 | $1,366 | $4,163,218 |
Totals | $8,379,233 | $57,977,584 | $62,193,599 | $1,366 | $4,163,218 |
*Management fees charged to Putnam Short Term Investment Fund have been waived by Putnam Management.
Note 6: Market, credit and other risks
In the normal course of business, the fund trades financial instruments and enters into financial transactions where risk of potential loss exists due to changes in the market (market risk) or failure of the contracting party to the transaction to perform (credit risk). The fund may be exposed to additional credit risk that an institution or other entity with which the fund has unsettled or open transactions will default. Investments in foreign securities involve certain risks, including those related to economic instability, unfavorable political developments, and currency fluctuations.
34 Europe Equity Fund
Putnam family of funds
The following is a list of Putnam’s open-end mutual funds offered to the public. Investors should carefully consider the investment objective, risks, charges, and expenses of a fund before investing. For a prospectus, or a summary prospectus if available, containing this and other information for any Putnam fund or product, contact your financial advisor or call Putnam Investor Services at 1-800-225-1581. Please read the prospectus carefully before investing.
Growth
Growth Opportunities Fund
International Growth Fund
Multi-Cap Growth Fund
Small Cap Growth Fund
Voyager Fund
Blend
Asia Pacific Equity Fund
Capital Opportunities Fund
Capital Spectrum Fund
Emerging Markets Equity Fund
Equity Spectrum Fund
Europe Equity Fund
Global Equity Fund
International Capital Opportunities Fund
International Equity Fund
Investors Fund
Low Volatility Equity Fund
Multi-Cap Core Fund
Research Fund
Strategic Volatility Equity Fund
Value
Convertible Securities Fund
Equity Income Fund
Global Dividend Fund
The Putnam Fund for Growth and Income
International Value Fund
Multi-Cap Value Fund
Small Cap Value Fund
Income
American Government Income Fund
Diversified Income Trust
Emerging Markets Income Fund
Floating Rate Income Fund
Global Income Trust
High Yield Advantage Fund
High Yield Trust
Income Fund
Money Market Fund*
Short Duration Income Fund
U.S. Government Income Trust
Tax-free Income
AMT-Free Municipal Fund
Intermediate-Term Municipal Income Fund
Short-Term Municipal Income Fund
Tax Exempt Income Fund
Tax Exempt Money Market Fund*
Tax-Free High Yield Fund
State tax-free income funds†:
Arizona, California, Massachusetts, Michigan,
Minnesota, New Jersey, New York, Ohio,
and Pennsylvania.
* An investment in a money market fund is not insured or guaranteed by the Federal Deposit Insurance Corporation or any other government agency. Although the fund seeks to preserve the value of your investment at $1.00 per share, it is possible to lose money by investing in the fund.
†Not available in all states.
Europe Equity Fund 35
Absolute Return
Absolute Return 100 Fund®
Absolute Return 300 Fund®
Absolute Return 500 Fund®
Absolute Return 700 Fund®
Global Sector
Global Consumer Fund
Global Energy Fund
Global Financials Fund
Global Health Care Fund
Global Industrials Fund
Global Natural Resources Fund
Global Sector Fund
Global Technology Fund
Global Telecommunications Fund
Global Utilities Fund
Asset Allocation
George Putnam Balanced Fund
Global Asset Allocation Funds — four investment portfolios that spread your money across a variety of stocks, bonds, and money market instruments.
Dynamic Asset Allocation Balanced Fund
Dynamic Asset Allocation Conservative Fund
Dynamic Asset Allocation Growth Fund
Dynamic Risk Allocation Fund
Retirement Income Lifestyle Funds — portfolios with managed allocations to stocks, bonds, and money market investments to generate retirement income.
Retirement Income Fund Lifestyle 1
Retirement Income Fund Lifestyle 2
Retirement Income Fund Lifestyle 3
RetirementReady® Funds — portfolios with adjusting allocations to stocks, bonds, and money market instruments, becoming more conservative over time.
RetirementReady® 2055 Fund
RetirementReady® 2050 Fund
RetirementReady® 2045 Fund
RetirementReady® 2040 Fund
RetirementReady® 2035 Fund
RetirementReady® 2030 Fund
RetirementReady® 2025 Fund
RetirementReady® 2020 Fund
RetirementReady® 2015 Fund
Check your account balances and the most recent month-end performance in the Individual Investors section at putnam.com.
36 Europe Equity Fund
Fund information
Founded over 75 years ago, Putnam Investments was built around the concept that a balance between risk and reward is the hallmark of a well-rounded financial program. We manage over 100 funds across income, value, blend, growth, asset allocation, absolute return, and global sector categories.
Investment Manager
Putnam Investment
Management, LLC
One Post Office Square
Boston, MA 02109
Investment Sub-Manager
Putnam Investments Limited
57–59 St James’s Street
London, England SW1A 1LD
Investment Sub-Advisor
The Putnam Advisory Company, LLC
One Post Office Square
Boston, MA 02109
Marketing Services
Putnam Retail Management
One Post Office Square
Boston, MA 02109
Custodian
State Street Bank
and Trust Company
Legal Counsel
Ropes & Gray LLP
Trustees
Jameson A. Baxter, Chair
Liaquat Ahamed
Ravi Akhoury
Barbara M. Baumann
Charles B. Curtis
Robert J. Darretta
Katinka Domotorffy
John A. Hill
Paul L. Joskow
Kenneth R. Leibler
Robert E. Patterson
George Putnam, III
Robert L. Reynolds
W. Thomas Stephens
Officers
Robert L. Reynolds
President
Jonathan S. Horwitz
Executive Vice President,
Principal Executive Officer, and
Compliance Liaison
Steven D. Krichmar
Vice President and
Principal Financial Officer
Robert T. Burns
Vice President and
Chief Legal Officer
Robert R. Leveille
Vice President and
Chief Compliance Officer
Michael J. Higgins
Vice President, Treasurer,
and Clerk
Janet C. Smith
Vice President,
Principal Accounting Officer,
and Assistant Treasurer
Susan G. Malloy
Vice President and
Assistant Treasurer
James P. Pappas
Vice President
Mark C. Trenchard
Vice President and
BSA Compliance Officer
Nancy E. Florek
Vice President, Director of
Proxy Voting and Corporate
Governance, Assistant Clerk,
and Associate Treasurer
This report is for the information of shareholders of Putnam Europe Equity Fund. It may also be used as sales literature when preceded or accompanied by the current prospectus, the most recent copy of Putnam’s Quarterly Performance Summary, and Putnam’s Quarterly Ranking Summary. For more recent performance, please visit putnam.com. Investors should carefully consider the investment objectives, risks, charges, and expenses of a fund, which are described in its prospectus. For this and other information or to request a prospectus or summary prospectus, call 1-800-225-1581 toll free. Please read the prospectus carefully before investing. The fund’s Statement of Additional Information contains additional information about the fund’s Trustees and is available without charge upon request by calling 1-800-225-1581.
| Item 2. Code of Ethics: |
| Not applicable |
| Item 3. Audit Committee Financial Expert: |
| Not applicable |
| Item 4. Principal Accountant Fees and Services: |
| Not applicable |
| Item 5. Audit Committee of Listed Registrants |
| Not applicable |
| Item 6. Schedule of Investments: |
| The registrant’s schedule of investments in unaffiliated issuers is included in the report to shareholders in Item 1 above. |
| Item 7. Disclosure of Proxy Voting Policies and Procedures For Closed-End Management Investment Companies: |
| Not applicable |
| Item 8. Portfolio Managers of Closed-End Investment Companies |
| Not Applicable |
| Item 9. Purchases of Equity Securities by Closed-End Management Investment Companies and Affiliated Purchasers: |
| Not applicable |
| Item 10. Submission of Matters to a Vote of Security Holders: |
| Not applicable |
| Item 11. Controls and Procedures: |
| (a) The registrant’s principal executive officer and principal financial officer have concluded, based on their evaluation of the effectiveness of the design and operation of the registrant’s disclosure controls and procedures as of a date within 90 days of the filing date of this report, that the design and operation of such procedures are generally effective to provide reasonable assurance that information required to be disclosed by the registrant in this report is recorded, processed, summarized and reported within the time periods specified in the Commission’s rules and forms. |
| (b) Changes in internal control over financial reporting: Not applicable |
| Item 12. Exhibits: |
| (a)(1) Not applicable |
| (a)(2) Separate certifications for the principal executive officer and principal financial officer of the registrant as required by Rule 30a-2(a) under the Investment Company Act of 1940, as amended, are filed herewith. |
| (b) The certifications required by Rule 30a-2(b) under the Investment Company Act of 1940, as amended, are filed herewith. |
| Putnam Europe Equity Fund |
| By (Signature and Title): |
| /s/ Janet C. Smith Janet C. Smith Principal Accounting Officer |
| Date: February 27, 2015 |
| Pursuant to the requirements of the Securities Exchange Act of 1934 and the Investment Company Act of 1940, this report has been signed below by the following persons on behalf of the registrant and in the capacities and on the dates indicated. |
| By (Signature and Title): |
| /s/ Jonathan S. Horwitz Jonathan S. Horwitz Principal Executive Officer |
| Date: February 27, 2015 |
| By (Signature and Title): |
| /s/ Steven D. Krichmar Steven D. Krichmar Principal Financial Officer |
| Date: February 27, 2015 |