*Not pictured: Johnny Cameron, Mark Fisher and Bill Friedrich (each appointed in March 2006)
Chairman
Sir George Mathewson (age 65)
CBE, DUniv, LLD, FRSE, FCIBS
C (Chairman), N (Chairman)
Appointed to the Board in September 1987 and as Chairman in April 2001, Sir George Mathewson has a wide background in finance, technology and management and spent some of his career in the United States. He became Group Chief Executive in January 1992 and, in March 2000, he was appointed Executive Deputy Chairman. He is a director of The Scottish Investment Trust PLC and the Institute of International Finance, Inc. He is also president of the International Monetary Conference, a member of the Advisory Committee of Bridgepoint Capital Limited and a member of the Financial Reporting Council. He was chief executive of the Scottish Development Agency from 1981 to 1987 and is a former president of the British Bankers’ Association.
Deputy Chairman and
Chairman-designate
Sir Tom McKillop* (age 62)
C, N
Appointed to the Board as Deputy Chairman in September 2005, Sir Tom is a non-executive director of BP p.l.c., and was formerly chief executive of AstraZeneca plc. He was formerly president of the European Federation of Pharmaceutical Industries and Associations and chairman of the British Pharma Group. He is Pro-Chancellor of the University of Leicester and a trustee of the Council for Industry and Higher Education.
Executive directors
Sir Fred Goodwin (age 47)
DUniv, FCIBS, FCIB, LLD
Group Chief Executive
C
Appointed to the Board in August 1998, Sir Fred Goodwin is a Chartered Accountant. He was formerly chief executive and director, Clydesdale Bank PLC and Yorkshire Bank PLC. He is chairman of The Prince’s Trust, a non-executive director of Bank of China Limited and a former president of the Chartered Institute of Bankers in Scotland.
Lawrence Fish (age 61)
Chairman and Chief Executive
Officer of Citizens Financial
Group, Inc.
Appointed to the Board in January 1993, Lawrence Fish is an American national. He is a career banker and was a director of the Federal Reserve Bank of Boston. He is a trustee of The Brookings Institution and a director of the Financial Services Roundtable, Textron Inc., and numerous community organisations in the USA.
Gordon Pell (age 56)
FCIBS, FCIB
Chief Executive,
Retail Markets
Appointed to the Board in March 2000, Gordon Pell was formerly group director of Lloyds TSB UK Retail Banking before joining National Westminster Bank Plc as a director in February 2000 and then becoming chief executive, Retail Banking. He is also a director of Race for Opportunity and a member of the National Employment Panel and the FSA Practitioner Panel.
Guy Whittaker (age 49)
Group Finance Director
C
Appointed to the Board in February 2006, Guy Whittaker was formerly group treasurer at Citigroup Inc., based in New York, having previously held a number of management positions within the financial markets business at Citigroup. He was elected a Lady Beaufort Fellow of Christ's College Cambridge in 2004.
Johnny Cameron (age 51)
FCIBS
Chief Executive, Corporate Markets
Appointed to the Board in March 2006, Johnny Cameron has held a number of senior positions in financial institutions including County NatWest, Dresdner Kleinwort Benson and RBS. He was appointed Managing Director, Corporate and Institutional Banking in 1998, before being promoted to Deputy Chief Executive, Corporate Banking and Financial Markets (renamed Corporate Markets in January 2006) in 2000, and Chief Executive in 2001.
Mark Fisher (age 46)
FCIBS
Chief Executive, Manufacturing
Appointed to the Board in March 2006, Mark Fisher is a career banker, having joined the Group in 1981 as a graduate trainee. Mark has held a number of senior management positions in NatWest Retail Bank, including Finance Director and latterly Chief Operating Officer. He was responsible for overseeing the successful integration of NatWest on to the RBS operational platform following the acquisition in 2001, and has since then completed the integration of Churchill Insurance. Mark is also Chairman of The Association for Payment Clearing Services (APACS).
Non-executive directors
Colin Buchan* (age 51)
A, C, R
Appointed to the Board in June 2002, Colin Buchan was educated in South Africa and spent the early part of his career in South Africa and the Far East. He has considerable international investment banking experience, as well as experience in very large risk management in the equities business. He was formerly a member of the group management board of UBS AG and head of equities of UBS Warburg. He is chairman of UBS Securities Canada Inc. and vice-chairman of Standard Life Investments Limited. He is also a director of Merrill Lynch World Mining Trust Plc, Merrill Lynch Gold Limited, Royal Scottish National Orchestra Society Limited and World Mining Investment Company Limited.
Jim Currie* (age 64)
D.Litt
R
Appointed to the Board in November 2001, Jim Currie is a highly experienced senior international civil servant who spent many years working in Brussels and Washington. He was formerly director general at the European Commission with responsibility for the EU’s environmental policy and director general for Customs and Excise and Indirect Taxation. He is also a director of Total Holdings UK Limited, an international advisor to Eversheds and a consultant to Butera & Andrews UK Limited.
Bill Friedrich* (age 56)
Appointed to the Board in March 2006, Bill Friedrich was appointed to the Board of BG Group plc as an Executive Director, Deputy Chief Executive and General Counsel in October 2000. Since 2005, he has had primary responsibility for the Group’s overall strategy function and portfolio development activities as well as oversight of the Group’s organisational and human resource matters. Prior to that he was responsible for BG’s operations in North and South America and various Group-wide staff functions. He joined British Gas plc in December 1995 as General Counsel after a 20-year career with Shearman & Sterling, based in New York, where he became a partner in 1983.
Archie Hunter* (age 62)
A (Chairman), C
Appointed to the Board in September 2004, Archie Hunter is a Chartered Accountant. He was Scottish senior partner of KPMG between 1992 and 1999 and President of The Institute of Chartered Accountants of Scotland in 1997/1998. He has extensive professional experience in the UK and North and South America. He is currently chairman of Macfarlane Group plc, a director of Edinburgh US Tracker Trust plc, Convenor of Court at the University of Strathclyde and a governor of the Beatson Cancer Research Institute.
Charles ‘Bud’ Koch (age 59)
Appointed to the Board in September 2004, Bud Koch is an American national. He has extensive professional experience in the USA and is currently chairman of the board of the Federal Home Loan Bank of Cincinnati, chairman of the board of John Carroll University and a trustee of Case Western Reserve University. He was chairman, president and chief executive officer of Charter One Financial, Inc. and its wholly owned subsidiary, Charter One Bank, N.A between 1973 and 2004. He is also a director of Assurant, Inc.
Janis Kong* (age 55)
OBE, DUniv
Appointed to the Board in January 2006, Janis Kong is currently executive chairman of Heathrow Airport Limited, chairman of Heathrow Express Limited and a director of BAA plc and Portmeirion Group plc. She is also a member of the board of Visit Britain and previously served as a member of the board of the South East England Regional Development Agency.
Joe MacHale* (age 54)
A
Appointed to the Board in September 2004, Joe MacHale is currently a non-executive director and chairman of the audit committee of Morgan Crucible plc, a non-executive director of Brit Insurance Holdings plc, and a trustee of MacMillan Cancer Relief. He held a number of senior executive positions with J P Morgan between 1979 and 2001 and was latterly chief executive of J P Morgan Europe, Middle East and Africa Region.
Sir Steve Robson* (age 62)
A
Appointed to the Board in July 2001, Sir Steve Robson is a former senior UK civil servant, who had responsibility for a wide variety of Treasury matters. His early career included the post of private secretary to the Chancellor of the Exchequer and secondment to ICFC (now 3i). He was also a second permanent secretary of HM Treasury, where he was managing director of the Finance and Regulation Directorate. He is a non-executive director of JP Morgan Cazenove Holdings, Xstrata Plc and Partnerships UK plc, and a member of the Chairman’s Advisory Committee of KPMG.
Bob Scott* (age 64)
CBE, FCIBS
C, N, R (Chairman)
Appointed to the Board in January 2001, Bob Scott is an Australian national. He is the senior independent director. He has many years experience in the international insurance business and played a leading role in the consolidation of the UK insurance industry. He is a former group chief executive of CGNU plc and chairman of the board of the Association of British Insurers. He is chairman of Yell Group plc and a non-executive director of Swiss Reinsurance Company (Zurich), Jardine Lloyd Thompson Group plc and Focus DIY Group Limited. He is also a trustee of the Crimestoppers Trust and an adviser to Duke Street Capital.
Peter Sutherland* (age 59)
KCMG
C, N
Appointed to the Board in January 2001, Peter Sutherland is an Irish national. He is a former attorney general of Ireland and from 1985 to 1989 was the European Commissioner responsible for competition policy. He is chairman of BP p.l.c. and Goldman Sachs International and honorary president and member of the Advisory Council for the European Movement – Ireland. He was formerly chairman of Allied Irish Bank and a director general of GATT and the World Trade Organisation.
Group Secretary and
General Counsel
Miller McLean (age 56)
FCIBS
C
Miller McLean was appointed Group Secretary in August 1994. He is a trustee of the Industry and Parliament Trust, a non-executive chairman of The Whitehall and Industry Group and a director of The Scottish Parliament and Business Exchange.
| A | member ofthe Audit Committee |
| C | member ofthe Chairman’s Advisory Group |
| N | member ofthe Nominations Committee |
| R | member ofthe Remuneration Committee |
| * | independent non-executive director |
61
Report of the directors
The directors have pleasure in presenting their report together with the audited accounts for the year ended 31 December 2005.
Profit and dividends
The profit attributable to the ordinary shareholders of the company for the year ended 31 December 2005 amounted to £5,392 million compared with £4,856 million for the year ended 31 December 2004, as set out in the consolidated income statement on page 97.
An interim dividend of 19.4p per ordinary share was paid on 7 October 2005 totalling £619 million (2004 – £529 million). The directors now recommend that a final dividend of 53.1p per ordinary share totalling £1,700 million (2004 – £1,308 million) be paid on 9 June 2006 to members on the register at the close of business on 10 March 2006. Subject to approval of the dividend at the Annual General Meeting, shareholders will be offered the opportunity to participate in a dividend reinvestment plan, which will replace the current scrip dividend scheme.
Activities and business review
The company is a holding company owning the entire issued ordinary share capital of the Royal Bank, the principal direct operating subsidiary undertaking of the company. The “Group” comprises the company and all its subsidiary and associated undertakings, including the Royal Bank and NatWest. The Group is engaged principally in providing a wide range of banking, insurance and other financial services. The financial risk management objectives and policies of the Group and information on the Group’s exposure to price, credit, liquidity and cash flow risk are contained in Note 34 on the financial statements. Details of the principal subsidiary undertakings of the company are shown in Note 15. A review of the business for the year to 31 December 2005, of recent events and of likely future developments is contained in the Operating and financial review.
Business developments
In August 2005, the Group announced a strategic partnership with Bank of China (BoC). Subsequently, a Group-led consortium acquired a 10% shareholding in BoC through a majority-owned subsidiary for US$3.1 billion (£1.7 billion). The Group’s share of the investment (US$1.6 billion) was financed through the disposal of its 2.2% holding in the issued share capital of Banco Santander Central Hispano, S.A. Following receipt of all required regulatory approvals, the investment was completed in December 2005. The two banks will co-operate across a range of business activities in China including credit cards, wealth management, corporate banking and personal lines insurance. They will also closely co-operate in key operational areas including financial controls, risk management, human resources and corporate governance.
Going concern
The directors are satisfied that the Group has adequate resources to continue in business for the foreseeable future. For this reason, they continue to adopt the ‘going concern’ basis for preparing the accounts.
Ordinary share capital
During the year ended 31 December 2005, the ordinary share capital was increased by the following issues:
| (a) | 13.5 million ordinary shares allotted as a result of the exercise of options under the company’s executive, sharesave and option 2000 schemes and a further 0.7 million ordinary shares allotted in respect of the exercise of options under the NatWest executive and sharesave schemes which had been exchanged for options over the company’s shares following the acquisition of NatWest in 2000; |
| | |
| (b) | 7.4 million ordinary shares allotted in lieu of cash dividends; and |
| | |
| (c) | 2.3 million ordinary shares allotted under the company’s employee share ownership plan. |
Details of the authorised and issued ordinary share capital at 31 December 2005 are shown in Note 30.
Preference share capital
Details of issues of preference shares during the year and the authorised and issued share capital at 31 December 2005 are shown in Note 30.
Authority to repurchase shares
At the Annual General Meeting in 2005, shareholders renewed the authority for the company to make market purchases of up to 317,495,924 ordinary shares. The directors have not exercised this authority to date. The Group has however announced its intention to repurchase up to £1 billion of ordinary shares over the course of the next 12 months, and shareholders will be asked to renew this authority at the Annual General Meeting in April.
62
Shareholdings
As at 27 February 2006, the company had been notified of the following interests in its shares, in accordance with section 198 of the Companies Act 1985:
| | | Number of shares | | % held | | | | Number of shares | | % held |
|
|
|
|
|
|
|
|
|
|
|
| Ordinary shares: | | | | | | 5½% cumulative preference shares: | | | | |
| Legal & General Group plc | | 98,761,695 | | 3.40 | | Commercial Union Assurance plc | | 91,429 | | 22.86 |
| Barclays PLC | | 126,816,644 | | 3.97 | | Mr P. S. and Mrs J. Allen | | 86,999 | | 21.75 |
| The Capital Group of Companies, Inc | | 95,578,555 | | 3.01 | | Bassett-Patrick Securities Limited* | | 46,255 | | 11.56 |
| 11% cumulative preference shares: | | | | | | E M Behrens Charitable Trust | | 20,000 | | 5.00 |
| Guardian Royal Exchange | | | | | | Mrs Gina Wild | | 19,800 | | 4.95 |
| Assurance plc | | 129,830 | | 25.97 | | Trustees of The Stephen Cockburn | | | | |
| Windsor Life Assurance | | | | | | Limited Pension Scheme | | 19,879 | | 4.97 |
| Company Limited | | 51,510 | | 10.30 | �� | Miss Elizabeth Hill | | 16,124 | | 4.03 |
| Mr S. J. and Mrs J. A. Cockburn | | 30,810 | | 6.16 | | Mr W. T. Hardison Jr. | | 13,532 | | 3.38 |
| Cleaning Tokens Limited | | 25,500 | | 5.10 | | Ms C. L. Allen | | 13,200 | | 3.30 |
| | | | | | | Ms J. C. Allen | | 12,750 | | 3.18 |
|
|
|
|
|
|
|
|
|
|
|
| * | Notification has been received on behalf of Mr A. W. R. Medlock and Mrs H. M. Medlock that they each have an interest in the holding of 51/2 % cumulative preference shares registered in the name of Bassett-Patrick Securities Limited noted above and that there are further holdings of 5,300 and 5,000 shares, respectively, of that class registered in each of their names. |
Directors
The names and brief biographical details of the directors are shown on page 61. All directors, except:
- Sir Angus Grossart, Lord Vallance and Iain Robertson, whoretired from the Board on 20 April 2005, and Eileen Mackay,who retired from the Board on 31 December 2005,
- Sir Tom McKillop, who was appointed to the Board on1 September 2005, Janis Kong, who was appointed to theBoard on 1 January 2006, and Guy Whittaker, who wasappointed to the Board on 1 February 2006, and
- Fred Watt, who resigned from the Board on 31 January 2006,
served throughout the year and to the date of signing of the financial statements.
Sir Tom McKillop, Colin Buchan, Janis Kong, Bob Scott, Peter Sutherland and Guy Whittaker will retire and offer themselves for election or re-election at the company’s Annual General Meeting. Bill Friedrich, Johnny Cameron and Mark Fisher have been appointed as directors with effect from 1 March 2006 and will also offer themselves for election at the company’s Annual General Meeting.
Details of the service agreement for Guy Whittaker are set out on page 77. Johnny Cameron has a service agreement with The Royal Bank of Scotland plc dated 29 March 1998 which may be terminated by Mr Cameron giving six months notice to the Royal Bank and by the Royal Bank giving 12 months notice to Mr Cameron. Mark Fisher has a service agreement with The Royal Bank of Scotland plc dated 3 May 2000 which may be terminated by either party giving six months notice to the other. No other director seeking election or re-election has a service agreement.
Sir George Mathewson will retire as Chairman of the Board with effect from the conclusion of the Annual General Meeting on 28 April 2006. The Group has secured his continued employment to serve in an advisory role to the Group. Sir Tom McKillop will succeed Sir George as Chairman.
Directors’ interests
The interests of the directors in the shares of the company at 31 December 2005 are shown on page 82. None of the directors held an interest in the loan capital of the company or in the shares and loan capital of any of the subsidiary undertakings of the company, during the period from 1 January 2005 to 27 February 2006.
Employee proposition
The Group recognises that staff performance is central to the successful delivery of its overall business strategy. Accordingly, the Group focuses on maintaining an employee proposition that attracts, engages and retains the best available talent.
Employee recruitment
Utilising a wide range of recruitment channels, including an open internal jobs market, talent forums and detailed succession planning, the Group ensures that the recruitment and development of employees is closely aligned to organisational requirements. A strong standing as an employer of choice prompts applications from hundreds of thousands of potential candidates each year. Similarly, all vacancies are displayed internally and RBS employees can apply for any role.
The Group retains a high profile as a graduate recruiter, providing a wide range of development programmes. In 2005, more than 14,000 graduates applied for over 230 places with the Group. The Group also received the Association of Graduate Recruiters Award for delivering the ‘Best Integrated Marketing Recruitment Campaign’ targeted at graduates.
63
Report of the directorscontinued
Group-wide co-ordination and access to recruitment and interview skills training ensures recruitment complies with internal and regulatory requirements. In addition, the Group continues to ensure all appointees are appropriately referenced and screened prior to joining the organisation.
Employee reward
The Group acknowledges that its continuing success is closely linked to the performance, skills and individual commitment of its employees. Significant focus is therefore given to offering an exceptional reward proposition to all RBS Group employees in order to attract, motivate and retain the best available talent at every level.
In 2005, employee costs of £5,992 million, including National Insurance and pension costs of £864 million, made up over a third of total expenditure.
The Group’s remuneration and benefits package, Total Reward, (consisting of salary, bonus, share scheme and competitive pension benefits) is acknowledged as one of the most comprehensive and flexible packages in the financial services sector. Salary awards within the Group reflect individual performance, offering greater increases for high performers, as well as acknowledging market competitor movements.
RBSelect, the Group’s benefits choice programme, forms part of the Total Reward package. It provides for UK staff in the Group a flexible way of tailoring their reward to reflect their own individual lifestyle needs. Options range from subsidised childcare vouchers and discounted personal insurance products to environmentally friendly bicycle purchases.
Employees can also participate in bonus incentive plans specific to their business and share in the Group’s ongoing success through profit sharing, Buy As You Earn and Sharesave schemes, which align their interests with those of shareholders. UK employees participate in profit sharing that is directly related to the annual performance of the Group. For the last seven years this has amounted to a further 10 percent of basic salary.
To enable employees to get the most from Total Reward, a wide range of information about reward and benefits has been introduced through RBSpeople.com, an internet site offering 24 hour access from home or work.
The RBS group Charity Lottery was launched during 2005. Employees contributing to the prize fund through a small monthly entry fee have the chance to win up to 50% of the total funds collected each month. The remainder, after payment of a small lottery-operating fee, is donated to charity.
The Group continues to offer membership of its final pension scheme, with the entire cost being met by the Group. The largest scheme is the Royal Bank of Scotland Group Pension Fund, with 80,000 employee members in the UK.
Employee learning and development
The Group actively encourages learning and development and is committed to creating and providing opportunities both inside and outside the workplace. These experiences are provided through a variety of developmental initiatives, technological innovations and learning networks and forums. Creating and maintaining a talented network of people across the Group ensures not only a strong leadership capability, but also a high performing workforce.
In 2005 a new Group-wide approach to leadership development was launched. Called the “Leadership Journey”, it defines success at different leadership levels and the key developmental challenges that employees face as they progress within the Group. A suite of development programmes has been designed and implemented to ensure appropriate leadership development, supporting the challenges that individual leaders face whilst completing different stages of the Leadership Journey.
A core component of this ongoing activity is the Group’s Executive Leadership Programme (developed in conjunction with the Harvard Business School) and the establishment of an on-site business school at the Group Headquarters at Gogarburn, Edinburgh, which opened in January 2006. The Business School is central to the Group’s commitment to developing its leaders, and equipping them with the skills and confidence necessary to lead in complex and challenging environments.
Employee communication
Employee engagement is encouraged through a variety of means including a corporate intranet, Group and divisional magazines, team meetings led by line managers, briefings held by senior managers and regular dialogue with employees and employee representatives.
During 2005, the high quality of the Group’s internal communications was reflected by success in a number of prestigious external awards schemes. Awards were attained at both Group and divisional level and included a Gold Award for hub magazine, the Manufacturing division’s internal publication, at the UK Communicators in Business Awards, and a Gold Award for the Group Communications team in the Regular Communications category at the International Visual Communication Association Awards
The Group Chief Executive and other senior Group executives regularly communicate with employees through ‘Question Time’ style programmes, broadcast on the Group’s internal television network. An ‘Open Air’ debate chaired by the Group Chief Executive on Diversity and Inclusion, seeking to ensure equality of opportunity for employees and customers, typifies this approach.
64
Employee consultation
The Group’s confidential global Employee Opinion Survey is externally designed, undertaken and analysed annually on behalf of the Group by International Survey Research (“ISR”).
The survey enables employees to maximise their contribution to the Group by expressing their views and opinions on a range of key issues.
The results from the 2005 survey, which 86% of Group employees completed, demonstrated significant improvements for the fifth successive year. This year, for the very first time, the Group scored above the ISR Global Financial Services Norm in every single category.
The survey results are presented at Board, divisional and team levels. Action plans are developed to address any issues identified. With continuing year-on-year improvement, strong divisional results and improvements in all leading indicators, it is believed that results are sustainable, particularly given the Group’s focus on continuous improvement.
In addition to direct communication and consultation with employees, the Group recognises the trade union Amicus in the UK, and the Irish Bank Officials Association and the Services, Industrial, Professional and Technical Union in Ireland. These formal relationships are complemented by works council arrangements in many of the Group’s mainland Europe-based operations.
The Group has an European Employee Communication Council that provides elected employee representatives with an opportunity to better understand market conditions and strategic decisions with transnational impact on our European operations.
Diversity
The Group’s “Managing Diversity” policy sets a framework and a minimum standard within which all employees can develop to their full potential irrespective of race, gender, marital status, age, disability, religious belief, political opinion or sexual orientation. Each division has developed and delivered an action plan incorporating both Group and division-specific priorities to promote diversity across all areas of the employee lifecycle.
The success of this approach culminated in the Group receiving a Gold Standard Award in the Race for Opportunity Benchmarking Survey, having previously attained a Bronze in 2004. The Group maintains its involvement in and support of the UK Employers’ Forum on Age, Employers’ Forum on Disability, Employers’ Forum on Belief, Stonewall and of the Government’s Age Positive campaign.
The Group is also committed to ensuring that all prospective applicants for employment are treated fairly and equitably throughout the recruitment process. Its comprehensive resourcing standards cover the attraction and retention of individuals with disabilities. Reasonable adjustments are provided to support applicants in the recruitment process where these are required. The Group provides reasonable workplace adjustments for new entrants into the Group and for existing employees who become disabled during their employment.
Health, safety, wellbeing and security
The health, safety, wellbeing and security of RBS staff and customers continue to be a priority for the Group. Regular reviews are undertaken of both policies and processes to ensure compliance with current legislation and best practice. The Group focus is on ensuring that these policies are closely linked to the operational needs of the business.
Corporate responsibility
Business excellence requires that the Group meets changing customer, shareholder, investor, employee and supplier expectations. The Group believes that meeting high standards of environmental, social and ethical responsibility is key to the way it does business.
The Board regularly considers corporate responsibility issues and receives a formal report twice each year. Further details of the Group’s corporate responsibility policies will be contained in the 2005 Corporate Responsibility Report.
Code of ethics
The Group has adopted a code of ethics that is applicable to all of the Group’s employees and a copy is available upon request.
Charitable contributions
In 2005 the contribution to the Group’s Community Investment programmes increased to £56.2 million (2004 – £45.8 million). The total amount given for charitable purposes by the company and its subsidiary undertakings during the year ended 31 December 2005 was £24.3 million (2004 – £20.1 million).
Corporate governance
The company is committed to high standards of Corporate governance. Details are given on pages 67 to 72.
Political donations
No political donations were made during the year.
At the Annual General Meeting in 2002, shareholders gave authority for the company and certain of its subsidiaries to make political donations and incur political expenditure up to a maximum aggregate sum of £675,000 as a precautionary measure in light of the wide definitions in The Political Parties, Elections and Referendums Act 2000, for a period of four years. These authorities have not been used and it is not proposed that the Group’s longstanding policy of not making contributions to any political party be changed. A resolution to renew a general Group authority will be proposed at the Annual General Meeting on 28 April 2006.
65
Report of the directorscontinued
Policy and practice on payment of creditors
The Group is committed to maintaining a sound commercial relationship with its suppliers. Consequently, it is the Group’s policy to negotiate and agree terms and conditions with its suppliers, which includes the giving of an undertaking to pay suppliers within 30 days of receipt of a correctly prepared invoice submitted in accordance with the terms of the contract or such other payment period as may be agreed.
At 31 December 2005, the Group’s trade creditors represented 27 days (2004 – 27 days) of amounts invoiced by suppliers. The company does not have any trade creditors.
Directors' indemnities
In terms of section 309C of The Companies Act 1985 (as amended), the directors of the company, members of the Group Executive Management Committee and Approved Persons of the Group (under the Financial Services and Markets Act 2000) have been granted Qualifying Third Party Indemnity Provisions by the company.
Auditors
The auditors, Deloitte & Touche LLP, have indicated their willingness to continue in office. A resolution to re-appoint Deloitte & Touche LLP as the company’s auditor will be proposed at the forthcoming Annual General Meeting.
By order of the Board.
| |
| Miller McLean |
| Secretary |
| 27 February 2006 |
| |
| |
| The Royal Bank of Scotland Group plc |
| is registered in Scotland No. 45551. |
66
Corporate governance
The company is committed to high standards of corporate governance, business integrity and professionalism in all its activities.
Throughout the year ended 31 December 2005, the company has complied with all of the provisions set out in the revised Combined Code issued by the Financial Reporting Council in July 2003 (the “Code”) except in relation to the authority reserved to the Board to make the final determination of the remuneration of the executive directors, which is explained below in the paragraph headed ‘Remuneration Committee’.
The company has also complied with the Smith Guidance on Audit Committees in all material respects.
Under the US Sarbanes-Oxley Act of 2002, enhanced standards of corporate governance and business and financial disclosure apply to companies, including the company, with securities registered in the US. The Group complies with all currently applicable sections of the Act.
Board of directors
The Board is the principal decision-making forum for the company. It has overall responsibility for leading and controlling the company and is accountable to shareholders for financial and operational performance. The Board approves Group strategy and monitors performance. The Board has adopted a formal schedule of matters detailing key aspects of the company’s affairs reserved to it for its decision. This schedule is reviewed annually.
The roles of the Chairman and Group Chief Executive are distinct and separate, with a clear division of responsibilities. The Chairman leads the Board and ensures the effective engagement and contribution of all non-executive and executive directors. The Group Chief Executive has responsibility for all Group businesses and acts in accordance with the authority delegated by the Board. Responsibility for the development of policy and strategy and operational management is delegated to the Group Chief Executive and other executive directors.
All directors participate in discussing strategy, performance and the financial and risk management of the company. Meetings of the Board are structured to allow open discussion.
The Board met nine times during 2005 and was supplied with comprehensive papers in advance of each Board meeting covering the Group’s principal business activities. Members of the executive management attend and make regular presentations at meetings of the Board.
Board balance and independence
The Board currently comprises the Chairman, six executive directors and eleven non-executive directors. The Board functions effectively and efficiently, and is considered to be of an appropriate size in view of the scale of the company and the diversity of its businesses. The directors provide the Group with the knowledge, mix of skills, experience and networks of contacts required. The Board Committees contain directors with a variety of relevant skills and experience so that no undue reliance is placed on any individual.
The non-executive directors combine broad business and commercial experience with independent and objective judgement. The balance between non-executive and executive directors enables the Board to provide clear and effective leadership and maintain the highest standards of integrity across the company’s business activities. The names and biographies of all Board members are set out on page 61.
The composition of the Board is subject to continuing review and the provisions of the Code will be taken into account in respect of the balance of the Board. The Code requires the Board to determine whether its non-executive members are independent.
The Board currently comprises ten independent and seven non-independent directors (including executive directors), in addition to the Chairman. Sir Tom McKillop is Chairman-designate and Bob Scott has been nominated as the senior independent director.
The Board considers that all non-executive directors are independent for the purposes of the Code, with the exception of Bud Koch who was formerly Chairman, President and Chief Executive Officer of Charter One Financial, Inc. which was acquired by Citizens Financial Group, Inc. in 2004.
Re-election of directors
At each Annual General Meeting, one third of the directors retire and offer themselves for re-election and each director must stand for re-election at least once every three years. Any non-executive directors who have served for more than nine years will also stand for annual re-election and the Board may consider their independence at that time. The proposed reelection of directors is subject to prior review by the Board.
The names of directors standing for re-election at the 2006 Annual General Meeting are contained on page 63 and further information will be given in the Chairman’s letter to shareholders in relation to the company’s Annual General Meeting.
Information, induction and professional development
All directors receive accurate, timely and clear information on all relevant matters. Any requests for further information or clarification are dealt with or co-ordinated by the Group Secretary.
The Group Secretary is responsible for advising the Board, through the Chairman, on all governance matters. All directors have access to the advice and services of the Group Secretary who is responsible to the Board for ensuring that Board procedures are followed and that applicable rules and regulations are complied with. In addition, all directors are able, if necessary, to obtain independent professional advice at the company’s expense.
Each new director receives a formal induction, including visits to all the Group’s major businesses and meetings with senior management. The induction is tailored to the director’s specific requirements. Existing directors undertake such professional development as they consider necessary in assisting them to carry out their duties as directors.
67
Corporate governancecontinued
Performance evaluation
The annual performance evaluation of the Board and its Committees was undertaken in the autumn of 2005. The evaluation, which covered the operation and effectiveness of the Board, the Remuneration Committee and the Nominations Committee, was conducted by the Group Secretary using a detailed questionnaire and meetings with each director. Amongst the areas reviewed were the composition of the Board, Board processes and performance against objectives.
In addition, each director discussed his or her own performance with the Chairman and the senior independent director met individually with the executive directors and with the non-executive directors as a group without the Chairman present, to consider the Chairman’s performance. The report on the Board evaluation, which was designed to assist the Board in further improving its performance, was considered and discussed by the Board as a whole and specific actions are currently being implemented.
A review of the effectiveness of the Audit Committee was undertaken during the year by PricewaterhouseCoopers and was the subject of a separate report to the Board. Amongst the areas reviewed were the composition and performance of the Committee and the Committee’s role in relation to internal and external audit, risk management and financial reporting.
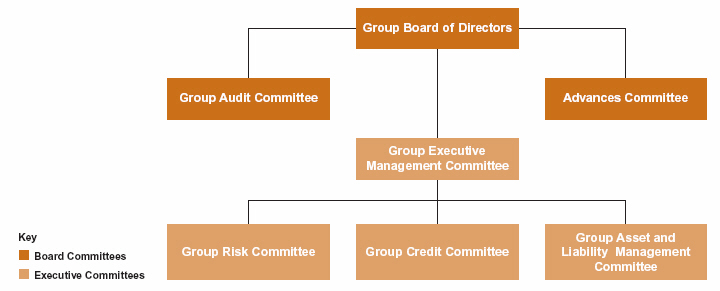
Board Committees
In order to provide effective oversight and leadership, the Board has established a number of Board Committees with particular responsibilities. The Committee chairmanship and membership are reviewed on a regular basis. The names and biographies of all Board Committee members are set out on page 61.
The terms of reference of the Audit, Remuneration and Nominations committees and the standard terms and conditions of the appointment of non-executive directors are available on the Group's website (www.rbs.com) and copies are available on request.
Audit Committee
All members of the Audit Committee are independent non-executive directors. The Audit Committee holds at least five meetings each year. The Audit Committee’s report is contained on pages 71 and 72.
Remuneration Committee
All members of the Remuneration Committee are independent non-executive directors. The Remuneration Committee holds at least three meetings each year.
The Remuneration Committee is responsible for assisting the Board in discharging its responsibilities and making all relevant disclosures in relation to the formulation and review of the Group’s executive remuneration policy. The Remuneration Committee makes recommendations to the Board on the remuneration arrangements for its executive directors and the Chairman. The Directors’ Remuneration Report is contained on pages 73 to 81.
Responsibility for determining the remuneration of executive directors has not been delegated to the Remuneration Committee, and in that sense the provisions of the Code have not been complied with. The Board as a whole reserves the authority to make the final determination of the remuneration of directors as it considers that this two stage process allows greater consideration and evaluation and is consistent with the unitary nature of the Board. No director is involved in decisions regarding his or her own remuneration.
Nominations Committee
The Nominations Committee comprises independent non-executive directors, under the chairmanship of the Chairman of the Board. The Nominations Committee meets as required.
The Nominations Committee is responsible for assisting the Board in the formal selection and appointment of directors. It considers potential candidates and recommends appointments of new directors to the Board. The appointments are based on merit and against objective criteria, including the time available to, and the commitment which will be required of, the potential director.
In addition, the Nominations Committee considers succession planning for the Chairman, Group Chief Executive and non-executive directors. The Nominations Committee takes into account the knowledge, mix of skills, experience and networks of contacts which are anticipated to be needed on the Board in the future. The Chairman, Group Chief Executive and non-executive directors meet to consider executive succession planning. No director is involved in decisions regarding his or her own succession.
The Board is aware of the other commitments of its directors and is satisfied that these do not conflict with their duties as non-executive directors of the company.
68
Meetings
The number of meetings of the Board and the Audit, Remuneration and Nominations Committees and individual attendance by members is shown below.
| | | Board | | Audit | | Remuneration | | Nominations |
|
|
|
|
|
|
|
|
|
| Total number of meetings | | | | | | | | |
| in 2005 | | 9 | | 9 | | 5 | | 5 |
|
|
|
|
|
|
|
|
|
| Number of meetings | | | | | | | | |
| attended in 2005 | | | | | | | | |
|
|
|
|
|
|
|
|
|
| Sir George Mathewson | | 9 | | – | | – | | 5 |
|
|
|
|
|
|
|
|
|
| Sir Tom McKillop* | | 2 | | – | | – | | 2 |
|
|
|
|
|
|
|
|
|
| Lord Vallance** | | 4 | | – | | – | | – |
|
|
|
|
|
|
|
|
|
| Sir Angus Grossart** | | 4 | | – | | – | | – |
|
|
|
|
|
|
|
|
|
| Sir Fred Goodwin | | 9 | | – | | – | | – |
|
|
|
|
|
|
|
|
|
| Mr Buchan | | 9 | | 8 | | 5 | | – |
|
|
|
|
|
|
|
|
|
| Dr Currie | | 9 | | – | | 5 | | – |
|
|
|
|
|
|
|
|
|
| Mr Fish | | 6 | | – | | – | | – |
|
|
|
|
|
|
|
|
|
| Mr Hunter | | 9 | | 9 | | – | | – |
|
|
|
|
|
|
|
|
|
| Mr Koch | | 9 | | – | | – | | – |
|
|
|
|
|
|
|
|
|
| Mr MacHale | | 9 | | 9 | | – | | – |
|
|
|
|
|
|
|
|
|
| Miss Mackay | | 9 | | 9 | | 5 | | – |
|
|
|
|
|
|
|
|
|
| Mr Pell | | 9 | | – | | – | | – |
|
|
|
|
|
|
|
|
|
| Mr Robertson** | | 3 | | – | | – | | – |
|
|
|
|
|
|
|
|
|
| Sir Steve Robson | | 9 | | 9 | | – | | – |
|
|
|
|
|
|
|
|
|
| Mr Scott | | 9 | | – | | 5 | | 4 |
|
|
|
|
|
|
|
|
|
| Mr Sutherland | | 8 | | – | | – | | 4 |
|
|
|
|
|
|
|
|
|
| Mr Watt | | 9 | | – | | – | | – |
|
|
|
|
|
|
|
|
|
* Sir Tom McKillop was appointed to the Board on 1 September 2005.
** Lord Vallance, Sir Angus Grossart and Iain Robertson retired from the Board on 20 April 2005.
Relations with shareholders
The company communicates with shareholders through the annual report and by providing information in advance of the Annual General Meeting. Individual shareholders can raise matters relating to their shareholdings and the business of the Group at any time throughout the year. Shareholders are given the opportunity to ask questions at the Annual General Meeting or submit written questions in advance. The chairmen of the Audit, Remuneration and Nominations Committees are available to answer questions at the Annual General Meeting.
Communication with the company’s largest institutional shareholders is undertaken as part of the company’s investor relations programme. During the year, the directors received copies of analysts’ reports and a monthly report from the Group’s investor relations department which includes an analysis of share price movements, the Group’s performance against the sector, and key broker comments. In addition, information on major investor relations activities and changes to external ratings are provided. In 2005, the senior independent director attended results presentations to enhance his understanding of the views of major shareholders and would be available to shareholders if concerns could not be addressed through the normal channels. The arrangements used to ensure that directors develop an understanding of the views of major shareholders are considered as part of the annual Board performance evaluation.
The Chairman, Group Chief Executive, Group Finance Director and, if appropriate, the senior independent director communicate shareholder views to the Board as a whole.
In 2005, a survey of investor perceptions was undertaken on behalf of the Board by independent advisers, and the findings were considered by the Board.
Internal control
The Board of directors is responsible for the Group’s system of internal control that is designed to facilitate effective and efficient operations and to ensure the quality of internal and external reporting and compliance with applicable laws and regulations. In devising internal controls, the Group has regard to the nature and extent of the risk, the likelihood of it crystallising and the cost of controls. A system of internal control is designed to manage, but not eliminate, the risk of failure to achieve business objectives and can only provide reasonable, and not absolute, assurance against the risk of material misstatement, fraud or losses.
The Board has established a process for the identification, evaluation and management of the significant risks faced by the Group, which operated throughout the year ended 31 December 2005 and to 27 February 2006, the date the directors approved the Report and Accounts. This process is regularly reviewed by the Board and meets the requirements of the guidance ‘Internal Control: Guidance for Directors on the Combined Code’ issued by the Institute of Chartered Accountants in England and Wales in 1999.
The effectiveness of the Group’s internal control system is reviewed regularly by the Board and the Audit Committee. Executive management committees or boards of directors in each of the Group’s businesses receive quarterly reports on significant risks facing their business and how they are being controlled. These reports are combined and submitted to the Board as quarterly risk and control assessments. Additional details of the Group’s approach to risk management are given in the ‘Risk management’ section of the ‘Operating and financial review’ on pages 38 to 58. The Audit Committee also receives regular reports from Group Risk Management and Group Internal Audit. In addition, the Group’s independent auditors present to the Audit Committee reports that include details of any significant internal control matters which they have identified. The system of internal controls of the authorised institutions and other regulated entities in the Group is also subject to regulatory oversight in the UK and overseas. Additional details of the Group’s regulatory oversight are given in the Supervision and Regulation section on pages 205 to 208.
69
Corporate governancecontinued
Disclosure controls and procedures
As required by US regulations, the Group Chief Executive and the Group Finance Director have evaluated the effectiveness of the company’s disclosure controls and procedures (as defined in the rules under the US Securities Exchange Act of 1934). This evaluation has been considered and approved by the Board which has authorised the Group Chief Executive and the Group Finance Director to certify that as at 31 December 2005, the company’s disclosure controls and procedures were adequate and effective and designed to ensure that material information relating to the company and its consolidated subsidiaries would be made known to them by others within those entities.
Changes in internal controls
There was no change in the company’s internal control over financial reporting that occurred during the period covered by this report that has materially affected, or is reasonably likely to materially affect, the company’s internal control over financial reporting.
70
Audit Committee Report
The members of the Audit Committee are Archie Hunter (Chairman), Colin Buchan, Joe MacHale, Eileen Mackay, until her retirement on 31 December 2005, and Sir Steve Robson. All members of the Audit Committee are independent non-executive directors. The Audit Committee holds at least five meetings each year, two of which are held immediately prior to submission of the interim and annual financial statements to the Group Board. This core agenda is supplemented by additional meetings as required, four being added in 2005. Audit Committee meetings are attended by relevant executive directors, the internal and external auditors and risk management executives. At least twice per annum the Committee meets privately with the external auditors. The Audit Committee also visits business divisions and certain Group functions under a programme set at the beginning of each year.
The Board is satisfied that all the Audit Committee members have recent and relevant financial experience. Although the Board has determined that each Member of the Audit Committee is an ‘Audit Committee Financial Expert’ and is independent, each as defined in the SEC rules under the US Securities Exchange Act of 1934 and related guidance, the members of the Audit Committee are selected with a view to the expertise and experience of the Audit Committee as a whole, and the Audit Committee reports to the Board as a single entity. The designation of a director or directors as an ‘Audit Committee Financial Expert’ does not impose on any such director any duties, obligations or liability that are greater than the duties, obligations and liability imposed on such director as a member of the Audit Committee and Board in the absence of such a designation. Nor does the designation of a director as an ‘Audit Committee Financial Expert’ affect the duties, obligations or liability of any other member of the Board.
The Audit Committee is responsible for:
- assisting the Board in discharging its responsibilities and inmaking all relevant disclosures in relation to the financialaffairs of the Group;
- reviewing accounting and financial reporting and regulatorycompliance;
- reviewing the Group’s systems of internal control; and
- monitoring the Group’s processes for internal audit, riskmanagement and external audit.
Full details of the responsibilities of the Audit Committee are available at www.rbs.com/content/corporate_responsibility/corporate_governance/downloads/group_audit.pdf.
The Audit Committee has adopted a policy on the engagement of the external auditors to supply audit and non-audit services, which takes into account relevant legislation regarding the provision of such services by an external audit firm. The Audit Committee reviews the policy annually and prospectively approves the provision of audit services and certain non-audit services by the external auditors.
Annual audit services include all services detailed in the annual engagement letter including the annual audit and interim reviews (including US reporting requirements), periodic profit verifications and reports to regulators including skilled persons reports commissioned by the Financial Services Authority (e.g. Reporting Accountants Reports).
Annual audit services also include statutory or non-statutory audits required by any Group companies that are not incorporated in the United Kingdom. Terms of engagement for these audits are agreed separately with management, and are consistent with those set out in the audit engagement letter, as local regulations permit.
The prospectively approved non-audit services include the following classes of service:
- capital raising, including consents, comfort letters andrelevant reviews of registration statements;
- provision of accounting opinions relating to the financialstatements of the Group;
- provision of reports that, according to law or regulation,must be rendered by the external auditors;
- tax compliance services;
- corporate finance services relative to companies that willremain outside the Group; and
- insolvency work relating to the Group’s customers.
The Audit Committee approves all other permitted non-audit services on a case by case basis. The relevant submissions by management outline the service required and confirm that the external auditor’s independence will not be compromised. In addition, the Audit Committee reviews and monitors the independence and objectivity of the external auditors when it approves non-audit work to be carried out by them, taking into consideration relevant legislation and ethical guidance.
Information on the audit and non-audit services carried out by the external auditors is detailed in Note 4 to the Group’s accounts.
The Audit Committee undertakes an annual evaluation to assess the independence and objectivity of the external auditors and the effectiveness of the audit process, taking into consideration relevant professional and regulatory requirements. The results of this evaluation are reported to the Board.
The Audit Committee makes recommendations to the Board for it to put to the Shareholders for their approval at the Annual General Meeting, in relation to the appointment, re-appointment and removal of Deloitte & Touche LLP as the external auditors and to approve the remuneration and terms of engagement of the external auditors.
71
Corporate governancecontinued
In 2004 KPMG conducted a review of the effectiveness of Group Internal Audit. It is intended that there will be an external review of the effectiveness of Group Internal Audit every three years, with internal reviews continuing in the intervening years. In 2005 the Audit Committee conducted a review of Group Internal Audit that involved cross Group participation and the external auditors.
During 2005 PricewaterhouseCoopers conducted an external review of the effectiveness of the Audit Committee. It is intended that there will be an external review of the effectiveness of the Audit Committee every three years, with internal reviews by the Board continuing in the intervening years.
In 2005 the Audit Committee reviewed the audit committee structure throughout the Group and as a result proposed to the Board a reorganisation and strengthening of the structure to ensure that audit committees would cover each separate Group business appropriately. That recommendation was accepted by the Board and is now being implemented.
72
Directors’ remuneration report
The Remuneration Committee
The members of the Remuneration Committee are Bob Scott (Chairman), Colin Buchan, Jim Currie and Eileen Mackay, until her retirement on 31 December 2005. All members of the Remuneration Committee are independent non-executive directors.
During the accounting period, the Remuneration Committee received advice from Watson Wyatt, Mercer Human Resource Consulting and Ernst & Young LLP on matters relating to directors’ remuneration in the UK (Watson Wyatt and Ernst & Young) and US (Mercer). In addition, the Remuneration Committee has taken account of the views of the Chairman of the Board and the Group Chief Executive on performance assessment of the executive directors.
In addition to advising the Remuneration Committee, Watson Wyatt provided professional services in the ordinary course of business, including actuarial advice and benefits administration services to subsidiaries of the Group and investment consulting advice to The Royal Bank of Scotland Pension Trustees Limited. Mercer Human Resource Consulting provided advice and support in connection with a range of benefits, pension actuarial and investment matters. Ernst & Young provided professional services in the ordinary course of business, including actuarial and corporate recovery advice.
Remuneration policy
The executive remuneration policy was approved by shareholders at the company’s Annual General Meeting in 2005. At the beginning of 2005, the Remuneration Committee decided to conduct a comprehensive review of all aspects of the executive remuneration package. A review of this depth had not been undertaken since 2000/2001. Its terms of reference were to examine all aspects of the executive remuneration strategy, policy and practice in light of the changing business make up and strategy of the Group and the evolution of best practice on executive remuneration. Following this review, the Remuneration Committee made no change to the overall executive remuneration policy, which is set out below. However, as a result of this review, the Group is making a number of changes to executive director remuneration practice which are described below.
The objective of the executive remuneration policy is to provide, in the context of the company’s business strategy, remuneration in form and amount which will attract, motivate and retain high calibre executives. In order to achieve this objective, the policy is framed around the following core principles:
- Total rewards will be set at levels that are competitive withinthe relevant market, taking each executive director’sremuneration package as a whole.
- Total potential rewards will be earned through achievementof demanding performance targets based on measuresconsistent with shareholder interests over the short, mediumand longer-term.
- Remuneration arrangements will strike an appropriate balancebetween fixed and performance-related rewards. Performance-related elements will comprise the major part of executiveremuneration packages. See illustrative charts below.
- Incentive plans and performance metrics will be structuredto be robust through the business cycle.
- Remuneration arrangements will be designed to support thecompany’s business strategy, to promote appropriateteamwork and to conform to best practice standards.
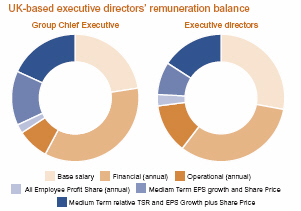
The above diagram has been prepared to illustrate the use of performance metrics in the total compensation package. For the Group Chief Executive 22% of the package is fixed and 78% is performance related. For the other executive directors, 28% is fixed and 72% is performance related. Values are entered on the basis of on target performance; long term incentives are shown at the approximate expected value at grant. Pension and other benefits have been excluded. Financial metrics include profit growth, cost control and ROE.
The non-executive directors’ fees are reviewed annually by the Board, on the recommendation of its Chairman. The level of remuneration reflects the responsibility and time commitment of directors and the level of fees paid to non-executive directors of comparable major UK companies. Non-executive directors do not participate in any incentive or performance plan.
The Remuneration Committee approves the remuneration arrangements of senior executives below Board level who are members of the Group Executive Management Committee, on the recommendation of the Group Chief Executive, and reviews all long-term incentive arrangements which are operated by the Group.
Components of executive remuneration
UK based directors
Salary
Salaries are reviewed annually as part of total remuneration, having regard to remuneration packages received by executives of comparable companies. The Remuneration Committee uses a range of survey data from remuneration consultants and reaches individual salary decisions taking account of the remuneration environment and the performance and responsibilities of the individual director.
Benefits
UK-based executive directors are eligible to participate in The Royal Bank of Scotland Group Pension Fund (“the RBS Fund”).
73
Directors’ remuneration reportcontinued
The RBS Fund is a non-contributory defined benefit fund which provides pensions and other benefits within Inland Revenue limits. Certain directors receive additional pension and life assurance benefits in excess of Inland Revenue limits. Details of pension arrangements of directors are shown on page 81.
From April 2006, new tax legislation will apply to UK pensions; in particular any pension in excess of the Lifetime Allowance will be subject to additional taxation. The Group will allow directors and employees whose benefits do, or are likely to exceed the Lifetime Allowance to opt-out of future tax-approved pension provision. In such cases the Group will pay the individual a salary supplement in lieu of pension provision. The Group will not meet the cost of any additional tax that individuals may incur as a result of their benefits exceeding the new Lifetime or Annual Allowances.
Executive directors are eligible to receive a choice of various employee benefits or a cash equivalent, on a similar basis to other employees. In addition, as employees, executive directors are eligible also to participate in Sharesave, Buy As You Earn and the Group profit sharing scheme, which currently pays up to 10 per cent of salaries, depending on the Group’s performance. These schemes are not subject to performance conditions since they are operated on an all-employee basis. Executive directors also receive death-in-service benefits.
Short-term annual incentives
As part of the overall review of the executive remuneration package referred to above, short term incentive levels were considered and the Remuneration Committee agreed to increase annual incentive potentials to reflect market practice and the setting of stretching new targets. As a result, from 2006 individual UK-based executive directors will normally have a maximum annual incentive potential of between 160% and 200% of salary. These will typically focus from year to year on the delivery of a combination of appropriate Group and individual financial and operational targets approved by the Remuneration Committee.
For the Group Chief Executive, the annual incentive is primarily based on specific Group financial performance measures such as operating profit, earnings per share growth and return on equity. The remainder of the Group Chief Executive’s annual incentive is based on a range of non-financial measures which may include measures relating to shareholders, customers and staff.
For the other executive directors a proportion of the annual incentive is based on Group financial performance and a proportion on division financial performance. The remainder of each individual’s annual incentive opportunity is dependent on achievement of a range of non-financial measures, specific objectives and key result areas. Divisional performance includes measures such as operating income, costs, bad debts or operating profit. Non-financial measures include customer measures (e.g. customer numbers, customer satisfaction), staff measures (e.g. employee engagement) and efficiency and change objectives.
For exceptional performance, as measured by the achievement of significant objectives, executive directors may be awarded incentive payments of up to 200% of salary, or 250% of salary, in the case of the Group Chief Executive. This discretion to pay additional bonuses for exceptional performance was last used in 2002 to recognise the successful integration of Natwest.
Long-term incentives
The company provides long-term incentives in the form of share options and share or share equivalent awards. Their objective is to encourage the creation of value over the long-term and to align the rewards of the executive directors with the returns to shareholders.
The Group’s policy is to encourage executives to hold shares and retain vested long-term incentives. This policy has successfully built high levels of shareholdings and equity participation amongst executives. A table showing directors’ interests in shares and the estimated value of the shares and vested long term incentives held by executives is shown on page 82. In light of the already high levels of share price exposure, the Remuneration Committee is not proposing to introduce mandatory or guideline shareholding requirements for executives at this time.
Medium-term performance plan
The medium-term performance plan (“MPP”) was approved by shareholders in April 2001. Each executive director is eligible for an annual award under the plan in the form of share or share equivalent awards. Whilst the rules of the plan allow awards over shares worth up to one and a half times earnings, the Remuneration Committee has adopted a policy of granting awards based on a multiple of salary. Normally awards are made at one times salary to executive directors, with one and a half times salary being granted in the case of the Group Chief Executive. No changes will be made to this policy without prior consultation with shareholders. All awards under the plan are subject to three-year performance targets.
The award in 2005 is subject to two performance measures. First, the annual growth in the company’s earnings per share (“EPS”) must exceed the annualised growth of the Retail Prices Index (“RPI”) plus three per cent. If this condition is satisfied, the company’s total shareholder return (“TSR”) is compared with the TSR of a comparator group of companies. The companies are Aviva plc; Banco Santander Central Hispano S.A. (“BSCH”); Barclays PLC; Citigroup inc.; HBOS plc; HSBC Holdings PLC; Legal & General Group plc; Lloyds TSB Group plc; Prudential plc and Standard Chartered PLC. Awards made under the plan will not vest if the company’s TSR is below the median of the comparator group. Achievement of the EPS target and median TSR performance against the comparator companies will result in vesting of 25% of the award, increasing to 200% if the company achieves a TSR ranking at first position in the comparator group and exceeds the TSR of the second placed comparator company by at least 34%.
During 2005, the Remuneration Committee reviewed all elements of the plan including the performance conditions, the vesting schedule and the comparator group. As a result, it is intended that for awards made from 2006, 50% of the award will vest on a relative TSR measure and 50% will vest on growth in adjusted EPS over the three year performance period.
74
The introduction of the EPS element is designed to ensure that the plan includes a performance measure which is in the clear line of sight for the participants and which reflects the business strategy for the next few years.
For the TSR element, vesting will be based on the level of outperformance by the Group of the median of the comparator group TSR over the performance period. The Remuneration Committee believes this method of measuring relative TSR performance provides a more approriate measure of management performance. This change is permitted under the rules of the plan. Awards made under the plan will not vest if the company’s TSR is below the median of the comparator group. Achievement of median TSR performance against comparator companies will result in vesting of 25% of the award. Outperformance of median TSR performance by up to 9% will result in vesting on a straight-line basis from 25% to 125%, outperformance by 9% to 18% will result in vesting on a straight-line basis from 125% to 200%. Vesting at 200% will occur if the company outperforms the median TSR performance of the comparator group by at least 18%.
Following the Remuneration Committee’s review of the plan, the comparator group was amended to comprise UK and international banking groups, which the Remuneration Committee considers more appropriate in the context of the Group’s business and performance. For awards made from 2006, the companies in the comparator group will be ABN Amro Holdings N.V.; BSCH; Barclays PLC; Citigroup Inc; HBOS plc; HSBC Holdings plc; Lloyds TSB Group plc and Standard Chartered PLC.
For the EPS element, the level of EPS growth over the three year period will be calculated by comparing the adjusted EPS in the year prior to the year of grant with that in the final year of the performance period. Each year the vesting schedule for the EPS growth measure will be agreed by the Remuneration Committee at the time of grant, having regard to the business plan, performance relative to comparators and analysts’ forecasts.
Options
The executive share option scheme was approved by shareholders in January 1999. The operation of the scheme was reviewed as part of the overall executive remuneration review and the Remuneration Committee is satisfied that no changes are required. Each executive director is eligible for an annual grant of an option, exercisable at the market price at the time of grant. Options granted to executive directors are typically over shares worth one and a quarter times salary with an upper maximum in appropriate circumstances of two and a half times salary, over shares at the market value at date of grant. No payment is made by the executive director on the grant of an option award.
All executive share option grants are subject to a performance condition which is reviewed by the Remuneration Committee annually. The performance target is currently that the options are exercisable only if, over a three year period from the date of grant, the growth in the company’s EPS has exceeded the growth in the RPI plus nine per cent. This EPS performance target, which is consistent with market practice, measuresunderlying financial performance and represents a long-term test of performance. For awards made from 2004, there is no re-testing of the performance condition.
US based director – Lawrence Fish
Lawrence Fish's total remuneration package was reviewed in 2004 by the Remuneration Committee as a result of the acquisition of Charter One and his changing RBS responsibilities in North America. A new cash long-term incentive plan was approved by shareholders at the 2005 Annual General Meeting. The remuneration policy for Mr Fish is as follows:
Base salary is set having regard to the levels of base salary in other US banks and the appropriate balance of fixed and variable remuneration for US based executives of UK listed companies operating within the corporate governance frameworks of the UK.
Benefits Mr Fish accrues pension benefits under a number of arrangements in the US. Details are provided on page 81. In addition he is entitled to receive other benefits on a similar basis to other Citizens employees.
Short term performance rewards take the form of an annual incentive plan which rewards the achievement of Group, business unit and individual financial and non-financial targets. The normal maximum annual bonus potential is two times salary, although additional amounts to a maximum of a further two times salary may be awarded, at the discretion of the Board, for exceptional performance as measured by the achievement of significant objectives.
Long term incentives consist of the following components:
- The two grants made under the Citizens Phantom 2000 Planvested on 1 January 2005 and 1 January 2006, respectively.
The value of units at the time of vesting is performance-linked and is based on the cumulative economic profitgenerated by Citizens, the trend in economic profit and onthe external market trends in the US banking sector, usingprice/earnings ratios of comparator US banks. This measurewas chosen to establish a clear link between the potentialincentive and the performance of Citizens. No other grantswill be made under this plan.
- A grant under the RBS medium-term performance planwithin the levels, and on the same terms, available to UKbased executives.
- A grant under the executive share option scheme within thelevels, and on the same terms, available to UK basedexecutives.
- A grant under the new Citizens Long Term Incentive Plan.Performance is measured on a combination of Growth inProfit before Tax and Relative Return on Equity based ona comparison of Citizens with comparator US banks. Thetargets for this plan are set on an annual basis over the threeyear term of the grant.
75
Directors’ remuneration reportcontinued
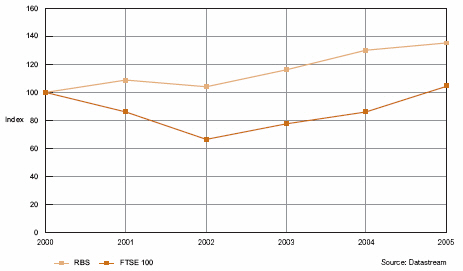
Total shareholder return performance
The undernoted performance graph illustrates the performance of the company over the past five years in terms of total shareholder return compared with that of the companies comprising the FTSE 100 index. This index has been selected because it represents a cross-section of leading UK companies. The total shareholder return for the company and the FTSE 100 have been rebased to 100 for 2000.
Total shareholder return
Service contracts
The company’s policy in relation to the duration of contracts with directors is that executive directors’ contracts generally continue until termination by either party, subject to the required notice, or until retirement date. The notice period under the service contracts of executive directors will not normally exceed 12 months. In relation to newly recruited executive directors, subject to the prior approval of the Remuneration Committee, the notice period from the employing company required to terminate the contract will not normally exceed 12 months unless there is a clear case for this. Where a longer period of notice is initially approved on appointment, it will normally be structured such that it will automatically reduce to 12 months in due course.
All new service contracts for executive directors will be subject to approval by the Remuneration Committee. Those contracts will normally include standard clauses covering the performance review process, the company’s normal disciplinary procedure, and terms for dismissal in the event of failure to perform or in situations involving actions in breach of the Group’s policies.
Any compensation payment made in connection with the departure of an executive director will be subject to approval by the Remuneration Committee, having regard to the terms of the service contract and the reasons for termination.
Information regarding executive directors’ service contracts is summarised in the table and notes below.
| Name | | Date of current contract/
Employing company | | Normal retirement age | | Notice period –
from company | | Notice period –
from executive |
|
|
|
|
|
|
|
|
|
| Sir Fred Goodwin | | 1 August 1998 | | 60 | | 12 months | | 6 months |
| | | The Royal Bank of Scotland plc | | | | | | |
| | | | | | | | | |
| Mr Pell | | 20 February 2006 | | 60 | | 12 months | | 6 months |
| | | The Royal Bank of Scotland plc | | | | | | |
| | | | | | | | | |
| Mr Watt* | | 28 September 2000 | | 60 | | 12 months | | 6 months |
| | | The Royal Bank of Scotland plc | | | | | | |
| | | | | | | | | |
| Mr Fish | | 18 February 2004 | | 65 | | 12 months | | 12 months |
| | | Citizens Financial Group, Inc. | | | | | | |
|
|
|
|
|
|
|
|
|
* Mr Watt resigned as a director on 31 January 2006.76
Except as noted below, in the event of severance of contract where any contractual notice period is not worked, the employing company may pay a sum to the executive in lieu of this period of notice. Any such payment would, at maximum, comprise base salary and a cash value in respect of fixed benefits (including pension plan contributions). In the event of situations involving breach of the employing company’s policies resulting in dismissal, reduced or no payments may be made to the executive. Depending on the circumstances of the termination of employment, the executive may be entitled, or the Remuneration Committee may exercise its discretion to allow, the executive to exercise outstanding awards under long-term incentive arrangements subject to the rules of relevant plan. The exception to these severance arrangements relates only to Mr Fish.
If Mr Fish’s contract is terminated without cause, or if he terminates the contract for good reason (as defined in the contract), he is entitled to a lump sum payment to compensate him for the loss of 12 months salary plus annual bonus. Mr Fish would also be entitled to receive for this period health, life insurance and long term disability coverage and any other benefits determined in accordance with the plans, policies and practices of Citizens at the time of termination. The Remuneration Committee has been advised that these termination provisions are less generous than the current market practice in the US.
Group Finance Director – Guy Whittaker
Guy Whittaker was appointed Group Finance Director on 1 February 2006 and has a service contract with The Royal Bank of Scotland plc dated 19 December 2005. This service contract provides for a normal retirement age of 60 and may be terminated by either party giving 12 months notice to the other.
In accordance with normal market practice, Mr Whittaker will be recompensed for the value of restricted stock and unvested options he forfeited on his departure from his previous employer. In this respect he will be provided with ordinary shares in The Royal Bank of Scotland Group plc worth £1,000,000 and restricted stock worth £1,450,000, the latter vesting in 3 tranches between 2007 and 2009. As Mr Whittaker forfeited his performance bonus from his previous employer, he received a cash payment of £1,195,181 and will receive restricted stock worth £962,785, the latter vesting in 4 tranches between 2007 and 2010. The provision of ordinary shares and the vesting of restricted stock is subject to certain conditions set out in Mr Whittaker’s service contract.
As Group Finance Director, Mr Whittaker will be eligible to receive short-term annual incentives and long-term incentives on the same basis as other UK-based executive directors.
Chairman and non-executive directors
The original date of appointment as a director of the company and the latest date for the next re-election are as follows:
| | | Date first appointed | | Latest date for
next re-election |
|
|
|
|
|
| Sir George Mathewson | | 1 September 1987 | | retires 28 April 2006 |
| Sir Tom McKillop | | 1 September 2005 | | 2006 |
| Mr Buchan | | 1 June 2002 | | 2006 |
| Dr Currie | | 28 November 2001 | | 2008 |
| Mr Hunter | | 1 September 2004 | | 2008 |
| Mr Koch | | 29 September 2004 | | 2008 |
| Mrs Kong | | 1 January 2006 | | 2006 |
| Mr MacHale | | 1 September 2004 | | 2008 |
| Sir Steve Robson | | 25 July 2001 | | 2008 |
| Mr Scott | | 31 January 2001 | | 2006 |
| Mr Sutherland | | 31 January 2001 | | 2006 |
|
|
|
|
|
The non-executive directors do not have service contracts or notice periods although they have letters of engagement reflecting their responsibilities and commitments. Under the company’s articles of association, all directors must retire by rotation and seek re-election by shareholders at least every three years. The dates in the table above reflect the latest date for re-election. However, in 2007, at least one-third of the Board will retire by rotation as required by the company’s articles of association. No compensation would be paid to the Chairman or to any non-executive director in the event of early termination.
The tables and explanatory notes on pages 78 to 80 report the remuneration of each director for the year ended 31 December 2005 and have been audited by the company’s auditors, Deloitte & Touche LLP.
77
Directors’ remuneration report continued
| Directors’ remuneration | | | | | | | | | | |
| | | Salary/
fees
£000 | | Performance
bonus*
£000 | | Benefits
£000 | | 2005
Total
£000 | | 2004
Total
£000 |
|
|
|
|
|
|
|
|
|
|
|
| Chairman | | | | | | | | | | |
| Sir George Mathewson | | 579 | | — | | 28 | | 607 | | 581 |
| | | | | | | | | | | |
| Executive directors | | | | | | | | | | |
| Sir Fred Goodwin | | 1,090 | | 1,760 | | 43 | | 2,893 | | 2,522 |
| Mr Fish ** | | 824 | | 1,649 | | 36 | | 2,509 | | 2,305 |
| Mr Pell | | 751 | | 825 | | 10 | | 1,586 | | 1,403 |
| Mr Watt | | 669 | | 726 | | 4 | | 1,399 | | 1,268 |
|
|
|
|
|
|
|
|
|
|
|
| * | includes 10% profit sharing |
| ** | Mr Fish is a non-executive director of Textron Inc. and retains the fees paid to him in this respect. For 2005, he received a remuneration package from Textron Inc. equivalent to approximately US$75,400. |
| Non-executive directors | | Board fees
£000 | | Board
committee fees
£000 | | 2005
Total
£000 | | 2004
Total
£000 |
|
|
|
|
|
|
|
|
|
| Deputy Chairman | | | | | | | | |
| Sir Tom McKillop (appointed 1 September 2005) | | 67 | | — | | 67 | | — |
| Vice-chairmen | | | | | | | | |
| Lord Vallance of Tummel (retired 20 April 2005) | | 33 | | — | | 33 | | 100 |
| Sir Angus Grossart (retired 20 April 2005) | | 33 | | — | | 33 | | 100 |
| | | | | | | | | |
| Mr Buchan | | 55 | | 54 | | 109 | | 100 |
| Dr Currie | | 55 | | 13 | | 68 | | 60 |
| Mr Hunter | | 55 | | 58 | | 113 | | 22 |
| Mr Koch† | | 55 | | — | | 55 | | 12 |
| Mr MacHale | | 55 | | 25 | | 80 | | 22 |
| Miss Mackay (retired 31 December 2005) | | 55 | | 38 | | 93 | | 75 |
| Mr Robertson (retired 20 April 2005) | | 33 | | — | | 33 | | 100 |
| Sir Steve Robson | | 55 | | 25 | | 80 | | 65 |
| Mr Scott* | | 100 | | — | | 100 | | 73 |
| Mr Sutherland | | 55 | | 5 | | 60 | | 53 |
|
|
|
|
|
|
|
|
|
| † | In addition to his role as a non-executive director, Mr Koch has an agreement with Citizens Financial Group, Inc. to provide consulting services for a period of three years following the acquisition by Citizens of Charter One Financial, Inc. For these services Mr Koch receives $402,500 per annum. |
| * | Mr Scott’s senior independent director fee covers all Board and Board Committee work including Chairmanship of the Remuneration Committee. |
| | No director received any expense allowances chargeable to UK income tax or compensation for loss of office/termination payment. The non-executive directors did not receive any bonus payments or benefits. |
78
Share options
Options to subscribe for ordinary shares of 25p each in the company granted to, and exercised by, directors during the year to 31 December 2005 are included in the table below:
| | | Options exercised in 2005 | | | | | |
| | | Options held at
1 January
2005 | | Options
granted in
2005 | | | | Market price at
date of exercise
£ | | Option price
£ | | Options held at 31 December 2005 | |
| | | | | Number | | | | Number | | Exercise period | |
|
|
|
|
|
|
|
|
|
|
|
|
|
|
|
|
| Sir George Mathewson | | 69,257 | | | | | | | | 9.33 | | 69,257 | | 11.05.01 – 10.05.08 | |
| | | 147,247 | | | | | | | | 7.81 | | 147,247 | | 29.03.03 – 28.03.10 | |
| | | 150 | | | | | | | | 12.40 | | 150 | | 09.08.03 – 08.08.06 | * |
| | | 20,100 | | | | | | | | 17.18 | | 20,100 | | 14.08.04 – 13.08.11 | |
| | | 1,347 | | | | | | | | 13.64 | | 1,347 | | 01.10.08 – 31.03.09 | * |
| | | 19,500 | | | | | | | | 18.18 | | 19,500 | | 14.03.05 – 13.03.12 | |
| | | 36,400 | | | | | | | | 12.37 | | 36,400 | | 13.03.06 – 12.03.13 | |
| | | 36,044 | | | | | | | | 17.34 | | 36,044 | | 11.03.07 – 10.03.14 | |
| | | | | 41,570 | | | | | | 17.29 | | 41,570 | | 10.03.08 – 09.03.15 | |
|
|
|
|
|
|
|
|
|
|
|
|
|
|
|
|
| | | 330,045 | | 41,570 | | | | | | | | 371,615 | | | |
|
|
|
|
|
|
|
|
|
|
|
|
|
|
|
|
| Sir Fred Goodwin | | 164,571 | | | | | | | | 8.75 | | 164,571 | | 07.12.01 – 06.12.08 | |
| | | 2,963 | | | | | | | | 11.18 | | 2,963 | | 04.03.02 – 03.03.09 | |
| | | 27,306 | | | | | | | | 11.97 | | 27,306 | | 03.06.02 – 02.06.09 | |
| | | 153,648 | | | | | | | | 7.81 | | 153,648 | | 29.03.03 – 28.03.10 | |
| | | 43,700 | | | | | | | | 17.18 | | 43,700 | | 14.08.04 – 13.08.11 | |
| | | 1,713 | | | | 1,713 | | 16.19 | | 9.85 | | – | | | |
| | | 41,300 | | | | | | | | 18.18 | | 41,300 | | 14.03.05 – 13.03.12 | |
| | | 72,800 | | | | | | | | 12.37 | | 72,800 | | 13.03.06 – 12.03.13 | |
| | | 144,175 | | | | | | | | 17.34 | | 144,175 | | 11.03.07 – 10.03.14 | |
| | | | | 159,051 | | | | | | 17.29 | | 159,051 | | 10.03.08 – 09.03.15 | |
| | | | | 1,267 | | | | | | 13.04 | | 1,267 | | 01.10.10 – 31.03.11 | * |
|
|
|
|
|
|
|
|
|
|
|
|
|
|
|
|
| | | 652,176 | | 160,318 | | 1,713 | | | | | | 810,781 | | | |
|
|
|
|
|
|
|
|
|
|
|
|
|
|
|
|
| Mr Fish | | 107,877 | | | | | | | | 9.33 | | 107,877 | | 11.05.01 – 10.05.08 | |
| | | 150 | | | | | | | | 12.40 | | 150 | | 09.08.03 – 08.08.06 | * |
| | | | | 37,603 | | | | | | 17.29 | | 37,603 | | 10.03.08 – 09.03.15 | |
|
|
|
|
|
|
|
|
|
|
|
|
|
|
|
|
| | | 108,027 | | 37,603 | | | | | | | | 145,630 | | | |
|
|
|
|
|
|
|
|
|
|
|
|
|
|
|
|
| Mr Pell | | 51,216 | | | | | | | | 7.81 | | 51,216 | | 29.03.03 – 28.03.10 | |
| | | 29,100 | | | | | | | | 17.18 | | 29,100 | | 14.08.04 – 13.08.11 | |
| | | 27,600 | | | | | | | | 18.18 | | 27,600 | | 14.03.05 – 13.03.12 | |
| | | 49,800 | | | | | | | | 12.37 | | 49,800 | | 13.03.06 – 12.03.13 | |
| | | 47,217 | | | | | | | | 17.34 | | 47,217 | | 11.03.07 – 10.03.14 | |
| | | | | 50,607 | | | | | | 17.29 | | 50,607 | | 10.03.08 – 09.03.15 | |
|
|
|
|
|
|
|
|
|
|
|
|
|
|
|
|
| | | 204,933 | | 50,607 | | | | | | | | 255,540 | | | |
|
|
|
|
|
|
|
|
|
|
|
|
|
|
|
|
| Mr Robertson** | | 56,635 | | | | | | | | 9.33 | | 56,635 | | 11.05.01 – 10.05.08 | |
| | | 82,654 | | | | | | | | 11.18 | | 82,654 | | 04.03.02 – 03.03.09 | |
| | | 128,040 | | | | | | | | 7.81 | | 128,040 | | 29.03.03 – 28.03.10 | |
| | | 36,400 | | | | | | | | 17.18 | | 36,400 | | 14.08.04 – 13.08.11 | |
|
|
|
|
|
|
|
|
|
|
|
|
|
|
|
|
| | | 303,729 | | | | | | | | | | 303,729 | | | |
|
|
|
|
|
|
|
|
|
|
|
|
|
|
|
|
| Mr Watt*** | | 70,148 | | | | | | | | 12.83 | | 70,148 | | 04.09.03 – 03.09.10 | |
| | | 23,300 | | | | | | | | 17.18 | | 23,300 | | 14.08.04 – 13.08.11 | |
| | | 22,100 | | | | | | | | 18.18 | | 22,100 | | 14.03.05 – 13.03.12 | |
| | | 42,500 | | | | | | | | 12.37 | | 42,500 | | 13.03.06 – 12.03.13 | |
| | | 43,253 | | | | | | | | 17.34 | | 43,253 | | 11.03.07 – 10.03.14 | |
| | | | | 57,259 | | | | | | 17.29 | | 57,259 | | 10.03.08 – 09.03.15 | |
|
|
|
|
|
|
|
|
|
|
|
|
|
|
|
|
| | | 201,301 | | 57,259 | | | | | | | | 258,560 | | | |
|
|
|
|
|
|
|
|
|
|
|
|
|
|
|
|
| * | Options held under the sharesave and option 2000 schemes, which are not subject to performance conditions. |
| ** | Mr Robertson retired from the Board on 20 April 2005. |
| *** | Mr Watt resigned from the Board on 31 January 2006. |
The performance conditions for options granted in 2005 are detailed on page 75.
79
Directors’ remuneration reportcontinued
No options had their terms and conditions varied during the accounting period to 31 December 2005. No payment is required on the award of an option.
The executive share options which are exercisable from March 2002 onwards are subject to the satisfaction of an EPS growth target which provides that options are exercisable only if, over a three year period, the growth in the company’s EPS has exceeded the growth in the RPI plus 9%. In respect of executive share options exercisable before March 2002 the performance condition is that the growth in the company’s EPS over threeyears has exceeded the growth in the RPI plus 6%.
The market price of the company’s ordinary shares at 31 December 2005 was £17.55 and the range during the year to 31 December 2005 was £15.22 to £18.33.
In the ten year period to 31 December 2005, awards made using new issue shares under the company’s share plans represented 4.62% of the company’s issued ordinary share capital, leaving an available dilution headroom of 5.38%.
Medium Term Performance Plan
| | Scheme interests
(share equivalents) at
1 January 2005 | | Awards
granted
in 2005 | | Market
price on
award
£ | | Awards
vested in
2005* | | Awards
exercised
in 2005 | | Market
price on
exercise
£ | | Share interest
(share
equivalents) at
31 December 2005 | | End of period
for qualifying
conditions to
be fulfilled |
|
|
|
|
|
|
|
|
|
|
|
|
|
|
|
|
|
| Sir Fred Goodwin | | 93,040 | | | | 16.35 | | | | | | | | 93,040 | | vested 31.12.03 |
| | | 33,855 | | | | 18.59 | | | | | | | | 33,855 | | vested 31.12.04 |
| | | 78,398 | | | | 17.22 | | Nil | | | | | | — | | vested 31.12.05 |
| | | 86,506 | | | | 17.34 | | | | | | | | 86,506 | | 31.12.06 |
| | | | | 95,431 | | 17.29 | | | | | | | | 95,431 | | 31.12.07 |
|
|
|
|
|
|
|
|
|
|
|
|
|
|
|
|
|
| | | 291,799 | | | | | | | | | | | | 308,832 | | |
|
|
|
|
|
|
|
|
|
|
|
|
|
|
|
|
|
| Mr Fish | | 35,274 | | | | 17.34 | | | | | | | | 35,274 | | 31.12.06 |
| | | | | 10,495 | | 17.29 | | | | | | | | 10,495 | | 31.12.07 |
|
|
|
|
|
|
|
|
|
|
|
|
|
|
|
|
|
| | | 35,274 | | | | | | | | | | | | 45,769 | | |
|
|
|
|
|
|
|
|
|
|
|
|
|
|
|
|
|
| Mr Pell | | 22,026 | | | | 16.35 | | | | | | | | 22,026 | | vested 31.12.03 |
| | | 22,570 | | | | 18.59 | | | | 22,570 | | 17.87 | | — | | vested 31.12.04 |
| | | 35,715 | | | | 17.22 | | Nil | | | | | | — | | vested 31.12.05 |
| | | 37,774 | | | | 17.34 | | | | | | | | 37,774 | | 31.12.06 |
| | | | | 40,486 | | 17.29 | | | | | | | | 40,486 | | 31.12.07 |
|
|
|
|
|
|
|
|
|
|
|
|
|
|
|
|
|
| | | 118,085 | | | | | | | | | | | | 100,286 | | |
|
|
|
|
|
|
|
|
|
|
|
|
|
|
|
|
|
| Mr Robertson** | | 77,533 | | | | 16.35 | | | | 77,533 | | 17.05 | | — | | vested 31.12.03 |
|
|
|
|
|
|
|
|
|
|
|
|
|
|
|
|
|
| Mr Watt | | 18,877 | | | | 18.59 | | | | | | | | 18,877 | | vested 31.12.04 |
| | | 30,488 | | | | 17.22 | | Nil | | | | | | — | | vested 31.12.05 |
| | | 34,603 | | | | 17.34 | | | | | | | | 34,603 | | 31.12.06 |
| | | | | 38,173 | | 17.29 | | | | | | | | 38,173 | | 31.12.07 |
|
|
|
|
|
|
|
|
|
|
|
|
|
|
|
|
|
| | | 83,968 | | | | | | | | | | | | 91,653 | | |
|
|
|
|
|
|
|
|
|
|
|
|
|
|
|
|
|
| * | Awards were granted on 12 June 2003. The vesting level was nil and these awards have now lapsed. |
| ** | The exercise of awards for Mr Robertson occurred after his retirement from the Group Board on 20 April 2005. |
Note:
For any awards that have vested, participants holding option-based awards can exercise their right over the underlying share equivalents at any time up to ten years from the date of grant.
No variation was made to any of the terms of the plan during the year. The performance measures are detailed on pages 74 and 75.
| Phantom 2000 Plan | | Awards granted during year | | | | |
| | | Phantom 2000 units at
1 January 2005 | | Units awarded
during year | | Market price
on award | | End of the period for
qualifying conditions
to be fulfilled | | Benefits received
during year | | Phantom 2000 units at
31 December 2005 |
|
|
|
|
|
|
|
|
|
|
|
|
|
| Mr Fish | | 1,000,000 | | | | | | 01.01.04 | | US$7,670,900 | | – |
| | | 1,000,000 | | | | | | 01.01.05 | | | | 1,000,000 |
|
|
|
|
|
|
|
|
|
|
|
|
|
| | | 2,000,000 | | | | | | | | | | 1,000,000 |
|
|
|
|
|
|
|
|
|
|
|
|
|
No variation was made to any of the terms of the plan during the year. The performance measures are detailed on page 74.
| Citizens Long Term Incentive Plan | | | | | | | | |
| | | Interests at 1 January 2005 | | Awards granted during year | | Benefits received during year | | Interests at 31 December 2005 |
|
|
|
|
|
|
|
|
|
| Mr Fish | | LTIP* awards for the | | LTIP award for the | | LTIP award for the | | LTIP* awards for the |
| | | 3 year periods: | | 3 year period: | | 3 year period: | | 3 year periods: |
| | | 01.01.02 – 31.12.04 | | | | 01.01.02 – 31.12.04 | | |
| | | 01.01.03 – 31.12.05 | | | | was US$1,025,394 | | 01.01.03 – 31.12.05 |
| | | 01.01.04 – 31.12.06 | | | | | | 01.01.04 – 31.12.06 |
| | | | | 01.01.05 – 31.12.07 | | | | 01.01.05 – 31.12.07 |
|
|
|
|
|
|
|
|
|
| * | A new cash LTIP was approved by shareholders at the company’s Annual General Meeting in April 2005. Details are given on page 75. This replaces the previous LTIP which provided for a target payment of 60% of average salary over the three year period and a maximum payment of 105% of average salary. |
80
Directors’ pension arrangements
During the year, Sir Fred Goodwin, Gordon Pell, Iain Robertson and Fred Watt participated in The Royal Bank of Scotland Group Pension Fund (“the RBS Fund”). The RBS Fund is a defined benefit fund which provides pensions and other benefits within Inland Revenue limits.
The pension entitlements of Sir Fred Goodwin, Mr Pell, Mr Robertson and Mr Watt within the RBS Fund are restricted by Inland Revenue limits as set out in the Finance Act 1989. Additional life assurance cover in excess of these limits is provided by a separate arrangement. Arrangements have been made to provide Sir Fred Goodwin and Mr Pell with additional pension benefits on a defined benefit basis outwith the RBS Fund. The figures shown below include the accrual in respect of these arrangements. Mr Watt was provided with additional pension benefits on a defined contribution basis and contributions made in the year are shown below.
No changes are proposed to the level or form of pension benefits for any of the current directors as a result of the changes in pension legislation which come into force in April 2006 although as stated above directors will be able to opt out of tax-approved pension provision if they wish and receive a salary supplement in lieu. In addition consideration will be given to funding a greater proportion of the benefits.
Of the total transfer value as at 31 December 2005 shown, 25% relates to benefits in funded pension schemes. Sir George Mathewson receives life insurance cover under an individual arrangement. The non-executive directors do not accrue pension benefits, other than Mr Robertson who continued to accrue benefits in the RBS Fund after his appointment as a non-executive director.
Lawrence Fish accrues pension benefits under a number of arrangements in the US. Defined benefits are built up under the Citizens’ Qualified Plan, Excess Plan and Supplemental Executive Retirement Arrangement. In addition, he is a member of two defined contribution arrangements – a Qualified 401(k) Plan and an Excess 401(k) Plan.
As in the 2004 Report and Accounts, disclosure of these benefits has been made in accordance with the United Kingdom Listing Authority Listing Rules and the Combined Code and with the Directors’ Remuneration Report Regulations 2002.
| Defined benefit arrangements | | Age at
31 December
2005 | | | Accrued
entitlement at
31 December
2005
000 p.a. | | | Additional
pension
earned
during the
year ended
31 December
2005
000 p.a. | | | Additional
pension
earned
during the
year ended
31 December
2005*
000 p.a. | | | Transfer
value as at
31 December
2005
000 | | | Transfer
value as at
31 December
2004
000 | | | Increase
in transfer
value during
year ended
31 December
2005
000 | | | Transfer value
for the additional
pension
earned
during the
year ended
31 December
2005*
000 | |
|
|
|
|
|
|
|
|
|
|
|
|
|
|
|
|
|
|
|
|
|
|
|
|
|
| | | | | | | | | | | | | | | | | | | | | | | | | |
| Sir Fred Goodwin | | 47 | | | £444 | | | £63 | | | £51 | | | £5,119 | | | £3,591 | | | £1,528 | | | £592 | |
| | | | | | | | | | | | | | | | | | | | | | | | | |
| Mr Pell | | 55 | | | £302 | | | £55 | | | £47 | | | £5,092 | | | £3,592 | | | £1,500 | | | £790 | |
| | | | | | | | | | | | | | | | | | | | | | | | | |
| Mr Robertson | | 60 | | | £37 | | | £4 | | | £3 | | | £676 | | | £565 | | | £111 | | | £48 | |
| | | | | | | | | | | | | | | | | | | | | | | | | |
| Mr Watt | | 45 | | | £9 | | | £2 | | | £2 | | | £96 | | | £62 | | | £34 | | | £19 | |
| | | | | | | | | | | | | | | | | | | | | | | | | |
| Mr Fish | | 61 | | | $1,384 | | | $244 | | | $244 | | | $13,347 | | | $10,046 | | | $3,301 | | | $2,350 | |
|
|
|
|
|
|
|
|
|
|
|
|
|
|
|
|
|
|
|
|
|
|
|
|
|
| * | net of statutory revaluation applying to deferred pensions |
| | Notes: |
| (1) | There is a significant difference in the form of disclosure required by the Combined Code and the Directors’ Remuneration Report Regulations 2002. The former requires the disclosure of the additional pension earned during the year and the transfer value equivalent to this pension based on stock market conditions at the end of the year. The latter requires the disclosure of the difference between the transfer value at the start and end of the year and is therefore dependent on the change in stock market conditions over the course of the year. The above disclosure has been made in accordance with the Combined Code and the Directors’ Remuneration Report Regulations 2002. |
| (2) | Mr Robertson continued to accrue pension during his service with the Group in 2005 after resignation as a director. The figures above include the pension accrued during this subsequent service. |
| (3) | The transfer values disclosed above do not represent a sum paid or payable to the individual director. Instead they represent a potential liability of the company /pension scheme. |
| (4) | No allowance is made in these transfer values for any enhanced benefits that may become payable on early retirement. |
| (5) | The proportion of benefits represented by funded pension schemes for Sir Fred Goodwin, Gordon Pell and Lawrence Fish is 3%, 69% and 3% respectively. All benefits for Iain Robertson and Fred Watt are in funded pension schemes. |
| (6) | Following Mr Pell’s appointment as Executive Chairman, Retail Markets, he was awarded enhanced pension benefits. |
| (7) | In accordance with US market practice, Mr Fish’s pensionable remuneration is limited to $4 million per annum. |
Contributions and allowances paid in the year ended 31 December 2005 under defined contribution arrangements were:
| | | 2005 | | | 2004 |
| | | 000 | | | 000 |
|
|
|
|
|
|
| Mr Watt | | £144 | | | £128 |
| Mr Fish | | $139 | | | $91 |
|
|
|
|
|
|
81
Directors’ interests in shares
| | Shares
beneficially
owned at
1 January 2005
or date of
appointment
if later | | 31 December 2005 | |
| |
|
|
|
|
|
|
|
|
|
|
|
| | | Shares
owned
beneficially | | Vested
MPP shares
or share
equivalents | | Vested
share
options | | Total | | | Value as at
31 December
2005
(2,3) | |
|
|
|
|
|
|
|
|
|
|
|
|
|
|
| Chairman | | | | | | | | | | | | | |
| Sir George Mathewson | 250,816 | | 260,159 | | — | | 256,254 | | 516,413 | | £ | 6,577,478 | |
| Executive directors | | | | | | | | | | | | | |
| Sir Fred Goodwin | 64,960 | | 66,762 | | 126,895 | | 433,488 | | 627,145 | | £ | 6,530,847 | |
| Mr Fish | 11,120 | | 11,120 | | — | | 108,027 | | 119,147 | | £ | 1,082,677 | |
| Mr Pell | 582 | | 582 | | 22,026 | | 107,916 | | 130,524 | | £ | 906,381 | |
| Mr Watt | 58,408 | | 59,111 | | 18,877 | | 115,548 | | 193,536 | | £ | 1,708,409 | |
|
|
|
|
|
|
|
|
|
|
|
|
|
|
| | | Shares
beneficially
owned at
1 January 2005
or date of
appointment
if later | | Shares
beneficially
owned at
31 December
2005 |
|
|
|
|
|
| Non-executive directors | | | | |
| Sir Tom McKillop | | — | | 30,000 |
| Mr Buchan | | 5,000 | | 5,000 |
| Dr Currie | | — | | 556 |
| Mr Hunter | | 1,500 | | 3,500 |
| Mr Koch | | 20,000 | | 20,000 |
| Mr MacHale | | 10,000 | | 10,000 |
| Mr Scott | | 2,448 | | 4,448 |
| Mr Sutherland | | — | | 5,590 |
|
|
|
|
|
No other director had an interest in the company’s ordinary shares during the year.
On both 9 January 2006 and 7 February 2006, 7 ordinary shares of 25p each were acquired by Sir Fred Goodwin under the Group’s Buy As You Earn share scheme.
| Notes: |
| (1) | The numbers shown in this table are taken from the audited disclosures shown elsewhere in this Annual Report. |
| (2) | The value is based on the share price at 31 December 2005, which was £17.55. During the year ended 31 December 2005 the share price ranged from £15.22 to £18.33. |
| (3) | The notional value of the vested share options has been calculated on the ‘in the money’ value. |
As of 1 March 2006, Mr Cameron and Mr Fisher (who were each appointed to the Board in March 2006 and are thus not included in the above charts) held 1,827 and 3,924 ordinary shares of the company, respectively. In addition, below are tables that set forth certain information regarding the Share options held by Mr Cameron and Mr Fisher as of 1 March 2006 and awards made to Mr Cameron and Mr Fisher under the company’s Medium Term Performance Plan as of 1 March 2006, respectively. For further information regarding the Medium Term Performance Plan, see pages 74 to 75.
| | Options held at
1 March 2006 | | Option price | | Exercise period |
| |
| |
| |
|
| Mr Cameron | | 150 | | 15.63 | | 05.04.04 – 03.04.07 |
| | 1,865 | | 9.85 | | 01.10.07 – 31.03.08 |
| | 19,194 | | 11.18 | | 04.03.02 – 03.03.09 |
| | 38,411 | | 7.81 | | 29.03.03 – 28.03.10 |
| | 26,200 | | 17.18 | | 14.08.04 – 13.08.11 |
| | 31,800 | | 18.18 | | 14.03.05 – 13.03.12 |
| | 52,600 | | 12.37 | | 13.03.06 – 12.03.13* |
| | 50,461 | | 17.34 | | 11.03.07 – 10.03.14* |
| | 80,972 | | 17.29 | | 10.03.08 – 09.03.15* |
| | |
| | | | |
| | 301,653 | | | | |
| | |
| | | | |
| Mr Fisher | | 283 | | 13.07 | | 01.10.06 – 31.03.07 |
| | 311 | | 12.09 | | 01.10.07 – 31.03.08 |
| | 145 | | 13.04 | | 01.10.08 – 31.03.09 |
| | 14,281 | | 9.24 | | 01.04.02 – 31.03.09 |
| | 33,291 | | 7.81 | | 29.03.03 – 28.03.10 |
| | 22,700 | | 18.18 | | 14.03.05 – 13.03.12 |
| | 40,500 | | 12.37 | | 13.03.06 – 12.03.13* |
| | 39,648 | | 17.34 | | 11.03.07 – 10.03.14* |
| | 60,729 | | 17.29 | | 10.03.08 – 09.03.15* |
| | 1,501 | | 17.18 | | 14.08.04 – 13.08.11* |
| | 20,299 | | 17.18 | | 14.08.04 – 13.08.11* |
| | |
| | | | |
| | 233,688 | | | | |
| | |
| | | | |
|
| *Not yet vested as at 1 March 2006 |
Medium term performance plan
| | Scheme interests at 1 March 2006 | | Option price | | End of period for qualifying
conditions to be fulfilled |
| |
| |
| |
|
| Mr Cameron | | 55,824 | | Nil | | Vested 31.12.03 |
| | 22,078 | | Nil | | Vested 31.12.04 |
| | 40,370 | | Nil | | 31.12.06 |
| | 46,270 | | Nil | | 31.12.07 |
| | |
| | | | |
| | 164,542 | | | | |
| | |
| | | | |
| Mr Fisher | | 20,000 | | Nil | | Vested 31.12.03 |
| | 8,000 | | Nil | | Vested 31.12.04 |
| | 31,719 | | Nil | | 31.12.06 |
| | 34,703 | | Nil | | 31.12.07 |
| | |
| | | | |
| | 94,422 | | | | |
| | |
| | | | |
|
| Note: For any awards that have vested, participants holding option-based awards can exercise their right over the underlying share equivalents at any time up to ten years from the date of grant. |
Preference shares
Mr Fish held 20,000 non-cumulative preference shares of US$0.01 each at 31 December 2005 (2004 – 20,000) and Mr Koch held 20,000 non-cumulative preference shares of US$0.01 each at 31 December 2005 (2004 – nil). No other director had an interest in the preference shares during the year.
Loan notes
No director had an interest in loan notes during the year.
The company’s Register of Directors’ Interests, which is open to inspection, contains full details of directors’ shareholdings and options to subscribe.
No director held a non-beneficial interest in the shares of the company at 31 December 2005, at 1 January 2005 or date of appointment if later.
82
Statement of directors’ responsibilities
The Directors are required by Article 4 of the IAS Regulation (European Commission Regulation No 1606/2002) to prepare Group accounts, and as permitted by the Companies Act 1985 have elected to prepare Company accounts, for each financial year in accordance with International Financial Reporting Standards. They are responsible for preparing accounts that present fairly the financial position, financial performance, and cash flows of the Group and the Company. In preparing those accounts, the directors are required to:
- select suitable accounting policies and then apply themconsistently;
- make judgements and estimates that are reasonable andprudent; and
- state whether applicable accounting standards have beenfollowed, subject to any material departures disclosed andexplained in the accounts.
The directors are responsible for keeping proper accounting records which disclose with reasonable accuracy at any time the financial position of the Group and to enable them to ensure that the Annual report and accounts complies with the Companies Act 1985. They are also responsible for safeguarding the assets of the company and the Group and hence for taking reasonable steps for the prevention and detection of fraud and other irregularities.
By order of the Board.
| |
| |
| Miller McLean |
| Secretary |
| 27 February 2006 |
83
[Page intentionally left blank]
84
Financial statements
| Contents |
| 86 | Report of independent registered public accounting firm |
| 88 | Accounting policies |
| 97 | Consolidated income statement |
| 98 | Balance sheets |
| 99 | Statements of recognised |
| | income and expense |
| 100 | Cash flow statements |
| 101 | Notes on the accounts |
85
Report of independent registered public accounting firm to the members of The Royal Bank of Scotland Group plc
We have audited the financial statements of The Royal Bank of Scotland Group plc (“the company”) and its subsidiaries (together “the Group”) for the year ended 31 December 2005 which comprise the accounting policies, the balance sheets as at 31 December 2005 and 2004, the consolidated income statement, the cash flow statements, the statements of recognised income and expense for each of the two years in the period ended 31 December 2005 and the related Notes 1 to 47. These financial statements have been prepared under the accounting policies set out therein. We have also audited the information in the part of the directors’ remuneration report that is described as having been audited.
Respective responsibilities of directors and auditors
As described in the ‘Statement of directors’ responsibilities’, the company’s directors are responsible for the preparation of the financial statements in accordance with applicable United Kingdom law and International Financial Reporting Standards (“IFRS”) as adopted for use in the European Union. They are also responsible for the preparation of the other information contained in the 2005 Annual Report including the directors’ remuneration report. Our responsibility is to audit the financial statements and the part of the directors’ remuneration report described as having been audited in accordance with relevant United Kingdom legal and regulatory requirements and International Standards on Auditing (UK and Ireland).
We report to you our opinion as to whether the financial statements give a true and fair view in accordance with the relevant framework and whether the financial statements and the part of the directors’ remuneration report described as having been audited have been properly prepared in accordance with the Companies Act 1985 and Article 4 of the IAS Regulation. We also report to you if, in our opinion, the directors’ report is not consistent with the financial statements, if the company has not kept proper accounting records, if we have not received all the information and explanations we require for our audit, or if information specified by law regarding directors’ remuneration and transactions with the company and other members of the Group is not disclosed.
We also report to you if, in our opinion, the company has not complied with any of the four directors’ remuneration disclosure requirements specified for our review by the Listing Rules of the Financial Services Authority. These comprise the amount of each element in the remuneration package and information on share options, details of long term incentive schemes, and money purchase and defined benefit schemes. We give a statement, to the extent possible, of details of any non-compliance.
We review whether the corporate governance statement reflects the company’s compliance with the nine provisions of the Combined Code specified for our review by the Listing Rules of the Financial Services Authority, and we report if it does not. We are not required to consider whether the Board’s statements on internal control cover all risks and controls, or form an opinion on the effectiveness of the Group’s corporate governance procedures or its risk and control procedures.
We read the directors’ report and the other information contained in the 2005 Annual Report as described in the contents section including the unaudited part of the directors’ remuneration report and consider the implications for our report if we become aware of any apparent misstatements or material inconsistencies with the financial statements.
Basis of audit opinion
We conducted our audit in accordance with International Standards on Auditing (UK and Ireland) issued by the Auditing Practices Board and with the standards of the United States Public Company Accounting Oversight Board. An audit includes examination, on a test basis, of evidence relevant to the amounts and disclosures in the financial statements and the part of the directors’ remuneration report described as having been audited. The Group is not required to have, nor were we engaged to perform, an audit of its internal control over financial reporting. An audit includes consideration of internal control over financial reporting as a basis for designing audit procedures that are appropriate in the circumstances, but not for the purposes of expressing an opinion on the effectiveness of the Group’s internal controls over financial reporting. Accordingly, we express no such opinion. It also includes an assessment of the significant estimates and judgements made by the directors in the preparation of the financial statements and of whether the accounting policies are appropriate to the circumstances of the company and the Group, consistently applied and adequately disclosed.
We planned and performed our audit so as to obtain all the information and explanations which we considered necessary in order to provide us with sufficient evidence to give reasonable assurance that the financial statements and the part of the directors’ remuneration report described as having been audited are free from material misstatement, whether caused by fraud or other irregularity or error. In forming our opinion, we also evaluated the overall adequacy of the presentation of information in the financial statements and the part of the directors’ remuneration report described as having been audited.
86
UK opinion
In our opinion:
- the Group financial statements give a true and fair view, inaccordance with IFRS as adopted for use in the EuropeanUnion, of the state of the Group’s affairs as at 31 December2005 and of its profit and cash flows for the year thenended;
- the company financial statements give a true and fair view, inaccordance with IFRS as adopted for use in the EuropeanUnion as applied in accordance with the requirements of theCompanies Act 1985, of the state of affairs of the companyas at 31 December 2005;
- the financial statements and the part of the directors’remuneration report described as having been audited havebeen properly prepared in accordance with the CompaniesAct 1985 and Article 4 of the IAS Regulation.
Separate opinion in relation to IFRS
As explained in the Accounting policies, the Group in addition to complying with its legal obligation to comply with IFRS as adopted for use in the European Union, has also complied with the IFRS as issued by the International Accounting Standards Board. In our opinion the financial statements give a true and fair view, in accordance with IFRS, of the state of the Group’s affairs as at 31 December 2005 and of its profit for the year then ended.
US opinion
In our opinion, the financial statements present fairly, in all material respects, the financial position of the Group as at 31 December 2005 and 2004 and the results of its operations and its cash flows for each of the two years in the period ended 31 December 2005 in conformity with IFRS.
IFRS vary in certain significant respects from accounting principles generally accepted in the United States of America. Information relating to the nature and effect of such differences is presented in Note 46 to the financial statements.
| |
| Deloitte & Touche LLP |
| Chartered Accountants and Registered Auditors |
| Edinburgh, United Kingdom |
| 27 February 2006 |
87
Accounting policies
1. Adoption of International Financial Reporting Standards
The annual accounts have, for the first time, been prepared in accordance with International Financial Reporting Standards adopted by the International Accounting Standards Board (“IASB”), and interpretations issued by the International Financial Reporting Interpretations Committee of the IASB (together “IFRS”) as endorsed by the European Union (“EU”). The EU has not endorsed the complete text of IAS 39 ‘Financial Instruments: Recognition and Measurement’; it has relaxed some of the standard’s hedging requirements. The Group has not taken advantage of this relaxation and has adopted IAS 39 as issued by the IASB. The date of transition to IFRS for the Group and the company (The Royal Bank of Scotland Group plc) and the date of their opening IFRS balance sheets was 1 January 2004. The company accounts have been presented in accordance with the Companies Act 1985.
The main differences between IFRS and previously applied generally accepted accounting principles (“UK GAAP”) and the effect of implementing IFRS on the Group and company balance sheets and shareholders’ funds as at 1 January and 31 December 2004 are set out on pages 162 to 170.
On initial adoption of IFRS, the Group (and the company where relevant) applied the following exemptions from the requirements of IFRS and from their retrospective application as permitted by IFRS 1 ‘First-time Adoption of International Financial Reporting Standards’:
Business combinations– the Group has applied IFRS 3 ‘Business Combinations’ to business combinations that occurred on or after 1 January 2004. Business combinations before that date have not been restated. Under UK GAAP, goodwill arising on acquisitions after 1 October 1998 was capitalised and amortised over its estimated useful economic life. Goodwill arising on acquisitions before 1 October 1998 was deducted from equity. The carrying amount of goodwill in the Group’s opening IFRS balance sheet was £13,131 million, its carrying value under UK GAAP as at 31 December 2003.
Fair value or revaluation as deemed cost– under UK GAAP, the Group’s freehold and long leasehold property occupied for its own use was recorded at valuation on the basis of existing use value. The Group has elected to use this valuation as at 31 December 2003 as deemed cost for its opening IFRS balance sheet. At this date, the carrying value under UK GAAP of freehold and long leasehold property occupied for own use was £2,391 million.
Compound financial instruments– the Group has not separated compound instruments between liability and equity components, as required by IAS 32 ‘Financial Instruments: Disclosure and Presentation’, where the liability component was not outstanding at 1 January 2004. UK GAAP did not permit compound instruments to be separated between liability and equity components on issue.
Derecognition– the Group has applied the derecognition requirements of IAS 39 to transactions occurring on or after 1 January 1992.
Share based payments– IFRS 2 ‘Share-based Payment’ has been applied to equity instruments granted after 7 November 2002.
Implementation of IAS 32, IAS 39 and IFRS 4 ‘Insurance Contracts’ (incorporating the adoption of FRS 27 ‘Life Assurance’)– as allowed by IFRS 1, the Group and the company implemented IAS 32, IAS 39 and IFRS 4 with effect from 1 January 2005 without restating the income statement, balance sheet and notes for 2004. The Group has adopted the Amendment to IAS 39 ‘The Fair Value Option’ issued by the IASB in June 2005 also from 1 January 2005. The effect of implementing IAS 32, IAS 39 and IFRS 4 on the Group and company balance sheets and shareholders’ funds as at 1 January 2005 is set out on pages 171 to 172. In preparing the 2004 comparatives, UK GAAP principles then current have been applied to financial instruments. The main differences between UK GAAP and IFRS on financial instruments are summarised on pages 164 to 166.
IFRS 1 prohibits retrospective application of some aspects of IFRS:
Derecognition of financial assets and liabilities– non-derivative financial assets and liabilities derecognised before 1 January 1992 (the date from which the derecognition requirements of IAS 39 have been implemented) under the Group’s previous GAAP have not been recognised in its opening IFRS balance sheet.
Hedge accounting– hedging relationships of a type that does not qualify for hedge accounting under IAS 39 are not reflected in the Group’s opening IFRS balance sheet.
Discontinued operations and assets classified as held for sale– the Group has applied IFRS 5 ‘Non-current Assets Held for Sale and Discontinued Operations’ from 1 January 2005.
The Group has adopted the Amendment ‘Actuarial Gains and Losses, Group Plans and Disclosures’ to IAS 19 ‘Employee Benefits’ from 1 January 2004. Actuarial gains and losses are recognised in full as they occur outside profit or loss.
2. Accounting convention
The company is incorporated in the UK and registered in Scotland. The financial statements have been prepared on the historical cost basis except that the following assets and liabilities are stated at their fair value: derivative financial instruments, held-for-trading financial assets and financial liabilities, financial assets and financial liabilities that are designated as at fair value through profit or loss, available-for-sale financial assets and investment property. Recognised financial assets and financial liabilities in fair value hedges are adjusted for changes in fair value in respect of the risk that is hedged.
3. Basis of consolidation
The consolidated financial statements incorporate the financial statements of the company and entities (including certain special purpose entities) controlled by the Group (its subsidiaries). Control exists where the Group has the power to govern the financial and operating policies of the entity; generally conferred by holding a majority of voting rights. On acquisition of a subsidiary, its identifiable assets, liabilities and
88
contingent liabilities are included in the consolidated accounts at their fair value. Any excess of the cost (the fair value of assets given, liabilities incurred or assumed and equity instruments issued by the Group plus any directly attributable costs) of an acquisition over the fair value of the net assets acquired is recognised as goodwill. The interest of minority shareholders is stated at their share of the fair value of the subsidiary’s net assets.
The results of subsidiaries acquired are included in the consolidated income statement from the date control passes to the Group. The results of subsidiaries sold are included up until the Group ceases to control them.
All intra-group balances, transactions, income and expenses are eliminated on consolidation. The consolidated accounts are prepared using uniform accounting policies.
4. Revenue recognition
Interest income on financial assets that are classified as loans and receivables, available-for-sale or held-to-maturity and interest expense on financial liabilities other than those at fair value through profit or loss are determined using the effective interest rate method. The effective interest rate method is a method of calculating the amortised cost of a financial asset or financial liability (or group of financial assets or liabilities) and of allocating the interest income or interest expense over the expected life of the asset or liability. The effective interest rate is the rate that exactly discounts estimated future cash flows to the instrument’s initial carrying amount. Calculation of the effective interest rate takes into account fees receivable, that are an integral part of the instrument’s yield, premiums or discounts on acquisition or issue, early redemption fees and transaction costs. All contractual terms of a financial instrument are considered when estimating future cash flows.
Financial assets and financial liabilities held-for-trading or designated as at fair value through profit or loss are recorded at fair value. Changes in fair value are recognised in profit or loss together with dividends and interest receivable and payable.
Commitment and utilisation fees are determined as a percentage of the outstanding facility. If it is unlikely that a specific lending arrangement will be entered into, such fees are taken to profit or loss over the life of the facility otherwise they are deferred and included in the effective interest rate on the advance.
Fees in respect of services are recognised as the right to consideration accrues through the provision of the service to the customer. The arrangements are generally contractual and the cost of providing the service is incurred as the service is rendered. The price is usually fixed and always determinable. The application of this policy to significant fee types is outlined below.
Payment services:this comprises income received for payment services including cheques cashed, direct debits, Clearing House Automated Payments (the UK electronic settlement system) and BACS payments (the automated clearing house that processes direct debits and direct credits). These are generally charged on a per transaction basis. The income is earned when the payment or transaction occurs. Payment services income is usually charged to the customer’s account, monthly or quarterly in arrears. Accruals are raised for services provided but not charged at period end.
Card related services:fees from credit card business include:
Commission received from retailers for processing credit and debit card transactions: income is accrued to the income statement as the service is performed.
Interchange received: as issuer, the Group receives a fee (interchange) each time a cardholder purchases goods and services. The Group also receives interchange fees from other card issuers for providing cash advances through its branch and Automated Teller Machine networks. These fees are accrued once the transaction has taken place.
An annual fee payable by a credit card holder is deferred and taken to profit or loss over the period of the service i.e. 12 months.
Insurance brokerage:this is made up of fees and commissions received from the agency sale of insurance. Commission on the sale of an insurance contract is earned at the inception of the policy as the insurance has been arranged and placed. However, provision is made where commission is refundable in the event of policy cancellation in line with estimated cancellations.
Investment management fees:fees charged for managing investments are recognised as revenue as the services are provided. Incremental costs that are directly attributable to securing an investment management contract are deferred and charged as expense as the related revenue is recognised.
Insurance premiums– see note 11 below.
5. Pensions and other post-retirement benefits
The Group provides post-retirement benefits in the form of pensions and healthcare plans to eligible employees.
For defined benefit schemes, scheme liabilities are measured on an actuarial basis using the projected unit credit method and discounted at a rate that reflects the current rate of return on a high quality corporate bond of equivalent term and currency to the scheme liabilities. Scheme assets are measured at their fair value. Any surplus or deficit of scheme assets over liabilities is recognised in the balance sheet as an asset (surplus) or liability (deficit). The current service cost and any past service costs together with the expected return on scheme assets less the unwinding of the discount on the scheme liabilities is charged to operating expenses. Actuarial gains and losses are recognised in full in the period in which they occur outside profit or loss and presented in the statement of recognised income and expense. Contributions to defined contribution pension schemes are recognised in the income statement when payable.
6. Intangible assets and goodwill
Intangible assets that are acquired by the Group are stated at cost less accumulated amortisation and impairment losses. Amortisation is charged to profit or loss using methods that best reflect the economic benefits over their estimated useful
89
Accounting policies continued
economic lives and is included in Depreciation and amortisation. The estimated useful economic lives are as follows:
| Core deposit intangibles | 7 years |
| Other acquired intangibles | 5-10 years |
| Computer software | 3-5 years |
Expenditure on internally generated goodwill and brands is written-off as incurred. Acquired goodwill being the excess of the cost of an acquisition over the Group’s interest in the net fair value of the identifiable assets, liabilities and contingent liabilities of the subsidiary, associate or joint venture acquired is initially recognised at cost and subsequently at cost less any accumulated impairment losses. Goodwill arising on the acquisition of subsidiaries and joint ventures is included in the balance sheet caption ‘Intangible fixed assets’ and that on associates within their carrying amounts. The gain or loss on the disposal of a subsidiary, associate or joint venture includes the carrying value of any related goodwill.
7. Property, plant and equipment
Items of property, plant and equipment are stated at cost less accumulated depreciation (see below) and impairment losses. Where an item of property, plant and equipment comprises major components having different useful lives, they are accounted for separately. Property that is being constructed or developed for future use as investment property is classified as property, plant and equipment and stated at cost until construction or development is complete, at which time it is reclassified as investment property.
Depreciation is charged to profit or loss on a straight-line basis so as to write-off the depreciable amount of property, plant and equipment (including assets owned and let on operating leases (except investment property – see note 20 below)) over their estimated useful lives. The depreciable amount is the cost of an asset less its residual value. Land is not depreciated. Estimated useful lives are as follows:
| Freehold and long leasehold buildings | 50 years |
| Short leaseholds | unexpired period |
| | of the lease |
| Property adaptation costs | 10 to 15 years |
| Computer equipment | up to 5 years |
| Other equipment | 4 to 15 years |
8. Impairment of intangible assets and property, plant and equipment
At each reporting date, the Group assesses whether there is any indication that its intangible assets, or property, plant and equipment are impaired. If any such indication exists, the Group estimates the recoverable amount of the asset and the impairment loss if any. Goodwill is tested for impairment annually or more frequently if events or changes in circumstances indicate that it might be impaired. If an asset does not generate cash flows that are independent from those of other assets or groups of assets, recoverable amount is determined for the cash-generating unit to which the asset belongs. The recoverable amount of an asset is the higher of its fair value less costs to sell and its value in use. Value in use is the present value of future cash flows from the asset or cash-generating unit discounted at a rate that reflects market interest rates adjusted for risks specific to the asset or cash generating unit that have not been reflected in the estimation of future cash flows. If the recoverable amount of an intangible or tangible asset is less than its carrying value, an impairment loss is recognised immediately in profit or loss and the carrying value of the asset reduced by the amount of the loss. A reversal of an impairment loss on intangible assets (excluding goodwill) or property, plant and equipment is recognised as it arises provided the increased carrying value does not exceed that which it would have been had no impairment loss been recognised. Impairment losses on goodwill are not reversed.
9. Foreign currencies
The Group’s consolidated financial statements are presented in sterling which is the functional currency of the company.
Transactions in foreign currencies are translated into sterling at the foreign exchange rate ruling at the date of the transaction. Monetary assets and liabilities denominated in foreign currencies are translated into sterling at the rates of exchange ruling at the balance sheet date. Foreign exchange differences arising on translation are recognised in profit or loss except for differences arising on cash flow hedges and hedges of net investments in foreign operations. Non-monetary items denominated in foreign currencies that are stated at fair value are translated into sterling at foreign exchange rates ruling at the dates the values were determined. Translation differences arising on non-monetary items measured at fair value are recognised in profit or loss except for differences arising on available-for-sale non-monetary financial assets, for example equity shares, which are included in the available-for-sale reserve in equity unless the asset is the hedged item in a fair value hedge.
The assets and liabilities of foreign operations, including goodwill and fair value adjustments arising on acquisition, are translated into sterling at foreign exchange rates ruling at the balance sheet date. The revenues and expenses of foreign operations are translated into sterling at average exchange rates unless these do not approximate to the foreign exchange rates ruling at the dates of the transactions. Foreign exchange differences arising on the translation of foreign operations are recognised directly in equity.
10. Leases
Contracts to lease assets are classified as finance leases if they transfer substantially all the risks and rewards of ownership of the asset to the customer. Other contracts to lease assets are classified as operating leases.
Finance lease receivables are stated in the balance sheet at the amount of the net investment in the lease being the minimum lease payments and any unguaranteed residual value discounted at the interest rate implicit in the lease. Finance lease income is allocated to accounting periods so as to give a constant periodic rate of return before tax on the net investment. Unguaranteed residual values are subject to regular review to identify potential impairment. If there has been a reduction in the estimated unguaranteed residual value, the income allocation is revised and any reduction in respect of amounts accrued is recognised immediately.
90
Rental income from operating leases is credited to the income statement on a receivable basis over the term of the lease. Operating lease assets are included within Property, plant and equipment and depreciated over their useful lives (see note 7 above).
11. Insurance
General insurance
General insurance comprises short-duration contracts principally property and liability insurance contracts. Due to the nature of the products sold – retail-based property and casualty, motor, home and personal health insurance contracts – the insurance protection is provided on an even basis throughout the term of the policy.
Premiums from general insurance contracts are recognised in the accounting period in which they begin. Unearned premiums represent the proportion of the net premiums that relate to periods of insurance after the balance sheet date and are calculated over the period of exposure under the policy, on a daily basis, 24th’s basis or allowing for the estimated incidence of exposure under policies which are longer than twelve months. Provision is made where necessary for the estimated amount of claims over and above unearned premiums including that in respect of future written business on discontinued lines under the run-off of delegated underwriting authority arrangements. It is designed to meet future claims and related expenses and is calculated across related classes of business on the basis of a separate carry forward of deferred acquisition expenses after making allowance for investment income.
Acquisition expenses relating to new and renewed business for all classes are expensed over the period during which the premiums are earned. The principal acquisition costs so deferred are commissions payable, costs associated with the telesales and underwriting staff and prepaid claims handling costs in respect of delegated claims handling arrangements for claims which are expected to occur after the balance sheet date. Claims and the related reinsurance are recognised in the accounting period in which the loss occurs. Provision is made for the full cost of settling outstanding claims at the balance sheet date, including claims estimated to have been incurred but not yet reported at that date, and claims handling expenses. The related reinsurance receivable is recognised at the same time.
Life assurance
The Group’s long-term assurance contracts include whole-life term assurance, endowment assurance, flexible whole-life, pension and annuity contracts that are expected to remain in force for an extended period of time. Long-term assurance contracts under which the Group does not accept significant insurance risk are classified as financial instruments.The Group recognises the value of in-force long-term assurance contracts as an asset. Cash flows associated with in-force contracts and related assets, including reinsurance cash flows, are projected, using appropriate assumptions as to future mortality, persistency and levels of expenses and excluding the value of future investment margins, to estimate future surpluses attributable to the Group. These surpluses, discounted at a risk-adjusted rate, are recognised as a separate asset. Changes in the value of this asset, which is determined on a post-tax basis, are included in operating profit.
The Group has reinsurance treaties that transfer significant insurance risk. Liabilities for reinsured contracts are calculated gross of reinsurance and a separate reinsurance asset recorded.
Premiums on long-term insurance contracts are recognised as income when receivable. Claims on long term insurance contracts reflect the cost of all claims arising during the year, including claims handling costs. Claims are recognised when the Group becomes aware of the claim.
12. Taxation
Provision is made for taxation at current enacted rates on taxable profits, arising in income or in equity, taking into account relief for overseas taxation where appropriate. Deferred taxation is accounted for in full for all temporary differences between the carrying amount of an asset or liability for accounting purposes and its carrying amount for tax purposes, except in relation to overseas earnings where remittance is controlled by the Group, and goodwill.
Deferred tax assets are only recognised to the extent that it is probable that they will be recovered.
13. Financial assets
Financial assets are classified into held-to-maturity investments; available-for-sale financial assets; held-for-trading; designated as at fair value through profit or loss; or loans and receivables.
Held-to-maturity investments– a financial asset is classified as a held-to-maturity investment only if it has fixed or determinable payments, a fixed maturity and the Group has the positive intention and ability to hold to maturity. Held-to-maturity investments are initially recognised at fair value plus directly related transaction costs. They are subsequently measured at amortised cost using the effective interest method (see note 4 above) less any impairment losses.
Held-for-trading– a financial asset is classified as held-for-trading if it is acquired principally for the purpose of selling in the near term, or forms part of a portfolio of financial instruments that are managed together and for which there is evidence of short-term profit taking, or it is a derivative (not in a qualifying hedge relationship). Held-for-trading financial assets are recognised at fair value with transaction costs being recognised in profit or loss. Subsequently they are measured at fair value. Gains and losses on held-for-trading financial assets are recognised in profit or loss as they arise.
Designated as at fair value through profit or loss– financial assets that the Group designates on initial recognition as being at fair value through profit or loss are recognised at fair value, with transaction costs being recognised in profit or loss and are subsequently measured at fair value. Gains and losses on financial assets that are designated as at fair value through profit or loss are recognised in profit or loss as they arise.
Financial assets may be designated as at fair value through profit or loss only if such designation (a) eliminates or significantly reduces a measurement or recognition inconsistency; or (b) applies to a group of financial assets, financial liabilities or both that the Group manages and
91
Accounting policiescontinued
evaluates on a fair value basis; or (c) relates to an instrument that contains an embedded derivative which is not evidently closely related to the host contract.
The principal category of financial assets designated as at fair value through profit or loss is policyholders’ assets underpinning insurance and investment contracts issued by the Group's life assurance businesses. Fair value designation significantly reduces the measurement inconsistency that would arise if these assets were classified as available-for-sale.
Loans and receivables– non-derivative financial assets with fixed or determinable repayments that are not quoted in an active market are classified as loans and receivables except those that are classified as available-for-sale or as held-for-trading, or designated as at fair value through profit or loss. Loans and receivables are initially recognised at fair value plus directly related transaction costs. They are subsequently measured at adjusted cost using the effective interest method (see note 4 above) less any impairment losses.
Available-for-sale– financial assets that are not classified as held-to-maturity; held-for-trading; designated at fair value through profit or loss; or loans and receivables are classified as available-for-sale. Financial assets can be designated as available-for-sale on initial recognition. Available-for-sale financial assets are initially recognised at fair value plus directly related transaction costs. They are subsequently measured at fair value. Impairment losses and exchange differences resulting from retranslating the amortised cost of currency monetary available-for-sale financial assets are recognised in profit or loss together with interest calculated using the effective interest rate (see note 4 above). Other changes in the fair value of available-for-sale financial assets are reported in a separate component of shareholders’ equity until disposal, when the cumulative gain or loss is recognised in profit or loss.
Regular way purchases of financial assets classified as loans and receivables are recognised on settlement date; all other regular way purchases are recognised on trade date.
Fair value for a net open position in a financial asset that is quoted in an active market is the current bid price times the number of units of the instrument held. Fair values for financial assets not quoted in an active market are determined using appropriate valuation techniques including discounting future cash flows, option pricing models and other methods that are consistent with accepted economic methodologies for pricing financial assets.
14. Impairment of financial assets
The Group assesses at each balance sheet date whether there is any objective evidence that a financial asset or group of financial assets classified as held-to-maturity, available-for-sale or loans and receivables is impaired. A financial asset or portfolio of financial assets is impaired and an impairment loss incurred if there is objective evidence that an event or events since initial recognition of the asset have adversely affected the amount or timing of future cash flows from the asset.
Financial assets carried at amortised cost– if there is objective evidence that an impairment loss on a financial asset or group of financial assets classified as loans and receivables or as held-to-maturity investments has been incurred, the Group measures the amount of the loss as the difference between the carrying amount of the asset or group of assets and the present value of estimated future cash flows from the asset or group of assets discounted at the effective interest rate of the instrument at initial recognition. Impairment losses are assessed individually for financial assets that are individually significant and individually or collectively for assets that are not individually significant. In making collective assessment of impairment, financial assets are grouped into portfolios on the basis of similar risk characteristics. Future cash flows from these portfolios are estimated on the basis of the contractual cash flows and historical loss experience for assets with similar credit risk characteristics. Historical loss experience is adjusted, on the basis of current observable data, to reflect the effects of current conditions not affecting the period of historical experience.
Impairment losses are recognised in profit or loss and the carrying amount of the financial asset or group of financial assets reduced by establishing an allowance for impairment losses. If in a subsequent period the amount of the impairment loss reduces and the reduction can be ascribed to an event after the impairment was recognised, the previously recognised loss is reversed by adjusting the allowance. Once an impairment loss has been recognised on a financial asset or group of financial assets, interest income is recognised on the carrying amount using the rate of interest at which estimated future cash flows were discounted in measuring impairment.
Financial assets carried at fair value– when a decline in the fair value of a financial asset classified as available-for-sale has been recognised directly in equity and there is objective evidence that the asset is impaired, the cumulative loss is removed from equity and recognised in profit or loss. The loss is measured as the difference between the amortised cost of the financial asset and its current fair value. Impairment losses on available-for-sale equity instruments are not reversed through profit or loss, but those on available-for-sale debt instruments are reversed, if there is an increase in fair value that is objectively related to a subsequent event.
15. Financial liabilities
A financial liability is classified as held-for-trading if it is incurred principally for the purpose of selling in the near term, or forms part of a portfolio of financial instruments that are managed together and for which there is evidence of short-term profit taking, or it is a derivative (not in a qualifying hedge relationship). Held-for-trading financial liabilities are recognised at fair value with transaction costs being recognised in profit or loss. Subsequently they are measured at fair value. Gains and losses are recognised in profit or loss as they arise. Financial liabilities that the Group designates on initial recognition as being at fair value through profit or loss are recognised at fair value, with transaction costs being recognised in profit or loss and are subsequently measured at fair value. Gains and losses on financial liabilities that are designated as at fair value through profit or loss are recognised in profit or loss as they arise.
92
Financial liabilities may be designated as at fair value through profit or loss only if such designation (a) eliminates or significantly reduces a measurement or recognition inconsistency; or (b) applies to a group of financial assets, financial liabilities or both that the Group manages and evaluates on a fair value basis; or (c) relates to an instrument that contains an embedded derivative which is not evidently closely related to the host contract.
The principal categories of financial liabilities designated as at fair value through profit or loss are (a) structured liabilities issued by the Group: designation significantly reduces the measurement inconsistency between these liabilities and the related derivatives carried at fair value, and (b) investment contracts issued by the Group's life assurance businesses: fair value designation significantly reduces the measurement inconsistency that would arise if these liabilities were measured at amortised cost.
All other financial liabilities are measured at amortised cost using the effective interest method (see note 4 above).
Fair value for a net open position in a financial liability that is quoted in an active market is the current offer price times the number of units of the instrument held or issued. Fair values for financial liabilities not quoted in an active market are determined using appropriate valuation techniques including discounting future cash flows, option pricing models and other methods that are consistent with accepted economic methodologies for pricing financial liabilities.
16. Derecognition
A financial asset is derecognised when it has been transferred and the transfer qualifies for derecognition. A transfer requires that the Group either: (a) transfers the contractual rights to receive the asset’s cash flows; or (b) retains the right to the asset’s cash flows but assumes a contractual obligation to pay those cash flows to a third party. After a transfer, the Group assesses the extent to which it has retained the risks and rewards of ownership of the transferred asset. If substantially all the risks and rewards have been retained, the asset remains on the balance sheet. If substantially all of the risks and rewards have been transferred, the asset is derecognised. If substantially all the risks and rewards have been neither retained nor transferred, the Group assesses whether or not it has retained control of the asset. If it has not retained control, the asset is derecognised. Where the Group has retained control of the asset, it continues to recognise the asset to the extent of its continuing involvement.
A financial liability is removed from the balance sheet when the obligation is discharged, or cancelled, or expires.
17. Capital instruments
The Group classifies a financial instrument that it issues as a financial asset, financial liability or an equity instrument in accordance with the substance of the contractual arrangement. An instrument is classified as a liability if it is a contractual obligation to deliver cash or another financial asset, or to exchange financial assets or financial liabilities on potentially unfavourable terms. An instrument is classified as equity if it evidences a residual interest in the assets of the Group after the deduction of liabilities. The components of a compound financial instrument issued by the Group are classified and accounted for separately as financial assets, financial liabilities or equity as appropriate.
18. Derivatives and hedging
Derivative financial instruments are recognised initially, and subsequently measured, at fair value. Derivative fair values are determined from quoted prices in active markets where available. Where there is no active market for an instrument, fair value is derived from prices for the derivative’s components using appropriate pricing or valuation models.
A derivative embedded in a contract is accounted for as stand-alone derivative if its economic characteristics are not closely related to the economic characteristics of the host contract; unless the entire contract is carried at fair value through profit or loss.
Gains and losses arising from changes in fair value of a derivative are recognised as they arise in profit or loss unless the derivative is the hedging instrument in a qualifying hedge. The Group enters into three types of hedge relationship: hedges of changes in the fair value of a recognised asset or liability or firm commitment (fair value hedges); hedges of the variability in cash flows from a recognised asset or liability or a forecast transaction (cash flow hedges); and hedges of the net investment in a foreign entity.
Hedge relationships are formally documented at inception. The documentation includes identification of the hedged item and the hedging instrument, details the risk that is being hedged and the way in which effectiveness will be assessed at inception and during the period of the hedge. If the hedge is not highly effective in offsetting changes in fair values or cash flows attributable to the hedged risk, consistent with the documented risk management strategy, hedge accounting is discontinued.
Fair value hedge– in a fair value hedge, the gain or loss on the hedging instrument is recognised in profit or loss. The gain or loss on the hedged item attributable to the hedged risk is recognised in profit or loss and adjusts the carrying amount of the hedged item. Hedge accounting is discontinued if the hedge no longer meets the criteria for hedge accounting or if the hedging instrument expires or is sold, terminated or exercised or if hedge designation is revoked. If the hedged item is one for which the effective interest rate method is used, any cumulative adjustment is amortised to profit or loss over the life of the hedged item using a recalculated effective interest rate.
Cash flow hedge– where a derivative financial instrument is designated as a hedge of the variability in cash flows of a recognised asset or liability or a highly probable forecast transaction, the effective portion of the gain or loss on the hedging instrument is recognised directly in equity. The ineffective portion is recognised in profit or loss. When the forecast transaction results in the recognition of a financial asset or financial liability, the cumulative gain or loss is reclassified from equity in the same periods in which the asset or liability affects profit or loss. Otherwise the cumulative gain or loss is removed from equity and recognised in profit or loss at the same
93
Accounting policiescontinued
time as the hedged transaction. Hedge accounting is discontinued if the hedge no longer meets the criteria for hedge accounting; if the hedging instrument expires or is sold, terminated or exercised; if the forecast transaction is no longer expected to occur; or if hedge designation is revoked. On the discontinuance of hedge accounting (except where a forecast transaction is no longer expected to occur), the cumulative unrealised gain or loss recognised in equity is recognised in profit or loss when the hedged cash flow occurs or, if the forecast transaction results in the recognition of a financial asset or financial liability, in the same periods during which the asset or liability affects profit or loss. Where a forecast transaction is no longer expected to occur, the cumulative unrealised gain or loss is recognised in profit or loss immediately.
Hedge of net investment in a foreign operation– where a foreign currency liability hedges a net investment in a foreign operation, the portion of foreign exchange differences arising on translation of the liability determined to be an effective hedge is recognised directly in equity. Any ineffective portion is recognised in profit or loss.
19. Share-based payments
The Group grants options over shares in The Royal Bank of Scotland Group plc to its employees under various share option schemes. The Group has applied IFRS 2 ‘Share-based Payment’ to grants under these schemes after 7 November 2002 that had not vested on 1 January 2005. The expense for these transactions is measured based on the fair value on the date the options are granted. The fair value is estimated using valuation techniques which take into account the option’s exercise price, its term, the risk free interest rate and the expected volatility of the market price of The Royal Bank of Scotland Group plc’s shares. Vesting conditions are not taken into account when measuring fair value, but are reflected by adjusting the number of options included in the measurement of the transaction such that the amount recognised reflects the number that actually vest. The fair value is expensed on a straight-line basis over the vesting period.
20. Investment property
Investment property comprises freehold and leasehold properties that are held to earn rentals or for capital appreciation or both. It is not depreciated but is stated at fair value based on valuations by independent registered valuers. Fair value is based on current prices in an active market for similar properties in the same location and condition. Any gain or loss arising from a change in fair value is recognised in profit or loss. Rental income from investment property is recognised on a straight-line basis over the term of the lease. Lease incentives granted are recognised as an integral part of the total rental income.
21. Cash and cash equivalents
Cash and cash equivalents comprises cash and demand deposits with banks together with short-term highly liquid investments that are readily convertible to known amounts of cash and subject to insignificant risk of change in value.
22. Shares in Group entities
The company’s investments in its subsidiaries are stated at cost less any impairment.
Critical accounting policies and key sources of estimation uncertainty
The reported results of the Group are sensitive to the accounting policies, assumptions and estimates that underlie the preparation of its financial statements. UK company law and IFRS require the directors, in preparing the Group's financial statements, to select suitable accounting policies, apply them consistently and make judgements and estimates that are reasonable and prudent. In the absence of an applicable standard or interpretation, IAS 8 ‘Accounting Policies, Changes in Accounting Estimates and Errors’, requires management to develop and apply an accounting policy that results in relevant and reliable information in the light of the requirements and guidance in IFRS dealing with similar and related issues and the IASB’s Framework for the Preparation and Presentation of Financial Statements.
The judgements and assumptions involved in the Group’s accounting policies that are considered by the Board to be the most important to the portrayal of its financial condition are discussed below. The use of estimates, assumptions or models that differ from those adopted by the Group would affect its reported results.
Loan impairment provisions
The Group’s loan impairment provisions are established to recognise incurred impairment losses in its portfolio of loans classified as loans and receivables and carried at amortised cost. A loan is impaired when there is objective evidence that events since the loan was granted have affected expected cash flows from the loan. The impairment loss is the difference between the carrying value of the loan and the present value of estimated future cash flows at the loan's original effective interest rate.
At 31 December 2005, gross loans and advances to customers totalled £421,110 million (2004 – £351,419 million) and customer loan impairment provisions amounted to £3,884 million (2004 – £4,168 million).
There are two components to the Group’s loan impairment provisions: individual and collective.
Individual component – all impaired loans that exceed specific thresholds are individually assessed for impairment. Individually assessed loans principally comprise the Group's portfolio of commercial loans to medium and large businesses. Impairment losses are recognised as the difference between the carrying value of the loan and the discounted value of management’s best estimate of future cash repayments and proceeds from any security held. These estimates take into account the customer’s debt capacity and financial flexibility; the level and quality of its earnings; the amount and sources of cash flows; the industry in which the counterparty operates; and the realisable value of any security held. Estimating the quantum and timing of future recoveries involves significant judgement. The size of receipts will depend on the future performance of the borrower and the value of security, both of which will be affected by future economic conditions; additionally, collateral may not be readily marketable. The actual amount of future cash flows and the date they are received may differ from these
94
estimates and consequently actual losses incurred may differ from those recognised in these financial statements.
Collective component – this is made up of two elements: loan impairment provisions for impaired loans that are below individual assessment thresholds (collective impaired loan provisions) and for loan losses that have been incurred but have not been separately identified at the balance sheet date (latent loss provisions). These are established on a portfolio basis taking into account the level of arrears, security, past loss experience, credit scores and defaults based on portfolio trends. The most significant factors in establishing these provisions are the expected loss rates and the related average life. These portfolios include credit card receivables and other personal advances including mortgages. The future credit quality of these portfolios is subject to uncertainties that could cause actual credit losses to differ materially from reported loan impairment provisions. These uncertainties include the economic environment, notably interest rates and their effect on customer spending, the unemployment level, payment behaviour and bankruptcy trends.
Pensions
The Group operates a number of defined benefit pension schemes as described in Note 3 on the financial statements. The assets of the schemes are measured at their fair value at the balance sheet date. Scheme liabilities are measured using the projected unit method, which takes account of projected earnings increases, using actuarial assumptions that give the best estimate of the future cash flows that will arise under the scheme liabilities. These cash flows are discounted at the interest rate applicable to high-quality corporate bonds of the same currency and term as the liabilities. Any surplus or deficit of scheme assets over liabilities is recognised in the balance sheet as an asset (surplus) or liability (deficit). In determining the value of scheme liabilities, assumptions are made as to price inflation, dividend growth, pension increases, earnings growth and employees. There is a range of assumptions that could be adopted in valuing the schemes’ liabilities. Different assumptions could significantly alter the amount of the deficit recognised in the balance sheet and the pension cost charged to the income statement. The assumptions adopted for the Group’s pension schemes are set out in Note 3 on the financial statements. The pension deficit recognised in the balance sheet at 31 December 2005 was £3,735 million (2004 – £2,940 million).
Fair value
Financial instruments classified as held-for-trading or designated as at fair value through profit or loss and financial assets classified as available-for-sale are recognised in the financial statements at fair value. All derivatives are measured at fair value. In the balance sheet, financial assets carried at fair value are included within Treasury and other eligible bills, Loans and advances to banks, Loans and advances to customers, Debt securities and Equity shares as appropriate. Financial liabilities carried at fair value are included within the captions Deposits by banks, Customer accounts, Debt securities in issue and Subordinated liabilities. Derivative assets and Derivative liabilities are shown separately on the face of the balance sheets. Gains or losses arising from changes in fair value of financial instruments classified as held-for-trading or designated as at fair value through profit or loss are included in the income statement. Unrealised gains and losses on available-for-sale financial assets are recognised directly in equity unless an impairment loss is recognised. The carrying value of a financial asset or a financial liability carried at cost or amortised cost that is the hedged item in a qualifying hedge relationship is adjusted by the gain or loss attributable to the hedged risk.
Fair value is the amount for which an asset could be exchanged, or a liability settled, between knowledgeable, willing parties in an arm's length transaction. Fair values are determined by reference to observable market prices where available and reliable. Where representative market prices for an instrument are not available or are unreliable because of poor liquidity, the fair value is derived from prices for its components using appropriate pricing or valuation models that are based on independently sourced market parameters, including interest rate yield curves, option volatilities and currency rates.
Financial assets carried at fair value include government, asset backed and corporate debt securities, reverse repos, loans, corporate equity shares and derivatives. Financial liabilities carried at fair value include deposits, repos, short positions in securities and debt securities issued. Fair value for a substantial proportion of these instruments is based on observable market prices or derived from observable market parameters. Where observable prices are not available, fair value is based on appropriate valuation techniques or management estimates.
The Group’s derivative products include swaps, forwards, futures and options. Exchange traded instruments are valued using quoted prices. The fair value of over-the-counter instruments is derived from pricing models which take account of contract terms, including maturity, as well as quoted market parameters such as interest rates and volatilities. Most of the Group’s pricing models do not entail material subjectivity because the methodologies utilised do not incorporate significant judgement and the parameters included in the models can be calibrated to actively quoted market prices. Values established from pricing models are adjusted for credit risk, liquidity risk and future operational costs.
A negligible proportion of the Group’s trading derivatives are valued directly from quoted prices, the majority being valued using appropriate valuation techniques. The fair value of substantially all securities positions carried at fair value is determined directly from quoted prices.
Details of financial instruments carried at fair value are given in Note 34 on the financial statements.
General insurance claims
The Group makes provision for the full cost of settling outstanding claims arising from its general insurance business at the balance sheet date, including claims estimated to have been incurred but not yet reported at that date and claims handling expenses. General insurance claims provisions amounted to £4,913 million at 31 December 2005 (2004 – £4,504 million).
Provisions are determined by management based on experience of claims settled and on statistical models which require certain assumptions to be made regarding the
95
Accounting policiescontinued
incidence, timing and amount of claims and any specific factors such as adverse weather conditions. In order to calculate the total provision required, the historical development of claims is analysed using statistical methodology to extrapolate, within acceptable probability parameters, the value of outstanding claims at the balance sheet date. Also included in the estimation of outstanding claims are other assumptions such as the inflationary factor used for bodily injury claims which is based on historical trends and, therefore, allows for some increase due to changes in common law and statute. Costs for both direct and indirect claims handling expenses are also included. Outward reinsurance recoveries are accounted for in the same accounting period as the direct claims to which they relate. The outstanding claims provision is based on information available to management and the eventual outcome may vary from the original assessment. Actual claims experience may differ from the historical pattern on which the estimate is based and the cost of settling individual claims may exceed that assumed.
Goodwill
The Group capitalises goodwill arising on the acquisition of businesses, as disclosed in the Accounting policies. The carrying value of goodwill as at 31 December 2005 was £18,823 million (2004 – £18,032 million).
Goodwill is the excess of the cost of an acquisition over the fair value of its net assets. The determination of the fair value of assets and liabilities of businesses acquired requires the exercise of management judgement; for example those financial assets and liabilities for which there are no quoted prices, and those non-financial assets where valuations reflect estimates of market conditions such as property. Different fair values would result in changes to the goodwill arising and to the post-acquisition performance of the acquisition. Goodwill is not amortised but is tested for impairment annually or more frequently if events or changes in circumstances indicate that it might be impaired.
For the purposes of impairment testing goodwill acquired in a business combination is allocated to each of the Group’s cash-generating units or groups of cash-generating units expected to benefit from the combination. Goodwill impairment testing involves the comparison of the carrying value of a cash-generating unit or group of cash generating units with its recoverable amount. The recoverable amount is the higher of the unit's fair value and its value in use. Value in use is the present value of expected future cash flows from the cash-generating unit or group of cash-generating units. Fair value is the amount obtainable for the sale of the cash-generating unit in an arm’s length transaction between knowledgeable, willing parties.
Impairment testing inherently involves a number of judgmental areas: the preparation of cash flow forecasts for periods that are beyond the normal requirements of management reporting; the assessment of the discount rate appropriate to the business; estimation of the fair value of cash-generating units; and the valuation of the separable assets of each business whose goodwill is being reviewed.
Accounting developments
International Financial Reporting Standards
The International Accounting Standards Board (“IASB”) issuedIFRS 7 ‘Financial Instruments: Disclosures’ in August 2005. The standard replaces IAS 30 ‘Disclosures in the Financial Statements of Banks and Similar Financial Institutions’ and the disclosure provisions in IAS 32 ‘Financial Instruments: Disclosure and Presentation’. IFRS 7 requires disclosure of the significance of financial instruments for an entity’s financial position and performance and of qualitative and quantitative information about exposure to risks arising from financial instruments. The standard is effective for annual periods beginning on or after 1 January 2007. Earlier application is encouraged.
At the same time the IASB issued an amendment ‘Capital Disclosures’ to IAS 1 ‘Presentation of Financial Statements’. It requires disclosures about an entity's capital and the way it is managed. This amendment is also effective for annual periods beginning on or after 1 January 2007. Earlier application is encouraged.
The IASB has also issued three amendments to IAS 39 ‘Financial Instruments: Recognition and Measurement’. The first, ‘Cash Flow Hedge Accounting of Forecast Intragroup Transactions’, published in April 2005, amends IAS 39 to permit the foreign currency risk of a highly probable forecast intragroup transaction to qualify as a hedged item in consolidated financial statements. The amendment is effective for annual periods beginning on or after 1 January 2006.
The second, ‘The Fair Value Option’, published in June 2005, places conditions on the option in IAS 39 to designate on initial recognition a financial asset or financial liability as at fair value through profit or loss. The amendment is effective for annual periods beginning on or after 1 January 2006. Earlier application is encouraged. The Group has adopted this amendment from 1 January 2005 (see accounting policies on page 88).
The third, ‘Financial Guarantee Contracts’, published in August 2005, amends IAS 39 and IFRS 4 ‘Insurance Contracts’. The amendments define a financial guarantee contract. They require such contracts to be recorded initially at fair value and subsequently at higher of the provision determined in accordance with IAS 37 ‘Provisions, Contingent Liabilities and Contingent Assets’ and the amount initially recognised less amortisation. The amendments are effective for annual periods beginning on or after 1 January 2006.
In December 2005, the IASB issued amendments to IAS 21 ‘The Effects of Changes in Foreign Exchange Rates’ to clarify that a monetary item can form part of the net investment in overseas operations regardless of the currency in which it is denominated and that the net investment in a foreign operation can include a loan from a fellow subsidiary. The amendments are effective immediately but have not been endorsed by the EU.
The Group is reviewing IFRS 7 and the amendments to IAS 1 and IAS 21 and those to IAS 39 that it has not implemented, to determine their effect on its financial reporting.
US GAAP
For a discussion of recent developments in US GAAP relevant to the Group, see Note 46 on the accounts.
96
| Consolidated income statement |
| for the year ended 31 December 2005 |
| | Note | | 2005
£m | | 2004
£m | |
|
|
|
|
|
|
|
| Interest receivable | | | 21,331 | | 16,632 | |
| Interest payable | | | (11,413 | ) | (7,561 | ) |
|
|
|
|
|
|
|
| Net interest income | | | 9,918 | | 9,071 | |
|
|
|
|
|
|
|
| Fees and commissions receivable | | | 6,750 | | 6,473 | |
| Fees and commissions payable | | | (1,841 | ) | (1,926 | ) |
| Income from trading activities | 1 | | 2,343 | | 1,988 | |
| Other operating income (excluding insurance premium income) | | | 2,953 | | 2,138 | |
| Insurance premium income | | | 6,076 | | 6,146 | |
| Reinsurers’ share | | | (297 | ) | (499 | ) |
|
|
|
|
|
|
|
| Non-interest income | | | 15,984 | | 14,320 | |
|
|
|
|
|
|
|
| Total income | | | 25,902 | | 23,391 | |
|
|
|
|
|
|
|
| Staff costs | | | 5,992 | | 5,188 | |
| Premises and equipment | | | 1,313 | | 1,177 | |
| Other administrative expenses | | | 2,816 | | 2,323 | |
| Depreciation and amortisation | | | 1,825 | | 1,674 | |
|
|
|
|
|
|
|
| Operating expenses | 2 | | 11,946 | | 10,362 | |
|
|
|
|
|
|
|
| Profit before other operating charges | | | 13,956 | | 13,029 | |
| Insurance claims | | | 4,413 | | 4,565 | |
| Reinsurers’ share | | | (100 | ) | (305 | ) |
|
|
|
|
|
|
|
| Operating profit before impairment losses | | | 9,643 | | 8,769 | |
| Impairment losses | | | 1,707 | | 1,485 | |
|
|
|
|
|
|
|
| Operating profit before tax | 4 | | 7,936 | | 7,284 | |
| Tax | 5 | | 2,378 | | 1,995 | |
|
|
|
|
|
|
|
| Profit for the year | | | 5,558 | | 5,289 | |
| | |
|
|
|
|
| | | | | | | |
| Profit attributable to: | | | | | | |
| Minority interests | | | 57 | | 177 | |
| Preference shareholders | 6 | | 109 | | 256 | |
| Ordinary shareholders | | | 5,392 | | 4,856 | |
|
|
|
|
|
|
|
| | | | 5,558 | | 5,289 | |
| | |
|
|
|
|
| | | | | | | |
| Per 25p ordinary share: | | | | | | |
| Basic earnings | 9 | | 169.4 | p | 157.4 | p |
| | |
|
|
|
|
| | | | | | | |
| Diluted earnings | 9 | | 168.3 | p | 155.9 | p |
| | |
|
|
|
|
| | | | | | | |
| Dividends | 7 | | 60.6 | p | 52.5 | p |
| | |
|
|
|
|
97
| Balance sheets |
| at 31 December 2005 |
| | | | Group | | Company |
| | |
|
|
| |
|
|
|
| | Note | | 2005
£m | | 2004
£m | | 2005
£m | | 2004
£m |
|
|
|
|
|
|
|
|
|
|
| Assets | | | | | | | | | |
| Cash and balances at central banks | | | 4,759 | | 4,293 | | — | | — |
| Treasury bills and other eligible bills | 10 | | 5,538 | | 6,110 | | — | | — |
| Loans and advances to banks | 11 | | 70,587 | | 61,073 | | 9,122 | | 4,106 |
| Loans and advances to customers | 12 | | 417,226 | | 347,251 | | 567 | | 305 |
| Debt securities | 13 | | 120,965 | | 93,908 | | — | | — |
| Equity shares | 14 | | 9,301 | | 4,723 | | — | | — |
| Investments in Group undertakings | 15 | | — | | — | | 20,851 | | 21,900 |
| Intangible assets | 17 | | 19,932 | | 19,242 | | — | | — |
| Property, plant and equipment | 18 | | 18,053 | | 16,428 | | — | | — |
| Settlement balances | | | 6,005 | | 5,682 | | — | | — |
| Derivatives at fair value | 19 | | 95,663 | | 17,800 | | 55 | | — |
| Prepayments, accrued income and other assets | 20 | | 8,798 | | 11,612 | | 147 | | 318 |
|
|
|
|
|
|
|
|
|
|
| Total assets | | | 776,827 | | 588,122 | | 30,742 | | 26,629 |
| | |
|
|
|
|
|
|
|
| | | | | | | | | | |
| Liabilities | | | | | | | | | |
| Deposits by banks | 21 | | 110,407 | | 99,883 | | 951 | | 174 |
| Customer accounts | 22 | | 342,867 | | 283,315 | | 55 | | — |
| Debt securities in issue | 23 | | 90,420 | | 63,999 | | 2,942 | | 1,608 |
| Settlement balances and short positions | 24 | | 43,988 | | 32,990 | | — | | — |
| Derivatives at fair value | 19 | | 96,438 | | 18,876 | | — | | — |
| Accruals, deferred income and other liabilities | 25 | | 14,247 | | 17,648 | | 14 | | 301 |
| Retirement benefit liabilities | 3 | | 3,735 | | 2,940 | | — | | — |
| Deferred taxation liabilities | 26 | | 1,695 | | 2,061 | | — | | — |
| Insurance liabilities | 27 | | 7,212 | | 8,647 | | — | | — |
| Subordinated liabilities | 28 | | 28,274 | | 20,366 | | 9,242 | | 5,935 |
|
|
|
|
|
|
|
|
|
|
| Total liabilities | | | 739,283 | | 550,725 | | 13,204 | | 8,018 |
| | | | | | | | | | |
| Equity * | | | | | | | | | |
| Minority interests | 29 | | 2,109 | | 3,492 | | — | | — |
| Shareholders’ equity | | | | | | | | | |
| Called up share capital | 30 | | 826 | | 822 | | 826 | | 822 |
| Reserves | 31 | | 34,609 | | 33,083 | | 16,712 | | 17,789 |
| Total equity | | | 37,544 | | 37,397 | | 17,538 | | 18,611 |
|
|
|
|
|
|
|
|
|
|
| | | | | | | | | | |
| Total liabilities and equity | | | 776,827 | | 588,122 | | 30,742 | | 26,629 |
| | |
|
|
|
|
|
|
|
* includes non-equity minority interests and preference shares in 2004.
The accounts were approved by the Board of directors on 27 February 2006 and signed on its behalf by:
| Sir George Mathewson | Sir Fred Goodwin | Guy Whittaker |
| Chairman | Group Chief Executive | Group Finance Director |
98
| Statements of recognised income and expense |
| for the year ended 31 December 2005 |
| | | | | Group | | | Company | |
| | | |
|
|
|
|
| |
|
|
|
|
|
| | Note | | | 2005
£m | | | 2004
£m | | | 2005
£m | | | 2004
£m | |
|
|
|
|
|
|
|
|
|
|
|
|
|
|
|
| Available-for-sale investments | | | | | | | | | | | | | | |
| Net valuation gains taken direct to equity | | | | 35 | | | | | | — | | | | |
| Net profit taken to income on sales | | | | (582 | ) | | | | | — | | | | |
| | | | | | | | | | | | | | | |
| Cash flow hedges | | | | | | | | | | | | | | |
| Net (losses)/gains taken direct to equity | | | | (67 | ) | | | | | 6 | | | | |
| | | | | | | | | | | | | | | |
| Exchange differences on translation of foreign operations | | | | 842 | | | (606 | ) | | — | | | — | |
| Actuarial losses on defined benefit plans | | | | (799 | ) | | (1,601 | ) | | — | | | — | |
| Other movements | | | | — | | | — | | | — | | | (1 | ) |
|
|
|
|
|
|
|
|
|
|
|
|
|
|
|
| (Expense)/income before tax on items recognised direct in equity | | | | (571 | ) | | (2,207 | ) | | 6 | | | (1 | ) |
| Tax on items recognised direct in equity | | | | 478 | | | 465 | | | (2 | ) | | — | |
|
|
|
|
|
|
|
|
|
|
|
|
|
|
|
| Net (expense)/income recognised direct in equity | | | | (93 | ) | | (1,742 | ) | | 4 | | | (1 | ) |
| Profit for the year | | | | 5,558 | | | 5,289 | | | 2,074 | | | 2,874 | |
|
|
|
|
|
|
|
|
|
|
|
|
|
|
|
| Total recognised income and expense for the year | | | | 5,465 | | | 3,547 | | | 2,078 | | | 2,873 | |
| | | |
|
|
|
|
|
|
|
|
|
|
|
| | | | | | | | | | | | | | | |
| Attributable to: | | | | | | | | | | | | | | |
| Equity holders of the parent | | | | 5,355 | | | 3,558 | | | 2,078 | | | 2,873 | |
| Minority interests | | | | 110 | | | (11 | ) | | — | | | — | |
|
|
|
|
|
|
|
|
|
|
|
|
|
|
|
| | | | | 5,465 | | | 3,547 | | | 2,078 | | | 2,873 | |
| | | |
|
|
|
|
|
|
|
|
|
|
|
| | | | | | | | | | | | | | | |
| Effect of changes in accounting policies on the implementation of IFRS | | | | | | | | | | | | | | |
| Equity holders of the parent | | | | (1,843 | ) | | 1,243 | | | (16,759 | ) | | (15,798 | ) |
| Minority interests | | | | (2,878 | ) | | (321 | ) | | — | | | — | |
|
|
|
|
|
|
|
|
|
|
|
|
|
|
|
| | | | | (4,721 | ) | | 922 | | | (16,759 | ) | | (15,798 | ) |
| | | |
|
|
|
|
|
|
|
|
|
|
|
99
| Cash flow statements |
| for the year ended 31 December 2005 |
|
| | | | | Group | | | Company | |
| | | |
|
|
|
|
| |
|
|
|
|
|
| | Note | | | 2005
£m | | | 2004
£m | | | 2005
£m | | | 2004
£m | |
|
|
|
|
|
|
|
|
|
|
|
|
|
|
|
| Operating activities | | | | | | | | | | | | | | |
| Operating profit before tax | | | | 7,936 | | | 7,284 | | | 1,932 | | | 2,890 | |
| | | | | | | | | | | | | | | |
| Adjustments for: | | | | | | | | | | | | | | |
| Depreciation and amortisation | | | | 1,825 | | | 1,674 | | | — | | | — | |
| Interest on subordinated liabilities | | | | 1,271 | | | 681 | | | 583 | | | 318 | |
| Charge for defined benefit pension schemes | | | | 462 | | | 397 | | | — | | | — | |
| Cash contribution to defined benefit pension schemes | | | | (452 | ) | | (1,146 | ) | | — | | | — | |
| Other non-cash items | | | | 338 | | | (767 | ) | | (16 | ) | | 1 | |
|
|
|
|
|
|
|
|
|
|
|
|
|
|
|
| Net cash inflow from trading activities | | | | 11,380 | | | 8,123 | | | 2,499 | | | 3,209 | |
| Changes in operating assets and liabilities | | | | (519 | ) | | (4,264 | ) | | 2,050 | | | (148 | ) |
|
|
|
|
|
|
|
|
|
|
|
|
|
|
|
| Net cash flows from operating activities before tax | | | | 10,861 | | | 3,859 | | | 4,549 | | | 3,061 | |
| Income taxes (paid)/received | | | | (1,911 | ) | | (1,366 | ) | | (18 | ) | | 36 | |
|
|
|
|
|
|
|
|
|
|
|
|
|
|
|
| Net cash flows from operating activities | 36 | | | 8,950 | | | 2,493 | | | 4,531 | | | 3,097 | |
|
|
|
|
|
|
|
|
|
|
|
|
|
|
|
| | | | | | | | | | | | | | | |
| Investing activities | | | | | | | | | | | | | | |
| Sale and maturity of securities | | | | 39,472 | | | 43,022 | | | — | | | — | |
| Purchase of securities | | | | (39,196 | ) | | (41,790 | ) | | — | | | — | |
| Investment in subsidiaries | | | | — | | | — | | | (2,961 | ) | | (6,342 | ) |
| Sale of property, plant and equipment | | | | 2,220 | | | 1,921 | | | — | | | — | |
| Purchase of property, plant and equipment | | | | (4,812 | ) | | (4,583 | ) | | — | | | — | |
| Net investment in business interests and intangible assets | 37 | | | (296 | ) | | (7,968 | ) | | — | | | — | |
| Loans to subsidiaries | | | | — | | | — | | | (337 | ) | | (350 | ) |
| Repayments to subsidiaries | | | | — | | | — | | | 1,183 | | | 40 | |
|
|
|
|
|
|
|
|
|
|
|
|
|
|
|
| Net cash flows from investing activities | | | | (2,612 | ) | | (9,398 | ) | | (2,115 | ) | | (6,652 | ) |
|
|
|
|
|
|
|
|
|
|
|
|
|
|
|
| | | | | | | | | | | | | | | |
| Financing activities | | | | | | | | | | | | | | |
| Issue of ordinary shares | | | | 163 | | | 2,845 | | | 163 | | | 2,845 | |
| Issue of equity preference shares | | | | 1,649 | | | 1,358 | | | 1,649 | | | 1,358 | |
| Issue of subordinated liabilities | | | | 1,234 | | | 4,624 | | | 337 | | | 1,424 | |
| Proceeds of minority interests acquired | | | | 1,264 | | | 1,260 | | | — | | | — | |
| Costs of minority interests redeemed | | | | (121 | ) | | (2 | ) | | — | | | — | |
| Repayments of subordinated liabilities | | | | (1,553 | ) | | (718 | ) | | (1,183 | ) | | (40 | ) |
| Dividends paid | | | | (2,007 | ) | | (1,635 | ) | | (1,912 | ) | | (1,488 | ) |
| Interest on subordinated liabilities | | | | (1,332 | ) | | (613 | ) | | (577 | ) | | (318 | ) |
|
|
|
|
|
|
|
|
|
|
|
|
|
|
|
| Net cash flows from financing activities | | | | (703 | ) | | 7,119 | | | (1,523 | ) | | 3,781 | |
|
|
|
|
|
|
|
|
|
|
|
|
|
|
|
| Effects of exchange rate changes on cash and cash equivalents | | | | (3,107 | ) | | 1,686 | | | (76 | ) | | — | |
|
|
|
|
|
|
|
|
|
|
|
|
|
|
|
| | | | | | | | | | | | | | | |
| Net increase in cash and cash equivalents | | | | 2,528 | | | 1,900 | | | 817 | | | 226 | |
| Cash and cash equivalents 1 January | | | | 50,021 | | | 48,121 | | | 309 | | | 83 | |
|
|
|
|
|
|
|
|
|
|
|
|
|
|
|
| Cash and cash equivalents 31 December | | | | 52,549 | | | 50,021 | | | 1,126 | | | 309 | |
| | | |
|
|
|
|
|
|
|
|
|
|
|
100
Notes on the accounts
Introduction
IAS 32 ‘Financial Instruments: Disclosure and Presentation’, IAS 39 ‘Financial Instruments: Recognition and Measurement’ and IFRS 4 ‘Insurance Contracts’ were implemented by the Group on 1 January 2005 and applied prospectively from that date and, as permitted by IFRS, without restating comparatives. Consequently, in the notes on the accounts affected by these standards, comparative data for 2004 in accordance with previous GAAP have been presented.
| 1Income from trading activities | | Group |
| | | | |
|
| | | | | 2005
£m | | 2004
£m |
|
|
|
|
|
|
|
|
| Foreign exchange(1) | | 683 | | 616 |
| Securities | | | | |
| | – | equities(2) | | 39 | | 36 |
| | – | debt(3) | | 1,023 | | 811 |
| Interest rate derivatives(4) | | 598 | | 525 |
|
|
|
|
|
|
|
|
| | | | | 2,343 | | 1,988 |
| | | | |
|
|
|
| | Notes: |
| (1) | Includes spot and forward foreign exchange contracts and currency swaps, futures and options and related hedges and funding |
| (2) | Includes equities, equity derivatives, commodity contracts and related hedges and funding. |
| (3) | Includes debt securities and related hedges and funding. |
| (4) | Includes interest rate swaps, forward rate agreements, interest rate options, interest rate futures and credit derivatives and related hedges and funding. |
| | | | | | |
| 2 Operating expenses | | |
| | | | | | Group |
| | | | |
|
| | | | | 2005
£m | | 2004
£m |
|
|
|
|
|
|
|
|
| Administrative expenses | | | | |
| Staff costs | | | | |
| Wages, salaries and other staff costs | | 5,084 | | 4,421 |
| Social security costs | | 354 | | 295 |
| Share-based compensation | | 44 | | 36 |
| Pension costs (see note 3) | | | | |
| – defined benefit schemes | | 462 | | 397 |
| – defined contribution schemes | | 48 | | 39 |
|
|
|
|
|
| | | | | 5,992 | | 5,188 |
| Premises and equipment | | 1,313 | | 1,177 |
| Other | | 2,816 | | 2,323 |
|
|
|
|
|
| | | | | 10,121 | | 8,688 |
| Depreciation and amortisation | | | | |
| Property plant and equipment (see note 18) | | 1,326 | | 1,155 |
| Intangible assets (see note 17) | | 499 | | 519 |
|
|
|
|
|
| | | | | 11,946 | | 10,362 |
| | | | |
|
|
|
The average number of persons employed by the Group during the year, excluding temporary staff, was 144,900 (2004 – 133,300).
101
Notes on the accountscontinued
3 Pension costs
The Group operates a number of pension schemes which are predominantly defined benefit schemes whose assets are independent of the Group’s finances. In addition to The Royal Bank of Scotland Group Pension Fund (‘Main Scheme’), the Group operates a number of other UK and overseas pension schemes.
It also provides other post-retirement benefits, principally through subscriptions to private healthcare schemes in the UK and the US and unfunded post-retirement benefit plans. Provision for the costs of these benefits is charged to the income statement over the average remaining future service lives of the eligible employees. The amounts are not material.
Interim valuations of the Group’s schemes were prepared to 31 December by independent actuaries, using the following assumptions:
| | Main Scheme | | | All Schemes | |
| |
|
|
| |
| |
| Principal actuarial assumptions at 31 December (weighted average) | | 2005 | | | 2004 | | | 2005 | | | 2004 | |
|
|
|
|
|
|
|
|
|
|
|
| |
| Discount rate | | 4.8% | | | 5.4% | | | 4.8% | | | 5.4% | |
| Expected return on plan assets | | 6.5% | | | 6.7% | | | 6.5% | | | 6.8% | |
| Rate of increase in salaries | | 4.0% | | | 4.0% | | | 3.9% | | | 3.9% | |
| Rate of increase in pensions in payment | | 2.7% | | | 2.7% | | | 2.6% | | | 2.7% | |
| Inflation assumption | | 2.7% | | | 2.7% | | | 2.7% | | | 2.7% | |
|
|
|
|
|
|
|
|
|
|
|
| |
| The expected return on plan assets at 31 December is based upon the weighted average of the following assumptions of the returnson the major classes of plan assets: |
| | | | | | | | | | | | | |
| | Main Scheme | | | All Schemes | |
| |
|
|
| |
| |
| | 2005 | | | 2004 | | | 2005 | | | 2004 | |
|
|
|
|
|
|
|
|
|
|
|
| |
| Equities | | 7.7% | | | 8.1% | | | 7.7% | | | 8.1% | |
| Index-linked bonds | | 4.1% | | | 4.5% | | | 4.1% | | | 4.5% | |
| Government fixed interest bonds | | 4.1% | | | 4.5% | | | 4.1% | | | 4.5% | |
| Corporate and other bonds | | 4.8% | | | 5.4% | | | 4.8% | | | 5.4% | |
| Property | | 5.9% | | | 6.3% | | | 5.9% | | | 6.3% | |
| Cash and other assets | | 4.2% | | | 4.6% | | | 3.7% | | | 4.5% | |
|
|
|
|
|
|
|
|
|
|
|
| |
| The expected return on Main Scheme plan assets at 31 December 2004 has been adjusted to reflect the investment, in early January2005, of payments made to the fund on 31 December and included as cash and other assets at that date. | |
| | | | | | | | | | | | | |
| Post-retirement mortality assumptions (Main Scheme) | | | | | 2005 | | | 2004 | | | 2003 | |
|
|
|
|
|
|
|
|
|
|
|
| |
| Longevity at age 60 for current pensioners (years) | | | | | | | | | | | | |
| Males | | | | | 25.4 | | | 25.4 | | | 23.5 | |
| Females | | | | | 28.2 | | | 28.2 | | | 25.3 | |
| | | | | | | | | | | | | |
| Longevity at age 60 for future pensioners (years) | | | | | | | | | | | | |
| Males | | | | | 26.2 | | | 26.2 | | | 24.8 | |
| Females | | | | | 29.0 | | | 29.0 | | | 26.5 | |
|
|
|
|
|
|
|
|
|
|
|
| |
102
| | Main Scheme | | | All Schemes | |
| |
|
|
|
|
|
|
|
| |
|
|
|
|
|
|
|
|
| Changes in value of net pension liability | | Fair value
of plan
assets
£m | | | Present
value of
defined
benefit
obligations
£m | | | Net
pension
liability
£m | | | Fair value
of plan
assets
£m | | | Present
value of
defined
benefit
obligations
£m | | | Net
pension
liability
£m | |
|
|
|
|
|
|
|
|
|
|
|
|
|
|
|
|
|
|
|
| At 1 January 2004 | | 11,797 | | | 13,594 | | | 1,797 | | | 12,862 | | | 14,898 | | | 2,036 | |
|
|
|
|
|
|
|
|
|
|
|
|
|
|
|
|
|
|
|
| Currency translation and other adjustments | | — | | | — | | | — | | | (18 | ) | | (9 | ) | | 9 | |
| Income statement: | | | | | | | | | | | | | | | | | | |
| Expected return | | 838 | | | | | | (838 | ) | | 920 | | | | | | (920 | ) |
| Interest cost | | | | | 759 | | | 759 | | | | | | 837 | | | 837 | |
| Current service cost | | | | | 400 | | | 400 | | | | | | 469 | | | 469 | |
| Past service cost | | | | | — | | | — | | | | | | 11 | | | 11 | |
| | | 838 | | | 1,159 | | | 321 | | | 920 | | | 1,317 | | | 397 | |
Statement of recognised income
and expense: | | | | | | | | | | | | | | | | | | |
| Actuarial gains and losses | | 392 | | | 1,825 | | | 1,433 | | | 408 | | | 2,009 | | | 1,601 | |
| Acquisitions of subsidiaries | | — | | | — | | | — | | | 45 | | | 88 | | | 43 | |
| Contributions by employer | | 1,069 | | | | | | (1,069 | ) | | 1,146 | | | | | | (1,146 | ) |
| Contributions by plan participants | | — | | | — | | | | | | 3 | | | 3 | | | | |
| Benefits paid | | (494 | ) | | (494 | ) | | | | | (534 | ) | | (534 | ) | | | |
| Expenses included in service cost | | (33 | ) | | (33 | ) | | | | | (34 | ) | | (34 | ) | | | |
|
|
|
|
|
|
|
|
|
|
|
|
|
|
|
|
|
|
|
| At 31 December 2004 | | 13,569 | | | 16,051 | | | 2,482 | | | 14,798 | | | 17,738 | | | 2,940 | |
|
|
|
|
|
|
|
|
|
|
|
|
|
|
|
|
|
|
|
| Currency translation and other adjustments | | — | | | — | | | — | | | 26 | | | 26 | | | — | |
| Income statement: | | | | | | | | | | | | | | | | | | |
| Expected return | | 930 | | | | | | (930 | ) | | 1,017 | | | | | | (1,017 | ) |
| Interest cost | | | | | 865 | | | 865 | | | | | | 953 | | | 953 | |
| Current service cost | | | | | 447 | | | 447 | | | | | | 522 | | | 522 | |
| Past service cost | | | | | 3 | | | 3 | | | | | | 4 | | | 4 | |
| | 930 | | | 1,315 | | | 385 | | | 1,017 | | | 1,479 | | | 462 | |
Statement of recognised income
and expense: | | | | | | | | | | | | | | | | | | |
| Actuarial gains and losses | | 1,556 | | | 2,273 | | | 717 | | | 1,660 | | | 2,459 | | | 799 | |
| Disposal of subsidiaries | | — | | | — | | | — | | | — | | | (14 | ) | | (14 | ) |
| Contributions by employer | | 380 | | | | | | (380 | ) | | 452 | | | | | | (452 | ) |
| Contributions by plan participants | | — | | | — | | | | | | 4 | | | 4 | | | | |
| Benefits paid | | (504 | ) | | (504 | ) | | | | | (550 | ) | | (550 | ) | | | |
| Expenses included in service cost | | (17 | ) | | (17 | ) | | | | | (19 | ) | | (19 | ) | | | |
|
|
|
|
|
|
|
|
|
|
|
|
|
|
|
|
|
|
|
| At 31 December 2005 | | 15,914 | | | 19,118 | | | 3,204 | | | 17,388 | | | 21,123 | | | 3,735 | |
| |
|
|
|
|
|
|
|
|
|
|
|
|
|
|
|
|
|
The Group expects to contribute £444 million to its defined benefit pension schemes in 2006 (Main Scheme – £384 million). Of the net pension liability, £104 million (2004 – £95 million) relates to unfunded schemes.
103
Notes on the accountscontinued
| 3 Pension costs(continued) | | | | | | | | | | | | |
| | Main Scheme | | | All Schemes | |
| |
|
|
|
|
| |
|
|
|
| |
| Major plan assets as a percentage of total plan assets | | 2005 | | | 2004 | | | 2005 | | | 2004 | |
|
|
|
|
|
|
|
|
|
|
|
| |
| Equities | | 61.3 | % | | 56.7 | % | | 61.6 | % | | 57.2 | % |
| Index-linked bonds | | 18.1 | % | | 16.5 | % | | 16.8 | % | | 15.3 | % |
| Government fixed interest bonds | | 1.8 | % | | 2.1 | % | | 2.6 | % | | 2.8 | % |
| Corporate and other bonds | | 14.6 | % | | 12.5 | % | | 14.6 | % | | 12.7 | % |
| Property | | 3.6 | % | | 3.1 | % | | 3.7 | % | | 3.2 | % |
| Cash and other assets | | 0.6 | % | | 9.1 | % | | 0.7 | % | | 8.8 | % |
|
|
|
|
|
|
|
|
|
|
|
| |
The pension plan assets include a holding of the company’s ordinary shares with a fair value of £78 million (2004 – £73 million), of which £76 million (2004 – £71 million) are held in the Main Scheme which also holds financial instruments issued by the Group with a value of £299 million (2004 – £726 million).
Cumulative net actuarial losses of £2,400 million (2004 – £1,601 million) have been recognised in the statement of recognised income and expense, of which £2,150 million (2004 – £1,433 million) relate to the Main Scheme.
| | Main Scheme | | All Schemes |
| |
|
|
|
|
|
|
| |
|
|
|
|
|
|
|
| History of defined benefit schemes | | 2005
£m | | | 2004
£m | | | 2003
£m | | 2005
£m | | | 2004
£m | | | 2003
£m |
|
|
|
|
|
|
|
|
|
|
|
|
|
|
|
|
|
| Present value of defined benefit obligations | | 19,118 | | | 16,051 | | | 13,594 | | 21,123 | | | 17,738 | | | 14,898 |
| Fair value of plan assets | | 15,914 | | | 13,569 | | | 11,797 | | 17,388 | | | 14,798 | | | 12,862 |
|
|
|
|
|
|
|
|
|
|
|
|
|
|
|
|
|
| Net deficit | | 3,204 | | | 2,482 | | | 1,797 | | 3,735 | | | 2,940 | | | 2,036 |
| |
|
|
|
|
|
|
|
|
|
|
|
|
|
|
|
| Experience losses on plan liabilities | | (41 | ) | | (624 | ) | | | | (68 | ) | | (631 | ) | | |
| Experience gains on plan assets | | 1,556 | | | 392 | | | | | 1,660 | | | 408 | | | |
| Actual return on pension schemes assets | | 2,486 | | | 1,230 | | | | | 2,677 | | | 1,328 | | | |
|
|
|
|
|
|
|
|
|
|
|
|
|
|
|
|
|
| 4 Operating profit before tax | | | | | | |
| | | | |
| Operating profit before tax is stated after taking account of the following: | | Group | |
| | | |
| |
| | | | 2005
£m | | | 2004
£m | |
|
|
|
|
|
|
|
| |
| Income | | Sales of available-for-sale securities | | | | | | |
| | – Gross gains | | 683 | | | | |
| | – Gross losses | | (16 | ) | | | |
| |
|
|
| | | | |
| | – Net profit | | 667 | | | | |
| | | |
| | | | |
| | Sales of investment securities | | | | | | |
| | – Gross gains | | | | | 197 | |
| | – Gross losses | | | | | (30 | ) |
| |
|
|
|
|
|
| |
| | – Net profit | | | | | 167 | |
| | | | | | |
| |
| | Dividend income | | 108 | | | 79 | |
| | Share of associated undertakings’ net profit | | 41 | | | 24 | |
| | Rental income from investment properties | | 250 | | | 241 | |
| | Net gains on financial assets and liabilities | | | | | | |
| | designated as at fair value through profit or loss | | 364 | | | | |
| Expenses | | Interest on subordinated liabilities | | 1,271 | | | 681 | |
| | Direct operating expenses of investment properties | | 61 | | | 72 | |
| | Integration expenditure* relating to: | | | | | | |
| | – acquisition of NatWest | | 129 | | | 280 | |
| | – other acquisitions | | 329 | | | 240 | |
|
|
|
|
|
|
|
| |
| | | | | | | |
| * Integration expenditure comprises: | | | | | | |
| | Staff costs | | 148 | | | 83 | |
| | Premises and equipment | | 39 | | | 35 | |
| | Other administrative expenses | | 131 | | | 149 | |
| | Depreciation and amortisation | | 140 | | | 253 | |
|
|
|
|
|
|
|
| |
| | | | 458 | | | 520 | |
| | | |
|
|
|
| |
104
| Auditors’ remuneration | | | | |
| | | |
| Amounts paid to the auditors for statutory audit and other services were as follows: | | Group |
| |
|
|
|
| | 2005
£m | | 2004
£m |
|
|
|
|
|
| Audit services | | | | |
| – Statutory audit | | 9.9 | | 8.2 |
| – Audit related including regulatory reporting* | | 7.0 | | 1.1 |
|
|
|
|
|
| | 16.9 | | 9.3 |
|
|
|
|
|
| Further assurance services | | 6.8 | | 3.0 |
|
|
|
|
|
| Tax services | | | | |
| – Compliance services | | 0.2 | | 0.2 |
| – Advisory services | | — | | 0.2 |
|
|
|
|
|
| | 0.2 | | 0.4 |
|
|
|
|
|
| Other services | | 0.4 | | 3.0 |
|
|
|
|
|
| Total | | 24.3 | | 15.7 |
| |
|
|
|
| * Includes fees relating to the transition to IFRS and work in respect of US Sarbanes-Oxley Act Section 404 reporting requirements. | | | |
| | | | |
| The auditors’ remuneration for statutory audit of the company was £0.1 million (2004 – £0.1 million). Non–audit fees paid to the auditors and their associates in the UK was £12.4 million (2004 – £6.4 million). | |
| | | | |
| 5 Tax | | Group | |
| |
| |
| | 2005
£m | | | 2004
£m | |
|
|
|
|
|
| |
| Current taxation: | | | | | | |
| UK corporation tax charge for the year at 30% | | 2,280 | | | 2,091 | |
| Over provision in respect ofprior periods | | (101 | ) | | (168 | ) |
| Relief for overseas taxation | | (171 | ) | | (212 | ) |
|
|
|
|
|
| |
| | 2,008 | | | 1,711 | |
| Deferred taxation: | | | | | | |
| Current year charge | | 477 | | | 333 | |
| Over provision in respect ofprior periods | | (107 | ) | | (49 | ) |
|
|
|
|
|
| |
| Tax charge for the year | | 2,378 | | | 1,995 | |
| |
|
|
|
| |
| The actual tax charge differs from the expected tax charge computed by applying the standard rate of UK corporation tax of 30% as follows: | | | | | | |
| | | | | | | |
| | 2005
£m | | | 2004
£m | |
|
|
|
|
|
| |
| Expected tax charge | | 2,381 | | | 2,185 | |
| Interest on subordinated debt not allowable for tax | | 79 | | | — | |
| Non-deductible items | | 230 | | | 110 | |
| Non-taxable items | | (166 | ) | | (128 | ) |
| Taxable foreign exchange movements | | (10 | ) | | (10 | ) |
| Foreign profits taxed at other rates | | 77 | | | 49 | |
| Unutilised losses brought forward and carried forward | | (5 | ) | | 6 | |
| Adjustments relating to prior periods | | (208 | ) | | (217 | ) |
|
|
|
|
|
| |
| Actual tax charge for the year | | 2,378 | | | 1,995 | |
| |
|
|
|
| |
(1) | Deferred tax assets of £51 million (2004 – £110 million) resulting from tax losses carried forward of £150 million (2004 – £291 million) have not been recognised as it is currently not certain that the assets will be recoverable. These assets may be recoverable if the losses can be offset against suitable future taxable profits arising in the same tax jurisdiction. |
105
Notes on the accountscontinued
| 6 Profit attributable to preference shareholders | | | | Group |
| | | |
|
|
|
| | | | Dividends paid
to equity
preference
shareholders
2005
£m | | Finance cost
included in
interest
payable
2005
£m | | Finance
cost of
preference
shares
2004
£m |
|
|
|
|
|
|
|
|
|
| Non-cumulative preference shares of US$0.01 | | | | 58 | | 115 | | 105 |
| Non-cumulative convertible preference shares ofUS$0.01 | | | | — | | 73 | | 90 |
| Non-cumulative convertible preference shares of€0.01 | | | | — | | 9 | | 33 |
| Non-cumulative preference shares of€0.01 | | | | 51 | | — | | 4 |
| Non-cumulative convertible preference shares of£0.01 | | | | — | | 15 | | 15 |
| Appropriation for premium payable on redemption and issue costs | | | | — | | 8 | | 9 |
|
|
|
|
|
|
|
|
|
| Total(3) | | | | 109 | | 220 | | 256 |
| | | |
|
|
|
|
|
| Equity | | | | | | | | 15 |
| Non-equity | | | | | | | | 241 |
|
|
|
|
|
|
|
|
|
| | Notes: |
| (1) | In the year ended 31 December 2005, dividends of £55,000 (2004 – £55,000) were paid on the 11% cumulative preference shares of £1 and dividends of £22,000 (2004 – £22,000) were paid on the 5.5% cumulative preference shares of £1. |
| (2) | Following the implementation of IAS 32 on 1 January 2005, several of the Group’s preference share issues are now included in subordinated liabilities and the finance cost thereon is included in interest payable. |
| (3) | Between 1 January 2006 and the date of approval of these accounts, dividends amounting to US$39 million have been declared in respect of equity preference shareholders for payment on 31 March 2006. |
| 7 Ordinary dividends | | Group |
| |
|
|
|
| | 2005
p per share | | 2004
p per share | | 2005
£m | | 2004
£m |
|
|
|
|
|
|
|
|
|
| Final dividend for previous year declared during the current year | | 41.2 | | 35.7 | | 1,308 | | 1,059 |
| Interim dividend | | 19.4 | | 16.8 | | 619 | | 529 |
|
|
|
|
|
|
|
|
|
| Total dividends paid on ordinary equity shares | | 60.6 | | 52.5 | | 1,927 | | 1,588 |
| |
|
|
|
Final dividends are not accounted for until they have been ratified at the Annual General Meeting. At the meeting on 28 April 2006, a dividend in respect of 2005 of 53.1 pence per share (2004 – 41.2 pence per share) amounting to a total of £1.7 billion (2004 – £1.3 billion) is to be proposed. The financial statements for the year ended 31 December 2005 do not reflect this dividend which, if approved, will be accounted for in shareholders’ equity as an appropriation of retained profits in the year ending 31 December 2006.
8 Profit dealt with in the accounts of the company
As permitted by section 230(3) of the Companies Act 1985, the primary financial statements of the company do not include an income statement. Condensed information is set out below:
| | Company | |
| |
| |
| | 2005
£m | | | 2004
£m | |
|
|
|
|
|
| |
| Dividends received from banking subsidiary | | 2,082 | | | 3,000 | |
| Dividends received from other subsidiaries | | 100 | | | — | |
|
|
|
|
|
| |
| Total income | | 2,182 | | | 3,000 | |
| Interest receivable from subsidiaries | | 577 | | | 313 | |
| Interest payable to subsidiaries | | (189 | ) | | (150 | ) |
| Other net interest payable and operating expenses | | (638 | ) | | (273 | ) |
|
|
|
|
|
| |
| Operating profit before tax | | 1,932 | | | 2,890 | |
| Tax | | 142 | | | (16 | ) |
|
|
|
|
|
| |
| Profit for the year | | 2,074 | | | 2,874 | |
| |
|
|
|
| |
| Profit attributable to: | | | | | | |
| Ordinary shareholders | | 1,965 | | | 2,618 | |
| Other shareholders | | 109 | | | 256 | |
|
|
|
|
|
| |
| | 2,074 | | | 2,874 | |
| |
|
|
|
| |
106
| 9 Earnings per ordinary share | | | | |
| | | |
| The earnings per share are based on the following: | | Group |
| |
|
| | 2005
£m | | 2004
£m |
|
|
|
|
|
| Earnings: | | | | |
| Profit attributableto ordinary shareholders | | 5,392 | | 4,856 |
| Add back dividends on dilutive convertible non-equity shares | | 65 | | 66 |
|
|
|
|
|
| Diluted earnings attributableto ordinary shareholders | | 5,457 | | 4,922 |
| |
|
|
|
| | Number of shares – millions |
|
|
|
|
|
| Number of ordinary shares: | | | | |
| Weighted average number of ordinary shares in issue during the year | | 3,183 | | 3,085 |
| Effect of dilutive share options and convertible non-equity shares | | 60 | | 73 |
|
|
|
|
|
| Diluted weighted average number of ordinary shares during the year | | 3,243 | | 3,158 |
| |
|
|
|
All convertible preference shares have a dilutive effect in the current year and as such have been included in the computation of diluted earnings per share. In 2004, $1,500 million of convertible preference shares was not included in the computation of diluted earnings per share as their effect was anti-dilutive.
| 10 Treasury bills and other eligible bills | | | | | | Group |
| | | | | |
|
| | | | | | 2005
£m | | 2004
£m |
|
|
|
|
|
|
|
|
|
| Treasury bills and similar securities | | | | | | 5,402 | | 5,538 |
| Other eligible bills | | | | | | 136 | | 572 |
|
|
|
|
|
|
|
|
|
| | | | | | 5,538 | | 6,110 |
| | | | | |
|
|
| Held-for-trading | | | | | | 3,004 | | |
| Available-for-sale | | | | | | 2,534 | | |
|
|
|
|
|
|
| | |
| | | | | | 5,538 | | |
| | | | | |
| | |
| 11 Loans and advances to banks | | Group | | Company |
| |
|
| |
|
| | 2005 | | 2004 | | 2005 | | 2004 |
| | £m | | £m | | £m | | £m |
|
|
|
|
|
|
|
|
|
| Held-for-trading | | 44,965 | | | | — | | |
| Designated as at fair value through profit or loss | | 282 | | | | — | | |
| Loans and receivables | | 25,340 | | | | 9,122 | | |
|
|
|
|
|
|
|
|
|
| | 70,587 | | 61,073 | | 9,122 | | 4,106 |
| | |
|
|
|
|
|
|
|
| Amounts above include: | | | | | | | | |
| Items in the course of collection from other banks | | 2,901 | | 2,629 | | | | |
| Due from subsidiaries | | | | | | 9,122 | | 4,106 |
|
|
|
|
|
|
|
|
|
| | | | | |
| 12 Loans and advances to customers | | Group | | Company |
| |
|
|
| |
|
| | 2005 | | 2004 | | 2005 | | 2004 |
| | £m | | £m | | £m | | £m |
|
|
|
|
|
|
|
|
|
| Held-for-trading | | 53,963 | | | | — | | |
| Designated as at fair value through profit or loss | | 616 | | | | — | | |
| Loans and receivables | | 350,960 | | | | 567 | | |
| Finance leases | | 11,687 | | | | — | | |
|
|
|
|
|
|
|
|
|
| | 417,226 | | 347,251 | | 567 | | 305 |
| |
|
|
|
|
|
|
|
| Amounts above include: | | | | | | | | |
| Due from subsidiaries | | | | | | 567 | | 305 |
| Subordinated advances | | | | 220 | | | | — |
|
|
|
|
|
|
|
|
|
107
Notes on the accountscontinued
12 Loans and advances to customers(continued)
Securitisations
The Group engages in securitisation transactions of its financial assets including commercial and residential mortgage loans, commercial and residential mortgage related securities, US Government agency collateralised mortgage obligations, and other types of financial assets. In such transactions, the assets, or interests in the assets, are transferred generally to a special purpose entity which then issues liabilities to third party investors.
Securitisations may, depending on the individual arrangement, result in continued recognition of the securitised assets; continued recognition of the assets to the extent of the Group’s continuing involvement in those assets; or derecognition of the assets and the separate recognition, as assets or liabilities, of any rights and obligations created or retained in the transfer (see Accounting policies on page 93). The Group has securitisations in each of these categories.
Continued recognition
The table below sets out the asset categories together the carrying amounts of the assets and associated liabilities.
| | 2005 | | 2004 |
| |
|
| |
|
|
| Asset type | | Assets
£m | | Liabilities
£m | | Assets
£m | | Liabilities
£m |
|
|
|
|
|
|
|
|
|
| Residential mortgages (1, 2) | | 2,388 | | 2,366 | | 1,519 | | 1,479 |
| Finance lease receivables (1, 3) | | 1,467 | | 1,170 | | 1,897 | | 1,502 |
| Other loans (1, 4) | | 2,189 | | 1,543 | | 1,713 | | 1,313 |
| Credit card receivables (5) | | 2,891 | | 2,836 | | 1,133 | | 1,133 |
| Commercial paper conduits (6) | | 6,688 | | 6,685 | | 4,704 | | 4,696 |
|
|
|
|
|
|
|
|
|
| (1) | At 31 December 2004, in accordance with previous GAAP, the financial assets in these categories were derecognised to the extent of non-recourse finance as the arrangements qualified for the linked presentation. |
| (2) | Mortgages have been transferred to special purpose vehicles, held ultimately by charitable trusts, funded principally through the issue of floating rate notes. The Group has entered into arm’s length fixed/floating interest rate swaps with the securitisation vehicles and provides mortgage management and agency services to the vehicles. On repayment of the financing, any further amounts generated by the mortgages will be paid to the Group. In 2004, the Group recognised net income of £26 million. |
| (3) | Certain finance lease receivables (leveraged leases) involve the Group as lessor obtaining non-recourse funding from third parties. This financing is secured on the underlying leases and the provider of the finance has no recourse whatsoever to the other assets of the Group. In 2004, the Group recognised net income of £13 million. |
| (4) | Other loans originated by the Group have been transferred to special purpose vehicles funded through the issue of notes. Any proceeds from the loans in excess of the amounts required to service and repay the notes are payable to the Group after deduction of expenses. In 2004, the Group recognised net income of £37 million. |
| (5) | Credit card receivables in the UK have been securitised. Notes have been issued by a special purpose vehicle. The note holders have a proportionate interest in a pool of credit card receivables that have been equitably assigned by the Group to a receivables trust. The Group continues to be exposed to the risks and rewards of the transferred receivables through its right to excess spread (after charge offs). |
| (6) | The Group sponsors commercial paper conduits. Customer assets are transferred into an SPE which issues notes in the commercial paper market. The Group supplies certain services and contingent liquidity support to these vehicles on an arm’s length basis as well as programme credit enhancement. |
108
Continuing involvement
In certain US securitisations of residential mortgages substantially all the risks and rewards have been neither transferred nor retained, but the Group has retained control, of the assets and continues to recognise the assets to the extent of its continuing involvement. Securitised assets were £39.8 billion; retained interests £863 million; subordination assets £609 million and related liabilities £609 million.
Derecognition
Other securitisations of the Group’s financial assets in the US qualify for derecognition as substantially all the risks and rewards of the assets been transferred The Group continues to recognise any retained interests in the securitisation vehicles.
Disclosures are given below about those securitisations of financial assets undertaken by the Group that resulted in derecognition or recognition to the extent of continuing involvement. The Group has classified these securitisations into three broad categories: US Agency, consumer, and commercial securitisations. During 2005, the Group received proceeds of approximately £46.3 billion from securitisation trusts in connection with new securitisations of Group assets and £9.6 billion in connection with securitisation of third-party assets.
The Group recognised net pre-tax gains of approximately £182 million (2004 – £111 million) relating to these securitisations. Net pre-tax gains are based on the difference between the sales prices and previous carrying values of assets prior to date of sale, are net of transaction costs, and exclude any results attributable to hedging activities, interest income, funding costs, and changes in asset values prior to, and in retained interest values subsequent to, the securitisation date.
At 31 December 2005, the fair value of the Group’s retained interests was approximately £2.1 billion (2004 – £1.4 billion). These retained interests comprise approximately £1,179 million in US Agency based retained interests, £764 million in consumer based retained interests and £128 million in commercial based retained interests. These retained interests primarily relate to mortgage loans and securities and arose from securitisations that have taken place in current and prior years. Cash flows received in 2005 from retained interests held at 31 December 2005 in connection with securitisations that took place incurrent and prior years amounted to approximately £481 million (2004 – £383 million).
109
Notes on the accountscontinued
12 Loans and advances to customers (continued)
Key economic assumptions used in measuring the value of retained interests at the date of securitisation resulting from securitisations completed during the year were as follows:
| Assumptions | | U.S. Agency
retained
interests | | | Consumer
retained
interests | | | Commercial
retained
interests | |
|
|
|
|
|
|
|
|
| |
| Prepayment speed | | 139 – 690PSA | | | 16 – 44% CPR | (1) | | 0 – 100 CPY | (1) |
| Weighted average life | | 1 – 20 years | | | 1 – 10 years | | | 1 – 20 years | |
| Cash flow discount rate | | 0– 26% | | | 4– 90% | | | 5– 81% | |
| Credit losses | | N/A | (3) | | 0 – 2% CDR | (4) | | N/A | (5) |
|
|
|
|
|
|
|
|
| |
| | | | | | | | | | |
| Key economic assumptions and the sensitivity of the current fair value of retained interests at 31 December 2005 to immediate adverse changes, as indicated below, in those assumptions are as follows: | |
| | | | | | | | | | |
| Assumptions/impact on fair value | | U.S. Agency
retained
interests | | | Consumer
retained
interests | | | Commercial
retained
interests | |
|
|
|
|
|
|
|
|
| |
| Fair value of retained interests at 31 December 2004 | | £1,179 million | | | £764 million | | | £128 million | |
| Prepayment speed(6) | | 9 – 25% CPR | (1) | | 16 – 80% CPR | (1) | | 0 – 75 CPY | (2) |
| Impact on fair value of10% adverse change | | £0.5 million | | | £26.1 million | | | — | |
| Impact on fair value of20% adverse change | | £0.6 million | | | £47.1 million | | | — | |
| Weighted average life | | 0 – 19 years | | | 1 – 10 years | | | 1 – 20 years | |
| Cash flow discount rate | | 0– 26% | | | 4– 96% | | | 5– 81% | |
| Impact on fair value of10% adverse change | | £33.5 million | | | £23.8 million | | | £4.7 million | |
| Impact on fair value of20% adverse change | | £65.1 million | | | £46.0 million | | | £9.1 million | |
| Credit losses | | N/A | (3) | | 0 – 2% CDR | (4) | | N/A | (5) |
| Impact on fair value of10% adverse change | | N/A | | | £10.9 million | | | N/A | |
| Impact on fair value of20% adverse change | | N/A | | | £19.8 million | | | N/A | |
|
|
|
|
|
|
|
|
| |
| | Notes: |
| (1) | Constant prepayment rate – the CPR range represents the low and high points of a dynamic CPR curve. |
| (2) | CPR with yield maintenance provision and thus prepayment risk is limited. |
| (3) | Population consists of securities whose collateral is guaranteed by US Government sponsored entities and therefore, no credit loss has been assumed. |
| (4) | Constant default rate. |
| (5) | Population consists of only investment grade senior tranches; therefore, no credit losses are included in the assumptions. |
| (6) | Prepayment speed has been stressed on an overall portfolio basis for US Agency retained interests due to the overall homogeneous nature of the collateral. Consumer and commercial retained interests have been stressed on a security level basis. |
The sensitivities depicted in the preceding table are hypothetical and should be used with caution. The likelihood of those percent variations selected for sensitivity testing is not necessarily indicative of expected market movements because the relationship of the change in the assumptions to the change in fair value may not be linear. Also, the effect of a variation in a particular assumption on the fair value of a retained interest is calculated without changing any other assumptions. This might not be the case in actual market conditions since changes in one factor might result in changes to other factors. Further, the sensitivities depicted above do not consider any corrective actions that the Group might take to mitigate the effect of any adverse changes in one or more key assumptions.
Mortgage-backed securities
The Group sells originated mortgage loans to US Agencies in return for securities backed by these loans and guaranteed by the Agency whilst retaining the rights to service the mortgages. These securities may be subsequently sold. The purchaser has recourse to the Group for losses up to pre-determined levels on certain designated mortgages. The Group is not obliged, and does not intend, to support losses that may be suffered by the Agencies. Under the terms of the sale agreements, the Agencies have agreed to seek repayment only from the cash from the mortgage loans. Once the securities exchanged for the loans have been sold the Group’s exposure is restricted to the amount of the recourse. At 31 December 2005 mortgages amounting to £385 million (2004 - £472 million) had been sold with recourse and the related securities sold. These loans have been derecognised; they qualified for the linked presentation under previous GAAP.
110
| 13 Debt securities | | | | | | | | | | | Group | |
| | | | | | | | | | |
|
|
|
|
|
|
|
|
|
|
|
|
|
| |
| 2005 | | | | | | | | | | | UK
government
£m | | | Other
government
£m | | | Other public
sector body
£m | | | Bank and
building
society
£m | | Other
issuers
£m | | Total
£m | |
|
|
|
|
|
|
|
|
|
|
|
|
|
|
|
| |
| Held-for-trading | | | | | | | | | | | 4,386 | | | 18,073 | | | 257 | | | 8 | | 57,929 | | 80,653 | |
| Designated as at fair value through profit or loss | | | | | | 451 | | | 7 | | | — | | | 864 | | 2,669 | | 3,991 | |
| Available-for-sale | | | | | | | | | | | 662 | | | 17,807 | | | 40 | | | 9,613 | | 7,411 | | 35,533 | |
| Loans and receivables | | | | | | | | | | | — | | | — | | | — | | | — | | 788 | | 788 | |
|
|
|
|
|
|
|
|
|
|
|
|
|
|
|
| |
| At 31 December 2005 | | | | | | | | | | | 5,499 | | | 35,887 | | | 297 | | | 10,485 | | 68,797 | | 120,965 | |
| | | | | | | | | | |
|
|
|
|
|
|
|
|
|
|
|
|
|
| |
| Available-for-sale | | | | | | | | | | | | | | | | | | | | | | | | | |
| Gross unrealised gains | | | | | | | | | | | 9 | | | 9 | | | — | | | 7 | | 41 | | 66 | |
| Gross unrealised losses | | | | | | | | | | | (7 | ) | | (277 | ) | | (1) | | | (6 | ) | (64) | | (355 | ) |
|
|
|
|
|
|
|
|
|
|
|
|
|
|
|
| |
| | | | | | | | | | | | | | | | | | | | | | | | | | |
| 2004 | | | | | | | | | | | | | | | | | | | | | | | | | |
|
|
|
|
|
|
|
|
|
|
|
|
|
|
|
| |
| Investment securities | | | | | | | | | | | 757 | | | 14,135 | | | 309 | | | 9,355 | | 10,987 | | 35,543 | |
| Other securities | | | | | | | | | | | 1,866 | | | 12,457 | | | 37 | | | 1,701 | | 42,304 | | 58,365 | |
|
|
|
|
|
|
|
|
|
|
|
|
|
|
|
| |
| At 31 December 2004(1) | | | | | | | | | | | 2,623 | | | 26,592 | | | 346 | | | 11,056 | | 53,291 | | 93,908 | |
| | | | | | | | | | |
|
|
|
|
|
|
|
|
|
|
|
|
|
|
|
| Investment securities: | | | | | | | | | | | | | | | | | | | | | | | | | |
| Book value | | | | | | | | | | | 757 | | | 14,135 | | | 309 | | | 9,355 | | 10,987 | | 35,543 | |
| Gross unrecognised gains | | | | | | 2 | | | 85 | | | 1 | | | 5 | | 78 | | 171 | |
| Gross unrecognised losses | | | | | | (22 | ) | | (44 | ) | | — | | | (4 | ) | (285) | | (355 | ) |
|
|
|
|
|
|
|
|
|
|
|
|
|
|
|
|
|
|
|
|
|
|
|
|
|
|
| Valuation at 31 December 2004 | | | | | | 737 | | | 14,176 | | | 310 | | | 9,356 | | 10,780 | | 35,359 | |
| | | | | | | | | | |
|
|
|
|
|
|
|
|
|
|
|
|
|
|
|
| (1) Amounts above include subordinated debt securities of £644 million at 31 December 2004. | | | | | | | | |
| | | | | | | | | | | | | | | | | | | | | | | | | | |
| 2005 | | | | | | | | | | | | | | | | | | | | Listed
£m | | Unlisted
£m | | Total
£m | |
|
|
|
|
|
|
|
|
|
|
|
|
|
|
|
| |
| Held-for-trading | | | | | | | | | | | | | | | | | | | | 41,544 | | 39,109 | | 80,653 | |
| Designated as at fair value through profit or loss | | | | | | | | | | | | | | | | | | | | 3,043 | | 948 | | 3,991 | |
| Available-for-sale | | | | | | | | | | | | | | | | | | | | 34,074 | | 1,459 | | 35,533 | |
| Loans and receivables | | | | | | | | | | | | | | | | | | | | — | | 788 | | 788 | |
|
|
|
|
|
|
|
|
|
|
|
|
|
|
|
| |
| At 31 December 2005 | | | | | | | | | | | | | | | | | | | | 78,661 | | 42,304 | | 120,965 | |
| | | | | | | | | | | | | | | | | | | |
| |
| 2004 | | | | | | | | | | | | | | | | | | | | | | | | | |
|
|
|
|
|
|
|
|
|
|
|
|
|
|
|
| |
| Investment securities | | | | | | | | | | | | | | | | | | | | 25,647 | | 9,896 | | 35,543 | |
| Other securities | | | | | | | | | | | | | | | | | | | | 30,946 | | 27,419 | | 58,365 | |
|
|
|
|
|
|
|
|
|
|
|
|
|
|
|
| |
| At 31 December 2004 | | | | | | | | | | | | | | | | | | | | 56,593 | | 37,315 | | 93,908 | |
| | | | | | | | | | | | | | | | | | | |
| |
| | |
| The following table shows the Group’s available-for-sale debt securities by remaining maturity and the related yield (based on weightedaverages) as at 31 December 2005. | |
| | | | | | | | | | | | | | | | | | | | | | | | | | |
| Within 1 year | | After 1 but
within 5 years | | | After 5 but
within 10 years | | | After 10 years | | Total | |
|
| |
| | |
| | |
| |
| |
| Amount
£m | | Yield
% | | Amount
£m | | | Yield
% | | | Amount
£m | | | Yield
% | | | Amount
£m | | | Yield
% | | Amount
£m | | Yield
% | |
|
|
|
|
|
|
|
|
|
|
|
|
|
|
|
| |
| UK government | 111 | | 7.0 | | 357 | | | 5.6 | | | 187 | | | 5.5 | | | 7 | | | 2.3 | | 662 | | 5.8 | |
| US government, federal agencies and states | 52 | | 2.2 | | 292 | | | 2.3 | | | 829 | | | 1.9 | | | 14,976 | | | 3.6 | | 16,149 | | 3.5 | |
| Other government | 604 | | 1.9 | | 1,088 | | | 4.1 | | | 4 | | | 5.0 | | | 3 | | | 4.5 | | 1,699 | | 3.3 | |
| Corporate debt securities | 640 | | 3.8 | | 1,492 | | | 3.9 | | | 222 | | | 4.7 | | | 191 | | | 5.1 | | 2,545 | | 4.0 | |
| Mortgage-backed securities | 27 | | 4.7 | | 13 | | | 6.0 | | | 511 | | | 5.8 | | | 3,230 | | | 3.6 | | 3,781 | | 3.9 | |
| Bank and building society | 7,853 | | 4.3 | | 1,567 | | | 3.9 | | | 156 | | | 4.1 | | | 37 | | | 4.5 | | 9,613 | | 4.3 | |
| Other | 837 | | 3.1 | | 56 | | | 2.8 | | | 3 | | | 6.8 | | | 188 | | | 4.8 | | 1,084 | | 3.4 | |
|
|
|
|
|
|
|
|
|
|
|
|
|
|
|
| |
| Total fair value | 10,124 | | 4.1 | | 4,865 | | | 4.0 | | | 1,912 | | | 3.8 | | | 18,632 | | | 3.6 | | 35,533 | | 3.8 | |
| |
|
|
|
|
|
|
|
|
|
|
|
|
|
|
| |
111
Notes on the accountscontinued
13 Debt securities (continued)
The table below shows the number and fair value of available-for-sale debt-securities that were in an unrealised loss position at 31 December 2005.
| | Less than 12 months | | | More than 12 months | | | Total | |
| |
| | |
| | |
|
|
| |
| Issued by | | Number
of issues | | Fair value
£m | | | Gross
unrealised
losses
£m | | | Fair value
£m | | Gross
unrealised
losses
£m | | | Fair value
£m | | | Gross
unrealised
losses
£m | |
|
|
|
|
|
|
|
|
|
|
|
|
|
|
|
|
|
|
| |
| UK government | | 9 | | — | | | — | | | 217 | | 7 | | | 217 | | | 7 | |
| US government, federal agencies and states | | 511 | | 13,390 | | | 228 | | | 1,475 | | 35 | | | 14,865 | | | 263 | |
| Other government | | 54 | | 1,136 | | | 7 | | | 149 | | 7 | | | 1,285 | | | 14 | |
| Corporates | | 21 | | 157 | | | 3 | | | 54 | | 1 | | | 211 | | | 4 | |
| Mortgage-backed securities | | 110 | | 2,797 | | | 55 | | | 149 | | 4 | | | 2,946 | | | 59 | |
| Bank and building society | | 159 | | 5,417 | | | 4 | | | 156 | | 2 | | | 5,573 | | | 6 | |
| Other | | 5 | | — | | | 2 | | | 6 | | — | | | 6 | | | 2 | |
|
|
|
|
|
|
|
|
|
|
|
|
|
|
|
|
|
|
| |
| | 869 | | 22,897 | | | 299 | | | 2,206 | | 56 | | | 25,103 | | | 355 | |
| | |
|
|
|
|
|
|
|
|
|
|
|
|
|
|
|
|
| |
| | | | | |
| The Group considers that unrealised losses on available-for-sale debt securities are temporary principally because they reflectchanges in benchmark interest rates. | |
| | | | | | | | | | | | | | | | | | | | |
| 14 Equity shares | | | | Group | |
| | | |
|
|
|
|
|
|
|
|
|
|
|
|
|
|
| |
| | | | Listed
£m | | | Unlisted
£m | | | 2005
Total
£m | | Listed
£m | | | Unlisted
£m | | | 2004
Total
£m | |
|
|
|
|
|
|
|
|
|
|
|
|
|
|
|
|
|
|
| |
| Held-for-trading | | | | 2,937 | | | 4 | | | 2,941 | | | | | | | | | |
| Designated as at fair value through profit or loss | | | | 2,113 | | | 428 | | | 2,541 | | | | | | | | | |
| Available-for-sale | | | | 704 | | | 3,115 | | | 3,819 | | | | | | | | | |
|
|
|
|
|
|
|
|
|
|
| | | | | | | | | |
| | | | 5,754 | | | 3,547 | | | 9,301 | | | | | | | | | |
| | | |
|
|
|
|
|
|
|
| | | | | | | | |
| Investment securities | | | | | | | | | | | | 1,213 | | | 1,227 | | | 2,440 | |
| Other securities | | | | | | | | | | | | 2,282 | | | 1 | | | 2,283 | |
| | | | | | | | | | | |
|
|
|
|
|
|
| |
| At 31 December | | | | | | | | | | | | 3,495 | | | 1,228 | | | 4,723 | |
| | | | | | | | | | | |
|
|
|
|
|
|
| |
| Available-for-sale | | | | | | | | | | | | | | | | | | | |
| Gross unrealised gains | | | | 168 | | | 54 | | | 222 | | | | | | | | | |
| Gross unrealised losses | | | | (5 | ) | | (8 | ) | | (13 | ) | | | | | | | | |
|
|
|
|
|
|
|
|
|
|
| | | | | | | | | |
| | | | 163 | | | 46 | | | 209 | | | | | | | | | |
| | | |
|
|
|
|
|
|
|
| | | | | | | | |
| Investment securities | | | | | | | | | | | | | | | | | | | |
| Book value | | | | | | | | | | | | 1,213 | | | 1,227 | | | 2,440 | |
| Gross unrecognised gains | | | | | | | | | | | | 356 | | | 169 | | | 525 | |
| Gross unrecognised losses | | | | | | | | | | | | (78 | ) | | (5 | ) | | (83 | ) |
| | | | | | | | | | | |
|
|
|
|
|
|
| |
| | | | | | | | | | | | 1,491 | | | 1,391 | | | 2,882 | |
| | | | | | | | | | | |
|
|
|
|
|
|
| |
Unquoted equity investments at cost include £1.8 billion attributable to the Group’s investment in Bank of China which was completed on 31 December 2005. Also included are equity investments in the Federal Home Loans Bank and Federal Reserve Bank that are redeemable at cost (£0.8 billion). The remaining investments at cost cannot be measured reliably and comprised numerous small shareholdings including those received on trouble debt restructuring. Disposals in the year generated gains of £85 million.
At 31 December 2005 the £13 million gross unrealised losses represented 23 equity issues with fair value of £30 million which were in an unrealised loss position for less than 12 months.
112
15 Investments in Group undertakings
Investments in Group undertakings are carried at cost less impairment. Movements during the year were as follows:
| | Company | |
| |
| |
| | 2005
£m | | | 2004
£m | |
|
|
|
|
|
| |
| At 1 January | | 21,900 | | | 15,497 | |
| Implementation of IAS 32 and IAS 39 on 1 January 2005 | | (4,004 | ) | | — | |
| Currency translation and other adjustments | | (6 | ) | | (399 | ) |
| Additions | | 2,961 | | | 6,802 | |
|
|
|
|
|
| |
| At 31 December | | 20,851 | | | 21,900 | |
| |
|
|
|
| |
The principal subsidiary undertakings of the company are shown below. Their capital consists of ordinary and preference shares which are unlisted with the exception of certain preference shares issued by NatWest. The Royal Bank and RBS Insurance Group Limited are directly owned by the company, and all of the other subsidiary undertakings are wholly owned directly, or indirectly through intermediate holding companies, by these companies. All of these subsidiaries are included in the Group’s consolidated financial statements and have an accounting reference date of 31 December.
| | Nature of
business | | Country of
incorporation
and principal
area of operation |
|
|
|
| The Royal Bank of Scotland plc | | Banking | | Great Britain |
| National Westminster Bank Plc(1) | | Banking | | Great Britain |
| Citizens Financial Group, Inc. | | Banking | | US |
| Coutts & Co(2) | | Private banking | | Great Britain |
| Greenwich Capital Markets, Inc. | | Broker dealer | | US |
| RBS Insurance Group Limited | | Insurance | | Great Britain |
| Ulster Bank Limited(3) | | Banking | | Northern Ireland |
|
|
|
| | Notes: |
| (1) | The company does not hold any of the NatWest preference shares in issue. |
| (2) | Coutts & Co is incorporated with unlimited liability. Its registered office is 440 Strand, London WC2R 0Q5. |
| (3) | Ulster Bank Limited and its subsidiary undertakings also operate in the Republic of Ireland. |
The above information is provided in relation to the principal related undertakings as permitted by Section 231(5) of the Companies Act 1985. Full information on all related undertakings will be included in the Annual Return filed with the UK Companies House.
113
Notes on the accountscontinued
| 16 Impaired and past-due financial assets | | Group |
| |
|
|
|
| 2005 | | Cost
£m | | Provision
£m | | Net book
value
£m |
|
|
|
|
| Impaired financial assets | | | | | | |
| Loans and receivables and finance leases | | 5,926 | | 3,344 | | 2,582 |
| Available-for-sale | | 316 | | 132 | | 184 |
|
|
|
|
|
|
| | 6,242 | | 3,476 | | 2,766 |
| |
|
|
|
|
| | Group |
| |
|
| | 2005
£m | | 2004
£m |
|
|
|
|
|
| Impairment losses charged to the income statement | | | | |
| Loans and receivables and finance leases (see table below) | | 1,703 | | |
| Available-for-sale | | 4 | | |
| Loans and advances (see table below) | | | | 1,402 |
| Amounts written-off fixed asset investments | | | | 83 |
|
|
|
|
|
| Total | | 1,707 | | 1,485 |
| |
|
|
|
The following table shows impairment losses for loans and receivables and finance leases (2004 – loans and advances).
| | Group | |
| |
|
|
|
|
|
|
| | 2005
£m | | | Specific
£m | | | General
£m | | | 2004
Total
£m | |
|
|
|
|
|
|
|
|
|
| At 1 January | | 4,174 | | | 3,332 | | | 553 | | | 3,885 | |
| Implementation of IAS 39 | | (29 | ) | | — | | | — | | | — | |
| Currency translation and other adjustments | | 51 | | | (22 | ) | | (76 | ) | | (98 | ) |
| Acquisitions | | — | | | 222 | | | 68 | | | 290 | |
| Amounts written-off (1) | | (2,040 | ) | | (1,449 | ) | | — | | | (1,449 | ) |
| Recoveries of amounts previously written-off | | 172 | | | 144 | | | — | | | 144 | |
| Charged to the income statement | | 1,703 | | | 1,386 | | | 16 | | | 1,402 | |
| Unwind of discount | | (144 | ) | | — | | | — | | | — | |
|
|
|
|
|
|
|
|
|
|
|
| At 31 December (2) | | 3,887 | | | 3,613 | | | 561 | | | 4,174 | |
| |
|
|
|
|
|
|
|
|
| (1) | Amounts written-off during the year include £2 million relating to banks (2004 – nil). |
| (2) | Balance at 31 December 2005 includes £3 million relating to banks (2004 – £6 million). |
Loan impairment
At 31 December 2005, the Group’s non-accrual loans, loans past due 90 days and troubled debt restructurings amounted to £5,937 million (2004 – £5,470 million). Loan impairment provisions of £3,344 million (2004 – £3,561 million) were held against these loans. Average non-accrual loans, loans past due 90 days and troubled debt restructurings for the year to 31 December 2005 were £5,923 million (2004 – £5,264 million).
| | IFRS |
| |
|
| | 2005
£m | | 2004
£m |
|
|
|
| Gross income not recognised but which would have been | | | | |
| recognised under the original terms of non-accrual and restructured loans | | | | |
| Domestic | | 334 | | 235 |
| Foreign | | 62 | | 58 |
|
|
|
|
|
| | 396 | | 293 |
| |
|
|
|
| Interest on non-accrual and restructured loans included in net interest income | | | | |
| Domestic | | 130 | | 58 |
| Foreign | | 14 | | 7 |
|
|
|
|
|
| | 144 | | 65 |
| |
|
|
|
114
| 17 Intangible assets | | Group | |
| |
|
|
|
|
|
|
|
|
|
|
|
|
|
|
| 2005 | | Goodwill
£m | | | Core
deposit
intangibles
£m | | | Other
purchased
intangibles
£m | | | Internally
generated
software
£m | | | Total
£m | |
|
|
|
|
|
|
|
|
|
|
|
|
|
|
|
|
| Cost: | | | | | | | | | | | | | | | |
| At 1 January 2005 | | 18,032 | | | 268 | | | 261 | | | 2,089 | | | 20,650 | |
| Currency translation and other adjustments | | 786 | | | 31 | | | 30 | | | — | | | 847 | |
| Acquisition of subsidiaries | | 113 | | | — | | | — | | | — | | | 113 | |
| Additions | | — | | | — | | | 34 | | | 329 | | | 363 | |
| Disposals and write-off of fully amortised assets | | (108 | ) | | — | | | — | | | (124 | ) | | (232 | ) |
|
|
|
|
|
|
|
|
|
|
|
|
|
|
|
|
| At 31 December 2005 | | 18,823 | | | 299 | | | 325 | | | 2,294 | | | 21,741 | |
| |
|
|
|
|
|
|
|
|
|
|
|
|
|
|
| Accumulated amortisation and impairment: | | | | | | | | | | | | | | | |
| At 1 January 2005 | | — | | | 22 | | | 22 | | | 1,364 | | | 1,408 | |
| Currency translation and other adjustments | | — | | | 5 | | | 3 | | | — | | | 8 | |
| Disposals and write-off of fully amortised assets | | — | | | — | | | — | | | (106 | ) | | (106 | ) |
| Charge for the year | | — | | | 58 | | | 39 | | | 402 | | | 499 | |
|
|
|
|
|
|
|
|
|
|
|
|
|
|
|
|
| At 31 December 2005 | | — | | | 85 | | | 64 | | | 1,660 | | | 1,809 | |
| |
|
|
|
|
|
|
|
|
|
|
|
|
|
|
| Net book value at 31 December 2005 | | 18,823 | | | 214 | | | 261 | | | 634 | | | 19,932 | |
| |
|
|
|
|
|
|
|
|
|
|
|
|
|
|
| | | | | | | | | | | | | | | | |
| 2004 | | | | | | | | | | | | | | | |
|
|
|
|
|
|
|
|
|
|
|
|
|
|
|
|
| Cost: | | | | | | | | | | | | | | | |
| At 1 January 2004 | | 13,131 | | | — | | | — | | | 1,827 | | | 14,958 | |
| Currency translation and other adjustments | | (518 | ) | | (18 | ) | | (2 | ) | | — | | | (538 | ) |
| Acquisition of subsidiaries | | 5,435 | | | 286 | | | 263 | | | — | | | 5,984 | |
| Additions | | — | | | — | | | — | | | 303 | | | 303 | |
| Disposals and write-off of fully amortised assets | | (16 | ) | | — | | | — | | | (41 | ) | | (57 | ) |
|
|
|
|
|
|
|
|
|
|
|
|
|
|
|
|
| At 31 December 2004 | | 18,032 | | | 268 | | | 261 | | | 2,089 | | | 20,650 | |
| |
|
|
|
|
|
|
|
|
|
|
|
|
|
|
| | | | | | | | | | | | | | | | |
| Accumulated amortisation and impairment: | | | | | | | | | | | | | | | |
| At 1 January 2004 | | — | | | — | | | — | | | 931 | | | 931 | |
| Currency translation and other adjustments | | — | | | (1 | ) | | — | | | — | | | (1 | ) |
| Disposals and write-off of fully amortised assets | | — | | | — | | | — | | | (41 | ) | | (41 | ) |
| Charge for the year | | — | | | 23 | | | 22 | | | 474 | | | 519 | |
|
|
|
|
|
|
|
|
|
|
|
|
|
|
|
|
| At 31 December 2004 | | — | | | 22 | | | 22 | | | 1,364 | | | 1,408 | |
| |
|
|
|
|
|
|
|
|
|
|
|
|
|
|
| Net book value at 31 December 2004 | | 18,032 | | | 246 | | | 239 | | | 725 | | | 19,242 | |
| |
|
|
|
|
|
|
|
|
|
|
|
|
|
|
| The weighted average amortisation period of purchased intangible assets, other than goodwill, subject to amortisation are: | | | The amortisation expense for each of the next five years is currently estimated to be: | |
| | | | | |
| | Years | | | £m |
| |
|
| Core deposit intangibles | 6 | | 2006 | 113 |
| Other purchased intangibles | 7 | | 2007 | 113 |
| | 2008 | 113 |
| | | 2009 | 67 |
| | | 2010 | 20 |
| | |
|
|
115
Notes on the accountscontinued
17Intangible assets(continued)
Impairment review
| | | | | | Goodwill | | | | |
| | | | | |
| | | | |
Significant Business
Division | | Acquisition | | Cash generating unit | | 2005
£m | (1) | | 2004
£m | | Basis of valuation | | Key assumptions |
|
|
|
|
|
|
|
|
|
|
|
|
|
|
| Corporate Markets | | NatWest* | | Core corporate banking | | 1,888 | | | 1,888(2) | | Earnings | | Allocation of |
|
|
|
|
|
|
|
|
|
|
|
| | common |
| Corporate Markets | | NatWest* | | Financial markets | | 1,563 | | | 1,563(2) | | Earnings | | resources |
|
|
|
|
|
|
|
|
|
|
|
| | |
| Retail Banking | | NatWest* | | NatWest Retail | | 3,095 | | | 2,721(2) | | Earnings | | |
|
|
|
|
|
|
|
|
|
|
|
|
|
|
| Citizens | | Mellon | | Mid-Atlantic | | 1,209 | | | 1,197(1) | | Expected earnings | | Mellon business |
| | | | | | | | | | | and cash generation | | typical of recent |
| | | | | | | | | | | multiples, including control
premium | | transactions in the
same region |
|
|
|
|
|
|
|
|
|
|
|
|
|
|
| Citizens | | Charter One | | Charter One | | 4,471 | | | | | Value-in-use: | | Terminal growth |
| (acquired 2004) | | | | | | | | | | | cash flow | | rate after year 7** |
|
|
|
|
|
|
|
|
|
|
|
|
|
|
| RBS Insurance | | Churchill | | Churchill Group | | 794 | | | 775(1) | | Value-in-use: | | Terminal growth |
| | | | | | | | | | | cash flow | | rate after year 7** |
|
|
|
|
|
|
|
|
|
|
|
|
|
|
| (1) | As at 30 September. |
| (2) | As at 1 January 2004. |
| * | Of the overall goodwill arising from the acquisition of NatWest in 2000, £2.7 billion (2004 – £3.1 billion) has been allocated to cash generating units other than those shown above. |
| ** | The key valuation parameters are the same as those used to support the Group’s decision to purchase the businesses. |
| | |
| 18 Property, plant and equipment | | Group | |
| | | | | | | | | | | | | | | | | | | | | |
| |
|
|
|
|
|
|
|
|
|
|
|
|
|
|
|
|
|
|
|
|
| 2005 | | Investment
properties
£m | | | Freehold
premises
£m | | | Long
leasehold
premises
£m | | | Short
leasehold
premises
£m | | | Computers
and other
equipment
£m | | | Operating
lease
assets
£m | | | Total
£m | |
|
|
|
|
|
|
|
|
|
|
|
|
|
|
|
|
|
|
|
|
|
|
| Cost or valuation: | | | | | | | | | | | | | | | | | | | | | |
| At 1 January 2005 | | 4,162 | | | 2,878 | | | 404 | | | 842 | | | 3,143 | | | 9,447 | | | 20,876 | |
| Currency translation and other adjustments | | (55 | ) | | 17 | | | 11 | | | 18 | | | 67 | | | 469 | | | 527 | |
| Reclassifications | | (2 | ) | | 34 | | | (31 | ) | | — | | | (1 | ) | | — | | | — | |
| Additions | | 348 | | | 331 | | | 25 | | | 322 | | | 597 | | | 3,136 | | | 4,759 | |
| Subsequent expenditure on investment properties | | 53 | | | — | | | — | | | — | | | — | | | — | | | 53 | |
| Change in fair value of investment properties | | 26 | | | — | | | — | | | — | | | — | | | — | | | 26 | |
| Disposals and write-off of fully depreciated assets | | (176 | ) | | (560 | ) | | (71 | ) | | (127 | ) | | (466 | ) | | (1,372 | ) | | (2,772 | ) |
| Disposals of subsidiaries | | (9 | ) | | (19 | ) | | — | | | (10 | ) | | (30 | ) | | (111 | ) | | (179 | ) |
|
|
|
|
|
|
|
|
|
|
|
|
|
|
|
|
|
|
|
|
|
|
| At 31 December 2005 | | 4,347 | | | 2,681 | | | 338 | | | 1,045 | | | 3,310 | | | 11,569 | | | 23,290 | |
| |
|
|
|
|
|
|
|
|
|
|
|
|
|
|
|
|
|
|
|
|
| | | | | | | | | | | | | | | | | | | | | | |
| Accumulated depreciation and amortisation: | | | | | | | | | | | | | | | | | | | | | |
| At 1 January 2005 | | — | | | 417 | | | 138 | | | 280 | | | 1,831 | | | 1,782 | | | 4,448 | |
| Currency translation and other adjustments | | — | | | 4 | | | — | | | 6 | | | 31 | | | 141 | | | 182 | |
| Disposals and write-off of fully depreciated assets | | — | | | (91 | ) | | (24 | ) | | (29 | ) | | (340 | ) | | (159 | ) | | (643 | ) |
| Disposals of subsidiaries | | — | | | — | | | — | | | (2 | ) | | (21 | ) | | (53 | ) | | (76 | ) |
| Depreciation charge for the year | | — | | | 60 | | | 7 | | | 64 | | | 390 | | | 805 | | | 1,326 | |
|
|
|
|
|
|
|
|
|
|
|
|
|
|
|
|
|
|
|
|
|
|
| At 31 December 2005 | | — | | | 390 | | | 121 | | | 319 | | | 1,891 | | | 2,516 | | | 5,237 | |
| |
|
|
|
|
|
|
|
|
|
|
|
|
|
|
|
|
|
|
|
|
| Net book value at 31 December 2005 | | 4,347 | | | 2,291 | | | 217 | | | 726 | | | 1,419 | | | 9,053 | | | 18,053 | |
| |
|
|
|
|
|
|
|
|
|
|
|
|
|
|
|
|
|
|
|
|
116
| | | | | | | | | | | Group | | | | | | | | | | |
| |
|
|
|
|
|
|
|
|
|
|
|
|
|
|
|
|
|
|
| |
| 2004 | | Investment
properties
£m | | | Freehold
premises
£m | | | Long
leasehold
premises
£m | | | Short
leasehold
premises
£m | | | Computers
and other
equipment
£m | | | Operating
lease
assets
£m | | | Total
£m | |
|
|
|
|
|
|
|
|
|
|
|
|
|
|
|
|
|
|
|
|
| |
| Cost: | | | | | | | | | | | | | | | | | | | | | |
| At 1 January 2004 | | 4,076 | | | 2,635 | | | 312 | | | 655 | | | 2,712 | | | 7,537 | | | 17,927 | |
Currency translation and other
adjustments | | 2 | | | (18 | ) | | — | | | (10 | ) | | (42 | ) | | (184 | ) | | (252 | ) |
| Reclassifications | | — | | | 1 | | | (5 | ) | | (5 | ) | | 9 | | | — | | | — | |
| Acquisition of subsidiaries | | — | | | 164 | | | 32 | | | 41 | | | 133 | | | 487 | | | 857 | |
| Additions | | 164 | | | 589 | | | 86 | | | 212 | | | 691 | | | 2,841 | | | 4,583 | |
Disposals and write-off of fully
depreciated assets | | (80 | ) | | (493 | ) | | (21 | ) | | (51 | ) | | (360 | ) | | (1,234 | ) | | (2,239 | ) |
|
|
|
|
|
|
|
|
|
|
|
|
|
|
|
|
|
|
|
|
| |
| At 31 December 2004 | | 4,162 | | | 2,878 | | | 404 | | | 842 | | | 3,143 | | | 9,447 | | | 20,876 | |
| |
|
|
|
|
|
|
|
|
|
|
|
|
|
|
|
|
|
|
| |
| Accumulated depreciation and amortisation: | | | | | | | | | | | | | | | | | | | | | |
| At 1 January 2004 | | — | | | 407 | | | 129 | | | 280 | | | 1,537 | | | 1,327 | | | 3,680 | |
Currency translation and
other adjustments | | — | | | (1 | ) | | 3 | | | (3 | ) | | (17 | ) | | (29 | ) | | (47 | ) |
| Reclassifications | | — | | | — | | | — | | | (2 | ) | | 2 | | | — | | | — | |
| Acquisition of subsidiaries | | — | | | — | | | 5 | | | — | | | 14 | | | 28 | | | 47 | |
Disposals and write-off of
fully depreciated assets | | — | | | (19 | ) | | (2 | ) | | (4 | ) | | (130 | ) | | (232 | ) | | (387 | ) |
| Depreciation charge for the year | | — | | | 30 | | | 3 | | | 9 | | | 425 | | | 688 | | | 1,155 | |
|
|
|
|
|
|
|
|
|
|
|
|
|
|
|
|
|
|
|
|
| |
| At 31 December 2004 | | — | | | 417 | | | 138 | | | 280 | | | 1,831 | | | 1,782 | | | 4,448 | |
| |
|
|
|
|
|
|
|
|
|
|
|
|
|
|
|
|
|
|
| |
| Net book value at 31 December 2004 | | 4,162 | | | 2,461 | | | 266 | | | 562 | | | 1,312 | | | 7,665 | | | 16,428 | |
| |
|
|
|
|
|
|
|
|
|
|
|
|
|
|
|
|
|
|
| |
| | 2005 | | 2004 |
| | £m | | £m |
|
|
|
|
|
| Contracts for future capital expenditure not provided for in the accounts | | | | |
| at the year end (excluding investment properties) | | 38 | | 447 |
| Contractual obligations to purchase, construct or develop investment | | | | |
| properties or to repair, maintain or enhance investment property | | 4 | | 155 |
| Property, plant and equipment pledged as security | | 1,250 | | 1,268 |
|
|
|
|
|
Investment properties are valued to reflect fair market value. Valuations are carried out by qualified surveyors who are members of the Royal Institution of Chartered Surveyors, or an equivalent overseas body. The 31 December 2005 valuation for a significant majority of the Group’s investment properties was undertaken by external valuers.
The fair value of investment properties includes £100 million (2004 – £74 million) of appreciation since purchase. This increase would normally be realised on disposal of the properties. Premises include £84 million (2004 – £570 million) assets in the course of construction.
117
Notes on the accountscontinued
19 Derivatives at fair value
Companies in the Group enter into various off-balance sheet financial instruments (derivatives) as principal either as a trading activity or to manage balance sheet foreign exchange and interest rate risk. Derivatives include swaps, forwards, futures and options. They may be traded on an organised exchange (exchange-traded) or over-the-counter (OTC). Holders of exchange traded derivatives are generally required to provide margin daily in the form of cash or other collateral.
Swaps include currency swaps, interest rate swaps, credit default swaps, total return swaps and equity and equity index swaps. A swap is an agreement to exchange cash flows in the future in accordance with a pre-arranged formula. In currency swap transactions, interest payment obligations are exchanged on assets and liabilities denominated in different currencies; the exchange of principal may be notional or actual. Interest rate swap contracts generally involve exchange of fixed and floating interest payment obligations without the exchange of the underlying principal amounts.
Forwards include forward foreign exchange contracts and forward rate agreements. A forward contract is a contract to buy (or sell) a specified amount of a physical or financial commodity, at agreed price, on an agreed future date. Forward foreign exchange contracts are contracts for the delayed delivery of currency on a specified future date. Forward rate agreements are contracts under which two counterparties agree on the interest to be paid on a notional deposit of a specified maturity at a specific future date; there is no exchange of principal.
Futures are exchange-traded forward contracts to buy (or sell) standardised amounts of underlying physical or financial commodities. The Group buys and sells currency, interest rate and equity futures.
Options include exchange-traded options on currencies, interest rates and equities and equity indices and OTC currency and equity options, interest rate caps and floors and swaptions. They are contracts that give the holder the right but not the obligation to buy (or sell) a specified amount of the underlying physical or financial commodity at an agreed price on an agreed date or over an agreed period.
The Group enters into fair value and cash flow hedges and hedges of net investments in foreign operations. Fair value hedges principally involve interest rate swaps hedging the interest rate risk in recognised financial assets and financial liabilities. Similarly the majority of the Group’s cash flow hedges relate to exposure to variability in future interest payments and receipts on forecast transactions and on recognised financial assets and financial liabilities and hedged by interest rate swaps for periods of up to 28 years. The Group hedges its net investments in foreign operations with currency borrowings.
| | Group |
| |
|
|
|
| | Total derivatives |
| |
|
|
| 2005 | | Notional amounts
£bn | | Assets
£m | | Liabilities
£m |
|
| Exchange rate contracts | | | | | | |
| Spot, forwards and futures | | 885 | | 10,758 | | 10,214 |
| Currency swaps | | 221 | | 3,228 | | 3,849 |
| Options purchased | | 301 | | 6,438 | | — |
| Options written | | 315 | | — | | 6,101 |
| | | | | | | |
| Interest rate contracts | | | | | | |
| Interest rate swaps | | 7,234 | | 65,618 | | 67,156 |
| Options purchased | | 814 | | 5,988 | | — |
| Options written | | 719 | | — | | 5.557 |
| Futures and forwards | | 1,482 | | 268 | | 325 |
| | | | | | | |
| Credit derivatives | | 217 | | 1,455 | | 1,355 |
| | | | | | | |
| Equity and commodity contracts | | 61 | | 1,910 | | 1,881 |
|
|
|
|
|
|
|
| | | | 95,663 | | 96,438 |
| | | |
|
|
| Included in the above are cash flow hedging derivatives as follows: | | | | | | |
| Spot, forwards and futures | | | | 5 | | 25 |
| Interest rate swaps | | | | 431 | | 373 |
| | | | | | | |
| Included in the above are fair value hedging derivatives as follows: | | | | | | |
| Interest rate swaps | | | | 1,096 | | 676 |
|
The company held derivative assets at fair value amounting to £55 million (notional amounts £1 billion).
118
| | Group | |
| |
|
|
|
|
|
| |
| | | | Trading derivatives
Fair value | |
| | | |
| |
| 2004 | | Notional amounts
£bn | | Assets
£m | | | Liabilities
£m | |
|
|
|
|
|
|
|
| |
| Exchange rate contracts | | | | | | | | |
| Spot, forwards and futures | | 746 | | 17,133 | | | 18,566 | |
| Currency swaps | | 178 | | 6,281 | | | 6,314 | |
| Options purchased | | 243 | | 5,797 | | | — | |
| Options written | | 256 | | — | | | 5,324 | |
| | | | | | | | | |
| Interest rate contracts | | | | | | | | |
| Interest rate swaps | | 4,939 | | 54,964 | | | 55,360 | |
| Options purchased | | 296 | | 3,168 | | | — | |
| Options written | | 287 | | — | | | 3,274 | |
| Futures and forwards | | 1,091 | | 475 | | | 479 | |
| | | | | | | | | |
| Credit derivatives | | 59 | | 264 | | | 285 | |
| | | | | | | | | |
| Equity and commodity contracts | | 41 | | 1,227 | | | 783 | |
|
|
|
|
|
|
|
| |
| | | | 89,309 | | | 90,385 | |
| Effect of netting | | | | (71,509 | ) | | (71,509 | ) |
|
|
|
|
|
|
|
| |
| | | | 17,800 | | | 18,876 | |
| | | |
|
|
|
| |
Non-trading derivatives
Under previous GAAP, hedging derivatives were accounted for in accordance with the treatment of the hedged transaction.As a result any gains or losses on the hedging instrument arising from changes in fair values were not recognised in the profit and loss account immediately but accounted for in the same manner as the hedged item. The Group established such non-trading derivative positions externally with third parties and also internally. The tables below include the components of the internal hedging programme that transferred risks to the trading portfolio or to external third party participants in the derivatives market.
| | Group |
| |
|
|
|
|
|
| | | | Fair value | | Book value |
| | | |
| |
|
| 2004 | | Notional
amounts
£bn | | Positive
£m | | Negative
£m | | Assets
£m | | Liabilities
£m |
|
|
|
|
|
|
|
|
|
|
|
| Exchange rate contracts | | | | | | | | | | |
| Spot, forwards and futures | | 21 | | 46 | | 665 | | 35 | | 603 |
| Currency swaps and options | | 5 | | 349 | | 227 | | 234 | | 123 |
| | | | | | | | | | | |
| Interest rate contracts | | | | | | | | | | |
| Interest rate swaps | | 121 | | 1,617 | | 1,342 | | 623 | | 650 |
| Futures, forwards and options | | 14 | | 71 | | 318 | | 2 | | 2 |
| | | | | | | | | | | |
| Credit derivatives | | 1 | | 4 | | 11 | | — | | 6 |
| | | | | | | | | | | |
| Equity and commodity contracts | | 2 | | 207 | | 62 | | 102 | | 15 |
|
|
|
|
|
|
|
|
|
|
|
| | | | 2,294 | | 2,625 | | 996 | | 1,399 |
| | | | |
|
|
|
|
|
|
|
119
Notes on the accountscontinued
| 19 Derivatives at fair value(continued) | | Group | |
| |
|
|
|
| |
| 2004 | | Unrecognised
gains and
losses
£m | | | Deferred
gains and
losses
£m | |
|
|
|
|
|
| |
| As at 1 January 2004 – gains | | 2,236 | | | 213 | |
| As at 1 January 2004 – losses | | (2,205 | ) | | (34 | ) |
|
|
|
|
|
| |
| | 31 | | | 179 | |
| Recognised gains that arose in previous periods | | (781 | ) | | (65 | ) |
| Recognised losses that arose in previous periods | | 537 | | | 4 | |
| Unrecognised gains and losses arising in the year | | 224 | | | — | |
| Unrecognised gains and losses deferred in the year | | 61 | | | (61 | ) |
| Unrecognised gains and losses deferred and taken to profit or loss in the year | | — | | | (30 | ) |
|
|
|
|
|
| |
| At 31 December 2004 | | 72 | | | 27 | |
| |
|
|
|
|
|
| | | | | | | |
| Of which – gains | | 1,571 | | | 483 | |
| Of which– losses | | (1,499 | ) | | (456 | ) |
|
|
|
|
|
| |
| | 72 | | | 27 | |
| |
|
|
|
|
|
Maturity of replacement cost of over-the-counter contracts (trading and non-trading)
Replacement cost indicates the Group’s derivatives credit exposure. The following table sets forth the gross positive fair values by maturity. The replacement cost of internal trades is not included as there is no credit risk associated with them.
| | Group |
| |
|
|
|
| 2004 | | Within
one year
£m | | One to
five years
£m | | Over
five years
£m | | Total
£m |
|
|
|
|
|
|
|
|
|
| Before netting | | | | | | | | |
| Exchange rate contracts | | 21,812 | | 5,414 | | 2,018 | | 29,244 |
| Interest rate contracts | | 6,777 | | 24,932 | | 27,287 | | 58,996 |
| Credit derivatives | | — | | 107 | | 157 | | 264 |
| Equity and commodity contracts | | 604 | | 777 | | 13 | | 1,394 |
|
|
|
|
|
|
|
|
|
| | 29,193 | | 31,230 | | 29,475 | | 89,898 |
| |
|
|
|
| Financial institutions | | | | | | | | 70,417 |
| Others | | | | | | | | 19,481 |
|
|
|
|
|
|
|
|
|
| | | | | | | | 89,898 |
| | | | | | | |
|
| 20 Prepayments, accrued income and other assets | | Group | | Company |
| |
| |
|
|
|
| | 2005
£m | | 2004
£m | | 2005
£m | | 2004
£m |
|
|
|
|
|
| Prepayments | | 1,274 | | 1,505 | | — | | — |
| Accrued income | | 857 | | 4,541 | | — | | 208 |
| Deferred expenses | | 372 | | 898 | | — | | — |
| Other assets | | 6,295 | | 4,668 | | 147 | | 110 |
|
|
|
|
|
|
|
|
|
| | 8,798 | | 11,612 | | 147 | | 318 |
| |
|
|
|
|
| | | | | | | | | |
| Amounts above include: | | | | | | | | |
| Due from subsidiaries | | | | | | — | | 313 |
|
|
|
|
|
120
| 21 Deposits by banks | | Group | | Company |
| |
|
| |
|
| | 2005
£m | | 2004
£m | | 2005
£m | | 2004
£m |
|
|
|
|
|
|
|
|
|
| Held-for-trading | | 32,067 | | | | — | | |
| Amortised cost | | 78,340 | | | | 951 | | |
|
|
|
|
|
|
|
|
|
| | 110,407 | | 99,883 | | 951 | | 174 |
| |
|
|
|
|
|
|
|
| Amounts above include: | | | | | | | | |
| Items in the course of transmission to other banks | | 722 | | 802 | | | | |
| Due to subsidiaries | | | | | | 944 | | 108 |
|
|
|
|
|
|
|
|
|
| | | | | |
| 22 Customer accounts | | Group | | Company |
| |
|
| |
|
| | 2005
£m | | 2004
£m | | 2005
£m | | 2004
£m |
|
|
|
|
|
|
|
|
|
| Held-for-trading | | 34,645 | | | | — | | |
| Designated as at fair value through profit or loss (1) | | 3,683 | | | | — | | |
| Amortised cost | | 304,539 | | | | 55 | | |
|
|
|
|
|
|
|
|
|
| | 342,867 | | 283,315 | | 55 | | — |
| |
|
|
|
|
|
|
|
| Amounts above include: | | | | | | | | |
| Due to subsidiaries | | | | | | 55 | | — |
|
|
|
|
|
|
|
|
|
| (1) | The amounts include insurance linked liabilities with a carrying value of £2,296 million. The carrying amount of other customer accounts designated as at fair value through profit or loss is £114 million greater than amortised cost. No amounts have been recognised in profit or loss for changes in credit risk associated with these liabilities as the changes are immaterial measured as the change in fair value from movements in the period in the credit risk premium payable by the Group. |
| | |
| 23 Debt securities in issue | | Group | | Company |
| |
| |
|
| | 2005
£m | | 2004
£m | | 2005
£m | | 2004
£m |
|
|
|
|
|
|
|
|
|
| Held-for-trading | | 1,469 | | | | — | | |
| Designated as at fair value through profit or loss (1) | | 11,068 | | | | — | | |
| Amortised cost | | 77,883 | | | | 2,942 | | |
|
|
|
|
|
|
|
|
|
| | 90,420 | | 63,999 | | 2,942 | | 1,608 |
| |
|
|
|
|
|
|
|
| (1) | No amounts have been recognised in profit or loss for changes in credit risk associated with these liabilities as the changes are immaterial measured as the change in fair value from movements in the period in the credit risk premium payable by the Group. The carrying amount is £365 million less than amortised cost. |
| | |
| 24 Settlement balances and short positions | | Group |
| |
|
| | 2005
£m | | 2004
£m |
|
|
|
| Settlement balances – amortised cost | | 6,561 | | 4,067 |
| Short positions – held-for-trading: | | | | |
| Debt securities – Government | | 30,749 | | 24,619 |
| Debt securities – Other issuers | | 5,355 | | 4,002 |
| Treasury bills and other eligible bills | | 1,178 | | 302 |
| Equity shares | | 145 | | — |
|
|
|
|
|
| | 43,988 | | 32,990 |
| |
|
|
|
121
Notes on the accountscontinued
| 25 Accruals, deferred income and other liabilities | | Group | | | Company | |
| |
| | |
| |
| | 2005
£m | | 2004
£m | | | 2005
£m | | | 2004
£m | |
|
|
|
|
|
|
|
|
|
|
| |
| Notes in circulation | | 1,365 | | 1,351 | | | — | | | — | |
| Current taxation | | 952 | | 662 | | | — | | | 18 | |
| Accruals | | 3,875 | | 8,468 | | | 13 | | | 83 | |
| Deferred income | | 3,333 | | 3,095 | | | — | | | — | |
| Provisions for liabilities and charges (see table below) | | 162 | | 198 | | | — | | | — | |
| Other liabilities | | 4,560 | | 3,874 | | | 1 | | | 200 | |
|
|
|
|
|
|
|
|
|
|
| |
| | 14,247 | | 17,648 | | | 14 | | | 301 | |
| |
|
|
|
|
|
|
|
|
| |
| Amounts above include: | | | | | | | | | | | |
| Due to subsidiaries | | | | | | | 1 | | | 150 | |
|
|
|
|
|
|
|
|
|
|
| |
| (1) Other liabilities include £10 million (2004 – £20 million) in respect of share-based compensation. | |
| | | | | | | | | | | |
| | | | | | | Group | | | | |
| | | |
|
|
|
|
|
|
| |
| Provisions for liabilities and charges | | | | Property(1)
£m | | | Other(2)
£m | | | Total
£m | |
|
|
|
|
|
|
|
|
|
|
| |
| At 1 January 2005 | | | | 164 | | | 34 | | | 198 | |
| Currency translation and other movements | | | | 1 | | | (1 | ) | | — | |
| Charge to income statement | | | | 7 | | | 7 | | | 14 | |
| Releases to income statement | | | | (14 | ) | | (2 | ) | | (16 | ) |
| Provisions utilised | | | | (29 | ) | | (5 | ) | | (34 | ) |
|
|
|
|
|
|
|
|
|
|
| |
| At 31 December 2005 | | | | 129 | | | 33 | | | 162 | |
| | | |
|
|
|
|
|
|
| |
| | Notes: |
| (1) | The Group has a number of leasehold properties where rents payable and other unavoidable costs exceed the value to the Group. Such costs arise over the period of the lease or to the expected termination date, and the provision has been discounted due to the long-term nature of certain of these obligations. |
| (2) | Other provisions arise in the normal course of business. |
| | | | | | | | | | | | |
| 26 Deferred taxation | | | | | | | | | | | |
| | | | | | |
| Provision for deferred taxation has been made as follows: | | Group | | | Company |
| |
|
|
| | |
|
|
|
| | 2005
£m | | | 2004
£m | | | 2005
£m | | | 2004
£m |
|
|
|
|
|
|
|
|
|
|
|
|
| Deferred tax liability | | 1,695 | | | 2,061 | | | — | | | — |
| Deferred tax asset (included in Prepayments, accrued income and other assets, Note 20) | | (156 | ) | | (47 | ) | | (3 | ) | | — |
|
|
|
|
|
|
|
|
|
|
|
|
| Net deferred tax | | 1,539 | | | 2,014 | | | (3 | ) | | — |
| |
|
|
|
|
|
|
|
|
|
|
| Group | |
|
|
|
|
|
|
|
|
|
|
|
|
|
|
|
|
|
|
|
|
|
|
|
|
|
|
|
|
|
|
| Accelerated
capital
Pension allowances | | | Provisions | | | Deferred
gains | | | Other
transition | | | Fair
value of
financial
instruments | | | Intangibles | | | Hedging | | | Other | | | Total | |
| £m | | | £m | | | £m | | | £m | | | £m | | | £m | | | £m | | | £m | | | £m | | | £m | |
|
|
|
|
|
|
|
|
|
|
|
|
|
|
|
|
|
|
|
|
|
|
|
|
|
|
|
|
|
|
| At 1 January 2004 under UK GAAP | 75 | | | 2,440 | | | (686 | ) | | 38 | | | — | | | — | | | — | | | — | | | 121 | | | 1,988 | |
| Implementation of IFRS (excluding IAS 32 and IAS 39) | (582 | ) | | (75 | ) | | — | | | 109 | | | 7 | | | — | | | 243 | | | — | | | (2 | ) | | (300 | ) |
|
|
|
|
|
|
|
|
|
|
|
|
|
|
|
|
|
|
|
|
|
|
|
|
|
|
|
|
|
|
| At 1 January 2004 restated | (507 | ) | | 2,365 | | | (686 | ) | | 147 | | | 7 | | | — | | | 243 | | | — | | | 119 | | | 1,688 | |
| Charge to income statement | (68 | ) | | 419 | | | 2 | | | (12 | ) | | (44 | ) | | — | | | (79 | ) | | — | | | 66 | | | 284 | |
| Charge to equity directly | (424 | ) | | (6 | ) | | 4 | | | — | | | 56 | | | — | | | (2 | ) | | — | | | 7 | | | (365 | ) |
| Acquisitions of subsidiaries | — | | | 514 | | | — | | | 7 | | | (6 | ) | | — | | | — | | | — | | | — | | | 515 | |
| Other | — | | | (87 | ) | | 22 | | | — | | | — | | | — | | | — | | | — | | | (43 | ) | | (108 | ) |
|
|
|
|
|
|
|
|
|
|
|
|
|
|
|
|
|
|
|
|
|
|
|
|
|
|
|
|
|
|
| At 1 January 2005 | (999 | ) | | 3,205 | | | (658 | ) | | 142 | | | 13 | | | — | | | 162 | | | — | | | 149 | | | 2,014 | |
| Implementation of IAS 32 and IAS 39 | — | | | — | | | (24 | ) | | — | | | (288 | ) | | 65 | | | — | | | 12 | | | — | | | (235 | ) |
|
|
|
|
|
|
|
|
|
|
|
|
|
|
|
|
|
|
|
|
|
|
|
|
|
|
|
|
|
|
| At 1 January 2005 restated | (999 | ) | | 3,205 | | | (682 | ) | | 142 | | | (275 | ) | | 65 | | | 162 | | | 12 | | | 149 | | | 1,779 | |
| Charge to income statement | 53 | | | 433 | | | 52 | | | (21 | ) | | (52 | ) | | 48 | | | (18 | ) | | — | | | (125 | ) | | 370 | |
| Charge to equity directly | (238 | ) | | — | | | — | | | — | | | — | | | (217 | ) | | — | | | (59 | ) | | (39 | ) | | (553 | ) |
| Other | 2 | | | 15 | | | (34 | ) | | — | | | — | | | (4 | ) | | 4 | | | 2 | | | (42 | ) | | (57 | ) |
|
|
|
|
|
|
|
|
|
|
|
|
|
|
|
|
|
|
|
|
|
|
|
|
|
|
|
|
|
|
| At 31 December 2005 | (1,182 | ) | | 3,653 | | | (664 | ) | | 121 | | | (327 | ) | | (108 | ) | | 148 | | | (45 | ) | | (57 | ) | | 1,539 | |
|
|
|
|
|
|
|
|
|
|
|
|
|
|
|
|
|
|
|
|
|
|
|
|
|
|
|
|
|
|
122
| | | | | | | | Company | |
| | | | | | | |
|
|
| | | | | | | | Total*
£m | |
|
|
|
|
|
|
|
|
|
|
| At 1 January 2004 and 1 January 2005 | | | | | | | | — | |
| Implementation of IAS 32 and IAS 39 | | | | | | | | (5 | ) |
|
|
|
|
|
|
|
|
|
|
| At 1 January 2005 restated | | | | | | | | (5 | ) |
| Charge to equity directly | | | | | | | | 2 | |
|
|
|
|
|
|
|
|
|
|
| At 31 December 2005 | | | | | | | | (3 | ) |
| | | | | | | |
|
|
| *All relates to hedging. | | | | | | | | | |
| | | | | | | | | | |
| 27 Insurance liabilities | | | | | | | | | |
| | | | | Group | |
| | | | |
|
|
| | | | | 2005
£m | | | 2004
£m | |
|
|
|
|
|
|
|
|
|
|
| Life assurance business: | | | | | | | | | |
| Unit linked insurance contracts | | | | | 325 | | | 306 | |
| Other insurance contracts | | | | | 1,974 | | | 1,735 | |
| Investment contracts | | | | | — | | | 2,102 | |
| General insurance business | | | | | 4,913 | | | 4,504 | |
|
|
|
|
|
|
|
|
|
|
| | | | | 7,212 | | | 8,647 | |
| | | | |
|
|
|
|
|
| General insurance business | | | | | | | | | |
| | | | | | | | | | |
| (i) Claims and loss adjustment expenses | | | | | | | | | |
| | Group | |
| |
|
|
|
|
|
|
|
|
| | Gross
£m | | | Reinsurance
£m | | | Net
£m | |
|
|
|
|
|
|
|
|
|
|
| Notified claims | | 2,812 | | | (481 | ) | | 2,331 | |
| Incurred but not reported | | 1,087 | | | (140 | ) | | 947 | |
|
|
|
|
|
|
|
|
|
|
| At 1 January 2004 | | 3,899 | | | (621 | ) | | 3,278 | |
| Cash paid for claims settled in the year | | (3,198 | ) | | 462 | | | (2,736 | ) |
| Increase in liabilities | | | | | | | | | |
| – arising from current year claims | | 3,943 | | | (484 | ) | | 3,459 | |
| – arising from prior year claims | | (139 | ) | | 217 | | | 78 | |
| Net exchange differences | | (1 | ) | | (1 | ) | | (2 | ) |
|
|
|
|
|
|
|
|
|
|
| At 31 December 2004 | | 4,504 | | | (427 | ) | | 4,077 | |
| |
|
|
|
|
|
|
|
|
|
|
|
|
|
|
|
|
|
|
| Notified claims | | 3,137 | | | (296 | ) | | 2,841 | |
| Incurred but not reported | | 1,367 | | | (131 | ) | | 1,236 | |
|
|
|
|
|
|
|
|
|
|
| At 1 January 2005 | | 4,504 | | | (427 | ) | | 4,077 | |
| Cash paid for claims settled in the year | | (3,474 | ) | | 147 | | | (3,327 | ) |
| Increase in liabilities | | | | | | | | | |
| – arising from current year claims | | 4,220 | | | (96 | ) | | 4,124 | |
| – arising from prior year claims | | (344 | ) | | 29 | | | (315 | ) |
| Net exchange differences | | 7 | | | (1 | ) | | 6 | |
|
|
|
|
|
|
|
|
|
|
| At 31 December 2005 | | 4,913 | | | (348 | ) | | 4,565 | |
| |
|
| Notified claims | | 3,465 | | | (208 | ) | | 3,257 | |
| Incurred but not reported | | 1,448 | | | (140 | ) | | 1,308 | |
|
|
|
|
|
|
|
|
|
|
| At 31 December 2005 | | 4,913 | | | (348 | ) | | 4,565 | |
| |
|
|
|
|
|
|
|
|
123
Notes on the accountscontinued
| 27 Insurance liabilities(continued) | | | | | | | | | |
| | | | | | | | | | |
| (ii) Provisions for unearned premiums and unexpired short term insurance risks | | | | | | | | | |
| | | | | Group | | | | |
| |
|
|
|
|
|
|
|
|
| Unearned premium provision | | Gross
£m | | | Reinsurance
£m | | | Net
£m | |
|
|
|
|
|
|
|
|
|
|
| At 1 January 2004 | | 2,472 | | | (125 | ) | | 2,347 | |
| Increase in the year | | 423 | | | — | | | 423 | |
| Release in the year | | — | | | 27 | | | 27 | |
|
|
|
|
|
|
|
|
|
|
| At 31 December 2004 | | 2,895 | | | (98 | ) | | 2,797 | |
| Release in the year | | (12 | ) | | 71 | | | 59 | |
|
|
|
|
|
|
|
|
|
|
| At 31 December 2005 | | 2,883 | | | (27 | ) | | 2,856 | |
| |
|
|
|
|
|
|
|
|
| Performance of life business (life contracts) in 2005 | | | | | | | | | |
| | | | | | | | Group | |
| | | | | | | |
|
|
| | | | | | | | 2005
£m | |
|
|
|
|
|
|
|
|
|
|
| Opening net assets | | | | | | | | 772 | |
| New business contribution | | | | | | | | 34 | |
| Profit from existing business: | | | | | | | | | |
| Expected return | | | | | | | | 16 | |
| Experience variances | | | | | | | | (13 | ) |
|
|
|
|
|
|
|
|
|
|
| | | | | | | | 3 | |
|
|
|
|
|
|
|
|
|
|
| Investment return variances | | | | | | | | 7 | |
| Economic assumption changes | | | | | | | | (15 | ) |
| Other | | | | | | | | 23 | |
|
|
|
|
|
|
|
|
|
|
| Closing net assets | | | | | | | | 824 | |
| | | | | | | |
|
|
| New business contribution represents the present value of future profits on new insurance contract business written during the year. | |
| | | | | | | | | | |
| Movement in provision for liabilities under life contracts and investment contracts (net of reinsurance) | | | | | | | |
| | | | | Group | |
| | | | |
|
|
| | | | | Life
contracts
£m | | | Investment
contracts
£m | |
|
|
|
|
|
|
|
|
|
|
| At 1 January 2005 | | | | | 2,041 | | | 2,102 | |
| Implementation of IAS 32, IAS 39 and IFRS 4 on 1 January 2005 | | | | | 47 | | | | |
| Premiums received | | | | | 429 | | | 86 | |
| Fees and expenses | | | | | (11 | ) | | (21 | ) |
| Investment return | | | | | 252 | | | 333 | |
| Actuarial adjustments | | | | | (91 | ) | | — | |
| Account balances paid on surrender and other terminations in the year | | | | | (368 | ) | | (204 | ) |
|
|
|
|
|
|
|
|
|
|
| At 31 December 2005 | | | | | 2,299 | | | 2,296 | |
| | | | |
|
|
|
|
|
Following implementation of IFRS 4 ‘Insurance Contracts’ on 1 January 2005, investment contracts have been reclassified as customer accounts.
Changes in assumptions during the year were not material to the profit recognised.
124
| Assets backing unit-linked liabilities | | 2005
£m | | 2004
£m |
|
|
|
| Debt securities | | 1,497 | | 1,491 |
| Equity securities | | 2,217 | | 1,887 |
| Other investments | | 8 | | 14 |
| Cash and cash equivalents | | 49 | | 65 |
| | | | | |
| The associated liabilities are: | | | | |
| Unit-linked contracts classified as insurance contracts | | 1,640 | | 1,514 |
| Unit-linked contracts classified as investment contracts (within customer deposits) | | 2,131 | | 1,943 |
|
|
|
| |
| There are no options and guarantees relating to life assurance contracts that could in aggregate have a material effect on the amount, timing and uncertainty of the Group’s future cash flows. |
| | | | | |
125
Notes on the accountscontinued
| 28 Subordinated liabilities | | Group | | Company |
| |
| |
|
| | 2005
£m | | 2004
£m | | 2005
£m | | 2004
£m |
|
|
|
|
|
| Designated as at fair value through profit or loss | | 150 | | | | — | | |
| Amortised cost | | 28,124 | | | | 9,242 | | |
|
|
| | | |
| | |
| | 28,274 | | | | 9,242 | | |
| |
| | | |
| | |
| Dated loan capital | | 12,977 | | 11,013 | | 2,039 | | 4,850 |
| Undated loan capital | | 10,236 | | 9,353 | | 1,244 | | 1,085 |
| Preference securities – preference shares | | 2,840 | | | | 2,344 | | |
| Preference securities – trust preferred securities | | 2,221 | | | | 3,615 | | |
|
|
|
|
|
|
|
|
|
| | 28,274 | | 20,366 | | 9,242 | | 5,935 |
| |
|
|
|
|
|
On implementation of IAS 32, certain preference shares were re-classified as liabilities; these securities remain subject to the capital maintenance rules of the Companies Act 1985.
The following tables analyse the remaining maturity of subordinated liabilities by (1) the final redemption date; and (2) the next callable date.
| | | | | Group |
| | | | |
|
|
|
|
|
|
|
|
|
|
|
|
|
| 2005 – final redemption | | | | 2006
£m | | 2007
£m | | 2008-2010
£m | | 2011-2015
£m | | thereafter
£m | | perpetual
£m | | Total
£m |
|
|
|
|
|
|
|
|
|
|
|
|
|
|
|
|
|
| Sterling | | | | 51 | | 150 | | — | | 1,123 | | 415 | | | | 1,739 |
| US$ | | | | 412 | | — | | 811 | | 3,537 | | 555 | | | | 5,315 |
| Euro | | | | 129 | | — | | 836 | | 3,003 | | 1,164 | | | | 5,132 |
| Other | | | | 10 | | — | | 356 | | 425 | | — | | | | 791 |
|
|
|
|
|
|
|
|
|
|
|
|
|
|
|
|
|
| Dated loan capital | | | | 602 | | 150 | | 2,003 | | 8,088 | | 2,134 | | | | 12,977 |
|
|
|
|
|
|
|
|
|
|
|
|
|
|
|
|
|
| Sterling | | | | | | | | | | | | | | 5,709 | | 5,709 |
| US$ | | | | | | | | | | | | | | 2,723 | | 2,723 |
| Euro | | | | | | | | | | | | | | 1,681 | | 1,681 |
| Other | | | | | | | | | | | | | | 123 | | 123 |
|
|
|
|
|
|
|
|
|
|
|
|
|
|
|
|
|
| Undated loan capital | | | | | | | | | | | | | | 10,236 | | 10,236 |
|
|
|
|
|
|
|
|
|
|
|
|
|
|
|
|
|
| Sterling | | | | | | | | | | | | | | 374 | | 374 |
| US$ | | | | | | | | | | | | | | 3,829 | | 3,829 |
| Euro | | | | | | | | | | | | | | 858 | | 858 |
|
|
|
|
|
|
|
|
|
|
|
|
|
|
|
|
|
| Preference securities | | | | | | | | | | | | | | 5,061 | | 5,061 |
|
|
|
|
|
|
|
|
|
|
|
|
|
|
|
|
|
| | | | 602 | | 150 | | 2,003 | | 8,088 | | 2,134 | | 15,297 | | 28,274 |
| | | |
|
|
|
|
|
|
|
|
|
|
|
|
|
| | Group |
| |
|
|
|
|
|
|
|
|
|
|
|
|
|
|
|
| 2005 – call date | | Currently
£m | | 2006
£m | | 2007
£m | | 2008 – 2010
£m | | 2011– 2015
£m | | thereafter
£m | | perpetual
£m | | Total
£m |
|
|
|
|
|
|
|
|
|
|
|
|
|
|
|
|
|
| Sterling | | — | | 51 | | 150 | | — | | 1,188 | | 350 | | | | 1,739 |
| US$ | | — | | 412 | | — | | 1,559 | | 3,079 | | 265 | | | | 5,315 |
| Euro | | — | | 129 | | — | | 1,522 | | 2,659 | | 822 | | | | 5,132 |
| Other | | — | | 10 | | — | | 781 | | — | | — | | | | 791 |
|
|
|
|
|
|
|
|
|
|
|
|
|
|
|
|
|
| Dated loan capital | | — | | 602 | | 150 | | 3,862 | | 6,926 | | 1,437 | | | | 12,977 |
|
|
|
|
|
|
|
|
|
|
|
|
|
|
|
|
|
| Sterling | | 127 | | 280 | | 174 | | 564 | | — | | 4,539 | | 25 | | 5,709 |
| US$ | | 1,645 | | 40 | | 333 | | 13 | | — | | — | | 692 | | 2,723 |
| Euro | | — | | 19 | | — | | 475 | | — | | 1,031 | | 156 | | 1,681 |
| Other | | — | | — | | — | | — | | — | | 123 | | — | | 123 |
|
|
|
|
|
|
|
|
|
|
|
|
|
|
|
|
|
| Undated loan capital | | 1,772 | | 339 | | 507 | | 1,052 | | — | | 5,693 | | 873 | | 10,236 |
|
|
|
|
|
|
|
|
|
|
|
|
|
|
|
|
|
| Sterling | | 152 | | — | | — | | 197 | | — | | 24 | | 1 | | 374 |
| US$ | | 741 | | 426 | | 289 | | 1,065 | | — | | 1,308 | | — | | 3,829 |
| Euro | | — | | — | | — | | — | | — | | 858 | | — | | 858 |
|
|
|
|
|
|
|
|
|
|
|
|
|
|
|
|
|
| Preference securities | | 893 | | 426 | | 289 | | 1,262 | | — | | 2,190 | | 1 | | 5,061 |
|
|
|
|
|
|
|
|
|
|
|
|
|
|
|
|
|
| | 2,665 | | 1,367 | | 946 | | 6,176 | | 6,926 | | 9,320 | | 874 | | 28,274 |
| | |
|
|
|
|
|
|
|
|
|
|
|
|
|
|
|
126
| | | | | Group |
| | | | |
|
|
|
|
|
|
|
|
|
|
|
|
|
| 2004 – final redemption | | | | 2005
£m | | 2006
£m | | 2007-2009
£m | | 2010-2014
£m | | thereafter
£m | | perpetual
£m | | Total
£m |
|
|
|
|
|
|
|
|
|
|
|
|
|
|
|
|
|
| Sterling | | | | 165 | | — | | 150 | | 486 | | 913 | | — | | 1,714 |
| US$ | | | | 206 | | 54 | | 719 | | 2,410 | | 850 | | — | | 4,239 |
| Euro | | | | — | | — | | 391 | | 2,621 | | 1,645 | | — | | 4,657 |
| Other | | | | — | | — | | — | | 403 | | — | | — | | 403 |
|
|
|
|
|
|
|
|
|
|
|
|
|
|
|
|
|
| Dated loan capital | | | | 371 | | 54 | | 1,260 | | 5,920 | | 3,408 | | — | | 11,013 |
|
|
|
|
|
|
|
|
|
|
|
|
|
|
|
|
|
| Sterling | | | | | | | | | | | | | | 5,308 | | 5,308 |
| US$ | | | | | | | | | | | | | | 2,372 | | 2,372 |
| Euro | | | | | | | | | | | | | | 1,509 | | 1,509 |
| Other | | | | | | | | | | | | | | 164 | | 164 |
|
|
|
|
|
|
|
|
|
|
|
|
|
|
|
|
|
| Undated loan capital | | | | | | | | | | | | | | 9,353 | | 9,353 |
|
|
|
|
|
|
|
|
|
|
|
|
|
|
|
|
|
| | | | 371 | | 54 | | 1,260 | | 5,920 | | 3,408 | | 9,353 | | 20,366 |
| | | | |
|
| | |
| | Group |
| |
|
|
|
|
|
|
|
|
|
|
|
|
|
|
|
| 2004 – call date | | Currently
£m | | 2005
£m | | 2006
£m | | 2007– 2009
£m | | 2010– 2014
£m | | thereafter
£m | | perpetual
£m | | Total
£m |
|
|
|
|
|
|
|
|
|
|
|
|
|
|
|
|
|
| Sterling | | — | | 165 | | 301 | | 150 | | 250 | | 848 | | | | 1,714 |
| US$ | | — | | 206 | | 54 | | 1,387 | | 2,000 | | 592 | | | | 4,239 |
| Euro | | — | | — | | — | | 1,095 | | 2,268 | | 1,294 | | | | 4,657 |
| Other | | — | | — | | — | | 403 | | — | | — | | | | 403 |
|
|
|
|
|
|
|
|
|
|
|
|
|
|
|
|
|
| Dated loan capital | | — | | 371 | | 355 | | 3,035 | | 4,518 | | 2,734 | | | | 11,013 |
|
|
|
|
|
|
|
|
|
|
|
|
|
|
|
|
|
| Sterling | | — | | — | | 125 | | 150 | | 1,347 | | 3,686 | | — | | 5,308 |
| US$ | | 1,316 | | 44 | | 103 | | 255 | | — | | — | | 654 | | 2,372 |
| Euro | | — | | — | | — | | 458 | | 1,051 | | — | | — | | 1,509 |
| Other | | — | | — | | — | | — | | — | | 164 | | — | | 164 |
|
|
|
|
|
|
|
|
|
|
|
|
|
|
|
|
|
| Undated loan capital | | 1,316 | | 44 | | 228 | | 863 | | 2,398 | | 3,850 | | 654 | | 9,353 |
|
|
|
|
|
|
|
|
|
|
|
|
|
|
|
|
|
| | 1,316 | | 415 | | 583 | | 3,898 | | 6,916 | | 6,584 | | 654 | | 20,366 |
| | |
|
|
|
|
|
|
|
|
|
|
|
|
|
|
|
127
Notes on the accountscontinued
| 28 Subordinated liabilities(continued) | | | | Company |
| | | | |
|
|
|
|
|
|
|
|
|
|
|
|
|
| 2005 – final redemption | | | | 2006
£m | | 2007
£m | | 2008-2010
£m | | 2011-2015
£m | | thereafter
£m | | perpetual
£m | | Total
£m |
|
|
|
|
|
|
|
|
|
|
|
|
|
|
|
|
|
| | | | | | | | | | | | | | | | | |
| Dated loan capital – US$ | | | | 33 | | — | | 232 | | 1,572 | | 202 | | | | 2,039 |
|
|
|
|
|
|
|
|
|
|
|
|
|
|
|
|
|
| Undated loan capital – US$ | | | | | | | | | | | | | | 1,244 | | 1,244 |
|
|
|
|
|
|
|
|
|
|
|
|
|
|
|
|
|
| Sterling | | | | | | | | | | | | | | 198 | | 198 |
| US$ | | | | | | | | | | | | | | 4,567 | | 4,567 |
| Euro | | | | | | | | | | | | | | 1,194 | | 1,194 |
|
|
|
|
|
|
|
|
|
|
|
|
|
|
|
|
|
| Preference securities | | | | | | | | | | | | | | 5,959 | | 5,959 |
|
|
|
|
|
|
|
|
|
|
|
|
|
|
|
|
|
| | | | 33 | | — | | 232 | | 1,572 | | 202 | | 7,203 | | 9,242 |
| | | | |
|
|
|
|
|
|
|
|
|
|
|
|
|
| | |
| | Company |
| |
|
|
|
|
|
|
|
|
|
|
|
|
|
|
|
| 2005 – call date | | Currently
£m | | 2006
£m | | 2007
£m | | 2008 – 2010
£m | | 2011– 2015
£m | | thereafter
£m | | perpetual
£m | | Total
£m |
|
|
|
|
|
|
|
|
|
|
|
|
|
|
|
|
|
| Dated loan capital – US$ | | — | | 33 | | — | | 232 | | 1,572 | | 202 | | — | | 2,039 |
|
|
|
|
|
|
|
|
|
|
|
|
|
|
|
|
|
| Undated loan capital – US$ | | 484 | | 24 | | 44 | | — | | — | | — | | 692 | | 1,244 |
|
|
|
|
|
|
|
|
|
|
|
|
|
|
|
|
|
| Sterling | | — | | — | | — | | 197 | | — | | — | | 1 | | 198 |
| US$ | | 595 | | 371 | | 115 | | 1,065 | | — | | 2,421 | | — | | 4,567 |
| Euro | | — | | — | | — | | — | | — | | 1,194 | | — | | 1,194 |
|
|
|
|
|
|
|
|
|
|
|
|
|
|
|
|
|
| Preference securities | | 595 | | 371 | | 115 | | 1,262 | | — | | 3,615 | | 1 | | 5,959 |
|
|
|
|
|
|
|
|
|
|
|
|
|
|
|
|
|
| | 1,079 | | 428 | | 159 | | 1,494 | | 1,572 | | 3,817 | | 693 | | 9,242 |
| | |
|
|
|
|
|
|
|
|
|
|
|
|
|
|
|
| | | | |
| | | | | Company |
| | | | |
|
|
|
|
|
|
|
|
|
|
|
|
|
| 2004 – final redemption | | | | 2005
£m | | 2006
£m | | 2007-2009
£m | | 2010-2014
£m | | thereafter
£m | | perpetual
£m | | Total
£m |
|
|
|
|
|
|
|
|
|
|
|
|
|
|
|
|
|
| Sterling | | | | 40 | | — | | — | | — | | — | | — | | 40 |
| US$ | | | | — | | — | | 589 | | 2,486 | | 860 | | — | | 3,935 |
| Euro | | | | — | | — | | — | | 875 | | — | | — | | 875 |
|
|
|
|
|
|
|
|
|
|
|
|
|
|
|
|
|
| Dated loan capital | | | | 40 | | — | | 589 | | 3,361 | | 860 | | — | | 4,850 |
|
|
|
|
|
|
|
|
|
|
|
|
|
|
|
|
|
| Undated loan capital – US$ | | | | — | | — | | — | | — | | — | | 1,085 | | 1,085 |
|
|
|
|
|
|
|
|
|
|
|
|
|
|
|
|
|
| | | | 40 | | — | | 589 | | 3,361 | | 860 | | 1,085 | | 5,935 |
| | | | |
|
|
|
|
|
|
|
|
|
|
|
|
|
| | |
| | Company |
| |
|
|
|
|
|
|
|
|
|
|
|
|
|
|
|
| 2004 – call date | | Currently
£m | | 2005
£m | | 2006
£m | | 2007– 2009
£m | | 2010– 2014
£m | | thereafter
£m | | perpetual
£m | | Total
£m |
|
|
|
|
|
|
|
|
|
|
|
|
|
|
|
|
|
| Sterling | | — | | 40 | | — | | — | | — | | — | | — | | 40 |
| US$ | | — | | — | | — | | 589 | | 2,486 | | 860 | | — | | 3,935 |
| Euro | | — | | — | | — | | — | | 875 | | — | | — | | 875 |
|
|
|
|
|
|
|
|
|
|
|
|
|
|
|
|
|
| Dated loan capital | | — | | 40 | | — | | 589 | | 3,361 | | 860 | | — | | 4,850 |
|
|
|
|
|
|
|
|
|
|
|
|
|
|
|
|
|
| Undated loan capital – US$ | | 284 | | 44 | | 103 | | — | | — | | — | | 654 | | 1,085 |
|
|
|
|
|
|
|
|
|
|
|
|
|
|
|
|
|
| | 284 | | 84 | | 103 | | 589 | | 3,361 | | 860 | | 654 | | 5,935 |
| | |
|
|
|
|
|
|
|
|
|
|
|
|
|
|
|
| | Notes: |
| (1) | In the event of certain changes in tax laws, dated and undated loan capital issues may be redeemed in whole, but not in part, at the option of the Group, at the principal amount thereof plus accrued interest, subject to prior regulatory approval. |
| (2) | At 31 December 2004 the principle amounts payable to dated and undated loan note holders would not have been materially different from the carrying amount. |
| (3) | On 30 November 2005, the company gave notice of redemption of 8 million Exchangeble Capital Securities, Series A, of US$25 each on 31 December 2005. This occurred on the next banking day, 3 January 2006. On 15 December 2005, NatWest gave notice of redemption of 20 million Exchangeble Capital Securities, Series A, of US$25 each on 17 January 2006. |
| | |
128
| 29 Minority interests | | | | | | | | | | Group | |
| | | | | | | | | |
| |
| | | | | | | | | | 2005
£m | | | 2004
£m | |
|
|
|
|
|
|
|
|
|
|
|
|
|
| |
| At 1 January | | | | | | | | | | 3,492 | | | 2,392 | |
| Implementation of IAS 32 and IAS 39on 1 January 2005 | | | | | | | | | | (2,541 | ) | | — | |
| Currency translation adjustments and other movements | | | | | | | | | | 53 | | | (188 | ) |
| Profit attributable to minority interests | | | | | | | | | | 57 | | | 177 | |
| Dividends paid | | | | | | | | | | (95 | ) | | (147 | ) |
| Equity raised | | | | | | | | | | 1,264 | | | 1,260 | |
| Equity withdrawn | | | | | | | | | | (121 | ) | | (2 | ) |
|
|
|
|
|
|
|
|
|
|
|
|
|
| |
| At 31 December | | | | | | | | | | 2,109 | | | 3,492 | |
| | | | | | | | | |
| |
| Equity minority interests at 31 December 2004 were £158 million. | | | | |
| | | | | | | | |
| 30 Share capital | | | | Allotted, called up and fully paid | | Authorised | |
| | | |
| |
| |
| | | | 1 January
2005
£m | | Issued during
the year
£m | | 31 December
2005
£m | | 31 December
2005
£m | | | 31 December
2004
£m | |
|
|
|
|
|
|
|
|
|
|
|
|
|
| |
| Equity shares | | | | | | | | | | | | | | |
| Ordinary shares of 25p | | | | 793 | | 6 | | 799 | | 1,270 | | | 1,020 | |
| Non-voting deferred shares of £0.01 | | | | 27 | | — | | 27 | | 323 | | | 323 | |
|
|
|
|
|
|
|
|
|
|
|
|
|
| |
| Total equity share capital | | | | 820 | | 6 | | 826 | | 1,593 | | | 1,343 | |
|
|
|
|
|
|
|
|
|
|
|
|
|
| |
| | | | | | | | | | | | | | | |
| Non-equity shares | | | | | | | | | | | | | | |
| Additional Value Shares of £0.01 | | | | — | | — | | — | | 27 | | | 27 | |
| Non-cumulative preference shares of US$0.01 | | | | 1 | | — | | 1 | | 2 | | | 2 | |
| Non-cumulative convertible preference shares of US$0.01 | | | | — | | — | | — | | — | | | — | |
| Non-cumulative preference shares of€0.01 | | | | — | | — | | — | | — | | | — | |
| Non-cumulative convertible preference shares of€0.01 | | | | — | | — | | — | | — | | | — | |
| Non-cumulative convertible preference shares of £0.25 | | | | — | | — | | — | | 225 | | | 225 | |
| Non-cumulative convertible preference shares of £0.01 | | | | — | | — | | — | | — | | | — | |
| Cumulative preference shares of £1 | | | | 1 | | — | | 1 | | 1 | | | 1 | |
| Non-cumulative preference shares of £1 | | | | — | | — | | — | | 300 | | | 300 | |
|
|
|
|
|
|
|
|
|
|
|
|
|
| |
| Total non-equity share capital | | | | 2 | | — | | 2 | | 555 | | | 555 | |
|
|
|
|
|
|
|
|
|
|
|
|
|
| |
| Total share capital | | | | 822 | | 6 | | 828 | | 2,148 | | | 1,898 | |
| | | | |
|
|
|
|
|
|
|
|
|
| |
| | | | | | | | | |
| | | | | | Allotted, called up and fully paid | | Authorised | |
| | | | | |
| |
| |
| Number of shares – thousands | | | | | | 2005 | | 2004 | | 2005 | | | 2004 | |
|
|
|
|
|
|
|
|
|
|
|
|
|
| |
| Equity shares | | | | | | | | | | | | | | |
| Ordinary shares of 25p | | | | | | 3,196,544 | | 3,172,605 | | 5,079,375 | | | 4,079,375 | |
| Non-voting deferred shares of £0.01 | | | | | | 2,660,556 | | 2,660,556 | | 32,300,000 | | | 32,300,000 | |
| | | | | | | | | | | | | | | |
| Non-equity shares | | | | | | | | | | | | | | |
| Additional Value Shares of £0.01 | | | | | | — | | — | | 2,700,000 | | | 2,700,000 | |
| Non-cumulative preference shares of US$0.01 | | | | | | 206,000 | | 153,000 | | 419,500 | | | 348,500 | |
| Non-cumulative convertible preference shares of US$0.01 | | | | | | 1,000 | | 1,900 | | 3,900 | | | 3,900 | |
| Non-cumulative preference shares of€0.01 | | | | | | 2,500 | | 1,250 | | 66,000 | | | 66,000 | |
| Non-cumulative convertible preference shares of€0.01 | | | | | | — | | 750 | | 3,000 | | | 3,000 | |
| Non-cumulative convertible preference shares of £0.25 | | | | | | — | | — | | 900,000 | | | 900,000 | |
| Non-cumulative convertible preference shares of £0.01 | | | | | | 200 | | 200 | | 1,000 | | | 1,000 | |
| Cumulative preference shares of £1 | | | | | | 900 | | 900 | | 900 | | | 900 | |
| Non-cumulative preference shares of £1 | | | | | | — | | — | | 300,000 | | | 300,000 | |
|
|
|
|
|
|
|
|
|
|
|
|
|
| |
129
Notes on the accountscontinued
30 Share capital(continued)
Ordinary shares
The following issues of ordinary shares were made during the year ended 31 December 2005:
(a) | 13.5 million ordinary shares following the exercise of options under the company’s executive, sharesave and option 2000 schemes and a further 0.7 million ordinary shares in respect of the exercise of options under the NatWest executive and sharesave schemes which had been exchanged for options over the company’s shares following the acquisition of NatWest in 2000; |
| | |
| (b) | 7.4 million ordinary shares in lieu of cash in respect of the final dividend for the year ended 31 December 2004 and the interim dividend for the year ended 31 December 2005; and |
| | |
| (c) | 2.3 million ordinary shares under the company’s employee share ownership plan. |
Consideration of £163 million was received on the issue of ordinary shares for cash and dividends of £124 million were satisfied by the issue of shares.
During the year to 31 December 2005, options were granted over 17.3 million ordinary shares under the company’s executive, sharesave and option 2000 schemes. At 31 December 2005, options granted under the company’s various schemes, exercisable up to 2015 at prices ranging from 496p to 1841p per share, were outstanding in respect of 70.8 million ordinary shares.
In addition, options granted under the NatWest schemes were outstanding in respect of 0.8 million ordinary shares exercisable up to 2009 at prices ranging from 403p to 924p per share.
Preference shares
In March 2005, the company redeemed 750,000 Series 1 non-cumulative convertible preference shares of €0.01 each at €1,000 per share and 500,000 Series 2 non-cumulative convertible preference shares of US$0.01 each at US$1,000 per share.
In May 2005, the company issued 40 million Series N non-cumulative preference shares of US$0.01 each at US$25 per share, the net proceeds being US$969 million.
In June 2005, the company issued 1.25 million Series 2 non-cumulative preference shares of €0.01 each at €1,000 per share, the net proceeds being€1,226 million.
In November 2005, the company issued 22 million Series P non-cumulative preference shares of US$0.01 each at US$25 per share, the net proceeds being US$533 million and redeemed 9 million Series J non-cumulative preference shares of US$0.01 each at US$25 per share.
In December 2005, the company redeemed 400,000 Series 3 non-cumulative convertible preference shares of US$0.01 each at US$1,000 per share.
The costs of issue and discounts allowed on preference shares issued during the year were £42 million.
Under IFRS, certain of the Group's preference shares are classified as debt and are now included in subordinated liabilities on the balance sheet. The following table shows the re-classification of the Group’s non-equity shares at 31 December 2004 in to equity shares and subordinated liabilities (see Note 28) upon implementation of IAS 32 on 1 January 2005. All preference share capital redeemed during the year was classified as debt and all capital issued during the year is classified as equity in accordance with IAS 32.
| | 31 December 2004 | | 1 January 2005 |
| |
| |
|
|
| Share capital and share premium | | Non-equity
£m | | Adjustment to
historic cost
£m | | | Equity
£m | | Debt
£m |
|
|
|
|
|
|
|
|
|
|
| Non-cumulative preference shares of US$0.01 | | 1,951 | | 35 | | | 499 | | 1,487 |
| Non-cumulative convertible preference shares of US$0.01 | | 978 | | — | | | — | | 978 |
| Non-cumulative preference shares of€0.01 | | 864 | | (4 | ) | | 860 | | — |
| Non-cumulative convertible preference shares of€0.01 | | 529 | | — | | | — | | 529 |
| Non-cumulative convertible preference shares of £0.01 | | 197 | | — | | | — | | 197 |
| Cumulative preference shares of £1 | | 1 | | — | | | — | | 1 |
|
|
|
|
|
|
|
|
|
|
| | 4,520 | | 31 | | | 1,359 | | 3,192 |
| |
|
130
Non-cumulative preference shares
Non-cumulative preference shares entitle the holders thereof to receive periodic non-cumulative cash dividends at specified fixed rates for each Series payable out of distributable profits of the company.
The non-cumulative preference shares are redeemable at the option of the company, in whole or in part from time to time at the rates detailed below plus dividends otherwise payable for the then current dividend period accrued to the date of redemption.
| Class of preference share | | Series | | Number
of shares in issue | | Redemption
date on or after | | Redemption
price per share |
|
|
|
|
|
|
|
|
|
| Non-cumulative preference shares of US$0.01 | | Series D | | 7 million | | 14 September 2005 | | US$25.00 |
| | Series E | | 8 million | | 17 October 2006 | | US$25.00 |
| | Series F | | 8 million | | 31 March 2007 | | US$25.00 |
| | Series G | | 10 million | | 31 March 2003 | | US$25.00 |
| | Series H | | 12 million | | 31 March 2004 | | US$25.00 |
| | Series I | | 12 million | | 30 September 2004 | | US$25.00 |
| | Series K | | 16 million | | 30 June 2006 | | US$25.00 |
| | Series L | | 34 million | | 30 September 2009 | | US$25.00 |
| | Series M | | 37 million | | 30 September 2009 | | US$25.00 |
| | Series N | | 40 million | | 30 June 2010 | | US$25 |
| | Series P | | 22 million | | 31 December 2010 | | US$25 |
Non-cumulative convertible preference
shares ofUS$0.01 | | Series 1 | | 1 million | | 31 March 2010 | | US$1,000 |
| Non-cumulative preference shares of€0.01 | | Series 1 | | 1.25 million | | 31 December 2009 | | €1,000 |
| | Series 2 | | 1.25 million | | 30 June 2010 | | €1,000 |
Non-cumulative convertible preference
shares of£0.01 | | Series 1 | | 0.2 million | | 31 December 2010 | | £1,000 |
|
|
|
|
|
|
|
|
|
In the event that the non-cumulative convertible preference shares are not redeemed on or before the redemption date, the holder may convert the non-cumulative convertible preference shares into ordinary shares in the company.
Under existing arrangements, no redemption or purchase of any non-cumulative preference shares may be made by the company without the prior consent of the UK Financial Services Authority.
On a winding-up or liquidation of the company, the holders of the non-cumulative preference shares will be entitled to receive, out of any surplus assets available for distribution to the company’s shareholders (after payment of arrears of dividends on the cumulative preference shares up to the date of repayment) pari passu with the cumulative preference shares, the non-cumulative sterling preference shares and all other shares of the company ranking pari passu with the non-cumulative preference shares as regards participation in the surplus assets of the company, a liquidation distribution of US$25 per non-cumulative preference share of US$0.01, US$1,000 per non-cumulative convertible preference share of US$0.01, €1,000 per non-cumulative preference share of €0.01 and £1,000 per non-cumulative convertible preference share of £0.01, together with an amount equal to dividends for the then current dividend period accrued to the date of payment, before any distribution or payment may be made to holders of the ordinary shares as regards participation in the surplus assets of the company.
Except as described above, the holders of the non-cumulative preference shares have no right to participate in the surplus assets of the company.
Holders of the non-cumulative preference shares are not entitled to receive notice of or attend general meetings of the company except if any resolution is proposed for adoption by the shareholders of the company to vary or abrogate any of the rights attaching to the non-cumulative preference shares or proposing the winding-up or liquidation of the company. In any such case, they are entitled to receive notice of and to attend the general meeting of shareholders at which such resolution is to be proposed and will be entitled to speak and vote on such resolution (but not on any other resolution). In addition, in the event that, prior to any general meeting of shareholders, the company has failed to pay in full the three most recent quarterly dividend payments due on the non-cumulative dollar preference shares, the two most recent semi-annual dividend payments due on the non-cumulative convertible dollar preference shares and the most recent annual dividend payments due on the non-cumulative convertible euro preference shares and on the non-cumulative convertible sterling preference shares, the holders shall be entitled to receive notice of, attend, speak and vote at such meeting on all matters together with the holders of the ordinary shares, and in these circumstances only, the rights of the holders of the non-cumulative preference shares so to vote shall continue until the company shall have resumed the payment in full of the dividends in arrears.
131
Notes on the accounts continued
| 31 Reserves | | Group | | | Company | |
| |
|
|
|
| | |
|
|
|
| |
| | 2005
£m | | | 2004
£m | | | 2005
£m | | | 2004
£m | |
|
|
|
|
|
|
|
|
|
|
|
|
|
| Share premium account | | | | | | | | | | | | |
| At 1 January | | 12,964 | | | 8,175 | | | 12,964 | | | 8,175 | |
| Reclassification of preference shares on implementation | | | | | | | | | | | | |
| of IAS 32 on 1 January 2005 | | (3,159 | ) | | — | | | (3,159 | ) | | — | |
| Currency translation adjustments | | — | | | (231 | ) | | — | | | (231 | ) |
| Shares issued during the year | | 1,972 | | | 4,550 | | | 1,972 | | | 4,550 | |
| Conversion of exchangeable undated loan capital | | — | | | 460 | | | — | | | 460 | |
| Other movements | | — | | | 10 | | | — | | | 10 | |
|
|
|
|
|
|
|
|
|
|
|
|
|
| At 31 December | | 11,777 | | | 12,964 | | | 11,777 | | | 12,964 | |
| |
|
|
|
|
|
|
|
|
|
|
|
| | | | | | | | | | | | | |
| Merger reserve | | | | | | | | | | | | |
| At 1 January and 31 December | | 10,881 | | | 10,881 | | | — | | | — | |
| |
|
|
|
|
|
|
|
|
|
|
|
| | | | | | | | | | | | | |
| Available-for-sale reserve | | | | | | | | | | | | |
| Implementation of IAS 32 and IAS 39 on 1 January 2005 | | 289 | | | | | | — | | | | |
| Currency translation adjustments | | 4 | | | | | | — | | | | |
| Unrealised gains in the year | | 35 | | | | | | — | | | | |
| Realised gains in the year | | (582 | ) | | | | | — | | | | |
| Taxation | | 181 | | | | | | — | | | | |
|
|
|
|
|
|
|
|
|
| | | |
| At 31 December | | (73 | ) | | | | | — | | | | |
| |
|
| | | | |
|
| | | |
| | | | | | | | | | | | | |
| Cash flow hedging reserve | | | | | | | | | | | | |
| Implementation of IAS 32 and IAS 39 on 1 January 2005 | | 67 | | | | | | (13 | ) | | | |
| Unrealised (losses)/gains in the year | | (67 | ) | | | | | 6 | | | | |
| Taxation | | 59 | | | | | | (2 | ) | | | |
|
|
|
|
|
|
|
|
|
| | | |
| At 31 December | | 59 | | | | | | (9 | ) | | | |
| |
|
| | | | |
|
| | | |
| | | | | | | | | | | | | |
| Foreign exchange reserve | | | | | | | | | | | | |
| At 1 January | | (320 | ) | | 90 | | | — | | | — | |
| Retranslation of net assets | | 1,588 | | | (830 | ) | | — | | | — | |
| Foreign currency (losses)/gains on hedges of net assets | | (799 | ) | | 420 | | | — | | | — | |
|
|
|
|
|
|
|
|
|
|
|
|
|
| At 31 December | | 469 | | | (320 | ) | | — | | | — | |
| |
|
|
|
|
|
|
|
|
|
|
|
| | | | | | | | | | | | | |
| Other reserves | | | | | | | | | | | | |
| At 1 January | | 150 | | | 157 | | | 150 | | | 157 | |
| Own shares held in relation to employee share schemes | | — | | | (7 | ) | | — | | | (7 | ) |
|
|
|
|
|
|
|
|
|
|
|
|
|
| At 31 December | | 150 | | | 150 | | | 150 | | | 150 | |
| |
|
|
|
|
|
|
|
|
|
|
|
| | | | | | | | | | | | | |
| Retained earnings | | | | | | | | | | | | |
| At 1 January | | 9,408 | | | 7,269 | | | 4,675 | | | 3,646 | |
| Implementation of IAS 32 and IAS 39 on 1 January 2005 | | (1,078 | ) | | — | | | 81 | | | — | |
| Currency translation adjustments and other movements | | — | | | (8 | ) | | — | | | (1 | ) |
| Profit attributable to ordinary and equity preference shareholders | | 5,501 | | | 5,112 | | | 2,074 | | | 2,874 | |
| Ordinary dividends paid | | (1,927 | ) | | (1,588 | ) | | (1,927 | ) | | (1,588 | ) |
| Equity preference dividends paid | | (109 | ) | | — | | | (109 | ) | | — | |
| Preference dividends – non-equity | | — | | | (256 | ) | | — | | | (256 | ) |
| Share-based payments, net of tax | | 112 | | | 15 | | | — | | | — | |
| Actuarial losses recognised in post-retirement benefit schemes, net of tax | | (561 | ) | | (1,136 | ) | | — | | | — | |
|
|
|
|
|
|
|
|
|
|
|
|
|
| At 31 December | | 11,346 | | | 9,408 | | | 4,794 | | | 4,675 | |
| |
|
|
|
|
|
|
|
|
|
|
|
| Reserves at 31 December | | 34,609 | | | 33,083 | | | 16,712 | | | 17,789 | |
| |
|
|
|
|
|
|
|
|
|
|
|
132
UK law prescribes that only reserves of the company are taken into account for the purpose of making distributions and the permissible applications of the share premium account. The merger reserve arose on the acquisition of NatWest under UK GAAP accounting.
The Group optimises capital efficiency by maintaining reserves in subsidiaries, including regulated entities. Certain preference shares and subordinated debt are also included within regulatory capital. The remittance of reserves to the parent or the redemption of shares or subordinated capital by regulated entities may be subject to maintaining the capital resources required by the relevant regulator.
At 31 December 2005, 680,966 (2004 – 707,247) ordinary shares of 25p each of the company were held by the 1992 Employee Share Trust and 91,951 (2004 – 63,098) ordinary shares of 25p each were held by the 2001 Employee Share Trust in respect of options under the executive option scheme and awards under the medium term performance plan.
32 Leases
Minimum amounts receivable and payable under non-cancellable leases
| | | Group | |
| | |
|
|
|
|
|
|
|
|
|
|
|
| | | Year in which receipt or payment will occur | |
| | |
|
|
|
|
|
|
|
|
|
|
|
| 2005 | | Within 1
year
£m | | | After 1 year
but within
5 years
£m | | | After 5
years
£m | | | Total
£m | |
|
|
|
|
|
|
|
|
|
|
|
|
|
| Finance lease assets: | | | | | | | | | | | | |
| Amounts receivable | | 1,297 | | | 4,733 | | | 11,604 | | | 17,634 | |
| Present value adjustment | | (462 | ) | | (1,857 | ) | | (3,628) | | | (5,947 | ) |
| Other movements | | (26 | ) | | (136 | ) | | (231 | ) | | (393 | ) |
|
|
|
|
|
|
|
|
|
|
|
|
|
| Present value amounts receivable | | 809 | | | 2,740 | | | 7,745 | | | 11,294 | |
| |
|
|
|
|
|
|
|
|
|
|
|
| Operating lease assets: | | | | | | | | | | | | |
| Amounts receivable | | 954 | | | 2,757 | | | 2,241 | | | 5,952 | |
| |
|
|
|
|
|
|
|
|
|
|
|
| Operating lease obligations: | | | | | | | | | | | | |
| Amounts payable: | | | | | | | | | | | | |
| Premises | | 310 | | | 1,103 | | | 1,700 | | | 3,113 | |
| Equipment | | 10 | | | 11 | | | — | | | 21 | |
|
|
|
|
|
|
|
|
|
|
|
|
|
| | 320 | | | 1,114 | | | 1,700 | | | 3,134 | |
| |
|
|
|
|
|
|
|
|
|
|
|
| | | | | | | | | | | | | |
| 2004 | | | | | | | | | | | | |
|
|
|
|
|
|
|
|
|
|
|
|
|
| Finance lease assets: | | | | | | | | | | | | |
| Amounts receivable | | 1,382 | | | 4,110 | | | 10,901 | | | 16,393 | |
| Present value adjustment | | (515 | ) | | (2,127 | ) | | (4,362 | ) | | (7,004 | ) |
| Other movements | | (50 | ) | | (170 | ) | | (446 | ) | | (666 | ) |
|
|
|
|
|
|
|
|
|
|
|
|
|
| Present value amounts receivable | | 817 | | | 1,813 | | | 6,093 | | | 8,723 | |
| |
|
|
|
|
|
|
|
|
|
|
|
| | | | | | | | | | | | | |
| Operating lease assets: | | | | | | | | | | | | |
| Amounts receivable | | 833 | | | 1,895 | | | 2,493 | | | 5,221 | |
| |
|
|
|
|
|
|
|
|
|
|
|
| | | | | | | | | | | | | |
| Operating lease obligations: | | | | | | | | | | | | |
| Amounts payable: | | | | | | | | | | | | |
| Premises | | 316 | | | 1,114 | | | 2,246 | | | 3,676 | |
| Equipment | | 12 | | | 18 | | | — | | | 30 | |
|
|
|
|
|
|
|
|
|
|
|
|
|
| | 328 | | | 1,132 | | | 2,246 | | | 3,706 | |
| |
|
|
|
|
|
|
|
|
|
|
|
133
Notes on the accounts continued32 Leases(continued)
| | 2005
£m | | | 2004
£m | |
|
|
|
|
|
|
|
| Nature of operating lease assets in balance sheet | | | | | | |
| Transportation | | 7,742 | | | 6,185 | |
| Cars and light commercial vehicles | | 978 | | | 895 | |
| Other | | 333 | | | 585 | |
|
|
|
|
|
|
|
| | 9,053 | | | 7,665 | |
| |
|
|
|
|
|
| Amounts recognised as income and expense | | | | | | |
| Finance lease receivables – contingent rental income | | (34 | ) | | (51 | ) |
| Operating lease payables – minimum payments | | 332 | | | 319 | |
| | | | | | | |
| Contracts for future capital expenditure not provided for at the year end | | | | | | |
| Operating leases | | 594 | | | 423 | |
| | | | | | | |
| Finance lease receivables | | | | | | |
| Unearned finance income | | 5,947 | | | 7,004 | |
| Accumulated allowance for uncollectable minimum lease receivables | | 72 | | | 68 | |
|
|
|
|
|
|
|
Residual value exposures
The tables below give details of the unguaranteed residual values included in the carrying value of finance lease receivables (see page 133) and operating lease assets (see note 18).
| | Year in which residual value will be recovered | |
| |
|
|
|
|
|
|
|
|
| |
| 2005 | | Within
1 years
£m | | After 1 year
but within
2 years
£m | | After 2 year
but within
5 years
£m | | After 5 year
£m | | Total
£m | |
|
|
|
|
|
|
|
|
|
|
| |
| Operating leases | | | | | | | | | | | |
| Transportation | | 579 | | 912 | | 895 | | 3,229 | | 5,615 | |
| Cars and light commercial vehicles | | 612 | | 115 | | 77 | | — | | 804 | |
| Other | | 26 | | 21 | | 84 | | 21 | | 152 | |
| Finance leases | | 26 | | 32 | | 104 | | 231 | | 393 | |
|
|
|
|
|
|
|
|
|
|
| |
| | 1,243 | | 1,080 | | 1,160 | | 3,481 | | 6,964 | |
| |
|
|
|
|
|
|
|
|
| |
| 2004 | | | | | | | | | | | |
|
|
|
|
|
|
|
|
|
|
| |
| Operating leases | | | | | | | | | | | |
| Transportation | | 65 | | 400 | | 1,257 | | 2,527 | | 4,249 | |
| Cars and light commercial vehicles | | 403 | | 141 | | 116 | | — | | 660 | |
| Other | | 27 | | 4 | | 51 | | 44 | | 126 | |
| Finance leases | | 50 | | 56 | | 114 | | 446 | | 666 | |
|
|
|
|
|
|
|
|
|
|
| |
| | 545 | | 601 | | 1,538 | | 3,017 | | 5,701 | |
| |
|
|
|
|
|
|
|
|
| |
134
33 Collateral
Securities repurchase agreements and lending transactions
The Group enters into securities repurchase agreements and securities lending transactions under which it receives or transfers collateral in accordance with normal market practice. Under standard terms for repurchase transactions in the UK and US markets, the recipient of collateral has an unrestricted right to sell or repledge it, subject to returning equivalent securities on settlement of the transaction.
Securities transferred under repurchase transactions included within securities on the balance sheet were as follows:
| | 2005
£m | | 2004
£m | |
|
|
|
|
| |
| Treasury and other eligible bills | | 896 | | 1,593 | |
| Debt securities | | 53,485 | | 32,129 | |
|
|
|
|
| |
| | 54,381 | | 33,722 | |
| |
|
|
| |
All of the above securities could be sold or repledged by the holder. Securities received as collateral under reverse repurchase agreements amounted to £105.6 billion (2004 – £91.4 billion), of which £85.6 billion (2004 – £85.1 billion) had been resold or repledged as collateral for the Group's own transactions.
Other collateral given
| Assets charged as security for liabilities | | 2005
£m | | 2004
£m | |
|
|
|
|
| |
| Loans and advances to customers | | 27,092 | | 16,071 | |
| Debt securities | | 9,578 | | 4,852 | |
| Property, plant and equipment | | 1,274 | | 1,268 | |
| Loans to banks | | 60 | | — | |
| Other | | 16 | | 4 | |
|
|
|
|
| |
| | 38,020 | | 22,195 | |
| |
|
|
| |
| | 2005 | | 2004 | |
| Liabilities secured by charges on assets | | £m | | £m | |
|
|
|
|
| |
| Deposits by banks | | 11,407 | | 5,628 | |
| Customer accounts | | 6,761 | | 2,001 | |
| Debt securities in issue | | 11,347 | | 6,561 | |
| Other liabilities | | 20 | | — | |
|
|
|
|
| |
| | 29,535 | | 14,190 | |
| |
|
|
| |
135
34 Financial instruments
Financial risk management policies and objectives
The Board establishes the overall governance framework for risk management and sets the risk appetite and philosophy for the Group.
The principal financial risks that the Group manages are as follows:
- Credit risk: credit risk is the risk arising from the possibility that the Group will incur losses from the failure of customers to meet their obligations
- Liquidity risk: the risk that the Group is unable to meet its’ obligations as they fall due.
- Market risk: the Group is exposed to market risk because of positions held in its trading portfolios and its non-trading businesses.
- Insurance underwriting risk: the Group is exposed to insurance risk, either directly through its businesses or through using insurance as a tool to mitigate other risk exposures.
Credit risk
The objective of credit risk management is to enable the Group to achieve sustainable and superior risk versus reward performance whilst maintaining credit risk exposure in line with approved risk appetite.
The key principles for credit risk management are set out in the Group’s Credit Risk Management Framework and include:
- Approval of all credit exposure must be granted prior to any advance or extension of credit.
- An appropriate credit risk assessment of the customer and related credit facilities must be undertaken prior to approval of credit exposure. This must include an assessment of, amongst others, the purpose of the credit and sources of repayment, compliance with affordability tests, repayment history, capacity to repay, sensitivity to economic and market developments and risk-adjusted return.
- The Board delegates authority to Executive Advances Committee, Group Credit Committee and divisional credit committees. A divisional CEO may delegate a subset of the divisional credit risk authority to sub-committees or to individuals.
- Credit risk authority must be specifically granted in writing to all individuals involved in the granting of credit approval, whether this is exercised personally or collectively as part of a credit committee. These individuals must act independently and with balanced commercial judgement in exercising credit authority.
- Where credit authority is exercised personally, the individual must not have any responsibility or accountability for business revenue origination.
- All credit exposures, once approved, must be effectively monitored and managed and reviewed periodically against approved limits. Review occurs at least annually, with lower quality exposures being subject to a greater frequency of analysis and assessment.
- Customers with emerging credit problems must be identified early and classified accordingly. Remedial actions must be implemented promptly to minimise the potential loss to the Group and consideration should be given whether to transfer customers with credit problems to a specialised problem management or recovery unit.
- Portfolio analysis and reporting must be used to identify and manage credit risk concentrations and credit risk quality migration.
Credit grading models
In order to support the analytical elements of the credit risk management framework, in particular the risk assessment part of the credit approval process, ongoing monitoring and portfolio analysis, the Group employs a range of credit risk models. These models can be broadly grouped into four categories.
- Probability of default (“PD”)/customer credit grade – these models assess the probability that the customer will fail to make full and timely repayment of credit obligations over a one year time horizon. Each customer is assigned an internal credit grade which corresponds to a probability of default. There are a number of different credit grading models in use across the Group, each of which considers particular characteristics of customer types in that portfolio. The credit grading models use a combination of quantitative inputs, such as recent financial performance and customer behaviour, and qualitative inputs, such as company management performance or sector outlook.
Every customer credit grade across all grading scales in the Group can be mapped to a Group level credit grade which uses a five band scale from AQ1 to AQ5.
- Loss given default (“LGD”) – these models estimate the economic loss that may be suffered by the Group on a credit facility in the event of default. The LGD of a facility represents the amount of debt which cannot be recovered and is typically expressed as a percentage of the EAD. The Group's LGD models take into account the type of borrower, facility and any risk mitigation such as the presence of any security or collateral held. The LGD may also be affected by the industry sector of the borrower, the legal jurisdiction in which the borrower operates as well as general economic conditions which may impact the value of any assets held as security.
136
- Exposure at default (“EAD”) – these models estimate theexpected level of utilisation of a credit facility at the time ofa borrower’s default. The EAD will typically be higher thanthe current utilisation (e.g. in the case where furtherdrawings are made on a revolving credit facility prior todefault) but will not typically exceed the total facility limit.The methodologies used in EAD modelling recognise thatcustomers may make more use of their existing creditfacilities in the run up to a default.
- Credit risk exposure measurement – these models calculatethe credit risk exposure for products where the exposure isnot 100% of the gross nominal amount of the creditobligation. These models are most commonly used forderivative and other traded instruments where the amount ofcredit risk exposure may be dependent on external variablessuch as interest rates or foreign exchange rates.
Risk assets
The Group’s portfolio consists of loans (including overdraft facilities), instalment credit, finance lease receivables, debt securities and other traded instruments. In order to encompass the entire range of products in the Group’s credit portfolios exposure is monitored using risk assets, which cover exposures to all these asset and customer types.
Risk asset quality
Internal reporting and oversight of risk assets is principally differentiated by credit ratings. Internal ratings are used to assess the credit quality of borrowers. Customers are assigned credit ratings, based on various credit grading models that reflect the probability of default. All credit ratings across the Group map to a Group level asset quality scale.
Provision analysis
The Group’s consumer portfolios, which consist of small value, high volume credits, have highly efficient largely automated processes for identifying problem credits and very short timescales, typically three months, before resolution or adoption of various recovery methods.
Corporate portfolios consist of higher value, lower volume credits, which tend to be structured to meet individual customer requirements. Provisions are assessed on a case by case basis.
Early and proactive management of problem exposures ensures that credit losses are minimised. Specialised units are used for different customer types to ensure that the appropriate risk mitigation is taken in a timely manner.
Portfolio provisions are reassessed regularly as part of the Group’s ongoing monitoring process.
Provisions methodology
Under IAS 39 provisions are assessed under three categories as described below:
Individually assessed provisions are the provisions required for individually significant impaired assets which are assessed on a case by case basis, taking into account the financial condition of the counterparty and any guarantor. This incorporates an estimate of the discounted value of any recoveries and realisation of security or collateral. The asset continues to be assessed on an individual basis until it is repaid in full, transferred to the performing portfolio or written off.
Collectively assessed provisions are the provisions on impaired credits below an agreed value threshold which are assessed on a portfolio basis, to reflect the homogenous nature of the assets, such as credit cards or personal loans. The provision is determined from a quantitative review of the relevant portfolio, taking account of the level of arrears, security and average loss experience over the recovery period.
Latent loss provisions are the provisions held against the estimated impairment in the performing portfolio which has yet to be identified and reported as at the balance sheet date. To assess the latent loss within the portfolio, the Group has developed methodologies to estimate the time that an asset can remain impaired within a performing portfolio before it is identified and reported as such.
Liquidity risk
Liquidity management within the Group focuses on both overall balance sheet structure and the control, within prudent limits, of risk arising from the mismatch of maturities across the balance sheet and from undrawn commitments and other contingent obligations. It is undertaken within limits and other policy parameters set by Group Asset and Liability Management Committee (GALCO).
The structure of the Group’s balance sheet is managed to maintain substantial diversification, to minimise concentration across its various deposit sources, and to contain the level of reliance on total and net short-term wholesale sources of funds within prudent levels.
The degree of maturity mismatch within the overall long-term structure of the Group’s assets and liabilities is also managed within internal policy limits, to ensure that term asset commitments may be funded on an economic basis over their life. In managing its overall term structure, the Group analyses and takes into account the effect of retail and corporate customer behaviour on actual asset and liability maturities where they differ materially from the underlying contractual maturities. The short-term maturity structure of the Group’s assets and liabilities is managed on a daily basis to ensure that contractual cash flow obligations, and potential cash flows arising from undrawn commitments and other contingent obligations, can be met as they arise from day to day, either from cash inflows from maturing assets, new borrowing or the sale or repurchase of debt securities held.
137
Notes on the accountscontinued
34 Financial instruments(continued)
Short-term liquidity risk is managed on a consolidated basis for the whole Group excluding the activities of Citizens and insurance businesses, which are subject to regulatory regimes that necessitate local management of liquidity.
Internal liquidity mismatch limits are set for all other subsidiaries and non-UK branches which have material local treasury activities in external markets, to ensure those activities do not compromise daily maintenance of the Group’s overall liquidity risk position within the Group’s policy parameters.
The level of large deposits taken from banks, corporate customers, non-bank financial institutions and other customers and significant cash outflows therefrom are also reviewed to monitor concentrations and identify any adverse trends.
Market risk
The Group is exposed to market risk because of positions held in its trading portfolios and its non-trading business including the Group’s treasury operations. The Group manages the market risk in its trading and treasury portfolios through its market risk management framework, which is based on value-at-risk (“VaR”) limits, together with, but not limited to, stress testing, scenario analysis, and position and sensitivity limits. Stress testing measures the impact of abnormal changes in market rates and prices on the fair value of the Group’s trading portfolios. GEMC approves the high-level VaR and stress limits for the Group. The Group Market Risk function, independent from the Group’s trading businesses, is responsible for setting and monitoring the adequacy and effectiveness of the Group’s market risk management processes.
Value-at-risk (“VaR”)
VaR is a technique that produces estimates of the potential negative change in the market value of a portfolio over a specified time horizon at given confidence levels. For internal risk management purposes, the Group’s VaR assumes a time horizon of one day and a confidence level of 95%. The Group uses historical simulation models in computing VaR. This approach, in common with many other VaR models, assumes that risk factor changes observed in the past are a good estimate of those likely to occur in the future and is, therefore, limited by the relevance of the historical data used. The Group’s method, however, does not make any assumption about the nature or type of underlying loss distribution. The Group typically uses the previous two years of market data. The Group’s VaR should be interpreted in light of the limitations of the methodology used. These limitations include:
- Historical data may not provide the best estimate of the jointdistribution of risk factor changes in the future and may failto capture the risk of possible extreme adverse marketmovements which have not occurred in the historical windowused in the calculations.
- VaR using a one-day time horizon does not fully capture themarket risk of positions that cannot be liquidated or hedgedwithin one day.
- VaR using a 95% confidence level does not reflect the extentof potential losses beyond that percentile.
The Group largely computes the VaR of trading portfolios at the close of business and positions may change substantially during the course of the trading day. Controls are in place to limit the Group’s intra-day exposure; such as the calculation of the VaR for selected portfolios. These limitations and the nature of the VaR measure mean that the Group cannot guarantee that losses will not exceed the VaR amounts indicated.
Trading
The principal focus of the Group’s trading activities is client facilitation – providing products to the Group’s client base at competitive prices. The Group also undertakes: market making –quoting firm bid (buy) and offer (sell) prices with the intention of profiting from the spread between the quotes; arbitrage –entering into offsetting positions in different but closely related markets in order to profit from market imperfections; and proprietary activity – taking positions in financial instruments as principal in order to take advantage of anticipated market conditions. The main risk factors are interest rates, credit spreads and foreign exchange. Financial instruments held in the Group’s trading portfolios include, but are not limited to, debt securities, loans, deposits, securities sale and repurchase agreements and derivative financial instruments (futures, forwards, swaps and options). For a discussion of the Group’s accounting policies for derivative financial instruments, see Accounting policies.
The VaR for the Group’s trading portfolios segregated by type of market risk exposure, including idiosyncratic risk, is presented in the table below.
| | 2005 | | 2004 | |
|
|
|
|
|
|
|
|
|
| |
|
|
|
|
|
|
|
| |
| Trading | | Average
£m | | Period end
£m | | | Maximum
£m | | Maximum
£m | | Average
£m | | Period end
£m | | | Maximum
£m | | Maximum
£m | |
|
|
|
|
|
|
|
|
|
|
|
|
|
|
|
|
|
|
| |
| Interest rate | | 7.3 | | 7.4 | | | 10.9 | | 5.1 | | 6.0 | | 5.4 | | | 8.5 | | 4.1 | |
| Credit spread | | 11.4 | | 11.8 | | | 14.4 | | 8.8 | | 8.6 | | 10.4 | | | 12.0 | | 5.1 | |
| Currency | | 1.8 | | 1.4 | | | 10.7 | | 0.5 | | 1.1 | | 1.2 | | | 2.7 | | 0.5 | |
| Equity and commodity | | 0.5 | | 0.7 | | | 1.1 | | 0.2 | | 0.8 | | 0.4 | | | 2.1 | | 0.3 | |
| Diversification | | | | (8.5 | ) | | | | | | | | (6.5 | ) | | | | | |
| | | |
|
| | | | | | | |
|
| | | | | |
| Total trading VaR | | 13.0 | | 12.8 | | | 16.5 | | 9.9 | | 10.6 | | 10.9 | | | 16.0 | | 6.3 | |
| |
|
|
|
|
|
|
|
|
|
|
|
|
|
|
|
|
| |
138
Non-trading
The principal market risks arising from the Group’s non-trading activities are interest rate risk, currency risk and equity risk. Treasury activity and mismatches between the repricing of assets and liabilities in its retail and corporate banking operations account for most of the non-trading interest rate risk. Non-trading currency risk derives from the Group’s investments in overseas subsidiaries, associates and branches. The Group’s venture capital portfolio and investments held by its general insurance business are the principal sources of non-trading equity price risk. The Group’s portfolios of non-trading financial instruments mainly comprise loans (including finance leases), debt securities, equity shares, deposits, certificates of deposits and other debt securities issued, loan capital and derivatives. To reflect their distinct nature, the Group’s long-term assurance assets and liabilities attributable to policyholders have been excluded from these market risk disclosures.
• Interest rate risk
Non-trading interest rate risk arises from the Group’s treasury activities and retail and corporate banking businesses.
Treasury
The Group’s treasury activities include its money market business and the management of internal funds flow within the Group’s businesses. Money market portfolios include cash instruments (principally debt securities, loans and deposits) and related hedging derivatives.
Retail and corporate banking
Structural interest rate risk arises in these activities where assets and liabilities have different repricing dates. It is the Group’s policy to minimise the sensitivity of net interest income to changes in interest rates and where interest rate risk is retained to ensure that appropriate resources, measures and limits are applied.
Structural interest rate risk is calculated in each division on the basis of establishing the repricing behaviour of each asset and liability product. For many products, the actual interest rate repricing characteristics differ from the contractual repricing. In most cases, the repricing maturity is determined by the market interest rate that most closely fits the historical behaviour of the product interest rate. For non-interest bearing current accounts, the repricing maturity is determined by the stability of the portfolio. The repricing maturities used are approved by Group Treasury and divisional asset and liability committees at least annually. Key conventions are reviewed annually by GALCO.
A static maturity gap report is produced as at the month-end for each division, in each functional currency based on the behaviouralised repricing for each product. It is Group policy to include in the gap report, non-financial assets and liabilities, mainly property, plant and equipment and the Group’s capital and reserves, spread over medium and longer term maturities. This report also includes hedge transactions, principally derivatives.
Any residual non-trading interest rate exposures are controlled by limiting repricing mismatches in the individual balance sheets. Potential exposures to interest rate movements in the medium to long term are measured and controlled using a version of the same VaR methodology that is used for the Group’s trading portfolios but without discount factors. Net accrual income exposures are measured and controlled in terms of sensitivity over time to movements in interest rates.
Risk is managed within limits approved by GALCO through the execution of cash and derivative instruments. Execution of the hedging is carried out by the relevant division through the Group’s treasury function. The residual risk position is reported to divisional asset and liability committees, GALCO and Board.
• Currency risk
The Group does not maintain material non-trading open currency positions other than the structural foreign currency translation exposures arising from its investments in foreign subsidiaries and associated undertakings and their related currency funding. The Group’s policy in relation to structural positions is to match fund the structural foreign currency exposure arising from net asset value, including goodwill, in foreign subsidiaries, equity accounted investments and branches, except where doing so would materially increase the sensitivity of either the Group’s or the subsidiary’s regulatory capital ratios to currency movements. The policy requires structural foreign exchange positions to be reviewed regularly by GALCO. Gains or losses on foreign currency investments net of any gains or losses on related foreign currency funding or hedges are recognised in the statement of recognised income and expense.
139
Notes on the accountscontinued
34 Financial instruments(continued)
The tables below set out the Group’s structural foreign currency exposures.
| 2005 | | Net investments
in foreign
operations
£m | | Foreign
currency
borrowings
hedging net
investments
£m | | Structural
foreign
currency
exposures
£m | |
|
|
|
|
|
|
| |
| US dollar | | 15,452 | | 6,637 | | 8,815 | |
| Euro | | 2,285 | | 139 | | 2,146 | |
| Swiss franc | | 431 | | 430 | | 1 | |
| Chinese RMB | | 914 | | — | | 914 | |
| Other non-sterling | | 76 | | 72 | | 4 | |
|
|
|
|
|
|
| |
| | 19,158 | | 7,278 | | 11,880 | |
| |
|
|
|
|
| |
| 2004 | | | | | | | |
|
|
|
|
|
|
| |
| US dollar | | 12,367 | | 6,580 | | 5,787 | |
| Euro | | 2,086 | | 1,349 | | 737 | |
| Swiss franc | | 398 | | 392 | | 6 | |
| Other non-sterling | | 116 | | 112 | | 4 | |
|
|
|
|
|
|
| |
| | 14,967 | | 8,433 | | 6,534 | |
| |
|
|
|
|
| |
The US dollar open structural foreign currency exposure reflects the action taken to mitigate the effect of the acquisition in 2004 of Charter One on the Group’s capital ratios. However, the increase in this position and the Euro structural exposure over 2004 is largely the result of the exclusion from the table of preference shares classified as equity under IFRS. These instruments continue to be considered part of the currency funding of foreign operations for asset and liability management purposes. The exposure in Chinese RMB arises from the Group’s strategic investment in Bank of China.
• Equity risk
Non-trading equity risk arises principally from the Group’s strategic investments, its venture capital activities and its general insurance business.
VaR is not an appropriate risk measure for the Group’s venture capital investments, which comprise a mix of quoted and unquoted investments, or its portfolio of strategic investments. These investments are carried at fair value with changes in fair value recorded in profit or loss, or equity.
Insurance risk
The Group is exposed to insurance risk, either directly through its businesses or through using insurance as a tool to reduce other risk exposures.
Insurance risk is the risk of fluctuations in the timing, frequency and severity of insured events, relative to the expectations of the Group at the time of underwriting.
Underwriting and pricing risk
The Group manages underwriting and pricing risk through underwriting guidelines for all business transacted restricting the types and classes of business that may be accepted; pricing policies by product line and by brand; and centralised control of policy wordings and any subsequent changes.
Claims management risk
The risk that claims are paid inappropriately is managed using a range of IT system controls and manual processes conducted by experienced staff, to ensure that claims are handled in a timely and accurate manner. Detailed policies and procedures exist to ensure that all claims are handled appropriately.
Reinsurance risk
Reinsurance protects against the effect of major catastrophic events or unforeseen volumes of, or adverse trends in, large individual claims and to transfer risk that is outside the Group’s current risk appetite.
Reinsurance is only effective when the counterparty is financially secure. The rating profile of the top ten reinsurers of the Group which accounts for 67% of the total reinsurance debtors is as follows:
| Standard & Poor’s Rating | Number of Reinsurers | |
|
| |
| AAA | 1 | |
| AAA- | 1 | |
| AA | 3 | |
| AA- | 2 | |
| A | 2 | |
| A- | 1 | |
140
Reserving risk
Reserving risk relates to both premiums and claims. It is the risk that reserves are assessed incorrectly such that insufficient funds have been retained to pay or handle claims as the amounts fall due. Claims development data provides information on the historical pattern of reserving risk.
| | Accident year | |
| | |
|
|
|
|
|
|
|
|
|
|
|
|
|
|
|
|
|
| Insurance claims – gross | | 2001
£m | | | 2002
£m | | | 2003
£m | | | 2004
£m | | | 2005
£m | | | Total
£m | |
|
|
|
|
|
|
|
|
|
|
|
|
|
|
|
|
|
|
|
| Estimate of ultimate claims costs: | | | | | | | | | | | | | | | | | | |
| At end of accident year | | 2,395 | | | 3,013 | | | 3,658 | | | 3,705 | | | 4,247 | | | 17,018 | |
| One year later | | (70 | ) | | 91 | | | (140 | ) | | (186 | ) | | — | | | (305 | ) |
| Two years later | | 20 | | | 1 | | | (106 | ) | | — | | | — | | | (85 | ) |
| Three years later | | 12 | | | (12 | ) | | — | | | — | | | — | | | — | |
| Four years later | | (40 | ) | | — | | | — | | | — | | | — | | | (40 | ) |
|
|
|
|
|
|
|
|
|
|
|
|
|
|
|
|
|
|
|
| Current estimate of cumulative claims | | 2,317 | | | 3,093 | | | 3,412 | | | 3,519 | | | 4,247 | | | 16,588 | |
| Cumulative payments to date | | (2,119 | ) | | (2,680 | ) | | (2,637 | ) | | (2,521 | ) | | (2,035 | ) | | (11,992 | ) |
|
|
|
|
|
|
|
|
|
|
|
|
|
|
|
|
|
|
|
| Liability recognised on the balance sheet | | 198 | | | 413 | | | 775 | | | 998 | | | 2,212 | | | 4,596 | |
| |
|
|
|
|
|
|
|
|
|
|
|
|
|
| | | |
| Liability in respect of prior years | | | | | | | | | | | | | | | | | 208 | |
| Claims handling costs | | | | | | | | | | | | | | | | | 109 | |
|
|
|
|
|
|
|
|
|
|
|
|
|
|
|
|
|
|
|
| Total liability included on the balance sheet | | | | | | | | | | | | | | | | | 4,913 | |
| | | | | | | | | | | | | | | | |
|
|
| | Accident year | |
| | |
|
|
|
|
|
|
|
|
|
|
|
|
|
|
|
|
|
| Insurance claims – net of reinsurance | | 2001
£m | | | 2002
£m | | | 2003
£m | | | 2004
£m | | | 2005
£m | | | Total
£m | |
|
|
|
|
|
|
|
|
|
|
|
|
|
|
|
|
|
|
|
| Estimate of ultimate claims costs: | | | | | | | | | | | | | | | | | | |
| At end of accident year | | 2,011 | | | 2,584 | | | 3,215 | | | 3,508 | | | 4,150 | | | 15,468 | |
| One year later | | (61 | ) | | 59 | | | (106 | ) | | (168 | ) | | — | | | (276 | ) |
| Two years later | | 22 | | | (12 | ) | | (103 | ) | | — | | | — | | | (93 | ) |
| Three years later | | 13 | | | (3 | ) | | — | | | — | | | — | | | 10 | |
| Four years later | | (41 | ) | | — | | | — | | | — | | | — | | | (41 | ) |
|
|
|
|
|
|
|
|
|
|
|
|
|
|
|
|
|
|
|
| Current estimate of cumulative claims | | 1,944 | | | 2,628 | | | 3,006 | | | 3,340 | | | 4,150 | | | 15,068 | |
| Cumulative payments to date | | (1,779 | ) | | (2,254 | ) | | (2,342 | ) | | (2,367 | ) | | (2,008 | ) | | (10,750 | ) |
|
|
|
|
|
|
|
|
|
|
|
|
|
|
|
|
|
|
|
| Liability recognised on the balance sheet | | 165 | | | 374 | | | 664 | | | 973 | | | 2,142 | | | 4,318 | |
| |
|
|
|
|
|
|
|
|
|
|
|
|
|
| | | |
| Liability in respect of prior years | | | | | | | | | | | | | | | | | 138 | |
| Claims handling costs | | | | | | | | | | | | | | | | | 109 | |
|
|
|
|
|
|
|
|
|
|
|
|
|
|
|
|
|
|
|
| Total liability included on the balance sheet | | | | | | | | | | | | | | | | | 4,565 | |
| | | | | | | | | | | | | | | | |
|
|
141
Notes on the accountscontinued
34 Financial instruments(continued)
Claims reserves
It is the Group’s policy to hold undiscounted claims reserves (including reserves to cover claims which have occurred but not been reported (IBNR reserves)) for all classes at a sufficient level to meet all liabilities as they fall due.
The Group’s focus is on high volume and relatively straightforward products, for example home and motor. This facilitates the generation of comprehensive underwriting and claims data, which is used to monitor and accurately price the risks accepted. This attention to data analysis is reinforced by tight controls on costs and claims handling procedures.
The following table indicates the diversity of risks underwritten, the frequency and severity of claims and the corresponding loss ratios for each major class of business, gross and net of reinsurance.
| | | | 2005 | | 2004 | |
| | | |
|
|
|
|
| |
|
|
|
|
| |
| | | | Earned
premiums
£m | | Claims
incurred
£m | | Loss
ratio
% | | Earned
premiums
£m | | Claims
incurred
£m | | Loss
ratio
% | |
|
|
|
|
|
|
|
|
|
|
|
|
|
|
| |
| Residential property | | Gross | | 1,098 | | 602 | | 55 | | 1,090 | | 599 | | 55 | |
| | Net | | 1,037 | | 580 | | 56 | | 990 | | 578 | | 58 | |
| Personal motor | | Gross | | 3,312 | | 2,603 | | 79 | | 3,179 | | 2,506 | | 79 | |
| | Net | | 3,257 | | 2,601 | | 80 | | 2,976 | | 2,360 | | 79 | |
| Commercial property | | Gross | | 212 | | 82 | | 39 | | 191 | | 77 | | 40 | |
| | Net | | 193 | | 77 | | 40 | | 173 | | 73 | | 42 | |
| Commercial motor | | Gross | | 102 | | 54 | | 53 | | 93 | | 71 | | 76 | |
| | Net | | 96 | | 44 | | 46 | | 87 | | 59 | | 68 | |
| Creditor | | Gross | | 157 | | 87 | | 55 | | 143 | | 74 | | 52 | |
| | Net | | 156 | | 87 | | 56 | | 142 | | 74 | | 52 | |
| Other | | Gross | | 696 | | 455 | | 65 | | 811 | | 499 | | 62 | |
| | Net | | 605 | | 426 | | 70 | | 685 | | 414 | | 60 | |
|
|
|
|
|
|
|
|
|
|
|
|
|
|
| |
| Total | | Gross | | 5,577 | | 3,883 | | 70 | | 5,507 | | 3,826 | | 69 | |
| | | |
|
|
|
|
|
|
|
|
|
|
| |
| | Net | | 5,344 | | 3,815 | | 71 | | 5,053 | | 3,558 | | 70 | |
| | | |
|
|
|
|
|
|
|
|
|
|
| |
The Group has no interest rate exposure from general insurance liabilities because provisions for claims under short term insurance contracts are not discounted.
Frequency and severity of specific risks and sources of uncertainty
Most general insurance contracts written by the Group are issued on an annual basis, which means that the Group’s liability extends for a 12 month period, after which the Group is entitled to decline or renew or can impose renewal terms by amending the premium or excess or both.
The following paragraphs explain the frequency and severity of claims and the sources of uncertainty for the key classes that the Group is exposed to:
a) Motor insurance contracts (private and commercial)
Claims experience is quite variable, due to a wide number of factors, but the principal ones of these are age of driver, type of vehicle and use.
There are many sources of uncertainty that will affect the Group's experience under motor insurance, including operational risk, reserving risk, premium rates not matching claims inflation rates, the social, economic and legislative environment and reinsurance failure risks.
b) Property insurance contracts (residential and commercial)
The major causes of claims for property insurance are theft, flood, escape of water, fire, storm, subsidence and various types of accidental damage.
The major source of uncertainty in the Group’s property accounts is the volatility of weather. Weather in the UK can affect most of the above perils. Over a longer period, the strength of the economy is also a factor.
c) Commercial other insurance contracts
Other commercial claims come mainly from business interruption and loss arising from the negligence of the insured (liability insurance). Business interruption losses come from the loss of income, revenue and/or profit as a result of property damage claims. Liability insurance comprises employers liability and public/products liability. Liability insurance is written on an occurrence basis, and is subject to claims over a substantial period of time, but where loss was in existence during the life of the policy.
Fluctuations in the social and economic climate are a source of uncertainty in the Group’s general liability account. Other sources of uncertainty are changes in the law, or its interpretation, and changes in the actuarial estimates underlying long-term claims. Other uncertainties are significant events (for example terrorist attacks) and any emerging new heads of damage, types of claim that are not envisaged when the policy is written.
142
d) Creditor insurance
Creditor insurance contracts are designed to cover payments on secured or unsecured lending. These contracts will be for a maximum term of 5 years. The causes of creditor insurance claims are loss of income through accident, sickness or unemployment or, in some circumstances, loss of life.
The main source of uncertainty affecting the Group's creditor accounts is the economic environment.
Life business
The three regulated life companies of RBSG, NatWest Life Assurance Limited, Royal Scottish Assurance plc (“RSA”) and Direct Line Life Limited, are required to meet minimum capital requirements at all times under the Financial Service Authority’s Prudential Sourcebook. The capital resources covering the regulatory requirement are not transferable to other areas of the Group. To ensure that the capitalrequirement is satisfied at all times, each company holds an additional voluntary buffer above the absolute minimum. Sufficient capital resources are held to ensure that the capital requirements are covered over a two year projection period. Life insurance results are inherently uncertain, due to actual experience being different to modelled assumptions. Such differences affect regulatory capital resources, as do varying levels of new business. Therefore, projections are formally reviewed twice a year. Where there is a shortfall of capital, various options are available to provide new capital.
The Group is not exposed to price, currency, credit, or interest risk on unit linked life contracts but it is exposed to variation in management fees. A decrease of 10% in the value of the assets would reduce the asset management fees by £5 million per annum (2004 – £5 million). The Group also writes insurance contracts with minimum guaranteed death benefits that expose it to the risk that declines in the value of underlying investments may increase the Group’s net exposure to death risk.
| Valuation discount rates | | 2005 | | | 2004 | |
|
|
|
|
|
|
|
| Assurances | | | | | | |
| Life policies | | 2.85% | | | 3.00% | |
| Pensions policies | | 3.80% | | | 4.00% | |
| Annuities in payment (all reinsured) | | 4.00% | | | 4.67% | |
| Interest rates | | | | | | |
| Sterling interest | | 2.85% net | | | 3.0% net | |
| Unit growth | | 2.85% net | | | 3.0% net | |
| Expense inflation | | 4.0% net | | | 4.0% net | |
|
|
|
|
|
|
|
Mortality assumptions are set with regard to recent experience and general industry trends.
| Mortality tables used: | | |
| Pre-2001 products – RSA | | |
|
|
|
| Term assurances | | 72% AM80 ult -2 + 33% AIDS R6A |
| Unit-linked life assurances | | 76.5% / 72% AM80 ult.-2+ 33% AIDS R6A |
| Unit-linked pensions | | 90% AM80 ult.-2 |
|
|
|
| | | |
| Pre-2000 products – NatWest Life | | |
|
|
|
| Term assurances | | 65% TM80 ultimate + 33% AIDS R6A |
| Unit-linked assurances | | 60% AM80 ult. |
|
|
|
| Rates above are for male, non-smokers. | | |
| | | |
| Post-2000 products | | |
|
|
|
| Term assurances | | 60% TM80 ult + 33% AIDS R6A |
|
|
|
| Expenses: | | | | | | | |
| Pre-2000 products – RSA | | | 2005
per annum | | | 2004
per annum | |
|
|
|
|
|
|
| |
| Lifestyle protection plan | | £ | 29.81 | | £ | 27.17 | |
| Mortgage savings plan | | £ | 67.05 | | £ | 60.08 | |
|
|
|
|
|
|
| |
| | | | | | | | |
| Pre-2000 products – NatWest Life | | | | | | | |
|
|
|
|
|
|
| |
| Term assurances | | £ | 26.79 | | £ | 25.13 | |
| Single premium unit-linked bonds | | £ | 23.86 | | £ | 22.38 | |
|
|
|
|
|
|
| |
| | | | | | | | |
| Post-2000 products | | | | | | | |
|
|
|
|
|
|
| |
| Term assurances | | £ | 23.97 | | £ | 22.38 | |
| Guaranteed bonds | | £ | 26.92 | | £ | 25.13 | |
|
|
|
|
|
|
| |
143
Notes on the accountscontinued34 Financial instruments(continued)
Frequency and severity of claims– for contracts where death is the insured risk, the most significant factors that could increase the overall frequency of claims are epidemics or wide spread changes in lifestyle, resulting in earlier or more claims than expected.
For contracts where survival is the insured risk, the most significant factor is continued improvement in medical science and social conditions that would increase longevity.
For contracts with fixed and guaranteed benefits and fixed future premiums, there are no mitigating terms and conditions that reduce the insurance risk accepted. Participating contracts can result in a significant portion of the insurance risk being shared with the insured party.
Sources of uncertainty in the estimation of future benefit payments and premium receipts– the Group uses base tables of standard mortality appropriate to the type of contract being written and the territory in which the insured person resides. These are adjusted to reflect the Group’s experience, mortality improvements and voluntary termination behaviour.
| Sensitivity factor | | Description of sensitivity factor applied |
|
|
|
| Interest rate and investment return | | Change in market interest rates of ± 1%. |
| | The test allows consistently for similar changes to investment returns and |
| | movements in the market value of backing fixed interest securities. |
|
|
|
| Expenses | | Increase in maintenance expenses of 10% |
|
|
|
| Assurance mortality/morbidity | | Increase in mortality/morbidity rates for assurance contracts of 5% |
|
|
|
| Annuitant mortality | | Reduction in mortality rates for annuity contracts of 5% |
|
|
|
The above sensitivity factors are applied via actuarial and statistical models, with the following impact on the financial statements.| Risk factor | | Variability | | Impact
on profit
and equity
£m | |
|
|
|
|
|
|
| Interest rates | | +1% | | (16 | ) |
| Interest rates | | –1% | | 20 | |
| Expenses | | +10% | | (5 | ) |
| Assurance mortality/morbidity | | +5% | | (7 | ) |
| Annuitant mortality | | – 5% | | — | |
|
|
|
|
|
|
Limitations of sensitivity analysis: the above tables demonstrate the effect of a change in a key assumption whilst other assumptions remain unaffected. In reality, such an occurrence is unlikely, due to correlation between the assumptions and other factors. It should also be noted that these sensitivities are non-linear, and larger or smaller impacts should not be interpolated or extrapolated from these results. The sensitivity analyses do not take into consideration that assets andliabilities are actively managed and may vary at the time that any actual market movement occurs.
Purchased insurance
The Insurance Sourcing Department is responsible to GEMC for the Group-wide purchase of insurance as a means of reducing other risk exposures.
144
| | | Group | |
| Remaining maturity | |
| |
2005 | | 1 month
or less
£m | | Within 3 months
£m | | 3-12 months
£m | | 1-5 years
£m | | Over 5 years
£m | | Equity shares
£m | | Total
£m | |
|
|
|
|
|
|
|
|
|
|
|
|
|
|
| |
| Assets | | | | | | | | | | | | | | | |
| Cash and balances at central banks | | 4,759 | | — | | — | | — | | — | | — | | 4,759 | |
| Treasury bills and other eligible bills | | 779 | | 1,252 | | 3,507 | | — | | — | | — | | 5,538 | |
| Loans and advances to banks | | 46,276 | | 14,959 | | 8,749 | | 265 | | 338 | | — | | 70,587 | |
| Loans and advances to customers | | 139,732 | | 48,881 | | 42,485 | | 66,488 | | 119,640 | | — | | 417,226 | |
| Debt securities | | 2,635 | | 8,289 | | 11,472 | | 25,621 | | 72,948 | | — | | 120,965 | |
| Equity shares | | — | | — | | — | | — | | — | | 9,301 | | 9,301 | |
| Settlement balances | | 6,005 | | — | | — | | — | | — | | — | | 6,005 | |
| Derivatives at fair value | | 4,816 | | 7,282 | | 11,778 | | 31,667 | | 40,120 | | — | | 95,663 | |
| | | | | | | | | | | | | | | | |
| Liabilities | | | | | | | | | | | | | | | |
| Deposits by banks | | 69,393 | | 17,876 | | 13,293 | | 8,264 | | 1,581 | | — | | 110,407 | |
| Customer accounts | | 286,960 | | 28,582 | | 14,516 | | 8,172 | | 4,637 | | — | | 342,867 | |
| Debt securities in issue | | 20,577 | | 23,297 | | 24,253 | | 14,986 | | 7,307 | | — | | 90,420 | |
| Settlement balances and short positions | | 16,533 | | 569 | | 1,696 | | 15,950 | | 9,240 | | — | | 43,988 | |
| Derivatives at fair value | | 4,962 | | 6,733 | | 12,740 | | 32,067 | | 39,936 | | — | | 96,438 | |
| Subordinated liabilities | | 539 | | 418 | | 3,075 | | 7,122 | | 17,120 | | — | | 28,274 | |
|
|
|
|
|
|
|
|
|
|
|
|
|
|
| |
| | | | | | | | | | | | | | | | |
| 2004 | | | | | | | | | | | | | | | |
|
|
|
|
|
|
|
|
|
|
|
|
|
|
| |
| Assets | | | | | | | | | | | | | | | |
| Cash and balances at central banks | | 4,293 | | — | | — | | — | | — | | — | | 4,293 | |
| Treasury bills and other eligible bills | | 2,201 | | 2,555 | | 1,354 | | — | | — | | — | | 6,110 | |
| Loans and advances to banks | | 36,482 | | 11,867 | | 11,902 | | 266 | | 556 | | — | | 61,073 | |
| Loans and advances to customers | | 103,672 | | 32,403 | | 38,990 | | 54,788 | | 117,398 | | — | | 347,251 | |
| Debt securities | | 2,002 | | 2,967 | | 11,635 | | 18,267 | | 59,037 | | — | | 93,908 | |
| Equity shares | | — | | — | | — | | — | | — | | 4,723 | | 4,723 | |
| Settlement balances | | 5,682 | | — | | — | | — | | — | | — | | 5,682 | |
| Derivatives at fair value | | 1,082 | | 1,538 | | 3,076 | | 6,230 | | 5,874 | | — | | 17,800 | |
| | | | | | | | | | | | | | | | |
| Liabilities | | | | | | | | | | | | | | | |
| Deposits by banks | | 65,489 | | 18,888 | | 10,474 | | 3,675 | | 1,357 | | — | | 99,883 | |
| Customer accounts | | 232,982 | | 25,801 | | 15,502 | | 7,803 | | 1,227 | | — | | 283,315 | |
| Debt securities in issue | | 15,505 | | 24,711 | | 13,852 | | 8,261 | | 1,670 | | — | | 63,999 | |
| Settlement balances and short positions | | 4,738 | | 577 | | 282 | | 19,486 | | 7,907 | | — | | 32,990 | |
| Derivatives at fair value | | 1,148 | | 1,570 | | 3,322 | | 6,606 | | 6,230 | | — | | 18,876 | |
| Subordinated liabilities | | — | | 1,135 | | 596 | | 4,481 | | 14,154 | | — | | 20,366 | |
|
|
|
|
|
|
|
|
|
|
|
|
|
|
| |
145
Notes on the accountscontinued
34 Financial instruments (continued)
| Remaining maturity | | Company | |
| |
| |
| 2005 | | 1 month
or less
£m | | 1-3 month
£m | | 3-12 month
£m | | 1-5 years
£m | | Over 5 years
£m | | Total
£m | |
|
|
|
|
|
|
|
|
|
|
|
|
| |
| Assets | | | | | | | | | | | | | |
| Loans and advances to banks | | 435 | | 1,476 | | 780 | | 1,510 | | 4,921 | | 9,122 | |
| Loans and advances to customers | | — | | — | | — | | 262 | | 305 | | 567 | |
| Derivatives at fair value | | — | | — | | — | | 55 | | — | | 55 | |
| | | | | | | | | | | | | | |
| Liabilities | | | | | | | | | | | | | |
| Deposits by banks | | 32 | | 919 | | — | | — | | — | | 951 | |
| Customer accounts | | — | | 55 | | — | | — | | — | | 55 | |
| Debt securities in issue | | 909 | | 2,033 | | — | | — | | — | | 2,942 | |
| Subordinated liabilities | | 189 | | 311 | | 1,008 | | 1,653 | | 6,081 | | 9,242 | |
|
|
|
|
|
|
|
|
|
|
|
|
| |
| | | | | | | | | | | | | | |
| 2004 | | | | | | | | | | | | | |
|
|
|
|
|
|
|
|
|
|
|
|
| |
| Assets | | | | | | | | | | | | | |
| Loans and advances to banks | | 196 | | 664 | | 351 | | 680 | | 2,215 | | 4,106 | |
| Loans and advances to customers | | — | | — | | — | | — | | 305 | | 305 | |
| | | | | | | | | | | | | | |
| Liabilities | | | | | | | | | | | | | |
| Deposits by banks | | 174 | | — | | — | | — | | — | | 174 | |
| Debt securities in issue | | 197 | | 394 | | 517 | | 500 | | — | | 1,608 | |
| Subordinated liabilities | | — | | — | | 368 | | 731 | | 4,836 | | 5,935 | |
|
|
|
|
|
|
|
|
|
|
|
|
| |
146
Interest rate sensitivity
The following tables summarise the interest rate sensitivity gap for the Group and the company at 31 December 2005 and 31 December 2004. The tables show the contractual repricing for each category of asset, liability and off-balance sheet items in the banking book. A liability (or negative) gap position exists when liabilities reprice more quickly or in greater proportion than assets during a given period and tends to benefit net interest income in a declining interest rate environment. An asset (or positive) gap position exists when assets reprice more quickly or in greater proportion than liabilities during a given period and tends to benefit net interest income in a rising interest rate environment. Contractual repricing terms do not reflect the potential impact of early repayment or withdrawal. Positions may not be reflective of those in subsequent periods. Major changes in positions can be made promptly as market outlooks change. In addition, significant variations in interest rate sensitivity may exist within the re-pricing periods presented and among the currencies in which the Group has interest rate positions.
| | | Group |
| | |
|
|
|
|
|
|
|
|
|
|
|
|
|
|
|
|
|
|
|
|
|
|
|
| 2005 | | 3 months or less
£m | | After 3 months but less than 6 months
£m | | After 6 months but less than 1 year
£m | | After 1 year but less than 5 years
£m | | Over 5 years
£m | | Total interest earning/ bearing
£m | | Yield
% | | Non interest earning/ bearing
£m | | Fair value through profit or loss
£m | | Banking book total £m | | Trading book total £m | | Total
£m |
|
|
|
|
|
|
|
|
|
|
|
|
|
|
|
|
|
|
|
|
|
|
|
|
|
| Assets | | | | | | | | | | | | | | | | | | | | | | | | |
| Loans and advances | | | | | | | | | | | | | | | | | | | | | | | | |
| to banks | | 15,843 | | 2,100 | | 2,293 | | 85 | | 69 | | 20,390 | | 3.71 | | 4,241 | | 282 | | 24,913 | | 45,674 | | 70,587 |
| Loans and advances | | | | | | | | | | | | | | | | | | | | | | | | |
| to customers | | 231,730 | | 14,063 | | 13,045 | | 49,078 | | 32,789 | | 340,705 | | 5.51 | | 15,274 | | 616 | | 356,595 | | 60,631 | | 417,226 |
| Debt securities and | | | | | | | | | | | | | | | | | | | | | | | | |
| treasury bills | | 12,416 | | 3,362 | | 994 | | 4,765 | | 16,857 | | 38,394 | | 3.81 | | 469 | | 3,991 | | 42,854 | | 83,649 | | 126,503 |
| Other assets | | — | | — | | — | | — | | — | | — | | | | 54,952 | | 2,541 | | 57,493 | | 105,018 | | 162,511 |
|
|
|
|
|
|
|
|
|
|
|
|
|
|
|
|
|
|
|
|
|
|
|
|
|
| Total assets | | 259,989 | | 19,525 | | 16,332 | | 53,928 | | 49,715 | | 399,489 | | 5.26 | | 74,936 | | 7,430 | | 481,855 | | 294,972 | | 776,827 |
| | |
|
|
|
|
|
|
|
|
|
|
|
|
|
|
|
|
|
|
|
|
|
|
|
| Liabilities and equity | | | | | | | | | | | | | | | | | | | | | | | | |
| Deposits by banks | | 54,515 | | 2,880 | | 1,507 | | 776 | | 968 | | 60,646 | | 3.97 | | 2,123 | | — | | 62,769 | | 47,638 | | 110,407 |
| Customer accounts | | 232,221 | | 5,715 | | 8,141 | | 7,332 | | 2,909 | | 256,318 | | 2.57 | | 37,817 | | 3,683 | | 297,818 | | 45,049 | | 342,867 |
| Debt securities in issue | | 65,055 | | 4,212 | | 3,586 | | 957 | | 1,140 | | 74,950 | | 4.18 | | 7 | | 11,068 | | 86,025 | | 4,395 | | 90,420 |
| Subordinated liabilities | | 3,965 | | 1,492 | | 116 | | 5,749 | | 16,339 | | 27,661 | | 6.84 | | 110 | | 150 | | 27,921 | | 353 | | 28,274 |
| Other liabilities | | — | | — | | — | | — | | — | | — | | | | 29,576 | | — | | 29,576 | | 139,848 | | 169,424 |
| Shareholders’ equity | | — | | — | | — | | — | | — | | — | | | | 33,775 | | — | | 33,775 | | 1,660 | | 35,435 |
| Internal funding of | | | | | | | | | | | | | | | | | | | | | | | | |
| trading business | | (48,506 | ) | (4,913 | ) | (1,800 | ) | (9 | ) | — | | (55,228 | ) | 3.83 | | (801 | ) | — | | (56,029 | ) | 56,029 | | — |
|
|
|
|
|
|
|
|
|
|
|
|
|
|
|
|
|
|
|
|
|
|
|
|
|
| Total liabilities and equity | | 307,250 | | 9,386 | | 11,550 | | 14,805 | | 21,356 | | 364,347 | | 3.82 | | 102,607 | | 14,901 | | 481,855 | | 294,972 | | 776,827 |
| | |
|
|
|
|
|
|
|
|
|
|
|
|
|
|
|
|
|
|
|
|
|
|
|
| Interest rate swaps | | (13,537 | ) | (2,849 | ) | (1,508 | ) | 1,182 | | 16,712 | | — | | | | — | | — | | | | | | |
| | |
|
|
|
|
|
|
|
|
|
|
|
|
|
|
|
|
|
| | | | | |
| interest rate sensitivity gap | | (60,798 | ) | 7,290 | | 3,274 | | 40,305 | | 45,071 | | 35,142 | | | | (27,671 | ) | (7,471 | ) | | | | | |
| | |
|
|
|
|
|
|
|
|
|
|
|
|
|
|
|
|
|
| | | | | |
| Cumulative interest rate | | | | | | | | | | | | | | | | | | | | | | | | |
| sensitivity gap | | (60,798 | ) | (53,508 | ) | (50,234 | ) | (9,929 | ) | 35,142 | | 35,142 | | | | 7,471 | | | | | | | | |
| | |
|
|
|
|
|
|
|
|
|
|
|
|
|
|
|
| | | | | | | |
Trading book
The table below sets out by time band the net effect on the Group’s profit or loss of a basis point (0.01%) increase in interest rates, assuming all trading positions remained unchanged.
| | | Group | |
| | |
| |
| 2005 | | 3 months or less £’000 | | After 3 months but less than 6 months £’000 | | After 6 months but less than 1 year
£’000 | | After 1 year but less than 5 years £’000 | | Over 5 years £’000 | | Total
£’000 | |
|
|
|
|
|
|
|
|
|
|
|
|
|
|
| (Loss)/gain per basis point increase | | (487 | ) | (40 | ) | 180 | | (1,631 | ) | 1,146 | | (832 | ) |
|
|
|
|
|
|
|
|
|
|
|
|
|
|
147
Notes on the accounts continued
34 Financial instruments(continued)| | Group |
| | |
|
|
|
|
|
|
|
|
|
|
|
|
|
|
|
|
|
| 2004 | | 3 months or less
£m | | After 3 months but less than 6 months
£m | | After 6 months but less than i year
£m | | After 1 year but less than 5 year
£m | | Over 5 years
£m | | Non
Interest
earning/
bearing
£m | | Banking
book
total
£m | | Trading
book
total
£m | | Total
£m |
|
|
|
|
|
|
|
|
|
|
|
|
|
|
|
|
|
|
|
| Assets | | | | | | | | | | | | | | | | | | |
| Loans and advances to banks | | 14,829 | | 5,140 | | 1,367 | | 77 | | 482 | | 3,272 | | 25,167 | | 35,906 | | 61,073 |
| Loans and advances to customers | | 191,796 | | 16,632 | | 11,177 | | 34,687 | | 28,419 | | 2,304 | | 285,015 | | 62,236 | | 347,251 |
| Debt securities and treasury bills | | 12,530 | | 4,088 | | 3,656 | | 6,133 | | 13,548 | | 2,416 | | 42,371 | | 57,647 | | 100,018 |
| Other assets | | — | | — | | — | | — | | — | | 54,871 | | 54,871 | | 24,909 | | 79,780 |
|
|
|
|
|
|
|
|
|
|
|
|
|
|
|
|
|
|
|
| Total assets | | 219,155 | | 25,860 | | 16,200 | | 40,897 | | 42,449 | | 62,863 | | 407,424 | | 180,698 | | 588,122 |
| |
|
|
|
|
|
|
|
|
|
|
|
|
|
|
|
|
|
| Liabilities and equity | | | | | | | | | | | | | | | | | | |
| Deposits by banks | | 54,679 | | 2,282 | | 907 | | 119 | | 477 | | 1,737 | | 60,201 | | 39,682 | | 99,883 |
| Customer accounts | | 190,796 | | 5,589 | | 6,948 | | 7,043 | | 461 | | 31,345 | | 242,182 | | 41,133 | | 283,315 |
| Debt securities in issue | | 45,903 | | 6,104 | | 4,418 | | 4,087 | | 1,727 | | — | | 62,239 | | 1,760 | | 63,999 |
| Subordinated liabilities | | 4,401 | | 1,020 | | 302 | | 2,151 | | 12,438 | | — | | 20,312 | | 54 | | 20,366 |
| Other liabilities | | 4 | | 5 | | 8 | | 49 | | 126 | | 33,469 | | 33,661 | | 52,993 | | 86,654 |
| Shareholders’ equity | | — | | — | | — | | — | | — | | 32,755 | | 32,755 | | 1,150 | | 33,905 |
| Internal funding of trading business | | (42,516 | ) | (313 | ) | (1,088 | ) | (9 | ) | — | | — | | (43,926 | ) | 43,926 | | — |
|
|
|
|
|
|
|
|
|
|
|
|
|
|
|
|
|
|
|
| Total liabilities and equity | | 253,267 | | 14,687 | | 11,495 | | 13,440 | | 15,229 | | 99,306 | | 407,424 | | 180,698 | | 588,122 |
| |
|
|
|
|
|
|
|
|
|
|
|
|
|
|
|
|
|
| Off-balance sheet items | | (2,126) | | (6,906 | ) | (1,160 | ) | 1,560 | | 8,632 | | — | | | | | | |
| |
|
|
|
|
|
|
|
|
|
|
| | | | | | |
| interest rate sensitivity gap | | (36,238 | ) | 4,267 | | 3,545 | | 29,017 | | 35,852 | | (36,443 | ) | | | | | |
| |
|
|
|
|
|
|
|
|
|
|
| | | | | | |
| Cumulative interest rate sensitivity gap | | (36,238 | ) | (31,971 | ) | (28,426 | ) | 591 | | 36,443 | | | | | | | | |
| |
|
|
|
|
|
|
|
|
| | | | | | | | |
148
| | | | | | | | | | | | | | | Company | | | | | | | | | | | | | |
| | |
| |
| 2005 | | 3 months or less
£m | | | After 3 months but less than 6 months
£m | | | After 6 months but less than 1 year
£m | | | After 1 year but less than 5 years
£m | | | Over 5 years
£m | | | Total interest
earning/
bearing
£m | | | Yield
% | | | Non interest
earning/
bearing
£m | | | Banking
Book
Total
£m | |
|
|
|
|
|
|
|
|
|
|
|
|
|
|
|
|
|
|
|
|
|
|
|
|
|
|
| |
| Assets | | | | | | | | | | | | | | | | | | | | | | | | | | | |
| Loans and advances to banks | | 1,803 | | | 554 | | | 119 | | | 1,585 | | | 5,061 | | | 9,122 | | | 6.05 | | | — | | | 9,122 | |
| Loans and advances to customers | | 305 | | | — | | | — | | | 262 | | | — | | | 567 | | | 2.82 | | | — | | | 567 | |
| Investment in subsidiaries | | — | | | — | | | — | | | — | | | — | | | — | | | — | | | 20,851 | | | 20,851 | |
| Other assets | | — | | | — | | | — | | | — | | | — | | | — | | | — | | | 202 | | | 202 | |
|
|
|
|
|
|
|
|
|
|
|
|
|
|
|
|
|
|
|
|
|
|
|
|
|
|
| |
| Total assets | | 2,108 | | | 554 | | | 119 | | | 1,847 | | | 5,061 | | | 9,689 | | | 5.86 | | | 21,053 | | | 30,742 | |
| |
|
|
|
|
|
|
|
|
|
|
|
|
|
|
|
|
|
|
|
|
|
|
|
|
| |
| Liabilities and equity | | | | | | | | | | | | | | | | | | | | | | | | | | | |
| Deposits by banks | | 951 | | | — | | | — | | | — | | | — | | | 951 | | | 4.42 | | | — | | | 951 | |
| Customer accounts | | 55 | | | — | | | — | | | — | | | — | | | 55 | | | — | | | — | | | 55 | |
| Debt securities in issue | | 2,942 | | | — | | | — | | | — | | | — | | | 2,942 | | | 4.55 | | | — | | | 2,942 | |
| Other liabilities | | — | | | — | | | — | | | — | | | — | | | — | | | — | | | 14 | | | 14 | |
| Subordinated liabilities | | 1,317 | | | 567 | | | 116 | | | 1,603 | | | 5,639 | | | 9,242 | | | 6.83 | | | — | | | 9,242 | |
| Shareholders’ equity | | — | | | — | | | — | | | — | | | — | | | — | | | — | | | 17,538 | | | 17,538 | |
|
|
|
|
|
|
|
|
|
|
|
|
|
|
|
|
|
|
|
|
|
|
|
|
|
|
| |
| Total liabilities and equity | | 5,265 | | | 567 | | | 116 | | | 1,603 | | | 5,639 | | | 13,190 | | | 6.12 | | | 17,552 | | | 30,742 | |
| |
|
|
|
|
|
|
|
|
|
|
|
|
|
|
|
|
|
|
|
|
|
|
|
|
| |
| | | | | | | | | | | | | | | | | | | | | | | | | | | | |
| Interest rate swaps | | — | | | — | | | — | | | — | | | — | | | — | | | | | | — | | | | |
| | |
|
|
|
|
|
|
|
|
|
|
|
|
|
|
|
|
|
|
|
|
|
| | | | |
| interest rate sensitivity gap | | (3,157 | ) | | (13 | ) | | 3 | | | 244 | | | (578 | ) | | (3,501 | ) | | | | | 3,501 | | | | |
| | |
|
|
|
|
|
|
|
|
|
|
|
|
|
|
|
|
|
|
|
|
|
| | | | |
| Cumulative interest rate sensitivity gap | | (3,157 | ) | | (3,170 | ) | | (3,167 | ) | | (2,923 | ) | | (3,501 | ) | | (3,501 | ) | | | | | | | | | |
| | |
|
|
|
|
|
|
|
|
|
|
|
|
|
|
|
|
| | | | | | | | | |
149
Notes on the accountscontinued
34 Financial instruments(continued)
The following table shows the carrying values and the fair values of financial instruments on the balance sheets.
| | Group | | Company | |
| |
| |
| |
| | 2005
Carrying
value
£m | | 2005
Fair
value
£m | | 2004
Carrying
value
£m | | 2004
Fair
value
£m | | 2005
Carrying
value
£m | | 2005
Fair
value
£m | | 2004
Carrying
value
£m | | 2004
Fair
value
£m | |
|
|
|
|
|
|
|
|
|
|
|
|
|
|
|
|
| |
| Financial assets | | | | | | | | | | | | | | | | | |
| Cash and balances at central banks | | 4,759 | | 4,759 | | 4,293 | | 4,293 | | — | | — | | — | | — | |
| | |
|
|
|
|
|
|
|
|
|
|
|
|
|
|
| |
| | | | | | | | | | | | | | | | | | |
| Treasury bills and other eligible bills | | | | | | | | | | — | | — | | | | | |
| Held-for-trading | | 3,004 | | 3,004 | | | | | | — | | — | | | | | |
| Available-for-sale | | 2,534 | | 2,534 | | | | | | — | | — | | | | | |
| | | | | | | | | | | | | | | | | | |
| Banking business | | | | | | 3,189 | | 3,189 | | | | | | — | | — | |
| Trading business | | | | | | 2,921 | | 2,921 | | | | | | — | | — | |
| | |
|
|
|
|
|
|
|
|
|
|
|
|
|
|
| |
| | 5,538 | | 5,538 | | 6,110 | | 6,110 | | — | | — | | — | | — | |
| | |
|
|
|
|
|
|
|
|
|
|
|
|
|
|
| |
| | | | | | | | | | | | | | | | | | |
| Loans and advance to banks | | | | | | | | | | | | | | | | | |
| Held-for-trading | | 44,965 | | 44,965 | | | | | | — | | — | | | | | |
Designated as at fair value
through profit or loss | | 282 | | 282 | | | | | | — | | — | | | | | |
| Loans and receivables | | 25,340 | | 25,336 | | | | | | 9,122 | | 9,122 | | | | | |
| | | | | | | | | | | | | | | | | | |
| Banking business | | | | | | 25,167 | | 25,111 | | | | | | 4,106 | | 4,106 | |
| Trading business | | | | | | 35,906 | | 35,906 | | | | | | — | | — | |
| | |
|
|
|
|
|
|
|
|
|
|
|
|
|
|
| |
| | 70,587 | | 70,583 | | 61,073 | | 61,017 | | 9,122 | | 9,122 | | 4,106 | | 4,106 | |
| | |
|
|
|
|
|
|
|
|
|
|
|
|
|
|
| |
| | | | | | | | | | | | | | | | | | |
| Loans and advance to customers | | | | | | | | | | | | | | | | | |
| Held-for-trading | | 53,963 | | 53,963 | | | | | | — | | — | | | | | |
Designated as at fair value
through profit or loss | | 616 | | 616 | | | | | | — | | — | | | | | |
| Loans and receivables | | 350,960 | | 354,670 | | | | | | 567 | | 567 | | | | | |
| Finance leases | | 11,687 | | 11,687 | | | | | | — | | — | | | | | |
| | | | | | | | | | | | | | | | | | |
| Banking business | | | | | | 285,015 | | 287,289 | | | | | | 305 | | 305 | |
| Trading business | | | | | | 62,236 | | 62,236 | | | | | | — | | — | |
| | |
|
|
|
|
|
|
|
|
|
|
|
|
|
|
| |
| | 417,226 | | 420,936 | | 347,251 | | 349,525 | | 567 | | 567 | | 305 | | 305 | |
| | |
|
|
|
|
|
|
|
|
|
|
|
|
|
|
| |
| | | | | | | | | | | | | | | | | | |
| Debt securities | | | | | | | | | | | | | | | | | |
| Held-for-trading | | 80,653 | | 80,653 | | | | | | — | | — | | | | | |
Designated as at fair value
through profit or loss | | 3,991 | | 3,991 | | | | | | — | | — | | | | | |
| Available-for-sale | | 35,533 | | 35,533 | | | | | | — | | — | | | | | |
| Loans and receivables | | 788 | | 788 | | | | | | — | | — | | | | | |
| | | | | | | | | | | | | | | | | | |
| Banking business | | | | | | 39,182 | | 38,998 | | | | | | — | | — | |
| Trading business | | | | | | 54,726 | | 54,726 | | | | | | — | | — | |
| | |
|
|
|
|
|
|
|
|
|
|
|
|
|
|
| |
| | 120,965 | | 120,965 | | 93,908 | | 93,724 | | — | | — | | — | | — | |
| | |
|
|
|
|
|
|
|
|
|
|
|
|
|
|
| |
| | | | | | | | | | | | | | | | | | |
| Equity shares | | | | | | | | | | | | | | | | | |
| Held-for-trading | | 2,941 | | 2,941 | | | | | | — | | — | | | | | |
Designated as at fair value
through profit or loss | | 2,541 | | 2,541 | | | | | | — | | — | | | | | |
| Available-for-sale | | 3,819 | | 3,819 | | | | | | — | | — | | | | | |
| | | | | | | | | | | | | | | | | | |
| Banking business | | | | | | 4,237 | | 4,679 | | | | | | — | | — | |
| Trading business | | | | | | 486 | | 486 | | | | | | — | | — | |
| | |
|
|
|
|
|
|
|
|
|
|
|
|
|
|
| |
| | 9,301 | | 9,301 | | 4,723 | | 5,165 | | — | | — | | — | | — | |
| | |
|
|
|
|
|
|
|
|
|
|
|
|
|
|
| |
| Settlement balances | | 6,005 | | 6,005 | | 5,682 | | 5,682 | | — | | — | | — | | — | |
| | |
|
|
|
|
|
|
|
|
|
|
|
|
|
|
| |
| Derivatives at fair value | | 95,663 | | 95,663 | | 17,800 | | 17,800 | | 55 | | 55 | | — | | — | |
|
|
|
|
|
|
|
|
|
|
|
|
|
|
|
|
| |
150
| | Group | | Company | |
| |
| |
| |
| | 2005
Carrying
value
£m | | 2005
Fair
value
£m | | 2004
Carrying
value
£m | | 2004
Fair
value
£m | | 2005
Carrying
value
£m | | 2005
Fair
value
£m | | 2004
Carrying
value
£m | | 2004
Fair
value
£m | |
|
|
|
|
|
|
|
|
|
|
|
|
|
|
|
|
| |
| Financial liabilities | | | | | | | | | | | | | | | | | |
| Deposits by banks | | | | | | | | | | | | | | | | | |
| Held-for-trading | | 32,067 | | 32,067 | | | | | | — | | — | | | | | |
| Amortised cost | | 78,340 | | 78,218 | | | | | | 951 | | 951 | | | | | |
| | | | | | | | | | | | | | | | | | |
| Banking business | | | | | | 60,201 | | 59,294 | | | | | | 174 | | 174 | |
| Trading business | | | | | | 39,682 | | 39,682 | | | | | | — | | — | |
| |
|
|
|
|
|
|
|
|
|
|
|
|
|
|
| |
| | 110,407 | | 110,285 | | 99,883 | | 98,976 | | 951 | | 951 | | 174 | | 174 | |
| |
|
|
|
|
|
|
|
|
|
|
|
|
|
|
| |
| | | | | | | | | | | | | | | | | | |
| Customer accounts | | | | | | | | | | | | | | | | | |
| Held-for-trading | | 34,645 | | 34,645 | | | | | | — | | — | | | | | |
Designated as at fair value
through profit or loss | | 3,683 | | 3,683 | | | | | | — | | — | | | | | |
| Amortised cost | | 304,539 | | 305,252 | | | | | | 55 | | 55 | | | | | |
| | | | | | | | | | | | | | | | | | |
| Banking business | | | | | | 242,182 | | 241,971 | | | | | | — | | — | |
| Trading business | | | | | | 41,133 | | 41,133 | | | | | | — | | — | |
| |
|
|
|
|
|
|
|
|
|
|
|
|
|
|
| |
| | 342,867 | | 343,580 | | 283,315 | | 283,104 | | 55 | | 55 | | — | | — | |
| |
|
|
|
|
|
|
|
|
|
|
|
|
|
|
| |
| | | | | | | | | | | | | | | | | | |
| Debt securities in issue | | | | | | | | | | | | | | | | | |
| Held-for-trading | | 1,469 | | 1,469 | | | | | | — | | — | | | | | |
Designated as at fair value
through profit or loss | | 11,068 | | 11,068 | | | | | | — | | — | | | | | |
| Amortised cost | | 77,883 | | 78,089 | | | | | | 2,942 | | 2,942 | | | | | |
| | | | | | | | | | | | | | | | | | |
| Banking business | | | | | | 62,239 | | 62,238 | | | | | | 1,608 | | 1,608 | |
| Trading business | | | | | | 1,760 | | 1,760 | | | | | | — | | — | |
| |
|
|
|
|
|
|
|
|
|
|
|
|
|
|
| |
| | 90,420 | | 90,626 | | 63,999 | | 63,998 | | 2,942 | | 2,942 | | 1,608 | | 1,608 | |
| |
|
|
|
|
|
|
|
|
|
|
|
|
|
|
| |
| | | | | | | | | | | | | | | | | | |
| Settlement balances and short positions | | 43,988 | | 43,988 | | 32,990 | | 32,990 | | — | | — | | — | | — | |
| |
|
|
|
|
|
|
|
|
|
|
|
|
|
|
| |
| Derivatives at fair value | | 96,438 | | 96,438 | | 18,876 | | 18,876 | | — | | — | | — | | — | |
| |
|
|
|
|
|
|
|
|
|
|
|
|
|
|
| |
| | | | | | | | | | | | | | | | | | |
| Subordinated liabilities | | | | | | | | | | | | | | | | | |
Designated as at fair value
through profit or loss | | 150 | | 150 | | | | | | — | | — | | | | | |
| Amortised cost | | 28,124 | | 29,598 | | | | | | 9,242 | | 9,639 | | | | | |
| | | | | | | | | | | | | | | | | | |
| Banking business | | | | | | 20,312 | | 21,652 | | | | | | 5,935 | | 6,184 | |
| Trading business | | | | | | 54 | | 54 | | | | | | — | | — | |
| |
|
|
|
|
|
|
|
|
|
|
|
|
|
|
| |
| | 28,274 | | 29,748 | | 20,366 | | 21,706 | | 9,242 | | 9,639 | | 5,935 | | 6,184 | |
|
|
|
|
|
|
|
|
|
|
|
|
|
|
|
|
| |
Analysis of total assets and liabilities
| | | | |
| | | 2004
£m | |
|
|
|
| |
| Assets: | denominated in sterling | | 279,433 | |
| denominated in currencies otherthan sterling | | 308,689 | |
|
|
|
| |
| | | 588,122 | |
| | | |
| |
| | | | | |
| Liabilities: | denominated in sterling | | 282,660 | |
| denominated in currencies otherthan sterling | | 305,462 | |
|
|
|
| |
| | | 588,122 | |
| | |
| |
151
Notes on the accountscontinued
34 Financial instruments(continued)
Industry risk – geographical analysis
| | | Group | |
| |
|
|
|
|
|
|
|
|
|
|
|
| |
| 2005 | | Loans and
advances
to banks
and customers
£m | | Treasury bills,
debt securities
and equity shares
£m | | Derivatives
£m | | Other
£m | (1)
| Total
£m | | Netting and
offset
£m | (2)
(2) |
|
|
|
|
|
|
|
|
|
|
|
|
| |
| UK | | | | | | | | | | | | | |
| Central and local government | | 4,082 | | 20,061 | | 175 | | 407 | | 24,725 | | 1,584 | |
| Manufacturing | | 14,861 | | 462 | | 1,088 | | — | | 16,411 | | 3,829 | |
| Construction | | 8,389 | | 53 | | 126 | | — | | 8,568 | | 1,655 | |
| Finance | | 99,123 | | 49,532 | | 66,132 | | 2,129 | | 216,916 | | 84,330 | |
| Service industries and business activities | | 53,504 | | 3,404 | | 2,148 | | 162 | | 59,218 | | 6,290 | |
| Agriculture, forestry and fishing | | 2,685 | | 17 | | 2 | | — | | 2,704 | | 265 | |
| Property | | 41,074 | | 401 | | 1,123 | | — | | 42,598 | | 3,157 | |
| Individuals | | | | | | | | | | | | | |
| Home mortgages | | 65,286 | | — | | 3 | | — | | 65,289 | | 2,690 | |
| Other | | 26,987 | | 564 | | — | | 186 | | 27,737 | | 688 | |
| Finance leases and instalment credit | | 13,909 | | 4 | | — | | — | | 13,913 | | — | |
| Interest accruals | | 1,503 | | 774 | | — | | — | | 2,277 | | — | |
|
|
|
|
|
|
|
|
|
|
|
|
| |
| Total UK | | 331,403 | | 75,272 | | 70,797 | | 2,884 | | 480,356 | | 104,488 | |
|
|
|
|
|
|
|
|
|
|
|
|
| |
| | | | | | | | | | | | | | |
| US | | | | | | | | | | | | | |
| Central and local government | | 472 | | 27,420 | | — | | 112 | | 28,004 | | — | |
| Manufacturing | | 3,369 | | 89 | | 91 | | — | | 3,549 | | 6 | |
| Construction | | 730 | | 30 | | 8 | | — | | 768 | | — | |
| Finance | | 33,811 | | 24,672 | | 21,023 | | 3,818 | | 83,324 | | 22,059 | |
| Service industries and business activities | | 10,440 | | 661 | | 113 | | — | | 11,214 | | 11 | |
| Agriculture, forestry and fishing | | 92 | | — | | — | | — | | 92 | | — | |
| Property | | 5,215 | | 5 | | 39 | | — | | 5,259 | | 15 | |
| Individuals | | | | | | | | | | | | | |
| Home mortgages | | 34,783 | | 922 | | — | | — | | 35,705 | | — | |
| Other | | 14,396 | | — | | — | | — | | 14,396 | | — | |
| Finance leases and instalment credit | | 2,973 | | — | | — | | — | | 2,973 | | — | |
| Interest accruals | | 424 | | 194 | | — | | — | | 618 | | 2 | |
|
|
|
|
|
|
|
|
|
|
|
|
| |
| Total US | | 106,705 | | 53,993 | | 21,274 | | 3,930 | | 185,902 | | 22,093 | |
|
|
|
|
|
|
|
|
|
|
|
|
| |
| | | | | | | | | | | | | | |
| Europe | | | | | | | | | | | | | |
| Central and local government | | 297 | | 301 | | — | | — | | 598 | | 121 | |
| Manufacturing | | 6,429 | | — | | — | | — | | 6,429 | | 891 | |
| Construction | | 2,382 | | — | | — | | — | | 2,382 | | 1,931 | |
| Finance | | 8,259 | | 2,214 | | 450 | | 8 | | 10,931 | | 4,988 | |
| Service industries and business activities | | 9,908 | | 10 | | 11 | | — | | 9,929 | | 3,735 | |
| Agriculture, forestry and fishing | | 514 | | — | | — | | — | | 514 | | 577 | |
| Property | | 5,078 | | 49 | | — | | — | | 5,127 | | 2,682 | |
| Individuals | | | | | | | | | | | | | |
| Home mortgages | | 8,848 | | — | | — | | — | | 8,848 | | 11,310 | |
| Other | | 3,585 | | 105 | | — | | — | | 3,690 | | 1,584 | |
| Finance leases and instalment credit | | 1,311 | | — | | — | | — | | 1,311 | | — | |
| Interest accruals | | 115 | | 26 | | — | | — | | 141 | | — | |
|
|
|
|
|
|
|
|
|
|
|
|
| |
| Total Europe | | 46,726 | | 2,705 | | 461 | | 8 | | 49,900 | | 27,819 | |
|
|
|
|
|
|
|
|
|
|
|
|
| |
| | | | | | | | | | | | | | |
| Rest of the World | | | | | | | | | | | | | |
| Central and local government | | 243 | | 1,709 | | 1,379 | | — | | 3,331 | | — | |
| Manufacturing | | 102 | | — | | 7 | | — | | 109 | | 1 | |
| Construction | | 65 | | — | | — | | — | | 65 | | — | |
| Finance | | 3,680 | | 2,233 | | 1,728 | | 3 | | 7,644 | | 896 | |
| Service industries and business activities | | 1,610 | | 24 | | 17 | | — | | 1,651 | | — | |
| Agriculture, forestry and fishing | | 3 | | — | | — | | — | | 3 | | — | |
| Property | | 112 | | — | | — | | — | | 112 | | 1 | |
| Individuals | | | | | | | | | | | | | |
| Home mortgages | | 216 | | — | | — | | — | | 216 | | — | |
| Other | | 792 | | — | | — | | — | | 792 | | — | |
| Finance lease and instalment credit | | — | | — | | — | | — | | — | | — | |
| Interest accruals | | 43 | | — | | — | | — | | 43 | | — | |
|
|
|
|
|
|
|
|
|
|
|
|
| |
| Total Rest of the World | | 6,866 | | 3,966 | | 3,131 | | 3 | | 13,966 | | 898 | |
|
|
|
|
|
|
|
|
|
|
|
|
| |
| (1) | Includes settlement balances of £6,005 million. |
| (2) | This column shows the amount by which exposures to counterparties are reduced by the existence of a legal right of set off (on the basis that the financial asset will be collected in accordance with its terms) and under master netting arrangements. The credit risk of financial assets subject to a master netting arrangement is eliminated only to the extent that financial liabilities due to the same counterparty will be settled after the assets are realised. The extent to which the Group's credit risk is reduced through a master netting arrangement may change substantially within a short period following the balance sheet date because the exposure is affected by each transaction subject to the arrangement. |
152
| | | Group | |
|
|
|
|
|
|
|
|
|
|
|
|
| |
| 2005 | | Loans and
advances
to banks
and customers
£m | | Treasury bills,
debt securities
and equity shares
£m | | Derivatives
£m | | Other
£m | (1)
| Total
£m | | Netting and
offset
£m | (2)
(2) |
|
|
|
|
|
|
|
|
|
|
|
|
| |
| Total | | | | | | | | | | | | | |
| Central and local government | | 5,094 | | 49,491 | | 1,554 | | 519 | | 56,658 | | 1,705 | |
| Manufacturing | | 24,761 | | 551 | | 1,186 | | — | | 26,498 | | 4,727 | |
| Construction | | 11,566 | | 83 | | 134 | | — | | 11,783 | | 3,586 | |
| Finance | | 144,873 | | 78,651 | | 89,333 | | 5,958 | | 318,815 | | 112,273 | |
| Service industries and business activities | | 75,462 | | 4,099 | | 2,289 | | 162 | | 82,012 | | 10,036 | |
| Agriculture, forestry and fishing | | 3,294 | | 17 | | 2 | | — | | 3,313 | | 842 | |
| Property | | 51,479 | | 455 | | 1,162 | | — | | 53,096 | | 5,855 | |
| Individuals | | | | | | | | | | | | | |
| Home mortgages | | 109,133 | | 922 | | 3 | | — | | 110,058 | | 14,000 | |
| Other | | 45,760 | | 669 | | — | | 186 | | 46,615 | | 2,272 | |
| Finance lease and instalment credit | | 18,193 | | 4 | | — | | — | | 18,197 | | — | |
| Interest accruals | | 2,085 | | 994 | | — | | — | | 3,079 | | 2 | |
|
|
|
|
|
|
|
|
|
|
|
|
| |
| | 491,700 | | 135,936 | | 95,663 | | 6,825 | | 730,124 | | 155,298 | |
|
|
|
|
|
|
|
|
|
|
|
|
| |
| (1) | Includes settlement balances of £6,005 million. |
| (2) | This column shows the amount by which exposures to counterparties are reduced by the existence of a legal right of set off (on the basis that the financial asset will be collected in accordance with its terms) and under master netting arrangements. The credit risk of financial assets subject to a master netting arrangement is eliminated only to the extent that financial liabilities due to the same counterparty will be settled after the assets are realised. The extent to which the Group's credit risk is reduced through a master netting arrangement may change substantially within a short period following the balance sheet date because the exposure is affected by each transaction subject to the arrangement. |
35 Memorandum items
Contingent liabilities and commitments
The amounts shown in the table below are intended only to provide an indication of the volume of business outstanding at 31 December. Although the Group is exposed to credit risk in the event of non-performance of the obligations undertaken by customers, the amounts shown do not, and are not intended to, provide any indication of the Group’s expectation of future losses.
| | Group | | Company | |
| | |
|
|
|
|
|
|
| |
| | 2005
£m | | 2004
£m | | 2005
£m | | 2004
£m | |
|
|
|
|
|
|
|
|
| |
| Contingent liabilities: | | | | | | | | | |
| Guarantees and assets pledged as collateral security | | 12,253 | | 10,438 | | 448 | | 448 | |
| Other contingent liabilities | | 6,394 | | 5,655 | | — | | — | |
|
|
|
|
|
|
|
|
| |
| | 18,647 | | 16,093 | | 448 | | 448 | |
| |
|
|
|
|
|
|
| |
| | | | | | | | | | |
| Commitments: | | | | | | | | | |
| Undrawn formal standby facilities, credit lines and other commitments to lend | | | | | | | | | |
| – less than one year | | 121,911 | | 109,653 | | — | | — | |
| – one year and over | | 81,110 | | 69,577 | | — | | — | |
| Other commitments | | 3,529 | | 1,547 | | — | | — | |
|
|
|
|
|
|
|
|
| |
| | 206,550 | | 180,777 | | — | | — | |
| |
|
|
|
|
|
|
| |
153
Notes on the accountscontinued
35 Memorandum items(continued)
Banking commitments and contingent obligations, which have been entered into on behalf of customers and for which there are corresponding obligations from customers, are not included in assets and liabilities. The Group’s maximum exposure to credit loss, in the event of non-performance by the other party and where all counterclaims, collateral or security proves valueless, is represented by the contractual nominal amount of these instruments included in the table. These commitments and contingent obligations are subject to the Group’s normal credit approval processes and any potential loss is taken into account in assessing provisions for bad and doubtful debts in accordance with the Group’s provisioning policy.
Contingent liabilities
Guarantees – the Group gives guarantees on behalf of customers. A financial guarantee represents an irrevocable undertaking that the Group will meet a customer’s obligations to third parties if the customer fails to do so. The maximum amount that the Group could be required to pay under a guarantee is its principal amount as disclosed in the table above. The Group expects most guarantees it provides to expire unused.
Other contingent liabilities – these include standby letters of credit, supporting customer debt issues and contingent liabilities relating to customer trading activities such as those arising from performance and customs bonds, warranties and indemnities.
Commitments
Commitments to lend – under a loan commitment the Group agrees to make funds available to a customer in the future. Loan commitments, which are usually for a specified term may be unconditionally cancellable or may persist, provided all conditions in the loan facility are satisfied or waived. Commitments to lend include commercial standby facilities and credit lines, liquidity facilities to commercial paper conduits and unutilised overdraft facilities.
Other commitments – these include forward asset purchases, forward deposits placed and undrawn note issuance and revolving underwriting facilities, documentary credits and other short-term trade related transactions.
Regulatory enquiries and investigations – in the normal course of business the Group and its subsidiaries co-operate with regulatory authorities in various jurisdictions in their enquiries or investigations into alleged or possible breaches of regulations.
Additional contingent liabilities arise in the normal course of the Group’s business. It is not anticipated that any material loss will arise from these transactions.
Litigation
Proceedings, including a consolidated class action, have been brought in the United States against a large number of defendants, including the Group, following the collapse of Enron. The claims against the Group could be significant but are largely unquantified. The Group considers that it has substantial and credible legal and factual defences to these claims and it continues to defend them vigorously. A court ordered mediation commenced in September 2003 but no material progress has been made towards a resolution of the claims, although a number of other defendants have reached settlements in the principal class action. The Group is unable reliably to estimate the possible loss in relation to these matters or the effect that the possible loss might have on the Group’s consolidated net assets or its operating results or cash flows in any particular period. In addition, pursuant to requests received from the US Securities and Exchange Commission and the Department of Justice, the Group has provided copies of Enron-related materials to these authorities and has co-operated fully with them.
Members of the Group are engaged in other litigation in the United Kingdom and a number of overseas jurisdictions, including the United States, involving claims by and against them arising in the ordinary course of business. The Group has reviewed these other actual, threatened and known potential claims and proceedings and, after consulting with its legal advisers, is satisfied that the outcome of these other claims and proceedings will not have a material adverse effect on its consolidated net assets, operating results or cash flows in any particular period.
Trustee and other fiduciary activities
In its capacity as trustee or other fiduciary role, the Group may hold or place assets on behalf of individuals, trusts, companies, pension schemes and others. The assets and their income are not included in the Group’s financial statements.
154
36 Net cash inflow from operating activities
| | Group | | | Company | |
| |
| |
| | 2005
£m | | | 2004
£m | | | 2005
£m | | | 2004
£m | |
|
|
|
|
|
|
|
|
|
|
|
|
|
| Operating profit before tax | | 7,936 | | | 7,284 | | | 1,932 | | | 2,890 | |
| Decrease/(increase) in prepayments and accrued income | | 1,064 | | | (333 | ) | | 4 | | | (17 | ) |
| Interest on subordinated liabilities | | 1,271 | | | 681 | | | 583 | | | 318 | |
| (Decrease)/increase in accruals and deferred income | | (1,200 | ) | | 1,750 | | | 8 | | | (7 | ) |
| Provisions for impairment losses | | 1,707 | | | 1,402 | | | — | | | — | |
| Loans and advances written-off net of recoveries | | (1,870 | ) | | (1,305 | ) | | — | | | — | |
| Unwind of discount on impairment losses | | (144 | ) | | — | | | — | | | — | |
| Profit on sale of property, plant and equipment | | (91 | ) | | (69 | ) | | — | | | — | |
| Loss/(profit) on sale of subsidiaries and associates | | 80 | | | (4 | ) | | — | | | — | |
| Profit on sale of securities | | (667 | ) | | (167 | ) | | — | | | — | |
| Charge for defined benefit pensions | | 462 | | | 397 | | | — | | | — | |
| Cash contribution to defined benefit pension schemes | | (452 | ) | | (1,146 | ) | | — | | | — | |
| Other provisions utilised | | (34 | ) | | (47 | ) | | — | | | — | |
| Depreciation and amortisation | | 1,825 | | | 1,674 | | | — | | | — | |
| Other non-cash items | | 1,493 | | | (1,994 | ) | | (28 | ) | | 25 | |
|
|
|
|
|
|
|
|
|
|
|
|
|
| Net cash inflow from trading activities | | 11,380 | | | 8,123 | | | 2,499 | | | 3,209 | |
|
|
|
|
|
|
|
|
|
|
|
|
|
| (Increase)/decrease in loans and advances to banks and customers | | (36,778 | ) | | (72,955 | ) | | (14 | ) | | 77 | |
| Increase in securities | | (28,842 | ) | | (11,883 | ) | | — | | | — | |
| (Increase)/decrease in other assets | | (2,390 | ) | | (2,208 | ) | | 5 | | | 33 | |
| (Increase)/decrease in derivative assets | | (5,758 | ) | | (3,753 | ) | | 50 | | | 21 | |
|
|
|
|
|
|
|
|
|
|
|
|
|
| Changes in operating assets | | (73,768 | ) | | (90,799 | ) | | 41 | | | 131 | |
|
|
|
|
|
|
|
|
|
|
|
|
|
| Increase in deposits by banks and customers | | 32,424 | | | 53,073 | | | 832 | | | 18 | |
| Increase in insurance liabilities | | 620 | | | 866 | | | — | | | — | |
| Increase/(decrease) in debt securities in issue | | 24,147 | | | 19,073 | | | 1,328 | | | (269 | ) |
| Increase/(decrease) in other liabilities | | 571 | | | 919 | | | (55 | ) | | (19 | ) |
| Increase/(decrease) in derivative liabilities | | 5,161 | | | 3,808 | | | (96 | ) | | (9 | ) |
| Increase in settlement balances and short positions | | 10,326 | | | 8,796 | | | — | | | — | |
|
|
|
|
|
|
|
|
|
|
|
|
|
| Changes in operating liabilities | | 73,249 | | | 86,535 | | | 2,009 | | | (279 | ) |
|
|
|
|
|
|
|
|
|
|
|
|
|
| Total income taxes paid | | (1,911 | ) | | (1,366 | ) | | (18 | ) | | 36 | |
|
|
|
|
|
|
|
|
|
|
|
|
|
| Net cash inflow from operating activities | | 8,950 | | | 2,493 | | | 4,531 | | | 3,097 | |
| | |
|
|
|
|
|
|
|
|
|
|
|
37 Analysis of the net investment in business interests and intangible assets | | Group | |
| |
| |
| | 2005
£m | | | 2004
£m | |
|
|
|
|
|
|
|
| Fair value given for businesses acquired | | (85 | ) | | (8,157 | ) |
| Cash and cash equivalents acquired | | — | | | 457 | |
| Non-cash consideration | | 10 | | | 4 | |
|
|
|
|
|
|
|
| Net outflow of cash in respect of purchases | | (75 | ) | | (7,696 | ) |
|
|
|
|
|
|
|
| | | | | | | |
| Cash and cash equivalents in businesses sold | | 10 | | | — | |
| Other assets sold | | 208 | | | 18 | |
| Non-cash consideration | | (30 | ) | | — | |
| (Loss)/profit on disposal | | (80 | ) | | 4 | |
|
|
|
|
|
|
|
| Net inflow of cash in respect of disposals | | 108 | | | 22 | |
|
|
|
|
|
|
|
| Dividends received from joint ventures | | 16 | | | 9 | |
| Cash expenditure on intangible assets | | (345 | ) | | (303 | ) |
|
|
|
|
|
|
|
| Net outflow | | (296 | ) | | (7,968 | ) |
| |
|
|
|
|
|
155
Notes on the accountscontinued38 Interest received and paid
| | Group | | | Company | |
| |
| | |
| |
| | 2005
£m | | | 2004
£m | | | 2005
£m | | | 2004
£m | |
|
|
|
|
|
|
|
|
|
|
|
|
|
| Interest received | | 21,608 | | | 17,025 | | | 488 | | | 337 | |
| Interest paid | | (11,878 | ) | | (8,164 | ) | | (704 | ) | | (402 | ) |
|
|
|
|
|
|
|
|
|
|
|
|
|
| | 9,730 | | | 8,861 | | | (216 | ) | | (65 | ) |
| |
|
|
|
|
|
|
|
|
|
|
|
39 Analysis of changes in financing during the year
| | Group | | | Company | |
| |
| | |
| |
| | Share capital | | | Subordinated liabilities | | | Share capital | | | Subordinated liabilities | |
| |
| | |
| | |
| | |
| |
| | 2005
£m | | | 2004
£m | | | 2005
£m | | | 2004
£m | | | 2005
£m | | | 2004
£m | | | 2005
£m | | | 2004
£m | |
|
|
|
|
|
|
|
|
|
|
|
|
|
|
|
|
|
|
|
|
|
|
|
|
|
| At 1 January | | 13,786 | | | 8,944 | | | 20,366 | | | 16,998 | | | 13,786 | | | 8,944 | | | 5,935 | | | 5,393 | |
| Implementation of IAS 32 | | (3,161 | ) | | | | | 7,160 | | | | | | (3,161 | ) | | | | | 3,308 | | | | |
|
|
|
|
|
|
|
|
|
|
|
|
|
|
|
|
|
|
|
|
|
|
|
|
|
| At 1 January 2005 restated | | 10,625 | | | 8,944 | | | 27,526 | | | 16,998 | | | 10,625 | | | 8,944 | | | 9,243 | | | 5,393 | |
|
|
|
|
|
|
|
|
|
|
|
|
|
|
|
|
|
|
|
|
|
|
|
|
|
| Issue of ordinary shares | | 163 | | | 2,845 | | | | | | | | | 163 | | | 2,845 | | | | | | | |
| Issue of equity preference shares | | 1,649 | | | 1,358 | | | | | | | | | 1,649 | | | 1,358 | | | | | | | |
| Net proceeds from issue of | | | | | | | | | | | | | | | | | | | | | | | | |
| subordinated liabilities | | | | | | | | 1,234 | | | 4,624 | | | | | | | | | 337 | | | 1,424 | |
| Repayment of subordinated liabilities | | | | | | | | (1,553 | ) | | (718 | ) | | | | | | | | (1,183 | ) | | (40 | ) |
|
|
|
|
|
|
|
|
|
|
|
|
|
|
|
|
|
|
|
|
|
|
|
|
|
| Net cash inflow/(outflow) from financing | | 1,812 | | | 4,203 | | | (319 | ) | | 3,906 | | | 1,812 | | | 4,203 | | | (846 | ) | | 1,384 | |
|
|
|
|
|
|
|
|
|
|
|
|
|
|
|
|
|
|
|
|
|
|
|
|
|
| Acquisitions of subsidiaries | | — | | | — | | | — | | | 397 | | | — | | | — | | | — | | | — | |
| Currency translation | | 166 | | | 179 | | | 1,067 | | | (475 | ) | | 166 | | | 179 | | | 845 | | | (382 | ) |
| Other non-cash movements | | — | | | 460 | | | — | | | (460 | ) | | — | | | 460 | | | — | | | (460 | ) |
|
|
|
|
|
|
|
|
|
|
|
|
|
|
|
|
|
|
|
|
|
|
|
|
|
| At 31 December | | 12,603 | | | 13,786 | | | 28,274 | | | 20,366 | | | 12,603 | | | 13,786 | | | 9,242 | | | 5,935 | |
| | |
|
|
|
|
|
|
|
|
|
|
|
|
|
|
|
|
|
|
|
|
|
|
|
40 Analysis of cash and cash equivalents
| | Group | | Company | |
| |
| |
| |
| | 2005
£m | | 2004
£m | | 2005
£m | | 2004
£m | |
|
|
|
|
|
|
|
|
|
|
| At 1 January | | | | | | | | | |
| – cash | | 23,723 | | 20,937 | | 60 | | 19 | |
| – cash equivalents | | 26,298 | | 27,184 | | 249 | | 64 | |
| Net cash inflow | | 2,528 | | 1,900 | | 817 | | 226 | |
|
|
|
|
|
|
|
|
|
|
| At 31 December | | 52,549 | | 50,021 | | 1,126 | | 309 | |
| | |
|
|
|
|
|
|
|
|
| | | | | | | | | | |
| Comprising: | | | | | | | | | |
| Cash and balances at central banks | | 4,456 | | 4,035 | | — | | — | |
| Treasury bills and debt securities | | 998 | | 3,016 | | — | | — | |
| Loans and advances to banks repayable on demand | | 47,095 | | 42,970 | | 1,126 | | 309 | |
|
|
|
|
|
|
|
|
|
|
| Cash and cash equivalents | | 52,549 | | 50,021 | | 1,126 | | 309 | |
| | |
|
|
|
|
|
|
|
|
Certain subsidiary undertakings are required to maintain balances with the Bank of England which, at 31 December 2005, amounted to £303 million (2004 – £260 million). Certain subsidiary undertakings are required by law to maintain reserve balances with the Federal Reserve Bank in the US. Such reserve balances amounted to US$156 million at 31 December 2005 (2004 – US$132 million).
156
41 Segmental analysisThe directors manage the Group primarily by class of business and present the segmental analysis on that basis. Segments charge market prices for services rendered to other parts of the Group with the exception of Manufacturing and central resources. The expenditure incurred by Manufacturing relates to shared costs principally in respect of the Group's UK and Ireland banking and insurance operations. These costs reflect activities that are shared between the various customer-facing divisions and consequently cannot be directly attributed to individual divisions. Funding charges between segments are determined by Group Treasury, having regard to commercial demands.
(a) Divisions
| | | | | | | | | | | | | | | | | | Group | | | | | | | | | | | | | |
| | |
|
| | | Revenue | | | Total Income | | | | | | | | | | | | | |
| | |
| | |
| | | | | | | | | | | | | |
| 2005 | | External
£m | | | Inter segment
£m | | | Total
£m | | | External
£m | | | Inter segment
£m | | | Total
£m | | | Operating expenses
£m | | | Depreciation and amortisation
£m | | | Provisions
£m | | | Operating profit before tax
£m | |
|
|
|
|
|
|
|
|
|
|
|
|
|
|
|
|
|
|
|
|
|
|
|
|
|
|
|
|
|
|
|
| Corporate Markets | | 14,633 | | | 3,724 | | | 18,357 | | | 11,062 | | | (2,247 | ) | | 8,815 | | | (2,440 | ) | | (816 | ) | | (335 | ) | | 5,224 | |
| Retail Banking | | 7,086 | | | 1,333 | | | 8,419 | | | 5,507 | | | (74 | ) | | 5,433 | | | (1,810 | ) | | (13 | ) | | (601 | ) | | 3,009 | |
| Retail Direct | | 3,751 | | | 183 | | | 3,934 | | | 2,123 | | | (157 | ) | | 1,966 | | | (580 | ) | | (25 | ) | | (571 | ) | | 790 | |
| Wealth Management | | 870 | | | 1,129 | | | 1,999 | | | (235 | ) | | 1,049 | | | 814 | | | (379 | ) | | (14 | ) | | (13 | ) | | 408 | |
| Ulster Bank | | 1,638 | | | 150 | | | 1,788 | | | 973 | | | (115 | ) | | 858 | | | (246 | ) | | (24 | ) | | (58 | ) | | 530 | |
| Citizens | | 4,878 | | | 4 | | | 4,882 | | | 3,353 | | | (89 | ) | | 3,264 | | | (1,407 | ) | | (151 | ) | | (131 | ) | | 1,575 | |
| RBS Insurance | | 6,194 | | | 67 | | | 6,261 | | | 5,501 | | | (12 | ) | | 5,489 | | | (4,536 | ) | | (27 | ) | | — | | | 926 | |
| Manufacturing | | 55 | | | 6 | | | 61 | | | (61 | ) | | (34 | ) | | (95 | ) | | (2,125 | ) | | (523 | ) | | — | | | (2,743 | ) |
| Central items | | 15 | | | 5,161 | | | 5,176 | | | (2,654 | ) | | 1,679 | | | (975 | ) | | (500 | ) | | 5 | | | 2 | | | (1,468 | ) |
| Eliminations | | — | | | (11,757 | ) | | (11,757 | ) | | — | | | — | | | — | | | — | | | — | | | — | | | — | |
|
|
|
|
|
|
|
|
|
|
|
|
|
|
|
|
|
|
|
|
|
|
|
|
|
|
|
|
|
|
|
Operating profit before amortisation of
purchased intangibles, integration costs and
net gain on sale of strategic investments | | 39,120 | | | — | | | 39,120 | | | 25,569 | | | — | | | 25,569 | | | (14,023 | ) | | (1,588 | ) | | (1,707 | ) | | 8,251 | |
| Amortisation of intangibles | | — | | | — | | | — | | | — | | | — | | | — | | | — | | | (97 | ) | | — | | | (97 | ) |
| Integration costs | | — | | | — | | | — | | | — | | | — | | | — | | | (318 | ) | | (140 | ) | | — | | | (458 | ) |
| Net gain on sale of strategic investments | | 333 | | | — | | | 333 | | | 333 | | | — | | | 333 | | | (93 | ) | | — | | | — | | | 240 | |
|
|
|
|
|
|
|
|
|
|
|
|
|
|
|
|
|
|
|
|
|
|
|
|
|
|
|
|
|
|
|
| Operating profit before tax | | 39,453 | | | — | | | 39,453 | | | 25,902 | | | — | | | 25,902 | | | (14,434 | ) | | (1,825 | ) | | (1,707 | ) | | 7,936 | |
| | |
|
|
|
|
|
|
|
|
|
|
|
|
|
|
|
|
|
|
|
|
|
|
|
|
|
|
|
|
|
| | | | | | | | | | | | | | | | | | Group | | | | | | | | | | | | | |
| | |
|
| | | Revenue | | | Total Income | | | | | | | | | | | | | |
| | |
| | |
| | | | | | | | | | | | | |
| 2004 | | External
£m | | | Inter segment
£m | | | Total
£m | | | External
£m | | | Inter segment
£m | | | Total
£m | | | Operating
expenses
£m | | | Depreciation
and
amortisation
£m | | | Provisions
£m | | | Operating
profit
before tax
£m | |
|
|
|
|
|
|
|
|
|
|
|
|
|
|
|
|
|
|
|
|
|
|
|
|
|
|
|
|
|
|
|
| Corporate Markets | | 11,809 | | | 4,007 | | | 15,816 | | | 9,548 | | | (1,897 | ) | | 7,651 | | | (2,084 | ) | | (760 | ) | | (581 | ) | | 4,226 | |
| Retail Banking | | 6,907 | | | 1,283 | | | 8,190 | | | 5,460 | | | 120 | | | 5,580 | | | (1,969 | ) | | (10 | ) | | (389 | ) | | 3,212 | |
| Retail Direct | | 3,504 | | | 109 | | | 3,613 | | | 1,933 | | | (156 | ) | | 1,777 | | | (552 | ) | | (27 | ) | | (313 | ) | | 885 | |
| Wealth Management | | 861 | | | 918 | | | 1,779 | | | 18 | | | 755 | | | 773 | | | (368 | ) | | (30 | ) | | (18 | ) | | 357 | |
| Ulster Bank | | 1,281 | | | 53 | | | 1,334 | | | 800 | | | (57 | ) | | 743 | | | (224 | ) | | (27 | ) | | (40 | ) | | 452 | |
| Citizens | | 2,929 | | | 15 | | | 2,944 | | | 2,265 | | | 3 | | | 2,268 | | | (1,003 | ) | | (77 | ) | | (117 | ) | | 1,071 | |
| RBS Insurance | | 6,043 | | | 33 | | | 6,076 | | | 5,064 | | | (25 | ) | | 5,039 | | | (4,145 | ) | | (31 | ) | | — | | | 863 | |
| Manufacturing | | 43 | | | 15 | | | 58 | | | (66 | ) | | — | | | (66 | ) | | (2,062 | ) | | (424 | ) | | — | | | (2,552 | ) |
| Central items | | — | | | 2,065 | | | 2,065 | | | (1,631 | ) | | 1,257 | | | (374 | ) | | (274 | ) | | 10 | | | (27 | ) | | (665 | ) |
| Eliminations | | — | | | (8,498 | ) | | (8,498 | ) | | — | | | — | | | — | | | — | | | — | | | — | | | — | |
|
|
|
|
|
|
|
|
|
|
|
|
|
|
|
|
|
|
|
|
|
|
|
|
|
|
|
|
|
|
|
| Operating profit before amortisation of | | | | | | | | | | | | | | | | | | | | | | | | | | | | | | |
| purchased intangibles and integration costs | | 33,377 | | | — | | | 33,377 | | | 23,391 | | | — | | | 23,391 | | | (12,681 | ) | | (1,376 | ) | | (1,485 | ) | | 7,849 | |
| Amortisation ofintangibles | | — | | | — | | | — | | | — | | | — | | | — | | | — | | | (45 | ) | | — | | | (45 | ) |
| Integration costs | | — | | | — | | | — | | | — | | | — | | | — | | | (267 | ) | | (253 | ) | | — | | | (520 | ) |
|
|
|
|
|
|
|
|
|
|
|
|
|
|
|
|
|
|
|
|
|
|
|
|
|
|
|
|
|
|
|
| Operating profit before tax | | 33,377 | | | — | | | 33,377 | | | 23,391 | | | — | | | 23,391 | | | (12,948 | ) | | (1,674 | ) | | (1,485 | ) | | 7,284 | |
| | |
|
|
|
|
|
|
|
|
|
|
|
|
|
|
|
|
|
|
|
|
|
|
|
|
|
|
|
|
|
157
Notes on the accountscontinued
41 Segmental analysis(continued)
| | | | | 2005 | | | | | | 2004 | | | |
| | |
| |
| |
| Group | | Assets
£m | | Liabilities
£m | | Cost to
acquire fixed
assets and
intangible
assets
£m | | Assets
£m | | Liabilities
£m | | Cost to
acquire fixed
assets and
intangible
assets
£m | |
| | |
|
|
|
|
|
|
|
|
|
|
| |
| Corporate Markets | | 499,206 | | 456,258 | | 3,674 | | 352,889 | | 320,263 | | 3,438 | |
| Retail Banking | | 83,077 | | 83,334 | | 1 | | 78,521 | | 76,726 | | 107 | |
| Retail Direct | | 27,210 | | 2,941 | | 23 | | 23,479 | | 4,160 | | 80 | |
| Wealth Management | | 10,078 | | 26,369 | | 42 | | 9,034 | | 23,478 | | 17 | |
| Ulster Bank | | 35,875 | | 29,878 | | 77 | | 27,405 | | 21,891 | | 564 | |
| Citizens | | 92,197 | | 77,471 | | 301 | | 71,597 | | 58,888 | | 6,165 | |
| RBS Insurance | | 12,523 | | 8,925 | | 172 | | 11,215 | | 8,356 | | 38 | |
| Manufacturing | | 5,638 | | 1,788 | | 998 | | 5,548 | | 2,149 | | 1,318 | |
| Central items | | 11,023 | | 52,319 | | — | | 8,434 | | 34,814 | | — | |
|
|
|
|
|
|
|
|
|
|
|
|
| |
| Group | | 776,827 | | 739,283 | | 5,288 | | 588,122 | | 550,725 | | 11,727 | |
| |
|
|
|
|
|
|
|
|
|
|
| |
Segmental analysis of goodwill is as follows:
| | | | | | | | | | | | | | | Group | | | | | | | | | | | | | |
| | |
|
|
|
|
|
|
|
|
|
|
|
|
|
|
|
|
|
|
|
|
|
|
|
|
|
|
| | | Corporate
Markets
£m | | | Retail
Banking
£m | | | Retail Direct
£m | | | Wealth
Management
£m | | | Citizens
£m | | | RBS
Insurance
£m | | | Ulster Bank
£m | | | Centre
£m | | | Total
£m | |
|
|
|
|
|
|
|
|
|
|
|
|
|
|
|
|
|
|
|
|
|
|
|
|
|
|
|
|
| At 1 January 2005 | | 186 | | | 83 | | | 174 | | | 153 | | | 6,635 | | | 961 | | | 425 | | | 9,415 | | | 18,032 | |
| Currency translation and other adjustments | | (5 | ) | | — | | | (3 | ) | | (4 | ) | | 809 | | | — | | | (11 | ) | | — | | | 786 | |
| Arising on acquisitions during the year | | 1 | | | 1 | | | 8 | | | — | | | — | | | 103 | | | — | | | — | | | 113 | |
| Disposals | | (96 | ) | | — | | | — | | | (12 | ) | | — | | | — | | | — | | | — | | | (108 | ) |
|
|
|
|
|
|
|
|
|
|
|
|
|
|
|
|
|
|
|
|
|
|
|
|
|
|
|
|
| At 31 December 2005 | | 86 | | | 84 | | | 179 | | | 137 | | | 7,444 | | | 1,064 | | | 414 | | | 9,415 | | | 18,823 | |
| |
|
|
|
|
|
|
|
|
|
|
|
|
|
|
|
|
|
|
|
|
|
|
|
|
|
|
158
(b) Geographical segments
The geographical analyses in the tables below have been compiled on the basis of location of office where the transactions are recorded
| | | | | | Group | | | | | |
| | |
|
|
|
|
|
|
|
|
| |
| 2005 | | UK
£m | | USA
£m | | Europe
£m | | Rest of
the world
£m | | Total
£m | |
|
|
|
|
|
|
|
|
|
|
| |
| Net interest income | | 6,942 | | 2,225 | | 713 | | 38 | | 9,918 | |
| Fees and commissions (net) | | 3,466 | | 1,100 | | 263 | | 80 | | 4,909 | |
| Income from trading activities | | 1,263 | | 959 | | 56 | | 65 | | 2,343 | |
| Other operating income | | 2,330 | | 211 | | 403 | | 9 | | 2,953 | |
| Insurance premium income (net of reinsurers’ share) | | 5,462 | | — | | 317 | | — | | 5,779 | |
|
|
|
|
|
|
|
|
|
|
| |
| Total income | | 19,463 | | 4,495 | | 1,752 | | 192 | | 25,902 | |
| |
|
|
|
|
|
|
|
|
| |
| Operating profit before tax | | 5,278 | | 2,032 | | 602 | | 24 | | 7,936 | |
| |
|
|
|
|
|
|
|
|
| |
| Total assets | | 492,962 | | 205,514 | | 62,203 | | 16,148 | | 776,827 | |
| |
|
|
|
|
|
|
|
|
| |
| Total liabilities | | 473,581 | | 191,189 | | 58,527 | | 15,986 | | 739,283 | |
| |
|
|
|
|
|
|
|
|
| |
| Net assets attributable to equity shareholders and minority interests | | 19,381 | | 14,325 | | 3,676 | | 162 | | 37,544 | |
| |
|
|
|
|
|
|
|
|
| |
| Contingent liabilities and commitments | | 161,927 | | 51,392 | | 10,714 | | 1,164 | | 225,197 | |
| |
|
|
|
|
|
|
|
|
| |
| Cost to acquire property, plant and equipment and intangible assets | | 3,353 | | 337 | | 1,581 | | 17 | | 5,288 | |
| |
|
|
|
|
|
|
|
|
| |
| | | | | | | | | | | | |
| 2004 | | | | | | | | | | | |
|
|
|
|
|
|
|
|
|
|
| |
| Net interest income | | 6,454 | | 1,825 | | 751 | | 41 | | 9,071 | |
| Fees and commissions (net) | | 3,455 | | 717 | | 301 | | 74 | | 4,547 | |
| Income from trading activities | | 1,113 | | 821 | | 18 | | 36 | | 1,988 | |
| Other operating income | | 1,741 | | 109 | | 284 | | 4 | | 2,138 | |
| Insurance premium income (net of reinsurers’ share) | | 5,390 | | — | | 257 | | — | | 5,647 | |
|
|
|
|
|
|
|
|
|
|
| |
| Total income | | 18,153 | | 3,472 | | 1,611 | | 155 | | 23,391 | |
| |
|
|
|
|
|
|
|
|
| |
| Operating profit before tax | | 5,059 | | 1,575 | | 583 | | 67 | | 7,284 | |
| |
|
|
|
|
|
|
|
|
| |
| Total assets | | 382,623 | | 145,748 | | 45,845 | | 13,906 | | 588,122 | |
| |
|
|
|
|
|
|
|
|
| |
| Total liabilities | | 362,297 | | 131,449 | | 43,129 | | 13,850 | | 550,725 | |
| |
|
|
|
|
|
|
|
|
| |
| Net assets attributable to equity shareholders and minority interests | | 20,326 | | 14,299 | | 2,716 | | 56 | | 37,397 | |
| |
|
|
|
|
|
|
|
|
| |
| Contingent liabilities and commitments | | 151,489 | | 37,972 | | 6,791 | | 618 | | 196,870 | |
| |
|
|
|
|
|
|
|
|
| |
| Cost to acquire property, plant and equipment and intangible assets | | 3,811 | | 6,178 | | 1,736 | | 2 | | 11,727 | |
| |
|
|
|
|
|
|
|
|
| |
159
Notes on the accountscontinued
42 Directors’ and key management remuneration
| | Group | |
| |
| |
| Directors’ remuneration | | 2005
£000 | | 2004
£000 | |
|
|
|
|
| |
| Non-executive directors – emoluments | | 924 | | 874 | |
| Chairman and executive directors – emoluments | | 8,994 | | 8,421 | |
| Chairman and executive directors – contributions and allowances in respect of defined | | | | | |
| Chairman and executive directors contribution pension schemes | | 220 | | 178 | |
|
|
|
|
| |
| | 10,138 | | 9,473 | |
| Chairman and executive directors – amounts receivable under long-term incentive plans | | 4,778 | | 2,189 | |
| Chairman and executive directors – gains on exercise of share options | | 11 | | 5 | |
|
|
|
|
| |
| | 14,927 | | 11,667 | |
| |
|
|
| |
Retirement benefits are accruing to four directors (2004 – five) under defined benefit schemes, two (2004 – two) of whom also accrued benefits under defined contribution schemes.
The executive directors may also participate in the company’s executive share option, sharesave and option 2000 schemes and details of their interests in the company’s shares arising from their participation are contained on page 79. Details of the remuneration received by each director during the year and each director’s pension arrangements are given on pages 78 to 81.
Compensation of key management
The aggregate remuneration of directors and other members of key management during the year was as follows:
| | Group | |
| |
| |
| | | 2005
£000 | | 2004
£000 | |
|
|
|
|
| |
| Short-term benefits | | 26,180 | | 23,652 | |
| Post-employment benefits | | 9,383 | | 5,298 | |
| Other long-term | | 4,215 | | — | |
| Share-based payments | | 1,568 | | 5,200 | |
|
|
|
|
| |
| | 41,346 | | 34,150 | |
| |
|
|
| |
160
43 Transactions with directors, officers and others
| (a) | At 31 December 2005, the amounts outstanding in relation to transactions, arrangements and agreements entered into by authorised institutions in the Group, as defined by UK Law, were £149,537 in respect of loans to six persons who were directors of the company (or persons connected with them) at any time during the financial period and £2,055 to one person who was an officer of the company at any time during the financial period. |
| |
| (b) | For the purposes of IAS 24 ‘Related Party Disclosures’, key management comprise directors of the company and members of the Group Executive Management Committee. The captions in the Group’s primary financial statements include the following amounts attributable, in aggregate, to key management: |
| | | 2005
£000 | | 2004
£000 |
|
|
|
|
|
| Loans and advances to customers | | 3,090 | | 2,497 |
| Customer accounts | | 12,604 | | 8,021 |
|
|
|
|
|
Key management have banking relationships with Group entities which are entered into in the normal course of business.
Key management had no reportable transactions or balances with the company except for dividends.
44 Related parties
| (a) | Group companies provide development and other types of capital support to businesses in their roles as providers of finance. These investments are made in the normal course of business and on arm’s-length terms. In some instances, the investment may extend to ownership or control over 20% or more of the voting rights of the investee company. However, these investments are not considered to give rise to transactions of a materiality requiring disclosure under IAS 24. |
| |
| (b) | The Group recharges The Royal Bank of Scotland Group Pension Fund with the cost of administration services incurred by it. The amounts involved are not material to the Group. |
| |
| (c) | In accordance with IAS 24, transactions or balances between Group entities that have been eliminated on consolidation are not reported. |
| |
| (d) | The captions in the primary financial statements of the parent company include amounts attributable to subsidiaries. These amounts have been disclosed in aggregate in the relevant notes to the financial statements. |
161
Notes on the accountscontinued
45 Transition to IFRS
(1) Significant differences between the Group’s UK GAAP accounting policies applied in its 2004 financial statements and its IFRS accounting policies
| UK GAAP | | IFRS |
|
|
|
| (a) Goodwill | | |
| Goodwill arising on acquisitions after 1 October 1998 is capitalised and amortised over its estimated useful economic life. Goodwill arising on acquisitions before 1 October 1998 was deducted from equity. Goodwill is reviewed for impairment at the end of the first full year following an acquisition and subsequently if events or changes in circumstances indicated that its carrying value might not be recoverable, | | Goodwill is recorded at cost less any accumulated impairment losses. Goodwill is tested annually for impairment or more frequently if events or changes in circumstances indicate that it might be impaired. The carrying amount of goodwill in the Group’s opening IFRS balance sheet (as at 1 January 2004) was £13,131 million, its carrying value under UK GAAP as at 31 December 2003. |
|
|
|
| (b) Intangibles other than goodwill | | |
| Computer software development costs | | |
| Most computer software development costs are written off as incurred. | | Computer software development costs are capitalised if they create an identifiable intangible asset. They are amortised over their estimated useful life of three years. Net computer software development costs of £818 million were recognised on transition to IFRS. |
| | | |
| Other intangibles | | |
| An intangible asset acquired in a business combination is capitalised separately from goodwill only if it can be disposed of separately from the revenue-earning activity to which it contributes and its value can be measured reliably. | | An intangible asset is recognised as an asset separately from goodwill if it is separable or if it arises from contractual or other legal rights regardless of whether these rights are transferable or separable. |
| | | |
| | Core deposit intangibles of £268 million, mortgage servicing rights of £81 million, customer relationships of £162 million and other intangibles of £18 million were recognised in business combinations that took place in 2004. |
|
|
|
| (c) Leasing | | |
| Finance lease income is recognised so as to give a level rate of return on the net cash investment in the lease; tax cash flows are taken into account in allocating income. | | IFRS requires a level rate of return on the net investment in the lease. Tax cash flows are not reflected in the pattern of income recognition. |
| | | |
| Assets held under operating leases are depreciated on a straight-line or reverse-annuity basis. | | Assets held on operating leases are depreciated on a straight- line basis. |
|
|
|
| (d) Dividends | | |
| Dividends payable on ordinary shares are recorded in the period to which they relate. | | Dividends are recorded in the period in which they are declared. |
|
|
|
| (e) Consolidation | | |
| UK GAAP requires consolidation of entities controlled by the reporting entity. Control is the ability to direct the financial and operating policies of an entity. | | All entities controlled by the Group are consolidated together with special purpose entities (SPEs) where the substance of the relationship between the reporting entity and the SPE indicates that it is controlled by the reporting entity. |
|
|
|
| (f) Life assurance | | |
| To reflect the distinct nature of long-term assurance assets and liabilities attributable to policyholders, they are shown separately on the consolidated balance sheet; the results of life assurance business are presented as a single contribution to profit before tax. | | Assets, liabilities, income and expense of life assurance business are consolidated on a line-by-line basis. |
| | | |
| Changes in embedded value determined on a post-tax basis are grossed up for inclusion in the income statement. | | Movements in embedded value are not grossed up, instead they are included net of tax in profit before tax. |
162
| UK GAAP | | IFRS |
|
|
|
| (g) Associates and joint ventures | | |
| An associate is an entity in which the reporting entity holds aparticipating interest and over whose operating and financialpolicies it exercises a significant influence in practice. A jointventure is an entity in which the reporting entity in practiceshares control with other investors. Associates are accountedfor using the equity method and joint ventures using the grossequity method. | | The definitions of associate and joint venture are similar tothose in UK GAAP. However, significant influence is defined asthe power to participate in the financial and operating policiesof the associate. A joint venture is an entity where the strategicfinancial and operating decisions require the unanimousconsent of the parties sharing control. Associates areaccounted for using the equity method. The Groupproportionately consolidates its joint ventures. |
|
|
|
| (h) Property, plant and equipment | | |
| The Group’s freehold and long leasehold property occupied forits own use is recorded at valuation on the basis of existinguse value. | | The Group’s freehold and long leasehold property occupied forits own use is recorded at cost less depreciation. The Group has elected to use the UK GAAP valuation as at 31 December 2003 as deemed cost for freehold and long leasehold property occupied for its own use in its opening IFRS balance sheet (1 January 2004). |
|
|
|
| (i) Investment property | | |
| Investment property is revalued annually to open market valueand changes in market value reflected in the Statement of totalrecognised gains and losses. | | Investment property is stated at fair value. Any gain or lossarising from a change in fair value is recognised in profit or loss. |
|
|
|
| (j) Share-based payments | | |
| No expense is recognised for options over The Royal Bank ofScotland Group plc shares granted to employees. | | The Group has applied IFRS 2 ‘Share-based Payment’ togrants of options over shares after 7 November 2002 that hadnot vested on 1 January 2005. The expense for these transactions is measured based on the fair value on the date the options are granted. The fair value is expensed on a straight-line basis over the vesting period. |
|
|
|
| (k) Pensions | | |
| Pension scheme assets are measured at fair value usingmid-market prices. | | Pension scheme assets are measured at fair value using bidprices. |
|
|
|
| (l) Income tax | | |
| Deferred tax is not accounted for in relation to revaluations of fixedassets where there is no commitment to dispose of the asset or inrelation to taxable gains or losses on sales of fixed assets that arerolled over into the tax cost of replacement fixed assets. | | Deferred tax is provided on fixed asset revaluations and ontaxable gains and losses on fixed asset sales rolled over intothe tax cost of replacement assets. |
|
|
|
| (m) Cash flow statements | | |
| Cash comprises cash and balances with central banks and loansand advances to banks repayable on demand. | | Cash and cash equivalents comprise cash on hand anddemand deposits with banks together with short-term highlyliquid investments that are readily convertible to known amounts of cash and subject to insignificant risk of changes in value. |
| | | |
| Under UK GAAP, cash flows are classified under the followingheadings: | | Under IFRS cash flows are classified into operating, investingand financing activities. |
| | | |
- operating activities
- dividends from joint ventures and associates
- returns on investments and servicing of finance
- taxation
- capital expenditure and financial investment
- acquisitions and disposals
- ordinary equity dividends paid
- financing
| | |
163
Notes on the accountscontinued
45 Transition to IFRS(continued)
Implementation of IAS 32, IAS 39 and IFRS 4
| UK GAAP | | IFRS |
|
|
|
| (n) Financial instruments: financial assets | | |
Loans are measured at cost less provisions for bad anddoubtful debts, derivatives held-for-trading are carried at fairvalue and hedging derivatives are accounted for inaccordance with the treatment of the item being hedged(see Derivatives and hedging below). Debt securities and equity shares intended for use on acontinuing basis in the Group’s activities are classified asinvestment securities and are stated at cost less provision forany permanent diminution in value. The cost of datedinvestment securities is adjusted for the amortisation ofpremiums or discounts. Other debt securities and equityshares are carried at fair value. | | Under IAS 39, financial assets are classified into held-to-maturity; available-for-sale; held-for-trading; designated as atfair value through profit or loss; and loans and receivables.Financial assets classified as held-to-maturity or as loans andreceivables are carried at amortised cost. Other financialassets are measured at fair value. Changes in the fair value ofavailable-for-sale financial assets are reported in a separatecomponent of shareholders’ equity. Changes in the fair value offinancial assets held-for-trading or designated as at fair valueare taken to profit or loss. Financial assets can be classified asheld-to-maturity only if they have a fixed maturity and thereporting entity has the positive intention and ability to hold tomaturity. Trading financial assets are held for the purpose ofselling in the near term. IFRS allows any financial asset to be designated as at fair value through profit or loss on initial recognition. Unquoted debt financial assets that are not classified as held-to-maturity, held-for-trading or designated as at fair value through profit or loss are categorised as loans and receivables. All other financial assets are classified as available-for-sale. |
|
|
|
| (o) Financial instruments: financial liabilities | | |
| Under UK GAAP, short positions in securities and tradingderivatives are carried at fair value; all other financial liabilitiesare recorded at amortised cost. | | IAS 39 requires all financial liabilities to be measured atamortised cost except those held-for-trading and those thatwere designated as at fair value through profit or loss on initialrecognition. |
|
|
|
| (p) Liabilities and equity | | |
| Under UK GAAP, all shares are classified as shareholders'funds. An analysis of shareholders’ funds between equity andnon-equity interests is given. | | There is no concept of non-equity shares in IFRS. Instrumentsare classified between equity and liabilities in accordance withthe substance of the contractual arrangements. A non-derivative instrument is classified as equity if it does not include a contractual obligation either to deliver cash or to exchange financial instruments with another entity under potentially unfavourable conditions, and, if the instrument will or may be settled by the issue of equity, settlement does not involve the issue of a variable number of shares. On implementation of IAS 32, non-equity shares with a balance sheet value of £3,192 million and £2,568 million of non-equity minority interests were reclassified as liabilities. |
164
| UK GAAP | | IFRS |
|
|
|
| (q) Effective interest rate and lending fees | | |
| Under UK GAAP, loan origination fees are recognised when received unless they are charged in lieu of interest. | | IAS 39 requires the amortised cost of a financial instrument to be calculated using the effective interest method. The effective interest rate is the rate that discounts estimated future cash flows over an instrument’s expected life to its net carrying value. It takes into account all fees and points paid that are an integral part of the yield, transaction costs and all other premiums and discounts. On implementation of IAS 39, the carrying value of financial assets was reduced by £708 million and financial liabilities increased by £224 million, deferred tax was reduced by £283 million and shareholders’ equity reduced by £649 million. |
|
| (r) Derivatives and hedging | | |
Under UK GAAP non-trading derivatives are accounted for on an accruals basis in accordance with the accounting treatment of the underlying transaction or transactions being hedged. If a non-trading derivative transaction is terminated or ceases to be an effective hedge, it is re-measured at fair value and any gain or loss amortised over the remaining life of the underlying transaction or transactions being hedged. If a hedged item is derecognised the related non-trading derivative is remeasured at fair value and any gain or loss taken to the income statement. | | Under IAS 39, all derivatives are measured at fair value. Hedge accounting is permitted for three types of hedge relationship: fair value hedge – the hedge of changes in the fair value of a recognised asset or liability or firm commitment; cash flow hedge – the hedge of variability in cash flows from a recognised asset or liability or a forecasted transaction; and the hedge of a net investment in a foreign entity. In a fair value hedge the gain or loss on the derivative is recognised in profit or loss as it arises offset by the corresponding gain or loss on the hedged item attributable to the risk hedged. In a cash flow hedge and in the hedge of a net investment in a foreign entity, the element of the derivative’s gain or loss that is an effective hedge is recognised directly in equity. The ineffective element is taken to the income statement. Certain conditions must be met for a relationship to qualify for hedge accounting. These include designation, documentation and prospective and actual hedge effectiveness. On implementation of IAS 39, non- trading derivatives were remeasured at fair value. |
| | | |
| Embedded derivatives are not bifurcated from the host contract. | | A derivative embedded in a contract is accounted for as a stand-alone derivative if its economic characteristics are not closely related to the economic characteristics of the host contract, unless the entire contract is carried at fair value through profit or loss. |
|
| (s) Loan impairment | | |
Under UK GAAP provisions for bad and doubtful debts are made so as to record impaired loans at their ultimate net realisable value. Specific provisions are established against individual advances or portfolios of smaller balance homogeneous advances and the general provision covers advances impaired at the balance sheet date but which have not been identified as such. Interest receivable from loans and advances is credited to the income statement as it accrues unless there is significant doubt that it can be collected. | | IFRS require impairment losses on financial assets carried at amortised cost to be measured as the difference between the asset's carrying amount and the present value of estimated future cash flows discounted at the asset's original effective interest rate. There is no concept of specific and general provision – under IFRS impairment is assessed individually for individually significant assets but can be assessed collectively for other assets. Once an impairment loss has been recognised on a financial asset or group of financial assets, interest income is recognised on the carrying amount using the rate of interest at which estimated future cash flows were discounted in measuring impairment. |
165
Notes on the accountscontinued
| Transition to IFRS(continued) | | |
| | | |
| UK GAAP | | IFRS |
|
|
|
| (t) Offset | | |
| Under UK GAAP an intention to settle net is not a requirementfor set off; the entity must have the ability to insist on netsettlement and that ability is assured beyond doubt. | | For a financial asset and a financial liability to be offset, IFRSrequire that an entity must intend to settle on a net basis or torealise the asset and settle the liability simultaneously. On implementation of IAS 32, the balance sheet value of financial assets and financial liabilities increased by £104 billion. |
|
|
|
| (u) Insurance contracts | | |
| All contracts within the life assurance business are accountedfor as insurance contracts and the obligations to policyholderspresented as Long-term assurance liabilities attributable topolicyholders. | | IFRS 4 requires life assurance products to be classifiedbetween insurance contracts and investment contracts. Thelatter are accounted for in accordance with IAS 39. Insurancecontracts continue to be accounted for using the embeddedvalue methodology. |
| | | |
| The value placed on in-force policies includes futureinvestment margins. | | The value of in-force policies excludes any amounts that reflectfuture investment margins. |
|
|
|
| (v) Linked presentation | | |
| FRS 5 ‘Reporting the Substance of Transactions’ allowsqualifying transactions to be presented using the linkedpresentation. | | There is no linked presentation under IFRS. If substantially allthe risks and rewards have been retained, the gross assetsand related funding are presented separately. |
|
|
|
| (w) Extinguishment of liabilities | | |
| Under UK GAAP, recognition of a financial liability ceases onceany transfer of economic benefits to the creditor is no longer likely. | | A financial liability is removed from the balance sheet when,and only when, it is extinguished i.e. when the obligationspecified in the contract is discharged or cancelled or expires. |
166
(2) Analysis of IFRS adjustments, excluding IAS 32, IAS 39 and IFRS 4
Opening balance sheet at 1 January 2004 – Group
| | | UK GAAP
£m | | Dividends
£m | | Income tax
£m | | Leases
£m | | | Consolidation
£m | | | Software
development
costs
£m | | Investment
property
£m | | | Share
based
payment
£m | | Employee
benefits
£m | | Insurance
£m | | | Total
adjustments
£m | | | IFRS
£m |
|
|
|
|
|
|
|
|
|
|
|
|
|
|
|
|
|
|
|
|
|
|
|
|
|
|
|
|
|
|
| Assets | | | | | | | | | | | | | | | | | | | | | | | | | | | | | |
| Cash and balances at central banks | | 3,822 | | — | | — | | — | | | — | | | — | | — | | | — | | — | | — | | | — | | | 3,822 |
| Treasury bills and other eligible bills | | 4,846 | | — | | — | | — | | | — | | | — | | — | | | — | | — | | — | | | — | | | 4,846 |
| Loans and advances to banks | | 54,392 | | — | | — | | — | | | (2 | ) | | — | | — | | | — | | — | | 1,013 | | | 1,011 | | | 55,403 |
| Loans and advances to customers | | 252,531 | | — | | — | | (147 | ) | | 1,798 | | | — | | (448 | ) | | — | | — | | (541 | ) | | 662 | | | 253,193 |
| Debt securities | | 79,949 | | — | | — | | — | | | 123 | | | — | | — | | | — | | — | | 1,076 | | | 1,199 | | | 81,148 |
| Equity shares | | 2,300 | | — | | — | | — | | | — | | | — | | — | | | — | | — | | 1,745 | | | 1,745 | | | 4,045 |
| Intangible assets | | 13,131 | | — | | — | | — | | | — | | | 896 | | — | | | — | | — | | — | | | 896 | | | 14,027 |
| Property, plant and equipment | | 13,927 | | — | | — | | (127 | ) | | 76 | | | (78 | ) | 448 | | | — | | — | | 1 | | | 320 | | | 14,247 |
| Settlement balances | | 2,857 | | — | | — | | — | | | — | | | — | | — | | | — | | — | | — | | | — | | | 2,857 |
| Derivatives at fair value | | 14,087 | | — | | — | | — | | | — | | | — | | — | | | — | | — | | (40 | ) | | (40 | ) | | 14,047 |
| Prepayments, accrued income | | | | | | | | | | | | | | | | | | | | | | | | | | | | | |
| and other assets | | 9,029 | | — | | — | | — | | | 72 | | | 1 | | — | | | — | | (10 | ) | 256 | | | 319 | | | 9,348 |
| Long-term assurance assets | | 3,557 | | — | | — | | — | | | — | | | — | | — | | | — | | — | | (3,557 | ) | | (3,557 | ) | | — |
|
|
|
|
|
|
|
|
|
|
|
|
|
|
|
|
|
|
|
|
|
|
|
|
|
|
|
|
|
|
| Total assets | | 454,428 | | — | | — | | (274 | ) | | 2,067 | | | 819 | | — | | | — | | (10 | ) | (47 | ) | | 2,555 | | | 456,983 |
| | |
|
|
|
|
|
|
|
|
|
|
|
|
|
|
|
|
|
|
|
|
|
|
|
|
|
|
|
|
| |
| Liabilities | | | | | | | | | | | | | | | | | | | | | | | | | | | | | |
| Deposits by banks | | 68,281 | | — | | — | | — | | | — | | | — | | — | | | — | | — | | — | | | — | | | 68,281 |
| Customer accounts | | 236,963 | | — | | — | | — | | | (1,002 | ) | | — | | — | | | — | | — | | (495 | ) | | (1,497 | ) | | 235,466 |
| Debt securities in issue | | 41,016 | | — | | — | | — | | | 3,129 | | | — | | — | | | — | | — | | — | | | 3,129 | | | 44,145 |
| Settlement balances and | | | | | | | | | | | | | | | | | | | | | | | | | | | | | |
| short positions | | 21,369 | | — | | — | | — | | | — | | | — | | — | | | — | | — | | — | | | — | | | 21,369 |
| Derivatives at fair value | | 15,173 | | — | | — | | — | | | — | | | — | | — | | | — | | — | | (105 | ) | | (105 | ) | | 15,068 |
| Accruals, deferred income | | | | | | | | | | | | | | | | | | | | | | | | | | | | | |
| and other liabilities | | 18,779 | | (1,059 | ) | — | | 2 | | | 238 | | | — | | — | | | 6 | | — | | (3,596 | ) | | (4,409 | ) | | 14,370 |
| Retirement benefit liabilities | | 1,445 | | — | | — | | — | | | — | | | — | | — | | | — | | 591 | | — | | | 591 | | | 2,036 |
| Deferred taxation liabilities | | 2,036 | | — | | 109 | | (75 | ) | | 13 | | | 243 | | — | | | (2 | ) | (584 | ) | (4 | ) | | (300 | ) | | 1,736 |
| Insurance liabilities | | — | | — | | — | | — | | | — | | | — | | — | | | — | | — | | 7,781 | | | 7,781 | | | 7,781 |
| Subordinated liabilities | | 16,998 | | — | | — | | — | | | — | | | — | | — | | | — | | — | | — | | | — | | | 16,998 |
| Minority interests | | 2,713 | | — | | — | | — | | | (313 | ) | | 5 | | — | | | — | | — | | (13 | ) | | (321 | ) | | 2,392 |
| Shareholders’ equity | | 26,098 | | 1,059 | | (109 | ) | (201 | ) | | 2 | | | 571 | | — | | | (4 | ) | (17 | ) | (58 | ) | | 1,243 | | | 27,341 |
| Long-term assurance liabilities | | 3,557 | | — | | — | | — | | | — | | | — | | — | | | — | | — | | (3,557 | ) | | (3,557 | ) | | — |
|
|
|
|
|
|
|
|
|
|
|
|
|
|
|
|
|
|
|
|
|
|
|
|
|
|
|
|
|
|
| Total liabilities and equity | | 454,428 | | — | | — | | (274 | ) | | 2,067 | | | 819 | | — | | | — | | (10 | ) | (47 | ) | | 2,555 | | | 456,983 |
| | |
|
|
|
|
|
|
|
|
|
|
|
|
|
|
|
|
|
|
|
|
|
|
|
|
|
|
|
|
167
Notes on the accountscontinued
45 Transition to IFRS(continued)
Opening balance sheet at 1 January 2004 – Company
| | | | UK GAAP
£m | | Dividends
£m | | | Valuation
of
subsidiaries
£m | | | Total
adjustments
£m | | | IFRS
£m | |
|
|
|
|
|
|
|
|
|
|
|
|
|
|
|
|
| Assets | | | | | | | | | | | | | | | |
| Loans and advances to banks | | | 4,257 | | — | | | — | | | — | | | 4,257 | |
| Loans and advances to customers | | | 382 | | — | | | — | | | — | | | 382 | |
| Investments in Group undertakings | | | 32,354 | | — | | | (16,857 | ) | | (16,857 | ) | | 15,497 | |
| Prepayments, accrued income and other assets | | | 355 | | — | | | — | | | — | | | 355 | |
|
|
|
|
|
|
|
|
|
|
|
|
|
|
|
|
| Total assets | | | 37,348 | | — | | | (16,857 | ) | | (16,857 | ) | | 20,491 | |
| | |
|
|
|
|
|
|
|
|
|
|
|
|
|
| |
| |
| Liabilities | | | | | | | | | | | | | | | |
| Deposits by banks | | | 156 | | — | | | — | | | — | | | 156 | |
| Debt securities in issue | | | 1,877 | | — | | | — | | | — | | | 1,877 | |
| Accruals, deferred income and other liabilities | | | 1,377 | | (1,059 | ) | | — | | | (1,059 | ) | | 318 | |
| Subordinated liabilities | | | 5,393 | | — | | | — | | | — | | | 5,393 | |
| Shareholders’ equity | | | 28,545 | | 1,059 | | | (16,857 | ) | | (15,798 | ) | | 12,747 | |
|
|
|
|
|
|
|
|
|
|
|
|
|
|
|
|
| Total liabilities and equity | | | 37,348 | | — | | | (16,857 | ) | | (16,857 | ) | | 20,491 | |
| |
|
|
|
|
|
|
|
|
|
|
|
|
|
|
| |
| Reconciliation of shareholders’ funds as at 1 January 2004 | | | | | | | | | | | | | | | |
| | | | | | | | | | | | Group
£m | | | Company
£m | |
|
|
|
|
|
|
|
|
|
|
|
|
|
|
|
|
| UK GAAP shareholders’ funds | | | | | | | | | | | 26,098 | | | 28,545 | |
| Standards applicable to all periods: | | | | | | | | | | | | | | | |
| Valuation of subsidiaries | | | | | | | | | | | — | | | (16,857 | ) |
| Proposed dividend | | | | | | | | | | | 1,059 | | | 1,059 | |
| Software development costs | | | | | | | | | | | 814 | | | –– | |
| Leasing | | | | | | | | | | | (276 | ) | | –– | |
| Share-based payments | | | | | | | | | | | (6 | ) | | –– | |
| Other | | | | | | | | | | | (72 | ) | | –– | |
| Tax effect on adjustments | | | | | | | | | | | (167 | ) | | –– | |
| Deferred tax | | | | | | | | | | | (109 | ) | | –– | |
|
|
|
|
|
|
|
|
|
|
|
|
|
|
|
|
| Shareholders' funds under IFRS | | | | | | | | | | | 27,341 | | | 12,747 | |
| | | | | | | | | |
|
|
|
|
|
|
168
Balance sheet at 31 December 2004 – Group
| | | UK GAAP
£m | | Dividends
£m | | | Income tax
£m | | | Property
plant and
equipment
£m | | | Leases
£m | | | Consolidation
£m | | | Software
development
costs
£m | | | Investment
property
£m | | | Share
based
payment
£m | | Employee
benefits
£m | | | Insurance
£m | | | Goodwill
£m | | | Total
adjustments
£m | | | IFRS
£m |
|
|
|
|
|
|
|
|
|
|
|
|
|
|
|
|
|
|
|
|
|
|
|
|
|
|
|
|
|
|
|
|
|
|
|
|
|
|
|
|
| Assets | | | | | | | | | | | | | | | | | | | | | | | | | | | | | | | | | | | | | | | |
| Cash and balances at | | | | | | | | | | | | | | | | | | | | | | | | | | | | | | | | | | | | | | | |
| central banks | | 4,293 | | — | | | — | | | — | | | — | | | — | | | — | | | — | | | — | | — | | | — | | | — | | | — | | | 4,293 |
| Treasury bills and other | | | | | | | | | | | | | | | | | | | | | | | | | | | | | | | | | | | | | | | |
| eligible bills | | 6,110 | | — | | | — | | | — | | | — | | | — | | | — | | | — | | | — | | — | | | — | | | — | | | — | | | 6,110 |
| Loans and advances | | | | | | | | | | | | | | | | | | | | | | | | | | | | | | | | | | | | | | | |
| to banks | | 60,889 | | — | | | — | | | — | | | — | | | (2 | ) | | — | | | — | | | — | | — | | | 186 | | | — | | | 184 | | | 61,073 |
| Loans and advances | | | | | | | | | | | | | | | | | | | | | | | | | | | | | | | | | | | | | | | |
| to customers | | 345,469 | | — | | | — | | | — | | | (132 | ) | | 3,173 | | | — | | | (449 | ) | | — | | — | | | (810 | ) | | — | | | 1,782 | | | 347,251 |
| Debt securities | | 91,211 | | — | | | — | | | — | | | — | | | 618 | | | — | | | — | | | — | | — | | | 2,079 | | | — | | | 2,697 | | | 93,908 |
| Equity shares | | 2,960 | | — | | | — | | | — | | | — | | | — | | | — | | | — | | | — | | — | | | 1,763 | | | — | | | 1,763 | | | 4,723 |
| Intangible assets | | 17,576 | | — | | | — | | | — | | | — | | | — | | | 725 | | | — | | | — | | — | | | — | | | 941 | | | 1,666 | | | 19,242 |
| Property, plant and | | | | | | | | | | | | | | | | | | | | | | | | | | | | | | | | | | | | | | | |
| equipment | | 16,294 | | — | | | — | | | (60 | ) | | (153 | ) | | 67 | | | (168 | ) | | 447 | | | — | | — | | | 1 | | | — | | | 134 | | | 16,428 |
| Settlement balances | | 5,682 | | — | | | — | | | — | | | — | | | — | | | — | | | — | | | — | | — | | | — | | | — | | | — | | | 5,682 |
| Derivatives at fair value | | 17,884 | | — | | | — | | | — | | | — | | | (37 | ) | | — | | | — | | | — | | — | | | (47 | ) | | — | | | (84 | ) | | 17,800 |
| Prepayments, accrued | | | | | | | | | | | | | | | | | | | | | | | | | | | | | | | | | | | | | | | |
| income and other | | | | | | | | | | | | | | | | | | | | | | | | | | | | | | | | | | | | | | | |
| assets | | 11,299 | | — | | | — | | | — | | | (9 | ) | | 118 | | | — | | | 1 | | | — | | (4 | ) | | 283 | | | (76 | ) | | (313 | ) | | 11,612 |
| Long-term assurance | | | | | | | | | | | | | | | | | | | | | | | | | | | | | | | | | | | | | | | |
| assets | | 3,800 | | — | | | — | | | — | | | — | | | — | | | — | | | — | | | — | | — | | | (3,800 | ) | | — | | | (3,800 | ) | | — |
|
|
|
|
|
|
|
|
|
|
|
|
|
|
|
|
|
|
|
|
|
|
|
|
|
|
|
|
|
|
|
|
|
|
|
|
|
|
|
|
| Total assets | | 583,467 | | — | | | — | | | (60 | ) | | (294 | ) | | 3,937 | | | 557 | | | (1 | ) | | — | | (4 | ) | | (345 | ) | | 865 | | | 4,655 | | | 588,122 |
| |
|
|
|
|
|
|
|
|
|
|
|
|
|
|
|
|
|
|
|
|
|
|
|
|
|
|
|
|
|
|
|
|
|
|
|
| Liabilities | | | | | | | | | | | | | | | | | | | | | | | | | | | | | | | | | | | | | | | |
| Deposits by banks | | 99,883 | | — | | | — | | | — | | | — | | | — | | | — | | | — | | | — | | — | | | — | | | — | | | — | | | 99,883 |
| Customer accounts | | 285,062 | | — | | | — | | | — | | | — | | | (1,015 | ) | | — | | | — | | | — | | — | | | (732 | ) | | — | | | (1,747 | ) | | 283,315 |
| Debt securities | | | | | | | | | | | | | | | | | | | | | | | | | | | | | | | | | | | | | | | |
| in issue | | 58,960 | | — | | | — | | | — | | | — | | | 5,039 | | | — | | | — | | | — | | — | | | — | | | — | | | 5,039 | | | 63,999 |
| Settlement balances | | | | | | | | | | | | | | | | | | | | | | | | | | | | | | | | | | | | | | | |
| and short positions | | 32,990 | | — | | | — | | | — | | | — | | | — | | | — | | | — | | | — | | — | | | — | | | — | | | — | | | 32,990 |
| Derivatives at fair value | | 19,034 | | — | | | — | | | — | | | — | | | — | | | — | | | — | | | — | | — | | | (158 | ) | | — | | | (158 | ) | | 18,876 |
| Accruals, deferred | | | | | | | | | | | | | | | | | | | | | | | | | | | | | | | | | | | | | | | |
| income and other | | | | | | | | | | | | | | | | | | | | | | | | | | | | | | | | | | | | | | | |
| liabilities | | 22,904 | | (1,308 | ) | | — | | | — | | | 25 | | | 258 | | | — | | | — | | | 20 | | — | | | (4,251 | ) | | — | | | (5,256 | ) | | 17,648 |
| Retirement benefit | | | | | | | | | | | | | | | | | | | | | | | | | | | | | | | | | | | | | | | |
| liabilities | | 1,901 | | — | | | — | | | — | | | — | | | 14 | | | — | | | — | | | — | | 1,025 | | | — | | | — | | | 1,039 | | | 2,940 |
| Deferred taxation | | | | | | | | | | | | | | | | | | | | | | | | | | | | | | | | | | | | | | | |
| liabilities | | 2,873 | | — | | | 109 | | | — | | | (90 | ) | | 9 | | | 164 | | | 1 | | | (6 | ) | (1,008 | ) | | 12 | | | (3 | ) | | (812 | ) | | 2,061 |
| Insurance liabilities | | — | | — | | | — | | | — | | | — | | | — | | | — | | | — | | | — | | — | | | 8,647 | | | — | | | 8,647 | | | 8,647 |
| Subordinated liabilities | | 20,366 | | — | | | — | | | — | | | — | | | — | | | — | | | — | | | — | | — | | | — | | | — | | | — | | | 20,366 |
| Minority interests | | 3,829 | | — | | | — | | | — | | | — | | | (334 | ) | | 6 | | | — | | | — | | — | | | (9 | ) | | — | | | (337 | ) | | 3,492 |
| Shareholders’ equity | | 31,865 | | 1,308 | | | (109 | ) | | (60 | ) | | (229 | ) | | (34 | ) | | 387 | | | (2 | ) | | (14 | ) | (21 | ) | | (54 | ) | | 868 | | | 2,040 | | | 33,905 |
| Long-term assurance | | | | | | | | | | | | | | | | | | | | | | | | | | | | | | | | | | | | | | | |
| liabilities | | 3,800 | | — | | | — | | | — | | | — | | | — | | | — | | | — | | | — | | — | | | (3,800 | ) | | — | | | (3,800 | ) | | — |
|
|
|
|
|
|
|
|
|
|
|
|
|
|
|
|
|
|
|
|
|
|
|
|
|
|
|
|
|
|
|
|
|
|
|
|
|
|
|
|
| Total liabilities | | | | | | | | | | | | | | | | | | | | | | | | | | | | | | | | | | | | | | | |
| and equity | | 583,467 | | — | | | — | | | (60 | ) | | (294 | ) | | 3,937 | | | 557 | | | (1 | ) | | — | | (4 | ) | | (345 | ) | | 865 | | | 4,655 | | | 588,122 |
| |
|
|
|
|
|
|
|
|
|
|
|
|
|
|
|
|
|
|
|
|
|
|
|
|
|
|
|
|
|
|
|
|
|
|
|
169
Notes on the accountscontinued
45 Transition to IFRS(continued)
Balance sheet at 31 December 2004 – Company
| | | UK GAAP
£m | | Dividends
£m | | | Valuation
of
subsidiaries
£m | | | Total
adjustments
£m | | | IFRS
£m |
|
|
|
|
|
|
|
|
|
|
|
|
|
|
| Assets | | | | | | | | | | | | | |
| Loans and advances to banks | | 4,106 | | — | | | — | | | — | | | 4,106 |
| Loans and advances to customers | | 305 | | — | | | — | | | — | | | 305 |
| Investments in Group undertakings | | 36,870 | | — | | | (14,970 | ) | | (14,970 | ) | | 21,900 |
| Prepayments, accrued income and other assets | | 322 | | (4 | ) | | — | | | (4 | ) | | 318 |
|
|
|
|
|
|
|
|
|
|
|
|
|
|
| Total assets | | 41,603 | | (4 | ) | | (14,970 | ) | | (14,974 | ) | | 26,629 |
| |
|
|
|
|
|
|
|
|
|
|
|
|
| |
| Liabilities | | | | | | | | | | | | | |
| Deposits by banks | | 174 | | — | | | — | | | — | | | 174 |
| Debt securities in issue | | 1,608 | | — | | | — | | | — | | | 1,608 |
| Accruals, deferred income and other liabilities | | 1,609 | | (1,308 | ) | | — | | | (1,308 | ) | | 301 |
| Subordinated liabilities | | 5,935 | | — | | | — | | | — | | | 5,935 |
| Shareholders’ equity | | 32,277 | | 1,304 | | | (14,970 | ) | | (13,666 | ) | | 18,611 |
|
|
|
|
|
|
|
|
|
|
|
|
|
|
| Total liabilities | | 41,603 | | (4 | ) | | (14,970 | ) | | (14,974 | ) | | 26,629 |
|
|
|
|
|
|
|
|
|
|
|
|
|
|
Consolidated income statement for the year ended 31 December 2004
| | | UK GAAP
£m | | Property,
including
investment
property
£m | | | Leases
£m | | | Consolidation
£m | | | Software
development
costs
£m | | | Share
based
payments
£m | | | Employee
benefits
£m | | | Insurance
£m | | | Goodwill
£m | | | Other
£m | | | Total
adjustments
£m | | | IFRS
£m |
|
|
|
|
|
|
|
|
|
|
|
|
|
|
|
|
|
|
|
|
|
|
|
|
|
|
|
|
|
|
|
|
|
|
|
| Net interest income | | 9,208 | | (21 | ) | | (18 | ) | | (67 | ) | | 16 | | | — | | | — | | | (47 | ) | | — | | | — | | | (137 | ) | | 9,071 |
| Non-interest income | | 8,602 | | 22 | | | 27 | | | (142 | ) | | — | | | — | | | (85 | ) | | 251 | | | — | | | (2 | ) | | 71 | | | 8,673 |
| Insurance net premium income | | 4,944 | | — | | | — | | | 109 | | | — | | | — | | | — | | | 594 | | | — | | | — | | | 703 | | | 5,647 |
|
|
|
|
|
|
|
|
|
|
|
|
|
|
|
|
|
|
|
|
|
|
|
|
|
|
|
|
|
|
|
|
|
|
|
| Total income | | 22,754 | | 1 | | | 9 | | | (100 | ) | | 16 | | | — | | | (85 | ) | | 798 | | | — | | | (2 | ) | | 637 | | | 23,391 |
| Operating expenses | | 10,846 | | 5 | | | 49 | | | 2 | | | 278 | | | 36 | | | (83 | ) | | 106 | | | (875 | ) | | (2 | ) | | (484 | ) | | 10,362 |
| Insurance net claims | | 3,480 | | — | | | — | | | 78 | | | — | | | — | | | — | | | 702 | | | — | | | — | | | 780 | | | 4,260 |
|
|
|
|
|
|
|
|
|
|
|
|
|
|
|
|
|
|
|
|
|
|
|
|
|
|
|
|
|
|
|
|
|
|
|
| Operating profit before | | | | | | | | | | | | | | | | | | | | | | | | | | | | | | | | | | |
| impairment losses | | 8,428 | | (4 | ) | | (40 | ) | | (180 | ) | | (262 | ) | | (36 | ) | | (2 | ) | | (10 | ) | | 875 | | | — | | | 341 | | | 8,769 |
| Impairment losses | | 1,511 | | — | | | — | | | (26 | ) | | — | | | — | | | — | | | — | | | — | | | — | | | (26 | ) | | 1,485 |
|
|
|
|
|
|
|
|
|
|
|
|
|
|
|
|
|
|
|
|
|
|
|
|
|
|
|
|
|
|
|
|
|
|
|
| Operating profit before tax | | 6,917 | | (4 | ) | | (40 | ) | | (154 | ) | | (262 | ) | | (36 | ) | | (2 | ) | | (10 | ) | | 875 | | | — | | | 367 | | | 7,284 |
| Tax | | 2,155 | | 1 | | | (12 | ) | | (40 | ) | | (79 | ) | | (11 | ) | | — | | | (17 | ) | | (2 | ) | | — | | | (160 | ) | | 1,995 |
|
|
|
|
|
|
|
|
|
|
|
|
|
|
|
|
|
|
|
|
|
|
|
|
|
|
|
|
|
|
|
|
|
|
|
| Profit for the year | | 4,762 | | (5 | ) | | (28 | ) | | (114 | ) | | (183 | ) | | (25 | ) | | (2 | ) | | 7 | | | 877 | | | — | | | 527 | | | 5,289 |
| |
|
|
|
|
|
|
|
|
|
|
|
|
|
|
|
|
|
|
|
|
|
|
|
|
|
|
|
|
|
|
|
|
|
Company income statement for the year ended 31 December 2004
| | | UK GAAP
£m | | Other
£m | | | Total
Adjustments
£m | | | IFRS
£m |
|
|
|
|
|
|
|
|
|
|
|
| |
| Profit for the year | | 2,878 | | (4 | ) | | (4 | ) | | 2,874 |
| |
|
|
|
|
|
|
|
|
|
170
(3) Analysis of IAS 32, IAS 39 and IFRS 4 adjustments
Balance sheet at 1 January 2005 – Group
| | | IFRS prospective adjustments |
| | |
|
|
|
|
|
|
|
|
|
|
|
|
|
|
|
|
|
|
|
|
|
|
|
|
|
|
|
|
|
|
|
|
|
|
|
|
|
|
|
|
|
|
| | | IFRS
31 December
2004
£m | | Offset
£m | | | Other
IAS 39
£m | | | Debt
equity
£m | | | Classification/
measurement
£m | | | Embedded
derivatives
£m | | | Provisioning
and
impairment
£m | | | Hedging/
measurement
£m | | | Derecognition
£m | | | Revenue
recognition
£m | | | Insurance
contracts
£m | | | Fair
value
option
£m | | | Other
£m | | | Total
adjustments
£m | | | IFRS
1 January
2005
£m |
|
|
|
|
|
|
|
|
|
|
|
|
|
|
|
|
|
|
|
|
|
|
|
|
|
|
|
|
|
|
|
|
|
|
|
|
|
|
|
|
|
|
|
|
| Assets | | | | | | | | | | | | | | | | | | | | | | | | | | | | | | | | | | | | | | | | | | | |
| Cash and balances at | | | | | | | | | | | | | | | | | | | | | | | | | | | | | | | | | | | | | | | | | | | |
| central banks | | 4,293 | | — | | | — | | | — | | | — | | | — | | | — | | | — | | | — | | | — | | | — | | | — | | | — | | | — | | | 4,293 |
| Treasury bills and | | | | | | | | | | | | | | | | | | | | | | | | | | | | | | | | | | | | | | | | | | | |
| other eligible bills | | 6,110 | | — | | | — | | | — | | | (1 | ) | | — | | | — | | | — | | | — | | | — | | | — | | | — | | | — | | | (1 | ) | | 6,109 |
| Loans and advances | | | | | | | | | | | | | | | | | | | | | | | | | | | | | | | | | | | | | | | | | | | |
| to banks | | 61,073 | | 4,425 | | | 165 | | | — | | | — | | | — | | | — | | | 4 | | | — | | | — | | | 23 | | | — | | | 1 | | | 4,618 | | | 65,691 |
| Loans and advances | | | | | | | | | | | | | | | | | | | | | | | | | | | | | | | | | | | | | | | | | | | |
| to customers | | 347,251 | | 28,566 | | | 1,533 | | | — | | | (31 | ) | | — | | | (82 | ) | | 518 | | | 4,022 | | | (615 | ) | | — | | | — | | | — | | | 33,911 | | | 381,162 |
| Debt securities | | 93,908 | | — | | | 747 | | | — | | | (241 | ) | | — | | | — | | | 50 | | | (580 | ) | | — | | | 31 | | | — | | | — | | | 7 | | | 93,915 |
| Equity shares | | 4,723 | | — | | | — | | | — | | | 507 | | | — | | | — | | | — | | | — | | | — | | | — | | | — | | | 1 | | | 508 | | | 5,231 |
| Intangible assets | | 19,242 | | — | | | — | | | — | | | — | | | — | | | — | | | — | | | — | | | — | | | — | | | — | | | — | | | — | | | 19,242 |
| Property, plant and | | | | | | | | | | | | | | | | | | | | | | | | | | | | | | | | | | | | | | | | | | | |
| equipment | | 16,428 | | — | | | — | | | — | | | — | | | — | | | — | | | — | | | — | | | (3 | ) | | — | | | — | | | — | | | (3 | ) | | 16,425 |
| Settlement balances | | 5,682 | | — | | | — | | | — | | | — | | | — | | | — | | | — | | | — | | | — | | | — | | | — | | | — | | | — | | | 5,682 |
| Derivatives at fair value | | 17,800 | | 71,509 | | | — | | | — | | | (18 | ) | | 114 | | | — | | | 520 | | | — | | | — | | | — | | | (20 | ) | | — | | | 72,105 | | | 89,905 |
| Prepayments, | | | | | | | | | | | | | | | | | | | | | | | | | | | | | | | | | | | | | | | | | | | |
| accrued income | | | | | | | | | | | | | | | | | | | | | | | | | | | | | | | | | | | | | | | | | | | |
| and other assets | | 11,612 | | (29 | ) | | (2,445 | ) | | — | | | (1 | ) | | 3 | | | — | | | (379 | ) | | 327 | | | (90 | ) | | (142 | ) | | — | | | (1 | ) | | (2,757 | ) | | 8,855 |
|
|
|
|
|
|
|
|
|
|
|
|
|
|
|
|
|
|
|
|
|
|
|
|
|
|
|
|
|
|
|
|
|
|
|
|
|
|
|
|
|
|
|
|
| Total assets | | 588,122 | | 104,471 | | | — | | | — | | | 215 | | | 117 | | | (82 | ) | | 713 | | | 3,769 | | | (708 | ) | | (88 | ) | | (20 | ) | | 1 | | | 108,388 | | | 696,510 |
| |
|
|
|
|
|
|
|
|
|
|
|
|
|
|
|
|
|
|
|
|
|
|
|
|
|
|
|
|
|
|
|
|
|
|
|
|
|
|
|
|
|
|
| | | | | | | | | | | | | | | | | | | | | | | | | | | | | | | | | | | | | | | | | | | | |
| Liabilities | | | | | | | | | | | | | | | | | | | | | | | | | | | | | | | | | | | | | | | | | | | |
| Deposits by banks | | 99,883 | | 4,425 | | | 207 | | | — | | | — | | | — | | | — | | | 10 | | | 1,501 | | | — | | | — | | | — | | | | | | 6,143 | | | 106,026 |
| Customer accounts | | 283,315 | | 28,566 | | | 937 | | | — | | | (2 | ) | | (39 | ) | | — | | | (11 | ) | | 177 | | | — | | | 2,102 | | | — | | | 1 | | | 31,731 | | | 315,046 |
| Debt securities in issue | | 63,999 | | — | | | 342 | | | — | | | (25 | ) | | — | | | — | | | (1,060 | ) | | 2,131 | | | — | | | — | | | 858 | | | — | | | 2,246 | | | 66,245 |
| Settlement balances | | | | | | | | | | | | | | | | | | | | | | | | | | | | | | | | | | | | | | | | | | | |
| and short positions | | 32,990 | | — | | | 349 | | | — | | | — | | | — | | | — | | | — | | | — | | | — | | | — | | | — | | | — | | | 349 | | | 33,339 |
| Derivatives at fair value | | 18,876 | | 71,509 | | | — | | | — | | | (19 | ) | | 188 | | | — | | | 1,599 | | | — | | | — | | | — | | | (876 | ) | | — | | | 72,401 | | | 91,277 |
| Accruals, deferred | | | | | | | | | | | | | | | | | | | | | | | | | | | | | | | | | | | | | | | | | | | |
| income and other | | | | | | | | | | | | | | | | | | | | | | | | | | | | | | | | | | | | | | | | | | | |
| assets | | 17,648 | | (29 | ) | | (2,346 | ) | | (60 | ) | | 32 | | | (32 | ) | | — | | | (636 | ) | | 130 | | | 224 | | | (162 | ) | | (49 | ) | | — | | | (2,928 | ) | | 14,720 |
| Retirement benefit | | | | | | | | | | | | | | | | | | | | | | | | | | | | | | | | | | | | | | | | | | | |
| liablities | | 2,940 | | — | | | — | | | — | | | — | | | — | | | — | | | — | | | — | | | — | | | — | | | — | | | — | | | — | | | 2,940 |
| Deferred taxation | | | | | | | | | | | | | | | | | | | | | | | | | | | | | | | | | | | | | | | | | | | |
| liabilities | | 2,061 | | — | | | — | | | — | | | 65 | | | — | | | (24 | ) | | 12 | | | (51 | ) | | (283 | ) | | 46 | | | — | | | — | | | (235 | ) | | 1,826 |
| Insurance liabilities | | 8,647 | | — | | | — | | | — | | | — | | | — | | | — | | | — | | | — | | | — | | | (2,055 | ) | | — | | | — | | | (2,055 | ) | | 6,592 |
| Subordinated liabilities | | 20,366 | | — | | | 511 | | | 5,820 | | | — | | | — | | | — | | | 782 | | | — | | | — | | | — | | | 47 | | | — | | | 7,160 | | | 27,526 |
| Minority interests | | 3,492 | | — | | | — | | | (2,493 | ) | | — | | | — | | | — | | | — | | | — | | | — | | | (48 | ) | | — | | | — | | | (2,541 | ) | | 951 |
| Shareholders’ equity | | 33,905 | | — | | | — | | | (3,267 | ) | | 164 | | | — | | | (58 | ) | | 17 | | | (119 | ) | | (649 | ) | | 29 | | | — | | | — | | | (3,883 | ) | | 30,022 |
|
|
|
|
|
|
|
|
|
|
|
|
|
|
|
|
|
|
|
|
|
|
|
|
|
|
|
|
|
|
|
|
|
|
|
|
|
|
|
|
|
|
|
|
| Total liabilities | | | | | | | | | | | | | | | | | | | | | | | | | | | | | | | | | | | | | | | | | | | |
| and equity | | 588,122 | | 104,471 | | | — | | | — | | | 215 | | | 117 | | | (82 | ) | | 713 | | | 3,769 | | | (708 | ) | | (88 | ) | | (20 | ) | | 1 | | | 108,388 | | | 696,510 |
| |
|
|
|
|
|
|
|
|
|
|
|
|
|
|
|
|
|
|
|
|
|
|
|
|
|
|
|
|
|
|
|
|
|
|
|
|
|
|
|
|
|
|
171
Notes on the accountscontinued45 Transition to IFRS(continued)
Balance sheet at 1 January 2005 – Company
| | | IFRS prospective adjustments |
| | |
|
|
|
|
|
|
|
|
|
|
|
|
|
|
|
|
|
|
|
| | | IFRS
31 December
2004
£m | | Debt/
equity
£m | | | Other
IAS 32/39
£m | | | Hedging &
measurement
£m | | | Fair
value
option
£m | | | Total
adjustments
£m | | | IFRS
1 January
2005
£m | |
|
|
|
|
|
|
|
|
|
|
|
|
|
|
|
|
|
|
|
|
|
| Assets | | | | | | | | | | | | | | | | | | | | |
| Loans and advances to banks | | 4,106 | | 3,959 | | | 91 | | | — | | | — | | | 4,050 | | | 8,156 | |
| Loans and advances to customers | | 305 | | 153 | | | 95 | | | — | | | — | | | 248 | | | 553 | |
| Investment in Group undertakings | | 21,900 | | (4,004 | ) | | — | | | — | | | — | | | (4,004 | ) | | 17,896 | |
| Derivatives at fair value | | — | | — | | | 101 | | | 4 | | | — | | | 105 | | | 105 | |
| Prepayments, accrued income and other assets | | 318 | | — | | | (287 | ) | | (17 | ) | | — | | | (304 | ) | | 14 | |
|
|
|
|
|
|
|
|
|
|
|
|
|
|
|
|
|
|
|
|
|
| Total assets | | 26,629 | | 108 | | | — | | | (13 | ) | | — | | | 95 | | | 26,724 | |
| | |
|
|
|
|
|
|
|
|
|
|
|
|
|
|
|
|
|
|
|
| | | | | | | | | | | | | | | | | | | | | |
| Liabilities | | | | | | | | | | | | | | | | | | | | |
| Deposits by banks | | 174 | | — | | | — | | | — | | | — | | | — | | | 174 | |
| Debt securities in issue | | 1,608 | | — | | | 6 | | | — | | | — | | | 6 | | | 1,614 | |
| Derivatives at fair value | | — | | — | | | 96 | | | — | | | — | | | 96 | | | 96 | |
| Accruals, deferred income and other liabilities | | 301 | | (31 | ) | | (146 | ) | | — | | | (45 | ) | | (222 | ) | | 79 | |
| Subordinated liabilities | | 5,935 | | 3,219 | | | 44 | | | — | | | 45 | | | 3,308 | | | 9,243 | |
| Shareholders’ funds | | 18,611 | | (3,080 | ) | | — | | | (13 | ) | | — | | | (3,093 | ) | | 15,518 | |
|
|
|
|
|
|
|
|
|
|
|
|
|
|
|
|
|
|
|
|
|
| Total liabilities | | 26,629 | | 108 | | | — | | | (13 | ) | | — | | | 95 | | | 26,724 | |
| | |
|
|
|
|
|
|
|
|
|
|
|
|
|
|
|
|
|
|
|
| | | | | | | | | | | | | | | | | | | | | |
| Reconciliation of shareholders’ funds | | | | | | | | | | | | | Group
£m | | | | | | Company
£m | |
|
|
|
|
|
|
|
|
|
|
|
|
|
|
|
|
|
|
|
|
|
| UK GAAP shareholders’ funds at 31 December 2004 | | | | | | | | | | | | | 31,865 | | | | | | 32,277 | |
| Standards applicable to all periods: | | | | | | | | | | | | | | | | | | | | |
| Valuation of subsidiaries | | | | | | | | | | | | | — | | | | | | (14,970 | ) |
| Proposed dividend | | | | | | | | | | | | | 1,308 | | | | | | 1,308 | |
| Goodwill and other intangibles | | | | | | | | | | | | | 865 | | | | | | — | |
| Software development costs | | | | | | | | | | | | | 551 | | | | | | — | |
| Leasing | | | | | | | | | | | | | (319 | ) | | | | | — | |
| Share-based payments | | | | | | | | | | | | | (20 | ) | | | | | — | |
| Other | | | | | | | | | | | | | (159 | ) | | | | | (4 | ) |
| Tax effect on adjustments | | | | | | | | | | | | | (77 | ) | | | | | — | |
| Deferred tax | | | | | | | | | | | | | (109 | ) | | | | | — | |
|
|
|
|
|
|
|
|
|
|
|
|
|
|
|
|
|
|
|
|
|
| Shareholders’ funds under IFRS at 31 December 2004 | | | | | | | | | 33,905 | | | | | | 18,611 | |
| Standards applicable from 1 January 2005: | | | | | | | | | | | | | | | | | | | | |
| Non-equity shares reclassified to debt | | | | | | | | | | | | | (3,192 | ) | | | | | (3,192 | ) |
| Revenue recognition | | | | | | | | | | | | | (932 | ) | | | | | — | |
| Derecognition | | | | | | | | | | | | | (170 | ) | | | | | — | |
| Securities | | | | | | | | | | | | | 229 | | | | | | — | |
| Investments in Group undertakings adjusted to historic cost | | | | | | | | | | | | | — | | | | | | 108 | |
| Other | | | | | | | | | | | | | (53 | ) | | | | | (14 | ) |
| Tax effect on adjustments | | | | | | | | | | | | | 235 | | | | | | 5 | |
|
|
|
|
|
|
|
|
|
|
|
|
|
|
|
|
|
|
|
|
|
| Shareholders’ funds under IFRS at 1 January 2005 | | | | | | | | | | | | | 30,022 | | | | | | 15,518 | |
| Equity – minority interests | | | | | | | | | | | | | 951 | | | | | | — | |
|
|
|
|
|
|
|
|
|
|
|
|
|
|
|
|
|
|
|
|
|
| Equity under IFRS at 1 January 2005 | | | | | | | | | | | | | 30,973 | | | | | | 15,518 | |
| | | | | | | | | | | | | |
|
|
|
|
|
|
|
|
| | | Group | | Company |
| | |
|
|
| |
|
|
|
| As at 1 January 2005 | | Fair value on
implementation
of IAS 39
£m | | Carrying value
under UK GAAP
£m | | Fair value on
implementation
of IAS 39
£m | | Carrying value
under UK GAAP
£m |
|
|
|
|
|
|
|
|
|
| Financial assets | | | | | | | | |
| – designated as at fair value through profit or loss | | 2,579 | | 2,728 | | — | | — |
| – Available-for-sale | | 40,161 | | 39,718 | | — | | — |
| | | | | | | | | |
| Financial liabilities | | | | | | | | |
| – designated as at fair value through profit or loss | | 9,976 | | 10,071 | | — | | — |
|
|
|
|
|
|
|
|
|
172
46 Significant differences between IFRS and US GAAPThe consolidated accounts of the Group have been prepared in accordance with IFRS issued and extant at 31 December 2005 which differ in certain significant respects from US GAAP. The significant differences which affect the Group are summarised below in three separate sections:
Section (1) covers significant differences between US GAAP and IFRS for the income statement for the year ended 31 December 2005 and the balance sheet at 31 December 2005. These differences include those between US GAAP and IAS 32, IAS 39 and IFRS 4. As permitted by IFRS 1, the Group implemented IAS 32, IAS 39 and IFRS 4 from 1 January 2005 without restating comparatives.
Section (2) sets out the significant differences between US GAAP and IFRS for 2004.
Section (3) summarises those areas where, though the recognition and measurement principles in US GAAP and IFRS are the same, adjustments to IFRS amounts are required due to differing implementation dates for the Group.
(1) For 31 December 2005
| IFRS | | US GAAP |
|
|
|
| (a) Acquisition accounting | | |
| All integration costs relating to acquisitions are expensed aspost-acquisition expenses. | | Certain restructuring and exit costs incurred in the acquiredbusiness are treated as liabilities assumed on acquisition and taken into account in the calculation of goodwill. |
|
|
|
| (b) Property revaluation and depreciation | | |
| Freehold and long leasehold property occupied for the Group'suse is carried at cost less accumulated depreciation.Depreciation is charged based on an estimated useful life of50 years. As permitted by IFRS 1, valuation as at 31 December2003 is its deemed cost. | | Under US GAAP, revaluations of property are not permitted.Depreciation is charged, and gains or losses on disposal arebased on the historical cost for both own-use and investmentproperties. |
| | | |
| Investment properties are carried at fair value; changes in fairvalue are included in the income statement. | | |
|
|
|
| (c) Leasehold property provisions | | |
| Provisions are recognised on leasehold properties when thereis a commitment to vacate the property. | | Provisions are recognised on leasehold properties at the timethe property is vacated. |
|
|
|
| (d) Loan origination | | |
| Only costs that are incremental and directly attributable to theorigination of a loan are deferred over the period of the relatedloan or facility. | | Certain direct (but not necessarily incremental) costs aredeferred and recognised over the period of the related loan orfacility. |
|
|
|
| (e) Pension costs | | |
| Pension scheme assets are measured at their fair value.Scheme liabilities are measured on anactuarial basis using the projected unit method and discountedat the current rate of return on a high quality corporate bond of equivalent term andcurrency. Any surplus or deficit of scheme assets comparedwith liabilities is recognised in the balance sheet as an asset(surplus) or liability (deficit). An asset is only recognised to theextent that the surplus can be recovered through reducedcontributions in the future or through refunds from the scheme. | | US GAAP requires a similar method but allows a certainportion of actuarial gains and losses to be deferred andallocated in equal amounts over the average remaining servicelives of current employees. An additional minimum liabilitymust be recognised if the accumulated benefit obligation (thecurrent value of accrued benefits without allowance for futuresalary increases) exceeds the fair value of plan assets and theGroup has recorded a prepaid pension cost or has an accruedliability that is less than the unfunded accumulated benefitobligation. Movements in the additional minimum liability, together with the related deferred tax, are recognised in a separate component of equity. |
|
|
|
173
Notes on the accountscontinued46 Significant differences between IFRS and US GAAP(continued)
| IFRS | | US GAAP |
|
|
|
| (f) Long-term assurance business | | |
| IFRS requires bancassurance contracts to be analysedbetween insurance and investment contracts. Investmentcontracts are accounted for as financial instruments. Insurancecontracts are accounted for using an embedded valuemethodology: the shareholders’ interest in the long-termassurance fund is valued as the discounted value of the cashflows expected to be generated from in-force policies togetherwith net assets in excess of the statutory liabilities. | | US GAAP also requires bancassurance contracts to beclassified either as insurance or investment contracts; howeverUS GAAP does not permit embedded value reporting. US GAAP requires deferred acquisition cost and incomeaccounting for all contracts. Where investment contract policycharges benefit future periods, they are deferred andamortised. |
|
|
|
| (g) Financial instruments | | |
| Financial assets designated as at fair value through profit or loss | | Such designation is not allowed under US GAAP. |
| Under IFRS, a financial asset may be designated as at fairvalue through profit or loss on initial recognition. | | |
| | | |
| | | |
Debt securities classified as loans and receivables
Non-derivative financial assets with fixed or determinablerepayments that are not quoted in an active market areclassified as loans and receivables except those that areclassified as held-to-maturity, held-for-trading, available-for-saleor designated as at fair value through profit or loss. Loans andreceivables are initially recognised at fair value plus directly related transaction costs. They are subsequently measured at adjusted cost using the effective interest method less any impairment losses. The Group has classified some debt securities as loans and receivables. | | Under US GAAP, these debt securities are classified asavailable-for-sale securities with unrealised gains and lossesreported in a separate component of equity, except when theunrealised loss is considered other than temporary in whichcase the loss is included in net income. |
| | | |
| Financial assets other than debt securities and equity shares classified as available-for-sale | | |
| Under IAS 39 financial assets classified as available-for-salemay take any legal form. | | Under US GAAP, only debt and equity securities can beclassified as available-for-sale. (Such securities are measuredat fair value with unrealised gains and losses reported in a separate component of equity). |
| | | |
| Foreign exchange gains and losses on monetary available-for- sale financial assets | | |
| For the purposes of recognising foreign exchange gains andlosses, a monetary available-for-sale financial asset is treated as if it were carried at amortised cost in the foreign currency. Accordingly, for such financial assets, exchange differences resulting from retranslating amortised cost are recognised in profit or loss. | | Such differences are included with other unrealised gains andlosses and reported in a separate component of equity. |
| | | |
| Financial liabilities | | |
| All financial liabilities held-for-trading are classified as such and carried at fair value with changes in fair value recognised in net income. A financial liability may be designated as at fair value through profit or loss. | | Only financial liabilities that are derivatives and short positions are carried at fair value with changes in fair value recognised in net income. |
|
|
|
174
| IFRS | | US GAAP |
|
|
|
| (h) Derivatives and hedging activities | | |
Gains and losses arising from changes in fair value of a derivative are recognised as they arise in profit or loss unless the derivative is the hedging instrument in a qualifying hedge. The Group enters into three types of hedge relationship: hedges of changes in the fair value of a recognised asset or liability or firm commitment (fair value hedges); hedges of the variability in cash flows from a recognised asset or liability or a forecast transaction (cash flow hedges); and hedges of the net investment in a foreign entity. | | US GAAP principles are similar to IFRS. There are however differences in their detailed application. The Group has not recognised any hedge relationships for US GAAP purposes except hedges of net investments in foreign operations. All derivatives are measured at fair value with changes in fair value recognised in net income. |
|
|
|
(i) Liabilities and equity | | |
The Group classifies a financial instrument that it issues as a financial asset, financial liability or an equity instrument in accordance with the substance of the contractual arrangement. An instrument is classified as a liability if there is a contractual obligation to deliver cash or another financial asset, or to exchange financial assets or financial liabilities on potentially unfavourable terms. An instrument is classified as equity if it evidences a residual interest in the assets of the Group after the deduction of liabilities. | | Under US GAAP, preference shares issued by the Group are classified as equity as they are perpetual and redeemable only at the option of the Group. Certain trusts and partnerships that are subsidiaries under IFRS are not consolidated under US GAAP because the Group is not their primary beneficiary. As a result securities issued by them are reclassified from minority interests to subordinated liabilities. |
|
|
|
(j) Offset arrangements | | |
A financial asset and a financial liability are offset and the net amount reported in the balance sheet when, and only when, the reporting entity currently has a legally enforceable right to set off the recognised amounts; and intends either to settle on a net basis, or to realise the asset and settle the liability simultaneously. Arrangements such as master netting arrangements do not generally provide a basis for offsetting. | | Under US GAAP, debit and credit balances with the same counterparty may be offset only where there is a legally enforceable right of set-off and the intention to settle on a net basis. However, fair value amounts for forward, interest rate swap, currency swap, option, and other conditional or exchange contracts executed with the same counterparty under a master netting agreement may be offset as may repurchase and reverse repurchase agreements that are executed under a master netting agreement with the same counterparty and have the same settlement date. This GAAP difference has no effect on net income or shareholders’ equity. |
|
|
|
175
Notes on the accountscontinued46 Significant differences between IFRS and US GAAP(continued)
(2) For 2004
As indicated above, as permitted by IFRS 1, in the preparation of the Group's 2004 consolidated income statements and balance sheets, all IFRS have been applied except those relating to financial instruments and insurance contracts where UK GAAP principles then current have been applied.
| IFRS or relevant UK GAAP | | US GAAP |
|
|
|
| (a) Acquisition accounting | | |
| All integration costs relating to acquisitions are expensed aspost-acquisition expenses. | | Certain restructuring and exit costs incurred in the acquiredbusiness are treated as liabilities assumed on acquisition andtaken into account in the calculation of goodwill. |
|
| (b) Property revaluation and depreciation | | |
Freehold and long leasehold property occupied for the Group'suse is carried at cost less accumulated depreciation.Depreciation is charged based on an estimated useful life of50 years. As permitted by IFRS 1, valuation as at 31 December2003 is its deemed cost. Investment properties are carried at fair value; changes in fair value are included in the income statement. | | Under US GAAP, revaluations of property are not permitted.Depreciation is charged, and gains or losses on disposal arebased on the historical cost for both own-use and investmentproperties. |
|
|
|
| (c) Leasehold property provisions | | |
| Provisions are raised on leasehold properties when there is acommitment to vacate the property. | | Provisions are recognised on leasehold properties at the timethe property is vacated. |
|
| (d) Loan origination fees | | |
| Certain loan fees, together with related costs, are recognisedin the income statement as received or incurred. | | Applicable non-refundable loan fees and certain direct costsare deferred and recognised over the period of the relatedloan or facility. |
|
| (e) Pension costs | | |
| Pension scheme assets are measured at their fair value.Scheme liabilities are measured on an actuarial basis using theprojected unit method and discounted at the current rate ofreturn on a high quality corporate bond of equivalent term andcurrency. Any surplus or deficit of scheme assets comparedwith liabilities is recognised in the balance sheet as an asset(surplus) or liability (deficit). An asset is only recognised to theextent that the surplus can be recovered through reducedcontributions in the future or through refunds from the scheme. | | US GAAP requires similar valuations but allows a certainportion of actuarial gains and losses to be deferred andallocated in equal amounts over the average remaining servicelives of current employees. An additional minimum liabilitymust be recognised if the accumulated benefit obligation (thecurrent value of accrued benefits without allowance for futuresalary increases) exceeds the fair value of plan assets and theGroup has recorded a prepaid pension cost or has an accruedliability that is less than the unfunded accumulated benefitobligation. Movements in the additional minimum liability, together with the related deferred tax, are recognised in a seperate component of equity. |
|
|
|
| (f) Long-term assurance business | | |
| The shareholders’ interest in the long-term assurance fund isvalued as the discounted value of the cash flows expected tobe generated from in-force policies together with net assets inexcess of the statutory liabilities. | | US GAAP does not permit embedded value reporting. USGAAP requires bancassurance contracts to be classified eitheras insurance or investment contracts. US GAAP requires deferred acquisition cost and income accounting for all contracts. Where investment contract policy charges benefit future periods, they are deferred and amortised. |
|
|
|
| (g) Extinguishment of liabilities | | |
| Recognition of a financial liability ceases once any transfer ofeconomic benefits to the creditor is no longer likely. | | A financial liability is derecognised only when the creditor ispaid or the debtor is legally released from being the primaryobligator under the liability, either judicially or by the creditor. |
|
|
|
176
| IFRS or relevant UK GAAP | | US GAAP |
|
|
|
| (h) Securities | | |
| The Group’s debt and equity securities are classified as beingheld as investment securities or for trading purposes. Investmentsecurities are stated at cost less provision for any permanent diminution in value. Premiums and discounts on dated debt securities are amortised to interest income over the period to maturity. Securities held for trading purposes are carried at fair value with changes in fair value recognised in profit or loss. | | Investment securities held by the Group’s private equity businessare considered to be held by investment companiesandcarried at fair value, with changes in fair value being reflected in net income. The Group’s other investment debt securities and marketable investment equity shares are classified as available- for-sale securities and measured at fair value with unrealised gains and losses reported in a separate component of equity, except when the unrealised loss is considered other-than- temporary in which case the loss is included in net income. The Group recognises an other-than-temporary impairment on an available-for-sale equity share when its carrying value has exceeded its market value for a period of more than twelve months. |
|
| (i) Derivatives and hedging activities | | |
| Non-trading derivatives are entered into by the Group to hedge exposures arising from transactions entered into in the normal course of banking activities. They are recognised in the accounts in accordance with the accounting treatment of the underlying transaction or transactions being hedged. To be classified as non- trading, a derivative must match or eliminate the risk inherent in the hedged item from potential movements in interest rates, exchange rates and market values. In addition, there must be a demonstrable link to an underlying transaction, pool of transactions or specified future transaction or transactions. Specified future transactions must be reasonably certain to arise for the derivative to be accounted for as a hedge. In the event that a non-trading derivative transaction is terminated or ceases to be an effective hedge, the derivative is remeasured at fair value and any resulting profit or loss amortised over the remaining life of the underlying transaction or transactions being hedged. If a hedged item is derecognised, or a specified future transaction is no longer likely to occur, the related non-trading derivative is remeasured at fair value and the resulting profit or loss taken to the income statement. | | The Group has not made changes in its use of non-trading derivatives to meet the hedge criteria in SFAS 133 ‘Accounting for Derivative Instruments and Hedging Activities’. For US GAAP purposes, its portfolio of non-trading derivatives is remeasured to fair value and changes in fair value reflected in net income. |
| | | |
| Monetary assets denominated in a foreign currency are retranslated at closing rates with exchange differences taken to profit or loss. Equity shares financed by foreign currency borrowings are retranslated at closing rates with exchange differences taken to reserves along with differences on the related borrowings. | | SFAS 133 does not permit a non-derivative financial instrument to be designated as the hedging instrument in a fair value hedge of the foreign exchange exposure of available-for-sale securities. |
| | | |
| Embedded derivatives are not bifurcated from the host contract. | | SFAS 133 requires derivatives embedded in other financial instruments to be accounted for on a stand-alone basis if they have economic characteristics and risks that differ from those of the host instrument. |
|
| (j) Consolidation | | |
All entities controlled by the Group are consolidated together with special purpose entities (SPEs) where the substance of the relationship between the reporting entity and the SPE indicates that it is controlled by the reporting entity. | | US GAAP requires consolidation by the primary beneficiary of a variable interest entity (VIE). An enterprise is the primary beneficiary of a VIE if it will absorb a majority of the entity’s expected losses, receive a majority of the entity's expected residual returns, or both. In accordance with the provisions of FIN46R, trust preferred securities issued by subsidiaries are in effect re-classified from minority interests to liabilities. Certain trusts and partnerships that are subsidiaries under IFRS are not consolidated under US GAAP because the Group is not their primary beneficiary. As a result securities issued by them are reclassified from minority interests to subordinated liabilities. |
|
177
Notes on the accountscontinued
46 Significant differences between IFRS and US GAAP(continued)
| IFRS or relevant UK GAAP | | US GAAP |
|
| (k) Offset arrangements | | |
| Debit and credit balances with the same counterparty areaggregated into a single item where there is a right to insist onnet settlement and the debit balance matures no later than thecredit balance. | | Under US GAAP, debit and credit balances with the samecounterparty may be offset only where there is a legallyenforceable right of set-off and the intention to settle on a netbasis. However, fair value amounts for forward, interest rateswap, currency swap, option, and other conditional or exchange contracts executed with the same counterparty under a master netting agreement may be offset as may repurchase and reverse repurchase agreements that are executed under a master netting agreement with the same counterparty and have the same settlement date. |
|
| (3) Implementation timing differences |
This section sets out the areas where differences in amounts reported under IFRS and US GAAP arise because the effective dates of standards are different although the recognition and measurement principles are the same. |
| |
| IFRS | | US GAAP |
|
| Intangible assets | | |
| Purchased goodwill | | |
| Purchased goodwill is recorded at cost less any accumulatedimpairment losses. Goodwill is tested annually (at 30 September)for impairment or more frequently if events or changes incircumstances indicate that it might be impaired. | | US GAAP requires the same treatment of purchased goodwill.This was adopted by the Group from 1 July 2001. Prior to thisgoodwill was recognised as an asset and amortised overperiods of up to 25 years. No amortisation was written back onthis change of policy. During 2005, the Group changed the date for performing its annual goodwill impairment test from 1 January to 30 September for certain of its reporting units in order to conform to the date selected by the Group upon adoption of IFRS. |
| | | |
Goodwill arising on acquisitions after 1 October 1998 was capitalised and amortised over its estimated useful economic life. Goodwill arising on acquisitions before 1 October 1998 was deducted from equity. The carrying amount of goodwill in the Group's opening IFRS balance sheet was its carrying value under UK GAAP as at 31 December 2003. There was no restatement of previous acquisitions in 1998. In 2004 no amortisation was written back. | | |
| | | |
| Other intangibles | | |
| Until 2004 intangible assets acquired in a businesscombination were recognised separately from goodwill only ifthey were separable and reliably measurable. Thereafter intangibles have been recognised if they are separable or arise from contractual or other legal rights. All intangibles are amortised over their useful economic lives. | | The same treatment was adopted for US GAAP purposes from1 July 2001. |
| | | |
|
|
|
Other adjustments in the reconciliation of net income for the year ended 31 December 2005 from IFRS to US GAAP include refinements to estimates arising from the implementation of IFRS.
Recent developments in US GAAP
In May 2005, the Financial Accounting Standards Board (FASB) issued Statement of Financial Accounting Standards 154 ‘Accounting Changes and Error Corrections’. The standard replaces APB 20 and SFAS 3 and amends the treatment of changes of accounting principle and the correction of errors. It is effective for accounting changes and corrections of errors made in fiscal years beginning after 15 December 2005.
In February 2006, the FASB published SFAS 155 ‘Accounting for Certain Hybrid Financial Instruments – an amendment of FASB Statements No 133 and 140’ (SFAS 155) which is effective for all financial instruments acquired or issued by the Group after 1 January 2007. The statement allows any hybrid financial instrument that contains an embedded derivative that would otherwise require bifurcation to be measured at fair value. The statement also eliminates the exemption from applying SFAS 133 to interests in securitised financial assets.
The FASB issued SFAS 156 ‘ Accounting for Servicing of Financial Assets - an amendment of FASB Statement No. 140’ in March 2006. SFAS 156 addresses the recognition and measurement of separately recognised servicing assets and liabilities and provides an approach to obtain hedge-like (offset) accounting. The standard also: clarifies when an obligation to service financial assets should be separately recognised as a servicing asset or liability; requires fair value measurement for these assets and liabilities, if practicable; permits fair value or amortisation for subsequent measurement of these assets and liabilities; and permits a servicer using derivatives to offset servicing risk to measure both the derivative and related servicing asset or liability at fair value.
178
Selected figures in accordance with US GAAP
The following tables summarise the significant adjustments to consolidated net income available for ordinary shareholders and shareholders’ equity which would result from the application of US GAAP instead of IFRS. Where applicable, the adjustments are stated gross of tax with the tax effect shown separately in total.
| Consolidated statement of income | | | 2005
£m | | | 2004
£m | |
|
|
|
|
|
|
|
|
| Profit attributable to ordinary shareholders – IFRS | | | 5,392 | | | 4,856 | |
| Adjustments in respect of: | | | | | | | |
| Acquisition accounting | | | — | | | 66 | |
| Property revaluation and depreciation | | | (90 | ) | | (65 | ) |
| Leasehold property provisions | | | (26 | ) | | (19 | ) |
| Loan origination | | | 55 | | | (85 | ) |
| Pension costs | | | (363 | ) | | (283 | ) |
| Long-term assurance business | | | 10 | | | (17 | ) |
| Extinguishment of liabilities | | | — | | | (94 | ) |
| Financial instruments | | | (556 | ) | | (628 | ) |
| Derivatives and hedging | | | (119 | ) | | 73 | |
| Liabilities and equity | | | 74 | | | — | |
| Intangible assets – timing difference | | | (66 | ) | | (95 | ) |
| Other | | | (59 | ) | | (40 | ) |
| Taxation | | | 223 | | | 240 | |
|
|
|
|
|
|
|
|
| Net income available for ordinary shareholders – US GAAP | | | 4,475 | | | 3,909 | |
| | |
|
|
|
|
|
| |
| |
| Consolidated shareholders’ equity | | | 2005
£m | | | 2004
£m | |
|
|
|
|
|
|
|
|
| Shareholders’ equity – IFRS | | | 35,435 | | | 33,905 | |
| Adjustments in respect of: | | | | | | | |
| Acquisition accounting | | | 517 | | | 517 | |
| Property revaluation and depreciation | | | (403 | ) | | (313 | ) |
| Leasehold property provisions | | | 38 | | | 64 | |
| Loan origination | | | 614 | | | (373 | ) |
| Pension costs | | | 145 | | | 215 | |
| Long-term assurance business | | | (47 | ) | | (163 | ) |
| Extinguishment of liabilities | | | — | | | (178 | ) |
| Financial instruments | | | (259 | ) | | 76 | |
| Derivatives and hedging | | | 260 | | | 238 | |
| Liabilities and equity | | | 2,298 | | | — | |
| Intangible assets – timing difference | | | 1,919 | | | 1,985 | |
| Other | | | — | | | 140 | |
| Taxation | | | (288 | ) | | 78 | |
|
|
|
|
|
|
|
|
| Shareholders’ equity – US GAAP | | | 40,229 | | | 36,191 | |
| | |
|
|
|
|
|
Total assets under US GAAP of £700.4 billion (2004 – £631.1 billion) primarily reflects the effect of certain arrangements that can be netted under US GAAP, together with the effect of adjustments made to shareholders’ equity.
179
46 Significant differences between IFRS and US GAAP(continued)
Earnings per share
Basic and diluted earnings per share (“EPS”) under US GAAP differ from IFRS only to the extent that the income calculated under US GAAP differs from that under IFRS.
| | | | 2005 | | | 2004 |
| | | |
|
|
|
|
|
|
|
|
|
|
|
|
|
|
| | | | Income*
£m | | No. of
shares
million | | Per share
amount
pence | | | | Income*
£m | | No. of
shares
million | | Per share
amount
pence | |
|
|
|
|
|
|
|
|
|
|
|
|
|
|
|
|
|
| Basic EPS | | | 4,475 | | 3,183 | | 140.6 | | | | 3,909 | | 3,085 | | 126.7 | |
| Dilutive effect of share options and convertible preference shares | | | 65 | | 60 | | (0.6 | ) | | | 66 | | 73 | | (0.8 | ) |
|
|
|
|
|
|
|
|
|
|
|
|
|
|
|
|
|
| Diluted EPS | | | 4,540 | | 3,243 | | 140.0 | | | | 3,975 | | 3,158 | | 125.9 | |
| | |
|
|
|
|
|
|
|
|
|
|
|
|
|
|
* US GAAP net income available to ordinary shareholders, see page 179.The Group has convertible preference shares totalling £200 million (2004 – £200 million),€nil million (2004 –€750 million) and $1,000 million (2004 – $1,900 million). All of the convertible preference shares have a dilutive effect in the current year and as such have been included in the computation of diluted earnings per share.
Outstanding options to purchase shares are excluded from the computation of diluted EPS where the exercise prices of the options are greater than the average market price of the ordinary shares during the relevant period. At 31 December 2005, there were 17.3 million such options outstanding (2004 –8.7 million).
Pensions
On 1 April 2002, the Group’s main pension schemes, The Royal Bank of Scotland Staff Pension Scheme and the National Westminster Bank Pension Fund, were merged to form The Royal Bank of Scotland Group Pension Fund (“the plan”). The provisions of SFAS 87 ‘Employers’ Accounting for Pensions’ have been applied to the plan, which covers most of the Group’s UK employees; the impact of US GAAP on the other Group schemes is considered to be immaterial.
A trust fund has been established under the plan, to which payments are made, determined on an actuarial basis, designed to build up reserves during the working life of full-time employees to pay such employees or their dependants a pension after retirement. Such pensions are based on final pensionable salaries and are related to the length of service prior to retirement. Pensions are limited to a maximum of two-thirds of final salary for 40 years service or more. Staff do not make contributions for basic pensions but may make voluntary contributions on a regular basis to purchase additional service qualification where less than 40 years service will have been completed by normal retirement age.
The assets of the plan are held under separate trusts and, in the long-term, the funding policy is to maintain assets sufficient to cover the benefits in respect of service to date, with due allowance for future earnings increases. The plan assets consist mainly of fixed-income securities and listed securities. The investment policy followed for the plan seeks to deploy the plan assets primarily in UK and overseas equity shares and UK government securities.
Disclosures required by SFAS 132R for the Group’s main scheme are set out below.
| Obligations and funded status | | | | | | | |
| Change in benefit obligation: | | | 2005
£m | | | 2004
£m | |
|
|
|
|
|
|
|
|
| Projected benefit obligation at beginning of year | | | 16,192 | | | 13,963 | |
| Service cost | | | 457 | | | 420 | |
| Interest cost | | | 860 | | | 768 | |
| Past service cost | | | 3 | | | — | |
| Net actuarial gain | | | 2,302 | | | 1,568 | |
| Benefits and expenses paid | | | (521 | ) | | (527 | ) |
|
|
|
|
|
|
|
|
| Projected benefit obligation at year end | | | 19,293 | | | 16,192 | |
| | |
|
|
|
|
|
| |
| Change in plan assets: | | | 2005
£m | | | 2004
£m | |
|
|
|
|
|
|
|
|
| Fair value of plan assets at beginning of year | | | 13,598 | | | 11,822 | |
| Actual return on plan assets | | | 2,477 | | | 1,234 | |
| Employer’s contribution | | | 380 | | | 1,069 | |
| Benefits and expenses paid | | | (521 | ) | | (527 | ) |
|
|
|
|
|
|
|
|
| Market value of plan assets at year end | | | 15,934 | | | 13,598 | |
| | |
|
|
|
|
|
180
| Prepaid pension cost: | | | 2005
£m | | | 2004
£m | |
|
|
|
|
|
|
|
|
| Funded status | | | (3,359 | ) | | (2,594 | ) |
| Unrecognised net actuarial loss | | | 6,383 | | | 5,990 | |
| Unrecognised prior service cost | | | 11 | | | 12 | |
| Unrecognised transition amount | | | — | | | (6 | ) |
|
|
|
|
|
|
|
|
| Prepaid pension cost at year end | | | 3,035 | | | 3,402 | |
| | |
|
|
|
|
|
| |
| |
| Components of net periodic pension cost: | | | 2005
£m | | | 2004
£m | |
|
|
|
|
|
|
|
|
| Service cost | | | 457 | | | 420 | |
| Interest cost | | | 860 | | | 768 | |
| Expected return on plan assets | | | (932 | ) | | (840 | ) |
| Amortisation of prior service cost | | | 4 | | | 1 | |
| Amortisation of loss | | | 364 | | | 263 | |
| Amortisation of net transition asset | | | (6 | ) | | (8 | ) |
|
|
|
|
|
|
|
|
| Net periodic pension cost | | | 747 | | | 604 | |
| | |
|
|
|
|
|
| |
| Assumptions | | | | | | | |
| Weighted average assumptions used at 31 December: | | | 2005
% per annum | | | 2004
% per annum | |
|
|
|
| Discount rate for liabilities | | | 4.80 | | | 5.40 | |
| Salary increases | | | 3.95 | | | 3.95 | |
| Pension increases | | | 2.70 | | | 2.70 | |
| Long-term rate of return on assets | | | 6.47 | | | 6.95 | |
|
|
|
|
|
|
|
|
| |
| |
| Weighted average allocations of market value of plan assets at 31 December: | | | 2005
% | | | 2004
% | |
|
|
|
|
|
|
|
|
| Equity shares | | | 61 | | | 57 | |
| Debt securities | | | 35 | | | 31 | |
| Other | | | 4 | | | 12 | |
|
|
|
|
|
|
|
|
| Total | | | 100 | | | 100 | |
| | |
|
|
|
|
|
At 31 December 2005, the fund’s accumulated benefit obligation was underfunded by £1,433 million (2004 – £561 million). This resulted in a reduction in the accumulated other comprehensive income component of US GAAP shareholders’ equity of £4,457 million (2004 – £3,951 million), comprising the excess of the accumulated benefit obligation over the market value of assets of £1,433 million (2004 – £561 million), prepaid pension cost of £3,035 million (2004 – £3,402 million) less unrecognised prior service cost £11 million (2004 – £12 million). This was reduced by deferred tax of £1,337 million (2004 – £1,185 million). At 31 December 2003, the fund had a surplus of assets over its accumulated benefit obligation and no minimum liability was recognised.Cash flows
The following pension payments under the main scheme, which reflect expected future service, as appropriate, are expected to be paid:
| | | £m |
|
|
|
| 2006 | | 513 |
| 2007 | | 522 |
| 2008 | | 535 |
| 2009 | | 549 |
| 2010 | | 565 |
| After 2011 | | 3,156 |
|
|
|
The Group expects to contribute £392 million to its main UK pension plan in 2006.
47 Post balance sheet events
There have been no significant events between the year end and the date of approval of these accounts which would require a change to or disclosure in the accounts.
181
[Page intentionally left blank]
182
Additional information
| Contents |
| | | |
| 184 | Financial summary | |
| 184 | Amounts in accordance with | |
| | IFRS | |
| 193 | Amounts in accordance with | |
| | US GAAP | |
| 194 | Amounts in accordance with | |
| | UK GAAP | |
| 202 | Exchange rates | |
| 203 | Off-balance sheet arrangements | |
| 205 | Economic and monetary | |
| | environment | |
| 205 | Supervision and regulation | |
| 209 | Description of property | |
| | and equipment | |
| 209 | Major shareholders | |
| 209 | Material contracts | |
183
Additional information
Financial summary
The Group’s accounts are prepared in accordance with IFRS, which differ in certain significant respects from US GAAP. For a discussion of such differences and a reconciliation between IFRS and US GAAP, see Note 46 on the accounts. The dollar financial information included below has been converted from sterling at a rate of £1.00 to US$1.7188, being the Noon Buying Rate on 30 December 2005.
| Amounts in accordance with IFRS | | | | | | | |
| | | | | | | | |
| Summary consolidated income statement – IFRS | | | 2005
$m | | 2005
£m | | 2004
£m |
|
|
|
|
|
|
|
|
| Net interest income | | | 17,047 | | 9,918 | | 9,071 |
| Non-interest income (1) | | | 27,473 | | 15,984 | | 14,320 |
|
|
|
|
|
|
|
|
| Total income | | | 44,520 | | 25,902 | | 23,391 |
| Operating expenses (2, 3, 4) | | | 20,533 | | 11,946 | | 10,362 |
| Insurance net claims | | | 7,413 | | 4,313 | | 4,260 |
|
|
|
|
|
|
|
|
| Operating profit before impairment losses | | | 16,574 | | 9,643 | | 8,769 |
| Impairment losses | | | 2,934 | | 1,707 | | 1,485 |
|
|
|
|
|
|
|
|
| Operating profit before tax | | | 13,640 | | 7,936 | | 7,284 |
| Tax | | | 4,087 | | 2,378 | | 1,995 |
|
|
|
|
|
|
|
|
| Profit for the year | | | 9,553 | | 5,558 | | 5,289 |
| Minority interests | | | 98 | | 57 | | 177 |
| Preference dividends | | | 187 | | 109 | | 256 |
|
|
|
|
|
|
|
|
| Profit attributable to ordinary shareholders | | | 9,268 | | 5,392 | | 4,856 |
| | |
|
|
|
|
|
| | Notes: |
| (1) | Includes gain on sale of strategic investment of £333 million for the year ended 31 December 2005 (2004 – nil). |
| (2) | Includes loss on sale of subsidiaries of £93 million for the year ended 31 December 2005 (2004 – nil). |
| (3) | Includes integration expenditure of £458 million for the year ended 31 December 2005 (2004 – £520 million). |
| (4) | Includes purchased intangibles amortisation of £97 million for the year ended 31 December 2005 (2004 – £45 million) |
| Summary consolidated balance sheet – IFRS | | | 2005
$m | | 2005
£m | | 2004
£m |
|
|
|
|
|
|
|
|
| Loans and advances | | | 838,453 | | 487,813 | | 408,324 |
| Debt securities and equity shares | | | 223,901 | | 130,266 | | 98,631 |
| Derivatives at fair value and settlement balances | | | 174,747 | | 101,668 | | 23,482 |
| Other assets | | | 98,109 | | 57,080 | | 57,685 |
|
|
|
|
|
|
|
|
| Total assets | | | 1,335,210 | | 776,827 | | 588,122 |
| | |
|
|
|
|
|
| | | | | | | | |
| Shareholders’ equity | | | 60,906 | | 35,435 | | 33,905 |
| Minority interests | | | 3,625 | | 2,109 | | 3,492 |
| Subordinated liabilities | | | 48,597 | | 28,274 | | 20,366 |
|
|
|
|
|
|
|
|
| Total capital resources | | | 113,128 | | 65,818 | | 57,763 |
| Deposits | | | 779,087 | | 453,274 | | 383,198 |
| Derivatives at fair value, settlement balances and short positions | | | 241,364 | | 140,426 | | 51,866 |
| Other liabilities | | | 201,631 | | 117,309 | | 95,295 |
|
|
|
|
|
|
|
|
| Total liabilities and equity | | | 1,335,210 | | 776,827 | | 588,122 |
| | |
|
|
|
|
|
184
| Other financial data based upon IFRS: | 2005 | | | 2004 | |
|
|
|
|
|
|
| Earnings per ordinary share – pence | 169.4 | | | 157.4 | |
| Diluted earnings per ordinary share – pence (1) | 168.3 | | | 155.9 | |
| Dividends per ordinary share – pence | 60.6 | | | 52.5 | |
| Dividend payout ratio (2) | 43 | % | | 38 | % |
| Share price per ordinary share at period end – £ | 17.55 | | | 17.52 | |
| Market capitalisation at period end – £bn | 56.1 | | | 55.6 | |
| Net asset value per ordinary share – £ | 10.14 | | | 9.26 | |
| Return on average total assets (3) | 0.73 | % | | 0.94 | % |
| Return on average ordinary shareholders’ equity (4) | 17.5 | % | | 18.3 | % |
| Average shareholders’ equity as a percentage of average total assets | 4.5 | % | | 5.9 | % |
| Risk asset ratio – Tier 1 | 7.6 | % | | 7.0 | % |
| Risk asset ratio – Total | 11.7 | % | | 11.7 | % |
| Ratio of earnings to combined fixed charges and preference share dividends (5) | | | | | |
| – including interest on deposits | 1.67 | | | 1.88 | |
| – excluding interest on deposits | 6.05 | | | 7.43 | |
| Ratio of earnings to fixed charges only (5) | | | | | |
| – including interest on deposits | 1.69 | | | 1.94 | |
| – excluding interest on deposits | 6.50 | | | 9.70 | |
|
|
|
|
|
|
| Notes: |
| (1) | All the convertible preference shares have a dilutive effect in the current year and as such have been included in the computation of diluted earnings per share. In 2004 their effect was anti-dilutive. |
| (2) | Dividend payout ratio represents the interim dividend paid and final dividend proposed as a percentage of profit attributable to ordinary shareholders. |
| (3) | Return on average total assets represents profit attributable to ordinary shareholders as a percentage of average total assets. |
| (4) | Return on average ordinary shareholders’ equity represents profit attributable to ordinary shareholders expressed as a percentage of average ordinary shareholders’ equity. |
| (5) | For this purpose, earnings consist of income before tax and minority interests, plus fixed charges less the unremitted income of associated undertakings (share of profits less dividends received). Fixed charges consist of total interest expense, including or excluding interest on deposits and debt securities in issue, as appropriate, and the proportion of rental expense deemed representative of the interest factor (one third of total rental expenses). |
185
Additional informationcontinued
Amounts in accordance with IFRS
Analysis of loans and advances to customers – IFRS
The following table analyses loans and advances to customers before provisions by remaining maturity, geographical area and type of customer. Overdrafts are included in the ‘Within 1 year’ category.
| | Within
1 year
£m | | After 1
but within
5 years
£m | | After
5 years
£m | | 2005
Total
£m | | | 2004
£m | |
|
|
|
|
|
|
|
|
|
|
|
|
| UK | | | | | | | | | | | |
| Central and local government | 3,336 | | — | | 4 | | 3,340 | | | 1,866 | |
| Manufacturing | 10,552 | | 555 | | 508 | | 11,615 | | | 6,292 | |
| Construction | 5,790 | | 726 | | 758 | | 7,274 | | | 5,024 | |
| Finance | 25,424 | | 1,229 | | 438 | | 27,091 | | | 24,638 | |
| Service industries and business activities | 31,448 | | 3,817 | | 5,422 | | 40,687 | | | 30,867 | |
| Agriculture, forestry and fishing | 1,644 | | 399 | | 602 | | 2,645 | | | 2,481 | |
| Property | 24,401 | | 3,264 | | 5,234 | | 32,899 | | | 26,448 | |
| Individuals – home mortgages | 19,576 | | 4,284 | | 41,426 | | 65,286 | | | 57,535 | |
| Individuals – other | 15,935 | | 6,806 | | 3,582 | | 26,323 | | | 26,459 | |
| Finance leases and instalment credit | 3,420 | | 3,941 | | 6,548 | | 13,909 | | | 13,044 | |
| Accrued interest | 1,247 | | 1 | | 2 | | 1,250 | | | | |
|
|
|
|
|
|
|
|
|
|
|
|
| Total domestic | 142,773 | | 25,022 | | 64,524 | | 232,319 | | | 194,654 | |
| Overseas residents | 39,446 | | 6,167 | | 6,621 | | 52,234 | | | 48,183 | |
|
|
|
|
|
|
|
|
|
|
|
|
| Total UK offices | 182,219 | | 31,189 | | 71,145 | | 284,553 | | | 242,837 | |
|
|
|
|
|
|
|
|
|
|
|
|
| | | | | | | | | | | | |
| Overseas | | | | | | | | | | | |
| US | 27,147 | | 27,541 | | 35,918 | | 90,606 | | | 74,027 | |
| Rest of the World | 23,691 | | 7,417 | | 14,843 | | 45,951 | | | 34,555 | |
|
|
|
|
|
|
|
|
|
|
|
|
| Total Overseas offices | 50,838 | | 34,958 | | 50,761 | | 136,557 | | | 108,582 | |
|
|
|
|
|
|
|
|
|
|
|
|
| Loans and advances to customers – gross | 233,057 | | 66,147 | | 121,906 | | 421,110 | | | 351,419 | |
|
|
|
|
|
| | | | | | |
| Loan impairment provisions | | | | | | | (3,884 | ) | | (4,168 | ) |
| | | | | | |
|
|
|
|
|
| Loans and advances to customers – net | | | | | | | 417,226 | | | 347,251 | |
| | | | | | |
|
|
|
|
|
| | | | | | | | | | | | |
| Fixed rate | 30,966 | | 29,099 | | 40,683 | | 100,748 | | | 101,227 | |
| Variable rate | 202,091 | | 37,048 | | 81,223 | | 320,362 | | | 250,192 | |
|
|
|
|
|
|
|
|
|
|
|
|
| Loans and advances to customers – gross | 233,057 | | 66,147 | | 121,906 | | 421,110 | | | 351,419 | |
|
|
|
|
|
|
|
|
|
|
|
|
Cross border exposures
Cross border exposures are defined as loans to banks and customers (including finance lease and instalment credit receivables) and other monetary assets, including non-local currency claims of overseas offices on local residents.
The Group monitors the geographical breakdown of these exposures based on the country of domicile of the borrower or guarantor of ultimate risk.
The table below sets out the Group’s cross border outstandings in excess of 0.75% of Group total assets (including acceptances), which totalled £776.8 billion (2004 – £588.5 billion). None of these countries has experienced repayment difficulties that have required refinancing of outstanding debt.
| | 2005 | | 2004 |
| | £m | | £m |
|
|
|
|
| United States | 34,246 | | 28,795 |
| Germany | 18,395 | | 14,050 |
| France | 13,402 | | 9,604 |
| Cayman Islands | 11,813 | | 7,258 |
| Netherlands | 8,026 | | 8,871 |
| Spain | 7,392 | | 5,249 |
| Switzerland | 7,061 | | * |
| Republic of Ireland | 6,008 | | * |
|
| |
|
* Less than 0.75% of Group total assets.
186
Loan impairment provisions
For a discussion of the factors considered in determining the amount of the provisions, see ‘Loan impairment’ on page 45 and ‘Accounting policies – Loan impairment provisions’ on page 94.
The following table shows the elements of loan impairment provisions.
| IFRS | |
|
|
|
|
|
|
| | 2005
£m | | | 2004
£m | |
|
|
|
|
|
|
| Provisions at the beginning of the year | | | | | |
| Domestic | 2,675 | | | 2,408 | |
| Foreign | 1,470 | | | 1,477 | |
|
|
|
|
|
|
| | 4,145 | | | 3,885 | |
|
|
|
|
|
|
| Currency translation and other adjustments | | | | | |
| Domestic | (7 | ) | | (8 | ) |
| Foreign | 58 | | | (90 | ) |
|
|
|
|
|
|
| | 51 | | | (98 | ) |
|
|
|
|
|
|
| Acquisitions of businesses | | | | | |
| Domestic | — | | | 2 | |
| Foreign | — | | | 288 | |
|
|
|
|
|
|
| | — | | | 290 | |
|
|
|
|
|
|
| Amounts written-off | | | | | |
| Domestic | (1,252 | ) | | (901 | ) |
| Foreign | (788 | ) | | (548 | ) |
|
|
|
|
|
|
| | (2,040 | ) | | (1,449 | ) |
|
|
|
|
|
|
| Recoveries of amounts written-off in previous years | | | | | |
| Domestic | 97 | | | 85 | |
| Foreign | 75 | | | 59 | |
|
|
|
|
|
|
| | 172 | | | 144 | |
|
|
|
|
|
|
| Charged to income statement | | | | | |
| Domestic | 1,376 | | | 960 | |
| Foreign | 327 | | | 442 | |
|
|
|
|
|
|
| | 1,703 | | | 1,402 | |
|
|
|
|
|
|
| Unwind of discount | | | | | |
| Domestic | (130 | ) | | — | |
| Foreign | (14 | ) | | — | |
|
|
|
|
|
|
| | (144 | ) | | — | |
|
|
|
|
|
|
| Provisions at the end of the year (1) | | | | | |
| Domestic | 2,759 | | | 2,546 | |
| Foreign | 1,128 | | | 1,628 | |
|
|
|
|
|
|
| | 3,887 | | | 4,174 | |
|
|
|
|
|
|
| | | | | | |
| Gross loans and advances to customers | | | | | |
|
|
|
|
|
|
| Domestic | 232,319 | | | 194,654 | |
| Foreign | 188,791 | | | 156,765 | |
|
|
|
|
|
|
| | 421,110 | | | 351,419 | |
|
|
|
|
|
|
| Closing customer provisions as a % of gross loans and advances to customers (2) | | | | | |
| Domestic | 1.19 | % | | 1.31 | % |
| Foreign | 0.60 | % | | 1.04 | % |
|
|
|
|
|
|
| Total | 0.92 | % | | 1.19 | % |
|
|
|
|
|
|
| | | | | | |
| Customer charge to income statement as a % of gross loans and advances to customers | | | | | |
| Domestic | 0.59 | % | | 0.49 | % |
| Foreign | 0.17 | % | | 0.28 | % |
|
|
|
|
|
|
| Total | 0.40 | % | | 0.40 | % |
|
|
|
|
|
|
| Notes: |
| (1) | Includes closing provisions against loans and advances to banks of £3 million (2004 – £6 million). |
| (2) | Closing customer provisions exclude closing provisions against loans and advances to banks. |
187
Additional informationcontinued
Loan impairment provisions(continued)
The following table presents additional information in respect of the loan impairment provisions.
| IFRS | |
|
|
|
|
|
|
| | 2005
£m | | | 2004
£m | |
|
|
|
|
|
|
| Loans and advances to customers (gross) | 421,110 | | | 351,419 | |
|
|
|
|
|
|
| | | | | | |
| Loan impairment provisions at end of year: | | | | | |
| – customers | 3,884 | | | | |
| – banks | 3 | | | | |
| Specific provisions – customers | | | | 3,607 | |
| Specific provisions – banks | | | | 6 | |
| General provision | | | | 561 | |
|
|
|
|
|
|
| | 3,887 | | | 4,174 | |
|
|
|
|
|
|
| | | | | | |
| Customer provision at end of year as % of loans and advances to customers at end of year: | | | | | |
| Specific provisions | | | | 1.03 | % |
| General provision | | | | 0.16 | % |
|
|
|
|
|
|
| | | | | 1.19 | % |
| | |
|
|
|
| | | | | | |
| Average loans and advances to customers (gross) | 402,473 | | | 299,430 | |
|
|
|
|
|
|
| | | | | | |
| As a % of average loans and advances to customers during the year: | | | | | |
| Total customer provisions charged to income statement | 0.42 | % | | 0.47 | % |
|
|
|
|
|
|
| | | | | | |
| Amounts written-off (net of recoveries) – customers | 0.46 | % | | 0.44 | % |
|
|
|
|
|
|
Analysis of closing loan impairment provisions
The following table analyses customer loan impairment provisions by geographical area and type of domestic customer.
| | IFRS |
|
|
| | 2005 | | | 2004 |
|
|
|
| | |
|
| | Closing
provision
£m | | % of loans
to total
loans
% | | | Closing
provision
£m | | % of loans
to total
loans
% |
|
|
|
|
|
|
|
|
|
| Domestic | | | | | | | | |
| Central and local government | — | | 0.8 | | | — | | 0.6 |
| Manufacturing | 138 | | 2.8 | | | 127 | | 1.8 |
| Construction | 74 | | 1.7 | | | 71 | | 1.4 |
| Finance | 104 | | 6.4 | | | 54 | | 7.0 |
| Service industries and business activities | 647 | | 9.7 | | | 516 | | 8.8 |
| Agriculture, forestry and fishing | 26 | | 0.6 | | | 23 | | 0.7 |
| Property | 63 | | 7.8 | | | 64 | | 7.5 |
| Individuals – home mortgages | 36 | | 15.5 | | | 32 | | 16.4 |
| Individuals – other | 1,513 | | 6.3 | | | 1,277 | | 7.5 |
| Finance leases and instalment credit | 88 | | 3.3 | | | 122 | | 3.7 |
| Accrued interest | — | | 0.3 | | | | | |
|
|
|
|
|
|
|
|
|
| Total domestic | 2,689 | | 55.2 | | | 2,286 | | 55.4 |
| Foreign | 652 | | 44.8 | | | 1,321 | | 44.6 |
|
|
|
|
|
|
|
|
|
| Impaired book provisions | 3,341 | | 100.0 | | | | | 100.0 |
| | |
| | | | |
|
| Latent book provisions | 543 | | | | | | | |
| Specific provisions | | | | | | 3,607 | | |
| General provision | | | | | | 561 | | |
|
| | | | |
| | |
| Total provisions | 3,884 | | | | | 4,168 | | |
|
| | | | |
| | |
188
Analysis of write-offs
The following table analyses amounts written-off by geographical area and type of domestic customer.
| IFRS | |
|
|
|
|
|
|
| | 2005
£m | | | 2004
£m | |
|
|
|
|
|
|
| Domestic | | | | | |
| Manufacturing | 40 | | | 55 | |
| Construction | 17 | | | 12 | |
| Finance | 21 | | | 19 | |
| Service industries and business activities | 176 | | | 163 | |
| Agriculture, forestry and fishing | 4 | | | 9 | |
| Property | 25 | | | 33 | |
| Individuals – home mortgages | 4 | | | 4 | |
| Individuals – others | 948 | | | 516 | |
| Finance leases and instalment credit | 15 | | | 90 | |
|
|
|
|
|
|
| Total domestic | 1,250 | | | 901 | |
| Foreign | 788 | | | 548 | |
|
|
|
|
|
|
| Total write-offs* | 2,038 | | | 1,449 | |
|
|
|
|
|
|
* Excludes amounts written-off in respect of banks of £2 million (2004 – nil).
Analysis of recoveries
The following table analyses recoveries of amounts written-off by geographical area and type of domestic customer.
| IFRS | |
|
|
|
|
|
|
| | 2005
£m | | | 2004
£m | |
|
|
|
|
|
|
| Domestic | | | | | |
| Manufacturing | 1 | | | 1 | |
| Construction | 1 | | | — | |
| Finance | — | | | 2 | |
| Service industries and business activities | 2 | | | 1 | |
| Property | 2 | | | — | |
| Individuals – home mortgages | — | | | 1 | |
| Individuals – others | 84 | | | 78 | |
| Finance leases and instalment credit | 7 | | | 2 | |
|
|
|
|
|
|
| Total domestic | 97 | | | 85 | |
| Foreign | 75 | | | 59 | |
|
|
|
|
|
|
| Total recoveries | 172 | | | 144 | |
|
|
|
|
|
|
189
Additional informationcontinued
Risk elements in lending and potential problem loans
The Group’s loan control and review procedures do not include the classification of loans as non-accrual, accruing past due, restructured and potential problem loans, as defined by the SEC in the US. The following table shows the estimated amount of loans that would be reported using the SEC’s classifications. The figures are stated before deducting the value of security held or related provisions.
IAS 39 requires interest to be recognised on a financial asset (or a group of financial assets) after impairment at the rate of interest used to discount recoveries when measuring the impairment loss. Thus, interest on impaired financial assets is credited to profit or loss as the discount on expected recoveries unwinds. Despite this, such assets are not considered performing. All loans that have an impairment provision are classified as non-accrual. This is a change from past practice where certain loans with provisions were classified as past due 90 days or potential problem loans (and interest accrued on them).
| IFRS | |
|
|
|
|
|
|
| | 2005
£m | | | 2004
£m | |
|
|
|
|
|
|
| Loans accounted for on a non-accrual basis (2): | | | | | |
| Domestic | 4,977 | | | 3,658 | |
| Foreign | 949 | | | 1,075 | |
|
|
|
|
|
|
| Total | 5,926 | | | 4,733 | |
|
|
|
|
|
|
| Accruing loans which are contractually overdue 90 days or more as to principal or interest (3): | | | | | |
| Domestic | 2 | | | 634 | |
| Foreign | 7 | | | 79 | |
|
|
|
|
|
|
| Total | 9 | | | 713 | |
|
|
|
|
|
|
| Loans not included above which are classified as ‘troubled debt restructurings’ by the SEC: | | | | | |
| Domestic | 2 | | | 14 | |
| Foreign | — | | | 10 | |
|
|
|
|
|
|
| Total | 2 | | | 24 | |
|
|
|
|
|
|
| Total risk elements in lending | 5,937 | | | 5,470 | |
|
|
|
|
|
|
| Potential problem loans (4) | | | | | |
| Domestic | 14 | | | 173 | |
| Foreign | 5 | | | 107 | |
|
|
|
|
|
|
| Total potential problem loans | 19 | | | 280 | |
|
|
|
|
|
|
| | | | | | |
| Closing provisions for impairment as a % oftotal risk elements in lending | 65 | % | | 76 | % |
| Closing provisions for impairment as a % oftotal risk elements in lending and potential problem loans | 65 | % | | 72 | % |
| Risk elements in lending as a % of gross lending to customers excluding reverse repos | 1.60 | % | | 1.83 | % |
|
|
|
|
|
|
| Notes: |
| (1) | For the analysis above, 'Domestic' consists of the United Kingdom domestic transactions of the Group. 'Foreign' comprises the Group’s transactions conducted through offices outside the UK and through those offices in the UK specifically organised to service international banking transactions. |
| (2) | All loans against which an impairment provision is held are reported in the non-accrual category. |
| (3) | Loans where an impairment event has taken place but no impairment recognised. This category is used for over-collateralised non-revolving credit facilities. |
| (4) | Loans for which an impairment event has occurred but no impairment provision is necessary. This category is used for over-collateralised advances and revolving credit facilities where identification as 90 days overdue is not feasible. |
| IFRS | |
|
|
|
|
|
|
| | 2005
£m | | | 2004
£m | |
|
|
|
|
|
|
| Gross income not recognised but which would have been | | | | | |
| recognised under the original terms of non-accrual and restructured loans | | | | | |
| Domestic | 334 | | | 235 | |
| Foreign | 62 | | | 58 | |
|
|
|
|
|
|
| | 396 | | | 293 | |
|
|
|
|
|
|
| | | | | | |
| Interest on non-accrual and restructured loans included in net interest income | | | | | |
| Domestic | 130 | | | 58 | |
| Foreign | 14 | | | 7 | |
|
|
|
|
|
|
| | 144 | | | 65 | |
|
|
|
|
|
|
190
Analysis of deposits – product analysis
The following table shows the distribution of the Group’s deposits by type and geographical area:
| IFRS | |
|
|
|
|
|
|
| | 2005
£m | | | 2004
£m | |
|
|
|
|
|
|
| UK | | | | | |
| Domestic: | | | | | |
| Demand deposits – interest-free | 28,833 | | | 22,307 | |
| Demand deposits – interest-bearing | 91,564 | | | 72,938 | |
| Time deposits – savings | 27,091 | | | 21,012 | |
| Time deposits – other | 73,097 | | | 76,995 | |
| Overseas residents: | | | | | |
| Demand deposits – interest-free | 396 | | | 387 | |
| Demand deposits – interest-bearing | 26,663 | | | 16,965 | |
| Time deposits – savings | 1,108 | | | 1,209 | |
| Time deposits – other | 53,997 | | | 52,629 | |
|
|
|
|
|
|
| Total UK offices (1) | 302,749 | | | 264,442 | |
|
|
|
|
|
|
| Overseas | | | | | |
| Demand deposits – interest-free | 13,248 | | | 10,371 | |
| Demand deposits – interest-bearing | 17,886 | | | 12,975 | |
| Time deposits – savings | 21,691 | | | 21,153 | |
| Time deposits – other | 97,700 | | | 74,257 | |
|
|
|
|
|
|
| Total overseas offices (see below) | 150,525 | | | 118,756 | |
|
|
|
|
|
|
| Total deposits | 453,274 | | | 383,198 | |
|
|
|
|
|
|
| | | | | | |
| Held for trading | 66,712 | | | | |
| Fair value through profit or loss | 3,683 | | | | |
| Amortised cost | 382,879 | | | | |
| | | | | | |
| Banking business | | | | 302,383 | |
| Trading business | | | | 80,815 | |
|
|
|
|
|
|
| Total deposits | 453,274 | | | 383,198 | |
|
|
|
|
|
|
| | | | | | |
| Overseas | | | | | |
| US | 120,405 | | | 86,677 | |
| Rest of the World | 30,120 | | | 32,079 | |
|
|
|
|
|
|
| Total overseas | 150,525 | | | 118,756 | |
|
|
|
|
|
|
| Note: |
| (1) | Presentation of product analysis data has been refined and 2004 has been restated onto a basis consistent with 2005. |
191
Additional informationcontinued
Short term borrowings
| IFRS | |
|
|
|
|
|
|
| | 2005
£m | | | 2004
£m | |
|
|
|
|
|
|
| Commercial paper | | | | | |
| Outstanding at year end | 14,110 | | | 8,391 | |
| Maximum outstanding at any month end during the year | 16,853 | | | 8,391 | |
| Approximate average amount during the year | 15,329 | | | 7,450 | |
| Approximate weighted average interest rate during the year | 3.7 | % | | 1.9 | % |
| Approximate weighted average interest rate at year end | 4.2 | % | | 2.6 | % |
| | | | | | |
| Other short term borrowings | | | | | |
| Outstanding at year end | 105,483 | | | 95,381 | |
| Maximum outstanding at any month end during the year | 117,913 | | | 96,356 | |
| Approximate average amount during the year | 100,681 | | | 85,496 | |
| Approximate weighted average interest rate during the year | 3.4 | % | | 2.9 | % |
| Approximate weighted average interest rate at year end | 3.5 | % | | 3.1 | % |
|
|
|
|
|
|
Average interest rates during the year are computed by dividing total interest expense by the average amount borrowed. Average interest rates at year end are average rates for a single day and as such may reflect one-day market distortions which may not be indicative of generally prevailing rates. Original maturities of commercial paper are not in excess of one year. ‘Other short-term borrowings’ consist principally of borrowings in the money markets included within ‘Deposits by banks’ and ‘Customer accounts’ in the accounts, and generally have original maturities of one year or less.
Certificates of deposit and other time deposits
The following table shows details of the Group’s certificates of deposit and other time deposits over $100,000 or equivalent by remaining maturity.
| | Within
3 months
£m | | Over 3 months
but within
6 months
£m | | Over 6 months
but within
12 months
£m | | Over
12 months
£m | | 2005
Total
£m |
|
|
|
|
|
|
|
|
|
|
| UK based companies and branches | | | | | | | | | |
| Certificates of deposit | 18,911 | | 2,009 | | 2,528 | | — | | 23,448 |
| Other time deposits | 64,819 | | 3,679 | | 2,113 | | 3,696 | | 74,307 |
| | | | | | | | | | |
| Overseas based companies and branches | | | | | | | | | |
| Certificates of deposit | 4,841 | | 956 | | 747 | | — | | 6,544 |
| Other time deposits | 61,126 | | 4,553 | | 3,114 | | 10,385 | | 79,178 |
|
|
|
|
|
|
|
|
|
|
| Total | 149,697 | | 11,197 | | 8,502 | | 14,081 | | 183,477 |
|
|
|
|
|
|
|
|
|
|
192
Amounts in accordance with US GAAP
| | 2005
$m | | 2005
£m | | | 2004
£m | | | 2003
£m | | | 2002
£m | | | 2001
£m | |
|
|
|
|
|
|
|
|
|
|
|
|
|
|
|
|
|
| Net income available for ordinary shareholders (1) | 7,692 | | 4,475 | | | 3,909 | | | 2,564 | | | 3,108 | | | 2,062 | |
| Shareholders’ equity (1) | 69,146 | | 40,229 | | | 36,191 | | | 31,665 | | | 28,177 | | | 29,088 | |
| Total assets (1) | 1,203,823 | | 700,386 | | | 631,100 | | | 488,046 | | | 430,573 | | | 386,696 | |
|
|
|
|
|
|
|
|
|
|
|
|
|
|
|
|
|
| | | | | | | | | | | | | | | | | |
| | | | | | | | | | | | | | | | | |
| Other financial data based upon US GAAP: | | | 2005 | | | 2004 | | | 2003 | | | 2002 | | | 2001 | |
|
|
|
|
|
|
|
|
|
|
|
|
|
|
|
|
|
| Basic earnings per ordinary share – pence | | | 140.6 | | | 126.7 | | | 87.5 | | | 107.9 | | | 74.7 | |
| Diluted earnings per ordinary share – pence (2) | | | 140.0 | | | 125.9 | | | 86.8 | | | 106.3 | | | 73.2 | |
| Dividends per ordinary share – pence | | | 60.6 | | | 52.5 | | | 45.6 | | | 39.7 | | | 34.5 | |
| Dividend payout ratio | | | 43.1 | % | | 40.6 | % | | 51.9 | % | | 36.7 | % | | 45.7 | % |
| Return on average total assets (3) | | | 0.64 | % | | 0.70 | % | | 0.55 | % | | 0.75 | % | | 0.57 | % |
| Return on average ordinary shareholders’ equity (4) | | | 13.4 | % | | 13.2 | % | | 9.5 | % | | 12.1 | % | | 8.8 | % |
| Average shareholders’ equity as a percentage | | | | | | | | | | | | | | | | |
| of average total assets | | | 5.4 | % | | 6.3 | % | | 6.5 | % | | 7.3 | % | | 7.7 | % |
| Ratio of earnings to combined fixed charges and preference | | | | | | | | | | | | | | | |
| share dividends (5) | | | | | | | | | | | | | | | | |
| – including interest on deposits | | | 1.57 | | | 1.73 | | | 1.98 | | | 1.97 | | | 1.51 | |
| – excluding interest on deposits | | | 5.31 | | | 6.34 | | | 7.24 | | | 6.49 | | | 4.63 | |
| Ratio of earnings to combined fixed charges only (5) | | | | | | | | | | | | | | | | |
| – including interest on deposits | | | 1.58 | | | 1.79 | | | 2.07 | | | 2.07 | | | 1.59 | |
| – excluding interest on deposits | | | 5.71 | | | 8.28 | | | 9.96 | | | 9.03 | | | 6.98 | |
|
|
|
|
|
|
|
|
|
|
|
|
|
|
|
|
|
| Notes: |
| (1) | The dollar information included above has been converted from sterling at a rate of US$1.7188, the Noon Buying Rate on 30 December 2005. |
| (2) | All convertible preference shares have a dilutive effect in the current year and as such have been included in the computation of diluted earnings per share. In prior years their effect was anti-dilutive. |
| (3) | Return on average total assets represents profit attributable to ordinary shareholders as a percentage of average total assets. |
| (4) | Return on average ordinary shareholders’ equity represents profit attributable to ordinary shareholders expressed as a percentage of average ordinary shareholders’ equity. |
| (5) | For this purpose, earnings consist of income before tax and minority interests, plus fixed charges less the unremitted income of associated undertakings (share of profits less dividends received). Fixed charges consist of total interest expense, including or excluding interest on deposits and debt securities in issue, as appropriate, and the proportion of rental expense deemed representative of the interest factor (one third of total rental expenses). |
193
Additional informationcontinued
| Amounts in accordance with UK GAAP | | | | | | | |
| | | | | | | | |
| Summary consolidated profit and loss account – UK GAAP | 2004
£m | | 2003
£m | | 2002
£m | | 2001
£m |
|
|
|
|
|
|
|
|
| Net interest income | 9,208 | | 8,301 | | 7,849 | | 6,846 |
| Non-interest income | 13,546 | | 10,980 | | 9,167 | | 7,712 |
|
|
|
|
|
|
|
|
| Total income | 22,754 | | 19,281 | | 17,016 | | 14,558 |
| Operating expenses excluding goodwill amortisation (1) | 9,931 | | 8,753 | | 8,738 | | 7,716 |
| Goodwill amortisation | 915 | | 763 | | 731 | | 651 |
| General insurance claims (net) | 3,480 | | 2,195 | | 1,350 | | 948 |
|
|
|
|
|
|
|
|
| Profit before provisions | 8,428 | | 7,570 | | 6,197 | | 5,243 |
| Provisions for bad and doubtful debts | 1,428 | | 1,461 | | 1,286 | | 984 |
| Amounts written off fixed asset investments | 83 | | 33 | | 59 | | 7 |
|
|
|
|
|
|
|
|
| Profit on ordinary activities before tax | 6,917 | | 6,076 | | 4,852 | | 4,252 |
| Tax on profit on ordinary activities | 2,155 | | 1,888 | | 1,582 | | 1,537 |
|
|
|
|
|
|
|
|
| Profit on ordinary activities after tax | 4,762 | | 4,188 | | 3,270 | | 2,715 |
| Minority interests (including non-equity) | 250 | | 210 | | 133 | | 90 |
| Preference dividends – non-equity | 256 | | 261 | | 305 | | 358 |
|
|
|
|
|
|
|
|
| | 4,256 | | 3,717 | | 2,832 | | 2,267 |
| Additional Value Shares dividend – non-equity | — | | 1,463 | | 798 | | 399 |
|
|
|
|
|
|
|
|
| Profit attributable to ordinary shareholders | 4,256 | | 2,254 | | 2,034 | | 1,868 |
|
|
|
|
|
|
|
|
| Notes: |
| (1) | Includes integration expenditure of £269 million for the year ended 31 December 2004 (2003 – £229 million; 2002 – £957 million; 2001 – £875 million). |
| | | | | | | | |
| Summary consolidated balance sheet – UK GAAP | 2004
£m | | 2003
£m | | 2002
£m | | 2001
£m |
|
|
|
|
|
|
|
|
| Loans and advances to banks (net of provisions) | 58,260 | | 51,891 | | 44,296 | | 38,513 |
| Loans and advances to customers (net of provisions) | 345,469 | | 252,531 | | 223,324 | | 190,492 |
| Debt securities and equity shares | 94,171 | | 82,249 | | 68,928 | | 65,597 |
| Intangible fixed assets | 17,576 | | 13,131 | | 12,697 | | 13,325 |
| Other assets | 67,991 | | 54,626 | | 61,793 | | 60,932 |
|
|
|
|
|
|
|
|
| Total assets | 583,467 | | 454,428 | | 411,038 | | 368,859 |
|
|
|
|
|
|
|
|
| | | | | | | | |
| Called up share capital | 822 | | 769 | | 754 | | 893 |
| Share premium account | 12,964 | | 8,175 | | 7,608 | | 7,465 |
| Other reserves | 10,856 | | 11,307 | | 11,922 | | 12,354 |
| Profit and loss account | 7,223 | | 5,847 | | 4,787 | | 5,956 |
|
|
|
|
|
|
|
|
| Shareholders’ funds | 31,865 | | 26,098 | | 25,071 | | 26,668 |
| Minority interests | 3,829 | | 2,713 | | 1,839 | | 585 |
| Subordinated liabilities | 20,366 | | 16,998 | | 13,965 | | 12,530 |
|
|
|
|
|
|
|
|
| Total capital resources | 56,060 | | 45,809 | | 40,875 | | 39,783 |
| Deposits by banks | 99,081 | | 67,323 | | 54,720 | | 40,038 |
| Customer accounts | 285,062 | | 236,963 | | 219,161 | | 198,995 |
| Debt securities in issue | 58,960 | | 41,016 | | 33,938 | | 30,669 |
| Other liabilities | 84,304 | | 63,317 | | 62,344 | | 59,374 |
|
|
|
|
|
|
|
|
| Total liabilities | 583,467 | | 454,428 | | 411,038 | | 368,859 |
|
|
|
|
|
|
|
|
194
| Other financial data based upon UK GAAP | 2004 | | | 2003 | | | 2002 | | | 2001 | |
|
|
|
|
|
|
|
|
|
|
|
|
| Earnings per ordinary share – pence | 138.0 | | | 76.9 | | | 70.6 | | | 67.6 | |
| Diluted earnings per ordinary share – pence (1) | 136.9 | | | 76.3 | | | 69.6 | | | 66.3 | |
| Dividends per ordinary share – pence | 58.0 | | | 50.3 | | | 43.7 | | | 38.0 | |
| Dividend payout ratio | 43.2 | % | | 66.1 | % | | 62.3 | % | | 58.1 | % |
| Share price per ordinary share at period end – £ | 17.52 | | | 16.46 | | | 14.88 | | | 16.72 | |
| Market capitalisation at period end – £bn | 55.6 | | | 48.8 | | | 43.2 | | | 47.8 | |
| Net asset value per ordinary share – £ | 8.62 | | | 7.82 | | | 7.43 | | | 7.79 | |
| Return on average total assets (2) | 0.82 | % | | 0.51 | % | | 0.52 | % | | 0.53 | % |
| Return on average equity shareholders’ funds (3) | 16.0 | % | | 9.8 | % | | 8.8 | % | | 8.9 | % |
| Average shareholders’ equity as a percentage | | | | | | | | | | | |
| of average total assets | 5.7 | % | | 5.9 | % | | 6.8 | % | | 7.2 | % |
| Risk asset ratio – Tier 1 | 7.0 | % | | 7.4 | % | | 7.3 | % | | 7.1 | % |
| Risk asset ratio – Total | 11.7 | % | | 11.8 | % | | 11.7 | % | | 11.5 | % |
| Ratio of earnings to combined fixed charges and preference | | | | | | | | | | | |
| share dividends (4) | | | | | | | | | | | |
| – including interest on deposits | 1.84 | | | 1.95 | | | 1.74 | | | 1.49 | |
| – excluding interest on deposits | 7.09 | | | 7.08 | | | 5.20 | | | 4.45 | |
| Ratio of earnings to fixed charges only (4) | | | | | | | | | | | |
| – including interest on deposits | 1.90 | | | 2.04 | | | 1.83 | | | 1.55 | |
| – excluding interest on deposits | 9.26 | | | 9.73 | | | 7.24 | | | 6.52 | |
|
|
|
|
|
|
|
|
|
|
|
|
| | Notes: |
| (1) | Convertible preference shares have not been included in the computation of diluted earnings per share as their effect was anti-dilutive. |
| (2) | Return on average total assets represents profit attributable to ordinary shareholders as a percentage of average total assets. |
| (3) | Return on average equity shareholders’ funds represents profit attributable to ordinary shareholders expressed as a percentage of average equity shareholders’ funds. |
| (4) | For this purpose, earnings consist of income before tax and minority interests, plus fixed charges less the unremitted income of associated undertakings (share of profits less dividends received). Fixed charges consist of total interest expense, including or excluding interest on deposits and debt securities in issue, as appropriate, and the proportion of rental expense deemed representative of the interest factor (one third of total rental expenses). |
195
Additional informationcontinued
Amounts in accordance with UK GAAP
Analysis of loans and advances to customers
The following table analyses loans and advances to customers before provisions by geographical area and type of customer.
| | UK GAAP | |
| |
|
|
|
|
|
|
|
|
|
|
|
| | 2004
£m | | | 2003
£m | | | 2002
£m | | | 2001
£m | |
|
|
|
|
|
|
|
|
|
|
|
|
| UK | | | | | | | | | | | |
| Central and local government | 1,866 | | | 1,217 | | | 1,521 | | | 706 | |
| Manufacturing | 6,292 | | | 6,384 | | | 7,386 | | | 7,401 | |
| Construction | 5,024 | | | 3,960 | | | 3,468 | | | 3,018 | |
| Finance | 25,157 | | | 18,948 | | | 12,396 | | | 8,517 | |
| Service industries and business activities | 30,850 | | | 29,290 | | | 26,022 | | | 25,033 | |
| Agriculture, forestry and fishing | 2,480 | | | 2,562 | | | 2,463 | | | 2,391 | |
| Property | 26,445 | | | 19,670 | | | 15,939 | | | 12,274 | |
| Individuals – home mortgages | 57,529 | | | 48,117 | | | 42,101 | | | 36,976 | |
| Individuals – other | 27,863 | | | 25,526 | | | 22,255 | | | 20,076 | |
| Finance leases and instalment credit | 13,083 | | | 11,703 | | | 11,723 | | | 11,258 | |
|
|
|
|
|
|
|
|
|
|
|
|
| Total domestic | 196,589 | | | 167,377 | | | 145,274 | | | 127,650 | |
| Overseas residents | 44,053 | | | 27,168 | | | 23,657 | | | 24,164 | |
|
|
|
|
|
|
|
|
|
|
|
|
| Total UK offices | 240,642 | | | 194,545 | | | 168,931 | | | 151,814 | |
|
|
|
|
|
|
|
|
|
|
|
|
| | | | | | | | | | | | |
| Overseas | | | | | | | | | | | |
| US | 74,045 | | | 40,373 | | | 41,008 | | | 29,230 | |
| Rest of the World | 35,004 | | | 21,535 | | | 17,305 | | | 13,093 | |
|
|
|
|
|
|
|
|
|
|
|
|
| Total overseas offices | 109,049 | | | 61,908 | | | 58,313 | | | 42,323 | |
|
|
|
|
|
|
|
|
|
|
|
|
| Loans and advances to customers – gross | 349,691 | | | 256,453 | | | 227,244 | | | 194,137 | |
| Provisions for bad and doubtful debts | (4,222 | ) | | (3,922 | ) | | (3,920 | ) | | (3,645 | ) |
| |
|
|
|
|
|
|
|
|
|
|
|
| Loans and advances to customers – net | 345,469 | | | 252,531 | | | 223,324 | | | 190,492 | |
| |
|
|
|
|
|
|
|
|
|
|
|
| | | | | | | | | | | | |
| Fixed rate | 100,729 | | | 81,918 | | | 80,326 | | | 62,282 | |
| Variable rate | 248,962 | | | 174,535 | | | 146,918 | | | 131,855 | |
|
|
|
|
|
|
|
|
|
|
|
|
| Loans and advances to customers – gross | 349,691 | | | 256,453 | | | 227,244 | | | 194,137 | |
| |
|
|
|
|
|
|
|
|
|
|
|
Cross border exposures
The table below sets out the Group’s cross border outstandings in excess of 0.75% of Group total assets (including acceptances), which totalled £583.8 billion at 31 December 2004 (2003 – £455.0 billion). None of these countries has experienced repayment difficulties that have required refinancing of outstanding debt.
| | UK GAAP |
|
|
|
|
| | 2004
£m | | 2003
£m |
|
|
|
|
| United States | 28,795 | | 14,618 |
| Germany | 14,050 | | 15,073 |
| France | 9,604 | | 7,524 |
| Netherlands | 8,871 | | 6,830 |
| Cayman Islands | 7,258 | | 6,666 |
| Spain | 5,249 | | 3,421 |
| Japan | 4,610 | | 4,141 |
|
|
|
|
196
Provisions for bad and doubtful debts
The following table shows the elements of provisions for bad and doubtful debts under UK GAAP.
| | UK GAAP | |
| |
|
|
|
|
|
|
|
|
|
|
|
| | 2004
£m | | | 2003
£m | | | 2002
£m | | | 2001
£m | |
|
|
|
|
|
|
|
|
|
|
|
|
| Provisions at thebeginning of the year | | | | | | | | | | | |
| Domestic | 2,452 | | | 2,581 | | | 2,467 | | | 2,370 | |
| Foreign | 1,477 | | | 1,346 | | | 1,186 | | | 783 | |
|
|
|
|
|
|
|
|
|
|
|
|
| | 3,929 | | | 3,927 | | | 3,653 | | | 3,153 | |
|
|
|
|
|
|
|
|
|
|
|
|
| Currency translation and other adjustments | | | | | | | | | | | |
| Domestic | (8 | ) | | (2 | ) | | (4 | ) | | 4 | |
| Foreign | (90 | ) | | (60 | ) | | (58 | ) | | 13 | |
|
|
|
|
|
|
|
|
|
|
|
|
| | (98 | ) | | (62 | ) | | (62 | ) | | 17 | |
|
|
|
|
|
|
|
|
|
|
|
|
| Acquisitions of businesses | | | | | | | | | | | |
| Domestic | 2 | | | — | | | 11 | | | 83 | |
| Foreign | 288 | | | 50 | | | 12 | | | 171 | |
|
|
|
|
|
|
|
|
|
|
|
|
| | 290 | | | 50 | | | 23 | | | 254 | |
|
|
|
|
|
|
|
|
|
|
|
|
| Amounts written-off | | | | | | | | | | | |
| Domestic | (920 | ) | | (1,097 | ) | | (743 | ) | | (645 | ) |
| Foreign | (548 | ) | | (422 | ) | | (293 | ) | | (190 | ) |
|
|
|
|
|
|
|
|
|
|
|
|
| | (1,468 | ) | | (1,519 | ) | | (1,036 | ) | | (835 | ) |
|
|
|
|
|
|
|
|
|
|
|
|
| Recoveries of amounts written-off in previous years | | | | | | | | | | | |
| Domestic | 88 | | | 38 | | | 37 | | | 54 | |
| Foreign | 59 | | | 34 | | | 26 | | | 26 | |
|
|
|
|
|
|
|
|
|
|
|
|
| | 147 | | | 72 | | | 63 | | | 80 | |
|
|
|
|
|
|
|
|
|
|
|
|
| Charged to profit and loss account | | | | | | | | | | | |
| Domestic | 986 | | | 932 | | | 813 | | | 601 | |
| Foreign | 442 | | | 529 | | | 473 | | | 383 | |
|
|
|
|
|
|
|
|
|
|
|
|
| | 1,428 | | | 1,461 | | | 1,286 | | | 984 | |
|
|
|
|
|
|
|
|
|
|
|
|
| Provisions at theend of the year (1) | | | | | | | | | | | |
| Domestic | 2,600 | | | 2,452 | | | 2,581 | | | 2,467 | |
| Foreign | 1,628 | | | 1,477 | | | 1,346 | | | 1,186 | |
|
|
|
|
|
|
|
|
|
|
|
|
| | 4,228 | | | 3,929 | | | 3,927 | | | 3,653 | |
| |
|
|
|
|
|
|
|
|
|
|
|
| | | | | | | | | | | | |
| Gross loans and advances to customers | | | | | | | | | | | |
|
|
|
|
|
|
|
|
|
|
|
|
| Domestic | 196,589 | | | 167,377 | | | 145,274 | | | 127,650 | |
| Foreign | 153,102 | | | 89,076 | | | 81,970 | | | 66,487 | |
|
|
|
|
|
|
|
|
|
|
|
|
| | 349,691 | | | 256,453 | | | 227,244 | | | 194,137 | |
| |
|
|
|
|
|
|
|
|
|
|
|
| Closing customer provisions as a % of gross loans and advances to customers (2) | | | | | | | | | | | |
| Domestic | 1.32 | % | | 1.46 | % | | 1.78 | % | | 1.93 | % |
| Foreign | 1.06 | % | | 1.65 | % | | 1.63 | % | | 1.77 | % |
|
|
|
|
|
|
|
|
|
|
|
|
| Total | 1.21 | % | | 1.53 | % | | 1.72 | % | | 1.88 | % |
| |
|
|
|
|
|
|
|
|
|
|
|
| | | | | | | | | | | | |
| Customer charge against profit as a % of gross loans and advances to customers | | | | | | | | | | | |
| Domestic | 0.50 | % | | 0.56 | % | | 0.56 | % | | 0.47 | % |
| Foreign | 0.29 | % | | 0.59 | % | | 0.58 | % | | 0.58 | % |
|
|
|
|
|
|
|
|
|
|
|
|
| Total | 0.41 | % | | 0.57 | % | | 0.57 | % | | 0.51 | % |
| |
|
|
|
|
|
|
|
|
|
|
|
| Notes: |
| (1) | Includes closing provisions against loans and advances to banks of £6 million in 2004 (2003 – £7 million; 2002 – £7 million; 2001 – £8 million). |
| (2) | Closing customer provisions exclude closing provisions against loans and advances to banks. |
197
Additional informationcontinued
Provisions for bad and doubtful debts(continued)
The following table presents additional information with respect to the provisions for bad and doubtful debts under UK GAAP.
| | UK GAAP | |
| |
|
|
|
|
|
|
|
|
|
|
|
| | 2004
£m | | | 2003
£m | | | 2002
£m | | | 2001
£m | |
|
|
|
|
|
|
|
|
|
|
|
|
| Loans and advances to customers (gross) | 349,691 | | | 256,453 | | | 227,244 | | | 194,137 | |
|
|
|
|
|
|
|
|
|
|
|
|
| | | | | | | | | | | | |
| Provisions at end of year: | | | | | | | | | | | |
| Specific provisions – customers | 3,648 | | | 3,356 | | | 3,323 | | | 3,031 | |
| Specific provisions– banks | 6 | | | 7 | | | 7 | | | 8 | |
| General provision | 574 | | | 566 | | | 597 | | | 614 | |
|
|
|
|
|
|
|
|
|
|
|
|
| | 4,228 | | | 3,929 | | | 3,927 | | | 3,653 | |
| |
|
|
|
|
|
|
|
|
|
|
|
| | | | | | | | | | | | |
| Customer provision at end of year as % of loans and | | | | | | | | | | | |
| advances to customers at end of year: | | | | | | | | | | | |
| Specific provisions | 1.04 | % | | 1.31 | % | | 1.46 | % | | 1.56 | % |
| General provision | 0.17 | % | | 0.22 | % | | 0.26 | % | | 0.32 | % |
|
|
|
|
|
|
|
|
|
|
|
|
| | 1.21 | % | | 1.53 | % | | 1.72 | % | | 1.88 | % |
| |
|
|
|
|
|
|
|
|
|
|
|
| | | | | | | | | | | | |
| Average loans and advances to customers (gross) | 298,150 | | | 245,798 | | | 211,206 | | | 181,584 | |
|
|
|
|
|
|
|
|
|
|
|
|
| | | | | | | | | | | | |
| As a % of average loans and advances to customers during the year: | | | | | | | | | | | |
| Total customer provisions charged to profit and loss | 0.48 | % | | 0.59 | % | | 0.61 | % | | 0.54 | % |
|
|
|
|
|
|
|
|
|
|
|
|
| | | | | | | | | | | | |
| Amounts written-off (net of recoveries) – customers | 0.44 | % | | 0.59 | % | | 0.46 | % | | 0.42 | % |
|
|
|
|
|
|
|
|
|
|
|
|
Analysis of closing provisions for bad and doubtful debtsThe following table analyses customer provisions for bad and doubtful debts by geographical area and type of domestic customer.
| | UK GAAP |
| |
|
|
|
|
|
|
|
|
|
|
|
|
|
|
|
| | 2004 | | 2003 | | 2002 | | 2001 |
| |
|
|
|
|
|
|
|
|
|
|
|
|
|
|
|
| | Closing
provision
£m | | % of loans
to total
loans
% | | Closing
provision
£m | | % of loans
to total
loans
% | | Closing
provision
£m | | % of loans
to total
loans
% | | Closing
provision
£m | | % of loans
to total
loans
% |
|
|
|
|
|
|
|
|
|
|
|
|
|
|
|
|
| Domestic | | | | | | | | | | | | | | | |
| Central and local government | — | | 0.5 | | — | | 0.5 | | — | | 0.6 | | — | | 0.4 |
| Manufacturing | 127 | | 1.8 | | 156 | | 2.5 | | 205 | | 3.2 | | 209 | | 3.8 |
| Construction | 71 | | 1.4 | | 56 | | 1.5 | | 65 | | 1.5 | | 72 | | 1.6 |
| Finance | 54 | | 7.2 | | 34 | | 7.4 | | 71 | | 5.5 | | 73 | | 4.4 |
| Service industries and business activities | 516 | | 8.8 | | 599 | | 11.4 | | 699 | | 11.5 | | 627 | | 12.9 |
| Agriculture, forestry and fishing | 23 | | 0.7 | | 20 | | 1.0 | | 29 | | 1.1 | | 31 | | 1.2 |
| Property | 64 | | 7.6 | | 58 | | 7.7 | | 40 | | 7.0 | | 39 | | 6.3 |
| Individuals – home mortgages | 32 | | 16.5 | | 35 | | 18.8 | | 60 | | 18.5 | | 53 | | 19.1 |
| Individuals – other | 1,318 | | 8.0 | | 1,003 | | 9.9 | | 855 | | 9.8 | | 855 | | 10.3 |
| Finance leases and instalment credit | 122 | | 3.7 | | 136 | | 4.6 | | 208 | | 5.2 | | 164 | | 5.8 |
|
|
|
|
|
|
|
|
|
|
|
|
|
|
|
|
| Total domestic | 2,327 | | 56.2 | | 2,097 | | 65.3 | | 2,232 | | 63.9 | | 2,123 | | 65.8 |
| Foreign | 1,321 | | 43.8 | | 1,259 | | 34.7 | | 1,091 | | 36.1 | | 908 | | 34.2 |
|
|
|
|
|
|
|
|
|
|
|
|
|
|
|
|
| Specific provisions | 3,648 | | 100.0 | | 3,356 | | 100.0 | | 3,323 | | 100.0 | | 3,031 | | 100.0 |
| | |
| | | |
| | | |
| | | |
|
| General provision | 574 | | | | 566 | | | | 597 | | | | 614 | | |
|
| | | |
| | | |
| | | |
| | |
| Total provisions | 4,222 | | | | 3,922 | | | | 3,920 | | | | 3,645 | | |
|
| | | |
| | | |
| | | |
| | |
198
Analysis of write-offs
The following table analyses amounts written-off by geographical area and type of domestic customer.
| | UK GAAP |
|
|
|
|
|
|
|
|
| | 2004
£m | | 2003
£m | | 2002
£m | | 2001
£m |
|
|
|
|
|
|
|
|
| Domestic | | | | | | | |
| Manufacturing | 55 | | 99 | | 111 | | 61 |
| Construction | 12 | | 22 | | 18 | | 19 |
| Finance | 19 | | 54 | | 35 | | 8 |
| Service industries and business activities | 163 | | 393 | | 180 | | 176 |
| Agriculture, forestry and fishing | 9 | | 4 | | 10 | | 5 |
| Property | 33 | | 6 | | 9 | | 14 |
| Individuals – home mortgages | 4 | | 2 | | 2 | | 3 |
| Individuals – others | 535 | | 357 | | 333 | | 297 |
| Finance leases and instalment credit | 90 | | 160 | | 45 | | 62 |
|
|
|
|
|
|
|
|
| Total domestic | 920 | | 1,097 | | 743 | | 645 |
| Foreign | 548 | | 422 | | 293 | | 190 |
|
|
|
|
|
|
|
|
| Total write-offs* | 1,468 | | 1,519 | | 1,036 | | 835 |
|
|
|
|
|
|
|
|
* Includes amounts written-off in respect of banks of nil in 2004 (2003 – nil; 2002 – £1 million; 2001 – £6 million).
Analysis of recoveries
The following table analyses recoveries of amounts written-off by geographical area and type of domestic customer.
| | UK GAAP |
|
|
|
|
|
|
|
|
| | 2004
£m | | 2003
£m | | 2002
£m | | 2001
£m |
|
|
|
|
|
|
|
|
| Domestic | | | | | | | |
| Manufacturing | 1 | | — | | 1 | | 2 |
| Construction | — | | — | | — | | 1 |
| Finance | 2 | | — | | — | | 1 |
| Service industries and business activities | 1 | | 3 | | 1 | | 5 |
| Property | — | | — | | 1 | | 1 |
| Individuals – home mortgages | 1 | | — | | — | | — |
| Individuals – others | 81 | | 26 | | 27 | | 41 |
| Finance leases and instalment credit | 2 | | 9 | | 7 | | 3 |
|
|
|
|
|
|
|
|
| Total domestic | 88 | | 38 | | 37 | | 54 |
| Foreign | 59 | | 34 | | 26 | | 26 |
|
|
|
|
|
|
|
|
| Total recoveries | 147 | | 72 | | 63 | | 80 |
|
|
|
|
|
|
|
|
199
Additional informationcontinued
Risk elements in lending and potential problem loans
The Group’s loan control and review procedures do not include the classification of loans as non-accrual, accruing past due, restructured and potential problem loans, as defined by the SEC in the US. The following table shows the estimated amount of loans that would be reported using the SEC’s classifications. The figures incorporate estimates and are stated before deducting the value of security held or related provisions.
| | UK GAAP | |
| |
|
|
|
|
|
|
|
|
|
|
|
| | 2004
£m | | | 2003
£m | | | 2002
£m | | | 2001
£m | |
|
|
|
|
|
|
|
|
|
|
|
|
| Loans accounted for on a non-accrual basis(3): | | | | | | | | | | | |
| Domestic | 3,705 | | | 3,221 | | | 3,077 | | | 2,829 | |
| Foreign | 1,075 | | | 1,211 | | | 1,098 | | | 737 | |
|
|
|
|
|
|
|
|
|
|
|
|
| Total | 4,780 | | | 4,432 | | | 4,175 | | | 3,566 | |
|
|
|
|
|
|
|
|
|
|
|
|
| Accruing loans which are contractually overdue 90 days | | | | | | | | | | | |
| or more as to principal or interest(4): | | | | | | | | | | | |
| Domestic | 646 | | | 561 | | | 363 | | | 643 | |
| Foreign | 79 | | | 81 | | | 129 | | | 142 | |
|
|
|
|
|
|
|
|
|
|
|
|
| Total | 725 | | | 642 | | | 492 | | | 785 | |
|
|
|
|
|
|
|
|
|
|
|
|
| Loans not included above which are classified | | | | | | | | | | | |
| as ‘troubled debt restructurings’ by the SEC: | | | | | | | | | | | |
| Domestic | 14 | | | 53 | | | 144 | | | 26 | |
| Foreign | 10 | | | 30 | | | 60 | | | 116 | |
|
|
|
|
|
|
|
|
|
|
|
|
| Total | 24 | | | 83 | | | 204 | | | 142 | |
|
|
|
|
|
|
|
|
|
|
|
|
| Total risk elements in lending | 5,529 | | | 5,157 | | | 4,871 | | | 4,493 | |
|
|
|
|
|
|
|
|
|
|
|
|
| Potential problem loans(5) | | | | | | | | | | | |
| Domestic | 173 | | | 492 | | | 639 | | | 801 | |
| Foreign | 107 | | | 99 | | | 544 | | | 279 | |
|
|
|
|
|
|
|
|
|
|
|
|
| Total potential problem loans | 280 | | | 591 | | | 1,183 | | | 1,080 | |
|
|
|
|
|
|
|
|
|
|
|
|
| | | | | | | | | | | | |
| Closing provisions for bad and doubtful debts as a % of total risk elements in lending | 76 | % | | 76 | % | | 80 | % | | 81 | % |
| Closing provisions for bad and doubtful debts as a % of | | | | | | | | | | | |
| total risk elements in lending and potential problem loans | 73 | % | | 68 | % | | 65 | % | | 65 | % |
| Risk elements in lending as a % of gross loans and advances | | | | | | | | | | | |
| to customers excluding reverse repos | 1.86 | % | | 2.22 | % | | 2.37 | % | | 2.46 | % |
|
|
|
|
|
|
|
|
|
|
|
|
| Notes: |
| (1) | For the analysis above, ‘Domestic’ consists of the UK domestic transactions of the Group. ‘Foreign’ comprises the Group’s transactions conducted through offices outside the UK and through those offices in the UK specifically organised to service international banking transactions. |
| (2) | The classification of a loan as non-accrual, past due 90 days or troubled debt restructuring does not necessarily indicate that the principal of the loan is uncollectable in whole or in part. Collection depends in each case on the individual circumstances of the loan, including the adequacy of any collateral securing the loan and therefore classification of a loan as non-accrual, past due 90 days or troubled debt restructuring does not always require that a provision be made against such a loan. In accordance with the Group’s provisioning policy for bad and doubtful debts, it is considered that adequate provisions for the above risk elements in lending have been made. |
| (3) | The Group’s UK banking subsidiary undertakings account for loans on a non-accrual basis from the point in time at which the collectability of interest is in significant doubt. Certain subsidiary undertakings of the Group, principally Citizens, generally account for loans on a non-accrual basis when interest or principal is past due 90 days. |
| (4) | Overdrafts generally have no fixed repayment schedule and consequently are not included in this category. |
| (5) | Loans that are current as to the payment of principal and interest but in respect of which management has serious doubts about the ability of the borrower to comply with contractual repayment terms. Substantial security is held in respect of these loans and appropriate provisions have already been made in accordance with the Group’s provisioning policy for bad and doubtful debts. |
| | |
| | UK GAAP |
|
|
|
|
|
|
|
|
| | 2004
£m | | 2003
£m | | 2002
£m | | 2001
£m |
|
|
|
|
|
|
|
|
| Gross income not recognised but which would have been | | | | | | | |
| recognised under the original terms of non-accrual and restructured loans | | | | | | | |
| Domestic | 237 | | 237 | | 234 | | 173 |
| Foreign | 58 | | 55 | | 73 | | 60 |
|
|
|
|
|
|
|
|
| | 295 | | 292 | | 307 | | 233 |
|
|
|
|
|
|
|
|
| | | | | | | | |
| Interest on non-accrual and restructured loans included in net interest income | | | | | | | |
| Domestic | 58 | | 60 | | 47 | | 42 |
| Foreign | 7 | | 3 | | 7 | | 14 |
|
|
|
|
|
|
|
|
| | 65 | | 63 | | 54 | | 56 |
|
|
|
|
|
|
|
|
200
Analysis of deposits – product analysis
The following table shows the distribution of the Group’s deposits by type and geographical area:
| | UK GAAP |
|
|
|
|
| | 2004
£m | | 2003
£m |
|
|
|
|
| UK | | | |
| Domestic: | | | |
| Demand deposits – interest-free | 22,249 | | 20,567 |
| Demand deposits– interest-bearing | 78,178 | | 78,670 |
| Time deposits – savings | 18,205 | | 13,238 |
| Time deposits– other | 68,662 | | 57,994 |
| Overseas residents: | | | |
| Demand deposits – interest-free | 376 | | 830 |
| Demand deposits– interest-bearing | 12,740 | | 9,559 |
| Time deposits – savings | 836 | | 1,014 |
| Time deposits– other | 64,141 | | 32,531 |
|
|
|
|
| Total UK offices | 265,387 | | 214,403 |
|
|
|
|
| Overseas | | | |
| Demand deposits – interest-free | 10,371 | | 7,937 |
| Demand deposits– interest-bearing | 12,975 | | 7,471 |
| Time deposits – savings | 21,153 | | 15,450 |
| Time deposits– other | 74,257 | | 59,025 |
|
|
|
|
| Total overseas offices (see below) | 118,756 | | 89,883 |
|
|
|
|
| Total deposits | 384,143 | | 304,286 |
|
|
|
|
| | | | |
| Banking business | 303,328 | | 251,986 |
| Trading business | 80,815 | | 52,300 |
|
|
|
|
| Total deposits | 384,143 | | 304,286 |
|
|
|
|
| | | | |
| Overseas | | | |
| US | 86,677 | | 67,019 |
| Rest of the World | 32,079 | | 22,864 |
|
|
|
|
| Total overseas | 118,756 | | 89,883 |
|
|
|
|
| | | | |
| Analysis of deposits – currency analysis | | | |
| |
| The following table shows the distribution of deposits by banks and customer accounts by sterling and other currencies: |
| | | | |
| | UK GAAP |
|
|
|
|
| | 2004
£m | | 2003
£m |
|
|
|
|
| Deposits by banks | | | |
| Sterling | 18,958 | | 14,574 |
| Other currencies | 80,123 | | 52,749 |
|
|
|
|
| Total deposits by banks | 99,081 | | 67,323 |
|
|
|
|
| | | | |
| Customer accounts | | | |
| Sterling | 161,636 | | 142,551 |
| Other currencies | 123,426 | | 94,412 |
|
|
|
|
| Total customer accounts | 285,062 | | 236,963 |
|
|
|
|
| Total deposits | 384,143 | | 304,286 |
|
|
|
|
201
Additional informationcontinued
Short term borrowings
| | UK GAAP | |
|
|
|
|
|
|
| | 2004
£m | | | 2003
£m | |
|
|
|
|
|
|
| Commercial paper | | | | | |
| Outstanding at year end | 8,391 | | | 6,968 | |
| Maximum outstanding at any month end during the year | 8,391 | | | 7,032 | |
| Approximate average amount during the year | 7,450 | | | 5,499 | |
| Approximate weighted average interest rate during the year | 1.9 | % | | 1.6 | % |
| Approximate weighted average interest rate at year end | 2.6 | % | | 1.5 | % |
| | | | | | |
| Other short term borrowings | | | | | |
| Outstanding at year end | 95,381 | | | 84,795 | |
| Maximum outstanding at any month end during the year | 96,356 | | | 94,570 | |
| Approximate average amount during the year | 85,496 | | | 78,004 | |
| Approximate weighted average interest rate during the year | 2.9 | % | | 2.2 | % |
| Approximate weighted average interest rate at year end | 3.1 | % | | 2.0 | % |
|
|
|
|
|
|
Average interest rates during the year are computed by dividing total interest expense by the average amount borrowed. Average interest rates at year end are average rates for a single day and as such may reflect one-day market distortions which may not be indicative of generally prevailing rates. Original maturities of commercial paper are not in excess of one year. ‘Other short-term borrowings’ consist principally of borrowings in the money markets included within ‘Deposits by banks’ and ‘Customer accounts’ in the accounts, and generally have original maturities of one year or less.
Certain debt securities
| | | | | | UK GAAP |
| | | | | |
|
|
|
|
|
|
|
| | | | | | 2003
Book Value
£m | | Gross
unrecognized
gains
£m | | Gross
unrecognized
losses
£m | | 2003
Valuation
£m |
|
|
|
|
|
|
|
|
|
|
|
|
| Investment securities: | | | | | | | | | | | |
| UK government | | | | | 1,516 | | 1 | ` | (6 | ) | 1,512 |
| Other government | | | | | 12,442 | | 101 | | (105 | ) | 12,438 |
| Other public sector bodies | | | | | 422 | | 4 | | – | | 426 |
| Bank and building society | | | | | 11,690 | | 4 | | (7 | ) | 11,687 |
| Other issuers | | | | | 15,464 | | 130 | | (302 | ) | 15,292 |
|
|
|
|
|
|
|
|
|
|
|
|
| | | | | | 41,534 | | 240 | | (419 | ) | 41,355 |
| | | | | |
|
|
|
|
|
|
|
Exchange rates
Except as stated, the following tables show, for the dates or periods indicated, the Noon Buying Rate in New York for cable transfers in sterling as certified for customs’ purposes by the Federal Reserve Bank of New York (the “Noon Buying Rate”):
| US dollars per £1 | March
2006 | | February
2006 | | January
2006 | | December
2005 | | November
2005 | | October
2005 |
|
|
|
|
|
|
|
|
|
|
|
|
| Noon Buying Rate | | | | | | | | | | | |
| High | 1.7567 | | 1.7807 | | 1.7885 | | 1.7740 | | 1.7755 | | 1.7855 |
| Low | 1.7256 | | 1.7343 | | 1.7404 | | 1.7188 | | 1.7138 | | 1.7484 |
|
|
|
|
|
|
|
|
|
|
|
|
| | | | | | | | | | | | |
| | | | | | | | | | | | |
| | | | 2005 | | 2004 | | 2003 | | 2002 | | 2001 |
|
|
|
|
|
|
|
|
|
|
|
|
| Noon Buying Rate | | | | | | | | | | | |
| Period end rate | | | 1.7188 | | 1.9160 | | 1.7842 | | 1.6095 | | 1.4543 |
| Average rate for the period (1) | | | 1.8147 | | 1.8356 | | 1.6450 | | 1.5043 | | 1.4396 |
| | | | | | | | | | | | |
| Consolidation rate (2) | | | | | | | | | | | |
| Period end rate | | | 1.7214 | | 1.9346 | | 1.7857 | | 1.6128 | | 1.4498 |
| Average rate for the period | | | 1.8198 | | 1.8325 | | 1.6354 | | 1.5032 | | 1.4401 |
|
|
|
|
|
|
|
|
|
|
|
|
| Notes: |
| (1) | The average of the Noon Buying Rates on the last business day of each month during the period. |
| (2) | The rates used by the Group for translating US dollars into sterling in the preparation of its financial statements. |
| (3) | On 24 April 2006, the Noon Buying Rate was £1.00 = US$1.7839. |
202
Off-balance sheet arrangements
The Group is involved with several types of off-balance sheet arrangements, including special purpose vehicles, lending commitments and financial guarantees.
Special purpose entities (“SPEs”)
SPEs are vehicles set up for a specific, limited purpose, usually do not carry out a business or trade and typically have no employees. They take a variety of legal forms – trusts, partnerships and companies – and fulfil many different functions. They constitute a key element of securitisation transactions in which an SPE acquires financial assets funded by the issue of securities. In the normal course of business, the Group arranges securitisations to facilitate client transactions and undertakes securitisations to sell financial assets or to obtain funding. It has established a number of SPEs to act as commercial paper conduits for customers. SPEs are also utilised in its fund management activities to structure investment funds to which the Group provides investment management services.
Commercial paper conduits– the Group has established a number of SPEs that act as multi-seller commercial paper conduits. These allow customers to access liquidity in the commercial paper market by selling assets to the conduit which it finances by issuing commercial paper to third parties. The Group supplies certain services and contingent liquidity support to these vehicles on an arm’s length basis as well as programme credit enhancement. These vehicles with total assets of £6,688 million at 31 December 2005 are consolidated under IFRS and US GAAP.
Residential mortgages and credit card securitisations– in the UK and Ireland, the Group has securitised portfolios of residential mortgages and credit card receivables totalling £5,279 million as at 31 December 2005. These assets have been transferred to SPEs funded by the issue of notes to third-party investors. These SPEs are consolidated under IFRS and US GAAP and the securitised assets remain on the Group’s balance sheet.
US securitisations– in the US, RBS Greenwich Capital securitises commercial and residential mortgage loans, commercial and residential mortgage related securities, US Government agency collateralised mortgage obligations, and other types of financial assets. It also acts as an underwriter and depositor in securitisation transactions involving both client and proprietary transactions. The majority of proprietary securitisations undertaken by RBS Greenwich Capital result in sales treatment under IFRS and US GAAP. Certain transactions may not result in derecognition of the assets under IFRS or US GAAP: under US GAAP, transactions involving vehicles that are not qualifying special purpose entities and where the Group is the primary beneficiary; under IFRS, those where the Group has retained substantially all the risks and rewards of the assets.
Finance lease receivables– in the US, the Group has financed lease receivables with non-recourse funding from third parties. The transactions are shown gross of third-party financing under IFRS but net under US GAAP.
Further disclosures about the Group’s securitisations are given in Note 12 on the accounts.
Lending commitments and other commitments
Under a loan commitment, the Group agrees to make funds available to a customer in the future. Loan commitments, which are usually for a specified term, may be unconditionally cancellable or may persist, provided all conditions in the loan facility are satisfied or waived. Commitments to lend include commercial standby facilities and credit lines, liquidity facilities to commercial paper conduits and unutilised overdraft facilities. Other commitments include documentary credits, which are commercial letters of credit providing for payment by the Group to a named beneficiary against presentation of specified documents, forward asset purchases, forward deposits placed and undrawn note issuance and revolving underwriting facilities.
Guarantees and other contingent liabilities
The Group gives guarantees on behalf of customers. A financial guarantee represents an irrevocable undertaking that the Group will meet a customer’s obligations to third parties if the customer fails to do so. The maximum amount that the Group could be required to pay under a guarantee is its principal amount. The Group expects most guarantees it provides to expire unused. Other contingent liabilities include those arising from standby letters of credit that support customer debt issues and those relating to customers’ trading activities such as performance and customs bonds, warranties and indemnities.
203
Additional informationcontinued
| The Group’s contingent liabilities and commitments are set out below. |
| 2005 | Less than
1 year
£m | | More than
1 year but
less than
3 years
£m | | More than
3 years but
less than
5 years
£m | | Over
5 years
£m | | Total
£m |
|
|
|
|
|
|
|
|
|
|
| Guarantees and assets pledged as collateral security | 1,584 | | 3,916 | | 3,760 | | 2,993 | | 12,253 |
| Other contingent liabilities | 3,078 | | 644 | | 677 | | 1,995 | | 6,394 |
| Undrawn formal standby facilities, credit lines and other commitments to lend | 132,126 | | 15,077 | | 33,466 | | 22,352 | | 203,021 |
| Other commitments | 2,402 | | 865 | | 148 | | 114 | | 3,529 |
|
|
|
|
|
|
|
|
|
|
| Total | 139,190 | | 20,502 | | 38,051 | | 27,454 | | 225,197 |
|
|
|
|
|
|
|
|
|
|
| | | | | | | | | | |
| 2004 | | | | | | | | | |
|
|
|
|
|
|
|
|
|
|
| Guarantees and assets pledged as collateral security | 3,974 | | 1,729 | | 1,893 | | 2,842 | | 10,438 |
| Other contingent liabilities | 3,076 | | 785 | | 293 | | 1,501 | | 5,655 |
| Undrawn formal standby facilities, credit lines and other commitments to lend | 118,367 | | 23,045 | | 21,216 | | 16,602 | | 179,230 |
| Other commitments | 881 | | 415 | | 6 | | 245 | | 1,547 |
|
|
|
|
|
|
|
|
|
|
| Total | 126,298 | | 25,974 | | 23,408 | | 21,190 | | 196,870 |
|
|
|
|
|
|
|
|
|
|
| | | | | | | | | | |
| | | | | | | | | | |
| Contractual obligations | | | | | | | | | |
| |
| The table below summarises the Group’s contractual cash obligations by remaining maturity. |
| | | | | | | | | | |
| 2005 | Less than
1 year
£m | | More than
1 year but
less than
3 years
£m | | More than
3 years but
less than
5 years
£m | | Over
5 years
£m | | Total
£m |
|
|
|
|
|
|
|
|
|
|
| Contractual cash obligations | | | | | | | | | |
| Dated loan capital | 602 | | 1,041 | | 2,971 | | 8,363 | | 12,977 |
| Operating leases | 310 | | 591 | | 512 | | 1,700 | | 3,113 |
| Unconditional obligations to purchase goods or services | 659 | | 458 | | 148 | | 20 | | 1,285 |
|
|
|
|
|
|
|
|
|
|
| Total | 1,571 | | 2,090 | | 3,631 | | 10,083 | | 17,375 |
|
|
|
|
|
|
|
|
|
|
| | | | | | | | | | |
| 2004 | | | | | | | | | |
|
|
|
|
|
|
|
|
|
|
| Contractual cash obligations | | | | | | | | | |
| Dated loan capital | 371 | | 527 | | 2,863 | | 7,252 | | 11,013 |
| Operating leases | 328 | | 597 | | 535 | | 2,246 | | 3,706 |
| Finance leases | 17 | | 38 | | 11 | | 126 | | 192 |
| Unconditional obligations to purchase goods or services | 733 | | 421 | | 148 | | 152 | | 1,454 |
|
|
|
|
|
|
|
|
|
|
| Total | 1,449 | | 1,583 | | 3,557 | | 9,776 | | 16,365 |
|
|
|
|
|
|
|
|
|
|
| | | | | | | | | | |
| The tables above do not include undated loan capital. Commitments for the purchase of software at 31 December 2005 were £139 million (2004 – £256 million). |
204
Economic and monetary environment
Monetary policy
The Group’s earnings are affected by domestic and global economic conditions. The policies of the UK government, and of governments in other countries in which the Group operates, also have an impact.
The UK government sets an inflation target, which changed in December 2003 from a 2.5% target based on the retail prices index excluding mortgage interest payments to a 2% target based on the consumer prices index, in line with other European countries.
The Bank of England has operational independence in setting the repo rate to achieve the inflation target. The Bank was given independence by the Chancellor of the Exchequer in 1997, with the aim of making monetary policy free from political influence, and therefore more stable and credible. The Bank’s Monetary Policy Committee (“MPC”) meets each month to agree any change to interest rates, and the minutes of these meetings are published two weeks later. One-off meetings can also be held in exceptional circumstances. In response to the downturn in the global economy and the terrorist attacks, the Bank of England, along with other major central banks around the world, cut rates sharply in 2001. Rates remained at exceptionally low levels throughout 2002, and were reduced again in the first half of 2003, reflecting the uncertain nature of the global and domestic economic circumstances. Signs of recovery in the global economy led the Bank of England to increase rates five times since November 2003, to 4.75%, before interest rates were cut to 4.5% in August 2005.
The value of sterling is also important for UK monetary conditions. The monetary authorities do not have an exchange rate target, but movements in sterling play a role in the MPC’s monthly debates.
European Economic and Monetary Union (“EMU”)
The European single currency, the euro, came into being on 1 January 1999. The third stage of EMU started on schedule on 1 January 1999. During the course of 1998, it was determined that eleven countries (Austria, Belgium, Finland, France, Germany, Ireland, Italy, Luxembourg, the Netherlands, Portugal and Spain) would participate. The UK, along with Denmark, exercised its right to opt out at that stage, and Sweden also determined not to be part of this first wave.
On 31 December 1998, the European Currency Unit (the “ECU”) was replaced by the euro on the international currency markets, on a one-for-one basis. The rates for the euro against other international currencies were based upon the official closing rates for the ECU. The bilateral rates for the legacy currencies of the participating states were derived from their rates within the Exchange Rate Mechanism and the closing value of the ECU. These rates, between the legacy currencies and between these currencies and the euro, were fixed as of 1 January 1999. The euro became the formal currency for all eleven then-participating states.
Euro notes and coins were introduced into circulation on 1 January 2002 in accordance with the Maastricht Treaty, which required that legacy currency notes and coins be withdrawn by 30 June 2002. Also on 1 January 1999, the European Central Bank ("ECB") assumed responsibility for the operation of monetary policy throughout the euro zone. The ECB sets one short-term interest rate to cover all twelve countries.
The UK government continues to support EMU entry in principle, but has decided the UK will not adopt the single currency until it is in the UK’s economic interests, with a positive referendum vote. The Chancellor of the Exchequer has laid down five key economic conditions for UK participation. An assessment of these five tests took place in June 2003, resulting in the publication of HM Treasury’s assessment, the 18 supporting EMU studies, and a third outline National Changeover Plan. While indicating that these five economic tests have yet to be fully met, the government has set out a programme of economic reforms and structural assessments necessary to achieve readiness for entry. The Chancellor made a progress statement in Budget 2004, at which point he decided not to undertake an immediate further assessment of the entry tests.
The Group continues to co-operate with the UK government, and to work within the financial services sector, to develop thinking and plans regarding a range of practical issues that would arise if the UK were to decide to enter EMU. In particular, the Group continues its involvement in discussions as to how a phased transition could be achieved, in order to minimise cost and risk. In addition, due attention is being paid to the implications, for elements of the Group and for customers, of the introduction of euro notes and coins and the withdrawal of sterling.
Uncertainty continues on the likelihood and timing of the euro being introduced in the UK. It is not possible to estimate with any degree of certainty the ultimate cost of making systems and operations fully compliant. Expenditure in the year ended 31 December 2005 in preparation for the possible introduction of the euro in the UK was minimal.
Supervision and regulation
1 United Kingdom
1.1 The regulatory regime applying to the UK financial services industry
The Financial Services and Markets Act 2000 (“FSMA2000”), containing an integrated legislative framework for regulating most of the UK financial services industry, came into force at the end of 2001. This and subsequent amendments established the Financial Services Authority (the “FSA”) as the single statutory regulator responsible for regulating deposit taking, insurance and investment business in the UK.
Under the FSMA 2000, businesses require the FSA’s permission to undertake specified types of activities including entering into and carrying out contracts of insurance; managing, dealing in or advising on, investments; accepting deposits; and issuing electronic money (“regulated activities”). The FSA has published detailed regulatory requirements contained in a Handbook of Rules and Guidance.
205
Additional informationcontinued
The FSA’s statutory objectives are to maintain confidence in, and to promote public understanding of, the UK financial system; to secure an appropriate degree of consumer protection; and to reduce the scope for financial crime. In achieving these objectives, the FSA must take account of certain “principles of good regulation” which include recognising the responsibilities of authorised firms’ own management, facilitating innovation and competition and acting proportionately in imposing burdens on the industry.
1.2 Authorised firms in the Group
As at 31 December 2005, 35 companies in the Group, spanning a range of financial services sectors (banking, insurance and investment business), are authorised and regulated to conduct regulated activities by the FSA. These companies are referred to as ‘authorised firms.’
The FSA supervises the banking business of the UK based banks in the Group, including the Royal Bank, NatWest, Coutts & Co, Ulster Bank Limited and Tesco Personal Finance Limited.
General insurance business is principally undertaken by companies in the RBS Insurance division, whilst life assurance business is undertaken by Royal Scottish Assurance plc and National Westminster Life Assurance Limited (with the Group’s partner, the AVIVA Group) and Direct Line Life Insurance Company Limited. Investment management business is principally undertaken by companies in the Wealth Management division, including Adam & Co Investment Management Limited and Coutts & Co Investment Management Limited, and in the Corporate Markets division, RBS Asset Management Ltd.
1.3 The FSA’s regulatory approach and supervisory standards
The regulatory regime focuses on the risks to the FSA of not meeting its statutory objectives and uses the full range of regulatory tools (including the authorisation of firms, rule-making, supervision, investigation and enforcement) available to the FSA. It is founded on a risk based, integrated approach to regulation.
The FSA can request information from and give directions to, authorised firms. It may also require authorised firms to provide independent reports prepared by professionals. The FSA can exercise indirect control over the holding companies of authorised firms via its statutory powers to object to persons who are, or will become, “controllers” of these firms.
As part of its regulatory approach the FSA carries out regular risk assessments of the firms in the Group and they are subject generally to direct and on-going FSA supervision.
Setting standards for firms
The FSA carries out the prudential supervision and conduct of business regulation of all authorised firms and also regulates the conduct of their business in the UK. Currently, the application of its conduct of business rules to banking business is limited but detailed conduct of business requirements apply to general insurance intermediary activities, mortgage businesses and investment business activities.
Prudential supervision includes monitoring the adequacy of a firm's management, its financial resources and internal systems and controls. Firms are required to submit regular returns to the FSA which provide material for supervisory assessment. Different prudential requirements have applied to different sectors of the financial services industry. However, the FSA has prepared an Integrated Prudential Sourcebook (“IPSB”) aimed at applying a more harmonised and consistent approach to prudential regulation across the whole industry. From 1 January 2005, insurers were the first industry segment to comply with the FSA's new IPSB requirements. Implementation for the remainder of the industry is expected in stages, from 1 January 2005 until 1 January 2008.
Many of the standards relating to the capital which firms must hold to absorb losses arising from risks to its business are determined by EU legislation or are negotiated internationally. The current capital adequacy regime requires firms to maintain certain levels of capital, of certain specified types (or tiers), against particular business risks.
In its supervisory role, the FSA sets requirements relating to matters such as consolidated supervision, capital adequacy, liquidity, large exposures, and the adequacy of accounting procedures and controls. Banks are required to set out their policy on “large exposures” and to inform the FSA of this. The policy must be reviewed annually and any significant departures from policies must be discussed with the FSA. Large exposures must be monitored and controlled.
As regards the insurance industry, the FSA’s primary objective is to regulate and supervise the industry so that policyholders have confidence that they have bought appropriate products, and so that UK insurers are able to meet their liabilities and treat customers fairly. The FSA sets requirements relating to “margins of solvency” (i.e. the excess of the value of assets over the amount of liabilities). Companies carrying out insurance business are required to submit regular returns covering reserves and solvency to the FSA.
206
Firms must also meet standards relating to senior management and internal systems and controls and must comply with rules designed to reduce the scope for firms to be used for money laundering. Revised Joint Money Laundering Steering Group Guidance Notes will come into force approximately mid 2006. The EU has published its draft Third Money Laundering Directive which will supersede the two previous Anti Money Laundering Directives. Implementation is expected in 2007.
Conduct of business standards essentially govern key aspects of firms’ relationships with customers, and require the provision of clear and adequate information, the managing of conflicts of interest and the recommending of products suitable to the needs of customers. The marketing of financial products (particularly investment products) is subject to detailed requirements.
1.4 Focus on customers
An important element in securing an appropriate degree of consumer protection is ensuring that suitable arrangements are made for dealing with customer complaints. Firms are required to establish appropriate internal complaint handling procedures and to report complaints statistics to the FSA. Where an issue cannot be resolved by the parties it may be referred for independent assessment to the Financial Ombudsman Service.
The FSA’s high level principles require all regulated firms to treat their customers fairly. The FSA has undertaken a number of industry wide thematic reviews on this issue, and this is expected to continue in 2006. The FSA has indicated that it will include assessment of firms' effectiveness in this area in regular risk assessments of firms.
The Financial Services Compensation Scheme (financed by levies on authorised firms) is available to provide compensation up to certain limits if a firm collapses owing money to investors, depositors or policyholders.
1.5 Fraud
Towards the end of October 2004, the FSA launched its new policy on combating fraud in the financial services industry – Fighting Fraud in Partnership. The FSA is working on a programme of activities focusing on (i) actions that the FSA will take, (ii) FSA support for work by trade associations and the industry, (iii) creating closer relationships with law enforcement agencies and, (iv) the Government making fraud a higher law enforcement priority and leading the development of a fraud strategy. On 26 October 2005, the Attorney General announced that the Government will carry out a wide ranging review of fraud to consider the scale and costs to the country of fraud. The final report is to be produced by late spring 2006.
1.6 Enforcement
Where appropriate, the FSA may discipline and/or prosecute for breaches of the legislative or regulatory requirements. The FSA works closely with the criminal authorities and uses both civil and criminal powers. It can withdraw a firm’s authorisation, discipline firms and individuals, prosecute for various offences and require funds to be returned to customers.
The FSA also has powers under certain consumer legislation to take action against authorised firms to address unfair terms in financial services consumer contracts.
1.7 Extension of the FSA’s responsibilities
From 31 October 2004, the scope of the FSA’s responsibilities was widened to cover the regulation and supervision of mortgage lending and administration and the provision of mortgage advice. Arrangements relating to the sale and administration of general insurance (and certain other insurance) contracts became regulated from 14 January 2005.
1.8 Other relevant UK agencies and Government departments
Consumer credit issues are covered by the Department of Trade and Industry (“DTI”) and the Office of Fair Trading (“OFT”) and competition issues are dealt with by the OFT.
Changes to consumer credit regulation are being promulgated at both national and EU levels. A number of changes to the UK regime took effect in May 2005, and the Consumer Credit Bill, once enacted in 2006, will make further, more fundamental, changes. Negotiations also continue on a draft EU Consumer Credit Directive, to harmonise core regulatory standards in each EU Member State. The UK regime will need to change again when this Directive is implemented in 2008 or later.
As discussed above, the retail banking and consumer credit industries are subject to continuing regulatory scrutiny, both in the UK and at the EU level. Details of the main competition inquiries which may affect the Group are set out below.
In June 2005, the European Commission launched a sector inquiry into competition in financial services. The financial services sector inquiry includes an investigation into three areas - payment cards, core retail banking and business insurance – across all 25 Member States. The outcome of the inquiry will not be known for some time, but the Commission wishes to promote the further integration of EU financial markets with a view to enhancing competitiveness, and accordingly it is likely to have an impact on markets in which the Group operates.
In March 2002, the UK Competition Commission recommended a number of pricing and behavioural remedies following its inquiry into the UK market for the supply of banking services to small and medium-sized enterprises. The Group gave undertakings to implement these remedies in 2003. However, the Competition Commission recommended in its 2002 Report that the OFT review the effectiveness of these undertakings after three years. In January 2006, the OFT announced that it was beginning its review, and that it expected to report to the Competition Commission around the end of 2006, unless its interim findings indicate a need for substantial further work.
In September 2005, the Citizens Advice Bureau made a super-complaint to the OFT regarding payment protection insurance. Following its preliminary inquiry, the OFT identified certain areas which it believes indicate the need for a more detailed examination of the sector, and it announced in December 2005 that it would be undertaking a market study. The market study was launched in April 2006, and the OFT expects to publish its report by the end of 2006.
The OFT reached a decision in September 2005 that the method by which the MasterCard interchange fees are set infringes competition law. In particular, the OFT claims that the interchange fee is used to recover “extraneous costs” for services which are not necessary for the operation of the MasterCard scheme. The Group (along with other card issuers) disputes the OFT’s findings and, together with the MasterCard Members Forum, has appealed the decision to the Competition Appeals Tribunal. It is expected that the appeal will be heard in September 2006.
In November 2004, MasterCard introduced new arrangements for setting the fallback interchange fees. In February 2006, the OFT announced that it was launching a further investigation into MasterCard’s new arrangements for the period after November 2004. Since the appeal in the earlier case will potentially have a decisive effect on the outcome of this further investigation, the OFT has said that it will confine its investigative activities to the gathering of further information pending the conclusion of the appeal.
The OFT has also issued a statement of objections against VISA and its UK members (including the Group) in October 2005, regarding interchange fees. The VISA case is at an earlier stage than the MasterCard case, and in the light of the importance of the outcome of the MasterCard appeal to the VISA case, the OFT has indicated that it will stay proceedings in the VISA case pending the conclusion of the MasterCard case.
In April 2006, the OFT published a statement setting out its views on the level of default charges set by credit card issuers in their contracts with consumers. The OFT is of the view that these charges are generally set at a higher level than is legally fair. It has therefore published its views on the principles which should apply to such charges, at the same time indicating that it is minded to challenge any charge in excess of a threshold of £12. Only a court can decide whether the level of a charge is fair, but the OFT has given interested parties until 31 May 2006 to respond to its position statement. The OFT has also said that the same principles regarding fairness should apply to other consumer contracts, such as bank overdrafts, store cards and mortgages. The Group is currently considering its response to the OFT’s announcement.
1.9 The European dimension
Much of the regulatory agenda in the UK and other European Member States in which the Group operates continues to be set by the European Union. Legislation comprising the Union’s Financial Services Action Plan is nearly complete and implemented, with attention now turning to the policy agenda through to 2010. The Commission wishes to pursue a different approach to policymaking: costed, evidence-based and targeted. Nonetheless, there are some major initiatives already in the pipeline; including a revised Consumer Credit Directive, a directive to establish a Legal Framework for the Euro Payments Area, Solvency II (a revised EU capital framework for insurance companies), and possible legislation on mortgage credit. In addition, the Capital Requirements Directive and Markets in Financial Instruments Directive, both of which apply to the Group are expected to be implemented in the next two years. The Group has been increasingly engaged with EU and national policymakers on all these priority measures, and will aim to maintain this level of involvement.
For a discussion of recent inquiries by the European Commission, see subsection 1.8 immediately above.
207
Additional informationcontinued
2 United States
As the ultimate parent of Citizens’ subsidiary US banks, the company is a bank holding company within the meaning of, and subject to regulation and supervision under, the US Bank Holding Company Act of 1956, as amended (the ‘BHCA’), by the Board of Governors of the Federal Reserve System (the ‘Federal Reserve Board’). Under current Federal Reserve Board policy, the company is expected to act as a source of financial strength to its US bank subsidiaries.
The BHCA generally prohibits the company from acquiring, directly or indirectly, the ownership or control of more than 5% of the voting shares of any company engaged in non-banking activities in the United States unless the Board has determined, by order or regulation, that such activities are so closely related to banking or managing or controlling banks as to be a proper incident thereto. In addition, the BHCA requires the company to obtain the prior approval of the Federal Reserve Board before acquiring, directly or indirectly, the ownership or control of more than 5% of any class of the voting shares of any US bank or bank holding company. With passage of the Gramm-Leach-Bliley Act of 1999 (the “GLBA”), bank holding companies that have met certain eligibility criteria and elected to become ‘financial holding companies’ are permitted to engage in a significantly expanded set of non-banking activities, including making controlling investments in non-bank business ventures without prior approval from the Federal Reserve Board under the Federal Reserve Board’s merchant banking authority. The company elected to become a financial holding company effective in February 2004. In November 2005, the company notified the Federal Reserve Board that it had commenced its merchant banking activities through its US subsidiary, Greenwich Capital Markets, Inc.
The company’s US bank and non-bank subsidiaries, and the Royal Bank’s US offices, are subject to direct supervision and regulation by various other federal and state authorities. Citizens’ state chartered bank subsidiaries are subject to regulation and supervision by state banking authorities and the US Federal Deposit Insurance Corporation, and the Royal Bank’s New York branch is supervised by the New York State Banking Department. The company's US insurance agencies are regulated by state insurance authorities. The company’s US securities affiliates, including Greenwich Capital Markets Inc., are subject to regulation and supervision by the US Securities and Exchange Commission and various self-regulating organisations. The futures activities of Greenwich Capital Markets, Inc. are also subject to oversight by the US Commodity Futures Trading Commission and the Chicago Board of Trade. Charter One Bank N.A., Citizens Bank NA, and RBS National Bank are regulated and supervised primarily by the US Office of the Comptroller of the Currency.
3 Regulatory developments for capital and risk management
The Basel Committee on Banking Supervision, which meets at the Bank of International Settlements in Switzerland, sets the standards for firm’s weighted risk asset calculations and associated regulatory capital triggers. This Committee published a revised framework, called Basel 2, in June 2004.
In the EU, the framework became law through the Capital Requirements Directive (EU CRD) and associated changes to national laws or regulatory guidelines (for example the FSA’s Integrated Prudential Sourcebook). Within the US, regulators have the flexibility to implement Basel 2 directly, after a Final Notice of Prudential Rulemaking expected later in 2006. Full adoption of these new rules comes into force across the EU on 1 January 2008 and the US on 1 January 2009.
Application of Basel 2 differs between jurisdictions. The EU is applying Basel 2 to all banks and investment firms. The US is taking a different approach, mandating that their largest internationally active banks use the ‘Advanced’ approaches for credit and operational risk calculations; other banks can either remain on Basel 1 (or a modified version thereof, called Basel 1a) or ‘opt-into’ Basel 2. Our US subsidiary, Citizens, currently falls outside the group of mandated Basel 2 banks for the purposes of US regulation.
Basel 2, based around three Pillars, presents a fundamental change to the current capital adequacy regime and will have wide ranging consequences for the banking industry as a whole. RBS is making good progress in satisfying the requirements for credit, market and operational risk which, together, represent the minimum capital standards (Pillar 1). Work on the other Pillars of Basel 2, supervisory review (Pillar 2) and market disclosures (Pillar 3) are also progressing as the standards are emerging from the regulatory authorities.
208
Description of property and equipment
The Group operates from a number of locations worldwide, principally in the UK. At 31 December 2005, the Royal Bank and NatWest had 643 and 1,631 retail branches, respectively, in the UK. Ulster Bank and First Active had a network of 272 branches in Northern Ireland and the Republic of Ireland. Citizens had 1,635 retail banking offices (including in-store branches) covering Connecticut, Delaware, Illinois, Indiana, Massachusetts, Michigan, New Hampshire, New Jersey, New York, Ohio, Pennsylvania, Rhode Island and Vermont. A substantial majority of the UK branches are owned by the Royal Bank, NatWest and their subsidiaries or are held under leases with unexpired terms of over 50 years. The Group’s principal properties include its headquarters at Gogarburn, Edinburgh, its principal offices in London at 135 and 280 Bishopsgate and the Drummond House administration centre located at South Gyle, Edinburgh.
Total capital expenditure on premises (excluding investment properties), computers and other equipment in the year ended 31 December 2005 was £1,275 million (2004 – £1,578 million).
Major shareholders
Details of major shareholders of the company’s ordinary and preference shares are given on page 63.
With the exception of Banco Santander Central Hispano S.A. which sold (i) 79 million shares representing 2.5% of the company’s ordinary share capital on 9 September 2004 and (ii) 82 million shares representing 2.5% of the company’s ordinary share capital on 27 January 2005, there have been no significant changes in the percentage ownership of major shareholders of the company’s ordinary and preference shares during the three years ended 27 February 2006. All shareholders within a class of the company’s shares have the same voting rights. The company is not directly or indirectly owned or controlled by another corporation or any foreign government.
At 27 February 2006, the directors of the company had options to purchase a total of 1,583,566 ordinary shares of the company.
As at 31 December 2005, almost all of the company’s US$ denominated preference shares were held by shareholders registered in the US. All other shares were predominantly held by shareholders registered outside the US.
Material Contracts
The company and its subsidiaries are party to various contracts in the ordinary course of business. For the year ended 31 December 2005, there have been no material contracts entered into outside the ordinary course of business.
209
[Page intentionally left blank.]
210
Shareholder information
| Contents |
| 212 | Financial calendar |
| 212 | Shareholder enquiries |
| 212 | Capital gains tax |
| 213 | Analyses of ordinary shareholders |
| 213 | Trading market |
| 215 | Dividend history |
| 216 | Taxation for US Holders |
| 220 | Share repurchases |
| 220 | Exchange controls |
| 220 | Memorandum and articles of association |
| 220 | Documents on display |
211
Shareholder information
| Financial calendar | |
| | |
| Annual General Meeting | 28 April 2006 at 2.00 pm, |
| | Edinburgh International Conference Centre, |
| | The Exchange, Morrison Street, Edinburgh |
| | |
| Interim results | 4 August 2006 |
| | |
Dividends | |
| Payment dates: | |
Ordinary shares (2005 Final) | 9 June 2006 |
| Ordinary shares (2006 Interim) | October 2006 |
| Cumulative preference shares | 31 May and 29 December 2006 |
| Non-cumulative dollar preference shares | 31 March, 30 June, 29 September and 29 December 2006 |
| Ex-dividend dates: | |
| Ordinary shares (2005 Final) | 8 March 2006 |
| Cumulative preference shares | 3 May 2006 |
| Record dates: | |
| Ordinary shares (2005 Final) | 10 March 2006 |
Cumulative preference shares | 5 May 2006 |
Shareholder enquiries
Shareholdings in the company may be checked by visiting our website (www.rbs.com/shareholder). You will need the shareholder reference number printed on your share certificate or tax voucher to gain access to this information.
Braille and audio Annual Review and Summary Financial Statement
Shareholders requiring a Braille or audio version of the Annual Review and Summary Financial Statement should contact the Registrar on 0870 702 0135.
ShareGift
The company is aware that shareholders who hold a small number of shares may be retaining these shares because dealing costs make it uneconomical to dispose of them. ShareGift, the charity share donation scheme is a free service operated by The Orr Mackintosh Foundation (registered charity 1052686) to enable shareholders to donate unwanted shares to charity.
Should you wish to donate your shares to charity in this way you should contact ShareGift for further information:
ShareGift, The Orr Mackintosh Foundation,
46 Grosvenor Street, London W1K 3HN
Tel: 020 7337 0501
www.ShareGift.org
Donating your shares in this way will not give rise to either a gain or a loss for UK capital gains tax purposes and you may be able to reclaim UK income tax on gifted shares. Further information can be obtained from HM Revenue & Customs.
Capital gains tax
For shareholders who held RBS ordinary shares at 31 March 1982, the market value of one ordinary share held was 103p. After adjusting for the 1 March 1985 rights issue, the 1 September 1989 capitalisation issue and the bonus issue of Additional Value Shares on 12 July 2000, the adjusted 31 March 1982 base value of one ordinary share held currently is 46.1p.
For shareholders who held NatWest ordinary shares at 31 March 1982, the market value of one ordinary share held was 85.16p for shareholders who accepted the basic terms of the RBS offer. This takes account of the August 1984 and June 1986 rights issues and the June 1989 bonus issue of NatWest ordinary shares as well as the subsequent issue of Additional Value Shares.
When disposing of shares, shareholders are also entitled to indexation allowance (to April 1998 only in the case of individuals and non-corporate holders), which is calculated on the 31 March 1982 value, on the cost of subsequent purchases from the date of purchase and on the subscription for rights from the date of that payment. Further adjustments must be made where a shareholder has chosen to receive shares instead of cash for dividends. Individuals and non-corporate shareholders may also be entitled to some taper relief to reduce the amount of any chargeable gain on disposal of shares.
The information set out above is intended as a general guide only and is based on current United Kingdom legislation and HM Revenue & Customs practice as at this date. This information deals only with the position of individual shareholders who are resident in the United Kingdom for tax purposes, who are the beneficial owners of their shares and who hold their shares as an investment. It does not deal with the position of shareholders other than individual shareholders, shareholders who are resident outside the United Kingdom for tax purposes or certain types of shareholders, such as dealers in securities.
212
| Analyses of ordinary shareholders at 31 December 2005 | | | | | |
| | shareholdings | | millions | | %
of total |
|
|
|
|
|
|
| Individuals | 168,687 | | 233.5 | | 7.3 |
| Banks and nominee companies | 19,832 | | 2,882.5 | | 90.2 |
| Investment trusts | 162 | | 0.7 | | — |
| Insurance companies | 325 | | 1.8 | | 0.1 |
| Other companies | 2,531 | | 65.4 | | 2.0 |
| Pension trusts | 46 | | 8.2 | | 0.3 |
| Other corporate bodies | 102 | | 4.4 | | 0.1 |
|
|
|
|
|
|
| | 191,685 | | 3,196.5 | | 100.0 |
| |
|
|
|
|
|
| | | | | | |
|
|
|
|
|
|
| Range of shareholdings: | | | | | |
| 1–1,000 | 128,045 | | 43.7 | | 1.4 |
| 1,001–10,000 | 58,577 | | 158.6 | | 5.0 |
| 10,001–100,000 | 3,738 | | 93.1 | | 2.9 |
| 100,001–1,000,000 | 929 | | 301.4 | | 9.4 |
| 1,000,001–10,000,000 | 341 | | 951.8 | | 29.8 |
| 10,000,001 and over | 55 | | 1,647.9 | | 51.5 |
|
|
|
|
|
|
| | 191,685 | | 3,196.5 | | 100.0 |
| |
|
|
|
|
|
Trading market
On 13 September 1995, 16 October 1996, 26 March 1997, 12 February 1998, 8 February 1999, 30 July 1999, 30 September 1999, 12 June 2001, 30 September 2004, 26 August 2004, 19 May 2005 and 9 November 2005 the company issued the following American Depositary Shares (“ADSs”) in the United States:
7,000,000 Series D (“Series D ADSs”) representing 7,000,000 non-cumulative dollar preference shares, Series D;
8,000,000 Series E (“Series E ADSs”) representing 8,000,000 non-cumulative dollar preference shares, Series E;
8,000,000 Series F (“Series F ADSs”) representing 8,000,000 non-cumulative dollar preference shares, Series F;
10,000,000 Series G (“Series G ADSs”) representing 10,000,000 non-cumulative dollar preference shares, Series G;
12,000,000 Series H (“Series H ADSs”) representing 12,000,000 non-cumulative dollar preference shares, Series H;
12,000,000 Series I (“Series I ADSs”) representing 12,000,000 non-cumulative dollar preference shares, Series I;
9,000,000 Series J (“Series J ADSs”) representing 9,000,000 non-cumulative dollar preference shares, Series J;
16,000,000 Series K (“Series K ADSs”) representing 16,000,000 non-cumulative dollar preference shares, Series K;
34,000,000 Series L (“Series L ADSs”) representing 34,000,000 non-cumulative dollar preference shares, Series L;
37,000,000 Series M (“Series M ADSs”) representing 37,000,000 non-cumulative dollar preference shares, Series M;
40,000,000 Series N (“Series N ADSs”) representing 40,000,000 non-cumulative dollar preference shares, Series N; and
22,000,000 Series P (“Series P ADSs”) representing 22,000,000 non-cumulative dollar preference shares, Series P.
Each of the respective ADSs represents the right to receive one corresponding preference share, and is evidenced by an American Depositary Receipt (“ADR”) and is listed on the New York Stock Exchange (“NYSE”).
The ADRs evidencing the ADSs above were issued pursuant to Deposit Agreements, among the company, The Bank of New York, as depository, and all holders from time-to-time of ADRs issued thereunder. Currently, there is no non-United States trading market for any of the non-cumulative dollar preference shares. All of the non-cumulative dollar preference shares are held by the depository, as custodian, in bearer form.
On 28 November 2005, the company redeemed the 9 million Series J non-cumulative preference shares of US$0.01 each and on 6 March 2006, the company redeemed the 7 million Series D and the 12 million Series I, non-cumulative preference shares of US$0.01.
At 31 December 2005, there were 216 registered shareholders of Series D ADSs, 114 registered shareholders of Series E ADSs, 133 registered shareholders of Series F ADSs, 83 registered shareholders of Series G ADSs, 82 registered shareholders of Series H ADSs, 112 registered shareholders of Series I ADSs, 62 registered shareholders of Series K ADSs, 28 registered shareholders of Series L ADSs, 1 registered shareholder of Series M ADSs, 43 registered shareholders of series N ADSs and 55 registered shareholders of Series P ADSs.
On 29 March 1994 and 23 June 2003, respectively, the company issued 8,000,000 Exchangeable Capital Securities (“X-CAPs”), Series A and 34,000,000 Exchangeable Capital Securities, Series B, each in connection with a public offering in the United States. On 30 September 2004, all of the outstanding Series B X-CAPs were exchanged into 34,000,000 non-cumulative dollar preference shares, Series L. On 31 December 2005, all of the outstanding Series A X-CAPS were redeemed.
On 20 August 2001, the company issued US$1.2 billion of perpetual regulatory tier one securities (‘PROs’) in connection with a public offering in the United States.
The ADSs and the PRO’s are listed on the NYSE.
213
Shareholder informationcontinued
The following table shows the high and low sales prices for each of the outstanding ADSs and PROs for the periods indicated, as reported on the NYSE composite tape:
| Figures in US$ | | | Series D
ADSs | | Series E
ADSs | | Series F
ADSs | | Series G
ADSs | | Series H
ADSs | | Series I
ADSs | | Series K
ADSs | | Series L
ADSs | | Series M
ADSs | | Series N
ADSs | | Series P
ADSs | | PROs(1) | |
|
|
|
|
|
|
|
|
|
|
|
|
|
|
|
|
|
|
|
|
|
|
|
|
|
|
|
| By month | | | | | | | | | | | | | | | | | | | | | | | | | | |
| March 2006 | High | | 25.32 | | 26.24 | | 26.56 | | 25.90 | | 25.78 | | 25.32 | | 25.86 | | 24.50 | | 25.62 | | 25.60 | | 25.34 | | 124.67 | |
| | Low | | 25.32 | | 25.55 | | 25.72 | | 25.45 | | 25.35 | | 25.31 | | 25.22 | | 23.20 | | 25.08 | | 25.10 | | 24.72 | | 119.63 | |
| February 2006 | High | | 25.42 | | 26.14 | | 26.89 | | 25.70 | | 25.63 | | 25.50 | | 25.77 | | 24.20 | | 25.55 | | 25.58 | | 25.30 | | 125.76 | |
| | Low | | 25.29 | | 25.73 | | 26.33 | | 25.47 | | 25.41 | | 25.23 | | 25.43 | | 23.67 | | 25.39 | | 25.36 | | 25.15 | | 122.25 | |
| January 2006 | High | | 26.25 | | 26.38 | | 27.25 | | 25.67 | | 25.52 | | 25.85 | | 25.75 | | 23.90 | | 25.58 | | 25.50 | | 25.35 | | 122.23 | |
| | Low | | 25.66 | | 25.73 | | 26.63 | | 25.35 | | 25.25 | | 25.31 | | 25.45 | | 23.09 | | 25.38 | | 25.13 | | 24.95 | | 119.70 | |
| December 2005 | High | | 26.25 | | 26.76 | | 27.83 | | 25.92 | | 25.67 | | 26.05 | | 25.95 | | 23.56 | | 25.50 | | 25.29 | | 25.30 | | 121.96 | |
| | Low | | 25.37 | | 25.75 | | 26.75 | | 25.28 | | 25.20 | | 25.35 | | 25.30 | | 22.90 | | 25.12 | | 24.97 | | 24.90 | | 118.77 | |
| November 2005 | High | | 26.20 | | 26.27 | | 27.05 | | 26.00 | | 25.91 | | 25.80 | | 26.05 | | 23.31 | | 25.28 | | 25.13 | | 25.50 | | 120.47 | |
| | Low | | 25.41 | | 25.80 | | 26.21 | | 25.45 | | 25.50 | | 25.49 | | 25.57 | | 22.67 | | 24.80 | | 24.70 | | 24.60 | | 116.70 | |
| October 2005 | High | | 26.26 | | 26.41 | | 26.96 | | 25.94 | | 25.66 | | 26.09 | | 25.92 | | 24.19 | | 25.42 | | 25.45 | | — | | 121.87 | |
| | Low | | 25.38 | | 26.10 | | 26.02 | | 25.54 | | 25.50 | | 25.56 | | 25.73 | | 22.90 | | 24.77 | | 24.92 | | — | | 117.23 | |
| | | | | | | | | | | | | | | | | | | | | | | | | | | |
| By quarter | | | | | | | | | | | | | | | | | | | | | | | | | | |
| 2006: First quarter | High | | 26.25 | | 26.38 | | 27.25 | | 25.90 | | 25.78 | | 25.85 | | 25.86 | | 24.50 | | 25.62 | | 25.60 | | 25.35 | | 125.76 | |
| | Low | | 25.29 | | 25.55 | | 25.72 | | 25.35 | | 25.25 | | 25.23 | | 25.22 | | 23.09 | | 25.08 | | 25.10 | | 24.72 | | 119.63 | |
| 2005: Fourth quarter | High | | 26.26 | | 26.76 | | 27.83 | | 26.00 | | 25.91 | | 26.09 | | 26.05 | | 24.19 | | 25.50 | | 25.45 | | 25.50 | | 121.96 | |
| | Low | | 25.37 | | 25.75 | | 26.02 | | 25.28 | | 25.20 | | 25.35 | | 25.30 | | 22.67 | | 24.77 | | 24.70 | | 24.60 | | 116.70 | |
| 2005: Third quarter | High | | 26.88 | | 27.00 | | 27.45 | | 26.00 | | 25.96 | | 26.35 | | 26.37 | | 24.90 | | 26.30 | | 26.23 | | — | | 127.58 | |
| | Low | | 25.56 | | 26.10 | | 26.50 | | 25.51 | | 25.36 | | 25.62 | | 25.59 | | 23.95 | | 25.37 | | 25.33 | | — | | 121.31 | |
| 2005: Second quarter | High | | 26.24 | | 27.05 | | 27.30 | | 25.80 | | 26.19 | | 26.08 | | 26.53 | | 24.40 | | 25.97 | | 25.38 | | — | | 128.54 | |
| | Low | | 25.62 | | 26.30 | | 26.27 | | 25.37 | | 25.30 | | 25.45 | | 25.75 | | 23.76 | | 25.30 | | 25.00 | | — | | 121.46 | |
| 2005: First quarter | High | | 26.75 | | 27.50 | | 28.00 | | 25.97 | | 25.79 | | 25.96 | | 26.84 | | 24.99 | | 26.75 | | — | | — | | 129.57 | |
| | Low | | 25.60 | | 26.11 | | 26.26 | | 25.30 | | 25.26 | | 25.33 | | 25.82 | | 23.31 | | 25.01 | | — | | — | | 120.03 | |
| 2004: Fourth quarter | High | | 26.96 | | 28.35 | | 27.90 | | 25.92 | | 25.87 | | 26.00 | | 27.18 | | 24.68 | | 26.16 | | — | | — | | 122.52 | |
| | Low | | 25.89 | | 27.00 | | 27.16 | | 25.30 | | 25.30 | | 25.30 | | 26.32 | | 23.51 | | 25.21 | | — | | — | | 117.44 | |
| 2004: Third quarter | High | | 27.45 | | 28.38 | | 28.15 | | 25.75 | | 25.62 | | 25.79 | | 27.30 | | — | | 25.35 | | — | | — | | 121.77 | |
| | Low | | 26.08 | | 26.65 | | 26.65 | | 25.12 | | 24.95 | | 25.20 | | 26.30 | | — | | 25.13 | | — | | — | | 112.21 | |
| 2004: Second quarter | High | | 27.22 | | 29.00 | | 28.10 | | 25.65 | | 25.41 | | 26.00 | | 27.97 | | — | | — | | — | | — | | 122.11 | |
| | Low | | 25.84 | | 25.90 | | 25.65 | | 24.20 | | 24.45 | | 25.14 | | 25.70 | | — | | — | | — | | — | | 110.58 | |
| 2004: First quarter | High | | 27.90 | | 29.00 | | 28.45 | | 25.90 | | 25.67 | | 26.25 | | 28.00 | | — | | — | | — | | — | | 125.14 | |
| | Low | | 26.96 | | 27.99 | | 27.65 | | 25.30 | | 25.15 | | 25.70 | | 27.21 | | — | | — | | — | | — | | 116.87 | |
| | | | | | | | | | | | | | | | | | | | | | | | | | | |
| By year | | | | | | | | | | | | | | | | | | | | | | | | | | |
| 2005 | High | | 26.88 | | 27.50 | | 28.00 | | 26.00 | | 26.19 | | 26.35 | | 26.84 | | 24.99 | | 26.75 | | 26.23 | | 25.50 | | 129.57 | |
| | Low | | 25.37 | | 25.75 | | 26.02 | | 25.28 | | 25.20 | | 25.33 | | 25.30 | | 22.67 | | 24.77 | | 24.70 | | 24.60 | | 116.70 | |
| 2004 | High | | 27.90 | | 29.00 | | 28.45 | | 25.92 | | 25.87 | | 26.25 | | 28.00 | | 24.68 | | 26.16 | | — | | — | | 125.14 | |
| | Low | | 25.84 | | 25.90 | | 25.65 | | 24.20 | | 24.45 | | 25.14 | | 25.70 | | 23.51 | | 25.13 | | — | | — | | 110.58 | |
| 2003 | High | | 29.00 | | 29.20 | | 29.05 | | 26.00 | | 26.40 | | 27.40 | | 28.20 | | — | | — | | — | | — | | 130.78 | |
| | Low | | 26.76 | | 27.01 | | 27.03 | | 25.00 | | 25.10 | | 25.65 | | 26.05 | | — | | — | | — | | — | | 111.06 | |
| 2002 | High | | 27.77 | | 28.20 | | 28.00 | | 25.73 | | 26.05 | | 27.08 | | 27.30 | | — | | — | | — | | — | | 116.36 | |
| | Low | | 25.74 | | 25.53 | | 25.15 | | 24.46 | | 24.27 | | 24.50 | | 24.79 | | — | | — | | — | | — | | 100.07 | |
| 2001 | High | | 27.99 | | 27.94 | | 27.20 | | 25.86 | | 27.15 | | 27.00 | | 26.95 | | — | | — | | — | | — | | 106.44 | |
| | Low | | 25.38 | | 25.25 | | 24.31 | | 22.94 | | 22.75 | | 24.63 | | 22.17 | | — | | — | | — | | — | | 96.58 | |
| Notes: |
| (1) | Price quoted as a % of US$1,000 nominal. |
214
Dividend history
As discussed on page 2, the Group implemented IFRS with effect from 1 January 2004. The dividend data presented for 2004 and 2005, each of which is based on IFRS, is not directly comparable with the dividend data presented for 2001, 2002 and 2003 on this page, each of which is based on UK GAAP.
| Preference and other non-equity dividends | | | | | | | | | |
| | | | |
| Following the implementation of IAS 32 on 1 January 2005, several of the Group’s preference share issues are now included in subordinated liabilities. In 2004, all preference shares were classified as non-equity and included in shareholders’ equity. |
| | 2005-IFRS | | 2004-IFRS |
|
|
|
|
|
|
|
| |
|
| | Subordinated
liabilities | | Equity | | Non-Equity |
| Amount per share | $ | | £ | | $ | | £ | | £ |
|
|
|
|
|
|
|
| |
|
| Non-cumulative preference shares of US$0.01 | | | | | | | | | |
| – Series B (1) | — | | — | | | | | | — |
| – Series C (1) | — | | — | | | | | | — |
| – Series D | 2.05 | | 1.13 | | | | | | 1.11 |
| – Series E | 2.03 | | 1.12 | | | | | | 1.10 |
| – Series F | 1.91 | | 1.06 | | | | | | 1.04 |
| – Series G | 1.85 | | 1.02 | | | | | | 1.00 |
| – Series H | 1.81 | | 1.00 | | | | | | 0.98 |
| – Series I | 2.00 | | 1.10 | | | | | | 1.08 |
| – Series J (2) | 1.94 | | 1.06 | | | | | | 1.15 |
| – Series K | 1.97 | | 1.09 | | | | | | 1.07 |
| – Series L | 1.44 | | 0.79 | | | | | | 0.19 |
| – Series M | | | | | 1.60 | | 0.88 | | 0.30 |
| – Series N | | | | | 0.97 | | 0.55 | | — |
| – Series P | | | | | 0.22 | | 0.13 | | — |
| Non-cumulative convertible preference shares ofUS$0.01 | | | | | | | | | |
| – Series 1 | 91.18 | | 50.33 | | | | | | 49.05 |
| – Series 2 (3) | 22.04 | | 11.60 | | | | | | 47.43 |
| – Series 3 (4) | 78.16 | | 43.03 | | | | | | 41.74 |
| Non-cumulative convertible preference shares of€0.01 | | | | | | | | | |
| – Series 1 | 19.83 | | 11.54 | | | | | | 44.19 |
| Non-cumulative preference shares of€0.01 | | | | | | | | | |
| – Series 1 | | | | | 70.72 | | 41.14 | | 3.45 |
| – Series 2 | | | | | — | | — | | –– |
| Non-cumulative convertible preference shares of£0.01 | | | | | | | | | |
| – Series 1 | 126.97 | | 73.87 | | | | | | 73.87 |
| Non-cumulative convertible preference shares of £0.25 | — | | — | | | | | | — |
| Additional Value Shares of £0.01 | — | | — | | | | | | — |
|
|
|
|
|
|
|
| |
|
| Ordinary dividends | | | | | | |
| | 2005-IFRS | | | | 2004-IFRS | |
| Amount per share | cents | | pence | | pence | |
|
|
|
|
|
| |
| Final dividend for previous year declared during current year | 70.8 | | 41.2 | | 35.7 | |
| Interim dividend | 33.3 | | 19.4 | | 16.8 | |
|
|
|
|
|
| |
| Total dividends paid on equity shares | 104.1 | | 60.6 | | 52.5 | |
|
|
|
|
|
| |
| Notes: |
| (1) | Redeemed on 30 January 2003. |
| (2) | Redeemed on 28 November 2005. |
| (3) | Redeemed on 31 March 2005. |
| (4) | Redeemed on 30 December 2005. |
For further information, see Notes 6 and 7 on the accounts.
| Preference and other non-equity dividends | | | | | | | | |
| | | | | | | | | |
| | | | | | | | |
| | | | | 2003-UK
GAAP | | 2002-UK
GAAP | | 2001-UK
GAAP |
| Amount per share | | | | £ | | £ | | £ |
|
| |
|
|
|
|
|
|
| Non-cumulative preference shares of US$0.01 | | | | | | | | |
| – Series B (1) | | | | 0.13 | | 1.65 | | 1.73 |
| – Series C (1) | | | | 0.11 | | 1.40 | | 1.47 |
| – Series D | | | | 1.23 | | 1.34 | | 1.41 |
| – Series E | | | | 1.21 | | 1.32 | | 1.40 |
| – Series F | | | | 1.15 | | 1.25 | | 1.31 |
| – Series G | | | | 1.11 | | 1.21 | | 1.27 |
| – Series H | | | | 1.09 | | 1.18 | | 1.24 |
| – Series I | | | | 1.20 | | 1.31 | | 1.38 |
| – Series J | | | | 1.27 | | 1.39 | | 1.46 |
| – Series K | | | | 1.18 | | 1.29 | | 0.74 |
| Non-cumulative convertible preference shares ofUS$0.01 | | | | | | | | |
| – Series 1 | | | | 54.89 | | 59.15 | | 62.70 |
| – Series 2 | | | | 53.08 | | 57.20 | | 60.63 |
| – Series 3 | | | | 45.57 | | 49.81 | | 53.74 |
| Non-cumulative convertible preference shares of€0.01 | | | | | | | | |
| – Series 1 | | | | 49.58 | | 44.45 | | 41.34 |
| Non-cumulative convertible preference shares of£0.01 | | | | | | | | |
| – Series 1 | | | | 73.87 | | 73.87 | | 73.87 |
| Non-cumulative convertible preference shares of £0.25 | | | | — | | — | | 0.08 |
| Additional Value Shares of £0.01 | | | | 0.55 | | 0.30 | | 0.15 |
|
|
|
|
|
|
|
|
|
| | | | | | |
| Ordinary dividends | | | | | |
| | 2003-UK
GAAP | | 2002-UK
GAAP | | 2001-UK
GAAP |
| Amount per share | pence | | pence | | pence |
|
|
|
|
|
|
| Interim | 14.6 | | 12.7 | | 11.0 |
| Final | 35.7 | | 31.0 | | 27.0 |
|
|
|
|
|
|
| Total dividends on equity shares | 50.3 | | 43.7 | | 38.0 |
|
|
|
|
|
|
| Notes: |
| (1) | Redeemed on 30 January 2003. |
215
Shareholder informationcontinued
Taxation for US Holders
The following discussion summarises certain US federal and UK tax consequences of the acquisition, ownership and disposition of non-cumulative dollar preference shares, ADSs, X-CAPs or PROs by a beneficial owner that is a citizen or resident of the United States or that otherwise will be subject to US federal income tax on a net income basis in respect of the non-cumulative dollar preference shares, ADSs, X-CAPs or PROs (a “US Holder”). This summary assumes that a US Holder is holding non-cumulative dollar preference shares, ADSs, X-CAPs or PROs, as applicable, as capital assets. This summary does not address the tax consequences to a US Holder (i) that is resident (or, in the case of an individual, ordinarily resident) in the UK for UK tax purposes or (ii) generally, that is a corporation which alone or together with one or more associated companies, controls, directly or indirectly, 10% or more of the voting stock of the company.
The statements and practices set forth below regarding US and UK tax laws, including the US/UK double taxation convention relating to income and capital gains which entered into force on 31 March 2003 (the “Treaty”), and the US/UK double taxation convention relating to estate and gift taxes (the “Estate Tax Treaty”), are based on those laws and practices as in force and as applied in practice on the date of this Report. This summary is not exhaustive of all possible tax considerations and holders are advised to satisfy themselves as to the overall tax consequences, including specifically the consequences under US federal, state, local and other laws, and possible changes in taxation law, of the acquisition, ownership and disposition of non-cumulative dollar preference shares, ADSs, X-CAPs or PROs by consulting their own tax advisers.
For the purposes of the Treaty, the Estate Tax Treaty and the US Internal Revenue Code of 1986, as amended (the “Code”), US Holders of ADSs will be treated as owners of the non-cumulative dollar preference shares underlying such ADSs.
Preference shares or ADSs
Taxation of dividends
The company is not required to withhold tax at source from dividend payments it makes or from any amount (including any amounts in respect of accrued dividends) distributed by the company.
Dividends paid by the company will constitute foreign source dividend income for US federal income tax purposes to the extent paid out of the current or accumulated earnings and profits of the company, as determined for US federal income tax purposes. Payments will not be eligible for the dividends-received deduction allowed to corporate US Holders.
Subject to applicable limitations that may vary depending upon a holder’s individual circumstances, dividends paid to certain non-corporate US Holders in taxable years beginning before 1 January 2009 will be taxable at a maximum tax rate of 15%. Non-corporate US Holders should consult their own tax advisers to determine whether they are subject to any special rules that limit their ability to be taxed at this favourable rate.
If a corporate US Holder is subject to UK corporation tax by reason of carrying on a trade in the UK through a permanent establishment and its non-cumulative dollar preference share or ADS is, or has been, used, held or acquired for the purposes of that permanent establishment, certain provisions introduced by the Finance (No. 2) Act 2005 will apply if the US Holder holds its non-cumulative dollar preference share or ADS for a “tax avoidance purpose”. If these provisions apply, dividends on the non-cumulative dollar preference share or ADS, as well as certain fair value credits and debits arising in respect of such share or ADS, will be brought within the charge to UK corporation tax on income and the UK tax position outlined in the preceding paragraphs will not apply in relation to such US Holder.
Taxation of capital gains
A US Holder that is not resident (or, in the case of an individual, ordinarily resident) in the UK will not normally be liable for UK tax on capital gains realised on the disposition of such holder’s non-cumulative dollar preference share or ADS unless at the time of the disposal, in the case of a corporate US Holder, such US Holder carries on a trade in the UK through a permanent establishment or, in the case of any other US Holder, such US Holder carries on a trade, profession or vocation in the UK through a UK branch or agency and such non-cumulative dollar preference share or ADS is or has been used, held or acquired by or for the purposes of such trade (or profession or vocation), permanent establishment, branch or agency. Special rules apply to individuals who are temporarily not resident or ordinarily resident in the UK.
A US Holder will, upon the sale, exchange or redemption of a non-cumulative dollar preference share or ADS, generally recognise capital gain or loss for US federal income tax purposes (assuming that in the case of a redemption, such US Holder does not own, and is not deemed to own, any ordinary shares of the company) in an amount equal to the difference between the amount realised (excluding in the case of a redemption any amount treated as a dividend for US federal income tax purposes, which will be taxed accordingly) and the US Holder’s tax basis in the non-cumulative dollar preference share or ADS.
A US Holder who is liable for both UK and US tax on gain recognised on the disposal of a non-cumulative dollar preference share or ADS will generally be entitled, subject to certain limitations, to credit the UK tax against its US federal income tax liability in respect of such gain.
Estate and gift tax
A non-cumulative dollar preference share or ADS beneficially owned by an individual, whose domicile is determined to be the United States for purposes of the Estate Tax Treaty and who is not a national of the UK, will not be subject to UK inheritance tax on the individual’s death or on a lifetime transfer of the non-cumulative dollar preference share or ADS, except in certain cases where the non-cumulative dollar preference share or ADS (i) is comprised in a settlement (unless, at the time of the settlement, the settlor was domiciled in the United States and was not a national of the UK); (ii) is part of the
216
business property of a UK permanent establishment of an enterprise; or (iii) pertains to a UK fixed base of an individual used for the performance of independent personal services. The Estate Tax Treaty generally provides a credit against US federal estate or gift tax liability for the amount of any tax paid in the UK in a case where the non-cumulative dollar preference share or ADS is subject to both UK inheritance tax and US federal estate or gift tax.
UK stamp duty and stamp duty reserve tax (“SDRT”)
The following is a summary of the UK stamp duty and SDRT consequences of transferring an ADS in registered form (otherwise than to the custodian on cancellation of the ADS) or of transferring a non-cumulative dollar preference share. A transfer of a registered ADS executed and retained in the United States will not give rise to stamp duty and an agreement to transfer a registered ADS will not give rise to SDRT. Stamp duty or SDRT will normally be payable on or in respect of transfers of non-cumulative dollar preference shares and accordingly any holder who acquires or intends to acquire non-cumulative dollar preference shares is advised to consult its own tax advisers in relation to stamp duty and SDRT.
X-CAPs
United States
Because the X-CAPs have no stated maturity, can be exchanged for preference shares or ADSs at the option of the company, would be treated as if they were preference shares in a winding-up of the company, and the company may elect not to make payments on the X-CAPs, the X-CAPs will be treated as equity for US federal income tax purposes.
Payments (including any UK withholding tax, as to which see below) will constitute foreign source dividend income for US federal income tax purposes to the extent paid out of the current or accumulated earnings and profits of the company, as determined for US federal income tax purposes. Payments will not be eligible for the dividends-received deduction allowed to corporate US Holders. A US Holder who is entitled under the Treaty to a refund of UK tax, if any, withheld on a payment will not be entitled to claim a foreign tax credit with respect to such tax.
Subject to applicable limitations that may vary depending upon a holder’s individual circumstances, dividends paid to certain non-corporate US Holders in taxable years beginning before 1 January 2009 will be taxable at a maximum tax rate of 15%. Non-corporate US Holders should consult their own tax advisers to determine whether they are subject to any special rules that limit their ability to be taxed at this favourable rate.
A US Holder will, upon the sale, exchange or redemption of X-CAPs, generally recognise capital gain or loss for US federal income tax purposes (assuming that in the case of a redemption, such US Holder does not own, and is not deemed to own, any ordinary shares of the company) in an amount equal to the difference between the amount realised (excluding in the case of a redemption any amount treated as a dividend for US federal income tax purposes, which will be taxed accordingly) and the US Holders tax basis in the X-CAPs.
A US Holder who is liable for both UK and US tax on gain recognised on the disposal of the X-CAPs will generally be entitled, subject to certain limitations, to credit the UK tax against its US federal income tax liability in respect of such gain.
Gain or loss will not be recognised by a US Holder upon the exchange of X-CAPs for preference shares or ADSs pursuant to the company’s exercise of its exchange right. A US Holder’s basis in the preference shares or ADSs received in exchange for its X-CAPs will be the same as the US Holder’s basis in the X-CAPs at the time of the exchange and the US Holder’s holding period for the preference shares or ADSs received in the exchange will include the holding period of the X-CAPs exchanged.
United Kingdom
Taxation of payments of interest
Payments on the X-CAPs will constitute interest rather than dividends for UK withholding tax purposes. However, the X-CAPs will constitute ‘quoted eurobonds’ within the meaning of section 349 of the Income and Corporation Taxes Act 1988, and therefore payments of interest will not be subject to withholding or deduction for or on account of UK taxation as long as the X-CAPs remain at all times listed on the New York Stock Exchange or some other recognised stock exchange within the meaning of section 841 of the Income and Corporation Taxes Act 1988. In all other cases an amount must be withheld on account of UK income tax at the lower rate (currently 20%) subject to any direction to the contrary by HM Revenue & Customs under the Treaty and except that the withholding obligation is disapplied in respect of payments to persons who the company reasonably believes are within the charge to corporation tax or fall within various categories enjoying a special tax status (including charities and pension funds), or are partnerships consisting of such persons (unless HM Revenue & Customs directs otherwise).
If interest were paid under deduction of UK income tax (e.g., if the X-CAPs lost their listing), US Holders may be able to claim a refund of the tax deducted under the Treaty.
Any paying agent or other person through whom interest is paid to, or by whom interest is received on behalf of, an individual, may be required to provide information in relation to the payment and the individual concerned to HM Revenue & Customs. HM Revenue & Customs may communicate this information to the tax authorities of other jurisdictions.
HM Revenue & Customs confirmed at around the time of issue of the X-CAPs that interest payments should not be treated as distributions for UK tax purposes by reason of (i) the fact that interest may be deferred under the terms of issue or (ii) the undated nature of the X-CAPs, provided that at the time an interest payment is made, the X-CAPs are not held by a company which is ‘associated’ with the company or by a ‘funded company’. A company will be associated with the company if, broadly speaking, it is in the same group as the company. A company will be a ‘funded company’ for these purposes if there are arrangements involving that company being put in funds (directly or indirectly) by the company, or an entity associated with the company. In this respect,
217
Shareholder informationcontinued
Taxation for US Holders(continued)
HM Revenue & Customs has confirmed that a company holding an interest in X-CAPs which incidentally has banking facilities with any company associated with the company will not be a ‘funded company’ by virtue of such facilities.
Interest on the X-CAPs constitutes UK source income for UK tax purposes and, as such, may be subject to income tax by direct assessment even where paid without withholding. However, interest with a UK source received without deduction or withholding on account of UK tax will not be chargeable to UK tax in the hands of a US Holder unless, in the case of a corporate US Holder, such US Holder carries on a trade in the UK through a UK permanent establishment or in the case of other US Holders, such persons carry on a trade, profession or vocation in the UK through a UK branch or agency in connection with which the interest is received or to which the X-CAPs are attributable. There are exemptions for interest received by certain categories of agents (such as some brokers and investment managers).
EU Directive on taxation of savings income
The European Union has adopted a directive regarding the taxation of savings income. The Directive requires Member States of the European Union to provide to the tax authorities of other Member States details of payments of interest or other similar income paid by a person to an individual in another Member State, except that Belgium, Luxembourg and Austria are instead imposing a withholding system for a transitional period unless during such period they elect otherwise.
Disposal (including redemption)
A disposal (including redemption) of X-CAPs by a non-corporate US Holder will not give rise to any liability to UK taxation on capital gains unless the US Holder carries on a trade (which for this purpose includes a profession or vocation) in the UK through a branch or agency and the X-CAPs are, or have been, held or acquired for the purposes of that trade, branch or agency. The exchange by such US Holder of X-CAPs for preference shares or ADSs pursuant to the company’s exercise of its exchange right will not give rise to a charge to UK tax on capital gains even if such US Holder would be subject to tax on a disposal of such holder’s X-CAPs in accordance with the tax treatment referred to previously.
A transfer of X-CAPs by a US Holder will not give rise to a charge to UK tax on accrued but unpaid interest payments, unless the US Holder is an individual or other non-corporate taxpayer and at any time in the relevant year of assessment or accounting period carries on a trade in the UK through a branch or agency to which the X-CAPs are attributable.
Annual tax charges
Corporate US Holders of X-CAPs may be subject to annual UK tax charges (or relief) by reference to fluctuations in exchange rates and in respect of profits, gains and losses arising from the X-CAPs, but only if such corporate US Holders carry on a trade, profession or vocation in the UK through a UK permanent establishment to which the X-CAPs are attributable.
Inheritance tax
X-CAPs in bearer form physically held outside the UK should not be subject to UK inheritance tax in respect of a lifetime transfer by, or the death of, a US Holder who is neither domiciled nor deemed to be domiciled in the UK for inheritance tax purposes. However, in relation to X-CAPs held through DTC (or any other clearing system), the position is not free from doubt and the HM Revenue and Customs is known to consider that the situs of securities held in this manner is not necessarily determined by the place in which the securities are physically held. If X-CAPs in bearer form are or become situated in the UK, or if X-CAPs are held in registered form, there may be a charge to UK inheritance tax as a result of a lifetime transfer at less than fair market value by, or on the death of, such US Holder. However, exemption from, or a reduction of, any such UK tax liability may be available under the Estate Tax Treaty in the same manner as for non-cumulative dollar preference shares. US Holders should consult their professional advisers in relation to such potential liability.
Stamp duty and SDRT
No UK stamp duty is payable on the transfer by delivery or redemption of bearer X-CAPs, whether in definitive form or in the form of one or more global X-CAPs. No SDRT is payable on any agreement to transfer bearer X-CAPs, provided that the agreement is not made in contemplation of, or as part of an arrangement for, a takeover of the company.
No UK stamp duty will be payable in respect of any instrument of transfer of depositary interests representing X-CAPs, provided that any instrument relating to such transfer is not executed in the UK, and remains at all times outside the UK. Depositary interests representing X-CAPs will not be “chargeable securities” for SDRT purposes, and consequently a transfer of such depositary interests will not be subject to SDRT. Although the position is not clear, the transfer on the sale of X-CAPs in registered form may attract ad valorem UK stamp duty or (if an unconditional agreement to transfer X-CAPs is not completed by a duly stamped transfer) UK SDRT, generally at the rate of 0.5% of the consideration paid, which, in the case of stamp duty, will be rounded up to £5 or multiples thereof. The transfer of X-CAPs in registered form to, or to a nominee or agent for, a person whose business (i) is or includes issuing depositary receipts or (ii) is or includes the provision of clearance services, may give rise to a liability to UK stamp duty or (to the extent that UK stamp duty is not paid on an instrument of transfer) UK SDRT, generally at the rate of 1.5% of the price of the X-CAPs transferred, which, in the case of stamp duty, will be rounded up to £5 or multiples thereof. Such transfer of X-CAPs in bearer form may give rise to a charge to UK SDRT generally at the rate of 1.5% of the price of the X-CAPs transferred. A charge to UK SDRT may also arise on the issue of X-CAPs whether in registered or bearer form to, or to a nominee or agent for, a person whose business is or includes issuing depositary receipts or includes the provision of clearance services, generally at the rate of 1.5% of the price of the X-CAPs issued.
218
PROs
United States
Payments of interest on a PRO (including any UK withholding tax, as to which see below) will constitute foreign source dividend income for US federal income tax purposes to the extent paid out of the current or accumulated earnings and profits of the company, as determined for US federal income tax purposes. Payments will not be eligible for the dividends-received deduction allowed to corporate US Holders. A US Holder who is entitled under the Treaty to a refund of UK tax, if any, withheld on a payment will not be entitled to claim a foreign tax credit with respect to such tax.
Subject to applicable limitations that may vary depending upon a holder’s individual circumstances, dividends paid to certain non-corporate US Holders in taxable years beginning before 1 January 2009 will be taxable at a maximum tax rate of 15%. Non-corporate US Holders should consult their own tax advisers to determine whether they are subject to any special rules that limit their ability to be taxed at this favourable rate.
A US Holder will, upon the sale, exchange or redemption of a PRO, generally recognise capital gain or loss for US federal income tax purposes (assuming that in the case of a redemption, such US Holder does not own, and is not deemed to own, any ordinary shares of the company) in an amount equal to the difference between the amount realised (excluding any amount in respect of mandatory interest and any Missed Payments which are to be satisfied on a Missed Payment Satisfaction Date, which would be treated as ordinary income) and the US Holder’s tax basis in the PRO.
A US Holder who is liable for both UK and US tax on gain recognised on the disposal of PROs will generally be entitled, subject to certain limitations, to credit the UK tax against its US federal income tax liability in respect of such gain.
United Kingdom
Taxation of payments on the PROs
Payments on the PROs will constitute interest rather than dividends for UK withholding tax purposes. However, the PROs will constitute “quoted eurobonds” within the meaning of section 349 of the Income and Corporation Taxes Act 1988 and therefore payments of interest will not be subject to withholding or deduction for or on account of UK taxation as long as the PROs remain at all times listed on a ‘recognised stock exchange’ within the meaning of section 841 of the Income and Corporation Taxes Act 1988. In all other cases, an amount must be withheld on account of UK income tax at the lower rate (currently 20%) subject to any direction to the contrary by HM Revenue & Customs under the Treaty and except that the withholding obligation is disapplied in respect of payments to persons who the company reasonably believes are within the charge to corporation tax or fall within various categories enjoying a special tax status (including charities and pension funds), or are partnerships consisting of such persons (unless HM Revenue & Customs directs otherwise). Where interest has been paid under deduction of UK withholding tax, US Holders may be able to recover the tax deducted under the Treaty.
Any paying agent or other person by or through whom interest is paid to, or by whom interest is received on behalf of, an individual, may be required to provide information in relation to the payment and the individual concerned to HM Revenue & Customs. HM Revenue & Customs may communicate this information to the tax authorities of other jurisdictions.
HM Revenue & Customs confirmed at around the time of the issue of the PROs that interest payments would not be treated as distributions for UK tax purposes by reason of (i) the fact that interest may be deferred under the terms of issue or (ii) the undated nature of the PROs, provided that at the time an interest payment is made, the PROs are not held by a company which is ‘associated’ with the company or by a ‘funded company’. A company will be associated with the company if, broadly speaking, it is part of the same group as the company. A company will be a ‘funded company’ for these purposes if there are arrangements involving that company being put in funds (directly or indirectly) by the company, or an entity associated with the company. In this respect, HM Revenue & Customs has confirmed that a company holding an interest in the PROs which incidentally has banking facilities with any company associated with the company will not be a ‘funded company’ by virtue of such facilities.
Interest on the PROs constitutes UK source income for UK tax purposes and, as such, may be subject to income tax by direct assessment even where paid without withholding. However, interest with a UK source received without deduction or withholding on account of UK tax will not be chargeable to UK tax in the hands of a US Holder unless, in the case of a corporate US Holder, such US Holder carries on a trade in the UK through a UK permanent establishment or in the case of other US Holders, such persons carry on a trade, profession or vocation in the UK through a UK branch or agency in connection with which the interest is received or to which the PROs are attributable. There are exemptions for interest received by certain categories of agents (such as some brokers and investment managers).
EU Directive on taxation of savings income
The European Union has adopted a directive regarding the taxation of savings income. The Directive requires Member States of the European Union to provide to the tax authorities of other Member States details of payments of interest and other similar income paid by a person to an individual resident in another Member State, except that Belgium, Luxembourg and Austria are instead imposing a withholding system for a transitional period unless during such period they elect otherwise.
Disposal (including redemption)
A disposal (including redemption) of PROs by a non-corporate US Holder will not give rise to any liability to UK taxation on capital gains unless the US Holder carries on a trade (which for this purpose includes a profession or a vocation) in the UK through a branch or agency and the PROs are, or have been, held or acquired for the purposes of that trade, branch or agency.
219
Shareholder informationcontinued
Taxation for US Holders(continued)
A transfer of PROs by a US Holder will not give rise to a charge to UK tax on accrued but unpaid interest payments, unless the US Holder is an individual or other non-corporate taxpayer and at any time in the relevant year of assessment or accounting period carries on a trade in the UK through a branch or agency to which the PROs are attributable.
Annual tax charges
Corporate US Holders of PROs may be subject to annual UK tax charges (or relief) by reference to fluctuations in exchange rates and in respect of profits, gains and losses arising from the PROs, but only if such corporate US Holders carry on a trade, profession or vocation in the UK through a UK permanent establishment to which the PROs are attributable.
Inheritance tax
In relation to PROs held through DTC (or any other clearing system), the UK inheritance tax position is not free from doubt in respect of a lifetime transfer, or death of, a US Holder who is not domiciled nor deemed to be domiciled in the UK for inheritance tax purposes; HM Revenue & Customs is known to consider that the situs of securities held in this manner is not necessarily determined by the place where the securities are registered. In appropriate circumstances, there may be a charge to UK inheritance tax as a result of a lifetime transfer at less than fair market value by, or on the death of, such US Holder. However, exemption from, or a reduction of, any such UK tax liability may be available under the Estate Tax Treaty. US Holders should consult their professional advisers in relation to such potential liability.
Stamp duty and SDRT
No stamp duty, SDRT or similar tax is imposed in the UK on the issue, transfer or redemption of the PROs.
Share repurchases
As discussed on page 62, the company has authority from its shareholders to make market purchases of ordinary shares. On 28 February 2006, the company announced its intention to repurchase up to £1 billion ordinary shares over the following 12 months. As at 21 April 2006, the company had repurchased 3.9 million ordinary shares at an average price of £18.69 pursuant to this publicly announced repurchase plan.
Exchange controls
The company has been advised that there are currently no UK laws, decrees or regulations which would prevent the remittance of dividends or other payments to non-UK resident holders of the company’s non-cumulative dollar preference shares.
There are no restrictions under the articles of association of the company or under UK law, as currently in effect, which limit the right of non-UK resident owners to hold or, when entitled to vote, freely to vote the company’s non-cumulative dollar preference shares.
Memorandum and articles of association
The company’s Memorandum of Association (the “Memorandum”) and Articles of Association (the “Articles”) as in effect at the date of this annual report are registered with the Registrar of Companies of Scotland. The Articles were last amended on 29 April 2004 and have been filed with the SEC. For a description of certain provisions of the company’s Memorandum and Articles, please refer to the ‘Additional Information — Memorandum and Articles of Association’ in the Group’s Annual Report on Form 20-F for the fiscal year ended 31 December 2004.
Incorporation and registration
The company was incorporated and registered in Scotland under the Companies Act 1948 as a limited company on 25 March 1968 under the name National and Commercial Banking Group Limited. On 10 March 1982, it changed its name to its present name and was registered under the Companies Acts 1948 to 1980 as a public company with limited liability. The company is registered under Company No. SC 45551.
Code of Ethics
As discussed on page 65, the Group has adopted a code of ethics that is applicable to all of the Group’s employees, which will be provided to any person, upon request, by contacting Group Secretariat at the telephone number listed on the following page.
Documents on display
Documents concerning the company may be inspected at 36 St Andrew Square, Edinburgh, EH2 2YB.
Executive directors’ service contracts and copies of directors’ indemnities granted by the company in terms of section 309C of the Companies Act 1985 may be inspected at the company’s office at Gogarburn, Edinburgh, EH12 1HQ (telephone 0131 626 4117).
In addition, we file reports and other information with the SEC. You can read and copy these reports and other information at the SEC’s Public Reference Room at 100 F Street, N.E., Room 1580, Washington, D.C. 20549. You can call the SEC at 1-800-SEC-0330 for further information on the Public Reference Room or contact the offices of The New York Stock Exchange, on which certain of our securities are listed, at 20 Broad Street, New York, New York 10005. The SEC also maintains a website at www.sec.gov which contains in electronic form each of the reports and other information that we have filed electronically with the SEC.
220
| Important addresses | | Principal offices |
| | |
| Shareholder enquiries | | The company |
| Registrar | | PO Box 1000 Gogarburn Edinburgh EH12 1HQ |
| Computershare Investor Services PLC | | Telephone: 0131 626 0000 |
| PO Box 82 | | |
| The Pavilions | | The Royal Bank of Scotland plc |
| Bridgwater Road | | PO Box 1000 Gogarburn Edinburgh EH12 1HQ |
| Bristol BS99 7NH | | 280 Bishopsgate London EC2M 4RB |
| Telephone: 0870 702 0135 | | |
| Facsimile: 0870 703 6009 | | National Westminster Bank Plc |
| Email: web.queries@computershare.co.uk | | 135 Bishopsgate London EC2M 3UR |
| | |
| Group Secretariat | | Citizens |
| The Royal Bank of Scotland Group plc | | Citizens Financial Group, Inc. |
| PO Box 1000 | | One Citizens Plaza Providence Rhode Island 02903 USA |
| Business House F | | |
| Gogarburn | | Ulster Bank |
| Edinburgh EH12 1HQ | | 11-16 Donegall Square East Belfast BT1 5UB |
| Telephone: 0131 556 8555 | | George’s Quay Dublin 2 |
| Facsimile: 0131 626 3081 | | |
| | | RBS Insurance |
| Investor Relations | | Direct Line House 3 Edridge Road Croydon Surrey CR9 1AG |
| 280 Bishopsgate | | Churchill Court Westmoreland Road Bromley BR1 1DP |
| London EC2M 4RB | | |
| Telephone: 0207 672 1578 | | RBS Greenwich Capital |
| Email: investor.relations@rbsir.com | | 600 Steamboat Road |
| | | Greenwich Connecticut 06830 USA |
| Registered office | | |
| 36 St Andrew Square | | Coutts Group |
| Edinburgh EH2 2YB | | 440 Strand London WC2R 0QS |
| Telephone: 0131 556 8555 | | |
| | | The Royal Bank of Scotland International Limited |
| Registered in Scotland No. 45551 | | Royal Bank House 71 Bath Street |
| | | St Helier Jersey Channel Islands JE4 8PJ |
| Website | | |
| www.rbs.com | | NatWest Offshore |
| | | 23/25 Broad Street |
| | | St Helier Jersey Channel lslands JE4 8QG |
221
Exhibit index
| | | |
Exhibit
Number | | Description |
| 1.1* | | Memorandum and Articles of Association of The Royal Bank of Scotland Group plc |
| 4.1*** | | Contract of employment for Sir Frederick A. Goodwin |
| 4.2*** | | Consulting Agreement for Bud Koch |
| 4.3*** | | Supplementary Agreement for Bud Koch |
| 4.4 | | Service contract for Gordon Pell |
| 4.5** | | Service contract for Lawrence Fish |
| 4.6 | | Service contract for Guy Whittaker |
| 4.7 | | Service contract for Mark Fisher |
| 4.8 | | Service contract for Johnny Cameron |
| 7.1 | | Explanation of ratio calculations |
| 8.1 | | Principal subsidiaries of The Royal Bank of Scotland Group plc |
| 12.1 | | CEO certification required by Rule 13a-14(a) |
| 12.2 | | CFO certification required by Rule 13a-14(a) |
| 13.1 | | Certification required by Rule 13a-14(b) |
| 15.1 | | Independent auditors’ consent |
* Previously filed and incorporated by reference to Exhibit 4.3 to Post-effective Amendment No. 2 to the Registration Statement on Form F-3 (Registration No. 333-100661).** Previously filed and incorporated by reference to Exhibit 4.6 to the Group’s Annual Report on Form 20-F for the fiscal year ended 31 December 2003 (File No. 1-10306).
*** Previously filed and incorporated by reference to Exhibits 4.1, 4.3 and 4.3.1, respectively, to the Group’s Annual Report on Form 20-F for the fiscal year ended 31 December 2004 (File No. 1-10306).
SIGNATURE
The registrant hereby certifies that it meets all of the requirements for filing on Form 20-F and that it has duly caused and authorized the undersigned to sign this annual report on its behalf.
The Royal Bank of Scotland Group plc
Registrant
| | |
| /s/ Guy Robert Whittaker | |
| |
| Guy Robert Whittaker | |
| Group Finance Director | |
26 April 2006
223