As filed with the Securities and Exchange Commission on May 14, 2008
UNITED STATES
SECURITIES AND EXCHANGE COMMISSION
Washington, D.C. 20549
FORM 20-F
| (Mark One) | | |
| o | | REGISTRATION STATEMENT PURSUANT TO SECTION 12(b) OR (g) OF THE SECURITIES EXCHANGE ACT OF 1934 |
| | | OR |
| x | | ANNUAL REPORT PURSUANT TO SECTION 13 OR 15(d) OF THE SECURITIES EXCHANGE ACT OF 1934 |
| | | For the fiscal year ended December 31, 2007 |
| | | OR |
| o | | TRANSITION REPORT PURSUANT TO SECTION 13 OR 15(d) OF THE SECURITIES EXCHANGE ACT OF 1934 |
| | | OR |
| o | | SHELL COMPANY REPORT PURSUANT TO SECTION 13 OR 15(d) OF THE SECURITIES EXCHANGE ACT OF 1934 |
Date of event requiring this shell company report ___________
For the transition period from ___________ to ___________
Commission file number 001-10306
THE ROYAL BANK OF SCOTLAND GROUP plc
(Exact name of Registrant as specified in its charter)
United Kingdom
(Jurisdiction of incorporation or organization)
RBS Gogarburn, PO Box 1000, Edinburgh EH12 1HQ
(Address of principal executive offices)
Miller McLean, Group General Counsel and Group Secretary, Tel: +44 (0) 131 523 2333, Fax: +44 (0) 131 626 3081,
PO Box 1000, Gogarburn, Edinburgh EH12 1HQ
(Name, Telephone, E-mail and/or Facsimile number and Address of Company Contact Person)
Securities registered or to be registered pursuant to Section 12(b) of the Act:
| Title of each class | | Name of each exchange on which registered |
| American Depositary Shares, each representing one ordinary share, nominal value £0.25 per share | | New York Stock Exchange |
| Ordinary shares, nominal value £0.25 per share | | New York Stock Exchange** |
| American Depositary Shares Series E*, F, G*, H, K*, L, M, N, P, Q, R, S, T and U each representing one Non-Cumulative Dollar Preference Share, Series E, F, G, H, K, L, M, N, P, Q, R, S, T and U respectively | | New York Stock Exchange |
| Dollar Perpetual Regulatory tier one securities, Series 1 | | New York Stock Exchange |
* Redeemed on January 16, 2007
** Not for trading, but only in connection with the registration of American Depositary Shares representing such ordinary shares pursuant to the requirements of the Securities and Exchange Commission.
Securities registered or to be registered pursuant to Section 12(g) of the Act:
None
Securities for which there is a reporting obligation pursuant to Section 15(d) of the Act:
None
Indicate the number of outstanding shares of each of the issuer’s classes of capital or common stock as of December 31, 2007, the close of the period covered by the annual report:
| Ordinary shares of 25 pence each | 10,006,215,087 | | Non-cumulative dollar preference shares, Series F, H and L to U | | 308,015,000 |
| Non-voting Deferred Shares | 2,660,556,304 | | Non-cumulative convertible dollar preference shares, Series 1 | | 1,000,000 |
| 11% cumulative preference shares | 500,000 | | Non-cumulative euro preference shares, Series 1 to 3 | | 2,526,000 |
| 5½% cumulative preference shares | 400,000 | | Non-cumulative convertible sterling preference shares, Series 1 | | 200,000 |
| | | | Non-cumulative sterling preference shares, Series 1 | | 750,000 |
Indicate by check mark if the registrant is a well-known seasoned issuer, as defined in Rule 405 of the Securities Act
Yes x No o
If this report is an annual or transition report, indicate by check mark if the registrant is not required to file reports pursuant to Section 13 or 15(d) of the Securities Exchange Act of 1934.
Yes o No x
Note — checking the box above will not relieve any registrant required to file reports pursuant to Section 13 or 15(d) of the Securities Exchange Act of 1934 from their obligations under those Sections.
Indicate by check mark whether the registrant (1) has filed all reports required to be filed by Section 13 or 15(d) of the Securities Exchange Act of 1934 during the preceding 12 months (or for such shorter period that the registrant was required to file such reports), and (2) has been subject to such filing requirements for the past 90 days.
Yes x No o
Indicate by check mark whether the registrant is a large accelerated filer, an accelerated filer, or a non-accelerated filer. See definition of “accelerated filer and large accelerated filer” in Rule 12b-2 of the Exchange Act. (Check one):
Large accelerated filer x | Accelerated filer o | Non-accelerated filer o |
Indicate by check mark which basis of accounting the registrant has used to prepare the financial statements included in this filing:
U.S. GAAP o International Financial Reporting Standards as issued by the International Accounting Standards Board x Other o
If “Other” has been checked in response to the previous question, indicate by check mark which financial statement item the registrant has elected to follow.
Item 17 o Item 18 o
If this is an annual report, indicate by check mark whether the registrant is a shell company (as defined in Rule 12b-2 of the Exchange Act).
Yes o No x
(APPLICABLE ONLY TO ISSUERS INVOLVED IN BANKRUPTCY PROCEEDINGS DURING THE PAST FIVE YEARS)
Indicate by check mark whether the registrant has filed all documents and reports required to be filed by Sections 12, 13 or 15(d) of the Securities Exchange Act of 1934 subsequent to the distribution of securities under a plan confirmed by a court.
Yes o No o
SEC Form 20-F cross reference guide
| Item | Item Caption | Pages |
| | | | |
| PART I | | | |
| 1 | Identity of Directors, Senior Management and Advisers | Not applicable |
| 2 | Offer Statistics and Expected Timetable | Not applicable |
| 3 | Key Information | |
| | | Selected financial data | 16, 159-161, 196-197, 205-206, 212, 226-227 |
| | | Capitalisation and indebtedness | Not applicable |
| | | Reasons for the offer and use of proceeds | Not applicable |
| | | Risk factors | 13-15 |
| 4 | Information on the Company | 20-22, 50, 54-60, 136-137, 140-141, 197-204, 206-211 |
| | | History and development of the Company | 4-6, 75, 146-147, 217, 236-237 |
| | | Business overview | 4-6, 75, 188-193, 213-215 |
| | | Organisational structure | |
| | | Property, plant and equipment | |
| 4A | Unresolved Staff Comments | |
| 5 | Operating and Financial Review and Prospects | |
| | | Operating results | 7-12, 16-50, 68, 138-139, 176, 213-215 |
| | | Liquidity and capital resources | 49-50, 61-64, 77, 127-135, 138-139, 146-147, 164-165, 167-181, 184-187, 204 |
| | | Research and development, patents, licences etc | Not applicable |
| | | Trend information | |
| | | Off balance sheet arrangements | |
| | | Contractual obligations | |
| 6 | Directors, Senior Management and Employees | |
| | | Directors and senior management | |
| | | Compensation | |
| | | Board practices | |
| | | Employees | |
| | | Share ownership | |
| 7 | Major Shareholders and Related Party Transactions | |
| | | Major shareholders | |
| | | Related party transactions | |
| | | Interests of experts and counsel | Not applicable |
| 8 | Financial Information | |
| | | Consolidated statements and other financial information | |
| | | Significant changes | |
| Item | Item Caption | Pages |
| | | | |
| 9 | The Offer and Listing | |
| | | Offer and listing details | |
| | | Plan of distribution | Not applicable |
| | | Markets | |
| | | Selling shareholders | Not applicable |
| | | Dilution | Not applicable |
| | | Expenses of the issue | Not applicable |
| 10 | Additional Information | |
| | | Share capital | Not applicable |
| | | Memorandum and articles of association | |
| | | Material contracts | |
| | | Exchange controls | |
| | | Taxation | |
| | | Dividends and paying agents | Not applicable |
| | | Statement of experts | Not applicable |
| | | Documents on display | |
| | | Subsidiary information | Not applicable |
| 11 | Quantitative and Qualitative Disclosure about Market Risk | 51-71, 127-135, 138-139, 167-180 |
| 12 | Description of Securities other than Equity Securities | Not applicable |
| PART II | | |
| 13 | Defaults, Dividend Arrearages and Delinquencies | Not applicable |
| 14 | Material Modifications to the Rights of Security Holders and Use of Proceeds | Not applicable |
| 15 | Controls and Procedures | |
| 16 | [Reserved] | |
| 16 | A | Audit Committee financial expert | |
| | B | Code of ethics | |
| | C | Principal Accountant Fees and services | |
| | D | Exemptions from the Listing Standards for Audit Committees | Not applicable |
| | E | Purchases of Equity Securities by the Issuer and Affiliated Purchasers | |
| PART III | | |
| 17 | Financial Statements | Not applicable |
| 18 | Financial Statements | |
| 19 | Exhibits | |
| | Signature | |
Business review
| 2 | Presentation of information |
| | |
| 3 | Forward-looking statements |
| | |
| 4 | Description of business |
| | |
| 13 | Risk factors |
| | |
| 16 | Financial highlights |
| | |
| 17 | Summary consolidated income statement |
| | |
| 20 | Analysis of results |
| | |
| 29 | Divisional performance |
| | |
| 47 | Consolidated balance sheet |
| | |
| 49 | Cash flow |
| | |
| 50 | Capital resources |
| | |
| 51 | Risk and capital management |
Presentation of information
In this document, and unless specified otherwise, the term ‘company’ means The Royal Bank of Scotland Group plc, ‘RBS’ or the ‘Group’ means the company and its subsidiary undertakings, ‘the Royal Bank’ means The Royal Bank of Scotland plc and ‘NatWest’ means National Westminster Bank Plc.
The company publishes its financial statements in pounds sterling (“£” or “sterling”). The abbreviations ‘£m’ and ‘£bn’ represent millions and thousands of millions of pounds sterling, respectively, and references to ‘pence’ represent pence in the United Kingdom (“UK”). Reference to ‘dollars’ or ‘$’ are to United States of America (“US”) dollars. The abbreviations ‘$m’ and ‘$bn’ represent millions and thousands of millions of dollars, respectively, and references to ‘cents’ represent cents in the US. The abbreviation ‘€’ represents the ‘euro’, the European single currency and the abbreviations ‘€m’ and ‘€bn’ represent millions and thousands of millions of euros, respectively.
Certain information in this report is presented separately for domestic and foreign activities. Domestic activities primarily consist of the UK domestic transactions of the Group. Foreign activities comprise the Group’s transactions conducted through those offices in the UK specifically organised to service international banking transactions and transactions conducted through offices outside the UK.
The geographic analysis in the average balance sheet and interest rates, changes in net interest income and average interest rates, yields, spreads and margins in this report have been compiled on the basis of location of office – UK and overseas. Management believes that this presentation provides more useful information on the Group’s yields, spreads and margins of the Group’s activities than would be provided by presentation on the basis of the domestic and foreign activities analysis used elsewhere in this report as it more closely reflects the basis on which the Group is managed. ‘UK’ in this context includes domestic transactions and transactions conducted through the offices in the UK which service international banking transactions.
The results, assets and liabilities of individual business units are classified as trading or non-trading based on their predominant activity. Although this method may result in some non-trading activity being classified as trading, and vice versa, the Group believes that any resulting misclassification is not material.
International Financial Reporting Standards
As required by the Companies Act 1985 and Article 4 of the European Union IAS Regulation, the consolidated financial statements of the Group are prepared in accordance with International Financial Reporting Standards issued by the International Accounting Standards Board (“IASB”) and interpretations issued by the International Financial Reporting Interpretations Committee of the IASB (together “IFRS’) as adopted by the European Union. It also complies with IFRS as issued by the IASB. On implementation of IFRS on 1 January 2005, the Group took advantage of the option in IFRS 1 ‘First-time Adoption of International Financial Reporting Standards’ to implement IAS 39 ‘Financial Instruments: Recognition and Measurement’, IAS 32 ‘Financial Instruments: Disclosure and Presentation’ and IFRS 4 ‘Insurance Contracts’ from 1 January 2005 without restating its 2004 income statement and balance sheet. The date of transition to IFRS for the Group and the company and the date of their opening IFRS balance sheets was 1 January 2004.
The Group’s published 2004 financial statements were prepared in accordance with then current UK generally accepted accounting principles (“UK GAAP” or “previous GAAP”) comprising standards issued by the UK Accounting Standards Board, pronouncements of the Urgent Issues Task Force, relevant Statements of Recommended Accounting Practice and provisions of the Companies Act 1985.
Acquisition of ABN AMRO
On 17 October 2007, RFS Holdings B.V. (“RFS Holdings”), a company jointly owned by RBS, Fortis N.V., Fortis SA/NV and Banco Santander S.A. (the “Consortium Banks”) and controlled by RBS, completed the acquisition of ABN AMRO Holding N.V. (“ABN AMRO”).
In due course, RFS Holdings will implement an orderly separation of the business units of ABN AMRO with RBS retaining the following ABN AMRO business units:
| · | Continuing businesses of Business Unit North America; |
| · | Business Unit Global Clients and wholesale clients in the Netherlands (including former Dutch wholesale clients) and Latin America (excluding Brazil); |
| · | Business Unit Asia (excluding Saudi Hollandi); and |
| · | Business Unit Europe (excluding Antonveneta). |
Certain other assets will continue to be shared by the Consortium Banks.
RFS Holdings is jointly owned by the Consortium Banks. It is controlled by the company and is therefore fully consolidated in its financial statements. Consequently, the statutory results of the Group for the year ended 31 December 2007 include the results of ABN AMRO for the period from 17 October 2007 to 31 December 2007. The interests of Fortis and Santander in RFS Holdings are included in minority interests.
Forward-looking statements
Certain sections in this document contain ‘forward-looking statements’ as that term is defined in the United States Private Securities Litigation Reform Act of 1995, such as statements that include the words ‘expect’, ‘estimate’, ‘project’, ‘anticipate’, ‘believes’, ‘should’, ‘could’, ‘intend’, ‘plan’, ‘probability’, ‘risk’, ‘Value-at-Risk (“VaR”)’, ‘target’, ‘goal’, ‘objective’, ‘may’, ‘will’, ‘endeavour’, ‘outlook’, ‘optimistic’, ‘prospects’ and similar expressions.
In particular, this document includes forward-looking statements relating, but not limited, to possible future write-downs and RBS's capital planning projections, the Group’s potential exposures to various types of market risks, such as interest rate risk, foreign exchange rate risk and commodity and equity price risk. Such statements are subject to risks and uncertainties. For example, certain of the market risk disclosures are dependent on choices about key model characteristics and assumptions and are subject to various limitations. By their nature, certain of the market risk disclosures are only estimates and, as a result, actual future gains and losses could differ materially from those that have been estimated.
Other factors that could cause actual results to differ materially from those estimated by the forward-looking statements contained in this document include, but are not limited to: the extent and nature of future developments in the credit markets, including the sub-prime market, and their impact on the financial industry in general and the Group in particular; the effect on the Group’s capital of write downs in respect of credit market exposures; successful consummation of the proposed rights issue; the Group’s ability to achieve revenue benefits and cost savings from the integration of certain of ABN AMRO’s businesses and assets; general economic conditions in the UK and in other countries in which the Group has significant business activities or investments, including the United States; the monetary and interest rate policies of the Bank of England, the Board of Governors of the Federal Reserve System and other G-7 central banks; inflation; deflation; unanticipated turbulence in interest rates, foreign currency exchange rates, commodity prices and equity prices; changes in UK and foreign laws, regulations and taxes; changes in competition and pricing environments; natural and other disasters; the inability to hedge certain risks economically; the adequacy of loss reserves; acquisitions or restructurings; technological changes; changes in consumer spending and saving habits; and the success of the Group in managing the risks involved in the foregoing.
The information set out in “Business review – Recent developments” relating to the estimated capital effect of RBS’s estimated capital market exposures constitutes “forward looking information” and is subject to risks and uncertainties, as set out under “Risk Factors”. In particular, there are a number of assumptions and judgements that underpin such estimates, including assumptions and judgements about the underlying performance of RBS’s operations, the state of the current and future credit markets (including credit markets in the United Kingdom, the United States and Europe), asset valuations, default rates, access to liquidity, the timing of disposals relating to the ABN AMRO restructuring and general economic conditions. Such information was prepared for capital planning purposes and not to predict future results and although RBS’s management believes that it has taken reasonable care in producing such estimations and projections, there can be no assurance that the estimated capital effect of the projected capital market exposures will be equivalent to any actual write downs or credit market exposures appearing in RBS’s reports and accounts to be prepared in the future. Any additional write downs may have a material adverse impact on RBS’s reported financial condition and results of operations.
The forward-looking statements contained in this document speak only as of the date of this report, and the Group does not undertake to update any forward-looking statement to reflect events or circumstances after the date hereof or to reflect the occurrence of unanticipated events.
For a further discussion of certain risks faced by the Group, see Risk factors on pages 13 to 15.
Business review
Description of business
Introduction
The Royal Bank of Scotland Group plc is the holding company of one of the world’s largest banking and financial services groups, with a market capitalisation of £44.4 billion at the end of 2007. Headquartered in Edinburgh, the Group operates in the UK, US and internationally through its two principal subsidiaries, the Royal Bank and NatWest. Both the Royal Bank and NatWest are major UK clearing banks whose origins go back over 275 years. In the US, the Group’s subsidiary Citizens is ranked the ninth largest commercial banking organisation by deposits. The Group has a large and diversified customer base and provides a wide range of products and services to personal, commercial and large corporate and institutional customers.
The Group had total assets of £1,900.5 billion and owners’ equity of £53.0 billion at 31 December 2007. It is strongly capitalised with a total capital ratio of 11.2% and tier 1 capital ratio of 7.3% as at 31 December 2007.
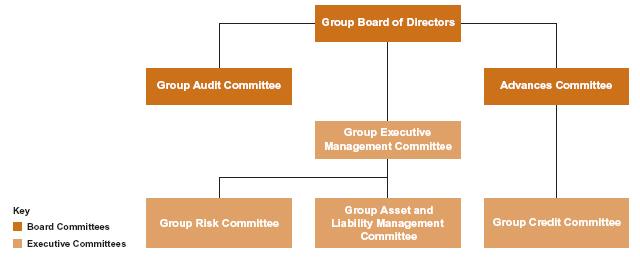
Organisational structure and business overview for 2007
For the year ended 31 December 2007, the Group’s activities were organised in the following business divisions: Corporate Markets (comprising Global Banking & Markets and UK Corporate Banking), Retail Markets (comprising Retail and Wealth Management), Ulster Bank, Citizens, RBS Insurance and Manufacturing. A description of each of the divisions is given below.
Corporate Markets is focused on the provision of debt and risk management services to medium and large businesses and financial institutions in the UK and around the world.
Global Banking & Markets (‘GBM’) is a leading banking partner to major corporations and financial institutions around the world, providing an extensive range of debt financing, risk management and investment services to its customers. GBM has a wide range of clients across its chosen markets. It has relationships with an overwhelming majority of the largest UK, European and US corporations and institutions. GBM’s principal activity in the US is conducted through RBS Greenwich Capital.
UK Corporate Banking is the largest provider of banking, finance and risk management services to UK corporate customers. Through its network of relationship managers across the country it distributes the full range of Corporate Markets’ products and services to companies.
Retail Markets leads the co-ordination and delivery of our multi-brand retail strategy across our product range and comprises Retail (including our direct channels businesses) and Wealth Management.
Retail comprises both the Royal Bank and NatWest retail brands, and a number of direct providers offering a full range of banking products and related financial services to the personal, premium and small business markets across several distribution channels.
In core retail banking, Retail offers a comprehensive product range across the personal and small business market: money transmission, savings, loans, mortgages and insurance. Customer choice and product flexibility are central to the retail banking proposition and customers are able to access services through a full range of channels, including the largest network of branches and ATMs in the UK, the internet and the telephone.
Retail also includes the Group’s non-branch based retail businesses that issue a comprehensive range of credit and charge cards to personal and corporate customers and provides card processing services for retail businesses. Retail is the leading merchant acquirer in Europe and ranks third globally.
It also includes Tesco Personal Finance, The One account, MINT, First Active UK, Direct Line Financial Services and Lombard Direct, all of which offer products to customers through direct channels principally in the UK. In continental Europe, Retail offers a similar range of products through the RBS and Comfort Card brands.
Wealth Management provides private banking and investment services to its clients through a number of leading UK and overseas private banking subsidiaries and offshore banking businesses. Coutts is one of the world's leading international wealth managers with offices in Switzerland, Dubai, Monaco, Hong Kong and Singapore, as well as its premier position in the UK. Adam & Company is the major private bank in Scotland. The offshore banking businesses – The Royal Bank of Scotland International and NatWest Offshore – deliver retail banking services to local and expatriate customers, principally in the Channel Islands, the Isle of Man and Gibraltar.
Ulster Bank Group including First Active, provides a comprehensive range of retail and wholesale financial services in the Republic of Ireland and Northern Ireland, supported by an extensive network of branch and business centres. Retail Markets operates in the personal and affluent banking sectors. Corporate Markets provides a wide range of services in the commercial, corporate and wealth markets. RBS’s European Consumer Finance (‘ECF’) activities, previously part of RBS Retail Markets, are now managed within Ulster Bank. ECF provides consumer finance products, particularly card-based revolving credits and fixed-term loans, in Germany and the Benelux countries.
Citizens is the second largest commercial banking organisation in New England and the ninth largest commercial banking organisation in the US measured by deposits. Citizens provides retail and corporate banking services under the Citizens brand in Connecticut, Delaware, Massachusetts, New Hampshire, New Jersey, New York state, Pennsylvania, Rhode Island and Vermont and the Charter One brand in Illinois, Indiana, Michigan and Ohio. Through its branch network Citizens provides a full range of retail and corporate banking services, including personal banking, residential mortgages and cash management.
In addition, Citizens engages in a wide variety of commercial lending, consumer lending, commercial and consumer deposit products, merchant credit card services, trust services and retail investment services. Citizens includes RBS Lynk, our merchant acquiring business, and Kroger Personal Finance, our credit card joint venture with the second largest US supermarket group.
RBS Insurance is the second largest general insurer in the UK, by gross written premiums. It sells and underwrites retail and SME insurance over the telephone and internet, as well as through brokers and partnerships. Direct Line, Churchill and Privilege sell general insurance products direct to the customer. Through its International Division, RBS Insurance sells general insurance, mainly motor, in Spain, Germany and Italy. The Intermediary and Broker Division sells general insurance products through independent brokers.
Manufacturing supports the customer-facing businesses and provides operational, technology and customer support in telephony, account management, lending and money transmission, global purchasing, property and other services.
Manufacturing drives optimum efficiencies and supports income growth across multiple brands and channels by using a single, scalable platform and common processes wherever possible. It also leverages the Group’s purchasing power and has become the centre of excellence for managing large-scale and complex change.
The expenditure incurred by Manufacturing relates to costs principally in respect of the Group’s banking and insurance operations in the UK and Ireland. These costs reflect activities that are shared between the various customer-facing divisions and consequently cannot be directly attributed to individual divisions. Instead, the Group monitors and controls each of its customer-facing divisions on revenue generation and direct costs whilst in Manufacturing such control is exercised through appropriate efficiency measures and targets. For financial reporting purposes the Manufacturing costs have been allocated to the relevant customer-facing divisions on a basis management considers to be reasonable.
ABN AMRO is a major international banking group with a leading position in international payments and a strong investment banking franchise with particular strengths in emerging markets, as well as offering a range of retail and commercial financial services around the world via regional business units in Europe, the Netherlands, North America, Latin America and Asia.
As discussed on page 2, ABN AMRO was acquired by the consortium banks in October 2007 through the Group's subsidiary, RFS Holdings. RFS Holdings excluding minority interests comprises those ABN AMRO business units that will be retained by RBS and are principally the global wholesale businesses and international retail businesses in Asia and the Middle East. In due course, these will be integrated with the Group's existing business and will further diversify the Group's global reach. RFS Holdings minority interests comprises those activities of ABN AMRO that are attributable to the other consortium banks, including retail banking in the Netherlands and Brazil.
The Centre comprises group and corporate functions, such as capital raising, finance, risk management, legal, communications and human resources. The Centre manages the Group’s capital requirements and Group-wide regulatory projects and provides services to the operating divisions.
Organisational structure and business overview as of 28 February 2008
On 28 February 2008, the company announced changes to its organisational structure which are aimed at recognising RBS’s presence in over 50 countries and facilitating the integration and operation of its expanded footprint. Following the acquisition of ABN AMRO in October 2007, the Group’s new organisational structure incorporates those ABN AMRO businesses to be retained by the Group but excludes the ABN AMRO businesses to be acquired by Fortis and Santander. This new organisational structure is expected to give RBS the appropriate framework for managing the enlarged Group in a way that fully capitalises on the enhanced range of attractive growth opportunities now available to it. The Group’s organisational structure as of 28 February 2008 comprises the following divisions:
Global Markets
Global Markets is focused on the provision of debt financing, risk management and transaction banking services to large businesses and financial institutions in the United Kingdom and around the world. Its activities have been organised into two divisions, GBM and Global Transaction Services, in order to best serve RBS’s customers whose financial needs are global.
GBM is a leading banking partner to major corporations and financial institutions around the world, providing an extensive range of debt financing, risk management and investment services to its customers. It includes the global banking and markets business of ABN AMRO, with the exception of its transaction banking division.
On 1 April 2008, RBS and Sempra Energy announced the formation of the commodities marketing joint venture, RBS Sempra Commodities LLP, which has become part of RBS’s GBM business. Under the joint venture, RBS Sempra Commodities LLP purchased Sempra Commodities. RBS’s initial equity investment in the joint venture was US$1.7bn and RBS will continue to provide any additional funding required for the ongoing operating expenses of the businesses.
Global Transaction Services combines the RBS and ABN AMRO franchises to create a new top 5 global transaction services business. The new division offers global payments, cash and liquidity management, as well as trade finance, merchant acquiring and commercial card products and services. Global Transaction Services includes the transaction banking units of RBS and ABN AMRO, the money transmission activities of the former UK Corporate Banking, the corporate money transmission function of Citizens, the UK commercial cards business and UK and international merchant acquiring.
Regional Markets
Regional Markets is organised around the provision of retail and commercial banking to customers in four regions: the United Kingdom, the United States, Europe and the Middle East and Asia. This includes the provision of wealth management services both in the United Kingdom and internationally.
UK Retail and Commercial Banking
This comprises the former Retail division, UK Wealth Management and the former UK Corporate Banking division. However, merchant acquiring, commercial cards and corporate money transmission activities are now part of Global Transaction Services.
RBS UK supplies financial services through both the RBS and NatWest brands, offering a full range of banking products and related financial services to the personal, premium and small business (“SMEs”) markets through the largest network of branches and ATMs in the United Kingdom, as well as by telephone and internet. Together, RBS and NatWest hold the joint number one position in personal current accounts and are the UK market leader in SME banking. The division also issues credit and charge cards and other financial products, including through other brands such as MINT, First Active UK and Tesco Personal Finance.
The UK wealth management arm provides private banking and investment services to clients through Coutts, Adam & Company, RBS International and NatWest Offshore.
UK Commercial Banking is the largest provider of banking, finance and risk management services in the United Kingdom. Through its network of relationship managers across the country, it distributes the full range of RBS Group products and services to companies.
US Retail and Commercial Banking
This comprises Citizens Financial Group, with the exception of its corporate money transmission activities and RBS Lynk, which are now part of Global Transaction Services. It also excludes manufacturing operations, which are now part of Group Manufacturing. Citizens Financial Group provides financial services through the Citizens and Charter One brands as well as through Kroger Personal Finance, its credit card joint venture with the second largest US supermarket group.
Citizens is engaged in retail and corporate banking activities through its branch network in 13 states in the United States and through non-branch offices in other states. Citizens was ranked the ninth largest commercial banking organisation in the United States based on deposits as at 31 December 2007.
Europe & Middle East Retail and Commercial Banking
This comprises Ulster Bank and the retail and commercial businesses of ABN AMRO in Europe and the Middle East.
Ulster Bank, including First Active, provides a comprehensive range of financial services across the island of Ireland. Its retail banking arm has a network of branches and operates in the personal, commercial and wealth management sectors, while its corporate markets operations provides services in the corporate and institutional markets.
The retail and commercial businesses in Europe and the Middle East offer services in Romania, Russia, Kazakhstan and the United Arab Emirates.
Asia Retail and Commercial Banking
Asia Retail and Commercial Banking is a significant force in a number of important economies in Asia with prominent market positions in India, Pakistan, China and Taiwan in addition to its presence in Hong Kong, Indonesia, Malaysia and Singapore. The international wealth management arm offers private banking and investment services to clients in selected markets through the RBS Coutts brand.
RBS Insurance
RBS Insurance sells and underwrites retail and SME insurance over the telephone and internet, as well as through brokers and partnerships. Its brands include Direct Line, Churchill, Privilege, Green Flag and NIG. Direct Line, Churchill and Privilege sell general insurance products direct to the customer. Through its international division, RBS Insurance sells general insurance, mainly motor, in Spain, Germany and Italy. The Intermediary and Broker division sells general insurance products through independent brokers.
Group Manufacturing
Group Manufacturing comprises the RBS and ABN AMRO manufacturing operations, including the ACES operation in India, as well as Citizens’ manufacturing and card operations. It supports the customer facing businesses and provides operational technology, customer support in telephony, account management, lending and money transmission, global purchasing, property and other services. Manufacturing drives efficiencies and supports income growth across multiple brands and channels by using a single, scalable platform and common processes wherever possible. It also leverages the Group’s purchasing power and has become the centre of excellence for managing large scale and complex change.
The Centre
The Centre comprises group and corporate functions, such as capital raising, finance, risk management, legal, communications and human resources. The Centre manages the Group’s capital requirements and Group-wide regulatory projects and provides services to the operating divisions.
Recent developments
On 22 April 2008, RBS announced a rights issue to raise proceeds of £12bn, net of expenses, to increase its capital base. RBS also announced revised targets for its capital ratios, estimated write downs for capital planning purposes, planned disposals and proposals relating to the 2008 interim dividend, and gave details of its current trading performance.
RBS’s capital plan had assumed that it would maintain its Tier 1 capital ratio in the range 7 per cent. to 8 per cent. and that it would rebuild its core Tier 1 capital ratio towards 5 per cent. by 2010. At the time of its 2007 results announcement RBS confirmed that it was operating within the parameters of this plan.
The balance of risks and opportunities inherent in this plan have been under continual review. However, in the light of developments during March including the severe and increasing deterioration in credit market conditions, the worsening economic outlook and the increased likelihood that credit markets could remain difficult for some time, the Board has concluded that it is now appropriate for RBS to accelerate its plans to increase its capital ratios and to move to a higher target range to reflect the generally weakened business environment.
Reflecting these factors, the Board has raised its target range for the Group’s Tier 1 capital ratio to 7.5 per cent. to 8.5 per cent. and has set a target for the core Tier 1 capital ratio of in excess of 6 per cent. at 31 December 2008 on a proportional consolidated basis1.
For capital planning purposes, the Board has used the values detailed below under “– Credit market exposures” as the basis for its estimates of write-downs in 2008 in respect of certain credit market exposures. These estimates are based on what the Board considers to be prudent assumptions reflecting the further sharp deterioration in market conditions and outlook in credit markets at this point.
As part of an ongoing exercise, in the context of its decision to increase capital levels, the Board has identified for possible whole or partial disposal RBS Insurance and other smaller assets which are not central to the very strong UK and international banking franchises that RBS has built. RBS is determined to achieve full and fair value in respect of any such disposals. At this stage RBS has assumed in its capital plan that a £4bn increase in core Tier 1 capital by the end of 2008 can be achieved in this way, although there is scope for fewer disposals to be made, whilst still exceeding the target core Tier 1 ratio of 6 per cent.
In addition, RBS envisages containing the capital demands of certain business lines, including GBM, through active management of its balance sheet.
Taking the above into account and having regard to the outlook for retained profits and the impact of active balance sheet management, the Board has determined that it is appropriate to raise £12bn through the rights issue, with the effect of achieving a Tier 1 capital ratio in excess of 8 per cent. and a core Tier 1 capital ratio in excess of 6 per cent. by year end on a proportional consolidated basis.
Rights issue
Pursuant to the rights issue, the Company is proposing to offer 6,123,010,462 new Ordinary Shares(representing approximately 61.1 per cent. of the existing issued share capital and 37.9 per cent. of the enlarged issued share capital immediately following completion of the rights issue) by way of rights to qualifying shareholders at 200 pence per share. The rights issue has been fully underwritten and is expected to raise approximately £12bn, net of expenses. The rights issue price represents a 34.9 per cent. discount to the theoretical ex rights price based on the closing middle market price on the London Stock Exchange of 372.5 pence per Ordinary Share on 21 April 2008 (being the last business day before the announcement of the terms of the rights issue).
The rights issue will be made on the basis of 11 new Ordinary Shares at 200 pence per share for every 18 existing Ordinary Shares held by qualifying shareholders at the close of business on the applicable record date.
The rights issue is conditional, among other things, upon:
| 1 | Previous guidance referred to 7 per cent. to 8 per cent. for Tier 1 capital ratio, with 25 per cent. to 30 per cent. preference share content, but with no target set for core Tier 1 capital ratio. |
| · | shareholder approval which was granted at the general meeting held on 14 May 2008 (the “general meeting”); |
| · | the underwriting agreement for the rights issue become unconditional in all respects save for the condition relating to admission of the new Ordinary Shares, nil paid, to the Official List of the UKLA and to trading on the London Stock Exchange; and |
| · | such admission becoming effective by not later than 8.00 a.m. on 19 May 2008 (or such later time and date as the parties to the underwriting agreement may agree). |
The new Ordinary Shares, when issued and fully paid, will rank pari passu in all respects with the existing issued Ordinary Shares including the right to receive dividends or distributions made, paid or declared after the date of this document, except in respect of the 2007 final dividend of 23.1 pence per Ordinary Share announced by RBS on 28 February 2008. The new Ordinary Shares, fully paid, are expected to be admitted to the Official List of the UKLA and to trading on the London Stock Exchange on or around 9 June 2008.
Credit market exposures
For capital planning purposes RBS has used the values detailed below as the basis for its estimates of write-downs in 2008 in respect of the credit market exposures set out in the table below. These estimates are based on what the Board considers to be prudent assumptions reflecting the further sharp deterioration in market conditions and outlook in credit markets at this point. The capital effect of these estimated write-downs is £4.3bn net of tax (£5.9bn before tax).
Fair value gains on own liabilities are estimated to be £0.6bn and are not included in the estimated capital effect.
The estimated write-downs before tax which have been used for RBS’s capital planning purposes, are as follows.
| | Net exposure at 31 December 2007(1) | | | | | | Current estimated net exposure(2) | | | | | | Estimated write-downs before tax(3) | |
| ABS CDOs | | | | | | | | | | | | | | | |
| High grade CDOs | | | 2,581 | | | | 84 | | | | 1,608 | | | | 52 | | | | (990 | ) |
| Mezzanine CDOs | | | 1,253 | | | | 70 | | | | 361 | | | | 20 | | | | (902 | ) |
Monoline exposures(4) | | | 2,547 | | | | n/a | | | | 3,174 | | | | n/a | | | | (1,752 | ) |
| US Residential Mortgages | | | | | | | | | | | | | | | | | | | | |
Subprime(5) | | | 1,292 | | | | 72 | | | | 600 | | | | 38 | | | | (405 | ) |
| Alt-A | | | 2,233 | | | | 83 | | | | 1,007 | | | | 50 | | | | (666 | ) |
| Other non-agency | | | 794 | | | | 94 | | | | 660 | | | | 82 | | | | (100 | ) |
| US commercial mortgages | | | 1,809 | | | | 97 | | | | 1,397 | | | | 83 | | | | (201 | ) |
| Leveraged Loans | | | | | | | | | | | | | | | | | | | | |
Funded and unfunded(6) | | | 14,506 | | | | 96 | | | | 12,354 | | | | 88 | | | | (1,250 | ) |
| CLOs | | | 1,386 | | | | 93 | | | | 1,214 | | | | 87 | | | | (106 | ) |
| CDS hedging | | | | | | | | | | | | | | | | | | | 470 | |
| Total net of CDS hedging | | | | | | | | | | | | | | | | | | | (5,902 | ) |
Notes:
| (1) | Net of hedges and write-downs. |
| (2) | Current exposure net of hedges and estimated write-downs. |
| (3) | Estimated write-downs before tax in 2008. |
| (4) | Monoline exposures relate to credit protection purchased on credit assets, including CDOs. As the value of the instruments underlying the hedges has fallen, the mark-to-market value of the hedges, and hence of the Group’s exposure, has increased. A credit valuation adjustment of £1,752m has been estimated reflecting the monolines’ weakening credit profile. Further information relating to exposures to monolines is set out below. |
| (5) | Includes investment grade, non-investment grade and residuals. |
| (6) | Funded exposures at 31 December 2007 were £8,698m. |
The following table sets out certain information in relation to RBS’s exposures to monoline insurers by counterparty credit quality.
| | | | | | | |
Monoline exposures by counterparty credit quality(1) £ billions | | | | | Fair value of underlying asset | | | | | | Credit valuation adjustments (pre-tax) | | | | | | | |
| AAA / AA | | | 19.8 | | | | 15.6 | | | | 4.2 | | | | (1.1 | ) | | | (0.4 | ) | | | 2.7 | |
| A / BBB | | | 2.6 | | | | 2.2 | | | | 0.4 | | | | (0.3 | ) | | | | | | | 0.2 | |
| Non-investment grade | | | 2.6 | | | | 1.0 | | | | 1.6 | | | | (1.3 | ) | | | | | | | 0.3 | |
| Total | | | 25.0 | | | | 18.8 | | | | 6.2 | | | | (2.7 | ) | | | (0.4 | ) | | | 3.2 | |
| Credit valuation adjustments taken in 2007 | | | | | | | | | | | | | | | 0.9 | | | | | | | | | |
| Estimated credit valuation adjustments before tax in 2008 | | | | | | | | | | | | | | | (1.8 | ) | | | | | | | | |
The following table sets out certain information in relation to RBS’s exposures to monoline insurers by collateral type.
Monoline exposures by collateral type(1) £ billions | | | | | Fair value of underlying asset | | | % Split underlying asset value | | | Underlying asset value as % of notional | | | | |
| RMBS and CDO of RMBS | | | 6.1 | | | | 2.5 | | | | 13 | % | | | 41 | % | | | 3.6 | |
| Other ABS | | | 4.5 | | | | 4.1 | | | | 22 | % | | | 91 | % | | | 0.3 | |
| CMBS | | | 3.7 | | | | 2.6 | | | | 14 | % | | | 70 | % | | | 1.0 | |
| Non ABS (incl CLOs) | | | 10.8 | | | | 9.6 | | | | 51 | % | | | 88 | % | | | 1.2 | |
| Total | | | 25.0 | | | | 18.8 | | | | 100 | % | | | 75 | % | | | 6.2 | |
The following table sets out certain information in relation to RBS’s exposures to super senior tranches of ABS CDOs.
CDO exposures – Super senior tranches of ABS CDO’s(1) | | | | | | | | | |
| Gross open exposures at 31 December 2007 (£bn) | | | 6.4 | | | | 3.1 | | | | 9.5 | |
| Net open exposures at 31 December 2007 (£bn) | | | 2.6 | | | | 1.3 | | | | 3.8 | |
| Effective attachment point at 31 December 2007 | | | 40 | % | | | 62 | % | | | 50 | % |
| Attachment point after estimated write-downs | | | 63 | % | | | 89 | % | | | 74 | % |
| % of underlying RMBS sub-prime assets | | | 69 | % | | | 91 | % | | | 79 | % |
| – originated in 2005 and earlier | | | 24 | % | | | 23 | % | | | 24 | % |
| – originated in 2006 | | | 28 | % | | | 69 | % | | | 46 | % |
| – originated in 2007 | | | 48 | % | | | 8 | % | | | 30 | % |
| Net open exposures after estimated write-downs (£bn) | | | 1.6 | | | | 0.4 | | | | 2.0 | |
Note:
| (1) | The financial information presented has been rounded to the nearest whole number or the nearest decimal. Therefore, the sum of the numbers in a column may not conform exactly to the total figure given for that column. In addition, certain percentages presented in the tables in this document reflect calculations based upon the underlying information prior to rounding, and, accordingly, may not conform exactly to the percentages that would be derived if the relevant calculations were based upon the rounded numbers. |
Dividends and dividend policy
The Board of RBS believes that the 2007 dividend payout ratio of around 45 per cent. remains sustainable over the medium-term, given the strength and diversity of the Group. The Board will assess future dividends based on circumstances at the time. Subject to this, the Board’s target for 2008 is that there would be a similar dividend payout ratio to 2007, based on earnings adjusted to exclude credit market-related write-downs and non-recurring items such as gains on disposals and integration costs.
It should be noted that the capital raised in the rights issue is not expected to generate the same return as existing capital in the business. This effect alone is likely to result in a reduction in dividend per share in 2008, after taking into account an adjustment in respect of the bonus element of the rights issue.
The Board believes that it would be prudent to issue new Ordinary Shares in the Company instead of paying the 2008 interim dividend. Accordingly, at the general meeting shareholders authorised the capitalisation of reserves which will allow the Company to issue such new Ordinary Shares instead of paying the interim dividend later this year. It is, however, RBS’s current intention that the 2008 final dividend be paid in cash.
Shareholders approved the 2007 final dividend at the Company’s annual general meeting on 23 April 2008. As previously announced, the 2007 final dividend will be paid in cash. The dividend payment date was previously 6 June 2008 but the Company will now pay the 2007 final dividend on 23 May 2008 so that shareholders will receive the cash dividend before the end of the rights issue offer period and be able to use such amounts after allowing for any tax in taking up their rights under the rights issue if they wish to do so. Until further notice, the Company’s dividend reinvestment plan (“DRIP”) will not be operated.
Capital
Taking into account the estimated write-downs, the rights issue and retentions, including conservative estimates in respect of other capital and strategic steps outlined herein, the Group’s capital ratios at 30 June 2008 and 31 December 2008 are expected to be approximately as set out below.
| | Core Tier 1 capital ratio(1) | | |
| Fully consolidated basis | | | |
| 30 June 2008 | >6% | | >8% |
| 31 December 2008 | >6% | | >8% |
| Proportional consolidated basis | | | |
| 30 June 2008 | >5% | | >7.5% |
| 31 December 2008 | >6% | | >8% |
Note:
| (1) | Prepared using Basel II methodology. |
2008 Annual General Meeting
On 23 April 2008, the Group held its Annual General Meeting. At the meeting, shareholders voted to (i) approve a final dividend of 23.1p per ordinary share, (ii) re-elect Colin Buchan, Jim Currie, Janis Kong, Sir Tom McKillop, Sir Steve Robson and Guy Whittaker as directors of the Group, (iii) re-appoint Deloitte & Touche LLP as the company’s auditor and (iv) authorise the Audit Committee to fix the remuneration of the auditors. All other resolutions presented to shareholders at the Annual General Meeting were also approved by shareholders.
Current trading and prospects
The following discussion reflects the change to the Group’s organisational structure announced on 28 February 2008.
The operating performance of many of RBS’s businesses since the beginning of 2008 has remained good, but results have been held back by the effects of the continuing deterioration in credit markets, which has resulted in additional write downs on credit market exposures in the first quarter. Some Global Banking & Markets (“GBM”) businesses have experienced a reduced level of activity, although others continue to perform well, as do Global Transaction Services and Regional Markets. Overall, the Group’s underlying results, excluding write downs, have remained satisfactory.
In a more uncertain environment for its customers, RBS has continued to benefit from strong growth in personal and corporate deposits and good growth in lending. Group net interest margin in the quarter was slightly lower, reflecting increased funding costs partially offset by stronger new business margins in some lending products.
Overall credit risk metrics have remained stable in the first quarter, with a continued decline in UK personal sector impairment losses but increased delinquencies in a specific US retail portfolio. Corporate credit quality remains broadly stable.
RBS divisions
Global Markets
Global Banking & Markets has been acutely affected by credit market conditions, particularly in March, with further write downs in credit markets during the quarter. There were good performances in rates and currencies, but lower business volumes in credit markets and equities, with corresponding reductions in costs. Credit impairments have remained low.
GBM has made a good start on exploiting the potential of ABN AMRO, with a significant number of deals already recorded as a result of combining the product expertise and customer franchises of the two businesses.
In response to the difficulties in its credit markets business, RBS has made significant changes to its North American management structure and has strengthened the control environment within GBM. It intends to reduce its headcount globally by more than originally envisaged through the ABN AMRO integration process.
Certain structured credit activities have been discontinued and problematic US sub prime mortgage related assets are now managed by a dedicated work out unit with a view to minimising risk and reducing positions at an appropriate pace. GBM remains focused on effective management of its capital and has accelerated other balance sheet management actions.
Global Transaction Services has delivered good growth in income and profit, despite a reduced benefit from non-interest bearing deposits as a result of lower interest rates. Transaction volumes have increased and the product strength and international capabilities of this new division have attracted significant new business, winning a number of notable new mandates in cash management, trade finance and financial institutions. Global Transaction Services continues to expand its international reach in merchant acquiring. Expense growth has remained under control.
Regional Markets
UK Retail & Commercial Banking has achieved steady growth in income, net of claims. Retail and commercial deposits have grown strongly, increasing by 12 per cent. in the first quarter, and there has been continued excellent progress in UK Wealth Management, where assets under management increased by 15 per cent. After two years in which RBS has had a limited appetite for the returns available in the UK mortgage market, it is now seeing competitors withdrawing from the market and has taken advantage of opportunities to write good credit quality mortgages at attractive margins. In the first quarter of 2008, RBS has achieved an 11 per cent. share of net new mortgage lending at an average loan to value of 64 per cent.
Retail impairment losses have continued to decline, reflecting our continued cautious approach to the personal unsecured credit market, while commercial credit quality has remained stable. We continue to monitor our exposure to commercial property carefully, and remain satisfied with the performance of our portfolio. Only 1 per cent. of commitments secured on commercial property is for speculative commercial property development.
US Retail & Commercial Banking has continued to achieve modest income growth while maintaining good cost discipline, but overall results have been held back by increased impairments in one specific loan portfolio. RBS continues to diversify its business, achieving good growth in commercial banking volumes and in cards. Deposit volumes are stable, but margins have been eroded by competitive pressure. Consumer lending volumes have contracted as underwriting standards have been tightened and consumer spending has slowed. Investment is being focused on the development of commercial banking activities and other selected opportunities.
Citizens’ credit portfolio continues to perform satisfactorily, with the exception of a specific portfolio within its home equity book. Delinquencies on this portfolio have risen markedly as the housing market has continued to weaken and the Group has continued to increase provisions. Excluding this portfolio, delinquencies in consumer lending represented only 0.7 per cent. of balances in the first quarter, unchanged from the level of a year earlier.
Europe and Middle East Retail & Commercial Banking has continued to deliver good profit growth, though income growth within Ulster Bank has moderated in line with the slower pace of Irish economic expansion. Credit quality remains stable. Results in sterling terms have benefited from the movement in the euro exchange rate. The business in the UAE continues to make good progress with record sales of credit cards and personal loans in March and continued strong performance in affluent banking.
Asia Retail & Commercial Banking has continued to generate very strong growth in both income and operating profit. RBS Coutts has maintained its momentum with deposits 18 per cent. ahead and assets under management 16 per cent. higher in March. In China, the affluent banking business is making excellent progress, with client funds doubling. The division is pressing ahead with continued focused investment in its retail and commercial banking franchise in the region.
RBS Insurance
RBS Insurance has achieved strong new business volumes and good renewal rates in its own motor and home brands. Expenses reflect accelerated marketing activity, while claims costs were lower as a result of enhanced risk selection as well as more favourable weather conditions. International businesses in Spain, Italy and Germany continued to make good progress.
Group Manufacturing
Group Manufacturing has continued to deliver good productivity gains in support of business growth in our customer facing divisions while continuing to invest in our infrastructure in the UK and internationally. Technology and operations costs remain tightly controlled.
Acquisitions and disposals
On 1 April 2008, RBS completed the formation of a commodities market making joint venture with Sempra Energy, RBS Sempra Commodities.
ABN AMRO integration
Integration benefits and headcount reductions achieved during the first quarter are slightly ahead of RBS’s initial expectations. Cost benefits are slightly ahead of schedule, while revenue benefits are slightly behind.
Implementation teams are now in place, with, for example, 44 separate workstreams established in GBM, covering products, clients, regions, functions and migration, involving 1,200 staff from RBS and ABN AMRO.
The ABN AMRO businesses acquired by RBS have been restructured to mirror the new RBS Group structure. Future single management appointments have been made and the co-location of GBM teams has begun, with rebranding of ABN AMRO buildings already under way. The combined GBM and Global Transaction Services teams have already achieved a significant number of deals in which ABN AMRO customers gain access to RBS product capabilities, such as US Treasury bonds, while RBS customers benefit from ABN AMRO product expertise in areas such as cash management and trade finance.
Competition
The Group faces intense competition in all the markets it serves. In the UK, the Group’s principal competitors are the other UK retail and commercial banks, building societies and the other major international banks represented in London.
Competition for corporate and institutional customers in the UK is from UK banks and from large foreign financial institutions who are also active and offer combined investment and commercial banking capabilities. In asset finance, the Group competes with banks and specialised asset finance providers, both captive and non-captive. In European and Asian corporate and institutional banking markets the Group competes with the large domestic banks active in these markets and with the major international banks.
In the small business banking market, the Group competes with other UK clearing banks, specialist finance providers and building societies.
In the personal banking segment the Group competes with UK banks and building societies, major retailers, life assurance companies and internet-only players. In the mortgage market the Group competes with UK banks and building societies. The Group’s life assurance businesses compete with Independent Financial Advisers and life assurance companies.
In the UK credit card market large retailers and specialist card issuers, including major US operators, are active in addition to the UK banks. Competitive activity is across a number of dimensions including introductory and longer term pricing, loyalty and reward schemes, and packaged benefits. In addition to physical distribution channels, providers compete through direct marketing activity and the internet. The market remains competitive, both between issuers and with other payment methods.
In Europe, Asia and the Middle East, the enlarged Group now competes in retail banking with local and international banks. In a number of these markets there are regulatory barriers to entry or expansion, and the state ownership of banks. Competition is generally intensifying as more players enter markets that are perceived to be de-regulating and offer significant growth potential.
In Wealth Management, The Royal Bank of Scotland International competes with other UK and international banks to offer offshore banking services. Coutts and Adam & Company compete as private banks with UK clearing and private banks, and with international private banks. Competition in wealth management activities has intensified as banks have increased their focus on competing for affluent and high net worth customers.
RBS Insurance competes in personal lines insurance and, to a limited extent, in commercial insurance. There is strong competition from a range of insurance companies which now operate telephone and internet direct sales businesses. Competition in the UK motor market remains particularly intense, and price comparison internet sites now play a major role in the marketplace. RBS Insurance also competes with local insurance companies in the direct motor insurance markets in Spain, Italy and Germany.
In Ireland, Ulster Bank and First Active compete in retail and commercial banking with the major Irish banks and building societies, and with other UK and international banks and building societies active in the market. Competition is intensifying as UK, Irish and other European institutions seek to expand their businesses.
In the United States, where competition is intense, Citizens competes in the New England, Mid-Atlantic and Mid West retail and mid-corporate banking markets with local and regional banks and other financial institutions. The Group also competes in the US in large corporate lending and specialised finance markets, and in fixed-income trading and sales. Competition is principally with the large US commercial and investment banks and international banks active in the US.
Risk factors
Set out below are certain risk factors which could affect the Group’s future results and cause them to be materially different from expected results. The Group’s results are also affected by competition and other factors. The factors discussed in this report should not be regarded as a complete and comprehensive statement of all potential risks and uncertainties.
The Group’s business and earnings may be affected by general business and geopolitical conditions.
The performance of the Group is significantly influenced by the economic conditions of the countries in which it operates, particularly the United Kingdom, the United States and Europe. A downturn in these economies, including any further deterioration in the US real estate or other markets, could result in a general reduction in business activity and a consequent loss of income for the Group. It could also cause a higher incidence of impairments and trading losses in the Group’s lending, trading and other portfolios. Geopolitical conditions can also affect the Group’s earnings. Terrorist acts and threats and the response of governments in the United Kingdom, the United States and elsewhere to them could affect the level of economic activity. The Group’s businesses could also be exposed to the risk of business interruption and economic slowdown following the outbreak of a pandemic.
Changes in interest rates, foreign exchange rates, bond and equity prices, and other market factors have affected and will continue to affect the Group’s business.
The most significant market risks the Group faces are interest rate, foreign exchange and bond and equity price risks. Changes in interest rate levels, yield curves and spreads may affect the interest rate margin realised between lending and borrowing costs. Changes in currency rates, particularly in the sterling-US dollar and sterling-euro exchange rates, affect the value of assets and liabilities denominated in foreign currencies and the reported earnings of the Group’s non-UK subsidiaries (principally ABN AMRO, Citizens, RBS Greenwich Capital and Ulster Bank) and may affect income from foreign exchange dealing. The performance of financial markets may affect bond and equity prices and, therefore, cause changes in the value of the Group’s investment and trading portfolios. While the Group has implemented risk management methods to mitigate and control these and other market risks to which it is exposed, it is difficult to predict with accuracy changes in economic or market conditions and to anticipate the effects that such changes could have on the Group’s financial performance and business operations.
The Group’s borrowing costs and its access to the debt capital markets depend significantly on its credit ratings.
On 22 April 2008, Standard & Poor’s rating service affirmed the long-term rating of the Group as ‘‘AA-’’ with a negative outlook. However, on that same day, Moody’s rating service announced that it was placing the long-term ratings of NatWest, the Royal Bank, the subsidiaries of Citizens and the Group under review for possible downgrade and Fitch Ratings downgraded the Group to ‘‘AA’’ with a stable outlook. A reduction in the long-term credit ratings of the company or one of its principal subsidiaries may increase its borrowing costs, limit its access to the capital markets and trigger additional collateral requirements in derivative contracts and other secured funding arrangements. Credit ratings are also important to the Group when competing in certain markets, such as longer-term over-the-counter derivatives. Therefore, further reductions in the Group’s credit ratings could adversely affect its access to liquidity and competitive position and, hence, negatively impact its earnings.
The Group’s business performance could be affected if its capital is not managed effectively.
The Group’s capital is critical to its ability to operate its businesses, to grow organically and to take advantage of strategic opportunities. The Group is required by regulators in the United Kingdom, the United States and the Netherlands, and in other jurisdictions in which it undertakes regulated activities, to maintain adequate capital. Although the Group mitigates the risk of not meeting capital adequacy requirements by careful management of its balance sheet and capital, through capital-raising activities, disciplined capital allocation and the hedging of capital currency exposures, any change that limits its ability effectively to manage such resources (including, for example, reductions in profits and retained earnings as a result of write-downs or otherwise, delays in the disposal of certain assets or the inability to syndicate loans as a result of market conditions or otherwise) could have a material adverse impact on its financial condition and regulatory capital position.
The value of certain financial instruments recorded at fair value is determined using financial models incorporating assumptions, judgements and estimates which may change over time.
Under IFRS, the Group recognises at fair value: (i) financial instruments classified as ‘‘held-for-trading’’ or ‘‘designated as at fair value through profit or loss’’, (ii) financial assets classified as ‘‘available-for-sale’’ and (iii) derivatives, each as further described in the notes to our financial statements. Generally, in order to establish the fair value of these instruments, the Group relies on quoted market prices or, where the market for a financial instrument is not sufficiently active, internal valuation models that utilise observable market data. In certain circumstances, the data for individual financial instruments or classes of financial instrument utilised by such valuation models may not be available or may become unavailable due to changes in market conditions, as has been the case over the past several months. In such circumstances, the Group’s internal valuation models require the Group to make assumptions, judgements and estimates in order to establish fair value. In common with other financial institutions, these internal valuation models are complex, and the assumptions, judgements and estimates the Group is required to make often relate to matters that are inherently uncertain, such as expected cash flows, the ability of borrowers to service debt, house price appreciation and depreciation, and relative levels of defaults and deficiencies. Such assumptions, judgements and estimates may need to be updated to reflect changing trends and market conditions. The resulting change in the fair values of the financial instruments could have a material adverse effect on the Group’s earnings.
The Group’s future earnings could be affected by depressed asset valuations resulting from poor market conditions.
Financial markets are sometimes subject to significant stress conditions where steep falls in perceived or actual asset values are accompanied by a severe reduction in market liquidity, as exemplified by recent events affecting asset-backed CDOs, the US sub-prime residential mortgage market and leveraged finance. In dislocated markets, hedging and other risk management strategies may not be as effective as they are in normal market conditions due, in part, to the decreasing credit quality of hedge counterparties, including monoline insurers. Severe market events are difficult to foresee and, if they continue to occur, could result in the Group incurring significant losses. In 2007, the Group recorded material write-downs on its credit market positions, principally on its US residential mortgage and monoline exposures. For capital planning purposes, the Group has estimated, based on current information, further significant write-downs in these and other exposures, as further described under "– Recent developements – Credit market exposures." As market conditions change, the fair value of these exposures could fall further than currently estimated and therefore result in additional write-downs. Moreover, recent market volatility and illiquidity has made it difficult to value certain of the Group’s exposures. Valuations in future periods, reflecting then-prevailing market conditions, may result in significant changes in the fair values of the Group’s exposures, even in respect of exposures, such as credit market exposures, for which the Group has previously recorded or estimated write-downs. In addition, the value ultimately realised by the Group will depend on the fair value as determined at that time and may be materially different from the current or estimated fair value. Any of these factors could require the Group to recognise further write-downs or realise impairment charges, any of which may adversely affect its financial condition and results of operations.
The value or effectiveness of any credit protection which the Group has purchased from monoline insurers may fluctuate depending on the financial condition of the insurer.
The Group’s credit exposure to the monoline sector arises from over-the-counter derivative contracts – mainly credit default swaps (‘‘CDS’’) which are carried at fair value. The fair value of these CDSs, and the Group’s exposure to the risk of default by the underlying counterparties, depends on the valuation and the perceived credit risk of the instrument against which protection has been bought. Towards the end of 2007, monoline insurers were adversely affected by their exposure to US residential mortgage-linked products. If the financial condition of these counterparties or their perceived credit worthiness deteriorates further, the Group could record further credit valuation adjustments on the CDSs bought from monoline insurers in addition to those already recorded, as described "– Recent developments – Credit market exposures."
Liquidity risk is inherent in the Group’s operations.
Liquidity risk is the risk that the Group will be unable to meet its obligations as they fall due. This risk is inherent in banking operations and can be heightened by a number of enterprise-specific factors such as an over-reliance on a particular source of funding, changes in credit ratings or by market-wide phenomena such as market dislocation and major disasters. The Group’s liquidity management focuses on maintaining a diverse and appropriate funding strategy for its operations, in controlling the mismatch of maturities and on carefully monitoring its undrawn commitments and contingent liabilities. However, the Group’s ability to access sources of liquidity during periods of liquidity stress (such as have been experienced in recent months), including through the issue or sale of complex financial and other instruments, may be constrained as a result of current and future market conditions. Furthermore, there is a risk that corporate and institutional counterparties with credit exposures may look to consolidate their exposure to the enlarged Group.
The financial performance of the Group may be affected by borrower credit quality.
Risks arising from changes in credit quality and the recoverability of loans and amounts due from counterparties are inherent in a wide range of the Group’s businesses. Adverse changes in the credit quality of the Group’s borrowers and counterparties, or in their behaviour, or a general deterioration in the UK, US, European or global economic conditions, or arising from systemic risks in the financial systems, could affect the recoverability and value of the Group’s assets and require an increase in the provision for impairment losses and other provisions.
Each of the Group’s businesses is subject to substantial regulation and oversight. Any significant regulatory developments could have an effect on how the Group conducts its business and on its results of operations.
The Group is subject to financial services laws, regulations, administrative actions and policies in each location in which it operates, all of which are subject to change. For example, the move from Basel I to Basel II on 1 January 2008 resulted in certain definitional changes in the way risk-weighted assets are calculated and the Group continues to work with regulators to refine the methods by which the calculation of risk-weighted assets is made. The change also impacted the way certain deductions to regulatory capital were applied.
Other areas where governmental policies and regulatory changes could have an adverse impact include, but are not limited to:
· the monetary, interest rate and other policies of central banks and regulatory authorities;
· general changes in government or regulatory policy or changes in regulatory regimes that may significantly influence investor decisions in particular markets in which the Group operates or may increase the costs of doing business in those markets;
· other general changes in the regulatory requirements, such as prudential rules relating to the capital adequacy framework;
· changes in competition and pricing environments;
· further developments in the financial reporting environment;
· expropriation, nationalisation, confiscation of assets and changes in legislation relating to foreign ownership; and
· other unfavourable political, military or diplomatic developments producing social instability or legal uncertainty which, in turn, may affect demand for the Group’s products and services.
Further changes to the regulatory requirements applicable to the Group, in particular in the United Kingdom, the United States and the Netherlands, whether resulting from recent events in the credit markets or otherwise, could materially affect its business, the products and services it offers and the value of its assets.
The Group is subject to litigation and regulatory investigations which may impact its business.
The company and its subsidiaries operate in a legal and regulatory environment that exposes them to potentially significant litigation and regulatory risks. As a result, the company and its subsidiaries are involved in various disputes and legal proceedings in the United Kingdom, the United States and other jurisdictions, including litigation and regulatory investigations. Such cases are subject to many uncertainties, and their outcome is often difficult to predict, particularly in the earlier stages of a case or investigation. Adverse regulatory action against the Group or adverse judgements in litigation to which the Group is a party could result in restrictions or limitations on the Group’s operations or result in a material adverse effect on the Group’s reputation or results of operations. Currently, the Group is responding to regulatory inquiries and investigations and is involved in litigation arising from its operations. For details about certain litigation and regulatory investigations in which the Group is involved, see pages 215 to 217.
Operational risks are inherent in the Group’s operations.
The Group’s operations are dependent on the ability to process a very large number of transactions efficiently and accurately. Operational losses can result from fraud, errors by employees, failure to document transactions properly or to obtain proper authorisation, failure to comply with regulatory requirements and conduct of business rules, equipment failures, natural disasters or the failure of external systems, including those of the Group’s suppliers or counterparties. Although the Group has implemented risk controls and loss mitigation actions, and substantial resources are devoted to developing efficient procedures and to staff training, it is not possible to be certain that such procedures will be effective in controlling each of the operational risks faced by the Group.
The Group is exposed to the risk of changes in tax legislation and its interpretation and to increases in the rate of corporate and other taxes in the jurisdictions in which it operates.
The Group’s activities are subject to tax at various rates around the world computed in accordance with local legislation and practice. Action by governments to increase tax rates or to impose additional taxes would reduce the profitability of the Group. Revisions to tax legislation or to its interpretation might also affect the Group’s results in the future.
The Group’s insurance businesses are subject to inherent risks involving claims.
Future claims in the Group’s general and life assurance business may be higher than expected as a result of changing trends in claims experience resulting from catastrophic weather conditions, demographic developments, changes in mortality and other causes outside the Group’s control. Such changes would affect the profitability of current and future insurance products and services. The Group reinsures some of the risks it has assumed and is accordingly exposed to the risk of loss should its reinsurers become unable or unwilling to pay claims made by the Group against them.
The Group’s future earnings and shareholder value in part depend on strategic decisions regarding organic growth and potential acquisitions and disposals.
The Group devotes substantial management and planning resources to the development of strategic plans for organic growth and identification of possible acquisitions and disposals. In addition, the Group’s strategic plans are also supported by substantial expenditure to generate organic growth in customer business. If these strategic plans, including the planned disposals discussed under "Recent developments", do not meet with success or fail to achieve the results expected, the Group’s earnings could grow more slowly or decline and its growth prospects may be impaired.
Proposals for the restructuring of ABN AMRO are complex and may not realise the anticipated benefits for the Group.
The restructuring plan in place for the integration and separation of ABN AMRO into and among the businesses and operations of the Consortium Banks is complex involving substantial reorganisation of ABN AMRO’s operations and legal structure. In addition, it contemplates activities taking place simultaneously in a number of businesses and jurisdictions. Implementation of the reorganisation and the realisation of the forecast benefits within the planned timescales will be challenging. Execution of the restructuring requires management resources previously devoted to the Group's businesses and the retention of appropriately skilled ABN AMRO staff. The Group may not realise the benefits of the acquisition or the restructuring when expected or to the extent projected.
If the Company is unable to complete the rights issue, it may be required to find alternative methods of increasing its core Tier 1 and Tier 1 capital ratios.
The purpose of the rights issue is to allow the Company to strengthen its capital position and to achieve a core Tier 1 capital ratio in excess of 6 per cent. and a Tier 1 capital ratio in excess of 8 per cent. by the end of 2008 on a proportional consolidated basis, which the Company believes are appropriate levels in light of current market conditions. If the Company is unable to complete the rights issue, it will need to assess its capital position and may be required to find alternative methods for achieving requisite capital ratios. Such methods could include a reduction in dividends, a reduction in the rate of growth of risk weighted assets, disposal of certain businesses or increased issuance of Tier 1 securities. There can be no assurance that any of these alternative methods would be successful in increasing the Company’s capital ratios sufficiently or on the timetable currently envisaged. If the Company is unable to increase its capital ratios sufficiently, its credit ratings may drop, its cost of funding may increase and its share price may decline.
Business review continued
Financial highlights
| for the year ended 31 December | | | 2007 £m | | | 2006 £m | | | 2005 £m | |
| Total income | | | 31,115 | | | 28,002 | | | 25,902 | |
| Operating profit before tax | | | 9,900 | | | 9,186 | | | 7,936 | |
| Profit attributable to ordinary shareholders | | | 7,303 | | | 6,202 | | | 5,392 | |
| Cost:income ratio (1) | | | 46.4% | | | 44.6% | | | 46.1% | |
| Basic earnings per share (pence) (2) | | | 76.4 | | | 64.9 | | | 56.5 | |
| Return on equity (3) | | | 18.8% | | | 18.5% | | | 17.5% | |
| | | 2007 | | 2006 | | 2005 | |
| at 31 December | | | £m | | | £m | | | £m | |
| Total assets | | | 1,900,519 | | | 871,432 | | | 776,827 | |
| Loans and advances to customers | | | 829,250 | | | 466,893 | | | 417,226 | |
| Deposits | | | 994,998 | | | 516,365 | | | 453,274 | |
| Owners’ equity | | | 53,038 | | | 40,227 | | | 35,435 | |
| Risk asset ratio – tier 1 | | | 7.3% | | | 7.5% | | | 7.6% | |
| – total | | | 11.2% | | | 11.7% | | | 11.7% | |
| | Notes: |
| | |
| (1) | Cost:income ratio represents operating expenses expressed as a percentage of total income. |
| | |
| (2) | Prior year per share data have been restated to reflect the bonus issue of ordinary shares in May 2007. |
| | |
| (3) | Return on equity represents profit attributable to ordinary shareholders expressed as a percentage of average ordinary shareholders’ equity. |
Overview of results
As discussed on page 2, the results of ABN AMRO are fully consolidated in the Group's financial statements. Consequently, the statutory results of the RBS for the year ended 31 December 2007 include the results of ABN AMRO for the period from 17 October 2007 to 31 December 2007. The interests of Fortis and Santander in RFS Holdings are included in minority interests.
Summary consolidated income statement for the year ended 31 December 2007
| | | 2007 | | | 2006 | | | 2005 | |
| | | | £m | | | | £m | | | | £m | |
| Net interest income | | | 12,668 | | | | 10,596 | | | | 9,918 | |
| Fees and commissions receivable | | | 8,465 | | | | 7,116 | | | | 6,750 | |
| Fees and commissions payable | | | (2,311 | ) | | | (1,922 | ) | | | (1,841 | ) |
| Other non-interest income | | | 6,184 | | | | 6,239 | | | | 5,296 | |
| Insurance premium income | | | 6,398 | | | | 6,243 | | | | 6,076 | |
| Reinsurers’ share | | | (289 | ) | | | (270 | ) | | | (297 | ) |
| Non-interest income | | | 18,447 | | | | 17,406 | | | | 15,984 | |
| Total income | | | 31,115 | | | | 28,002 | | | | 25,902 | |
| Operating expenses | | | 14,435 | | | | 12,480 | | | | 11,946 | |
| Profit before other operating charges and impairment losses | | | 16,680 | | | | 15,522 | | | | 13,956 | |
| Insurance claims | | | 4,770 | | | | 4,550 | | | | 4,413 | |
| Reinsurers’ share | | | (118 | ) | | | (92 | ) | | | (100 | ) |
| Impairment losses | | | 2,128 | | | | 1,878 | | | | 1,707 | |
| Operating profit before tax | | | 9,900 | | | | 9,186 | | | | 7,936 | |
| Tax | | | 2,052 | | | | 2,689 | | | | 2,378 | |
| Profit from continuing operations | | | 7,848 | | | | 6,497 | | | | 5,558 | |
| Loss from discontinued operations, net of tax | | | 136 | | | | — | | | | — | |
| Profit for the year | | | 7,712 | | | | 6,497 | | | | 5,558 | |
| Minority interests | | | 163 | | | | 104 | | | | 57 | |
| Other owners | | | 246 | | | | 191 | | | | 109 | |
| Profit attributable to ordinary shareholders | | | 7,303 | | | | 6,202 | | | | 5,392 | |
| | | | | | | | | | | | | |
| | | | | | | | | | | | | |
Basic earnings per ordinary share* | | | 76.4p | | | | 64.9p | | | | 56.5p | |
| | | | | | | | | | | | | |
| Diluted earnings per ordinary share* | | | 75.7p | | | | 64.4p | | | | 56.1p | |
* Prior year per share data have been restated to reflect the bonus issue of ordinary shares in May 2007.
Business review continued
2007 compared with 2006
Profit
Profit before tax was up 8%, from £9,186 million to £9,900 million. The results of ABN AMRO are included from the date of acquisition, 17 October 2007.
Total income
The Group achieved strong growth in income during 2007. Total income was up 11% or £3,113 million to £31,115 million, notwithstanding the significant impact of the developments in global credit markets in the second half of 2007.
Net interest income increased by 20% to £12,668 million and represents 41% of total income (2006 – 38%). Average loans and advances to customers grew by 26% and average customer deposits grew by 27%.
Non-interest income increased by £1,041 million to £18,447 million and represents 59% of total income (2006 – 62%).
Net interest margin
The Group’s net interest margin at 2.39% was down from 2.53% in 2006.
Operating expenses
Operating expenses increased by 16% to £14,435 million. Integration costs were £108 million compared with £134 million in 2006.
Cost:income ratio
The Group’s cost:income ratio was 46.4% compared with 44.6% in 2006.
Net insurance claims
Bancassurance and general insurance claims, after reinsurance, increased by 4% to £4,652 million reflecting adverse weather conditions in the summer of 2007. Excluding the impact of the floods in the summer, net general insurance claims decreased by 7%.
Impairment losses
Impairment losses rose 13% to £2,128 million, compared with £1,878 million in 2006.
Risk elements in lending and potential problem loans represented 1.64% of gross loans and advances to customers excluding reverse repos at 31 December 2007 (2006 – 1.57%).
Provision coverage of risk elements in lending and potential problem loans was 56% (2006 – 62%).
Taxation
The effective tax rate for 2007 was 20.7% (2006 – 29.3%). The headline rate is lower than the standard rate of UK corporation tax of 30% principally due to certain non-taxable capital gains and changes to deferred tax balances following the change in rate of corporation tax.
Earnings and dividends
Basic earnings per ordinary share increased by 18%, from 64.9p to 76.4p.
A final dividend of 23.1p per ordinary share is recommended, giving a total dividend for the year of 33.2p, an increase of 10%. If approved, the final dividend will be paid on 6 June 2008 to shareholders registered on 7 March 2008.
Balance sheet
Total assets were £1,900.5 billion at 31 December 2007. The acquisition of ABN AMRO in October 2007 increased assets by £774.2 billion, with the balance accounted for largely by growth in our lending to customers and in trading assets.
Lending to customers, excluding repurchase agreements and stock borrowing (“reverse repos”), increased in 2007 by 70% or £283.0 billion to £686.9 billion. Customer deposits, excluding repurchase agreements and stock lending (“repos”), grew by 71% or £227.2 billion to £547.5 billion.
Capital ratios at 31 December 2007 were 7.3% (Tier 1) and 11.2% (Total).
Bonus issue
In May 2007, the Group capitalised £1,576 million of its share premium account by way of a bonus issue of two new ordinary shares of 25p each for every one held.
Profitability
The after-tax return on ordinary shareholders’ equity, which is based on profit attributable to ordinary shareholders and average ordinary shareholders’ equity, was 18.8% compared with 18.5% in 2006.
2006 compared with 2005
Profit
Profit before tax was up 16%, from £7,936 million to £9,186 million, reflecting strong organic income growth in all divisions.
Total income
The Group achieved strong growth in income during 2006. Total income was up 8% or £2,100 million to £28,002 million.
Net interest income increased by 7% to £10,596 million and represents 38% of total income (2005 – 38%). Average loans and advances to customers and average customer deposits grew by 14% and 11% respectively.
Non-interest income increased by 9% to £17,406 million and represents 62% of total income (2005 – 62%).
Net interest margin
The Group’s net interest margin at 2.53% was down from 2.60% in 2005, due mainly to the business mix effect of growth in corporate and mortgage lending and the impact of the flatter US dollar yield curve.
Operating expenses
Operating expenses rose by 4% to £12,480 million.
Integration
Integration costs were £134 million compared with £458 million in 2005. Included are costs relating to the integration of First Active and Charter One, as well as the amortisation of software costs relating to the integration of Churchill. Integration costs in 2005 included software costs relating to the acquisition of NatWest which were previously written-off as incurred under UK GAAP but under IFRS were capitalised and amortised. All such software was fully amortised by the end of 2005.
Cost:income ratio
The Group’s cost:income ratio was 44.6% compared with 46.1% in 2005.
Net insurance claims
Bancassurance and general insurance claims, after reinsurance, increased by 3% to £4,458 million reflecting volume growth.
Impairment losses
Impairment losses were £1,878 million compared with £1,707 million in 2005, an increase of 10%.
Risk elements in lending and potential problem loans represented 1.57% of gross loans and advances to customers excluding reverse repos at 31 December 2006 (2005 – 1.60%).
Provision coverage of risk elements in lending and potential problem loans was 62% compared with 65% at 31 December 2005. This reflects amounts written-off and the changing mix from unsecured to secured exposures.
Earnings and dividends*
Basic earnings per ordinary share increased by 15%, from 56.5p to 64.9p.
A final dividend of 22.1p per ordinary share was paid, giving a total dividend for the year of 30.2p, an increase of 25%.
*restated for the effect of the bonus issue of ordinary shares in May 2007.
Balance sheet
Total assets were £871.4 billion at 31 December 2006, 12% higher than total assets of £776.8 billion at 31 December 2005.
Lending to customers, excluding repurchase agreements and stock borrowing (“reverse repos”), increased in 2006 by 10% or £35.7 billion to £404.0 billion. Customer deposits, excluding repurchase agreements and stock lending (“repos”), grew by 9% or £26.1 billion to £320.2 billion.
Capital ratios at 31 December 2006 were 7.5% (Tier 1) and 11.7% (Total).
Profitability
The after-tax return on ordinary equity, which is based on profit attributable to ordinary shareholders and average ordinary equity, was 18.5% compared with 17.5% in 2005.
Business review continued
Analysis of results
Net interest income
| | | 2007 | | | 2006 | | | 2005 | |
| | | | £m | | | | £m | | | | £m | |
| Interest receivable | | | 33,420 | | | | 24,688 | | | | 21,331 | |
| Interest payable | | | (20,752 | ) | | | (14,092 | ) | | | (11,413 | ) |
| Net interest income | | | 12,668 | | | | 10,596 | | | | 9,918 | |
| | | | | | | | | | | | | |
| | | % | | | % | | | % | |
| Gross yield on interest-earning assets of the banking business | | | 6.30 | | | | 5.90 | | | | 5.59 | |
| Cost of interest-bearing liabilities of the banking business | | | (4.39 | ) | | | (3.85 | ) | | | (3.36 | ) |
| Interest spread of the banking business | | | 1.91 | | | | 2.05 | | | | 2.23 | |
| Benefit from interest-free funds | | | 0.48 | | | | 0.48 | | | | 0.37 | |
| Net interest margin of the banking business | | | 2.39 | | | | 2.53 | | | | 2.60 | |
| | | | | | | | | | | | | |
| Yields, spreads and margins of the banking business | | % | | | % | | | % | |
Gross yield (1) | | | | | | | | | | | | |
| Group | | | 6.30 | | | | 5.90 | | | | 5.59 | |
| UK | | | 6.69 | | | | 6.13 | | | | 6.06 | |
| Overseas | | | 5.79 | | | | 5.50 | | | | 4.74 | |
Interest spread (2) | | | | | | | | | | | | |
| Group | | | 1.91 | | | | 2.05 | | | | 2.23 | |
| UK | | | 2.30 | | | | 2.37 | | | | 2.45 | |
| Overseas | | | 1.39 | | | | 1.47 | | | | 1.87 | |
Net interest margin (3) | | | | | | | | | | | | |
| Group | | | 2.39 | | | | 2.53 | | | | 2.60 | |
| UK | | | 2.55 | | | | 2.68 | | | | 2.75 | |
| Overseas | | | 2.17 | | | | 2.26 | | | | 2.32 | |
| | | | | | | | | | | | | |
| The Royal Bank of Scotland plc base rate (average) | | | 5.51 | | | | 4.64 | | | | 4.65 | |
| London inter-bank three month offered rates (average): | | | | | | | | | | | | |
| Sterling | | | 6.00 | | | | 4.85 | | | | 4.76 | |
| Eurodollar | | | 5.29 | | | | 5.20 | | | | 3.56 | |
| Euro | | | 4.28 | | | | 3.08 | | | | 2.18 | |
| | Notes: |
| | |
| (1) | Gross yield is the interest rate earned on average interest-earning assets of the banking business. |
| | |
| (2) | Interest spread is the difference between the gross yield and the interest rate paid on average interest-bearing liabilities of the banking business. |
| | |
| (3) | Net interest margin is net interest income of the banking business as a percentage of average interest-earning assets of the banking business. |
Average balance sheet and related interest
| | | 2007 | | | 2006 | | | 2005 | |
| | | Average | | | | | | | Average | | | | | | | | | Average | | | | | | | |
| | | balance | | Interest | | Rate | | | balance | | | Interest | | | Rate | | | balance | | | Interest | | | Rate | |
| | | | £m | | | £m | | % | | | | £m | | | | £m | | | % | | | | £m | | | | £m | | | % | |
| Assets | | | | | | | | | | | | | | | | | | | | | | | | | | | | | | | |
Treasury bills and other eligible bills – UK | | | 357 | | | 16 | | | 4.48 | | | | 2,059 | | | | 90 | | | | 4.37 | | | | 3,160 | | | | 138 | | | | 4.37 | |
| – Overseas | | | 131 | | | 5 | | | 3.82 | | | | 70 | | | | 3 | | | | 4.29 | | | | 55 | | | | 2 | | | | 3.64 | |
Loans and advances to banks – UK | | | 21,133 | | | 1,024 | | | 4.85 | | | | 15,934 | | | | 681 | | | | 4.27 | | | | 15,477 | | | | 649 | | | | 4.19 | |
| – Overseas | | | 13,798 | | | 626 | | | 4.54 | | | | 7,237 | | | | 237 | | | | 3.27 | | | | 9,422 | | | | 259 | | | | 2.75 | |
Loans and advances to customers – UK | | | 268,911 | | | 18,506 | | | 6.88 | | | | 239,086 | | | | 15,141 | | | | 6.33 | | | | 212,156 | | | | 13,453 | | | | 6.34 | |
| – Overseas | | | 183,186 | | | 11,046 | | | 6.03 | | | | 121,092 | | | | 6,977 | | | | 5.76 | | | | 104,579 | | | | 5,206 | | | | 4.98 | |
Debt securities – UK | | | 10,526 | | | 584 | | | 5.55 | | | | 10,757 | | | | 508 | | | | 4.72 | | | | 14,731 | | | | 630 | | | | 4.28 | |
| – Overseas | | | 32,333 | | | 1,613 | | | 4.99 | | | | 21,962 | | | | 1,051 | | | | 4.79 | | | | 22,299 | | | | 994 | | | | 4.46 | |
Total interest-earning assets – banking business (2, 3) | | | 530,375 | | | 33,420 | | | 6.30 | | | | 418,197 | | | | 24,688 | | | | 5.90 | | | | 381,879 | | | | 21,331 | | | | 5.59 | |
– trading business (4) | | | 313,204 | | | | | | | | | | 202,408 | | | | | | | | | | | | 172,990 | | | | | | | | | |
| Total interest-earning assets | | | 843,579 | | | | | | | | | | 620,605 | | | | | | | | | | | | 554,869 | | | | | | | | | |
Non-interest-earning assets (2, 3) | | | 316,697 | | | | | | | | | | 213,297 | | | | | | | | | | | | 182,179 | | | | | | | | | |
| Total assets | | | 1,160,276 | | | | | | | | | | 833,902 | | | | | | | | | | | | 737,048 | | | | | | | | | |
| Percentage of assets applicable to overseas operations | | | 38.0 | % | | | | | | | | | 35.2 | % | | | | | | | | | | | 35.3 | % | | | | | | | | |
| Liabilities and owners’ equity | | | | | | | | | | | | | | | | | | | | | | | | | | | | | | | | | | |
Deposits by banks – UK | | | 52,951 | | | 2,234 | | | 4.22 | | | | 35,985 | | | | 1,393 | | | | 3.87 | | | | 34,742 | | | | 1,192 | | | | 3.43 | |
| – Overseas | | | 34,559 | | | 1,417 | | | 4.10 | | | | 28,772 | | | | 1,228 | | | | 4.27 | | | | 27,383 | | | | 891 | | | | 3.25 | |
Customer accounts: demand deposits – UK | | | 93,764 | | | 3,296 | | | 3.52 | | | | 86,207 | | | | 2,428 | | | | 2.82 | | | | 73,653 | | | | 2,057 | | | | 2.79 | |
| – Overseas | | | 30,739 | | | 1,035 | | | 3.37 | | | | 13,113 | | | | 441 | | | | 3.36 | | | | 13,823 | | | | 299 | | | | 2.16 | |
Customer accounts: savings deposits – UK | | | 36,334 | | | 1,658 | | | 4.56 | | | | 30,933 | | | | 1,058 | | | | 3.42 | | | | 26,727 | | | | 778 | | | | 2.91 | |
| – Overseas | | | 29,908 | | | 1,005 | | | 3.36 | | | | 19,766 | | | | 529 | | | | 2.68 | | | | 21,700 | | | | 381 | | | | 1.76 | |
Customer accounts: other time deposits – UK | | | 88,089 | | | 4,201 | | | 4.77 | | | | 67,126 | | | | 2,807 | | | | 4.18 | | | | 60,350 | | | | 2,325 | | | | 3.85 | |
| – Overseas | | | 46,284 | | | 2,282 | | | 4.93 | | | | 36,177 | | | | 1,636 | | | | 4.52 | | | | 32,024 | | | | 979 | | | | 3.06 | |
Debt securities in issue – UK | | | 57,140 | | | 3,060 | | | 5.36 | | | | 45,829 | | | | 2,210 | | | | 4.82 | | | | 42,745 | | | | 1,771 | | | | 4.14 | |
| – Overseas | | | 50,064 | | | 2,650 | | | 5.29 | | | | 25,249 | | | | 1,076 | | | | 4.26 | | | | 19,621 | | | | 633 | | | | 3.23 | |
Subordinated liabilities – UK | | | 23,502 | | | 1,300 | | | 5.53 | | | | 23,873 | | | | 1,226 | | | | 5.14 | | | | 23,948 | | | | 1,117 | | | | 4.66 | |
| – Overseas | | | 4,763 | | | 242 | | | 5.08 | | | | 2,639 | | | | 160 | | | | 6.06 | | | | 2,642 | | | | 154 | | | | 5.83 | |
Internal funding of trading business – UK | | | (68,395 | ) | | (3,307 | ) | | 4.84 | | | | (44,475 | ) | | | (1,893 | ) | | | 4.26 | | | | (37,628 | ) | | | (1,125 | ) | | | 2.99 | |
| – Overseas | | | (7,454 | ) | | (321 | ) | | 4.31 | | | | (4,930 | ) | | | (207 | ) | | | 4.20 | | | | (2,186 | ) | | | (39 | ) | | | 1.78 | |
Total interest-bearing liabilities – banking business (2, 3) | | | 472,248 | | | 20,752 | | | 4.39 | | | | 366,264 | | | | 14,092 | | | | 3.85 | | | | 339,544 | | | | 11,413 | | | | 3.36 | |
– trading business (4) | | | 316,540 | | | | | | | | | | 204,810 | | | | | | | | | | | | 172,744 | | | | | | | | | |
| Total interest-bearing liabilities | | | 788,788 | | | | | | | | | | 571,074 | | | | | | | | | | | | 512,288 | | | | | | | | | |
| Non-interest-bearing liabilities | | | | | | | | | | | | | | | | | | | | | | | | | | | | | | | | | | |
Demand deposits – UK | | | 18,416 | | | | | | | | | | 17,909 | | | | | | | | | | | | 17,484 | | | | | | | | | |
| – Overseas | | | 14,455 | | | | | | | | | | 11,668 | | | | | | | | | | | | 11,181 | | | | | | | | | |
Other liabilities (3, 4) | | | 295,258 | | | | | | | | | | 196,375 | | | | | | | | | | | | 163,147 | | | | | | | | | |
| Shareholders' equity | | | 43,359 | | | | | | | | | | 36,876 | | | | | | | | | | | | 32,948 | | | | | | | | | |
| Total liabilities & shareholders' equity | | | 1,160,276 | | | | | | | | | | 833,902 | | | | | | | | | | | | 737,048 | | | | | | | | | |
| Percentage of liabilities applicable to overseas operations | | | 35.9 | % | | | | | | | | | 32.3 | % | | | | | | | | | | | 33.5 | % | | | | | | | | |
| | Notes: |
| | |
| (1) | The analysis into UK and Overseas has been compiled on the basis of location of office. |
| | |
| (2) | Interest-earning assets and interest-bearing liabilities include the Retail bancassurance assets and liabilities attributable to policyholders. |
| | |
| (3) | Interest income and interest expense do not include interest on financial assets and liabilities designated as at fair value through profit or loss. |
| | |
| (4) | Interest receivable and interest payable on trading assets and liabilities are included in income from trading activities. |
Analysis of change in net interest income – volume and rate analysis
Volume and rate variances have been calculated based on movements in average balances over the period and changes in interest rates on average interest-earning assets and average interest-bearing liabilities. Changes due to a combination of volume and rate are allocated pro rata to volume and rate movements.
| | | 2007 over 2006 | | | 2006 over 2005 | |
| | | Increase/(decrease) due to changes in: | | | Increase/(decrease) due to changes in: | |
| | | Average | | | Average | | | Net | | | Average | | | Average | | | Net | |
| | | volume | | | rate | | | change | | | volume | | | rate | | | change | |
| | | | £m | | | | £m | | | | £m | | | | £m | | | | £m | | | | £m | |
| Interest-earning assets | | | | | | | | | | | | | | | | | | | | | | | | |
| Treasury bills and other eligible bills | | | | | | | | | | | | | | | | | | | | | | | | |
| UK | | | (76 | ) | | | 2 | | | | (74 | ) | | | (48 | ) | | | — | | | | (48 | ) |
| Overseas | | | 2 | | | | — | | | | 2 | | | | 1 | | | | — | | | | 1 | |
| Loans and advances to banks | | | | | | | | | | | | | | | | | | | | | | | | |
| UK | | | 243 | | | | 100 | | | | 343 | | | | 19 | | | | 13 | | | | 32 | |
| Overseas | | | 273 | | | | 116 | | | | 389 | | | | (66 | ) | | | 44 | | | | (22 | ) |
| Loans and advances to customers | | | | | | | | | | | | | | | | | | | | | | | | |
| UK | | | 1,985 | | | | 1,380 | | | | 3,365 | | | | 1,705 | | | | (17 | ) | | | 1,688 | |
| Overseas | | | 3,730 | | | | 339 | | | | 4,069 | | | | 887 | | | | 884 | | | | 1,771 | |
| Debt securities | | | | | | | | | | | | | | | | | | | | | | | | |
| UK | | | (11 | ) | | | 87 | | | | 76 | | | | (183 | ) | | | 61 | | | | (122 | ) |
| Overseas | | | 516 | | | | 46 | | | | 562 | | | | (15 | ) | | | 72 | | | | 57 | |
| Total interest receivable of the banking business | | | | | | | | | | | | | | | | | | | | | | | | |
| UK | | | 2,141 | | | | 1,569 | | | | 3,710 | | | | 1,493 | | | | 57 | | | | 1,550 | |
| Overseas | | | 4,521 | | | | 501 | | | | 5,022 | | | | 807 | | | | 1,000 | | | | 1,807 | |
| | | | 6,662 | | | | 2,070 | | | | 8,732 | | | | 2,300 | | | | 1,057 | | | | 3,357 | |
| Interest-bearing liabilities | | | | | | | | | | | | | | | | | | | | | | | | |
| Deposits by banks | | | | | | | | | | | | | | | | | | | | | | | | |
| UK | | | (706 | ) | | | (135 | ) | | | (841 | ) | | | (44 | ) | | | (157 | ) | | | (201 | ) |
| Overseas | | | (239 | ) | | | 50 | | | | (189 | ) | | | (47 | ) | | | (290 | ) | | | (337 | ) |
| Customer accounts: demand deposits | | | | | | | | | | | | | | | | | | | | | | | | |
| UK | | | (227 | ) | | | (641 | ) | | | (868 | ) | | | (353 | ) | | | (18 | ) | | | (371 | ) |
| Overseas | | | (593 | ) | | | (1 | ) | | | (594 | ) | | | 16 | | | | (158 | ) | | | (142 | ) |
| Customer accounts: savings deposits | | | | | | | | | | | | | | | | | | | | | | | | |
| UK | | | (206 | ) | | | (394 | ) | | | (600 | ) | | | (133 | ) | | | (147 | ) | | | (280 | ) |
| Overseas | | | (318 | ) | | | (158 | ) | | | (476 | ) | | | 37 | | | | (185 | ) | | | (148 | ) |
| Customer accounts: other time deposits | | | | | | | | | | | | | | | | | | | | | | | | |
| UK | | | (962 | ) | | | (432 | ) | | | (1,394 | ) | | | (274 | ) | | | (208 | ) | | | (482 | ) |
| Overseas | | | (488 | ) | | | (158 | ) | | | (646 | ) | | | (140 | ) | | | (517 | ) | | | (657 | ) |
| Debt securities in issue | | | | | | | | | | | | | | | | | | | | | | | | |
| UK | | | (587 | ) | | | (263 | ) | | | (850 | ) | | | (134 | ) | | | (305 | ) | | | (439 | ) |
| Overseas | | | (1,263 | ) | | | (311 | ) | | | (1,574 | ) | | | (209 | ) | | | (234 | ) | | | (443 | ) |
| Subordinated liabilities | | | | | | | | | | | | | | | | | | | | | | | | |
| UK | | | 19 | | | | (93 | ) | | | (74 | ) | | | 4 | | | | (113 | ) | | | (109 | ) |
| Overseas | | | (111 | ) | | | 29 | | | | (82 | ) | | | — | | | | (6 | ) | | | (6 | ) |
| Internal funding of trading business | | | | | | | | | | | | | | | | | | | | | | | | |
| UK | | | 1,129 | | | | 285 | | | | 1,414 | | | | 231 | | | | 537 | | | | 768 | |
| Overseas | | | 109 | | | | 5 | | | | 114 | | | | 81 | | | | 87 | | | | 168 | |
| Total interest payable of the banking business | | | | | | | | | | | | | | | | | | | | | | | | |
| UK | | | (1,540 | ) | | | (1,673 | ) | | | (3,213 | ) | | | (703 | ) | | | (411 | ) | | | (1,114 | ) |
| Overseas | | | (2,903 | ) | | | (544 | ) | | | (3,447 | ) | | | (262 | ) | | | (1,303 | ) | | | (1,565 | ) |
| | | | (4,443 | ) | | | (2,217 | ) | | | (6,660 | ) | | | (965 | ) | | | (1,714 | ) | | | (2,679 | ) |
| Movement in net interest income | | | | | | | | | | | | | | | | | | | | | | | | |
| UK | | | 601 | | | | (104 | ) | | | 497 | | | | 790 | | | | (354 | ) | | | 436 | |
| Overseas | | | 1,618 | | | | (43 | ) | | | 1,575 | | | | 545 | | | | (303 | ) | | | 242 | |
| | | | 2,219 | | | | (147 | ) | | | 2,072 | | | | 1,335 | | | | (657 | ) | | | 678 | |
Business review continued
Non-interest income
| | | 2007 | | | 2006 | | | 2005 | |
| | | | £m | | | | £m | | | | £m | |
| Fees and commissions receivable | | | 8,465 | | | | 7,116 | | | | 6,750 | |
| Fees and commissions payable | | | (2,311 | ) | | | (1,922 | ) | | | (1,841 | ) |
| Income from trading activities | | | 1,327 | | | | 2,675 | | | | 2,343 | |
| Other operating income | | | 4,857 | | | | 3,564 | | | | 2,953 | |
| | | | 12,338 | | | | 11,433 | | | | 10,205 | |
| Insurance premium income | | | 6,398 | | | | 6,243 | | | | 6,076 | |
| Reinsurers’ share | | | (289 | ) | | | (270 | ) | | | (297 | ) |
| | | | 6,109 | | | | 5,973 | | | | 5,779 | |
| | | | 18,447 | | | | 17,406 | | | | 15,984 | |
2007 compared with 2006
Non-interest income increased by 6%, £1,041 million to £18,447 million, including £960 million from the acquisition of ABN AMRO. Good organic growth was offset by write-downs in Global Banking & Markets in respect of US mortgage-related and leveraged finance exposures. Non-interest income represents 59% of total income (2006 – 62%). Excluding general insurance premium income, non-interest income rose by 8%, £905 million to £12,338 million.
Within non-interest income, fees and commissions receivable increased by 19% or £1,349 million, to £8,465 million, while fees and commissions payable increased by 20%, £389 million to £2,311 million.
Income from trading activities was down from £2,675 million to £1,327 million. Interest rate and currency trading activities benefitted from increased volatility and there was good growth from a broadening product range. These improvements were, however, more than offset by credit markets write downs (see credit market exposures on page 24).
Other operating income increased by 36%, £1,293 million to £4,857 million. This was principally due to growth in income from rental and asset-backed activities and principal investments in Corporate Markets.
General insurance premium income, after reinsurance, increased by 2% to £6,109 million with good growth in policies in the core businesses, particularly in Continental Europe.
2006 compared with 2005
Non-interest income increased by £1,422 million, 9% to £17,406 million reflecting strong organic growth in all divisions especially Global Banking & Markets, up 25% and Wealth Management, up 14%. Non-interest income represents 62% of total income (2005 – 62%). Excluding general insurance premium income, non-interest income rose by 12% or £1,228 million to £11,433 million.
Within non-interest income, fees and commissions receivable increased by 5% or £366 million, to £7,116 million, while fees and commissions payable increased by 4%, £81 million to £1,922 million.
Income from trading activities, which primarily arises from providing customers with debt and risk management products in interest rate, currency and credit, was up £332 million, 14%, reflecting increased customer volumes.
Other operating income increased by 21%, £611 million to £3,564 million. This was principally due to growth in income from rental and asset-backed activities and principal investments in Corporate Markets.
General insurance premium income, after reinsurance, rose by 3%, or £194 million to £5,973 million with good growth in motor policies in the UK and Continental Europe.
Credit market exposures
| | | Net exposure at | | | Average | |
| | | 31 December 2007 | | | price | |
| | | | £m | | | % | |
| Super senior tranches of ABS CDOs | | | | | | | |
| High grade CDOs | | | 2,581 | | | | 84 | |
| Mezzanine CDOs | | | 1,253 | | | | 70 | |
| CDO squared | | | — | | | | — | |
| Sub-prime trading inventory | | | | | | | | |
| Investment grade | | | 937 | | | | 79 | |
| Non-investment grade | | | 255 | | | | 54 | |
| Residuals | | | 100 | | | | 50 | |
| Leveraged finance | | | 8,698 | | | | 95 | |
The Group has a leading position in structuring, distributing and trading asset-backed securities (ABS). These activities include buying mortgage-backed securities, including securities backed by US sub-prime mortgages, and repackaging them into collateralised debt obligations (CDOs) for subsequent sale to investors. The Group retains exposure to some of the super senior tranches of these CDOs which are all carried at fair value.
At 31 December 2007 the Group’s exposure to these super senior tranches, net of hedges and write-downs, totalled £2.6 billion to high grade CDOs, which include commercial loan collateral as well as prime and sub-prime mortgage collateral, and £1.3 billion to mezzanine CDOs, which are based primarily on residential mortgage collateral. Both categories of CDO have high attachment points. There was also £1.2 billion of exposure to sub-prime mortgages through a trading inventory of mortgage-backed securities and CDOs and £100 million through securitisation residuals.
In the second half of 2007, rising mortgage delinquencies and expectations of declining house prices in the US led to a deterioration of the estimated value of these exposures. Our valuations of the ABS CDO super senior exposures take into consideration outputs from our proprietary model, observable market benchmarks and prudent valuation adjustments. Trading book exposures and residuals are marked to market on the basis of direct prices, where available, or observable market benchmarks.
Drawn leveraged finance positions totalled £8.7 billion at 31 December 2007. Positions are valued by considering recent syndication prices in the same or similar assets, prices in the secondary loan market, and with reference to relevant indices for credit products such as the LevX, LCDX and ITraxx and CDX credit default swap indices.
| | | Exposure net | |
| | | of hedges at | |
| | | 31 December 2007 | |
| | | | £m | |
| Alt-A | | | | |
| Investment grade | | | 1,972 | |
| Non-investment grade | | | 261 | |
| CLOs | | | 1,386 | |
| Commercial mortgages | | | 8,808 | |
| Financial guarantors | | | 2,547 | |
At 31 December 2007, the Group had £2.2 billion of US Alt-A residential mortgage trading inventory, of which more than 85% is investment grade. Collateralised loan obligation exposures totalled £1.4 billion. Commercial mortgage exposure, consisting of loans originated for the purposes of securitisation, totalled £8.8 billion at 31 December 2007. The portfolio consisted predominantly of commercial mortgages originated in Europe. The Group hedges some of its positions with counterparties including financial guarantors. At 31 December 2007 the Group had £2.5 billion of derivative exposure to financial guarantors. All of the above exposures are carried at fair value.
Business review continued
Operating expenses
| | | 2007 | | | 2006 | | | 2005 | |
| | | | £m | | | | £m | | | | £m | |
| Administrative expenses: | | | | | | | | | | | | |
| Staff costs | | | 7,552 | | | | 6,723 | | | | 5,992 | |
| Premises and equipment | | | 1,766 | | | | 1,421 | | | | 1,313 | |
| Other administrative expenses | | | 3,147 | | | | 2,658 | | | | 2,816 | |
| Total administrative expenses | | | 12,465 | | | | 10,802 | | | | 10,121 | |
| Depreciation and amortisation | | | 1,970 | | | | 1,678 | | | | 1,825 | |
| | | | 14,435 | | | | 12,480 | | | | 11,946 | |
2007 compared with 2006
Operating expenses increased by 16%, £1,955 million to £14,435 million including £1,880 million relating to ABN AMRO. Adjusting for this, operating expenses increased by just £75 million, 1%, reflecting tight cost management and the benefits of the Group’s manufacturing platform. Further improvements in productivity have supported growth in business volumes, and allowed the Group to maintain high levels of customer satisfaction.
The Group’s ratio of operating expenses to total income was 46.4% compared with 44.6% in 2006.
2006 compared with 2005
Operating expenses rose by 4% to £12,480 million to support the strong growth in business volumes.
Staff costs were up £731 million, 12% to £6,723 million reflecting growth and expansion of activities in Corporate Markets, where the number of staff increased by 1,600.
Premises and equipment expenses increased by £108 million, 8% to £1,421 million reflecting the continuation of our branch network improvement programme and ongoing investment in our major operational centres.
Other administrative expenses, down 6%, £158 million to £2,658 million reflected efficiency improvements whilst supporting higher business volumes and lower costs in relation to the integration of Churchill, First Active and Citizens’ acquisitions.
The Group’s ratio of operating expenses to total income was 44.6% compared with 46.1% in 2005.
Integration costs
| | | 2007 | | | 2006 | | | 2005 | |
| | | | £m | | | | £m | | | | £m | |
| Staff costs | | | 18 | | | | 76 | | | | 148 | |
| Premises and equipment | | | 4 | | | | 10 | | | | 39 | |
| Other administrative expenses | | | 26 | | | | 32 | | | | 131 | |
| Depreciation and amortisation | | | 60 | | | | 16 | | | | 140 | |
| | | | 108 | | | | 134 | | | | 458 | |
2007 compared with 2006 and 2005
Integration costs in 2007 were £108 million compared with £134 million in 2006 and £458 million in 2005 comprising amortisation of internally developed software and other expenditure. Software costs were previously written-off as incurred under UK GAAP but under IFRS are now amortised over the expected useful lives of up to five years. All software relating to the NatWest integration was fully amortised by the end of 2005. The balance of integration costs principally relates to the integration of Churchill, First Active and Citizens’ acquisitions, including Charter One which was acquired in August 2004.
Accruals in relation to integration costs are set out below.
| | | At | | | Charge | | | Utilised | | | At | |
| | | 31 December | | | to income | | | during | | | 31 December | |
| | | 2006 | | | statement | | | the year | | | 2007 | |
| | | | £m | | | | £m | | | | £m | | | | £m | |
| Staff costs | | | 23 | | | | 18 | | | | (37 | ) | | | 4 | |
| Premises and equipment | | | — | | | | 4 | | | | (2 | ) | | | 2 | |
| Other | | | 8 | | | | 86 | | | | (93 | ) | | | 1 | |
| | | | 31 | | | | 108 | | | | (132 | ) | | | 7 | |
Business review continued
Impairment losses
| | | 2007 | | | 2006 | | | 2005 | |
| | | | £m | | | | £m | | | | £m | |
| New impairment losses | | | 2,518 | | | | 2,093 | | | | 1,879 | |
| less: recoveries of amounts previously written-off | | | (390 | ) | | | (215 | ) | | | (172 | ) |
| Charge to income statement | | | 2,128 | | | | 1,878 | | | | 1,707 | |
| Comprising: | | | | | | | | | | | | |
| Loan impairment losses | | | 2,106 | | | | 1,877 | | | | 1,703 | |
| Other impairment losses | | | 22 | | | | 1 | | | | 4 | |
| Charge to income statement | | | 2,128 | | | | 1,878 | | | | 1,707 | |
2007 compared with 2006
Impairment losses were £2,128 million compared with £1,878 million. Impairment losses in ABN AMRO in the period since acquisition were £263 million. Adjusting for this, impairment losses fell by £13 million, 1%. This reflected improvement in Corporate Markets and Retail Markets partially offset by higher impairment in Citizens. New impairment losses were up 20%, £425 million to £2,518 million. Recoveries of amounts previously written-off were up £175 million, 81% to £390 million. Consequently the net charge to the income statement was up £250 million, 13% to £2,128 million.
Total balance sheet provisions for impairment, including ABN AMRO, amounted to £6,441 million compared with £3,935 million in 2006.
Total provision coverage (the ratio of total balance sheet provisions for impairment to total risk elements in lending) decreased from 62% to 60%. The ratio of total balance sheet provisions for impairment to total risk elements in lending and potential problem loans also decreased to 56% compared with 62% in 2006. This reflects amounts written-off and the slightly lower risk profile of the portfolio.
2006 compared with 2005
Impairment losses were £1,878 million compared with £1,707 million in 2005. New impairment losses were up 11%, £214 million to £2,093 million. Recoveries of amounts previously written-off were up £43 million, 25% to £215 million. Consequently the net charge to the income statement was up £171 million, 10% to £1,878 million. Improvements in Corporate Markets reflecting a benign credit environment partly offset higher impairment losses in Retail Markets and Citizens.
Total balance sheet provisions for impairment amounted to £3,935 million compared with £3,887 million in 2005.
Total provision coverage (the ratio of total balance sheet provisions for impairment to total risk elements in lending) decreased from 65% to 62%. The ratio of total balance sheet provisions for impairment to total risk elements in lending and potential problem loans also decreased to 62% compared with 65% in 2005. This reflects amounts written-off and the changing mix from unsecured to secured exposure.
Taxation
| | | 2007 | | | 2006 | | | 2005 | |
| | | | £m | | | | £m | | | | £m | |
| Tax | | | 2,052 | | | | 2,689 | | | | 2,378 | |
| | | | | | | | | | |
| | | % | | | % | | | % | |
| UK corporation tax rate | | | 30.0 | | | | 30.0 | | | | 30.0 | |
| Effective tax rate | | | 20.7 | | | | 29.3 | | | | 30.0 | |
The actual tax charge differs from the expected tax charge computed by applying the standard rate of UK corporation tax as follows:
| | | 2007 | | | 2006 | | | 2005 | |
| | | | £m | | | | £m | | | | £m | |
| Expected tax charge | | | 2,970 | | | | 2,756 | | | | 2,381 | |
| Non-deductible items | | | 263 | | | | 288 | | | | 309 | |
| Non-taxable items | | | (595 | ) | | | (251 | ) | | | (166 | ) |
| Taxable foreign exchange movements | | | 16 | | | | 5 | | | | (10 | ) |
| Reduction in deferred tax liability following change in the rate of UK Corporation Tax | | | (189 | ) | | | — | | | | — | |
| Foreign profits taxed at other rates | | | (37 | ) | | | 63 | | | | 77 | |
| Unutilised losses – brought forward and carried forward | | | (9 | ) | | | 14 | | | | (5 | ) |
| Adjustments in respect of prior periods | | | (367 | ) | | | (186 | ) | | | (208 | ) |
| Actual tax charge | | | 2,052 | | | | 2,689 | | | | 2,378 | |
The effective tax rate for the year was 20.7% (2006 – 29.3%; 2005 – 30.0%) . The headline rate is lower than the standard rate of UK corporation tax of 30% principally due to certain non-taxable capital gains, changes to deferred tax balances following the change in rate of corporation tax and release of tax provisions following the finalisation of prior year issues.
Business review continued
Divisional performance
The following discussion reflects the organization of the Group's operations as at 31 December 2007.
The profit of each division before amortisation of purchased intangible assets, integration costs and net gain on sale of strategic investments and subsidiaries and after allocation of manufacturing costs where appropriate (“Operating profit before tax”) are shown below. The Group continues to manage costs where they arise, with customer-facing divisions controlling their direct expenses whilst Manufacturing is responsible for shared costs. The Group does not allocate these shared costs between divisions in the day-to-day management of its businesses, and the way in which divisional results are presented reflects this. The results below include an allocation of Manufacturing costs to the customer-facing divisions on a basis management considers to be reasonable.
| | | 2007 | | | 2006 | | | 2005 | |
| | | | £m | | | | £m | | | | £m | |
| Global Banking & Markets | | | 3,687 | | | | 3,779 | | | | 3,053 | |
| UK Corporate Banking | | | 1,961 | | | | 1,762 | | | | 1,571 | |
| Retail Markets | | | | | | | | | | | | |
| - Retail | | | 2,470 | | | | 2,250 | | | | 2,207 | |
| - Wealth Management | | | 413 | | | | 318 | | | | 249 | |
| Total Retail Markets | | | 2,883 | | | | 2,568 | | | | 2,456 | |
| Ulster Bank | | | 513 | | | | 421 | | | | 361 | |
| Citizens | | | 1,323 | | | | 1,582 | | | | 1,575 | |
| RBS Insurance | | | 683 | | | | 749 | | | | 727 | |
| Manufacturing | | | - | | | | - | | | | - | |
| Central Items | | | (896 | ) | | | (1,447 | ) | | | (1,492 | ) |
| RFS Holdings excluding minority interests | | | (115 | ) | | | - | | | | - | |
| RFS Holdings minority interests | | | 243 | | | | - | | | | - | |
| Profit before amortisation of purchased intangible assets, integration costs and net gain on sale of strategic investments and subsidiaries | | | 10,282 | | | | 9,414 | | | | 8,251 | |
| Amortisation of purchased intangible assets | | | (274 | ) | | | (94 | ) | | | (97 | ) |
| Integration costs | | | (108 | ) | | | (134 | ) | | | (458 | ) |
| Net gain on sale of strategic investments and subsidiaries | | | - | | | | - | | | | 240 | |
| Operating profit before tax | | | 9,900 | | | | 9,186 | | | | 7,936 | |
The performance of each of the divisions is reviewed on pages 30 to 45.
Business review continued
Corporate Markets – Global Banking & Markets
| | | 2007 | | | 2006 | | | 2005 | |
| | | | £m | | | | £m | | | | £m | |
| Net interest income from banking activities | | | 1,544 | | | | 1,632 | | | | 1,487 | |
| Funding costs of rental assets | | | (495 | ) | | | (519 | ) | | | (452 | ) |
| Net interest income | | | 1,049 | | | | 1,113 | | | | 1,035 | |
| Net fees and commissions receivable | | | 1,193 | | | | 895 | | | | 704 | |
| Income from trading activities | | | 1,006 | | | | 2,348 | | | | 2,061 | |
| Income from rental assets | | | 1,174 | | | | 1,196 | | | | 1,074 | |
| Other operating income | | | 2,158 | | | | 1,279 | | | | 744 | |
| Non-interest income | | | 5,531 | | | | 5,718 | | | | 4,583 | |
| Total Income | | | 6,580 | | | | 6,831 | | | | 5,618 | |
| Direct expenses | | | | | | | | | | | | |
| - staff costs | | | 1,826 | | | | 1,975 | | | | 1,518 | |
| - other | | | 518 | | | | 442 | | | | 371 | |
| - operating lease depreciation | | | 365 | | | | 406 | | | | 398 | |
| | | | 2,709 | | | | 2,823 | | | | 2,287 | |
| Impairment losses | | | 39 | | | | 85 | | | | 139 | |
| Contribution | | | 3,832 | | | | 3,923 | | | | 3,192 | |
| Allocation of Manufacturing costs | | | 145 | | | | 144 | | | | 139 | |
| Operating profit before tax | | | 3,687 | | | | 3,779 | | | | 3,053 | |
| | | £bn | | | £bn | | | £bn | |
| Total assets* | | | 579.4 | | | | 383.7 | | | | 330.9 | |
| Loans and advances to customers - gross* | | | | | | | | | | | | |
| - banking book | | | 121.1 | | | | 94.3 | | | | 82.0 | |
| - trading book | | | 20.0 | | | | 15.4 | | | | 11.8 | |
| Rental assets | | | 10.2 | | | | 12.2 | | | | 11.9 | |
| Customer deposits* | | | 72.9 | | | | 54.1 | | | | 44.7 | |
| Risk-weighted assets | | | 152.6 | | | | 138.1 | | | | 120.0 | |
* excluding repos and reverse repos
2007 compared with 2006
Global Banking & Markets (GBM) achieved strong performances in many of its businesses in 2007, with particularly strong growth in interest rate and currency trading activities, but financial results were held back by challenging credit market conditions in the second half of the year. Operating profit before tax was £3,687 million, 2% lower than 2006’s record result.
While many parts of GBM grew strongly, total income of £6,580 million was 4% lower than in 2006, reflecting both cumulative 2007 write-downs of our sub-prime-related and leveraged finance positions and an additional £456 million in response to the weakening credit profile of certain financial guarantors.
These losses were partially offset by a reduction of £123 million in the carrying value of our own debt and by a gain of £950 million realised on the sale of Southern Water. The resulting reduction in profit, net of write-downs, gains and variable costs, was £484 million. Excluding these effects, underlying income rose by 8% and underlying operating profit by 10%, reflecting the business’s continued operating momentum.
The strength of GBM and the successful diversification of its product capabilities resulted in a continuation of the strong growth we have achieved in Asia and continental Europe in recent years. In Asia we have now established a solid platform, with good product capabilities and client relationships. In 2007 this resulted in Asian income growing by 96%, with outstanding growth in our activities in China and Japan. In Europe, income grew by 39%, with particularly good results in the Nordic region and in the Iberian Peninsula, where GBM further expanded its strong position in the provision of financing and risk management services to corporates and financial institutions. Income in the UK grew by 21%, while results in North America declined as a result of credit market conditions affecting GBM’s asset-backed and structured credit businesses.
Net interest income fell by 6% to £1,049 million. Average loans and advances to customers, excluding reverse repos, increased by 22% as we expanded our customer base outside the UK and average customer deposits increased by 25%.
Net fee income rose by 33% to £1,193 million, reflecting our top tier position in arranging, structuring and distributing large scale financings. We achieved particularly strong growth in non-US loan markets.
Income from trading activities declined by £1,342 million. Interest rate and currency trading activities took advantage of increased volatility leading to income growth of 78% and 48% respectively. These strong performances were supplemented by good growth in our broadening product range, including equity derivatives and retail investor products. However, in credit markets, write-downs reflecting the weakening of the US housing market led to a sharp fall in income.
Rental and other asset-based activities achieved continuing success in originating, structuring, financing and managing physical assets such as aircraft, trains, ships and real estate for our customers. Income from rental assets decreased by 2% to £1,174 million.
Other operating income increased to £2,158 million, including the successful sale of Southern Water concluded during the second half. The majority of our remaining private equity portfolio has been sold into a fund, managed by RBS, thereby improving capital efficiency while offering more predictable and stable returns.
Costs were reduced by 4% to £2,854 million, in line with income. We continued to invest in expanding our geographical footprint, our infrastructure and our product range.
Portfolio credit risk remained stable and impairment losses declined to £39 million in 2007, with no deterioration in overall corporate credit quality. The liquidity and profitability of our corporate customers remains generally strong.
Total assets increased to £579.4 billion, primarily reflecting an increase of £128.8 billion in derivative assets (mostly rates and currencies) accompanied by a corresponding increase in derivative liabilities. The increase was a result of the strong growth in client-driven interest rate and currency trading activities in a more volatile market environment. Careful risk and capital management held our risk-weighted assets to £152.6 billion, an increase of 10% over the prior year.
2006 compared with 2005
Global Banking & Markets performed strongly in 2006, delivering excellent growth in income while continuing to build our strong international franchise. Total income rose by 22% to £6,831 million, contribution by 23% to £3,923 million and operating profit before tax by 24% to £3,779 million.
GBM is a leading provider of debt financing and risk management solutions covering the origination, structuring and distribution of a wide range of assets. In 2006 we arranged over $450 billion of financing for our corporate and institutional customers, up 17% from 2005. We ranked first among managers of global asset-backed and mortgage-backed securitisations and fourth among managers of global syndicated loans, while among managers of international bonds we moved from thirteenth place to eighth. These league table positions demonstrate our success in broadening and deepening our franchise.
In 2006 we have further invested in extending our product capabilities and our worldwide reach. Income in North America rose by 18% in local currency, despite flat revenues in our US residential mortgage-backed securities business, as the investments we have made in our debt capital markets, loan markets, rates and credit trading businesses have borne fruit.
In Europe, income increased by 26% in local currency as a result of good performances in Germany, France, Spain, Italy and the Nordic region. We participated in many of the largest cross-border financings in 2006. Asia-Pacific, too, showed marked progress, with income increasing by 35% in US dollar terms. We have established a promising presence in the region, building our product capability and client relationships.
Net interest income rose by 8% to £1,113 million, representing 16% of total GBM income. Average loans and advances to customers increased by 20% as we further expanded our customer base outside the UK.
Net fee income rose by 27% to £895 million, reflecting our top tier position in arranging, structuring and distributing large scale private and public financings. We have increased our customer penetration, and in 2006 were the third most active underwriter of bonds for European, including UK, corporates.
Income from trading activities continued to grow steadily, rising by 14% to £2,348 million as a result of good volumes of debt and risk management products provided to our customers. A strong performance in credit products was supplemented by growth in our broadening product range, including equity derivatives and structured credit, partially offset by the impact of a slower US mortgage-backed securities market. Average trading book value at risk remained modest at £14.2 million.
Our rental and other asset-based activities have achieved continuing success in originating, structuring, financing and managing physical assets such as aircraft, trains, ships and real estate for our customers. This success has driven good growth in income from rental assets, which increased to £1,196 million from £1,074 million.
These businesses also generate value through the ownership of a portfolio of assets which we manage actively. Good results from these activities, as well as from principal investments where we work with our corporate customers and with financial sponsors, leveraging our financial capability to structure and participate in a wide variety of investment opportunities, were reflected in other operating income, which increased to £1,279 million from £744 million in 2005.
We have maintained good cost discipline while continuing to invest in extending our geographical footprint, our infrastructure and our product range. Total expenses grew by 22% to £2,967 million. Variable performance-related compensation increased and now accounts for 41% of total costs.
Portfolio risk remained stable and the corporate credit environment remained benign. Impairment losses fell to £85 million, with the distribution of impairments over the course of the year reflecting recoveries in the first half.
Average risk-weighted assets grew by 11% and the ratio of operating profit to average risk-weighted assets improved from 2.6% to 2.9%.
Business review continued
Corporate Markets – UK Corporate Banking
| | | 2007 | | 2006 | | 2005 | |
| | | | £m | | | £m | | | £m | |
| Net interest income | | | 2,260 | | | 2,115 | | | 1,906 | |
| Non-interest income | | | 1,482 | | | 1,347 | | | 1,266 | |
| Total income | | | 3,742 | | | 3,462 | | | 3,172 | |
| Direct expenses | | | | | | | | | | |
| - staff costs | | | 631 | | | 564 | | | 489 | |
| - other | | | 214 | | | 186 | | | 165 | |
- operating lease depreciation | | | 319 | | | 330 | | | 335 | |
| | | | 1,164 | | | 1,080 | | | 989 | |
| Impairment losses | | | 180 | | | 189 | | | 196 | |
| Contribution | | | 2,398 | | | 2,193 | | | 1,987 | |
| Allocation of Manufacturing costs | | | 437 | | | 431 | | | 416 | |
| Operating profit before tax | | | 1,961 | | | 1,762 | | | 1,571 | |
| | | £bn | | £bn | | £bn | |
| Total assets* | | | 102.7 | | | 88.7 | | | 78.3 | |
| Loans and advances to customers - gross* | | | 100.6 | | | 86.8 | | | 76.7 | |
| Customer deposits* | | | 86.6 | | | 78.5 | | | 66.4 | |
| Risk-weighted assets | | | 104.6 | | | 93.1 | | | 82.6 | |
* excluding repos and reverse repos
2007 compared with 2006
UK Corporate Banking (‘UKCB’) had another successful year of profitable growth, building further on our market-leading position and achieving significant improvements in customer satisfaction. Total income rose by 8% to £3,742 million and contribution by 9% to £2,398 million. Operating profit before tax rose by 11% to £1,961 million.
There has been good growth in customer volumes, with average loans and advances up 11% and average deposits up 14%. Net interest income increased by 7% to £2,260 million as net interest margin narrowed slightly from the prior year. In recent months we have seen firmer margins in some areas.
Non-interest income rose by 10% to £1,482 million, as a result of growth in fees and continued progress in the distribution of trade and invoice finance products as well as of interest rate and foreign exchange products.
Total expenses rose by 6% to £1,601 million, with investment targeted towards improving customer service. Around 600 new front line roles were created and major new functionality was added to the Bankline electronic banking platform. These initiatives have contributed to strongly favourable customer satisfaction scores in 2007.
Impairment losses totalled £180 million, 5% lower than in 2006, reflecting the strong quality of the portfolio. Corporate credit metrics remained stable.
2006 compared with 2005
UK Corporate Banking had a successful year across all its businesses, strengthening its market leading positions in corporate and commercial banking and building good momentum in the provision of a broadening range of financing and risk management services to its customer base. As a result UKCB increased its total income by 9% to £3,462 million and contribution by 10% to £2,193 million. Operating profit before tax rose by 12% to £1,762 million.
Net interest income grew by 11% to £2,115 million. We achieved an 18% increase in average loans and advances to customers, with good growth across all customer segments. We increased average customer deposits by 21%, demonstrating the attractiveness of our range of deposit products for commercial and corporate customers. Changes in the deposit mix and some narrowing of lending margins, principally in the first half of the year, led to a modest decline in UKCB’s net interest margin.
Non-interest income rose by 6% to £1,347 million, reflecting good growth in origination fees and improved distribution of trade and invoice finance and interest rate and foreign exchange products.
Total expenses rose by 8% to £1,511 million. The increase in direct expenses, excluding operating lease depreciation, reflected the recruitment of additional relationship managers and other staff to strengthen the quality of service provided to our expanding customer base, as well as further investment in our electronic banking proposition.
Impairment losses were 4% lower than in 2005 at £189 million. Portfolio risk remained stable and the credit environment benign.
Retail Markets
| | | 2007 | | 2006 | | 2005 | |
| | | | £m | | | £m | | | £m | |
| Net interest income | | | 4,760 | | | 4,604 | | | 4,404 | |
| Non-interest income | | | 4,030 | | | 3,851 | | | 3,678 | |
| Total income | | | 8,790 | | | 8,455 | | | 8,082 | |
| Direct expenses | | | | | | | | | | |
| – staff costs | | | 1,699 | | | 1,616 | | | 1,539 | |
| – other | | | 742 | | | 748 | | | 788 | |
| | | | 2,441 | | | 2,364 | | | 2,327 | |
| Insurance net claims | | | 518 | | | 488 | | | 486 | |
| Impairment losses | | | 1,200 | | | 1,311 | | | 1,148 | |
| Contribution | | | 4,631 | | | 4,292 | | | 4,121 | |
| Allocation of Manufacturing costs | | | 1,748 | | | 1,724 | | | 1,665 | |
| Operating profit before tax | | | 2,883 | | | 2,568 | | | 2,456 | |
| | | | | | | | |
| | | £bn | | £bn | | £bn | |
| Total banking assets | | | 125.1 | | | 118.4 | | | 113.0 | |
| Loans and advances to customers – gross | | | | | | | | | | |
| – mortgages | | | 72.0 | | | 69.7 | | | 64.6 | |
| – personal | | | 21.5 | | | 20.5 | | | 21.0 | |
| – cards | | | 8.4 | | | 8.2 | | | 8.7 | |
| – business | | | 20.2 | | | 18.1 | | | 16.7 | |
| Customer deposits* | | | 130.4 | | | 115.5 | | | 105.2 | |
| Investment management assets – excluding deposits | | | 42.1 | | | 34.9 | | | 31.4 | |
| Risk-weighted assets | | | 80.8 | | | 77.0 | | | 79.2 | |
* customer deposits exclude bancassurance
2007 compared with 2006
Retail Markets delivered a strong performance in 2007 with operating profit rising by 12% to £2,883 million as a result of good income growth, tight expense control and reduced impairment costs. Total income rose 4% to £8,790 million, and income net of claims also grew by 4% to £8,272 million.
These strong results reflect the emphasis on savings and investment products, our focus on profitability rather than volume in consumer lending, and significant investment in our Wealth Management business in the UK and Asia. Customer deposits increased by 13% to £130.4 billion, while loans and advances grew by 5% to £122.1 billion.
The full year results show momentum developing in the business, with operating profit before tax in the second half of the year 14% higher than in the same period of 2006.
Expenses have been kept under tight control, with efficiency gains allowing us to invest and grow the business. Impairment losses maintained the improvement witnessed in the first half of the year, falling by 8% for the year as a whole. Arrears trends on credit cards and unsecured personal loans continued to improve, as did the quality of our asset base.
Risk-weighted assets rose by 5% to £80.8 billion at the end of 2007.
2006 compared with 2005
Retail Markets achieved a good performance in 2006, with total income rising by 5% to £8,455 million. Contribution increased by 4% to £4,292 million and operating profit before tax by 5% to £2,568 million.
Responding to evolving demand from its customers, Retail Markets has added to its capabilities in deposits and investment products and has been rewarded by strong growth in these areas. Lending growth has been centred on high quality residential mortgages and small business loans, while personal unsecured lending was flat, as we limited our activity in the direct loans market and customer demand remained subdued. We have used our full range of brands to address markets flexibly, focusing on the most appropriate products and channels in the light of prevailing market conditions. Expenses have been kept under tight control, with additional investment in our business offset by efficiency gains and the benefits of combining Retail Banking and Direct Channels into a unified business.
Customer recruitment has been centred on our branch channels, where we have achieved good growth in savings accounts and are joint market leader for personal current accounts. Our commitment to customer service, through the largest network of branches and ATMs in the UK, is reflected in our industry-leading customer satisfaction ratings.
Average risk-weighted assets fell by 3%, reflecting a change in business mix toward mortgage lending as well as careful balance sheet management, including increased use of securitisations.
Business review continued
Retail
| | | 2007 | | 2006 | | 2005 | |
| | | | £m | | | £m | | | £m | |
| Net interest income | | | 4,191 | | | 4,108 | | | 3,965 | |
| Non-interest income | | | 3,571 | | | 3,458 | | | 3,333 | |
| Total income | | | 7,762 | | | 7,566 | | | 7,298 | |
| Direct expenses | | | | | | | | | | |
| – staff costs | | | 1,361 | | | 1,317 | | | 1,281 | |
| – other | | | 614 | | | 621 | | | 663 | |
| | | | 1,975 | | | 1,938 | | | 1,944 | |
| Insurance net claims | | | 518 | | | 488 | | | 486 | |
| Impairment losses | | | 1,196 | | | 1,310 | | | 1,135 | |
| Contribution | | | 4,073 | | | 3,830 | | | 3,733 | |
| Allocation of Manufacturing costs | | | 1,603 | | | 1,580 | | | 1,526 | |
| Operating profit before tax | | | 2,470 | | | 2,250 | | | 2,207 | |
| | | | | | | | | | | |
| | | £bn | | £bn | | £bn | |
| Total banking assets | | | 111.1 | | | 107.4 | | | 102.9 | |
| Loans and advances to customers – gross | | | | | | | | | | |
| – mortgages | | | 67.3 | | | 65.6 | | | 61.1 | |
| – personal | | | 17.3 | | | 17.2 | | | 17.2 | |
| – cards | | | 8.3 | | | 8.1 | | | 8.6 | |
| – business | | | 18.7 | | | 16.9 | | | 16.3 | |
| Customer deposits* | | | 96.5 | | | 87.1 | | | 79.8 | |
| Risk-weighted assets | | | 73.3 | | | 70.6 | | | 73.2 | |
* customer deposits exclude bancassurance
2007 compared with 2006
Retail achieved strong results in 2007, increasing operating profit by 10% to £2,470 million as a result of good income growth in both consumer and business banking combined with tight cost control and a reduction in impairment losses. Total income grew by 3% to £7,762 million, while income net of claims grew by 2% to £7,244 million and contribution by 6% to £4,073 million.
We have accelerated the expansion of our consumer banking franchise, opening more than 975,000 new personal current accounts in 2007 and maintaining the Group’s joint number one position in the current account market. RBS and NatWest continue to lead the other major high street banks in Great Britain for customer satisfaction. We continue to focus on sales through the branch channel, and by adding more customer advisers in our branches have achieved a significant uplift in volumes.
Bancassurance continued its excellent progress with sales growth of 28% to £342 million annual premium equivalent, representing a doubling of 2005 sales. We invested further in our sales force, ending the year with more than 1,000 financial planning managers.
In business banking we strengthened our management team and improved operational processes, producing good results. During 2007 we placed an additional 500 business managers back in branches, launched additional products to support the start-up market, and added new roles supporting ethnic minorities, women in business and community banking.
In our cards and direct finance business, we have maintained our focus on credit card sales through the branch channel, where new business sales were up 47% on 2006, while continuing to take a cautious view on direct sales. Our cards acquiring business continued to grow market share, strengthening its market leading position with an 11% increase in transactions in 2007.
Average customer deposit balances were 9% higher, driven by accelerating growth in both personal savings, up 12%, and business deposits, up 11%, alongside modest growth in current account balances. Savings balance growth was helped by good sales of new accounts to branch customers, with NatWest opening more than 1 million new savings accounts.
Average loans and advances to customers increased by 3%, with average mortgage lending up 5% and average business lending up 9%. Mortgage activity focused on branch channels, where net lending was 14% higher than in the previous year. We also took advantage of improved margins in the intermediary segment in the latter part of the year to improve volumes. Direct loan balances declined over the year as we maintained our strategy of focussing unsecured personal lending on profitability rather than volume, although we continued to grow lending through the branch channel. After a decline in credit card balances in the first half of the year we improved recruitment and retention in the second half.
Net interest income increased by 2% to £4,191 million, with strong growth in deposits helping to mitigate the impact of lower unsecured lending volumes and lower average card
balances. Net interest margin declined modestly, in line with previous guidance, with savings margins consistent with 2006, despite increased competition for deposits.
Non-interest income was £3,571 million, 3% ahead of 2006, with strong growth in investment income offset by lower levels of direct lending and reduced instances of current account fees.
Total expenses rose by 2% to £3,578 million, driven by increased investment in customer-facing staff in branches and in our bancassurance and investment businesses. Other costs reduced by 1% to £614 million.
Impairment losses decreased by 9% to £1,196 million, reflecting the improvement in arrears trends on both credit cards and unsecured personal loans. Mortgage arrears remained very low, and we have maintained conservative lending criteria – the average loan-to-value ratio of Retail’s mortgages was 46% overall and 63% on new mortgages written in 2007, and this improved as the year progressed. Small business credit quality remained good.
2006 compared with 2005
Retail has delivered a good performance in 2006, achieving 4% growth in total income to £7,566 million. Contribution was up by 3% to £3,830 million, and operating profit before tax by 2% to £2,250 million.
We have advanced in personal banking, with good growth in savings and investment products combined with effective cost control and improvements in the quality of our lending book. Credit card recruitment and unsecured personal lending continues to be focused on lower risk segments, with reduced emphasis on acquisition through direct marketing.
We have continued to expand our customer franchise, growing our personal current account base by 232,000 in 2006 as a result of our sustained focus on quality and customer service. We continue to have the highest share of customers switching current accounts from other banks, and are now joint leader in the personal current account market. RBS is first and NatWest is joint second among major high street banks in Great Britain for the percentage of main current account customers that are “extremely satisfied” overall.
Net interest income increased by 4% to £4,108 million, with faster growth in deposits helping to mitigate lower unsecured lending volumes. Net interest margin improved slightly in the second half.
Average customer deposit balances were 9% higher, driven by personal savings balances up 12% and accelerating growth in business deposits, up 7%. Average mortgage lending was up 8%, with stronger volumes in the second half leading to a 7% market share of net lending in that period. Our offset mortgage product continues to perform well. For the year as a whole, average personal unsecured lending and credit card lending was flat, reflecting the slower UK consumer demand and our concentration on quality business with existing customers. In the second half we further reduced our activity in the direct loans market, but unsecured balances from our RBS and NatWest customers are broadly in line with the first half. Average business lending rose 5%, reflecting our cautious credit stance.
Non-interest income rose by 4% to £3,458 million. There was strong growth in our investments and private banking businesses as well as business banking fees, mitigating the slowdown in personal loan related insurance income.
Despite investments for future growth, total expenses rose by just 1%, to £3,518 million, whilst direct expenses were held flat at £1,938 million. Staff costs increased by 3% to £1,317 million, reflecting sustained investment in customer service and the expansion of our bancassurance and investment businesses. We continue to make efficiency gains as a result of the consolidation of our retail businesses. Other costs, such as marketing expenses, fell by 6% to £621 million, also benefiting from consolidation.
Impairment losses increased by 15% to £1,310 million, but were lower in the second half of the year than in the first. The year-on-year change in impairment losses slowed from 19% in the first half to 12% in the second half. Credit card arrears have stabilised, while the rate of increase in arrears on unsecured personal loans continued to slow. Mortgage arrears remain very low – the average loan-to-value ratio of Retail’s mortgages was 46% overall and 64% on new mortgages written in 2006. Small business credit quality remains steady.
Bancassurance
Bancassurance has had an excellent year with sales increasing by 56% to £267 million annual premium equivalent. The growth reflects the continued increase in focus on the recruitment of Financial Planning Managers, up 25% and productivity levels, up 43%. Increased sales of collective investments on the back of a successful ISA season and strong individual pensions growth, boosted by A-Day, helped underpin the outturn. Sales of guaranteed bonds were also particularly strong, and helped support a new business margin which improved significantly over the period. The product proposition was strengthened across all lines. Latest market share data shows an increase from 6.6% to 9.0% . On a UK GAAP embedded value basis for life assurance, investment contracts and open ended investment companies, adjusted for investment market volatility, pre tax profit was £78 million compared with £42 million in 2005.
Net claims, which include maturities, surrenders and liabilities to policyholders, were stable at £488 million compared with £486 million in 2005.
Business review continued
Wealth Management
| | | 2007 | | 2006 | | 2005 | |
| | | | £m | | | £m | | | £m | |
| Net interest income | | | 569 | | | 496 | | | 439 | |
| Non-interest income | | | 459 | | | 393 | | | 345 | |
| Total income | | | 1,028 | | | 889 | | | 784 | |
| Direct expenses | | | | | | | | | | |
| – staff costs | | | 338 | | | 299 | | | 258 | |
| – other | | | 128 | | | 127 | | | 125 | |
| | | | 466 | | | 426 | | | 383 | |
| Impairment losses | | | 4 | | | 1 | | | 13 | |
| Contribution | | | 558 | | | 462 | | | 388 | |
| Allocation of Manufacturing costs | | | 145 | | | 144 | | | 139 | |
| Operating profit before tax | | | 413 | | | 318 | | | 249 | |
| | | | | | | | |
| | | £bn | | £bn | | £bn | |
| Loans and advances to customers – gross | | | 10.5 | | | 8.8 | | | 7.8 | |
| Investment management assets – excluding deposits | | | 35.1 | | | 28.2 | | | 25.4 | |
| Customer deposits | | | 33.9 | | | 28.4 | | | 25.4 | |
| Risk-weighted assets | | | 7.5 | | | 6.4 | | | 6.0 | |
2007 compared with 2006
Wealth Management’s offering of private banking and investment services continued to deliver very strong growth in income, up 16% in 2007 to £1,028 million. Contribution grew by 21% to £558 million and operating profit before tax by 30% to £413 million.
We have continued Coutts & Co’s UK regional expansion programme, and this has helped us to grow customer numbers by 7% and income by 22%. Outside the UK, Coutts International has been re-branded as RBS Coutts to leverage the global brand strength of the Group in the continental European and Asia-Pacific markets and RBS Coutts has maintained its momentum in the Asia-Pacific region, succeeding in growing customer numbers by 27% and income by 51% in US dollar terms.
Growth in banking volumes contributed to a 15% rise in net interest income to £569 million. Average loans and advances to customers rose by 13% and average deposits by 17%.
Non-interest income grew by 17% to £459 million, reflecting higher investment management fees and new product sales, including new investment vehicles specialising in private equity and natural resources, as well as continued growth in underlying new business volumes, particularly in the UK and Asia. Assets under management rose to £35.1 billion at 31 December 2007, up 24% from a year earlier.
Total expenses rose by 7% to £611 million, with direct expense up 9% at £466 million, reflecting continued investment in the UK and continental Europe along with a further significant expansion of our team of private bankers in Asia. Total headcount increased by 12%.
2006 compared with 2005
Wealth Management delivered strong growth, with total income rising by 13% to £889 million. Contribution grew by 19% to £462 million and operating profit before tax by 28% to £318 million.
Wealth Management’s offering of private banking and investment services delivered robust organic income growth in 2006. Our continuing investment in Coutts UK, Adam & Company and our offshore businesses helped us to achieve an overall increase in client numbers of 5%. Coutts UK customers rose by 9%. Outside the UK, Coutts International was successful in the Asia-Pacific region in recruiting additional experienced private bankers. We grew customer numbers in the region by 13% and income by 24%.
Growth in banking volumes contributed to a 13% rise in net interest income to £496 million. Average loans and advances to customers rose by 14% and average deposits by 10%, with net interest margin maintained at close to 2005 levels.
Non-interest income grew by 14% to £393 million, reflecting higher investment management fees and performance fees, as well as strong growth in new business volumes, particularly in the UK. Assets under management rose by 11%, to £28.2 billion at the year-end.
Total expenses rose by 9% to £570 million. In a highly competitive recruitment market, headcount was successfully increased by 7%, reflecting our continued investment in the UK and further expansion in Asia.
Impairment losses returned to historic levels, following a number of specific items in prior years.
Ulster Bank
| | | 2007 | | 2006 | | 2005 | |
| | | | £m | | | £m | | | £m | |
| Net interest income | | | 923 | | | 812 | | | 713 | |
| Non-interest income | | | 374 | | | 313 | | | 290 | |
| Total income | | | 1,297 | | | 1,125 | | | 1,003 | |
| Direct expenses | | | | | | | | | | |
| – staff costs | | | 302 | | | 254 | | | 217 | |
| – other | | | 159 | | | 131 | | | 122 | |
| | | | 461 | | | 385 | | | 339 | |
| Impairment losses | | | 104 | | | 104 | | | 95 | |
| Contribution | | | 732 | | | 636 | | | 569 | |
| Allocation of Manufacturing costs | | | 219 | | | 215 | | | 208 | |
| Operating profit before tax | | | 513 | | | 421 | | | 361 | |
| | | | | | | | |
| | | £bn | | £bn | | £bn | |
| Total assets | | | 54.8 | | | 44.5 | | | 37.2 | |
| Loans and advances to customers – gross | | | | | | | | | | |
| – mortgages | | | 18.3 | | | 15.0 | | | 13.2 | |
| – corporate | | | 24.8 | | | 19.6 | | | 13.7 | |
| – other | | | 4.0 | | | 3.6 | | | 2.6 | |
| Customer deposits | | | 21.8 | | | 18.1 | | | 15.9 | |
| Risk-weighted assets | | | 36.0 | | | 29.7 | | | 23.8 | |
| Average exchange rate – €/£ | | | 1.461 | | | 1.467 | | | 1.463 | |
| Spot exchange rate – €/£ | | | 1.361 | | | 1.490 | | | 1.457 | |
2007 compared with 2006
Ulster Bank maintained its success in building its personal and corporate banking business in the island of Ireland, with total income rising by 15% to £1,297 million, contribution by 15% to £732 million and operating profit before tax by 22% to £513 million. These results reflect solid sales growth across all activities, driven by an enhanced range of innovative products and an expanded distribution network.
Net interest income increased by 14% to £923 million, reflecting good growth in both loans and deposits. Average loans and advances to customers increased by 24%, with particular strength in business lending, with a 29% increase spread across a variety of industrial sectors. Our mortgage book also saw very good growth in 2007, in spite of the slowdown in the housing market, with average balances up 17%. We achieved particular success in attracting remortgagers with our Switcher package. We were also successful in the current account switching market, winning 100,000 new current account customers during the year. This, together with new product launches such as the eSavings Account and Reward Reserve savings accounts, contributed to a 17% increase in average customer deposits. Net interest margin tightened, reflecting more competitive market conditions and increased funding costs.
Non-interest income rose by 19% to £374 million, driven by strong performances in Corporate Markets and credit cards. We successfully launched our new wealth business in the course of the year.
Total expenses increased by 13% to £680 million, as we continued our investment programme to support the future growth of the business. We continued to expand our branch and business centre footprint and recruited additional customer-facing staff, particularly in Corporate Markets.
Despite tighter housing market conditions, arrears trends saw no deterioration in 2007 and impairment losses remained stable at £104 million.
Business review continued
2006 compared with 2005
Ulster Bank made strong progress in both personal and corporate banking in the Republic of Ireland and in Northern Ireland, with total income rising by 12% to £1,125 million. Contribution increased by 12% to £636 million and operating profit before tax by 17% to £421 million.
Net interest income increased by 14% to £812 million, reflecting good growth in both loans and customer deposits. Average loans and advances to customers increased by 28%, and average customer deposits by 15%. A principal focus during 2006 was the expansion of our corporate banking franchise, and we succeeded in increasing corporate customer numbers by 7% in the Republic of Ireland and by 4% in Northern Ireland. This contributed to strong growth in both corporate lending, where average loans and advances increased by 32%, and deposits, with Ulster Bank winning a share of new business current accounts well in excess of its historic market share, particularly in the Republic of Ireland. Average mortgage balances grew by 26%, although the rate of growth was slower in the second half when there was some evidence of a more subdued pace of expansion in the mortgage market. The change in business mix resulting from strong growth in corporate lending and mortgages, together with some competitive pressures, led to a modest reduction in net interest margin in the first half, with margin stabilising in the second half.
Non-interest income rose by 8% to £313 million. Ulster Bank achieved good growth in fees from credit cards and ATMs as well as in sales of investment products, which was only partially offset by the introduction of Ulster Bank’s new range of current accounts, which are free of transaction fees.
Total expenses increased by 10% to £600 million, as we continued our investment programme to support the future growth of the business. We recruited additional customer-facing staff, particularly in corporate banking, opened three new business centres and continued with our branch improvement programme. By the end of 2006, 70% of Ulster Bank branches had been upgraded.
During 2006 we successfully completed the migration of our core systems to the RBS Group manufacturing model and, as a result, we now have access to the complete RBS product range.
The credit environment remains benign. Impairment losses rose by £9 million to £104 million, consistent with growth in lending.
Citizens
| | | 2007 | | | 2006 | | | 2005 | | | 2007 | | | 2006 | | | 2005 | |
| | | | £m | | | | £m | | | | £m | | | | $m | | | | $m | | | | $m | |
| Net interest income | | | 1,975 | | | | 2,085 | | | | 2,122 | | | | 3,954 | | | | 3,844 | | | | 3,861 | |
| Non-interest income | | | 1,147 | | | | 1,232 | | | | 1,142 | | | | 2,295 | | | | 2,271 | | | | 2,079 | |
| Total income | | | 3,122 | | | | 3,317 | | | | 3,264 | | | | 6,249 | | | | 6,115 | | | | 5,940 | |
| Direct expenses | | | | | | | | | | | | | | | | | | | | | | | | |
| - staff costs | | | 741 | | | | 803 | | | | 819 | | | | 1,483 | | | | 1,480 | | | | 1,490 | |
| - other | | | 717 | | | | 751 | | | | 739 | | | | 1,437 | | | | 1,385 | | | | 1,344 | |
| | | | 1,458 | | | | 1,554 | | | | 1,558 | | | | 2,920 | | | | 2,865 | | | | 2,834 | |
| Impairment losses | | | 341 | | | | 181 | | | | 131 | | | | 682 | | | | 333 | | | | 239 | |
| Operating profit before tax | | | 1,323 | | | | 1,582 | | | | 1,575 | | | | 2,647 | | | | 2,917 | | | | 2,867 | |
| | £bn | | £bn | | | £bn | | | US$bn | | | US$bn | | | US$bn | |
| Total assets | 80.4 | | | 82.6 | | | | 92.2 | | | | 161.1 | | | | 162.2 | | | | 158.8 | |
| Loans and advances to customers - gross | | | | | | | | | | | | | | | | | | | | | |
| - mortgages | 9.5 | | | 9.5 | | | | 10.9 | | | | 19.1 | | | | 18.6 | | | | 18.8 | |
| - home equity | 17.9 | | | 17.6 | | | | 18.5 | | | | 35.9 | | | | 34.5 | | | | 31.8 | |
| - other consumer | 10.9 | | | 11.7 | | | | 14.4 | | | | 21.7 | | | | 23.2 | | | | 24.8 | |
| - corporate and commercial | 18.7 | | | 16.7 | | | | 17.0 | | | | 37.6 | | | | 32.7 | | | | 29.2 | |
| Customer deposits | 57.4 | | | 54.3 | | | | 61.7 | | | | 115.0 | | | | 106.8 | | | | 106.3 | |
| Customer deposits (excluding wholesale funding) | 52.4 | | | 51.8 | | | | 61.1 | | | | 105.0 | | | | 101.8 | | | | 105.2 | |
| Risk-weighted assets | 57.1 | | | 57.6 | | | | 61.8 | | | | 114.4 | | | | 113.1 | | | | 106.4 | |
| | | | | | | | | | | | | | | | | | | | | | |
| Average exchange rate - US$/£ | 2.001 | | | 1.844 | | | | 1.820 | | | | | | | | | | | | | |
| Spot exchange rate - US$/£ | 2.004 | | | 1.965 | | | | 1.721 | | | | | | | | | | | | | |
2007 compared with 2006
Against the background of weaker housing and credit market conditions, Citizens’ franchise demonstrated resilience in 2007, with a particularly good performance in corporate and commercial banking. Despite modest growth in net interest margins and strong fee growth in several products, total income fell by 6% to £3,122 million due mainly to the weak dollar exchange rate but, in dollar terms, total income increased by 2% to $6,249 million. Tight cost control helped limit the fall in operating profit. However, impairment losses increased from 0.31% of loans and advances to 0.60%, resulting in a decrease in operating profit before tax of 16% to £1,323 million, or 9% to $2,647 million in dollar terms.
Net interest income fell by 5% to £1,975 million due mainly to the unfavourable dollar exchange rate. In dollar terms, net interest income rose by 3% to $3,954 million. Average loans and advances to customers increased by 4%, with strong growth in corporate and commercial lending, up 13%, with close attention being paid to our risk appetite in light of prevailing market conditions. Average customer deposits increased by 1% but deposit margins narrowed as a result of deposit pricing competition and continued migration from low-cost checking accounts and liquid savings to higher-cost products. Notwithstanding this migration, Citizens’ net interest margin increased slightly to 2.80% in 2007, compared with 2.72% in 2006, thanks in part to improved lending spreads in the latter part of the year.
Non-interest income fell by 7% to £1,147 million. In dollar terms, non-interest income rose by 1% to $2,295 million. Business and corporate fees rose strongly, with good results especially in foreign exchange, interest rate derivatives and cash management, driven by increasing cooperation with RBS Corporate Markets. Good progress was also made in credit card issuing, where we increased our customer base by 20%, and in merchant acquiring, where RBS Lynk achieved significant growth, processing 30% more transactions than in 2006 and expanding its merchant base by 5%.
In response to more difficult market conditions Citizens intensified cost discipline, with a reduction in headcount helping to reduce total expenses by 6%. In dollar terms, total expense growth was limited to 2%, despite enhancements to infrastructure and processes as well as continued investment in growth opportunities including mid-corporate banking, contactless debit cards and merchant acquiring.
Rising losses and increased provisions lifted impairment costs from £181 million in 2006 to £341 million in 2007. In dollar terms, impairment losses rose from $333 million in 2006 to $682 million in 2007. Against a background of weaker economic activity the Citizens portfolio is performing well, although we have experienced a reversion from the very low levels of impairment seen in recent years, reflecting both the planned expansion of our commercial loan book and the impact of a softer housing market. There has also been an increase in reserving. The average FICO scores on our consumer portfolios, including home equity lines of credit, remain in excess of 700, with 97% of lending secured. Average loan-to-value ratios at the end of 2007 were 58% on our residential mortgage book and 74% on our home equity book.
Business review continued
2006 compared with 2005
Citizens grew its total income by 2% to £3,317 million, while its operating profit rose slightly to £1,582 million. In dollar terms, Citizens total income increased by 3% to $6,115 million and its operating profit before tax by 2% to $2,917 million.
We have achieved good growth in lending volumes, with average loans and advances to customers increasing by 10%. In business lending, average loans excluding finance leases increased by 15%, reflecting Citizens’ success in adding new mid-corporate customers and increasing its total number of business customers by 4% to 467,000. In personal lending, Citizens increased average mortgage and home equity lending by 14%, though the mortgage market slowed in the second half. Average credit card receivables, while still relatively small, increased by 19%.
We increased average customer deposits by 4%, although spot balances at the end of 2006 were little changed from the end of 2005. As interest rates rose further and the US yield curve inverted, we saw migration from low-cost checking and liquid savings to higher-cost term and time deposits. This migration is a principal reason for the decline in Citizens’ net interest margin to 2.72% in 2006, compared with 3.00% in 2005. The decline slowed over the course of the year, with net interest margin in the second half 6 basis points lower than in the first. Lower net interest margins more than offset the benefit of higher average loans and deposits, leaving net interest income marginally lower at $3,844 million.
Non-interest income rose by 8% to £1,232 million. In dollar terms, non-interest income rose by 9% to $2,271 million. Business and corporate fees rose strongly, with good results especially in foreign exchange, interest rate derivatives and cash management benefiting from increased activity with Corporate Markets. There was good progress in debit cards, where issuance has been boosted by the launch in September of our "Everyday Rewards" programme. Citizens has also become the US’s leading issuer of Paypass™ contactless debit cards, with 3.65 million cards issued. Our credit card customers increased by 20%, whilst RBS Lynk, our merchant acquiring business, also achieved significant growth, processing 40% more transactions than it did in 2005 and expanding its merchant base by 11%.
Total expenses were flat, reflecting tight cost control and a 5% reduction in headcount, despite continued investment in growth opportunities such as mid-corporate banking, contactless debit cards, merchant acquiring and supermarket banking.
Citizens continued to expand its branch network. Our partnership with Stop & Shop Supermarkets has helped us to expand our supermarket banking franchise into New York, while in October we announced the purchase of GreatBanc, Inc., strengthening our position in the Chicago market and making us the 4th largest bank in the Chicago area, based on deposits. The acquisition was completed in February 2007.
Impairment losses totalled £181 million ($333 million), representing just 0.31% of loans and advances to customers and illustrating the prime quality of our portfolio. Underlying strong credit quality remained unchanged as our portfolio grew, with risk elements in lending and problem loans representing 0.32% of loans and advances, the same level as in 2005. Our consumer lending is to prime customers with average FICO scores on our portfolios, including home equity lines of credit, in excess of 700, and 95% of lending is secured.
RBS Insurance
| | | 2007 | | | 2006 | | | 2005 | |
| | | | £m | | | | £m | | | | £m | |
| Earned premiums | | | 5,607 | | | | 5,713 | | | | 5,641 | |
| Reinsurers’ share | | | (220 | ) | | | (212 | ) | | | (246 | ) |
| Insurance premium income | | | 5,387 | | | | 5,501 | | | | 5,395 | |
| Net fees and commissions | | | (465 | ) | | | (486 | ) | | | (449 | ) |
| Other income | | | 734 | | | | 664 | | | | 543 | |
| Total income | | | 5,656 | | | | 5,679 | | | | 5,489 | |
| Direct expenses | | | | | | | | | | | | |
| – staff costs | | | 297 | | | | 319 | | | | 316 | |
| – other | | | 447 | | | | 426 | | | | 411 | |
| | | | 744 | | | | 745 | | | | 727 | |
| Gross claims | | | 4,091 | | | | 4,030 | | | | 3,903 | |
| Reinsurers’ share | | | (81 | ) | | | (60 | ) | | | (76 | ) |
| Net claims | | | 4,010 | | | | 3,970 | | | | 3,827 | |
| Contribution | | | 902 | | | | 964 | | | | 935 | |
| Allocation of Manufacturing costs | | | 219 | | | | 215 | | | | 208 | |
| Operating profit before tax | | | 683 | | | | 749 | | | | 727 | |
| | | | | | | | | | | | | |
| In-force policies (000’s) | | | | | | | | | | | | |
| – Own-brand motor | | | 6,713 | | | | 6,790 | | | | 6,580 | |
| – Own-brand non-motor (home, rescue, pet, HR24) | | | 3,752 | | | | 3,759 | | | | 3,762 | |
| – Partnerships and broker (motor, home, rescue, SMEs, pet, HR24) | | | 9,302 | | | | 11,242 | | | | 11,317 | |
| General insurance reserves – total (£m) | | | 8,192 | | | | 8,068 | | | | 7,776 | |
2007 compared with 2006
RBS Insurance has made good progress in 2007 in competitive markets. Total income was maintained at £5,656 million, in line with 2006 levels, with growth in our own-brand businesses offset by a decline in partnerships.
Operating profit before tax declined by 9% to £683 million, reflecting the impact of the severe flooding experienced in June and July. Excluding the £274 million impact of the floods, contribution grew by 22% and operating profit by 28%, supported by strong claims management and the benefits of improved risk selection in this and prior years. We have continued to focus on selective underwriting of more profitable business.
Our own-brand businesses have performed well, with income rising by 1% and contribution growing by 4%. Excluding the impact of the floods, own-brand contribution grew by 24%. In the UK motor market we have pursued a strategy of targeting lower risk drivers and have increased premium rates to offset claims inflation, improving profitability by implementing heavier price increases in higher risk categories. Our international businesses performed well, with Spain delivering strong profit growth while, in line with plan, our German and Italian businesses also achieved profitability in 2007. Home insurance grew across all of our own brands in the second half, and we achieved particular success in the distribution of home policies through our bank branches, with sales up 40%.
In our partnerships and broker business, providing underwriting and processing services to third parties, we have concentrated on more profitable opportunities and have consequently not renewed a number of large rescue contracts. We also pulled back from some less profitable segments of the broker market. This resulted in a 17% reduction in in-force policies, but income fell by only 2%. Contribution from partnerships and brokers fell by 22% as a result of flood-related claims. Excluding the impact of the floods, contribution from partnerships and brokers increased by 18%.
For RBS Insurance as a whole, insurance premium income, net of fees and commissions, was 2% lower at £4,922 million, reflecting modest growth in our own brands offset by a 5% decline in the partnerships and broker segment. Other income rose by 11% to £734 million, reflecting increased investment income.
Total expenses were held flat at £963 million. Within this, staff costs reduced by 7%, reflecting our continued focus on improving efficiency whilst maintaining service standards. A 5% rise in non-staff costs reflects increased marketing investment in our own brands.
Net claims rose by 1% to £4,010 million. Gross claims relating to the floods in June and July cost more than £330 million, with a net impact, after allowing for profit sharing and reinsurance, of £274 million. Excluding the impact of the floods, net claims costs were reduced by 7%. In the motor book, while average claims costs have continued to rise, this has been mitigated by improvements in risk selection and management and by continuing efficiencies in claims handling.
The UK combined operating ratio for 2007, including manufacturing costs, increased to 98.0%, reflecting a higher loss ratio and the reduction in partnership income. Excluding the impact of the floods, the combined operating ratio was 91.9%.
Business review continued
2006 compared with 2005
RBS Insurance increased total income by 3% to £5,679 million, with contribution also rising by 3% to £964 million and operating profit before tax by the same percentage to £749 million.
We achieved overall policy growth of 1% in our businesses including excellent progress in our European businesses. Our joint venture in Spain grew policy numbers by 14% to 1.34 million.
In the UK we have grown our own-brand motor book by 3% whilst focusing on more profitable customers acquired through our direct brands, with good results achieved through the internet channel, which accounted for half of all new own-brand motor policies last year.
We implemented price rises in motor insurance in the second half of the year, and average motor premium rates across the market increased in the fourth quarter. Higher premium rates will, however, take time to feed through into income, and competition on prices remains strong.
Our own-brand non-motor personal lines policies were flat, despite particularly good progress in Tesco Personal Finance. SME has also performed well with policies sold through our intermediary business growing by 10%.
However, some of our partnership books continue to age and we did not renew a number of other partnerships. As a result, the number of partnership policies in force fell by 1%.
Insurance premium income was up 2% to £5,501 million, reflecting a modest overall increase in the total number of in-force policies.
Net fees and commissions payable increased by 8% to £486 million, whilst other income rose by 22% to £664 million, reflecting increased investment income.
Total expenses rose by 3% to £960 million. Good cost discipline held direct expenses to £745 million, up 2%. Staff costs rose by 1%, reflecting improved efficiency despite continued investment in service standards. A 4% rise in non-staff costs included increased marketing expenditure to support growth in continental Europe.
Net claims rose by 4% to £3,970 million. The environment for home claims remained benign, whilst underlying increases in average motor claims costs were partially offset by purchasing efficiencies and improvements in risk management.
The UK combined operating ratio for 2006, including Manufacturing costs, was 94.6%, compared with 93.4% in 2005, reflecting a higher loss ratio and the discontinuation of some partnerships.
Manufacturing
| | | 2007 | | | 2006 | | | 2005 | |
| | | | £m | | | | £m | | | | £m | |
| Staff costs | | | 763 | | | | 762 | | | | 724 | |
| Other costs | | | 2,151 | | | | 2,110 | | | | 2,052 | |
| Total Manufacturing costs | | | 2,914 | | | | 2,872 | | | | 2,776 | |
| Allocated to divisions | | | (2,914 | ) | | | (2,872 | ) | | | (2,776 | ) |
| | | | — | | | | — | | | | — | |
| Analysis of Manufacturing costs: | | | | | | | | | | | | |
| Group Technology | | | 984 | | | | 974 | | | | 959 | |
| Group Property | | | 962 | | | | 932 | | | | 857 | |
| Customer Support and other operations | | | 968 | | | | 966 | | | | 960 | |
| Total Manufacturing costs | | | 2,914 | | | | 2,872 | | | | 2,776 | |
2007 compared with 2006
Manufacturing costs increased by 1% to £2,914 million, as further improvements in productivity enabled us to support growth in business volumes and to maintain high levels of customer satisfaction while continuing to invest in the further development of our business. Staff costs were flat, as salary inflation was offset by reduced headcount in Operations, resulting from process efficiencies. Other costs increased by 2%, reflecting property investment and continued growth in the volumes of transactions handled.
Group Technology costs remained under tight control, increasing by only 1% to £984 million, as significant improvements in productivity were balanced by investment in software development.
Group Property costs rose by 3% to £962 million, reflecting refurbishment and expansion of the Ulster Bank network and continuing investment to support the strong growth of our business in Europe and Asia, including the opening of a new Corporate Markets office in Paris and further development of our office portfolio in India and Singapore.
Customer Support and other operations costs remained broadly flat at £968 million, with further significant improvements in productivity enabling us to continue to absorb significant increases in service volumes. At the same time we maintained our focus on service quality, and our UK-based telephony centres continued to record market-leading customer satisfaction scores. Our investment in process re-engineering across our operational centres under the ‘Work-Out’ banner is expected to deliver further improvements in efficiency.
2006 compared with 2005
Manufacturing costs increased by 3% to £2,872 million, benefiting from investment in efficiency programmes while supporting business growth and maintaining high levels of customer satisfaction. Staff costs rose by 5%, with increases in Group Technology partially offset by reduced headcount in Operations.
Group Technology costs were 2% higher at £974 million, as we achieved significant improvements in productivity balanced by investment in software development. In the biggest integration project undertaken since NatWest, we brought Ulster Bank onto the RBS technology platform.
Group Property costs increased by 9% to £932 million, reflecting the continuation of our branch improvement programme and ongoing investment in major operational centres, including Manchester, Birmingham and Glasgow.
Customer Support and other operations held costs virtually flat at £966 million and, like Group Technology, achieved significant improvements in productivity. At the same time we maintained our focus on service quality, and our UK-based telephony centres continued to record market-leading customer satisfaction scores. Our investment in ‘lean manufacturing’ approaches across our operational centres is expected to deliver further improvements in efficiency.
RFS Holdings
| | | RFS Holdings excluding minority interest | | | RFS Holdings minority interest | |
| | | | £m | | | | £m | |
| Net interest income | | | 275 | | | | 1,144 | |
| Non-interest income | | | 539 | | | | 437 | |
| Total income | | | 814 | | | | 1,581 | |
| Operating expenses and insurance claims | | | 864 | | | | 1,140 | |
| | | | (50 | ) | | | 441 | |
| Impairment losses | | | 65 | | | | 198 | |
| Contribution and operating profit before tax | | | (115 | ) | | | 243 | |
| | | | | | | | | |
| | | £bn | | | £bn | |
| Total assets | | | 533.9 | | | | 240.5 | |
| Total liabilities | | | 511.5 | | | | 215.8 | |
| | | | | | | | | |
RFS Holdings as a whole recorded income totalling £2,395 million and operating profit from continuing activities of £128 million for the period from 17 October to 31 December 2007. RFS Holdings excluding minority interests accounted for total income of £814 million. Trading profits of these businesses totalled £49 million offset by £91 million of credit market write-downs.
Business review continued
Central items
| | | 2007 | | | 2006 | | | 2005 | |
| | | | £m | | | | £m | | | | £m | |
| Funding and corporate costs | | | 289 | | | | 862 | | | | 950 | |
| Departmental and other costs | | | 461 | | | | 442 | | | | 402 | |
| | | | 750 | | | | 1,304 | | | | 1,352 | |
| Allocation of Manufacturing costs | | | 146 | | | | 143 | | | | 140 | |
| Total central Items | | | 896 | | | | 1,447 | | | | 1,492 | |
2007 compared with 2006
Central costs were substantially lower, reflecting in part the gains realised on a number of planned disposals that formed part of the Group’s funding arrangements for the acquisition of ABN AMRO. These gains contributed to a reduction of £717 million in funding and corporate costs, which also benefited from a reduction of £152 million in the carrying value of our own debt accounted for at fair value and the receipt of a dividend on our investment in Bank of China. These benefits were partially offset by funding costs of £144 million relating to ABN AMRO and goodwill payments amounting to £119 million in respect of current account administration fees. Funding and corporate costs, which include realised gains totalling £475 million, were £289 million, 66% lower than in 2006.
Departmental and other costs increased by 4% to £461 million. This largely reflects the centralisation of certain functions and increased regulatory requirements.
2006 compared with 2005
Total central items decreased by 3% to £1,447 million.
Funding and corporate costs were 9% lower at £862 million, largely reflecting a year on year reduction of £41 million in IFRS-related volatility. The Group hedges its economic risks, and volatility attributable to derivatives in economic hedges that do not meet the criteria in IFRS for hedge accounting is transferred to the Group’s central treasury function.
Departmental and other costs were 10% higher at £442 million largely attributable to additional pension costs and higher securitisation costs.
Employee numbers at 31 December (full time equivalents rounded to the nearest hundred)
| | | 2007 | | | 2006 | | | 2005 | |
| Global Banking & Markets | | | 10,300 | | | | 8,600 | | | | 7,400 | |
| UK Corporate Banking | | | 9,500 | | | | 8,800 | | | | 8,400 | |
| Retail | | | 37,500 | | | | 38,900 | | | | 39,600 | |
| Wealth Management | | | 5,000 | | | | 4,500 | | | | 4,200 | |
| Ulster Bank | | | 6,400 | | | | 5,600 | | | | 5,100 | |
| Citizens | | | 22,500 | | | | 23,100 | | | | 24,400 | |
| RBS Insurance | | | 17,300 | | | | 17,500 | | | | 19,300 | |
| Manufacturing | | | 25,200 | | | | 25,400 | | | | 26,100 | |
| Centre | | | 2,900 | | | | 2,600 | | | | 2,500 | |
| | | | 136,600 | | | | 135,000 | | | | 137,000 | |
| RFS Holdings | | | 89,800 | | | | — | | | | — | |
| Group total | | | 226,400 | | | | 135,000 | | | | 137,000 | |
2007 compared with 2006
The number of employees at 31 December 2007 was 226,400, an increase of 91,400 compared with the previous year, of which the acquisition of ABN AMRO by RFS Holdings added 89,800 employees.
2006 compared with 2005
The number of employees at 31 December 2006 was 135,000, a decrease of 2,000 compared with the prior year.
Business review continued
Consolidated balance sheet
at 31 December 2007
| | | 2007 | | | 2006 | |
| | | | £m | | | | £m | |
| Assets | | | | | | | | |
| Cash and balances at central banks | | | 17,866 | | | | 6,121 | |
| Treasury and other eligible bills | | | 18,229 | | | | 5,491 | |
| Loans and advances to banks | | | 219,460 | | | | 82,606 | |
| Loans and advances to customers | | | 829,250 | | | | 466,893 | |
| Debt securities | | | 276,427 | | | | 127,251 | |
| Equity shares | | | 53,026 | | | | 13,504 | |
| Settlement balances | | | 16,589 | | | | 7,425 | |
| Derivatives | | | 337,410 | | | | 116,681 | |
| Intangible assets | | | 48,492 | | | | 18,904 | |
| Property, plant and equipment | | | 18,750 | | | | 18,420 | |
| Prepayments, accrued income and other assets | | | 19,066 | | | | 8,136 | |
| Assets of disposal groups | | | 45,954 | | | | — | |
| Total assets | | | 1,900,519 | | | | 871,432 | |
| Liabilities | | | | | | | | |
| Deposits by banks | | | 312,633 | | | | 132,143 | |
| Customer accounts | | | 682,365 | | | | 384,222 | |
| Debt securities in issue | | | 273,615 | | | | 85,963 | |
| Settlement balances and short positions | | | 91,021 | | | | 49,476 | |
| Derivatives | | | 332,060 | | | | 118,112 | |
| Accruals, deferred income and other liabilities | | | 34,024 | | | | 15,660 | |
| Retirement benefit liabilities | | | 496 | | | | 1,992 | |
| Deferred taxation | | | 5,510 | | | | 3,264 | |
| Insurance liabilities | | | 10,162 | | | | 7,456 | |
| Subordinated liabilities | | | 37,979 | | | | 27,654 | |
| Liabilities of disposal groups | | | 29,228 | | | | — | |
| Total liabilities | | | 1,809,093 | | | | 825,942 | |
| | | | | | | | | |
| Minority interests | | | 38,388 | | | | 5,263 | |
| Equity owners | | | 53,038 | | | | 40,227 | |
| Total equity | | | 91,426 | | | | 45,490 | |
| | | | | | | | | |
| Total liabilities and equity | | | 1,900,519 | | | | 871,432 | |
| | | | | | | | | |
| Analysis of repurchase agreements included above | | | | | | | | |
| | | | | | | | | |
| Reverse repurchase agreements and stock borrowing | | | | | | | | |
| Loans and advances to banks | | | 175,941 | | | | 54,152 | |
| Loans and advances to customers | | | 142,357 | | | | 62,908 | |
| | | | 318,298 | | | | 117,060 | |
| Repurchase agreements and stock lending | | | | | | | | |
| Deposits by banks | | | 163,038 | | | | 76,376 | |
| Customer accounts | | | 134,916 | | | | 63,984 | |
| | | | 297,954 | | | | 140,360 | |
Overview of consolidated balance sheet
Total assets of £1,900.5 billion at 31 December 2007 were up £1,029.1 billion compared with 31 December 2006, of which £774.2 billion relates to the acquisition of ABN AMRO. The remaining increase in total assets, up £254.9 billion, 29% to £1,126.3 billion, largely reflected an increase in derivative assets, which was accompanied by a corresponding increase in derivative liabilities, and secured financing through reverse repurchase agreements and stock borrowing ("reverse repos") and lending growth across all divisions.
Treasury and other eligible bills increased by £12.7 billion to £18.2 billion. The acquisition of ABN AMRO added £1.7 billion with the remaining increase of £11.0 billion to £16.5 billion due to increased trading activity.
Loans and advances to banks increased by £136.9 billion to £219.5 billion with reverse repos up by £121.8 billion to £175.9 billion. The acquisition of ABN AMRO added £122.1 billion. The remaining increase in loans and advances to banks was £14.8 billion, 18%, to £97.4 billion of which reverse repos increased by £13.5 billion, 25% to £67.6 billion and bank placings increased by £1.3 billion, 5%, to £29.8 billion.
Loans and advances to customers rose by £362.4 billion to £829.3 billion. Within this, reverse repos increased by £79.4 billion to £142.4 billion. The acquisition of ABN AMRO added £285.5 billion. The remaining increase in loans and advances to customers was £76.9 billion, 16%, to £543.8 billion with reverse repos increasing by £16.1 billion, 26% to £79.1 billion. Excluding reverse repos, lending rose by £60.8 billion, 15% to £464.7 billion, reflecting growth across all divisions.
Debt securities increased by £149.2 billion to £276.4 billion of which £121.8 billion related to the acquisition of ABN AMRO. The remaining increase of £27.4 billion, 22%, to £154.6 billion was principally due to increased trading book holdings in Corporate Markets.
Equity shares rose by £39.5 billion to £53.0 billion primarily reflecting the acquisition of ABN AMRO, partially offset by a £0.8 billion reduction in the value of the Bank of China shareholding.
Intangible assets increased by £29.6 billion to £48.5 billion due to the acquisition of ABN AMRO and represented goodwill of £24.5 billion and other intangible assets of £5.1 billion.
Property, plant and equipment were up £0.3 billion, 2% to £18.8 billion. The acquisition of ABN AMRO added £2.2 billion which was largely offset by the sale of the Canary Wharf investment properties and sale and leaseback transactions in the UK and US.
Settlement balances rose £9.2 billion to £16.6 billion. The acquisition of ABN AMRO added £11.3 billion, but was partially offset by a reduction of £2.1 billion, 28% to £5.3 billion as a result of reduced customer activity.
Derivatives, assets and liabilities increased reflecting the acquisition of ABN AMRO, growth in trading volumes and the effects of interest and exchange rate movements amidst current market conditions.
Prepayments, accrued income and other assets were up £10.9 billion to £19.1 billion primarily reflecting the acquisition of ABN AMRO.
Assets and liabilities of disposal groups comprise those business units of ABN AMRO that were acquired exclusively with a view to disposal, including Banca Antonveneta, Asset Management and Private Equity.
Deposits by banks rose by £180.5 billion to £312.6 billion of which repurchase agreements and stock lending (“repos”) were up £86.7 billion to £163.0 billion. The acquisition of ABN AMRO added £169.8 billion. The remaining increase in deposits by banks was £10.7 billion, 8% to £142.8 billion. Inter-bank deposits were up £11.9 billion, 21% at £67.7 billion, partially offset by a reduction in repos down £1.2 billion, 2% to £75.1 billion.
Customer accounts were up £298.1 billion to £682.4 billion with repos up £70.9 billion to £134.9 billion. The acquisition of ABN AMRO added £240.3 billion. The remaining increase in customer accounts was £57.8 billion, 15% at £442.1 billion with repos up £11.0 billion, 17% to £75.0 billion. Excluding repos, deposits rose by £46.8 billion, 15%, to £367.1 billion with good growth in all divisions.
Debt securities in issue have increased by £187.7 billion to £273.6 billion, of which £129.0 billion related to the acquisition of ABN AMRO.
Settlement balances and short positions were up £41.5 billion to £91.0 billion. The acquisition of ABN AMRO added £37.1 billion, with the remaining increase of £4.4 billion, 9% to £53.8 billion reflecting growth in customer activity.
Accruals, deferred income and other liabilities increased £18.4 billion to £34.0 billion largely reflecting the acquisition of ABN AMRO.
Deferred taxation liabilities rose by £2.2 billion, 69% to £5.5 billion largely due to the acquisition of ABN AMRO.
Subordinated liabilities were up £10.3 billion, 37% to £38.0 billion reflecting the acquisition of ABN AMRO. The issue of £1.0 billion dated loan capital and £0.7 billion movement in exchange rates was offset by the redemption of £0.7 billion dated loan capital, £0.4 billion undated loan capital and £0.6 billion non-cumulative preference shares.
Equity minority interests increased by £33.1 billion to £38.4 billion reflecting £33.8 billion in respect of the acquisition of ABN AMRO, partially offset by a reduction of £0.4 billion in the value of the investment in Bank of China.
Owners’ equity increased by £12.8 billion, 32%, to £53.0 billion. The profit for the year of £7.6 billion, issue of £2.7 billion of ordinary share capital, £3.2 billion of non-cumulative fixed rate equity preference shares and £1.1 billion of other paid-in equity to fund the Group's investment in ABN AMRO, together with other issues of £0.4 billion non-cumulative fixed rate equity preference shares and £0.1 billion of ordinary shares in respect of the exercise of share options, a £1.5 billion net decrease after tax in the Group's pension liability and £0.4 billion resulting from the effect of exchange rates, were partly offset by the payment of the 2006 final ordinary dividend and the 2007 interim dividend, £3.0 billion and preference dividends of £0.3 billion, £0.5 billion reduction in available-for-sale reserves, and a £0.4 billion decrease in cash flow hedging reserve.
Business review continued
Cash flow
| | | 2007 | | | 2006 | | | 2005 | |
| | | | £m | | | | £m | | | | £m | |
| Net cash flows from operating activities | | | 25,604 | | | | 17,441 | | | | 4,140 | |
| Net cash flows from investing activities | | | 15,999 | | | | 6,645 | | | | (2,612 | ) |
| Net cash flows from financing activities | | | 29,691 | | | | (1,516 | ) | | | (703 | ) |
| Effects of exchange rate changes on cash and cash equivalents | | | 6,010 | | | | (3,468 | ) | | | 1,703 | |
| Net increase in cash and cash equivalents | | | 77,304 | | | | 19,102 | | | | 2,528 | |
2007
The major factors contributing to the net cash inflow from operating activities of £25,604 million were the increase of £28,261 million in operating liabilities less operating assets and the profit before tax of £9,900 million, partly offset by the elimination of foreign exchange differences of £10,282 million and income taxes paid of £2,442 million.
The acquisition of ABN AMRO, included within net investment in business interests and intangible assets of £13,640 million, was the largest element giving rise to net cash flows from investing activities of £15,999 million, with cash and cash equivalents acquired of £60,093 million more than offsetting the cash consideration paid of £45,856 million. Net sales and maturities of securities of £1,987 million and net disposals of property, plant and equipment, £706 million less the net cash outflow of £597 million in respect of other acquisitions and disposals represented the other principle factors.
Net cash flows from financing activities of £29,691 million primarily relate to the cash injection of £31,019 million from the consortium partners in relation to the acquisition of ABN AMRO, together with the issue of £4,829 million of equity securities and £1,018 million of subordinated liabilities, offset in part by dividend payments of £3,411 million, the repayment of £1,708 million subordinated liabilities, interest on subordinated liabilities of £1,522 million and the redemption of £545 million of minority interests.
2006
The major factors contributing to the net cash inflow from operating activities of £17,441 million were the profit before tax of £9,186 million adjusted for the elimination of foreign exchange differences of £4,516 million and depreciation and amortisation of £1,678 million, together with an increase of £3,980 million in operating liabilities less operating assets.
Net sales and maturities of securities of £8,000 million was partially offset by net purchases of property, plant and equipment of £1,292 million, resulting in the net cash inflow from investing activities of £6,645 million.
The issue of £671 million of equity preference shares, £3,027 million of subordinated liabilities and proceeds of £1,354 million from minority interests issued were more than offset by dividend payments of £2,727 million, purchase of ordinary shares amounting to £991 million, repayment of £1,318 million of subordinated liabilities and interest on subordinated liabilities of £1,409 million, resulting in a net cash outflow from financing activities of £1,516 million.
2005
The major factors contributing to the net cash inflow of £4,140 million from operating activities in 2005 were the profit before tax of £7,936 million less elimination of foreign exchange differences of £3,060 million, increases in deposits and debt securities in issue of £56,571 million, and increases in short positions and settlement balances of £10,326 million, partially offset by increases in securities of £28,842 million and increases in loans and advances of £36,778 million.
Net purchases of property, plant and equipment of £2,592 million, including operating lease assets and computer and other equipment, were the main contributors to the net cash outflow from investing activities of £2,612 million.
The issue of £1,649 million preference shares and £1,234 million subordinated debt were more than offset by dividend payments of £2,007 million and the repayment of £1,553 million of subordinated liabilities, resulting in a net cash outflow from financing activities of £703 million.
Capital resources
The following tables analyse the Group’s regulatory capital resources at 31 December:
| | | IFRS 2007 | | | IFRS 2006 | | | IFRS 2005 | |
| | | | £m | | | | £m | | | | £m | |
| Capital base | | | | | | | | | | | | |
| Tier 1 capital | | | 44,364 | | | | 30,041 | | | | 28,218 | |
| Tier 2 capital | | | 33,693 | | | | 27,491 | | | | 22,437 | |
| Tier 3 capital | | | 200 | | | | — | | | | — | |
| | | | 78,257 | | | | 57,532 | | | | 50,655 | |
| Less: investments in insurance subsidiaries, associated | | | | | | | | | | | | |
| undertakings and other supervisory deductions | | | (10,283 | ) | | | (10,583 | ) | | | (7,282 | ) |
| Total capital | | | 67,974 | | | | 46,949 | | | | 43,373 | |
| | | | | | | | | | | | | |
| Risk-weighted assets | | | | | | | | | | | | |
| Banking book: | | | | | | | | | | | | |
| On-balance sheet | | | 480,200 | | | | 318,600 | | | | 303,300 | |
| Off-balance sheet | | | 84,600 | | | | 59,400 | | | | 51,500 | |
| Trading book | | | 44,200 | | | | 22,300 | | | | 16,200 | |
| | | | 609,000 | | | | 400,300 | | | | 371,000 | |
| | | | | | | | | | |
| Risk asset ratios | | % | | | % | | | % | |
| Tier 1 | | | 7.3 | | | | 7.5 | | | | 7.6 | |
| Total | | | 11.2 | | | | 11.7 | | | | 11.7 | |
| | | | | UK GAAP 2004 | | | UK GAAP 2003 | |
| | | | | | £m | | | | £m | |
| Capital base | | | | | | | | | | |
| Tier 1 capital | | | | | 22,694 | | | | 19,399 | |
| Tier 2 capital | | | | | 20,229 | | | | 16,439 | |
| | | | | | 42,923 | | | | 35,838 | |
| Less: investments in insurance subsidiaries, associated | | | | | | | | | | |
| undertakings and other supervisory deductions | | | | | (5,165 | ) | | | (4,618 | ) |
| Total capital | | | | | 37,758 | | | | 31,220 | |
| | | | | | | | | | | |
| Risk-weighted assets | | | | | | | | | | |
| Banking book: | | | | | | | | | | |
| On-balance sheet | | | | | 261,800 | | | | 214,400 | |
| Off-balance sheet | | | | | 44,900 | | | | 36,400 | |
| Trading book | | | | | 17,100 | | | | 12,900 | |
| | | | | | 323,800 | | | | 263,700 | |
| | | | | | | | | |
| Risk asset ratios | | | | % | | | % | |
| Tier 1 | | | | | 7.0 | | | | 7.4 | |
| Total | | | | | 11.7 | | | | 11.8 | |
Note: The data for 2003 and 2004 in the table above are under UK GAAP as previously published and regulated. As from 1 January 2005, the Group is regulated on an IFRS basis.
It is the Group’s policy to maintain a strong capital base, to expand it as appropriate and to utilise it efficiently throughout its activities to optimise the return to shareholders while maintaining a prudent relationship between the capital base and the underlying risks of the business. In carrying out this policy, the Group has regard to the supervisory requirements of the Financial Services Authority (“FSA”). The FSA uses Risk Asset Ratio (“RAR”) as a measure of capital adequacy in the UK banking sector, comparing a bank’s capital resources with its risk-weighted assets (the assets and off-balance sheet exposures are ‘weighted’ to reflect the inherent credit and other risks); by international agreement, the RAR should be not less than 8% with a tier 1 component of not less than 4%. At 31 December 2007, the Group’s total RAR was 11.2% (2006 – 11.7%) and the tier 1 RAR was 7.3% (2006 – 7.5%). For details of the Group’s current capital ratio targets, you should read “Business review – Recent Developments – Capital”.
Business review continued
Risk and capital management
Governance
The Group Board of directors sets the overall risk appetite and philosophy; the risk and capital framework underpins delivery of the Board’s strategy. The Board is supported by three committees:
| · | Group Audit Committee (“GAC”), comprising independent non-executive directors, focuses on financial reporting and application of accounting policies as part of the internal control and risk assessment framework. GAC monitors the identification, evaluation and management of all significant risks throughout the Group. This work is supported by Group Internal Audit, which provides an independent assessment of the design, adequacy and effectiveness of internal controls. |
| · | Advances Committee (“AC”), reporting to the Board, deals with transactions that exceed the Group Credit Committee’s delegated authority. |
| · | Group Executive Management Committee (“GEMC”), an executive committee, ensures that implementation of strategy and operations are in line with the agreed risk appetite. GEMC is supported by the following: |
| | - | Group Risk Committee (“GRC”) recommends and approves limits, processes and policies that ensure the effective management of all material non-balance sheet risks across the Group. |
| | | |
| | - | Group Credit Committee (“GCC”) approves credit proposals under authority delegated to it by the Board and/or Advances Committee. |
| | | |
| | - | Group Asset and Liability Management Committee (“GALCO”) is responsible for identifying, managing and controlling the Group balance sheet risks. These risks are managed by setting limits and controls for capital adequacy, funding and liquidity, intra-group exposures, and non-trading interest rate, equity and foreign currency risk. |
Risk and capital
It is the Group’s policy to optimise return to shareholders while maintaining a strong capital base and credit rating to support business growth and meet regulatory capital requirements at all times.
On 22 April 2008, the Group announced that the Board has raised its target range for the Group’s Tier 1 capital ratio to 7.5 per cent. to 8.5 per cent. and has set a target for the core Tier 1 capital ratio of in excess of 6 per cent. at 31 December 2008 on a proportional consolidated basis. Prior to that time, previous guidance given by the Group referred to a 7 per cent. to 8 per cent. target range for the Tier 1 capital ratio, with 25 per cent. to 30 per cent. preference share content, but with no target range set for the core Tier 1 capital ratio. The target ranges are in excess of minimum regulatory requirements.
Capital adequacy and risk management are closely aligned. The Group undertakes a regular assessment of its internal capital requirement based on a quantification of the material risks to which it is exposed. This assessment includes the use of stress tests to assess whether the Group’s capital resources are adequate to remain above minimum requirements during a macroeconomic recession. The results of this internal capital assessment are reviewed by the Group Board and are used to ensure the adequacy of the Group’s available capital resources, to measure risk-adjusted returns, to inform the annual business and financial planning process and to inform the Board’s approval of risk appetite limits.
The allocation of capital resources to divisions is determined as part of the annual business and financial planning process.
Risk appetite is measured as the maximum level of retained risk the Group will accept to deliver its business objectives. Risk appetite is generally defined through both quantitative and qualitative techniques including stress testing, risk concentration, value-at-risk and risk underwriting criteria, ensuring that appropriate principles, policies and procedures are in place and applied.
The main risks facing the Group are shown below. These should be considered in conjunction with the Risk factors set out on pages 13 to 15 which could affect the Group’s performance.
| · | Credit risk: is the risk arising from the possibility that the Group will incur losses from the failure of customers to meet their obligations. |
| | |
| · | Funding and liquidity risk: is the risk the Group is unable to meet its obligations as they fall due. |
| | |
| · | Market risk: the Group is exposed to market risk because of positions held in its trading portfolios and its non-trading businesses. |
| | |
| · | Pension obligation risk: is the risk that the liabilities of the Group’s various defined benefit pension schemes will exceed their assets as a result of which the Group is required or chooses to make additional contributions to schemes. |
| | |
| · | Equity risk: reflects the variability in the value of equity investments resulting in gains or losses. |
| | |
| · | Insurance risk: the Group is exposed to insurance risk, either directly through its businesses or through using insurance as a tool to mitigate other risk exposures. |
| | |
| · | Operational risk: is the risk arising from the Group’s people, processes, systems, physical assets and external events. |
| | |
| · | Regulatory risk: is the risk arising from failing to meet the requirements and expectations of the Group’s many regulators, or from a failure to address or implement any change in these requirements or expectations. |
These risk and capital management processes performed well throughout 2007, and continued working through the market disruption seen since August 2007.
Management responsibilities
All staff have a role to play in the day to day management of risk in their division, in line with Group policy, which is set and managed by specialist staff in:
| · | Risk Management: credit, market, regulatory, enterprise and insurance risk, together with risk analytics. |
| | |
| · | Group Treasury: balance sheet, capital management, intra-group credit exposure, funding and liquidity and hedging policies. |
Independence underpins the approach to risk management, which is reinforced throughout the Group by appropriate reporting lines.
Business review continued
Credit risk
Credit risk is managed to achieve sustainable and superior risk-reward performance whilst maintaining exposures within acceptable risk appetite parameters. This is achieved through the combination of governance, policies, systems and controls, underpinned by sound commercial judgement as described below.
| · | Policies and risk appetite: policies provide clarity around the required Group framework for the assessment, approval, monitoring and management of credit risk where risk appetite sets the tolerance of loss. Limits are used to manage concentration risk by single name, sector and country. |
| | |
| · | Decision makers: credit authority is granted to independent persons or committees with the appropriate experience, seniority and commercial judgement. Credit authority is not extended to relationship managers. Specialist internal credit risk departments independently oversee the credit process and make credit decisions or recommendations to the appropriate credit committee. |
| | |
| · | Models: credit models are used to measure and assess risk decisions and to aid on-going monitoring. Measures, such as Probability of Default, Exposure at Default, Loss Given Default (see below) and Expected Loss are calculated using duly authorised models. All credit models are subject to independent review prior to implementation and existing models are reviewed on at least an annual basis. |
| | |
| · | Mitigation techniques to reduce the potential for loss: credit risk may be mitigated by the taking of financial or physical security, the assignment of receivables or the use of credit derivatives, guarantees, risk participations, credit insurance, set off or netting. |
| | |
| · | Risk systems and data quality: systems are well organised to produce timely, accurate and complete inputs for risk reporting and to administer key credit processes. |
| | |
| · | Analysis and reporting: portfolio analysis and reporting are used to ensure the identification of emerging concentration risks and adverse movements in credit risk quality. |
| | |
| · | Stress testing: stress testing forms an integral part of portfolio analysis, providing a measure of potential vulnerability to exceptional but plausible economic and geopolitical events which assists management in the identification of risk not otherwise apparent in more benign circumstances. Stress testing informs risk appetite decisions. |
| | |
| · | Portfolio management: active management of portfolio concentrations as measured by risk reporting and stress testing, where credit risk may be mitigated through promoting asset sales, buying credit protection or curtailing risk appetite for new transactions. |
| | |
| · | Credit stewardship: customer transaction monitoring and management is a continuous process, ensuring performance is satisfactory and that documentation, security and valuations are complete and up to date. |
| | |
| · | Problem debt identification: policies and systems encourage the early identification of problems and the employment of specialised staff focused on collections and problem debt management. |
| | |
| · | Provisioning: independent assessment using best practice models for collective and latent loss. Professional evaluation is applied to individual cases, to ensure that such losses are comprehensively identified and adequately provided for. |
| | |
| · | Recovery: maximising the return to the Group through the recovery process. |
Basel II
RBS has received agreement (called ‘a waiver’) from the UK Financial Services Authority to adopt the Advanced Internal Ratings Based (AIRB) approach for calculating capital requirements for the majority of the business with effect from 1 January 2008. The Group, therefore, will be one of a small number of banks whose risk systems and approaches have achieved the advanced standard for credit, the most sophisticated available under the new Basel II framework.
The AIRB approach to Basel II is based on the following metrics.
| · | Probability of default (“PD”): the likelihood that a customer will fail to make full and timely repayment of credit obligations over a one year time horizon. Customers are assigned an internal credit grade which corresponds to probability of default. Every customer credit grade across all grading scales in the Group can be mapped to a Group level credit grade (see page 55). |
| | |
| · | Exposure at default (“EAD”): such models estimate the expected level of utilisation of a credit facility at the time of a borrower’s default. The EAD is typically higher than the current utilisation (e.g. in the case where further drawings are made on a revolving credit facility prior to default) but will not typically exceed the total facility limit. |
| | |
| · | Loss given default (“LGD”): models estimate the economic loss that may occur in the event of default, being the debt that cannot be recovered. The Group’s LGD models take into account the type of borrower, facility and any risk mitigation such as security or collateral held. |
Credit risk assets
Credit risk assets are an internal risk measure of the Group’s exposure to customers. These consist of loans and advances (including overdraft facilities), instalment credit, finance lease receivables, debt securities and other traded instruments across all customer types.
| | 2007 | 2006 | 2005 |
| Credit risk assets | £bn | £bn | £bn |
| Corporate Markets | | | |
| – Global Banking & Markets | 330.2 | 233.4 | 206.5 |
| – UK Corporate Banking | 86.8 | 76.0 | 66.5 |
| Retail Markets | | | |
| – Retail | 112.8 | 108.1 | 103.2 |
| – Wealth Management | 11.7 | 10.0 | 8.9 |
| Ulster Bank | 46.5 | 37.0 | 31.9 |
| Citizens | 71.8 | 67.5 | 74.5 |
| RBS Insurance | 9.0 | 7.2 | 6.7 |
| RFS Holdings excluding minority interest | 131.8 | — | — |
| RFS Holdings minority interest | 206.0 | — | — |
| | 1,006.6 | 539.2 | 498.2 |
Excluding reverse repurchase agreements, credit risk assets as at 31 December 2007 were £1,006.6 billion (2006 – £539.2 billion), an increase of £467.4 billion during the year of which £337.8 billion arose from the acquisition of ABN AMRO.
An analysis of reverse repurchase agreements is shown below.
| | 2007 | 2006 | 2005 |
| Reverse repurchase agreements | £bn | £bn | £bn |
| Banks | 67.6 | 54.2 | 41.8 |
| Customers | 79.1 | 62.9 | 48.9 |
| RFS Holdings excluding minority interest | 169.9 | — | — |
| RFS Holdings minority interest | 1.7 | — | — |
| | 318.3 | 117.1 | 90.7 |
Reverse repurchase agreements as at 31 December 2007 were £318.3 billion (2006 – £117.1 billion), an increase of £201.2 billion of which £171.6 billion arose from the acquisition of ABN AMRO.
Business review continued
Credit risk asset quality
Internal reporting and oversight of risk assets is principally differentiated by credit ratings. Internal ratings are used to assess the credit quality of borrowers. Customers are assigned an internal credit grade based on various grading models that reflect the probability of default. All credit ratings across the Group map to a Group level asset quality scale.
Expressed as an annual probability of default, the upper and lower boundaries and the midpoint for each of these Group level asset quality grades are as follows:
| | Annual probability of default | |
| | Minimum | Midpoint | Maximum | S&P |
| Asset quality grade | % | % | % | equivalent |
| AQ1 | 0.00 | 0.10 | 0.20 | AAA to BBB- |
| AQ2 | 0.21 | 0.40 | 0.60 | BB+ to BB |
| AQ3 | 0.61 | 1.05 | 1.50 | BB- to B+ |
| AQ4 | 1.51 | 3.25 | 5.00 | B+ to B |
| AQ5 | 5.01 | 52.50 | 100.00 | B and below |
Distribution of credit risk assets by asset quality
As at 31 December 2007, exposure to investment grade counterparties (AQ1) accounted for 47% (2006 – 46%) of credit risk assets and 96% (2006 – 97%) of exposures were to counterparties rated AQ4 or higher. The exposure to the lowest asset quality (AQ5) was 4% (2006 – 3%).
Note: Graph data are shown net of provisions and reverse repurchase agreements.
Distribution of credit risk assets by industry sector
Industry analysis plays an important part in assessing potential concentration risk from within the loan portfolio. Particular attention is given to industry sectors where the Group believes there is a high degree of risk or potential for volatility in the future.
The Group also uses scenario analysis and stress testing in order to monitor the risk to clusters of correlated industry sectors.
Note: Graph data are shown net of provisions and reverse repurchase agreements.
As at 31 December 2007, 26% of credit risk assets (2006 – 28%) related to individuals and includes mortgage lending and other smaller loans that are intrinsically well-diversified. Corporate industry exposure comprised 38% of credit risk assets (2006 – 36%), which are well diversified across a range of sectors. Banks and financial services account for 22% of credit risk assets (2006 – 20%) and public sector and quasi government credit risk assets make up the remaining 14% (2006 – 16%).
Business review continued
Distribution of credit risk assets by geography
The acquisition of ABN AMRO in October 2007 has also changed the risk profile of the Group, with benefits arising from increased diversification available from the Group’s wider global reach.
The Group operates in over 50 countries, but with the majority of assets in the UK, North America and Europe.
Distribution of credit risk assets by product and customer type
The Group also monitors its credit portfolio by customer type and product type. The largest category is lending to banks, corporates, sovereigns and quasi governments which represented 49% of credit risk assets as at 31 December 2007 (2006 – 41%). Lending to individuals accounted for 23% (2006 – 26%).
Loan impairment
The Group classifies impaired assets as either Risk Elements in Lending (REIL) or Potential Problem Loans (PPL). REIL represents non-accrual loans, loans that are accruing but are past due 90 days and restructured loans. PPL represents impaired assets which are not included in REIL but where information about possible credit problems cause management to have serious doubts about the future ability of the borrower to comply with loan repayment terms.
Both REIL and PPL are reported gross of the value of any security held, which could reduce the eventual loss should it occur, and gross of any provision marked. Therefore impaired assets which are highly collateralised, such as mortgages, will have a low coverage ratio of provisions held against reported impaired balance.
The table below sets out the Group’s loans that are classified as REIL and PPL:
| | | 2007 | | 2006 | | | 2005 | |
| REIL and PPL | | | £m | | | £m | | | | £m | |
Non-accrual loans (1) | | | 10,362 | | | 6,232 | | | | 5,926 | |
Accrual loans past due 90 days (2) | | | 369 | | | 105 | | | | 9 | |
Troubled debt restructurings (3) | | | — | | | — | | | | 2 | |
| Total REIL | | | 10,731 | | | 6,337 | | | | 5,937 | |
PPL (4) | | | 671 | | | 52 | | | | 19 | |
| Total REIL and PPL | | | 11,402 | | | 6,389 | | | | 5,956 | |
| | | | | | | | | | | | |
REIL and PPL as % of customer loans and advances – gross (5) | | | 1.64% | | | 1.57% | | | | 1.60% | |
The sub-categories of REIL and PPL are calculated as described in notes 1 to 4 below.
| | Notes: |
| | |
| (1) | All loans against which an impairment provision is held are reported in the non-accrual category. |
| | |
| (2) | Loans where an impairment event has taken place but no impairment recognised. This category is used for fully collateralised non-revolving credit facilities. |
| | |
| (3) | Troubled debt restructurings represent loans that have been restructured following the granting of a concession by the Group to the borrower. |
| | |
| (4) | Loans for which an impairment event has occurred but no impairment provision is necessary. This category is used for fully collateralised advances and revolving credit facilities where identification as 90 days overdue is not feasible. |
| | |
| (5) | Gross of provisions and excluding reverse repurchase agreements. |
REIL as at 31 December 2007 was £10,731 million (2006 – £6,337 million), an increase of £4,394 million (69%) during the year, of which £3,807 million related to ABN AMRO. As a percentage of customer lending, REIL and PPL in aggregate increased to 1.64% of customer loans and advances at 31 December 2007 (2006 – 1.57%) ..
REIL by division
The table below shows REIL by division.
| | 2007 | 2006 | 2005 |
| REIL | £m | £m | £m |
| Corporate Markets | | | |
| – Global Banking & Markets | 373 | 492 | 496 |
| – UK Corporate Banking | 1,236 | 1,034 | 969 |
| Retail Markets | | | |
| – Retail | 4,286 | 4,078 | 3,783 |
| – Wealth Management | 45 | 43 | 58 |
| Ulster Bank | 667 | 498 | 436 |
| Citizens | 317 | 175 | 195 |
| Other | — | 17 | — |
| RFS Holdings excluding minority interest | 1,327 | — | — |
| RFS Holdings minority interest | 2,480 | — | — |
| Total REIL | 10,731 | 6,337 | 5,937 |
During 2007, REIL in Retail Markets increased by £210 million, Ulster Bank by £169 million and Citizens by £142 million.
Business review continued
Impairment loss provision methodology
Provisions for impairment losses are assessed under three categories as described below:
Individually assessed provisions are the provisions required for individually significant impaired assets which are assessed on a case by case basis, taking into account the financial condition of the counterparty and any guarantor. This incorporates an estimate of the discounted value of any recoveries and realisation of security or collateral. The asset continues to be assessed on an individual basis until it is repaid in full, transferred to the performing portfolio or written-off.
Collectively assessed provisions are provisions on impaired credits below an agreed threshold which are assessed on a portfolio basis, to reflect the homogeneous nature of the assets, such as credit cards or personal loans. The provision is determined from a quantitative review of the relevant portfolio, taking account of the level of arrears, security and average loss experience over the recovery period.
Latent loss provisions are provisions held against the estimated impairment in the performing portfolio which have yet to be identified as at the balance sheet date. To assess the latent loss within the portfolios, the Group has developed methodologies to estimate the time that an asset can remain impaired within a performing portfolio before it is identified and reported as such.
Provision analysis
The Group’s consumer portfolios, which consist of small value, high volume credits, have highly efficient largely automated processes for identifying problem credits and very short timescales, typically three months, before resolution or adoption of various recovery methods.
Corporate portfolios consist of higher value, low volume credits, which tend to be structured to meet individual customer requirements. Provisions are assessed on a case by case basis by experienced specialists, with input from professional valuers and accountants as appropriate. The Group operates a provisions governance framework which sets thresholds whereby suitable oversight and challenge is undertaken. These opinions and levels of provision are overseen by each division’s Provision Committee. Significant cases are presented to, and challenged by, the Group Problem Exposure Review Forum.
Early and active management of problem exposures ensures that credit losses are minimised. Specialised units are used for different customer types to ensure that the appropriate risk mitigation is taken in a timely manner.
Portfolio provisions are reassessed regularly as part of the Group’s ongoing monitoring process.
The following table shows an analysis of the loan impairment charge.
| | | 2007 | | 2006 | | | 2005 | |
| Loan impairment charge | | | £m | | | £m | | | | £m | |
| Latent loss provisions charge | | | 88 | | | 87 | | | | 14 | |
| Collectively assessed provisions charge | | | 1,744 | | | 1,573 | | | | 1,399 | |
| Individually assessed provisions charge | | | 274 | | | 217 | | | | 290 | |
| Total charge to income statement | | | 2,106 | | | 1,877 | | | | 1,703 | |
| | | | | | | | | | | | |
Charge as a % of customer loans and advances – gross (1) | | | 0.30% | | | 0.46% | | | | 0.46% | |
| | Note: |
| | |
| (1) | Gross of provisions and excluding reverse repurchase agreements. |
Provisions for loan impairment charged to the income statement in 2007 were £2,106 million, up £229 million (12%) from 2006, of which £262 million relates to ABN AMRO. As a percentage of customer lending, the impairment charge was 0.30% (2006 – 0.46%).
Summary of loan impairment provisions
| | | 2007 | | 2006 | | | 2005 | |
Loan impairment provisions (1) | | | £m | | | £m | | | | £m | |
| Latent loss provisions | | | 1,050 | | | 593 | | | | 543 | |
| Collectively assessed provisions | | | 3,834 | | | 2,645 | | | | 2,587 | |
| Individually assessed provisions | | | 1,554 | | | 695 | | | | 754 | |
| Total provisions | | | 6,438 | | | 3,933 | | | | 3,884 | |
| | | | | | | | | | | | |
Total provision as a % of customer loans and advances – gross (2) | | | 0.9% | | | 1.0% | | | | 1.0% | |
| | Notes: |
| | |
| (1) | Excludes provisions against loans and advances to banks of £3 million (2006 – £2 million; 2005 – £3 million). |
| | |
| (2) | Gross of provisions and excluding reverse repurchase agreements. |
| | |
As at 31 December 2007 total customer provisions were £6,438 million, up £2,505 million (64%) from 31 December 2006, of which £2,205 million related to ABN AMRO.
Provisions coverage
The Group’s provision coverage ratios are shown in the table below.
| | | 2007 | | 2006 | | | 2005 | |
| Total provision expressed as a: | | | | | | | | |
| % of REIL | | | 60% | | | 62% | | | | 65% | |
| % of REIL and PPL | | | 56% | | | 62% | | | | 65% | |
The coverage ratio of closing provisions to REIL and PPL decreased from 62% to 56% during 2007. The lower coverage ratio reflects amounts written-off and the changing mix from unsecured to secured exposures.
Movement in loan impairment provisions balance
The movement in provisions balance is shown in the table below.
| | | 2007 | | | 2006 | |
| | | | £m | | | | £m | |
| Balance as at 1 January | | | 3,935 | | | | 3,887 | |
| Currency translation and other adjustments | | | 137 | | | | (61 | ) |
| Acquisition of subsidiaries | | | | | | | | |
| – RFS Holdings excluding minority interest | | | 657 | | | | — | |
| – RFS Holdings minority interest | | | 1,547 | | | | — | |
| – Other | | | 6 | | | | — | |
| Amounts written-off | | | (2,171 | ) | | | (1,841 | ) |
| Recoveries of amounts previously written-off | | | 390 | | | | 215 | |
| Charge to income statement | | | 2,106 | | | | 1,877 | |
Discount unwind (1) | | | (166 | ) | | | (142 | ) |
Balance as at 31 December (2) | | | 6,441 | | | | 3,935 | |
| | Notes: |
| | |
| (1) | The impact of discounting inherent within the provisions balance is unwound as the time to receiving the expected recovery cash flows draws nearer. |
| | |
| (2) | Includes provisions against loans and advances to banks of £3 million (2006 – £2 million). |
An impairment provision calculated using the effective interest rate method leaves a discounted asset; the discount unwinds at a constant effective rate until the outstanding asset is completely realised.
Business review continued
Liquidity risk
The Group’s liquidity policy is designed to ensure that it can at all times meet its obligations as they fall due.
Liquidity management within the Group focuses on overall balance sheet structure and the control, within prudent limits, of risk arising from the mismatch of maturities across the balance sheet and from exposure to undrawn commitments and other contingent obligations. The management of liquidity risk within the Group is undertaken within limits and other policy parameters set by GALCO. Compliance is monitored and coordinated by Group Treasury both in respect of internal policy and the regulatory requirements of the Financial Services Authority. In addition, all subsidiaries and branches outside the UK ensure compliance with any local regulatory liquidity requirements and are subject to Group Treasury oversight.
Diversification of funding sources
The structure of the Group’s balance sheet is managed to maintain substantial diversification, to minimise concentration across its various deposit sources, and to limit the reliance on total short-term wholesale sources of funds (gross and net of repos) within prudent levels.
During 2007, the Group’s funding sources remained well diversified by counterparty, instrument and maturity, both before and after the acquisition of ABN AMRO in October 2007.
| | | 2007 | | | | | | 2006 | | | | | | 2005 | | | | |
| Sources of funding | | | £m | | | % | | | | £m | | | % | | | | £m | | | % | |
| Customer accounts (excluding repos) | | | | | | | | | | | | | | | | | | | | | |
| Repayable on demand | | | 346,074 | | | | 24 | | | | 197,771 | | | | 28 | | | | 172,853 | | | | 27 | |
| Time deposits | | | 201,375 | | | | 14 | | | | 122,467 | | | | 17 | | | | 121,260 | | | | 19 | |
| Total customer accounts (excluding repos) | | | 547,449 | | | | 38 | | | | 320,238 | | | | 45 | | | | 294,113 | | | | 46 | |
Debt securities in issue over one year remaining maturity | | | 117,873 | | | | 8 | | | | 44,006 | | | | 6 | | | | 22,293 | | | | 3 | |
| Subordinated liabilities | | | 37,979 | | | | 3 | | | | 27,654 | | | | 4 | | | | 28,274 | | | | 4 | |
| Owners’ equity | | | 53,038 | | | | 4 | | | | 40,227 | | | | 6 | | | | 35,435 | | | | 6 | |
| Total customer accounts and long term funds | | | 756,339 | | | | 53 | | | | 432,125 | | | | 61 | | | | 380,115 | | | | 59 | |
| Repo agreements with customers | | | 134,916 | | | | 10 | | | | 63,984 | | | | 9 | | | | 48,754 | | | | 7 | |
| Repo agreements with banks | | | 163,038 | | | | 11 | | | | 76,376 | | | | 11 | | | | 47,905 | | | | 7 | |
| Total customer accounts, long term funds | | | | | | | | | | | | | | | | | | | | | | | | |
| and collateralised borrowing | | | 1,054,293 | | | | 74 | | | | 572,485 | | | | 81 | | | | 476,774 | | | | 73 | |
Debt securities in issue up to one year remaining maturity | | | 155,742 | | | | 11 | | | | 41,957 | | | | 5 | | | | 68,127 | | | | 11 | |
| Deposits by banks (excluding repos) | | | 149,595 | | | | 10 | | | | 55,767 | | | | 8 | | | | 62,502 | | | | 10 | |
| Short positions | | | 73,501 | | | | 5 | | | | 43,809 | | | | 6 | | | | 37,427 | | | | 6 | |
| Total | | | 1,433,131 | | | | 100 | | | | 714,018 | | | | 100 | | | | 644,830 | | | | 100 | |
Customer accounts (excluding repos) and long term funds (term debt securities in issue of over one year remaining maturity and capital) continue to represent the core of the Group’s funding. These core funds in total increased by £324.2 billion (75%) over the course of 2007 to represent 53% of total funding at 31 December 2007. The inclusion of ABN AMRO has added £253.5 billion.
Customer accounts comprise a well diversified and stable source of funds from a wide range of retail, corporate and non-bank institutional customers. Customer accounts grew by £227.2 billion (71%) of which the acquisition of ABN AMRO added £180.9 billion to represent 38% of total funding at 31 December 2007.
Term debt securities in issue with an outstanding term of over one year increased £73.9 billion to represent 8% of the Group’s funding at 31 December 2007, reflecting the activity of the Group in raising term funds through its securitisation and Euro and US Medium Term Note programmes. ABN AMRO term debt issuance through its similar programmes has added £62.4 billion.
Capital (owners’ equity and subordinated debt) increased by £13.0 billion (19%) to provide 9% of total funding at 31 December 2007.
Repo borrowing collateralised by a range of debt securities and other assets is undertaken with a range of corporate and institutional customers and banks. Collateralised borrowing by repo increased by £157.6 billion to represent 21% of the Group’s funding at 31 December 2007. ABN AMRO collateralised borrowing by repo has added £147.8 billion.
Short term wholesale funds (with up to one year residual maturity) are taken on an uncollateralised basis from a wide range of counterparties and debt investors, with the largest single depositor continuing to represent less than 1% of the Group’s total funding.
Short positions in various securities are held primarily by RBS Greenwich Capital in the US, RBS Global Banking & Markets and by ABN AMRO Global Markets. The level of funding from short term unsecured debt issuance, bank deposits (excluding repos) and short positions has increased by £237.3 billion to represent 26% of total funding at 31 December 2007. ABN AMRO short-term wholesale borrowing has added £175.3 billion.
Net customer activity
Net customer lending, excluding repos, rose by £58.2 billion (66%) over the course of 2007 as the growth in loans and advances to customers continued to exceed growth in customer accounts, thus increasing commensurately the reliance on wholesale market funding to support loan growth.
ABN AMRO net customer lending, excluding repos, has added £43.5 billion, reducing the ratio of loans and advances to customer accounts to 126.6% .
| | | 2007 | | | 2006 | | | 2005 | |
| Net customer activity | | | £m | | | | £m | | | | £m | |
| Loans and advances to customers (gross, excluding reverse repos) | | | 693,331 | | | | 407,918 | | | | 372,223 | |
| Customer accounts (excluding repos) | | | 547,449 | | | | 320,238 | | | | 294,113 | |
| Customer lending less customer accounts | | | 145,882 | | | | 87,680 | | | | 78,110 | |
| | | | | | | | | | | | | |
| Loans and advances to customers as a % of customer accounts (excluding repos) | | | 126.6% | | | | 127.4% | | | | 126.6% | |
Management of term structure
The Group evaluates on a regular basis its structural liquidity risk and applies a variety of balance sheet management and term funding strategies to maintain this risk within its normal policy parameters.
The degree of maturity mismatch within the overall long-term structure of the Group’s assets and liabilities is managed within internal policy guidelines, to ensure that term asset commitments may be funded on an economic basis over their life. In managing its overall term structure, the Group analyses and takes into account the effect of retail and corporate customer behaviour on actual asset and liability maturities where they differ materially from the underlying contractual maturities.
Stress testing
In August 2007, a systemic liquidity stress event was triggered by difficulties in the US sub-prime mortgage market which then spread more widely to the global asset-backed market and impacted adversely the overall supply and cost of funding and liquidity for other than very short-term maturities. RBS has managed its liquidity position through those market conditions, increased its liquidity cushion and remains able fully to meet its funding needs.
The Group performs stress tests to simulate how events may impact its funding and liquidity capabilities. Such tests inform the overall balance sheet structure and help define prudent limits for control of the risk arising from the mismatch of maturities across the balance sheet and from undrawn commitments and other contingent obligations. The nature of stress tests is kept under review in line with evolving market conditions.
Contingency funding plans are maintained to anticipate and respond to any approaching or actual material deterioration in market conditions. The Group remains confident that it can manage its liquidity requirements effectively under such circumstances.
Daily management
The primary focus of the daily management activity is to ensure access to sufficient liquidity to meet cash flow obligations within key time horizons, in particular out to one month ahead.
The short-term maturity structure of the Group’s liabilities and assets is managed daily to ensure that all material or potential cash flow obligations, arising from undrawn commitments and other contingent obligations can be met. Potential sources include cash inflows from maturing assets, new borrowing or the sale of various debt securities held (after allowing for appropriate haircuts).
Short-term liquidity risk is generally managed on a consolidated basis with internal liquidity mismatch limits set for all subsidiaries and non-UK branches which have material local treasury activities, thereby assuring that the daily maintenance of the Group’s overall liquidity risk position is not compromised. ABN AMRO, Citizens Financial Group and RBS Insurance manage liquidity locally, given different regulatory regimes, subject to review by Group Treasury. As integration of ABN AMRO’s businesses within the Group proceeds, the liquidity risk policies, parameters and metrics used will be progressively aligned within a single framework.
Business review continued
| | | 2007 | | | 2006 | | | 2005 | |
| Net short-term wholesale market activity | | | £m | | | | £m | | | | £m | |
| Debt securities, listed held-for-trading equity shares, treasury and other eligible bills | | | 328,352 | | | | 135,775 | | | | 129,440 | |
| Reverse repo agreements with banks and customers | | | 318,298 | | | | 117,060 | | | | 90,691 | |
| Less: repos with banks and customers | | | (297,954 | ) | | | (140,360 | ) | | | (96,659 | ) |
| Short positions | | | (73,501 | ) | | | (43,809 | ) | | | (37,427 | ) |
| Insurance companies’ debt securities held | | | (8,062 | ) | | | (6,149 | ) | | | (5,724 | ) |
| Debt securities charged as security for liabilities | | | (29,709 | ) | | | (8,560 | ) | | | (9,578 | ) |
| Net marketable assets | | | 237,424 | | | | 53,957 | | | | 70,743 | |
| By remaining maturity up to one month: | | | | | | | | | | | | |
| Deposits by banks (excluding repos) | | | 112,181 | | | | 36,089 | | | | 35,153 | |
| Less: loans and advances to banks (gross, excluding reverse repos) | | | (25,609 | ) | | | (21,136 | ) | | | (16,381 | ) |
| Debt securities in issue | | | 66,289 | | | | 19,924 | | | | 20,577 | |
| Net wholesale liabilities due within one month | | | 152,861 | | | | 34,877 | | | | 39,349 | |
| Net surplus of marketable assets over wholesale liabilities due within one month | | | 84,563 | | | | 19,080 | | | | 31,394 | |
The Group’s net surplus of marketable assets over net short-term wholesale liabilities due within one month increased by £65.5 billion, reflecting actions taken by the Group to increase its liquidity cover in response to market conditions. ABN AMRO added £21.7 billion to the net surplus of marketable assets over net short-term wholesale liabilities due within one month, which was £84.6 billion at 31 December 2007.
Sterling liquidity
Over 22% of the Group’s total assets are denominated in sterling, where the FSA requires the Group, on a consolidated basis, to maintain daily a minimum ratio of 100% between:
| · | a stock of qualifying high quality liquid assets (primarily UK and EU government securities, treasury bills and cash held in branches); and |
| | |
| · | the sum of: sterling wholesale net outflows contractually due within five working days (offset up to a limit of 50%, by 85% of sterling certificates of deposit held which mature beyond five working days); and 5% of retail deposits with a residual contractual maturity of five working days or less. |
The FSA also sets an absolute minimum level for the stock of qualifying liquid assets that the Group is required to maintain each day. Internal processes ensure that the Group achieves or exceeds these minimum requirements at all times.
Liquidity in non-sterling currencies
The Group also recognises the importance of non-sterling liquidity, which is managed daily within various limits. This takes into account the marketability, within a short period, of the wide range of debt securities held, if required to meet unexpected outflows.
The level of contingent risk from the potential drawing of undrawn or partially drawn commitments, back-up lines, standby lines and other similar facilities is also actively monitored and reflected in the measures of the Group’s non-sterling liquidity risk. Particular attention is given to the US dollar commercial paper market and the propensity of the Group’s bank and corporate counterparties who are active in raising funds from that market to switch to utilising facilities offered by the Group in the event of either counterparty specific difficulties or a significant widening of interest spreads generally in the commercial paper market.
The Group also provides liquidity back-up facilities to its own conduits and has small exposures to other selected conduits which take funding from the asset-backed commercial paper (“ABCP”) market. The short-term contingent liquidity risk in providing such backup facilities is mitigated by the spread of maturity dates of the commercial paper taken by the conduits. Limits sanctioned for such facilities totalled approximately £64 billion at 31 December 2007, of which £16 billion related to the RBS conduits and £48 billion to ABN AMRO conduits. The RBS conduits are multi-seller ABCP conduits rated at A1 or A1+/P1 levels. During the difficult market conditions since August 2007 the conduits were generally able to continue to issue rated CP albeit at generally shorter maturities and higher price levels than previously. There was an increased shortage of market liquidity, particularly in November and December, for longer dated issuance (i.e. over 1 month) as the year end approached. RBS and RBS Greenwich Capital Markets act as dealers to the conduits’ CP issuance programmes and have purchased CP in that capacity but such holdings have not generally been material. The majority of the ABN AMRO conduits are also rated A1 or A1+/P1 and they experienced similar trading conditions to the RBS conduits although they saw two small conduits draw liquidity. ABN AMRO Bank and ABN AMRO Corp act as dealers to the programmes and have held generally non material CP on inventory. The conduits are consolidated by the Group.
Developments in liquidity risk management regulation
During 2007, increased regulatory focus and the need for international coordination of liquidity risk management has been highlighted by external market conditions.
New liquidity regulation was also introduced by a number of local regulators, notably in the Republic of Ireland. The Group had no difficulties in meeting the new requirements.
Further regulatory developments are expected through 2008, including progress in harmonising liquidity requirements. Central Banks are also expected to continue to work to coordinate their liquidity supply arrangements in order to mitigate market conditions. The Group has been, and continues to be, actively involved in working with the various regulatory policy makers and central banks to assist the development of an appropriate future liquidity regime which takes into account both national considerations and the integrated cross-border approach to the management of liquidity risk within integrated banking groups such as the Group.
Market risk
Market risk is defined as the risk of loss resulting from adverse changes in risk factors such as interest rates, foreign currency and equity prices, together with related factors such as market volatilities.
The Group is exposed to market risk because of positions held in its trading portfolios as well as its non-trading business including the Group’s treasury operations.
There are two sources of market risk for the Group:
| · | Trading: the principal risk factors for the Group are interest rates, credit spreads, equity prices and foreign exchange. |
The primary focus of the Group’s trading activities is client facilitation – providing products to the Group’s client base at competitive prices. The Group also undertakes: market making – quoting firm bid (buy) and offer (sell) prices with the intention of profiting from the spread between the quotes; arbitrage – entering into offsetting positions in different but closely related markets in order to profit from market imperfections; and proprietary activity – taking positions in financial instruments as principal in order to take advantage of anticipated market conditions.
Financial instruments held in the Group’s trading portfolios include, but are not limited to: debt securities, loans, deposits, equities, securities sale and repurchase agreements and derivative financial instruments (futures, forwards, swaps and options).
For a discussion of the Group’s accounting policies for, and information with respect to, its exposures to derivative financial instruments, see Accounting policies and Note 13 on the accounts.
| · | Non-trading: the principal market risks arising from the Group’s non-trading activities are interest rate risk, currency risk and equity risk. |
Treasury activity and mismatches between the repricing of assets and liabilities in its retail and commercial banking operations account for most of the non-trading interest rate risk. Non-trading currency risk derives from the Group’s investments in overseas subsidiaries, associates and branches.
The Group’s strategic investment in Bank of China, venture capital portfolio and investments held by its general insurance business are the principal sources of non-trading equity price risk.
The Group’s portfolios of non-trading financial instruments mainly comprise loans (including finance leases), debt securities, equity shares, deposits, certificates of deposit and other debt securities issued, loan capital and derivatives. To reflect their distinct nature, the Group’s long-term assurance assets and liabilities attributable to policyholders have been excluded from these market risk disclosures.
Strategy and process
GEMC approves the Group’s trading book market risk appetite, expressed in value-at-risk (VaR) and stress testing limits. These limits are delegated to individual trading businesses within the Group. The Board, GEMC and GRC review monthly reports, which provide summary information on VaR, trading positions and stress tests.
Business review continued
The market risk function is independent of the Group’s trading businesses and is responsible for:
| · | effective application and compliance with the Group’s Market Risk Policy Statement (MRPS), aligning the market risk taken by the Group with the risk limits set by GEMC; |
| | |
| · | identification, measurement, monitoring, analysis and reporting of the market risk generated by the various businesses; and |
| | |
| · | determination of appropriate policies and methodologies to measure and control market risk. |
Market risk measurement methodology
The Group uses a number of approaches to measure market risk in its trading and treasury portfolios. These approaches include:
(i) VaR
VaR is a technique that produces estimates of the potential negative change in the market value of a portfolio over a specified time horizon at given confidence levels. For internal risk management purposes, the Group’s VaR assumes a time horizon of one trading day and a confidence level of 95%. The Group also calculates VaR at a confidence interval of 99% and a time horizon of ten trading days for the purposes of calculating trading book market risk capital.
The Group uses historical simulation models in computing VaR. This approach, in common with many other VaR models, assumes that risk factor changes observed in the past are a good estimate of those likely to occur in the future and is, therefore, limited by the relevance of the historical data used. The Group’s method, however, does not make any assumption about the nature or type of underlying loss distribution. The Group typically uses the previous 500 trading days of market data.
The Group calculates both general market risk (i.e. the risk due to movement in general market benchmarks) and idiosyncratic market risk (i.e. the risk due to movements in the value of securities by reference to specific issuers) using its VaR models.
The Group’s VaR should be interpreted in light of the limitations of the methodology used. These limitations include:
| · | Historical data may not provide the best estimate of the joint distribution of risk factor changes in the future and may fail to capture the risk of possible extreme adverse market movements which have not occurred in the historical window used in the calculations. |
| | |
| · | VaR using a one-day time horizon does not fully capture the market risk of positions that cannot be liquidated or hedged within one day. |
| | |
| · | VaR using a 95% confidence level does not reflect the extent of potential losses beyond that percentile. |
The Group largely computes the VaR of trading portfolios at the close of business and positions may change substantially during the course of the trading day. Further controls are in place to limit the Group’s intra-day exposure, such as the calculation of the VaR for selected portfolios. These limitations and the nature of the VaR measure mean that the Group cannot guarantee that losses will not exceed the VaR amounts indicated. The Group undertakes stress testing to identify the potential for losses in excess of the VaR.
The VaR for the Group’s trading portfolios segregated by type of market risk exposure, including idiosyncratic risk, is presented in the table below.
| | | | | | | |
| | 2007 | | 2006 |
| | Average | Period end | Maximum | Minimum | | Average | Period end | Maximum | Minimum |
| | £m | £m | £m | £m | | £m | £m | £m | £m |
| Interest rate | 12.5 | 15.0 | 21.8 | 7.6 | | 8.7 | 10.2 | 15.0 | 5.7 |
| Credit spread | 18.8 | 41.9 | 45.2 | 12.6 | | 13.2 | 14.1 | 15.7 | 10.4 |
| Currency | 2.6 | 3.0 | 6.9 | 1.1 | | 2.2 | 2.5 | 3.5 | 1.0 |
| Equity | 5.4 | 14.0 | 22.0 | 1.4 | | 1.1 | 1.6 | 4.4 | 0.5 |
| Commodity | 0.2 | 0.5 | 1.6 | — | | 0.2 | — | 1.1 | — |
| Diversification | | (28.7 | ) | | | | (12.8 | ) | |
| Total trading VaR | 21.6 | 45.7 | 50.1 | 13.2 | | 14.2 | 15.6 | 18.9 | 10.4 |
Backtesting
The Group undertakes a programme of daily backtesting, which compares the actual profit or loss realised in trading activity to the VaR estimation. The results of the backtesting process are one of the methods by which the Group monitors the ongoing suitability of its VaR model. Backtesting exceptions are those instances when a realised loss exceeds the predicted VaR. At the 99% confidence level, no more than one backtesting exception is expected every 100 trading days. The Group experienced three backtesting exceptions at the consolidated Group level during 2007.
The Group’s trading activities are carried out principally by Global Banking & Markets. The chart below depicts the number of days on which Global Banking & Markets’ trading income fell within stated ranges.
(ii) Stress testing
Stress testing measures the impact of abnormal changes in market rates and prices on the fair value of the Group’s trading portfolios. GEMC approves the high-level market risk stress test limit for the Group.
The Group calculates a range of market risk stress tests each day. The objective of stress testing is to identify the loss that the Group’s current portfolio of trading book exposures would generate in plausible but adverse market events. The Group calculates historical stress tests and hypothetical stress tests.
Historical stress tests calculate the loss that would be generated if the market movements that occurred during a historical market event were to be repeated. Hypothetical stress tests calculate the loss that would be generated if a specific set of adverse market movements were to occur.
In addition to the Group-level consolidated market risk stress tests, stress testing is also undertaken at key trading strategy level. Additional stress tests are undertaken for those strategies where the associated market risks are not adequately captured by VaR.
Stress test exposures are discussed with senior management and are reported to GRC, GEMC and the Board. Breaches in the Group’s market risk stress testing limit are reported to GRC, GEMC and the Board.
(iii) Position risk and sensitivity analyses
In addition to the VaR and stress testing measures discussed above, the Group calculates a wide range of sensitivity and position risk measures, for example interest rate ladders or option revaluation matrices. These measures provide valuable additional controls, often at individual desk or strategy level.
Market risk controls
All divisions which incur market risk in the course of their business are required to comply with the requirements of the Group’s MRPS. The main risk management tools are delegated authorities, specifically hard limits and discussion triggers.
Limits form part of the dealing authorities and constitute one of the cornerstones of the market risk management framework. Their breach must be followed by appropriate action, as specified in detail in the MRPS. Upon notification of a limit breach, the appropriate body must take either of the following actions:
| · | instructions can be given to reduce positions so as to bring the Group within the agreed limits, or |
| | |
| · | a temporary increase in the limit (for instance, in order to allow orderly unwinding of positions) can be granted, or |
| | |
| · | a permanent increase in the limit can be granted. |
Business review continued
Treasury
The Group’s treasury activities include its money market business and the management of internal funds flow within the Group’s businesses. Money market portfolios include cash instruments (principally debt securities, loans and deposits) and related hedging derivatives. VaR for the Group’s treasury portfolios, which relates mainly to interest rate risk including credit spreads, was £5.5 million at 31 December 2007 (2006 –£1.5 million). During the year the maximum VaR was £6.4 million (2006 – £4.4 million), the minimum £1.3 million (2006 –£0.6 million) and the average £3.7 million (2006 – £2.4 million).
Retail and commercial banking
Non-trading interest rate risk can arise in these activities from a variety of sources, including where assets, liabilities and off-balance sheet instruments have different repricing dates.
Non-trading interest rate risk is calculated in each business on the basis of establishing the repricing behaviour of each asset, liability and off-balance sheet product. For many products, the actual interest rate repricing characteristics differ from the contractual repricing. In most cases, the repricing maturity is determined by the market interest rate that most closely fits the historical behaviour of the product interest rate. For non interest bearing current accounts, the repricing maturity is determined by the stability of the portfolio. The repricing maturities used are approved by Group Treasury and divisional asset and liability committees at least annually. Key conventions are reviewed annually by GALCO.
A static maturity gap report is produced as at the month-end for each business, in each functional currency based on the behaviouralised repricing for each product. It is Group policy to include in the gap report, non-financial assets and liabilities, mainly property, plant and equipment and the Group’s capital and reserves, spread over medium and longer term maturities. This report also includes hedge transactions, principally derivatives.
Any residual non-trading interest rate exposures are controlled by limiting repricing mismatches in the individual business balance sheets. Potential exposures to interest rate movements in the medium to long term are measured and controlled using a version of the same VaR methodology that is used for the Group’s trading portfolios but without discount factors. Net accrual income exposures are measured and controlled in terms of sensitivity over time to movements in interest rates.
Risk is managed within VaR limits approved by GALCO, through the execution of cash and derivative instruments. Execution of the hedging is carried out by the relevant division through the Group’s treasury functions. The residual risk position is reported to divisional asset and liability committees, GALCO and the Board.
Non-trading interest rate VaR
Non-trading interest rate VaR for the Group’s treasury and retail and commercial banking activities was £42.9 million at 31 December 2007 (2006 – £40.2 million) with the major exposure being to changes in longer term US dollar interest rates. During the year, the maximum VaR was £53.6 million (2006 – £98.7 million), the minimum £32.9 million (2006 – £40.2 million) and the average £43.2 million (2006 – £76.6 million).
Citizens was the main contributor to overall non-trading interest rate VaR. It invests in portfolios of highly rated and liquid investments, principally mortgage-backed securities issued by US Government-backed entities. This balance sheet management approach is common for US retail banks where mortgages are originated and then sold to Federal agencies for funding through the capital markets.
VaR, like all interest rate risk measures, has limitations when applied to retail banking books and the management of Citizens Financial Group’s interest rate exposures involves a number of other interest rate risk measures and related limits. Two measures that are reported both to Citizens ALCO and the Board are:
| · | The sensitivity of net accrual earnings to a series of parallel movements in interest rates; and |
| | |
| · | Economic value of equity (“EVE”) sensitivity to a series of parallel movements in interest rates. |
The limits applied to these measures are set to parallel movements of +/-1% and +/-2%. The EVE methodology captures deposit re-pricing strategies and the embedded option risks that exist within both the investment portfolio of mortgage-backed securities and the consumer loan portfolio.
EVE is the present value of the cash flows generated by the current balance sheet. EVE sensitivity to a 2% parallel movement upwards and downwards in US interest rates is shown below.
| | Percent increase/(decrease) in Citizens EVE |
| | 2% parallel upward movement in US interest rates | | 2% parallel downward movement in US interest rates (no negative rates allowed) |
| 2007 | % | | % |
| Period end | (6.4) | | (9.7) |
| Maximum | (10.1) | | (10.3) |
| Minimum | (4.5) | | (3.0) |
| Average | (8.0) | | (7.6) |
| | | | |
| 2006 | | | |
| Period end | (9.6) | | (7.2) |
| Maximum | (10.1) | | (10.3) |
| Minimum | (8.4) | | (1.9) |
| Average | (9.4) | | (6.0) |
For the Group, the other major structural interest rate risk arises from a low interest rate environment, particularly in sterling, sustained for a number of years. In such a scenario, deposit pricing may reach effective floors below which it is not practical to reduce rates further whilst variable rate asset pricing continues to decline. A sustained low rate scenario would also generate progressively reduced income from the medium and long term hedging of non-interest bearing liabilities.
Currency risk
The Group does not maintain material non-trading open currency positions other than the structural foreign currency translation exposures arising from its investments in foreign subsidiaries and associated undertakings and their related currency funding. The Group’s policy in relation to structural positions is to match fund the structural foreign currency exposure arising from net asset value, including goodwill, in foreign subsidiaries, equity accounted investments and branches, except where doing so would materially increase the sensitivity of either the Group’s or the subsidiary’s regulatory capital ratios to currency movements. The policy requires structural foreign exchange positions to be reviewed regularly by GALCO. Foreign exchange differences arising on the translation of foreign operations are recognised directly in equity together with the effective portion of foreign exchange differences arising on hedging instruments.
Equity classification of foreign currency denominated preference share issuances requires that these shares be held on the balance sheet at historic cost. Consequently, these share issuances have the effect of increasing the Group’s structural foreign currency position.
The tables below set out the Group’s structural foreign currency exposures.
| | Net investments in foreign operations | | Net investment hedges | | Structural foreign currency exposures |
| 2007 | £m | | £m | | £m |
| US dollar | 14,819 | | 2,844 | | 11,975 |
| Euro | 46,629 | | 41,220 | | 5,409 |
| Swiss franc | 910 | | 863 | | 47 |
| Chinese RMB | 2,600 | | 1,938 | | 662 |
| Brazilian real | 3,755 | | — | | 3,755 |
| Other non-sterling | 2,995 | | 875 | | 2,120 |
| | 71,708 | | 47,740 | | 23,968 |
| 2006 | | | | | |
| US dollar | 15,036 | | 5,278 | | 9,758 |
| Euro | 3,059 | | 1,696 | | 1,363 |
| Swiss franc | 462 | | 457 | | 5 |
| Chinese RMB | 3,013 | | — | | 3,013 |
| Other non-sterling | 132 | | 107 | | 25 |
| | 21,702 | | 7,538 | | 14,164 |
The exposure in Chinese RMB arises from the Group’s strategic investment in Bank of China.
Business review continued
Pension obligation risk
The Group is also exposed to risk from its defined benefit pension schemes. The schemes’ assets comprise investment portfolios which are held to meet projected liabilities to the scheme members. Risk arises from the schemes because returns from these portfolios may be less than expected and because there may be greater than expected increases in the estimated value of the schemes’ liabilities. In these circumstances, the Group could be obliged, or may choose, to make additional contributions to the schemes.
Equity risk
Non-trading equity positions can result in changes in the Group’s non-trading income and reserves arising from changes in equity prices/income. These movements may crystallise during the course of normal business activities or in stress market conditions.
There are several reasons for retaining equity positions in the Group’s non-trading book, including achieving strategic objectives, expected capital gain and supporting venture capital transactions. These investments are carried at fair value with changes in fair value recorded in profit or loss, or in equity
The types, nature and amounts of exchange-traded exposures, private equity exposures, and other exposures vary significantly Such exposures may take the form of listed and unlisted equity shares, equity warrants and options, linked equity fund investments, private equity and venture capital investments, preference shares classified as equity and capital stock in the Federal Home Loans Bank and the Federal Reserve Bank.
Insurance risk
The Group is exposed to insurance risk, either directly through its businesses or through using insurance as a tool to reduce other risk exposures.
Effectively, an insurance contract transfers risk from the policyholder to the insurer, whereby, in return for a premium paid, the insurer indemnifies the policyholder on the occurrence of specified events. Insurance risk arises through fluctuations in the timing, frequency and/or severity of insured events, relative to the expectations at the time of underwriting. Insurance risk is managed in four distinct ways:
| · | Underwriting and pricing risk |
Overall, insurance risk is predictable, supported by large volumes of data over time. Uncertainty does exist, especially around predictions, for example, variations in weather. Risk is minimised through the application of documented risk policies, coupled with governance frameworks.
The specific characteristics of each of the risks highlighted above are as follows:
Underwriting and pricing risk: the Group manages underwriting and pricing risk through a wide range of processes which include:
| · | Underwriting guidelines that detail the class, nature and type of business that may be accepted; |
| | |
| · | Pricing policies which are set by senior management; |
| | |
| · | Centralised control of policy wordings and any subsequent changes. |
Claims management risk: arises if claims are handled or paid inappropriately. Claims are managed using a range of IT system controls and manual processes conducted by experienced staff. These, together with a range of detailed policies and procedures, ensure that claims are handled in a timely, appropriate and accurate manner. The processes include controls to avoid claims staff handling or paying claims beyond their level of authority, as well as controls to avoid paying invalid claims. Loss adjustors are used to handle certain claims to conclusion.
Reinsurance risk: the following types of reinsurance are used to protect against the impact of major catastrophic events or unforeseen volumes of (or adverse trends in) large individual claims and to transfer risk that is outside the Group’s current risk appetite. Reinsurance of risks above the Group’s risk appetite is only effective if the reinsurance premium payable makes economic sense and the counterparty is financially secure. Before entering a contract with a new reinsurer, it must satisfy the Credit Risk Approval process that uses information derived internally and from security ratings agencies. Acceptable reinsurers are rated at A- or better unless specifically authorised by the RBS Insurance Group Board.
| · | Excess of loss ‘per individual risk’ reinsurance to protect against significantly large individual losses. |
| | |
| · | Excess of loss catastrophic ‘event’ reinsurance to protect against major events, for example, windstorms or floods. |
| | |
| · | Quota share reinsurance to protect against unforeseen adverse trends, where the reinsurer takes an agreed percentage of premiums and claims. |
Other forms of reinsurance may also be utilised, subject to approval by senior management.
Reserving risk: arises when reserves are assessed incorrectly, so that insufficient funds are retained to pay (or handle) claims as they fall due either for claims which have already occurred in relation to the claims reserves (including claims handling expense reserves) or will occur in future periods of insurance
(in relation to the premium reserves). The Group holds undiscounted claims reserves (including reserves to cover claims which have been incurred but not reported (IBNR reserves)) for all classes at a sufficient level to meet all liabilities as they fall due, having regard to actuarial estimates and the volatility observed and expected in the claims in each class. Group policy ensures that the net unearned premium reserves are adequate to meet the expected cost of claims and associated expenses in relation to the exposure after the balance sheet date. To the extent that the unearned premium reserves, net of reinsurance and deferred acquisition costs are inadequate, a liability adequacy provision will be held.
The Group’s policy is to hold appropriate levels of provisions, typically in excess of the actuarial best estimate, for the major classes of business.
Frequency and severity of specific risks and sources of uncertainty
The Group’s focus in its insurance operation is on high volume and relatively straightforward products, for example home and motor. This facilitates the generation of comprehensive underwriting and claims data, which are used to accurately price and monitor the risks accepted. This attention to data analysis is reinforced by tight controls on costs and claims handling procedures.
Most general insurance contracts are written on an annual basis, which means that the Group’s liability extends for a twelve month period, after which the Group is entitled to decline or renew or can impose renewal terms by amending the premium, terms and/or conditions.
Uncertainty regarding possible frequency and severity of claims arise as follows:
a) Motor insurance contracts (private and commercial): claims experience varies, but the principal factors include age, gender and driving experience, together with the type of vehicle and location.
b) Property insurance contracts (residential and commercial): short-term uncertainty is mainly driven by weather conditions. Over a longer period, the strength of the economy is also a factor.
c) Other commercial insurance contracts: claims may arise from business interruption and loss arising from the negligence of the insured (liability insurance). Business interruption losses come from the loss of income, revenue and/or profit as a result of property damage claims. Liability insurance includes employers liability and public/products liability.
Fluctuations in the social, economic and legislative climate are a source of uncertainty in the Group’s general liability account, and in particular court judgements and legislation, significant events (for example terrorist attacks), any emerging new heads of damage and types of claim that are not envisaged when the policy is written.
Life business
The three regulated life companies of the Group, National Westminster Life Assurance Limited, Royal Scottish Assurance plc and Direct Line Life Insurance Company Limited, are required to meet minimum capital requirements at all times under the Financial Service Authority’s Prudential Sourcebook.
The capital resources covering the regulatory requirement are not transferable to other areas of the Group. To ensure that the capital requirement is satisfied at all times, each company holds a voluntary buffer above the regulatory minimum.
The Group is not exposed to price, currency, credit, or interest risk on unit linked life contracts but it is exposed to variation in management fees. A decrease of 10% in the value of the assets would reduce the asset management fees by £2 million per annum (2006 – £5 million). The Group also writes insurance contracts with minimum guaranteed death benefits that expose it to the risk that declines in the value of underlying investments may increase the Group’s net exposure to death risk.
Operational risk
Operational risks are inherent in the Group’s business. Operational risk losses occur as the result of fraud, human error, missing or inadequately designed processes, failed systems, damage to physical assets, improper behaviour or from external events.
To ensure appropriate responsibility is allocated for the management, reporting and escalation of operational risk, the Group operates a three lines of defence model which outlines principles for the roles, responsibilities and accountabilities for operational risk management:
| · | The first line of defence is the business line management. This is where the primary responsibility resides for the identification, management and mitigation of the risks associated with the products and processes of the business. This accountability includes regular testing and certification of the adequacy and effectiveness of controls and compliance with Group Policies including the Group’s Operational Risk Policy and Principles (“ORPP”). |
| | |
| · | The second line of defence is the Operational Risk community. The Group Operational Risk department is responsible for the design and ownership of the ORPP. The ORPP provides the principles and minimum standards for delivering effective operational risk management. It incorporates key processes including risk and control assessment, scenario analysis, loss data collection, new product approval process, key risk indicators, notifiable events process, and the self certification process. Implementation of the ORPP is facilitated and overseen by Divisional Operational Risk teams who provide expert support and advice as well as oversight and challenge to business line management. |
Business review continued
| · | The third line of defence is audit. Group Internal Audit is responsible for assessing compliance with the ORPP and for providing independent evaluation of the adequacy and effectiveness of the risk and control framework. |
Basel II introduces for the first time, a specific capital charge for operational risk. From launch in 2008, the Group will initially apply the Standardised Approach.
Regulatory risk and supervision
The approach to regulatory risk has three distinct elements:
| · | Review of potential changes in regulation to ensure the Group addresses the risks arising from such changes and implement them appropriately. |
| | |
| · | Monitoring of compliance with existing rules and regulations and mitigating the consequences of any inadvertent non- compliance. |
| | |
| · | Management of effective relationships with regulators to ensure open two-way communication. |
The Group and its subsidiaries are fully engaged with regulatory authorities in all the jurisdictions in which they operate, in response to regulators’ on-going supervisory requirements.
Under a Group-wide framework of high-level policies, regulatory risk is managed by developing, maintaining and implementing local policies and systems to ensure effective compliance. The Group‘s operating processes are designed so as to meet all regulatory and legal requirements in all jurisdictions that the Group operates in.
The Group works with domestic and international trade associations, and proactively engages with regulators, especially the UK Financial Services Authority (FSA), as well as with other influential stakeholders such as the Basel Committee, the Committee of European Banking Supervisors and the EU Commission, to gain an appropriate understanding of planned changes and to contribute to regulatory policy formulation.
Following the acquisition of ABN AMRO, the Group operates in over 50 countries.
In the normal course of business the Group and its subsidiaries co-operate with regulatory authorities in various jurisdictions in their enquiries or investigations into alleged or possible breaches of regulations.
The Group has co-operated fully with various regulatory reviews of the operation of retail banking and consumer credit industries in the UK and elsewhere. The outcome of these reviews is outside the Group’s control and it is not possible to predict the effect, if any, on the Group’s operations of future changes in regulatory actions and policies. For further details of certain investigation to which the Group is subject, please read "Additional information - Investigations".
Governance
| 73 | Board of directors |
| | and secretary |
| | |
| 75 | Report of the directors |
| | |
| 80 | Corporate governance |
| | |
| 87 | Directors’ remuneration report |
| | |
| 97 | Directors’ interests in shares |
| | |
| 98 | Statement of directors’ |
| | responsibilities |
Board of directors and secretary
Chairman
1. Sir Tom McKillop (age 64)
C, N, R
Appointed to the Board as Deputy Chairman in September 2005, Sir Tom is a non-executive director of BP p.l.c., and president of the Science Council. He was formerly chief executive of AstraZeneca PLC, and was previously president of the European Federation of Pharmaceutical Industries and Associations and chairman of the British Pharma Group. He is a trustee of the Council for Industry and Higher Education.
Executive directors
Group Chief Executive
2. Sir Fred Goodwin (age 49)
DUniv, FCIBS, FCIB, FIB, LLD
C
Appointed to the Board in August 1998, Sir Fred is a Chartered Accountant. He was formerly chief executive and director, Clydesdale Bank PLC and Yorkshire Bank PLC. He is chairman of The Prince’s Trust, a non-executive director of Bank of China Limited and a former president of the Chartered Institute of Bankers in Scotland.
Group Finance Director
3. Guy Whittaker (age 51)
C
Appointed to the Board in February 2006, Guy Whittaker joined RBS after spending 25 years with Citigroup. He was formerly the Group treasurer based in New York and prior to that had held a number of management positions within the financial markets business based in London.
Chief Executive, Corporate Markets
4. Johnny Cameron (age 53) FCIBS
Appointed to the Board in March 2006, Johnny Cameron joined RBS from Dresdner Kleinwort Benson in 1998. In 2000, he was appointed Deputy Chief Executive of Corporate Banking & Financial Markets (CBFM) with responsibility for the integration of the NatWest and RBS Corporate Banking businesses. In October 2001 he was appointed Chief Executive CBFM, subsequently renamed Corporate Markets in January 2006.
Chairman, RBS America and
Citizens Financial Group, Inc.
5. Lawrence Fish (age 63)
Appointed to the Board in January 1993, Lawrence Fish is an American national. He is a career banker and was previously a director of the Federal Reserve Bank of Boston. He is a an incorporator of the Massachusetts Institute of Technology (MIT), a trustee of The Brookings Institution, and a director of Textron Inc. and numerous community organisations in the USA. Mr. Fish became a non - executive director as of 1 May 2008.
Chairman, Managing Board, ABN AMRO
6. Mark Fisher (age 47) FCIBS
Appointed to the Board in March 2006, Mark Fisher is a career banker having joined National Westminster Bank Plc in 1981. In 2000, he was appointed Chief Executive, Manufacturing with various responsibilities including the integration of RBS and NatWest systems platforms. Mark Fisher is Chief Executive Officer of ABN AMRO and was appointed as Chairman of the Managing Board in November 2007.
Chief Executive, Retail Markets
7. Gordon Pell (age 58) FCIBS, FCIB
Appointed to the Board in March 2000, Gordon Pell was formerly group director of Lloyds TSB UK Retail Banking before joining National Westminster Bank Plc as a director in February 2000 and then becoming Chief Executive, Retail Banking. He is also a director of Race for Opportunity and a member of the FSA Practitioner Panel. He was appointed chairman of the Business Commission on Racial Equality in the Workplace in July 2006 and deputy chairman of the Board of the British Bankers Association in September 2007.
Non-executive directors
8. Colin Buchan* (age 53)
A, C, R
Appointed to the Board in June 2002, Colin Buchan was educated in South Africa and spent the early part of his career in South Africa and the Far East. He has considerable international investment banking experience, as well as experience in very large risk management in the equities business. He was formerly a member of the group management board of UBS AG and head of equities of UBS Warburg, and was the former chairman of UBS Securities Canada Inc. He is a director of Standard Life plc, Merrill Lynch World Mining Trust Plc, Merrill Lynch Gold Limited, Royal Scottish National Orchestra Society Limited and World Mining Investment Company Limited.
9. Jim Currie* (age 66) D.Litt
R
Appointed to the Board in November 2001, Jim Currie is a highly experienced senior international civil servant who spent many years working in Brussels and Washington. He was formerly director general at the European Commission with responsibility for the EU’s environmental policy and director general for Customs and Excise and Indirect Taxation. He is currently a director of Total Upstream UK Limited, The Met Office and Vimetco N.V. as well as an international adviser to Eversheds.
10. Bill Friedrich* (age 59)
A
Appointed to the Board in March 2006, Bill Friedrich is the former deputy chief executive of BG Group plc. He previously served as general counsel for British Gas plc and is a former partner of Shearman & Sterling where he practised as a general corporate lawyer working for several of the world's leading financial institutions.
11. Archie Hunter* (age 64)
A (Chairman), C, N
Appointed to the Board in September 2004, Archie Hunter is a Chartered Accountant. He was Scottish senior partner of KPMG between 1992 and 1999 and president of The Institute of Chartered Accountants of Scotland in 1997/1998. He has extensive professional experience in the UK and North and South America. He is currently chairman of Macfarlane Group plc, a director of Edinburgh US Tracker Trust plc and a governor of the Beatson Institute for Cancer Research.
12. Charles ‘Bud’ Koch (age 61)
Appointed to the Board in September 2004, Bud Koch is an American national. He has extensive professional experience in the USA and is immediate past chairman of the board of John Carroll University and a trustee of Case Western Reserve University. He was chairman, president and chief executive officer of Charter One Financial, Inc. and its wholly owned subsidiary, Charter One Bank, N.A. between 1973 and 2004. He is also a director of Assurant, Inc and a public interest director of the Federal Home Loan Bank of Cincinnati.
13. Janis Kong* (age 57) OBE, DUniv
R
Appointed to the Board in January 2006, Janis Kong was formerly executive chairman of Heathrow Airport Limited, chairman of Heathrow Express Limited and a director of BAA plc. She is currently a non-executive director of Kingfisher plc and Portmeirion Group plc. She is also chairman of Forum for the Future and a member of the board of Visit Britain.
14. Joe MacHale* (age 56)
A
Appointed to the Board in September 2004, Joe MacHale is currently the senior independent director and chairman of the audit committee of Morgan Crucible plc, a non-executive director and chairman of the remuneration committee of Brit Insurance Holdings plc, and a trustee of MacMillan Cancer Support. He held a number of senior executive positions with J P Morgan between 1979 and 2001 and was latterly chief executive of J P Morgan Europe, Middle East and Africa Region.
15. Sir Steve Robson* (age 64)
A
Appointed to the Board in July 2001, Sir Steve is a former senior UK civil servant, who had responsibility for a wide variety of Treasury matters. His early career included the post of private secretary to the Chancellor of the Exchequer and secondment to ICFC (now 3i). He was also a second permanent secretary of HM Treasury, where he was managing director of the Finance and Regulation Directorate. He is a non-executive director of JP Morgan Cazenove Holdings, Xstrata Plc, The Financial Reporting Council Limited and Partnerships UK plc, and a member of the Chairman’s Advisory Committee of KPMG.
16. Bob Scott* (age 66) CBE, FCIBS
C, N, R (Chairman)
Appointed to the Board in January 2001, Bob Scott is an Australian national. He is the senior independent director. He has many years’ experience in the international insurance business and played a leading role in the consolidation of the UK insurance industry. He is a former group chief executive of CGNU plc (now Aviva plc) and former chairman of the board of the Association of British Insurers. He is currently chairman of Yell Group plc and a non-executive director of Swiss Reinsurance Company and Jardine Lloyd Thompson Group plc. He is also a trustee of the Crimestoppers Trust, an adviser to Duke Street Capital Private Equity and a board member of Pension Insurance Corporation Holdings LLP.
17. Peter Sutherland* (age 61) KCMG
C, N, R
Appointed to the Board in January 2001, Peter Sutherland is an Irish national. He is a former attorney general of Ireland and from 1985 to 1989 was the European Commissioner responsible for competition policy. He is chairman of BP p.l.c. and Goldman Sachs International. He was formerly chairman of Allied Irish Bank and director general of GATT and its successor, the World Trade Organisation.
Group Secretary and General Counsel
18. Miller McLean (age 58)
FCIBS, FIB
C
Miller McLean was appointed Group Secretary in August 1994. He is a trustee of the Industry and Parliament Trust, non-executive chairman of The Whitehall and Industry Group, director of The Scottish Parliament and Business Exchange and president of the Chartered Institute of Bankers in Scotland.
| A | member of the Audit Committee |
| C | member of the Chairman’s Advisory Group |
| N | member of the Nominations Committee |
| R | member of the Remuneration Committee |
| * | independent non-executive director |
Report of the directors
The directors have pleasure in presenting their report together with the audited accounts for the year ended 31 December 2007.
Profit and dividends
The profit attributable to the ordinary shareholders of the company for the year ended 31 December 2007 amounted to £7,303 million compared with £6,202 million for the year ended 31 December 2006, as set out in the consolidated income statement on page 102.
An interim dividend of 10.1p per ordinary share was paid on 5 October 2007 totalling £953 million (2006 – £771 million). The directors now recommend that, subject to approval at the Annual General Meeting, a final dividend of 23.1p per ordinary share totalling £2.3 billion (2006 – £2.1 billion) be paid on 6 June 2008 to members on the register at the close of business on 7 March 2008.
Business review
Activities
The company is a holding company owning the entire issued ordinary share capital of The Royal Bank of Scotland, the principal direct operating subsidiary undertaking of the company. The “Group” comprises the company and all its subsidiary and associated undertakings, including The Royal Bank of Scotland and NatWest. Details of the principal subsidiary undertakings of the company are shown in Note 16 on the accounts.
The Group is engaged principally in providing a wide range of banking, insurance and other financial services. Further details of the organisational structure and business overview of the Group, including the products and services provided by each of its divisions and the competitive markets in which they operate, is contained on pages 4 to 6 of the Business review.
Risk factors
The Group’s future performance and results could be materially different from expected results depending on the outcome of certain potential risks and uncertainties. Details of the principal risk factors the Group faces are given on pages 13 to 15 of the Business review.
The reported results of the Group are also sensitive to the accounting policies, assumptions and estimates that underlie the preparation of its financial statements. Details of the Group’s critical accounting policies and key sources of accounting judgements are included in the Accounting policies on pages 106 to 120.
The Group’s approach to risk management, including its financial risk management objectives and policies and information on the Group’s exposure to price, credit, liquidity and cash flow risk is discussed in Note 31 on the accounts.
Financial performance
A review of the Group’s performance during the year ended 31 December 2007, including details of each division, and the Group’s financial position as at that date is contained in the Business review on pages 16 to 50.
Business developments
In October 2007, RFS Holdings B.V. (“RFS Holdings”), a company jointly owned by the company, Fortis N.V., Fortis SA/NV and Banco Santander S.A. (the “Consortium Banks”) and controlled by the company, completed the acquisition of ABN AMRO Holding N.V. (“ABN AMRO”).
In due course, RFS Holdings will implement an orderly separation of the business units of ABN AMRO with the company retaining the following ABN AMRO business units:
| · | Continuing businesses of Business Unit North America; |
| | |
| · | Business Unit Global Clients and wholesale clients in the Netherlands (including former Dutch wholesale clients) and Latin America (excluding Brazil); |
| | |
| · | Business Unit Asia (excluding Saudi Hollandi); and |
| | |
| · | Business Unit Europe (excluding Antonveneta). |
Certain other assets will continue to be shared by the Consortium Banks.
Employees
As at 31 December 2007, the Group employed over 226,000 employees (full-time equivalent basis) throughout the world including almost 90,000 employees in ABN AMRO. Details of employee related costs are included in Note 2 on the accounts on page 122.
Employee recruitment
Across the Group worldwide, over 30,000 employees are recruited at different levels every year. The Group utilises a wide range of recruitment channels including its in-house search function, external executive search suppliers, general advertising, an open internal jobs market, talent reviews and detailed succession planning to ensure that the recruitment and development of its employees is fully aligned to its organisational requirements.
Employee reward
The Group recognises that its continuing success is closely linked to the performance, skills and individual commitment of its employees.
The Group aims to attract and retain the most talented people. To stay ahead of the market, salaries are routinely compared with those paid for similar roles by competitors, and individual performance is recognised and rewarded.
The Group offers a comprehensive remuneration and benefits package, Total Reward, to all employees. Total Reward is externally recognised as offering one of the most innovative and flexible remuneration and benefits programmes in the financial services sector.
Within this package, RBSelect, the Group’s benefits choice programme, aims to provide employees with a wide range of benefits to choose from that suits their needs and lifestyle. Its aim is to make sure there are choices to suit everyone right across the Group, and during 2007 this approach was extended to a number of non-UK employees.
Employees also participate in bonus incentive plans specific to their business and share in the Group’s ongoing success through the Profit Share, Buy As You Earn and Sharesave schemes, which align their interests with those of shareholders.
Employee learning and development
The Group maintains a strong commitment to creating and providing learning opportunities for all its employees through a variety of personal development and training programmes and learning networks. The Group’s employees are encouraged to volunteer to work with its community partners. The Group continues to invest in leadership and management development which is consistent with its objective of being the employer of choice: attracting, rewarding and retaining the very best talent.
Many of the Group’s development programmes are delivered at the RBS Business School based on the Gogarburn Campus.
Employee communication
Employee engagement is encouraged through a range of communication channels, at both a divisional and Group level. These channels provide access to news and information in a number of ways, including the intranet, magazines, team meetings led by line managers, briefings held by senior managers and regular dialogue with employees and employee representatives.
The Group Chief Executive and other senior Group executives regularly communicate with employees through ‘Question Time’ style programmes, broadcast on the Group’s internal television network.
Employee consultation
Each year, all employees are invited to complete the global Employee Opinion Survey. The survey is confidential and independently managed by Towers-Perrin Independent Survey Research (TP-ISR). The survey provides a channel for employees to express their views and opinions about the Group on a range of key issues.
In 2007, the response rate was 90%. This is the highest it has ever been, and 20% higher than the financial services norm. This represents over 129,000 employees participating in the survey across 36 countries and in nine languages. Online coverage of the survey increased to 95% globally.
The Group outperformed the ‘global financial services norm’ in every one of the 15 categories for the third year in succession. The survey results are presented to the Board and at divisional and team levels. Action plans are developed to address any issues identified.
The Group recognises employer representative organisations such as trade unions and work councils in a number of businesses and countries. The Group has a European Employee Communication Council that provides elected representatives with an opportunity to better understand the impact on its European operations.
Diversity
The Group’s Managing Diversity policy sets a framework for broadening the Group’s talent base, achieving the highest levels of performance and enabling all employees to reach their full potential irrespective of age, disability, gender, marital status, political opinion, race, religious belief or sexual orientation.
The Group is also committed to ensuring that all prospective applicants for employment are treated fairly and equitably throughout the recruitment process. Its comprehensive resourcing standards cover the attraction and retention of individuals with disabilities. Reasonable adjustments are provided to support applicants in the recruitment process where these are required. The Group provides reasonable workplace adjustments for new entrants into the Group and for existing employees who become disabled during their employment.
Health, safety, wellbeing and security
The health, safety, wellbeing and security of employees and customers continues to be a priority for the Group. Regular reviews are undertaken of both policies and processes to ensure compliance with current legislation and best practice. The Group focus is on ensuring that these policies are closely linked to the operational needs of the business. Health and safety standards within high risk areas and activities have been reviewed and action taken to further improve performance.
During 2007, the development of global health, safety and wellbeing arrangements has been a key priority, to ensure equitable standards of health and safety for all Group employees. The Employee Assistance Programme, which provides advice on a range of personal and work related matters, has been further enhanced and the coverage extended during the year.
Pre-employment screening
The Group has a comprehensive pre-employment screening policy to guard against possible infiltration and employee-related fraud. In addition to existing workplace security measures, all people engaged in the Group are screened prior to commencing employment.
Code of ethics
The Group has a code of ethics applicable to all employees in every country of its operations and is available in eleven languages and a copy is available on request.
Report of the directors continued
Corporate responsibility
Business excellence requires that the Group meets changing customer, shareholder, investor, employee and supplier expectations. The Group believes that meeting high standards of environmental, social and ethical responsibility is key to the way it does business.
In 2007, the Group undertook a survey to identify and prioritise the issues that stakeholders care about in relation to the financial services sector. This allows the Group to focus corporate responsibility activities on issues which matter most to stakeholders. Financial crime and corruption is the primary focus, followed by consumer banking issues, employee practices, direct environmental impact, community investment, global lending and project finance, financial inclusion and capability and support for small businesses. The Group takes all these responsibilities seriously, continually monitoring and managing them through policies and practices across the Group. The Board regularly considers corporate responsibility issues and receives a formal report on these each year.
Further details of the Group’s corporate responsibility policies will be contained in the 2007 Corporate Responsibility Report.
Going concern
The directors are satisfied that the Group has adequate resources to continue in business for the foreseeable future. For this reason, they continue to adopt the ‘going concern’ basis for preparing the accounts.
Corporate governance
The company is committed to high standards of corporate governance. Details are given on pages 80 to 86.
Ordinary share capital
In May 2007, the company capitalised £1,576 million of its share premium account by way of a bonus issue of two new ordinary shares of 25p each for every one ordinary share held by shareholders at close of business on 4 May 2007. As of 8 May 2007, the authorised ordinary share capital of the company increased by £1,609 million (6,434,972,616 ordinary shares of 25p each) and the allotted, called-up and fully paid ordinary share capital increased by £1,576 million (6,304,298,670 ordinary shares of 25p each).
During the year, the ordinary share capital was also increased by 530.6 million ordinary shares issued to former ABN AMRO shareholders and 19.1 million ordinary shares allotted as a result of the exercise of options under the company’s share schemes.
Details of the authorised and issued ordinary share capital at 31 December 2007 are shown in Note 26 on the accounts.
Preference share capital
Details of issues and redemptions of preference shares during the year and the authorised and issued preference share capital at 31 December 2007 are shown in Note 26 on the accounts.
Authority to repurchase shares
At the Annual General Meeting in 2007, shareholders renewed the authority for the company to make market purchases of up to 958,712,195 ordinary shares. The directors have not exercised this authority to date. Shareholders will be asked to renew this authority at the Annual General Meeting in April 2008.
Additional information
Where not provided previously in the Report of the directors, the following provides the additional information required to be disclosed by Part 7 of the Companies Act 1985 as amended.
Details of the ordinary and preference share capital are provided in Note 26 on the accounts on pages 159 to 161. The rights and obligations attaching to the company’s ordinary shares and preference shares are set out in the company’s Articles of Association, copies of which can be obtained from Companies House in the UK or by writing to the Group Secretary and General Counsel.
On a show of hands at a general meeting of the company every holder of ordinary shares and cumulative preference shares present in person or by proxy and entitled to vote shall have one vote. On a poll, every holder of ordinary shares present in person or by proxy and entitled to vote shall have one vote for every share held. On a poll, holders of cumulative preference shares present in person or by proxy and entitled to vote shall have four votes for every share held. The Notice of the Annual General Meeting specifies the deadlines for exercising voting rights and appointing a proxy or proxies to vote in relation to resolutions to be passed at the general meeting.
The cumulative preference shares represent less than 0.04% of the total voting rights of the company, the remaining being represented by the ordinary shares.
There are no restrictions on the transfer of ordinary shares in the company other than certain restrictions which may from time to time be imposed by laws and regulations (for example, insider trading laws). Pursuant to the Listing Rules of the Financial Services Authority certain employees of the company require the approval of the company to deal in the company’s shares.
A number of the company’s share plans include restrictions on transfers of shares while the shares are subject to the plans, in particular the Employee Share Ownership Plan.
The rights and obligations of holders of non-cumulative preference shares are set out in Note 26 on the accounts on page 161.
The company is not aware of any agreements between shareholders that may result in restrictions on the transfer of securities and/or voting rights. There are no persons holding securities carrying special rights with regard to control of the company.
Under the rules of certain employee share plans, eligible employees are entitled to acquire shares in the company, and shares are held in trust for participants by The Royal Bank of Scotland and Ulster Bank Dublin Trust Company as Trustees. Voting rights are exercised by the Trustees on receipt of participants’ instructions. If a participant does not submit an instruction to the Trustee no vote is registered.
The Royal Bank of Scotland Group plc 2001 Employee Share Trust and The Royal Bank of Scotland plc 1992 Employee Share Trust are used to hold shares on behalf of the Group’s executive share plans. The voting rights are exercisable by the Trustees, however, in accordance with investor protection guidelines, the Trustees abstain from voting. The Trustees would take independent advice before accepting any offer for the company in a takeover bid situation.
The rules governing the appointment of directors is set out in the Corporate Governance Report on page 80. The company’s Articles of Association may only be amended by a special resolution at a general meeting of shareholders.
A change of control of the company following a takeover bid may cause a number of agreements to which the company is party to take effect, alter or terminate. In addition, a number of executive directors' service agreements may be affected on a change of control. All of the company’s employee share plans contain provisions relating to a change of control. Outstanding awards and options may vest and become exercisable on change of control, subject where appropriate to the satisfaction of any performance conditions at that time and pro-rating of awards. In the context of the company as a whole, these agreements are not considered to be significant.
Directors
The names and brief biographical details of the directors are shown on pages 73 and 74. All directors served throughout the year and to the date of signing of the financial statements.
Larry Fish became non-executive Chairman, RBS America and Citizens Financial Group, Inc. with effect from 1 January 2008. On 1 May 2008, he will become a non-executive director of the company and will continue in the role of non-executive Chairman, RBS America and Citizens Financial Group, Inc.
Colin Buchan, Jim Currie, Janis Kong, Sir Tom McKillop, Sir Steve Robson and Guy Whittaker will retire and offer themselves for re-election at the company’s Annual General Meeting on 23 April 2008.
Details of the service agreement for Guy Whittaker are set out on pages 90 and 91. No other director seeking election or re-election has a service agreement.
Directors’ interests
The interests of the directors in the shares of the company at 31 December 2007 are shown on page 97. None of the directors held an interest in the loan capital of the company or in the shares and loan capital of any of the subsidiary undertakings of the company, during the period from 1 January 2007 to 27 February 2008.
Directors' indemnities
In terms of section 236 of the Companies Act 2006, the directors of the company, members of the Group Executive Management Committee and Approved Persons of the Group (under the Financial Services and Markets Act 2000) have been granted Qualifying Third Party Indemnity Provisions by the company.
In terms of section 236 of the Companies Act 2006, Qualifying Pension Scheme Indemnity Provisions (‘QPSIP’) have been issued by the company to a number of pension trustees/directors of in-house corporate trustees of the Group’s pension schemes. The intention is to issue QPSIPs to all pension trustees of the Group’s pension schemes during 2008.
Directors' disclosure to auditors:
Each of the directors at the date of approval of this report confirms that:
(a) so far as the director is aware, there is no relevant audit information of which the company’s auditors are unaware;
and
(b) the director has taken all the steps that he/she ought to have taken as a director to make himself/herself aware of any relevant audit information and to establish that the company’s auditors are aware of that information.
This confirmation is given and should be interpreted in accordance with the provisions of section 234ZA of the Companies Act 1985.
Report of the directors continued
Shareholdings
The table below shows the shareholders that have notified us that they hold more than 3% of the voting rights in the undernoted classes of shares.
| | Number of shares | % held | | | Number of shares | % held |
| Ordinary shares: | | | | 5½% cumulative preference shares: | | |
| Legal & General Group plc | 504,686,799 | 5.04 | | Mr P S and Mrs J M Allen; | | |
| 11% cumulative preference shares: | | | | Miss C L Allen, and Miss J C Allen | 451,796 | 28.23 |
| Guardian Royal Exchange Assurance plc | 129,830 | 25.97 | | Commercial Union Assurance plc | 91,429 | 22.86 |
| Windsor Life Assurance Company Limited | 51,510 | 10.30 | | Bassett-Patrick Securities Limited* | 46,255 | 11.56 |
| Mr S. J. and Mrs J. A. Cockburn | 15,520 | 3.10 | | E M Behrens Charitable Trust | 20,000 | 5.00 |
| Mr Stephen J Cockburn | 15,290 | 3.06 | | Mrs Gina Wild | 19,800 | 4.95 |
| Cleaning Tokens Limited | 25,500 | 5.10 | | Trustees of The Stephen Cockburn | | |
| | | | | Limited Pension Scheme | 19,879 | 4.97 |
| | | | | Miss Elizabeth Hill | 16,124 | 4.03 |
| | | | | Mr W. T. Hardison Jr. | 13,532 | 3.38 |
*Notification has been received on behalf of Mr A. W. R. Medlock and Mrs H. M. Medlock that they each have an interest in the holding of 5½% cumulative preference shares registered in the name of Bassett-Patrick Securities Limited noted above and that there are further holdings of 5,300 and 5,000 shares, respectively, of that class registered in each of their names.
Charitable contributions
In 2007 the contribution to the Group’s Community Investment programmes was £57.7 million (2006 – £58.6 million). The total amount given for charitable purposes by the company and its subsidiary undertakings during the year ended 31 December 2007 was £32.1 million (2006 – £25.4 million).
Political donations
At the Annual General Meeting in 2006, shareholders gave authority for the company to make political donations and incur political expenditure up to a maximum aggregate sum of £500,000 as a precautionary measure in light of the wide definitions in The Political Parties, Elections and Referendums Act 2000, for a period of four years. These authorities have not been used.
No political donations were made during the year and it is not proposed that the Group’s longstanding policy of not making contributions to any political party be changed.
Policy and practice on payment of creditors
The Group is committed to maintaining a sound commercial relationship with its suppliers. Consequently, it is the Group’s policy to negotiate and agree terms and conditions with its suppliers, which includes the giving of an undertaking to pay suppliers within 30 days of receipt of a correctly prepared invoice submitted in accordance with the terms of the contract or such other payment period as may be agreed.
At 31 December 2007, the Group’s trade creditors represented 30 days (2006 – 28 days) of amounts invoiced by suppliers.
Auditors
The auditors, Deloitte & Touche LLP, have indicated their willingness to continue in office. A resolution to re-appoint Deloitte & Touche LLP as the company’s auditor will be proposed at the forthcoming Annual General Meeting.
By order of the Board.
Miller McLean
Secretary
27 February 2008
The Royal Bank of Scotland Group plc is registered in Scotland No. 45551.
Corporate governance
The company is committed to high standards of corporate governance, business integrity and professionalism in all its activities.
Throughout the year ended 31 December 2007, the company has complied with all of the provisions of the revised Combined Code issued by the Financial Reporting Council in June 2006 (the “Code”) except in relation to the authority reserved to the Board to make the final determination of the remuneration of the executive directors, which is explained in the paragraph headed ‘Remuneration Committee’.
The company has also complied with the Smith Guidance on Audit Committees in all material respects.
Under the US Sarbanes-Oxley Act of 2002 (the “Act”), specific standards of corporate governance and business and financial disclosures apply to companies with securities registered in the US. The company complies with all applicable sections of the Act.
The New York Stock Exchange
As a foreign issuer with American Depositary Shares (“ADS”) representing ordinary shares, preference shares and debt securities listed on the New York Stock Exchange (“NYSE”), the company must disclose any significant ways in which its corporate governance practices differ from those followed by US companies under the NYSE’s corporate governance listing standards. In addition, the company must comply fully with the provisions of the listing standards that relate to the composition, responsibilities and operation of audit committees. These provisions incorporate the relevant rules concerning audit committees of the US Securities Exchange Act of 1934.
The company has reviewed its corporate governance arrangements and is satisfied that these are consistent with the NYSE’s corporate governance listing practices, with the exception of the following. The Nominations Committee is chaired by the Chairman of the Board, who may not be currently considered independent under the UK Combined Code, and the Chairman of the Board is a member of the Remuneration Committee, both of which are permitted by the UK Combined Code (since the Chairman was considered independent on appointment). The company’s Audit, Nomination and Remuneration Committees are otherwise composed solely of non-executive directors deemed by the Board to be independent. The NYSE’s corporate governance listing standards also require that a compensation committee has direct responsibility to review and approve Group Chief Executive remuneration. The Board, rather than the Remuneration Committee, reserves the authority to make the final determination of the remuneration of the Group Chief Executive, which is explained on page 82 in the paragraph headed ‘Remuneration Committee’.
The Group Audit Committee complies with the provisions of the NYSE’s corporate governance listing standards that relate to the composition, responsibilities and operation of audit committees. In May 2007, the company submitted its required annual written affirmation to the NYSE confirming its full compliance with those and other applicable provisions. In addition, following the listing of ADS representing common shares on the NYSE, an interim written affirmation was required and was filed in October 2007. More detailed information about the Audit Committee and its work during 2007 is set out in the Audit Committee’s Report on pages 83 and 84.
Board of directors
The Board is the principal decision-making forum for the company. It has overall responsibility for leading and controlling the company and is accountable to shareholders for financial and operational performance. The Board approves Group strategy and monitors performance. The Board has adopted a formal schedule of matters detailing key aspects of the company’s affairs reserved to it for its decision. This schedule is reviewed annually.
The roles of the Chairman and Group Chief Executive are distinct and separate, with a clear division of responsibilities. The Chairman leads the Board and ensures the effective engagement and contribution of all non-executive and executive directors. The Group Chief Executive has responsibility for all Group businesses and acts in accordance with the authority delegated by the Board. Responsibility for the development of policy and strategy and operational management is delegated to the Group Chief Executive and other executive directors.
All directors participate in discussing strategy, performance and the financial and risk management of the company. Meetings of the Board are structured to allow open discussion.
There were nine scheduled Board meetings during 2007. The directors were supplied with comprehensive papers in advance of each Board meeting covering the Group’s principal business activities. Members of executive management attend and make regular presentations at meetings of the Board. In addition to scheduled meetings, 20 ad hoc Board meetings and Chairman’s Committee meetings were held during 2007 to consider the acquisition of ABN AMRO. These meetings were attended by the majority of directors.
The Board is aware of the other commitments of its directors and is satisfied that these do not conflict with their duties as directors of the company.
Board balance and independence
The Board currently comprises the Chairman, six executive directors and ten non-executive directors (with effect from 1 May 2008, and the change in role of Larry Fish to non-executive director of the company, the Board will comprise the Chairman, five executive directors and eleven non-executive directors). The Board functions effectively and efficiently, and is considered to be of an appropriate size in view of the scale of the company and the diversity of its businesses. The directors provide the Group with the knowledge, mix of skills, experience and networks of contacts required. The Board Committees contain directors with a variety of relevant skills and experience so that no undue reliance is placed on any individual.
Corporate governance continued
The non-executive directors combine broad business and commercial experience with independent and objective judgement. The balance between non-executive and executive directors enables the Board to provide clear and effective leadership and maintain the highest standards of integrity across the company’s business activities. The names and biographies of all Board members are set out on pages 73 and 74.
The composition of the Board is subject to continuing review and the provisions of the Code will be taken into account in respect of the balance of the Board. The Code requires the Board to determine whether its non-executive members are independent.
The Board comprises nine independent and seven non-independent directors (including executive directors), in addition to the Chairman. Bob Scott has been nominated as the senior independent director.
The Board considers that all non-executive directors are independent for the purposes of the Code, with the exception of Bud Koch who was formerly Chairman, President and Chief Executive Officer of Charter One Financial, Inc. which was acquired by Citizens Financial Group, Inc. in 2004. Larry Fish will not be considered an independent non-executive director from 1 May 2008.
Re-election of directors
At each Annual General Meeting, one third of the directors retire and offer themselves for re-election and each director must stand for re-election at least once every three years. Any non-executive directors who have served for more than nine years will also stand for annual re-election and the Board will consider their independence at that time. The proposed re-election of directors is subject to prior review by the Board.
The names of directors standing for re-election at the 2008 Annual General Meeting are contained on page 78 and further information will be given in the Chairman’s letter to shareholders in relation to the company’s Annual General Meeting.
Information, induction and professional development
All directors receive accurate, timely and clear information on all relevant matters. All directors have access to the advice and services of the Group Secretary and General Counsel who is responsible to the Board for ensuring that Board procedures are followed and that applicable rules and regulations are complied with. In addition, all directors are able, if necessary, to obtain independent professional advice at the company’s expense.
Each new director receives a formal induction on joining the Board, including visits to the Group’s major businesses and meetings with directors and senior management. The induction is tailored to the director’s specific requirements. Directors are advised of appropriate training and professional development opportunities and undertake the training and professional development they consider necessary in assisting them to carry out their duties as a director.
Performance evaluation
The Board has undertaken a formal and rigorous annual evaluation of its own performance and that of its committees and individual directors.
The performance evaluation of the operation and effectiveness of the Board, the Remuneration Committee and the Nominations Committee was undertaken in the autumn of 2007. This was conducted internally using a detailed questionnaire and individual meetings with each director. Amongst the areas reviewed were the role of the Board, Board composition, Board meetings and processes, Board performance and reporting, external relationships and Board Committees. A separate performance evaluation of the Audit Committee was also undertaken internally in late 2007 using a detailed questionnaire and meetings with Audit Committee members and attendees.
The report on the Board evaluation, which was designed to assist the Board in further improving its performance, was considered and discussed by the Board as a whole and a separate report on the outcomes of the evaluation of the Audit Committee was also considered and discussed by the Board. The Board evaluation involved detailed consideration of Board composition, Board engagement in risk management and capital planning and the format of the Board meetings. The Board also considered the range and balance of its activities and was content that it was allocating appropriate time to such key matters as monitoring business performance, risk appetite and strategy.
Taking into account their review and discussions the directors have concluded that the Board is effective in meeting its objectives and fulfilling its duties and obligations. The directors are also satisfied that each of the Board’s Committees (Audit, Remuneration and Nominations) carries out its delegated duties effectively.
In addition, each director discussed his or her own performance as a director and their Board evaluation questionnaire with the Chairman. The senior independent director canvassed the views of the executive directors and met with the non-executive directors as a group without the Chairman present to consider the Chairman’s performance. The Board is satisfied that each director continues to contribute effectively to the Board and the Group and demonstrates commitment to his or her role as a director.
Board Committees
In order to provide effective oversight and leadership, the Board has established a number of Board Committees with particular responsibilities. The Committee chairmanship and membership are reviewed on a regular basis. The names and biographies of all Board Committee members are set out on pages 73 and 74.
The terms of reference of the Audit, Remuneration and Nominations Committees and the standard terms and conditions of appointment of non-executive directors are available on the Group’s website (www.rbs.com) and copies are available on request.
Audit Committee
All members of the Audit Committee are independent non-executive directors. The Audit Committee holds at least five meetings each year. The Audit Committee’s report is set out on pages 83 and 84.
Remuneration Committee
The members of the Remuneration Committee comprise independent non-executive directors, together with the Chairman of the Board. The Remuneration Committee holds at least three meetings each year.
The Remuneration Committee is responsible for assisting the Board in discharging its responsibilities and making all relevant disclosures in relation to the formulation and review of the Group’s executive remuneration policy. The Remuneration Committee makes recommendations to the Board on the remuneration arrangements for the executive directors and the Chairman. The Directors’ Remuneration Report is contained on pages 87 to 96.
Responsibility for determining the remuneration of executive directors has not been delegated to the Remuneration Committee, and in that respect the provisions of the Code have not been complied with. The Board as a whole reserves the authority to make the final determination of the remuneration of directors as it considers that this two stage process allows greater consideration and evaluation and is consistent with the unitary nature of the Board. No director is involved in decisions regarding his or her own remuneration.
Nominations Committee
The Nominations Committee comprises independent non-executive directors, under the chairmanship of the Chairman of the Board. The Nominations Committee meets as required.
The Nominations Committee is responsible for assisting the Board in the formal selection and appointment of directors. It considers potential candidates and recommends appointments of new directors to the Board. The appointments are based on merit against objective criteria, including the time available of the potential director and the commitment which will be required.
In addition, the Nominations Committee considers succession planning for the Chairman, Group Chief Executive and non-executive directors. The Nominations Committee takes into account the knowledge, mix of skills, experience and networks of contacts which are anticipated to be needed on the Board in the future. The Chairman, Group Chief Executive and non-executive directors meet to consider executive succession planning. No director is involved in decisions regarding his or her own succession.
Meetings
The number of scheduled meetings of the Board and the Audit, Remuneration and Nominations Committees and individual attendance by members is shown below.
| | Board | Audit | Remuneration | Nominations |
Total number of meetings in 2007 | 9 | 6 | 3 | 2 |
Number of meetings attended in 2007 | | | | |
| Sir Tom McKillop | 9 | — | 3 | 2 |
| Sir Fred Goodwin | 9 | — | — | — |
| Mr Buchan | 8 | 6 | 3 | — |
| Mr Cameron | 8 | — | — | — |
| Dr Currie | 9 | — | 3 | — |
| Mr Fish | 9 | — | — | — |
| Mr Fisher | 9 | — | — | — |
| Mr Friedrich | 9 | 6 | — | — |
| Mr Hunter | 9 | 6 | — | 2 |
| Mr Koch | 9 | — | — | — |
| Mrs Kong | 9 | — | 3 | — |
| Mr MacHale | 9 | 6 | — | — |
| Mr Pell | 9 | — | — | — |
| Sir Steve Robson | 9 | 5 | — | — |
| Mr Scott | 9 | — | 3 | 2 |
| Mr Sutherland | 8 | — | 3 | 1 |
| Mr Whittaker | 9 | — | — | — |
Relations with shareholders
The company communicates with shareholders through the Annual Report and by providing information in advance of the Annual General Meeting. Individual shareholders can raise matters relating to their shareholdings and the business of the Group at any time throughout the year. Shareholders are given the opportunity to ask questions at the Annual General Meeting or submit written questions in advance. The chairmen of the Audit, Remuneration and Nominations Committees are available to answer questions at the Annual General Meeting.
Communication with the company’s largest institutional shareholders is undertaken as part of the company’s investor relations programme. The Chairman meets with the Group’s top 20 investors once every 12 to 18 months to receive their feedback on issues such as strategy, business performance and corporate governance. During the year, the directors received copies of analysts’ reports and a monthly report from the Group’s investor relations department which includes an analysis of share price movements, the Group’s performance against the sector, and key broker comments. In addition, information on major investor relations activities and changes to external ratings is provided. The senior independent director would be available to shareholders if concerns could not be addressed through the normal channels. The arrangements used to ensure that directors develop an understanding of the views of major shareholders are considered as part of the annual Board performance evaluation.
Corporate governance continued
The Chairman, Group Chief Executive, Group Finance Director and, if appropriate, the senior independent director communicate shareholder views to the Board as a whole.
The Board commissions a survey of investor perceptions periodically. The survey is undertaken on behalf of the Board by independent consultants and the outcomes of the study are considered by the Board.
Audit Committee Report
The members of the Audit Committee are Archie Hunter (Chairman), Colin Buchan, Bill Friedrich, Joe MacHale and Sir Steve Robson. All members of the Audit Committee are independent non-executive directors. The Audit Committee holds at least five meetings each year, two of which are held immediately prior to submission of the interim and annual financial statements to the Group Board. This core programme is supplemented by additional meetings as required, four being added in 2007. Audit Committee meetings are attended by relevant executive directors, the internal and external auditors and finance and risk management executives. At least twice per annum the Audit Committee meets privately with the external auditors. Since 2000, the Audit Committee has undertaken an annual programme of visits to the Group's business divisions and control functions. The object of the programme is to allow the Audit Committee to gain a better understanding of the risk and control issues facing the Group and an invitation to attend is extended to all non-executive directors. The programme of future visits is considered annually and the norm is for three or four visits to be undertaken each year.
The Board is satisfied that all the Audit Committee members have recent and relevant financial experience. Although the Board has determined that each member of the Audit Committee is an ‘Audit Committee Financial Expert’ and is independent, each as defined in the SEC rules under the US Securities Exchange Act of 1934 and related guidance, the members of the Audit Committee are selected with a view to the expertise and experience of the Audit Committee as a whole, and the Audit Committee reports to the Board as a single entity. The designation of a director or directors as an ‘Audit Committee Financial Expert’ does not impose on any such director, any duties, obligations or liability that are greater than the duties, obligations and liability imposed on such director as a member of the Audit Committee and Board in the absence of such a designation. Nor does the designation of a director as an ‘Audit Committee Financial Expert’ affect the duties, obligations or liability of any other member of the Board.
The Audit Committee is responsible for:
| · | assisting the Board in discharging its responsibilities and in making all relevant disclosures in relation to the financial affairs of the Group; |
| | |
| · | reviewing accounting and financial reporting and regulatory compliance; |
| | |
| · | reviewing the Group’s systems of internal control; and |
| | |
| · | monitoring the Group’s processes for internal audit, risk management and external audit. |
Full details of the responsibilities of the Audit Committee are available at www.rbs.com
The Audit Committee has adopted a policy on the engagement of the external auditors to supply audit and non-audit services, which takes into account relevant legislation regarding the provision of such services by an external audit firm. The Audit Committee reviews the policy annually and prospectively approves the provision of audit services and certain non-audit services by the external auditors.
Annual audit services include all services detailed in the annual engagement letter including the annual audit and interim reviews (including US reporting requirements), periodic profit verifications and reports to regulators including skilled persons reports commissioned by the Financial Services Authority (e.g. Reporting Accountants Reports).
Annual audit services also include statutory or non-statutory audits required by any Group companies that are not incorporated in the UK. Terms of engagement for these audits are agreed separately with management, and are consistent with those set out in the audit engagement letter, as local regulations permit.
The prospectively approved non-audit services include the following classes of service:
| · | capital raising, including consents, comfort letters and relevant reviews of registration statements; |
| | |
| · | provision of accounting opinions relating to the financial statements of the Group; |
| | |
| · | provision of reports that, according to law or regulation, must be rendered by the external auditors; |
| | |
| · | tax compliance services; |
| | |
| · | corporate finance services relative to companies that will remain outside the Group; and |
| | |
| · | insolvency work relating to the Group’s customers. |
The Audit Committee approves all other permitted non-audit services on a case by case basis before their commencement. In addition, the Audit Committee reviews and monitors the independence and objectivity of the external auditors when it approves non-audit work to be carried out by them, taking into consideration relevant legislation and ethical guidance. Information on the audit and non-audit services carried out by the external auditors is detailed in Note 4 to the Group’s accounts.
Corporate governance continued
The Audit Committee undertakes an annual evaluation to assess the independence and objectivity of the external auditors and the effectiveness of the audit process, taking into consideration relevant professional and regulatory requirements. The results of this evaluation are reported to the Board.
The Audit Committee is responsible for making recommendations to the Board, for it to submit the Audit Committee’s recommendations to shareholders for their approval at the Annual General Meeting in relation to the appointment, reappointment and removal of the external auditors. The Board has endorsed the Audit Committee’s recommendation that shareholders be requested to approve the reappointment of Deloitte & Touche LLP as external auditors at the Annual General Meeting in April 2008.
The Audit Committee also fixes the remuneration of the external auditors as authorised by shareholders at the Annual General Meeting.
The Audit Committee approves the terms of engagement of the external auditors.
It is intended that there will be an external review of the effectiveness of Group Internal Audit every three to five years, in line with best practice, with internal reviews continuing in the intervening years. In 2007, KPMG conducted a review of the effectiveness of Group Internal Audit and concluded that the function operated effectively. The Board considered the external review findings and also concluded that the Group Internal Audit function was effective.
It is intended that there will be an external review of the effectiveness of the Audit Committee every three to five years, with internal reviews by the Board continuing in the intervening years. PricewaterhouseCoopers conducted an external review of the effectiveness of the Audit Committee in 2005. An internal review of the Audit Committee’s performance was undertaken in 2007 and a separate report on the outcome was considered and discussed by the Board which concluded that it effectively discharged its responsibilities.
Since 2005, divisional audit committees have been responsible for reviewing each division’s business. These committees report to the Audit Committee which has concluded that they operate effectively.
Archie Hunter
Chairman of the Audit Committee
27 February 2008
Internal Control
Management of The Royal Bank of Scotland Group (“the Group”) is responsible for the Group’s system of internal control that is designed to facilitate effective and efficient operations and to ensure the quality of internal and external reporting and compliance with applicable laws and regulations. In devising internal controls, the Group has regard to the nature and extent of the risk, the likelihood of it crystallising and the cost of controls. A system of internal control is designed to manage, but not eliminate, the risk of failure to achieve business objectives and can only provide reasonable, and not absolute, assurance against the risk of material misstatement, fraud or losses.
Management’s report on internal control over financial reporting
Management of the Group is responsible for establishing and maintaining adequate internal control over financial reporting for the Group.
The Group’s internal control over financial reporting is a component of an overall system of internal control. The Group’s internal control over financial reporting is a process designed to provide reasonable assurance regarding the preparation, reliability and fair presentation of financial statements for external purposes in accordance with International Financial Reporting Standards (“IFRS”) and it includes:
| · | Policies and procedures that relate to the maintenance of records that, in reasonable detail, fairly and accurately reflect the transactions and disposition of assets. |
| · | Controls providing reasonable assurance that transactions are recorded as necessary to permit the preparation of financial statements in accordance with IFRS, and that receipts and expenditures are being made only as authorised by management. |
| · | Controls providing reasonable assurance regarding prevention or timely detection of unauthorised acquisition, use or disposition of assets that could have a material effect on the financial statements. |
Because of its inherent limitations, internal control over financial reporting may not prevent or detect misstatements. In addition, projections of any evaluation of effectiveness to future periods are subject to the risk that controls may become inadequate because of changes in conditions or because the degree of compliance with policies or procedures may deteriorate.
Management assessed the effectiveness of the Group’s internal control over financial reporting as of 31 December 2007 based on the criteria set forth by the Committee of Sponsoring Organizations of the Treadway Commission in “Internal Control – Integrated Framework”. Management excluded from its assessment the internal control over financial reporting of ABN AMRO Holdings N.V. (“ABN AMRO”), which was acquired on 17 October 2007. ABN AMRO represented 40.7% of the Group’s total assets, a negligible proportion of the shareholders’ total equity, 7.7% of the Group’s total income and 0.2% of the Group’s profit after tax as of and for the year ended 31 December 2007.
Based on its assessment, management believes that, as of 31 December 2007, the Group’s internal control over financial reporting is effective.
The effectiveness of the Group’s internal control over financial reporting as of 31 December 2007 has been audited by Deloitte & Touche LLP, the Group’s independent registered public accounting firm. The report of the independent registered public accounting firm to the directors of the Royal Bank of Scotland Group plc expresses an unqualified opinion on the effectiveness of the Group’s internal control over financial reporting as of 31 December 2007.
Disclosure controls and procedures
As required by US regulations, the effectiveness of the company’s disclosure controls and procedures (as defined in the rules under the US Securities Exchange Act of 1934) have been evaluated. This evaluation has been considered and approved by the Board which has instructed the Group Chief Executive and the Group Finance Director to certify that, as at 31 December 2007, the company’s disclosure controls and procedures were adequate and effective and designed to ensure that material information relating to the company and its consolidated subsidiaries would be made known to them by others within those entities.
Changes in internal controls
There was no change in the company’s internal control over financial reporting that occurred during the period covered by this report that has materially affected, or is reasonably likely to materially affect, the company’s internal control over financial reporting.
Report of Independent Registered Public Accounting Firm to the members of The Royal Bank of Scotland Group plc
We have audited the internal control over financial reporting of The Royal Bank of Scotland Group plc and subsidiaries (‘’the Group”) as of 31 December 2007, based on criteria established in Internal Control—Integrated Framework issued by the Committee of Sponsoring Organizations of the Treadway Commission. As described in Management’s report on internal control over financial reporting, management excluded from its assessment the internal control over financial reporting at ABN AMRO Holdings N.V., which was acquired on 17 October 2007. ABN AMRO Holdings N.V. represented 40.7% of the Group’s total assets, a negligible proportion of the shareholders’ total equity, 7.7% of the Group’s total income and 0.2% of the Group’s profit after tax as of and for the year ended 31 December 2007. Accordingly, the scope of our audit did not include the internal control over financial reporting at ABN AMRO Holdings N.V..
The Group's management is responsible for maintaining effective internal control over financial reporting and for assessing its effectiveness. Our responsibility is to express an opinion on the effectiveness of the Group's internal control over financial reporting based on our audit.
We conducted our audit in accordance with the standards of the Public Company Accounting Oversight Board (United States). Those standards require that we plan and perform the audit to obtain reasonable assurance about whether effective internal control over financial reporting was maintained in all material respects. Our audit included obtaining an understanding of internal control over financial reporting, assessing the risk of whether a material weakness existed, testing and evaluating the design and operating effectiveness of internal control, and performing such other procedures as we considered necessary in the circumstances. We believe that our audit provides a reasonable basis for our opinion.
A company's internal control over financial reporting is a process designed by, or under the supervision of, the company's principal executive and principal financial officers, or persons performing similar functions, and implemented by the company's board of directors, management, and other personnel to provide reasonable assurance regarding the reliability of financial reporting and the preparation of financial statements for external purposes in accordance with generally accepted accounting principles. A company's internal control over financial reporting includes those policies and procedures that (1) pertain to the maintenance of records that, in reasonable detail, accurately and fairly reflect the transactions and dispositions of the assets of the company; (2) provide reasonable assurance that transactions are recorded as necessary to permit preparation of financial statements in accordance with generally accepted accounting principles, and that receipts and expenditures of the company are being made only in accordance with authorisations of management and directors of the company; and (3) provide reasonable assurance regarding prevention or timely detection of unauthorised acquisition, use, or disposition of the company's assets that could have a material effect on the financial statements.
Because of the inherent limitations of internal control over financial reporting, including the possibility of collusion or improper management override of controls, material misstatements due to error or fraud may not be prevented or detected on a timely basis. Also, projections of any evaluation of the effectiveness of the internal control over financial reporting to future periods are subject to the risk that the controls may become inadequate because of changes in conditions, or that the degree of compliance with the policies or procedures may deteriorate.
In our opinion, the Group maintained, in all material respects, effective internal control over financial reporting as of 31 December 2007, based on the criteria established in Internal Control—Integrated Framework issued by the Committee of Sponsoring Organizations of the Treadway Commission.
We have also audited, in accordance with the standards of the Public Company Accounting Oversight Board (United States), the consolidated financial statements as at and for the year ended 31 December 2007 of the Group and our report dated 27 February 2008 expressed an unqualified opinion on those financial statements.
DELOITTE & TOUCHE LLP
Chartered Accountants and Registered Auditors
Edinburgh, United Kingdom
27 February 2008
Directors’ remuneration report
The Remuneration Committee
The members of the Remuneration Committee are Bob Scott (Chairman), Colin Buchan, Jim Currie, Janis Kong, Sir Tom McKillop and Peter Sutherland. The members of the Remuneration Committee comprise independent non-executive directors, together with the Chairman of the Board.
During the year, the Remuneration Committee received advice from Watson Wyatt and Mercer on matters relating to directors’ remuneration in the UK (Watson Wyatt) and US (Mercer), together with advice from the Group Director, Human Resources and the Group Secretary and General Counsel on general remuneration matters. In addition, the Remuneration Committee has taken account of the views of the Group Chief Executive on performance assessment of the executive directors.
In addition to advising the Remuneration Committee, Watson Wyatt provided professional services in the ordinary course of business, including actuarial advice and benefits administration services to subsidiaries of the Group and investment consulting and actuarial advice to the trustees of some of the Group’s pension funds. Mercer provided advice and support in connection with a range of compensation benefits, pension actuarial and investment matters. The advisers to the Remuneration Committee are appointed independently by the Committee, which reviews its selection of advisers annually. The Committee is satisfied that the consultants from Watson Wyatt and Mercer who advise the Committee operate independently of the consulting teams undertaking other work with the Group.
Compensation
Remuneration policy
The Remuneration Committee conducted a comprehensive review of all aspects of the remuneration package in 2005, and the executive remuneration policy outcome was approved by shareholders at the company’s Annual General Meeting in 2006. A new executive share option plan was approved by shareholders at the company’s 2007 Annual General Meeting. During 2007 the Remuneration Committee continued to review policy in light of business needs, market changes and shareholder comments.
The objective of the executive remuneration policy is to provide, in the context of the company’s business strategy, remuneration in form and amount which will attract, motivate and retain high-calibre executives. In order to achieve this objective, the policy is framed around the following core principles:
| · | Total rewards will be set at levels that are competitive within the relevant market, taking each executive director’s remuneration package as a whole. The relevant market is FTSE top 20 companies and major UK, European and US banks. |
| | |
| · | Total potential rewards will be earned through achievement of demanding performance targets based on measures consistent with shareholder interests over the short, medium and longer term. |
| | |
| · | Remuneration arrangements will strike an appropriate balance between fixed and performance-related rewards. Performance-related elements will comprise the major part of executive remuneration packages. See illustrative charts below. |
| | |
| · | Incentive plans and performance metrics will be structured to be robust through the business cycle. |
| | |
| · | Remuneration arrangements will be designed to support the company’s business strategy, to promote teamwork and to conform to best practice standards. |
UK-based executive directors’ remuneration balance
The above diagram has been prepared to illustrate the use of performance metrics in the total direct compensation package. For the Group Chief Executive, 21% of the package is fixed and 79% is performance related. For the executive directors, 27% is fixed and 73% is performance related. Values are shown on the basis of on-target annual performance with long term incentives at the approximate fair value at grant (80% of the face value of the shares for the MPP and 12% for the ESOP). In 2007 the MPP grant due to vest lapsed in its entirety having not met the required performance conditions. The executive share options due to vest in 2007 vested in full. At the date of vesting the share price was £6.96 and the exercise price was £5.78. Pension and other benefits have been excluded from this diagram. Financial metrics include profit growth, cost control and return on equity.
The non-executive directors’ fees are reviewed annually by the Board, on the recommendation of its Chairman. The level of remuneration reflects the responsibility and time commitment of directors and the level of fees paid to non-executive directors of comparable major UK companies. Non-executive directors do not participate in any incentive or performance plan.
The Remuneration Committee makes recommendations to the Board on the remuneration arrangements for the executive directors and the Chairman. The Remuneration Committee also approves the remuneration arrangements of senior executives below Board level who are members of the Group Executive Management Committee, on the recommendation of the Group Chief Executive, and maintains oversight of the application of remuneration policy below this level. The Committee reviews all long-term incentive arrangements operated by the Group.
Directors’ remuneration report continued
Components of executive remuneration
UK based directors
Salary
Salaries are reviewed annually as part of total remuneration, having regard to remuneration packages received by executives of comparable companies. The Remuneration Committee uses a range of survey data from published and proprietary sources and reaches individual salary decisions taking account of the remuneration environment and the performance and responsibilities of the individual director.
Benefits
The Group operates The Royal Bank of Scotland Group Pension Fund (“the RBS Fund”), a non-contributory defined benefit fund for employees (including executive directors) who joined the Group prior to 1 October 2006. Any new executive directors will not be eligible to participate in the RBS Fund unless they were already a member prior to 1 October 2006; instead they will receive a cash allowance.
Details of pension arrangements of directors are shown on page 96. Where cash allowances are paid in place of pension accrual (or of pension accrual on salary over the pension earnings cap), they are shown on page 92. Executive directors also receive additional cover for death-in-service benefits.
Executive directors are eligible to receive a choice of various employee benefits or a cash equivalent, on a similar basis to other employees. In addition, as employees, executive directors are eligible to participate in Sharesave, Buy As You Earn and the Profit Sharing scheme. These schemes are not subject to performance conditions since they are operated on an all-employee basis.
Short-term annual incentives
UK-based executive directors normally have a maximum annual incentive potential of between 160% and 200% of salary. For exceptional performance, as measured by the achievement of additional challenging objectives, executive directors may be awarded incentive payments of up to 200% of salary, or 250% of salary, in the case of the Group Chief Executive, the Chief Executive, Corporate Markets and the Chief Executive, Retail Markets. Awards will normally be based on the delivery of a combination of appropriate Group and individual financial and operational targets approved each year by the Remuneration Committee.
For the Group Chief Executive, the annual incentive is primarily based on specific Group financial performance measures such as operating profit, earnings per share growth and return on equity. The remainder of the Group Chief Executive’s annual incentive is based on a range of non-financial measures which may include measures relating to shareholders, customers and staff.
For the other executive directors, a proportion of the annual incentive is based on Group financial performance and a proportion on divisional financial performance. The remainder of each individual’s annual incentive opportunity is dependent on achievement of a range of non-financial measures, specific objectives and key result areas. Divisional performance includes measures such as operating income, costs, loan impairments or operating profit. Non-financial measures include customer measures (e.g. customer numbers, customer satisfaction), staff measures (e.g. employee engagement) and efficiency and change objectives.
In respect of 2007, the Remuneration Committee reviewed the annual incentive payments for all executive directors taking into account performance against targets set at the beginning of the year and covering Group financial performance, each director’s operational targets, and where appropriate, divisional financial targets. For all directors operational targets included specified strategic developments and improvement in customer and employee satisfaction scores.
Group operating profit targets were met in full notwithstanding the impact of challenging credit market conditions in the second half of the year, and customer and employee satisfaction scores showed improvement in line with or above expectations. Financial performance in most divisions exceeded target. As a result, the Remuneration Committee proposed and the Board (excluding executive directors) agreed annual incentive payments of up to 112.5% of normal maximum levels. Levels of incentive payments to executive directors covered a wide range, reflecting variations in divisional performance.
Long-term incentives
The company provides long-term incentives in the form of share options and share or share equivalent awards. Their objective is to encourage the creation of value over the long term and to align the rewards of the executive directors with the returns to shareholders.
Medium-term Performance Plan
The Medium-term Performance Plan (“MPP”) was approved by shareholders in April 2001. Each executive director is eligible for an annual award under the plan in the form of share or share equivalent awards. Whilst the rules of the plan allow awards over shares worth up to one and a half times earnings, the Remuneration Committee has adopted a policy of granting awards based on a multiple of salary. Normally awards are made at one times salary to executive directors, with one and a half times salary being granted in the case of the Group Chief Executive. No changes will be made to this policy without prior consultation with shareholders. All awards under the plan are subject to three-year performance targets.
Awards made in 2006 and 2007 are subject to two performance measures; 50% of the award vests on a relative Total Shareholder Return (“TSR”) measure and 50% vests on growth in adjusted earnings per share (“EPS”) over the three year performance period.
For the TSR element, vesting is based on the level of outperformance by the Group of the median of the comparator group TSR over the performance period. Awards made under the plan will not vest if the company’s TSR is below the median of the comparator group. Achievement of median TSR performance against comparator companies will result in vesting of 25% of the award. Outperformance of median TSR performance by up to 9% will result in vesting on a straight-line basis from 25% to 125%, outperformance by 9% to 18% will result in vesting on a straight-line basis from 125% to 200%. Vesting at 200% will occur if the company outperforms the median TSR performance of the comparator group by at least 18%. For awards made in 2006 and 2007, the companies in the comparator group were ABN AMRO Holdings N.V.; Banco Santander Central Hispano, S.A.; Barclays PLC; Citigroup Inc; HBOS plc; HSBC Holdings plc; Lloyds TSB Group plc and Standard Chartered PLC. Following the acquisition of ABN AMRO by the Consortium Banks in October 2007, the Remuneration Committee agreed that Fortis N.V. would replace ABN AMRO in the comparator group for awards made in 2006 and 2007, and also for awards to be made in 2008.
The EPS element ensures a clear line of sight for executives to improve long-term financial performance. For this element, the level of EPS growth over the three year period is calculated by comparing the adjusted EPS in the year prior to the year of grant with that in the final year of the performance period. Each year the vesting schedule for the EPS growth measure is agreed by the Remuneration Committee at the time of grant, having regard to the business plan, performance relative to comparators and analysts’ forecasts.
For the awards made in 2006 and 2007, the EPS element of the awards will not vest if EPS growth is below 5% per annum compound over the three year period. Where EPS growth is between 5% per annum and 10% per annum vesting will occur on a straight-line basis from 25% to 100%. Vesting at 100% will occur if EPS growth is at least 10% per annum compound.
Options
A new executive share option plan was approved by shareholders at the company’s 2007 Annual General Meeting. Options were subsequently granted to executive directors over shares worth up to a maximum of three times salary with an EPS performance condition.
The performance condition is based on the average annual growth in the Group’s adjusted EPS over the three year performance period commencing in the year of grant. The calibration of the EPS growth measure is agreed by the Remuneration Committee at the time of each grant having regard to the business plan, prevailing economic conditions and analysts’ forecasts.
In respect of the grant to executive directors in 2007, options will only be exercisable if, over the three year period, the growth in the company’s adjusted EPS has been at least 6% per annum (‘the threshold level’). The percentage of options that vest is then determined on a straight line basis between 30% at the threshold level and 100% at the maximum level for growth in adjusted EPS of 12% per annum.
Shareholding guidelines
In 2006, the Remuneration Committee reviewed the policy on shareholding requirements and the Group has now adopted shareholding guidelines for executive directors.
The target shareholding level is 200% of gross annual salary for the Group Chief Executive and 100% of gross annual salary for executive directors. Target shareholding levels are determined by reference to ordinary shares held, together with any vested awards under the Group’s Medium-term Performance Plan. Executive directors have a period of five years in which to build up their shareholdings to meet the guideline levels.
US based director – Larry Fish
Larry Fish was previously Chairman and Chief Executive Officer of Citizens Financial Group, Inc. From 23 March 2007, he was appointed Chairman, RBS America and Citizens. With effect from 1 January 2008 he has undertaken that role in a non-executive capacity and is being paid a fixed fee of US$600,000 per annum (inclusive of fees as a non-executive director of the company with effect from 1 May 2008).
He will not participate in any annual bonus plan nor will he be eligible for further grants under any long term incentive plans. Existing long term incentive awards will vest to him, subject to achievement of all relevant service and performance conditions, at the completion of the appropriate performance period.
Accrual of pension entitlement will cease at 30 April 2008. He will participate in the Citizens medical insurance plan to this date, after which he is eligible to join the Citizens retiree medical plan.
Directors’ remuneration report continued
Total shareholder return performance
The undernoted performance graph illustrates the performance of the company over the past five years in terms of total shareholder return compared with that of the companies comprising the FTSE 100 Index. This Index has been selected because it represents a cross-section of leading UK companies. The total shareholder return for FTSE banks for the same period has been added for comparison. The total shareholder return for the company and the indices have been rebased to 100 for 2002.
Total shareholder return
Service contracts
The company’s policy in relation to the duration of contracts with directors is that executive directors’ contracts generally continue until termination by either party, subject to the required notice, or until retirement. The notice period under the service contracts of executive directors will not normally exceed 12 months. In relation to newly recruited executive directors, subject to the prior approval of the Remuneration Committee, the notice period from the employing company may be extended beyond 12 months if there is a clear case for this. Where a longer period of notice is initially approved on appointment, it will normally be structured such that it will automatically reduce to 12 months in due course.
All new service contracts for executive directors are subject to approval by the Remuneration Committee. Those contracts normally include standard clauses covering the performance review process, the company’s normal disciplinary procedure, and terms for dismissal in the event of failure to perform or in situations involving actions in breach of the Group’s policies.
Any compensation payment made in connection with the departure of an executive director will be subject to approval by the Remuneration Committee, having regard to the terms of the service contract and the reasons for termination.
Information regarding executive directors’ service contracts is summarised in the table and note below. (1)
| | Date of current contract/ | Notice period – | Notice period – |
| Name | Employing company | from company | from executive |
| Sir Fred Goodwin | 1 August 1998 | 12 months | 6 months |
| | The Royal Bank of Scotland plc | | |
| Mr Cameron | 29 March 1998 | 12 months | 6 months |
| | The Royal Bank of Scotland plc | | |
| Mr Fisher | 27 February 2007 | 12 months | 12 months |
| | The Royal Bank of Scotland plc | | |
| Mr Pell | 20 February 2006 | 12 months | 6 months |
| | The Royal Bank of Scotland plc | | |
| Mr Whittaker | 19 December 2005 | 12 months | 12 months |
| | The Royal Bank of Scotland plc | | |
Note:
| | |
| (1) | With effect from 1 May 2008, Mr Fish will become a non-executive director of the company. In line with other non-executive directors, his appointment will be covered by a letter of engagement. The appointment will be for an initial term expiring on 9 October 2009 and is terminable earlier by either party upon written notice. |
Except as noted below, in the event of severance where any contractual notice period is not worked, the employing company may pay a sum to the executive in lieu of this period of notice. Any such payment would, at maximum, comprise base salary and a cash value in respect of fixed benefits (including pension plan contributions). In the event of situations involving breach of the employing company’s policies resulting in dismissal, reduced or no payments may be made to the executive. Depending on the circumstances of the termination of employment, the executive may be entitled, or the Remuneration Committee may exercise its discretion to allow, the executive to exercise outstanding awards under long-term incentive arrangements subject to the rules of the relevant plan. All UK based directors, with the exception of Guy Whittaker, are members of The Royal Bank of Scotland Group Pension Fund (‘the RBS Fund’) and are contractually entitled to receive all pension benefits in accordance with its terms. The RBS Fund rules allow all members who retire early at the request of their employer to receive a pension based on accrued service with no discount applied for early retirement.
The Remuneration Committee has reviewed this provision of the RBS Fund, which applies equally to executive directors and other employees. The Remuneration Committee concluded that a change to the terms of the RBS Fund in respect of early retirement at the company’s request would not be a cost effective route to take at this time. The RBS Fund is closed to employees, including any executive directors, joining the Group after 30 September 2006.
Chairman and non-executive directors
The original date of appointment as a director of the company and the latest date for the next re-election are as follows:
| | | Latest date for |
| | Date first appointed | next re-election |
| Sir Tom McKillop | 1 September 2005 | 2009 |
| Mr Buchan | 1 June 2002 | 2009 |
| Dr Currie | 28 November 2001 | 2008 |
| Mr Friedrich | 1 March 2006 | 2009 |
| Mr Hunter | 1 September 2004 | 2010 |
| Mr Koch | 29 September 2004 | 2010 |
| Mrs Kong | 1 January 2006 | 2009 |
| Mr MacHale | 1 September 2004 | 2010 |
| Sir Steve Robson | 25 July 2001 | 2008 |
| Mr Scott | 31 January 2001 | 2009 |
| Mr Sutherland | 31 January 2001 | 2009 |
The non-executive directors do not have service contracts or notice periods although they have letters of engagement reflecting their responsibilities and commitments. Under the company’s Articles of Association, all directors must retire by rotation and seek re-election by shareholders at least every three years. The dates in the table above reflect the latest date for re-election. However, in 2008, at least one-third of the Board will retire by rotation as required by the company’s Articles of Association. No compensation would be paid to the Chairman or to any non-executive director in the event of early termination.
Directors’ remuneration report continued
The tables and explanatory notes on pages 92 to 96 report the remuneration of each director for the year ended 31 December 2007 and have been audited by the company’s auditors, Deloitte & Touche LLP.
Directors’ remuneration
| | | | Salary/
fees
£000 | | | | Performance
bonus(1)
£000 | | | | Pension
allowance
£000 | | | | Benefits
£000 | | | | 2007
Total
£000 | | | | 2006
Total
£000 | |
| Chairman | | | | | | | | | | | | | | | | | | | | | | | | |
| Sir Tom McKillop | | | 750 | | | | — | | | | — | | | | — | | | | 750 | | | | 471 | |
| | | | | | | | | | | | | | | | | | | | | | | | | |
| Executive directors | | | | | | | | | | | | | | | | | | | | | | | | |
| Sir Fred Goodwin | | | 1,290 | | | | 2,860 | | | | — | | | | 40 | | | | 4,190 | | | | 3,996 | |
| Mr Cameron | | | 988 | | | | 1,900 | | | | 341 | | | | 27 | | | | 3,256 | | | | 3,496 | |
Mr Fish (2) | | | 999 | | | | 200 | | | | — | | | | 54 | | | | 1,253 | | | | 2,679 | |
Mr Fisher (3) | | | 726 | | | | 1,428 | | | | 178 | | | | 26 | | | | 2,358 | | | | 1,894 | |
| Mr Pell | | | 825 | | | | 1,377 | | | | — | | | | 2 | | | | 2,204 | | | | 2,120 | |
| Mr Whittaker | | | 760 | | | | 1,425 | | | | 262 | | | | 3 | | | | 2,450 | | | | 4,475 | |
Notes:
| | |
| (1) | Includes 10% profit sharing. |
| | |
| (2) | Mr Fish is a non-executive director of Textron Inc. and retains the fees paid to him in this respect. For 2007, he received a remuneration package from Textron Inc. equivalent to approximately US$87,565. |
| | |
| (3) | On his appointment as Chairman of the Managing Board of ABN AMRO on 1 November 2007, Mr Fisher transferred to the Netherlands. In line with the Group’s international assignment policy he was eligible for assistance in moving his home and family to the Netherlands and for ongoing tax equalisation, cost of living, housing and other secondment benefits, the value of which is £15,419 and is included under benefits, above. |
| Non-executive directors | | | Board
fees
£000 | | | | Board
committee
fees
£000 | | | | £000 | | | | £000 | |
| Mr Buchan | | | 70 | | | | 52 | | | | 122 | | | | 120 | |
| Dr Currie | | | 70 | | | | 15 | | | | 85 | | | | 80 | |
| Mr Friedrich | | | 70 | | | | 30 | | | | 100 | | | | 69 | |
| Mr Hunter | | | 70 | | | | 92 | | | | 162 | | | | 158 | |
Mr Koch(1) | | | 70 | | | | — | | | | 70 | | | | 65 | |
| Mrs Kong | | | 70 | | | | 15 | | | | 85 | | | | 73 | |
| Mr MacHale | | | 70 | | | | 30 | | | | 100 | | | | 95 | |
| Sir Steve Robson | | | 70 | | | | 30 | | | | 100 | | | | 95 | |
Mr Scott (2) | | | | | | | | | | | 160 | | | | 155 | |
| Mr Sutherland | | | 70 | | | | 27 | | | | 97 | | | | 88 | |
Notes:
| | |
| (1) | In addition to his role as a non-executive director, Mr Koch had an agreement with Citizens Financial Group, Inc. to provide consulting services for a period of three years, which ended on 1 September 2007, following the acquisition by Citizens of Charter One Financial, Inc. For these services Mr Koch received $268,333 in 2007. |
| | |
| (2) | Mr Scott’s senior independent director fee covers all Board and Board Committee work including Chairmanship of the Remuneration Committee. |
No director received any expense allowances chargeable to UK income tax or compensation for loss of office/termination payment. The non-executive directors did not receive any bonus payments or benefits.
Share options
Options to subscribe for ordinary shares of 25p each in the company granted to, and exercised by, directors during the year to 31 December 2007 are included in the table below. Options held at 1 January 2007 and the related option price have been restated to reflect the bonus issue of ordinary shares in May 2007.
| | | | | | | | | Options exercised in 2007 | | | | | | | |
| | | Options held at 1 January | | | Options granted in | | | | | | Market price at date of exercise | | | Option price | | | Options held at 31 December 2007 | |
| | | 2007 | | | 2007 | | | Number | | | | £ | | | | £ | | | Number | | | Exercise period | |
| Sir Fred Goodwin | | | 493,713 | | | | | | | 493,713 | | | | 5.32 | | | | 2.92 | | | | — | | | | |
| | | | 8,889 | | | | | | | | | | | | | | | 3.73 | | | | 8,889 | | | | 04.03.02 – 03.03.09 | |
| | | | 81,918 | | | | | | | | | | | | | | | 3.99 | | | | 81,918 | | | | 03.06.02 – 02.06.09 | |
| | | | 460,944 | | | | | | | | | | | | | | | 2.60 | | | | 460,944 | | | | 29.03.03 – 28.03.10 | |
| | | | 131,100 | | | | | | | | | | | | | | | 5.73 | | | | 131,100 | | | | 14.08.04 – 13.08.11 | |
| | | | 123,900 | | | | | | | | | | | | | | | 6.06 | | | | 123,900 | | | | 14.03.05 – 13.03.12 | |
| | | | 218,400 | | | | | | | | | | | | | | | 4.12 | | | | 218,400 | | | | 13.03.06 – 12.03.13 | |
| | | | 432,525 | | | | | | | | | | | | | | | 5.78 | | | | 432,525 | | | | 11.03.07 – 10.03.14 | |
| | | | 477,153 | | | | | | | | | | | | | | | 5.76 | | | | 477,153 | | | | 10.03.08 – 09.03.15 | |
| | | | 485,961 | | | | | | | | | | | | | | | 6.17 | | | | 485,961 | | | | 09.03.09 – 08.03.16 | |
| | | | 3,801 | | | | | | | | | | | | | | | 4.35 | | | | 3,801 | | | | 01.10.10 – 31.03.11 | (1) |
| | | | | | | | 695,188 | | | | | | | | | | | | 5.61 | | | | 695,188 | | | | 16.08.10 – 15.08.17 | |
| | | | 2,918,304 | | | | | | | | | | | | | | | | | | | | 3,119,779 | | | | | |
| Mr Cameron | | | 57,582 | | | | | | | | | | | | | | | | 3.73 | | | | 57,582 | | | | 04.03.02 – 03.03.09 | |
| | | | 115,233 | | | | | | | | | | | | | | | | 2.60 | | | | 115,233 | | | | 29.03.03 – 28.03.10 | |
| | | | 450 | | | | | | | | 450 | | | | 6.77 | | | | 5.21 | | | | — | | | | | |
| | | | 78,600 | | | | | | | | | | | | | | | | 5.73 | | | | 78,600 | | | | 14.08.04 – 13.08.11 | |
| | | | 95,400 | | | | | | | | | | | | | | | | 6.06 | | | | 95,400 | | | | 14.03.05 – 13.03.12 | |
| | | | 157,800 | | | | | | | | | | | | | | | | 4.12 | | | | 157,800 | | | | 13.03.06 – 12.03.13 | |
| | | | 151,383 | | | | | | | | | | | | | | | | 5.78 | | | | 151,383 | | | | 11.03.07 – 10.03.14 | |
| | | | 5,595 | | | | | | | | 5,595 | | | | 5.24 | | | | 3.28 | | | | — | | | | | |
| | | | 242,916 | | | | | | | | | | | | | | | | 5.76 | | | | 242,916 | | | | 10.03.08 – 09.03.15 | |
| | | | 255,129 | | | | | | | | | | | | | | | | 6.17 | | | | 255,129 | | | | 09.03.09 – 08.03.16 | |
| | | | | | | | 374,332 | | | | | | | | | | | | 5.61 | | | | 374,332 | | | | 16.08.10 – 15.08.17 | |
| | | | 1,160,088 | | | | | | | | | | | | | | | | | | | | 1,528,375 | | | | | |
| Mr Fish | | | 323,631 | | | | | | | | | | | | | | | | 3.11 | | | | 323,631 | | | | 11.05.01 – 10.05.08 | |
| | | | 112,809 | | | | | | | | | | | | | | | | 5.76 | | | | 112,809 | | | | 10.03.08 – 09.03.15 | |
| | | | 333,387 | | | | | | | | | | | | | | | | 6.17 | | | | 333,387 | | | | 09.03.09 – 08.03.16 | |
| | | | | | | | 523,640 | | | | | | | | | | | | 5.61 | | | | 523,640 | | | | 16.08.10 – 15.08.17 | |
| | | | 769,827 | | | | | | | | | | | | | | | | | | | | 1,293,467 | | | | | |
| Mr Fisher | | | 42,843 | | | | | | | | | | | | | | | | 3.08 | | | | 42,843 | | | | 01.04.02 – 31.03.09 | |
| | | | 99,873 | | | | | | | | | | | | | | | | 2.60 | | | | 99,873 | | | | 29.03.03 – 28.03.10 | |
| | | | 65,400 | | | | | | | | | | | | | | | | 5.73 | | | | 65,400 | | | | 14.08.04 – 13.08.11 | |
| | | | 68,100 | | | | | | | | | | | | | | | | 6.06 | | | | 68,100 | | | | 14.03.05 – 13.03.12 | |
| | | | 121,500 | | | | | | | | | | | | | | | | 4.12 | | | | 121,500 | | | | 13.03.06 – 12.03.13 | |
| | | | 118,944 | | | | | | | | | | | | | | | | 5.78 | | | | 118,944 | | | | 11.03.07 – 10.03.14 | |
| | | | 182,187 | | | | | | | | | | | | | | | | 5.76 | | | | 182,187 | | | | 10.03.08 – 09.03.15 | |
| | | | 933 | | | | | | | | 933 | | | | 5.24 | | | | 4.03 | | | | — | | | | | |
| | | | 435 | | | | | | | | | | | | | | | | 4.35 | | | | 435 | | | | 01.10.08 – 31.03.09 | (1) |
| | | | 184,260 | | | | | | | | | | | | | | | | 6.17 | | | | 184,260 | | | | 09.03.09 – 08.03.16 | |
| | | | | | | | 262,033 | | | | | | | | | | | | 5.61 | | | | 262,033 | | | | 16.08.10 – 15.08.17 | |
| | | | | | | | 1,611 | | | | | | | | | | | | 4.69 | | | | 1,611 | | | | 01.10.10 – 31.03.11 | (1) |
| | | | 884,475 | | | | | | | | | | | | | | | | | | | | 1,147,186 | | | | | |
| Mr Pell | | | 153,648 | | | | | | | | 153,648 | | | | 4.40 | | | | 2.60 | | | | — | | | | | |
| | | | 87,300 | | | | | | | | | | | | | | | | 5.73 | | | | 87,300 | | | | 14.08.04 – 13.08.11 | |
| | | | 82,800 | | | | | | | | | | | | | | | | 6.06 | | | | 82,800 | | | | 14.03.05 – 13.03.12 | |
| | | | 149,400 | | | | | | | | | | | | | | | | 4.12 | | | | 149,400 | | | | 13.03.06 – 12.03.13 | |
| | | | 141,651 | | | | | | | | | | | | | | | | 5.78 | | | | 141,651 | | | | 11.03.07 – 10.03.14 | |
| | | | 151,821 | | | | | | | | | | | | | | | | 5.76 | | | | 151,821 | | | | 10.03.08 – 09.03.15 | |
| | | | 187,095 | | | | | | | | | | | | | | | | 6.17 | | | | 187,095 | | | | 09.03.09 – 08.03.16 | |
| | | | | | | | 259,894 | | | | | | | | | | | | 5.61 | | | | 259,894 | | | | 16.08.10 – 15.08.17 | |
| | | | 953,715 | | | | | | | | | | | | | | | | | | | | 1,059,961 | | | | | |
| Mr Whittaker | | | 170,085 | | | | | | | | | | | | | | | | 6.17 | | | | 170,085 | | | | 09.03.09 – 08.03.16 | |
| | | | 3,705 | | | | | | | | | | | | | | | | 4.61 | | | | 3,705 | | | | 01.10.13 – 31.03.14 | (1) |
| | | | | | | | 280,749 | | | | | | | | | | | | 5.61 | | | | 280,749 | | | | 16.08.10 – 15.08.17 | |
| | | | 173,790 | | | | | | | | | | | | | | | | | | | | 454,539 | | | | | |
| | Note: |
| | |
| (1) | Options held under the sharesave schemes, which are not subject to performance conditions. |
The performance conditions for options granted in 2007 are detailed on page 89.
Directors’ remuneration report continued
No options had their terms and conditions varied during the accounting period to 31 December 2007. No payment is required on the award of an option.
The performance condition applying to executive share options granted in 2007 and exercisable in August 2010 is outlined on page 89.
For executive share options where the first exercisable date is between March 2002 and March 2009 inclusive, options are exercisable only if, over a three year period, the growth in the company’s EPS has exceeded the growth in the Retail Prices Index (RPI) plus 9%. In respect of executive share options exercisable before March 2002, the performance condition is that the growth in the company’s EPS over three years has exceeded the growth in the RPI plus 6%.
The market price of the company’s ordinary shares at 31 December 2007 was £4.44 and the range during the year to 31 December 2007 was £3.97 to £7.20.
In the ten year period to 31 December 2007, awards made that could require new issue shares under the company’s share plans represented 5.5% of the company’s issued ordinary share capital, leaving an available dilution headroom of 4.5% ..
Medium Term Performance Plan
Scheme interests at 1 January 2007 and the related market price on award in the table below have been restated to reflect the bonus issue of ordinary shares in May 2007.
| | | Scheme interests (share equivalents) at 1 January 2007 | | | Awards granted in 2007 | | | Market price on award £ | | Awards vested in 2007 | (1) | | Awards exercised in 2007 | | Share interest (share equivalents) at 31 December 2007 | | | End of period for qualifying conditions to be fulfilled | |
| Sir Fred Goodwin | | | 279,120 | | | | | | | 5.45 | | | | | | | | 279,120 | | | vested 31.12.03 | |
| | | | 101,565 | | | | | | | 6.20 | | | | | | | | 101,565 | | | vested 31.12.04 | |
| | | | 286,293 | | | | | | | 5.76 | | Nil | | | | | | — | | | lapsed 31.12.07 | |
| | | | 291,579 | | | | | | | 6.17 | | | | | | | | 291,579 | | | | 31.12.08 | |
| | | | | | | | 278,970 | | | | 6.99 | | | | | | | | 278,970 | | | | 31.12.09 | |
| | | | 958,557 | | | | | | | | | | | | | | | | 951,234 | | | | | |
| Mr Cameron | | | 167,472 | | | | | | | | 5.45 | | | | | | | | 167,472 | | | vested 31.12.03 | |
| | | | 66,234 | | | | | | | | 6.20 | | | | | | | | 66,234 | | | vested 31.12.04 | |
| | | | 138,810 | | | | | | | | 5.76 | | Nil | | | | | | – | | | lapsed 31.12.07 | |
| | | | 145,791 | | | | | | | | 6.17 | | | | | | | | 145,791 | | | | 31.12.08 | |
| | | | | | | | 143,064 | | | | 6.99 | | | | | | | | 143,064 | | | | 31.12.09 | |
| | | | 518,307 | | | | | | | | | | | | | | | | 522,561 | | | | | |
| Mr Fish | | | 31,485 | | | | | | | | 5.76 | | Nil | | | | | | – | | | lapsed 31.12.07 | |
| | | | 93,351 | | | | | | | | 6.17 | | | | | | | | 93,351 | | | | 31.12.08 | |
| | | | | | | | 85,905 | | | | 6.99 | | | | | | | | 85,905 | | | | 31.12.09 | |
| | | | 124,836 | | | | | | | | | | | | | | | | 179,256 | | | | | |
| Mr Fisher | | | 60,000 | | | | | | | | 5.45 | | | | | | | | 60,000 | | | vested 31.12.03 | |
| | | | 24,000 | | | | | | | | 6.20 | | | | | | | | 24,000 | | | vested 31.12.04 | |
| | | | 104,109 | | | | | | | | 5.76 | | Nil | | | | | | – | | | lapsed 31.12.07 | |
| | | | 105,294 | | | | | | | | 6.17 | | | | | | | | 105,294 | | | | 31.12.08 | |
| | | | | | | | 100,146 | | | | 6.99 | | | | | | | | 100,146 | | | | 31.12.09 | |
| | | | 293,403 | | | | | | | | | | | | | | | | 289,440 | | | | | |
| Mr Pell | | | 121,458 | | | | | | | | 5.76 | | Nil | | | | | | – | | | lapsed 31.12.07 | |
| | | | 124,731 | | | | | | | | 6.17 | | | | | | | | 124,731 | | | | 31.12.08 | |
| | | | | | | | 115,881 | | | | 6.99 | | | | | | | | 115,881 | | | | 31.12.09 | |
| | | | 246,189 | | | | | | | | | | | | | | | | 240,612 | | | | | |
| Mr Whittaker | | | 113,391 | | | | | | | | 6.17 | | | | | | | | 113,391 | | | | 31.12.08 | |
| | | | | | | | 107,298 | | | | 6.99 | | | | | | | | 107,298 | | | | 31.12.09 | |
| | | | 113,391 | | | | | | | | | | | | | | | | 220,689 | | | | | |
| | Note: |
| | |
| (1) | Awards were granted on 28 April 2005 and these awards have now lapsed. |
For any awards that have vested, participants holding option-based awards can exercise their right over the underlying share equivalents at any time up to ten years from the date of grant.
No variation was made to any of the terms of the plan during the year. The performance measures are detailed on pages 88 and 89.
Restricted Stock Award
Interests at 1 January 2007 and the related prices on award and vesting in the table below have been restated to reflect the bonus issue of ordinary shares in May 2007.
| | | Awards held at 1 January 2007 | | | Market price on award £ | | | Awards vested in 2007 | | | Market price on vesting £ | | | Value of awards vested £ | | | Awards held at 31 December 2007 | | | End of the period for qualifying conditions to be fulfilled | |
Mr Whittaker(1) | | | 168,855 | | | | 6.46 | | | | 168,855 | | | | 6.78 | | | | 1,144,837 | | | | — | | | | |
| | | | 91,449 | | | | 6.46 | | | | | | | | | | | | | | | | 91,449 | | | | 01.02.08 | (3) |
| | | | 75,966 | | | | 6.46 | | | | | | | | | | | | | | | | 75,966 | | | | 01.02.09 | |
| | | | 37,263 | | | | 6.46 | | | | | | | | | | | | | | | | 37,263 | | | | 01.02.10 | |
| | | | 373,533 | | | | | | | | | | | | | | | | | | | | 204,678 | | | | | |
Notes:
| | |
| (1) | Awards were granted to Mr Whittaker in lieu of unvested share awards from his previous employer. |
| | |
| (2) | The end period for qualifying conditions is subject to any restrictions on dealing in the Group’s shares which may be in place and to which Mr Whittaker may be subject. As a result of the close period prior to the announcement of the Group’s results, the end of the period for qualifying conditions to be fulfilled in 2008 is 28 February 2008. |
| | |
| (3) | Award has now vested and shares will be released to Mr Whittaker on 28 February 2008. |
Citizens Long Term Incentive Plan (1)
| | | Interests at 1 January 2007 | | Awards granted during year | | Benefits received during year | | Interests at 31 December 2007 |
| Mr Fish | | LTIP awards for the | | LTIP award for the | | LTIP award for the | | LTIP awards for the |
| | | 3 year periods: | | 3 year period: | | 3 year period: | | 3 year periods: |
| | | 01.01.04 – 31.12.06 | | | | 01.01.04 – 31.12.06 | | |
| | | | | | | was US$1,389,148 | | |
| | | 01.01.05 – 31.12.07 | | | | | | 01.01.05 – 31.12.07 |
| | | 01.01.06 – 31.12.08 | | | | | | 01.01.06 – 31.12.08 |
| | | | | 01.01.07 – 31.12.09 | | | | 01.01.07 – 31.12.09 |
| | Note: |
| | |
| (1) | A new cash LTIP was approved by shareholders at the company’s Annual General Meeting in April 2005. Performance is measured on a combination of growth in Profit before tax and Relative Return on Equity based on a comparison of Citizens with comparator US banks. |
No variation was made to any of the terms of the plan during the year.
Directors’ remuneration report continued
Directors’ pension arrangements
During the year, Johnny Cameron, Sir Fred Goodwin and Gordon Pell accrued pensionable service in The Royal Bank of Scotland Group Pension Fund (“the RBS Fund”). The RBS Fund is a defined benefit fund registered with HM Revenue & Customs under the Finance Act 2004.
Sir Fred Goodwin and Gordon Pell are provided with additional pension benefits on a defined benefit basis outwith the RBS Fund. The figures shown below include the accrual in respect of these arrangements. A funded, non-registered, arrangement has been set up to provide Sir Fred Goodwin’s benefits to the extent they are not provided by the RBS Fund.
Johnny Cameron’s benefits are based on salary limited to the pensions earning cap and he receives a cash allowance in place of pension on salary above this cap.
Mark Fisher opted to cease future accrual of pension benefit within the RBS Fund with effect from 6 April 2006. The increase in pension shown in the table arises from his increase in pensionable salary over the year. He is provided with a cash allowance in place of further pension benefits.
Guy Whittaker is provided with a cash allowance in place of pension benefits.
The cash allowances for Johnny Cameron, Mark Fisher and Guy Whittaker are shown on page 92.
Larry Fish accrues pension benefits under a number of arrangements in the US. Defined benefits are built up under the Citizens’ Qualified Plan, Excess Plan and Supplemental Executive Retirement Arrangement. In addition, he is a member of two defined contribution arrangements: a Qualified 401(k) Plan and an Excess 401(k) Plan. He will continue to accrue benefits under these plans until 30 April 2008.
Of the total transfer value shown as at 31 December 2007, 54% relates to benefits in funded pension schemes.
Disclosure of these benefits has been made in accordance with the United Kingdom Listing Authority Listing Rules and with the Directors’ Remuneration Report Regulations 2002.
| Defined benefit arrangements | | Age at 31 December 2007 | | | Accrued entitlement at 31 December 2007 £000 p.a. | | | Additional pension earned during the year ended 31 December 2007 £000 p.a. | | | Additional pension earned during the year ended 31 December 2007* £000 p.a. | | | Transfer value as at 31 December 2007 £000 | | | Transfer value as at 31 December 2006 £000 | | | Increase in transfer value during year ended 31 December 2007 £000 | | | Transfer value for the additional pension earned during the year ended 31 December 2007* £000 | |
| Sir Fred Goodwin | | | 49 | | | | 579 | | | | 69 | | | | 50 | | | | 8,370 | | | | 7,043 | | | | 1,327 | | | | 722 | |
| Mr Cameron | | | 53 | | | | 57 | | | | 6 | | | | 3 | | | | 931 | | | | 824 | | | | 107 | | | | 56 | |
| Mr Fish | | | 63 | | | | $2,080 | | | | $251 | | | | $251 | | | | $24,101 | | | | $17,800 | | | | $6,301 | | | | $2,915 | |
| Mr Fisher | | | 47 | | | | 337 | | | | 35 | | | | 24 | | | | 4,562 | | | | 3,904 | | | | 658 | | | | 323 | |
| Mr Pell | | | 57 | | | | 423 | | | | 62 | | | | 49 | | | | 8,403 | | | | 6,744 | | | | 1,659 | | | | 971 | |
* net of statutory revaluation applying to deferred pensions
Notes:
| | |
| (1) | There is a significant difference in the form of disclosure required by the Combined Code and the Directors’ Remuneration Report Regulations 2002. The former requires the disclosure of the additional pension earned during the year and the transfer value equivalent to this pension based on stock market conditions at the end of the year. The latter requires the disclosure of the difference between the transfer value at the start and end of the year and is therefore dependent on the change in stock market conditions over the course of the year. The above disclosure has been made in accordance with the Combined Code and the Directors’ Remuneration Report Regulations 2002. |
| | |
| (2) | The transfer values disclosed above do not represent a sum paid or payable to the individual director. Instead they represent a potential liability of the Group pension scheme. |
| | |
| (3) | No allowance is made in these transfer values for any enhanced benefits that may become payable on early retirement. |
| | |
| (4) | The proportion of benefits represented by funded pension schemes for Gordon Pell and Larry Fish is 53% and 2% respectively. All benefits for Johnny Cameron, Mark Fisher and Sir Fred Goodwin are in funded pension schemes. |
| | |
| (5) | In accordance with US market practice, Larry Fish’s pensionable remuneration is limited to US$4 million per annum. |
| | |
| (6) | Larry Fish’s executive director service contract effective from February 2004 provides that he may retire at any age between 60 and 65. As noted on page 89, he will cease pension accrual with effect from 1 May 2008 and draw his pension from that date. The valuation of his benefits in the table above as at the end of 2007 allow for this payment date; previous figures assumed retirement at age 65. |
Contributions and allowances paid in the year ended 31 December 2007 under defined contribution arrangements were:
| | 2007 | 2006 |
| | 000 | 000 |
| Mr Cameron | — | £46 |
| Mr Fish | $60 | $56 |
Bob Scott
Chairman of the Remuneration Committee
27 February 2008
Directors’ interests in shares
Shares beneficially owned at 1 January 2007 in the tables below have been restated to reflect the bonus issue of ordinary shares in May 2007.
| | | | | | 31 December 2007 | |
| Executive directors | | Shares beneficially owned at 1 January 2007 | | | Shares owned beneficially | | | Vested MPP shares or share equivalents | | | Vested share options | | | Total | | | Value as at 31 December 2007(2,3)
£ | |
| Sir Fred Goodwin | | | 200,532 | | | | 694,498 | | | | 380,685 | | | | 1,457,676 | | | | 2,532,859 | | | | 5,732,777 | |
| Mr Cameron | | | 6,036 | | | | 16,582 | | | | 233,706 | | | | 655,998 | | | | 906,286 | | | | 1,413,969 | |
| Mr Fish | | | 33,360 | | | | 33,360 | | | | — | | | | 323,631 | | | | 356,991 | | | | 578,548 | |
| Mr Fisher | | | 13,494 | | | | 21,345 | | | | 84,000 | | | | 516,660 | | | | 622,005 | | | | 747,907 | |
| Mr Pell | | | 1,746 | | | | 155,394 | | | | — | | | | 461,151 | | | | 616,545 | | | | 737,259 | |
| Mr Whittaker | | | 154,815 | | | | 278,191 | | | | — | | | | — | | | | 278,191 | | | | 1,235,168 | |
Notes:
| | |
| (1) | The numbers shown in this table are taken from the audited disclosures shown elsewhere in this Annual Report. |
| | |
| (2) | The value is based on the share price at 31 December 2007, which was £4.44. During the year ended 31 December 2007 the share price ranged from £3.97 to £7.20. |
| | |
| (3) | The notional value of the vested share options has been calculated on the ‘in the money’ value using the share price of £4.44 as at 31 December 2007 less the option prices of vested options. |
| | |
| (4) | As at 31 December 2007, the executive directors held a technical interest as potential beneficiaries in The Royal Bank of Scotland Group plc 2001 Employee Share Trust (9,570,456 shares) and The Royal Bank of Scotland plc 1992 Employee Share Trust (904,326 shares), being trusts operated for the benefit of employees of the company and its subsidiaries. |
| | Shares | Shares |
| | beneficially | beneficially |
| | owned at | owned at |
| | 1 January | 31 December |
| Non-executive directors | 2007 | 2007 |
| Chairman | | |
| Sir Tom McKillop | 90,000 | 208,000 |
| | | |
| Mr Buchan | 15,000 | 40,000 |
| Dr Currie | 1,668 | 1,668 |
| Mr Friedrich | 60,768 | 110,475 |
| Mr Hunter | 10,500 | 10,500 |
| Mr Koch | 60,000 | 90,000 |
| Mrs Kong | 21,000 | 26,000 |
| Mr MacHale | 30,000 | 72,200 |
| Mr Scott | 13,344 | 23,344 |
| Mr Sutherland | 16,770 | 17,643 |
No other director had an interest in the company’s ordinary shares during the year.
On 7 January 2008 and 7 February 2008, 29 and 33 ordinary shares of 25p each, respectively, were acquired by both Sir Fred Goodwin and Mr Fisher under the Group’s Buy As You Earn share scheme.
Preference shares
Mr Fish held 20,000 non-cumulative preference shares of US$0.01 each at 31 December 2007 (2006 – 20,000) and Mr Koch held 20,000 non-cumulative preference shares of US$0.01 each at 31 December 2007 (2006 – 20,000). No other director had an interest in the preference shares during the year.
No director held a non-beneficial interest in the shares of the company at 31 December 2007, at 1 January 2007 or date of appointment if later.
Statement of directors’ responsibilities
The directors are required by Article 4 of the IAS Regulation (European Commission Regulation No 1606/2002) to prepare Group accounts, and as permitted by the Companies Act 1985 have elected to prepare company accounts, for each financial year in accordance with International Financial Reporting Standards as adopted by the European Union. They are responsible for preparing accounts that present fairly the financial position, financial performance and cash flows of the Group and the company. In preparing those accounts, the directors are required to:
| · | select suitable accounting policies and then apply them consistently; |
| | |
| · | make judgements and estimates that are reasonable and prudent; and |
| | |
| · | state whether applicable accounting standards have been followed, subject to any material departures disclosed and explained in the accounts. |
The directors are responsible for keeping proper accounting records which disclose with reasonable accuracy at any time the financial position of the Group and to enable them to ensure that the Annual Report and Accounts complies with the Companies Act 1985. They are also responsible for safeguarding the assets of the company and the Group and hence for taking reasonable steps for the prevention and detection of fraud and other irregularities.
By order of the Board.
Miller McLean
Secretary
27 February 2008
Financial statements
| 100 | Report of Independent Registered Public Accounting Firm |
| | |
| 102 | Consolidated income statement |
| | |
| 103 | Balance sheets |
| | |
| 104 | Statements of recognised |
| | income and expense |
| | |
| 105 | Cash flow statements |
| | |
| 106 | Accounting policies |
| | |
| 122 | Notes on the accounts |
Report of Independent Registered Public Accounting Firm to the members of The Royal Bank of Scotland Group plc
We have audited the financial statements of The Royal Bank of Scotland Group plc (“the company”) and its subsidiaries (together “the Group”) for the year ended 31 December 2007 which comprise the accounting policies, the balance sheets as at 31 December 2007 and 2006, the consolidated income statements, the cash flow statements, the statements of recognised income and expense for each of the three years in the period ended 31 December 2007 and the related Notes 1 to 43. These financial statements have been prepared under the accounting policies set out therein. We have also audited the information in the part of the directors’ remuneration report that is described as having been audited.
Respective responsibilities of directors and auditors
The directors’ responsibilities for preparing the annual report, the directors’ remuneration report and the financial statements in accordance with applicable law and International Financial Reporting Standards (IFRS), as adopted by the European Union, are set out in the statement of directors’ responsibilities.
Our responsibility is to audit the financial statements and the part of the directors’ remuneration report described as having been audited in accordance with relevant legal and regulatory requirements and International Standards on Auditing (UK and Ireland).
We report to you our opinion as to whether the financial statements give a true and fair view and whether the financial statements and the part of the directors’ remuneration report described as having been audited have been properly prepared in accordance with the Companies Act 1985, and as regards the Group’s consolidated financial statements, Article 4 of the IAS Regulation. We also report to you whether in our opinion, the information given in the directors’ report is consistent with the financial statements. The information given in the directors’ report includes that specific information presented in the Business review that is cross referred from the business review section of the directors’ report.
In addition we report to you if, in our opinion, the company has not kept proper accounting records, we have not received all the information and explanations we require for our audit, or if information specified by law regarding directors’ remuneration and other transactions is not disclosed.
We review whether the corporate governance statement reflects the company’s compliance with the nine provisions of the 2006 Combined Code specified for our review by the Listing Rules of the Financial Services Authority, and we report if it does not.
The Listing Rules do not require us to consider whether the Board or management’s statements on internal control cover all risks and controls, or form an opinion on the effectiveness of the Group’s corporate governance procedures or its risk and control procedures.
We read the other information contained in the Annual Report and Accounts 2007 as described in the contents section, including the unaudited part of the directors’ remuneration report, and consider whether it is consistent with the audited financial statements. We consider the implications for our report if we become aware of any apparent misstatements or material inconsistencies with the financial statements. Our responsibilities do not extend to any further information outside the Annual Report and Accounts 2007.
Basis of audit opinion
We conducted our audit in accordance with International Standards on Auditing (UK and Ireland) issued by the Auditing Practices Board and with the standards of the Public Company Accounting Oversight Board (United States). An audit includes examination, on a test basis, of evidence relevant to the amounts and disclosures in the financial statements and the part of the directors’ remuneration report described as having been audited. It also includes an assessment of the significant estimates and judgements made by the directors in the preparation of the financial statements, and of whether the accounting policies are appropriate to the circumstances of the company and the Group, consistently applied and adequately disclosed.
We planned and performed our audit so as to obtain all the information and explanations which we considered necessary in order to provide us with sufficient evidence to give reasonable assurance that the financial statements and the part of the directors’ remuneration report described as having been audited are free from material misstatement, whether caused by fraud or other irregularity or error. In forming our opinion, we also evaluated the overall adequacy of the presentation of information in the financial statements and the part of the directors’ remuneration report described as having been audited.
UK opinion
In our opinion:
| · | the Group financial statements give a true and fair view, in accordance with IFRS as adopted by the European Union, of the state of the Group’s affairs as at 31 December 2007 and of its profit and cash flows for the year then ended; |
| | |
| · | the company financial statements give a true and fair view, in accordance with IFRS as adopted by the European Union as applied in accordance with the provisions of the companies Act 1985, of the state of affairs of the company as at 31 December 2007; |
| | |
| · | the financial statements and the part of the directors’ remuneration report described as having been audited have been properly prepared in accordance with the Companies Act 1985 and, as regards the Group financial statements, Article 4 of the IAS Regulation; and |
| | |
| · | the information given in the directors’ report is consistent with the financial statements. |
Separate opinion in relation to IFRS
As explained in the accounting policies, the Group, in addition to complying with its legal obligation to comply with IFRS as adopted by the European Union, has also complied with IFRS as issued by the International Accounting Standards Board (IASB).
In our opinion the financial statements give a true and fair view, in accordance with IFRS, of the state of the Group’s affairs as at 31 December 2007 and of its profit and cash flows for the year then ended.
US opinion
In our opinion, the financial statements present fairly, in all material respects, the financial position of the Group as at 31 December 2007 and 2006 and the results of its operations and its cash flows for each of the three years in the period ended 31 December 2007, in conformity with IFRS as adopted for use in the European Union and IFRS as issued by the IASB.
We have also audited, in accordance with the standards of the Public Company Accounting Oversight Board (United States), the Group’s internal control over financial reporting as at 31 December 2007, based on the criteria established in Internal Control-Integrated Framework issued by the Committee of Sponsoring Organisations of the Treadway Commission. Management excluded from its assessment the internal control over financial reporting of ABN AMRO Holding N.V., and its subsidiaries which was acquired on 17 October 2007. Accordingly, our audit did not include the internal control over financial reporting in ABN AMRO Holding N.V. and its subsidiaries. ABN AMRO Holdings N.V. represented 40.7% of the Group’s total assets, a negligible proportion of the shareholders’ total equity, 7.7% of the Group’s total income and 0.2% of the Group’s profit after tax as of and for the year ended 31 December 2007.
Our report dated 27 February 2008 which is included in this Annual Report on Form 20-F for the year ended 31 December 2007 expresses an unqualified opinion on the effectiveness of the Group’s internal control over financial reporting of the Group excluding ABN AMRO Holding N.V. and its subsidiaries.
Deloitte & Touche LLP
Chartered Accountants and Registered Auditors
Edinburgh, United Kingdom
27 February 2008
Consolidated income statement for the year ended 31 December 2007
| | | | | | 2007 | | | 2006 | | | 2005 | |
| | | Note | | | | £m | | | | £m | | | | £m | |
| Interest receivable | | | | | | 33,420 | | | | 24,688 | | | | 21,331 | |
| Interest payable | | | | | | (20,752 | ) | | | (14,092 | ) | | | (11,413 | ) |
| Net interest income | | | | | | 12,668 | | | | 10,596 | | | | 9,918 | |
| Fees and commissions receivable | | | | | | 8,465 | | | | 7,116 | | | | 6,750 | |
| Fees and commissions payable | | | | | | (2,311 | ) | | | (1,922 | ) | | | (1,841 | ) |
| Income from trading activities | | | 1 | | | | 1,327 | | | | 2,675 | | | | 2,343 | |
| Other operating income (excluding insurance premium income) | | | | | | | 4,857 | | | | 3,564 | | | | 2,953 | |
| Insurance premium income | | | | | | | 6,398 | | | | 6,243 | | | | 6,076 | |
| Reinsurers’ share | | | | | | | (289 | ) | | | (270 | ) | | | (297 | ) |
| Non-interest income | | | | | | | 18,447 | | | | 17,406 | | | | 15,984 | |
| Total income | | | | | | | 31,115 | | | | 28,002 | | | | 25,902 | |
| Staff costs | | | | | | | 7,552 | | | | 6,723 | | | | 5,992 | |
| Premises and equipment | | | | | | | 1,766 | | | | 1,421 | | | | 1,313 | |
| Other administrative expenses | | | | | | | 3,147 | | | | 2,658 | | | | 2,816 | |
| Depreciation and amortisation | | | | | | | 1,970 | | | | 1,678 | | | | 1,825 | |
| Operating expenses | | | 2 | | | | 14,435 | | | | 12,480 | | | | 11,946 | |
| Profit before other operating charges and impairment losses | | | | | | | 16,680 | | | | 15,522 | | | | 13,956 | |
| Insurance claims | | | | | | | 4,770 | | | | 4,550 | | | | 4,413 | |
| Reinsurers’ share | | | | | | | (118 | ) | | | (92 | ) | | | (100 | ) |
| Impairment losses | | | 12 | | | | 2,128 | | | | 1,878 | | | | 1,707 | |
| Operating profit before tax | | | | | | | 9,900 | | | | 9,186 | | | | 7,936 | |
| Tax | | | 5 | | | | 2,052 | | | | 2,689 | | | | 2,378 | |
| Profit from continuing operations | | | | | | | 7,848 | | | | 6,497 | | | | 5,558 | |
| Loss from discontinued operations, net of tax | | | | | | | 136 | | | | — | | | | — | |
| Profit for the year | | | | | | | 7,712 | | | | 6,497 | | | | 5,558 | |
| Profit attributable to: | | | | | | | | | | | | | | | | |
| Minority interests | | | | | | | 163 | | | | 104 | | | | 57 | |
| Other owners | | | 6 | | | | 246 | | | | 191 | | | | 109 | |
| Ordinary shareholders | | | | | | | 7,303 | | | | 6,202 | | | | 5,392 | |
| | | | | | | | 7,712 | | | | 6,497 | | | | 5,558 | |
| Per 25p ordinary share: | | | | | | | | | | | | | | | | |
| Basic earnings | | | 9 | | | | 76.4 | p | | | 64.9 | p | | | 56.5 | p |
| | | | | | | | | | | | | | | | | |
| Diluted earnings | | | 9 | | | | 75.7 | p | | | 64.4 | p | | | 56.1 | p |
| | | | | | | | | | | | | | | | | |
| Dividends | | | 7 | | | | 32.2 | p | | | 25.8 | p | | | 20.2 | p |
Balance sheets at 31 December 2007
| | | Group | | Company |
| | | 2007 | 2006 | | 2007 | 2006 |
| | Note | £m | £m | | £m | £m |
| Assets | | | | | | |
| Cash and balances at central banks | | 17,866 | 6,121 | | — | — |
| Treasury and other eligible bills subject to repurchase agreements | 29 | 7,090 | 1,426 | | — | — |
| Other treasury and other eligible bills | | 11,139 | 4,065 | | — | — |
| Treasury and other eligible bills | 10 | 18,229 | 5,491 | | — | — |
| Loans and advances to banks | 10 | 219,460 | 82,606 | | 7,686 | 7,252 |
| Loans and advances to customers | 10 | 829,250 | 466,893 | | 307 | 286 |
| Debt securities subject to repurchase agreements | 29 | 100,561 | 58,874 | | — | — |
| Other debt securities | | 175,866 | 68,377 | | — | — |
| Debt securities | 14 | 276,427 | 127,251 | | — | — |
| Equity shares | 15 | 53,026 | 13,504 | | — | — |
| Investments in Group undertakings | 16 | — | — | | 43,542 | 21,784 |
| Settlement balances | | 16,589 | 7,425 | | — | — |
| Derivatives | 13 | 337,410 | 116,681 | | 173 | — |
| Intangible assets | 17 | 48,492 | 18,904 | | — | — |
| Property, plant and equipment | 18 | 18,750 | 18,420 | | — | — |
| Prepayments, accrued income and other assets | 19 | 19,066 | 8,136 | | 127 | 3 |
| Assets of disposal groups | | 45,954 | — | | — | — |
| Total assets | | 1,900,519 | 871,432 | | 51,835 | 29,325 |
| Liabilities | | | | | �� | |
| Deposits by banks | 10 | 312,633 | 132,143 | | 5,572 | 738 |
| Customer accounts | 10 | 682,365 | 384,222 | | — | — |
| Debt securities in issue | 10 | 273,615 | 85,963 | | 13,453 | 2,139 |
| Settlement balances and short positions | 10 | 91,021 | 49,476 | | — | — |
| Derivatives | 13 | 332,060 | 118,112 | | 179 | 42 |
| Accruals, deferred income and other liabilities | 21 | 34,024 | 15,660 | | 8 | 15 |
| Retirement benefit liabilities | 3 | 496 | 1,992 | | — | — |
| Deferred taxation | 22 | 5,510 | 3,264 | | 3 | — |
| Insurance liabilities | 23 | 10,162 | 7,456 | | — | — |
| Subordinated liabilities | 24 | 37,979 | 27,654 | | 7,743 | 8,194 |
| Liabilities of disposal groups | | 29,228 | — | | — | — |
| Total liabilities | | 1,809,093 | 825,942 | | 26,958 | 11,128 |
| Minority interests | 25 | 38,388 | 5,263 | | — | — |
| Equity owners | 26, 27 | 53,038 | 40,227 | | 24,877 | 18,197 |
| Total equity | | 91,426 | 45,490 | | 24,877 | 18,197 |
| Total liabilities and equity | | 1,900,519 | 871,432 | | 51,835 | 29,325 |
The accounts were approved by the Board of directors on 27 February 2008 and signed on its behalf by:
| Sir Tom McKillop | Sir Fred Goodwin | Guy Whittaker |
| Chairman | Group Chief Executive | Group Finance Director |
Statements of recognised income and expense for the year ended 31 December 2007
| | | Group | | | Company | |
| | | 2007 | | | 2006 | | | 2005 | | | 2007 | | | 2006 | | | 2005 | |
| | | | £m | | | | £m | | | | £m | | | | £m | | | | £m | | | | £m | |
| Available-for-sale investments | | | | | | | | | | | | | | | | | | | | | | | | |
| Net valuation (losses)/gains taken direct to equity | | | (776 | ) | | | 4,792 | | | | 35 | | | | — | | | | — | | | | — | |
| Net profit taken to income on sales | | | (513 | ) | | | (313 | ) | | | (582 | ) | | | — | | | | — | | | | — | |
| | | | | | | | | | | | | | | | | | | | | | | | | |
| Cash flow hedges | | | | | | | | | | | | | | | | | | | | | | | | |
| Net (losses)/gains taken direct to equity | | | (426 | ) | | | (109 | ) | | | 18 | | | | — | | | | — | | | | — | |
| Net (gains)/losses taken to earnings | | | (138 | ) | | | (140 | ) | | | (85 | ) | | | 3 | | | | 3 | | | | 6 | |
| | | | | | | | | | | | | | | | | | | | | | | | | |
| Exchange differences on translation of foreign operations | | | 2,210 | | | | (1,681 | ) | | | 842 | | | | — | | | | — | | | | — | |
| Actuarial gains/(losses) on defined benefit plans | | | 2,189 | | | | 1,781 | | | | (799 | ) | | | — | | | | — | | | | — | |
| Income/(expense) before tax on items recognised direct in equity | | | 2,546 | | | | 4,330 | | | | (571 | ) | | | 3 | | | | 3 | | | | 6 | |
| Tax on items recognised direct in equity | | | (170 | ) | | | (1,173 | ) | | | 478 | | | | (1 | ) | | | (1 | ) | | | (2 | ) |
| Net income/(expense) recognised direct in equity | | | 2,376 | | | | 3,157 | | | | (93 | ) | | | 2 | | | | 2 | | | | 4 | |
| Profit for the year | | | 7,712 | | | | 6,497 | | | | 5,558 | | | | 2,499 | | | | 3,499 | | | | 2,074 | |
| Total recognised income and expense for the year | | | 10,088 | | | | 9,654 | | | | 5,465 | | | | 2,501 | | | | 3,501 | | | | 2,078 | |
| Attributable to: | | | | | | | | | | | | | | | | | | | | | | | | |
| Equity owners | | | 8,610 | | | | 7,707 | | | | 5,355 | | | | 2,501 | | | | 3,501 | | | | 2,078 | |
| Minority interests | | | 1,478 | | | | 1,947 | | | | 110 | | | | — | | | | — | | | | — | |
| | | | 10,088 | | | | 9,654 | | | | 5,465 | | | | 2,501 | | | | 3,501 | | | | 2,078 | |
Cash flow statements for the year ended 31 December 2007
| | | | | | Group | | | Company | |
| | | | | | 2007 | | | 2006 | | | 2005 | | | 2007 | | | 2006 | | | 2005 | |
| | | Note | | | | £m | | | | £m | | | | £m | | | | £m | | | | £m | | | | £m | |
| Operating activities | | | | | | | | | | | | | | | | | | | | | | | | | | | |
| Operating profit before tax | | | | | | 9,900 | | | | 9,186 | | | | 7,936 | | | | 2,372 | | | | 3,486 | | | | 1,932 | |
| Adjustments for: | | | | | | | | | | | | | | | | | | | | | | | | | | | |
| Depreciation and amortisation | | | | | | 1,970 | | | | 1,678 | | | | 1,825 | | | | — | | | | — | | | | — | |
| Interest on subordinated liabilities | | | | | | 1,542 | | | | 1,386 | | | | 1,271 | | | | 470 | | | | 520 | | | | 583 | |
| Charge for defined benefit pension schemes | | | | | | 489 | | | | 580 | | | | 462 | | | | — | | | | — | | | | — | |
| Cash contribution to defined benefit pension schemes | | | | | | (599 | ) | | | (536 | ) | | | (452 | ) | | | — | | | | — | | | | — | |
| Elimination of foreign exchange differences | | | | | | (10,282 | ) | | | 4,516 | | | | (3,060 | ) | | | (58 | ) | | | (22 | ) | | | (30 | ) |
| Other non-cash items | | | | | | (3,235 | ) | | | (1,120 | ) | | | (1,412 | ) | | | 1 | | | | 18 | | | | (104 | ) |
| Net cash (outflow)/inflow from trading activities | | | | | | (215 | ) | | | 15,690 | | | | 6,570 | | | | 2,785 | | | | 4,002 | | | | 2,381 | |
| Changes in operating assets and liabilities | | | | | | 28,261 | | | | 3,980 | | | | (519 | ) | | | 15,562 | | | | (508 | ) | | | 2,050 | |
| Net cash flows from operating activities before tax | | | | | | 28,046 | | | | 19,670 | | | | 6,051 | | | | 18,347 | | | | 3,494 | | | | 4,431 | |
| Income taxes (paid)/received | | | | | | (2,442 | ) | | | (2,229 | ) | | | (1,911 | ) | | | 6 | | | | 154 | | | | (18 | ) |
| Net cash flows from operating activities | | | 34 | | | | 25,604 | | | | 17,441 | | | | 4,140 | | | | 18,353 | | | | 3,648 | | | | 4,413 | |
| Investing activities | | | | | | | | | | | | | | | | | | | | | | | | | | | | |
| Sale and maturity of securities | | | | | | | 63,007 | | | | 27,126 | | | | 39,472 | | | | — | | | | — | | | | — | |
| Purchase of securities | | | | | | | (61,020 | ) | | | (19,126 | ) | | | (39,196 | ) | | | — | | | | — | | | | — | |
| Investment in subsidiaries | | | | | | | — | | | | — | | | | — | | | | (18,510 | ) | | | (1,097 | ) | | | (2,961 | ) |
| Disposal of subsidiaries | | | | | | | — | | | | — | | | | — | | | | 6 | | | | — | | | | — | |
| Sale of property, plant and equipment | | | | | | | 5,786 | | | | 2,990 | | | | 2,220 | | | | — | | | | — | | | | — | |
| Purchase of property, plant and equipment | | | | | | | (5,080 | ) | | | (4,282 | ) | | | (4,812 | ) | | | — | | | | — | | | | — | |
| Discontinued activities | | | | | | | (334 | ) | | | — | | | | — | | | | — | | | | — | | | | — | |
| Net investment in business interests and intangible assets | | | 35 | | | | 13,640 | | | | (63 | ) | | | (296 | ) | | | — | | | | — | | | | — | |
| Loans to subsidiaries | | | | | | | — | | | | — | | | | — | | | | — | | | | — | | | | (337 | ) |
| Repayments from subsidiaries | | | | | | | — | | | | — | | | | — | | | | 469 | | | | 547 | | | | 1,183 | |
| Net cash flows from investing activities | | | | | | | 15,999 | | | | 6,645 | | | | (2,612 | ) | | | (18,035 | ) | | | (550 | ) | | | (2,115 | ) |
| Financing activities | | | | | | | | | | | | | | | | | | | | | | | | | | | | |
| Issue of ordinary shares | | | | | | | 77 | | | | 104 | | | | 163 | | | | 77 | | | | 104 | | | | 163 | |
| Issue of other equity interests | | | | | | | 3,600 | | | | 671 | | | | 1,649 | | | | 3,600 | | | | 671 | | | | 1,649 | |
| Issue of paid up equity | | | | | | | 1,073 | | | | — | | | | — | | | | 1,073 | | | | — | | | | — | |
| Issue of subordinated liabilities | | | | | | | 1,018 | | | | 3,027 | | | | 1,234 | | | | — | | | | 399 | | | | 337 | |
| Proceeds of minority interests issued | | | | | | | 31,095 | | | | 1,354 | | | | 1,264 | | | | — | | | | — | | | | — | |
| Redemption of minority interests | | | | | | | (545 | ) | | | (81 | ) | | | (121 | ) | | | — | | | | — | | | | — | |
| Repurchase of ordinary shares | | | | | | | — | | | | (991 | ) | | | — | | | | — | | | | (991 | ) | | | — | |
| Shares purchased by employee trusts | | | | | | | (65 | ) | | | (254 | ) | | | — | | | | — | | | | — | | | | — | |
| Shares issued under employee share schemes | | | | | | | 79 | | | | 108 | | | | — | | | | — | | | | 7 | | | | — | |
| Repayment of subordinated liabilities | | | | | | | (1,708 | ) | | | (1,318 | ) | | | (1,553 | ) | | | (469 | ) | | | (547 | ) | | | (1,183 | ) |
| Dividends paid | | | | | | | (3,411 | ) | | | (2,727 | ) | | | (2,007 | ) | | | (3,290 | ) | | | (2,661 | ) | | | (1,912 | ) |
| Interest on subordinated liabilities | | | | | | | (1,522 | ) | | | (1,409 | ) | | | (1,332 | ) | | | (455 | ) | | | (497 | ) | | | (577 | ) |
| Net cash flows from financing activities | | | | | | | 29,691 | | | | (1,516 | ) | | | (703 | ) | | | 536 | | | | (3,515 | ) | | | (1,523 | ) |
| Effects of exchange rate changes on cash and cash equivalents | | | | 6,010 | | | | (3,468 | ) | | | 1,703 | | | | 62 | | | | (52 | ) | | | 42 | |
| Net increase/(decrease) in cash and cash equivalents | | | | | | | 77,304 | | | | 19,102 | | | | 2,528 | | | | 916 | | | | (469 | ) | | | 817 | |
| Cash and cash equivalents 1 January | | | | | | | 71,651 | | | | 52,549 | | | | 50,021 | | | | 657 | | | | 1,126 | | | | 309 | |
| Cash and cash equivalents 31 December | | | | | | | 148,955 | | | | 71,651 | | | | 52,549 | | | | 1,573 | | | | 657 | | | | 1,126 | |
Accounting policies
1. Presentation of accounts
The accounts are prepared in accordance with International Financial Reporting Standards issued by the International Accounting Standards Board (“IASB”) and interpretations issued by the International Financial Reporting Interpretations Committee of the IASB (together “IFRS”) as adopted by the European Union (“EU”). The EU has not adopted the complete text of IAS 39 ‘Financial Instruments: Recognition and Measurement’; it has relaxed some of the standard’s hedging requirements. The Group has not taken advantage of this relaxation and has adopted IAS 39 as issued by the IASB: the Group’s financial statements are prepared in accordance with IFRS as issued by the IASB. The date of transition to IFRS for the Group and the company (The Royal Bank of Scotland Group plc) and the date of their opening IFRS balance sheets was 1 January 2004.
The Group has adopted IFRS 7 ‘Financial Instruments: Disclosures’ for the accounting period beginning 1 January 2007. This has had no effect on the results, cash flows or financial position of the Group or the company. However, there are changes to the notes on the accounts and comparative information is presented accordingly.
The Group is no longer required to include reconciliations of shareholders’ equity and net income under IFRS and US GAAP in its filings with the Securities and Exchange Commission in the US.
The company is incorporated in the UK and registered in Scotland. The accounts are prepared on the historical cost basis except that the following assets and liabilities are stated at their fair value: derivative financial instruments, held-for-trading financial assets and financial liabilities, financial assets and financial liabilities that are designated as at fair value through profit or loss, available-for-sale financial assets and investment property. Recognised financial assets and financial liabilities in fair value hedges are adjusted for changes in fair value in respect of the risk that is hedged.
The company accounts are presented in accordance with the Companies Act 1985.
2. Basis of consolidation
The consolidated financial statements incorporate the financial statements of the company and entities (including certain special purpose entities) that continue to be controlled by the Group (its subsidiaries). Control exists where the Group has the power to govern the financial and operating policies of the entity; generally conferred by holding a majority of voting rights. On acquisition of a subsidiary, its identifiable assets, liabilities and contingent liabilities are included in the consolidated accounts at their fair value. Any excess of the cost (the fair value of assets given, liabilities incurred or assumed and equity instruments issued by the Group plus any directly attributable costs) of an acquisition over the fair value of the net assets acquired is recognised as goodwill. The interest of minority shareholders is stated at their share of the fair value of the subsidiary’s net assets.
The results of subsidiaries acquired are included in the consolidated income statement from the date control passes to the Group. The results of subsidiaries are included up until the Group ceases to control them through a sale or significant change in circumstances.
All intra-group balances, transactions, income and expenses are eliminated on consolidation. The consolidated accounts are prepared using uniform accounting policies.
3. Revenue recognition
Interest income on financial assets that are classified as loans and receivables, available-for-sale or held-to-maturity and interest expense on financial liabilities other than those at fair value through profit or loss are determined using the effective interest method. The effective interest method is a method of calculating the amortised cost of a financial asset or financial liability (or group of financial assets or liabilities) and of allocating the interest income or interest expense over the expected life of the asset or liability. The effective interest rate is the rate that exactly discounts estimated future cash flows to the instrument’s initial carrying amount. Calculation of the effective interest rate takes into account fees payable or receivable, that are an integral part of the instrument’s yield, premiums or discounts on acquisition or issue, early redemption fees and transaction costs. All contractual terms of a financial instrument are considered when estimating future cash flows.
Financial assets and financial liabilities held-for-trading or designated as at fair value through profit or loss are recorded at fair value. Changes in fair value are recognised in profit or loss together with dividends and interest receivable and payable.
Commitment and utilisation fees are determined as a percentage of the outstanding facility. If it is unlikely that a specific lending arrangement will be entered into, such fees are taken to profit or loss over the life of the facility otherwise they are deferred and included in the effective interest rate on the advance.
Fees in respect of services are recognised as the right to consideration accrues through the provision of the service to the customer. The arrangements are generally contractual and the cost of providing the service is incurred as the service is rendered. The price is usually fixed and always determinable. The application of this policy to significant fee types is outlined below.
Payment services: this comprises income received for payment services including cheques cashed, direct debits, Clearing House Automated Payments (the UK electronic settlement system) and BACS payments (the automated clearing house that processes direct debits and direct credits). These are generally charged on a per transaction basis. The income is earned when the payment or transaction occurs. Charges for payment services are usually debited to the customer’s account, monthly or quarterly in arrears. Accruals are raised for services provided but not charged at period end.
Card related services: fees from credit card business include:
Commission received from retailers for processing credit and debit card transactions: income is accrued to the income statement as the service is performed.
Interchange received: as issuer, the Group receives a fee (interchange) each time a cardholder purchases goods and services. The Group also receives interchange fees from other card issuers for providing cash advances through its branch and Automated Teller Machine networks. These fees are accrued once the transaction has taken place.
An annual fee payable by a credit card holder is deferred and taken to profit or loss over the period of the service i.e. 12 months.
Insurance brokerage: this is made up of fees and commissions received from the agency sale of insurance. Commission on the sale of an insurance contract is earned at the inception of the policy as the insurance has been arranged and placed. However, provision is made where commission is refundable in the event of policy cancellation in line with estimated cancellations.
Investment management fees: fees charged for managing investments are recognised as revenue as the services are provided. Incremental costs that are directly attributable to securing an investment management contract are deferred and charged as expense as the related revenue is recognised.
Insurance premiums – see accounting policy 10 below.
4. Pensions and other post-retirement benefits
The Group provides post-retirement benefits in the form of pensions and healthcare plans to eligible employees.
For defined benefit schemes, scheme liabilities are measured on an actuarial basis using the projected unit credit method and discounted at a rate that reflects the current rate of return on a high quality corporate bond of equivalent term and currency to the scheme liabilities. Scheme assets are measured at their fair value. Any surplus or deficit of scheme assets over liabilities is recognised in the balance sheet as an asset (surplus) or liability (deficit). The current service cost and any past service costs together with the expected return on scheme assets less the unwinding of the discount on the scheme liabilities is charged to operating expenses. Actuarial gains and losses are recognised in full in the period in which they occur outside profit or loss and presented in the statement of recognised income and expense.
Contributions to defined contribution pension schemes are recognised in the income statement when payable.
5. Intangible assets and goodwill
Intangible assets that are acquired by the Group are stated at cost less accumulated amortisation and impairment losses. Amortisation is charged to profit or loss over the assets’ estimated economic lives using methods that best reflect the pattern of economic benefits and is included in depreciation and amortisation. The estimated useful economic lives are as follows:
| Core deposit intangibles | 6 to 10 years |
| Other acquired intangibles | 5 to 10 years |
| Computer software | 3 to 5 years |
Expenditure on internally generated goodwill and brands is written-off as incurred. Direct costs relating to the development of internal-use computer software are capitalised once technical feasibility and economic viability have been established. These costs include payroll, the costs of materials and services, and directly attributable overhead. Capitalisation of costs ceases when the software is capable of operating as intended. During and after development, accumulated costs are reviewed for impairment against the projected benefits that the software is expected to generate. Costs incurred prior to the establishment of technical feasibility and economic viability are expensed as incurred as are all training costs and general overhead. The costs of licences to use computer software that are expected to generate economic benefits beyond one year are also capitalised.
Acquired goodwill being the excess of the cost of an acquisition over the Group’s interest in the net fair value of the identifiable assets, liabilities and contingent liabilities of the subsidiary, associate or joint venture acquired is initially recognised at cost and subsequently at cost less any accumulated impairment losses. Goodwill arising on the acquisition of subsidiaries and joint ventures is included in the balance sheet caption ‘Intangible assets’ and that on associates within their carrying amounts. The gain or loss on the disposal of a subsidiary, associate or joint venture includes the carrying value of any related goodwill.
On implementation of IFRS, the Group did not restate business combinations that occurred before January 2004. Under previous GAAP, goodwill arising on acquisitions after 1 October 1998 was capitalised and amortised over its estimated useful economic life. Goodwill arising on acquisitions before 1 October 1998 was deducted from equity. The carrying amount of goodwill in the Group’s opening IFRS balance sheet (1 January 2004) was £13,131 million, its carrying value under previous GAAP.
6. Property, plant and equipment
Items of property, plant and equipment are stated at cost less accumulated depreciation (see below) and impairment losses. Where an item of property, plant and equipment comprises major components having different useful lives, they are accounted for separately. Property that is being constructed or developed for future use as investment property is classified as property, plant and equipment and stated at cost until construction or development is complete, at which time it is reclassified as investment property.
Accounting policies continued
Depreciation is charged to profit or loss on a straight-line basis so as to write-off the depreciable amount of property, plant and equipment (including assets owned and let on operating leases (except investment property – see accounting policy 21 below)) over their estimated useful lives. The depreciable amount is the cost of an asset less its residual value. Land is not depreciated. Estimated useful lives are as follows:
| Freehold and long leasehold buildings | 50 years |
| Short leaseholds | unexpired period |
| | of the lease |
| Property adaptation costs | 10 to 15 years |
| Computer equipment | up to 5 years |
| Other equipment | 4 to 15 years |
Under previous GAAP, the Group’s freehold and long leasehold property occupied for its own use was recorded at valuation on the basis of existing use value. The Group elected to use this valuation as at 31 December 2003 (£2,391 million) as deemed cost for its opening IFRS balance sheet (1 January 2004).
7. Impairment of intangible assets and property, plant and equipment
At each reporting date, the Group assesses whether there is any indication that its intangible assets, or property, plant and equipment are impaired. If any such indication exists, the Group estimates the recoverable amount of the asset and the impairment loss if any. Goodwill is tested for impairment annually or more frequently if events or changes in circumstances indicate that it might be impaired. If an asset does not generate cash flows that are independent from those of other assets or groups of assets, recoverable amount is determined for the cash-generating unit to which the asset belongs. The recoverable amount of an asset is the higher of its fair value less cost to sell and its value in use. Value in use is the present value of future cash flows from the asset or cash-generating unit discounted at a rate that reflects market interest rates adjusted for risks specific to the asset or cash generating unit that have not been reflected in the estimation of future cash flows. If the recoverable amount of an intangible or tangible asset is less than its carrying value, an impairment loss is recognised immediately in profit or loss and the carrying value of the asset reduced by the amount of the loss. A reversal of an impairment loss on intangible assets (excluding goodwill) or property, plant and equipment is recognised as it arises provided the increased carrying value does not exceed that which it would have been had no impairment loss been recognised. Impairment losses on goodwill are not reversed.
8. Foreign currencies
The Group’s consolidated financial statements are presented in sterling which is the functional currency of the company.
Transactions in foreign currencies are translated into sterling at the foreign exchange rate ruling at the date of the transaction. Monetary assets and liabilities denominated in foreign currencies are translated into sterling at the rates of exchange ruling at the balance sheet date. Foreign exchange differences arising on translation are reported in income from trading activities except for differences arising on cash flow hedges and hedges of net investments in foreign operations. Non-monetary items denominated in foreign currencies that are stated at fair value are translated into sterling at foreign exchange rates ruling at the dates the values were determined. Translation differences arising on non-monetary items measured at fair value are recognised in profit or loss except for differences arising on available-for-sale non-monetary financial assets, for example equity shares, which are included in the available-for-sale reserve in equity unless the asset is the hedged item in a fair value hedge.
The assets and liabilities of foreign operations, including goodwill and fair value adjustments arising on acquisition, are translated into sterling at foreign exchange rates ruling at the balance sheet date. The revenues and expenses of foreign operations are translated into sterling at average exchange rates unless these do not approximate to the foreign exchange rates ruling at the dates of the transactions. Foreign exchange differences arising on the translation of a foreign operation are recognised directly in equity and included in profit or loss on its disposal.
9. Leases
Contracts to lease assets are classified as finance leases if they transfer substantially all the risks and rewards of ownership of the asset to the customer. Other contracts to lease assets are classified as operating leases.
Finance lease receivables are stated in the balance sheet at the amount of the net investment in the lease being the minimum lease payments and any unguaranteed residual value discounted at the interest rate implicit in the lease. Finance lease income is allocated to accounting periods so as to give a constant periodic rate of return before tax on the net investment. Unguaranteed residual values are subject to regular review to identify potential impairment. If there has been a reduction in the estimated unguaranteed residual value, the income allocation is revised and any reduction in respect of amounts accrued is recognised immediately.
Rental income from operating leases is credited to the income statement on a receivable basis over the term of the lease. Operating lease assets are included within Property, plant and equipment and depreciated over their useful lives (see accounting policy 6 above).
10. Insurance
General insurance
General insurance comprises short-duration contracts, principally property and liability insurance contracts. Due to the nature of the products sold – retail-based property and casualty, motor, home and personal health insurance contracts – the insurance protection is provided on an even basis throughout the term of the policy.
Premiums from general insurance contracts are recognised in the accounting period in which they begin. Unearned premiums represent the proportion of the net premiums that relate to periods of insurance after the balance sheet date and are calculated over the period of exposure under the policy, on a daily basis, 24th’s basis or allowing for the estimated incidence of exposure under policies which are longer than twelve months. Provision is made where necessary for the estimated amount of claims over and above unearned premiums including that in respect of future written business on discontinued lines under the run-off of delegated underwriting authority arrangements. The provision is designed to meet future claims and related expenses and is calculated across related classes of business on the basis of a separate carry forward of deferred acquisition expenses after making allowance for investment income.
Acquisition expenses relating to new and renewed business for all classes are expensed over the period during which the premiums are earned. The principal acquisition costs so deferred are commissions payable, costs associated with the telesales and underwriting staff and prepaid claims handling costs in respect of delegated claims handling arrangements for claims which are expected to occur after the balance sheet date. Claims and the related reinsurance are recognised in the accounting period in which the loss occurs. Provision is made for the full cost of settling outstanding claims at the balance sheet date, including claims estimated to have been incurred but not yet reported at that date, and claims handling expenses. The related reinsurance receivable is recognised at the same time.
Life assurance
The Group’s long-term assurance contracts include whole-life term assurance, endowment assurance, flexible whole-life, pension and annuity contracts that are expected to remain in force for an extended period of time. Long-term assurance contracts under which the Group does not accept significant insurance risk are classified as financial instruments.
The Group recognises the value of in-force long-term assurance contracts as an asset. Cash flows associated with in-force contracts and related assets, including reinsurance cash flows, are projected, using appropriate assumptions as to future mortality, persistency and levels of expenses and excluding the value of future investment margins, to estimate future surpluses attributable to the Group. These surpluses, discounted at a risk-adjusted rate, are recognised as a separate asset. Changes in the value of this asset are included in profit or loss.
Premiums on long-term insurance contracts are recognised as income when receivable. Claims on long-term insurance contracts reflect the cost of all claims arising during the year, including claims handling costs. Claims are recognised when the Group becomes aware of the claim.
Reinsurance
The Group has reinsurance treaties that transfer significant insurance risk. Liabilities for reinsured contracts are calculated gross of reinsurance and a separate reinsurance asset recorded.
11. Taxation
Provision is made for taxation at current enacted rates on taxable profits, arising in income or in equity, taking into account relief for overseas taxation where appropriate. Deferred taxation is accounted for in full for all temporary differences between the carrying amount of an asset or liability for accounting purposes and its carrying amount for tax purposes, except in relation to overseas earnings where remittance is controlled by the Group, and goodwill.
Deferred tax assets are only recognised to the extent that it is probable that they will be recovered.
12. Financial assets
On initial recognition financial assets are classified into held-to-maturity investments; available-for-sale financial assets; held-for-trading; designated as at fair value through profit or loss; or loans and receivables.
Held-to-maturity investments – a financial asset may be classified as a held-to-maturity investment only if it has fixed or determinable payments, a fixed maturity and the Group has the positive intention and ability to hold to maturity. Held-to-maturity investments are initially recognised at fair value plus directly related transaction costs. They are subsequently measured at amortised cost using the effective interest method (see accounting policy 3 above) less any impairment losses.
Held-for-trading – a financial asset is classified as held-for-trading if it is acquired principally for the purpose of selling in the near term, or forms part of a portfolio of financial instruments that are managed together and for which there is evidence of short-term profit taking, or it is a derivative (not in a qualifying hedge relationship). Held-for-trading financial assets are recognised at fair value with transaction costs being recognised in profit or loss. Subsequently they are measured at fair value. Gains and losses on held-for-trading financial assets are recognised in profit or loss as they arise.
Accounting policies continued
Designated as at fair value through profit or loss – financial assets may be designated as at fair value through profit or loss only if such designation (a) eliminates or significantly reduces a measurement or recognition inconsistency; or (b) applies to a group of financial assets, financial liabilities or both that the Group manages and evaluates on a fair value basis; or (c) relates to an instrument that contains an embedded derivative which is not evidently closely related to the host contract.
Financial assets that the Group designates on initial recognition as being at fair value through profit or loss are recognised at fair value, with transaction costs being recognised in profit or loss and are subsequently measured at fair value. Gains and losses on financial assets that are designated as at fair value through profit or loss are recognised in profit or loss as they arise.
The principal category of financial assets designated as at fair value through profit or loss is policyholders’ assets underpinning insurance and investment contracts issued by the Group's life assurance businesses. Fair value designation significantly reduces the measurement inconsistency that would arise if these assets were classified as available-for-sale.
Loans and receivables – non-derivative financial assets with fixed or determinable repayments that are not quoted in an active market are classified as loans and receivables except those that are classified as available-for-sale or as held-for-trading, or designated as at fair value through profit or loss. Loans and receivables are initially recognised at fair value plus directly related transaction costs. They are subsequently measured at amortised cost using the effective interest method (see accounting policy 3 above) less any impairment losses.
Available-for-sale – financial assets that are not classified as held-to-maturity; held-for-trading; designated as at fair value through profit or loss; or loans and receivables are classified as available-for-sale. Financial assets can be designated as available-for-sale on initial recognition. Available-for-sale financial assets are initially recognised at fair value plus directly related transaction costs. They are subsequently measured at fair value. Unquoted equity investments whose fair value cannot be measured reliably are carried at cost and classified as available-for-sale financial assets. Impairment losses and exchange differences resulting from retranslating the amortised cost of currency monetary available-for-sale financial assets are recognised in profit or loss together with interest calculated using the effective interest method (see accounting policy 3 above). Other changes in the fair value of available-for-sale financial assets are reported in a separate component of shareholders’ equity until disposal, when the cumulative gain or loss is recognised in profit or loss.
Regular way purchases of financial assets classified as loans and receivables are recognised on settlement date; all other regular way purchases are recognised on trade date.
Fair value for a net open position in a financial asset that is quoted in an active market is the current bid price times the number of units of the instrument held. Fair values for financial assets not quoted in an active market are determined using appropriate valuation techniques including discounting future cash flows, option pricing models and other methods that are consistent with accepted economic methodologies for pricing financial assets.
13. Impairment of financial assets
The Group assesses at each balance sheet date whether there is any objective evidence that a financial asset or group of financial assets classified as held-to-maturity, available-for-sale or loans and receivables is impaired. A financial asset or portfolio of financial assets is impaired and an impairment loss incurred if there is objective evidence that an event or events since initial recognition of the asset have adversely affected the amount or timing of future cash flows from the asset.
Financial assets carried at amortised cost – if there is objective evidence that an impairment loss on a financial asset or group of financial assets classified as loans and receivables or as held-to-maturity investments has been incurred, the Group measures the amount of the loss as the difference between the carrying amount of the asset or group of assets and the present value of estimated future cash flows from the asset or group of assets discounted at the effective interest rate of the instrument at initial recognition.
Impairment losses are assessed individually for financial assets that are individually significant and individually or collectively for assets that are not individually significant. In making collective assessment of impairment, financial assets are grouped into portfolios on the basis of similar risk characteristics. Future cash flows from these portfolios are estimated on the basis of the contractual cash flows and historical loss experience for assets with similar credit risk characteristics. Historical loss experience is adjusted, on the basis of current observable data, to reflect the effects of current conditions not affecting the period of historical experience.
Impairment losses are recognised in profit or loss and the carrying amount of the financial asset or group of financial assets reduced by establishing an allowance for impairment losses. If in a subsequent period the amount of the impairment loss reduces and the reduction can be ascribed to an event after the impairment was recognised, the previously
recognised loss is reversed by adjusting the allowance. Once an impairment loss has been recognised on a financial asset or group of financial assets, interest income is recognised on the carrying amount using the rate of interest at which estimated future cash flows were discounted in measuring impairment.
Financial assets carried at fair value – when a decline in the fair value of a financial asset classified as available-for-sale has been recognised directly in equity and there is objective evidence that the asset is impaired, the cumulative loss is removed from equity and recognised in profit or loss. The loss is measured as the difference between the amortised cost of the financial asset and its current fair value. Impairment losses on available-for-sale equity instruments are not reversed through profit or loss, but those on available-for-sale debt instruments are reversed, if there is an increase in fair value that is objectively related to a subsequent event.
14. Financial liabilities
A financial liability is classified as held-for-trading if it is incurred principally for the purpose of selling in the near term, or forms part of a portfolio of financial instruments that are managed together and for which there is evidence of short-term profit taking, or it is a derivative (not in a qualifying hedge relationship). Held-for-trading financial liabilities are recognised at fair value with transaction costs being recognised in profit or loss. Subsequently they are measured at fair value. Gains and losses are recognised in profit or loss as they arise.
Financial liabilities that the Group designates on initial recognition as being at fair value through profit or loss are recognised at fair value, with transaction costs being recognised in profit or loss, and are subsequently measured at fair value. Gains and losses on financial liabilities that are designated as at fair value through profit or loss are recognised in profit or loss as they arise.
Financial liabilities may be designated as at fair value through profit or loss only if such designation (a) eliminates or significantly reduces a measurement or recognition inconsistency; or (b) applies to a group of financial assets, financial liabilities or both that the Group manages and evaluates on a fair value basis; or (c) relates to an instrument that contains an embedded derivative which is not evidently closely related to the host contract.
The principal categories of financial liabilities designated as at fair value through profit or loss are (a) structured liabilities issued by the Group: designation significantly reduces the measurement inconsistency between these liabilities and the related derivatives carried at fair value; and (b) investment contracts issued by the Group's life assurance businesses: fair value designation significantly reduces the measurement inconsistency that would arise if these liabilities were measured at amortised cost.
All other financial liabilities are measured at amortised cost using the effective interest method (see accounting policy 3 above).
Fair value for a net open position in a financial liability that is quoted in an active market is the current offer price times the number of units of the instrument held or issued. Fair values for financial liabilities not quoted in an active market are determined using appropriate valuation techniques including discounting future cash flows, option pricing models and other methods that are consistent with accepted economic methodologies for pricing financial liabilities.
15. Derecognition
A financial asset is derecognised when it has been transferred and the transfer qualifies for derecognition. A transfer requires that the Group either: (a) transfers the contractual rights to receive the asset’s cash flows; or (b) retains the right to the asset’s cash flows but assumes a contractual obligation to pay those cash flows to a third party. After a transfer, the Group assesses the extent to which it has retained the risks and rewards of ownership of the transferred asset. If substantially all the risks and rewards have been retained, the asset remains on the balance sheet. If substantially all the risks and rewards have been transferred, the asset is derecognised. If substantially all the risks and rewards have been neither retained nor transferred, the Group assesses whether or not it has retained control of the asset. If it has not retained control, the asset is derecognised. Where the Group has retained control of the asset, it continues to recognise the asset to the extent of its continuing involvement.
A financial liability is removed from the balance sheet when the obligation is discharged, or cancelled, or expires.
16. Sale and repurchase transactions
Securities subject to a sale and repurchase agreement under which substantially all the risks and rewards of ownership are retained by the Group continue to be shown on the balance sheet and the sale proceeds recorded as a deposit. Securities acquired in a reverse sale and repurchase transaction under which the Group is not exposed to substantially all the risks and rewards of ownership are not recognised on the balance sheet and the consideration is recorded in Loans and advances to banks or Loans and advances to customers as appropriate.
Securities borrowing and lending transactions are usually secured by cash or securities advanced by the borrower. Borrowed securities are not recognised on the balance sheet or lent securities derecognised. Cash collateral received or given is treated as a loan or deposit; collateral in the form of securities is not recognised. However, where securities borrowed are transferred to third parties, a liability for the obligation to return the securities to the stock lending counterparty is recorded.
Accounting policies continued
17. Netting
Financial assets and financial liabilities are offset and the net amount presented in the balance sheet when, and only when, the Group currently has a legally enforceable right to set off the recognised amounts; and it intends either to settle on a net basis, or to realise the asset and settle the liability simultaneously. The Group is party to a number of arrangements, including master netting agreements, that give it the right to offset financial assets and financial liabilities but where it does not intend to settle the amounts net or simultaneously and therefore the assets and liabilities concerned are presented gross.
18. Capital instruments
The Group classifies a financial instrument that it issues as a financial asset, financial liability or an equity instrument in accordance with the substance of the contractual arrangement. An instrument is classified as a liability if it is a contractual obligation to deliver cash or another financial asset, or to exchange financial assets or financial liabilities on potentially unfavourable terms. An instrument is classified as equity if it evidences a residual interest in the assets of the Group after the deduction of liabilities. The components of a compound financial instrument issued by the Group are classified and accounted for separately as financial assets, financial liabilities or equity as appropriate.
19. Derivatives and hedging
Derivative financial instruments are recognised initially, and subsequently measured, at fair value. Derivative fair values are determined from quoted prices in active markets where available. Where there is no active market for an instrument, fair value is derived from prices for the derivative’s components using appropriate pricing or valuation models.
A derivative embedded in a contract is accounted for as a stand-alone derivative if its economic characteristics are not closely related to the economic characteristics of the host contract; unless the entire contract is carried at fair value through profit or loss.
Gains and losses arising from changes in the fair value of a derivative are recognised as they arise in profit or loss unless the derivative is the hedging instrument in a qualifying hedge. The Group enters into three types of hedge relationship: hedges of changes in the fair value of a recognised asset or liability or firm commitment (fair value hedges); hedges of the variability in cash flows from a recognised asset or liability or a forecast transaction (cash flow hedges); and hedges of the net investment in a foreign operation.
Hedge relationships are formally documented at inception. The documentation includes identification of the hedged item and the hedging instrument, details the risk that is being hedged and the way in which effectiveness will be assessed at inception and during the period of the hedge. If the hedge is not highly effective in offsetting changes in fair values or cash flows attributable to the hedged risk, consistent with the documented risk management strategy, hedge accounting is discontinued.
Fair value hedge – in a fair value hedge, the gain or loss on the hedging instrument is recognised in profit or loss. The gain or loss on the hedged item attributable to the hedged risk is recognised in profit or loss and adjusts the carrying amount of the hedged item. Hedge accounting is discontinued if the hedge no longer meets the criteria for hedge accounting or if the hedging instrument expires or is sold, terminated or exercised or if hedge designation is revoked. If the hedged item is one for which the effective interest rate method is used, any cumulative adjustment is amortised to profit or loss over the life of the hedged item using a recalculated effective interest rate.
Cash flow hedge – where a derivative financial instrument is designated as a hedge of the variability in cash flows of a recognised asset or liability or a highly probable forecast transaction, the effective portion of the gain or loss on the hedging instrument is recognised directly in equity. The ineffective portion is recognised in profit or loss. When the forecast transaction results in the recognition of a financial asset or financial liability, the cumulative gain or loss is reclassified from equity in the same periods in which the asset or liability affects profit or loss. Otherwise the cumulative gain or loss is removed from equity and recognised in profit or loss at the same time as the hedged transaction. Hedge accounting is discontinued if the hedge no longer meets the criteria for hedge accounting; if the hedging instrument expires or is sold, terminated or exercised; if the forecast transaction is no longer expected to occur; or if hedge designation is revoked. On the discontinuance of hedge accounting (except where a forecast transaction is no longer expected to occur), the cumulative unrealised gain or loss recognised in equity is recognised in profit or loss when the hedged cash flow occurs or, if the forecast transaction results in the recognition of a financial asset or financial liability, in the same periods during which the asset or liability affects profit or loss. Where a forecast transaction is no longer expected to occur, the cumulative unrealised gain or loss is recognised in profit or loss immediately.
Hedge of net investment in a foreign operation – in the hedge of a net investment in a foreign operation, the portion of foreign exchange differences arising on the hedging instrument determined to be an effective hedge is recognised directly in equity. Any ineffective portion is recognised in profit or loss. Non-derivative financial liabilities as well as derivatives may be the hedging instrument in a net investment hedge.
20. Share-based payments
The Group grants options over shares in The Royal Bank of Scotland Group plc to its employees under various share option schemes. The Group has applied IFRS 2 ‘Share-based Payment’ to grants under these schemes after 7 November 2002 that had not vested on 1 January 2005. The expense for these transactions is measured based on the fair value on the date the options are granted. The fair value is estimated using valuation techniques which take into account the option’s exercise price, its term, the risk-free interest rate and the expected volatility of the market price of The Royal Bank of Scotland Group plc’s shares. Vesting conditions are not taken into account when measuring fair value, but are reflected by adjusting the number of options included in the measurement of the transaction such that the amount recognised reflects the number that actually vest. The fair value is expensed on a straight-line basis over the vesting period.
21. Investment property
Investment property comprises freehold and leasehold properties that are held to earn rentals or for capital appreciation or both. It is not depreciated but is stated at fair value based on valuations by independent registered valuers. Fair value is based on current prices for similar properties in the same location and condition. Any gain or loss arising from a change in fair value is recognised in profit or loss. Rental income from investment property is recognised on a straight-line basis over the term of the lease. Lease incentives granted are recognised as an integral part of the total rental income.
22. Cash and cash equivalents
Cash and cash equivalents comprises cash and demand deposits with banks together with short-term highly liquid investments that are readily convertible to known amounts of cash and subject to insignificant risk of change in value.
23. Shares in Group entities
The company’s investments in its subsidiaries are stated at cost less any impairment.
Critical accounting policies and key sources of estimation uncertainty
The reported results of the Group are sensitive to the accounting policies, assumptions and estimates that underlie the preparation of its financial statements. UK company law and IFRS require the directors, in preparing the Group’s financial statements, to select suitable accounting policies, apply them consistently and make judgements and estimates that are reasonable and prudent. In the absence of an applicable standard or interpretation, IAS 8 ‘Accounting Policies, Changes in Accounting Estimates and Errors’, requires management to develop and apply an accounting policy that results in relevant and reliable information in the light of the requirements and guidance in IFRS dealing with similar and related issues and the IASB’s Framework for the Preparation and Presentation of Financial Statements. The judgements and assumptions involved in the Group’s accounting policies that are considered by the Board to be the most important to the portrayal of its financial condition are discussed below. The use of estimates, assumptions or models that differ from those adopted by the Group would affect its reported results.
Loan impairment provisions
The Group’s loan impairment provisions are established to recognise incurred impairment losses in its portfolio of loans classified as loans and receivables and carried at amortised cost. A loan is impaired when there is objective evidence that events since the loan was granted have affected expected cash flows from the loan. The impairment loss is the difference between the carrying value of the loan and the present value of estimated future cash flows at the loan’s original effective interest rate.
At 31 December 2007, gross loans and advances to customers totalled £835,688 million (2006 – £470,826 million) and customer loan impairment provisions amounted to £6,438 million (2006 – £3,933 million).
There are two components to the Group’s loan impairment provisions: individual and collective.
Individual component – all impaired loans that exceed specific thresholds are individually assessed for impairment. Individually assessed loans principally comprise the Group’s portfolio of commercial loans to medium and large businesses. Impairment losses are recognised as the difference between the carrying value of the loan and the discounted value of management’s best estimate of future cash repayments and proceeds from any security held. These estimates take into
Accounting policies continued
account the customer’s debt capacity and financial flexibility; the level and quality of its earnings; the amount and sources of cash flows; the industry in which the counterparty operates; and the realisable value of any security held. Estimating the quantum and timing of future recoveries involves significant judgement. The size of receipts will depend on the future performance of the borrower and the value of security, both of which will be affected by future economic conditions; additionally, collateral may not be readily marketable. The actual amount of future cash flows and the date they are received may differ from these estimates and consequently actual losses incurred may differ from those recognised in these financial statements.
Collective component – this is made up of two elements: loan impairment provisions for impaired loans that are below individual assessment thresholds (collective impaired loan provisions) and for loan losses that have been incurred but have not been separately identified at the balance sheet date (latent loss provisions). These are established on a portfolio basis using a present value methodology taking into account the level of arrears, security, past loss experience, credit scores and defaults based on portfolio trends. The most significant factors in establishing these provisions are the expected loss rates and the related average life. These portfolios include credit card receivables and other personal advances including mortgages. The future credit quality of these portfolios is subject to uncertainties that could cause actual credit losses to differ materially from reported loan impairment provisions. These uncertainties include the economic environment, notably interest rates and their effect on customer spending, the unemployment level, payment behaviour and bankruptcy trends.
Pensions
The Group operates a number of defined benefit pension schemes as described in Note 3 on the accounts. The assets of the schemes are measured at their fair value at the balance sheet date. Scheme liabilities are measured using the projected unit method, which takes account of projected earnings increases, using actuarial assumptions that give the best estimate of the future cash flows that will arise under the scheme liabilities. These cash flows are discounted at the interest rate applicable to high-quality corporate bonds of the same currency and term as the liabilities. Any recognisable surplus or deficit of scheme assets over liabilities is recognised in the balance sheet as an asset (surplus) or liability (deficit). In determining the value of scheme liabilities, assumptions are made as to price inflation, dividend growth, pension increases, earnings growth and employees. There is a range of assumptions that could be adopted in valuing the schemes’ liabilities. Different assumptions could significantly alter the amount of the surplus or deficit recognised in the balance sheet and the pension cost charged to the income statement. The assumptions adopted for the Group’s pension schemes are set out in Note 3 on the accounts. A pension asset of £836 million and a liability of £496 million were recognised in the balance sheet at 31 December 2007 (2006 liability – £1,992 million).
Fair value – financial instruments
Financial instruments classified as held-for-trading or designated as at fair value through profit or loss and financial assets classified as available-for-sale are recognised in the financial statements at fair value. All derivatives are measured at fair value. Gains or losses arising from changes in the fair value of financial instruments classified as held-for-trading or designated as at fair value through profit or loss are included in the income statement. Unrealised gains and losses on available-for-sale financial assets are recognised directly in equity unless an impairment loss is recognised.
Financial instruments measured at fair value include:
Loans and advances (held-for-trading and designated as at fair value though profit or loss) – principally comprise reverse repurchase agreements (reverse repos) and syndicated loans. In repurchase agreements one party agrees to sell securities to another and simultaneously agrees to repurchase the securities at a future date for a specified price. The repurchase price is fixed at the outset, usually being the original sale price plus an amount representing interest for the period from the sale to the repurchase. Syndicated loans measured at fair value are amounts retained, from syndications where the Group was lead manager or underwriter, in excess of the Group’s intended long term participation.
Treasury and other eligible bills and debt securities (held-for-trading, designated as at fair value though profit or loss and available-for-sale) – treasury bills are UK and foreign government treasury bills and other bank bills eligible for refinancing with central banks. Debt securities include those issued by governments, municipal bodies, mortgage agencies and financial institutions as well as corporate bonds, debentures and residual interests in securitisations.
Equity securities (held-for-trading, designated as at fair value though profit or loss and available-for-sale) – comprise equity shares of companies or corporations both listed and unlisted.
Deposits by banks and customer accounts (held-for-trading and designated as at fair value though profit or loss) – deposits measured at fair value principally include repurchase agreements (repos) discussed above and investment contracts issued by the Group’s life assurance businesses.
Debt securities in issue (held-for-trading and designated as at fair value though profit or loss) – measured at fair value and principally comprise medium term notes.
Short positions (held-for-trading) – arise in dealing and market making activities where treasury and other eligible bills, debt securities and equity shares are sold which the Group does not currently possess.
Derivatives – these include swaps, forwards, futures and options. They may be traded on an organised exchange (exchange-traded) or over-the-counter (OTC). Holders of exchange traded derivatives are generally required to provide margin daily in the form of cash or other collateral.
Swaps include currency swaps, interest rate swaps, credit default swaps, total return swaps and equity and equity index swaps. A swap is an agreement to exchange cash flows in the future in accordance with a pre-arranged formula. In currency swap transactions, interest payment obligations are exchanged on assets and liabilities denominated in different currencies; the exchange of principal may be notional or actual. Interest rate swap contracts generally involve exchange of fixed and floating interest payment obligations without the exchange of the underlying principal amounts.
Forwards include forward foreign exchange contracts and forward rate agreements. A forward contract is a contract to buy (or sell) a specified amount of a physical or financial commodity, at an agreed price, on an agreed future date. Forward foreign exchange contracts are contracts for the delayed delivery of currency on a specified future date. Forward rate agreements are contracts under which two counterparties agree on the interest to be paid on a notional deposit of a specified term starting on a specific future date; there is no exchange of principal.
Futures are exchange-traded forward contracts to buy (or sell) standardised amounts of underlying physical or financial commodities. The Group buys and sells currency, interest rate and equity futures. Options include exchange-traded options on currencies, interest rates and equities and equity indices and OTC currency and equity options, interest rate caps and floors and swaptions. They are contracts that give the holder the right but not the obligation to buy (or sell) a specified amount of the underlying physical or financial commodity at an agreed price on an agreed date or over an agreed period.
Fair value is the amount for which an asset could be exchanged, or a liability settled, between knowledgeable, willing parties in an arm’s length transaction. Fair values are determined from quoted prices in active markets for identical financial assets or financial liabilities where these are available. Fair value for a net open position in a financial asset or financial liability in an active market is the current bid or offer price times the number of units of the instrument held. Where a trading portfolio contains both financial assets and financial liabilities which are derivatives of the same underlying instrument, fair value is determined by valuing the gross long and short positions at current mid market prices, with an adjustment at portfolio level to the net open long or short position to amend the valuation to bid or offer as appropriate. Where the market for a financial instrument is not active, fair value is established using a valuation technique. These valuation techniques involve a degree of estimation, the extent of which depends on the instrument’s complexity and the availability of market-based data.
Accounting policies continued
The table below shows financial instruments carried at fair value at 31 December 2007, by valuation method.
| | | Quoted prices in active markets(1) | | | Valuation techniques based on observable market data(2) | | | Valuation techniques incorporating information other than observable market data(3) | | | Total | |
| Financial instruments measured at fair value | | £bn | | | £bn | | | £bn | | | £bn | |
| Assets | | | | | | | | | | | | |
| Fair value though profit or loss | | | | | | | | | | | | |
| Loans and advances to banks | | | — | | | | 71.5 | | | | 0.1 | | | | 71.6 | |
| Loans and advances to customers | | | — | | | | 94.4 | | | | 13.1 | | | | 107.5 | |
| Treasury and other eligible bills and debt securities | | | 83.1 | | | | 101.7 | | | | 11.6 | | | | 196.4 | |
| Equity shares | | | 36.5 | | | | 8.1 | | | | 0.8 | | | | 45.4 | |
| Derivatives | | | 1.9 | | | | 330.3 | | | | 5.2 | | | | 337.4 | |
| Available-for-sale | | | | | | | | | | | | | | | | |
| Treasury and other eligible bills and debt securities | | | 32.1 | | | | 62.4 | | | | 1.1 | | | | 95.6 | |
| Equity shares | | | 5.8 | | | | 1.0 | | | | 0.8 | | | | 7.6 | |
| | | | 159.4 | | | | 669.4 | | | | 32.7 | | | | 861.5 | |
| Liabilities | | | | | | | | | | | | | | | | |
| Deposits by banks and customer accounts | | | — | | | | 131.9 | | | | 1.5 | | | | 133.4 | |
| Debt securities in issue | | | — | | | | 42.1 | | | | 9.2 | | | | 51.3 | |
| Short positions | | | 63.6 | | | | 9.9 | | | | — | | | | 73.5 | |
| Derivatives | | | 2.1 | | | | 325.6 | | | | 4.4 | | | | 332.1 | |
Other financial liabilities (4) | | | — | | | | 0.9 | | | | 0.2 | | | | 1.1 | |
| | | | 65.7 | | | | 510.4 | | | | 15.3 | | | | 591.4 | |
| | Notes: |
| | |
| (1) | Financial assets and financial liabilities valued using unadjusted quoted prices in active markets for identical assets or liabilities. This category includes listed equity shares, exchange-traded derivatives, UK, US and certain other government securities, and US agency securities in active markets. |
| | |
| (2) | Financial assets and financial liabilities valued using techniques based on observable market data. Instruments in this category are valued using: |
| | |
| (a) | quoted prices for similar assets or liabilities, or identical assets or liabilities in markets which are considered to be less than active; or |
| | | |
| (b) | valuation techniques where all the inputs that have a significant effect on the valuation are directly or indirectly based on observable market data. |
| | | |
| | Financial assets and financial liabilities in this category include repos, reverse repos, structured and US commercial mortgage loans, structured deposits, investment contracts issued by the Group’s life assurance businesses, corporate and municipal debt securities, most debt securities in issue, certain unlisted equity shares for which recent market data are available, the majority of the Group’s OTC derivatives and certain instruments listed in (1) above where markets are considered to be less than active. |
| | |
| (3) | Valuation techniques incorporating information other than observable market data are used for instruments where at least one input (which could have a significant effect on the instrument’s valuation) cannot be based on observable market data. Where inputs can be observed from market data without undue cost and effort, the observed input is used; if not, the input is estimated. Financial assets and liabilities in this category include certain syndicated and commercial mortgage loans, unlisted equity shares, certain residual interests in securitisations, super senior tranches of high grade and mezzanine collateralised debt obligations (CDOs) and other sub-prime trading inventory, less liquid debt securities, certain structured debt securities in issue and OTC derivatives where valuation depends upon unobservable inputs such as certain long dated and exotic contracts. No gain or loss is recognised on the initial recognition of a financial instrument valued using a technique incorporating significant unobservable data. |
| | |
| (4) | Other financial liabilities comprise subordinated liabilities and provisions relating to undrawn syndicated loan facilities. |
The Group uses a number of methodologies to determine the fair value of financial instruments for which observable prices in active markets for identical instruments are not available. These techniques include: relative value methodologies based on observable prices for similar instruments; present value approaches where future cash flows from the asset or liability are estimated and then discounted using a risk-adjusted interest rate; and Black-Scholes, Monte-Carlo and binomial option pricing models. The principal inputs to these valuation techniques are listed below. Values between and beyond available data points are obtained by interpolation and extrapolation.
· | Bond prices – quoted prices are generally available for government bonds, certain corporate securities and some mortgage-related products. |
| | |
· | Credit spreads – where available, these are derived from prices of credit default swaps or other credit based instruments, such as debt securities. For others, credit spreads are obtained from pricing services. |
| | |
· | Interest rates – these are principally benchmark interest rates such as the London Inter-Bank Offered Rate (LIBOR) and quoted interest rates in the swap, bond and futures markets. |
| | |
· | Foreign currency exchange rates – there are observable markets both spot and forward and in futures in the world’s major currencies. |
| | |
· | Equity and equity index prices – quoted prices are generally readily available for equity shares listed on the world’s major stock exchanges and for major indices on such shares. |
| | |
· | Commodity prices – many commodities are actively traded in spot, forward and futures on exchanges in London, New York and other commercial centres. |
| | |
· | Price volatilities and correlations – volatility is a measure of the tendency of a price to change with time. Correlation measures the degree to which two or more prices or other variables are observed to move together. If they move in the same direction there is positive correlation; if they move in opposite directions there is negative correlation. Volatility is a key input in valuing options and the value of certain products such as derivatives with more than one underlying variable that is correlation-dependent. Volatility and correlation values are obtained from broker quotations, pricing services or derived from option prices. |
| | |
· | Prepayment rates – the fair value of a financial instrument that can be prepaid by the issuer or borrower differs from that of an instrument that cannot be prepaid. In valuing prepayable instruments that are not quoted in active markets the Group incorporates the value of the prepayment option. |
| | |
· | Counterparty credit spreads – adjustment is made to market prices (or parameters) when the creditworthiness of the counterparty differs from that of the assumed counterparty in the market price (or parameter), for example many OTC derivative price quotations are for transactions with a counterparty with an ‘AA’ credit rating. |
The Group refines and modifies its valuation techniques as markets and products develop and the pricing for individual products becomes more transparent.
While the Group believes its valuation techniques are appropriate and consistent with other market participants, the use of different methodologies or assumptions could result in different estimates of fair value at the balance sheet date. Portfolios whose fair values are based on valuation techniques incorporating information other than observable market data and related sensitivity analysis on portfolios at 31 December 2007 are summarised in the table below.
| | | Assets | | Liabilities | |
| | | | | | | | | | | | | | | | Debt | | | | Other | | | |
| | | Loans and | | | | | | | | | | | | | securities | | | | financial | | | |
| | | advances | | | Securities | | | Derivatives | | | Total | | Deposits | | in issue | | Derivatives | | liabilities | | Total | |
| Portfolio | | £bn | | | £bn | | | £bn | | | £bn | | £bn | | £bn | | £bn | | £bn | | £bn | |
| Syndicated loans | | | 4.6 | | | | | | | | | | 4.6 | | | | | | | | | | | |
| Commercial mortgages | | | 2.2 | | | | | | | | | | 2.2 | | | | | | | | | | | |
| Super senior tranches of | | | | | | | | | | | | | | | | | | | | | | | | |
| asset-backed CDOs | | | | | | | 3.8 | | | | | | | 3.8 | | | | | | | | | | | |
| Other debt securities | | | | | | | 8.8 | | | | | | | 8.8 | | | | | | | | | | | |
| Exotic derivatives | | | | | | | | | | | 5.2 | | | | 5.2 | | | | | | | 4.4 | | | | | 4.4 | |
| Other portfolios | | | 6.4 | | | | 1.7 | | | | | | | | 8.1 | | 1.5 | | 9.2 | | | | | 0.2 | | | 10.9 | |
| | | | 13.2 | | | | 14.3 | | | | 5.2 | | | | 32.7 | | 1.5 | | 9.2 | | | 4.4 | | 0.2 | | | 15.3 | |
Accounting policies continued
Syndicated loans – syndicated loans are valued by considering recent syndication prices in the same or similar assets, prices in the secondary loan market, and with reference to relevant indices for credit products and credit default swaps such as the LevX, LCDX, ITraxx and CDX. Assumptions relating to the expected refinancing period are based on market experience and market convention. Adjustments to observed prices are made for differences between instruments, such as counterparty creditworthiness, term, and quality of any collateral.
The fair value of drawn syndicated loans valued using techniques other than by considering recent syndication prices in the same or similar assets and prices in the secondary loan market was £4,624 million. Using reasonably possible alternative assumptions about refinancing periods (which were stressed by one year) and the value attributed to potentially favourable flexible loan conditions (which are attributed no value in reported figures) would reduce the fair value by up to £46 million or increase the fair value by up to £83 million.
Commercial mortgages – senior and mezzanine commercial mortgages are loans secured on commercial land and buildings that were originated or acquired by the Group for securitisation. Senior commercial mortgages carry a variable interest rate and mezzanine or more junior commercial mortgages may carry a fixed or variable interest rate. Factors affecting the value of these loans may include, but are not limited to, loan type, underlying property type and geographic location, loan interest rate, loan to value ratios, debt service coverage ratios, prepayment rates, cumulative loan loss information, yields, investor demand, market volatility since the last securitisation, and credit enhancement.
Where observable market prices for a particular loan are not available, the fair value will typically be determined with reference to observable market transactions in other loans or credit related products including debt securities and credit derivatives. Assumptions are made about the relationship between the loan and the available benchmark data. Using reasonably possible alternative assumptions for credit spreads (taking into account all other applicable factors) would reduce the fair value by up to £52 million or increase the fair value by up to £49 million.
Super senior tranches of asset-backed CDOs – the Group is a participant in the US asset-backed securities market: buying residential mortgage-backed securities (‘RMBS’), including securities backed by US sub-prime mortgages, and repackaging them into collateralised debt obligations (‘CDOs’) for sale to investors. The Group retains exposure to some of the super senior tranches of these CDOs. In the second half of 2007, rising mortgage delinquencies and expectations of declining house prices in the US led to a deterioration of the estimated fair value of these exposures.
An analysis of the Group’s super senior tranche exposures to these CDOs is shown below:
| | | | High grade | | Mezzanine |
| Exposure (£m) | | | | 6,420 | | | 3,040 |
| | | | | | | | |
| Exposure after hedges (£m) | | | | 3,073 | | | 1,790 |
| | | | | | | | |
Weighted average attachment point (1) | | | | 29% | | | 46% |
| | | | | | | | |
| % of underlying RMBS sub-prime assets | | | | 69% | | | 91% |
| | | | | | | | |
| Of which originated in: | | | | | | | |
| | | | | | | | | |
| | – 2005 and earlier | | | | 24% | | | 23% |
| | – 2006 | | | | 28% | | | 69% |
| | – 2007 | | | | 48% | | | 8% |
| | | | | | | | |
| Collateral by rating: | | | | | | | |
| – investment grade | | | | 98% | | | 31% |
| – non-investment grade | | | | 2% | | | 69% |
| | | | | | | | |
| Net exposure (£m) | | | | 2,581 | | | 1,253 |
| | | | | | | | |
| Effective attachment point post write down | | | | 40% | | | 62% |
| | Note: |
| | |
| (1) | Attachment point is the minimum level of losses in a portfolio to which a tranche is exposed, as a percentage of the total notional size of the portfolio. For example, a 5-10% tranche has an attachment point of 5% and a detachment point of 10%. When the accumulated loss of the reference pool is no more than 5% of the total initial notional of the pool, the tranche will not be affected. However, when the loss has exceeded 5%, any further loss will be deducted from the tranche’s notional principal until the detachment point, 10%, is reached. |
The Group’s valuation of the super senior asset-backed CDO exposures takes into consideration outputs from a proprietary model, market data and appropriate valuation adjustments. There is significant subjectivity in the valuation with very little market activity to provide support for fair value levels at which willing buyers and sellers would transact.
The Group’s proprietary model predicts the expected cash flows of the underlying mortgages using assumptions about future macroeconomic conditions (including house price appreciation and depreciation) and defaults/delinquencies on these underlying mortgages derived from publicly available data. The resulting cash flows are discounted using a risk adjusted rate.
Alternative valuations have been produced using reasonably possible alternative assumptions about macroeconomic conditions including house price appreciation and depreciation, and the effect of regional variations. In addition, the discount rate applied to the model output has been stressed. The output from using these alternative assumptions has been compared with inferred pricing from other published data.
The Group believes that reasonably possible alternative assumptions could reduce or increase predicted cumulative losses from the model by up to 20%. Using these alternative assumptions would reduce the fair value by up to £385 million or increase the fair value by up to £235 million.
Other debt securities – where observable market prices for a particular debt security are not available, the fair value will typically be determined with reference to observable market transactions in other credit related products including debt securities and credit derivatives. Assumptions are made about the relationship between the individual debt security and the available benchmark data. Using differing assumptions about this relationship would result in different fair values for these assets. Using reasonably possible alternative assumptions for credit spread (taking into account the underlying currency, tenor and rating) would reduce the fair value by up to £88 million or increase the fair value by up to £109 million.
Derivatives – derivatives are priced using quoted prices for the same or similar instruments where these are available. However, the majority of derivatives are valued using pricing models. Inputs for these models are usually observed directly in the market, or derived from observed prices. However, it is not always possible to observe or corroborate all model inputs.
Unobservable inputs used are based on estimates taking into account a range of available information including historic analysis, historic traded levels, market practice, comparison to other relevant benchmark observable data and consensus pricing data. Using reasonably possible alternative assumptions, principally correlations, including the relative impact of unobservable inputs as compared to those which may be observed, would reduce the fair value by up to £80 million or increase the fair value by up to £80 million.
Other portfolios – other than the portfolios discussed above, there are other financial instruments which are held at fair value determined from data which are not market observable, or incorporating material adjustments to market observed data. Using reasonably possible alternative assumptions appropriate to the financial asset or liability in question, such as credit spreads, derivative inputs and equity correlations, would reduce the fair value by up to £119 million or increase the fair value by up to £117 million.
Accounting policies continued
General insurance claims
The Group makes provision for the full cost of settling outstanding claims arising from its general insurance business at the balance sheet date, including claims estimated to have been incurred but not yet reported at that date and claims handling expenses. General insurance claims provisions amounted to £5,466 million at 31 December 2007 (2006 – £5,247 million).
Provisions are determined by management based on experience of claims settled and on statistical models which require certain assumptions to be made regarding the incidence, timing and amount of claims and any specific factors such as adverse weather conditions. In order to calculate the total provision required, the historical development of claims is analysed using statistical methodology to extrapolate, within acceptable probability parameters, the value of outstanding claims at the balance sheet date. Also included in the estimation of outstanding claims are other assumptions such as the inflationary factor used for bodily injury claims which is based on historical trends and, therefore, allows for some increase due to changes in common law and statute. Costs for both direct and indirect claims handling expenses are also included. Outward reinsurance recoveries are accounted for in the same accounting period as the direct claims to which they relate. The outstanding claims provision is based on information available to management and the eventual outcome may vary from the original assessment. Actual claims experience may differ from the historical pattern on which the estimate is based and the cost of settling individual claims may exceed that assumed.
Goodwill
The Group capitalises goodwill arising on the acquisition of businesses, as discussed in accounting policy 5. The carrying value of goodwill as at 31 December 2007 was £42,369 million (2006 – £17,889 million).
Goodwill is the excess of the cost of an acquired business over the fair value of its net assets. The determination of the fair value of assets and liabilities of businesses acquired requires the exercise of management judgement; for example those financial assets and liabilities for which there are no quoted prices, and those non-financial assets where valuations reflect estimates of market conditions such as property. Different fair values would result in changes to the goodwill arising and to the post-acquisition performance of the acquisition. Goodwill is not amortised but is tested for impairment annually or more frequently if events or changes in circumstances indicate that it might be impaired.
For the purposes of impairment testing, goodwill acquired in a business combination is allocated to each of the Group’s cash-generating units or groups of cash-generating units expected to benefit from the combination. Goodwill impairment testing involves the comparison of the carrying value of a cash-generating unit or group of cash generating units with its recoverable amount. The recoverable amount is the higher of the unit’s fair value and its value in use. Value in use is the present value of expected future cash flows from the cash-generating unit or group of cash-generating units. Fair value is the amount obtainable for the sale of the cash-generating unit in an arm’s length transaction between knowledgeable, willing parties.
Impairment testing inherently involves a number of judgmental areas: the preparation of cash flow forecasts for periods that are beyond the normal requirements of management reporting; the assessment of the discount rate appropriate to the business; estimation of the fair value of cash-generating units; and the valuation of the separable assets of each business whose goodwill is being reviewed.
Accounting developments
International Financial Reporting Standards
The International Financial Reporting Interpretations Committee (‘IFRIC’) issued interpretation IFRIC 11 ‘Group and Treasury Share Transactions’ in November 2006. Entities which buy their own shares, or whose shareholders buy shares in the reporting entity, in order to provide incentives to employees must account for those incentives on an equity-settled basis. This principle applies also to the accounting by subsidiaries. The interpretation is effective for annual accounting periods beginning on or after 1 March 2007 and is not expected to have a material effect on the Group or company.
The IFRIC issued interpretation IFRIC 12 ‘Service Concession Arrangements’ in November 2006. Entities providing infrastructure and services to governments under concession arrangements must account for each component of the arrangement separately. Infrastructure provided under these arrangements may be recognised as either a financial asset or an intangible asset. The interpretation is effective for accounting periods beginning on or after 1 January 2008 and is not expected to have a material effect on the Group or company.
The IASB issued IFRS 8 ‘Operating Segments’ in November 2006. This will replace IAS 14 ‘Segment Reporting’ for accounting periods beginning on or after 1 January 2009. IFRS 8 requires entities to report segment information as reported to management and reconcile it to the financial statements and is not expected to have a material effect on the Group or company.
The IASB issued a revised IAS 23 ‘Borrowing Costs’ in March 2007. Entities are required to capitalise borrowing costs attributable to the development or construction of intangible assets or property plant or equipment. The standard is effective for accounting periods beginning on or after 1 January 2009 and is not expected to have a material effect on the Group or company.
The IFRIC issued interpretation IFRIC 13 ‘Customer Loyalty Programmes’ in June 2007. Entities that provide customers with benefits ancillary to a sale of goods or services should apportion the sales proceeds to those benefits on the basis of relative fair values. The interpretation is effective for accounting periods beginning on or after 1 July 2008 and is not expected to have a material effect on the Group or company.
The IFRIC issued interpretation IFRIC 14 ‘IAS 19 – The Limit on a Defined Benefit Asset, Minimum Funding Requirements and their Interaction’ in July 2007. The net pension asset that may be recognised by a sponsoring entity is limited to the amount to which it has an unconditional right of refund or can be recovered through the settlement of plan liabilities. Entities legally bound to minimum funding requirements are required to take account of those obligations when recognising the net asset or liability for an employee benefit scheme. The interpretation is effective for accounting periods beginning on or after 1 January 2008 and is not expected to have a material effect on the Group or company.
The IASB issued a revised IAS 1 ‘Presentation of Financial Statements’ in September 2007 effective for accounting periods beginning on or after 1 January 2009. The amendments to the presentation requirements for financial statements are not expected to have a material effect on the Group or company.
The IASB published a revised IFRS 3 ‘Business Combinations’ and related revisions to IAS 27 ‘Consolidated and Separate Financial Statements’ following the completion in January 2008 of its project on the acquisition and disposal of subsidiaries. The standards improve convergence with US GAAP and provide new guidance on accounting for changes in interests in subsidiaries. The cost of an acquisition will comprise only consideration paid to vendors for equity; other costs will be expensed immediately. Groups will only account for goodwill on acquisition of a subsidiary; subsequent changes in interest will be recognised in equity and only on a loss of control will there be a profit or loss on disposal to be recognised in income. The changes are effective for accounting periods beginning on or after 1 July 2009 but both standards may be adopted together for accounting periods beginning on or after 1 July 2007. These changes will affect the Group's accounting for future acquisitions and disposals of subsidiaries.
The IASB published revisions to IAS 32 ‘Financial Instruments: Presentation’ and consequential revisions to other standards in February 2008 to improve the accounting for and disclosure of puttable financial instruments. The revisions are effective for accounting periods beginning on or after 1 January 2009 but together they may be adopted earlier. They are not expected to have a material affect on the Group or the company.
Notes on the accounts
1 Income from trading activities
| | | Group | |
| | | 2007 | | | 2006 | | | 2005 | |
| | | | £m | | | | £m | | | | £m | |
Foreign exchange (1) | | | 1,050 | | | | 738 | | | | 647 | |
Interest rate (2) | | | 1,466 | | | | 973 | | | | 943 | |
Credit (3) | | | (1,430 | ) | | | 841 | | | | 666 | |
Equities and commodities (4) | | | 241 | | | | 123 | | | | 87 | |
| | | | 1,327 | | | | 2,675 | | | | 2,343 | |
The analysis of trading income is based on how the business is organised and the underlying risks managed.
| | Notes: |
| | |
| | Trading income comprises gains and losses on financial instruments held for trading, both realised and unrealised, interest income and dividends and the related funding costs. The types of instruments include: |
| | |
| (1) | Foreign exchange: spot foreign exchange contracts, currency swaps and options, emerging markets and related hedges and funding. |
| | |
| (2) | Interest rate: interest rate swaps, forward foreign exchange contracts, forward rate agreements, interest rate options, interest rate futures and related hedges and funding. |
| | |
| (3) | Credit: asset-backed securities, corporate bonds, credit derivatives and related hedges and funding. |
| | |
| (4) | Equities and commodities: equity derivatives, commodity contracts and related hedges and funding. |
2 Operating expenses
| | | Group | |
| | | 2007 | | | 2006 | | | 2005 | |
| | | | £m | | | | £m | | | | £m | |
| Wages, salaries and other staff costs | | | 6,387 | | | | 5,652 | | | | 5,084 | |
| Social security costs | | | 522 | | | | 389 | | | | 354 | |
| Share-based compensation | | | 65 | | | | 65 | | | | 44 | |
| Pension costs (see Note 3) | | | | | | | | | | | | |
| – defined benefit schemes | | | 489 | | | | 580 | | | | 462 | |
| – defined contribution schemes | | | 89 | | | | 37 | | | | 48 | |
| Staff costs | | | 7,552 | | | | 6,723 | | | | 5,992 | |
| Premises and equipment | | | 1,766 | | | | 1,421 | | | | 1,313 | |
| Other administrative expenses | | | 3,147 | | | | 2,658 | | | | 2,816 | |
| Property, plant and equipment (see Note 18) | | | 1,311 | | | | 1,293 | | | | 1,326 | |
| Intangible assets (see Note 17) | | | 659 | | | | 385 | | | | 499 | |
| Depreciation and amortisation | | | 1,970 | | | | 1,678 | | | | 1,825 | |
| | | | 14,435 | | | | 12,480 | | | | 11,946 | |
Integration costs included in operating expenses comprise expenditure incurred in respect of cost reduction and revenue enhancement programmes set in connection with the various acquisitions made by the Group:
| | | Group | |
| | | 2007 | | | 2006 | | | 2005 | |
| | | | £m | | | | £m | | | | £m | |
| Staff costs | | | 18 | | | | 76 | | | | 148 | |
| Premises and equipment | | | 4 | | | | 10 | | | | 39 | |
| Other administrative expenses | | | 26 | | | | 32 | | | | 131 | |
| Depreciation and amortisation | | | 60 | | | | 16 | | | | 140 | |
| | | | 108 | | | | 134 | | | | 458 | |
The average number of persons employed in the continuing operations of the Group during the year, excluding temporary staff, was 164,700 (2006 – 142,600; 2005 – 144,900); on the same basis the discontinued operations employed 5,800 (2006 and 2005 – nil). The average number of temporary employees during 2007 was 4,900. The number of persons employed in the continuing operations of the Group at 31 December, excluding temporary staff, was as follows:
| | | Group | |
| | | 2007 | | | 2006 | | | 2005 | |
| Global Banking & Markets | | | 9,300 | | | | 7,700 | | | | 6,900 | |
| RFS Holdings excluding minority interest | | | 31,100 | | | | — | | | | — | |
| UK Corporate Banking | | | 9,600 | | | | 8,800 | | | | 8,200 | |
| Retail | | | 41,400 | | | | 42,900 | | | | 43,400 | |
| Wealth Management | | | 5,000 | | | | 4,600 | | | | 4,300 | |
| Ulster Bank | | | 6,400 | | | | 5,600 | | | | 5,200 | |
| Citizens | | | 23,900 | | | | 24,600 | | | | 26,000 | |
| RBS Insurance | | | 18,000 | | | | 18,500 | | | | 20,500 | |
| Manufacturing | | | 26,300 | | | | 26,600 | | | | 26,700 | |
| Centre | | | 2,700 | | | | 2,500 | | | | 2,300 | |
| RFS Holdings minority interest | | | 59,900 | | | | — | | | | — | |
| Total | | | 233,600 | | | | 141,800 | | | | 143,500 | |
| | | | | | | | | | | | | |
| UK | | | 108,600 | | | | 105,700 | | | | 107,200 | |
| US | | | 27,100 | | | | 26,200 | | | | 27,400 | |
| Europe | | | 41,300 | | | | 8,100 | | | | 7,800 | |
| Rest of the World | | | 56,600 | | | | 1,800 | | | | 1,100 | |
| Total | | | 233,600 | | | | 141,800 | | | | 143,500 | |
3 Pension costs
Members of the Group sponsor a number of pension schemes in the UK and overseas, predominantly defined benefit schemes, whose assets are independent of the Group’s finances. The Group’s defined benefit schemes generally provide a pension of one-sixtieth of final pensionable salary for each year of service prior to retirement up to a maximum of 40 years. Employees do not make contributions for basic pensions but may make voluntary contributions to secure additional benefits on a money-purchase basis. Since October 2006 The Royal Bank of Scotland Group Pension Fund (‘Main scheme’) has been closed to new entrants.
The Group also provides post-retirement benefits other than pensions, principally through subscriptions to private healthcare schemes in the UK and the US and unfunded post-retirement benefit plans. Provision for the costs of these benefits is charged to the income statement over the average remaining future service lives of eligible employees. The amounts are not material.
Interim valuations of the Group’s schemes were prepared to 31 December by independent actuaries, using the following assumptions:
| | | Main scheme | | | All schemes | |
| Principal actuarial assumptions at 31 December | | 2007 | | 2006 | | 2005 | | 2007 | | 2006 | | 2005 |
| | | | | | | | | | | | weighted average | |
| Discount rate | | | 6.0 | % | | | 5.3 | % | | | 4.8 | % | | | 5.8 | % | | | 5.3 | % | | | 4.8 | % |
| Expected return on plan assets (weighted average) | | | 6.9 | % | | | 6.9 | % | | | 6.5 | % | | | 6.8 | % | | | 6.9 | % | | | 6.5 | % |
| Rate of increase in salaries | | | 4.5 | % | | | 4.2 | % | | | 4.0 | % | | | 4.0 | % | | | 4.1 | % | | | 3.9 | % |
| Rate of increase in pensions in payment | | | 3.2 | % | | | 2.9 | % | | | 2.7 | % | | | 2.8 | % | | | 2.8 | % | | | 2.6 | % |
| Inflation assumption | | | 3.2 | % | | | 2.9 | % | | | 2.7 | % | | | 2.9 | % | | | 2.9 | % | | | 2.7 | % |
| | | | | | | |
| | | | | | | |
| | | Main scheme | | | All schemes | |
| Major classes of plan assets as a percentage of total plan assets | | 2007 | | 2006 | | 2005 | | 2007 | | 2006 | | 2005 |
| Equities | | | 61.0 | % | | | 60.5 | % | | | 61.3 | % | | | 57.8 | % | | | 60.7 | % | | | 61.6 | % |
| Index-linked bonds | | | 18.2 | % | | | 17.3 | % | | | 18.1 | % | | | 13.1 | % | | | 16.1 | % | | | 16.8 | % |
| Government fixed interest bonds | | | 1.2 | % | | | 2.5 | % | | | 1.8 | % | | | 12.9 | % | | | 3.3 | % | | | 2.6 | % |
| Corporate and other bonds | | | 15.1 | % | | | 14.0 | % | | | 14.6 | % | | | 12.0 | % | | | 13.9 | % | | | 14.6 | % |
| Property | | | 3.8 | % | | | 4.3 | % | | | 3.6 | % | | | 3.0 | % | | | 4.5 | % | | | 3.7 | % |
| Cash and other assets | | | 0.7 | % | | | 1.4 | % | | | 0.6 | % | | | 1.2 | % | | | 1.5 | % | | | 0.7 | % |
Ordinary shares of the company with a fair value of £69 million (2006 – £89 million; 2005 – £78 million) are held by the Group’s pension schemes; £65 million (2006 – £87 million; 2005 – £76 million) in the Main scheme which also holds other financial instruments issued by the Group with a value of £606 million (2006 – £258 million; 2005 – £299 million).
The expected return on plan assets at 31 December is based upon the weighted average of the following assumed returns on the major classes of plan assets:
| | | Main scheme | | | All schemes | |
| | | 2007 | | 2006 | | 2005 | | | 2007 | | | 2006 | | | 2005 |
| Equities | | | 8.1 | % | | | 8.1 | % | | | 7.7 | % | | | 8.1% | | | | 8.1 | % | | | 7.7 | % |
| Index-linked bonds | | | 4.5 | % | | | 4.5 | % | | | 4.1 | % | | | 4.5% | | | | 4.5 | % | | | 4.1 | % |
| Government fixed interest bonds | | | 4.5 | % | | | 4.5 | % | | | 4.1 | % | | | 4.7% | | | | 4.5 | % | | | 4.1 | % |
| Corporate and other bonds | | | 5.5 | % | | | 5.3 | % | | | 4.8 | % | | | 5.5% | | | | 5.3 | % | | | 4.8 | % |
| Property | | | 6.3 | % | | | 6.3 | % | | | 5.9 | % | | | 6.3% | | | | 6.3 | % | | | 5.9 | % |
| Cash and other assets | | | 4.6 | % | | | 4.6 | % | | | 4.2 | % | | | 4.5% | | | | 4.4 | % | | | 3.7 | % |
| Post-retirement mortality assumptions (Main scheme) | | 2007 | | | 2006 | | | 2005 | |
| Longevity at age 60 for current pensioners (years) | | | | | | | | | |
| Males | | | 26.0 | | | | 26.0 | | | | 25.4 | |
| Females | | | 26.8 | | | | 28.9 | | | | 28.2 | |
| Longevity at age 60 for future pensioners (years) | | | | | | | | | | | | |
| Males | | | 28.1 | | | | 26.8 | | | | 26.2 | |
| Females | | | 28.2 | | | | 29.7 | | | | 29.0 | |
These post-retirement mortality assumptions are derived from standard mortality tables used by the scheme actuary to value the liabilities for the main scheme. Following a comprehensive review of the mortality experience of the main scheme over the last three years by the scheme actuary, different standard mortality tables (adjusted as appropriate) have been used in valuing the scheme liabilities as at 31 December 2007.
Notes on the accounts continued
3 Pension costs (continued)
| | | Main scheme | | All schemes | |
| | | | | Present | | | | | | Present | | | |
| | | | | value of | | Net | | | | value of | | Net | |
| | | Fair value | | defined | | pension | | Fair value | | defined | | pension | |
| | | of plan | | benefit | | deficit/ | | of plan | | benefit | | deficit/ | |
| | | assets | | obligations | | (surplus) | | assets | | obligations | | (surplus) | |
| Changes in value of net pension deficit/(surplus) | | | £m | | | £m | | | £m | | | £m | | | £m | | | £m | |
| At 1 January 2006 | | | 15,914 | | | 19,118 | | | 3,204 | | | 17,388 | | | 21,123 | | | 3,735 | |
| Currency translation and other adjustments | | | — | | | — | | | — | | | (59 | ) | | (65 | ) | | (6 | ) |
| Income statement: | | | | | | | | | | | | | | | | | | | |
| Expected return | | | 1,022 | | | | | | (1,022 | ) | | 1,073 | | | | | | (1,073 | ) |
| Interest cost | | | | | | 918 | | | 918 | | | | | | 985 | | | 985 | |
| Current service cost | | | | | | 571 | | | 571 | | | | | | 645 | | | 645 | |
| Past service cost | | | | | | 15 | | | 15 | | | | | | 23 | | | 23 | |
| | | | 1,022 | | | 1,504 | | | 482 | | | 1,073 | | | 1,653 | | | 580 | |
| Statement of recognised income and expense: | | | | | | | | | | | | | | | | | | | |
| Actuarial gains and losses | | | 552 | | | (1,077 | ) | | (1,629 | ) | | 587 | | | (1,194 | ) | | (1,781 | ) |
| Contributions by employer | | | 427 | | | — | | | (427 | ) | | 536 | | | — | | | (536 | ) |
| Benefits paid | | | (515 | ) | | (515 | ) | | — | | | (538 | ) | | (538 | ) | | — | |
| Expenses included in service cost | | | (26 | ) | | (26 | ) | | — | | | (28 | ) | | (28 | ) | | — | |
| At 1 January 2007 | | | 17,374 | | | 19,004 | | | 1,630 | | | 18,959 | | | 20,951 | | | 1,992 | |
| Currency translation and other adjustments | | | — | | | — | | | — | | | 381 | | | 385 | | | 4 | |
| Income statement: | | | | | | | | | | | | | | | | | | | |
| Expected return | | | 1,182 | | | | | | (1,182 | ) | | 1,394 | | | | | | (1,394 | ) |
| Interest cost | | | | | | 1,007 | | | 1,007 | | | | | | 1,177 | | | 1,177 | |
| Current service cost | | | | | | 566 | | | 566 | | | | | | 684 | | | 684 | |
| Past service cost | | | | | | 19 | | | 19 | | | | | | 22 | | | 22 | |
| | | | 1,182 | | | 1,592 | | | 410 | | | 1,394 | | | 1,883 | | | 489 | |
| Statement of recognised income and expense: | | | | | | | | | | | | | | | | | | | |
| Actuarial gains and losses | | | 163 | | | (1,937 | ) | | (2,100 | ) | | 19 | | | (2,170 | ) | | (2,189 | ) |
| Acquisition of subsidiaries | | | — | | | — | | | — | | | 6,997 | | | 6,960 | | | (37 | ) |
| Intra-group transfers | | | 30 | | | 30 | | | — | | | — | | | — | | | — | |
| Contributions by employer | | | 416 | | | — | | | (416 | ) | | 599 | | | — | | | (599 | ) |
| Contributions by plan participants | | | — | | | — | | | — | | | 5 | | | 5 | | | — | |
| Benefits paid | | | (551 | ) | | (551 | ) | | — | | | (652 | ) | | (652 | ) | | — | |
| Expenses included in service cost | | | (39 | ) | | (39 | ) | | — | | | (40 | ) | | (40 | ) | | — | |
| At 31 December 2007 | | | 18,575 | | | 18,099 | | | (476 | ) | | 27,662 | | | 27,322 | | | (340 | ) |
| | | | | | | | | | | | | | | | | | | | |
| | | | | | | | | | | | | | | | | | | | |
| Net pension surplus comprises: | | | | | | | | | | | | | | | | | | £m | |
| Net assets of schemes in surplus (included in Prepayments, accrued income and other assets, Note 19) | | | | | | (836 | ) |
| Net liabilities of schemes in deficit | | | | | | | | | | | | | | | | | | 496 | |
| | | | | | | | | | | | | | | | | | | (340 | ) |
Acquisition of subsidiaries includes fair value of plan assets of £6,118 million and present value of defined benefit obligations £5,962 million in respect of ABN AMRO's principal pension scheme in the Netherlands. At 31 December 2007, these were £6,417 million and £6,189 million respectively. The principal actuarial assumptions at 31 December 2007 were: discount rate 5.4%; expected return on plan assets (weighted average) 6.2%; rate of increase in salaries 2.5%; rate of increase in pensions in payment 2.0%; and inflation assumption 2.0% ..
The Group expects to contribute £481 million to its defined benefit pension schemes in 2008 (Main scheme – £413 million). Of the net liabilities of schemes in deficit, £212 million (2006 – £106 million) relates to unfunded schemes.
Cumulative net actuarial gains of £1,570 million (2006 – £619 million losses; 2005 – £2,400 million losses) have been recognised in the statement of recognised income and expense, of which £1,579 million (2006 – £521 million losses; 2005 – £2,150 million losses) relate to the Main scheme.
| | | Main scheme | | | All schemes | |
| | | 2007 | | | 2006 | | | 2005 | | | 2004 | | | 2007 | | | 2006 | | | 2005 | | | 2004 | |
| History of defined benefit schemes | | | £m | | | | £m | | | | £m | | | | £m | | | | £m | | | | £m | | | | £m | | | | £m | |
| Fair value of plan assets | | | 18,575 | | | | 17,374 | | | | 15,914 | | | | 13,569 | | | | 27,662 | | | | 18,959 | | | | 17,388 | | | | 14,798 | |
| Present value of defined benefit obligations | | | 18,099 | | | | 19,004 | | | | 19,118 | | | | 16,051 | | | | 27,322 | | | | 20,951 | | | | 21,123 | | | | 17,738 | |
| Net surplus/(deficit) | | | 476 | | | | (1,630 | ) | | | (3,204 | ) | | | (2,482 | ) | | | 340 | | | | (1,992 | ) | | | (3,735 | ) | | | (2,940 | ) |
| | | | | | | | | | | | | | | | | | | | | | | | | | | | | | | | | |
| Experience losses on plan liabilities | | | (256 | ) | | | (4 | ) | | | (41 | ) | | | (624 | ) | | | (210 | ) | | | (19 | ) | | | (68 | ) | | | (631 | ) |
| Experience gains on plan assets | | | 163 | | | | 552 | | | | 1,556 | | | | 392 | | | | 19 | | | | 587 | | | | 1,660 | | | | 408 | |
| Actual return on pension schemes assets | | | 1,345 | | | | 1,574 | | | | 2,486 | | | | 1,230 | | | | 1,413 | | | | 1,660 | | | | 2,677 | | | | 1,328 | |
4 Auditors’ remuneration
Amounts paid to the company’s auditors for statutory audit and other services were as follows:
| | | Group | |
| | | | 2007 £m | | | | 2006 £m | | | | 2005 £m | |
| Audit Services | | | | | | | | | | | | |
- Statutory audit(1) | | | 20.4 | | | | 14.9 | | | | 9.9 | |
- Audit related including regulatory reporting | | | 1.4 | | | | 2.0 | | | | 7.0 | |
| | | | 21.8 | | | | 16.9 | | | | 16.9 | |
| Tax Services | | | | | | | | | | | | |
- Compliance services | | | 0.2 | | | | 0.2 | | | | 0.2 | |
- Advisory services | | | 0.2 | | | | 0.1 | | | | — | |
| | | | 0.4 | | | | 0.3 | | | | 0.2 | |
| All Other Services | | | 9.0 | | | | 5.5 | | | | 7.2 | |
| Total | | | 31.2 | | | | 22.7 | | | | 24.3 | |
Note:
(1) Excluding fees paid in respect of ABN AMRO Holding B.V. which is audited by another firm.
5 Tax
| | | Group | |
| | | | 2007
£m | | | | 2006
£m | | | | 2005
£m | |
| Current taxation: | | | | | | | | | | | | |
| Charge for the year | | | 2,522 | | | | 2,626 | | | | 2,280 | |
| Over provision in respect of prior periods | | | (39 | ) | | | (253 | ) | | | (101 | ) |
| Relief for overseas taxation | | | (198 | ) | | | (147 | ) | | | (171 | ) |
| | | | 2,285 | | | | 2,226 | | | | 2,008 | |
| Deferred taxation: | | | | | | | | | | | | |
| Charge for the year | | | 95 | | | | 396 | | | | 477 | |
| (Under)/over provision in respect of prior periods | | | (328 | ) | | | 67 | | | | (107 | ) |
| Tax charge for the year | | | 2,052 | | | | 2,689 | | | | 2,378 | |
The actual tax charge differs from the expected tax charge computed by applying the standard rate of UK corporation tax of 30% as follows:
| | | | 2007
£m | | | | 2006
£m | | | | 2005
£m | |
| Expected tax charge | | | 2,970 | | | | 2,756 | | | | 2,381 | |
| Non-deductible items | | | 263 | | | | 288 | | | | 309 | |
| Non-taxable items | | | (595 | ) | | | (251 | ) | | | (166 | ) |
| Taxable foreign exchange movements | | | 16 | | | | 5 | | | | (10 | ) |
| Foreign profits taxed at other rates | | | (37 | ) | | | 63 | | | | 77 | |
| Reduction in deferred tax liability following change in the rate of UK Corporation Tax | | | (189 | ) | | | — | | | | — | |
| Unutilised losses brought forward and carried forward | | | (9 | ) | | | 14 | | | | (5 | ) |
| Adjustments in respect of prior periods | | | (367 | ) | | | (186 | ) | | | (208 | ) |
| Actual tax charge | | | 2,052 | | | | 2,689 | | | | 2,378 | |
The effective tax rate for the year was 20.7% (2006 – 29.3%; 2005 – 30.0%) . The tax rate benefited from a reduction of £189 million in the Group’s deferred tax liability following the change in the rate of UK Corporation Tax from 30% to 28% from 1 April 2008.
Notes on the accounts continued
6 Profit attributable to other owners
| | | Group | |
| | | 2007 | | | 2006 | | | 2005 | |
| | | | £m | | | | £m | | | | £m | |
| Dividends paid to other owners: | | | | | | | | | | | | |
| Non-cumulative preference shares of US$0.01 | | | 152 | | | | 99 | | | | 58 | |
| Non-cumulative preference shares of €0.01 | | | 94 | | | | 92 | | | | 51 | |
| Total | | | 246 | | | | 191 | | | | 109 | |
| | Notes: |
| | |
| (1) | In accordance with IAS 32, certain preference share issued by the company are included in subordinated liabilities and the related finance cost in interest payable. |
| | |
| (2) | Between 1 January 2008 and the date of approval of these accounts, dividends amounting to US$161 million have been declared in respect of equity preference shares for payment on 31 March 2008. |
7 Ordinary dividends
Prior year ordinary dividends per share in the table below have been restated for the effect of the bonus issue of ordinary shares in May 2007.
| | | Group | |
| | | 2007 | | | 2006 | | | 2005 | | | 2007 | | | 2006 | | | 2005 | |
| | | p per share | | | p per share | | | p per share | | | | £m | | | | £m | | | | £m | |
| Final dividend for previous year declared during the current year | | | 22.1 | | | | 17.7 | | | | 13.7 | | | | 2,091 | | | | 1,699 | | | | 1,308 | |
| Interim dividend | | | 10.1 | | | | 8.1 | | | | 6.5 | | | | 953 | | | | 771 | | | | 619 | |
| Total dividends paid on ordinary equity shares | | | 32.2 | | | | 25.8 | | | | 20.2 | | | | 3,044 | | | | 2,470 | | | | 1,927 | |
Final dividends are not accounted for until they have been ratified by members in a general meeting. At the Annual General Meeting on 23 April 2008, a final dividend will be proposed in respect of 2007 of 23.1 pence per share (2006 – 22.1 pence per share) amounting to a total of £2.3 billion (2006 – £2.1 billion). The financial statements for the year ended 31 December 2007 do not reflect this dividend which, if approved, will be accounted for in owners’ equity as an appropriation of retained profits in the year ending 31 December 2008.
8 Profit dealt with in the accounts of the company
As permitted by section 230(3) of the Companies Act 1985, the primary financial statements of the company do not include an income statement. Condensed information is set out below:
| | | Company | |
| | | 2007 | | | 2006 | | | 2005 | |
| | | | £m | | | | £m | | | | £m | |
| Dividends received from banking subsidiary | | | 2,330 | | | | 3,502 | | | | 2,082 | |
| Dividends received from other subsidiaries | | | 415 | | | | 229 | | | | 100 | |
| Total income | | | 2,745 | | | | 3,731 | | | | 2,182 | |
| Interest receivable from subsidiaries | | | 460 | | | | 516 | | | | 577 | |
| Interest payable to subsidiaries | | | (307 | ) | | | (246 | ) | | | (189 | ) |
| Other net interest payable and operating expenses | | | (526 | ) | | | (515 | ) | | | (638 | ) |
| Operating profit before tax | | | 2,372 | | | | 3,486 | | | | 1,932 | |
| Tax | | | 127 | | | | 13 | | | | 142 | |
| Profit for the year | | | 2,499 | | | | 3,499 | | | | 2,074 | |
| Profit attributable to: | | | | | | | | | | | | |
| Ordinary shareholders | | | 2,253 | | | | 3,308 | | | | 1,965 | |
| Other owners | | | 246 | | | | 191 | | | | 109 | |
| | | | 2,499 | | | | 3,499 | | | | 2,074 | |
9 Earnings per ordinary share
The earnings per share are based on the following:
| | | Group | |
| | | 2007 | | | 2006 | | | 2005 | |
| | | | £m | | | | £m | | | | £m | |
| Earnings: | | | | | | | | | | | | |
| Profit attributable to ordinary shareholders | | | 7,303 | | | | 6,202 | | | | 5,392 | |
| Add back dividends on dilutive convertible non-equity shares | | | 60 | | | | 64 | | | | 65 | |
| Diluted earnings attributable to ordinary shareholders | | | 7,363 | | | | 6,266 | | | | 5,457 | |
| | | | |
| | | | |
| | | Number of shares – millions | |
| Number of ordinary shares: | | | | | | | | | | | | |
| Weighted average number of ordinary shares in issue during the year | | | 9,557 | | | | 9,555 | | | | 9,549 | |
| Effect of dilutive share options and convertible non-equity shares | | | 166 | | | | 174 | | | | 180 | |
| Diluted weighted average number of ordinary shares during the year | | | 9,723 | | | | 9,729 | | | | 9,729 | |
The numbers of ordinary shares in issue in prior years have been restated for the effect of the bonus issue of ordinary shares in May 2007. All convertible preference shares have a dilutive effect in 2007, 2006 and 2005 and have been included in the computation of diluted earnings per share.
The effect of discontinued operations on earnings per share is not material.
10 Financial instruments
The following tables analyse the Group’s financial assets and financial liabilities in accordance with the categories of financial instruments in IAS 39. Assets and liabilities outside the scope of IAS 39 are shown separately.
| | | Group | |
| | | Held-for- trading | | Designated as at fair value through profit or loss | | Hedging derivatives | | Available- for-sale | | Loans and receivables | | Other (amortised cost) | | Finance leases | | Non financial assets/ liabilities | | Total | |
| 2007 | | | £m | | | £m | | | £m | | | £m | | | £m | | | £m | | | £m | | | £m | | | £m | |
| Assets | | | | | | | | | | | | | | | | | | | | | | | | | | | | |
| Cash and balances at central banks | | | — | | | — | | | | | | — | | | 17,866 | | | | | | — | | | | | | 17,866 | |
Treasury and other eligible bills (1) | | | 18,027 | | | — | | | | | | 202 | | | — | | | | | | — | | | | | | 18,229 | |
Loans and advances to banks (2) | | | 71,639 | | | — | | | | | | — | | | 147,821 | | | | | | — | | | | | | 219,460 | |
Loans and advances to customers (3) | | | 104,387 | | | 3,067 | | | | | | — | | | 709,226 | | | | | | 12,570 | | | | | | 829,250 | |
| Debt securities | | | 172,644 | | | 5,777 | | | | | | 95,334 | | | 2,672 | | | | | | — | | | | | | 276,427 | |
| Equity shares | | | 37,546 | | | 7,866 | | | | | | 7,614 | | | — | | | | | | — | | | | | | 53,026 | |
| Settlement balances | | | — | | | — | | | | | | — | | | 16,589 | | | | | | — | | | | | | 16,589 | |
| Derivatives | | | 334,857 | | | — | | | 2,553 | | | — | | | — | | | | | | — | | | | | | 337,410 | |
| Intangible assets | | | | | | | | | | | | | | | | | | | | | | | | 48,492 | | | 48,492 | |
| Property, plant and equipment | | | | | | | | | | | | | | | | | | | | | | | | 18,750 | | | 18,750 | |
| Prepayments, accrued income | | | | | | | | | | | | | | | | | | | | | | | | | | | | |
| and other assets | | | — | | | — | | | | | | — | | | 877 | | | | | | — | | | 18,189 | | | 19,066 | |
| Assets of disposal groups | | | | | | | | | | | | | | | | | | | | | | | | 45,954 | | | 45,954 | |
| | | | 739,100 | | | 16,710 | | | 2,553 | | | 103,150 | | | 895,051 | | | | | | 12,570 | | | 131,385 | | | 1,900,519 | |
| Liabilities | | | | | | | | | | | | | | | | | | | | | | | | | | | | |
Deposits by banks (4) | | | 65,491 | | | — | | | | | | | | | | | | 247,142 | | | — | | | | | | 312,633 | |
Customer accounts (5, 6) | | | 60,425 | | | 7,505 | | | | | | | | | | | | 614,435 | | | — | | | | | | 682,365 | |
Debt securities in issue (7, 8) | | | 9,455 | | | 41,834 | | | | | | | | | | | | 222,326 | | | — | | | | | | 273,615 | |
| Settlement balances | | | | | | | | | | | | | | | | | | | | | | | | | | | | |
| and short positions | | | 73,501 | | | — | | | | | | | | | | | | 17,520 | | | — | | | | | | 91,021 | |
| Derivatives | | | 329,351 | | | — | | | 2,709 | | | | | | | | | — | | | — | | | | | | 332,060 | |
| Accruals, deferred income | | | | | | | | | | | | | | | | | | | | | | | | | | | | |
| and other liabilities | | | 210 | | | — | | | | | | | | | | | | 1,545 | | | 19 | | | 32,250 | | | 34,024 | |
| Retirement benefit liabilities | | | | | | | | | | | | | | | | | | | | | | | | 496 | | | 496 | |
| Deferred taxation | | | | | | | | | | | | | | | | | | | | | | | | 5,510 | | | 5,510 | |
| Insurance liabilities | | | | | | | | | | | | | | | | | | | | | | | | 10,162 | | | 10,162 | |
| Subordinated liabilities | | | — | | | 898 | | | | | | | | | | | | 37,081 | | | — | | | — | | | 37,979 | |
| Liabilities of disposal groups | | | | | | | | | | | | | | | | | | | | | | | | 29,228 | | | 29,228 | |
| | | | 538,433 | | | 50,237 | | | 2,709 | | | | | | | | | 1,140,049 | | | 19 | | | 77,646 | | | 1,809,093 | |
| Equity | | | | | | | | | | | | | | | | | | | | | | | | | | | 91,426 | |
| | | | | | | | | | | | | | | | | | | | | | | | | | | | 1,900,519 | |
Notes on the accounts continued
10 Financial instruments (continued)
| | | Group | |
| | | Held-for- trading | | | Designated as at fair value through profit or loss | | | Hedging derivatives | | | Available- for-sale | | | Loans and receivables | | | Other (amortised cost) | | | Finance leases | | | Non financial assets/ liabilities | | | Total | |
| 2006 | | | £m | | | | £m | | | | £m | | | | £m | | | | £m | | | | £m | | | | £m | | | | £m | | | | £m | |
| Assets | | | | | | | | | | | | | | | | | | | | | | | | | | | | | | | | | | | | |
| Cash and balances at central banks | | | — | | | | — | | | | | | | | — | | | | 6,121 | | | | | | | | — | | | | | | | | 6,121 | |
Treasury and other eligible bills (1) | | | 4,516 | | | | — | | | | | | | | 975 | | | | — | | | | | | | | — | | | | | | | | 5,491 | |
Loans and advances to banks (2) | | | 52,736 | | | | 376 | | | | | | | | — | | | | 29,494 | | | | | | | | — | | | | | | | | 82,606 | |
Loans and advances to customers (3) | | | 72,462 | | | | 1,327 | | | | | | | | — | | | | 381,583 | | | | | | | | 11,521 | | | | | | | | 466,893 | |
| Debt securities | | | 95,192 | | | | 5,989 | | | | | | | | 25,509 | | | | 561 | | | | | | | | — | | | | | | | | 127,251 | |
| Equity shares | | | 3,038 | | | | 2,610 | | | | | | | | 7,856 | | | | — | | | | | | | | — | | | | | | | | 13,504 | |
| Settlement balances | | | — | | | | — | | | | | | | | — | | | | 7,425 | | | | | | | | — | | | | | | | | 7,425 | |
| Derivatives | | | 115,500 | | | | — | | | | 1,181 | | | | — | | | | — | | | | | | | | — | | | | | | | | 116,681 | |
| Intangible assets | | | | | | | | | | | | | | | | | | | | | | | | | | | | | | | 18,904 | | | | 18,904 | |
| Property, plant and equipment | | | | | | | | | | | | | | | | | | | | | | | | | | | | | | | 18,420 | | | | 18,420 | |
| Prepayments, accrued income | | | | | | | | | | | | | | | | | | | | | | | | | | | | | | | | | | | | |
| and other assets | | | — | | | | — | | | | | | | | — | | | | 953 | | | | | | | | — | | | | 7,183 | | | | 8,136 | |
| | | | 343,444 | | | | 10,302 | | | | 1,181 | | | | 34,340 | | | | 426,137 | | | | | | | | 11,521 | | | | 44,507 | | | | 871,432 | |
| Liabilities | | | | | | | | | | | | | | | | | | | | | | | | | | | | | | | | | | | | |
Deposits by banks (4) | | | 57,452 | | | | — | | | | | | | | | | | | | | | | 74,691 | | | | — | | | | — | | | | 132,143 | |
Customer accounts (5, 6) | | | 46,797 | | | | 3,922 | | | | | | | | | | | | | | | | 333,503 | | | | — | | | | — | | | | 384,222 | |
Debt securities in issue (7, 8) | | | 2,141 | | | | 10,499 | | | | | | | | | | | | | | | | 73,323 | | | | — | | | | — | | | | 85,963 | |
| Settlement balances and | | | | | | | | | | | | | | | | | | | | | | | | | | | | | | | | | | | | |
| short positions | | | 43,809 | | | | — | | | | | | | | | | | | | | | | 5,667 | | | | — | | | | — | | | | 49,476 | |
| Derivatives | | | 117,277 | | | | — | | | | 835 | | | | | | | | | | | | — | | | | — | | | | — | | | | 118,112 | |
| Accruals, deferred income | | | | | | | | | | | | | | | | | | | | | | | | | | | | | | | | | | | | |
| and other liabilities | | | — | | | | — | | | | | | | | | | | | | | | | 1,453 | | | | 89 | | | | 14,118 | | | | 15,660 | |
| Retirement benefit liabilities | | | | | | | | | | | | | | | | | | | | | | | | | | | | | | | 1,992 | | | | 1,992 | |
| Deferred taxation | | | | | | | | | | | | | | | | | | | | | | | | | | | | | | | 3,264 | | | | 3,264 | |
| Insurance liabilities | | | | | | | | | | | | | | | | | | | | | | | | | | | | | | | 7,456 | | | | 7,456 | |
| Subordinated liabilities | | | — | | | | 124 | | | | | | | | | | | | | | | | 27,530 | | | | — | | | | — | | | | 27,654 | |
| | | | 267,476 | | | | 14,545 | | | | 835 | | | | | | | | | | | | 516,167 | | | | 89 | | | | 26,830 | | | | 825,942 | |
| | | | | | | | | | | | | | | | | | | | | | | | | | | | | | | | | | | | | |
| Equity | | | | | | | | | | | | | | | | | | | | | | | | | | | | | | | | | | | 45,490 | |
| | | | | | | | | | | | | | | | | | | | | | | | | | | | | | | | | | | | 871,432 | |
| | Notes: |
| | |
| (1) | Comprises treasury bills and similar securities of £16,315 million (2006 – £5,407 million) and other eligible bills of £1,914 million (2006 – £84 million). |
| | |
| (2) | Includes reverse repurchase agreements of £175,941 million (2006 – £54,152 million) and items in the course of collection from other banks of £3,095 million (2006 – £3,471 million). |
| | |
| (3) | Includes reverse repurchase agreements of £142,357 million (2006 – £62,908 million). |
| | |
| (4) | Includes repurchase agreements of £163,038 million (2006 – £76,376 million) and items in the course of transmission to other banks of £372 million (2006 – £799 million). |
| | |
| (5) | Includes repurchase agreements of £134,916 million (2006 – £63,984 million). |
| | |
| (6) | The carrying amount of other customer accounts designated as at fair value through profit or loss is £77 million (2006 – £140 million) greater than the principal amount. No amounts have been recognised in profit or loss for changes in credit risk associated with these liabilities as the changes are immaterial measured as the change in fair value from movements in the period in the credit risk premium payable. The amounts include investment contracts with a carrying value of £5,555 (2006 – £2,246 million). |
| | |
| (7) | Comprises bonds and medium term notes of £119,021 million (2006 – £43,408 million) and certificates of deposit and other commercial paper of £154,594 (2006 – £42,555 million). |
| | |
| (8) | £162 million (2006 – nil) has been recognised in profit or loss for changes in credit risk associated with these liabilities measured as the change in fair value from movements in the period in the credit risk premium payable by the Group. The carrying amount is £317 million (2006 – £383 million) lower than the principal amount. |
| Amounts included in the consolidated income statement: | | Group | |
| | | 2007 | | | 2006 | | | 2005 | |
| | | | £m | | | | £m | | | | £m | |
| | | | | | | | | | | | | |
| Gains on financial assets/liabilities designated as at fair value through profit or loss | | | 1,074 | | | | 573 | | | | 364 | |
| Gains on disposal or settlement of loans and receivables | | | 3 | | | | 21 | | | | 25 | |
On the initial recognition of financial assets and liabilities valued using valuation techniques incorporating information other than observable market data, any difference between the transaction price and that derived from the valuation technique is deferred. Such amounts are recognised in profit or loss over the life of the transaction; when market data become observable; or when the transaction matures or is closed out as appropriate. At 31 December 2007, net gains of £72 million (2006 – £15 million) were carried forward in the balance sheet. During the year net gains of £67 million (2006 – £3 million) were deferred and £10 million (2006 – £4 million) released to profit or loss.
The following tables analyse the company’s financial assets and financial liabilities in accordance with the categories of financial instruments in IAS 39. Assets and liabilities outside the scope of IAS 39 are shown separately.
| | | Company | |
| | | Held-for- trading | | Hedging derivatives | | Loans and receivables | | Other (amortised cost) | | Non financial assets/ liabilities | | Total | |
| 2007 | | | £m | | | £m | | | £m | | | £m | | | £m | | | £m | |
| Assets | | | | | | | | | | | | | | | | | | | |
Loans and advances to banks (1) | | | — | | | — | | | 7,686 | | | | | | — | | | 7,686 | |
Loans and advances to customers (2) | | | — | | | — | | | 307 | | | | | | — | | | 307 | |
| Investment in Group undertakings | | | — | | | — | | | — | | | | | | 43,542 | | | 43,542 | |
| Derivatives | | | 173 | | | — | | | — | | | | | | — | | | 173 | |
| Prepayments, accrued income and other assets | | | — | | | — | | | — | | | | | | 127 | | | 127 | |
| | | | 173 | | | — | | | 7,993 | | | | | | 43,669 | | | 51,835 | |
| Liabilities | | | | | | | | | | | | | | | | | | | |
Deposits by banks (3) | | | — | | | — | | | | | | 5,572 | | | — | | | 5,572 | |
| Debt securities in issue | | | — | | | — | | | | | | 13,453 | | | — | | | 13,453 | |
| Derivatives | | | 125 | | | 54 | | | | | | — | | | — | | | 179 | |
| Accruals, deferred income and other liabilities | | | — | | | — | | | | | | — | | | 8 | | | 8 | |
| Deferred taxation | | | — | | | — | | | | | | — | | | 3 | | | 3 | |
| Subordinated liabilities | | | — | | | — | | | | | | 7,743 | | | — | | | 7,743 | |
| | | | 125 | | | 54 | | | | | | 26,768 | | | 11 | | | 26,958 | |
| | | | | | | | | | | | | | | | | | | | |
| Equity | | | | | | | | | | | | | | | | | | 24,877 | |
| | | | | | | | | | | | | | | | | | | 51,835 | |
| | | | | | | | | | | | | | | | | | | | |
| | | | | | | | | | | | | | | | | | | | |
| 2006 | | | | | | | | | | | | | | | | | | | |
| Assets | | | | | | | | | | | | | | | | | | | |
Loans and advances to banks (1) | | | — | | | — | | | 7,252 | | | | | | — | | | 7,252 | |
Loans and advances to customers (2) | | | — | | | — | | | 286 | | | | | | — | | | 286 | |
| Investment in Group undertakings | | | — | | | — | | | — | | | | | | 21,784 | | | 21,784 | |
| Prepayments, accrued income and other assets | | | — | | | — | | | — | | | | | | 3 | | | 3 | |
| | | | — | | | — | | | 7,538 | | | | | | 21,787 | | | 29,325 | |
| Liabilities | | | | | | | | | | | | | | | | | | | |
Deposits by banks (3) | | | — | | | — | | | | | | 738 | | | — | | | 738 | |
| Debt securities in issue | | | — | | | — | | | | | | 2,139 | | | — | | | 2,139 | |
| Derivatives | | | 42 | | | — | | | | | | — | | | — | | | 42 | |
| Accruals, deferred income and other liabilities | | | — | | | — | | | | | | — | | | 15 | | | 15 | |
| Subordinated liabilities | | | — | | | — | | | | | | 8,194 | | | — | | | 8,194 | |
| | | | 42 | | | — | | | | | | 11,071 | | | 15 | | | 11,128 | |
| | | | | | | | | | | | | | | | | | | | |
| Equity | | | | | | | | | | | | | | | | | | 18,197 | |
| | | | | | | | | | | | | | | | | | | 29,325 | |
| | Notes: |
| | |
| (1) | Includes amounts due from subsidiaries of £7,130 million (2006 – £7,252 million). |
| (2) | Due from subsidiaries. |
Notes on the accounts continued
10 Financial instruments (continued)
The following table shows the carrying values and the fair values of financial instruments on the balance sheets carried at amortised cost.
| | | Group | | | Company | |
| | | 2007 | | 2007 | | | 2006 | | | 2006 | | | 2007 | | 2007 | | | 2006 | | | 2006 | |
| | | Carrying | | Fair | | | Carrying | | | Fair | | | Carrying | | Fair | | | Carrying | | | Fair | |
| | | value | | value | | | value | | | value | | | value | | value | | | value | | | value | |
| | | | £m | | | £m | | | | £m | | | | £m | | | | £m | | | £m | | | | £m | | | | £m | |
| Financial assets | | | | | | | | | | | | | | | | | | | | | | | | | | | | | | |
| Cash and balances at central banks | | | 17,866 | | | 17,866 | | | | 6,121 | | | | 6,121 | | | | — | | | — | | | | — | | | | — | |
| Loans and advances to banks | | | | | | | | | | | | | | | | | | | | | | | | | | | | | | |
| Loans and receivables | | | 147,821 | | | 147,818 | | | | 29,494 | | | | 29,474 | | | | 7,686 | | | 7,686 | | | | 7,252 | | | | 7,252 | |
| Loans and advances to customers | | | | | | | | | | | | | | | | | | | | | | | | | | | | | | |
| Loans and receivables | | | 709,226 | | | 711,481 | | | | 381,583 | | | | 382,671 | | | | 307 | | | 307 | | | | 286 | | | | 286 | |
| Finance leases | | | 12,570 | | | 12,376 | | | | 11,521 | | | | 11,504 | | | | — | | | — | | | | — | | | | — | |
| Debt securities | | | | | | | | | | | | | | | | | | | | | | | | | | | | | | |
| Loans and receivables | | | 2,672 | | | 2,644 | | | | 561 | | | | 561 | | | | — | | | — | | | | — | | | | — | |
| | | | | | | | | | | | | | | | | | | | | | | | | | | | | | | |
| Settlement balances | | | 16,589 | | | 16,589 | | | | 7,425 | | | | 7,425 | | | | — | | | — | | | | — | | | | — | |
| | | | | | | | | | | | | | | | | | | | | | | | | | | | | | | |
| | | | | | | | | | | | | | | | | | | | | | | | | | | | | | | |
| Financial liabilities | | | | | | | | | | | | | | | | | | | | | | | | | | | | | | |
| Deposits by banks | | | | | | | | | | | | | | | | | | | | | | | | | | | | | | |
| Amortised cost | | | 247,142 | | | 246,966 | | | | 74,691 | | | | 74,510 | | | | 5,572 | | | 5,572 | | | | 738 | | | | 738 | |
| Customer accounts | | | | | | | | | | | | | | | | | | | | | | | | | | | | | | |
| Amortised cost | | | 614,435 | | | 614,069 | | | | 333,503 | | | | 333,286 | | | | — | | | — | | | | — | | | | — | |
| Debt securities in issue | | | | | | | | | | | | | | | | | | | | | | | | | | | | | | |
| Amortised cost | | | 222,326 | | | 222,206 | | | | 73,323 | | | | 73,580 | | | | 13,453 | | | 13,453 | | | | 2,139 | | | | 2,139 | |
| | | | | | | | | | | | | | | | | | | | | | | | | | | | | | | |
| Settlement balances | | | 17,520 | | | 17,520 | | | | 5,667 | | | | 5,667 | | | | — | | | — | | | | — | | | | — | |
| Subordinated liabilities | | | | | | | | | | | | | | | | | | | | | | | | | | | | | | |
| Amortised cost | | | 37,081 | | | 35,729 | | | | 27,530 | | | | 28,606 | | | | 7,743 | | | 6,983 | | | | 8,194 | | | | 8,369 | |
Remaining maturity
| | | Group | |
| | | 2007 | | | 2006 | |
| | | Less than | | More than | | | | | Less than | | | More than | | | | |
| | | 12 months | | 12 months | | Total | | | 12 months | | | 12 months | | | Total | |
| | | | £m | | | £m | | | £m | | | | £m | | | | £m | | | | £m | |
| Assets | | | | | | | | | | | | | | | | | | | | | | |
| Cash and balances at central banks | | | 17,866 | | | — | | | 17,866 | | | | 6,121 | | | | — | | | | 6,121 | |
| Treasury and other eligible bills | | | 18,108 | | | 121 | | | 18,229 | | | | 5,491 | | | | — | | | | 5,491 | |
| Loans and advances to banks | | | 187,969 | | | 31,491 | | | 219,460 | | | | 82,193 | | | | 413 | | | | 82,606 | |
| Loans and advances to customers | | | 396,453 | | | 432,797 | | | 829,250 | | | | 263,504 | | | | 203,389 | | | | 466,893 | |
| Debt securities | | | 51,980 | | | 224,447 | | | 276,427 | | | | 25,324 | | | | 101,927 | | | | 127,251 | |
| Equity shares | | | — | | | 53,026 | | | 53,026 | | | | — | | | | 13,504 | | | | 13,504 | |
| Settlement balances | | | 16,561 | | | 28 | | | 16,589 | | | | 7,425 | | | | — | | | | 7,425 | |
| Derivatives | | | 56,668 | | | 280,742 | | | 337,410 | | | | 27,984 | | | | 88,697 | | | | 116,681 | |
| | | | | | | | | | | | | | | | | | | | | | | |
| Liabilities | | | | | | | | | | | | | | | | | | | | | | |
| Deposits by banks | | | 303,273 | | | 9,360 | | | 312,633 | | | | 124,584 | | | | 7,559 | | | | 132,143 | |
| Customer accounts | | | 650,687 | | | 31,678 | | | 682,365 | | | | 372,604 | | | | 11,618 | | | | 384,222 | |
| Debt securities in issue | | | 155,742 | | | 117,873 | | | 273,615 | | | | 41,957 | | | | 44,006 | | | | 85,963 | |
| Settlement balances and short positions | | | 44,466 | | | 46,555 | | | 91,021 | | | | 26,450 | | | | 23,026 | | | | 49,476 | |
| Derivatives | | | 60,451 | | | 271,609 | | | 332,060 | | | | 30,082 | | | | 88,030 | | | | 118,112 | |
| Subordinated liabilities | | | 1,867 | | | 36,112 | | | 37,979 | | | | 675 | | | | 26,979 | | | | 27,654 | |
| | | Company | |
| | | 2007 | | | 2006 | |
| | | Less than | | More than | | | | | Less than | | | More than | | | | |
| | | 12 months | | 12 months | | Total | | | 12 months | | | 12 months | | | Total | |
| | | | £m | | | £m | | | £m | | | | £m | | | | £m | | | | £m | |
| Assets | | | | | | | | | | | | | | | | | | | | | | |
| Loans and advances to banks | | | 1,655 | | | 6,031 | | | 7,686 | | | | 1,171 | | | | 6,081 | | | | 7,252 | |
| Loans and advances to customers | | | 307 | | | — | | | 307 | | | | 286 | | | | — | | | | 286 | |
| Derivatives | | | 127 | | | 46 | | | 173 | | | | — | | | | — | | | | — | |
| | | | | | | | | | | | | | | | | | | | | | | |
| Liabilities | | | | | | | | | | | | | | | | | | | | | | |
| Deposits by banks | | | 5,572 | | | — | | | 5,572 | | | | — | | | | 738 | | | | 738 | |
| Debt securities in issue | | | 8,855 | | | 4,598 | | | 13,453 | | | | 1,681 | | | | 458 | | | | 2,139 | |
| Derivatives | | | 102 | | | 77 | | | 179 | | | | 23 | | | | 19 | | | | 42 | |
| Subordinated liabilities | | | 119 | | | 7,624 | | | 7,743 | | | | 104 | | | | 8,090 | | | | 8,194 | |
Notes on the accounts continued
11 Asset quality
Asset grades
Internal reporting and oversight of risk assets is principally differentiated by credit ratings. Internal ratings are used to assess the credit quality of borrowers. Customers are assigned an internal credit grade based on various credit grading models that reflect the probability of default. All credit ratings across the Group map to a Group level asset quality scale.
Expressed as an annual probability of default, the upper and lower boundaries and the midpoint for each of these Group level asset quality grades are as follows:
| Asset | | Annual probability of default | |
| quality | | Minimum | | | Midpoint | | | Maximum | |
| grade | | % | | | % | | | % | |
| AQ1 | | | 0.00 | | | | 0.10 | | | | 0.20 | |
| AQ2 | | | 0.21 | | | | 0.40 | | | | 0.60 | |
| AQ3 | | | 0.61 | | | | 1.05 | | | | 1.50 | |
| AQ4 | | | 1.51 | | | | 3.25 | | | | 5.00 | |
| AQ5 | | | 5.01 | | | | 52.50 | | | | 100.00 | |
The following table provides an analysis of the credit quality of financial assets by the Group’s internal credit ratings.
| | | | Group | |
| | | | AQ1 | | | AQ2 | | | AQ3 | | | AQ4 | | | AQ5 | | | | | | | | | | | | Total | |
| 2007 | | | £m | | | £m | | | £m | | | £m | | | £m | | | £m | | | £m | | | £m | | | £m | |
| Cash and balance at central banks | | | 17,866 | | | — | | | — | | | — | | | — | | | — | | | — | | | — | | | 17,866 | |
| Treasury and other eligible bills | | | 18,218 | | | — | | | 11 | | | — | | | — | | | — | | | — | | | — | | | 18,229 | |
| Loans and advances to banks* | | | 204,083 | | | 5,797 | | | 4,937 | | | 407 | | | 1,119 | | | — | | | 25 | | | (3 | ) | | 216,365 | |
| Loans and advances to customers | | | 275,926 | | | 174,249 | | | 221,701 | | | 84,896 | | | 55,343 | | | 13,236 | | | 10,337 | | | (6,438 | ) | | 829,250 | |
| Debt securities | | | 240,677 | | | 15,688 | | | 2,328 | | | 1,372 | | | 16,361 | | | — | | | 5 | | | (4 | ) | | 276,427 | |
| Settlement balances | | | 14,491 | | | 98 | | | 344 | | | 21 | | | 68 | | | 1,567 | | | — | | | — | | | 16,589 | |
| Derivatives | | | 300,122 | | | 23,333 | | | 11,299 | | | 2,352 | | | 304 | | | — | | | — | | | — | | | 337,410 | |
| Other financial instruments | | | 649 | | | — | | | — | | | 20 | | | 143 | | | 65 | | | — | | | — | | | 877 | |
| | | | 1,072,032 | | | 219,165 | | | 240,620 | | | 89,068 | | | 73,338 | | | 14,868 | | | 10,367 | | | (6,445 | ) | | 1,713,013 | |
| | | | | | | | | | | | | | | | | | | | | | | | | | | | | |
| Commitments | | | 131,750 | | | 89,682 | | | 74,126 | | | 25,320 | | | 17,301 | | | — | | | — | | | — | | | 338,179 | |
| Contingent liabilities | | | 26,120 | | | 16,314 | | | 11,740 | | | 4,032 | | | 3,714 | | | — | | | — | | | — | | | 61,920 | |
| Total off-balance sheet | | | 157,870 | | | 105,996 | | | 85,866 | | | 29,352 | | | 21,015 | | | — | | | — | | | — | | | 400,099 | |
| 2006 | | | | | | | | | | | | | | | | | | | |
| Cash and balance at central banks | | | 6,121 | | | — | | | — | | | — | | | — | | | — | | | — | | | — | | | 6,121 | |
| Treasury and other eligible bills | | | 5,491 | | | — | | | — | | | — | | | — | | | — | | | — | | | — | | | 5,491 | |
| Loans and advances to banks* | | | 77,513 | | | 748 | | | 416 | | | 346 | | | 111 | | | 1 | | | 2 | | | (2 | ) | | 79,135 | |
| Loans and advances to customers | | | 149,221 | | | 85,511 | | | 124,215 | | | 72,622 | | | 24,703 | | | 8,324 | | | 6,230 | | | (3,933 | ) | | 466,893 | |
| Debt securities | | | 122,152 | | | 2,707 | | | 1,206 | | | 345 | | | 841 | | | — | | | 3 | | | (3 | ) | | 127,251 | |
| Settlement balances | | | 4,936 | | | 473 | | | 261 | | | 454 | | | — | | | 1,301 | | | — | | | — | | | 7,425 | |
| Derivatives | | | 89,292 | | | 18,827 | | | 7,776 | | | 505 | | | 281 | | | — | | | — | | | — | | | 116,681 | |
| Other financial instruments | | | 604 | | | — | | | — | | | 29 | | | 269 | | | 51 | | | — | | | — | | | 953 | |
| | | | 455,330 | | | 108,266 | | | 133,874 | | | 74,301 | | | 26,205 | | | 9,677 | | | 6,235 | | | (3,938 | ) | | 809,950 | |
| | | | | | | | | | | | | | | | | | | | | | | | | | | | | |
| Commitments | | | 112,505 | | | 52,279 | | | 46,742 | | | 18,954 | | | 14,577 | | | — | | | — | | | — | | | 245,057 | |
| Contingent liabilities | | | 6,172 | | | 7,870 | | | 3,453 | | | 1,468 | | | 883 | | | — | | | — | | | — | | | 19,846 | |
| Total off-balance sheet | | | 118,677 | | | 60,149 | | | 50,195 | | | 20,422 | | | 15,460 | | | — | | | — | | | — | | | 264,903 | |
* Excluding items in the course of collection of £3,095 million (2006 – £3,471 million).
Industry risk – geographical analysis
The following table analyses financial assets by location of office and by industry type.
| | | Group | |
| | | Loans and advances to banks and customers | | | Treasury bills, debt securities | | | Derivatives | | | Other(1) | | | Total | | | | |
| 2007 | | | £m | | | | £m | | | | £m | | | | £m | | | | £m | | | | £m | |
| UK | | | | | | | | | | | | | | | | | | | | | | | | |
| Central and local government | | | 4,728 | | | | 30,285 | | | | 3,912 | | | | — | | | | 38,925 | | | | 1,531 | |
| Manufacturing | | | 21,083 | | | | 2,751 | | | | 4,800 | | | | — | | | | 28,634 | | | | 4,032 | |
| Construction | | | 12,363 | | | | 456 | | | | 741 | | | | — | | | | 13,560 | | | | 1,684 | |
| Finance | | | 295,366 | | | | 106,201 | | | | 299,867 | | | | 12,716 | | | | 714,150 | | | | 246,428 | |
| Service industries and business activities | | | 74,399 | | | | 16,801 | | | | 4,411 | | | | — | | | | 95,611 | | | | 6,687 | |
| Agriculture, forestry and fishing | | | 2,570 | | | | 66 | | | | 58 | | | | — | | | | 2,694 | | | | 104 | |
| Property | | | 63,715 | | | | 640 | | | | 969 | | | | 7 | | | | 65,331 | | | | 2,033 | |
| Individuals | | | | | | | | | | | | | | | | | | | | | | | | |
| Home mortgages | | | 73,916 | | | | 1,795 | | | | 5 | | | | — | | | | 75,716 | | | | — | |
| Other | | | 28,747 | | | | 1,140 | | | | 15 | | | | 23 | | | | 29,925 | | | | 7 | |
| Finance leases and instalment credit | | | 15,632 | | | | 131 | | | | 27 | | | | — | | | | 15,790 | | | | 5 | |
| Interest accruals | | | 3,512 | | | | 1,607 | | | | — | | | | — | | | | 5,119 | | | | — | |
| Total UK | | | 596,031 | | | | 161,873 | | | | 314,805 | | | | 12,746 | | | | 1,085,455 | | | | 262,511 | |
| | | | | | | | | | | | | | | | | | | | | | | | | |
| US | | | | | | | | | | | | | | | | | | | | | | | | |
| Central and local government | | | 386 | | | | 23,506 | | | | 10 | | | | 212 | | | | 24,114 | | | | — | |
| Manufacturing | | | 7,399 | | | | 608 | | | | 111 | | | | — | | | | 8,118 | | | | 13 | |
| Construction | | | 793 | | | | 96 | | | | — | | | | — | | | | 889 | | | | — | |
| Finance | | | 69,867 | | | | 39,049 | | | | 9,354 | | | | 3,095 | | | | 121,365 | | | | 23,026 | |
| Service industries and business activities | | | 16,474 | | | | 2,190 | | | | 233 | | | | 1 | | | | 18,898 | | | | 18 | |
| Agriculture, forestry and fishing | | | 20 | | | | 4 | | | | — | | | | — | | | | 24 | | | | — | |
| Property | | | 6,456 | | | | 4,089 | | | | — | | | | — | | | | 10,545 | | | | — | |
| Individuals | | | | | | | | | | | | | | | | | | | | | | | | |
| Home mortgages | | | 27,882 | | | | — | | | | — | | | | — | | | | 27,882 | | | | — | |
| Other | | | 10,879 | | | | — | | | | — | | | | — | | | | 10,879 | | | | — | |
| Finance leases and instalment credit | | | 2,228 | | | | — | | | | — | | | | — | | | | 2,228 | | | | — | |
| Interest accruals | | | 1,421 | | | | 379 | | | | — | | | | — | | | | 1,800 | | | | 2 | |
| Total US | | | 143,805 | | | | 69,921 | | | | 9,708 | | | | 3,308 | | | | 226,742 | | | | 23,059 | |
| | | | | | | | | | | | | | | | | | | | | | | | | |
| Europe | | | | | | | | | | | | | | | | | | | | | | | | |
| Central and local government | | | 2,371 | | | | 30,593 | | | | 132 | | | | — | | | | 33,096 | | | | 9 | |
| Manufacturing | | | 15,159 | | | | 13 | | | | 361 | | | | — | | | | 15,533 | | | | 214 | |
| Construction | | | 4,779 | | | | — | | | | 13 | | | | — | | | | 4,792 | | | | — | |
| Finance | | | 40,498 | | | | 42,418 | | | | 6,285 | | | | 157 | | | | 89,358 | | | | 84,200 | |
| Service industries and business activities | | | 46,500 | | | | 540 | | | | 481 | | | | — | | | | 47,521 | | | | 24,648 | |
| Agriculture, forestry and fishing | | | 4,650 | | | | 2 | | | | 42 | | | | — | | | | 4,694 | | | | — | |
| Property | | | 15,768 | | | | 67 | | | | 8 | | | | — | | | | 15,843 | | | | — | |
| Individuals | | | | | | | | | | | | | | | | | | | | | | | | |
| Home mortgages | | | 81,557 | | | | 18 | | | | — | | | | — | | | | 81,575 | | | | — | |
| Other | | | 16,292 | | | | 3,292 | | | | — | | | | — | | | | 19,584 | | | | — | |
| Finance leases and instalment credit | | | 1,620 | | | | — | | | | — | | | | — | | | | 1,620 | | | | — | |
| Interest accruals | | | 2,872 | | | | 1,101 | | | | — | | | | — | | | | 3,973 | | | | — | |
| Total Europe | | | 232,066 | | | | 78,044 | | | | 7,322 | | | | 157 | | | | 317,589 | | | | 109,071 | |
| | | | | | | | | | | | | | | | | | | | | | | | | |
| Rest of the World | | | | | | | | | | | | | | | | | | | | | | | | |
| Central and local government | | | 2,592 | | | | 18,821 | | | | 94 | | | | — | | | | 21,507 | | | | — | |
| Manufacturing | | | 8,078 | | | | 46 | | | | 738 | | | | — | | | | 8,862 | | | | — | |
| Construction | | | 825 | | | | 79 | | | | 3 | | | | — | | | | 907 | | | | 1 | |
| Finance | | | 37,502 | | | | 16,919 | | | | 3,797 | | | | 1,210 | | | | 59,428 | | | | 6,059 | |
| Service industries and business activities | | | 14,449 | | | | 1,825 | | | | 661 | | | | — | | | | 16,935 | | | | 103 | |
| Agriculture, forestry and fishing | | | 1,941 | | | | — | | | | — | | | | — | | | | 1,941 | | | | — | |
| Property | | | 2,898 | | | | 217 | | | | 28 | | | | — | | | | 3,143 | | | | — | |
| Individuals | | | | | | | | | | | | | | | | | | | | | | | | |
| Home mortgages | | | 1,740 | | | | — | | | | — | | | | — | | | | 1,740 | | | | — | |
| Other | | | 12,261 | | | | — | | | | — | | | | — | | | | 12,261 | | | | 3 | |
| Finance leases and instalment credit | | | 18 | | | | — | | | | 254 | | | | 45 | | | | 317 | | | | — | |
| Interest accruals | | | 945 | | | | 11 | | | | — | | | | — | | | | 956 | | | | — | |
| Total Rest of the World | | | 83,249 | | | | 37,918 | | | | 5,575 | | | | 1,255 | | | | 127,997 | | | | 6,166 | |
Notes on the accounts continued
11 Asset quality (continued)
Industry risk – geographical analysis
| | Group | |
| | Loans and advances to banks and customers | | Treasury bills, debt securities and equity shares | | Derivatives | | Other(1) | | Total | | Netting and offset | (2) |
| 2007 | | £m | | | £m | | | £m | | | £m | | | £m | | | £m | |
| Total | | | | | | | | | | | | | | | | | | |
| Central and local government | | 10,077 | | | 103,205 | | | 4,148 | | | 212 | | | 117,642 | | | 1,540 | |
| Manufacturing | | 51,719 | | | 3,418 | | | 6,010 | | | — | | | 61,147 | | | 4,259 | |
| Construction | | 18,760 | | | 631 | | | 757 | | | — | | | 20,148 | | | 1,685 | |
| Finance | | 443,233 | | | 204,587 | | | 319,303 | | | 17,178 | | | 984,301 | | | 359,713 | |
| Service industries and business activities | | 151,822 | | | 21,356 | | | 5,786 | | | 1 | | | 178,965 | | | 31,456 | |
| Agriculture, forestry and fishing | | 9,181 | | | 72 | | | 100 | | | — | | | 9,353 | | | 104 | |
| Property | | 88,837 | | | 5,013 | | | 1,005 | | | 7 | | | 94,862 | | | 2,033 | |
| Individuals | | | | | | | | | | | | | | | | | | |
| Home mortgages | | 185,095 | | | 1,813 | | | 5 | | | — | | | 186,913 | | — | |
| Other | | 68,179 | | | 4,432 | | | 15 | | | 23 | | | 72,649 | | | 10 | |
| Finance leases and instalment credit | | 19,498 | | | 131 | | | 281 | | | 45 | | | 19,955 | | | 5 | |
| Interest accruals | | 8,750 | | | 3,098 | | | — | | | — | | | 11,848 | | | 2 | |
| | | 1,055,151 | | | 347,756 | | | 337,410 | | | 17,466 | | | 1,757,783 | | | 400,807 | |
| | Notes: |
| | |
| (1) | Includes settlement balances of £16,589 million. |
| | |
| (2) | This column shows the amount by which the Group’s credit risk exposure is reduced through arrangements, such as master netting agreements, which give the Group a legal right to set-off the financial asset against a financial liability due to the same counterparty. In addition, the Group holds collateral in respect of individual loans and advances to banks and to customers. This collateral includes mortgages over property (both personal and commercial); charges over business assets such as plant, inventories and trade debtors; and guarantees of lending from parties other than the borrower. The Group obtains collateral in the form of securities in reverse repurchase agreements. Cash and securities are received as collateral in respect of derivative transactions. |
| | Group | |
| | Loans and advances to banks and customers | | Treasury bills, debt securities and equity shares | | Derivatives | | Other(1) | | Total | | Netting and offset | (2) |
| 2006 | | £m | | | £m | | | £m | | | £m | | | £m | | | £m | |
| UK | | | | | | | | | | | | | | | | | | |
| Central and local government | | 7,629 | | | 28,211 | | | 345 | | | 1,624 | | | 37,809 | | | 1,553 | |
| Manufacturing | | 15,259 | | | 521 | | | 915 | | | 49 | | | 16,744 | | | 4,540 | |
| Construction | | 9,667 | | | 115 | | | 179 | | | 3 | | | 9,964 | | | 1,458 | |
| Finance | | 128,463 | | | 47,274 | | | 80,577 | | | 2,199 | | | 258,513 | | | 93,403 | |
| Service industries and business activities | | 57,895 | | | 4,330 | | | 2,616 | | | 769 | | | 65,610 | | | 5,289 | |
| Agriculture, forestry and fishing | | 2,819 | | | 61 | | | 3 | | | — | | | 2,883 | | | 99 | |
| Property | | 51,303 | | | 561 | | | 646 | | | 11 | | | 52,521 | | | 1,291 | |
| Individuals | | | | | | | | | | | | | | | | | | |
| Home mortgages | | 70,884 | | | — | | | 1 | | | — | | | 70,885 | | | — | |
| Other | | 28,594 | | | 861 | | | 29 | | | 58 | | | 29,542 | | | 61 | |
| Finance leases and instalment credit | | 14,218 | | | 5 | | | — | | | — | | | 14,223 | | | 189 | |
| Interest accruals | | 1,890 | | | 62 | | | — | | | — | | | 1,952 | | | — | |
| Total UK | | 388,621 | | | 82,001 | | | 85,311 | | | 4,713 | | | 560,646 | | | 107,883 | |
| | | | | | | | | | | | | | | | | | | |
| US | | | | | | | | | | | | | | | | | | |
| Central and local government | | 435 | | | 24,013 | | | — | | | 102 | | | 24,550 | | | 1 | |
| Manufacturing | | 3,842 | | | 251 | | | 157 | | | — | | | 4,250 | | | 52 | |
| Construction | | 790 | | | 48 | | | 12 | | | — | | | 850 | | | — | |
| Finance | | 31,785 | | | 28,333 | | | 29,989 | | | 3,495 | | | 93,602 | | | 26,037 | |
| Service industries and business activities | | 10,678 | | | 1,267 | | | 168 | | | — | | | 12,113 | | | 22 | |
| Agriculture, forestry and fishing | | 64 | | | — | | | — | | | — | | | 64 | | | — | |
| Property | | 5,781 | | | — | | | 24 | | | — | | | 5,805 | | | 19 | |
| Individuals | | | | | | | | | | | | | | | | | | |
| Home mortgages | | 34,230 | | | — | | | — | | | — | | | 34,230 | | | — | |
| Other | | 11,643 | | | — | | | — | | | — | | | 11,643 | | | — | |
| Finance leases and instalment credit | | 2,282 | | | — | | | — | | | — | | | 2,282 | | | — | |
| Interest accruals | | 526 | | | 343 | | | — | | | — | | | 869 | | | 2 | |
| Total US | | 102,056 | | | 54,255 | | | 30,350 | | | 3,597 | | | 190,258 | | | 26,133 | |
| | Group | |
| | Loans and advances to banks and customers | | Treasury bills, debt securities and equity shares | | Derivatives | | Other | (1) | Total | | Netting and offset | (2) |
| 2006 | | £m | | | £m | | | £m | | | £m | | | £m | | | £m | |
| Europe | | | | | | | | | | | | | | | | | | |
| Central and local government | | 488 | | | 423 | | | — | | | 3 | | | 914 | | | — | |
| Manufacturing | | 4,067 | | | — | | | — | | | — | | | 4,067 | | | — | |
| Construction | | 2,751 | | | — | | | — | | | — | | | 2,751 | | | — | |
| Finance | | 6,067 | | | 1,938 | | | 860 | | | 49 | | | 8,914 | | | 7 | |
| Service industries and business activities | | 9,607 | | | 100 | | | 7 | | | 7 | | | 9,721 | | | — | |
| Agriculture, forestry and fishing | | 469 | | | 2 | | | — | | | — | | | 471 | | | — | |
| Property | | 8,781 | | | 21 | | | — | | | — | | | 8,802 | | | — | |
| Individuals | | | | | | | | | | | | | | | | | | |
| Home mortgages | | 13,661 | | | — | | | — | | | — | | | 13,661 | | | — | |
| Other | | 3,774 | | | — | | | — | | | — | | | 3,774 | | | — | |
| Finance leases and instalment credit | | 1,325 | | | — | | | — | | | — | | | 1,325 | | | — | |
| Interest accruals | | 221 | | | — | | | — | | | — | | | 221 | | | — | |
| Total Europe | | 51,211 | | | 2,484 | | | 867 | | | 59 | | | 54,621 | | | 7 | |
| | | | | | | | | | | | | | | | | | | |
| Rest of the World | | | | | | | | | | | | | | | | | | |
| Central and local government | | 185 | | | 921 | | | 16 | | | — | | | 1,122 | | | 1 | |
| Manufacturing | | 129 | | | — | | | 3 | | | — | | | 132 | | | 3 | |
| Construction | | 80 | | | — | | | — | | | — | | | 80 | | | — | |
| Finance | | 6,116 | | | 6,652 | | | 106 | | | 7 | | | 12,881 | | | 2,271 | |
| Service industries and business activities | | 2,664 | | | 2 | | | 27 | | | 2 | | | 2,695 | | | 2 | |
| Agriculture, forestry and fishing | | 13 | | | — | | | — | | | — | | | 13 | | | — | |
| Property | | 1,250 | | | 19 | | | 1 | | | — | | | 1,270 | | | — | |
| Individuals | | | | | | | | | | | | | | | | | | |
| Home mortgages | | 273 | | | — | | | — | | | — | | | 273 | | | — | |
| Other | | 782 | | | — | | | — | | | — | | | 782 | | | — | |
| Finance leases and instalment credit | | 10 | | | — | | | — | | | — | | | 10 | | | — | |
| Interest accruals | | 44 | | | — | | | — | | | — | | | 44 | | | — | |
| Total Rest of the World | | 11,546 | | | 7,594 | | | 153 | | | 9 | | | 19,302 | | | 2,277 | |
| | | | | | | | | | | | | | | | | | | |
| Total | | | | | | | | | | | | | | | | | | |
| Central and local government | | 8,737 | | | 53,568 | | | 361 | | | 1,729 | | | 64,395 | | | 1,555 | |
| Manufacturing | | 23,297 | | | 772 | | | 1,075 | | | 49 | | | 25,193 | | | 4,595 | |
| Construction | | 13,288 | | | 163 | | | 191 | | | 3 | | | 13,645 | | | 1,458 | |
| Finance | | 172,431 | | | 84,197 | | | 111,532 | | | 5,750 | | | 373,910 | | | 121,718 | |
| Service industries and business activities | | 80,844 | | | 5,699 | | | 2,818 | | | 778 | | | 90,139 | | | 5,313 | |
| Agriculture, forestry and fishing | | 3,365 | | | 63 | | | 3 | | | — | | | 3,431 | | | 99 | |
| Property | | 67,115 | | | 601 | | | 671 | | | 11 | | | 68,398 | | | 1,310 | |
| Individuals | | | | | | | | | | | | | | | | | | |
| Home mortgages | | 119,048 | | | — | | | 1 | | | — | | | 119,049 | | | — | |
| Other | | 44,793 | | | 861 | | | 29 | | | 58 | | | 45,741 | | | 61 | |
| Finance leases and instalment credit | | 17,835 | | | 5 | | | — | | | — | | | 17,840 | | | 189 | |
| Interest accruals | | 2,681 | | | 405 | | | — | | | — | | | 3,086 | | | 2 | |
| | | 553,434 | | | 146,334 | | | 116,681 | | | 8,378 | | | 824,827 | | | 136,300 | |
Notes:
| (1) | Includes settlement balances of £7,425 million. |
| | |
| (2) | This column shows the amount by which the Group’s credit risk exposure is reduced through arrangements, such as master netting agreements, which give the Group a legal right to set-off the financial asset against a financial liability due to the same counterparty. In addition, the Group holds collateral in respect of individual loans and advances to banks and to customers. This collateral includes mortgages over property (both personal and commercial); charges over business assets such as plant, inventories and trade debtors; and guarantees of lending from parties other than the borrower. The Group obtains collateral in the form of securities in reverse repurchase agreements. Cash and securities are received as collateral in respect of derivative transactions. |
Notes on the accounts continued
12 Past due and impaired financial assets
The following table shows the movement in the provision for impairment losses for loans and advances.
| | Group | |
| | Individually | | Collectively | | | | Total | | | | | |
| | assessed | | assessed | | Latent | | 2007 | | 2006 | | 2005 | |
| | | £m | | | £m | | | £m | | | £m | | | £m | | | £m | |
| At 1 January | | 697 | | | 2,645 | | | 593 | | | 3,935 | | | 3,887 | | | 4,174 | |
| Implementation of IAS 39 on 1 January 2005 | | — | | | — | | | — | | | — | | | — | | | (29 | ) |
| Currency translation and other adjustments | | 58 | | | 61 | | | 18 | | | 137 | | | (61 | ) | | 51 | |
| Acquisition of subsidiaries | | 952 | | | 907 | | | 351 | | | 2,210 | | | — | | | — | |
Amounts written-off(1) | | (525 | ) | | (1,646 | ) | | — | | | (2,171 | ) | | (1,841 | ) | | (2,040 | ) |
| Recoveries of amounts previously written-off | | 129 | | | 261 | | | — | | | 390 | | | 215 | | | 172 | |
| Charged to the income statement | | 274 | | | 1,744 | | | 88 | | | 2,106 | | | 1,877 | | | 1,703 | |
| Unwind of discount | | (28 | ) | | (138 | ) | | — | | | (166 | ) | | (142 | ) | | (144 | ) |
At 31 December(2) | | 1,557 | | | 3,834 | | | 1,050 | | | 6,441 | | | 3,935 | | | 3,887 | |
| | Notes: |
| | |
| (1) | Amounts written-off include £2 million in 2005 relating to loans and advances to banks. |
| | |
| (2) | Impairment losses at 31 December 2007 include £3 million relating to loans and advances to banks (2006 – £2 million; 2005 – £3 million). |
| | |
| (3) | There is no provision for impairment losses in the company. |
| | | Group | |
| | | 2007 | | 2006 | | 2005 | |
| Impairment losses charged to the income statement | | | £m | | | £m | | | £m | |
| Loans and advances to customers | | | 2,106 | | | 1,877 | | | 1,703 | |
| Debt securities | | | 20 | | | — | | | — | |
| Equity shares | | | 2 | | | 1 | | | 4 | |
| | | | 22 | | | 1 | | | 4 | |
| | | | 2,128 | | | 1,878 | | | 1,707 | |
| | | | | | | | | | | |
| | | 2007 | | 2006 | | 2005 | |
| Group | | | £m | | | £m | | | £m | |
| Gross income not recognised but which would have been recognised under the | | | | | | | | | | |
| original terms of non-accrual and restructured loans | | | | | | | | | | |
| Domestic | | | 390 | | | 370 | | | 334 | |
| Foreign | | | 155 | | | 77 | | | 62 | |
| | | | 545 | | | 447 | | | 396 | |
| | | | | | | | | | | |
| Interest on non-accrual and restructured loans included in net interest income | | | | | | | | | | |
| Domestic | | | 165 | | | 142 | | | 130 | |
| Foreign | | | 16 | | | 15 | | | 14 | |
| | | | 181 | | | 157 | | | 144 | |
The following table shows analysis of impaired financial assets.
| | | 2007 | | 2006 | |
| | | | | | | Net book | | | | | | Net book | |
| | | Cost | | Provision | | value | | Cost | | Provision | | value | |
| Group | | | £m | | | £m | | | £m | | | £m | | | £m | | | £m | |
| Impaired financial assets | | | | | | | | | | | | | | | | | | | |
Loans and advances to banks (1) | | | 25 | | | 3 | | | 22 | | | 2 | | | 2 | | | — | |
Loans and advances to customers (2) | | | 10,337 | | | 5,388 | | | 4,949 | | | 6,230 | | | 3,340 | | | 2,890 | |
Debt securities (1) | | | 5 | | | 4 | | | 1 | | | 3 | | | 3 | | | — | |
Equity shares (1) | | | 142 | | | 70 | | | 72 | | | 182 | | | 85 | | | 97 | |
| | | | 10,509 | | | 5,465 | | | 5,044 | | | 6,417 | | | 3,430 | | | 2,987 | |
| | Notes: |
| | |
| (1) | Impairment provisions individually assessed. |
| | |
| (2) | Impairment provisions individually assessed on balances of £3,178 million (2006 – £1,196 million). |
The Group holds collateral in respect of certain loans and advances to banks and to customers that are past due or impaired. Such collateral includes mortgages over property (both personal and commercial); charges over business assets such as plant, inventories and trade debtors; and guarantees of lending from parties other than the borrower.
The following table shows financial and non-financial assets, recognised on the Group's balance sheet, obtained during the year by taking possession of collateral or calling on other credit enhancements.
| | | 2007 | | | 2006 | |
| Group | | | £m | | | | £m | |
| Residential property | | | 32 | | | | 12 | |
| Other property | | | 8 | | | | — | |
| Cash | | | 18 | | | | 9 | |
| Other assets | | | 5 | | | | 3 | |
| | | | 63 | | | | 24 | |
In general, the Group seeks to dispose of property and other assets obtained by taking possession of collateral that are not readily convertible into cash as rapidly as the market for the individual asset permits.
The following loans and advances to customers were past due at the balance sheet date but not considered impaired:
| | | Group | |
| | | | | | | | | Past due | | | |
| | | Past due | | Past due | | Past due | | 90 days | | | |
| | | 1-29 days | | 30-59 days | | 60-89 days | | or more | | Total | |
| | | | £m | | | £m | | | £m | | | £m | | | £m | |
| 2007 | | | 8,768 | | | 2,745 | | | 1,354 | | | 369 | | | 13,236 | |
| | | | | | | | | | | | | | | | | |
| 2006 | | | 6,254 | | | 1,300 | | | 665 | | | 105 | | | 8,324 | |
These balances include loans and advances to customers that are past due through administrative and other delays in recording payments or in finalising documentation and other events unrelated to credit quality.
Loans that have been renegotiated in the past 12 months that would otherwise have been past due or impaired amounted to £930 million as at 31 December 2007 (2006 – £744 million).
Notes on the accounts continued
Companies in the Group transact derivatives as principal either as a trading activity or to manage balance sheet foreign exchange, interest rate and credit risk.
The Group enters into fair value hedges, cash flow hedges and hedges of net investments in foreign operations. Fair value hedges principally involve interest rate swaps hedging the interest rate risk in recognised financial assets and financial liabilities. Similarly, the majority of the Group’s cash flow hedges relate to exposure to variability in future interest payments and receipts on forecast transactions and on recognised financial assets and financial liabilities and hedged by interest rate swaps for periods of up to 25 years. The Group hedges its net investments in foreign operations with currency borrowings and forward foreign exchange contracts.
For cash flow hedge relationships of interest rate risk the hedged items are actual and forecast variable interest rate cash flows arising from financial assets and financial liabilities with interest rates linked to LIBOR, EURIBOR or the Bank of England Official Bank Rate. The financial assets are customer loans and the financial liabilities are customer deposits and LIBOR linked medium-term notes and other issued securities.
For cash flow hedging relationships, the initial and ongoing prospective effectiveness is assessed by comparing movements in the fair value of the expected highly probable forecast interest cash flows with movements in the fair value of the expected changes in cash flows from the hedging interest rate swap or by comparing the respective changes in the price value of a basis point. Prospective effectiveness is measured on a cumulative basis i.e. over the entire life of the hedge relationship. The method of calculating hedge ineffectiveness is the hypothetical derivative method. Retrospective effectiveness is assessed by comparing the actual movements in the fair value of the cash flows and actual movements in the fair value of the hedged cash flows from the interest rate swap over the life to date of the hedging relationship.
For fair value hedge relationships of interest rate risk the hedged items are typically large corporate fixed-rate loans, fixed-rate finance leases, fixed-rate medium-term notes or preference shares classified as debt. The initial and ongoing prospective effectiveness of fair value hedge relationships is assessed on a cumulative basis by comparing movements in the fair value of the hedged item attributable to the hedged risk with changes in the fair value of the hedging interest rate swap or by comparing the respective changes in the price value of a basis point. Retrospective effectiveness is assessed by comparing the actual movements in the fair value of the hedged items attributable to the hedged risk with actual movements in the fair value of the hedging derivative over the life to date of the hedging relationship.
| | Group | |
| | 2007 | | 2006 | |
| | Notional amounts | | Assets | | Liabilities | | Notional amounts | | Assets | | Liabilities | |
| | £bn | | | £m | | | £m | | £bn | | | £m | | | £m | |
| Exchange rate contracts | | | | | | | | | | | | | | | | |
| Spot, forwards and futures | | 2,134 | | | 29,829 | | | 29,629 | | | 1,158 | | | 11,290 | | | 11,806 | |
| Currency swaps | | 887 | | | 14,785 | | | 13,789 | | | 255 | | | 5,023 | | | 4,735 | |
| Options purchased | | 488 | | | 13,750 | | | — | | | 361 | | | 7,408 | | | — | |
| Options written | | 519 | | | — | | | 13,892 | | | 364 | | | — | | | 6,646 | |
| | | | | | | | | | | | | | | | | | | |
| Interest rate contracts | | | | | | | | | | | | | | | | | | |
| Interest rate swaps | | 24,798 | | | 202,478 | | | 201,487 | | | 12,038 | | | 76,671 | | | 78,979 | |
| Options purchased | | 4,084 | | | 30,681 | | | — | | | 1,763 | | | 10,852 | | | — | |
| Options written | | 3,640 | | | — | | | 31,199 | | | 1,589 | | | — | | | 10,489 | |
| Futures and forwards | | 3,164 | | | 807 | | | 987 | | | 1,823 | | | 285 | | | 328 | |
| | | | | | | | | | | | | | | | | | | |
| Credit derivatives | | 2,402 | | | 34,123 | | | 29,855 | | | 346 | | | 2,336 | | | 2,338 | |
| | | | | | | | | | | | | | | | | | | |
| Equity and commodity contracts | | 281 | | | 10,957 | | | 11,222 | | | 82 | | | 2,816 | | | 2,791 | |
| | | | | | 337,410 | | | 332,060 | | | | | | 116,681 | | | 118,112 | |
| | | | | | | | | | | | | | | | | | | |
| Included above are derivatives held for hedging purposes as follows: | | | | | | | | | | | | | | | | |
| | | | | | | | | | | | | | | | | | | |
| Fair value hedging: | | | | | | | | | | | | | | | | | | |
| Exchange rate contracts | | | | | 62 | | | 344 | | | | | | — | | | — | |
| Interest rate contracts | | | | | 1,598 | | | 1,062 | | | | | | 804 | | | 384 | |
| | | | | | | | | | | | | | | | | | | |
| Cash flow hedging: | | | | | | | | | | | | | | | | | | |
| Exchange rate contracts | | | | | 155 | | | 78 | | | | | | 41 | | | — | |
| Interest rate contracts | | | | | 738 | | | 1,014 | | | | | | 336 | | | 451 | |
| | | | | | | | | | | | | | | | | | | |
| Net investment hedging: | | | | | | | | | | | | | | | | | | |
| Exchange rate contracts | | | | | — | | | 211 | | | | | | — | | | — | |
| | | | | | | | | | | | | | | | | | | |
| Hedge ineffectiveness recognised in other operating income comprised: | | | | | | | | | | | | | | | | |
| | | | | | | | | | | 2007 | | 2006 | | 2005 | |
| | | | | | | | | | | | £m | | | £m | | | £m | |
| Fair value hedging: | | | | | | | | | | | | | | | | | | |
| Gains on the hedged items attributable to the hedged risk | | | | | | | | | 81 | | | 219 | | | 56 | |
| Losses on the hedging instruments | | | | | | | | | | | (87 | ) | | (215 | ) | | (80 | ) |
| Fair value ineffectiveness | | | | | | | | | | | (6 | ) | | 4 | | | (24 | ) |
| Cash flow hedging ineffectiveness | | | | | | | | | | | 9 | | | 4 | | | 12 | |
| | | | | | | | | | | | 3 | | | 8 | | | (12 | ) |
| | Company | |
| | 2007 | | 2006 | |
| | Notional amounts | | Assets | | Liabilities | | Notional amounts | | Assets | | Liabilities | |
| | £bn | | | £m | | | £m | | £bn | | | £m | | | £m | |
| Exchange contracts | | 13 | | | 154 | | | 178 | | | 1 | | | — | | | 42 | |
| Interest rate contracts | | 1 | | | 19 | | | 1 | | | — | | | — | | | — | |
| | | | | | 173 | | | 179 | | | | | | — | | | 42 | |
Included above are fair value hedging derivatives liabilities of £54 million (2006 – nil).
Notes on the accounts continued
| | Group | |
| | UK government | | US government, state and federal agency | | Other government | | US government sponsored entity | | Bank and building society | | Mortgage- backed securities(1) | | Corporate | | Other | | Total | |
| 2007 | | £m | | | £m | | | £m | | | £m | | | £m | | | £m | | | £m | | | £m | | | £m | |
| Held-for-trading | | 9,163 | | | 12,791 | | | 43,743 | | | 18,422 | | | 7,830 | | | 43,680 | | | 35,769 | | | 1,246 | | | 172,644 | |
| Designated as at fair value | | | | | | | | | | | | | | | | | | | | | | | | | | | |
| through profit or loss | | 2,235 | | | 397 | | | 101 | | | — | | | 154 | | | 330 | | | 2,125 | | | 435 | | | 5,777 | |
| Available-for-sale | | 1,030 | | | 6,867 | | | 33,840 | | | 5,830 | | | 11,835 | | | 23,680 | | | 6,505 | | | 5,747 | | | 95,334 | |
| Loans and receivables | | — | | | — | | | 1,988 | | | — | | | — | | | 612 | | | — | | | 72 | | | 2,672 | |
| | | 12,428 | | | 20,055 | | | 79,672 | | | 24,252 | | | 19,819 | | | 68,302 | | | 44,399 | | | 7,500 | | | 276,427 | |
| Available-for-sale | | | | | | | | | | | | | | | | | | | | | | | | | | | |
| Gross unrealised gains | | 29 | | | 14 | | | 56 | | | 3 | | | 12 | | | 15 | | | 22 | | | 1 | | | 152 | |
| Gross unrealised losses | | — | | | (62 | ) | | (276 | ) | | (66 | ) | | (42 | ) | | (115 | ) | | (22 | ) | | (10 | ) | | (593 | ) |
| | | | | | | | | | | | | | | | | | | | | | | | | | | | |
| 2006 | | | | | | | | | | | | | | | | | | | | | | | | | | | |
| Held-for-trading | | 8,122 | | | 10,965 | | | 13,839 | | | 10,065 | | | 34 | | | 28,658 | | | 23,194 | | | 315 | | | 95,192 | |
| Designated as at fair value | | | | | | | | | | | | | | | | | | | | | | | | | | | |
| through profit or loss | | 1,730 | | | — | | | 85 | | | — | | | 609 | | | 98 | | | 2,867 | | | 600 | | | 5,989 | |
| Available-for-sale | | 843 | | | 6,234 | | | 1,218 | | | 6,651 | | | 4,584 | | | 3,434 | | | 2,211 | | | 334 | | | 25,509 | |
| Loans and receivables | | — | | | — | | | — | | | — | | | — | | | — | | | 21 | | | 540 | | | 561 | |
| | | 10,695 | | | 17,199 | | | 15,142 | | | 16,716 | | | 5,227 | | | 32,190 | | | 28,293 | | | 1,789 | | | 127,251 | |
| Available-for-sale | | | | | | | | | | | | | | | | | | | | | | | | | | | |
| Gross unrealised gains | | — | | | 6 | | | 4 | | | 1 | | | 1 | | | 6 | | | 12 | | | — | | | 30 | |
| Gross unrealised losses | | (5 | ) | | (88 | ) | | (20 | ) | | (142 | ) | | (8 | ) | | (47 | ) | | (16 | ) | | (13 | ) | | (339 | ) |
| | Note: |
| | |
| (1) | Excludes securities issued by US federal agencies and government sponsored entities. |
The following tables analyse by issuer the Group’s available-for-sale debt securities by remaining maturity and the related yield (based on weighted averages).
| | Within 1 year | | After 1 but within 5 years | | After 5 but within 10 years | | After 10 years | | Total | |
| | Amount | | Yield | | Amount | | Yield | | Amount | | Yield | | Amount | | Yield | | Amount | | Yield | |
| 2007 | | £m | | % | | | £m | | % | | | £m | | % | | | £m | | % | | | £m | | % | |
| UK government | | 96 | | | 4.9 | | | 306 | | | 5.5 | | | 625 | | | 4.2 | | | 3 | | | 5.2 | | | 1,030 | | | 4.7 | |
| US government, state, and federal agency | | 99 | | | 4.6 | | | 167 | | | 4.9 | | | 1,431 | | | 4.2 | | | 5,170 | | | 5.2 | | | 6,867 | | | 5.0 | |
| Other government | | 11,933 | | | 3.8 | | | 12,515 | | | 5.3 | | | 7,262 | | | 4.0 | | | 2,130 | | | 4.3 | | | 33,840 | | | 4.4 | |
| US government sponsored entity | | — | | | — | | | — | | | — | | | 44 | | | 5.5 | | | 5,786 | | | 5.0 | | | 5,830 | | | 5.0 | |
| Bank and building society | | 9,023 | | | 5.3 | | | 1,795 | | | 4.4 | | | 445 | | | 3.3 | | | 572 | | | 3.8 | | | 11,835 | | | 5.0 | |
Mortgage-backed securities (1) | | 1,069 | | | 5.1 | | | 4,202 | | | 4.5 | | | 10,308 | | | 3.5 | | | 8,101 | | | 4.6 | | | 23,680 | | | 4.1 | |
| Corporate | | 1,616 | | | 3.7 | | | 3,119 | | | 5.3 | | | 1,357 | | | 4.7 | | | 413 | | | 4.7 | | | 6,505 | | | 4.7 | |
| Other | | 1,603 | | | 3.5 | | | 1,600 | | | 4.2 | | | 1,851 | | | 4.9 | | | 693 | | | 5.5 | | | 5,747 | | | 4.4 | |
| Total fair value | | 25,439 | | | 4.3 | | | 23,704 | | | 5.0 | | | 23,323 | | | 3.9 | | | 22,868 | | | 4.8 | | | 95,334 | | | 4.5 | |
| | | | | | | | | | | | | | | | | | | | | | | | | | | | | | | |
| 2006 | | | | | | | | | | | | | | | | | | | | | | | | | | | | | | |
| UK government | | 562 | | | 5.6 | | | 146 | | | 5.7 | | | 97 | | | 5.0 | | | 38 | | | 4.7 | | | 843 | | | 5.5 | |
| US government, state, and federal agency | | 11 | | | 4.8 | | | 627 | | | 4.8 | | | 22 | | | 4.7 | | | 5,574 | | | 5.1 | | | 6,234 | | | 5.1 | |
| Other government | | 180 | | | 2.6 | | | 822 | | | 3.7 | | | 213 | | | 1.1 | | | 3 | | | 3.9 | | | 1,218 | | | 3.1 | |
| US government sponsored entity | | — | | | — | | | 140 | | | 5.4 | | | 368 | | | 5.6 | | | 6,143 | | | 5.0 | | | 6,651 | | | 5.0 | |
| Bank and building society | | 2,427 | | | 5.1 | | | 1,368 | | | 4.8 | | | 28 | | | 5.4 | | | 761 | | | 6.9 | | | 4,584 | | | 5.3 | |
Mortgage-backed securities (1) | | 259 | | | 5.1 | | | 232 | | | 5.6 | | | 294 | | | 5.5 | | | 2,649 | | | 4.9 | | | 3,434 | | | 5.0 | |
| Corporate | | 360 | | | 3.9 | | | 1,256 | | | 4.5 | | | 413 | | | 4.7 | | | 182 | | | 4.6 | | | 2,211 | | | 4.4 | |
| Other | | 188 | | | 4.5 | | | 135 | | | 4.0 | | | 11 | | | 5.3 | | | — | | | — | | | 334 | | | 4.3 | |
| Total fair value | | 3,987 | | | 4.9 | | | 4,726 | | | 4.6 | | | 1,446 | | | 4.6 | | | 15,350 | | | 5.1 | | | 25,509 | | | 4.9 | |
| | Note: |
| | |
| (1) | Excludes securities issued by US federal agencies and government sponsored entities. |
The tables below show the fair value of available-for-sale debt securities that were in an unrealised loss position.
| | Less than 12 months | | More than 12 months | | Total | |
| | Fair value | | Gross unrealised losses | | Fair value | | Gross unrealised losses | | Fair value | | Gross unrealised losses | |
| 2007 | | £m | | | £m | | | £m | | | £m | | | £m | | | £m | |
| UK government | | — | | | — | | | 114 | | | — | | | 114 | | | — | |
| US government, state, and federal agency | | 2,704 | | | 38 | | | 2,146 | | | 24 | | | 4,850 | | | 62 | |
| Other government | | 18,802 | | | 275 | | | 655 | | | 1 | | | 19,457 | | | 276 | |
| US government sponsored entity | | 1,133 | | | 11 | | | 4,190 | | | 55 | | | 5,323 | | | 66 | |
| Bank and building society | | 715 | | | 26 | | | 671 | | | 16 | | | 1,386 | | | 42 | |
Mortgage-backed securities (1) | | 17,062 | | | 68 | | | 1,480 | | | 47 | | | 18,542 | | | 115 | |
| Corporate | | 1,053 | | | 11 | | | 542 | | | 11 | | | 1,595 | | | 22 | |
| Other | | 1,403 | | | 10 | | | — | | | — | | | 1,403 | | | 10 | |
| | | 42,872 | | | 439 | | | 9,798 | | | 154 | | | 52,670 | | | 593 | |
| | | | | | | | | | | | | | | | | | | |
| | | | | | | | | | | | | | | | | | | |
| 2006 | | | | | | | | | | | | | | | | | | |
| UK government | | 263 | | | 5 | | | — | | | — | | | 263 | | | 5 | |
| US government, state, and federal agency | | 829 | | | 10 | | | 4,215 | | | 78 | | | 5,044 | | | 88 | |
| Other government | | 63 | | | 3 | | | 633 | | | 17 | | | 696 | | | 20 | |
| US government sponsored entity | | 1,102 | | | 17 | | | 5,149 | | | 125 | | | 6,251 | | | 142 | |
| Bank and building society | | 2,245 | | | 3 | | | 268 | | | 5 | | | 2,513 | | | 8 | |
Mortgage-backed securities (1) | | 624 | | | 14 | | | 1,440 | | | 33 | | | 2,064 | | | 47 | |
| Corporate | | 827 | | | 14 | | | 62 | | | 2 | | | 889 | | | 16 | |
| Other | | 44 | | | 13 | | | — | | | — | | | 44 | | | 13 | |
| | | 5,997 | | | 79 | | | 11,767 | | | 260 | | | 17,764 | | | 339 | |
| | Note: |
| | |
| (1) | Excludes securities issued by US federal agencies and government sponsored entities. |
Gross gains of £60 million (2006 – £34 million) and gross losses of £12 million (2006 – £19 million) were realised on the sale of available-for-sale securities.
Interest receivable includes £2,197 million (2006 – £1,559 million; 2005 – £1,624 million) in respect of debt securities.
Notes on the accounts continued
| | Group | |
| | 2007 | | 2006 | |
| | Listed | | Unlisted | | Total | | Listed | | Unlisted | | Total | |
| | | £m | | | £m | | | £m | | | £m | | | £m | | | £m | |
| Held-for-trading | | 33,696 | | | 3,850 | | | 37,546 | | | 3,033 | | | 5 | | | 3,038 | |
| Designated as at fair value through profit or loss | | 1,856 | | | 6,010 | | | 7,866 | | | 2,051 | | | 559 | | | 2,610 | |
| Available-for-sale | | 5,622 | | | 1,992 | | | 7,614 | | | 6,367 | | | 1,489 | | | 7,856 | |
| | | 41,174 | | | 11,852 | | | 53,026 | | | 11,451 | | | 2,053 | | | 13,504 | |
| | | | | | | | | | | | | | | | | | | |
| | | | | | | | | | | | | | | | | | | |
| Available-for-sale | | | | | | | | | | | | | | | | | | |
| Gross unrealised gains | | 3,467 | | | 130 | | | 3,597 | | | 4,377 | | | 177 | | | 4,554 | |
| Gross unrealised losses | | (3 | ) | | (7 | ) | | (10 | ) | | — | | | (6 | ) | | (6 | ) |
Gross gains of £475 million (2006 – £357 million) and gross losses of £9 million (2006 – £3 million) were realised on the sale of available-for-sale equity shares.
Dividend income from available-for-sale equity shares was £137 million (2006 – £92 million; 2005 – £108 million).
The Group’s private equity investments are generally unquoted. They are held for capital appreciation over the medium term. In December 2007, the Group disposed of a significant proportion of its private equity portfolio to private equity funds managed by the Group.
Unquoted equity investments whose fair value cannot be reliably measured are carried at cost and classified as available-for-sale financial assets. They include capital stock (redeemable at cost) in the Federal Home Loans Bank and the Federal Reserve Bank of £0.5 billion (2006 – £0.8 billion) that the Group’s banking subsidiaries in the US are required to hold; and a number of individually small shareholdings in unlisted companies. Disposals in the year generated gains of £0.5 million (2006 – £56 million; 2005 – £85 million) based on cost of sales of £4 million (2006 – £14 million; 2005 – £17 million).
16 Investments in Group undertakings
Investments in Group undertakings are carried at cost less impairment. Movements during the year were as follows:
| | | Company | |
| | | 2007 | | 2006 | |
| | | | £m | | | £m | |
| At 1 January | | | 21,784 | | | 20,851 | |
| Currency translation and other adjustments | | | 535 | | | (164 | ) |
| Additions | | | 17,566 | | | — | |
| Disposals | | | (6 | ) | | — | |
| Additional investments in Group undertakings | | | 3,663 | | | 1,097 | |
| At 31 December | | | 43,542 | | | 21,784 | |
The principal subsidiary undertakings of the company are shown below. Their capital consists of ordinary and preference shares which are unlisted with the exception of certain preference shares issued by NatWest. The Royal Bank of Scotland plc, RBS Insurance Group Limited and RFS Holdings B.V. are directly owned by the company, and all of the other subsidiary undertakings are owned directly, or indirectly through intermediate holding companies, by these companies. All of these subsidiaries are included in the Group’s consolidated financial statements and have an accounting reference date of 31 December.
| | Nature of business | Country of incorporation and principal area of operation | | Group interest | |
| The Royal Bank of Scotland plc | Banking | Great Britain | | | 100% | |
National Westminster Bank Plc (1) | Banking | Great Britain | | | 100% | |
| Citizens Financial Group, Inc. | Banking | US | | | 100% | |
Coutts & Co (2) | Private banking | Great Britain | | | 100% | |
| Greenwich Capital Markets, Inc. | Broker dealer | US | | | 100% | |
| RBS Insurance Group Limited | Insurance | Great Britain | | | 100% | |
Ulster Bank Limited (3) | Banking | Northern Ireland | | | 100% | |
ABN AMRO Bank N.V. (4) | Banking | The Netherlands | | | 38% | |
| | Notes: |
| | |
| (1) | The company does not hold any of the NatWest preference shares in issue. |
| | |
| (2) | Coutts & Co is incorporated with unlimited liability. Its registered office is 440 Strand, London WC2R 0QS. |
| | |
| (3) | Ulster Bank Limited and its subsidiaries also operate in the Republic of Ireland. |
| | |
| (4) | RFS Holdings B.V. (RFS) owns 99% of the outstanding shares of ABN AMRO Holding N.V. (ABN AMRO). The company owns 38% of RFS; the balance of shares is held by Fortis N.V., Fortis SA/NV, and Banco Santander S.A. (the consortium banks). Although the company does not control a majority of the voting rights in RFS, through the terms of the Consortium and Shareholders’ Agreement and RFS’s Articles of Association, it controls the board of RFS and RFS is a subsidiary of the company. The capital and income rights of shares issued by RFS are linked to the net assets and income of the ABN AMRO business units which the individual consortium banks have agreed to acquire. |
The above information is provided in relation to the principal related undertakings as permitted by Section 231(5) of the Companies Act 1985. Full information on all related undertakings will be included in the Annual Return delivered to the Registrar of Companies for Scotland.
Notes on the accounts continued
| | Group | |
| | | | Core | | Other | | Internally | | | |
| | | | deposit | | purchased | | generated | | | |
| | Goodwill | | intangibles | | intangibles | | software | | Total | |
| 2007 | | £m | | | £m | | | £m | | | £m | | | £m | |
| Cost: | | | | | | | | | | | | | | | |
| At 1 January 2007 | | 17,889 | | | 265 | | | 275 | | | 2,642 | | | 21,071 | |
| Currency translation and other adjustments | | 1,199 | | | 98 | | | 136 | | | 48 | | | 1,481 | |
| Acquisition of subsidiaries | | 23,321 | | | 1,842 | | | 2,452 | | | 717 | | | 28,332 | |
| Additions | | — | | | — | | | 6 | | | 481 | | | 487 | |
| Impairment of goodwill | | (40 | ) | | — | | | — | | | — | | | (40 | ) |
| Disposals and write-off of fully amortised assets | | — | | | — | | | (3 | ) | | (84 | ) | | (87 | ) |
| At 31 December 2007 | | 42,369 | | | 2,205 | | | 2,866 | | | 3,804 | | | 51,244 | |
| | | | | | | | | | | | | | | | |
| Accumulated amortisation: | | | | | | | | | | | | | | | |
| At 1 January 2007 | | — | | | 127 | | | 97 | | | 1,943 | | | 2,167 | |
| Currency translation and other adjustments | | — | | | 1 | | | 3 | | | 3 | | | 7 | |
| Disposals and write-off of fully amortised assets | | — | | | — | | | (1 | ) | | (80 | ) | | (81 | ) |
| Charge for the year | | — | | | 110 | | | 124 | | | 425 | | | 659 | |
| At 31 December 2007 | | — | | | 238 | | | 223 | | | 2,291 | | | 2,752 | |
| | | | | | | | | | | | | | | | |
| Net book value at 31 December 2007 | | 42,369 | | | 1,967 | | | 2,643 | | | 1,513 | | | 48,492 | |
| | | | | | | | | | | | | | | | |
| 2006 | | | | | | | | | | | | | | | |
| Cost: | | | | | | | | | | | | | | | |
| At 1 January 2006 | | 18,823 | | | 299 | | | 325 | | | 2,294 | | | 21,741 | |
| Currency translation and other adjustments | | (924 | ) | | (34 | ) | | (47 | ) | | (1 | ) | | (1,006 | ) |
| Additions | | — | | | — | | | 19 | | | 382 | | | 401 | |
| Disposal of subsidiaries | | (10 | ) | | — | | | (1 | ) | | — | | | (11 | ) |
| Disposals and write-off of fully amortised assets | | — | | | — | | | (21 | ) | | (33 | ) | | (54 | ) |
| At 31 December 2006 | | 17,889 | | | 265 | | | 275 | | | 2,642 | | | 21,071 | |
| | | | | | | | | | | | | | | | |
| Accumulated amortisation: | | | | | | | | | | | | | | | |
| At 1 January 2006 | | — | | | 85 | | | 64 | | | 1,660 | | | 1,809 | |
| Currency translation and other adjustments | | — | | | (12 | ) | | (7 | ) | | — | | | (19 | ) |
| Disposals and write-off of fully amortised assets | | — | | | — | | | — | | | (8 | ) | | (8 | ) |
| Charge for the year | | — | | | 54 | | | 40 | | | 291 | | | 385 | |
| At 31 December 2006 | | — | | | 127 | | | 97 | | | 1,943 | | | 2,167 | |
| | | | | | | | | | | | | | | | |
| Net book value at 31 December 2006 | | 17,889 | | | 138 | | | 178 | | | 699 | | | 18,904 | |
Impairment review
The Group’s goodwill acquired in business combinations is reviewed annually at 30 September for impairment by comparing the recoverable amount of each cash generating unit (CGU) to which goodwill has been allocated with its carrying value.
The Group recognised goodwill of £23.3 billion following the preliminary allocation of fair values since acquiring ABN AMRO on 17 October 2007 (Note 35). Subsequent events have not significantly affected the assumptions and estimates supporting the consortium’s investment decision and the Group has therefore concluded that there is no impairment of the goodwill recognised at 31 December 2007.
Other CGUs where goodwill is significant were as follows:
| | | Goodwill at 30 September | |
| | | 2007 | | 2006 | |
| | Recoverable amount based on: | | £m | | | £m | |
| Global Banking & Markets | Fair value less costs to sell | | 2,346 | | | 2,341 | |
| UK Corporate Banking | Fair value less costs to sell | | 1,630 | | | 1,630 | |
| Retail | Fair value less costs to sell | | 4,278 | | | 4,365 | |
| Wealth Management | Fair value less costs to sell | | 1,100 | | | 1,105 | |
| RBS Insurance | Fair value less costs to sell | | 1,064 | | | 1,069 | |
| Citizens – Retail Banking | Value in use | | 2,067 | | | — | |
| Citizens – Commercial Banking | Value in use | | 2,274 | | | — | |
| Citizens – Consumer Financial Services | Value in use | | 1,701 | | | — | |
| Citizens – Midstates | Value in use | | — | | | 5,598 | |
The recoverable amounts for all CGUs, except for Citizens were based on fair value less costs to sell. Fair value was based upon a price-earnings methodology using current earnings for each unit. Approximate price earnings multiples, validated against independent analyst information were applied to each CGU. The multiples used for both 2007 and 2006 were in the range 9.5 – 13.0 times earnings after charging manufacturing costs.
The goodwill allocated to Global Banking & Markets, UK Corporate Banking, Retail and Wealth Management principally arose from the acquisition of NatWest in 2000. The recoverable amount of these cash generating units exceeds their carrying value by over £15 billion. The goodwill allocated to RBS Insurance principally arose from the acquisition of Churchill in 2003. The recoverable amount for RBS Insurance exceeds the carrying value by over £1.5 billion. The multiples or earnings would have to be less than one third of those used to cause the value in use of the units to equal their carrying value.
Further developments in the Group’s US businesses have led to divisionalisation on a product basis instead of the geographical basis used in 2006. The recoverable amount was based on a value in use methodology using management forecasts to 2012 (2006 – 2014). A terminal growth rate of 5% (2006 – 5%) and a discount rate of 11% (2006 – 10%) was used. The recoverable amount of Citizens exceeds its carrying value by over $5 billion. The profit growth rate would have to be approximately half the projected rate to cause the value in use of the unit to equal its carrying amount.
Notes on the accounts continued
18 Property, plant and equipment
| | Group | |
| | Investment properties | | Freehold premises | | Long leasehold premises | | Short leasehold premises | | Computers and other equipment | | Operating lease assets | | Total | |
| 2007 | | £m | | | £m | | | £m | | | £m | | | £m | | | £m | | | £m | |
| Cost or valuation: | | | | | | | | | | | | | | | | | | | | | |
| At 1 January 2007 | | 4,885 | | | 2,579 | | | 310 | | | 1,254 | | | 3,069 | | | 11,589 | | | 23,686 | |
| Currency translation and other adjustments | | 96 | | | 65 | | | 1 | | | 11 | | | 12 | | | (10 | ) | | 175 | |
| Acquisition of subsidiaries | | — | | | 955 | | | — | | | 157 | | | 191 | | | 202 | | | 1,505 | |
| Reclassifications | | 3 | | | (4 | ) | | 3 | | | 1 | | | (3 | ) | | — | | | — | |
| Additions | | 450 | | | 592 | | | 34 | | | 309 | | | 857 | | | 2,791 | | | 5,033 | |
| Transfers to disposal groups | | — | | | (4 | ) | | (13 | ) | | — | | | — | | | (422 | ) | | (439 | ) |
| Expenditure on investment properties | | 41 | | | — | | | — | | | — | | | — | | | — | | | 41 | |
| Change in fair value of investment properties | | 288 | | | — | | | — | | | — | | | — | | | — | | | 288 | |
| Disposals and write-off of fully depreciated assets | | (2,332 | ) | | (533 | ) | | (120 | ) | | (44 | ) | | (197 | ) | | (2,713 | ) | | (5,939 | ) |
| At 31 December 2007 | | 3,431 | | | 3,650 | | | 215 | | | 1,688 | | | 3,929 | | | 11,437 | | | 24,350 | |
| | | | | | | | | | | | | | | | | | | | | | |
| Accumulated depreciation and amortisation: | | | | | | | | | | | | | | | | | | | | | |
| At 1 January 2007 | | — | | | 446 | | | 96 | | | 374 | | | 1,670 | | | 2,680 | | | 5,266 | |
| Currency translation and other adjustments | | — | | | (4 | ) | | — | | | (1 | ) | | (1 | ) | | 2 | | | (4 | ) |
| Transfers to disposal groups | | — | | | — | | | — | | | — | | | — | | | (52 | ) | | (52 | ) |
| Reclassifications | | — | | | (2 | ) | | 2 | | | — | | | — | | | — | | | — | |
| Disposals and write-off of fully depreciated assets | | — | | | (122 | ) | | (32 | ) | | (25 | ) | | (132 | ) | | (610 | ) | | (921 | ) |
| Charge for the year | | — | | | 73 | | | 8 | | | 88 | | | 415 | | | 727 | | | 1,311 | |
| At 31 December 2007 | | — | | | 391 | | | 74 | | | 436 | | | 1,952 | | | 2,747 | | | 5,600 | |
| | | | | | | | | | | | | | | | | | | | | | |
| Net book value at 31 December 2007 | | 3,431 | | | 3,259 | | | 141 | | | 1,252 | | | 1,977 | | | 8,690 | | | 18,750 | |
| | | | | | | | | | | | | | | | | | | | | | |
| 2006 | | | | | | | | | | | | | | | | | | | | | |
| Cost or valuation: | | | | | | | | | | | | | | | | | | | | | |
| At 1 January 2006 | | 4,347 | | | 2,681 | | | 338 | | | 1,045 | | | 3,310 | | | 11,569 | | | 23,290 | |
| Currency translation and other adjustments | | 14 | | | (38 | ) | | (1 | ) | | (29 | ) | | (98 | ) | | (587 | ) | | (739 | ) |
| Reclassifications | | — | | | (6 | ) | | (9 | ) | | 12 | | | — | | | 3 | | | — | |
| Additions | | 632 | | | 295 | | | 26 | | | 266 | | | 553 | | | 2,551 | | | 4,323 | |
| Expenditure on investment properties | | 16 | | | — | | | — | | | — | | | — | | | — | | | 16 | |
| Change in fair value of investment properties | | 486 | | | — | | | — | | | — | | | — | | | — | | | 486 | |
| Disposals and write-off of fully depreciated assets | | (610 | ) | | (353 | ) | | (44 | ) | | (40 | ) | | (693 | ) | | (1,947 | ) | | (3,687 | ) |
| Disposals of subsidiaries | | — | | | — | | | — | | | — | | | (3 | ) | | — | | | (3 | ) |
| At 31 December 2006 | | 4,885 | | | 2,579 | | | 310 | | | 1,254 | | | 3,069 | | | 11,589 | | | 23,686 | |
| | | | | | | | | | | | | | | | | | | | | | |
| Accumulated depreciation and amortisation: | | | | | | | | | | | | | | | | | | | | | |
| At 1 January 2006 | | — | | | 390 | | | 121 | | | 319 | | | 1,891 | | | 2,516 | | | 5,237 | |
| Currency translation and other adjustments | | — | | | (2 | ) | | — | | | (11 | ) | | (41 | ) | | (95 | ) | | (149 | ) |
| Reclassifications | | — | | | 4 | | | (7 | ) | | 3 | | | — | | | — | | | — | |
| Disposals and write-off of fully depreciated assets | | — | | | (5 | ) | | (26 | ) | | (15 | ) | | (539 | ) | | (528 | ) | | (1,113 | ) |
| Disposals of subsidiaries | | — | | | — | | | — | | | — | | | (2 | ) | | — | | | (2 | ) |
| Charge for the year | | — | | | 59 | | | 8 | | | 78 | | | 361 | | | 787 | | | 1,293 | |
| At 31 December 2006 | | — | | | 446 | | | 96 | | | 374 | | | 1,670 | | | 2,680 | | | 5,266 | |
| | | | | | | | | | | | | | | | | | | | | | |
| Net book value at 31 December 2006 | | 4,885 | | | 2,133 | | | 214 | | | 880 | | | 1,399 | | | 8,909 | | | 18,420 | |
| | 2007 | | 2006 | |
| | | £m | | | £m | |
| Contracts for future capital expenditure not provided for in the accounts | | | | | | |
| at the year end (excluding investment properties and operating lease assets) | | 201 | | | 117 | |
| Contractual obligations to purchase, construct or develop investment | | | | | | |
| properties or to repair, maintain or enhance investment properties | | 9 | | | 6 | |
| Property, plant and equipment pledged as security | | 935 | | | 1,222 | |
Investment properties are valued to reflect fair value, that is, the market value of the Group’s interest at the reporting date excluding any special terms or circumstances relating to the use or financing of the property and transaction costs that would be incurred in making a sale. Observed market data such as rental yield, replacement cost and useful life, reflect relatively few transactions involving property that, necessarily, is not identical to property owned by the Group.
Valuations are carried out by qualified surveyors who are members of the Royal Institution of Chartered Surveyors, or an equivalent overseas body. The valuation as at 31 December 2007 for a significant majority of the Group’s investment properties was undertaken by external valuers.
The fair value of investment properties includes £234 million (2006 – £451 million) of appreciation since purchase.
Rental income from investment properties was £300 million (2006 – £278 million; 2005 – £250 million). Direct operating expenses of investment properties were £49 million (2006 –£54 million; 2005 – £61 million).
Property, plant and equipment, excluding investment properties, include £717 million (2006 – £607 million) assets in the course of construction.
Freehold and long leasehold properties with a net book value of £451 million (2006 – £164 million; 2005 – £63 million) were sold subject to operating leases.
19 Prepayments, accrued income and other assets
| | Group | | Company | |
| | 2007 | | 2006 | | 2007 | | 2006 | |
| | | £m | | | £m | | | £m | | | £m | |
| Prepayments | | 2,187 | | | 946 | | | — | | | — | |
| Accrued income | | 1,214 | | | 668 | | | — | | | — | |
| Deferred expenses | | 385 | | | 367 | | | — | | | — | |
| Deferred tax asset | | 2,944 | | | 156 | | | — | | | 3 | |
| Pension schemes in net surplus | | 836 | | | — | | | — | | | — | |
| Other assets | | 11,500 | | | 5,999 | | | 127 | | | — | |
| | | 19,066 | | | 8,136 | | | 127 | | | 3 | |
Notes on the accounts continued
20 Settlement balances and short positions
| | Group | |
| | 2007 | | 2006 | |
| | | £m | | | £m | |
| Settlement balances (amortised cost) | | 17,520 | | | 5,667 | |
| Short positions (held-for-trading): | | | | | | |
| Debt securities – Government | | 40,376 | | | 36,901 | |
| – Other issuers | | 25,310 | | | 5,843 | |
| Treasury and other eligible bills | | 672 | | | 654 | |
| Equity shares | | 7,143 | | | 411 | |
| | | 91,021 | | | 49,476 | |
21 Accruals, deferred income and other liabilities
| | Group | | Company | |
| | 2007 | | 2006 | | 2007 | | 2006 | |
| | | £m | | | £m | | | £m | | | £m | |
| Notes in circulation | | 1,545 | | | 1,453 | | | — | | | — | |
| Current taxation | | 1,630 | | | 789 | | | — | | | — | |
| Accruals | | 8,193 | | | 4,412 | | | — | | | — | |
| Deferred income | | 6,289 | | | 3,377 | | | — | | | — | |
Other liabilities (1) | | 16,367 | | | 5,629 | | | 8 | | | 15 | |
| | | 34,024 | | | 15,660 | | | 8 | | | 15 | |
| | Note: |
| | |
| (1) | Other liabilities include £9 million (2006 – £10 million) in respect of share-based compensation. |
Included in other liabilities are provisions for liabilities and charges as follows:
| | | Group | |
| | | | £m | |
| At 1 January 2007 | | | 200 | |
| Currency translation and other movements | | | (5 | ) |
| Acquisition of subsidiaries | | | 39 | |
| Charge to income statement | | | 184 | |
| Releases to income statement | | | (39 | ) |
| Provisions utilised | | | (211 | ) |
| At 31 December 2007 | | | 168 | |
| | Note: |
| | |
| (1) | Comprises property provisions and other provisions arising in the normal course of business. |
Provision for deferred taxation has been made as follows:
| | Group | | Company | |
| | 2007 | | 2006 | | 2007 | | 2006 | |
| | | £m | | | £m | | | £m | | | £m | |
| Deferred tax liability | | 5,510 | | | 3,264 | | | 3 | | | — | |
| Deferred tax asset (included in Prepayments, accrued income and other assets, Note 19) | | (2,944 | ) | | (156 | ) | | — | | | (3 | ) |
| Net deferred tax | | 2,566 | | | 3,108 | | | 3 | | | (3 | ) |
| | Group | |
| | Pension | | Accelerated capital allowances | | Provisions | | Deferred gains | | IAS transition | | Fair value of financial instruments | | Intangibles | | Cash flow hedging | | Tax losses carried forward | | Other | | Total | |
| | | £m | | | £m | | | £m | | | £m | | | £m | | | £m | | | £m | | | £m | | | £m | | | £m | | | £m | |
| At 1 January 2006 | | (1,182 | ) | | 3,653 | | | (664 | ) | | 121 | | | (327 | ) | | (108 | ) | | 148 | | | (45 | ) | | — | | | (57 | ) | | 1,539 | |
| Charge to income statement | | 57 | | | 254 | | | 360 | | | 131 | | | (365 | ) | | (34 | ) | | 127 | | | (1 | ) | | — | | | (30 | ) | | 499 | |
| Charge to equity directly | | 519 | | | — | | | — | | | 666 | | | (2 | ) | | 2 | | | — | | | (41 | ) | | — | | | (14 | ) | | 1,130 | |
| Other | | (22 | ) | | (89 | ) | | 20 | | | 4 | | | 25 | | | 8 | | | (20 | ) | | (10 | ) | | — | | | 24 | | | (60 | ) |
| At 1 January 2007 | | (628 | ) | | 3,818 | | | (284 | ) | | 922 | | | (669 | ) | | (132 | ) | | 255 | | | (97 | ) | | — | | | (77 | ) | | 3,108 | |
| Acquisition/(disposals) | | | | | | | | | | | | | | | | | | | | | | | | | | | | | | | | | |
| of subsidiaries | | (35 | ) | | (284 | ) | | (539 | ) | | 50 | | | — | | | (184 | ) | | 1,076 | | | — | | | (867 | ) | | 83 | | | (700 | ) |
| Charge to income statement | | 43 | | | (138 | ) | | (44 | ) | | (141 | ) | | 46 | | | 72 | | | (65 | ) | | (48 | ) | | (57 | ) | | 99 | | | (233 | ) |
| Charge to equity directly | | 660 | | | — | | | — | | | (187 | ) | | — | | | 17 | | | — | | | (107 | ) | | — | | | 43 | | | 426 | |
| Other | | (2 | ) | | (12 | ) | | (19 | ) | | (38 | ) | | 4 | | | (6 | ) | | 28 | | | — | | | 20 | | | (10 | ) | | (35 | ) |
| At 31 December 2007 | | 38 | | | 3,384 | | | (886 | ) | | 606 | | | (619 | ) | | (233 | ) | | 1,294 | | | (252 | ) | | (904 | ) | | 138 | | | 2,566 | |
| | Company * | |
| | | £m | |
| At 1 January 2006, 31 December 2006 and 1 January 2007 | | (3 | ) |
| Charge to equity directly | | 6 | |
| At 31 December 2007 | | 3 | |
* All relates to hedging.
| | Notes: |
| | |
| (1) | Deferred tax assets of £687 million (2006 – £86 million) have not been recognised in respect of tax losses carried forward of £2,043 million (2006 – £254 million) as it is not considered probable that taxable profits will arise against which they could be utilised. Of these losses, £75 million will expire within one year, £238 million within five years and £1,376 million thereafter. The balance of tax losses carried forward has no time limit. |
| | |
| (2) | Deferred tax liabilities of £977 million (2006 – £649 million) have not been recognised in respect of retained earnings of overseas subsidiaries and held-over gains on the incorporation of overseas branches. Retained earnings of overseas subsidiaries are expected to be reinvested indefinitely or remitted to the UK free from further taxation. No taxation is expected to arise in the foreseeable future in respect of held-over gains. |
Notes on the accounts continued
| | Group | |
| | 2007 | | 2006 | |
| | | £m | | | £m | |
| Life assurance business: | | | | | | |
| Unit linked insurance contracts | | 364 | | | 379 | |
| Other linked insurance contracts | | 4,034 | | | 1,334 | |
| Other insurance contracts | | 298 | | | 496 | |
| | | 4,696 | | | 2,209 | |
| General insurance business | | 5,466 | | | 5,247 | |
| | | 10,162 | | | 7,456 | |
General insurance business
(i) Claims and loss adjustment expenses
| | Group | |
| | Gross | | Reinsurance | | Net | |
| | | £m | | | £m | | | £m | |
| Notified claims | | 3,465 | | | (208 | ) | | 3,257 | |
| Incurred but not reported | | 1,448 | | | (140 | ) | | 1,308 | |
| At 1 January 2006 | | 4,913 | | | (348 | ) | | 4,565 | |
| Cash paid for claims settled in the year | | (3,687 | ) | | 106 | | | (3,581 | ) |
| Increase/(decrease) in liabilities | | | | | | | | | |
| – arising from current year claims | | 4,267 | | | (53 | ) | | 4,214 | |
| – arising from prior year claims | | (242 | ) | | 4 | | | (238 | ) |
| Net exchange differences | | (4 | ) | | — | | | (4 | ) |
| At 31 December 2006 | | 5,247 | | | (291 | ) | | 4,956 | |
| | | | | | | | | | |
| Notified claims | | 3,735 | | | (205 | ) | | 3,530 | |
| Incurred but not reported | | 1,512 | | | (86 | ) | | 1,426 | |
| At 1 January 2007 | | 5,247 | | | (291 | ) | | 4,956 | |
| Cash paid for claims settled in the year | | (3,876 | ) | | 94 | | | (3,782 | ) |
| Increase/(decrease) in liabilities | | | | | | | | | |
| – arising from current year claims | | 4,643 | | | (49 | ) | | 4,594 | |
| – arising from prior year claims | | (573 | ) | | (20 | ) | | (593 | ) |
| Net exchange differences | | 25 | | | 3 | | | 28 | |
| At 31 December 2007 | | 5,466 | | | (263 | ) | | 5,203 | |
| | | | | | | | | | |
| Notified claims | | 3,894 | | | (264 | ) | | 3,630 | |
| Incurred but not reported | | 1,572 | | | 1 | | | 1,573 | |
| At 31 December 2007 | | 5,466 | | | (263 | ) | | 5,203 | |
(ii) Provisions for unearned premiums and unexpired short-term insurance risks
| | Group | |
| | Gross | | Reinsurance | | Net | |
| Unearned premium provision | | £m | | | £m | | | £m | |
| At 1 January 2006 | | 2,883 | | | (27 | ) | | 2,856 | |
| Increase in the year | | — | | | (16 | ) | | (16 | ) |
| Release in the year | | (33 | ) | | — | | | (33 | ) |
| At 1 January 2007 | | 2,850 | | | (43 | ) | | 2,807 | |
| Release in the year | | (98 | ) | | 2 | | | (96 | ) |
| At 31 December 2007 | | 2,752 | | | (41 | ) | | 2,711 | |
| | Group | |
| | 2007 | | 2006 | |
| Gross performance of life business (life contracts) | | £m | | | £m | |
| Opening net assets | | 579 | | | 707 | |
| Transfer to shareholders funds | | — | | | (185 | ) |
| Profit from existing business: | | | | | | |
| Expected return | | 35 | | | 26 | |
| Experience variances | | (23 | ) | | (3 | ) |
| | | 12 | | | 23 | |
New business contribution (1) | | 5 | | | 12 | |
| Operating assumption changes | | 6 | | | 5 | |
| Investment return variances | | (14 | ) | | 1 | |
| Economic assumption changes | | — | | | (1 | ) |
| Other | | 16 | | | 17 | |
| Closing net assets | | 604 | | | 579 | |
| | Note: |
| | |
| (1) | New business contribution represents the present value of future profits on new insurance contract business written during the year. |
| | Group | |
| | Life | | Investment | |
| | contracts | | contracts | |
| Movement in provision for liabilities under life contracts and under linked and other investment contracts | | £m | | | £m | |
| At 1 January 2006 | | 2,299 | | | 2,296 | |
| Premiums received | | 588 | | | 83 | |
| Fees and expenses | | (30 | ) | | (19 | ) |
| Investment return | | 235 | | | 182 | |
| Actuarial adjustments | | (454 | ) | | — | |
| Account balances paid on surrender and other terminations in the year | | (429 | ) | | (296 | ) |
| At 1 January 2007 | | 2,209 | | | 2,246 | |
| Acquisition of subsidiaries | | 2,275 | | | 3,245 | |
| Premiums received | | 784 | | | 140 | |
| Fees and expenses | | (30 | ) | | (25 | ) |
| Investment return | | 251 | | | 93 | |
| Actuarial adjustments | | (493 | ) | | — | |
| Account balances paid on surrender and other terminations in the year | | (468 | ) | | (320 | ) |
| Exchange and other adjustments | | 168 | | | 176 | |
| At 31 December 2007 | | 4,696 | | | 5,555 | |
Investment contracts are presented within customer deposits.
Changes in assumptions during the year were not material to the profit recognised.
| | Group | |
| | 2007 | | 2006 | |
| Assets backing linked liabilities | | £m | | | £m | |
| Debt securities | | 2,899 | | | 1,540 | |
| Equity securities | | 6,863 | | | 2,243 | |
| Cash and cash equivalents | | 68 | | | 76 | |
| | | | | | | |
| The associated liabilities are: | | | | | | |
| Linked contracts classified as insurance contracts | | 4,398 | | | 1,713 | |
| Linked contracts classified as investment contracts | | 5,432 | | | 2,146 | |
There are no options and guarantees relating to life assurance contracts that could in aggregate have a material effect on the amount, timing and uncertainty of the Group’s future cash flows.
Notes on the accounts continued
24 Subordinated liabilities
| | Group | | Company | |
| | 2007 | | 2006 | | 2007 | | 2006 | |
| | | £m | | | £m | | | £m | | | £m | |
| Dated loan capital | | 23,065 | | | 13,772 | | | 5,585 | | | 5,531 | |
| Undated loan capital | | 9,866 | | | 9,555 | | | 781 | | | 834 | |
| Preference shares | | 1,686 | | | 2,277 | | | 1,377 | | | 1,829 | |
| Trust preferred securities | | 3,362 | | | 2,050 | | | — | | | — | |
| | | 37,979 | | | 27,654 | | | 7,743 | | | 8,194 | |
Certain preference shares issued by the company are classified as liabilities; these securities remain subject to the capital maintenance rules of the Companies Act 1985.
The following tables analyse the remaining maturity of subordinated liabilities by (1) the final redemption date; and (2) the next callable date.
| | Group | |
| | | 2008 | | 2009 | | | 2010-2012 | | | 2013-2017 | | Thereafter | | Perpetual | | Total | |
| 2007 – final redemption | | | £m | | | £m | | | £m | | | £m | | | £m | | | £m | | | £m | |
| Sterling | | | 194 | | | — | | | 34 | | | 1,405 | | | 389 | | | 5,818 | | | 7,840 | |
| US$ | | | 874 | | | 1,505 | | | 620 | | | 5,477 | | | 743 | | | 3,985 | | | 13,204 | |
| Euro | | | 764 | | | 1,312 | | | 1,405 | | | 5,711 | | | 1,674 | | | 3,164 | | | 14,030 | |
| Other | | | 35 | | | — | | | 6 | | | 2,076 | | | 325 | | | 463 | | | 2,905 | |
| Total | | | 1,867 | | | 2,817 | | | 2,065 | | | 14,669 | | | 3,131 | | | 13,430 | | | 37,979 | |
| | | |
| | | |
| | Group | |
| | Currently | | 2008 | | 2009 | | | 2010-2012 | | | 2013-2017 | | Thereafter | | Perpetual | | Total | |
| 2007 – call date | | £m | | | £m | | | £m | | | £m | | | £m | | | £m | | | £m | | | £m | |
| Sterling | | — | | | 194 | | | — | | | 1,497 | | | 2,456 | | | 3,527 | | | 166 | | | 7,840 | |
| US$ | | 1,347 | | | 1,463 | | | 2,550 | | | 4,485 | | | 1,678 | | | 1,681 | | | — | | | 13,204 | |
| Euro | | — | | | 1,612 | | | 1,685 | | | 4,992 | | | 5,091 | | | 611 | | | 39 | | | 14,030 | |
| Other | | — | | | 35 | | | 431 | | | 843 | | | 1,468 | | | 128 | | | — | | | 2,905 | |
| Total | | 1,347 | | | 3,304 | | | 4,666 | | | 11,817 | | | 10,693 | | | 5,947 | | | 205 | | | 37,979 | |
| | | |
| | | |
| | Group | |
| | | | 2007 | | 2008 | | | 2009-2011 | | | 2012-2016 | | Thereafter | | Perpetual | | Total | |
| 2006 – final redemption | | | | £m | | | £m | | | £m | | | £m | | | £m | | | £m | | | £m | |
| Sterling | | | | 352 | | | — | | | — | | | 772 | | | 391 | | | 5,960 | | | 7,475 | |
| US$ | | | | 112 | | | 87 | | | 1,123 | | | 3,938 | | | 229 | | | 4,893 | | | 10,382 | |
| Euro | | | | 187 | | | 173 | | | 955 | | | 2,656 | | | 1,578 | | | 2,381 | | | 7,930 | |
| Other | | | | 24 | | | — | | | — | | | 984 | | | 445 | | | 414 | | | 1,867 | |
| Total | | | | 675 | | | 260 | | | 2,078 | | | 8,350 | | | 2,643 | | | 13,648 | | | 27,654 | |
| | | |
| | | |
| | Group | |
| | Currently | | 2007 | | 2008 | | | 2009–2011 | | | 2012–2016 | | Thereafter | | Perpetual | | Total | |
| 2006 – call date | | £m | | | £m | | | £m | | | £m | | | £m | | | £m | | | £m | | | £m | |
| Sterling | | — | | | 502 | | | — | | | 1,103 | | | 2,161 | | | 3,543 | | | 166 | | | 7,475 | |
| US$ | | 1,843 | | | 1,200 | | | 469 | | | 3,835 | | | 1,859 | | | 1,176 | | | — | | | 10,382 | |
| Euro | | — | | | 274 | | | 948 | | | 1,634 | | | 4,473 | | | 565 | | | 36 | | | 7,930 | |
| Other | | — | | | 24 | | | — | | | 701 | | | 1,043 | | | 99 | | | — | | | 1,867 | |
| Total | | 1,843 | | | 2,000 | | | 1,417 | | | 7,273 | | | 9,536 | | | 5,383 | | | 202 | | | 27,654 | |
| | Company | |
| | | 2008 | | 2009 | | | 2010-2012 | | | 2013-2017 | | Thereafter | | Perpetual | | Total | |
| 2007 – final redemption | | | £m | | | £m | | | £m | | | £m | | | £m | | | £m | | | £m | |
| Sterling | | | 13 | | | — | | | — | | | — | | | 399 | | | 199 | | | 611 | |
| US$ | | | 61 | | | 199 | | | 148 | | | 1,204 | | | 2,259 | | | 1,935 | | | 5,806 | |
| Euro | | | 45 | | | — | | | — | | | — | | | 1,281 | | | — | | | 1,326 | |
| Total | | | 119 | | | 199 | | | 148 | | | 1,204 | | | 3,939 | | | 2,134 | | | 7,743 | |
| | | |
| | Company | |
| | Currently | | 2008 | | 2009 | | | 2010-2012 | | | 2013-2017 | | Thereafter | | Perpetual | | Total | |
| 2007 – call date | | £m | | | £m | | | £m | | | £m | | | £m | | | £m | | | £m | | | £m | |
| Sterling | | — | | | 13 | | | — | | | 198 | | | 399 | | | — | | | 1 | | | 611 | |
| US$ | | 425 | | | 435 | | | 620 | | | 643 | | | 2,594 | | | 1,089 | | | — | | | 5,806 | |
| Euro | | — | | | 45 | | | — | | | 914 | | | 367 | | | — | | | — | | | 1,326 | |
| Total | | 425 | | | 493 | | | 620 | | | 1,755 | | | 3,360 | | | 1,089 | | | 1 | | | 7,743 | |
| | | |
| | Company | |
| | | | 2007 | | 2008 | | | 2009-2011 | | | 2012-2016 | | Thereafter | | Perpetual | | Total | |
| 2006 – final redemption | | | | £m | | | £m | | | £m | | | £m | | | £m | | | £m | | | £m | |
| Sterling | | | | — | | | — | | | — | | | — | | | 399 | | | 199 | | | 598 | |
| US$ | | | | 63 | | | — | | | 355 | | | 1,227 | | | 2,301 | | | 2,440 | | | 6,386 | |
| Euro | | | | 41 | | | — | | | — | | | — | | | 1,169 | | | — | | | 1,210 | |
| Total | | | | 104 | | | — | | | 355 | | | 1,227 | | | 3,869 | | | 2,639 | | | 8,194 | |
| | | |
| | Company | |
| | Currently | | 2007 | | 2008 | | | 2009–2011 | | | 2012–2016 | | Thereafter | | Perpetual | | Total | |
| 2006 – call date | | £m | | | £m | | | £m | | | £m | | | £m | | | £m | | | £m | | | £m | |
| Sterling | | — | | | — | | | — | | | 198 | | | — | | | 399 | | | 1 | | | 598 | |
| US$ | | 762 | | | 203 | | | 380 | | | 1,287 | | | 2,643 | | | 1,111 | | | — | | | 6,386 | |
| Euro | | — | | | 41 | | | — | | | — | | | 1,169 | | | — | | | — | | | 1,210 | |
| Total | | 762 | | | 244 | | | 380 | | | 1,485 | | | 3,812 | | | 1,510 | | | 1 | | | 8,194 | |
Notes on the accounts continued
24 Subordinated liabilities(continued)
Dated loan capital
| | 2007 | | 2006 | |
| | | £m | | | £m | |
| The company | | | | | | |
US$400 million 6.4% subordinated notes 2009 (1) | | 202 | | | 206 | |
US$300 million 6.375% subordinated notes 2011 (1) | | 163 | | | 163 | |
US$750 million 5% subordinated notes 2013 (1) | | 382 | | | 375 | |
US$750 million 5% subordinated notes 2014 (1) | | 386 | | | 373 | |
US$250 million 5% subordinated notes 2014 (1) | | 123 | | | 125 | |
US$675 million 5.05% subordinated notes 2015 (1) | | 357 | | | 351 | |
US$350 million 4.7% subordinated notes 2018 (1) | | 173 | | | 169 | |
| | | 1,786 | * | | 1,762 | * |
| The Royal Bank of Scotland plc | | | | | | |
| £150 million 8.375% subordinated notes 2007 (redeemed January 2007) | | — | | | 162 | |
| €255 million 5.25% subordinated notes 2008 | | 192 | | | 177 | |
| €300 million 4.875% subordinated notes 2009 | | 228 | | | 212 | |
| US$350 million floating rate subordinated notes 2012 (redeemed July 2007) | | — | | | 184 | |
| US$500 million floating rate subordinated notes 2012 (redeemed July 2007) | | — | | | 254 | |
| €130 million floating rate subordinated notes 2012 (redeemed July 2007) | | — | | | 88 | |
| €1,000 million floating rate subordinated notes 2013 (callable October 2008) | | 744 | | | 677 | |
| US$50 million floating rate subordinated notes 2013 | | 26 | | | 25 | |
| €1,000 million 6% subordinated notes 2013 | | 790 | | | 745 | |
| €500 million 6% subordinated notes 2013 | | 374 | | | 342 | |
£150 million 10.5% subordinated bonds 2013 (2) | | 169 | | | 168 | |
| US$1,250 million floating rate subordinated notes 2014 (callable July 2009) | | 630 | | | 643 | |
| AUD590 million 6% subordinated notes 2014 (callable October 2009) | | 254 | | | 235 | |
| AUD410 million floating rate subordinated notes 2014 (callable October 2009) | | 182 | | | 167 | |
| CAD700 million 4.25% subordinated notes 2015 (callable March 2010) | | 358 | | | 307 | |
| £250 million 9.625% subordinated bonds 2015 | | 286 | | | 287 | |
| US$750 million floating rate subordinated notes 2015 (callable September 2010) | | 374 | | | 381 | |
| €750 million floating rate subordinated notes 2015 | | 564 | | | 531 | |
| CHF400 million 2.375% subordinated notes 2015 | | 166 | | | 160 | |
| CHF100 million 2.375% subordinated notes 2015 | | 41 | | | 43 | |
| CHF200 million 2.375% subordinated notes 2015 | | 86 | | | 81 | |
| US$500 million floating rate subordinated notes 2016 (callable October 2011) | | 252 | | | 257 | |
| US$1,500 million floating rate subordinated notes 2016 (callable April 2011) | | 757 | | | 773 | |
| €500 million 4.5% subordinated 2016 (callable January 2011) | | 379 | | | 350 | |
| CHF200 million 2.75% subordinated notes 2017 (callable December 2012) | | 89 | | | 84 | |
| €100 million floating rate subordinated notes 2017 | | 73 | | | 67 | |
| €500 million floating rate subordinated notes 2017 (callable June 2012) | | 371 | | | 337 | |
| €750 million 4.35% subordinated notes 2017 (callable October 2017) | | 548 | | | 502 | |
| AUD450 million 6.5% subordinated notes 2017 (callable February 2012) | | 202 | | | 184 | |
| AUD450 million floating rate subordinated notes 2017 (callable February 2012) | | 199 | | | 182 | |
| US$1,500 million floating rate subordinated callable step up | | | | | | |
| notes due August 2017 (issued May 2007; callable August 2012) | | 752 | | | — | |
| US$125.6 million floating rate subordinated notes 2020 | | 64 | | | 65 | |
| €1,000 million 4.625% subordinated notes 2021 (callable September 2016) | | 724 | | | 687 | |
| €300 million CMS linked floating rate subordinated notes due June 2022 (issued June 2007) | | 228 | | | — | |
| | | | | | | |
| National Westminster Bank Plc | | | | | | |
| US$1,000 million 7.375% subordinated notes 2009 | | 507 | | | 516 | |
| €600 million 6% subordinated notes 2010 | | 474 | | | 440 | |
| €500 million 5.125% subordinated notes 2011 | | 376 | | | 343 | |
| £300 million 7.875% subordinated notes 2015 | | 349 | | | 350 | |
| £300 million 6.5% subordinated notes 2021 | | 330 | | | 332 | |
| | | | | | | |
| Charter One Financial, Inc | | | | | | |
| US$400 million 6.375% subordinated notes 2012 | | 212 | | | 218 | |
| | | | | | | |
| Greenwich Capital Holdings, Inc | | | | | | |
| US$500 million subordinated loan capital 2010 floating rate notes (callable on any interest payment date) | | 249 | | | 256 | |
| US$170 million subordinated loan capital floating rate notes 2008 | | 85 | | | 87 | |
| US$100 million 5.575% senior subordinated revolving credit 2009 (issued June 2007) | | 50 | | | — | |
| | | | | | | |
| First Active Plc | | | | | | |
| US$35 million 7.24% subordinated bonds 2012 (redeemed December 2007) | | — | | | 22 | |
| £60 million 6.375% subordinated bonds 2018 (callable April 2013) | | 65 | | | 65 | |
| | | | | | | |
| Other minority interest subordinated issues | | 16 | | | 24 | |
| | | | | | | |
| ABN AMRO and subsidiaries | | | | | | |
| €113 million 7.50% subordinated notes 2008 | | 83 | | | — | |
| €182 million 6.00% subordinated notes 2009 | | 132 | | | — | |
| €182 million 6.13% subordinated notes 2009 | | 127 | | | — | |
Dated loan capital (continued)
| | 2007 | | 2006 | |
| | | £m | | | £m | |
| €1,150 million 4.63% subordinated notes 2009 | | 848 | | | — | |
| €250 million 4.70% CMS linked subordinated notes 2019 | | 131 | | | — | |
| €800 million 6.25% subordinated notes 2010 | | 598 | | | — | |
| €100 million 5.13% flip flop Bermudan callable subordinated notes 2017 (callable December 2012) | | 75 | | | — | |
| €500 million floating rate Bermudan callable subordinated lower tier 2 notes 2018 (callable May 2013) | | 350 | | | — | |
| €1,000 million floating rate Bermudan callable subordinated lower tier 2 notes 2016 (callable September 2011) | | 710 | | | — | |
| €13 million zero coupon subordinated notes 2029 (callable June 2009) | | 2 | | | — | |
| €82 million floating rate subordinated notes 2017 | | 55 | | | — | |
| €103 million floating rate subordinated lower tier 2 notes 2020 | | 68 | | | — | |
| €170 million floating rate sinkable subordinated notes 2041 | | 184 | | | — | |
| €15 million CMS linked floating rate subordinated lower tier 2 notes 2020 | | 11 | | | — | |
| €1,500 million floating rate Bermudan callable subordinated lower tier 2 notes 2015 (callable June 2010) | | 1,087 | | | — | |
| €5 million floating rate Bermudan callable subordinated lower tier 2 notes 2015 (callable October 2010) | | 4 | | | — | |
| €65 million floating rate Bermudan callable subordinated lower tier 2 notes 2015 (callable October 2010) | | 48 | | | — | |
| US$12 million floating rate subordinated notes 2008 | | 6 | | | — | |
| US$12 million floating rate subordinated notes 2008 | | 6 | | | — | |
| US$165 million 6.14% subordinated notes 2019 | | 94 | | | — | |
| US$72 million 5.98% subordinated notes 2019 | | 7 | | | — | |
| US$500 million 4.65% subordinated notes 2018 | | 214 | | | — | |
| US$500 million floating rate Bermudan callable subordinated notes 2013 (callable September 2008) | | 232 | | | — | |
| US$1,500 million floating rate Bermudan callable subordinated notes 2015 (callable March 2010) | | 717 | | | — | |
| US$100 million floating rate Bermudan callable subordinated lower tier 2 notes 2015 (callable October 2010) | | 50 | | | — | |
| US$36 million floating rate Bermudan callable subordinated lower tier 2 notes 2015 (callable October 2010) | | 18 | | | — | |
| US$1,000 million floating rate Bermudan callable subordinated lower tier 2 notes 2017 (callable January 2012) | | 479 | | | — | |
| AUD575 million 6.50% Bermudan callable subordinated lower tier 2 notes 2018 (callable May 2013) | | 231 | | | — | |
| AUD175 million 7.46% Bermudan callable subordinated lower tier 2 notes 2018 (callable May 2013) | | 73 | | | — | |
| €26 million 7.42% subordinated notes 2016 | | 20 | | | — | |
| €7 million 7.38% subordinated notes 2016 | | 6 | | | — | |
| €256 million 5.25% subordinated notes 2008 | | 190 | | | — | |
| €13 million floating rate subordinated notes 2008 | | 9 | | | — | |
| £42 million 8.18% subordinated notes 2010 | | 19 | | | — | |
| £25 million 9.18% amortising MTN subordinated lower tier 2 notes 2011 | | 15 | | | — | |
| £750 million 5% Bermudan callable subordinated upper tier 2 notes 2016 | | 642 | | | — | |
| US$250 million 7.75% subordinated notes 2023 | | 127 | | | — | |
| US$150 million 7.13% subordinated notes 2093 | | 76 | | | — | |
| US$250 million 7.00% subordinated notes 2008 | | 127 | | | — | |
| US$68 million floating rate subordinated notes 2009 | | 34 | | | — | |
| US$12 million floating rate subordinated notes 2009 | | 6 | | | — | |
| BRL50 million floating rate subordinated notes 2013 | | 14 | | | — | |
| BRL250 million floating rate subordinated notes 2013 | | 71 | | | — | |
| BRL250 million floating rate subordinated notes 2014 | | 71 | | | — | |
| BRL885 million floating rate subordinated notes 2014 | | 251 | | | — | |
| BRL300 million floating rate subordinated notes 2014 | | 85 | | | — | |
| PKR0.80 million floating rate subordinated notes 2012 | | 6 | | | — | |
| MYR200 million subordinated notes 2017 | | 30 | | | — | |
| TRY60 million subordinated notes | | 25 | | | — | |
| | | 23,065 | | | 13,772 | |
| * | In addition the company has issued 0.5 million subordinated loan notes of €1,000 each, 1.95 million subordinated loan notes of US$1,000 each and 0.4 million subordinated loan notes of £1,000 each. These loan notes are included in the company balance sheet as loan capital but are reclassified as minority interest Trust Preferred Securities on consolidation (see Note 25). |
| | Notes: |
| | |
| (1) | On-lent to The Royal Bank of Scotland plc on a subordinated basis. |
| | |
| (2) | Unconditionally guaranteed by the company. |
| | |
| (3) | In the event of certain changes in tax laws, dated loan capital issues may be redeemed in whole, but not in part, at the option of the issuer, at the principal amount thereof plus accrued interest, subject to prior regulatory approval. |
| | |
| (4) | Except as stated above, claims in respect of the Group’s dated loan capital are subordinated to the claims of other creditors. None of the Group’s dated loan capital is secured. |
| | |
| (5) | Interest on all floating rate subordinated notes is calculated by reference to market rates. |
Notes on the accounts continued
24 Subordinated liabilities (continued)
Undated loan capital
| | 2007 | | 2006 | |
| | | £m | | | £m | |
| The company | | | | | | |
US$350 million undated floating rate primary capital notes (callable on any interest payment date) (1) | | 175 | | | 178 | |
| US$75 million floating rate perpetual capital securities (redeemed October 2007) | | — | | | 38 | |
US$1,200 million 7.648% perpetual regulatory tier one securities (callable September 2031) (1, 2) | | 606 | | | 618 | |
| | | 781 | | | 834 | |
| The Royal Bank of Scotland plc | | | | | | |
| £150 million 5.625% undated subordinated notes (callable June 2032) | | 144 | | | 144 | |
| £175 million 7.375% undated subordinated notes (callable August 2010) | | 183 | | | 183 | |
| €152 million 5.875% undated subordinated notes (callable October 2008) | | 114 | | | 105 | |
| £350 million 6.25% undated subordinated notes (callable December 2012) | | 354 | | | 350 | |
| £500 million 6% undated subordinated notes (callable September 2014) | | 517 | | | 512 | |
| €500 million 5.125% undated subordinated notes (callable July 2014) | | 371 | | | 350 | |
| €1,000 million floating rate undated subordinated notes (callable July 2014) | | 742 | | | 675 | |
| £500 million 5.125% undated subordinated notes (callable March 2016) | | 499 | | | 493 | |
| £200 million 5.625% subordinated upper tier 2 notes (callable September 2026) | | 210 | | | 210 | |
| £600 million 5.5% undated subordinated notes (callable December 2019) | | 595 | | | 594 | |
| £500 million 6.2% undated subordinated notes (callable March 2022) | | 543 | | | 546 | |
£200 million 9.5% undated subordinated bonds (callable August 2018) (3) | | 228 | | | 229 | |
| £400 million 5.625% subordinated upper tier 2 notes (callable September 2026) | | 397 | | | 397 | |
| £300 million 5.625% undated subordinated notes (callable September 2026) | | 318 | | | 326 | |
| £350 million 5.625% undated subordinated notes (callable June 2032) | | 363 | | | 362 | |
| £150 million undated subordinated floating rate step-up notes (redeemed March 2007) | | — | | | 150 | |
| £400 million 5% undated subordinated notes (callable March 2011) | | 402 | | | 395 | |
| JPY25 billion 2.605% undated subordinates notes (callable November 2034) | | 103 | | | 99 | |
| CAD700 million 5.37% fixed rate undated subordinated notes (callable May 2016) | | 363 | | | 317 | |
| | | | | | | |
| National Westminster Bank Plc | | | | | | |
| US$500 million primary capital floating rate notes, Series A (callable on any interest payment date) | | 251 | | | 256 | |
| US$500 million primary capital floating rate notes, Series B (callable on any interest payment date) | | 256 | | | 267 | |
| US$500 million primary capital floating rate notes, Series C (callable on any interest payment date) | | 255 | | | 254 | |
| US$500 million 7.75% reset subordinated notes (redeemed October 2007) | | — | | | 262 | |
| €400 million 6.625% fixed/floating rate undated subordinated notes (callable October 2009) | | 303 | | | 280 | |
| €100 million floating rate undated step-up notes (callable October 2009) | | 74 | | | 68 | |
| £325 million 7.625% undated subordinated step-up notes (callable January 2010) | | 357 | | | 359 | |
| £200 million 7.125% undated subordinated step-up notes (callable October 2022) | | 205 | | | 205 | |
£200 million 11.5% undated subordinated notes (callable December 2022) (4) | | 269 | | | 272 | |
| | | | | | | |
| First Active plc | | | | | | |
| £20 million 11.75% perpetual tier two capital | | 23 | | | 23 | |
| €38 million 11.375% perpetual tier two capital | | 39 | | | 36 | |
| £1.3 million floating rate perpetual tier two capital | | 2 | | | 2 | |
| | | | | | | |
| ABN AMRO and subsidiaries | | | | | | |
| €9 million 4.65% perpetual convertible financing preference shares (callable January 2011) | | 7 | | | — | |
| €1,000 million 4.310% perpetual Bermudan callable subordinated tier 1 notes (callable March 2016) | | 598 | | | — | |
| | | 9,866 | | | 9,555 | |
| | Notes: |
| | |
| (1) | On-lent to The Royal Bank of Scotland plc on a subordinated basis. |
| | |
| (2) | The company can satisfy interest payment obligations by issuing ordinary shares to appointed Trustees sufficient to enable them, on selling these shares, to settle the interest payment. |
| | |
| (3) | Guaranteed by the company. |
| | |
| (4) | Exchangeable at the option of the issuer into 200 million 8.392% (gross) non-cumulative preference shares of £1 each of National Westminster Bank Plc at any time. |
| | |
| (5) | Except as stated above, claims in respect of the Group’s undated loan capital are subordinated to the claims of other creditors. None of the Group’s undated loan capital is secured. |
| | |
| (6) | In the event of certain changes in tax laws, undated loan capital issues may be redeemed in whole, but not in part, at the option of the Group, at the principal amount thereof plus accrued interest, subject to prior regulatory approval. |
| | |
| (7) | Interest on all floating rate subordinated notes is calculated by reference to market rates. |
Preference shares
| | 2007 | | 2006 | |
| | | £m | | | £m | |
| The company | | | | | | |
Non-cumulative preference shares of US$0.01 (1) | | | | | | |
| Series E US$200 million 8.1% (redeemed January 2007) | | — | | | 102 | |
| Series F US$200 million 7.65% (redeemable at option of issuer) | | 100 | | | 102 | |
| Series G US$250 million 7.4% (redeemed January 2007) | | — | | | 126 | |
| Series H US$300 million 7.25% (redeemable at option of issuer) | | 150 | | | 153 | |
| Series K US$400 million 7.875% (redeemed January 2007) | | — | | | 203 | |
| Series L US$850 million 5.75% (redeemable September 2009) | | 421 | | | 429 | |
Non-cumulative convertible preference shares of US$0.01 (1) | | | | | | |
| Series 1 US$1,000 million 9.118% (redeemable March 2010) | | 510 | | | 515 | |
Non-cumulative convertible preference shares of £0.01 (1) | | | | | | |
| Series 1 £200 million 7.387% (redeemable December 2010) | | 201 | | | 200 | |
| Cumulative preference shares of £1 | | | | | | |
| £0.5 million 11% (non-redeemable) | | 1 | | | 1 | |
| £0.4 million 5.5% (non-redeemable) | | — | | | — | |
| | | 1,383 | | | 1,831 | |
| National Westminster Bank Plc | | | | | | |
| Non-cumulative preference shares of £1 | | | | | | |
| Series A £140 million 9% (non-redeemable) | | 143 | | | 142 | |
| Non-cumulative preference shares of US$25 | | | | | | |
| Series B US$250 million 7.8752% (redeemed January 2007) | | — | | | 141 | |
Series C US$300 million 7.7628% (2) | | 160 | | | 163 | |
| | | 1,686 | | | 2,277 | |
| | Notes: |
| | |
| (1) | Further details of the contractual terms of the preference shares are given in Note 26 on page 161. |
| | |
| (2) | Series C preference shares each carry a gross dividend of 8.625% inclusive of associated tax credit. Redeemable at the option of the issuer at par. |
Trust preferred securities
| | | 2007 | | 2006 | |
| | | | £m | | | £m | |
€1,250 million 6.467% (redeemable June 2012) (1) | | | 979 | | | 918 | |
US$750 million 6.8% (redeemable March 2008) (1) | | | 374 | | | 382 | |
US$850 million 4.709% (redeemable July 2013) (1) | | | 421 | | | 409 | |
US$650 million 6.425% (redeemable January 2034) (1) | | | 344 | | | 341 | |
| | | | | | | | |
| ABN AMRO and subsidiaries | | | | | | | |
| US$1,285 million 6.03% Trust Preferred V (redeemable July 2008) | | | 438 | | | — | |
| US$200 million 6.25% Trust Preferred VI (redeemable September 2008) | | | 79 | | | — | |
| US$1,800 million 6.08% Trust Preferred VII (redeemable February 2009) | | | 727 | | | — | |
| | | | 3,362 | | | 2,050 | |
| | Note: |
| | |
| (1) | The trust preferred securities issued by subsidiaries have no maturity date and are not redeemable at the option of the holders at any time. These securities may with the consent of the UK Financial Services Authority be redeemed, by the issuer on the dates specified above or on any interest payment date thereafter. They may also be redeemed in whole, but not in part, upon the occurrence of certain tax and regulatory events. The company classifies its obligations to these subsidiaries as dated loan capital. |
Notes on the accounts continued
| | Group | |
| | 2007 | | 2006 | |
| | | £m | | | £m | |
| At 1 January | | 5,263 | | | 2,109 | |
| Currency translation adjustments and other movements | | 1,834 | | | (297 | ) |
| Acquisition of ABN AMRO | | 32,245 | | | — | |
| Profit attributable to minority interests | | 163 | | | 104 | |
| Dividends paid | | (121 | ) | | (66 | ) |
| (Losses)/gains on available-for-sale securities, net of tax | | (564 | ) | | 2,140 | |
| Movements in cash flow hedging reserves, net of tax | | 26 | | | — | |
| Actuarial gains recognised in retirement benefit schemes, net of tax | | 19 | | | — | |
| Equity raised | | 76 | | | 1,354 | |
| Equity withdrawn | | (553 | ) | | (81 | ) |
| At 31 December | | 38,388 | | | 5,263 | |
| | | | | | | |
Included in minority interests are the following trust preferred securities (1): | | | | | | |
| | 2007 | | 2006 | |
| | | £m | | | £m | |
| US$950 million 5.512% (redeemable September 2014) | | 529 | | | 529 | |
| US$1,000 million 3 month US$ LIBOR plus 0.80% (redeemable September 2014) | | 555 | | | 555 | |
| €500 million 4.243% (redeemable January 2016) | | 337 | | | 337 | |
| £400 million 5.6457% (redeemable June 2017) | | 400 | | | 400 | |
| | | 1,821 | | | 1,821 | |
| | Note: |
| | |
| (1) | The trust preferred securities issued by subsidiaries have no maturity date and are not redeemable at the option of the holders at any time. These securities may, with the consent of the UK Financial Services Authority, be redeemed, in whole or in part, by the issuer on the dates specified above or on any interest payment date thereafter. They may also be redeemed in whole, but not in part, upon the occurrence of certain tax and regulatory events. The company classifies its obligations to these subsidiaries as dated loan capital. |
| | Allotted, called up and fully paid | | Authorised | |
| | 1 January | | Issued | | 31 December | | 31 December | | 31 December | |
| | 2007 | | during the year | | 2007 | | 2007 | | 2006 | |
| | | £m | | | £m | | | £m | | | £m | | | £m | |
| Ordinary shares of 25p | | 788 | | | 1,713 | | | 2,501 | | | 3,018 | | | 1,270 | |
| Non-voting deferred shares of £0.01 | | 27 | | | — | | | 27 | | | 323 | | | 323 | |
| Additional Value Shares of £0.01 | | — | | | — | | | — | | | 27 | | | 27 | |
| Non-cumulative preference shares of US$0.01 | | 1 | | | 1 | | | 2 | | | 2 | | | 2 | |
| Non-cumulative convertible preference shares of US$0.01 | | — | | | — | | | — | | | — | | | — | |
| Non-cumulative preference shares of €0.01 | | — | | | — | | | — | | | — | | | — | |
| Non-cumulative convertible preference shares of €0.01 | | — | | | — | | | — | | | — | | | — | |
| Non-cumulative convertible preference shares of £0.25 | | — | | | — | | | — | | | 225 | | | 225 | |
| Non-cumulative convertible preference shares of £0.01 | | — | | | — | | | — | | | — | | | — | |
| Cumulative preference shares of £1 | | 1 | | | — | | | 1 | | | 1 | | | 1 | |
| Non-cumulative preference shares of £1 | | — | | | 1 | | | 1 | | | 300 | | | 300 | |
| | | Allotted, called up and fully paid | | | Authorised | |
| Number of shares – thousands | | 2007 | | | 2006 | | | 2005 | | | 2007 | | | 2006 | | | 2005 | |
| Ordinary shares of 25p | | | 10,006,215 | | | | 3,152,844 | | | | 3,196,544 | | | | 12,070,492 | | | | 5,079,375 | | | | 5,079,375 | |
| Non-voting deferred shares of £0.01 | | | 2,660,556 | | | | 2,660,556 | | | | 2,660,556 | | | | 32,300,000 | | | | 32,300,000 | | | | 32,300,000 | |
| Additional Value Shares of £0.01 | | | — | | | | — | | | | — | | | | 2,700,000 | | | | 2,700,000 | | | | 2,700,000 | |
| Non-cumulative preference shares of US$0.01 | | | 308,015 | | | | 240,000 | | | | 206,000 | | | | 419,500 | | | | 419,500 | | | | 419,500 | |
| Non-cumulative convertible preference shares of US$0.01 | | | 1,000 | | | | 1,000 | | | | 1,000 | | | | 3,900 | | | | 3,900 | | | | 3,900 | |
| Non-cumulative preference shares of €0.01 | | | 2,526 | | | | 2,500 | | | | 2,500 | | | | 66,000 | | | | 66,000 | | | | 66,000 | |
| Non-cumulative convertible preference shares of €0.01 | | | — | | | | — | | | | — | | | | 3,000 | | | | 3,000 | | | | 3,000 | |
| Non-cumulative convertible preference shares of £0.25 | | | — | | | | — | | | | — | | | | 900,000 | | | | 900,000 | | | | 900,000 | |
| Non-cumulative convertible preference shares of £0.01 | | | 200 | | | | 200 | | | | 200 | | | | 1,000 | | | | 1,000 | | | | 1,000 | |
| Cumulative preference shares of £1 | | | 900 | | | | 900 | | | | 900 | | | | 900 | | | | 900 | | | | 900 | |
| Non-cumulative preference shares of £1 | | | 750 | | | | — | | | | — | | | | 300,000 | | | | 300,000 | | | | 300,000 | |
Movement in ordinary shares in issue during the year:
| | | Number of shares | |
| | | — thousands | |
| At 1 January 2007 | | | 3,152,844 | |
| Bonus issue in May 2007 | | | 6,304,299 | |
| Shares issued in respect of the acquisition of ABN AMRO | | | 530,621 | |
| Other shares issued during the year | | | 19,146 | |
| Shares cancelled during the year | | | (695 | ) |
| At 31 December 2007 | | | 10,006,215 | |
Notes on the accounts continued
26 Share capital (continued)
Ordinary shares
In May 2007, the company capitalised £1,576 million of its share premium account by way of a bonus issue of two new ordinary shares of 25p each for every one ordinary share held by shareholders at close of business on 4 May 2007.
In addition, the following issues of ordinary shares were made during the year ended 31 December 2007:
| (a) | 530.6 million ordinary shares issued to former shareholders of ABN AMRO; and |
| (b) | 19.1 million ordinary shares following the exercise of options under the company’s share schemes. |
Consideration of £77 million was received on the issue of ordinary shares for cash.
During the year ended 31 December 2007, options were granted over 44.8 million ordinary shares under the company’s executive and sharesave schemes. At 31 December 2007, options granted under the company’s various schemes, exercisable up to 2017 at prices ranging from 260p to 700p per share, were outstanding in respect of 188.7 million ordinary shares.
In addition, options granted under the NatWest executive scheme were outstanding in respect of 1 million ordinary shares exercisable up to 2009 at prices ranging from 228p to 308p per share.
Employee share trusts purchased 10.8 million ordinary shares at a cost of £65.3 million and awarded 19.8 million ordinary shares on receipt of £79 million on the exercise of awards under employee share schemes.
The employee share trusts incurred costs of £0.4 million in purchasing the company’s ordinary shares.
Preference shares
In January 2007, the company redeemed the 8 million Series E, the 10 million Series G and the 16 million Series K, non-cumulative preference shares of US$0.01 each at US$25 per share.
In June 2007, the company issued 38 million Series S non-cumulative preference shares of US$0.01 at US$25 each, the net proceeds being US$920 million.
In September 2007, the company issued 64 million Series T non-cumulative preference shares of US$0.01 at US$25 each, the net proceeds being US$1,550 million.
In October 2007, the company issued:
| (a) | 26,000 Series 3 non-cumulative preference shares of €0.01 at €50,000 each, the net proceeds being €1,287 million; |
| | |
| (b) | 750,000 Series 1 non-cumulative preference shares of £1 at £1,000 each, the net proceeds being £742 million; and |
| | |
| (c) | 15,000 Series U non-cumulative preference shares of US$0.01 at US$100,000 each, the net proceeds being US$1,485 million. |
The costs of issue and discounts allowed on preference shares issued during the year were £64 million.
Under IFRS certain of the Group’s preference shares are classified as debt and are included in subordinated liabilities on the balance sheet.
Other securities
In October 2007, the company issued the following subordinated securities in the legal form of debt that are classified as equity under IFRS:
| (a) | US$1,600 million fixed/floating rate preferred capital securities, the net proceeds being US$1,584 million; and |
| | |
| (b) | CAD600 million innovative tier 1 bonds, the net proceeds being CAD594 million. |
These securities entitle the holders to interest which may be deferred at the sole discretion of the company. Repayment of the securities is at the sole discretion of the company on giving between 30 and 60 days notice.
Non-cumulative preference shares
Non-cumulative preference shares entitle the holders thereof (subject to the terms of issue) to receive periodic non-cumulative cash dividends at specified fixed rates for each Series payable out of distributable profits of the company.
The non-cumulative preference shares are redeemable at the option of the company, in whole or in part from time to time at the rates detailed below plus dividends otherwise payable for the then current dividend period accrued to the date of redemption.
| | | Number | | | | Redemption | Redemption | |
| | | of shares | | Interest | | date on | price | Debt or |
| Class of preference share | | in issue | | rate | | or after | per share | equity (1) |
Non-cumulative preference shares of US$0.01 | | | | | | | | | |
| Series F | | 8 million | | 7.65% | | 31 March 2007 | | | Debt |
| Series H | | 12 million | | 7.25% | | 31 March 2004 | | | Debt |
| Series L | | 34 million | | 5.75% | | 30 September 2009 | | | Debt |
| Series M | | 37 million | | 6.4% | | 30 September 2009 | | | Equity |
| Series N | | 40 million | | 6.35% | | 30 June 2010 | | | Equity |
| Series P | | 22 million | | 6.25% | | 31 December 2010 | | | Equity |
| Series Q | | 27 million | | 6.75% | | 30 June 2011 | | | Equity |
| Series R | | 26 million | | 6.125% | | 30 December 2011 | | | Equity |
| Series S | | 38 million | | 6.6% | | 30 June 2012 | | | Equity |
| Series T | | 64 million | | 7.25% | | 31 December 2012 | | | Equity |
| Series U | | 15,000 | | 7.64% | | 29 September 2017 | | | Equity |
Non-cumulative convertible preference shares of US$0.01 | | | | | | | | | |
| Series 1 | | 1 million | | 9.118% | | 31 March 2010 | | | Debt |
Non-cumulative preference shares of €0.01 | | | | | | | | | |
| Series 1 | | 1.25 million | | 5.5% | | 31 December 2009 | | | Equity |
| Series 2 | | 1.25 million | | 5.25% | | 30 June 2010 | | | Equity |
| Series 3 | | 26,000 | | 7.0916% | | 29 September 2017 | | | Equity |
Non-cumulative convertible preference shares of £0.01 | | | | | | | | | |
| Series 1 | | 200,000 | | 7.387% | | 31 December 2010 | | | Debt |
Non-cumulative preference shares of £1 | | | | | | | | | |
| Series 1 | | 750,000 | | 8.162% | | 5 October 2012 | | | Equity |
| | Notes: |
| | |
| (1) | Those preference shares where the Group has an obligation to pay dividends are classified as debt; those where distributions are discretionary are classified as equity. The conversion rights attaching to the convertible preference shares may result in the Group delivering a variable number of equity shares to preference shareholders; these convertible preference shares are treated as debt. |
In the event that the non-cumulative convertible preference shares are not redeemed on or before the redemption date, the holder may convert the non-cumulative convertible preference shares into ordinary shares in the company.
Under existing arrangements, no redemption or purchase of any non-cumulative preference shares may be made by the company without the prior consent of the UK Financial Services Authority.
On a winding-up or liquidation of the company, the holders of the non-cumulative preference shares will be entitled to receive, out of any surplus assets available for distribution to the company’s shareholders (after payment of arrears of dividends on the cumulative preference shares up to the date of repayment) pari passu with the cumulative preference shares and all other shares of the company ranking pari passu with the non-cumulative preference shares as regards participation in the surplus assets of the company, a liquidation distribution per share equal to the applicable redemption price detailed in the table above, together with an amount equal to dividends for the then current dividend period accrued to the date of payment, before any distribution or payment may be made to holders of the ordinary shares as regards participation in the surplus assets of the company.
Except as described above, the holders of the non-cumulative preference shares have no right to participate in the surplus assets of the company.
Holders of the non-cumulative preference shares are not entitled to receive notice of or attend general meetings of the company except if any resolution is proposed for adoption by the shareholders of the company to vary or abrogate any of the rights attaching to the non-cumulative preference shares or proposing the winding-up or liquidation of the company. In any such case, they are entitled to receive notice of and to attend the general meeting of shareholders at which such resolution is to be proposed and are entitled to speak and vote on such resolution (but not on any other resolution). In addition, in the event that, prior to any general meeting of shareholders, the company has failed to pay in full the three most recent quarterly dividend payments due on the non-cumulative dollar preference shares (other than Series U), the two most recent semi-annual dividend payments due on the non-cumulative convertible dollar preference shares and the most recent dividend payments due on the non-cumulative euro preference shares, the non-cumulative sterling preference shares, the Series U non-cumulative dollar preference shares and the non-cumulative convertible sterling preference shares, the holders shall be entitled to receive notice of, attend, speak and vote at such meeting on all matters together with the holders of the ordinary shares, and in these circumstances only, the rights of the holders of the non-cumulative preference shares so to vote shall continue until the company shall have resumed the payment in full of the dividends in arrears.
Notes on the accounts continued
27 Owners’ equity
| | | Group | | | Company | |
| | | 2007 | | | 2006 | | | 2005 | | | 2007 | | | 2006 | | | 2005 | |
| | | | £m | | | | £m | | | | £m | | | | £m | | | | £m | | | | £m | |
| Called-up share capital | | | | | | | | | | | | | | | | | | | | | | | | |
| At 1 January | | | 815 | | | | 826 | | | | 822 | | | | 815 | | | | 826 | | | | 822 | |
| Implementation of IAS 32 on 1 January 2005 | | | — | | | | — | | | | (2 | ) | | | — | | | | — | | | | (2 | ) |
| Bonus issue of ordinary shares | | | 1,576 | | | | — | | | | — | | | | 1,576 | | | | — | | | | — | |
| Shares issued during the year | | | 139 | | | | 2 | | | | 6 | | | | 139 | | | | 2 | | | | 6 | |
| Shares repurchased during the year | | | — | | | | (13 | ) | | | — | | | | — | | | | (13 | ) | | | — | |
| At 31 December | | | 2,530 | | | | 815 | | | | 826 | | | | 2,530 | | | | 815 | | | | 826 | |
| | | | | | | | | | | | | | | | | | | | | | | | | |
| | | | | | | | | | | | | | | | | | | | | | | | | |
| Paid-in equity | | | | | | | | | | | | | | | | | | | | | | | | |
| Securities issued during the year | | | 1,073 | | | | — | | | | — | | | | 1,073 | | | | — | | | | — | |
| At 31 December | | | 1,073 | | | | — | | | | — | | | | 1,073 | | | | — | | | | — | |
| | | | | | | | | | | | | | | | | | | | | | | | | |
| | | | | | | | | | | | | | | | | | | | | | | | | |
| Share premium account | | | | | | | | | | | | | | | | | | | | | | | | |
| At 1 January | | | 12,482 | | | | 11,777 | | | | 12,964 | | | | 12,482 | | | | 11,777 | | | | 12,964 | |
| Reclassification of preference shares on implementation | | | | | | | | | | | | | | | | | | | | | | | | |
| of IAS 32 on 1 January 2005 | | | — | | | | — | | | | (3,159 | ) | | | — | | | | — | | | | (3,159 | ) |
| Bonus issue of ordinary shares | | | (1,576 | ) | | | — | | | | — | | | | (1,576 | ) | | | — | | | | — | |
| Shares issued during the year | | | 6,257 | | | | 815 | | | | 1,972 | | | | 6,257 | | | | 815 | | | | 1,972 | |
| Shares repurchased during the year | | | — | | | | (381 | ) | | | — | | | | — | | | | (381 | ) | | | — | |
| Redemption of preference shares classified as debt | | | 159 | | | | 271 | | | | — | | | | 159 | | | | 271 | | | | — | |
| At 31 December | | | 17,322 | | | | 12,482 | | | | 11,777 | | | | 17,322 | | | | 12,482 | | | | 11,777 | |
| | | | | | | | | | | | | | | | | | | | | | | | | |
| Merger reserve | | | | | | | | | | | | | | | | | | | | | | | | |
| At 1 January and 31 December | | | 10,881 | | | | 10,881 | | | | 10,881 | | | | — | | | | — | | | | — | |
| | | | | | | | | | | | | | | | | | | | | | | | | |
| Available-for-sale reserve | | | | | | | | | | | | | | | | | | | | | | | | |
| At 1 January | | | 1,528 | | | | (73 | ) | | | | | | | — | | | | — | | | | — | |
| Implementation of IAS 32 and IAS 39 on 1 January 2005 | | | — | | | | — | | | | 289 | | | | — | | | | — | | | | — | |
| Unrealised (losses)/gains in the year | | | (191 | ) | | | 2,609 | | | | 39 | | | | — | | | | — | | | | — | |
| Realised gains in the year | | | (513 | ) | | | (313 | ) | | | (582 | ) | | | — | | | | — | | | | — | |
| Taxation | | | 208 | | | | (695 | ) | | | 181 | | | | — | | | | — | | | | — | |
| At 31 December | | | 1,032 | | | | 1,528 | | | | (73 | ) | | | — | | | | — | | | | — | |
| | | | | | | | | | | | | | | | | | | | | | | | | |
| | | | | | | | | | | | | | | | | | | | | | | | | |
| Cash flow hedging reserve | | | | | | | | | | | | | | | | | | | | | | | | |
| At 1 January | | | (149 | ) | | | 59 | | | | | | | | (7 | ) | | | (9 | ) | | | | |
| Implementation of IAS 32 and IAS 39 on 1 January 2005 | | | — | | | | — | | | | 67 | | | | — | | | | — | | | | (13 | ) |
| Amount recognised in equity during the year | | | (460 | ) | | | (109 | ) | | | 18 | | | | — | | | | — | | | | — | |
Amount transferred from equity to earnings in the year (1) | | | (138 | ) | | | (140 | ) | | | (85 | ) | | | 3 | | | | 3 | | | | 6 | |
| Taxation | | | 192 | | | | 41 | | | | 59 | | | | (1 | ) | | | (1 | ) | | | (2 | ) |
| At 31 December | | | (555 | ) | | | (149 | ) | | | 59 | | | | (5 | ) | | | (7 | ) | | | (9 | ) |
| | | | | | | | | | | | | | | | | | | | | | | | | |
| | | | | | | | | | | | | | | | | | | | | | | | | |
| Foreign exchange reserve | | | | | | | | | | | | | | | | | | | | | | | | |
| At 1 January | | | (872 | ) | | | 469 | | | | (320 | ) | | | — | | | | — | | | | — | |
| Retranslation of net assets | | | 1,339 | | | | (2,159 | ) | | | 1,588 | | | | — | | | | — | | | | — | |
| Foreign currency (losses)/gains on hedges of net assets | | | (963 | ) | | | 818 | | | | (799 | ) | | | — | | | | — | | | | — | |
| Taxation | | | 70 | | | | — | | | | — | | | | — | | | | — | | | | — | |
| At 31 December | | | (426 | ) | | | (872 | ) | | | 469 | | | | — | | | | — | | | | — | |
| Capital redemption reserve | | | | | | | | | | | | | | | | | | | | | | | | |
| At 1 January | | | 170 | | | | 157 | | | | 157 | | | | 170 | | | | 157 | | | | 157 | |
| Shares repurchased during the year | | | — | | | | 13 | | | | — | | | | — | | | | 13 | | | | — | |
| At 31 December | | | 170 | | | | 170 | | | | 157 | | | | 170 | | | | 170 | | | | 157 | |
| | Note: |
| | |
(1) | Of the amount transferred to earnings, £138 million (2006 – £140 million; 2005 – £85 million) was recorded in net interest income and nil (2006 and 2005 – nil) in other operating income. |
| | | Group | | | Company | |
| | | 2007 | | | 2006 | | | 2005 | | | 2007 | | | 2006 | | | 2005 | |
| | | | £m | | | | £m | | | | £m | | | | £m | | | | £m | | | | £m | |
| Retained earnings | | | | | | | | | | | | | | | | | | | | | | | | |
| At 1 January | | | 15,487 | | | | 11,346 | | | | 9,408 | | | | 4,737 | | | | 4,794 | | | | 4,675 | |
| Implementation of IAS 32 and IAS 39 on 1 January 2005 | | | — | | | | — | | | | (1,078 | ) | | | — | | | | — | | | | 81 | |
| Profit attributable to ordinary and equity preference shareholders | | | 7,549 | | | | 6,393 | | | | 5,501 | | | | 2,499 | | | | 3,499 | | | | 2,074 | |
| Ordinary dividends paid | | | (3,044 | ) | | | (2,470 | ) | | | (1,927 | ) | | | (3,044 | ) | | | (2,470 | ) | | | (1,927 | ) |
| Equity preference dividends paid | | | (246 | ) | | | (191 | ) | | | (109 | ) | | | (246 | ) | | | (191 | ) | | | (109 | ) |
| Shares repurchased during the year | | | — | | | | (624 | ) | | | — | | | | — | | | | (624 | ) | | | — | |
| Redemption of preference shares classified as debt | | | (159 | ) | | | (271 | ) | | | — | | | | (159 | ) | | | (271 | ) | | | — | |
| Actuarial gains/(losses) recognised in retirement benefit | | | | | | | | | | | | | | | | | | | | | | | | |
| schemes, net of tax | | | 1,517 | | | | 1,262 | | | | (561 | ) | | | — | | | | — | | | | — | |
| Net cost of shares bought and used to satisfy share-based payments | | | (40 | ) | | | (38 | ) | | | — | | | | — | | | | — | | | | — | |
| Share-based payments, net of tax | | | 8 | | | | 80 | | | | 112 | | | | — | | | | — | | | | — | |
| At 31 December | | | 21,072 | | | | 15,487 | | | | 11,346 | | | | 3,787 | | | | 4,737 | | | | 4,794 | |
| Own shares held | | | | | | | | | | | | | | | | | | | | | | | | |
| At 1 January | | | (115 | ) | | | (7 | ) | | | (7 | ) | | | — | | | | (7 | ) | | | (7 | ) |
| Shares purchased during the year | | | (65 | ) | | | (254 | ) | | | — | | | | — | | | | — | | | | — | |
| Shares issued under employee share schemes | | | 119 | | | | 146 | | | | — | | | | — | | | | 7 | | | | — | |
| At 31 December | | | (61 | ) | | | (115 | ) | | | (7 | ) | | | — | | | | — | | | | (7 | ) |
| | | | | | | | | | | | | | | | | | | | | | | | | |
| Owners’ equity at 31 December | | | 53,038 | | | | 40,227 | | | | 35,435 | | | | 24,877 | | | | 18,197 | | | | 17,538 | |
The merger reserve comprises the premium on shares issued to acquire NatWest less goodwill amortisation charged under previous GAAP. No share premium was recorded in the company financial statements through the operation of the merger relief provisions of the Companies Act 1985.
UK law prescribes that only the reserves of the company are taken into account for the purpose of making distributions and in determining the permissible applications of the share premium account.
The Group optimises capital efficiency by maintaining reserves in subsidiaries, including regulated entities. Certain preference shares and subordinated debt are also included within regulatory capital. The remittance of reserves to the parent or the redemption of shares or subordinated capital by regulated entities may be subject to maintaining the capital resources required by the relevant regulator.
At 31 December 2007, 10,474,782 (2006 – 19,492,506) ordinary shares of 25p each of the company were held by Employee Share Trusts in respect of share awards and options granted to employees.
Paid-in equity represents notes issued under the company’s euro medium term note programme with par value of US$1,600 million and CAD600 million that are classified as equity under IFRS. The notes attract coupons of 6.99% and 6.666% respectively until October 2017 when they increase to 2.67% above the London interbank offered rate for 3-month US dollar deposits and 2.76% above the Canadian dollar offered rate respectively.
Notes on the accounts continued
28 Leases
Minimum amounts receivable and payable under non-cancellable leases.
| | | Group | |
| | | Year in which receipt or payment will occur | |
| | | | | | After 1 year | | | | | | | |
| | | Within 1 | | | but within | | | After 5 | | | | |
| | | year | | | 5 years | | | years | | | Total | |
| 2007 | | | £m | | | | £m | | | | £m | | | | £m | |
| Finance lease assets: | | | | | | | | | | | | | | | | |
| Amounts receivable | | | 1,297 | | | | 4,968 | | | | 11,648 | | | | 17,913 | |
| Present value adjustment | | | (390 | ) | | | (1,766 | ) | | | (3,187 | ) | | | (5,343 | ) |
| Other movements | | | (23 | ) | | | (144 | ) | | | (288 | ) | | | (455 | ) |
| Present value amounts receivable | | | 884 | | | | 3,058 | | | | 8,173 | | | | 12,115 | |
| | | | | | | | | | | | | | | | | |
| Operating lease assets: | | | | | | | | | | | | | | | | |
| Future minimum lease receivables | | | 1,073 | | | | 3,046 | | | | 1,473 | | | | 5,592 | |
| | | | | | | | | | | | | | | | | |
| Operating lease obligations: | | | | | | | | | | | | | | | | |
| Future minimum lease payables: | | | | | | | | | | | | | | | | |
| Premises | | | 350 | | | | 1,210 | | | | 3,017 | | | | 4,577 | |
| Equipment | | | 9 | | | | 14 | | | | — | | | | 23 | |
| | | | 359 | | | | 1,224 | | | | 3,017 | | | | 4,600 | |
| 2006 | | | | | | | | | | | | | | | | |
| Finance lease assets: | | | | | | | | | | | | | | | | |
| Amounts receivable | | | 1,235 | | | | 4,331 | | | | 11,166 | | | | 16,732 | |
| Present value adjustment | | | (453 | ) | | | (1,648 | ) | | | (3,110 | ) | | | (5,211 | ) |
| Other movements | | | (22 | ) | | | (80 | ) | | | (295 | ) | | | (397 | ) |
| Present value amounts receivable | | | 760 | | | | 2,603 | | | | 7,761 | | | | 11,124 | |
| | | | | | | | | | | | | | | | | |
| Operating lease assets: | | | | | | | | | | | | | | | | |
| Future minimum lease receivables | | | 444 | | | | 2,391 | | | | 2,640 | | | | 5,475 | |
| | | | | | | | | | | | | | | | | |
| Operating lease obligations: | | | | | | | | | | | | | | | | |
| Future minimum lease payables: | | | | | | | | | | | | | | | | |
| Premises | | | 332 | | | | 1,151 | | | | 1,877 | | | | 3,360 | |
| Equipment | | | 7 | | | | 6 | | | | — | | | | 13 | |
| | | | 339 | | | | 1,157 | | | | 1,877 | | | | 3,373 | |
| | | | | | | | | | | | | | | | | |
| | | | | | | | | | | | | | | | | |
| | | | | | | | | | | Group | |
| | | | | | | | | | | 2007 | | | 2006 | |
| | | | | | | | | | | | £m | | | | £m | |
| Nature of operating lease assets in balance sheet | | | | | | | | | | | | | | | | |
| Transportation | | | | | | | | | | | 6,859 | | | | 7,414 | |
| Cars and light commercial vehicles | | | | | | | | | | | 1,390 | | | | 1,204 | |
| Other | | | | | | | | | | | 441 | | | | 291 | |
| | | | | | | | | | | | 8,690 | | | | 8,909 | |
| | | | | | | | | | | | | | | | | |
| Amounts recognised as income and expense | | | | | | | | | | | | | | | | |
| Finance lease receivables – contingent rental income | | | | | | | | | | | (23 | ) | | | (37 | ) |
| Operating lease payables – minimum payments | | | | | | | | | | | 322 | | | | 366 | |
| | | | | | | | | | | | | | | | | |
Contracts for future capital expenditure not provided for at the year end | | | | | | | | | | | | | | | | |
| Operating leases | | | | | | | | | | | 545 | | | | 1,437 | |
| | | | | | | | | | | | | | | | | |
| Finance lease receivables | | | | | | | | | | | | | | | | |
| Unearned finance income | | | | | | | | | | | 5,343 | | | | 5,211 | |
| Accumulated allowance for uncollectable minimum lease receivables | | | | | | | | | | | 63 | | | | 67 | |
Residual value exposures
The tables below give details of the unguaranteed residual values included in the carrying value of finance lease receivables (see page 130) and operating lease assets (see page 146).
| | | Year in which residual value will be recovered | |
| | | | | | After 1 year | | | After 2 years | | | | | | | |
| | | Within 1 | | | but within | | | but within | | | After 5 | | | | |
| | | year | | | 2 years | | | 5 years | | | years | | | Total | |
| 2007 | | | £m | | | | £m | | | | £m | | | | £m | | | | £m | |
| Operating leases | | | | | | | | | | | | | | | | | | | | |
| Transportation | | | 485 | | | | 253 | | | | 1,762 | | | | 2,505 | | | | 5,005 | |
| Cars and light commercial vehicles | | | 331 | | | | 467 | | | | 118 | | | | — | | | | 916 | |
| Other | | | 26 | | | | 47 | | | | 64 | | | | 18 | | | | 155 | |
| Finance leases | | | 23 | | | | 29 | | | | 115 | | | | 288 | | | | 455 | |
| | | | 865 | | | | 796 | | | | 2,059 | | | | 2,811 | | | | 6,531 | |
| 2006 | | | | | | | | | | | | | | | | | | | | |
| Operating leases | | | | | | | | | | | | | | | | | | | | |
| Transportation | | | 1,054 | | | | 180 | | | | 1,339 | | | | 2,517 | | | | 5,090 | |
| Cars and light commercial vehicles | | | 168 | | | | 295 | | | | 329 | | | | — | | | | 792 | |
| Other | | | 13 | | | | 30 | | | | 77 | | | | 24 | | | | 144 | |
| Finance leases | | | 22 | | | | 22 | | | | 58 | | | | 295 | | | | 397 | |
| | | | 1,257 | | | | 527 | | | | 1,803 | | | | 2,836 | | | | 6,423 | |
The Group provides asset finance to its customers through acting as a lessor. It purchases plant, equipment and intellectual property, renting them to customers under lease arrangements that, depending on their terms, qualify as either operating or finance leases.
29 Collateral
Securities repurchase agreements and lending transactions
The Group enters into securities repurchase agreements and securities lending transactions under which it receives or transfers collateral in accordance with normal market practice. Generally, the agreements require additional collateral to be provided if the value of the securities fall below a predetermined level.
Under standard terms for repurchase transactions in the UK and US markets, the recipient of collateral has an unrestricted right to sell or repledge it, subject to returning equivalent securities on settlement of the transaction.
The fair value (and carrying value) of securities transferred under repurchase transactions included within securities on the balance sheet were as follows:
| | | 2007 | | | 2006 | |
| | | | £m | | | | £m | |
| Treasury and other eligible bills | | | 7,090 | | | | 1,426 | |
| Debt securities | | | 100,561 | | | | 58,874 | |
| | | | 107,651 | | | | 60,300 | |
All of the above securities could be sold or repledged by the holder. Securities received as collateral under reverse repurchase agreements amounted to £373.7 billion (2006 – £124.7 billion), of which £337.8 billion (2006 – £107.2 billion) had been resold or repledged as collateral for the Group’s own transactions.
| Other collateral given | | | | | | |
| | | 2007 | | | 2006 | |
| Group assets charged as security for liabilities | | | £m | | | | £m | |
| Loans and advances to banks | | | 753 | | | | 469 | |
| Loans and advances to customers | | | 80,719 | | | | 44,966 | |
| Debt securities | | | 29,709 | | | | 8,560 | |
| Property, plant and equipment | | | 935 | | | | 1,222 | |
| Other | | | 1,765 | | | | 13 | |
| | | | 113,881 | | | | 55,230 | |
| | | | | | | | | |
| | | | | | | | | |
| | | 2007 | | | 2006 | |
| Liabilities secured by charges on Group assets | | | £m | | | | £m | |
| Deposits by banks | | | 21,693 | | | | 11,680 | |
| Customer accounts | | | 6,670 | | | | 7,095 | |
| Debt securities in issue | | | 65,080 | | | | 27,607 | |
| Other liabilities | | | — | | | | 45 | |
| | | | 93,443 | | | | 46,427 | |
Of the assets above, £62.0 billion (2006 – £30.1 billion) relate to securitisations (see Note 30). The remaining balances mainly relate to assets charged as security against deposits from central and federal banks and other public sector bodies.
Notes on the accounts continued
30 Securitisations and other asset transfers
In the normal course of business, the Group arranges securitisations to facilitate client transactions and undertakes securitisations to sell financial assets or to fund specific portfolios of assets. The Group also acts as an underwriter and depositor in securitisation transactions involving both client and proprietary transactions. In a securitisation, assets, or interests in a pool of assets, are transferred generally to a special purpose entity (“SPE”) which then issues liabilities to third party investors.
SPEs are vehicles set up for a specific, limited purpose, usually do not carry out a business or trade and typically have no employees. They take a variety of legal forms – trusts, partnerships and companies – and fulfil many different functions. As well as being a key element of securitisations, SPEs are also used in fund management activities to segregate custodial duties from the fund management advice provided by the Group.
Securitisations may, depending on the individual arrangement, result in continued recognition of the securitised assets; continued recognition of the assets to the extent of the Group’s continuing involvement in those assets; or derecognition of the assets and the separate recognition, as assets or liabilities, of any rights and obligations created or retained in the transfer (see Accounting policy on page 111). The Group has securitisations in each of these categories.
Continued recognition
The table below sets out the asset categories together with the carrying amounts of the assets and associated liabilities for those securitisations and other asset transfers where substantially all the risks and rewards of the assets have been retained by the Group.
| | | 2007 | | | | | | 2006 | | | | |
| | | Assets | | | Liabilities | | | Assets | | | Liabilities | |
| Asset type | | | £m | | | | £m | | | | £m | | | | £m | |
| Residential mortgages | | | 23,652 | | | | 23,436 | | | | 15,698 | | | | 15,375 | |
| Credit card receivables | | | 2,948 | | | | 2,664 | | | | 2,891 | | | | 2,585 | |
| Other loans | | | 1,703 | | | | 1,149 | | | | 1,931 | | | | 1,346 | |
| Commercial paper conduits | | | 32,613 | | | | 31,193 | | | | 8,360 | | | | 8,284 | |
| Finance lease receivables | | | 1,038 | | | | 823 | | | | 1,211 | | | | 953 | |
Residential mortgages securitisations – the Group has securitised portfolios of residential mortgages. Mortgages have been transferred to SPEs, held ultimately by charitable trusts, funded principally through the issue of floating rate notes. The Group has entered into arm’s length fixed/floating interest rate swaps and cross-currency swaps with the securitisation SPEs and provides mortgage management and agency services to the SPEs. On repayment of the financing, any further amounts generated by the mortgages will be paid to the Group. The SPEs are consolidated and the mortgages remain on the Group’s balance sheet.
Credit card securitisations – credit card receivables in the UK have been securitised. Notes have been issued by an SPE. The note holders have a proportionate interest in a pool of credit card receivables that have been equitably assigned by the Group to a receivables trust. The Group continues to be exposed to the risks and rewards of the transferred receivables through its right to excess spread (after charge-offs). The SPE is consolidated and the credit card receivables remain on the Group’s balance sheet.
Other securitisations – other loans originated by the Group have been transferred to SPEs funded through the issue of notes. Any proceeds from the loans in excess of the amounts required to service and repay the notes are payable to the Group after deduction of expenses. The SPEs are consolidated and the loans remain on the Group’s balance sheet.
Commercial paper conduits – the Group sponsors commercial paper conduits. Customer assets are transferred into SPEs which issue notes in the commercial paper market. The Group supplies certain services and contingent liquidity support to these SPEs on an arm’s length basis as well as programme credit enhancement. The SPEs are consolidated.
Finance lease receivables – certain finance lease receivables (leveraged leases) in the US involve the Group as lessor obtaining non-recourse funding from third parties. This financing is secured on the underlying leases and the provider of the finance has no recourse whatsoever to the other assets of the Group. The transactions are recorded gross of third-party financing.
Continuing involvement
In certain securitisations of US residential mortgages, substantially all the risks and rewards have been neither transferred nor retained, but the Group has retained control, as defined by IFRS, of the assets and continues to recognise the assets to the extent of its continuing involvement which takes the form of retaining certain subordinated bonds issued by the securitisation SPEs. These bonds have differing rights and, depending on their terms, they may expose the Group to interest rate risk where they carry a fixed coupon or to credit risk depending on the extent of their subordination. Certain bonds entitle the Group to additional interest if the portfolio performs better than expected and others give the Group the right to prepayment penalties received on the securitised mortgages. At 31 December 2007, securitised assets were £18.1 billion (2006 – £37.3 billion); retained interests £1,037 million (2006 – £930 million); subordinated assets £314 million (2006 – £694 million) and related liabilities £314 million (2006 –£694 million).
Derecognition
Other securitisations of the Group’s financial assets in the US qualify for derecognition as substantially all the risks and rewards of the assets have been transferred. The Group continues to recognise any retained interests in the securitisation vehicles.
31 Risk management
Financial risk management policies and objectives
The Group Board of directors sets the overall risk appetite and philosophy; the risk and capital framework underpins delivery of the Board’s strategy.
Risk and capital
It is the Group’s policy to optimise return to shareholders while maintaining a strong capital base and credit rating to support business growth and meet regulatory capital requirements at all times.
Risk appetite is measured as the maximum level of retained risk the Group will accept to deliver its business objectives. Risk appetite is generally defined through both quantitative and qualitative techniques including stress testing, risk concentration, value-at-risk and risk underwriting criteria, ensuring that appropriate principles, policies and procedures are in place and applied.
The main financial risks facing the Group are as follows:
| • | Credit risk: is the risk arising from the possibility that the Group will incur losses from the failure of customers to meet their obligations. |
| | |
| • | Funding and liquidity risk: is the risk that the Group is unable to meet its obligations as they fall due. |
| | |
| • | Market risk: the Group is exposed to market risk because of positions held in its trading portfolios and its non-trading businesses. |
| | |
| • | Equity risk: gains or losses on equity investments. |
| | |
| • | Insurance risk: the Group is exposed to insurance risk, either directly through its businesses or through using insurance as a tool to mitigate other risk exposures. |
Credit risk
Credit risk is managed to achieve sustainable and superior risk-reward performance while maintaining exposures within acceptable risk appetite parameters. This is achieved through the combination of governance, policies, systems and controls, underpinned by sound commercial judgement as described below.
| • | Policies and risk appetite: policies provide a clear framework for the assessment, approval, monitoring and management of credit risk where risk appetite sets the tolerance of loss. Limits are used to manage concentration risk by single name, sector and country. |
| | |
| • | Decision makers: credit authority is granted to independent persons or committees with the appropriate experience, seniority and commercial judgement. Credit authority is not extended to relationship managers. Specialist internal credit risk departments independently oversee the credit process and make credit decisions or recommendations to the appropriate credit committee. |
| | |
| • | Models: credit models are used to measure and assess risk decisions and to aid on-going monitoring. Measures, such as Probability of Default, Exposure at Default, Loss Given Default (see page 168) and Expected Loss are calculated using duly authorised models. All credit models are subject to independent review prior to implementation and existing models are reviewed on at least an annual basis. |
Notes on the accounts continued
31 Risk management (continued)
| • | Mitigation techniques to reduce the potential for loss: credit risk may be mitigated by the taking of financial or physical security, the assignment of receivables or the use of credit derivatives, guarantees, risk participations, credit insurance, set off or netting. |
| | |
| • | Risk systems and data quality: systems are well organised to produce timely, accurate and complete inputs for risk reporting and to administer key credit processes. |
| | |
| • | Analysis and reporting: portfolio analysis and reporting are used to ensure the identification of emerging concentration risks and adverse movements in credit risk quality. |
| | |
| • | Stress testing: stress testing forms an integral part of portfolio analysis, providing a measure of potential vulnerability to exceptional but plausible economic and geopolitical events which assists management in the identification of risk not otherwise apparent in more benign circumstances. Stress testing informs risk appetite decisions. |
| | |
| • | Portfolio management: active management of portfolio concentrations as measured by risk reporting and stress testing, where credit risk may be mitigated through promoting asset sales, buying credit protection or curtailing risk appetite for new transactions. |
| | |
| • | Credit stewardship: customer transaction monitoring and management is a continuous process, ensuring performance is satisfactory and that documentation, security and valuations are complete and up to date. |
| | |
| • | Problem debt identification: policies and systems encourage the early identification of problems and the employment of specialised staff focused on collections and problem debt management. |
| | |
| • | Provisioning: independent assessment using best practice models for collective and latent loss. Professional evaluation is applied to individual cases, to ensure that such losses are comprehensively identified and adequately provided for. |
| | |
| • | Recovery: maximising the return to the Group through the recovery process. |
Credit risk models
Credit risk models are used throughout the Group to support the analytical elements of the credit risk management framework, in particular the risk assessment part of the credit approval process, ongoing monitoring as well as portfolio analysis and reporting. Credit risk models used by the Group can be broadly grouped into three categories.
| • | Probability of default (“PD”): the likelihood that a customer will fail to make full and timely repayment of credit obligations over a one year time horizon. Customers are assigned an internal credit grade which corresponds to probability of default. Every customer credit grade across all grading scales in the Group can be mapped to a Group level credit grade (see page 55). |
| | |
| • | Exposure at default (“EAD”): such models estimate the expected level of utilisation of a credit facility at the time of a borrower’s default. The EAD is typically higher than the current utilisation (e.g. in the case where further drawings are made on a revolving credit facility prior to default) but will not typically exceed the total facility limit. |
| | |
| • | Loss given default (“LGD”): models estimate the economic loss that may occur in the event of default, being the debt that cannot be recovered. The Group’s LGD models take into account the type of borrower, facility and any risk mitigation such as security or collateral held. |
Loan impairment
The Group classifies impaired assets as either Risk Elements in Lending (REIL) or Potential Problem Loans (PPL). REIL represents non-accrual loans, loans that are accruing but are past due 90 days and restructured loans. PPL represents impaired assets which are not included in REIL but where information about possible credit problems cause management to have serious doubts about the future ability of the borrower to comply with loan repayment terms.
Both REIL and PPL are reported gross of the value of any security held, which could reduce the eventual loss should it occur, and gross of any provision marked. Therefore impaired assets which are highly collateralised, such as mortgages, will have a low coverage ratio of provisions held against reported impaired balance.
The table below sets out the Group’s loans that are classified as REIL and PPL:
| | | 2007 | | | 2006 | |
| REIL and PPL | | | £m | | | | £m | |
Non-accrual loans (1) | | | 10,362 | | | | 6,232 | |
Accrual loans past due 90 days (2) | | | 369 | | | | 105 | |
Troubled debt restructurings (3) | | | — | | | | — | |
| Total REIL | | | 10,731 | | | | 6,337 | |
PPL (4) | | | 671 | | | | 52 | |
| Total REIL and PPL | | | 11,402 | | | | 6,389 | |
REIL and PPL as % of customer loans and advances – gross (5) | | | 1.64 | % | | | 1.57 | % |
The sub-categories of REIL and PPL are calculated as described in notes 1 to 4 below.
| | Notes: |
| | |
(1) | All loans against which an impairment provision is held are reported in the non-accrual category. |
| | |
(2) | Loans where an impairment event has taken place but no impairment recognised. This category is used for fully collateralised non-revolving credit facilities. |
| | |
(3) | Troubled debt restructurings represent loans that have been restructured following the granting of a concession by the Group to the borrower. |
| | |
(4) | Loans for which an impairment event has occurred but no impairment provision is necessary. This category is used for fully collateralised advances and revolving credit facilities where identification as 90 days overdue is not feasible. |
| | |
(5) | Gross of provisions and excluding reverse repurchase agreements. |
Impairment loss provision methodology
Provisions for impairment losses are assessed under three categories as described below:
Individually assessed provisions are the provisions required for individually significant impaired assets which are assessed on a case by case basis, taking into account the financial condition of the counterparty and any guarantor. This incorporates an estimate of the discounted value of any recoveries and realisation of security or collateral. The asset continues to be assessed on an individual basis until it is repaid in full, transferred to the performing portfolio or written-off.
Collectively assessed provisions are provisions on impaired credits below an agreed threshold which are assessed on a portfolio basis, to reflect the homogeneous nature of the assets, such as credit cards or personal loans. The provision is determined from a quantitative review of the relevant portfolio, taking account of the level of arrears, security and average loss experience over the recovery period.
Latent loss provisions are provisions held against the estimated impairment in the performing portfolio which have yet to be identified as at the balance sheet date. To assess the latent loss within the portfolios, the Group has developed methodologies to estimate the time that an asset can remain impaired within a performing portfolio before it is identified and reported as such.
Provision analysis
The Group’s consumer portfolios, which consist of small value, high volume credits, have highly efficient largely automated processes for identifying problem credits and very short timescales, typically three months, before resolution or adoption of various recovery methods.
Corporate portfolios consist of higher value, low volume credits, which tend to be structured to meet individual customer requirements. Provisions are assessed on a case by case basis by experienced specialists, with input from professional valuers and accountants as appropriate. The Group operates a provisions governance framework which sets thresholds whereby suitable oversight and challenge is undertaken. These opinions and levels of provision are overseen by each division’s Provision Committee. Significant cases are presented to, and challenged by, the Group Problem Exposure Review Forum.
Early and active management of problem exposures ensures that credit losses are minimised. Specialised units are used for different customer types to ensure that the appropriate risk mitigation is taken in a timely manner.
Portfolio provisions are reassessed regularly as part of the Group’s ongoing monitoring process.
nts
Notes on the accounts continued
31 Risk management (continued)
The following table shows an analysis of the loan impairment charge.
| | | 2007 | | | 2006 | | | 2005 | |
| Loan impairment charge | | | £m | | | | £m | | | | £m | |
| Latent loss provisions charge | | | 88 | | | | 87 | | | | 14 | |
| Collectively assessed provisions charge | | | 1,744 | | | | 1,573 | | | | 1,399 | |
| Individually assessed provisions charge | | | 274 | | | | 217 | | | | 290 | |
| Total charge to income statement | | | 2,106 | | | | 1,877 | | | | 1,703 | |
| | | | | | | | | | | | | |
Charge as a % of customer loans and advances – gross (1) | | | 0.30% | | | | 0.46% | | | | 0.46% | |
| | Note: |
| | |
| (1) | Gross of provisions and excluding reverse repurchase agreements. |
Liquidity risk
The Group’s liquidity policy is designed to ensure that it can at all times meet its obligations as they fall due.
Liquidity management within the Group focuses on overall balance sheet structure and the control, within prudent limits, of risk arising from exposure to the mismatch of maturities across the balance sheet and from undrawn commitments and other contingent obligations. The management of liquidity risk within the Group is undertaken within limits and other policy parameters set by Group Asset and Liability Management Committee (GALCO). Compliance is monitored and coordinated by Group Treasury both in respect of internal policy and the regulatory requirements of the Financial Services Authority. In addition, all subsidiaries and branches outside the UK ensure compliance with any local regulatory liquidity requirements and are subject to Group Treasury oversight.
Diversification of funding sources
The structure of the Group’s balance sheet is managed to maintain substantial diversification, to minimise concentration across its various deposit sources, and to limit the reliance on total short-term wholesale sources of funds (gross and net of repos) within prudent levels.
During 2007, the Group’s funding sources remained well diversified by counterparty, instrument and maturity, both before and after the acquisition of ABN AMRO in October 2007.
| | | 2007 | | | | | | 2006 | | | | |
| Sources of funding | | | £m | | | % | | | | £m | | | % | |
| Customer accounts (excluding repos) | | | | | | | | | | | | | | |
| Repayable on demand | | | 346,074 | | | | 24 | | | | 197,771 | | | | 28 | |
| Time deposits | | | 201,375 | | | | 14 | | | | 122,467 | | | | 17 | |
| Total customer accounts (excluding repos) | | | 547,449 | | | | 38 | | | | 320,238 | | | | 45 | |
Debt securities in issue over one year remaining maturity | | | 117,873 | | | | 8 | | | | 44,006 | | | | 6 | |
| Subordinated liabilities | | | 37,979 | | | | 3 | | | | 27,654 | | | | 4 | |
| Owners’ equity | | | 53,038 | | | | 4 | | | | 40,227 | | | | 6 | |
| Total customer accounts and long term funds | | | 756,339 | | | | 53 | | | | 432,125 | | | | 61 | |
| Repo agreements with customers | | | 134,916 | | | | 10 | | | | 63,984 | | | | 9 | |
| Repo agreements with banks | | | 163,038 | | | | 11 | | | | 76,376 | | | | 11 | |
Total customer accounts, long term funds and collateralised borrowing | | | 1,054,293 | | | | 74 | | | | 572,485 | | | | 81 | |
Debt securities in issue up to one year remaining maturity | | | 155,742 | | | | 11 | | | | 41,957 | | | | 5 | |
| Deposits by banks (excluding repos) | | | 149,595 | | | | 10 | | | | 55,767 | | | | 8 | |
| Short positions | | | 73,501 | | | | 5 | | | | 43,809 | | | | 6 | |
Total | | | 1,433,131 | | | | 100 | | | | 714,018 | | | | 100 | |
Net customer activity
| | | 2007 | | | 2006 | |
| | | | £m | | | | £m | |
| Loans and advances to customers (gross, excluding reverse repos) | | | 693,331 | | | | 407,918 | |
| Customer accounts (excluding repos) | | | 547,449 | | | | 320,238 | |
| Customer lending less customer accounts | | | 145,882 | | | | 87,680 | |
| Loans and advances to customers as a % of customer accounts (excluding repos) | | | 126.6% | | | | 127.4% | |
Management of term structure
The Group evaluates on a regular basis its structural liquidity risk and applies a variety of balance sheet management and term funding strategies to maintain this risk within its normal policy parameters.
The degree of maturity mismatch within the overall long-term structure of the Group’s assets and liabilities is managed within internal policy guidelines, to ensure that term asset commitments may be funded on an economic basis over their life. In managing its overall term structure, the Group analyses and takes into account the effect of retail and corporate customer behaviour on actual asset and liability maturities where they differ materially from the underlying contractual maturities.
Stress testing
The Group performs stress tests to simulate how events may impact its funding and liquidity capabilities. Such tests inform the overall balance sheet structure and help define prudent limits for control of the risk arising from the mismatch of maturities across the balance sheet and from undrawn commitments and other contingent obligations. The nature of stress tests is kept under review in line with evolving market conditions.
Daily management
The short-term maturity structure of the Group’s liabilities and assets is managed daily to ensure that all material or potential cash flow obligations arising from undrawn commitments and other contingent obligations, can be met. Potential sources include cash inflows from maturing assets, new borrowing or the sale of various debt securities held (after allowing for appropriate haircuts).
Short-term liquidity risk is generally managed on a consolidated basis with internal liquidity mismatch limits set for all subsidiaries and non-UK branches which have material local treasury activities, thereby assuring that the daily maintenance of the Group’s overall liquidity risk position is not compromised. ABN AMRO, Citizens Financial Group and RBS Insurance manage liquidity locally, given different regulatory regimes, subject to review by Group Treasury. As integration of ABN AMRO’s businesses within the Group proceeds, the liquidity risk policies, parameters and metrics used will be progressively aligned within a single framework.
31 Risk management (continued)
| | | | | | 2006 | |
| Net short-term wholesale market activity | | | £m | | | | £m | |
| Debt securities, listed held-for-trading equity shares, treasury and other eligible bills | | | 328,352 | | | | 135,775 | |
| Reverse repo agreements with banks and customers | | | 318,298 | | | | 117,060 | |
| Less: repos with banks and customers | | | (297,954 | ) | | | (140,360 | ) |
| Short positions | | | (73,501 | ) | | | (43,809 | ) |
| Insurance companies’ debt securities held | | | (8,062 | ) | | | (6,149 | ) |
| Debt securities charged as security for liabilities | | | (29,709 | ) | | | (8,560 | ) |
| Net marketable assets | | | 237,424 | | | | 53,957 | |
| | | | | | | | | |
| By remaining maturity up to one month: | | | | | | | | |
| Deposits by banks (excluding repos) | | | 112,181 | | | | 36,089 | |
| Less: loans and advances to banks (gross, excluding reverse repos) | | | (25,609 | ) | | | (21,136 | ) |
| Debt securities in issue | | | 66,289 | | | | 19,924 | |
| Net wholesale liabilities due within one month | | | 152,861 | | | | 34,877 | |
| | | | | | | | | |
| Net surplus of marketable assets over wholesale liabilities due within one month | | | 84,563 | | | | 19,080 | |
The following table shows cash flows payable on financial liabilities up to a period of 20 years including future payments of interest.
| | | Group | |
| | | 0-3 months | | | 3-12 months | | | 1-3 years | | | 3-5 years | | | 5-10 years | | | 10-20 years | |
| 2007 | | | £m | | | | £m | | | | £m | | | | £m | | | | £m | | | | £m | |
| Deposits by banks | | | 220,914 | | | | 21,580 | | | | 3,206 | | | | 2,225 | | | | 1,509 | | | | 434 | |
| Customer accounts | | | 561,003 | | | | 30,539 | | | | 9,430 | | | | 4,509 | | | | 11,615 | | | | 9,052 | |
| Debt securities in issue | | | 111,292 | | | | 37,292 | | | | 57,562 | | | | 34,917 | | | | 44,166 | | | | 4,223 | |
| Derivatives held for hedging | | | 252 | | | | 667 | | | | 822 | | | | 449 | | | | 605 | | | | 118 | |
| Subordinated liabilities | | | 641 | | | | 3,720 | | | | 5,603 | | | | 3,466 | | | | 22,735 | | | | 6,354 | |
| Settlement balances and other liabilities | | | 17,998 | | | | 5 | | | | 14 | | | | 6 | | | | 12 | | | | 7 | |
| | | | 912,100 | | | | 93,803 | | | | 76,637 | | | | 45,572 | | | | 80,642 | | | | 20,188 | |
| 2006 | | | | | | | | | | | | | | | | | | | | | | | | |
| Deposits by banks | | | 62,672 | | | | 5,733 | | | | 3,677 | | | | 2,591 | | | | 1,264 | | | | 153 | |
| Customer accounts | | | 324,933 | | | | 5,662 | | | | 1,349 | | | | 1,297 | | | | 2,521 | | | | 1,290 | |
| Debt securities in issue | | | 44,113 | | | | 10,949 | | | | 15,046 | | | | 7,571 | | | | 7,499 | | | | 5,005 | |
| Derivatives held for hedging | | | 25 | | | | 199 | | | | 300 | | | | 178 | | | | 210 | | | | 108 | |
| Subordinated liabilities | | | 953 | | | | 1,140 | | | | 3,689 | | | | 4,606 | | | | 12,788 | | | | 15,934 | |
| Settlement balances and other liabilities | | | 7,142 | | | | 20 | | | | 26 | | | | 16 | | | | 9 | | | | 4 | |
| | | | 439,838 | | | | 23,703 | | | | 24,087 | | | | 16,259 | | | | 24,291 | | | | 22,494 | |
Notes on the accounts continued
| | | Company | |
| | | 0-3 months | | | 3-12 months | | | 1-3 years | | | 3-5 years | | | 5-10 years | | | 10-20 years | |
| 2007 | | | £m | | | | £m | | | | £m | | | | £m | | | | £m | | | | £m | |
| Deposits by banks | | | 116 | | | | 5,544 | | | | — | | | | — | | | | — | | | | — | |
| Debt securities in issue | | | 824 | | | | 8,477 | | | | 3,447 | | | | 1,372 | | | | — | | | | — | |
| Derivatives held for hedging | | | 52 | | | | 1 | | | | — | | | | 2 | | | | — | | | | — | |
| Subordinated liabilities | | | 116 | | | | 347 | | | | 1,119 | | | | 1,045 | | | | 3,282 | | | | 3,909 | |
| | | | 1,108 | | | | 14,369 | | | | 4,566 | | | | 2,419 | | | | 3,282 | | | | 3,909 | |
| 2006 | | | | | | | | | | | | | | | | | | | | | | | | |
| Deposits by banks | | | 10 | | | | 30 | | | | 778 | | | | — | | | | — | | | | — | |
| Debt securities in issue | | | 537 | | | | 1,217 | | | | 474 | | | | — | | | | — | | | | — | |
| Subordinated liabilities | | | 553 | | | | 336 | | | | 1,145 | | | | 1,503 | | | | 3,117 | | | | 3,542 | |
| | | | 1,100 | | | | 1,583 | | | | 2,397 | | | | 1,503 | | | | 3,117 | | | | 3,542 | |
The tables above show the timing of cash outflows to settle financial liabilities. They have been prepared on the following basis:
Prepayable liabilities – where a financial liability can be prepaid by the counterparty, the cash outflow has been included at the earliest date on which the counterparty can require repayment regardless of whether or not such early repayment results in a penalty. If the repayment of a financial liability is triggered by, or is subject to, specific criteria such as market price hurdles being reached, it is included at the earliest possible date that the conditions could be fulfilled without considering the probability of the conditions being met. For example, if a structured note is automatically prepaid when an equity index exceeds a certain level, the cash outflow will be included in the less than three months period whatever the level of the index at the year end. The settlement date of debt securities in issue issued by certain securitisation vehicles consolidated by the Group depends on when cash flows are received from the securitised assets. Where these assets are prepayable, the timing of the cash outflow relating to securities assumes that each asset will be prepaid at the earliest possible date.
Liabilities with a contractual maturity of greater than 20 years – the principal amounts of financial liabilities that are repayable after 20 years or where the counterparty has no right to repayment of the principal are excluded from the table as are interest payments after 20 years.
Held-for-trading liabilities – held-for-trading liabilities amounting to £538.4 billion (2006 – £267.5 billion) have been excluded from the table in view of their short term nature.
Investment contracts – investment contracts issued by the Group’s life assurance businesses with a carrying value of £5.6 billion (2006 – £2.2 billion) are excluded from this analysis as their repayment is linked directly to the financial assets backing these contracts.
Financial assets held by the Group to meet these cash outflows include cash, balances at central banks and treasury bills of £36.1 billion (2006 – £11.6 billion), loans to banks and customers of £1,048.7 billion (2006 – £549.5 billion) including £452.4 billion (2006 – £288.9 billion) repayable within three months. The Group also held debt securities with a market value of £276.4 billion (2006 – £127.3 billion) of which £130.3 billion (2006 – £67.4 billion) were pledged to secure liabilities. Funds can be raised in the short-term from highly liquid securities held by the Group by sale or by disposal or by sale and repurchase transactions regardless of their stated maturity.
As explained above the table is prepared on the basis that prepayable liabilities are called at the earliest possible date. In practice, the average maturity of these liabilities significantly exceeds that shown in the table. In addition, although many customer accounts are contractually repayable on demand or at short notice, the Group’s short-term deposit base is stable over the long term as deposit rollovers and new deposits offset cash outflows.
The following table shows the expected maturity of insurance liabilities up to 20 years excluding those linked directly to the financial assets backing these contracts (2007 – £4,398 million; 2006 – £1,713 million).
| | | Group | |
| | | 0-3 months | | 3-12 months | | 1-3 years | | 3-5 years | | 5-10 years | | 10-20 years | |
| | | | £m | | | £m | | | £m | | | £m | | | £m | | | £m | |
| 2007 | | | 710 | | | 1,796 | | | 1,961 | | | 882 | | | 395 | | | 33 | |
| | | | | | | | | | | | | | | | | | | | |
| 2006 | | | 644 | | | 1,688 | | | 1,997 | | | 885 | | | 517 | | | 68 | |
Notes on the accounts continued
31 Risk management (continued)
Other contractual cash obligations
The table below summarises the Group’s other contractual cash obligations by payment date.
| | | | | | | Group | | | | | |
| | | 0-3 months | | 3-12 months | | 1-3 years | | 3-5 years | | 5-10 years | | 10-20 years | |
| 2007 | | | £m | | | £m | | | £m | | | £m | | | £m | | | £m | |
| Operating leases | | | 90 | | | 268 | | | 655 | | | 569 | | | 1,060 | | | 1,958 | |
| Contractual obligations to purchase goods or services | | | 441 | | | 1,007 | | | 748 | | | 199 | | | 5 | | | 2 | |
| | | | 531 | | | 1,275 | | | 1,403 | | | 768 | | | 1,065 | | | 1,960 | |
| 2006 | | | | | | | | | | | | | | | | | | | |
| Operating leases | | | 85 | | | 254 | | | 624 | | | 533 | | | 804 | | | 1,073 | |
| Contractual obligations to purchase goods or services | | | 378 | | | 449 | | | 969 | | | 101 | | | 114 | | | 39 | |
| | | | 463 | | | 703 | | | 1,593 | | | 634 | | | 918 | | | 1,112 | |
The Group’s undrawn formal facilities, credit lines and other commitments to lend were £335,688 million (2006 – £242,655 million). While the Group has given commitments to provide these funds, some facilities may be subject to certain conditions being met by the counterparty. The Group does not expect all facilities to be drawn, and some may lapse before drawdown.
Market risk
Market risk is defined as the risk of loss resulting from adverse changes in risk factors such as interest rates, foreign currency and equity prices together with related factors such as market volatilities.
The Group is exposed to market risk because of positions held in its trading portfolios as well as its non-trading business including the Group’s treasury operations.
Value-at-risk (“VaR”)
VaR is a technique that produces estimates of the potential negative change in the market value of a portfolio over a specified time horizon at given confidence levels. For internal risk management purposes, the Group’s VaR assumes a time horizon of one trading day and a confidence level of 95%. The Group uses historical simulation models in computing VaR. This approach, in common with many other VaR models, assumes that risk factor changes observed in the past are a good estimate of those likely to occur in the future and is, therefore, limited by the relevance of the historical data used. The Group’s method, however, does not make any assumption about the nature or type of underlying loss distribution. The Group typically uses the previous 500 trading days of market data.
The Group calculates both general market risk (i.e. the risk due to movement in general market benchmarks) and idiosyncratic market risk (i.e. the risk due to movements in the value of securities by reference to specific issuers) using its VaR models.
The Group’s VaR should be interpreted in light of the limitations of the methodology used. These limitations include:
• | Historical data may not provide the best estimate of the joint distribution of risk factor changes in the future and may fail to capture the risk of possible extreme adverse market movements which have not occurred in the historical window used in the calculations. |
| | |
• | VaR using a one-day time horizon does not fully capture the market risk of positions that cannot be liquidated or hedged within one day. |
| | |
• | VaR using a 95% confidence level does not reflect the extent of potential losses beyond that percentile. |
The Group largely computes the VaR of trading portfolios at the close of business and positions may change substantially during the course of the trading day. Further controls are in place to limit the Group’s intra-day exposure; such as the calculation of the VaR for selected portfolios. These limitations and the nature of the VaR measure mean that the Group cannot guarantee that losses will not exceed the VaR amounts indicated. The Group undertakes stress testing to identify the potential for losses in excess of VaR.
Trading
The primary focus of the Group’s trading activities is client facilitation – providing products to the Group’s client base at competitive prices. The Group also undertakes: market making – quoting firm bid (buy) and offer (sell) prices with the intention of profiting from the spread between the quotes; arbitrage –entering into offsetting positions in different but closely related markets in order to profit from market imperfections; and proprietary activity – taking positions in financial instruments as principal in order to take advantage of anticipated market conditions. The principal risk factors are interest rates, credit spreads, equity prices and foreign exchange. Financial instruments held in the Group’s trading portfolios include, but are not limited to, debt securities, loans, deposits, equity shares, securities sale and repurchase agreements and derivative financial instruments (futures, forwards, swaps and options). For a discussion of the Group’s accounting policies for derivative financial instruments, see Accounting policies on page 112.
The VaR for the Group’s trading portfolios segregated by type of market risk exposure, including idiosyncratic risk, is presented in the table below.
| | | | | 2007 | | | | | | | | | | 2006 | | | | | | | |
| | | Average | | Period end | | Maximum | | Minimum | | | Average | | | Period end | | | Maximum | | | Minimum | |
| Trading | | | £m | | | £m | | | £m | | | £m | | | | £m | | | | £m | | | | £m | | | | £m | |
| Interest rate | | | 12.5 | | | 15.0 | | | 21.8 | | | 7.6 | | | | 8.7 | | | | 10.2 | | | | 15.0 | | | | 5.7 | |
| Credit spread | | | 18.8 | | | 41.9 | | | 45.2 | | | 12.6 | | | | 13.2 | | | | 14.1 | | | | 15.7 | | | | 10.4 | |
| Currency | | | 2.6 | | | 3.0 | | | 6.9 | | | 1.1 | | | | 2.2 | | | | 2.5 | | | | 3.5 | | | | 1.0 | |
| Equity | | | 5.4 | | | 14.0 | | | 22.0 | | | 1.4 | | | | 1.1 | | | | 1.6 | | | | 4.4 | | | | 0.5 | |
| Commodity | | | 0.2 | | | 0.5 | | | 1.6 | | | — | | | | 0.2 | | | | — | | | | 1.1 | | | | — | |
| Diversification | | | | | | (28.7 | ) | | | | | | | | | | | | | (12.8 | ) | | | | | | | | |
| Total trading VaR | | | 21.6 | | | 45.7 | | | 50.1 | | | 13.2 | | | | 14.2 | | | | 15.6 | | | | 18.9 | | | | 10.4 | |
Non-trading
The principal market risks arising from the Group’s non-trading activities are interest rate risk, currency risk and equity risk.
Treasury activity and mismatches between the repricing of assets and liabilities in its retail and commercial banking operations account for most of the non-trading interest rate risk. Non-trading currency risk derives from the Group’s investments in overseas subsidiaries, associates and branches.
The Group’s strategic investment in Bank of China, venture capital portfolio and investments held by its general insurance business are the principal sources of non-trading equity price risk.
The Group’s portfolios of non-trading financial instruments mainly comprise loans (including finance leases), debt securities, equity shares, deposits, certificates of deposit and other debt securities issued, loan capital and derivatives. To reflect their distinct nature, the Group’s long-term assurance assets and liabilities attributable to policyholders have been excluded from these market risk disclosures.
Interest rate risk
Non-trading interest rate risk arises from the Group’s treasury activities and retail and commercial banking businesses.
Treasury
The Group’s treasury activities include its money market business and the management of internal funds flow within the Group’s businesses. Money market portfolios include cash instruments (principally debt securities, loans and deposits) and related hedging derivatives. VaR for the Group’s treasury portfolios, which relates mainly to interest rate risk including credit spreads, was £5.5 million at 31 December 2007 (2006 –£1.5 million). During the year the maximum VaR was £6.4 million (2006 – £4.4 million), the minimum £1.3 million (2006 –£0.6 million) and the average £3.7 million (2006 – £2.4 million).
Retail and commercial banking
Non-trading interest rate risk is calculated in each business on the basis of establishing the repricing behaviour of each asset, liability and off-balance sheet product. For many products, the actual interest rate repricing characteristics differ from the contractual repricing. In most cases, the repricing maturity is determined by the market interest rate that most closely fits the historical behaviour of the product interest rate. For non-interest bearing current accounts, the repricing maturity is determined by the stability of the portfolio. The repricing maturities used are approved by Group Treasury and divisional asset and liability committees at least annually. Key conventions are reviewed annually by GALCO.
A static maturity gap report is produced as at the month-end for each division, in each functional currency based on the behaviouralised repricing for each product. It is Group policy to include in the gap report, non-financial assets and liabilities, mainly property, plant and equipment and the Group’s capital and reserves, spread over medium and longer term maturities. This report also includes hedge transactions, principally derivatives.
Any residual non-trading interest rate exposures are controlled by limiting repricing mismatches in the individual business balance sheets. Potential exposures to interest rate movements in the medium to long term are measured and controlled using a version of the same VaR methodology that is used for the Group’s trading portfolios but without discount factors. Net accrual income exposures are measured and controlled in terms of sensitivity over time to movements in interest rates.
Notes on the accounts continued
31 Risk management (continued)
Risk is managed within limits approved by GALCO through the execution of cash and derivative instruments. Execution of the hedging is carried out by the relevant division through the Group’s treasury function. The residual risk position is reported to divisional asset and liability committees, GALCO and the Board.
Non-trading interest rate VaR
Non-trading interest rate VaR for the Group’s treasury and retail and commercial banking activities was £42.9 million at 31 December 2007 (2006 – £40.2 million) with the major exposure being to changes in longer term US dollar interest rates. During the year, the maximum VaR was £53.6 million (2006 – £98.7 million), the minimum £32.9 million (2006 – £40.2 million) and the average £43.2 million (2006 – £76.6 million).
Citizens was the main contributor to overall non-trading interest rate VaR. It invests in a portfolio of highly rated and liquid investments, principally mortgage-backed securities issued by US Government-backed entities. This balance sheet management approach is common for US retail banks where mortgages are originated and then sold to Federal agencies for funding through the capital markets.
Currency risk
The Group does not maintain material non-trading open currency positions other than the structural foreign currency translation exposures arising from its investments in foreign subsidiaries and associated undertakings and their related currency funding. The Group’s policy in relation to structural positions is to match fund the structural foreign currency exposure arising from net asset value, including goodwill, in foreign subsidiaries, equity accounted investments and branches, except where doing so would materially increase the sensitivity of either the Group’s or the subsidiary’s regulatory capital ratios to currency movements. The policy requires structural foreign exchange positions to be reviewed regularly by GALCO. Foreign exchange differences arising on the translation of foreign operations are recognised directly in equity together with the effective portion of foreign exchange differences arising on hedging instruments.
Equity classification of foreign currency denominated preference share issuances requires that these shares be held on the balance sheet at historic cost. Consequently, these share issuances have the effect of increasing the Group’s structural foreign currency position.
The tables below set out the Group’s structural foreign currency exposures.
| | Net investments in foreign operations | Net investment hedges | Structural foreign currency exposures |
| 2007 | £m | £m | £m |
| US dollar | 14,819 | 2,844 | 11,975 |
| Euro | 46,629 | 41,220 | 5,409 |
| Swiss franc | 910 | 863 | 47 |
| Chinese RMB | 2,600 | 1,938 | 662 |
| Brazilian real | 3,755 | — | 3,755 |
| Other non-sterling | 2,995 | 875 | 2,120 |
| | 71,708 | 47,740 | 23,968 |
| 2006 | | | |
| US dollar | 15,036 | 5,278 | 9,758 |
| Euro | 3,059 | 1,696 | 1,363 |
| Swiss franc | 462 | 457 | 5 |
| Chinese RMB | 3,013 | — | 3,013 |
| Other non-sterling | 132 | 107 | 25 |
| | 21,702 | 7,538 | 14,164 |
The exposure in Chinese RMB arises from the Group’s strategic investment in Bank of China.
Retranslation gains and losses on the Group’s net investments in operations together with those on instruments hedging these investments are recognised directly in equity. Changes in foreign currency exchange rates will affect equity in proportion to the structural foreign currency exposure. A five percent strengthening of foreign currencies would result in a loss of £1,140 million (2006 – £670 million) recognised in equity. A five percent weakening of foreign currencies would result in a gain of £1,200 million (2006 – £710 million) recognised in equity.
Equity risk
Non-trading equity positions can result in changes in the Group’s non-trading income and reserves arising from changes in equity prices/income.
The types, nature and amounts of exchange-traded exposures, private equity exposures, and other exposures vary significantly. Such exposures may take the form of listed and unlisted equity shares, equity warrants and options, linked equity fund investments, private equity and venture capital investments, preference shares classified as equity and capital stock in the Federal Home Loans Bank and Federal Reserve Bank.
Insurance risk
The Group is exposed to insurance risk, either directly through its businesses or through using insurance as a tool to reduce other risk exposures.
Insurance risk is the risk of fluctuations in the timing, frequency or severity of insured events, relative to the expectations of the Group at the time of underwriting.
Underwriting and pricing risk
The Group manages underwriting and pricing risk through the use of underwriting guidelines which detail the class, nature and type of business that may be accepted; pricing policies by product line and by brand; and centralised control of policy wordings and any subsequent changes.
Claims management risk
The risk that claims are handled or paid inappropriately is managed using a range of IT system controls and manual processes conducted by experienced staff. These, together with a range of detailed policies and procedures ensure that all claims are handled in a timely, appropriate and accurate manner.
Reinsurance risk
Reinsurance is used to protect against the impact of major catastrophic events or unforeseen volumes of, or adverse trends in, large individual claims and to transfer risk that is outside the Group’s current risk appetite.
Reinsurance of risks above the Group’s risk appetite is only effective if the reinsurance premium makes economic sense and the counterparty is financially secure. Acceptable reinsurers are rated A- or better unless specifically authorised.
Reserving risk
Reserving risk relates to both premiums and claims. It is the risk that reserves are assessed incorrectly such that insufficient funds have been retained to pay or handle claims as the amounts fall due. Claims development data provides information on the historical pattern of reserving risk.
| | | Accident year | |
| Insurance claims – gross | | | | | | | 2003 £m | | | | 2004 £m | | | | 2005 £m | | | | 2006 £m | | | | 2007 £m | | | | Total £m | |
| Estimate of ultimate claims costs: | | | | | | | | | | | | | | | | | | | | | | | | | | | | |
| At end of accident year | | | 3,013 | | | | 3,658 | | | | 3,710 | | | | 4,265 | | | | 4,269 | | | | 4,621 | | | | 23,536 | |
| One year later | | | 91 | | | | (140 | ) | | | (186 | ) | | | (92 | ) | | | (275 | ) | | | — | | | | (602 | ) |
| Two years later | | | 1 | | | | (106 | ) | | | (88 | ) | | | (147 | ) | | | — | | | | — | | | | (340 | ) |
| Three years later | | | (12 | ) | | | (55 | ) | | | (85 | ) | | | — | | | | — | | | | — | | | | (152 | ) |
| Four years later | | | (17 | ) | | | (47 | ) | | | — | | | | — | | | | — | | | | — | | | | (64 | ) |
| Five years later | | | (19 | ) | | | — | | | | — | | | | — | | | | — | | | | — | | | | (19 | ) |
| Current estimate of cumulative claims | | | 3,057 | | | | 3,310 | | | | 3,351 | | | | 4,026 | | | | 3,994 | | | | 4,621 | | | | 22,359 | |
| Cumulative payments to date | | | (2,893 | ) | | | (2,972 | ) | | | (2,825 | ) | | | (3,272 | ) | | | (2,947 | ) | | | (2,306 | ) | | | (17,215 | ) |
| | | | 164 | | | | 338 | | | | 526 | | | | 754 | | | | 1,047 | | | | 2,315 | | | | 5,144 | |
| Liability in respect of prior years | | | | | | | | | | | | | | | | | | | | | | | | | | | 202 | |
| Claims handling costs | | | | | | | | | | | | | | | | | | | | | | | | | | | 120 | |
| Gross general insurance claims liability | | | | | | | | | | | | | | | | | | | | | | | | | | | 5,466 | |
| | | | |
| | | Accident year | |
| Insurance claims – net of reinsurance | | | 2002 £m | | | | 2003 £m | | | | 2004 £m | | | | 2005 £m | | | | 2006 £m | | | | 2007 £m | | | | Total £m | |
| Estimate of ultimate claims costs: | | | | | | | | | | | | | | | | | | | | | | | | | | | | |
| At end of accident year | | | 2,584 | | | | 3,215 | | | | 3,514 | | | | 4,168 | | | | 4,215 | | | | 4,572 | | | | 22,268 | |
| One year later | | | 59 | | | | (106 | ) | | | (168 | ) | | | (67 | ) | | | (261 | ) | | | — | | | | (543 | ) |
| Two years later | | | (12 | ) | | | (103 | ) | | | (90 | ) | | | (161 | ) | | | — | | | | — | | | | (366 | ) |
| Three years later | | | (3 | ) | | | (53 | ) | | | (81 | ) | | | — | | | | — | | | | — | | | | (137 | ) |
| Four years later | | | (21 | ) | | | (44 | ) | | | — | | | | — | | | | — | | | | — | | | | (65 | ) |
| Five years later | | | (24 | ) | | | — | | | | — | | | | — | | | | — | | | | — | | | | (24 | ) |
| Current estimate of cumulative claims | | | 2,583 | | | | 2,909 | | | | 3,175 | | | | 3,940 | | | | 3,954 | | | | 4,572 | | | | 21,133 | |
| Cumulative payments to date | | | (2,473 | ) | | | (2,648 | ) | | | (2,721 | ) | | | (3,226 | ) | | | (2,771 | ) | | | (2,379 | ) | | | (16,218 | ) |
| | | | 110 | | | | 261 | | | | 454 | | | | 714 | | | | 1,183 | | | | 2,193 | | | | 4,915 | |
| Liability in respect of prior years | | | | | | | | | | | | | | | | | | | | | | | | | | | 168 | |
| Claims handling costs | | | | | | | | | | | | | | | | | | | | | | | | | | | 120 | |
| Net general insurance claims liability | | | | | | | | | | | | | | | | | | | | | | | | | | | 5,203 | |
Notes on the accounts continued
31 Risk management (continued)
Claims reserves
It is the Group’s policy to hold undiscounted claims reserves (including reserves to cover claims which have been incurred but not reported (IBNR reserves)) for all classes at a sufficient level to meet all liabilities as they fall due.
The Group’s focus is on high volume and relatively straightforward products, for example home and motor. This facilitates the generation of comprehensive underwriting and claims data, which are used to accurately price and monitor the risks accepted.
The following table indicates the diversity of risks underwritten and the corresponding loss ratios for each major class of business, gross and net of reinsurance.
| | | | 2007 | | 2006 | | 2005 |
| | | | Earned | Claims | Loss | | Earned | Loss | | Earned | Loss |
| | | | premiums | incurred | ratio | | premiums | ratio | | premiums | ratio |
| | | | £m | £m | % | | £m | % | | £m | % |
| Residential property | Gross | | 1,087 | 894 | 82 | | 1,121 | 56 | | 1,098 | 55 |
| | Net | | 1,020 | 878 | 86 | | 1,061 | 59 | | 1,037 | 56 |
| Personal motor | Gross | | 3,254 | 2,616 | 80 | | 3,384 | 84 | | 3,312 | 79 |
| | Net | | 3,161 | 2,560 | 81 | | 3,279 | 85 | | 3,257 | 80 |
| Commercial property | Gross | �� | 211 | 116 | 55 | | 218 | 37 | | 212 | 39 |
| | Net | | 191 | 115 | 60 | | 198 | 38 | | 193 | 40 |
| Commercial motor | Gross | | 142 | 107 | 75 | | 90 | 69 | | 102 | 53 |
| | Net | | 133 | 107 | 80 | | 88 | 68 | | 96 | 46 |
| Other | Gross | | 851 | 337 | 40 | | 842 | 47 | | 853 | 63 |
| | Net | | 839 | 340 | 41 | | 833 | 49 | | 761 | 67 |
| Total | Gross | | 5,545 | 4,070 | 73 | | 5,655 | 71 | | 5,577 | 70 |
| | Net | | 5,344 | 4,000 | 75 | | 5,459 | 73 | | 5,344 | 71 |
The Group has no interest rate exposure from general insurance liabilities because provisions for claims under short-term insurance contracts are not discounted.
Frequency and severity of specific risks and sources of uncertainty
Most general insurance contracts are written on an annual basis, which means that the Group’s liability extends for a 12 month period, after which the Group is entitled to decline or renew or can impose renewal terms by amending the premium, terms and conditions, or both.
The frequency and severity of claims and the sources of uncertainty for the key classes that the Group is exposed to are as follows:
a) Motor insurance contracts (private and commercial)
Claims experience is quite variable, due to a wide range of factors, but the principal ones are age, sex and driving experience of the driver, type and nature of vehicle, use of vehicle and area.
There are many sources of uncertainty that will affect the Group’s experience under motor insurance, including operational risk, reserving risk, premium rates not matching claims inflation rates, the weather, the social, economic and legislative environment and reinsurance failure risk.
b) Property insurance contracts (residential and commercial)
The major causes of claims for property insurance are theft, flood, escape of water, fire, storm, subsidence and various types of accidental damage.
The major source of uncertainty in the Group’s property accounts is the volatility of weather. Weather in the UK can affect most of the above perils. Over a longer period, the strength of the economy is also a factor.
c) Other commercial insurance contracts
Other commercial claims come mainly from business interruption and loss arising from the negligence of the insured (liability insurance). Business interruption losses come from the loss of income, revenue and/or profit as a result of property damage claims. Liability insurance includes employers liability and public/products liability. Liability insurance is written on an occurrence basis, and is subject to claims that are identified over a substantial period of time, but where the loss event occurred during the life of the policy.
Fluctuations in the social and economic climate are a source of uncertainty in the Group’s business interruption and general liability accounts. Other sources of uncertainty are changes in the law, or its interpretation, and reserving risk. Other uncertainties are significant events (for example terrorist attacks) and any emerging new heads of damage or types of claim that are not envisaged when the policy is written.
Life business
The Group’s three UK regulated life companies, National Westminster Life Assurance Limited, Royal Scottish Assurance plc (“RSA”) and Direct Line Life Insurance Company Limited, are required to meet minimum capital requirements at all times under the Financial Service Authority’s Prudential Sourcebook. The capital resources covering the regulatory requirement are not transferable to other areas of the Group. To ensure that the capital requirement is satisfied at all times, each company holds an additional voluntary buffer above the regulatory minimum.
The Group is not exposed to price, currency, credit, or interest risk on unit linked life contracts but it is exposed to variation in management fees. A decrease of 10% in the value of the assets would reduce the asset management fees by £2 million per annum (2006 – £5 million). The Group also writes insurance contracts with minimum guaranteed death benefits that expose it to the risk that declines in the value of underlying investments may increase the Group’s net exposure to death risk.
The Group’s long-term assurance contracts include whole-life, term assurance, endowment assurances, flexible whole life, pension and annuity contracts that are expected to remain in force for an extended period of time.
Contracts under which the Group does not accept significant insurance risk are classified as investment contracts. Long term business provisions are calculated in accordance with the UK accounting standard FRS 27 ‘Life Assurance’.
Estimations (assumptions) including future mortality, morbidity, persistency and levels of expenses are made in calculating actuarial reserves. Key metrics include:
| | Europe | | UK |
| Assumptions | 2007 | | 2007 | 2006 | 2005 |
| Valuation interest rate | | | | | |
| Term assurance | | | 3.00% | 3.00% | 2.85% |
| Interest | 4.06% | | 3.00% | 3.00% | 2.85% |
| Unit growth | 5.38% | | 3.50% | 3.50% | 2.85% |
| Expense inflation | 3.00% | | 4.00% | 4.00% | 4.00% |
Sample UK mortality rates, expressed as deaths per million per annum, for term assurance products (age 40).
| Mortality |
| Male non-smoker | 810 | 517 | 470 |
| Male smoker | 1,830 | 983 | 893 |
| Female non-smoker | 460 | 278 | 253 |
| Female smoker | 1,310 | 618 | 563 |
In 2007 the Group moved from the UK 80 series to the 00 series for mortality. In Europe there is an aggregate mortality rate of 1,117 deaths per million per annum (aged 40).
Expenses:
| | 2007 | 2006 | 2005 |
| Pre-2000 products – RSA | per annum | per annum | per annum |
| Lifestyle protection plan | £25.18 | £28.96 | £29.81 |
| Mortgage savings plan | £56.67 | £65.15 | £67.05 |
| | | | |
| Pre-2000 products – NatWest Life | | | |
| Term assurances | £26.01 | £26.01 | £26.79 |
| Single premium unit-linked bonds | £23.17 | £23.17 | £23.86 |
| | | | |
| Post-2000 products | | | |
| Term assurances | £23.16 | £23.16 | £23.97 |
| Guaranteed bonds | £25.71 | £25.71 | £26.92 |
Notes on the accounts continued
31 Risk management (continued)
Frequency and severity of claims – for contracts where death is the insured risk, the most significant factors that could increase the overall frequency of claims are epidemics or widespread changes in lifestyle, resulting in earlier or more claims than expected.
For contracts where survival is the insured risk, the most significant factor is continued improvement in medical science and social conditions that would increase longevity.
For contracts with fixed and guaranteed benefits and fixed future premiums, there are no mitigating terms and conditions that reduce the insurance risk accepted. Participating contracts can result in a significant portion of the insurance risk being shared with the insured party.
Sources of uncertainty in the estimation of future benefit payments and premium receipts – the Group uses base tables of standard mortality appropriate to the type of contract being written and the territory in which the insured person resides. These are adjusted to reflect the Group’s experience, mortality improvements and voluntary termination behaviour.
| Sensitivity factor | Description of sensitivity factor applied |
| Interest rate and investment return | Change in market interest rates of ±1%. |
| | The test allows consistently for similar changes to investment returns and |
| | movements in the market value of backing fixed interest securities. |
| Expenses | Increase in maintenance expenses of 10% |
| Assurance mortality/morbidity | Increase in mortality/morbidity rates for assurance contracts of 5% |
| Annuitant mortality | Reduction in mortality rates for annuity contracts of 5% |
The above UK sensitivity factors are applied via actuarial and statistical models, with the following impact on the financial statements.
| | | | | | Impact on profit and equity | |
| | | | | | 2007 | | | 2006 | |
| Risk factor | | Variability | | | | £m | | | | £m | |
| Interest rates | | | +1% | | | | (18 | ) | | | (19 | ) |
| Interest rates | | | –1% | | | | 15 | | | | 23 | |
| Expenses | | | +10% | | | | (5 | ) | | | (5 | ) |
| Assurance mortality/morbidity | | | +5% | | | | (8 | ) | | | (6 | ) |
| Annuitant mortality | | | –5% | | | | — | | | | — | |
Limitations of sensitivity analysis: the above tables demonstrate the effect of a change in a key UK assumption whilst other assumptions remain unaffected (assumptions related to ABN AMRO are not material). In reality, such an occurrence is unlikely, due to correlation between the assumptions and other factors. It should also be noted that these sensitivities are non-linear, and larger or smaller impacts should not be interpolated or extrapolated from these results. The sensitivity analyses do not take into consideration that assets and liabilities are actively managed and may vary at the time that any actual market movement occurs.
32 Capital resources
The Group’s regulatory capital resources at 31 December in accordance with Financial Services Authority (‘FSA’) definitions were as follows:
| | | 2007 | | | 2006 | |
| Composition of regulatory capital | | | £m | | | | £m | |
| Tier 1 capital: | | | | | | | | |
| Owners' equity and minority interests | | | 88,311 | | | | 41,700 | |
| Innovative tier 1 securities and preference shares transferred from subordinated liabilities | | | 6,919 | | | | 4,900 | |
| Goodwill capitalised and other intangible assets | | | (48,492 | ) | | | (18,904 | ) |
| Regulatory and other adjustments | | | (2,374 | ) | | | 2,345 | |
| Total qualifying tier 1 capital | | | 44,364 | | | | 30,041 | |
| | | | | | | | | |
| Tier 2 capital: | | | | | | | | |
| Unrealised gains on available-for-sale equities | | | 3,115 | | | | 3,790 | |
| Collective impairment allowances, net of taxes | | | 2,582 | | | | 2,267 | |
| Qualifying subordinated debt | | | 27,681 | | | | 21,024 | |
| Minority and other interests in tier 2 capital | | | 315 | | | | 410 | |
| Total qualifying tier 2 capital | | | 33,693 | | | | 27,491 | |
| | | | | | | | | |
| Total qualifying tier 3 capital | | | 200 | | | | — | |
| | | | | | | | | |
| Supervisory deductions: | | | | | | | | |
| Unconsolidated investments | | | 4,297 | | | | 3,870 | |
| Investments in other banks | | | 463 | | | | 5,203 | |
| Other deductions | | | 5,523 | | | | 1,510 | |
| Total regulatory capital | | | 67,974 | | | | 46,949 | |
It is the Group’s policy to maintain a strong capital base, to expand it as appropriate and to utilise it efficiently throughout its activities to optimise the return to shareholders while maintaining a prudent relationship between the capital base and the underlying risks of the business. In carrying out this policy, the Group has regard to the supervisory requirements of the FSA. The FSA uses Risk Asset Ratio (“RAR”) as a measure of capital adequacy in the UK banking sector, comparing a bank’s capital resources with its risk-weighted assets (the assets and off-balance sheet exposures are ‘weighted’ to reflect the inherent credit and other risks); by international agreement, the RAR should be not less than 8% with a tier 1 component of not less than 4%. The Group has complied with the FSA’s capital requirements throughout the year.
A number of subsidiaries and sub-groups within the Group, principally banking and insurance entities, are subject to various individual regulatory capital requirements in the UK and overseas.
Notes on the accounts continued
33 Memorandum items
Contingent liabilities and commitments
The amounts shown in the table below are intended only to provide an indication of the volume of business outstanding at 31 December. Although the Group is exposed to credit risk in the event of non-performance of the obligations undertaken by customers, the amounts shown do not, and are not intended to, provide any indication of the Group’s expectation of future losses.
| | | More than | More than | | | |
| | | 1 year but | 3 years but | | | |
| | Less than | less than | less than | Over | | |
| | 1 year | 3 years | 5 years | 5 years | 2007 | 2006 |
| Group | £m | £m | £m | £m | £m | £m |
| Contingent liabilities: | | | | | | |
| Guarantees and assets pledged as collateral security | 27,943 | 5,626 | 2,226 | 10,646 | 46,441 | 10,725 |
| Other contingent liabilities | 7,954 | 2,073 | 1,456 | 3,996 | 15,479 | 9,121 |
| | 35,897 | 7,699 | 3,682 | 14,642 | 61,920 | 19,846 |
| Commitments: | | | | | | |
| Undrawn formal standby facilities, credit lines and | | | | | | |
| other commitments to lend | | | | | | |
| – less than one year | 184,791 | — | — | — | 184,791 | 140,742 |
| – one year and over | 16,456 | 38,966 | 58,405 | 37,070 | 150,897 | 101,913 |
| Other commitments | 2,001 | 324 | 165 | 1 | 2,491 | 2,402 |
| | 203,248 | 39,290 | 58,570 | 37,071 | 338,179 | 245,057 |
Banking commitments and contingent obligations, which have been entered into on behalf of customers and for which there are corresponding obligations from customers, are not included in assets and liabilities. The Group’s maximum exposure to credit loss, in the event of non-performance by the other party and where all counterclaims, collateral or security proves valueless, is represented by the contractual nominal amount of these instruments included in the table. These commitments and contingent obligations are subject to the Group’s normal credit approval processes.
Contingent liabilities
Guarantees – the Group gives guarantees on behalf of customers. A financial guarantee represents an irrevocable undertaking that the Group will meet a customer’s obligations to third parties if the customer fails to do so. The maximum amount that the Group could be required to pay under a guarantee is its principal amount as disclosed in the table above. The Group expects most guarantees it provides to expire unused.
Other contingent liabilities – these include standby letters of credit, supporting customer debt issues and contingent liabilities relating to customer trading activities such as those arising from performance and customs bonds, warranties and indemnities.
Commitments
Commitments to lend – under a loan commitment the Group agrees to make funds available to a customer in the future. Loan commitments, which are usually for a specified term may be unconditionally cancellable or may persist, provided all conditions in the loan facility are satisfied or waived. Commitments to lend include commercial standby facilities and credit lines, liquidity facilities to commercial paper conduits and unutilised overdraft facilities.
Other commitments – these include documentary credits, which are commercial letters of credit providing for payment by the Group to a named beneficiary against presentation of specified documents, forward asset purchases, forward deposits placed and undrawn note issuance and revolving underwriting facilities, and other short-term trade related transactions.
Regulatory enquiries and investigations
In the normal course of business the Group and its subsidiaries co-operate with regulatory authorities in various jurisdictions in their enquiries or investigations into alleged or possible breaches of regulations.
As previously disclosed by ABN AMRO, the United States Department of Justice has been conducting a criminal investigation into ABN AMRO’s dollar clearing activities, Office of Foreign Assets Control compliance procedures and other Bank Secrecy Act compliance matters. ABN AMRO has cooperated and continues to cooperate fully with the investigation. Prior to the acquisition by the Group, ABN AMRO had reached an agreement in principle with the Department of Justice that would resolve all presently known aspects of the ongoing investigation by way of a Deferred Prosecution Agreement in return for a settlement payment by ABN AMRO of US$500 million (which amount was accrued by ABN AMRO in its interim financial statements for the six months ended 30 June 2007). Negotiations are continuing to enable a written agreement to be concluded.
Certain of the Group’s subsidiaries have received requests for information from various US governmental agencies and self-regulatory organisations including in connection with sub-prime mortgages and securitisations, collateralised debt obligations and synthetic products related to sub-prime mortgages. The Group and its subsidiaries are cooperating with these various requests for information and investigations.
Trustee and other fiduciary activities
In its capacity as trustee or other fiduciary role, the Group may hold or place assets on behalf of individuals, trusts, companies, pension schemes and others. The assets and their income are not included in the Group’s financial statements. The Group earned fee income of £695 million (2006 – £472 million; 2005 – £366 million) from these activities.
Litigation
Proceedings, including consolidated class actions on behalf of former Enron securities holders, have been brought in the United States against a large number of defendants, including the Group, following the collapse of Enron. The claims against the Group could be significant; the class plaintiff’s position is that each defendant is responsible for an entire aggregate damage amount less settlements – they have not quantified claimed damages against the Group in particular. The Group considers that it has substantial and credible legal and factual defences to these claims and will continue to defend them vigorously. Recent Supreme Court and Fifth Circuit decisions provide further support for the Group’s position. The Group is unable reliably to estimate the liability, if any, that might arise or its effect on the Group’s consolidated net assets, its operating results or cash flows in any particular period.
On 27 July 2007, following discussions between the Office of Fair Trading (‘OFT’), the Financial Ombudsman Service, the Financial Services Authority and all the major UK banks (including the Group) in the first half of 2007, the OFT issued proceedings in a test case against the banks including the Group to determine the legal status and enforceability of certain charges relating to unauthorised overdrafts. The hearing of the test case commenced on 17 January 2008. The Group maintains that its charges are fair and enforceable and is defending its position vigorously. It cannot, however, at this stage predict with any certainty the outcome of the test case and is unable reliably to estimate the liability, if any, that may arise or its effect on the Group’s consolidated net assets, operating results or cash flows in any particular period.
Members of the Group are engaged in other litigation in the United Kingdom and a number of overseas jurisdictions, including the United States, involving claims by and against them arising in the ordinary course of business. The Group has reviewed these other actual, threatened and known potential claims and proceedings and, after consulting with its legal advisers, does not expect that the outcome of these other claims and proceedings will have a material adverse effect on its consolidated net assets, operating results or cash flows in any particular period.
Additional contingent liabilities arise in the normal course of the Group’s business. It is not anticipated that any material loss will arise from these transactions.
Notes on the accounts continued
34 Net cash inflow from operating activities
| | | Group | | | Company | |
| | | 2007 | | | 2006 | | | 2005 | | | 2007 | | | 2006 | | | 2005 | |
| | | | £m | | | | £m | | | | £m | | | | £m | | | | £m | | | | £m | |
| Operating profit before tax | | | 9,900 | | | | 9,186 | | | | 7,936 | | | | 2,372 | | | | 3,486 | | | | 1,932 | |
| (Increase)/decrease in prepayments and accrued income | | | (662 | ) | | | 322 | | | | 1,064 | | | | (1 | ) | | | — | | | | 4 | |
| Interest on subordinated liabilities | | | 1,542 | | | | 1,386 | | | | 1,271 | | | | 470 | | | | 520 | | | | 583 | |
| (Decrease)/increase in accruals and deferred income | | | (818 | ) | | | 515 | | | | (1,200 | ) | | | — | | | | (27 | ) | | | 8 | |
| Provisions for impairment losses | | | 2,128 | | | | 1,877 | | | | 1,707 | | | | — | | | | — | | | | — | |
| Loans and advances written-off net of recoveries | | | (1,781 | ) | | | (1,626 | ) | | | (1,870 | ) | | | — | | | | — | | | | — | |
| Unwind of discount on impairment losses | | | (166 | ) | | | (142 | ) | | | (144 | ) | | | — | | | | — | | | | — | |
| Profit on sale of property, plant and equipment | | | (741 | ) | | | (216 | ) | | | (91 | ) | | | — | | | | — | | | | — | |
| (Profit)/loss on sale of subsidiaries and associates | | | (67 | ) | | | (44 | ) | | | 80 | | | | — | | | | — | | | | — | |
| Profit on sale of securities | | | (544 | ) | | | (369 | ) | | | (667 | ) | | | — | | | | — | | | | — | |
| Charge for defined benefit pension schemes | | | 489 | | | | 580 | | | | 462 | | | | — | | | | — | | | | — | |
| Cash contribution to defined benefit pension schemes | | | (599 | ) | | | (536 | ) | | | (452 | ) | | | — | | | | — | | | | — | |
| Other provisions utilised | | | (211 | ) | | | (42 | ) | | | (34 | ) | | | — | | | | — | | | | — | |
| Depreciation and amortisation | | | 1,970 | | | | 1,678 | | | | 1,825 | | | | — | | | | — | | | | — | |
| Elimination of foreign exchange differences | | | (10,282 | ) | | | 4,516 | | | | (3,060 | ) | | | (58 | ) | | | (22 | ) | | | (30 | ) |
| Other non-cash items | | | (373 | ) | | | (1,395 | ) | | | (257 | ) | | | 2 | | | | 45 | | | | (116 | ) |
| Net cash (outflow)/inflow from trading activities | | | (215 | ) | | | 15,690 | | | | 6,570 | | | | 2,785 | | | | 4,002 | | | | 2,381 | |
| (Increase)/decrease in loans and advances to banks and customers | | | (90,829 | ) | | | (44,525 | ) | | | (36,778 | ) | | | (8 | ) | | | 346 | | | | (14 | ) |
| Increase in securities | | | (26,167 | ) | | | (16,703 | ) | | | (28,842 | ) | | | — | | | | — | | | | — | |
| (Increase)/decrease in other assets | | | (384 | ) | | | 671 | | | | (2,390 | ) | | | — | | | | 2 | | | | 5 | |
| (Increase)/decrease in derivative assets | | | (134,356 | ) | | | (21,018 | ) | | | (5,758 | ) | | | (173 | ) | | | 55 | | | | 50 | |
| Changes in operating assets | | | (251,736 | ) | | | (81,575 | ) | | | (73,768 | ) | | | (181 | ) | | | 403 | | | | 41 | |
| Increase/(decrease) in deposits by banks and customers | | | 81,645 | | | | 63,091 | | | | 32,424 | | | | 4,677 | | | | (164 | ) | | | 832 | |
| Increase in insurance liabilities | | | 2,706 | | | | 244 | | | | 620 | | | | — | | | | — | | | | — | |
| Increase/(decrease) in debt securities in issue | | | 59,735 | | | | (4,457 | ) | | | 24,147 | | | | 10,936 | | | | (803 | ) | | | 1,328 | |
| (Decrease)/increase in other liabilities | | | (1,036 | ) | | | 935 | | | | 571 | | | | (7 | ) | | | 14 | | | | (55 | ) |
| Increase/(decrease) in derivative liabilities | | | 128,874 | | | | 21,674 | | | | 5,161 | | | | 137 | | | | 42 | | | | (96 | ) |
| Increase in settlement balances and short positions | | | 8,073 | | | | 4,068 | | | | 10,326 | | | | — | | | | — | | | | — | |
| Changes in operating liabilities | | | 279,997 | | | | 85,555 | | | | 73,249 | | | | 15,743 | | | | (911 | ) | | | 2,009 | |
| Total income taxes (paid)/received | | | (2,442 | ) | | | (2,229 | ) | | | (1,911 | ) | | | 6 | | | | 154 | | | | (18 | ) |
| Net cash inflow from operating activities | | | 25,604 | | | | 17,441 | | | | 4,140 | | | | 18,353 | | | | 3,648 | | | | 4,413 | |
35 Analysis of the net investment in business interests and intangible assets
(a) Acquisition of ABN AMRO
On 17 October 2007, the Group, through its subsidiary RFS Holdings B.V. (‘RFS’), acquired 99% of the ordinary shares of ABN AMRO Holding N.V., the holding company of a major European banking group based in the Netherlands with subsidiaries that undertake commercial banking operations, investment banking and other related financial activities. The provisional fair values of ABN AMRO’s assets and liabilities at the date of acquisition and the consideration paid were as follows:
| | | Pre-acquisition | | | | | | Provisional | | | Recognised | |
| | | carrying | | | Disposal | | | fair value | | | acquisition | |
| | | amounts | | | groups (1) | | | adjustments (2) | | | values (2) | |
| | | | £m | | | | £m | | | | £m | | | | £m | |
| Cash and balances at central banks | | | 7,263 | | | | (186 | ) | | | — | | | | 7,077 | |
| Loans and advances to banks | | | 120,120 | | | | (3,646 | ) | | | — | | | | 116,474 | |
| Loans and advances to customers | | | 314,287 | | | | (26,158 | ) | | | (1,843 | ) | | | 286,286 | |
| Treasury and other eligible bills and debt and equity securities | | | 166,018 | | | | (3,804 | ) | | | — | | | | 162,214 | |
| Derivatives | | | 86,695 | | | | (322 | ) | | | — | | | | 86,373 | |
| Intangible assets | | | 4,239 | | | | (3,522 | ) | | | 4,282 | | | | 4,999 | |
| Property, plant and equipment | | | 2,062 | | | | (747 | ) | | | 175 | | | | 1,490 | |
| Other assets | | | 32,710 | | | | (7 | ) | | | 1,357 | | | | 34,060 | |
Assets of disposal groups (1) | | | 2,987 | | | | 38,392 | | | | 787 | | | | 42,166 | |
| | | | | | | | | | | | | | | | | |
| Deposits by banks | | | (160,906 | ) | | | 2,808 | | | | (321 | ) | | | (158,419 | ) |
| Customer accounts | | | (253,583 | ) | | | 13,786 | | | | (152 | ) | | | (239,949 | ) |
| Debt securities in issue | | | (134,630 | ) | | | 5,937 | | | | 776 | | | | (127,917 | ) |
| Settlement balances and short positions | | | (44,748 | ) | | | 36 | | | | — | | | | (44,712 | ) |
| Derivatives | | | (85,491 | ) | | | 417 | | | | — | | | | (85,074 | ) |
| Subordinated liabilities | | | (11,748 | ) | | | 868 | | | | 685 | | | | (10,195 | ) |
| Other liabilities | | | (21,268 | ) | | | 271 | | | | (1,814 | ) | | | (22,811 | ) |
Liabilities of disposal groups (1) | | | (2,377 | ) | | | (24,123 | ) | | | — | | | | (26,500 | ) |
| Net identifiable assets and liabilities | | | 21,630 | | | | — | | | | 3,932 | | | | 25,562 | |
| Minority interests | | | | | | | | | | | | | | | (242 | ) |
Goodwill on acquisition (3) | | | | | | | | | | | | | | | 23,255 | |
| Consideration | | | | | | | | | | | | | | | 48,575 | |
| | | | | | | | | | | | | | | | | |
| Satisfied by: | | | | | | | | | | | | | | | | |
Issue of 531 million ordinary shares of the company (4) | | | | | | | | | | | | | | | 2,719 | |
| Cash | | | | | | | | | | | | | | | 45,786 | |
| Fees and expenses relating to the acquisition | | | | | | | | | | | | | | | 70 | |
| Consideration | | | | | | | | | | | | | | | 48,575 | |
| | | | | | | | | | | | | | | | | |
| Net cash: | | | | | | | | | | | | | | | | |
| Cash consideration | | | | | | | | | | | | | | | 45,856 | |
| Cash acquired | | | | | | | | | | | | | | | (60,093 | ) |
| | | | | | | | | | | | | | | | 14,237 | |
| | Notes: |
| | |
| (1) | Following an agreement between Santander and Banca Monte dei Paschi di Siena S.p.A., it was announced on 10 November 2007 that Banca Antonveneta SpA., excluding its subsidiary Interbanca will be sold by ABN AMRO to Banca Monte dei Paschi di Siena S.p.A. for consideration of €9 billion (£6.6 billion). The sale of ABN AMRO’s asset management business to Fortis received approval from the Managing Board of ABN AMRO on 23 November 2007. These businesses and ABN AMRO’s private equity business have been classified as disposal groups on the acquisition of ABN AMRO. In addition, under the terms of the Consortium and Shareholders’ Agreement, consortium members other than the Group have agreed to acquire, in due course, various ABN AMRO businesses including operations in Brazil, the commercial and retail businesses in the Netherlands, the private clients business and Interbanca. |
| | |
| (2) | The initial accounting for the acquisition has been determined provisionally because of its complexity and the limited time available between the acquisition and the preparation of these financial statements. |
| | |
| (3) | Goodwill arising on the acquisition is attributable to anticipated cost and revenue synergies and long-term earnings potential of the acquired businesses. |
| | |
| (4) | Valued at an average price of 512p per ordinary 25p share based on the closing price on the trading day immediately prior to the date of exchange. |
| | |
| (5) | ABN AMRO made a loss for the period since its acquisition of £123 million, of which £136 million was attributable to discontinued operations. |
Notes on the accounts continued
35 Analysis of the net investment in business interests and intangible assets (continued)
(b) Other acquisitions and disposals
| | | Group | |
| | | 2007 | | | 2006 | | | 2005 | |
| | | | £m | | | | £m | | | | £m | |
| Fair value given for businesses acquired | | | (280 | ) | | | (21 | ) | | | (85 | ) |
| Cash and cash equivalents acquired | | | 5 | | | | — | | | | — | |
| Non-cash consideration | | | — | | | | — | | | | 10 | |
| Net outflow of cash in respect of purchases | | | (275 | ) | | | (21 | ) | | | (75 | ) |
| | | | | | | | | | | | | |
| Cash and cash equivalents in businesses sold | | | 21 | | | | 229 | | | | 10 | |
| Other assets sold | | | 16 | | | | 36 | | | | 208 | |
| Non-cash consideration | | | (2 | ) | | | (1 | ) | | | (30 | ) |
| Profit/(loss) on disposal | | | 67 | | | | 44 | | | | (80 | ) |
| Net inflow of cash in respect of disposals | | | 102 | | | | 308 | | | | 108 | |
| Dividends received from joint ventures | | | 11 | | | | 29 | | | | 16 | |
| Cash expenditure on intangible assets | | | (435 | ) | | | (379 | ) | | | (345 | ) |
| Net outflow | | | (597 | ) | | | (63 | ) | | | (296 | ) |
Excluding the impact of the amortisation of fair value adjustments and funding costs, it is estimated that the Group would have reported total income of £40.7 billion and profit after tax from continuing operations for the year of £9.2 billion had all acquisitions occurred on 1 January 2007.
36 Interest received and paid
| | | Group | | | Company | |
| | | 2007 | | | 2006 | | | 2005 | | | 2007 | | | 2006 | | | 2005 | |
| | | | £m | | | | £m | | | | £m | | | | £m | | | | £m | | | | £m | |
| Interest received | | | 32,720 | | | | 24,381 | | | | 21,608 | | | | 457 | | | | 594 | | | | 488 | |
| Interest paid | | | (18,976 | ) | | | (14,656 | ) | | | (11,878 | ) | | | (746 | ) | | | (632 | ) | | | (704 | ) |
| | | | 13,744 | | | | 9,725 | | | | 9,730 | | | | (289 | ) | | | (38 | ) | | | (216 | ) |
37 Analysis of changes in financing during the year
| | | Group | | | Company | |
| | | Share capital, share premium and paid-in equity | | | Subordinated liabilities | | | Share capital, share premium and paid-in equity | | | Subordinated liabilities | |
| | | 2007 | | | 2006 | | | 2007 | | | 2006 | | | 2007 | | | 2006 | | | 2007 | | | 2006 | |
| | | | £m | | | | £m | | | | £m | | | | £m | | | | £m | | | | £m | | | | £m | | | | £m | |
| At 1 January | | | 13,297 | | | | 12,603 | | | | 27,654 | | | | 28,274 | | | | 13,297 | | | | 12,603 | | | | 8,194 | | | | 9,242 | |
| Issue of ordinary shares | | | 77 | | | | 104 | | | | | | | | | | | | 77 | | | | 104 | | | | | | | | | |
| Issue of other equity securities | | | 4,673 | | | | 671 | | | | | | | | | | | | 4,673 | | | | 671 | | | | | | | | | |
| Repurchase of ordinary shares | | | — | | | | (394 | ) | | | | | | | | | | | — | | | | (394 | ) | | | | | | | | |
| Net proceeds from issue of | | | | | | | | | | | | | | | | | | | | | | | | | | | | | | | | |
| subordinated liabilities | | | | | | | | | | | 1,018 | | | | 3,027 | | | | | | | | | | | | — | | | | 399 | |
| Repayment of subordinated liabilities | | | | | | | | | | | (1,708 | ) | | | (1,318 | ) | | | | | | | | | | | (469 | ) | | | (547 | ) |
| Net cash inflow/(outflow) from financing | | | 4,750 | | | | 381 | | | | (690 | ) | | | 1,709 | | | | 4,750 | | | | 381 | | | | (469 | ) | | | (148 | ) |
| Acquisition of subsidiaries | | | 2,719 | | | | — | | | | 10,195 | | | | — | | | | 2,719 | | | | — | | | | — | | | | — | |
| Currency translation and other adjustments | | | 159 | | | | 313 | | | | 820 | | | | (2,329 | ) | | | 159 | | | | 313 | | | | 18 | | | | (900 | ) |
| At 31 December | | | 20,925 | | | | 13,297 | | | | 37,979 | | | | 27,654 | | | | 20,925 | | | | 13,297 | | | | 7,743 | | | | 8,194 | |
38 Analysis of cash and cash equivalents
| | | Group | | | Company | |
| | | 2007 | | | 2006 | | | 2005 | | | 2007 | | | 2006 | | | 2005 | |
| | | | £m | | | | £m | | | | £m | | | | £m | | | | £m | | | | £m | |
| At 1 January | | | | | | | | | | | | | | | | | | | | | | | | |
| – cash | | | 28,378 | | | | 25,476 | | | | 23,723 | | | | 11 | | | | 30 | | | | 60 | |
| – cash equivalents | | | 43,273 | | | | 27,073 | | | | 26,298 | | | | 646 | | | | 1,096 | | | | 249 | |
| Acquisition of subsidiaries | | | 60,098 | | | | — | | | | — | | | | — | | | | — | | | | — | |
| Net cash inflow/(outflow) | | | 17,206 | | | | 19,102 | | | | 2,528 | | | | 916 | | | | (469 | ) | | | 817 | |
| At 31 December | | | 148,955 | | | | 71,651 | | | | 52,549 | | | | 1,573 | | | | 657 | | | | 1,126 | |
| | | | | | | | | | | | | | | | | | | | | | | | | |
| Comprising: | | | | | | | | | | | | | | | | | | | | | | | | |
| Cash and balances at central banks | | | 17,428 | | | | 5,752 | | | | 4,456 | | | | — | | | | — | | | | — | |
| Treasury bills and debt securities | | | 6,818 | | | | 1,596 | | | | 998 | | | | — | | | | — | | | | — | |
| Loans and advances to banks | | | 124,709 | | | | 64,303 | | | | 47,095 | | | | 1,573 | | | | 657 | | | | 1,126 | |
| Cash and cash equivalents | | | 148,955 | | | | 71,651 | | | | 52,549 | | | | 1,573 | | | | 657 | | | | 1,126 | |
Certain subsidiary undertakings are required to maintain balances with the Bank of England which, at 31 December 2007, amounted to £439 million (2006 – £369 million). Certain subsidiary undertakings are required by law to maintain reserve balances with the Federal Reserve Bank in the US. Such reserve balances amounted to US$1 million at 31 December 2007 (2006 – US$13 million). ABN AMRO had mandatory reserve deposits of €6 million at 31 December 2007.
Notes on the accounts continued
39 Segmental analysis
(a) Divisions
The directors manage the Group primarily by class of business and present the segmental analysis on that basis. The Group’s activities are organised as follows:
| · | Global Banking & Markets is a leading banking partner to major corporations and financial institutions around the world, providing an extensive range of debt financing, risk management and investment services to its customers. |
| | |
| · | RFS Holdings excluding minority interest comprises those activities of ABN AMRO that are attributable to the Group including investment banking, international cash payments and trade finance. |
| | |
| · | UK Corporate Banking provides banking, finance and risk management services to UK corporate customers. Through its network of relationship managers across the country it distributes the full range of Corporate Markets’ products and services to companies. |
| | |
| · | Retail comprises both the Royal Bank and NatWest retail brands, and a number of direct providers offering a full range of banking products and related financial services to the personal, premium and small business markets across several distribution channels. Retail also includes the Group’s non-branch based retail business, such as Tesco Personal Finance, that issues a comprehensive range of credit and charge cards to personal and corporate customers and provides card processing services for retail businesses. |
| | |
| · | Wealth Management provides private banking and investment services to its global clients through Coutts Group, Adam & Company, The Royal Bank of Scotland International and NatWest Offshore. |
| | |
| · | Ulster Bank Group brings together the Ulster Bank and First Active businesses. Retail Markets serves personal customers through both brands and Corporate Markets caters for the banking needs of business and corporate customers. |
| | |
| · | Citizens is engaged in retail and corporate banking activities through its branch network in 13 states in the United States and through non-branch offices in other states. Citizens includes the two banks, RBS Citizens, NA and Citizens Bank of Pennsylvania. Citizens also includes RBS Lynk, our merchant acquiring business, and Kroger Personal Finance, the credit card joint venture with the second largest US supermarket group. |
| | |
| · | RBS Insurance sells and underwrites retail and SME insurance over the telephone and internet, as well as through brokers and partnerships. Direct Line, Churchill and Privilege sell general insurance products direct to the customer. Through its International Division, RBS Insurance sells general insurance, mainly motor, in Spain, Germany and Italy. The Intermediary and Broker Division sells general insurance products through independent brokers. |
| | |
| · | Manufacturing supports the customer-facing businesses and provides operational technology, customer support in telephony, account management, lending and money transmission, global purchasing, property and other services. |
| | |
| · | RFS Holdings minority interest comprises those activities of ABN AMRO that are attributable to the other consortium banks including retail banking in the Netherlands and Brazil. |
Segments charge market prices for services rendered to other parts of the Group with the exception of Manufacturing and central items. The expenditure incurred by Manufacturing relates to costs principally in respect of the Group’s banking and insurance operations in the UK and Ireland. These costs reflect activities that are shared between the various customer-facing divisions. These shared costs and related assets and liabilities are not allocated to divisions in the day-to-day management of the businesses but are allocated to customer-facing divisions for financial reporting purposes on a basis the directors consider to be reasonable. Funding charges between segments are determined by Group Treasury, having regard to commercial demands. The results of each division before amortisation of purchased intangible assets, integration costs and net gain on sale of strategic investments and subsidiaries, and where appropriate, allocation of Manufacturing costs (‘Contribution’) and after allocation of Manufacturing costs (‘Operating profit before tax’) are shown below.
| | | Group | |
| | | Net interest income | | | Non-interest income | | | Total | | | Operating expenses and insurance claims | | | Depreciation and amortisation | | | Impairment losses | | | Contribution | | | Allocation of Manufacturing costs | | | Operating profit before tax | |
| 2007 | | | £m | | | | £m | | | | £m | | | | £m | | | | £m | | | | £m | | | | £m | | | | £m | | | | £m | |
| Global Banking & Markets | | | 1,049 | | | | 5,531 | | | | 6,580 | | | | (2,254 | ) | | | (455 | ) | | | (39 | ) | | | 3,832 | | | | (145 | ) | | | 3,687 | |
| RFS Holdings excluding | | | | | | | | | | | | | | | | | | | | | | | | | | | | | | | | | | | | |
| minority interest | | | 275 | | | | 539 | | | | 814 | | | | (816 | ) | | | (48 | ) | | | (65 | ) | | | (115 | ) | | | — | | | | (115 | ) |
| UK Corporate Banking | | | 2,260 | | | | 1,482 | | | | 3,742 | | | | (836 | ) | | | (328 | ) | | | (180 | ) | | | 2,398 | | | | (437 | ) | | | 1,961 | |
| Retail | | | 4,191 | | | | 3,571 | | | | 7,762 | | | | (2,468 | ) | | | (25 | ) | | | (1,196 | ) | | | 4,073 | | | | (1,603 | ) | | | 2,470 | |
| Wealth Management | | | 569 | | | | 459 | | | | 1,028 | | | | (455 | ) | | | (11 | ) | | | (4 | ) | | | 558 | | | | (145 | ) | | | 413 | |
| Ulster Bank | | | 923 | | | | 374 | | | | 1,297 | | | | (437 | ) | | | (24 | ) | | | (104 | ) | | | 732 | | | | (219 | ) | | | 513 | |
| Citizens | | | 1,975 | | | | 1,147 | | | | 3,122 | | | | (1,340 | ) | | | (118 | ) | | | (341 | ) | | | 1,323 | | | | — | | | | 1,323 | |
| RBS Insurance | | | 611 | | | | 5,045 | | | | 5,656 | | | | (4,708 | ) | | | (46 | ) | | | — | | | | 902 | | | | (219 | ) | | | 683 | |
| Manufacturing | | | (175 | ) | | | 36 | | | | (139 | ) | | | (2,223 | ) | | | (552 | ) | | | — | | | | (2,914 | ) | | | 2,914 | | | | — | |
| Central items | | | (154 | ) | | | (174 | ) | | | (328 | ) | | | (436 | ) | | | 15 | | | | (1 | ) | | | (750 | ) | | | (146 | ) | | | (896 | ) |
| RFS Holdings minority interest | | | 1,144 | | | | 437 | | | | 1,581 | | | | (1,056 | ) | | | (84 | ) | | | (198 | ) | | | 243 | | | | — | | | | 243 | |
| | | | 12,668 | | | | 18,447 | | | | 31,115 | | | | (17,029 | ) | | | (1,676 | ) | | | (2,128 | ) | | | 10,282 | | | | — | | | | 10,282 | |
| Amortisation of intangibles | | | — | | | | — | | | | — | | | | (40 | ) | | | (234 | ) | | | — | | | | (274 | ) | | | — | | | | (274 | ) |
| Integration cost | | | — | | | | — | | | | — | | | | (48 | ) | | | (60 | ) | | | — | | | | (108 | ) | | | — | | | | (108 | ) |
| | | | 12,668 | | | | 18,447 | | | | 31,115 | | | | (17,117 | ) | | | (1,970 | ) | | | (2,128 | ) | | | 9,900 | | | | — | | | | 9,900 | |
| | | | | | | | | | | | | | | | | | | | | | | | | | | | | | | | | | | | | |
| 2006 | | | | | | | | | | | | | | | | | | | | | | | | | | | | | | | | | | | | |
| Global Banking & Markets | | | 1,113 | | | | 5,718 | | | | 6,831 | | | | (2,351 | ) | | | (472 | ) | | | (85 | ) | | | 3,923 | | | | (144 | ) | | | 3,779 | |
| UK Corporate Banking | | | 2,115 | | | | 1,347 | | | | 3,462 | | | | (742 | ) | | | (338 | ) | | | (189 | ) | | | 2,193 | | | | (431 | ) | | | 1,762 | |
| Retail | | | 4,108 | | | | 3,458 | | | | 7,566 | | | | (2,396 | ) | | | (30 | ) | | | (1,310 | ) | | | 3,830 | | | | (1,580 | ) | | | 2,250 | |
| Wealth Management | | | 496 | | | | 393 | | | | 889 | | | | (415 | ) | | | (11 | ) | | | (1 | ) | | | 462 | | | | (144 | ) | | | 318 | |
| Ulster Bank | | | 812 | | | | 313 | | | | 1,125 | | | | (364 | ) | | | (21 | ) | | | (104 | ) | | | 636 | | | | (215 | ) | | | 421 | |
| Citizens | | | 2,085 | | | | 1,232 | | | | 3,317 | | | | (1,398 | ) | | | (156 | ) | | | (181 | ) | | | 1,582 | | | | — | | | | 1,582 | |
| RBS Insurance | | | 511 | | | | 5,168 | | | | 5,679 | | | | (4,671 | ) | | | (44 | ) | | | — | | | | 964 | | | | (215 | ) | | | 749 | |
| Manufacturing | | | (174 | ) | | | 45 | | | | (129 | ) | | | (2,223 | ) | | | (520 | ) | | | — | | | | (2,872 | ) | | | 2,872 | | | | — | |
| Central items | | | (470 | ) | | | (268 | ) | | | (738 | ) | | | (582 | ) | | | 24 | | | | (8 | ) | | | (1,304 | ) | | | (143 | ) | | | (1,447 | ) |
| | | | 10,596 | | | | 17,406 | | | | 28,002 | | | | (15,142 | ) | | | (1,568 | ) | | | (1,878 | ) | | | 9,414 | | | | — | | | | 9,414 | |
| Amortisation of intangibles | | | — | | | | — | | | | — | | | | — | | | | (94 | ) | | | — | | | | (94 | ) | | | — | | | | (94 | ) |
| Integration costs | | | — | | | | — | | | | — | | | | (118 | ) | | | (16 | ) | | | — | | | | (134 | ) | | | — | | | | (134 | ) |
| | | | 10,596 | | | | 17,406 | | | | 28,002 | | | | (15,260 | ) | | | (1,678 | ) | | | (1,878 | ) | | | 9,186 | | | | — | | | | 9,186 | |
| | | | | | | | | | | | | | | | | | | | | | | | | | | | | | | | | | | | | |
| 2005 | | | | | | | | | | | | | | | | | | | | | | | | | | | | | | | | | | | | |
| Global Banking & Markets | | | 1,035 | | | | 4,583 | | | | 5,618 | | | | (1,814 | ) | | | (473 | ) | | | (139 | ) | | | 3,192 | | | | (139 | ) | | | 3,053 | |
| UK Corporate Banking | | | 1,906 | | | | 1,266 | | | | 3,172 | | | | (646 | ) | | | (343 | ) | | | (196 | ) | | | 1,987 | | | | (416 | ) | | | 1,571 | |
| Retail | | | 3,965 | | | | 3,333 | | | | 7,298 | | | | (2,393 | ) | | | (37 | ) | | | (1,135 | ) | | | 3,733 | | | | (1,526 | ) | | | 2,207 | |
| Wealth Management | | | 439 | | | | 345 | | | | 784 | | | | (369 | ) | | | (14 | ) | | | (13 | ) | | | 388 | | | | (139 | ) | | | 249 | |
| Ulster Bank | | | 713 | | | | 290 | | | | 1,003 | | | | (314 | ) | | | (25 | ) | | | (95 | ) | | | 569 | | | | (208 | ) | | | 361 | |
| Citizens | | | 2,122 | | | | 1,142 | | | | 3,264 | | | | (1,407 | ) | | | (151 | ) | | | (131 | ) | | | 1,575 | | | | — | | | | 1,575 | |
| RBS Insurance | | | 461 | | | | 5,028 | | | | 5,489 | | | | (4,527 | ) | | | (27 | ) | | | — | | | | 935 | | | | (208 | ) | | | 727 | |
| Manufacturing | | | (169 | ) | | | 50 | | | | (119 | ) | | | (2,134 | ) | | | (523 | ) | | | — | | | | (2,776 | ) | | | 2,776 | | | | — | |
| Central items | | | (554 | ) | | | (386 | ) | | | (940 | ) | | | (419 | ) | | | 5 | | | | 2 | | | | (1,352 | ) | | | (140 | ) | | | (1,492 | ) |
| | | | 9,918 | | | | 15,651 | | | | 25,569 | | | | (14,023 | ) | | | (1,588 | ) | | | (1,707 | ) | | | 8,251 | | | | — | | | | 8,251 | |
| Amortisation of intangibles | | | — | | | | — | | | | — | | | | — | | | | (97 | ) | | | — | | | | (97 | ) | | | — | | | | (97 | ) |
| Integration costs | | | — | | | | — | | | | — | | | | (318 | ) | | | (140 | ) | | | — | | | | (458 | ) | | | — | | | | (458 | ) |
| Net gain on sale of strategic | | | | | | | | | | | | | | | | | | | | | | | | | | | | | | | | | | | | |
| investments and subsidiaries | | | — | | | | 333 | | | | 333 | | | | (93 | ) | | | — | | | | — | | | | 240 | | | | — | | | | 240 | |
| | | | 9,918 | | | | 15,984 | | | | 25,902 | | | | (14,434 | ) | | | (1,825 | ) | | | (1,707 | ) | | | 7,936 | | | | — | | | | 7,936 | |
Notes on the accounts continued
39 Segmental analysis (continued)
| | | 2007 | | | 2006 | | | 2005 | |
| | | | | | Inter | | | | | | | | | Inter | | | | | | | | | Inter | | | | |
| | | External | | | segment | | | Total | | | External | | | segment | | | Total | | | External | | | segment | | | Total | |
| Total revenue | | | £m | | | | £m | | | | £m | | | | £m | | | | £m | | | | £m | | | | £m | | | | £m | | | | £m | |
| Global Banking & Markets | | | 12,512 | | | | 9,614 | | | | 22,126 | | | | 11,419 | | | | 7,638 | | | | 19,057 | | | | 8,501 | | | | 3,623 | | | | 12,124 | |
| RFS Holdings excluding | | | | | | | | | | | | | | | | | | | | | | | | | | | | | | | | | | | | |
| minority interest | | | 2,845 | | | | 399 | | | | 3,244 | | | | — | | | | — | | | | — | | | | — | | | | — | | | | — | |
| UK Corporate Banking | | | 7,277 | | | | 44 | | | | 7,321 | | | | 5,962 | | | | 18 | | | | 5,980 | | | | 6,104 | | | | 101 | | | | 6,205 | |
| Retail | | | 12,041 | | | | 1,895 | | | | 13,936 | | | | 11,143 | | | | 1,612 | | | | 12,755 | | | | 10,698 | | | | 1,516 | | | | 12,214 | |
| Wealth Management | | | 922 | | | | 2,218 | | | | 3,140 | | | | 991 | | | | 1,430 | | | | 2,421 | | | | 843 | | | | 1,129 | | | | 1,972 | |
| Ulster Bank | | | 2,841 | | | | 197 | | | | 3,038 | | | | 2,361 | | | | 196 | | | | 2,557 | | | | 1,820 | | | | 150 | | | | 1,970 | |
| Citizens | | | 5,528 | | | | — | | | | 5,528 | | | | 5,872 | | | | 2 | | | | 5,874 | | | | 4,878 | | | | 4 | | | | 4,882 | |
| RBS Insurance | | | 6,333 | | | | 89 | | | | 6,422 | | | | 6,365 | | | | 82 | | | | 6,447 | | | | 6,194 | | | | 67 | | | | 6,261 | |
| Manufacturing | | | 41 | | | | 1 | | | | 42 | | | | 49 | | | | 5 | | | | 54 | | | | 54 | | | | 6 | | | | 60 | |
| Central items | | | 1,013 | | | | 9,717 | | | | 10,730 | | | | 124 | | | | 7,985 | | | | 8,109 | | | | 28 | | | | 5,161 | | | | 5,189 | |
| RFS Holdings minority interest | | | 3,114 | | | | (399 | ) | | | 2,715 | | | | — | | | | — | | | | — | | | | — | | | | — | | | | — | |
| Eliminations | | | — | | | | (23,775 | ) | | | (23,775 | ) | | | — | | | | (18,968 | ) | | | (18,968 | ) | | | — | | | | (11,757 | ) | | | (11,757 | ) |
| | | | 54,467 | | | | — | | | | 54,467 | | | | 44,286 | | | | — | | | | 44,286 | | | | 39,120 | | | | — | | | | 39,120 | |
| Net gain on sale of strategic | | | | | | | | | | | | | | | | | | | | | | | | | | | | | | | | | | | | |
| investments | | | — | | | | — | | | | — | | | | — | | | | — | | | | — | | | | 333 | | | | — | | | | 333 | |
| | | | 54,467 | | | | — | | | | 54,467 | | | | 44,286 | | | | — | | | | 44,286 | | | | 39,453 | | | | — | | | | 39,453 | |
Note:
(1) Revenue represents total income included in the income statement grossed-up for interest payable and fees and commissions payable.
| | | 2007 | | | 2006 | | | 2005 | |
| | | | | | Inter | | | | | | | | | Inter | | | | | | | | | Inter | | | | |
| | | External | | | segment | | | Total | | | External | | | segment | | | Total | | | External | | | segment | | | Total | |
| Total income | | | £m | | | | £m | | | | £m | | | | £m | | | | £m | | | | £m | | | | £m | | | | £m | | | | £m | |
| Global Banking & Markets | | | 8,578 | | | | (1,998 | ) | | | 6,580 | | | | 8,502 | | | | (1,671 | ) | | | 6,831 | | | | 6,338 | | | | (720 | ) | | | 5,618 | |
| RFS Holdings excluding | | | | | | | | | | | | | | | | | | | | | | | | | | | | | | | | | | | | |
| minority interest | | | 415 | | | | 399 | | | | 814 | | | | — | | | | — | | | | — | | | | — | | | | — | | | | — | |
| UK Corporate Banking | | | 5,980 | | | | (2,238 | ) | | | 3,742 | | | | 5,231 | | | | (1,769 | ) | | | 3,462 | | | | 4,699 | | | | (1,527 | ) | | | 3,172 | |
| Retail | | | 8,175 | | | | (413 | ) | | | 7,762 | | | | 7,903 | | | | (337 | ) | | | 7,566 | | | | 7,556 | | | | (258 | ) | | | 7,298 | |
| Wealth Management | | | (1,046 | ) | | | 2,074 | | | | 1,028 | | | | (507 | ) | | | 1,396 | | | | 889 | | | | (265 | ) | | | 1,049 | | | | 784 | |
| Ulster Bank | | | 1,774 | | | | (477 | ) | | | 1,297 | | | | 1,278 | | | | (153 | ) | | | 1,125 | | | | 1,090 | | | | (87 | ) | | | 1,003 | |
| Citizens | | | 3,178 | | | | (56 | ) | | | 3,122 | | | | 3,399 | | | | (82 | ) | | | 3,317 | | | | 3,353 | | | | (89 | ) | | | 3,264 | |
| RBS Insurance | | | 5,649 | | | | 7 | | | | 5,656 | | | | 5,662 | | | | 17 | | | | 5,679 | | | | 5,501 | | | | (12 | ) | | | 5,489 | |
| Manufacturing | | | (135 | ) | | | (4 | ) | | | (139 | ) | | | (108 | ) | | | (21 | ) | | | (129 | ) | | | (85 | ) | | | (34 | ) | | | (119 | ) |
| Central items | | | (3,433 | ) | | | 3,105 | | | | (328 | ) | | | (3,358 | ) | | | 2,620 | | | | (738 | ) | | | (2,618 | ) | | | 1,678 | | | | (940 | ) |
| RFS Holdings minority interest | | | 1,980 | | | | (399 | ) | | | 1,581 | | | | — | | | | — | | | | — | | | | — | | | | — | | | | — | |
| | | | 31,115 | | | | — | | | | 31,115 | | | | 28,002 | | | | — | | | | 28,002 | | | | 25,569 | | | | — | | | | 25,569 | |
| Net gain on sale of strategic | | | | | | | | | | | | | | | | | | | | | | | | | | | | | | | | | | | | |
| investments | | | — | | | | — | | | | — | | | | — | | | | — | | | | — | | | | 333 | | | | — | | | | 333 | |
| | | | 31,115 | | | | — | | | | 31,115 | | | | 28,002 | | | | — | | | | 28,002 | | | | 25,902 | | | | — | | | | 25,902 | |
| | Note: |
| | |
| (1) | Segmental results for 2006 and 2005 have been restated to reflect transfers of businesses between segments in 2007. |
| | | Group | |
| | | Assets – before allocation of Manufacturing assets | | | Allocation of Manufacturing assets | | | Assets | | | Liabilities – before allocation of Manufacturing liabilities | | | Allocation of Manufacturing liabilities | | | Liabilities | | | Cost to acquire fixed assets and intangible assets – before allocation of Manufacturing assets | | | Allocation of Manufacturing assets | | | Cost to acquire fixed assets and intangible assets | |
| 2007 | | | £m | | | | £m | | | | £m | | | | £m | | | | £m | | | | £m | | | | £m | | | | £m | | | | £m | |
| Global Banking & Markets | | | 724,905 | | | | 267 | | | | 725,172 | | | | 658,786 | | | | — | | | | 658,786 | | | | 2,208 | | | | 91 | | | | 2,299 | |
| RFS Holdings excluding | | | | | | | | | | | | | | | | | | | | | | | | | | | | | | | | | | | | |
| minority interest | | | 533,853 | | | | — | | | | 533,853 | | | | 511,486 | | | | — | | | | 511,486 | | | | — | | | | — | | | | — | |
| UK Corporate Banking | | | 102,728 | | | | 460 | | | | 103,188 | | | | 88,214 | | | | — | | | | 88,214 | | | | 1,320 | | | | 131 | | | | 1,451 | |
| Retail | | | 116,755 | | | | 2,968 | | | | 119,723 | | | | 102,145 | | | | 1,076 | | | | 103,221 | | | | 26 | | | | 480 | | | | 506 | |
| Wealth Management | | | 14,014 | | | | 199 | | | | 14,213 | | | | 34,950 | | | | — | | | | 34,950 | | | | 33 | | | | 59 | | | | 92 | |
| Ulster Bank | | | 54,790 | | | | 255 | | | | 55,045 | | | | 44,307 | | | | — | | | | 44,307 | | | | 35 | | | | 77 | | | | 112 | |
| Citizens | | | 80,390 | | | | — | | | | 80,390 | | | | 67,901 | | | | — | | | | 67,901 | | | | 171 | | | | — | | | | 171 | |
| RBS Insurance | | | 12,439 | | | | 419 | | | | 12,858 | | | | 8,935 | | | | — | | | | 8,935 | | | | 92 | | | | 113 | | | | 205 | |
| Manufacturing | | | 5,375 | | | | (5,375 | ) | | | — | | | | 1,950 | | | | (1,950 | ) | | | — | | | | 1,001 | | | | (1,001 | ) | | | — | |
| Central items | | | 14,818 | | | | 807 | | | | 15,625 | | | | 74,596 | | | | 874 | | | | 75,470 | | | | — | | | | 50 | | | | 50 | |
| RFS Holdings minority interest | | | 240,452 | | | | — | | | | 240,452 | | | | 215,823 | | | | — | | | | 215,823 | | | | 675 | | | | — | | | | 675 | |
| Group | | | 1,900,519 | | | | — | | | | 1,900,519 | | | | 1,809,093 | | | | — | | | | 1,809,093 | | | | 5,561 | | | | — | | | | 5,561 | |
| | | Group | |
| | | Assets – before allocation of Manufacturing assets | | | Allocation of Manufacturing assets | | | Assets | | | Liabilities – before allocation of Manufacturing liabilities | | | Allocation of Manufacturing liabilities | | | Liabilities | | | Cost to acquire fixed assets and intangible assets – before allocation of Manufacturing assets | | | Allocation of Manufacturing assets | | | Cost to acquire fixed assets and intangible assets | |
| 2006 | | | £m | | | | £m | | | | £m | | | | £m | | | | £m | | | | £m | | | | £m | | | | £m | | | | £m | |
| Global Banking & Markets | | | 498,267 | | | | 228 | | | | 498,495 | | | | 444,496 | | | | — | | | | 444,496 | | | | 2,069 | | | | 14 | | | | 2,083 | |
| UK Corporate Banking | | | 88,694 | | | | 417 | | | | 89,111 | | | | 80,254 | | | | — | | | | 80,254 | | | | 1,284 | | | | 46 | | | | 1,330 | |
| Retail | | | 113,383 | | | | 3,546 | | | | 116,929 | | | | 92,981 | | | | 1,014 | | | | 93,995 | | | | 13 | | | | 186 | | | | 199 | |
| Wealth Management | | | 10,987 | | | | 196 | | | | 11,183 | | | | 29,375 | | | | — | | | | 29,375 | | | | 79 | | | | 19 | | | | 98 | |
| Ulster Bank | | | 44,515 | | | | 265 | | | | 44,780 | | | | 34,534 | | | | — | | | | 34,534 | | | | 166 | | | | 24 | | | | 190 | |
| Citizens | | | 82,531 | | | | — | | | | 82,531 | | | | 69,770 | | | | — | | | | 69,770 | | | | 203 | | | | — | | | | 203 | |
| RBS Insurance | | | 12,252 | | | | 397 | | | | 12,649 | | | | 9,085 | | | | — | | | | 9,085 | | | | 83 | | | | 54 | | | | 137 | |
| Manufacturing | | | 5,709 | | | | (5,709 | ) | | | — | | | | 1,884 | | | | (1,884 | ) | | | — | | | | 361 | | | | (361 | ) | | | — | |
| Central items | | | 15,094 | | | | 660 | | | | 15,754 | | | | 63,563 | | | | 870 | | | | 64,433 | | | | 482 | | | | 18 | | | | 500 | |
| Group | | | 871,432 | | | | — | | | | 871,432 | | | | 825,942 | | | | — | | | | 825,942 | | | | 4,740 | | | | — | | | | 4,740 | |
| | | 2007 | | | 2006 | |
| Owners’ equity by division | | | £m | | | | £m | |
| Global Banking & Markets | | | 11,584 | | | | 10,745 | |
| RFS Holdings excluding minority interests | | | 18,162 | | | | — | |
| UK Corporate Banking | | | 7,619 | | | | 6,987 | |
| Retail | | | 5,977 | | | | 6,057 | |
| Wealth Management | | | 549 | | | | 487 | |
| Ulster Bank | | | 2,829 | | | | 2,960 | |
| Citizens | | | 11,001 | | | | 11,765 | |
| RBS Insurance | | | 2,646 | | | | 2,461 | |
| Manufacturing | | | 250 | | | | 246 | |
| Central items | | | (7,579 | ) | | | (1,481 | ) |
| Group | | | 53,038 | | | | 40,227 | |
| | Note: |
| | |
| (1) | Segmental results for 2006 have been restated to reflect transfers of businesses between segments in 2007. |
Segmental analysis of goodwill is as follows:
| | | Group | |
| | | Global Banking & Markets | | | UK Corporate Banking | | | Retail | | | Wealth Management | | | Ulster Bank | | | Citizens | | | RBS Insurance | | | ABN AMRO | | | Central items | | | Total | |
| | | | £m | | | | £m | | | | £m | | | | £m | | | | £m | | | | £m | | | | £m | | | | £m | | | | £m | | | | £m | |
| At 1 January 2006 | | | 31 | | | | 55 | | | | 263 | | | | 137 | | | | 414 | | | | 7,444 | | | | 1,064 | | | | — | | | | 9,415 | | | | 18,823 | |
| Currency translation and other adjustments | | | 4 | | | | — | | | | (8 | ) | | | (7 | ) | | | (9 | ) | | | (904 | ) | | | — | | | | — | | | | — | | | | (924 | ) |
| Disposals | | | — | | | | — | | | | — | | | | (3 | ) | | | — | | | | (7 | ) | | | — | | | | — | | | | — | | | | (10 | ) |
| At 1 January 2007 | | | 35 | | | | 55 | | | | 255 | | | | 127 | | | | 405 | | | | 6,533 | | | | 1,064 | | | | — | | | | 9,415 | | | | 17,889 | |
| Currency translation and other adjustments | | | 2 | | | | (7 | ) | | | 10 | | | | 7 | | | | 38 | | | | (126 | ) | | | 1 | | | | 1,274 | | | | — | | | | 1,199 | |
| Acquisitions | | | — | | | | — | | | | — | | | | — | | | | — | | | | 66 | | | | — | | | | 23,255 | | | | — | | | | 23,321 | |
| Transfer between divisions | | | — | | | | — | | | | (54 | ) | | | — | | | | 54 | | | | — | | | | — | | | | — | | | | — | | | | — | |
| Impairment of goodwill | | | — | | | | — | | | | (40 | ) | | | — | | | | — | | | | — | | | | — | | | | — | | | | — | | | | (40 | ) |
| At 31 December 2007 | | | 37 | | | | 48 | | | | 171 | | | | 134 | | | | 497 | | | | 6,473 | | | | 1,065 | | | | 24,529 | | | | 9,415 | | | | 42,369 | |
Notes on the accounts continued
39 Segmental analysis (continued)
(b) Geographical segments
The geographical analyses in the tables below have been compiled on the basis of location of office where the transactions are recorded.
| | Group |
| | UK | USA | Europe | | Rest of the World | Total |
| 2007 | £m | £m | £m | | £m | £m |
| Total revenue | 33,743 | 8,570 | 8,140 | | 4,014 | 54,467 |
| | | | | | | |
| Net interest income | 8,350 | 2,054 | 1,510 | | 754 | 12,668 |
| Fees and commissions (net) | 3,933 | 1,176 | 560 | | 485 | 6,154 |
| Income from trading activities | 1,252 | (486) | 348 | | 213 | 1,327 |
| Other operating income | 3,844 | 260 | 587 | | 166 | 4,857 |
| Insurance premium income (net of reinsurers’ share) | 5,562 | — | 525 | | 22 | 6,109 |
| Total income | 22,941 | 3,004 | 3,530 | | 1,640 | 31,115 |
| | | | | | | |
| Operating profit before tax | 7,761 | 719 | 1,136 | | 284 | 9,900 |
| | | | | | | |
| Total assets | 998,088 | 340,170 | 421,724 | | 140,537 | 1,900,519 |
| | | | | | | |
| Total liabilities | 962,364 | 326,499 | 392,028 | | 128,202 | 1,809,093 |
| | | | | | | |
| Net assets attributable to equity owners and minority interests | 35,724 | 13,671 | 29,696 | | 12,335 | 91,426 |
| | | | | | | |
| Contingent liabilities and commitments | 197,637 | 95,547 | 82,316 | | 24,599 | 400,099 |
| | | | | | | |
| Cost to acquire property, plant and equipment and intangible assets | 3,305 | 238 | 1,793 | | 225 | 5,561 |
| | | | | | | |
| 2006 | | | | | | |
| Total revenue | 29,162 | 9,411 | 4,683 | | 1,030 | 44,286 |
| | | | | | | |
| Net interest income | 7,541 | 2,278 | 709 | | 68 | 10,596 |
| Fees and commissions (net) | 3,443 | 1,245 | 412 | | 94 | 5,194 |
| Income from trading activities | 1,585 | 939 | 108 | | 43 | 2,675 |
| Other operating income | 2,766 | 295 | 491 | | 12 | 3,564 |
| Insurance premium income (net of reinsurers’ share) | 5,604 | — | 369 | | — | 5,973 |
| Total income | 20,939 | 4,757 | 2,089 | | 217 | 28,002 |
| | | | | | | |
| Operating profit before tax | 6,038 | 2,334 | 785 | | 29 | 9,186 |
| | | | | | | |
| Total assets | 589,962 | 201,134 | 60,759 | | 19,577 | 871,432 |
| | | | | | | |
| Total liabilities | 568,492 | 187,143 | 56,662 | | 13,645 | 825,942 |
| | | | | | | |
| Net assets attributable to equity owners and minority interests | 21,470 | 13,991 | 4,097 | | 5,932 | 45,490 |
| | | | | | | |
| Contingent liabilities and commitments | 186,627 | 57,873 | 13,244 | | 7,159 | 264,903 |
| | | | | | | |
| Cost to acquire property, plant and equipment and intangible assets | 3,040 | 254 | 1,427 | | 19 | 4,740 |
| | Group |
| | UK | USA | Europe | Rest of the World | Total |
| 2005 | £m | £m | £m | £m | £m |
| Total revenue | 27,461 | 7,562 | 3,650 | 780 | 39,453 |
| | | | | | |
| Net interest income | 6,942 | 2,225 | 713 | 38 | 9,918 |
| Fees and commissions (net) | 3,466 | 1,100 | 263 | 80 | 4,909 |
| Income from trading activities | 1,263 | 959 | 56 | 65 | 2,343 |
| Other operating income | 2,330 | 211 | 403 | 9 | 2,953 |
| Insurance premium income (net of reinsurers’ share) | 5,462 | — | 317 | — | 5,779 |
| Total income | 19,463 | 4,495 | 1,752 | 192 | 25,902 |
| | | | | | |
| Operating profit before tax | 5,278 | 2,032 | 602 | 24 | 7,936 |
| | | | | | |
| Total assets | 492,962 | 205,514 | 62,203 | 16,148 | 776,827 |
| | | | | | |
| Total liabilities | 473,581 | 191,189 | 58,527 | 15,986 | 739,283 |
| | | | | | |
| Net assets attributable to equity owners and minority interests | 19,381 | 14,325 | 3,676 | 162 | 37,544 |
| | | | | | |
| Contingent liabilities and commitments | 168,887 | 51,392 | 10,714 | 1,164 | 232,157 |
| | | | | | |
| Cost to acquire property, plant and equipment and intangible assets | 3,353 | 337 | 1,581 | 17 | 5,288 |
40 Directors’ and key management remuneration
| | Group |
| | 2007 | 2006 |
| Directors’ remuneration | £000 | £000 |
| Non-executive directors – emoluments | 1,081 | 998 |
| Chairman and executive directors – emoluments | 16,461 | 19,448 |
| – contributions and allowances in respect of defined | | |
| contribution pension schemes | 30 | 101 |
| | 17,572 | 20,547 |
| – amounts receivable under long-term incentive plans | 1,839 | 3,997 |
| – gains on exercise of share options | 1,474 | 2 |
| | 20,885 | 24,546 |
Retirement benefits are accruing to five directors (2006 – five) under defined benefit schemes, one (2006 – two) of whom also accrued benefits under defined contribution schemes.
The executive directors may also participate in the company’s executive share option and sharesave schemes and details of their interests in the company’s shares arising from their participation are given on page 85. Details of the remuneration received by each director during the year and each director’s pension arrangements are given on pages 92 to 96.
Compensation of key management
The aggregate remuneration of directors and other members of key management during the year was as follows:
| | Group |
| | 2007 | 2006 |
| | £000 | £000 |
| Short-term benefits | 37,763 | 41,003 |
| Post-employment benefits | 10,051 | 11,264 |
| Other long-term | 708 | 3,309 |
| Share-based payments | 5,165 | 2,787 |
| | 53,687 | 58,363 |
Notes on the accounts continued
41 Transactions with directors, officers and others
| (a) | At 31 December 2007, the amounts outstanding in relation to transactions, arrangements and agreements entered into by authorised institutions in the Group, as defined in UK legislation, were £527,021 in respect of loans to 15 persons who were directors of the company (or persons connected with them) at any time during the financial period. |
| (b) | For the purposes of IAS 24 ‘Related Party Disclosures’, key management comprise directors of the company and members of the Group Executive Management Committee. |
The captions in the Group’s primary financial statements include the following amounts attributable, in aggregate, to key management:
| | 2007 | 2006 |
| | £000 | £000 |
| Loans and advances to customers | 2,023 | 2,188 |
| Customer accounts | 13,309 | 18,575 |
Key management have banking relationships with Group entities which are entered into in the normal course of business and on substantially the same terms, including interest rates and security, as for comparable transactions with other persons of a similar standing or, where applicable, with other employees. These transactions did not involve more than the normal risk of repayment or present other unfavourable features.
Key management had no reportable transactions or balances with the company except for dividends.
42 Related parties
| (a) | Group companies provide development and other types of capital support to businesses in their roles as providers of finance. These investments are made in the normal course of business and on arm’s-length terms. In some instances, the investment may extend to ownership or control over 20% or more of the voting rights of the investee company. However, these investments are not considered to give rise to transactions of a materiality requiring disclosure under IAS 24. |
| | |
| (b) | The Group recharges The Royal Bank of Scotland Group Pension Fund with the cost of administration services incurred by it. The amounts involved are not material to the Group. |
| | |
| (c) | In accordance with IAS 24, transactions or balances between Group entities that have been eliminated on consolidation are not reported. |
| | |
| (d) | The captions in the primary financial statements of the parent company include amounts attributable to subsidiaries. These amounts have been disclosed in aggregate in the relevant notes to the financial statements. |
43 Post balance sheet events
There have been no significant events between the year end and the date of approval of these accounts which would require a change to or disclosure in the accounts.
Additional information
| 196 | Financial summary |
| | |
| 196 | Amounts in accordance |
| | with IFRS |
| | |
| 205 | Amounts in accordance |
| | with UK GAAP |
| | |
| 212 | Exchange rates |
| | |
| 213 | Economic and monetary |
| | environment |
| | |
| 213 | Supervision and regulation |
| | |
| 215 | Litigation |
| | |
| 216 | Investigations |
| | |
| 217 | Description of property |
| | and equipment |
| | |
| 217 | Major shareholders |
| | |
| 218 | Material contracts |
| | |
| 218 | FSA Listing Rules disclosure |
Additional information
Financial summary
The Group’s financial statements are prepared in accordance with IFRS as issued by the IASB. Selected data under IFRS for each of the four years ended 31 December 2007 are presented on page 196 to 204. Selected data under UK GAAP for each of the two years ended 31 December 2004 are presented on pages 205 to 211. The dollar financial information included below has been converted from sterling at a rate of £1.00 to US$1.9843, being the Noon Buying Rate on 31 December 2007.
Amounts in accordance with IFRS
| | 2007 | 2007 | 2006 | 2005 | 2004 |
| Summary consolidated income statement – IFRS | $m | £m | £m | £m | £m |
| Net interest income | 25,137 | 12,668 | 10,596 | 9,918 | 9,071 |
Non-interest income (1) | 36,604 | 18,447 | 17,406 | 15,984 | 14,320 |
| Total income | 61,741 | 31,115 | 28,002 | 25,902 | 23,391 |
Operating expenses (2, 3, 4) | 28,643 | 14,435 | 12,480 | 11,946 | 10,362 |
| Profit before other operating charges and impairment losses | 33,098 | 16,680 | 15,522 | 13,956 | 13,029 |
| Insurance net claims | 9,231 | 4,652 | 4,458 | 4,313 | 4,260 |
| Impairment losses | 4,222 | 2,128 | 1,878 | 1,707 | 1,485 |
| Operating profit before tax | 19,645 | 9,900 | 9,186 | 7,936 | 7,284 |
| Tax | 4,072 | 2,052 | 2,689 | 2,378 | 1,995 |
| Profit from continuing operations | 15,573 | 7,848 | 6,497 | 5,558 | 5,289 |
| Loss from discontinued operations, net of tax | 270 | 136 | — | — | — |
| Profit for the year | 15,303 | 7,712 | 6,497 | 5,558 | 5,289 |
| | | | | | |
| Profit attributable to: | | | | | |
| Minority interests | 324 | 163 | 104 | 57 | 177 |
| Other owners | 488 | 246 | 191 | 109 | 256 |
| Ordinary shareholders | 14,491 | 7,303 | 6,202 | 5,392 | 4,856 |
| | Notes: |
| | |
| (1) | Includes gain on sale of strategic investment of £333 million in 2005. |
| | |
| (2) | Includes loss on sale of subsidiaries of £93 million in 2005. |
| | |
| (3) | Includes integration expenditure of £108 million in 2007 (2006 – £134 million; 2005 – £458 million; 2004 – £520 million). |
| | |
| (4) | Includes purchased intangibles amortisation of £274 million in 2007 (2006 – £94 million; 2005 – £97 million; 2004 – £45 million). |
| | 2007 | 2007 | 2006 | 2005 | 2004 |
| Summary consolidated balance sheet – IFRS | $m | £m | £m | £m | £m |
| Loans and advances | 2,080,955 | 1,048,710 | 549,499 | 487,813 | 408,324 |
| Debt securities and equity shares | 653,734 | 329,453 | 140,755 | 130,266 | 98,631 |
| Derivatives and settlement balances | 702,440 | 353,999 | 124,106 | 101,668 | 23,482 |
| Other assets | 334,071 | 168,357 | 57,072 | 57,080 | 57,685 |
| Total assets | 3,771,200 | 1,900,519 | 871,432 | 776,827 | 588,122 |
| | | | | | |
| Equity owners | 105,243 | 53,038 | 40,227 | 35,435 | 33,905 |
| Minority interests | 76,173 | 38,388 | 5,263 | 2,109 | 3,492 |
| Subordinated liabilities | 75,362 | 37,979 | 27,654 | 28,274 | 20,366 |
| Deposits | 1,974,375 | 994,998 | 516,365 | 453,274 | 383,198 |
| Derivatives, settlement balances and short positions | 839,520 | 423,081 | 167,588 | 140,426 | 51,866 |
| Other liabilities | 700,527 | 353,035 | 114,335 | 117,309 | 95,295 |
| Total liabilities and equity | 3,771,200 | 1,900,519 | 871,432 | 776,827 | 588,122 |
The per share data in the table below have been restated for the effect of the bonus issue of ordinary shares in May 2007.
| Other financial data based upon IFRS | 2007 | 2006 | 2005 | 2004 |
| Earnings per ordinary share – pence | 76.4 | 64.9 | 56.5 | 52.5 |
Diluted earnings per ordinary share – pence (1) | 75.7 | 64.4 | 56.1 | 52.0 |
| Dividends per ordinary share – pence | 32.2 | 25.8 | 20.2 | 17.5 |
Dividend payout ratio (2) | 45% | 46% | 43% | 38% |
| Share price per ordinary share at year end – £ | 4.44 | 6.64 | 5.85 | 5.84 |
| Market capitalisation at year end – £bn | 44.4 | 62.8 | 56.1 | 55.6 |
| Net asset value per ordinary share – £ | 4.47 | 3.86 | 3.38 | 3.09 |
Return on average total assets (3) | 0.63% | 0.74% | 0.73% | 0.94% |
Return on average ordinary shareholders’ equity (4) | 18.8% | 18.5% | 17.5% | 18.3% |
| Average owners’ equity as a percentage of average total assets | 3.7% | 4.4% | 4.5% | 5.9% |
| Risk asset ratio – Tier 1 | 7.3% | 7.5% | 7.6% | 7.0% |
| Risk asset ratio – Total | 11.2% | 11.7% | 11.7% | 11.7% |
Ratio of earnings to combined fixed charges and preference share dividends (5) | | | | |
| – including interest on deposits | 1.44 | 1.62 | 1.67 | 1.88 |
| – excluding interest on deposits | 5.74 | 6.12 | 6.05 | 7.43 |
Ratio of earnings to fixed charges only (5) | | | | |
| – including interest on deposits | 1.46 | 1.64 | 1.69 | 1.94 |
| – excluding interest on deposits | 6.53 | 6.87 | 6.50 | 9.70 |
| | Notes: |
| | |
| (1) | All the convertible preference shares have a dilutive effect in 2007, 2006 and 2005 and as such have been included in the computation of diluted earnings per share. In 2004 their effect was anti-dilutive. |
| | |
| (2) | Dividend payout ratio represents the interim dividend paid and final dividend proposed as a percentage of profit attributable to ordinary shareholders. |
| | |
| (3) | Return on average total assets represents profit attributable to ordinary shareholders as a percentage of average total assets. |
| | |
| (4) | Return on average ordinary shareholders’ equity represents profit attributable to ordinary shareholders expressed as a percentage of average ordinary shareholders’ equity. |
| | |
| (5) | For this purpose, earnings consist of income before tax and minority interests, plus fixed charges less the unremitted income of associated undertakings (share of profits less dividends received). Fixed charges consist of total interest expense, including or excluding interest on deposits and debt securities in issue, as appropriate, and the proportion of rental expense deemed representative of the interest factor (one third of total rental expenses). |
Additional information continued
Amounts in accordance with IFRS (continued)
Analysis of loans and advances to customers – IFRS
The following table analyses loans and advances to customers before provisions by remaining maturity, geographical area and type of customer. Overdrafts are included in the ‘Within 1 year’ category.
| | | Within 1 year | | After 1 but within 5 years | | After 5 years | | 2007 Total | | 2006 | | | 2005 | | | 2004 | |
| | | | £m | | | £m | | | £m | | | £m | | | £m | | | | £m | | | | £m | |
| UK | | | | | | | | | | | | | | | | | | | | | | | | |
| Central and local government | | | 2,790 | | | 29 | | | 316 | | | 3,135 | | | 6,732 | | | | 3,340 | | | | 1,866 | |
| Manufacturing | | | 7,836 | | | 3,584 | | | 2,032 | | | 13,452 | | | 11,051 | | | | 11,615 | | | | 6,292 | |
| Construction | | | 6,427 | | | 2,443 | | | 1,332 | | | 10,202 | | | 8,251 | | | | 7,274 | | | | 5,024 | |
| Finance | | | 64,624 | | | 4,283 | | | 1,783 | | | 70,690 | | | 25,017 | | | | 27,091 | | | | 24,638 | |
| Service industries and business activities | | | 21,194 | | | 15,471 | | | 17,300 | | | 53,965 | | | 43,887 | | | | 40,687 | | | | 30,867 | |
| Agriculture, forestry and fishing | | | 1,109 | | | 516 | | | 848 | | | 2,473 | | | 2,767 | | | | 2,645 | | | | 2,481 | |
| Property | | | 15,236 | | | 17,596 | | | 17,219 | | | 50,051 | | | 39,296 | | | | 32,899 | | | | 26,448 | |
| Individuals – home mortgages | | | 19,394 | | | 1,183 | | | 53,339 | | | 73,916 | | | 70,884 | | | | 65,286 | | | | 57,535 | |
| – other | | | 23,525 | | | 2,425 | | | 2,236 | | | 28,186 | | | 27,922 | | | | 26,323 | | | | 26,459 | |
| Finance leases and instalment credit | | | 2,476 | | | 6,045 | | | 7,111 | | | 15,632 | | | 14,218 | | | | 13,909 | | | | 13,044 | |
| Accrued interest | | | 2,124 | | | 79 | | | 141 | | | 2,344 | | | 1,497 | | | | 1,250 | | | | — | |
| Total domestic | | | 166,735 | | | 53,654 | | | 103,657 | | | 324,046 | | | 251,522 | | | | 232,319 | | | | 194,654 | |
| Overseas residents | | | 51,758 | | | 23,242 | | | 23,845 | | | 98,845 | | | 69,242 | | | | 52,234 | | | | 48,183 | |
| Total UK offices | | | 218,493 | | | 76,896 | | | 127,502 | | | 422,891 | | | 320,764 | | | | 284,553 | | | | 242,837 | |
| | | | | | | | | | | | | | | | | | | | | | | | | |
| Overseas | | | | | | | | | | | | | | | | | | | | | | | | |
| US | | | 72,268 | | | 26,017 | | | 36,774 | | | 135,059 | | | 92,166 | | | | 90,606 | | | | 74,027 | |
| Rest of the World | | | 112,130 | | | 52,621 | | | 112,987 | | | 277,738 | | | 57,896 | | | | 45,951 | | | | 34,555 | |
| Total Overseas offices | | | 184,398 | | | 78,638 | | | 149,761 | | | 412,797 | | | 150,062 | | | | 136,557 | | | | 108,582 | |
| Loans and advances to customers – gross | | | 402,891 | | | 155,534 | | | 277,263 | | | 835,688 | | | 470,826 | | | | 421,110 | | | | 351,419 | |
| Loan impairment provisions | | | | | | | | | | | | (6,438 | ) | | (3,933 | ) | | | (3,884 | ) | | | (4,168 | ) |
| Loans and advances to customers – net | | | | | | | | | | | | 829,250 | | | 466,893 | | | | 417,226 | | | | 347,251 | |
| | | | | | | | | | | | | | | | | | | | | | | | | |
| Fixed rate | | | 149,685 | | | 62,985 | | | 139,227 | | | 351,897 | | | 115,240 | | | | 100,748 | | | | 101,227 | |
| Variable rate | | | 253,206 | | | 92,549 | | | 138,036 | | | 483,791 | | | 355,586 | | | | 320,362 | | | | 250,192 | |
| Loans and advances to customers – gross | | | 402,891 | | | 155,534 | | | 277,263 | | | 835,688 | | | 470,826 | | | | 421,110 | | | | 351,419 | |
Cross border exposures
Cross border exposures are defined as loans to banks and customers (including finance lease and instalment credit receivables) and other monetary assets, including non-local currency claims of overseas offices on local residents.
The Group monitors the geographical breakdown of these exposures based on the country of domicile of the borrower or guarantor of ultimate risk.
The table below sets out the Group’s cross border outstandings in excess of 0.75% of Group total assets (including acceptances), which totalled £1,900.5 billion at 31 December 2007 (2006 – £871.4 billion; 2005 – £776.8 billion). None of these countries has experienced repayment difficulties that have required refinancing of outstanding debt.
| | 2007 | 2006 | 2005 |
| | £m | £m | £m |
| United States | 91,653 | 43,718 | 34,246 |
| France | 65,430 | 18,136 | 13,402 |
| Germany | 51,123 | 20,130 | 18,395 |
| Japan | 31,922 | 7,725 | * |
| Spain | 31,651 | 9,341 | 7,392 |
| Netherlands | 27,707 | 12,407 | 8,026 |
| Italy | 23,925 | 7,506 | * |
| Republic of Ireland | 17,736 | 8,530 | 6,008 |
| Cayman Islands | 17,099 | 9,063 | 11,813 |
| Norway | * | 7,768 | * |
| Switzerland | * | 7,262 | 7,061 |
| China | * | 6,574 | * |
* Less than 0.75% of Group total assets.
Loan impairment provisions
For a discussion of the factors considered in determining the amount of the provisions, see ‘Loan impairment’ on page 58 and ‘Critical accounting polices – Loan impairment provisions’ on pages 113 and 114.
The following table shows the elements of loan impairment provisions.
| | | IFRS | |
| | | 2007 | | | 2006 | | | 2005 | | | 2004 | |
| | | | £m | | | | £m | | | | £m | | | | £m | |
| Provisions at the beginning of the year | | | | | | | | | | | | | | | | |
| Domestic | | | 3,037 | | | | 2,759 | | | | 2,675 | | | | 2,408 | |
| Foreign | | | 898 | | | | 1,128 | | | | 1,470 | | | | 1,477 | |
| | | | 3,935 | | | | 3,887 | | | | 4,145 | | | | 3,885 | |
| Currency translation and other adjustments | | | | | | | | | | | | | | | | |
| Domestic | | | 5 | | | | (17 | ) | | | (7 | ) | | | (8 | ) |
| Foreign | | | 132 | | | | (44 | ) | | | 58 | | | | (90 | ) |
| | | | 137 | | | | (61 | ) | | | 51 | | | | (98 | ) |
| Acquisitions of businesses | | | | | | | | | | | | | | | | |
| Domestic | | | 10 | | | �� | — | | | | — | | | | 2 | |
| Foreign | | | 2,200 | | | | — | | | | — | | | | 288 | |
| | | | 2,210 | | | | — | | | | — | | | | 290 | |
| Amounts written-off | | | | | | | | | | | | | | | | |
| Domestic | | | (1,222 | ) | | | (1,360 | ) | | | (1,252 | ) | | | (901 | ) |
| Foreign | | | (949 | ) | | | (481 | ) | | | (788 | ) | | | (548 | ) |
| | | | (2,171 | ) | | | (1,841 | ) | | | (2,040 | ) | | | (1,449 | ) |
| Recoveries of amounts written-off in previous years | | | | | | | | | | | | | | | | |
| Domestic | | | 158 | | | | 119 | | | | 97 | | | | 85 | |
| Foreign | | | 232 | | | | 96 | | | | 75 | | | | 59 | |
| | | | 390 | | | | 215 | | | | 172 | | | | 144 | |
| Charged to income statement | | | | | | | | | | | | | | | | |
| Domestic | | | 1,420 | | | | 1,663 | | | | 1,376 | | | | 960 | |
| Foreign | | | 686 | | | | 214 | | | | 327 | | | | 442 | |
| | | | 2,106 | | | | 1,877 | | | | 1,703 | | | | 1,402 | |
| Unwind of discount | | | | | | | | | | | | | | | | |
| Domestic | | | (150 | ) | | | (127 | ) | | | (130 | ) | | | — | |
| Foreign | | | (16 | ) | | | (15 | ) | | | (14 | ) | | | — | |
| | | | (166 | ) | | | (142 | ) | | | (144 | ) | | | — | |
Provisions at the end of the year (1) | | | | | | | | | | | | | | | | |
| Domestic | | | 3,258 | | | | 3,037 | | | | 2,759 | | | | 2,546 | |
| Foreign | | | 3,183 | | | | 898 | | | | 1,128 | | | | 1,628 | |
| | | | 6,441 | | | | 3,935 | | | | 3,887 | | | | 4,174 | |
| Gross loans and advances to customers | | | | | | | | | | | | | | | | |
| Domestic | | | 324,046 | | | | 251,522 | | | | 232,319 | | | | 194,654 | |
| Foreign | | | 511,642 | | | | 219,304 | | | | 188,791 | | | | 156,765 | |
| | | | 835,688 | | | | 470,826 | | | | 421,110 | | | | 351,419 | |
Closing customer provisions as a % of gross loans and advances to customers (2) | | | | | | | | | | | | | | | | |
| Domestic | | | 1.00 | % | | | 1.21 | % | | | 1.19 | % | | | 1.31 | % |
| Foreign | | | 0.62 | % | | | 0.41 | % | | | 0.60 | % | | | 1.04 | % |
| Total | | | 0.77 | % | | | 0.84 | % | | | 0.92 | % | | | 1.19 | % |
| | | | | | | | | | | | | | | | | |
| Customer charge to income statement as a % of gross loans and advances to customers | | | | | | | | | | | | | | | | |
| Domestic | | | 0.44 | % | | | 0.66 | % | | | 0.59 | % | | | 0.49 | % |
| Foreign | | | 0.13 | % | | | 0.10 | % | | | 0.17 | % | | | 0.28 | % |
| Total | | | 0.25 | % | | | 0.40 | % | | | 0.40 | % | | | 0.40 | % |
| | Notes: |
| | |
| (1) | Includes closing provisions against loans and advances to banks of £3 million (2006 – £2 million; 2005 – £3 million; 2004 – £6 million). |
| | |
| (2) | Closing customer provisions exclude closing provisions against loans and advances to banks. |
Additional information continued
Amounts in accordance with IFRS (continued)
Loan impairment provisions (continued)
The following table shows additional information in respect of the loan impairment provisions.
| | IFRS |
| | 2007 | 2006 | 2005 | 2004 |
| | £m | £m | £m | £m |
| | | | | |
| Loans and advances to customers (gross) | 835,688 | 470,826 | 421,110 | 351,419 |
| | | | | |
| Loan impairment provisions at end of year: | | | | |
| – customers | 6,438 | 3,933 | 3,884 | |
| – banks | 3 | 2 | 3 | |
| Specific provisions – customers | | | | 3,607 |
| Specific provisions – banks | | | | 6 |
| General provision | | | | 561 |
| | 6,441 | 3,935 | 3,887 | 4,174 |
| | | | | |
| Average loans and advances to customers (gross) | 567,900 | 445,766 | 402,473 | 299,430 |
| | | | | |
| As a % of average loans and advances to customers during the year: | | | | |
| Total customer provisions charged to income statement | 0.37% | 0.42% | 0.42% | 0.47% |
| | | | | |
| Amounts written-off (net of recoveries) – customers | 0.31% | 0.36% | 0.46% | 0.44% |
Analysis of closing loan impairment provisions
The following table analyses customer loan impairment provisions by geographical area and type of domestic customer.
| | IFRS |
| | 2007 | | 2006 | | 2005 | | 2004 |
| | Closing provision | % of loans to total loans | | Closing provision | % of loans to total loans | | Closing provision | % of loans to total loans | | Closing provision | % of loans to total loans |
| | £m | % | | £m | % | | £m | % | | £m | % |
| Domestic | | | | | | | | | | | |
| Central and local government | — | 0.4 | | — | 1.4 | | — | 0.8 | | — | 0.6 |
| Manufacturing | 93 | 1.6 | | 94 | 2.4 | | 138 | 2.8 | | 127 | 1.8 |
| Construction | 75 | 1.2 | | 63 | 1.8 | | 74 | 1.7 | | 71 | 1.4 |
| Finance | 52 | 8.4 | | 33 | 5.3 | | 104 | 6.4 | | 54 | 7.0 |
| Service industries and business activities | 562 | 6.5 | | 647 | 9.3 | | 647 | 9.7 | | 516 | 8.8 |
| Agriculture, forestry and fishing | 21 | 0.3 | | 25 | 0.6 | | 26 | 0.6 | | 23 | 0.7 |
| Property | 85 | 6.0 | | 70 | 8.3 | | 63 | 7.8 | | 64 | 7.5 |
| Individuals – home mortgages | 36 | 8.8 | | 37 | 15.1 | | 36 | 15.5 | | 32 | 16.4 |
| – other | 2,043 | 3.4 | | 1,826 | 5.9 | | 1,513 | 6.3 | | 1,277 | 7.5 |
| Finance leases and instalment credit | 132 | 1.9 | | 103 | 3.0 | | 88 | 3.3 | | 122 | 3.7 |
| Accrued interest | — | 0.3 | | — | 0.3 | | — | 0.3 | | | |
| Total domestic | 3,099 | 38.8 | | 2,898 | 53.4 | | 2,689 | 55.2 | | 2,286 | 55.4 |
| Foreign | 2,289 | 61.2 | | 442 | 46.6 | | 652 | 44.8 | | 1,321 | 44.6 |
| Impaired book provisions | 5,388 | 100.00 | | 3,340 | 100.0 | | 3,341 | 100.0 | | | 100.0 |
| Latent book provisions | 1,050 | | | 593 | | | 543 | | | | |
| Specific provisions | | | | | | | | | | 3,607 | |
| General provision | | | | | | | | | | 561 | |
| Total provisions | 6,438 | | | 3,933 | | | 3,884 | | | 4,168 | |
Analysis of write-offs
The following table analyses amounts written-off by geographical area and type of domestic customer.
| | IFRS |
| | 2007 | 2006 | 2005 | 2004 |
| | £m | £m | £m | £m |
| Domestic | | | | |
| Manufacturing | 29 | 41 | 40 | 55 |
| Construction | 21 | 29 | 17 | 12 |
| Finance | 47 | 17 | 21 | 19 |
| Service industries and business activities | 190 | 212 | 176 | 163 |
| Agriculture, forestry and fishing | 4 | 5 | 4 | 9 |
| Property | 9 | 6 | 25 | 33 |
| Individuals – home mortgages | — | 5 | 4 | 4 |
| – others | 909 | 1,021 | 948 | 516 |
| Finance leases and instalment credit | 13 | 24 | 15 | 90 |
| Total domestic | 1,222 | 1,360 | 1,250 | 901 |
| Foreign | 949 | 481 | 788 | 548 |
Total write-offs (1) | 2,171 | 1,841 | 2,038 | 1,449 |
Note:
| (1) | Excludes £2 million written-off in respect of loans and advances to banks in 2005. |
Analysis of recoveries
The following table analyses recoveries of amounts written-off by geographical area and type of domestic customer.
| | IFRS |
| | 2007 | 2006 | 2005 | 2004 |
| | £m | £m | £m | £m |
| Domestic | | | | |
| Manufacturing | — | — | 1 | 1 |
| Construction | — | — | 1 | — |
| Finance | — | — | — | 2 |
| Service industries and business activities | 7 | 5 | 2 | 1 |
| Property | — | 1 | 2 | — |
| Individuals – home mortgages | — | — | — | 1 |
| Individuals – others | 143 | 101 | 84 | 78 |
| Finance leases and instalment credit | 8 | 12 | 7 | 2 |
| Total domestic | 158 | 119 | 97 | 85 |
| Foreign | 232 | 96 | 75 | 59 |
| Total recoveries | 390 | 215 | 172 | 144 |
Additional information continued
Amounts in accordance with IFRS (continued)
Risk elements in lending and potential problem loans
The Group’s loan control and review procedures do not include the classification of loans as non-accrual, accruing past due, restructured and potential problem loans, as defined by the SEC in the US. The following table shows the estimated amount of loans that would be reported using the SEC’s classifications. The figures are stated before deducting the value of security held or related provisions.
IFRS require interest to be recognised on a financial asset (or a group of financial assets) after impairment at the rate of interest used to discount recoveries when measuring the impairment loss. Thus, interest on impaired financial assets is credited to profit or loss as the discount on expected recoveries unwinds. Despite this, such assets are not considered performing. All loans that have an impairment provision are classified as non-accrual. This is a change from practice in 2004 and earlier years where certain loans with provisions were classified as past due 90 days or potential problem loans (and interest accrued on them).
| | IFRS |
| | 2007 | 2006 | 2005 | 2004 |
| | £m | £m | £m | £m |
Loans accounted for on a non-accrual basis (2): | | | | |
| Domestic | 5,599 | 5,420 | 4,977 | 3,658 |
| Foreign | 4,763 | 812 | 949 | 1,075 |
| Total | 10,362 | 6,232 | 5,926 | 4,733 |
Accruing loans which are contractually overdue 90 days or more as to principal or interest (3): | | | | |
| Domestic | 217 | 81 | 2 | 634 |
| Foreign | 152 | 24 | 7 | 79 |
| Total | 369 | 105 | 9 | 713 |
| Loans not included above which are classified as ‘troubled debt restructurings’ by the SEC: | | | | |
| Domestic | — | — | 2 | 14 |
| Foreign | — | — | — | 10 |
| Total | — | — | 2 | 24 |
| Total risk elements in lending | 10,731 | 6,337 | 5,937 | 5,470 |
| | | | | |
Potential problem loans (4) | | | | |
| Domestic | 63 | 47 | 14 | 173 |
| Foreign | 608 | 5 | 5 | 107 |
| Total potential problem loans | 671 | 52 | 19 | 280 |
| | | | | |
| Closing provisions for impairment as a % of total risk elements in lending | 60% | 62% | 65% | 76% |
Closing provisions for impairment as a % of total risk elements in lending and potential problem loans | 56% | 62% | 65% | 72% |
| Risk elements in lending as a % of gross lending to customers excluding reverse repos | 1.55% | 1.55% | 1.60% | 1.83% |
| | Notes: |
| | |
| (1) | For the analysis above, ‘Domestic’ consists of the United Kingdom domestic transactions of the Group. ‘Foreign’ comprises the Group’s transactions conducted through offices outside the UK and through those offices in the UK specifically organised to service international banking transactions. |
| | |
| (2) | All loans against which an impairment provision is held are reported in the non-accrual category. |
| | |
| (3) | Loans where an impairment event has taken place but no impairment recognised. This category is used for fully collateralised non-revolving credit facilities. |
| | |
| (4) | Loans for which an impairment event has occurred but no impairment provision is necessary. This category is used for fully collateralised advances and revolving credit facilities where identification as 90 days overdue is not feasible. |
| | IFRS |
| | 2007 | 2006 | 2005 | 2004 |
| | £m | £m | £m | £m |
| Gross income not recognised but which would have been | | | | |
| recognised under the original terms of non-accrual and restructured loans | | | | |
| Domestic | 390 | 370 | 334 | 235 |
| Foreign | 155 | 77 | 62 | 58 |
| | 545 | 447 | 396 | 293 |
| | | | | |
| Interest on non-accrual and restructured loans included in net interest income | | | | |
| Domestic | 165 | 142 | 130 | 58 |
| Foreign | 16 | 15 | 14 | 7 |
| | 181 | 157 | 144 | 65 |
Analysis of deposits – product analysis
The following table shows the distribution of the Group’s deposits by type and geographical area:
| | IFRS |
| | 2007 | 2006 | 2005 |
| | £m | £m | £m |
| UK | | | |
| Domestic: | | | |
| Demand deposits – interest-free | 43,721 | 39,149 | 28,833 |
| – interest-bearing | 121,343 | 118,315 | 91,564 |
| Time deposits – savings | 41,185 | 31,656 | 27,091 |
| – other | 207,247 | 80,496 | 73,097 |
| Overseas residents: | | | |
| Demand deposits – interest-free | 563 | 573 | 396 |
| – interest-bearing | 25,129 | 37,729 | 26,663 |
| Time deposits – savings | 605 | 1,122 | 1,108 |
| – other | 87,437 | 51,568 | 53,997 |
| Total UK offices | 527,230 | 360,608 | 302,749 |
| Overseas | | | |
| Demand deposits – interest-free | 27,959 | 12,173 | 13,248 |
| – interest-bearing | 70,758 | 27,441 | 17,886 |
| Time deposits – savings | 52,381 | 19,049 | 21,691 |
| – other | 316,670 | 97,094 | 97,700 |
| Total overseas offices (see below) | 467,768 | 155,757 | 150,525 |
| Total deposits | 994,998 | 516,365 | 453,274 |
| | | | |
| Held-for-trading | 125,916 | 104,249 | 66,712 |
| Designated as at fair value through profit or loss | 7,505 | 3,922 | 3,683 |
| Amortised cost | 861,577 | 408,194 | 382,879 |
| Total deposits | 994,998 | 516,365 | 453,274 |
| | | | |
| Overseas | | | |
| US | 152,324 | 115,121 | 120,405 |
| Rest of the World | 315,444 | 40,636 | 30,120 |
| Total overseas | 467,768 | 155,757 | 150,525 |
Additional information continued
Amounts in accordance with IFRS (continued)
Short term borrowings
| | IFRS |
| | 2007 | 2006 | 2005 |
| | £m | £m | £m |
| Commercial paper | | | |
| Outstanding at year end | 78,612 | 12,675 | 14,110 |
| Maximum outstanding at any month end during the year | 81,187 | 14,402 | 16,853 |
| Approximate average amount during the year | 32,498 | 13,225 | 15,329 |
| Approximate weighted average interest rate during the year | 4.8% | 4.9% | 3.7% |
| Approximate weighted average interest rate at year end | 5.5% | 5.0% | 4.2% |
| | | | |
| Other short term borrowings | | | |
| Outstanding at year end | 280,526 | 122,576 | 105,483 |
| Maximum outstanding at any month end during the year | 312,557 | 130,867 | 117,913 |
| Approximate average amount during the year | 188,326 | 112,008 | 100,681 |
| Approximate weighted average interest rate during the year | 4.6% | 4.5% | 3.4% |
| Approximate weighted average interest rate at year end | 4.1% | 4.5% | 3.5% |
Average interest rates during the year are computed by dividing total interest expense by the average amount borrowed. Average interest rates at year end are average rates for a single day and as such may reflect one-day market distortions which may not be indicative of generally prevailing rates. Original maturities of commercial paper are not in excess of one year. ‘Other short-term borrowings’ consist principally of borrowings in the money markets included within ‘Deposits by banks’ and ‘Customer accounts’ in the accounts, and generally have original maturities of one year or less.
Certificates of deposit and other time deposits
The following table shows details of the Group’s certificates of deposit and other time deposits over $100,000 or equivalent by remaining maturity.
| | Within 3 months | Over 3 months but within 6 months | Over 6 months but within 12 months | Over 12 months | 2007 Total |
| | £m | £m | £m | £m | £m |
| UK based companies and branches | | | | | |
| Certificates of deposit | 18,747 | 4,832 | 1,897 | 1,064 | 26,540 |
| Other time deposits | 98,943 | 6,467 | 3,734 | 12,085 | 121,229 |
| | | | | | |
| Overseas based companies and branches | | | | | |
| Certificates of deposit | 39,039 | 6,797 | 2,213 | 27,683 | 75,732 |
| Other time deposits | 131,701 | 12,745 | 5,077 | 13,227 | 162,750 |
| Total | 288,430 | 30,841 | 12,921 | 54,059 | 386,251 |
Amounts in accordance with UK GAAP
| | 2004 | 2003 |
| Summary consolidated profit and loss account – UK GAAP | £m | £m |
| Net interest income | 9,208 | 8,301 |
| Non-interest income | 13,546 | 10,980 |
| Total income | 22,754 | 19,281 |
Operating expenses excluding goodwill amortisation (1) | 9,931 | 8,753 |
| Goodwill amortisation | 915 | 763 |
| General insurance claims (net) | 3,480 | 2,195 |
| Profit before provisions | 8,428 | 7,570 |
| Provisions for bad and doubtful debts | 1,428 | 1,461 |
| Amounts written off fixed asset investments | 83 | 33 |
| Profit on ordinary activities before tax | 6,917 | 6,076 |
| Tax on profit on ordinary activities | 2,155 | 1,888 |
| Profit on ordinary activities after tax | 4,762 | 4,188 |
| Minority interests (including non-equity) | 250 | 210 |
| Preference dividends – non-equity | 256 | 261 |
| | 4,256 | 3,717 |
| Additional Value Shares dividend – non-equity | — | 1,463 |
| Profit attributable to ordinary shareholders | 4,256 | 2,254 |
Note:
| (1) | Includes integration expenditure of £269 million in 2004 (2003 – £229 million). |
| | 2004 | 2003 |
| Summary consolidated balance sheet – UK GAAP | £m | £m |
| Loans and advances to banks (net of provisions) | 58,260 | 51,891 |
| Loans and advances to customers (net of provisions) | 345,469 | 252,531 |
| Debt securities and equity shares | 94,171 | 82,249 |
| Intangible fixed assets | 17,576 | 13,131 |
| Other assets | 67,991 | 54,626 |
| Total assets | 583,467 | 454,428 |
| | | |
| Called up share capital | 822 | 769 |
| Share premium account | 12,964 | 8,175 |
| Other reserves | 10,856 | 11,307 |
| Profit and loss account | 7,223 | 5,847 |
| Shareholders’ funds | 31,865 | 26,098 |
| Minority interests | 3,829 | 2,713 |
| Subordinated liabilities | 20,366 | 16,998 |
| Deposits by banks | 99,081 | 67,323 |
| Customer accounts | 285,062 | 236,963 |
| Debt securities in issue | 58,960 | 41,016 |
| Other liabilities | 84,304 | 63,317 |
| Total liabilities | 583,467 | 454,428 |
Additional information continued
Amounts in accordance with UK GAAP (continued)
The per share data in the table below have been restated for the effect of the bonus issue of ordinary shares in May 2007.
| Other financial data based upon UK GAAP | 2004 | 2003 |
| Earnings per ordinary share – pence | 46.0 | 25.6 |
Diluted earnings per ordinary share – pence (1) | 45.6 | 25.4 |
| Dividends per ordinary share – pence | 19.3 | 16.8 |
Dividend payout ratio (2) | 43% | 66% |
| Share price per ordinary share at period end – £ | 5.84 | 5.49 |
| Market capitalisation at period end – £bn | 55.6 | 48.8 |
| Net asset value per ordinary share – £ | 2.87 | 2.61 |
Return on average total assets (3) | 0.82% | 0.51% |
Return on average equity shareholders’ funds (4) | 16.0% | 9.8% |
| Average shareholders’ equity as a percentage | | |
| of average total assets | 5.7% | 5.9% |
| Risk asset ratio – Tier 1 | 7.0% | 7.4% |
| – Total | 11.7% | 11.8% |
| Ratio of earnings to combined fixed charges and preference | | |
share dividends (5) | | |
| – including interest on deposits | 1.84 | 1.95 |
| – excluding interest on deposits | 7.09 | 7.08 |
Ratio of earnings to fixed charges only (5) | | |
| – including interest on deposits | 1.90 | 2.04 |
| – excluding interest on deposits | 9.26 | 9.73 |
| | Notes: |
| | |
| (1) | Convertible preference shares have not been included in the computation of diluted earnings per share as their effect was anti-dilutive. |
| | |
| (2) | Dividend payout ratio represents the interim dividend paid and final dividend proposed as a percentage of profit attributable to ordinary shareholders. |
| | |
| (3) | Return on average total assets represents profit attributable to ordinary shareholders as a percentage of average total assets. |
| | |
| (4) | Return on average equity shareholders’ funds represents profit attributable to ordinary shareholders expressed as a percentage of average equity shareholders’ funds. |
| | |
| (5) | For this purpose, earnings consist of income before tax and minority interests, plus fixed charges less the unremitted income of associated undertakings (share of profits less dividends received). Fixed charges consist of total interest expense, including or excluding interest on deposits and debt securities in issue, as appropriate, and the proportion of rental expense deemed representative of the interest factor (one third of total rental expenses). |
Analysis of loans and advances to customers
The following table analyses loans and advances to customers before provisions by geographical area and type of customer.
| | UK GAAP |
| | 2004 | 2003 |
| | £m | £m |
| UK | | |
| Central and local government | 1,866 | 1,217 |
| Manufacturing | 6,292 | 6,384 |
| Construction | 5,024 | 3,960 |
| Finance | 25,157 | 18,948 |
| Service industries and business activities | 30,850 | 29,290 |
| Agriculture, forestry and fishing | 2,480 | 2,562 |
| Property | 26,445 | 19,670 |
| Individuals – home mortgages | 57,529 | 48,117 |
| – other | 27,863 | 25,526 |
| Finance leases and instalment credit | 13,083 | 11,703 |
| Total domestic | 196,589 | 167,377 |
| Overseas residents | 44,053 | 27,168 |
| Total UK offices | 240,642 | 194,545 |
| | | |
| Overseas | | |
| US | 74,045 | 40,373 |
| Rest of the World | 35,004 | 21,535 |
| Total overseas offices | 109,049 | 61,908 |
| Loans and advances to customers – gross | 349,691 | 256,453 |
| Provisions for bad and doubtful debts | (4,222) | (3,922) |
| Loans and advances to customers – net | 345,469 | 252,531 |
| | | |
| Fixed rate | 100,729 | 81,918 |
| Variable rate | 248,962 | 174,535 |
| Loans and advances to customers – gross | 349,691 | 256,453 |
Cross border exposures
The table below sets out the Group’s cross border outstandings in excess of 0.75% of Group total assets (including acceptances), which totalled £583.8 billion at 31 December 2004 (2003 – £455.0 billion). None of these countries has experienced repayment difficulties that have required refinancing of outstanding debt.
| | UK GAAP |
| | 2004 | 2003 |
| | £m | £m |
| United States | 28,795 | 14,618 |
| Germany | 14,050 | 15,073 |
| France | 9,604 | 7,524 |
| Netherlands | 8,871 | 6,830 |
| Cayman Islands | 7,258 | 6,666 |
| Spain | 5,249 | 3,421 |
| Japan | 4,610 | 4,141 |
Additional information continued
Amounts in accordance with UK GAAP (continued)
Provisions for bad and doubtful debts
The following table shows the elements of provisions for bad and doubtful debts under UK GAAP.
| | UK GAAP |
| | 2004 | 2003 |
| | £m | £m |
| Provisions at the beginning of the year | | |
| Domestic | 2,452 | 2,581 |
| Foreign | 1,477 | 1,346 |
| | 3,929 | 3,927 |
| Currency translation and other adjustments | | |
| Domestic | (8) | (2) |
| Foreign | (90) | (60) |
| | (98) | (62) |
| Acquisitions of businesses | | |
| Domestic | 2 | — |
| Foreign | 288 | 50 |
| | 290 | 50 |
| Amounts written-off | | |
| Domestic | (920) | (1,097) |
| Foreign | (548) | (422) |
| | (1,468) | (1,519) |
| Recoveries of amounts written-off in previous years | | |
| Domestic | 88 | 38 |
| Foreign | 59 | 34 |
| | 147 | 72 |
| Charged to profit and loss account | | |
| Domestic | 986 | 932 |
| Foreign | 442 | 529 |
| | 1,428 | 1,461 |
Provisions at the end of the year (1) | | |
| Domestic | 2,600 | 2,452 |
| Foreign | 1,628 | 1,477 |
| | 4,228 | 3,929 |
| Gross loans and advances to customers | | |
| Domestic | 196,589 | 167,377 |
| Foreign | 153,102 | 89,076 |
| | 349,691 | 256,453 |
Closing customer provisions as a % of gross loans and advances to customers (2) | | |
| Domestic | 1.32% | 1.46% |
| Foreign | 1.06% | 1.65% |
| Total | 1.21% | 1.53% |
| | | |
| Customer charge against profit as a % of gross loans and advances to customers | | |
| Domestic | 0.50% | 0.56% |
| Foreign | 0.29% | 0.59% |
| Total | 0.41% | 0.57% |
| | Notes: |
| | |
| (1) | Includes closing provisions against loans and advances to banks of £6 million in 2004 (2003 – £7 million). |
| | |
| (2) | Closing customer provisions exclude closing provisions against loans and advances to banks. |
The following table shows additional information with respect to the provisions for bad and doubtful debts under UK GAAP.
| | UK GAAP |
| | 2004 | 2003 |
| | £m | £m |
| Loans and advances to customers (gross) | 349,691 | 256,453 |
| | | |
| Provisions at end of year: | | |
| Specific provisions – customers | 3,648 | 3,356 |
| – banks | 6 | 7 |
| General provision | 574 | 566 |
| | 4,228 | 3,929 |
| | | |
| Customer provision at end of year as % of loans and | | |
| advances to customers at end of year: | | |
| Specific provisions | 1.04% | 1.31% |
| General provision | 0.17% | 0.22% |
| | 1.21% | 1.53% |
| | | |
| Average loans and advances to customers (gross) | 298,150 | 245,798 |
| | | |
| As a % of average loans and advances to customers during the year: | | |
| Total customer provisions charged to profit and loss | 0.48% | 0.59% |
| | | |
| Amounts written-off (net of recoveries) – customers | 0.44% | 0.59% |
Analysis of closing provisions for bad and doubtful debts
The following table analyses customer provisions for bad and doubtful debts by geographical area and type of domestic customer.
| | UK GAAP |
| | 2004 | | 2003 |
| | Closing provision | % of loans to total loans | | Closing provision | % of loans to total loans |
| | £m | % | | £m | % |
| Domestic | | | | | |
| Central and local government | — | 0.5 | | — | 0.5 |
| Manufacturing | 127 | 1.8 | | 156 | 2.5 |
| Construction | 71 | 1.4 | | 56 | 1.5 |
| Finance | 54 | 7.2 | | 34 | 7.4 |
| Service industries and business activities | 516 | 8.8 | | 599 | 11.4 |
| Agriculture, forestry and fishing | 23 | 0.7 | | 20 | 1.0 |
| Property | 64 | 7.6 | | 58 | 7.7 |
| Individuals – home mortgages | 32 | 16.5 | | 35 | 18.8 |
| – other | 1,318 | 8.0 | | 1,003 | 9.9 |
| Finance leases and instalment credit | 122 | 3.7 | | 136 | 4.6 |
| Total domestic | 2,327 | 56.2 | | 2,097 | 65.3 |
| Foreign | 1,321 | 43.8 | | 1,259 | 34.7 |
| Specific provisions | 3,648 | 100.0 | | 3,356 | 100.0 |
| General provision | 574 | | | 566 | |
| Total provisions | 4,222 | | | 3,922 | |
Additional information continued
Amounts in accordance with UK GAAP (continued)
Analysis of write-offs
The following table analyses amounts written-off by geographical area and type of domestic customer.
| | UK GAAP |
| | 2004 | 2003 |
| | £m | £m |
| Domestic | | |
| Manufacturing | 55 | 99 |
| Construction | 12 | 22 |
| Finance | 19 | 54 |
| Service industries and business activities | 163 | 393 |
| Agriculture, forestry and fishing | 9 | 4 |
| Property | 33 | 6 |
| Individuals – home mortgages | 4 | 2 |
| – others | 535 | 357 |
| Finance leases and instalment credit | 90 | 160 |
| Total domestic | 920 | 1,097 |
| Foreign | 548 | 422 |
| Total write-offs | 1,468 | 1,519 |
Analysis of recoveries
The following table analyses recoveries of amounts written-off by geographical area and type of domestic customer.
| | UK GAAP |
| | 2004 | 2003 |
| | £m | £m |
| Domestic | | |
| Manufacturing | 1 | — |
| Finance | 2 | — |
| Service industries and business activities | 1 | 3 |
| Individuals – home mortgages | 1 | — |
| – others | 81 | 26 |
| Finance leases and instalment credit | 2 | 9 |
| Total domestic | 88 | 38 |
| Foreign | 59 | 34 |
| Total recoveries | 147 | 72 |
Risk elements in lending and potential problem loans
The Group’s loan control and review procedures do not include the classification of loans as non-accrual, accruing past due, restructured and potential problem loans, as defined by the SEC in the US. The following table shows the estimated amount of loans that would be reported using the SEC’s classifications. The figures incorporate estimates and are stated before deducting the value of security held or related provisions.
| | UK GAAP |
| | 2004 | 2003 |
| | £m | £m |
Loans accounted for on a non-accrual basis (3): | | |
| Domestic | 3,705 | 3,221 |
| Foreign | 1,075 | 1,211 |
| Total | 4,780 | 4,432 |
Accruing loans which are contractually overdue 90 days or more as to principal or interest (4): | | |
| Domestic | 646 | 561 |
| Foreign | 79 | 81 |
| Total | 725 | 642 |
| Loans not included above which are classified as ‘troubled debt restructurings’ by the SEC: | | |
| Domestic | 14 | 53 |
| Foreign | 10 | 30 |
| Total | 24 | 83 |
| Total risk elements in lending | 5,529 | 5,157 |
| | | |
Potential problem loans (5) | | |
| Domestic | 173 | 492 |
| Foreign | 107 | 99 |
| Total potential problem loans | 280 | 591 |
| | | |
| Closing provisions for bad and doubtful debts as a % of total risk elements in lending | 76% | 76% |
| Closing provisions for bad and doubtful debts as a % of total risk elements in lending and potential problem loans | 73% | 68% |
| Risk elements in lending as a % of gross loans and advances to customers excluding reverse repos | 1.86% | 2.22% |
| | Notes: |
| | |
| (1) | For the analysis above, ‘Domestic’ consists of the UK domestic transactions of the Group. ‘Foreign’ comprises the Group’s transactions conducted through offices outside the UK and through those offices in the UK specifically organised to service international banking transactions. |
| | |
| (2) | The classification of a loan as non-accrual, past due 90 days or troubled debt restructuring does not necessarily indicate that the principal of the loan is uncollectable in whole or in part. Collection depends in each case on the individual circumstances of the loan, including the adequacy of any collateral securing the loan and therefore classification of a loan as non-accrual, past due 90 days or troubled debt restructuring does not always require that a provision be made against such a loan. In accordance with the Group’s provisioning policy for bad and doubtful debts, it is considered that adequate provisions for the above risk elements in lending have been made. |
| | |
| (3) | The Group’s UK banking subsidiary undertakings account for loans on a non-accrual basis from the point in time at which the collectability of interest is in significant doubt. Certain subsidiary undertakings of the Group, principally Citizens, generally account for loans on a non-accrual basis when interest or principal is past due 90 days. |
| | |
| (4) | Overdrafts generally have no fixed repayment schedule and consequently are not included in this category. |
| | |
| (5) | Loans that are current as to the payment of principal and interest but in respect of which management has serious doubts about the ability of the borrower to comply with contractual repayment terms. Substantial security is held in respect of these loans and appropriate provisions have already been made in accordance with the Group’s provisioning policy for bad and doubtful debts. |
| | UK GAAP |
| | 2004 | 2003 |
| | £m | £m |
| Gross income not recognised but which would have been | | |
| recognised under the original terms of non-accrual and restructured loans | | |
| Domestic | 237 | 237 |
| Foreign | 58 | 55 |
| | 295 | 292 |
| | | |
| Interest on non-accrual and restructured loans included in net interest income | | |
| Domestic | 58 | 60 |
| Foreign | 7 | 3 |
| | 65 | 63 |
Additional information continued
Exchange rates
Except as stated, the following tables show, for the dates or periods indicated, the Noon Buying Rate in New York for cable transfers in sterling as certified for customs’ purposes by the Federal Reserve Bank of New York (the “Noon Buying Rate”):
| | April | March | February | January | December | November |
| US dollars per £1 | 2008 | 2008 | 2008 | 2008 | 2007 | 2007 |
| Noon Buying Rate | | | | | | |
| High | 1.9994 | 2.0311 | 1.9923 | 1.9895 | 2.0658 | 2.1104 |
| Low | 1.9627 | 1.9823 | 1.9405 | 1.9515 | 1.9774 | 2.0478 |
| | 2007 | 2006 | 2005 | 2004 | 2003 |
| Noon Buying Rate | | | | | |
| Period end rate | 1.9843 | 1.9586 | 1.7188 | 1.9160 | 1.7842 |
Average rate for the period (1) | 2.0073 | 1.8582 | 1.8147 | 1.8356 | 1.6450 |
| | | | | | |
Consolidation rate (2) | | | | | |
| Period end rate | 2.0043 | 1.9651 | 1.7214 | 1.9346 | 1.7857 |
| Average rate for the period | 2.0015 | 1.8436 | 1.8198 | 1.8325 | 1.6354 |
| | Notes: |
| | |
| (1) | The average of the Noon Buying Rates on the last business day of each month during the period. |
| | |
| (2) | The rates used by the Group for translating US dollars into sterling in the preparation of its financial statements. |
| | |
| (3) | On 12 May 2008, the Noon Buying Rate was £1.00 = US$1.9616. |
Economic and monetary environment
The Group’s earnings are affected by the economic and monetary environment in its key markets (UK, US, Eurozone and Asia Pacific).
Global financial markets entered a period of unprecedented strain in the second half of 2007, with reference interbank lending rates spiking sharply and parts of the short-term money market seizing up. This temporarily tightened monetary conditions, affecting credit supply and denting investor risk appetite, at a time when a slowdown in global economic activity had started. After a series of individual efforts, central banks in Canada, the Eurozone, Switzerland, the UK and the US intervened in concert to improve liquidity conditions in money markets in December. This measure was successful in bringing interest rate spreads in interbank markets back towards historic averages, but uncertainties about the full impact on the real economy and the future evolution of debt markets remain.
The UK interest rate cycle peaked in 2007, with the Monetary Policy Committee (MPC) first hiking the Bank Rate from 5% to 5.75% in three successive 25bps moves in January, May and July, before cutting it back to 5.50% in December and most recently to 5.25% in February. The rate increases were due to a combination of above-trend growth at 3.1% and CPI-inflation exceeding the official target of 2% for most of the year on the back of high commodity prices. Upside risks to inflation over the medium-term prevailed, preventing the MPC from cutting more aggressively in response to the liquidity squeeze in financial markets in December. On balance, monetary conditions were probably in restrictive territory in 2007, which is expected to lead to slower growth in 2008. Sterling’s 6% depreciation on a trade-weighted basis only partly offset the dampening impact from strains in money markets and high inflation-adjusted interest rates, which only started to fall towards the end of the year.
US monetary conditions were close to neutral at the start of 2007, with policy rates on hold at 5.25% until the onset of the liquidity crisis in August. A marked slowdown in the US housing market, deterioration in consumer and business confidence and the liquidity squeeze in financial markets prompted the Federal Open Market Committee (FOMC) to bring the federal funds rate down to 4.25% by the end of the year. Despite a 10% decline in the value of the dollar on a trade-weighted basis and the resulting stimulus for US exports, the overall outlook for the US economy darkened materially in the first two months of 2008. The FOMC continued to react aggressively in the face of more evidence of downside risks to economic growth, and further reduced the policy rate by 125bps at two meetings in January, bringing it to 3.00% at the end of February 2008. Even though CPI-inflation ran above 4% by the end of 2007, US bond markets did not seem overly concerned about rising inflationary pressure in the longer term, as the long-end of the yield curve shifted downwards too.
Against the backdrop of robust demand, and an upward trend in CPI-inflation, the European Central Bank raised the official refinancing rate twice in the first half of 2007, from 3.5% to 4%, and staying on hold for the rest of the year. Rapid economic growth in emerging market economies resulted in strong demand for Eurozone export goods, despite a 5% trade-weighted appreciation of the euro. Overall, the Eurozone appeared to be less affected by the liquidity squeeze than the UK or the US, partly because domestic demand had been less reliant on credit.
Asia Pacific was the most dynamic region in 2007, with economic growth outpacing the rate of expansion recorded in other regions. Exports remained the main driver of economic growth, resulting in a large current account surplus, and corresponding inflows of foreign exchange into the region. Some countries in the region continued to manage their currencies, to prevent appreciation. This loosening of monetary conditions boosted domestic investment. Inflationary pressures started to emerge, possibly requiring a tighter stance of monetary policy further out.
In addition to influencing the level of effective demand countries face, exchange rates affect earnings reported by the Group’s non-UK subsidiaries, and the value of non-sterling denominated assets and liabilities. Sterling remained strong against the dollar in 2007, gaining another 1%, but slipped by 8% against the euro. These movements have mixed effects on the Group’s reported earnings, assets and liabilities, boosting their sterling-value when denominated in euro but depressing their sterling-value when denominated in dollars.
Supervision and regulation
1. United Kingdom
1.1 Authorised firms in the Group
The UK Financial Services Authority (FSA) is the consolidated supervisor of the Group and the Royal Bank. As at 31 December 2007, 31 companies in the Group (excluding subsidiaries of the ABN AMRO Group), spanning a range of financial services sectors (banking, insurance and investment business), were authorised to conduct financial activities regulated by the FSA.
The UK authorised banks in the Group include the Royal Bank, NatWest, Coutts & Co and Ulster Bank Ltd. Wholesale activities, other than Group Treasury activities, are concentrated in the Group’s Corporate Markets division and are undertaken under the names of the Royal Bank and NatWest. UK retail banking activities are managed by the Retail Markets division. The exception is Ulster Bank Ltd, which is run as a separate division within the Group. Ulster Bank Ltd provides banking services in Northern Ireland while the banking service to the Republic of Ireland is provided by Ulster Bank Ireland Ltd which is primarily supervised by the Irish Financial Services Regulatory Authority.
Additional information continued
Investment management business is principally undertaken by companies in the Retail Markets division, including Adam & Company Investment Management Limited, and in the Corporate Markets division, RBS Asset Management Limited.
General insurance business is principally undertaken by companies in the RBS Insurance division, including Direct Line Insurance plc and Churchill Insurance Company Limited. Life assurance business is undertaken by Royal Scottish Assurance plc and National Westminster Life Assurance Limited (with the Group’s partner, the AVIVA Group) and Direct Line Life Insurance Company Limited.
1.2 Regulatory development and implementation.
Basel II is the most significant change to regulation of the banking industry for many years and will have a lasting effect on our relationships with customers, investors and other key stakeholders. The FSA in the UK has endorsed the Group’s approach to managing credit risk under Basel II. This puts us among the small number of UK financial services organisations that are using Advanced Internal Ratings Based approach for the calculation of credit risk capital requirements from 1 January 2008. From 2008, the Group will apply the Standardised Approach for operational risk, migrating to the Advanced Measurement Approach (AMA) in line with the US timescales. The Group has implemented Pillar 2 and Pillar 3 in line with regulatory requirements.
In addition, the Group successfully implemented the Markets in Financial Instruments Directive (‘MiFID’) by the implementation date of 1 November 2007. MiFID established a comprehensive legislative framework at the European level, which is now implemented in the UK, for the establishment and conduct of investment firms, multilateral trading facilities and regulated markets.
The FSA’s high level principles require all regulated firms to treat their customers fairly and a specific industry wide project on Treating Customers Fairly (‘TCF’) was launched in 2004. The FSA emphasised that TCF will be a key area of focus for the regulator over the coming years. In the summer of 2007 it followed this up by setting out specific targets that it would expect all firms to meet during 2008 in relation to management information required to evidence TCF embeddedness. The Group already had several underlying principles built into the existing customer proposition which clearly demonstrated the concept of fairness in action. These fundamental business values include demonstrating fairness, transparency and honesty throughout the whole relationship with our customers, ensuring that any representations we make are clear, fair and not misleading, and having mechanisms in place to avoid things going wrong and correct any deficiencies.
UK FSA authorised firms must also comply with rules designed to reduce the scope for firms to be used for financial crime and in particular money laundering. Revised Joint Money Laundering Steering Group Guidance Notes were issued on 13 November 2007 to take into account the new Money Laundering Regulations 2007. These Regulations came into force on 15 December 2007 and implemented the EU’s Third Money Laundering Directive. Amongst their other provisions, the Regulations endorse a risk based approach to combating money laundering, while also prescribing ‘enhanced due diligence’ for non face to face customers, ‘politically exposed persons’ (PEPs) and correspondent banking. Whilst for all material purposes the Group is already compliant – these provisions having been anticipated in industry guidance for some time – internal processes are continually reviewed to ensure best practice standards are met. In particular, the Group has issued new internal policy guidelines based on the regulations and supporting industry guidance against which all divisions have undertaken a gap analysis as a basis for further action plans where necessary.
1.3 Information Commissioners Office
The Information Commissioner’s Office (ICO) is the UK’s independent public body set up to promote access to official information and to protect personal information. The ICO enforces the Data Protection Act 1998, the Freedom of Information Act 2000, the Privacy and Electronic Communications Regulations 2003 and the Environmental Information Regulations 2004, regulating the organisations that come within their remits. They promote awareness of information rights and obligations and ensure compliance. The Commissioner reports directly to Parliament and has the power to order compliance, using enforcement and prosecution. The Group takes data protection very seriously and follows the guidance provided by the ICO. The Group continues to improve its processes in line with changing guidelines and in order to meet customers increasing expectations in relation to information security.
2. International
2.1 ABN AMRO
The consolidated supervisor of ABN AMRO is the Dutch central bank, De Nederlandsche Bank (DNB). It operates partly as the Dutch central bank and prudential supervisor of banks and insurance companies; and also as part of the European System of Central Banks. Following the acquisition of ABN AMRO the Group now operates in over 50 countries.
2.2 United States
The Group is both a bank holding company and financial holding company within the meaning of the US Bank Holding Company Act of 1956. As such, it is subject to the regulation and supervision of the Board of Governors of the Federal Reserve System (the “Federal Reserve”). Among other things, the Group’s direct and indirect activities and investments in the United States are limited to those that are ‘financial in nature’ or ‘incidental’ or ‘complementary’ to a financial activity, as determined by the Federal Reserve. The Group is also required to obtain the prior approval of the Federal Reserve before acquiring, directly or indirectly, the ownership or control of more than 5% of any class of the voting shares of any US bank or bank holding company.
Under current Federal Reserve policy, the Group is required to act as a source of financial strength for its US bank subsidiaries. Among other things, this source of strength obligation could require the Group to inject capital into any of its US bank subsidiaries if any of them became undercapitalised.
The Group’s US bank and non-bank subsidiaries and RBS’s US branches are also subject to supervision and regulation by a variety of other U.S. regulatory agencies. As of 1 September 2007, Citizens Financial Group’s bank subsidiaries (with the exception of its state-chartered bank subsidiary in the State of Pennsylvania) were merged and consolidated into a single nationally chartered bank, RBS Citizens, NA. As a result, RBS Citizens, NA is now supervised by the Office of the Comptroller of the Currency, a bureau of the US Department of the Treasury charged with the regulation and supervision of nationally chartered banks. Citizens Financial Group remains under the supervision of the Federal Reserve as a bank holding company. Citizens Bank of Pennsylvania is subject to the regulation and supervision of the Pennsylvania Department of Banking and the US Federal Deposit Insurance Corporation. RBS’s New York branch is supervised by the New York State Banking Department, and its Connecticut branch is supervised by the Connecticut Department of Banking. Both branches are also subject to supervisory oversight by the Federal Reserve, through the Federal Reserve Bank of Boston.
The Group’s US insurance agencies are regulated by state insurance authorities. The Group’s US broker dealer, Greenwich Capital Markets, Inc., is subject to regulation and supervision by the US Securities and Exchange Commission and the Financial Industry National Regulatory Association (FINRA) with respect to its securities activities. With respect to its futures activities, Greenwich Capital Markets, Inc. is also subject to regulation and oversight by the US Commodity Futures Trading Commission and the Chicago Board of Trade.
The Group is subject to extensive regulations that impose obligations on financial institutions to maintain appropriate policies, procedures and controls to detect, prevent and report money laundering and terrorist financing and to ensure compliance with US economic sanctions against designated foreign countries, nationals and others. Anti-money laundering, anti-terrorism and economic sanctions regulations have become a major focus of US government policy relating to financial institutions and are rigorously enforced by US government agencies.
2.3 Other jurisdictions
The Group and Bank of China have established an exclusive strategic partnership. The Group and Bank of China have agreed to co-operate across a range of business activities, building on Bank of China’s distribution strength and the Group’s product skills in areas including credit cards, wealth management, corporate banking and personal lines insurance. The Group also continues to grow its other Asian activities, having recently set up new branches in the Middle East and Far East. As in all jurisdictions in which the Group undertakes business, it considers regulatory risk as a key component of is new products approval process to ensure that it meets with local regulatory requirements.
Litigation
As a participant in the financial services industry, the Group operates in a legal and regulatory environment that exposes it to potentially significant litigation risks. As a result, RBSG and other members of the Group are involved in various disputes and legal proceedings in the United Kingdom, the United States and other jurisdictions, including litigation. Such cases are subject to many uncertainties, and their outcome is often difficult to predict, particularly in the earlier stages of a case. Currently, the Group is involved in litigation arising out of its operations.
Other than as set out in this section, so far as the company is aware, neither the company nor any member of the Group is or has been engaged in nor has pending or threatened any governmental, legal or arbitration proceedings which may have or have had in the recent past (covering the 12 months immediately preceding the date of this document) a significant effect on the Group’s financial position or profitability.
United Kingdom
In common with other banks in the United Kingdom, the Royal Bank and NatWest have received claims and complaints from a large number of customers relating to the legal status and enforceability of current and historic contractual terms in personal current account agreements relating to unarranged overdraft and unpaid item charges (‘‘Relevant Charges’’) and seeking repayment of Relevant Charges that had been applied to their accounts in the past. The claims and complaints are based primarily on the common law penalty doctrine and the Unfair Terms in Consumer Contracts Regulations 1999 (the ‘‘Regulations’’). Because of the High Court test case referred to below, most existing and new claims in the County Courts are currently stayed and there is currently an FSA waiver of the complaints handling process and a standstill of Financial Ombudsman Service decisions.
On 27 July 2007, following discussions between the OFT, the Financial Ombudsman Service, the Financial Services Authority and major UK banks (including RBS), the OFT issued proceedings in a test case against the banks which was intended to determine certain preliminary issues concerning the legal status and enforceability of contractual terms relating to Relevant Charges.
The judgement on these preliminary issues was handed down on 24 April 2008. The judgement primarily addressed the contractual terms relating to Relevant Charges in personal current account (excluding basic bank account) agreements in force in early 2008 (‘‘Current Terms’’) and not contractual terms in historic personal current account agreements. The judgement held that the Current Terms used by the Royal Bank and NatWest (i) are not unenforceable as penalties, but (ii) are not exempt from assessment for fairness under the Regulations. The Group is considering whether to appeal any of the rulings contained in the judgement.
A High Court hearing has been arranged for 22 May 2008 at which the OFT, RBS and the other test case banks are expected to make submissions to the Court in relation to whether they wish to appeal the judgement, the implications of the judgement in the test case and arrangements for any remaining issues relevant to the customer claims and complaints to be determined in the test case in due course.
The issues relating to the legal status and enforceability of the Relevant Charges are complex. RBS maintains that its Relevant Charges are fair and enforceable and believes that it has a number of substantive and credible defences. The Group cannot, however, at this stage predict with any certainty if, or for how long, the stays, waiver and standstill referred to above will remain in place. Nor can it at this stage predict with any certainty the timing or substance of the final outcome of the customer claims and complaints, any appeals against the judgement handed down on 24 April 2008 and any further stages of the test case. It is unable reliably to estimate the liability, if any, that may arise as a result of or in connection with these matters or its effect on the Group’s consolidated net assets, operating results or cash flows in any particular period. Consistent with the Group’s obligations as a company admitted to the Official List, the Group will give further details in relation to the OFT litigation when they become available, including its potential impact on the Company.
United States
Proceedings, including consolidated class actions on behalf of former Enron securities holders, have been brought in the United States against a large number of defendants, including the Group, following the collapse of Enron. The claims against the Group could be significant; the class plaintiff’s position is that each defendant is responsible for an entire aggregate damage amount less settlements—they have not quantified claimed damages against the Group in particular. The Group considers that it has substantial and credible legal and factual defences to these claims and will continue to defend them vigorously. Recent decisions by the US Supreme Court and the US federal court for the Fifth Circuit provide further support for the Group’s position. The Group is unable reliably to estimate the liability, if any, that might arise or its effect on the Group’s consolidated net assets, its operating results or cash flows in any particular period.
Investigations
The Group’s businesses and earnings can be affected by the fiscal or other policies and other actions of various governmental and regulatory authorities in the United Kingdom, the European Union, the United States and elsewhere. There is continuing political and regulatory scrutiny of the operation of the retail banking and consumer credit industries in the United Kingdom and elsewhere. The nature and impact of future changes in policies and regulatory action are not predictable and are beyond the Group’s control but could have an adverse impact on the Group’s businesses and earnings.
European Union
In the European Union, these regulatory actions included an inquiry into retail banking in all of the then 25 member states by the European Commission’s Directorate General for Competition. The inquiry examined retail banking in Europe generally. On 31 January 2007, the European Commission announced that barriers to competition in certain areas of retail banking, payment cards and payment systems in the European Union had been identified. The European Commission indicated that it will use its powers to address these barriers and will encourage national competition authorities to enforce European and national competition laws where appropriate.
In 2007 the European Commission issued a judgement that MasterCard’s current multilateral interchange fee (‘‘MIF’’) arrangement for cross border payment card transactions with MasterCard and Maestro branded consumer credit and debit cards in the European Union are in breach of competition law. MasterCard is required by the decision to withdraw the relevant cross border MIFs by June 2008. The Group is waiting for MasterCard to report to member banks with its proposals for removing the cross border MIF for credit and debit card transactions. The Group also understands that MasterCard is intending to appeal the decision. Visa’s MIFs were temporarily allowed in 2002 by the European Commission up to 31 December 2007. On 27 March 2008, the European Commission opened a formal inquiry into Visa’s current MIF arrangements for cross border payment card transactions with Visa branded debit and consumer credit card charges in the European Union. There is no deadline for the closure of the inquiry.
United Kingdom
In the United Kingdom, in September 2005, the Office of Fair Trading (‘‘OFT’’) received a supercomplaint from the Citizens Advice Bureau relating to payment protection insurance (‘‘PPI’’). As a result, the OFT commenced a market study on PPI in April 2006. In October 2006, the OFT announced the outcome of the market study and, on 7 February 2007, following a period of consultation, the OFT referred the PPI market to the Competition Commission (‘‘CC’’) for an in-depth inquiry. This inquiry could continue for up to two years. Also, in October 2006, the Financial Services Authority published the outcome of its broad industry thematic review of PPI sales practices in which it concluded that some institutions fail to treat customers fairly.
In January 2006, the OFT commenced a review of the undertakings given following the conclusion of the CC inquiry in 2002 into the supply of banking services to small and medium enterprises (‘‘SMEs’’). On 21 December 2007, the CC published its decision to lift the temporary price controls imposed in 2003 on the United Kingdom’s four largest banks servicing SMEs (including RBS) and to retain certain behavioural undertakings.
The OFT has carried out investigations into Visa and MasterCard credit card interchange rates. The decision by the OFT in the MasterCard interchange case was set aside by the Competition Appeals Tribunal in June 2006. The OFT’s investigations in the Visa interchange case and a second MasterCard interchange case are ongoing. The outcome is not known, but these investigations may have an impact on the consumer credit industry in general and, therefore, on the Group’s business in this sector. On 9 February 2007, the OFT announced that it was expanding its investigation into interchange rates to include debit cards.
On 29 March 2007, the OFT announced that, following an initial review into bank current account charges, it had decided to conduct an in-depth study of UK retail bank pricing and a formal investigation into the fairness of bank current account charges. The findings of the OFT’s study and investigation are expected to be published later this year. Given the stage of the investigation, the Company cannot estimate the impact of any adverse outcome of the investigation upon it, if any. However, the Company is cooperating fully with the OFT to achieve resolution of the matters under investigation.
On 26 January 2007, the FSA issued a Statement of Good Practice relating to Mortgage Exit Administration Fees. On 1 March 2007, the Group adopted a policy of charging all customers the fee applicable at the time the customers took out the mortgage or, if later, varied their mortgage. The Company believes that it is currently in compliance with the Statement of Good Practice and will continue to monitor its performance against those standards.
On 26 April 2007, the Office of Rail Regulation referred the leasing of rolling stock for franchised passenger services and the supply of related maintenance services in the United Kingdom to the CC for an inquiry lasting up to two years. The Group owns the Angel Trains group, a rolling stock leasing business operating in this market. Given the stage of the investigation, the Company cannot estimate the impact of any adverse outcome of the investigation upon it, if any. The Company is cooperating fully with the Office of Rail Regulation and the CC to resolve the questions being considered.
On 15 May 2007, the CC published its final report into the supply of personal current account banking services in Northern Ireland. The Northern Ireland PCA Banking Market Investigation Order 2008 implementing the remedies (including, inter alia, measures designed to make switching current accounts between banks easier for depositors and requiring the provision of aggregate fees and other information to customers) set out in the report came into force on 22 February 2008. The Group owns Ulster Bank, which is active in the Northern Ireland current account market. The Company has responded to the remedies mandated by the Order and believes that it is currently in compliance with its obligations. The Company will continue to monitor its performance against those requirements.
Additional information continued
United States
In July 2004, ABN AMRO signed a written agreement with the US regulatory authorities concerning ABN AMRO’s dollar clearing activities in the New York branch. In addition, in December 2005, ABN AMRO agreed to a Cease and Desist Order with the Dutch Central Bank and various US federal and state regulators. This involved an agreement to pay an aggregate civil penalty of US$75m and a voluntary endowment of $5m in connection with deficiencies in the US dollar clearing operations at ABN AMRO’s New York branch and OFAC compliance procedures regarding transactions originating at its Dubai branch. ABN AMRO and members of ABN AMRO’s management continue to provide information to law enforcement authorities in connection with ongoing criminal investigations relating to ABN AMRO’s dollar clearing activities, OFAC compliance procedures and other Bank Secrecy Act compliance matters. The Cease and Desist Order with the Dutch Central Bank was lifted on 26 July 2007. Although no written agreement has yet been reached and negotiations are ongoing, ABN AMRO has reached an agreement in principle with the US Department of Justice that would resolve all presently known aspects of the ongoing investigation. Under the terms of the agreement in principle, ABN AMRO and the United States would enter into a deferred prosecution agreement in which ABN AMRO would waive indictment and agree to the filing of information in the United States District Court charging it with certain violations of federal law based on information disclosed in an agreed factual statement. ABN AMRO would also agree to continue cooperating in the United States’ ongoing investigation and to settle all known civil and criminal claims currently held by the United States for the sum of US$500m. The precise terms of the deferred prosecution agreement are still under negotiation.
These compliance issues and the related sanctions and investigations have had, and will continue to have, an impact on ABN AMRO’s operations in the United States, including limitations on expansion. ABN AMRO is actively exploring all possible options to resolve these issues. The ultimate resolution of these compliance issues and related investigations and the nature and severity of possible additional sanctions cannot be predicted.
The New York State Attorney General has issued subpoenas to a wide array of participants in the sub-prime mortgage industry including mortgage originators, appraisers, due diligence firms, investment banks and rating agencies, focusing on the information underwriters obtained as part of the due diligence process from the independent due diligence firms and whether that information is adequately disclosed to investors. RBS Greenwich Capital has produced documents requested by the New York State Attorney General principally related to sub-prime loans that were pooled into one securitisation transaction.
In addition to the above, certain of the Group’s subsidiaries have received requests for information from various US governmental agencies and self-regulatory organisations including in connection with sub-prime mortgages and securitisations, collateralised debt obligations and synthetic products related to sub-prime mortgages. In particular, during March 2008 the Group was advised by the SEC that it had commenced a non-public, formal investigation relating to the Group’s US sub-prime securities exposure and US residential mortgage exposures. The company and its subsidiaries are co-operating with these various requests for information and investigations.
Description of property and equipment
The Group operates from a number of locations worldwide, principally in the UK. At 31 December 2007, the Royal Bank and NatWest had 649 and 1,629 retail branches, respectively, in the UK. Ulster Bank and First Active had a network of 282 branches in Northern Ireland and the Republic of Ireland. Citizens had 1,616 retail banking offices (including in-store branches) covering Connecticut, Delaware, Illinois, Indiana, Massachusetts, Michigan, New Hampshire, New Jersey, New York, Ohio, Pennsylvania, Rhode Island and Vermont. A substantial majority of the UK branches are owned by the Royal Bank, NatWest and their subsidiaries or are held under leases with unexpired terms of over 50 years. The Group’s principal properties include its headquarters at Gogarburn, Edinburgh, its principal offices in London at 135 and 280 Bishopsgate and the Drummond House administration centre located at South Gyle, Edinburgh.
Total capital expenditure on premises (excluding investment properties), computers and other equipment in the year ended 31 December 2007 was £1,792 million (2006 – £1,140 million; 2005 – £1,275 million).
Major shareholders
Details of major shareholders of the company’s ordinary and preference shares are given on page 79. As of 12 May, 2008, the holdings of major shareholders did not change, except for Legal and General Group plc, which held 465,895,376 ordinary shares or 4.64%.
There have been no significant changes in the percentage ownership of major shareholders of the company’s ordinary and preference shares during the three years ended 27 February 2008. All shareholders within a class of the company’s shares have the same voting rights. The company is not directly or indirectly owned or controlled by another corporation or any foreign government and the company is unaware of any arrangement which might result in a change of control.
At 27 February 2008, the directors of the company had options to purchase a total of 8,603,307 ordinary shares of the company. At 12 May, 2008, the directors of the company had options to purchase a total of 12,346,237 ordinary shares of the company.
As at 31 December 2007, almost all of the company’s US$ denominated preference shares and ADSs representing ordinary shares were held by shareholders registered in the US. All other shares were predominantly held by shareholders registered outside the US.
Material contracts
The company and its subsidiaries are party to various contracts in the ordinary course of business. During the year ended 31 December 2007, the company entered into a Consortium and Shareholders’ Agreement dated 28 May 2007, among the company, Banco Santander Central Hispano, S.A. Fortis N.V., Fortis SA/NV and RFS Holdings B.V., which governs the relationships amongst these parties in relation to the offers by RFS Holdings B.V. to the holders of ABN AMRO ordinary shares and American Depositary Shares, as more fully described in the section entitled ‘Summary of the Consortium and Shareholders’ Agreement’ included in the company’s Form F-4, as amended (Reg. No. 333-144752). Other than the aforementioned agreement, there have been no material contracts entered into outside the ordinary course of business.
Rights issue underwriting agreement
Pursuant to an underwriting agreement dated 22 April 2008 among the company, certain underwriters and the Royal Bank, the underwriters have agreed severally to procure subscribers for, or failing which themselves to subscribe for, new Ordinary Shares not taken up under the rights issue, in each case at the issue price of 200 pence per share. On 24 April 2008, pursuant to the terms of the underwriting agreement, the company appointed certain additional institutions as underwriters, who thereby became parties to the underwriting agreement.
In consideration of their services under the underwriting agreement, and subject to their obligations under the underwriting agreement having become unconditional and the underwriting agreement not having been terminated, the underwriters will be paid (i) a base fee of 1.50 per cent. of the issue price multiplied by the aggregate number of new Ordinary Shares and (ii) in the company’s sole discretion (as to payment and allocation) a discretionary fee equal to 0.25 per cent. of the issue price multiplied by the aggregate number of new Ordinary Shares, in each case, whether or not they are called upon to acquire or procure acquirers for any of the new Ordinary Shares under the underwriting agreement. Subject to the underwriters’ obligations under the underwriting agreement having become unconditional and the underwriting agreement not having been terminated, the company will pay the Royal Bank an aggregate bookrunning fee of 0.05 per cent. of the issue price multiplied by the aggregate number of new Ordinary Shares. Out of such fees (to the extent received by the underwriters) the underwriters will pay any sub-underwriting commissions (to the extent that sub-underwriters are or have been procured). The underwriters may arrange sub-underwriting for some, all or none of the new Ordinary Shares.
The company shall pay (whether or not the underwriters’ obligations under this underwriting agreement become unconditional) all costs and expenses of, or in connection with, the rights issue, the general meeting, the allotment and issue of the new ordinary shares and the underwriting agreement including (but not limited to) the UK Listing Authority and the London Stock Exchange and Euronext Amsterdam listing and trading fees, other regulatory fees and expenses, printing and advertising costs, postage, the registrar’s charges, its own and the Underwriters’ properly incurred legal and other out of pocket expenses, all accountancy and other professional fees, properly incurred public relations fees and expenses and all stamp duty and stamp duty reserve tax (if any) and other duties and taxes (other than corporation tax incurred by any of the underwriters on the commissions payable to them).
The obligations of the underwriters under the underwriting agreement are subject to certain conditions including, amongst others:
| · | shareholder approval which was granted at the general meeting held on 14 May 2008 (the “general meeting”); |
| · | the underwriting agreement for the rights issue become unconditional in all respects save for the condition relating to admission of the new Ordinary Shares, nil paid, to the Official List of the UKLA and to trading on the London Stock Exchange; and |
| · | such admission becoming effective by not later than 8.00 a.m. on 19 May 2008 (or such later time and date as the parties to the underwriting agreement may agree). |
The lead underwriters may terminate the Underwriting Agreement in certain circumstances but only prior to admission of the new Ordinary shares, fully paid, to the Official List of the UKLA and to trading on the London Stock Exchange. The company has given certain representations and warranties and indemnities to the Underwriters under which the liabilities of the company are unlimited as to time and amount.
FSA Listing Rules disclosure
With effect from 17 October 2007, the Group transferred to Santander (a related party for the purposes of the FSA Listing Rules) its rights and obligations under the Consortium and Shareholders’ Agreement in respect of the ABN AMRO Global Clients business in Brazil for €750 million.
Shareholder information
| 220 | Financial calendar |
| | |
| 220 | Shareholder enquiries |
| | |
| 221 | Capital gains tax |
| | |
| 222 | Analyses of ordinary shareholders |
| | |
| 223 | Trading market |
| | |
| 226 | Dividend history |
| | |
| 227 | Taxation for US Holders |
| | |
| 231 | Exchange controls |
| | |
| 231 | Memorandum and Articles of Association |
| | |
| 236 | Incorporation and registration |
| | |
| 236 | Code of ethics |
| | |
| 236 | Documents on display |
| | |
| 237 | Important addresses |
| | |
| 237 | Principal offices |
Shareholder information
| Financial calendar | |
| Annual General Meeting | 23 April 2008 at 2.00 pm |
| | Edinburgh International Conference Centre, |
| | The Exchange, Morrison Street, Edinburgh |
| | |
| Interim results | 8 August 2008 |
| | |
| Dividends | |
| Payment dates: | |
| Ordinary shares (2007 Final) | 6 June 2008 |
| Ordinary shares (2008 Interim) | October 2008 |
| Cumulative preference shares | 30 May and 31 December 2008 |
| Non-cumulative preference shares | 31 March, 30 June, 30 September and 31 December 2008 |
| Ex-dividend dates: | |
| Ordinary shares (2007 Final) | 5 March 2008 |
| Cumulative preference shares | 30 April 2008 |
| Record dates: | |
| Ordinary shares (2007 Final) | 7 March 2008 |
| Cumulative preference shares | 2 May 2008 |
Shareholder enquiries
Shareholdings in the company may be checked by visiting our website (www.rbs.com/shareholder). You will need the shareholder reference number printed on your share certificate or tax voucher to gain access to this information.
Dividend payments
The company pays its dividends in pounds sterling although shareholders may choose to receive payment in US dollars or euros.
Shareholders wishing to receive payment in either US dollars or euros should request an instruction form from the company’s registrar:
Computershare Investor Services PLC
PO Box 82
The Pavilions
Bridgwater Road
Bristol BS99 6ZZ
Telephone: 0870 702 0135
Fax: 0870 703 6009
Email: web.queries@computershare.co.uk
Shareholders may also download an instruction form via our website (www.rbs.com/shareholder).
Completed instruction forms must be returned to the registrar no later than 15 working days before the relevant dividend payment date.
Braille and audio Annual Review and Summary Financial Statement
Shareholders requiring a Braille or audio version of the Annual Review and Summary Financial Statement should contact the Registrar on 0870 702 0135.
ShareGift
The company is aware that shareholders who hold a small number of shares may be retaining these shares because dealing costs make it uneconomical to dispose of them. ShareGift, the charity share donation scheme is a free service operated by The Orr Mackintosh Foundation (registered charity 1052686) to enable shareholders to donate shares to charity.
Should you wish to donate your shares to charity in this way you should contact ShareGift for further information:
ShareGift, The Orr Mackintosh Foundation, 17 Carlton House Terrace, London SW1Y 5AH Tel: 020 7930 3737 www.ShareGift.org
Donating your shares in this way will not give rise to either a gain or a loss for UK capital gains tax purposes and you may be able to reclaim UK income tax on gifted shares. Further information can be obtained from HM Revenue & Customs.
Capital gains tax
For shareholders who held RBS ordinary shares at 31 March 1982, the market value of one ordinary share held was 103p. After adjusting for the 1 March 1985 rights issue, the 1 September 1989 capitalisation issue, the bonus issue of Additional Value Shares on 12 July 2000 and the bonus issue of ordinary shares on 8 May 2007, the adjusted 31 March 1982 base value of one ordinary share held currently is 15.4p.
For shareholders who held NatWest ordinary shares at 31 March 1982, the market value of one ordinary share held was 28.39p for shareholders who accepted the basic terms of the RBS offer. This takes account of the August 1984 and June 1986 rights issues and the June 1989 bonus issue of NatWest ordinary shares as well as the subsequent issue of Additional Value Shares and the bonus issue of ordinary shares on 8 May 2007.
When disposing of shares, shareholders are also entitled to indexation allowance (to April 1998 only in the case of individuals and non-corporate holders), which is calculated on the 31 March 1982 value, on the cost of subsequent purchases from the date of purchase and on the subscription for rights from the date of that payment. Further adjustments must be made where a shareholder has chosen to receive shares instead of cash for dividends. Individuals and non-corporate shareholders may also be entitled to some taper relief to reduce the amount of any chargeable gain on disposal of shares.
It was announced in the Pre-Budget Report on 9 October 2007 that the capital gains tax treatment for individuals will change for disposals made on or after 6 April 2008. There will be a single rate of capital gains tax set at 18%. Indexation allowance and taper relief will no longer be available and for assets held on 31 March 1982, the market value of the asset on that date will automatically be used for the purpose of calculating the gain or loss arising on a disposal.
The information set out above is intended as a general guide only and is based on current United Kingdom legislation and HM Revenue & Customs practice as at this date. This information deals only with the position of individual shareholders who are resident in the United Kingdom for tax purposes, who are the beneficial owners of their shares and who hold their shares as an investment. It does not deal with the position of shareholders other than individual shareholders, shareholders who are resident outside the United Kingdom for tax purposes or certain types of shareholders, such as dealers in securities.
Shareholder information continued
Analyses of ordinary shareholders at 31 December 2007
| | Shareholdings | | Number of shares – millions | | % |
| Individuals | 174,438 | | 693.7 | | 6.9 |
| Banks and nominee companies | 25,434 | | 8,898.1 | | 88.9 |
| Investment trusts | 172 | | 4.3 | | 0.1 |
| Insurance companies | 329 | | 5.1 | | 0.1 |
| Other companies | 2,148 | | 321.6 | | 3.2 |
| Pension trusts | 45 | | 32.7 | | 0.3 |
| Other corporate bodies | 94 | | 50.7 | | 0.5 |
| | 202,660 | | 10,006.2 | | 100.00 |
| | | | | | |
| Range of shareholdings: | | | | | |
| 1 – 1,000 | 84,387 | | 34.5 | | 0.3 |
| 1,001 – 10,000 | 99,951 | | 336.1 | | 3.4 |
| 10,001 – 100,000 | 16,400 | | 351.8 | | 3.5 |
| 100,001 – 1,000,000 | 1,202 | | 420.8 | | 4.2 |
| 1,000,001 – 10,000,000 | 569 | | 1,853.4 | | 18.5 |
| 10,000,001 and over | 151 | | 7,009.6 | | 70.1 |
| | 202,660 | | 10,006.2 | | 100.00 |
Trading market
Non-cumulative dollar preference shares
On 26 March 1997, 8 February 1999, 30 September 2004, 26 August 2004, 19 May 2005, 9 November 2005, 25 May 2006, 27 December 2006, 28 June 2007, 27 September 2007 and 4 October 2007 the company issued the following American Depositary Shares (“ADSs”) representing non-cumulative dollar preference shares of the company, in the United States, which were outstanding at 31 December 2007:
8,000,000 Series F (“Series F ADSs”) representing 8,000,000 non-cumulative dollar preference shares, Series F;
12,000,000 Series H (“Series H ADSs”) representing 12,000,000 non-cumulative dollar preference shares, Series H;
34,000,000 Series L (“Series L ADSs”) representing 34,000,000 non-cumulative dollar preference shares, Series L;
37,000,000 Series M (“Series M ADSs”) representing 37,000,000 non-cumulative dollar preference shares, Series M;
40,000,000 Series N (“Series N ADSs”) representing 40,000,000 non-cumulative dollar preference shares, Series N;
22,000,000 Series P (“Series P ADSs”) representing 22,000,000 non-cumulative dollar preference shares, Series P;
27,000,000 Series Q (“Series Q ADSs”) representing 27,000,000 non-cumulative dollar preference shares, Series Q;
26,000,000 Series R (“Series R ADSs”) representing 26,000,000 non-cumulative dollar preference shares, Series R;
38,000,000 Series S (“Series S ADSs”) representing 38,000,000 non-cumulative dollar preference shares, Series S;
64,000,000 Series T (“Series T ADSs”) representing 64,000,000 non-cumulative dollar preference shares, Series T; and
15,000 Series U (“Series U ADSs”) representing 15,000 non-cumulative dollar preference shares, Series U.
Each of the respective ADSs set out above represents the right to receive one corresponding preference share, and is evidenced by an American Depositary Receipt (“ADR”) and is listed on the New York Stock Exchange, a subsidiary of NYSE Euronext (“NYSE”).
The ADRs evidencing the ADSs above were issued pursuant to Deposit Agreements, among the company, The Bank of New York, as depository, and all holders from time-to-time of ADRs issued thereunder. Currently, there is no non-United States trading market for any of the non-cumulative dollar preference shares. All of the non-cumulative dollar preference shares are held by the depository, as custodian, in bearer form.
In January 2007, the company redeemed the 8 million Series E non-cumulative preference shares of US$0.01 each, the 10 million Series G non-cumulative preference shares of US$0.01 each and the 16 million Series K non-cumulative preference shares of US$0.01 each.
At 31 December 2007, there were 100 registered shareholders of Series F ADSs, 63 registered shareholders of Series H ADSs, 25 registered shareholders of Series L ADSs, 1 registered shareholder of Series M ADSs, 47 registered shareholders of Series N ADSs, 55 registered shareholders of Series P ADSs, 17 registered shareholders of Series Q ADSs, 1 registered shareholder of Series R ADSs, 1 registered shareholder of Series S ADSs, 23 registered shareholders of Series T ADSs and 1 registered shareholder of Series U ADSs.
PROs
On 20 August 2001, the company issued US$1.2 billion of perpetual regulatory tier one securities (‘PROs’) in connection with a public offering in the United States. The PROs are listed on the NYSE.
ADSs representing ordinary shares
On 17 October 2007, the company listed ADSs, each representing one ordinary share, nominal value 25p each (or a right to receive one ordinary share), and evidenced by an ADR or uncertificated securities, on the NYSE. On the same day, trading commenced on a ‘when issued’ basis and on 18 October 2007, regular trading commenced. As of 31 December 2007, 62.9 million ADSs were outstanding. The ADSs were issued in connection with the company’s bid for the outstanding share capital of ABN AMRO Holding N.V.
The ADSs described in the above paragraph were issued pursuant to a Deposit Agreement, among the company, The Bank of New York Mellon, as depositary, and all owners and holders from time to time of ADSs issued thereunder. The ordinary shares of the company are listed and traded on the London Stock Exchange. All ordinary shares are deposited with the principal London office of The Bank of New York Mellon, as custodian for the depositary.
Shareholder information continued
The following table shows, for the periods indicated, the high and low sales prices for each of the outstanding ADSs representing non-cumulative dollar preference shares and PROs, as reported on the NYSE composite tape:
| Figures in US$ | | Series F ADSs | | Series H ADSs | | Series L ADSs | | Series M ADSs | | Series N ADSs | | Series P ADSs | | Series Q ADSs | | Series R ADSs | | Series S ADSs | | Series T ADSs | | Series U ADSs | | PROs (1) |
| By month | | | | | | | | | | | | | | | | | | | | | | | | |
| | | | | | | | | | | | | | | | | | | | | | | | | |
| April 2008 | High | 25.65 | | 24.92 | | 20.22 | | 22.64 | | 22.52 | | 21.99 | | 23.74 | | 21.49 | | 22.74 | | 24.70 | | 94.13 | | 93.76 |
| | Low | 25.13 | | 24.20 | | 19.41 | | 21.45 | | 21.50 | | 20.90 | | 22.95 | | 20.55 | | 21.78 | | 23.79 | | 85.25 | | 91.00 |
| March 2008 | High | 25.59 | | 25.30 | | 20.88 | | 23.70 | | 23.38 | | 23.00 | | 24.84 | | 22.74 | | 23.67 | | 25.20 | | 100.36 | | 102.99 |
| | Low | 24.53 | | 24.00 | | 18.05 | | 20.60 | | 19.78 | | 20.05 | | 22.75 | | 19.79 | | 20.77 | | 23.95 | | 86.13 | | 93.76 |
| February 2008 | High | 25.53 | | 25.30 | | 22.27 | | 24.10 | | 24.01 | | 23.83 | | 24.95 | | 23.21 | | 24.45 | | 25.66 | | 102.68 | | 104.90 |
| | Low | 25.22 | | 24.90 | | 21.19 | | 22.89 | | 22.60 | | 22.45 | | 23.72 | | 22.37 | | 23.26 | | 25.00 | | 97.54 | | 100.73 |
| January 2008 | High | 25.55 | | 25.15 | | 22.20 | | 24.12 | | 24.00 | | 23.85 | | 24.83 | | 23.52 | | 24.66 | | 25.50 | | 105.61 | | 107.55 |
| | Low | 24.50 | | 24.21 | | 18.80 | | 20.88 | | 20.54 | | 20.10 | | 21.80 | | 19.90 | | 21.39 | | 24.00 | | 101.72 | | 104.13 |
| December 2007 | High | 25.54 | | 25.10 | | 20.66 | | 22.44 | | 22.12 | | 21.99 | | 23.69 | | 21.50 | | 22.75 | | 25.22 | | 102.81 | | 106.64 |
| | Low | 23.60 | | 22.70 | | 17.90 | | 19.68 | | 19.50 | | 19.25 | | 20.71 | | 18.96 | | 20.26 | | 22.61 | | 98.34 | | 100.49 |
| November 2007 | High | 25.75 | | 25.25 | | 20.89 | | 23.01 | | 22.81 | | 22.60 | | 24.52 | | 21.93 | | 23.30 | | 25.25 | | 104.94 | | 109.95 |
| | Low | 25.25 | | 22.77 | | 18.44 | | 20.19 | | 20.14 | | 19.94 | | 21.30 | | 19.44 | | 20.73 | | 23.35 | | 101.16 | | 103.08 |
| | | | | | | | | | | | | | | | | | | | | | | | | |
| By quarter | | | | | | | | | | | | | | | | | | | | | | | | |
| 2008: First quarter | High | 25.59 | | 25.30 | | 22.27 | | 24.12 | | 24.01 | | 23.85 | | 24.95 | | 23.52 | | 24.66 | | 25.66 | | 105.61 | | 107.55 |
| | Low | 24.50 | | 24.00 | | 18.05 | | 20.60 | | 19.78 | | 20.05 | | 21.80 | | 19.79 | | 20.77 | | 23.95 | | 86.13 | | 93.76 |
| 2007: Fourth quarter | High | 25.85 | | 25.50 | | 21.34 | | 23.23 | | 23.10 | | 22.89 | | 24.80 | | 22.54 | | 24.11 | | 25.48 | | 107.98 | | 109.95 |
| | Low | 23.60 | | 22.70 | | 17.90 | | 19.68 | | 19.50 | | 19.25 | | 20.71 | | 18.96 | | 20.26 | | 22.61 | | 98.34 | | 100.49 |
| 2007: Third quarter | High | 26.23 | | 25.60 | | 22.23 | | 24.60 | | 24.30 | | 24.14 | | 25.88 | | 23.55 | | 25.20 | | 25.10 | | — | | 112.88 |
| | Low | 25.25 | | 24.95 | | 20.30 | | 22.22 | | 21.98 | | 21.76 | | 23.49 | | 21.20 | | 22.77 | | 24.95 | | — | | 104.94 |
| 2007: Second quarter | High | 26.50 | | 25.78 | | 24.36 | | 25.88 | | 25.67 | | 25.78 | | 26.40 | | 25.35 | | 25.00 | | — | | — | | 118.15 |
| | Low | 25.39 | | 25.10 | | 21.80 | | 24.10 | | 23.81 | | 23.51 | | 24.95 | | 23.30 | | 24.75 | | — | | — | | 110.17 |
| 2007: First quarter | High | 25.76 | | 25.85 | | 24.75 | | 25.99 | | 25.75 | | 25.83 | | 26.91 | | 25.50 | | — | | — | | — | | 122.07 |
| | Low | 25.26 | | 25.21 | | 24.02 | | 25.50 | | 25.35 | | 25.25 | | 26.08 | | 24.79 | | — | | — | | — | | 115.81 |
| 2006: Fourth quarter | High | 26.73 | | 25.95 | | 24.62 | | 26.08 | | 25.96 | | 26.07 | | 26.76 | | — | | — | | — | | — | | 121.54 |
| | Low | 25.29 | | 25.17 | | 23.80 | | 25.23 | | 25.21 | | 24.91 | | 25.97 | | — | | — | | — | | — | | 114.47 |
| 2006: Third quarter | High | 26.91 | | 25.75 | | 24.08 | | 25.44 | | 25.30 | | 25.33 | | 26.24 | | — | | — | | — | | — | | 117.81 |
| | Low | 25.58 | | 25.16 | | 21.71 | | 24.05 | | 23.69 | | 23.64 | | 25.08 | | — | | — | | — | | — | | 106.96 |
| 2006: Second quarter | High | 26.07 | | 25.49 | | 23.39 | | 25.03 | | 25.04 | | 24.70 | | 25.55 | | — | | — | | — | | — | | 114.90 |
| | Low | 25.45 | | 25.01 | | 21.15 | | 23.58 | | 23.32 | | 22.76 | | 24.67 | | — | | — | | — | | — | | 106.06 |
| 2006: First quarter | High | 27.25 | | 25.78 | | 24.50 | | 25.62 | | 25.60 | | 25.35 | | — | | — | | — | | — | | — | | 122.23 |
| | Low | 25.72 | | 25.25 | | 23.09 | | 25.08 | | 25.10 | | 24.72 | | — | | — | | — | | — | | — | | 114.75 |
| By year | | | | | | | | | | | | | | | | | | | | | | | | |
| 2007 | High | 26.50 | | 25.85 | | 24.75 | | 25.99 | | 25.75 | | 25.83 | | 26.91 | | 25.50 | | 25.20 | | 25.48 | | 107.98 | | 122.07 |
| | Low | 23.60 | | 22.70 | | 17.90 | | 19.68 | | 19.50 | | 19.25 | | 20.71 | | 18.96 | | 20.26 | | 22.61 | | 98.34 | | 100.49 |
| 2006 | High | 27.25 | | 25.95 | | 24.62 | | 26.08 | | 25.96 | | 26.07 | | 26.76 | | — | | — | | — | | — | | 122.23 |
| | Low | 25.29 | | 25.01 | | 21.15 | | 23.58 | | 23.32 | | 22.76 | | 24.67 | | — | | — | | — | | — | | 106.06 |
| 2005 | High | 28.00 | | 26.19 | | 24.99 | | 26.75 | | 26.23 | | 25.50 | | — | | — | | — | | — | | — | | 129.57 |
| | Low | 26.02 | | 25.20 | | 22.67 | | 24.77 | | 24.70 | | 24.60 | | — | | — | | — | | — | | — | | 116.70 |
| 2004 | High | 28.45 | | 25.87 | | 24.68 | | 26.16 | | — | | — | | — | | — | | — | | — | | — | | 125.14 |
| | Low | 25.65 | | 24.45 | | 23.51 | | 25.13 | | — | | — | | — | | — | | — | | — | | — | | 110.58 |
| 2003 | High | 29.05 | | 26.40 | | — | | — | | — | | — | | — | | — | | — | | — | | — | | 130.78 |
| | Low | 27.03 | | 25.10 | | — | | — | | — | | — | | — | | — | | — | | — | | — | | 111.06 |
Note:
| (1) | Price quoted as a % of US$1,000 nominal. |
Ordinary shares
The following table shows, for the periods indicated, the high and low sales prices for the company’s ordinary shares on the London Stock Exchange, as derived from the Daily Office List of the UK Listing Authority:
| Figures in £ | | Ordinary shares | | Figures in £ | | Ordinary shares | | Figures in £ | | Ordinary shares |
| By month | | | | By quarter | | | | By year | | |
| April 2008 | High | 3.8400 | | 2008: First quarter | High | 4.4250 | | 2007 | High | 7.1900 |
| | Low | 3.4075 | | | Low | 3.0500 | | | Low | 3.9725 |
| March 2008 | High | 3.6925 | | 2007: Fourth quarter | | 5.6950 | | | | 6.6600 |
| | Low | 3.0500 | | | | 3.9725 | | | | 5.5600 |
| February 2008 | High | 4.1350 | | 2007: Third quarter | | 6.4250 | | | | |
| | Low | 3.5075 | | | | 5.0850 | | | | |
| | | | 2007: Second quarter | | 6.9000 | | | | |
| | | | | | | 6.2300 | | | | |
| | | | | | | | | | |
| | | | | | | | | | | |
| | | | 2006: Fourth quarter | | | | | | |
| | | | | | | | | | | |
| | | | 2006: Third quarter | | | | | | |
| | | | | | | | | | | |
| | | | 2006: Second quarter | | | | | | |
| | | | | | | | | | | |
| | | | | 2006: First quarter | | | | | | |
| | | | | | | | | | | |
On 12 May 2008, the closing price of shares on the London Stock Exchange was £3.4475, equivalent to $6.7626 per share translated at the Noon Buying Rate of $1.9616 per £1.00 on 12 May 2008.
ADSs
The following table shows, for the periods indicated, the high and low sales prices for the company’s ordinary ADSs, as reported on the NYSE composite tape:
| Figures in US$ | | ADSs | | Figures in US$ | | ADSs | | Figures in US$ | | ADSs |
| By month | | | | By quarter | | | | By year | | |
| April 2008 | High | 7.76 | | 2008: First quarter | High | 8.90 | | 2007 | High | 11.30 |
| | Low | 6.85 | | | Low | 6.28 | | | Low | 8.43 |
| March 2008 | High | 7.50 | | 2007: Fourth quarter | High | 11.30 | | | | |
| | Low | 6.28 | | | Low | 8.43 | | | | |
| February 2008 | High | 8.34 | | | | | | | | |
| | Low | 7.06 | | | | | | | | |
| January 2008 | High | 8.90 | | | | | | | | |
| | Low | 7.50 | | | | | | | | |
| December 2007 | High | 10.26 | | | | | | | | |
| | Low | 8.64 | | | | | | | | |
| November 2007 | High | 10.58 | | | | | | | | |
| | Low | 8.43 | | | | | | | | |
On 12 May 2008, the closing price of ordinary ADSs on the New York Stock Exchange was $6.94.
Shareholder information continued
Dividend history
Preference and other non-equity dividends
| | IFRS 2007 | | IFRS 2006 | | IFRS 2005 |
| | Subordinated liabilities | Equity | | Subordinated liabilities | Equity | | Subordinated liabilities | Equity |
| Amount per share | $ | £ | $ | £ | | £ | £ | | £ | £ |
| Non-cumulative preference shares of US$0.01 | | | | | | | | | | |
| – Series D (redeemed March 2006) | — | — | | | | 0.21 | | | 1.13 | |
| – Series E (redeemed January 2007) | 0.08 | 0.04 | | | | 1.10 | | | 1.12 | |
| – Series F | 1.91 | 0.96 | | | | 1.03 | | | 1.06 | |
| – Series G (redeemed January 2007) | 0.08 | 0.04 | | | | 1.00 | | | 1.02 | |
| – Series H | 1.81 | 0.91 | | | | 0.98 | | | 1.00 | |
| – Series I (redeemed March 2006) | — | — | | | | 0.20 | | | 1.10 | |
| – Series J (redeemed November 2005) | — | — | | | | — | | | 1.06 | |
| – Series K (redeemed January 2007) | 0.08 | 0.04 | | | | 1.06 | | | 1.09 | |
| – Series L | 1.44 | 0.72 | | | | 0.78 | | | 0.79 | |
| – Series M | | | 1.60 | 0.80 | | | 0.87 | | | 0.88 |
| – Series N | | | 1.59 | 0.79 | | | 0.86 | | | 0.55 |
| – Series P | | | 1.56 | 0.78 | | | 0.85 | | | 0.13 |
| – Series Q | | | 1.69 | 0.84 | | | 0.53 | | | — |
| – Series R | | | 1.54 | 0.77 | | | — | | | — |
| – Series S (issued June 2007) | | | 0.83 | 0.41 | | | — | | | — |
| – Series T (issued September 2007) | | | 0.47 | 0.23 | | | — | | | — |
| Non-cumulative convertible preference shares | | | | | | | | | | |
| of US$0.01 | | | | | | | | | | |
| – Series 1 | 91.18 | 45.58 | | | | 50.26 | | | 50.33 | |
| – Series 2 (redeemed March 2005) | — | — | | | | — | | | 11.60 | |
| – Series 3 (redeemed December 2005) | — | — | | | | — | | | 43.03 | |
| Non-cumulative convertible preference shares | | | | | | | | | | |
| of €0.01 | | | | | | | | | | |
| – Series 1 (redeemed March 2005) | — | — | | | | — | | | 11.54 | |
| Non-cumulative preference shares of €0.01 | | | | | | | | | | |
| – Series 1 | | | 79.43 | 39.63 | | | 37.18 | | | 41.14 |
| – Series 2 | | | 71.19 | 35.52 | | | 36.22 | | | — |
| Non-cumulative convertible preference shares | | | | | | | | | | |
| of £0.01 | | | | | | | | | | |
| – Series 1 | 148.06 | 73.87 | | | | 73.87 | | | 73.87 | |
| | | | |
| | | UK GAAP 2004 | UK GAAP 2003 |
| Amount per share | | £ | £ |
| Non-cumulative preference shares of US$0.01 | | | |
| – Series B (redeemed January 2003) | | — | 0.13 |
| – Series C (redeemed January 2003) | | — | 0.11 |
| – Series D (redeemed March 2006) | | 1.11 | 1.23 |
| – Series E (redeemed January 2007) | | 1.10 | 1.21 |
| – Series F | | 1.04 | 1.15 |
| – Series G (redeemed January 2007) | | 1.00 | 1.11 |
| – Series H | | 0.98 | 1.09 |
| – Series I (redeemed March 2006) | | 1.08 | 1.20 |
| – Series J (redeemed November 2005) | | 1.15 | 1.27 |
| – Series K (redeemed January 2007) | | 1.07 | 1.18 |
| – Series L | | 0.19 | — |
| – Series M | | 0.30 | — |
| Non-cumulative convertible preference shares | | | |
| of US$0.01 | | | |
| – Series 1 | | 49.05 | 54.89 |
| – Series 2 (redeemed March 2005) | | 47.43 | 53.08 |
| – Series 3 (redeemed December 2005) | | 41.74 | 45.57 |
| Non-cumulative convertible preference shares | | | |
| of €0.01 | | | |
| – Series 1 (redeemed March 2005) | | 44.19 | 49.58 |
| Non-cumulative preference shares of €0.01 | | | |
| – Series 1 | | 3.45 | — |
| Non-cumulative convertible preference shares | | | |
| of £0.01 | | | |
| – Series 1 | | 73.87 | 73.87 |
| Additional Value Shares of £1 | | — | 0.55 |
Ordinary dividends
For a discussion of the Group’s current dividend policy, please read “Business review – Recent developments – Dividends and dividend policy”.
Ordinary dividends per share for prior years in the table below have been restated for the effect of the bonus issue of ordinary shares in May 2007.
| | IFRS 2007 | IFRS 2006 | IFRS 2005 |
Amount per share and American Depository Shares (1) | cents | pence | pence | pence |
| Interim | 20.1 | 10.1 | 8.1 | 6.5 |
Final (2) | 45.8 | 23.1 | 22.1 | 17.7 |
| Total dividends on equity shares | 65.9 | 33.2 | 30.2 | 24.2 |
| | UK GAAP 2004 | UK GAAP 2003 |
| Amount per share | pence | pence |
| Interim | 5.6 | 4.9 |
Final (2) | 13.7 | 11.9 |
| Total dividends on equity shares | 19.3 | 16.8 |
| | Notes: |
| | |
| (1) | Each American Depositary Share represents one ordinary share. The historical amounts listed in the table apply to the ordinary shares, as the American Depositary Shares were not issued until October 2007 as described above under Trading Market. |
| | |
| (2) | 2007 final dividends are proposed. |
For further information, see Notes 6 and 7 on the accounts.
Taxation for US Holders
The following discussion summarises certain US federal and UK tax consequences of the acquisition, ownership and disposition of ordinary shares, non-cumulative dollar preference shares, ADSs representing ordinary shares (“ordinary ADSs”), ADSs representing non-cumulative dollar preference shares (“preference ADSs”) or PROs by a beneficial owner that is, for US federal tax purposes, (i) a citizen or individual resident of the United States; (ii) a corporation, or other entity taxable as a corporation, created or organized in or under the laws of the United States or any political subdivision thereof; or (iii) an estate or trust the income of which is subject to U.S. federal income taxation regardless of its source (a “US Holder”). This summary assumes that a US Holder is holding ordinary shares, non-cumulative dollar preference shares, ordinary ADSs, preference ADSs or PROs, as applicable, as capital assets. This summary does not address the tax consequences to a US Holder (i) that is resident (or, in the case of an individual, ordinarily resident) in the UK for UK tax purposes or (ii) generally, that is a corporation which alone or together with one or more associated companies, controls, directly or indirectly, 10% or more of the voting stock of the company.
The statements and practices set forth below regarding US and UK tax laws, including the US/UK double taxation convention relating to income and capital gains which entered into force on 31 March 2003 (the “Treaty”), and the US/UK double taxation convention relating to estate and gift taxes (the “Estate Tax Treaty”), are based on those laws and practices as in force and as applied in practice on the date of this Report. This summary is not exhaustive of all possible tax considerations and holders are advised to satisfy themselves as to the overall tax consequences, including specifically the consequences under US federal, state, local and other laws, and possible changes in taxation law, of the acquisition, ownership and disposition of ordinary shares, non-cumulative dollar preference shares, ordinary ADSs, preference ADSs or PROs by consulting their own tax advisers.
The following discussion assumes that the Company is not, and will not become, a passive foreign investment company (“PFIC”) – see “Passive Foreign Investment Company Considerations” on page 230.
Ordinary shares, preference shares, ordinary ADSs and preference ADSs
Taxation of dividends
For the purposes of the Treaty, the Estate Tax Treaty and the US Internal Revenue Code of 1986, as amended (the “Code”), US Holders of ordinary ADSs and preference ADSs should be treated as owners of the ordinary shares and the non-cumulative dollar preference shares underlying such ADSs.
The US Treasury has expressed concerns that parties to whom ADSs are pre-released or intermediaries in the chain of ownership between US Holders and the issuer of the security underlying the ADSs may be taking actions that are inconsistent with the claiming of foreign tax credits for US Holders of ADSs. Such actions would also be inconsistent with the claiming of the reduced rate of tax applicable to dividends received by certain non-corporate US Holders. Accordingly, availability of the reduced tax rate for dividends received by certain non-corporate US Holders of ordinary ADSs could be affected by actions taken by such parties or intermediaries.
The company is not required to withhold UK tax at source from dividend payments it makes or from any amount (including any amounts in respect of accrued dividends) distributed by the company. US Holders who are not resident or ordinarily resident in the UK and who do not carry on a trade, profession or vocation in the UK through a branch, agency or permanent establishment in connection with which their ordinary shares, non-cumulative preference shares, ordinary ADSs or preference ADSs are held used or acquired will not be subject to UK tax in respect of any dividends received on the relevant shares or ADSs.
Distributions by the company will constitute foreign source dividend income for US federal income tax purposes to the extent paid out of the current or accumulated earnings and profits of the company, as determined for US federal income tax purposes. Because the company does not maintain calculations of its earnings and profits under US federal income tax principles, it is expected that distributions will be reported to US Holders as dividends. Payments will not be eligible for the dividends-received deduction allowed to corporate US Holders.
Subject to applicable limitations that may vary depending upon a holder’s individual circumstances, dividends paid to certain non-corporate US Holders in taxable years beginning before 1 January 2011 will be taxable at a maximum tax rate of 15%. Non-corporate US Holders should consult their own tax advisers to determine whether they are subject to any special rules that limit their ability to be taxed at this favourable rate.
Dividends will be included in a US Holder’s income on the date of the US Holder’s (or in the case of ADSs, the Depositary’s) receipt of the dividend. The amount of any dividend income paid in pounds sterling or euros will be a US dollar amount calculated by reference to the relevant exchange rate in effect on the date of such receipt regardless of whether the payment is in fact converted into US dollars. If the dividend is converted into US dollars on the date of receipt, the US Holder generally should not be required to recognise foreign currency gain or loss in respect of the dividend income. If the amount of such dividend is not converted into US dollars on the date of receipt, the US Holder may have foreign currency gain or loss.
Shareholder information continued
Taxation of capital gains
A US Holder that is not resident (or, in the case of an individual, ordinarily resident) in the UK will not normally be liable for UK tax on capital gains realised on the disposition of an ordinary share, a non-cumulative dollar preference share, an ordinary ADS or a preference ADS unless at the time of the disposal, in the case of a corporate US Holder, such US Holder carries on a trade in the UK through a permanent establishment or, in the case of any other US Holder, such US Holder carries on a trade, profession or vocation in the UK through a UK branch or agency and such ordinary share, non-cumulative dollar preference share, ordinary ADS or preference ADS is or has been used, held or acquired by or for the purposes of such trade (or profession or vocation), permanent establishment, branch or agency. Special rules apply to individuals who are temporarily not resident or ordinarily resident in the UK.
A US Holder will, upon the sale or other disposition of an ordinary share, a non-cumulative dollar preference share, an ordinary ADS or a preference ADS, or upon the redemption of a non-cumulative dollar preference share or preference ADS, generally recognise capital gain or loss for US federal income tax purposes (assuming that in the case of a redemption of a non-cumulative dollar preference share or a preference ADS, such US Holder does not own, and is not deemed to own, any ordinary shares or ordinary ADSs of the company) in an amount equal to the difference between the amount realised (excluding in the case of a redemption any amount treated as a dividend for US federal income tax purposes, which will be taxed accordingly) and the US Holder’s tax basis in such share or ADS. This capital gain or loss will be long-term capital gain or loss if the US Holder held the share or ADS so sold, disposed or redeemed for more than one year.
A US Holder who is liable for both UK and US tax on a gain recognised on the disposal of an ordinary share, a non-cumulative dollar preference share, an ordinary ADS or a preference ADS will generally be entitled, subject to certain limitations, to credit the UK tax against its US federal income tax liability in respect of such gain.
If a corporate US Holder is subject to UK corporation tax by reason of carrying on a trade in the UK through a permanent establishment and its non-cumulative dollar preference share or preference ADS is, or has been, used, held or acquired for the purposes of that permanent establishment, certain provisions introduced by the Finance (No. 2) Act 2005 will apply if the US Holder holds its non-cumulative dollar preference share or preference ADS for a “tax avoidance purpose”. If these provisions apply, dividends on the non-cumulative dollar preference share, or preference ADS, as well as certain fair value credits and debits arising in respect of such share or ADS, will be brought within the charge to UK corporation tax on income and the UK tax position outlined in the preceding paragraphs will not apply in relation to such US Holder.
Estate and gift tax
Subject to the discussion of the Estate Tax Treaty in the next paragraph, ordinary shares, non-cumulative dollar preference shares, ordinary ADSs or preference ADSs beneficially owned by an individual may be subject to UK inheritance tax (subject to exemptions and reliefs) on the death of the individual or in certain circumstances, if such shares or ADSs are the subject of a gift (including a transfer at less than market value) by such individual. (Inheritance tax is not generally chargeable on gifts to individuals made more than seven years before the death of the donor). Ordinary shares, non-cumulative dollar preference shares, ordinary ADSs or preference ADSs held by the trustees of a settlement will also be subject to UK inheritance tax. Special rules apply to such settlements.
An ordinary share, a non-cumulative dollar preference share, an ordinary ADS or a preference ADS beneficially owned by an individual, whose domicile is determined to be the United States for purposes of the Estate Tax Treaty and who is not a national of the UK, will not be subject to UK inheritance tax on the individual’s death or on a lifetime transfer of such share or ADS, except in certain cases where the share or ADS (i) is comprised in a settlement (unless, at the time of the settlement, the settlor was domiciled in the United States and was not a national of the UK); (ii) is part of the business property of a UK permanent establishment of an enterprise; or (iii) pertains to a UK fixed base of an individual used for the performance of independent personal services. The Estate Tax Treaty generally provides a credit against US federal estate or gift tax liability for the amount of any tax paid in the UK in a case where the ordinary share, non-cumulative dollar preference share, ordinary ADS or preference ADS is subject to both UK inheritance tax and US federal estate or gift tax.
UK stamp duty and stamp duty reserve tax (“SDRT”)
The following is a summary of the UK stamp duty and SDRT consequences of transferring an ADS or ADR in registered form (otherwise than to the custodian on cancellation of the ADS) or of transferring an ordinary share or a non-cumulative dollar preference share. A transfer of a registered ADS or ADR executed and retained in the United States will not give rise to stamp duty and an agreement to transfer a registered ADS or ADR will not give rise to SDRT. Stamp duty or SDRT will normally be payable on or in respect of transfers of ordinary shares or non-cumulative dollar preference shares and accordingly any holder who acquires or intends to acquire ordinary shares or non-cumulative dollar preference shares is advised to consult its own tax advisers in relation to stamp duty and SDRT.
PROs
United States
Payments of interest on a PRO (including any UK withholding tax, as to which see below) will constitute foreign source dividend income for US federal income tax purposes to the extent paid out of the current or accumulated earnings and profits of the company, as determined for US federal income tax purposes. Payments will not be eligible for the dividends-received deduction allowed to corporate US Holders. A US Holder who is entitled under the Treaty to a refund of UK tax, if any, withheld on a payment will not be entitled to claim a foreign tax credit with respect to such tax.
Subject to applicable limitations that may vary depending upon a holder’s individual circumstances, dividends paid to certain non-corporate US Holders in taxable years beginning before 1 January 2011 will be taxable at a maximum tax rate of 15%. Non-corporate US Holders should consult their own tax advisers to determine whether they are subject to any special rules that limit their ability to be taxed at this favourable rate.
In addition, bills have been introduced in both the US House and the US Senate which would, if enacted, deny the favourable tax rates described in the preceding paragraph for dividends paid in respect of certain securities, including securities such as PROs, where the issuer of the securities is allowed a deduction under the tax laws of a foreign country with respect to such dividend. The proposed legislation would apply to dividends received after the date of its enactment. It is not possible to predict whether the proposed legislation will be enacted, either in its present form or any other form. Non-corporate US Holders should consult their tax advisers with respect to the potential enactment of currently proposed legislation and its application in their particular circumstances.
A US Holder will, upon the sale, exchange or redemption of a PRO, generally recognise capital gain or loss for US federal income tax purposes (assuming that in the case of a redemption, such US Holder does not own, and is not deemed to own, any ordinary shares or ordinary ADSs of the company) in an amount equal to the difference between the amount realised (excluding any amount in respect of mandatory interest and any missed payments which are to be satisfied on a missed payment satisfaction date, which would be treated as ordinary income) and the US Holder’s tax basis in the PRO.
A US Holder who is liable for both UK and US tax on gain recognised on the disposal of PROs will generally be entitled, subject to certain limitations, to credit the UK tax against its US federal income tax liability in respect of such gain.
United Kingdom
Taxation of payments on the PROs
Payments on the PROs will constitute interest rather than dividends for UK withholding tax purposes. However, the PROs will constitute ‘quoted eurobonds’ within the meaning of section 987 of the Income Tax Act 2007 and therefore payments of interest will not be subject to withholding or deduction for or on account of UK taxation as long as the PROs remain at all times listed on a ‘recognised stock exchange’ within the meaning of section 1005 of the Income Tax Act 2007. In all other cases, an amount must be withheld on account of UK income tax at the savings rate (currently 20%) subject to any direction to the contrary by HM Revenue & Customs under the Treaty and except that the withholding obligation is disapplied in respect of payments to persons who the company reasonably believes are within the charge to corporation tax or fall within various categories enjoying a special tax status (including charities and pension funds), or are partnerships consisting of such persons (unless HM Revenue & Customs directs otherwise). Where interest has been paid under deduction of UK withholding tax, US Holders may be able to recover the tax deducted under the Treaty.
Any paying agent or other person by or through whom interest is paid to, or by whom interest is received on behalf of, an individual, may be required to provide information in relation to the payment and the individual concerned to HM Revenue & Customs. HM Revenue & Customs may communicate this information to the tax authorities of other jurisdictions.
HM Revenue & Customs confirmed at around the time of the issue of the PROs that interest payments would not be treated as distributions for UK tax purposes by reason of (i) the fact that interest may be deferred under the terms of issue; or (ii) the undated nature of the PROs, provided that at the time an interest payment is made, the PROs are not held by a company which is ‘associated’ with the company or by a ‘funded company’. A company will be associated with the company if, broadly speaking, it is part of the same group as the company. A company will be a ‘funded company’ for these purposes if there are arrangements involving that company being put in funds (directly or indirectly) by the company, or an entity associated with the company. In this respect, HM Revenue & Customs has confirmed that a company holding an interest in the PROs which incidentally has banking facilities with any company associated with the company will not be a ‘funded company’ by virtue of such facilities. Interest on the PROs constitutes UK source income for UK tax purposes and, as such, may be subject to income tax by direct assessment even where paid without withholding. However, interest with a UK source received without deduction or withholding on account of UK tax will not be chargeable to UK tax in the hands of a US Holder unless, in the case of a corporate US Holder, such US Holder carries on a trade in the UK through a UK permanent establishment or in the case of other US Holders, such persons carry on a trade, profession or vocation in the UK through a UK branch or agency in connection with which the interest is received or to which the PROs are attributable. There are exemptions for interest received by certain categories of agents (such as some brokers and investment managers).
Shareholder information continued
EU Directive on taxation of savings income
The European Union has adopted a directive regarding the taxation of savings income. The Directive requires member states of the European Union to provide to the tax authorities of other member states details of payments of interest and other similar income paid by a person to an individual or certain other persons resident in another member state, except that Belgium, Luxembourg and Austria may instead impose a withholding system for a transitional period unless during such period they elect otherwise.
Disposal (including redemption)
A disposal (including redemption) of PROs by a non-corporate US Holder will not give rise to any liability to UK taxation on capital gains unless the US Holder carries on a trade (which for this purpose includes a profession or a vocation) in the UK through a branch or agency and the PROs are, or have been, held or acquired for the purposes of that trade, branch or agency.
A transfer of PROs by a US Holder will not give rise to a charge to UK tax on accrued but unpaid interest payments, unless the US Holder is an individual or other non-corporate taxpayer and at any time in the relevant year of assessment or accounting period carries on a trade in the UK through a branch or agency to which the PROs are attributable.
Annual tax charges
Corporate US Holders of PROs may be subject to annual UK tax charges (or relief) by reference to fluctuations in exchange rates and in respect of profits, gains and losses arising from the PROs, but only if such corporate US Holders carry on a trade, profession or vocation in the UK through a UK permanent establishment to which the PROs are attributable.
Inheritance tax
In relation to PROs held through DTC (or any other clearing system), the UK inheritance tax position is not free from doubt in respect of a lifetime transfer, or death of, a US Holder who is not domiciled nor deemed to be domiciled in the UK for inheritance tax purposes; HM Revenue & Customs is known to consider that the situs of securities held in this manner is not necessarily determined by the place where the securities are registered. In appropriate circumstances, there may be a charge to UK inheritance tax as a result of a lifetime transfer at less than market value by, or on the death of, such US Holder. Inheritance tax is not generally chargeable on gifts to individuals made more than seven years before the death of the donor. However, exemption from, or a reduction of, any such UK tax liability may be available under the Estate Tax Treaty (see below). US Holders should consult their professional advisers in relation to such potential liability. PROs beneficially owned by an individual, whose domicile is determined to be the United States for the purposes of the Estate Tax Treaty and who is not a national of the UK, will not be subject to UK inheritance tax on the individual’s death or on a lifetime transfer of the PRO, except in certain cases where the PRO (i) is comprised in a settlement (unless, at the time of the settlement, the settlor was domiciled in the United States and was not a national of the UK); (ii) is part of the business property of a UK permanent establishment of an enterprise; or (iii) pertains to a UK fixed base of an individual used for the performance of independent personal services. The Estate Tax Treaty generally provides a credit against US federal estate or gift tax liability for the amount of any tax paid in the UK in a case where the PRO is subject to both UK inheritance tax and US federal estate or gift tax.
Stamp duty and SDRT
No stamp duty, SDRT or similar tax is imposed in the UK on the issue, transfer or redemption of the PROs.
Passive Foreign Investment Company considerations
A foreign corporation will be a PFIC in any taxable year in which, after taking into account the income and assets of the corporation and certain subsidiaries pursuant to applicable “look-through rules,” either (i) at least 75% of its gross income is “passive income” or (ii) at least 50% of the average value of its assets is attributable to assets which produce passive income or are held for the production of passive income. The company does not believe that it was a PFIC for its 2007 taxable year. Although interest income is generally passive income, a special rule allows banks to treat their banking business income as non-passive. To qualify for this rule, a bank must satisfy certain requirements regarding its licensing and activities. The company believes that it currently meets these requirements. The company’s possible status as a PFIC must be determined annually, however, and may be subject to change if the company fails to qualify under this special rule for any year in which a US Holder holds ordinary shares, non-cumulative dollar preference shares, ordinary ADSs, preference ADSs or PROs. If the company were to be treated as a PFIC in any year during which a US Holder holds ordinary shares, non-cumulative dollar preference shares, ordinary ADSs, preference ADSs or PROs, the US Holder would generally be subject to adverse US federal income tax consequences. Holders should consult their own tax advisers as to the potential application of the PFIC rules to the ownership and disposition of the company’s ordinary shares, non-cumulative dollar preference shares, ordinary ADSs, preference ADSs or PROs.
Exchange controls
The company has been advised that there are currently no UK laws, decrees or regulations which would prevent the import or export of capital, including the availability of cash or cash equivalents for use by the Group, or the remittance of dividends, interest or other payments to non-UK resident holders of the company’s securities.
There are no restrictions under the Articles of Association of the company or under UK law, as currently in effect, which limit the right of non-UK resident owners to hold or, when entitled to vote, freely to vote the company’s securities.
Memorandum and Articles of Association
The following information is a summary of certain terms of the company’s Memorandum of Association (the “Memorandum”) and Articles of Association (the “Articles”) as in effect at the date of this Annual Report and certain relevant provisions of the Companies Act 1985, as amended (the “ 1985 Act”) and the Companies Act 2006 (the “2006 Act”) where appropriate and as relevant to the holders of any class of share. The Articles were last amended on 23 April 2008. The amendments to the Articles were designed to update the Articles primarily to take account of changes in company law introduced by the 2006 Act. The following summary description is qualified in its entirety by reference to the terms and provisions of the Memorandum and Articles. The Memorandum and Articles are registered with the Registrar of Companies of Scotland. Holders of any class of share are encouraged to read the full Memorandum and Articles, which have been filed as an exhibit to this annual report on Form 20-F.
Incorporation and registration
The company was incorporated and registered in Scotland under the Companies Act 1948 as a limited company on 25 March 1968 under the name National and Commercial Banking Group Limited. On 10 March 1982, it changed its name to its present name and was registered under the Companies Acts 1948 to 1980 as a public company with limited liability. The company is registered under Company No. SC 45551.
Purpose and objects
The Memorandum provides, amongst other things, that its objects are to carry on the business of banking in all or any of its aspects and to carry on the business of a holding company. The company’s objects are set out in full in clause 4 of the Memorandum.
Directors
At each annual general meeting of the company, any Director appointed since the last annual general meeting and any Directors who were not appointed at one of the preceeding two annual general meetings shall retire from office and may offer themselves for re-election by the members. Directors who have attained the age of 16 may be appointed to or remain on the Board if that appointment is or was made or approved by the company in a general meeting.
Directors may be appointed by the company by ordinary resolution or by the Board. A director appointed by the Board holds office only until the next annual general meeting, whereupon he will be eligible for re-election. Unless and until otherwise determined by ordinary resolution, the directors (other than alternate directors) shall be not more than twenty five. There is no stipulation in the Articles regarding a minimum number of directors; under the 2006 Act, and in the absence of express provision, the minimum number is two.
Directors’ interests
A director shall not vote at a meeting of the Board or a committee of the Board on any resolution of the Board concerning a matter in which he has an interest (otherwise than by virtue of his interest in shares, debentures or other securities of, or otherwise in or through, the company) which (together with any interest of any person connected with him) is, to his knowledge, material unless his interests arises only because the resolution relates to one or more of the following matters:
| | i. | the giving of any security or indemnity to him pursuant to the Articles or in respect of money lent, or obligations incurred, by him at the request of, or for the benefit of, the company or any of its subsidiary undertakings; |
| |
| | ii. | the giving of any security or indemnity to a third party in respect of a debt or obligation of the company or any of its subsidiary undertakings for which he has assumed responsibility (in whole or in part) under a guarantee or indemnity or by the giving of security; |
| |
| | iii. | a proposal concerning an offer of shares, debentures or other securities of the company, or any of its subsidiary undertakings, for subscription or purchase, in which offer he is, or may be, entitled to participate as a holder of securities or in the underwriting or sub-underwriting of which he is to participate; |
| |
| | iv. | any proposal concerning any other body corporate in which he is interested, directly or indirectly, whether as an officer or shareholder or otherwise, provided that he is not the holder of shares representing one per cent or more of any class of the equity share capital of such body corporate; |
| |
| | v. | any proposal concerning the adoption, modification or operation of a pension fund or retirement, death or disability benefits scheme or employees’ share scheme which relates both to directors and employees of the company or a subsidiary of the company and does not provide any privilege or advantage in respect of any director which it does not accord to the employees to which the fund or scheme relates; |
| |
| | vi. | a contract or arrangement for the benefit of the employees of the company or any of its subsidiary undertakings which does not accord him any privilege or advantage not generally accorded to the employees to whom the contract or arrangement relates; and |
| |
| | vii. | a proposal concerning any insurance which the company proposes to purchase and/or maintain for the benefit of any directors or for persons who include directors of the company. |
| |
Under the 2006 Act, from 1 October 2008 a director must avoid a situation where he has, or can have, a direct or indirect interest that conflicts, or possibly may conflict, with the company’s interests. The 2006 Act allows directors of public companies, where appropriate, to authorise conflicts and potential conflicts where the articles of association contain a provision to this effect. The 2006 Act also allows the articles of association to contain other provisions for dealing with directors’ conflicts of interest to avoid a breach of duty.
Clause 100 of the Articles, to take effect from 1 October 2008, gives the directors authority to authorise any matter which would or might otherwise constitute or give rise to a breach of the duty of a director under the 2006 Act to avoid a situation in which he has, or can have, a direct or indirect interest that conflicts, or possibly may conflict with the company.
Authorisation of any matter pursuant to Clause 100 must be approved in accordance with normal board procedures by directors who have no interest in the matter being considered. In taking the decision, the directors must act in a way they consider, in good faith, will be most likely to promote the company’s success. Any authorisation of a matter may be given on or subject to such conditions or limitations as the directors determine, whether at the time of authorisation or subsequently, including providing for the exclusion of the interested directors from the receipt of information or participation in discussion relating to the matter authorised by the directors and providing that interested directors in receipt of confidential information from a third party are not obliged to disclose such information to the company or use the information in relation to the company’s affairs. Any authorization may be terminated by the directors at any time.
A director is not, except as otherwise agreed by him, accountable to the company for any benefit which he, or a person connected with him, derives from any matter authorised by the directors and any contract, transaction or arrangement relating to such matter is not liable to be avoided on the grounds of such benefit.
Borrowing powers
The directors may exercise all the powers of the company to borrow money and to mortgage or charge its undertaking, property and uncalled capital and to issue debentures and other securities, whether outright or as collateral security for any debt, guarantee, liability or obligation of the company, or of any third party.
Qualifying shareholding
Directors are not required to hold any shares of the company by way of qualification.
Classes of shares
The company has issued and outstanding the following 3 general classes of shares, namely ordinary shares, preference shares and non-voting deferred shares to which the provisions set forth below apply. In addition, the company has authorized as part of its share capital Additional Value Shares (“AVSs”). All of the issued AVSs were converted into non-voting deferred shares in December 2003. The terms of those AVSs are set out in Schedule 4 to the Articles.
Dividends
General
Subject to the provisions of the 1985 Act and clause 133 of the Articles, the company may, by ordinary resolution, declare dividends on ordinary shares save that no dividend shall be payable except out of profits available for distribution, or in excess of the amount recommended by the Board or in contravention of the special rights attaching to any share.
Any dividend which has remained unclaimed for 12 years from the date of declaration shall be forfeited and shall revert to the company. The company may cease sending dividend warrants and cheques by post or otherwise to a member if such instruments have been returned undelivered to, or left uncashed by, that member on at least two consecutive occasions, or, following one such occasion, reasonable enquiries have failed to establish any new address or account of the registered holder. The company may resume sending warrants and cheques if the holder requests such recommencement in writing.
Preference shares
Each cumulative preference share confers the right to a fixed cumulative preferential dividend payable half-yearly. Each non-cumulative preference share confers the right to a preferential dividend (not exceeding a specified amount) payable in the currency of the relevant share. The rate of such dividend and the date of payment thereof, together with the terms and conditions of the dividend, are as may be determined by the directors prior to allotment. Cumulative preference share dividends are paid in priority to any dividend on any other class of share.
The non-cumulative preference shares rank for dividend after the cumulative preference shares but rank pari passu with each other and any shares expressed to rank, in terms of participation in the profits of the company, in some or all respects pari passu therewith and otherwise in priority to dividends payable on the ordinary shares and any other share capital in the company.
The directors may resolve prior to the issue and allotment of any series of non-cumulative preference shares that full dividends in respect of a particular dividend payment date will not be declared and paid if, (i) in its sole and absolute discretion, the directors resolve prior to the relevant dividend payment date that such dividend (or part thereof) shall not be paid and/or (ii) in the opinion of the directors, payment of a dividend would cause a breach of the UK Financial Services Authority’s capital adequacy requirements applicable to the company or its subsidiaries, or subject to the next following paragraph, insufficient distributable profits of the company are available to cover the payment in full of all dividends after having paid any dividends payable on any of the cumulative preference shares.
If dividends will be paid but, in the opinion of the directors, insufficient distributable profits of the company are available to cover the payment in full of dividends after having paid any dividends payable on any of the cumulative preference shares, dividends will be declared by the directors, pro rata on the non-cumulative preference shares to the extent of the available distributable profits.
The non-cumulative preference shares will carry no further rights to participate in the profits of the company and if, and to the extent, any dividend or part of any dividend is on any occasion not paid for any of the reasons described above, holders of non-cumulative preference shares will have no claim in respect of such non-payment.
If any dividend is not payable for the reasons described in clause (ii) of this subsection, the directors may pay a special dividend not exceeding US$0.01, £0.01 or €0.01 (depending on the currency of the relevant preference share) per share.
If the dividend payable on any series of non-cumulative preference shares on the most recent payment date is not paid in full, or if a sum is not set aside to provide for such payment in full, in either case for the reasons set forth in clause (ii) of this subsection, no dividends may be declared on any other share capital of the company and no sum may be set aside for the payment of a dividend on any other share capital (in each case other than the cumulative preference shares), unless, on the date of declaration, an amount equal to the dividend payable in respect of the then current dividend period for such series of non-cumulative preference shares is set aside for payment in full on the next dividend payment date.
If any dividend payable on the non-cumulative preference shares is not paid in full or if a sum is not set aside to provide for such payment in full (in either case for the reasons set forth in clause (ii) of this subsection), the company may not redeem or purchase or otherwise acquire any other share capital of the company and may not set aside any sum nor establish any sinking fund for its redemption, purchase or other such acquisition, until such time as dividends have been declared and paid in full in respect of successive dividend periods together aggregating not less than twelve months.
The non-payment of any dividend (in full or in part) by reason of the exercise of the directors’ discretion referred to in clause (i) of this subsection, shall not prevent or restrict (a) the declaration and payment of dividends on any other series of non-cumulative preference shares or on any non-cumulative preference shares expressed to rank pari passu with the non-cumulative preference shares, (b) the setting aside of sums for the payment of such dividends, (c) except as set forth in the following paragraph, the redemption, purchase or other acquisition of shares in the company by the company, or (d) except as set forth in the following paragraph, the setting aside of sums, or the establishment of sinking funds, for any such redemption, purchase or other acquisition by the company.
If dividends are not declared and paid in full on any series of non-cumulative preference shares as a result of the directors’ discretion referred to in clause (i) of this subsection, then the company may not redeem, purchase or otherwise acquire for any consideration any share capital ranking after such preference shares, and may not set aside any sum nor establish any sinking fund for the redemption, purchase or other acquisition thereof, until such time as the company has declared and paid in full dividends on such series of non-cumulative preference shares in respect of successive dividend periods together aggregating no less than twelve months. In addition, no dividend may be declared or paid on any of the company’s share capital ranking after such preference shares until the dividend in respect of a particular dividend payment date payable on the preference shares to which the directors’ discretion in clause (i) of this subsection applies has been declared and paid in full.
Non-voting deferred shares
The holders of non-voting deferred shares are not entitled to the payment of any dividend or other distribution.
Distribution of assets on liquidation
Cumulative preference shares
In the event of a return of capital on a winding-up or otherwise, the holders of cumulative preference shares are entitled to receive out of the surplus assets of the company available for distribution amongst the members (i) in priority to the holders of the non-cumulative preference shares and any other shares ranking pari passu therewith, the arrears of any fixed dividends including the amount of any dividend due for a payment after the date of commencement of any winding-up or liquidation but which is payable in respect of a half-year period ending on or before such date and (ii) pari passu with the holders of the non-cumulative preference shares and any other shares ranking pari passu therewith, the amount paid up or credited as paid up on such shares together with any premium.
Non-cumulative preference shares
Each non-cumulative preference share will confer on a winding up or liquidation (except (unless otherwise provided by the terms of issue) a redemption or purchase by the company of any shares in the capital of the company), the right to receive out of surplus assets of the company available for distribution amongst the members after payment of the arrears (if any) of the cumulative dividend on the cumulative preference shares and in priority to the holders of the ordinary shares, repayment of the amount paid up or credited as paid up on the non-cumulative preference shares together with any premium paid on issue pari passu with the holders of the cumulative preference shares and together with an amount equal to accrued and unpaid dividends.
Non-voting deferred shares
On a winding-up or other return of capital of the company, holders of non-voting deferred shares are entitled only to payment of the amounts paid up on the non-voting deferred shares, after repayment to the holders of ordinary shares of the nominal amount paid up on the ordinary shares held by them and payment of £100,000 on each ordinary share.
General
On a winding-up of the company, the liquidator may, with the authority of any extraordinary resolution and any other sanction required by the Insolvency Act 1986 and subject to the rights attaching to any class of shares after payment of all liabilities, including the payment to holders of preference shares, divide amongst the members in specie or kind the whole or any part of the assets of the company or vest the whole or any part of the assets in trustees upon such trusts for the benefit of the members and may determine the scope and terms of those trusts. No member shall be compelled to accept any assets on which there is a liability.
Voting Rights
General
Subject to any rights or restrictions as to voting attaching to any shares or class of shares, on a show of hands every member who is present in person or by proxy at a general meeting shall have one vote and on a poll every member present in person or by proxy shall have one vote for each 25 pence in nominal amount of shares held by him. No member shall, unless the directors otherwise determine, be entitled to vote at a general meeting or at a separate meeting of the holders of shares in the capital of the company, either in person or by proxy, in respect of any share held by him unless all monies presently payable by him in respect of that share have been paid.
The quorum required for a meeting of members is not less than five members present in person and entitled to vote. If a meeting is adjourned because of the lack of a quorum, the members present in person or by proxy and entitled to vote will constitute a quorum at the adjourned meeting.
Meetings are convened upon written notice of not less than 21 days in respect of annual general meetings of members and not less than 14 days in respect of other meetings of members.
Cumulative preference shares
At a general meeting of the company, every holder of a cumulative preference share who is present in person or by proxy shall be entitled to one vote on a show of hands and, on a poll, every person who is present in person or by proxy shall have one vote for each 25 pence in nominal amount of shares held. No member shall be entitled to vote any share in person or by proxy unless all moneys owed in respect of that share have been paid.
Non-cumulative preference shares
Holders of non-cumulative preference shares are not entitled to attend or vote at any general meeting unless the business of the meeting includes the consideration of a resolution for the winding-up of the company or any resolution directly varying or abrogating the rights attached to any such shares and then in such case only to speak to and vote upon any such resolution.
However, holders have the right to vote in respect of any matter when the dividend payable on their shares has not been declared in full for such number of dividend periods as the directors shall determine prior to the allotment thereof.
Whenever a holder is entitled to vote at a general meeting, on a show of hands every shareholder who is present in person has one vote and, on a poll, every such holder who is present in person or by proxy shall have such number of votes as may be determined by the directors prior to allotment.
Non-voting deferred shares
The holders of non-voting deferred shares are not entitled to receive notice of or to attend or vote at any general meeting of the company or otherwise receive any shareholder communication.
Redemption
Unless the directors determine, prior to allotment of any particular series of non-cumulative preference shares, that such series shall be non-redeemable, the preference shares will be redeemable at the option of the company on any date (a “Redemption Date”) which (subject to certain exceptions described in the terms of such shares) falls no earlier than such date (if any) as may be fixed by the directors, prior to allotment of such shares. On redemption, there shall be paid on each non-cumulative preference share the aggregate of its nominal amount together with any premium paid on issue, where applicable a redemption premium and accruals of dividend.
Purchase
General
Subject to the 1985 Act, the company may, by special resolution, reduce its share capital, any capital redemption reserve and any share premium account or other undistributable reserve and may also, subject to the 1985 Act, the requirements of the London Stock Exchange and the rights attached to any class of shares, purchase its own shares (including redeemable shares).
Non-cumulative preference shares and convertible preference shares
Subject to the 1985 Act, the company may purchase any non-cumulative preference shares and convertible preference shares upon such terms as the directors shall determine provided that, where the shares being purchased are listed on the London Stock Exchange, the purchase price payable, exclusive of expenses and accrued dividends, shall not exceed (a) in the case of a purchase in the open market, or by tender, the average of the closing middle market quotations of such shares for the 10 dealing days preceding the date of the purchase of (if higher), in the case of a purchase in the open market only, the market price on the date of purchase provided that such market price is not more than 105 per cent of such average and (b) in the case of a purchase by private treaty, 120 per cent of the closing middle market quotation of such shares for the last dealing day preceding the date of purchase; but so that this proviso shall not apply to any purchase of such shares made in the ordinary course of a business of dealing in securities. Upon the purchase of any such shares, the nominal amount of such shares shall thereafter be divided into, and reclassified as, ordinary shares.
Conversion rights
Convertible preference shares carry the right to convert into ordinary shares if they have not been the subject of a notice of redemption from the company, on or before a specified date determined by the directors. The right to convert will be exercisable by service of a conversion notice on the company within a specified period. The company will use reasonable endeavours to arrange the sale, on behalf of convertible preference shareholders who have submitted a conversion notice, of the ordinary shares which result from such conversion and to pay to them the proceeds of such sale so that they receive net proceeds equal to the nominal value of the convertible preference shares which were the subject of the conversion notice and any premium at which such shares were issued, provided that ordinary shares will not be sold at below a benchmark price (as determined prior to the issue of the relevant convertible preference shares by the directors).
In December 2003, following the payment of aggregate dividends of £1 in respect of each AVS, all issued and outstanding AVSs were de-listed from the Official List and from trading on the London Stock Exchange’s market for listed securities and converted into non-voting deferred shares of £0.01 each.
Changes in share capital and variation of rights
Subject to the provisions of the 1985 Act and without prejudice to any rights attached to any existing shares or class of shares, any share may be issued with such rights or restrictions as the company may by ordinary resolution determine or, subject to and in default of such determination, as the Board shall determine. Subject to the provisions of the 1985 Act, the company may issue shares which are, or at the option of the company or the holder are liable, to be redeemed. Subject to the provisions of the 1985 Act and the Articles, unissued shares are at the disposal of the Board.
The company may by ordinary resolution: increase its share capital; consolidate and divide all or any of its share capital into shares of larger amount than its existing shares; subject to the provisions of the 1985 Act, subdivide its shares, or any of them, into shares of smaller amount than is fixed by the Memorandum; or cancel any shares which have not been taken or agreed to be taken by any person and diminish the amount of its share capital by the amount of the shares so cancelled.
Subject to the provisions of the 1985 Act, if at any time the capital of the company is divided into different classes of shares, the rights attached to any class of shares may (unless further conditions are provided by the terms of issue of the shares of that class) be varied or abrogated, whether or not the company is being wound up, either with the consent in writing of the holders of three-quarters in-nominal value of the issued shares of the class or with the sanction of an extraordinary resolution passed at a separate general meeting of holders of the shares of the class (but not otherwise).
To any such separate general meeting the provision of the Articles relating to general meetings will apply, save that:
| | (i) | if at any adjourned meeting of such holders a quorum as defined above is not present, two people who hold shares of the class, or their proxies. are a quorum; and |
| |
| | (ii) | any such holder present in person or by proxy may demand a poll. |
| |
The rights attaching to any class of shares having preferential rights are not, unless otherwise expressly provided by the terms of issue thereof, deemed to be varied by the creation or issue of further shares ranking, as regards participation in the profits or assets of the company, pari passu therewith, but in no respect in priority thereto.
Disclosure of interests in shares
The 2006 Act gives the company the power to require persons who it believes to be, or have been within the previous three years, interested in its shares, to disclose prescribed particulars of those interests. Failure to supply the information or supplying a statement which is materially false may lead to the Board imposing restrictions upon the relevant shares. The restrictions available are the suspension of voting or other rights conferred by membership in relation to meetings of the company in respect of the relevant shares and, additionally, in the case of a shareholding representing at least 0.25 per cent of the class of shares concerned, the withholding of payment of dividends on, and the restriction of transfers of, the relevant shares.
Limitations on rights to own share
There are no limitations imposed by UK law or the Memorandum and Articles on the right of non-residents or foreign persons to hold or vote the company's shares other than the limitations that would generally apply to all of the company's shareholders.
Members resident abroad
Members with registered addresses outside the United Kingdom are not entitled to receive notices from the company unless they have given the company an address within the United Kingdom at which such notices may be served.
Incorporation and registration
The company was incorporated and registered in Scotland under the Companies Act 1948 as a limited company on 25 March 1968 under the name National and Commercial Banking Group Limited. On 10 March 1982, it changed its name to its present name and was registered under the Companies Acts 1948 to 1980 as a public company with limited liability. The company is registered under Company No. SC 45551.
Code of ethics
As discussed on page 76, the Group has adopted a code of ethics that is applicable to all of the Group’s employees, which will be provided to any person without charge, upon request, by contacting Group Secretariat at the telephone number listed on page 237.
Documents on display
Documents concerning the company may be inspected at 36 St Andrew Square, Edinburgh, EH2 2YB.
Executive directors’ service contracts and copies of directors’ indemnities granted by the company in terms of section 309C of the Companies Act 1985 may be inspected at the company’s office at Gogarburn, Edinburgh, EH12 1HQ (telephone 0131 626 4114).
In addition, we file reports and other information with the SEC. You can read and copy these reports and other information at the SEC’s Public Reference Room at 100 F Street, N.E., Room 1580, Washington, D.C. 20549. You can call the SEC at 1-800-SEC-0330 for further information on the Public Reference Room or contact the offices of The New York Stock Exchange, on which certain of our securities are listed, at 20 Broad Street, New York, New York 10005. The SEC also maintains a website at www.sec.gov which contains in electronic form each of the reports and other information that we have filed electronically with the SEC.
Shareholder information continued
| Important addresses | Principal offices |
| | |
| Shareholder enquiries | The company |
| Registrar | PO Box 1000 Gogarburn Edinburgh EH12 1HQ |
| Computershare Investor Services PLC | Telephone: 0131 626 0000 |
| The Pavilions | |
| Bridgwater Road | The Royal Bank of Scotland plc |
| Bristol BS99 6ZZ | PO Box 1000 Gogarburn Edinburgh EH12 1HQ |
| Telephone: 0870 702 0135 | 280 Bishopsgate London EC2M 4RB |
| Facsimile: 0870 703 6009 | |
| Email: web.queries@computershare.co.uk | National Westminster Bank Plc |
| | 135 Bishopsgate London EC2M 3UR |
| ADR Depositary Bank | |
| The Bank of New York Mellon | Citizens |
| Investor Services | Citizens Financial Group, Inc. |
| PO Box 11258 | One Citizens Plaza Providence Rhode Island 02903 USA |
| Church Street Station | |
| New York NY 10286-1258 | Ulster Bank |
| Telephone: 1 888 269 2377 (US callers) | 11-16 Donegall Square East Belfast BT1 5UB |
| Telephone: 212 815 3700 (International) | George’s Quay Dublin 2 |
| Email: shareowners@bankofny.com | |
| | RBS Insurance |
| Group Secretariat | Direct Line House 3 Edridge Road Croydon Surrey CR9 1AG |
| The Royal Bank of Scotland Group plc | Churchill Court Westmoreland Road Bromley BR1 1DP |
| PO Box 1000 | |
| Business House F | RBS Greenwich Capital |
| Gogarburn | 600 Steamboat Road |
| Edinburgh EH12 1HQ | Greenwich Connecticut 06830 USA |
| Telephone: 0131 556 8555 | |
| Facsimile: 0131 626 3081 | Coutts Group |
| | 440 Strand London WC2R 0QS |
| Investor Relations | |
| 280 Bishopsgate | The Royal Bank of Scotland International Limited |
| London EC2M 4RB | Royal Bank House 71 Bath Street |
| Telephone: 0207 672 1758 | St Helier Jersey Channel Islands JE4 8PJ |
| Email: investor.relations@rbs.com | |
| | NatWest Offshore |
| Registered office | 23/25 Broad Street |
| 36 St Andrew Square | St Helier Jersey Channel Islands JE4 8QJ |
| Edinburgh EH2 2YB | |
| Telephone: 0131 556 8555 | ABN AMRO Holding N.V. |
| Registered in Scotland No. 45551 | Gustav Mahlerlaan 10 |
| | 1082 PP Amsterdam The Netherlands |
| Website | |
| www.rbs.com | |
Exhibit index
Exhibit Number | | Description |
| | | |
| 1.1 | | Memorandum and Articles of Association of The Royal Bank of Scotland Group plc |
| 2.1 | | Form of Deposit Agreement among The Royal Bank of Scotland Group plc, The Bank of New York as Depositary, and all Owners and Holders from time to time of American Depositary Receipts issued thereunder, incorporated by reference to Exhibit 1 to the Registration Statement on Form F-6 (Registration No. 333-144756) (filed on 20 July 2007) |
| 2.2 | | Form of American Depositary Receipt for ordinary shares of the par value of £0.25 each incorporated by reference to Exhibit A of Exhibit 1 to the Registration Statement on Form F-6 (Registration No. 333-144756) (filed on 20 July 2007) |
| 2.3 | | Letter dated May 12, 2008 from The Bank of New York Mellon as Depository to The Royal Bank of Scotland Group plc relating to the Pre-release of American Depository Receipts |
| 4.1* | | Contract of employment for Sir Frederick A. Goodwin |
| 4.2** | | Service contract for Gordon Pell |
| 4.3 | | Service contract for Lawrence Fish |
| 4.4** | | Service contract for Guy Whittaker |
| 4.5** | | Service contract for Johnny Cameron |
| 4.6*** | | Service Agreement for Mark Fisher |
| 4.7*** | | Deed of Indemnity in favor of Sir Frederick A. Goodwin |
| 4.8*** | | Form of Deed of Indemnity for Directors |
| 4.9 | | Consortium and Shareholders' Agreement, dated 28 May 2007, among The Royal Bank of Scotland Group plc, Banco Santander Central Hispano, S.A., Fortis N.V., Fortis SA/NV and RFS Holdings B.V. incorporated by reference to Exhibit 10.1 to the Registration Statement on Form F-4 (Registration No. 333-144752) (filed on July 20, 2007) |
| 4.10 | | Supplemental Consortium and Shareholders' Agreement dated 17 September 2007, supplementing the Consortium and Shareholders' Agreement dated 28 May 2007, among The Royal Bank of Scotland Group plc, Banco Santander, S.A., Fortis N.V., Fortis SA/NV and RFS Holdings B.V. incorporated by reference to Exhibit 99.(A)(5)(XXVI) to Amendment No. 9 to the Tender Offer Statement on Schedule TO filed on 18 September 2007 |
| 7.1 | | Explanation of ratio calculations |
| 8.1 | | Principal subsidiaries of The Royal Bank of Scotland Group plc |
| 12.1 | | CEO certification required by Rule 13a-14(a) |
| 12.2 | | CFO certification required by Rule 13a-14(a) |
| 13.1 | | Certification required by Rule 13a-14(b) |
| 15.1 | | Consent of independent registered public accounting firm |
| 15.2 | | Summary of the Consortium and Shareholders’ Agreement excerpted from Amendment No. 7 to the Registration Statement on Form F-4 (Registration No. 333-144752) (filed on October 1, 2007) |
*Previously filed and incorporated by reference to Exhibit 4.1 to the Group’s Annual Report on Form 20-F for the fiscal year ended 31 December 2004 (File No. 1-10306).
**Previously filed and incorporated by reference to Exhibits 4.4, 4.6 and 4.8, respectively, to the Group’s Annual Report on Form 20-F for the fiscal year ended 31 December 2005 (File No. 1-10306).
***Previously filed and incorporated by reference to Exhibits 4.9, 4.10 and 4.11, respectively, to the Group’s Annual Report on Form 20-F for the fiscal year ended 31 December 2006 (File No. 1-10306). With respect to Exhibit 4.11, the sentence "PROVIDED THAT this Indemnity is given subject to the provisions of Section 309A Companies Act 1985" has been replaced with "PROVIDED THAT this Indemnity is given subject to the provisions of Section 234 Companies Act 2006."
SIGNATURE
The registrant hereby certifies that it meets all of the requirements for filing on Form 20-F and that it has duly caused and authorized the undersigned to sign this annual report on its behalf.
The Royal Bank of Scotland Group plc
Registrant
/s/ Guy Robert Whittaker
Guy Robert Whittaker
Group Finance Director
14 May 2008