Woodside Energy Annual Report INCORPORATING APPENDIX 4E
Exhibit 99.1
Australia’s leading energy company

ANNUAL REPORT 2024
This Annual Report 2024 is a summary of Woodside’s operations and activities for the 12-month period ended 31 December 2024 and financial position as of 31 December 2024. Woodside Energy Group Ltd (ABN 55 004 898 962) is the ultimate holding company of the Woodside group of companies. In this report, unless otherwise stated, references to “Woodside”, the “Group”, the “company”, “we”, “us” and “our” refer to Woodside Energy Group Ltd and/or its controlled entities as a whole. The text does not distinguish between the activities of the ultimate holding company and those of its controlled entities.
This report contains references to woodside.com. These references are for the readers’ convenience only and are not incorporated by reference into this report. Similarly, the content of any other websites referred to in this report does not form part of it.
Please refer to section 6.7—Glossary, units of measure and conversion factors for definitions of terms used in this report.
On the cover
In late 2024, the Pluto Train 2 module program was successfully completed, following the arrival of 51 modules, weighing a combined 56,000 metric tonnes.
IMPORTANT CAUTIONARY INFORMATION
This report contains forward-looking statements, greenhouse gas emissions data, industry, market and competitive position data and Woodside’s Financial Statements. Please refer to section 6.8—Information about this report for important cautionary information relating to these matters.
NON-IFRS MEASURES
Certain parts of this report contain financial measures that have not been prepared in accordance with International Financial Reporting Standards (IFRS) and are also “non-GAAP financial measures” (as defined in Item 10(e) of Regulation S-K under the US Securities Act of 1933, as amended). Further details are available in section 6.6—Alternative performance measures for further details and a reconciliation of these measures to the most directly comparable IFRS measure presented in Woodside’s Financial Statements. These non-IFRS financial measures are defined in section 6.7—Glossary, units of measure and conversion factors.
SUSTAINABILITY
Sustainability considerations are factored into Woodside’s business activities and investment decisions. Further information regarding Woodside’s approach to sustainability and sustainability performance is included in section 3.8—Sustainability Report and the sustainability section of our website.
ACKNOWLEDGING COUNTRY
Woodside recognises Aboriginal and Torres Strait Islander peoples as Australia’s First Peoples. We acknowledge their connection to land, waters and the environment and pay our respects to ancestors and Elders, past and present. We extend this recognition and respect to First Nations peoples and communities around the world.
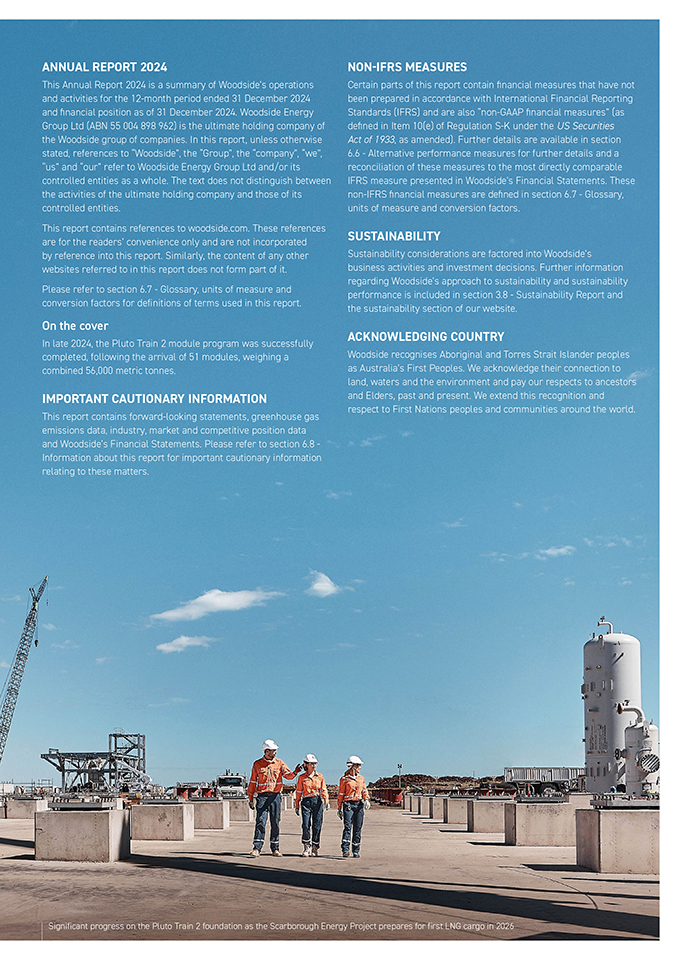
Significant progress on the Pluto Train 2 foundation as the Scarborough Energy Project prepares for first LNG cargo in 2026
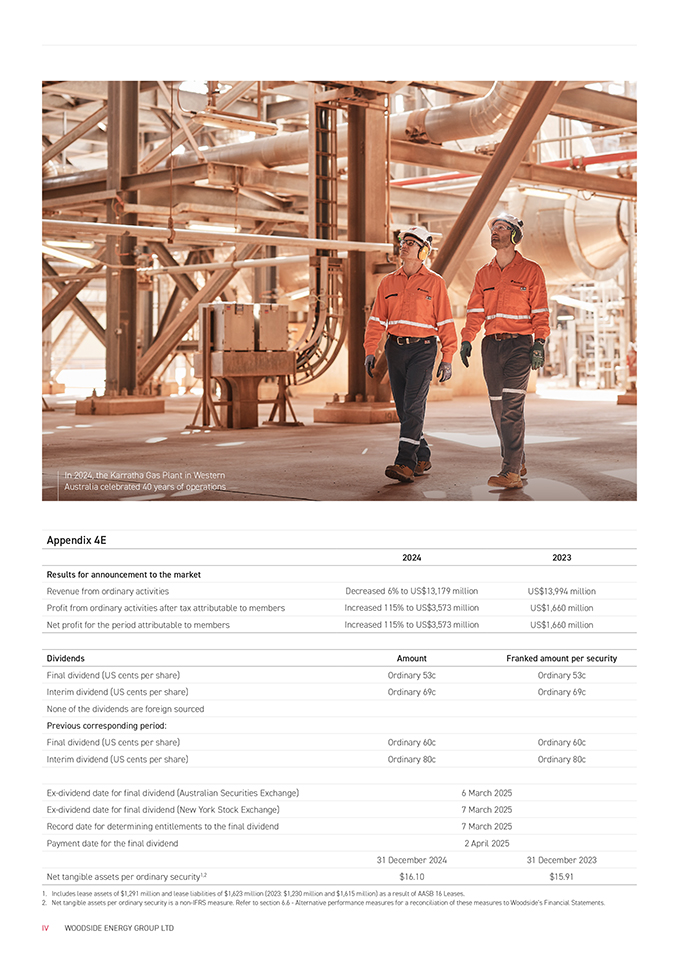
In 2024, the Karratha Gas Plant in Western Australia celebrated 40 years of operations
Appendix 4E
2024 2023 Results for announcement to the market
Revenue from ordinary activities Decreased 6% to US$13,179 million US$13,994 million Profit from ordinary activities after tax attributable to members Increased 115% to US$3,573 million US$1,660 million Net profit for the period attributable to members Increased 115% to US$3,573 million US$1,660 million
Dividends Amount Franked amount per security
Final dividend (US cents per share) Ordinary 53c Ordinary 53c Interim dividend (US cents per share) Ordinary 69c Ordinary 69c None of the dividends are foreign sourced
Previous corresponding period:
Final dividend (US cents per share) Ordinary 60c Ordinary 60c Interim dividend (US cents per share) Ordinary 80c Ordinary 80c
Ex-dividend date for final dividend (Australian Securities Exchange) 6 March 2025 Ex-dividend date for final dividend (New York Stock Exchange) 7 March 2025 Record date for determining entitlements to the final dividend 7 March 2025 Payment date for the final dividend 2 April 2025
31 December 2024 31 December 2023 Net tangible assets per ordinary security1,2 $16.10 $15.91
1. Includes lease assets of $1,291 million and lease liabilities of $1,623 million (2023: $1,230 million and $1,615 million) as a result of AASB 16 Leases.
2. Net tangible assets per ordinary security is a non-IFRS measure. Refer to section 6.6—Alternative performance measures for a reconciliation of these measures to Woodside’s Financial Statements.
IV WOODSIDE ENERGY GROUP LTD
Contents
1. Overview 6
1.1 About Woodside 6 1.2 2024 summary 7 1.3 Chair’s report 10 1.4 Chief Executive Officer’s report 12 1.5 Global portfolio 14
2. Strategy and Financial Performance 16
2.1 Woodside’s strategy 17 2.2 Capital management 18 2.3 Financial overview 22 2.4 Energy markets 24 2.5 Business model and value chain 25
3. Our Business 27
3.1 Australian operations 27 3.2 International operations 30 3.3 Marketing and trading 32 3.4 Projects 34 3.5 Decommissioning 36 3.6 Developments and exploration 38 3.7 New energy opportunities 41 3.8 Sustainability Report 44 3.9 Risk factors 70 3.10 Reserves and Resources Statement 82
4. Governance 88
4.1 Corporate Governance Statement 88 Corporate governance at Woodside 89 Board of Directors 90 Board Committees 99 Executive Leadership Team 102 Promoting responsible and ethical behaviour 104 Risk management and internal control 106 Inclusion and diversity 108 Other governance disclosures 110 Shareholders 112 4.2 Directors’ report 113 4.3 Remuneration Report 118
5. Financial Statements 145
5.1 Financial Statements 145
6. Additional Information 215
6.1 Supplementary information on oil and gas—unaudited 215 6.2 Three-year financial analysis 221 6.3 Additional disclosures 225 6.4 Shareholder statistics 238 6.5 Asset facts 246 6.6 Alternative performance measures 250 6.7 Glossary, units of measure and conversion factors 254 6.8 Information about this report 258 6.9 Ten-year comparative data summary 260

1.1 OVERVIEW • ABOUT WOODSIDE About Woodside From our beginnings in Australia 70 years ago, we are now a global energy company providing reliable and affordable energy to help people lead better lives. Our strategy is to thrive through the energy transition by developing a low-cost, lower-carbon, profitable, resilient and diversified portfolio. This strategy is underpinned by three goals: providing energy; creating and returning value to shareholders; and conducting our business sustainably. Driven by a spirit of innovation and determination, we established the liquefied natural gas (LNG) industry in Australia in the 1980s and remain one of the nation’s largest suppliers of LNG to major regional trading partners. We have safely and reliably delivered natural gas to homes and businesses in Australia for decades and continue to provide reliable energy to support Australia’s mining, manufacturing and electricity sectors. We are leveraging this track record of world-class project execution and operational excellence as we build a diverse global portfolio to meet the world’s growing energy needs. We are executing major projects today, while pursuing growth opportunities that will deliver long-term value for our shareholders. We maintain a strong balance sheet and a disciplined investment approach, focused on strategic rationale and financial returns. We are playing our part in the global transition to a lower-carbon future by supplying vital energy for the world’s needs today and investing in new energy for tomorrow. Our core product of LNG is expected to play a sustained role through the energy transition. In particular, LNG can help customers in major economies meet their energy security and decarbonisation goals, including by displacing coal and backing up and supplementing energy from renewable sources. We are also investing in new products and services, such as lower- carbon ammonia and carbon capture and storage (CCS), that can help customers reduce or avoid their emissions. We are on track to meeting our 2025 and 2030 net equity Scope 1 and 2 greenhouse gas (GHG) emissions targets, towards our aspiration of net zero by 2050 or sooner.1 Our values guide all that we do and underpin our continued focus on safety, environmental and social performance. We are proud of our meaningful relationships with communities and the significant contributions we make, our management of biodiversity and the natural environment where we operate and believe our skilled workforce provides the foundation to deliver these outcomes. 1. Targets and aspiration are for net equity Scope 1 and 2 GHG emissions relative to a starting base of 6.32 Mt CO2-e which is representative of the gross annual average equity Scope 1 and 2 GHG emissions over 2016-2020 and which may be adjusted (up or down) for potential equity changes in producing or sanctioned assets with a final investment decision prior to 2021. Net equity emissions include the utilisation of carbon credits as offsets. Production increased from Pluto LNG in Western Australia 6 WOODSIDE ENERGY GROUP LTD
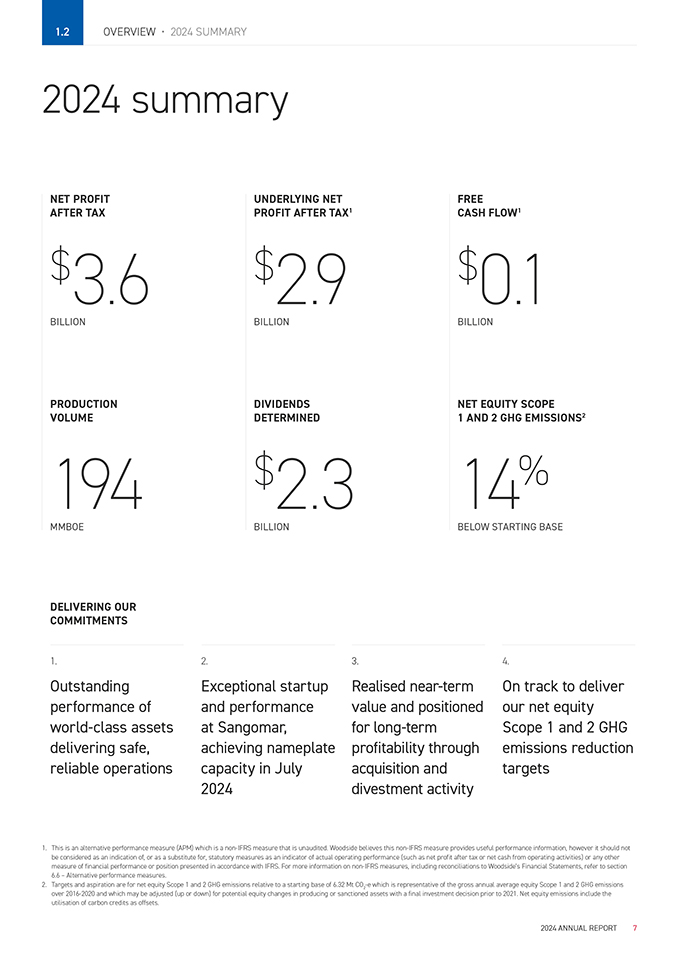
1.2 OVERVIEW • 2024 SUMMARY 2024 summary NET PROFIT AFTER TAX $3.6 BILLION PRODUCTION VOLUME 194 MMBOE UNDERLYING NET PROFIT AFTER TAX1 $2.9 BILLION DIVIDENDS DETERMINED $2.3 BILLION FREE CASH FLOW1 $0.1 BILLION NET EQUITY SCOPE 1 AND 2 GHG EMISSIONS2 14% BELOW STARTING BASE DELIVERING OUR COMMITMENTS 1. Outstanding performance of world-class assets delivering safe, reliable operations 2. Exceptional startup and performance at Sangomar, achieving nameplate capacity in July 2024 3. Realised near-term value and positioned for long-term profitability through acquisition and divestment activity 4. On track to deliver our net equity Scope 1 and 2 GHG emissions reduction targets 1. This is an alternative performance measure (APM) which is a non-IFRS measure that is unaudited. Woodside believes this non-IFRS measure provides useful performance information, however it should not be considered as an indication of, or as a substitute for, statutory measures as an indicator of actual operating performance (such as net profit after tax or net cash from operating activities) or any other measure of financial performance or position presented in accordance with IFRS. For more information on non-IFRS measures, including reconciliations to Woodside’s Financial Statements, refer to section 6.6 – Alternative performance measures. 2. Targets and aspiration are for net equity Scope 1 and 2 GHG emissions relative to a starting base of 6.32 Mt CO2-e which is representative of the gross annual average equity Scope 1 and 2 GHG emissions over 2016-2020 and which may be adjusted (up or down) for potential equity changes in producing or sanctioned assets with a final investment decision prior to 2021. Net equity emissions include the utilisation of carbon credits as offsets. 2024 ANNUAL REPORT 7
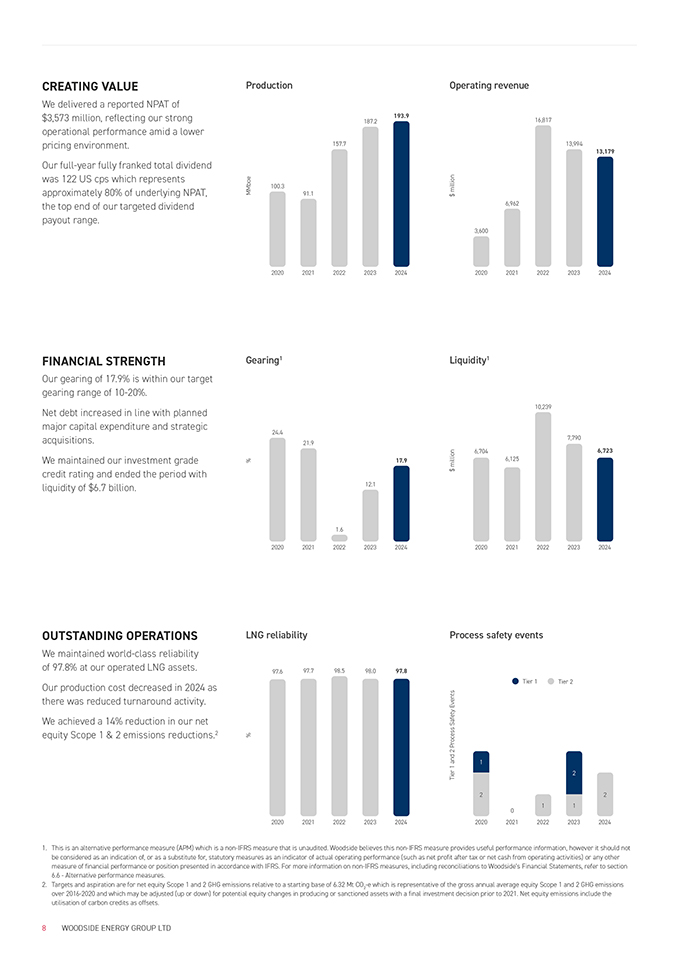
CREATING VALUE We delivered a reported NPAT of $3,573 million, reflecting our strong operational performance amid a lower pricing environment. Our full-year fully franked total dividend was 122 US cps which represents approximately 80% of underlying NPAT, the top end of our targeted dividend payout range. Production 100.3 91.1 157.7 187.2 193.9 Operating revenue 6,962 3,600 16,817 13,994 13,179 2020 2021 202220232024 20202021202220232024 FINANCIAL STRENGTH Our gearing of 17.9% is within our target gearing range of 10-20%. Net debt increased in line with planned major capital expenditure and strategic acquisitions. We maintained our investment grade credit rating and ended the period with liquidity of $6.7 billion. Gearing1 24.4 21.9 12.1 17.9 Liquidity1 6,704 6,125 10,239 7,790 6,723 1.6 20202021202220232024 20202021202220232024 OUTSTANDING OPERATIONS We maintained world-class reliability LNG reliability Process safety events of 97.8% at our operated LNG assets. Our production cost decreased in 2024 as there was reduced turnaround activity. We achieved a 14% reduction in our net equity Scope 1 & 2 emissions reductions.2 97.6 97.7 98.5 98.0 97.8 Tier 1Tier 2 1 2 22 11 0 2020202120222023202420202021202220232024 1. This is an alternative performance measure (APM) which is a non-IFRS measure that is unaudited. Woodside believes this non-IFRS measure provides useful performance information, however it should not be considered as an indication of, or as a substitute for, statutory measures as an indicator of actual operating performance (such as net profit after tax or net cash from operating activities) or any other measure of financial performance or position presented in accordance with IFRS. For more information on non-IFRS measures, including reconciliations to Woodside’s Financial Statements, refer to section 6.6—Alternative performance measures. 2. Targets and aspiration are for net equity Scope 1 and 2 GHG emissions relative to a starting base of 6.32 Mt CO2-e which is representative of the gross annual average equity Scope 1 and 2 GHG emissions over 2016-2020 and which may be adjusted (up or down) for potential equity changes in producing or sanctioned assets with a final investment decision prior to 2021. Net equity emissions include the utilisation of carbon credits as offsets. 8 WOODSIDE ENERGY GROUP LTD
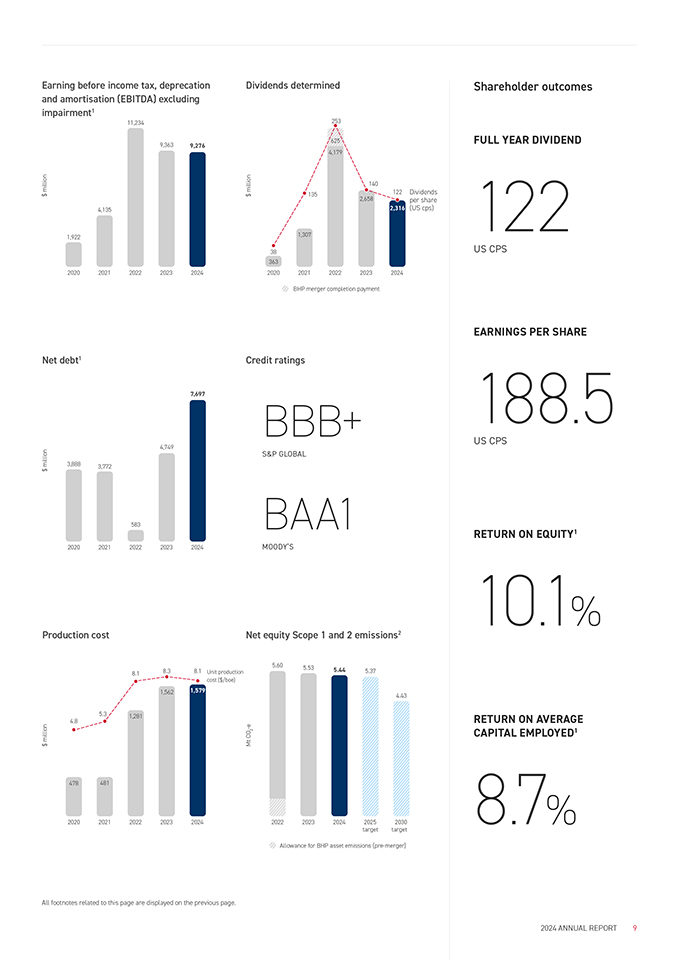
Earning before income tax, deprecation and amortisation (EBITDA) excluding impairment1 Dividends determined Shareholder outcomes 11,234 9,363 9,276 135 253 625 4,179 140 2,658 22 Dividends per share FULL YEAR DIVIDEND 122 4,135 2,316 (US cps) 1,922 38 363 1,307 US CPS 2020 2021 202220232024 20202021202220232024 BHP merger completion payment EARNINGS PER SHARE Net debt1 3,888 3,772 583 4,749 7,697 Credit ratings BBB+ S&P GLOBAL BAA1 188.5 US CPS RETURN ON EQUITY1 20202021202220232024 Production cost MOODY’S Net equity Scope 1 and 2 emissions2 10.1% 8.1 8.3 1,562 8.1 1,579 Unit production cost ($/boe) 5.60 5.53 5.44 5.37 4.43 4.8 5.3 1,281 RETURN ON AVERAGE CAPITAL EMPLOYED1 2020 2021202220232024 20222023202420252030 8.7% 478 481 targettarget Allowance for BHP asset emissions (pre-merger) All footnotes related to this page are displayed on the previous page. 2024 ANNUAL REPORT 9
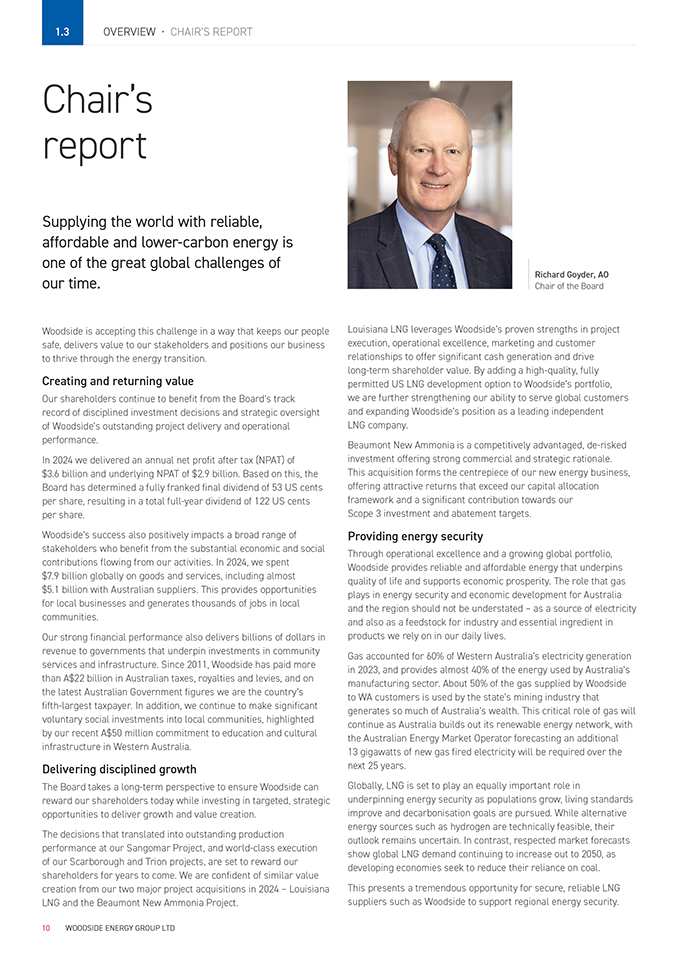
1.3 OVERVIEW • CHAIR’S REPORT Chair’s report Supplying the world with reliable, affordable and lower-carbon energy is one of the great global challenges of our time. Woodside is accepting this challenge in a way that keeps our people safe, delivers value to our stakeholders and positions our business to thrive through the energy transition. Creating and returning value Our shareholders continue to benefit from the Board’s track record of disciplined investment decisions and strategic oversight of Woodside’s outstanding project delivery and operational performance. In 2024 we delivered an annual net profit after tax (NPAT) of $3.6 billion and underlying NPAT of $2.9 billion. Based on this, the Board has determined a fully franked final dividend of 53 US cents per share, resulting in a total full-year dividend of 122 US cents per share. Woodside’s success also positively impacts a broad range of stakeholders who benefit from the substantial economic and social contributions flowing from our activities. In 2024, we spent $7.9 billion globally on goods and services, including almost $5.1 billion with Australian suppliers. This provides opportunities for local businesses and generates thousands of jobs in local communities. Our strong financial performance also delivers billions of dollars in revenue to governments that underpin investments in community services and infrastructure. Since 2011, Woodside has paid more than A$22 billion in Australian taxes, royalties and levies, and on the latest Australian Government figures we are the country’s fifth-largest taxpayer. In addition, we continue to make significant voluntary social investments into local communities, highlighted by our recent A$50 million commitment to education and cultural infrastructure in Western Australia. Delivering disciplined growth The Board takes a long-term perspective to ensure Woodside can reward our shareholders today while investing in targeted, strategic opportunities to deliver growth and value creation. The decisions that translated into outstanding production performance at our Sangomar Project, and world-class execution of our Scarborough and Trion projects, are set to reward our shareholders for years to come. We are confident of similar value creation from our two major project acquisitions in 2024 – Louisiana LNG and the Beaumont New Ammonia Project. Richard Goyder, AO Chair of the Board Louisiana LNG leverages Woodside’s proven strengths in project execution, operational excellence, marketing and customer relationships to offer significant cash generation and drive long-term shareholder value. By adding a high-quality, fully permitted US LNG development option to Woodside’s portfolio, we are further strengthening our ability to serve global customers and expanding Woodside’s position as a leading independent LNG company. Beaumont New Ammonia is a competitively advantaged, de-risked investment offering strong commercial and strategic rationale. This acquisition forms the centrepiece of our new energy business, offering attractive returns that exceed our capital allocation framework and a significant contribution towards our Scope 3 investment and abatement targets. Providing energy security Through operational excellence and a growing global portfolio, Woodside provides reliable and affordable energy that underpins quality of life and supports economic prosperity. The role that gas plays in energy security and economic development for Australia and the region should not be understated – as a source of electricity and also as a feedstock for industry and essential ingredient in products we rely on in our daily lives. Gas accounted for 60% of Western Australia’s electricity generation in 2023, and provides almost 40% of the energy used by Australia’s manufacturing sector. About 50% of the gas supplied by Woodside to WA customers is used by the state’s mining industry that generates so much of Australia’s wealth. This critical role of gas will continue as Australia builds out its renewable energy network, with the Australian Energy Market Operator forecasting an additional 13 gigawatts of new gas fired electricity will be required over the next 25 years. Globally, LNG is set to play an equally important role in underpinning energy security as populations grow, living standards improve and decarbonisation goals are pursued. While alternative energy sources such as hydrogen are technically feasible, their outlook remains uncertain. In contrast, respected market forecasts show global LNG demand continuing to increase out to 2050, as developing economies seek to reduce their reliance on coal. This presents a tremendous opportunity for secure, reliable LNG suppliers such as Woodside to support regional energy security. 10 WOODSIDE ENERGY GROUP LTD
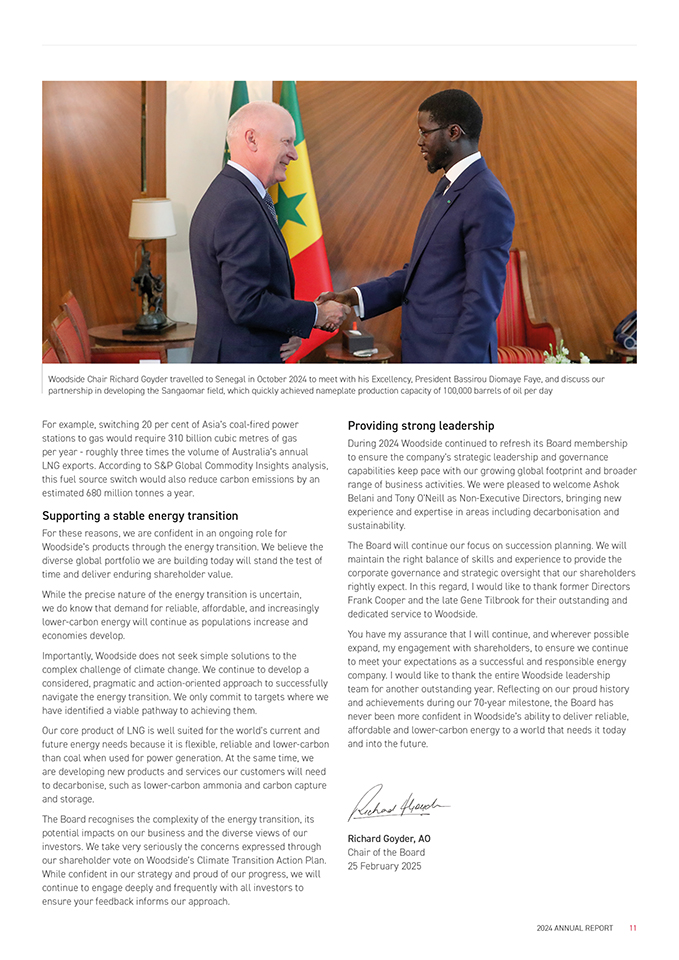
Woodside Chair Richard Goyder travelled to Senegal in October 2024 to meet with his Excellency, President Bassirou Diomaye Faye, and discuss our partnership in developing the Sangaomar field, which quickly achieved nameplate production capacity of 100,000 barrels of oil per day For example, switching 20 per cent of Asia’s coal-fired power stations to gas would require 310 billion cubic metres of gas per year—roughly three times the volume of Australia’s annual LNG exports. According to S&P Global Commodity Insights analysis, this fuel source switch would also reduce carbon emissions by an estimated 680 million tonnes a year. Supporting a stable energy transition For these reasons, we are confident in an ongoing role for Woodside’s products through the energy transition. We believe the diverse global portfolio we are building today will stand the test of time and deliver enduring shareholder value. While the precise nature of the energy transition is uncertain, we do know that demand for reliable, affordable, and increasingly lower-carbon energy will continue as populations increase and economies develop. Importantly, Woodside does not seek simple solutions to the complex challenge of climate change. We continue to develop a considered, pragmatic and action-oriented approach to successfully navigate the energy transition. We only commit to targets where we have identified a viable pathway to achieving them. Our core product of LNG is well suited for the world’s current and future energy needs because it is flexible, reliable and lower-carbon than coal when used for power generation. At the same time, we are developing new products and services our customers will need to decarbonise, such as lower-carbon ammonia and carbon capture and storage. The Board recognises the complexity of the energy transition, its potential impacts on our business and the diverse views of our investors. We take very seriously the concerns expressed through our shareholder vote on Woodside’s Climate Transition Action Plan. While confident in our strategy and proud of our progress, we will continue to engage deeply and frequently with all investors to ensure your feedback informs our approach. Providing strong leadership During 2024 Woodside continued to refresh its Board membership to ensure the company’s strategic leadership and governance capabilities keep pace with our growing global footprint and broader range of business activities. We were pleased to welcome Ashok Belani and Tony O’Neill as Non-Executive Directors, bringing new experience and expertise in areas including decarbonisation and sustainability. The Board will continue our focus on succession planning. We will maintain the right balance of skills and experience to provide the corporate governance and strategic oversight that our shareholders rightly expect. In this regard, I would like to thank former Directors Frank Cooper and the late Gene Tilbrook for their outstanding and dedicated service to Woodside. You have my assurance that I will continue, and wherever possible expand, my engagement with shareholders, to ensure we continue to meet your expectations as a successful and responsible energy company. I would like to thank the entire Woodside leadership team for another outstanding year. Reflecting on our proud history and achievements during our 70-year milestone, the Board has never been more confident in Woodside’s ability to deliver reliable, affordable and lower-carbon energy to a world that needs it today and into the future. Richard Goyder, AO Chair of the Board 25 February 2025 2024 ANNUAL REPORT 11
1.4 OVERVIEW • CHIEF EXECUTIVE OFFICER’S REPORT Chief Executive Officer’s report Seventy years after our founding, Woodside’s determination to provide energy the world needs while delivering value for our shareholders is stronger than ever. Our outstanding performance in 2024 was underpinned by operational excellence, financial discipline, world-class project delivery and strategic partnerships. We also took transformative decisions during the year that set the foundations for Woodside’s next chapter of growth and value, supporting our strategy to thrive through the energy transition. Safety remains our priority The death in October 2024 of an OCI contractor employee at our Beaumont New Ammonia Project is a painful reminder of the need for constant vigilance and continuous improvement in our safety performance. We are taking action to strengthen our safety culture, simplify our processes and improve our systems. While these initiatives are aimed at sustainable improvement in our safety performance, we are already seeing some positive results. With more than 23 million exposure hours worked across our global activities in 2024, we did not record any Tier 1 safety events or permanent injuries. The outstanding safety record achieved at our Sangomar Project and during delivery of the Pluto Train 2 modules also shows what we are capable of and sets the required standard for Woodside going forward. Outstanding operations performance World-class operating performance across our global assets delivered record full-year production of 194 million barrels of oil equivalent in 2024, at the top end of our guidance range. We matched increased production with greater efficiency, generating strong operating revenue and cash flow. We reduced our overall unit production cost to $8.1 per barrel of oil equivalent, an outstanding result in an inflationary environment. A highlight of 2024 was the production ramp-up at Sangomar, which achieved nameplate capacity of 100,000 barrels within weeks of start-up. Reliability reached 94% during the fourth quarter of 2024, with cargoes delivered to buyers in Europe, Asia and the US. Our operated Australian LNG projects continued their world-class performance with reliability maintained at 98%, among the highest reported globally across the sector. Meg O’Neill Chief Executive Officer and Managing Director Delivering for customers This track record of operational excellence ensures Woodside remains a supplier of choice for major energy customers in the region. During 2024 Woodside signed three agreements for the long-term sale of LNG to customers in Japan, Korea and Taiwan. These agreements demonstrate the value that regional energy customers place on security and certainty of supply, and the ongoing role of LNG in balancing our customers’ energy security and decarbonisation needs. In Australia, we remain a key supplier of reliable and affordable energy to homes and businesses. During the year we made extra supplies of domestic gas available, supporting energy security and meeting ongoing customer demand. This included executed sales of 77 Petajoules (Pj) for delivery across 2025 and 2026 in east coast Australia for local manufacturing, agribusiness and energy retailers. In Western Australia, we executed domestic gas sales of 73 Pj for delivery across 2025 and 2026 to mining, industrial and retail energy customers. With ongoing robust LNG demand forecast for the Asia Pacific region, and near-term structural shortfalls in gas supply forecast for both the east coast and Western Australian markets, Woodside will continue to be a reliable supplier of energy to support local and regional energy security. Project execution for long-term value During 2024 we made significant progress on major projects to deliver Woodside’s next wave of growth and shareholder value. The Scarborough Energy Project in Western Australia was 78% complete at year-end and remains on track for first LNG cargo in 2026. Major milestones achieved during the year included delivery and installation of all 51 Pluto Train 2 modules, and installation of the 433 km offshore trunkline. We also welcomed LNG Japan and JERA as participants in the Scarborough Joint Venture, demonstrating our ability to attract quality, strategic partners to our world-class projects. At our Trion Project offshore Mexico, we transitioned into the construction phase with work commencing on the offshore floating production unit. Trion was 20% compete at year-end, and is on track for first oil in 2028. 12 WOODSIDE ENERGY GROUP LTD
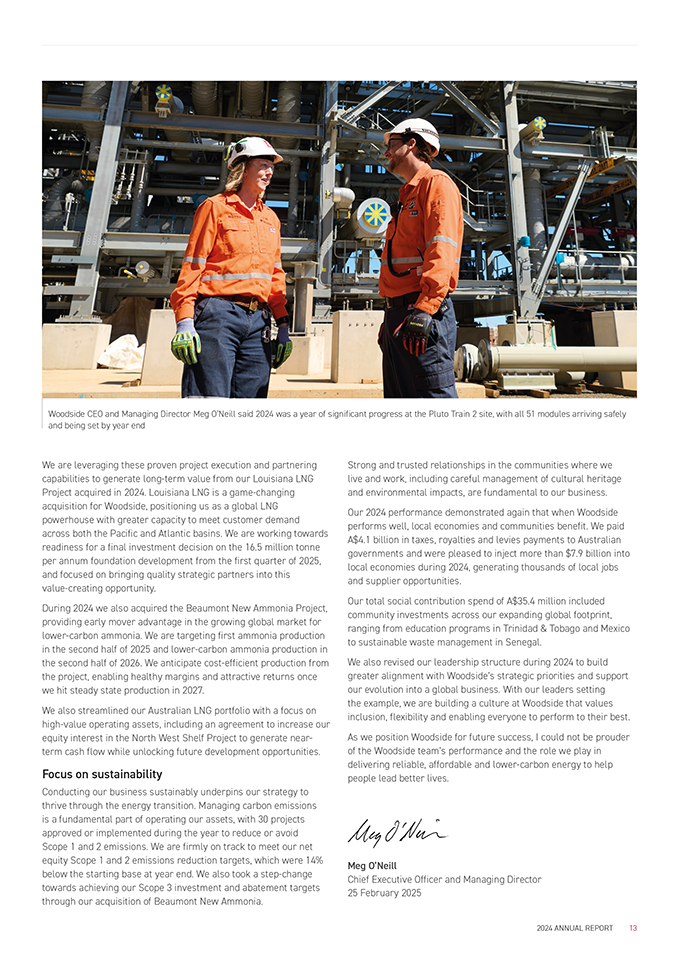
Woodside CEO and Managing Director Meg O’Neill said 2024 was a year of significant progress at the Pluto Train 2 site, with all 51 modules arriving safely and being set by year end We are leveraging these proven project execution and partnering capabilities to generate long-term value from our Louisiana LNG Project acquired in 2024. Louisiana LNG is a game-changing acquisition for Woodside, positioning us as a global LNG powerhouse with greater capacity to meet customer demand across both the Pacific and Atlantic basins. We are working towards readiness for a final investment decision on the 16.5 million tonne per annum foundation development from the first quarter of 2025, and focused on bringing quality strategic partners into this value-creating opportunity. During 2024 we also acquired the Beaumont New Ammonia Project, providing early mover advantage in the growing global market for lower-carbon ammonia. We are targeting first ammonia production in the second half of 2025 and lower-carbon ammonia production in the second half of 2026. We anticipate cost-efficient production from the project, enabling healthy margins and attractive returns once we hit steady state production in 2027. We also streamlined our Australian LNG portfolio with a focus on high-value operating assets, including an agreement to increase our equity interest in the North West Shelf Project to generate near- term cash flow while unlocking future development opportunities. Focus on sustainability Conducting our business sustainably underpins our strategy to thrive through the energy transition. Managing carbon emissions is a fundamental part of operating our assets, with 30 projects approved or implemented during the year to reduce or avoid Scope 1 and 2 emissions. We are firmly on track to meet our net equity Scope 1 and 2 emissions reduction targets, which were 14% below the starting base at year end. We also took a step-change towards achieving our Scope 3 investment and abatement targets through our acquisition of Beaumont New Ammonia. Strong and trusted relationships in the communities where we live and work, including careful management of cultural heritage and environmental impacts, are fundamental to our business. Our 2024 performance demonstrated again that when Woodside performs well, local economies and communities benefit. We paid A$4.1 billion in taxes, royalties and levies payments to Australian governments and were pleased to inject more than $7.9 billion into local economies during 2024, generating thousands of local jobs and supplier opportunities. Our total social contribution spend of A$35.4 million included community investments across our expanding global footprint, ranging from education programs in Trinidad & Tobago and Mexico to sustainable waste management in Senegal. We also revised our leadership structure during 2024 to build greater alignment with Woodside’s strategic priorities and support our evolution into a global business. With our leaders setting the example, we are building a culture at Woodside that values inclusion, flexibility and enabling everyone to perform to their best. As we position Woodside for future success, I could not be prouder of the Woodside team’s performance and the role we play in delivering reliable, affordable and lower-carbon energy to help people lead better lives. Meg O’Neill Chief Executive Officer and Managing Director 25 February 2025 2024 ANNUAL REPORT 13
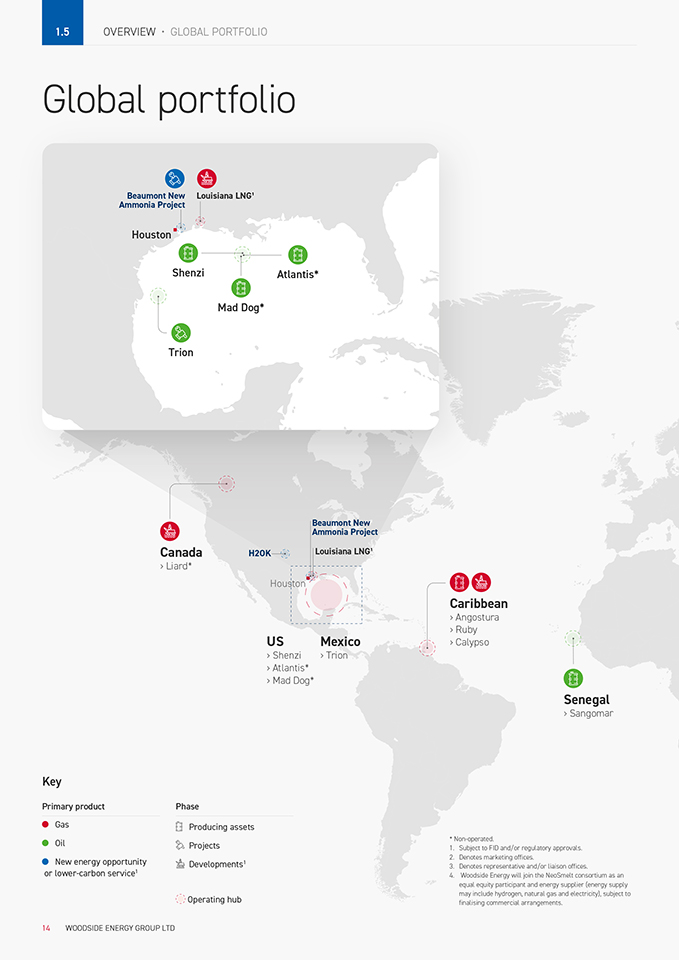
OVERVIEW • GLOBAL PORTFOLIO Global portfolio Beaumont New Louisiana LNG’ Ammonia Project Houston . , ‘ fD ‘‘I fD ShenziAtlantis* fD Mad Dog* Trion r a Canada > Liard* B a i \ct H2QK—--4 ,Louisiana LNG’— ————--1—’’ fiG Houston !/ ‘ \! ‘I us > Shenzi >Atlantis* >Mad Dog* I ———— ‘ Mexico >Trion Caribbean >Angostura >Ruby >Calypso fD Senegal > Sangomar Key Primary productPhase e Gasu Producing assets e Oil e New energy opportunity or lower-carbon service’ Q, Projects Developments’ Operating hub * Non-operated I SubJect to FlO and/or regulatory approvals 2 Denotes marketing offices 3 Denotes representative and/or liaison offices 4 Woodside Energy will join the NeoSmelt consortium as an equal equ1ty part1c1pant and energy supplier (energy supply may include hydrogen, natural gas and electricity), subject to finalising commercial arrangements 14 WOODSIDE ENERGY GROUP LTD
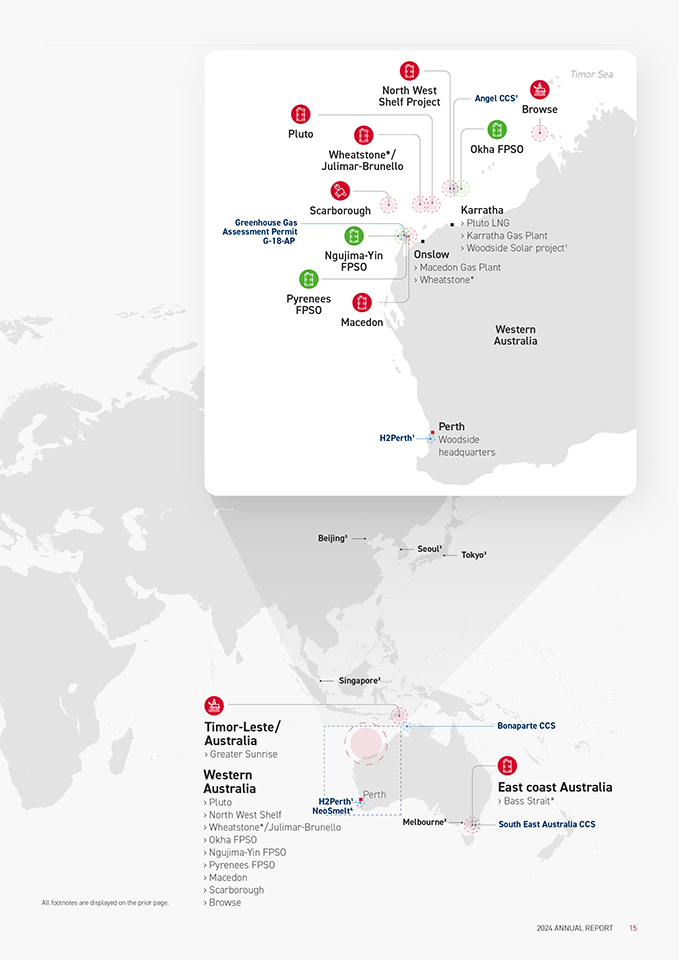
fD Pluto fD North West Shelf Project fD Angel CCS’ Browse Timor Sea Wheatstone* I Julimar-Brunello _ / Scarborough ‘, ; Greenhouse Gas ———— Assessment Permit .1;·; \ G-18-AP W’·’’-’ ·’ • Karratha • > Pluto LNG > Karratha Gas Plant >Woodside Solar proJect’ Ngujima-Yin FPSO Pyrenees FPSOW Macedon Onslow > Macedon Gas Plant >Wheatstone* Western Australia Perth H2Perth’ Woodside headquarters Beijing’ Singapore’ Seoul’ .. Tokyo’ Timor-Leste/ ;——-7 _ -:_ _ —-·—,’—.· ——— Bonaparte CCS l- Australia >Greater Sunrise :( \: I- /: :‘uesa iPerth: East coast Australia > PlutoH:2Perth’.L!’ ,:>Bass Stra1t* > North West ShelfNeoSmelt• All footnotes are displayed on the prior page >Wheatstone*/Juli mar-Brun-l > Okha FPSO > NguJima-Yin FPSO > Pyrenees FPSO >Macedon > Scarborough >Browse ——————Melbourne’, ‘ :::——— South East Australia CCS 2024 ANNUAL REPORT 15

STRATEGY AND FINANCIAL PERFORMANCE Woodside continues to deliver value for our stakeholders. 16
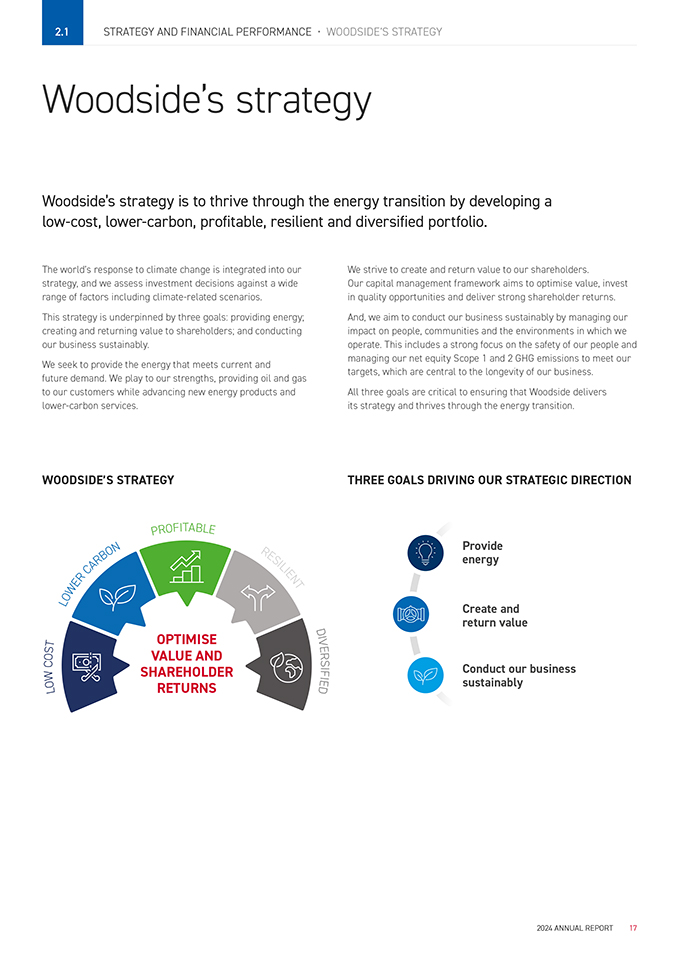
2.1 STRATEGY AND FINANCIAL PERFORMANCE • WOODSIDE’S STRATEGY Woodside’s strategy Woodside’s strategy is to thrive through the energy transition by developing a low-cost, lower-carbon, profitable, resilient and diversified portfolio. The world’s response to climate change is integrated into our strategy, and we assess investment decisions against a wide range of factors including climate-related scenarios. This strategy is underpinned by three goals: providing energy; creating and returning value to shareholders; and conducting our business sustainably. We seek to provide the energy that meets current and future demand. We play to our strengths, providing oil and gas to our customers while advancing new energy products and lower-carbon services. We strive to create and return value to our shareholders. Our capital management framework aims to optimise value, invest in quality opportunities and deliver strong shareholder returns. And, we aim to conduct our business sustainably by managing our impact on people, communities and the environments in which we operate. This includes a strong focus on the safety of our people and managing our net equity Scope 1 and 2 GHG emissions to meet our targets, which are central to the longevity of our business. All three goals are critical to ensuring that Woodside delivers its strategy and thrives through the energy transition. WOODSIDE’S STRATEGY THREE GOALS DRIVING OUR STRATEGIC DIRECTION Provide energy OPTIMISE VALUE AND SHAREHOLDER RETURNS Create and return value Conduct our business sustainably 2024 ANNUAL REPORT 17
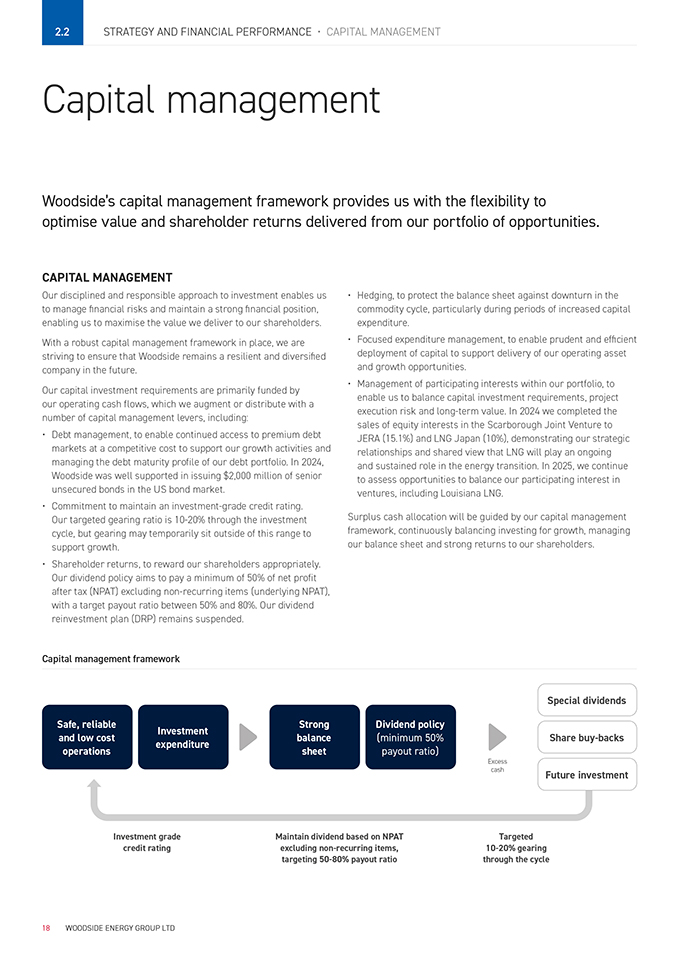
2.2 STRATEGY AND FINANCIAL PERFORMANCE • CAPITAL MANAGEMENT Capital management Woodside’s capital management framework provides us with the flexibility to optimise value and shareholder returns delivered from our portfolio of opportunities. CAPITAL MANAGEMENT Our disciplined and responsible approach to investment enables us to manage financial risks and maintain a strong financial position, enabling us to maximise the value we deliver to our shareholders. With a robust capital management framework in place, we are striving to ensure that Woodside remains a resilient and diversified company in the future. Our capital investment requirements are primarily funded by our operating cash flows, which we augment or distribute with a number of capital management levers, including: • Debt management, to enable continued access to premium debt markets at a competitive cost to support our growth activities and managing the debt maturity profile of our debt portfolio. In 2024, Woodside was well supported in issuing $2,000 million of senior unsecured bonds in the US bond market. • Commitment to maintain an investment-grade credit rating. Our targeted gearing ratio is 10-20% through the investment cycle, but gearing may temporarily sit outside of this range to support growth. • Shareholder returns, to reward our shareholders appropriately. Our dividend policy aims to pay a minimum of 50% of net profit after tax (NPAT) excluding non-recurring items (underlying NPAT), with a target payout ratio between 50% and 80%. Our dividend reinvestment plan (DRP) remains suspended. • Hedging, to protect the balance sheet against downturn in the commodity cycle, particularly during periods of increased capital expenditure. • Focused expenditure management, to enable prudent and efficient deployment of capital to support delivery of our operating asset and growth opportunities. • Management of participating interests within our portfolio, to enable us to balance capital investment requirements, project execution risk and long-term value. In 2024 we completed the sales of equity interests in the Scarborough Joint Venture to JERA (15.1%) and LNG Japan (10%), demonstrating our strategic relationships and shared view that LNG will play an ongoing and sustained role in the energy transition. In 2025, we continue to assess opportunities to balance our participating interest in ventures, including Louisiana LNG. Surplus cash allocation will be guided by our capital management framework, continuously balancing investing for growth, managing our balance sheet and strong returns to our shareholders. Capital management framework Special dividends Safe, reliable and low cost operations Investment expenditure Strong balance sheet Dividend policy (minimum 50% payout ratio) Excess cash Share buy-backs Future investment Investment grade credit rating Maintain dividend based on NPAT excluding non-recurring items, targeting 50-80% payout ratio Targeted 10-20% gearing through the cycle 18 WOODSIDE ENERGY GROUP LTD
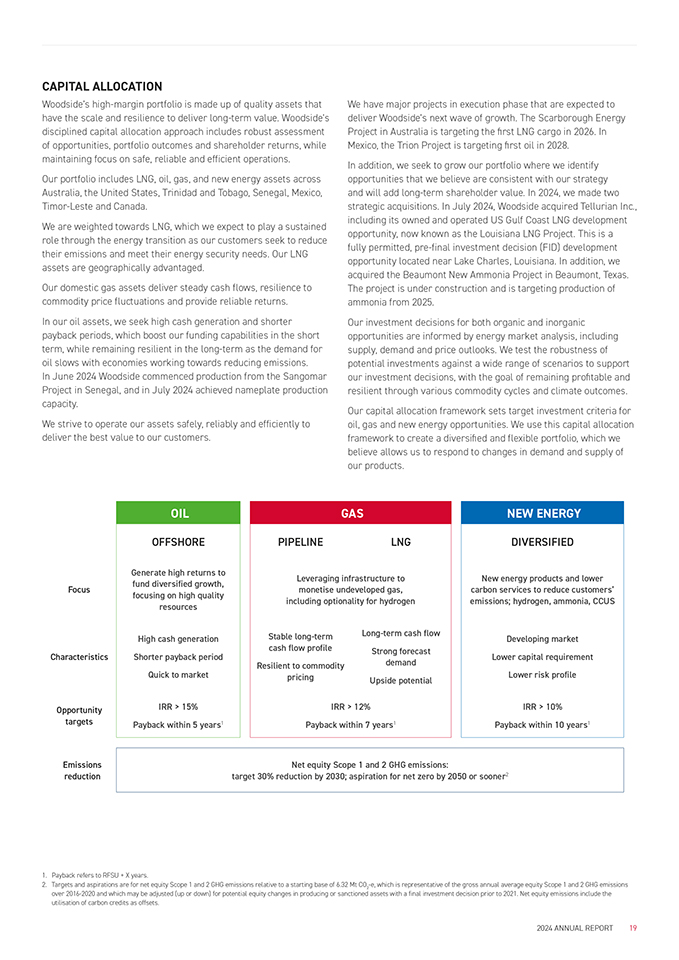
CAPITAL ALLOCATION Woodside’s high-margin portfolio is made up of quality assets that have the scale and resilience to deliver long-term value. Woodside’s disciplined capital allocation approach includes robust assessment of opportunities, portfolio outcomes and shareholder returns, while maintaining focus on safe, reliable and efficient operations. Our portfolio includes LNG, oil, gas, and new energy assets across Australia, the United States, Trinidad and Tobago, Senegal, Mexico, Timor-Leste and Canada. We are weighted towards LNG, which we expect to play a sustained role through the energy transition as our customers seek to reduce their emissions and meet their energy security needs. Our LNG assets are geographically advantaged. Our domestic gas assets deliver steady cash flows, resilience to commodity price fluctuations and provide reliable returns. In our oil assets, we seek high cash generation and shorter payback periods, which boost our funding capabilities in the short term, while remaining resilient in the long-term as the demand for oil slows with economies working towards reducing emissions. In June 2024 Woodside commenced production from the Sangomar Project in Senegal, and in July 2024 achieved nameplate production capacity. We strive to operate our assets safely, reliably and efficiently to deliver the best value to our customers. We have major projects in execution phase that are expected to deliver Woodside’s next wave of growth. The Scarborough Energy Project in Australia is targeting the first LNG cargo in 2026. In Mexico, the Trion Project is targeting first oil in 2028. In addition, we seek to grow our portfolio where we identify opportunities that we believe are consistent with our strategy and will add long-term shareholder value. In 2024, we made two strategic acquisitions. In July 2024, Woodside acquired Tellurian Inc., including its owned and operated US Gulf Coast LNG development opportunity, now known as the Louisiana LNG Project. This is a fully permitted, pre-final investment decision (FID) development opportunity located near Lake Charles, Louisiana. In addition, we acquired the Beaumont New Ammonia Project in Beaumont, Texas. The project is under construction and is targeting production of ammonia from 2025. Our investment decisions for both organic and inorganic opportunities are informed by energy market analysis, including supply, demand and price outlooks. We test the robustness of potential investments against a wide range of scenarios to support our investment decisions, with the goal of remaining profitable and resilient through various commodity cycles and climate outcomes. Our capital allocation framework sets target investment criteria for oil, gas and new energy opportunities. We use this capital allocation framework to create a diversified and flexible portfolio, which we believe allows us to respond to changes in demand and supply of our products. OIL GAS NEW ENERGY OFFSHOREPIPELINELNGDIVERSIFIED Focus Generate high returns to fund diversified growth, focusing on high quality resources Leveraging infrastructure to monetise undeveloped gas, including optionality for hydrogen New energy products and lower carbon services to reduce customers’ emissions; hydrogen, ammonia, CCUS Characteristics High cash generation Shorter payback period Quick to market Stable long-term cash flow profile Resilient to commodity pricing Long-term cash flow Strong forecast demand Upside potential Developing market Lower capital requirement Lower risk profile Opportunity targets IRR > 15% Payback within 5 years1 IRR > 12% Payback within 7 years1 IRR > 10% Payback within 10 years1 Emissions reduction Net equity Scope 1 and 2 GHG emissions: target 30% reduction by 2030; aspiration for net zero by 2050 or sooner2 1. Payback refers to RFSU + X years. 2. Targets and aspirations are for net equity Scope 1 and 2 GHG emissions relative to a starting base of 6.32 Mt CO2-e, which is representative of the gross annual average equity Scope 1 and 2 GHG emissions over 2016-2020 and which may be adjusted (up or down) for potential equity changes in producing or sanctioned assets with a final investment decision prior to 2021. Net equity emissions include the utilisation of carbon credits as offsets. 2024 ANNUAL REPORT 19
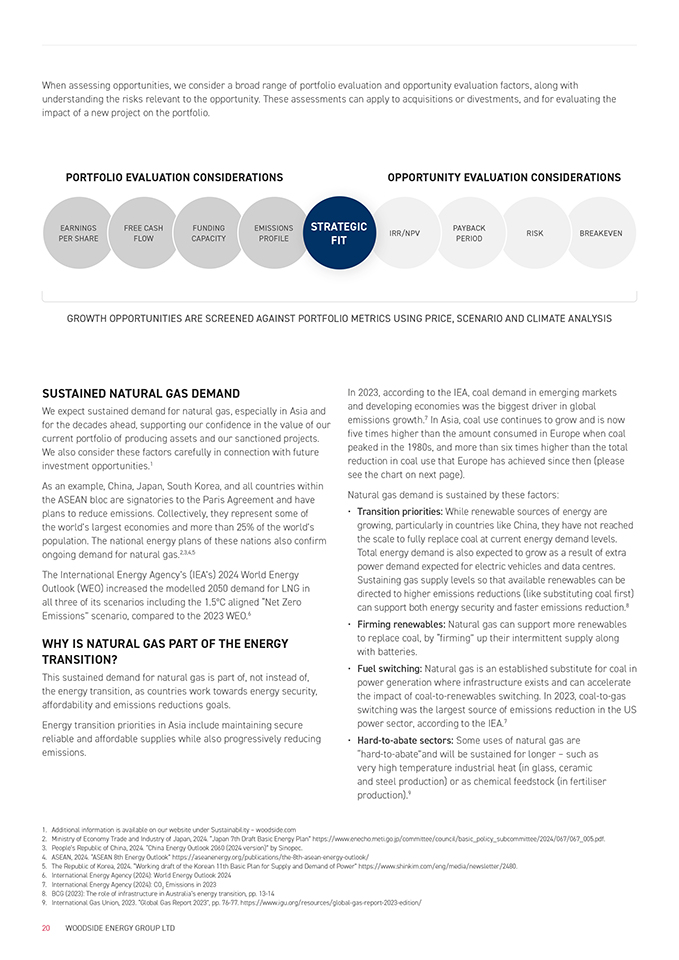
When assessing opportunities, we consider a broad range of portfolio evaluation and opportunity evaluation factors, along with understanding the risks relevant to the opportunity. These assessments can apply to acquisitions or divestments, and for evaluating the impact of a new project on the portfolio. PORTFOLIO EVALUATION CONSIDERATIONS OPPORTUNITY EVALUATION CONSIDERATIONS EARNINGS PER SHARE FREE CASH FLOW FUNDING CAPACITY EMISSIO PROFILE STRATEGIC FIT RR/NPV PAYBACK PERIOD RISK BREAKEVEN GROWTH OPPORTUNITIES ARE SCREENED AGAINST PORTFOLIO METRICS USING PRICE, SCENARIO AND CLIMATE ANALYSIS SUSTAINED NATURAL GAS DEMAND We expect sustained demand for natural gas, especially in Asia and for the decades ahead, supporting our confidence in the value of our current portfolio of producing assets and our sanctioned projects. We also consider these factors carefully in connection with future investment opportunities.1 As an example, China, Japan, South Korea, and all countries within the ASEAN bloc are signatories to the Paris Agreement and have plans to reduce emissions. Collectively, they represent some of the world’s largest economies and more than 25% of the world’s population. The national energy plans of these nations also confirm ongoing demand for natural gas.2,3,4,5 The International Energy Agency’s (IEA’s) 2024 World Energy Outlook (WEO) increased the modelled 2050 demand for LNG in all three of its scenarios including the 1.5°C aligned “Net Zero Emissions” scenario, compared to the 2023 WEO.6 WHY IS NATURAL GAS PART OF THE ENERGY TRANSITION? This sustained demand for natural gas is part of, not instead of, the energy transition, as countries work towards energy security, affordability and emissions reductions goals. Energy transition priorities in Asia include maintaining secure reliable and affordable supplies while also progressively reducing emissions. In 2023, according to the IEA, coal demand in emerging markets and developing economies was the biggest driver in global emissions growth.7 In Asia, coal use continues to grow and is now five times higher than the amount consumed in Europe when coal peaked in the 1980s, and more than six times higher than the total reduction in coal use that Europe has achieved since then (please see the chart on next page). Natural gas demand is sustained by these factors: • Transition priorities: While renewable sources of energy are growing, particularly in countries like China, they have not reached the scale to fully replace coal at current energy demand levels. Total energy demand is also expected to grow as a result of extra power demand expected for electric vehicles and data centres. Sustaining gas supply levels so that available renewables can be directed to higher emissions reductions (like substituting coal first) can support both energy security and faster emissions reduction.8 • Firming renewables: Natural gas can support more renewables to replace coal, by “firming” up their intermittent supply along with batteries. • Fuel switching: Natural gas is an established substitute for coal in power generation where infrastructure exists and can accelerate the impact of coal-to-renewables switching. In 2023, coal-to-gas switching was the largest source of emissions reduction in the US power sector, according to the IEA.7 • Hard-to-abate sectors: Some uses of natural gas are “hard-to-abate”and will be sustained for longer – such as very high temperature industrial heat (in glass, ceramic and steel production) or as chemical feedstock (in fertiliser production).9 1. Additional information is available on our website under Sustainability – woodside.com 2. Ministry of Economy Trade and Industry of Japan, 2024. “Japan 7th Draft Basic Energy Plan” https://www.enecho.meti.go.jp/committee/council/basic_policy_subcommittee/2024/067/067_005.pdf. 3. People’s Republic of China, 2024. “China Energy Outlook 2060 (2024 version)” by Sinopec. 4. ASEAN, 2024. “ASEAN 8th Energy Outlook” https://aseanenergy.org/publications/the-8th-asean-energy-outlook/ 5. The Republic of Korea, 2024. “Working draft of the Korean 11th Basic Plan for Supply and Demand of Power” https://www.shinkim.com/eng/media/newsletter/2480. 6. International Energy Agency (2024): World Energy Outlook 2024 7. International Energy Agency (2024): CO2 Emissions in 2023 8. BCG (2023): The role of infrastructure in Australia’s energy transition, pp. 13-14 9. International Gas Union, 2023. “Global Gas Report 2023”, pp. 76-77. https://www.igu.org/resources/global-gas-report-2023-edition/ 20 WOODSIDE ENERGY GROUP LTD
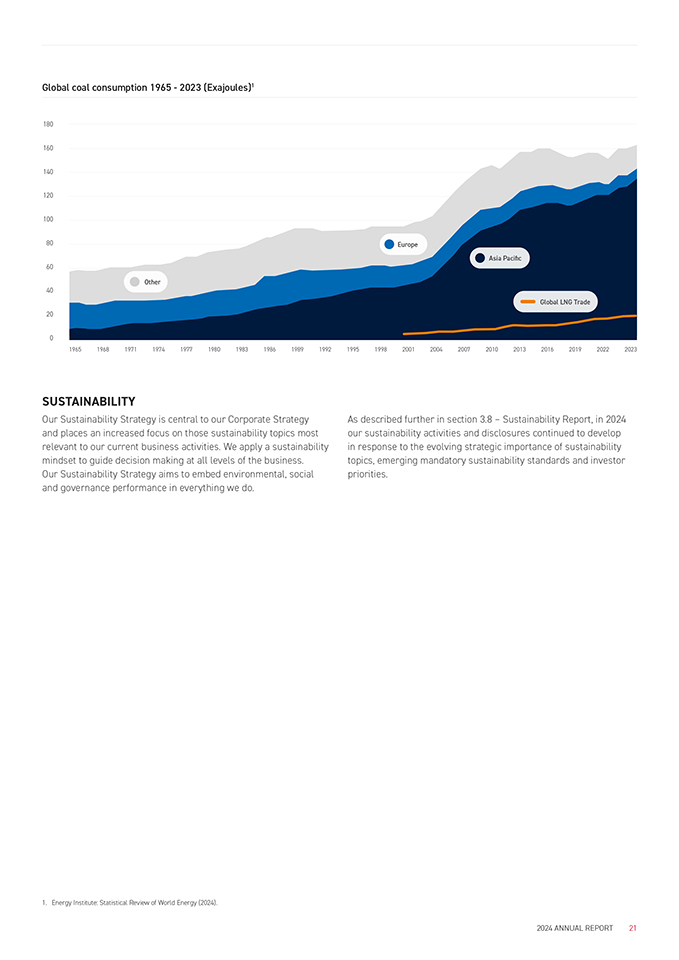
Global coal consumption 1965—2023 (Exajoules)1 180 160 140 120 100 80 60 Other 40 20 Europe Asia Pacific Global LNG Trade 0 1965 1968 1971197419771980198319861989199219951998200120042007201020132016201920222023 SUSTAINABILITY Our Sustainability Strategy is central to our Corporate Strategy and places an increased focus on those sustainability topics most relevant to our current business activities. We apply a sustainability mindset to guide decision making at all levels of the business. Our Sustainability Strategy aims to embed environmental, social and governance performance in everything we do. As described further in section 3.8 – Sustainability Report, in 2024 our sustainability activities and disclosures continued to develop in response to the evolving strategic importance of sustainability topics, emerging mandatory sustainability standards and investor priorities. 1. Energy Institute: Statistical Review of World Energy (2024). 2024 ANNUAL REPORT 21
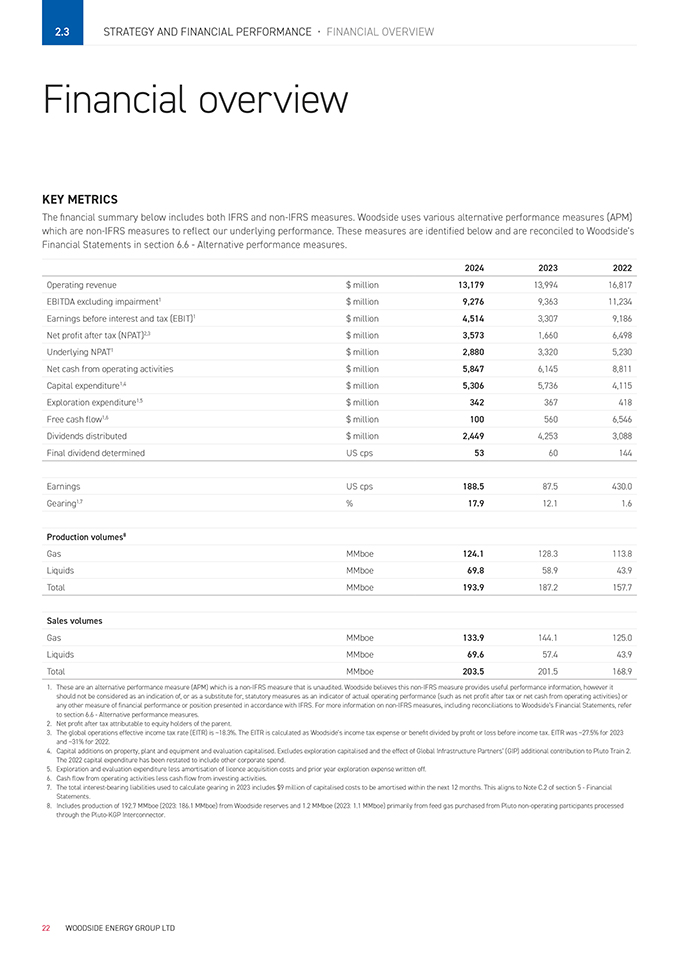
2.3 STRATEGY AND FINANCIAL PERFORMANCE • FINANCIAL OVERVIEW Financial overview KEY METRICS The financial summary below includes both IFRS and non-IFRS measures. Woodside uses various alternative performance measures (APM) which are non-IFRS measures to reflect our underlying performance. These measures are identified below and are reconciled to Woodside’s Financial Statements in section 6.6—Alternative performance measures. 2024 2023 2022 Operating revenue$ million13,17913,99416,817 EBITDA excluding impairment1$ million9,2769,36311,234 Earnings before interest and tax (EBIT)1$ million4,5143,3079,186 Net profit after tax (NPAT)2,3$ million3,5731,6606,498 Underlying NPAT1$ million2,8803,3205,230 Net cash from operating activities$ million5,8476,1458,811 Capital expenditure1,4$ million5,3065,7364,115 Exploration expenditure1,5$ million342367418 Free cash flow1,6$ million1005606,546 Dividends distributed$ million2,4494,2533,088 Final dividend determinedUS cps5360144 EarningsUS cps188.587.5430.0 Gearing1,7%17.912.11.6 Production volumes8 GasMMboe124.1128.3113.8 LiquidsMMboe69.858.943.9 TotalMMboe193.9187.2157.7 Sales volumes GasMMboe133.9144.1125.0 LiquidsMMboe69.657.443.9 TotalMMboe203.5201.5168.9 1. These are an alternative performance measure (APM) which is a non-IFRS measure that is unaudited. Woodside believes this non-IFRS measure provides useful performance information, however it should not be considered as an indication of, or as a substitute for, statutory measures as an indicator of actual operating performance (such as net profit after tax or net cash from operating activities) or any other measure of financial performance or position presented in accordance with IFRS. For more information on non-IFRS measures, including reconciliations to Woodside’s Financial Statements, refer to section 6.6—Alternative performance measures. 2. Net profit after tax attributable to equity holders of the parent. 3. The global operations effective income tax rate (EITR) is ~18.3%. The EITR is calculated as Woodside’s income tax expense or benefit divided by profit or loss before income tax. EITR was ~27.5% for 2023 and ~31% for 2022. 4. Capital additions on property, plant and equipment and evaluation capitalised. Excludes exploration capitalised and the effect of Global Infrastructure Partners’ (GIP) additional contribution to Pluto Train 2. The 2022 capital expenditure has been restated to include other corporate spend. 5. Exploration and evaluation expenditure less amortisation of licence acquisition costs and prior year exploration expense written off. 6. Cash flow from operating activities less cash flow from investing activities. 7. The total interest-bearing liabilities used to calculate gearing in 2023 includes $9 million of capitalised costs to be amortised within the next 12 months. This aligns to Note C.2 of section 5—Financial Statements. 8. Includes production of 192.7 MMboe (2023: 186.1 MMboe) from Woodside reserves and 1.2 MMboe (2023: 1.1 MMboe) primarily from feed gas purchased from Pluto non-operating participants processed through the Pluto-KGP Interconnector. 22 WOODSIDE ENERGY GROUP LTD
CAPITAL MANAGEMENT Final dividend A 2024 final dividend of 53 US cents per share (cps) has been determined, representing a full-year dividend yield of 8.0%.1 The total amount of the final dividend payment comes to $1,006 million which represents approximately 80% of underlying NPAT for the second half of 2024, and will be fully franked for Australian tax purposes.2 The dividend reinvestment plan (DRP) remains suspended. Liquidity and debt service Woodside’s primary sources of liquidity are cash and cash equivalents, net cash generated by operating activities, unused borrowing capacity under its bilateral facilities and syndicated facilities, issuances of debt or equity securities and other sources, such as selldowns. During the year, Woodside generated $5,847 million of cash flow from operating activities, received $2,285 million of proceeds from the equity selldown in the Scarborough Joint Venture and delivered positive free cash flow of $100 million.2,3 Woodside entered into the following new drawn debt facilities in 2024: • $1,200 million seven-year syndicated term loan from Asian and European commercial banks. • $1,000 million ten-year loan from the Japan Bank for International Cooperation (JBIC) to support the Scarborough Energy Project. • $450 million ten-year syndicated term loan from Asian commercial banks. Woodside also, through a wholly owned subsidiary, issued $2,000 million of senior unsecured bonds in the United States, comprising a $1,250 million ten-year bond and a $750 million 30-year bond. Woodside received strong support from commercial banks and investors on all of the 2024 funding activities, including oversubscription of the $1,200 million term loan and $2,000 million US bond issuance. At the end of the period, Woodside had cash and cash equivalents of $3,923 million, drawn debt of $10,050 million, including $1,000 million principal debt payable in 2025, and liquidity of $6,723 million.4 Additional details of Woodside’s credit facilities, including total commitments, maturity and interest and amount outstanding as of 31 December 2024, can be found in Note C.2 to the audited Financial Statements. Woodside’s principal ongoing uses of cash are to meet working capital requirements, fund debt obligations and finance Woodside’s capital expenditure and acquisitions. Working capital is sufficient for present requirements. Woodside’s capital expenditure for 2025 is expected to be between $4,500 million and $5,000 million primarily due to Scarborough and Trion, and remaining acquisition expenditure for Beaumont New Ammonia. Woodside’s capital expenditure estimates exclude Louisiana LNG project expenditure as this remains subject to FID as well as the impact of any subsequent asset selldowns, future acquisitions or other changes in equity. We are targeting first LNG cargo in 2026 for Scarborough and first oil in 2028 for Trion. Total project estimated cost for Scarborough is $12.5 billion ($8.2 billion Woodside share) and $7.2 billion for Trion ($4.8 billion Woodside share including capital carry of PEMEX of approximately US$460 million). Woodside has no off-balance sheet arrangements that have, or are reasonably likely to have, a current or future material effect on Woodside’s financial condition, revenues or expenses, results of operations, liquidity, capital expenditures or capital resources. Balance sheet Woodside remains committed to maintaining an investment- grade credit rating, which supports our aims of providing sustainable returns to shareholders and investing in future growth opportunities, in accordance with our capital allocation framework. Any downgrade in credit ratings could affect Woodside’s ability to access capital markets and increase the cost of capital of the existing debt portfolio. In 2024, Woodside’s credit ratings of BBB+ and Baa1 by S&P Global and Moody’s respectively were both maintained.5 Woodside’s gearing at the end of 2024 was 17.9%, within our target range of 10-20%. Woodside’s gearing may at times fall outside the target range of 10-20% as the balance sheet is managed through the investment cycle, including increasing above the range to support growth.6 Commodity price risk management Woodside hedges to protect the balance sheet against downside commodity price risk, particularly during periods of high capital expenditure. Woodside hedged approximately 29.3 MMboe of 2024 volumes. The realised value of these oil price hedges was a pre-tax loss of $202 million. As at 31 December 2024, Woodside has placed oil price hedges for approximately 30 MMboe of 2025 production at an average price of approximately $78.7 per barrel. Woodside has also placed hedges for Corpus Christi LNG volumes to protect against downside pricing risk. These hedges are Henry Hub and Title Transfer Facility commodity swaps. As at 31 December 2024, an average of 94% of 2025 volumes and 67% of 2026 volumes have reduced pricing risk as a result of hedging activities. 1. Calculated based on Woodside’s closing share price on 31 December 2024 of A$24.60 ($15.29) and a US$:A$ exchange rate of 0.6217. 2. Underlying NPAT and free cash flow are a non-IFRS measures. Refer to section 6.6—Alternative performance measures for a reconciliation of these measures to Woodside’s Financial Statements. 3. Cash flow from operating activities less cash flow from investing activities. 4. Liquidity is a non-IFRS measure. Refer to section 6.6—Alternative performance measures for a reconciliation of these measures to Woodside’s Financial Statements. 5. Credit ratings are forward-looking opinions on credit risk. S&P Global’s and Moody’s credit ratings express the opinion of each agency on the ability and willingness of Woodside to meet its financial obligations in full and on time. A credit rating is not a recommendation to buy, sell or hold securities and may be subject to suspension, reduction or withdrawal at any time by an assigning rating agency. Any rating should be evaluated independently of any other information. 6. Gearing and net debt are non-IFRS measures. Refer to section 6.6—Alternative performance measures for a reconciliation of these measures to Woodside’s Financial Statements. 2024 ANNUAL REPORT 23
2.4 STRATEGY AND FINANCIAL PERFORMANCE • ENERGY MARKETS Energy markets Global energy markets during 2024 experienced price volatility resulting from significant geopolitical events, changes of government and energy policy shifts worldwide. Volatility in energy markets reinforces the need for reliable, affordable, and secure energy. Despite price volatility, energy markets have been stable overall due to ample supply and uninterrupted flows. The demand for oil and natural gas highlights the need for ongoing hydrocarbon production and investment. MACROECONOMIC FACTORS In 2024, central banks in advanced economies tried to balance monetary policy to curb inflation without stifling growth. The Organisation for Economic Co-operation and Development’s (OECD’s) December 2024 Economic Outlook projects global GDP growth of 3.3% in 2025, up from the 3.2% in 2024.1 The world’s population is expected to reach 9.7 billion in 2050 (an increase of 1.6 billion from 2024) and global GDP is forecast to almost double, driving increased energy demand.2 Artificial intelligence and data centres may also represent significant drivers of future energy demand. Oil Numerous geopolitical events including Russia’s invasion of Ukraine and conflicts in the Middle East have altered trade flows and contributed to high volatility in oil markets over the past four years. Despite OPEC+ exercising production restraint, the oil market was well supplied as production in the United States, Canada, Brazil and Guyana continued to increase in 2024. In the second half of the year, OPEC+ announced it would delay its planned unwinding of production cuts to 2025, citing strong non-OPEC+ supply and an uncertain demand outlook linked to China’s economic data. Dated Brent averaged US$80.8 per barrel in 2024, 2.3% below average 2023 prices and 7.1% above the five-year average. Liquefied Natural Gas Despite relatively mild weather, global gas markets in 2024 remained tight. Supply uncertainty was exacerbated by Russian LNG sanctions, the end of the Ukraine gas transit deal and weather risks. Wood Mackenzie’s base case scenario forecasts global LNG demand to increase by 55% (220 Mt per annum) to 2034.3 South East Asia is expected to remain the major engine of growth past this period with the power and industrial sectors driving continuous LNG demand growth as domestic production declines. North East Asian LNG prices averaged US$11.9 per million British thermal units (MMBtu), 13.5% below average 2023 prices and 27.8% below the five-year average.3 Australian domestic gas markets The Australian Government released its Future Gas Strategy in 2024 highlighting the importance of gas in the energy transition. Australian domestic gas markets experienced some supply shortfalls in 2024. In Western Australia, the market was finely balanced with increases in power demand offset by the closure of the Kwinana refinery and temporary suspension of BHP’s Nickel West Project. The east coast gas market broadly stabilised during 2024 but did experience seasonal supply gaps. Without further investment, both the west and east coasts of Australia are expected to be structurally short of gas by 2030. New energy products Across the globe, investment in new energy technology has increased, spurred by government policy seeking to reduce long- term emissions. Investment has been currently focused towards solar, wind, battery technologies and electric vehicles. Other products such as hydrogen face challenges specifically relating to cost inflation, uncertainty in demand from end-users, uncertainty around availability and eligibility for government support. Woodside continues to believe that new energy products will play an important role in the energy transition as part of the energy mix. Lower-carbon ammonia is economically advantaged under the United States and European policy settings supporting viability of new projects. Underlying demand for ammonia continues to grow with global population increases together with the expected adoption of new lower-carbon ammonia uses such as power generation, as a marine fuel, and potentially as a hydrogen carrier. 1. OECD Economic Outlook, 4 December 2024. 2. UN World Population Prospects 2024. 3. WoodMackenzie, Global Gas Investment Horizon Outlook, November 2024. 24 WOODSIDE ENERGY GROUP LTD
2.5 STRATEGY AND FINANCIAL PERFORMANCE • BUSINESS MODEL AND VALUE CHAIN Business model and value chain Woodside seeks to optimise returns across the value chain by prioritising competitive growth opportunities; utilising our operational, development and technological capabilities; and investing in customer relationships. 2024 examples Acquire, divest, explore and develop We manage our portfolio through acquisitions, divestments and exploration, based on a disciplined approach to optimising shareholder value and appropriately managing risk. We look for material positions in world-class assets and locations that are aligned with our capabilities and existing portfolio. We are focused on value and look to generate low-cost, lower-carbon development opportunities. During the development phases, we aim to optimise value by selecting the best concept for extracting, processing and delivering energy to our customers. • Acquired the Louisiana LNG opportunity. • Acquired the Beaumont New Ammonia Project. • Completed the sales of equity interests in the Scarborough Joint Venture to JERA (15.1%) and LNG Japan (10%). • Agreed to an asset swap with Chevron under which Woodside will acquire Chevron’s interest in the NWS Project, the NWS Oil Project and the Angel CCS Project, and transfer all of its interest in both the Wheatstone and Julimar-Brunello Projects to Chevron.1 Project execution We are building on decades of project execution expertise, investing in opportunities across the globe. Woodside is benefitting from the increased scope and scale of its projects portfolio through knowledge sharing across projects and our relationships with suppliers and contractors. We design and execute projects with a focus on safety, cost and sustainability. • Completed Sangomar Project and achieved first oil in June 2024, delivering $948 million in revenue to Woodside in 2024. • Continued project execution of Scarborough and Trion, which were 78% and 20% complete respectively by the end of 2024.2 Operate Our operations prioritise safety while focusing on strong reliability and environmental performance in remote and challenging locations. In Australia, our operated assets include the NWS Project and Pluto LNG. We also operate Macedon and three floating production storage and offloading (FPSO) facilities and have non-operated interests in Bass Strait and Wheatstone. Internationally, we operate Sangomar in Senegal, Shenzi in the Gulf of Mexico, Angostura and Ruby in Trinidad and Tobago, and have non-operated interests in Atlantis and Mad Dog in the Gulf of Mexico.3 We endeavour to adopt technology and a continuous improvement mindset to support operational performance and optimise the value of our assets. • Achieved reliability of 98.3% at KGP and 96.1% at Pluto LNG. • Delivered excellent early production performance at Sangomar, quickly achieving nameplate capacity of 100,000 barrels per day. Market and transport Our relationships with customers have been maintained through a track record of reliable delivery since the NWS Project’s first LNG cargo was delivered to Japan in 1989. We are building scale and flexibility in our portfolio by expanding our global supply presence, through our own production and through offtake agreements with third parties, and by maintaining our own shipping fleet. This helps ensure reliable delivery to our customers and creates opportunities to capture value by portfolio and shipping optimisation. We continue to look for opportunities to collaborate with our customers on lower-carbon energy solutions. • Signed sales and purchase agreements with KOGAS, CPC and JERA for the long-term supply of LNG to Korea, Taiwan and Japan respectively. • Received new long-term charter LNG vessel, the Woodside Scarlet Ibis. Decommission Decommissioning is integrated into project planning, from the earliest stages of development through to the end-of-field life. We work with global contractors to safely remove facilities and to plug and abandon wells that are no longer required for our operations. We work with regulators to deliver our decommissioning commitments. • Removed the final two of 18 xmas trees (valve systems) at Enfield. • Successfully recovered the Griffin riser turret mooring. • Decommissioned 149 km of pipeline and recovered more than 90 subsea structures. • Plugged and abandoned seven of ten Stybarrow wells. 1. Completion of the transaction is subject to customary conditions precedent, refer to section 3.1—Australian Operations for details. 2. Scarborough completion percentage excluding Pluto Train 1 modifications. 3. On 20 January 2025, President Trump issued an Executive Order renaming the area known as the “Gulf of Mexico” as the “Gulf of America”. The US Interior Department formally announced the change on 24 January 2025 and US federal agencies are currently in the process of implementing the change. In this 2024 Annual Report, Woodside uses the term “Gulf of Mexico” to refer to the area in which its Shenzi, Mad Dog and Atlantis projects are located, as that term was in effect during the period covered by this report. Woodside will adopt the naming conventions required by applicable laws and regulations in relation to US waters. 2024 ANNUAL REPORT 25
OPER A TIONS Our established track record of operational excellence and reliable supply underpins our success. 26
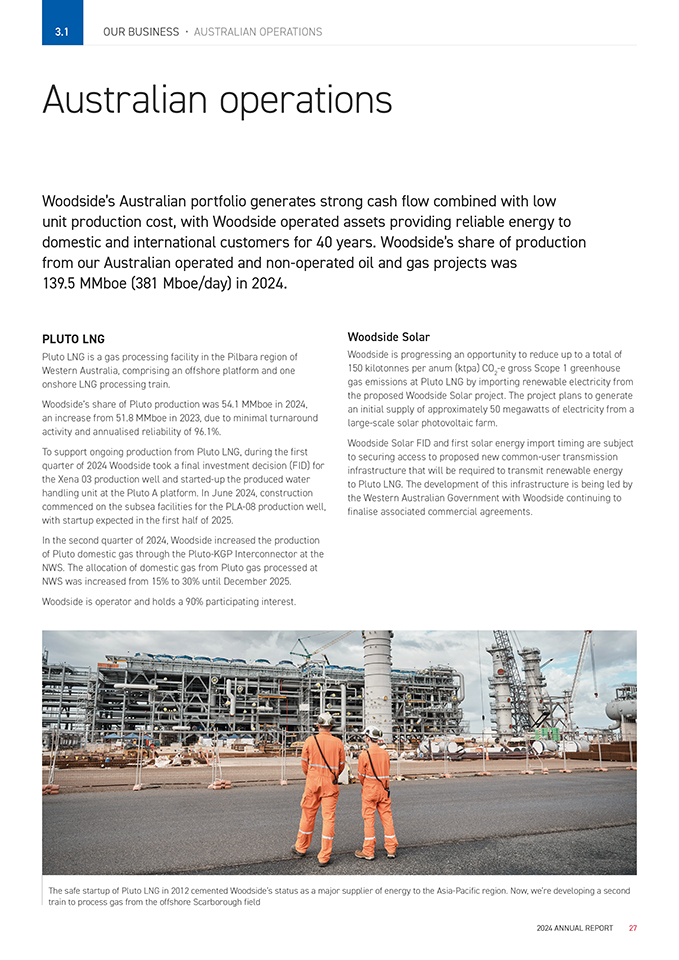
3.1 OUR BUSINESS • AUSTRALIAN OPERATIONS Australian operations Woodside’s Australian portfolio generates strong cash flow combined with low unit production cost, with Woodside operated assets providing reliable energy to domestic and international customers for 40 years. Woodside’s share of production from our Australian operated and non-operated oil and gas projects was 139.5 MMboe (381 Mboe/day) in 2024. PLUTO LNG Pluto LNG is a gas processing facility in the Pilbara region of Western Australia, comprising an offshore platform and one onshore LNG processing train. Woodside’s share of Pluto production was 54.1 MMboe in 2024, an increase from 51.8 MMboe in 2023, due to minimal turnaround activity and annualised reliability of 96.1%. To support ongoing production from Pluto LNG, during the first quarter of 2024 Woodside took a final investment decision (FID) for the Xena 03 production well and started-up the produced water handling unit at the Pluto A platform. In June 2024, construction commenced on the subsea facilities for the PLA-08 production well, with startup expected in the first half of 2025. In the second quarter of 2024, Woodside increased the production of Pluto domestic gas through the Pluto-KGP Interconnector at the NWS. The allocation of domestic gas from Pluto gas processed at NWS was increased from 15% to 30% until December 2025. Woodside is operator and holds a 90% participating interest. Woodside Solar Woodside is progressing an opportunity to reduce up to a total of 150 kilotonnes per anum (ktpa) CO2-e gross Scope 1 greenhouse gas emissions at Pluto LNG by importing renewable electricity from the proposed Woodside Solar project. The project plans to generate an initial supply of approximately 50 megawatts of electricity from a large-scale solar photovoltaic farm. Woodside Solar FID and first solar energy import timing are subject to securing access to proposed new common-user transmission infrastructure that will be required to transmit renewable energy to Pluto LNG. The development of this infrastructure is being led by the Western Australian Government with Woodside continuing to finalise associated commercial agreements. The safe startup of Pluto LNG in 2012 cemented Woodside’s status as a major supplier of energy to the Asia-Pacific region. Now, we’re developing a second train to process gas from the offshore Scarborough field 2024 ANNUAL REPORT 27
NORTH WEST SHELF PROJECT The NWS Project consists of three offshore platforms and the onshore Karratha Gas Plant (KGP). KGP includes five onshore LNG processing trains and two domestic gas trains. Woodside’s share of NWS Project production was 38.1 MMboe in 2024, a decrease from 40.8 MMboe in 2023, due to gradual reservoir decline. World-class reliability continued at KGP achieving an annual reliability rate of 98.3%. In 2024, 11.8 MMboe of Pluto gas was processed at KGP through the Pluto-KGP Interconnector. This was a 5.6% increase compared to 2023. Discussions continued between the NWS Joint Venture participants and other resource owners for the processing of additional third- party gas to utilise available processing capacity at KGP. Processing of Waitsia gas continued and is expected to ramp up when the Waitsia Stage 2 facility commences production. The strategic consolidation of the NWS Project’s ownership structure, through the conditional asset swap agreement with Chevron that was announced in December 2024 (see page 29), is a significant milestone in the 40-year history of this critical energy infrastructure. This transaction creates greater opportunity to fill emerging processing capacity at KGP and maximise value accretive recovery from the NWS Project. The NWS Joint Venture participants took FID on the Lambert West Project which will support ongoing production from the NWS. This project is targeted for startup in the second half of 2025. Additionally, FID was taken on the Low-Low Pressure Operation Project at Goodwyn Alpha, aimed at increasing and accelerating NWS production from the Goodwyn area reservoirs. The NWS Joint Venture participants also progressed a NWS infill program, which includes a proposed subsea tieback of five wells into existing offshore NWS facilities, to be produced via the KGP. This project is targeting FID in 2025. State environmental approval for the NWS Project Extension was received in December 2024; the Federal environmental approval process is ongoing. These approvals would support long-term operations and processing of future third-party gas resources at KGP through to 2070. After 40 years of operations, the NWS Project is entering a period of production decline. With increased ullage due to natural field decline and limited third-party gas-processing demand, LNG train 2 was taken offline as preparations for permanent retirement commenced in the last quarter of 2024. Planned maintenance activities at the Goodwyn Alpha facility, North Rankin Complex and an onshore LNG train at KGP were successfully completed in 2024. Woodside is operator and holds a 33.33% participating interest. Following completion of the asset swap agreement with Chevron announced in 2024, Woodside’s participating interest will increase.1 WHEATSTONE AND JULIMAR-BRUNELLO Wheatstone is an LNG-processing facility near Onslow, Western Australia, comprising an offshore production platform and two onshore LNG-processing trains. It processes gas from several offshore gas fields, including Julimar and Brunello. Woodside’s share of production from Wheatstone was 12.6 MMboe in 2024, a decrease from 13.5 MMboe in 2023, due to unplanned outages affecting the Julimar subsea production system and Wheatstone facility respectively. Wheatstone’s domestic gas plant nameplate capacity was successfully increased for the second consecutive year, with the upgraded nameplate of 230 terajoules (TJ) per day representing a 12% increase from the original design. Woodside is operator and holds a 65% participating interest in the Julimar-Brunello fields. Woodside holds a 13% non-operated interest in the Wheatstone project. Following completion of the asset swap agreement with Chevron announced in 2024, Woodside’s interest in Wheatstone and Julimar-Brunello will reduce to zero. BASS STRAIT Bass Strait is located in the South East of Australia and produces oil and gas through a network of offshore platforms, pipelines and onshore processing facilities located in Victoria. The Bass Strait assets include the Gippsland Basin Joint Venture (GBJV) and the Kipper Unit Joint Venture. Woodside’s share of production from the Bass Strait was 18.8 MMboe in 2024, this was a decrease from 22.8 MMboe in 2023, driven by natural field decline, lower Australian east coast short- term gas market demand, offshore maintenance and reduced production capacity. All of Woodside’s share of gas produced by the GBJV is supplied into the eastern Australian domestic gas market. Through the execution of the Gippsland Asset Streamlining project, the asset has optimised facilities and transitioned to a gas focused business. In 2024, the Halibut, West Kingfish and Cobia oil platforms ceased production, marking the end of 55 years of crude oil production from the Bass Strait. At Longford, the crude stabilisation plant and gas plant 1 were permanently shut-in, streamlining the asset for ongoing gas and condensate production. The Kipper Compression Project, which added compression facilities to the West Tuna Platform, successfully commenced operation in the third quarter of 2024, delivering a production rate increase and enabling continued supply of gas from the Kipper field to the domestic market. The Hastings Generation Project at Long Island Point successfully started up in September, using ethane to generate electricity to supply power to the grid. Woodside holds a 50% non-operating interest in the GBJV and a 32.5% non-operating interest in the Kipper Unit Joint Venture. 1. The NWS Project consists of a number of active joint ventures. Prior to completion of the transaction, Woodside has a participating interest of 33.33% and Chevron has a 16.67% participating interest in all of these joint ventures, apart from the NWS joint ventures with CNOOC. For CLNG JV with CNOOC, Woodside’s participating interest is 25% and Chevron’s is 12.5%. For the Extended Interest JVs with CNOOC, Woodside’s participating interest is 31.567% and Chevron’s participating interest is 15.78%. 28 WOODSIDE ENERGY GROUP LTD
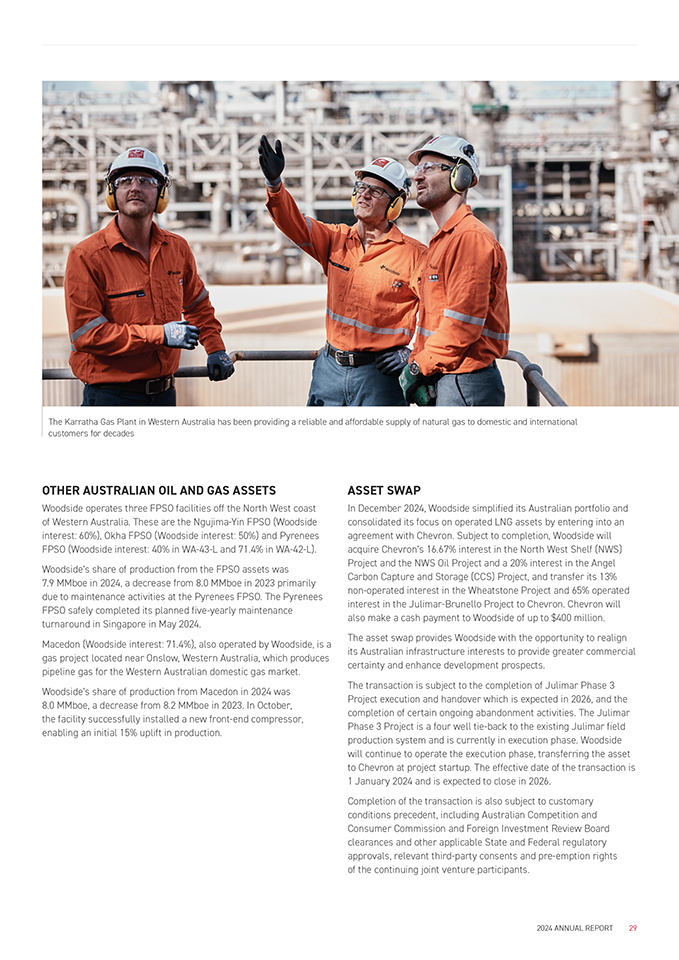
The Karratha Gas Plant in Western Australia has been providing a reliable and affordable supply of natural gas to domestic and international customers for decades OTHER AUSTRALIAN OIL AND GAS ASSETS Woodside operates three FPSO facilities off the North West coast of Western Australia. These are the Ngujima-Yin FPSO (Woodside interest: 60%), Okha FPSO (Woodside interest: 50%) and Pyrenees FPSO (Woodside interest: 40% in WA-43-L and 71.4% in WA-42-L). Woodside’s share of production from the FPSO assets was 7.9 MMboe in 2024, a decrease from 8.0 MMboe in 2023 primarily due to maintenance activities at the Pyrenees FPSO. The Pyrenees FPSO safely completed its planned five-yearly maintenance turnaround in Singapore in May 2024. Macedon (Woodside interest: 71.4%), also operated by Woodside, is a gas project located near Onslow, Western Australia, which produces pipeline gas for the Western Australian domestic gas market. Woodside’s share of production from Macedon in 2024 was 8.0 MMboe, a decrease from 8.2 MMboe in 2023. In October, the facility successfully installed a new front-end compressor, enabling an initial 15% uplift in production. ASSET SWAP In December 2024, Woodside simplified its Australian portfolio and consolidated its focus on operated LNG assets by entering into an agreement with Chevron. Subject to completion, Woodside will acquire Chevron’s 16.67% interest in the North West Shelf (NWS) Project and the NWS Oil Project and a 20% interest in the Angel Carbon Capture and Storage (CCS) Project, and transfer its 13% non-operated interest in the Wheatstone Project and 65% operated interest in the Julimar-Brunello Project to Chevron. Chevron will also make a cash payment to Woodside of up to $400 million. The asset swap provides Woodside with the opportunity to realign its Australian infrastructure interests to provide greater commercial certainty and enhance development prospects. The transaction is subject to the completion of Julimar Phase 3 Project execution and handover which is expected in 2026, and the completion of certain ongoing abandonment activities. The Julimar Phase 3 Project is a four well tie-back to the existing Julimar field production system and is currently in execution phase. Woodside will continue to operate the execution phase, transferring the asset to Chevron at project startup. The effective date of the transaction is 1 January 2024 and is expected to close in 2026. Completion of the transaction is also subject to customary conditions precedent, including Australian Competition and Consumer Commission and Foreign Investment Review Board clearances and other applicable State and Federal regulatory approvals, relevant third-party consents and pre-emption rights of the continuing joint venture participants. 2024 ANNUAL REPORT 29
3.2 OUR BUSINESS • INTERNATIONAL OPERATIONS International operations Woodside’s international portfolio consists of established high-quality operated and non-operated oil and gas assets in Senegal, the US Gulf of Mexico and Trinidad and Tobago.1 Woodside’s share of production from international operations was 54.4 MMboe (149 Mboe/day) in 2024. SANGOMAR The Sangomar oil and gas field is located offshore Senegal, approximately 100 km south of Dakar. Woodside achieved first oil production in June 2024, marking the safe delivery of the country’s first offshore oil project. The Sangomar Field Development Phase 1 is a deepwater project including a stand-alone FPSO facility with a nameplate capacity of 100,000 bbl per day, and subsea infrastructure that is designed to allow subsequent development phases. The final Sangomar Field Development Phase 1 cost was approximately $5.0 billion, at the lower end of the previously estimated range of $4.9—$5.2 billion. Woodside’s share of production from Sangomar was 13.3 MMboe in 2024. Early production performance has been outstanding with nameplate production capacity achieved in July 2024 and maintained. Sangomar crude received strong interest from buyers in Europe, Asia and the United States, with 17 cargoes exported by the end of December 2024. The Sangomar drilling campaign was concluded during the year, marking the successful drilling and completion of 24 development wells. The FPSO hook-up, commissioning and startup activities were completed with reliability of 90% since startup. Woodside will continue to analyse production performance to inform the potential Sangomar Phase 2 development. Woodside is the operator and holds an 82% participating interest in the Sangomar exploitation area. MAD DOG Mad Dog is a conventional oil and gas development located in the US Gulf of Mexico.1 The Mad Dog Phase 1 development includes a spar facility (A-Spar) with drilling capability and dry-tree producer wells. A planned intervention campaign at A-Spar was completed in July 2024, achieving increased production rates. Mad Dog Phase 2 is a development of the southern flank of the Mad Dog field through the Argos floating production facility. First oil was achieved in April 2023 and production ramped up throughout 2024, with the facility achieving peak production of 130,000 bbl per day. The development includes subsea producer wells and subsea water injector wells. Execution of the Mad Dog Southwest Extension Project is ongoing, following sanction in late 2023. First production is planned for 2026. Woodside’s share of production from Mad Dog was 11.3 MMboe in 2024, an increase from 7.2 MMboe in 2023. The increase was driven primarily by production ramp up at Argos. Woodside holds a 23.9% non-operating participating interest. ATLANTIS Atlantis is a conventional oil and gas development in the US Gulf of Mexico.1 The Atlantis development includes a semi-submersible facility with subsea production wells and subsea water injector wells. Woodside’s share of production from Atlantis was 10.5 MMboe in 2024, a decrease from 12.6 MMboe in 2023. The decrease was driven primarily by a planned facility and midstream turnaround and multiple downtime events associated with weather events. One production well was completed in 2024. This was the first horizontal well in the Atlantis field. Woodside took FID on the Atlantis Drill Center 1 Expansion in February 2024. It is a two well tie-back to the Atlantis facility through the existing Drill Center 1 manifold in the southwest portion of the field. First production is planned for 2026. Woodside holds a 44% non-operating participating interest. 1. On 20 January 2025, President Trump issued an Executive Order renaming the area known as the “Gulf of Mexico” as the “Gulf of America”. The US Interior Department formally announced the change on 24 January 2025 and US federal agencies are currently in the process of implementing the change. In this 2024 Annual Report, Woodside uses the term “Gulf of Mexico” to refer to the area in which its Shenzi, Mad Dog and Atlantis projects are located, as that term was in effect during the period covered by this report. Woodside will adopt the naming conventions required by applicable laws and regulations in relation to US waters. 30 WOODSIDE ENERGY GROUP LTD

SHENZI Shenzi is a conventional oil and gas field developed through a tension leg platform located in the US Gulf of Mexico.1 The facility has subsea production and water injection wells. In addition, two subsea wells are tied back to the non-operated Marco Polo platform. Woodside’s share of production from Shenzi was 9.4 MMboe in 2024, down from 10.8 MMboe in 2023. This was due to natural depletion and multiple downtime events associated with weather events. Woodside is operator and holds a 72% participating interest. GREATER ANGOSTURA Greater Angostura includes the Angostura and Ruby conventional oil and gas fields, located offshore Trinidad and Tobago. The development includes an offshore central processing facility, five wellhead platforms and an onshore oil terminal. Woodside and the Trinidad and Tobago Ministry of Energy and Energy Industries reached an agreement in the fourth quarter of 2024 to modify key fiscal terms in their production sharing contract in support of economic life extension. The revised terms take effect from 2025. Woodside’s share of production from Greater Angostura was 9.5 MMboe in 2024, a decrease from 11.2 MMboe in 2023 primarily due to a planned facility maintenance turnaround completed in June 2024. Woodside is operator and holds a 45% participating interest in the Angostura field and a 68.5% participating interest in the Ruby field. 1. On 20 January 2025, President Trump issued an Executive Order renaming the area known as the “Gulf of Mexico” as the “Gulf of America”. The US Interior Department formally announced the change on 24 January 2025 and US federal agencies are currently in the process of implementing the change. In this 2024 Annual Report, Woodside uses the term “Gulf of Mexico” to refer to the area in which its Shenzi, Mad Dog and Atlantis projects are located, as that term was in effect during the period covered by this report. Woodside will adopt the naming conventions required by applicable laws and regulations in relation to US waters. Woodside CEO and Managing Director Meg O’Neill (centre) and the President of Senegal, His Excellency Bassirou Diomaye Diakhar Faye (centre), together with representatives from the Senegalese government and Woodside employees on an offshore visit to the Léopold Sédar Senghor FPSO 2024 ANNUAL REPORT 31
3.3 OUR BUSINESS • MARKETING AND TRADING Marketing and trading Woodside’s marketing business generated $427 million in profit before tax in 2024. Woodside has a global portfolio with positions in both the Pacific and Atlantic basins. We have a strong track record of reliable supply to major energy customers through our integrated shipping, operations, marketing and trading activities across LNG, pipeline gas, condensate, crude and natural gas liquid (NGL) cargoes. The marketing segment’s strong profit reflects the optimisation activities and incremental value generated through the marketing, trading and shipping of Woodside’s oil and gas and through third-party purchased values. Woodside’s LNG portfolio is managed through a mix of short, mid and long-term contracts, supplied with cargoes sourced from producing assets or purchased from third parties. In 2024, Woodside’s exposure of produced LNG to gas hub indices was 34.4%. This represents 15% of Woodside’s total equity production. Woodside remains one of the largest suppliers of Australian LNG to major regional trading partners. In 2024, Woodside signed sale and purchase agreements with KOGAS, CPC and JERA for the long- term supply of LNG to Korea, Taiwan and Japan respectively. These LNG buyers are some of the largest in the world, demonstrating ongoing robust demand for Woodside’s products and the ability of LNG to meet energy security needs while supporting regional decarbonisation goals. The KOGAS agreement is for the supply of approximately 0.5 million tonnes per annum (Mtpa) of LNG from 2026, for a period of 10.5 years on a delivered basis. The CPC agreement is for the supply of approximately 6 million tonnes of LNG on a delivered basis over ten years, from July 2024. Under the CPC agreement, Woodside may also deliver approximately 8.4 million tonnes of LNG for a further ten years, from 2034 to 2043.1 The JERA agreement is for the supply of approximately 0.4 Mtpa (six cargoes) of LNG over ten years on a delivered basis, commencing in April 2026. LNG delivered under all three agreements will be sourced from volumes across Woodside’s global portfolio. Woodside’s LNG trading activities seek to maximise value of our LNG portfolio. Third-party cargoes are purchased from Corpus Christi LNG through a long-term offtake agreement and from the spot market through our relationships with other producers and traders. The marketing of crude, condensate and NGLs is predominantly based on short-term sales and supplemented by term arrangements. The majority of Woodside’s crude oil and condensate in Australia, Senegal and Trinidad and Tobago is currently sold to international markets. In the US Gulf of Mexico, crude oil is sold to refiners and traders on the US Gulf Coast. Woodside has also maintained its operational flexibility in the US Gulf of Mexico through access to infrastructure that enables the export of crude oil to international markets.2 Woodside produces natural gas for domestic markets in Western Australia, the east coast of Australia, the United States and Trinidad and Tobago. In 2024, Woodside’s Western Australian assets produced 86 petajoules (PJ) of natural gas, representing approximately 21% of Western Australia’s domestic gas supply. Woodside executed 73.5 PJ of termed WA gas sales for delivery across 2025 and 2026 and will continue to support the domestic market by offering additional supply for 2025 and onwards. A record quantity of trucked LNG (approximately 1,900 TJ) was also delivered in 2024 to customers in northern Western Australia. Since the commencement of operations at the Pluto LNG Truck Loading Facility in 2019, Woodside has delivered more than 3,200 trailers of LNG (approximately 3,250 TJ), offering a lower-carbon alternative to diesel and fuel-oil for industry to users in remote locations. In the east coast of Australia, Woodside’s share of Bass Strait production was 84.9 PJ, representing approximately 17% of all gas supplied to the east coast market. All of Woodside’s production from Bass Strait is sold into the east coast domestic market. Woodside was granted an exemption under the applicable domestic Gas Market Code legislation in January 2024. The exemption provides Woodside with the opportunity to increase delivery to the east coast domestic market by more than 260 PJ (100% share) through to 2033 if needed. In the US Gulf of Mexico, natural gas is sold to end-users and merchants at the tailgate of the Neptune gas processing plant, which is owned and operated by a third-party midstream company.2 Woodside’s marketing and trading portfolio is supported by our managed shipping capacity which includes seven LNG vessels under long-term charter and multiple vessels on short-term charter. A new 174,000 m3 long-term charter LNG vessel, the Woodside Scarlet Ibis, was delivered in June 2024. 1. Subject to conditions and agreement on terms for this period. 2. On 20 January 2025, President Trump issued an Executive Order renaming the area known as the “Gulf of Mexico” as the “Gulf of America”. The US Interior Department formally announced the change on 24 January 2025 and US federal agencies are currently in the process of implementing the change. In this 2024 Annual Report, Woodside uses the term “Gulf of Mexico” to refer to the area in which its Shenzi, Mad Dog and Atlantis projects are located, as that term was in effect during the period covered by this report. Woodside will adopt the naming conventions required by applicable laws and regulations in relation to US waters. 32 WOODSIDE ENERGY GROUP LTD
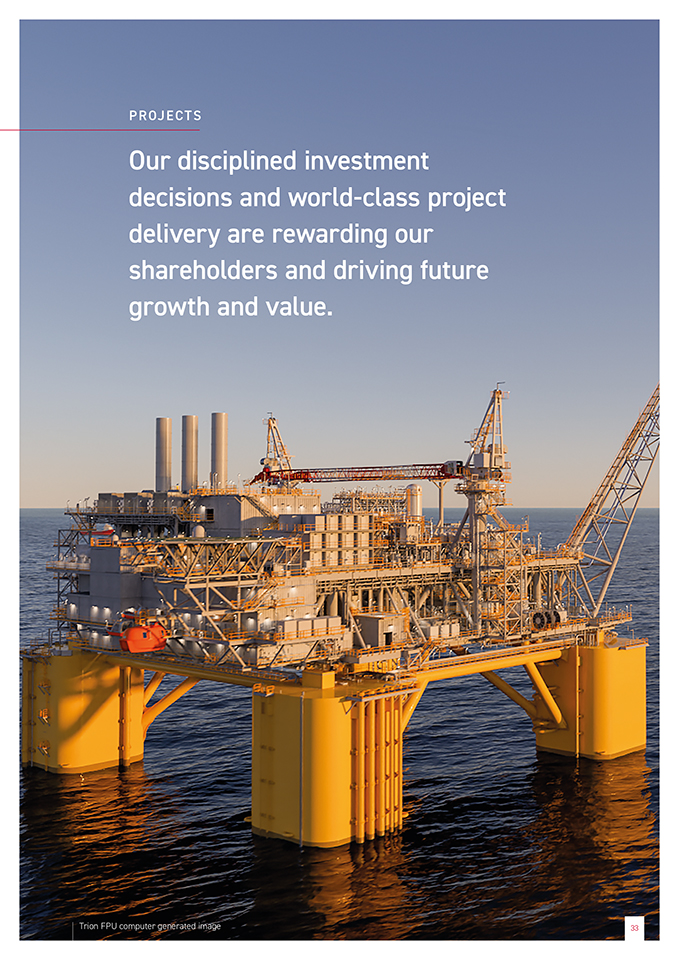
PR O JEC TS Our disciplined investment decisions and world-class project delivery are rewarding our shareholders and driving future growth and value. Trion FPU computer generated image 33 33
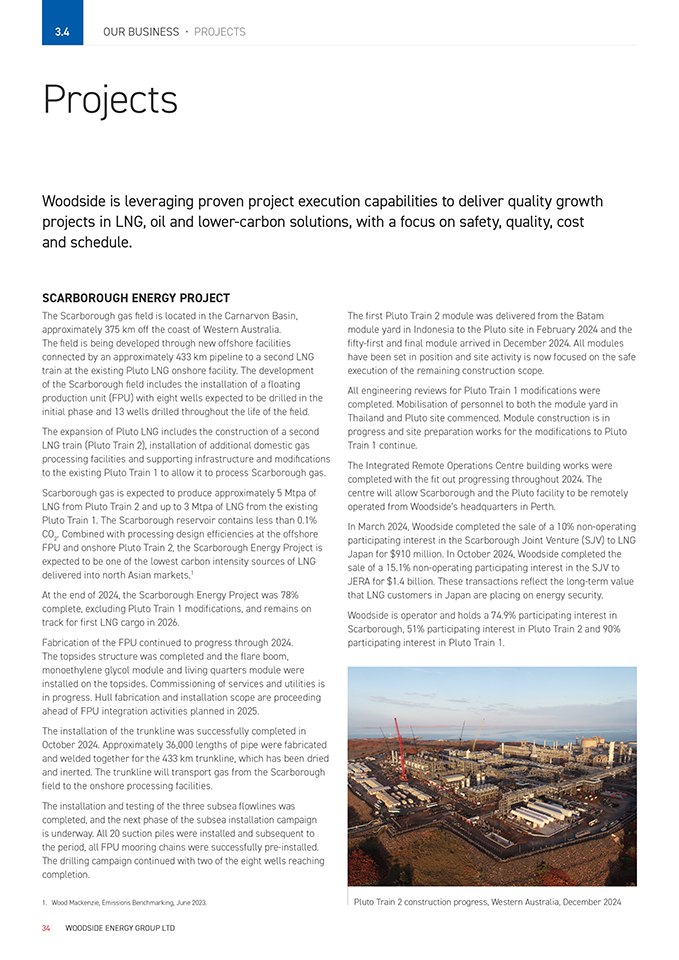
3.4 OUR BUSINESS • PROJECTS Projects Woodside is leveraging proven project execution capabilities to deliver quality growth projects in LNG, oil and lower-carbon solutions, with a focus on safety, quality, cost and schedule. SCARBOROUGH ENERGY PROJECT The Scarborough gas field is located in the Carnarvon Basin, approximately 375 km off the coast of Western Australia. The field is being developed through new offshore facilities connected by an approximately 433 km pipeline to a second LNG train at the existing Pluto LNG onshore facility. The development of the Scarborough field includes the installation of a floating production unit (FPU) with eight wells expected to be drilled in the initial phase and 13 wells drilled throughout the life of the field. The expansion of Pluto LNG includes the construction of a second LNG train (Pluto Train 2), installation of additional domestic gas processing facilities and supporting infrastructure and modifications to the existing Pluto Train 1 to allow it to process Scarborough gas. Scarborough gas is expected to produce approximately 5 Mtpa of LNG from Pluto Train 2 and up to 3 Mtpa of LNG from the existing Pluto Train 1. The Scarborough reservoir contains less than 0.1% CO2. Combined with processing design efficiencies at the offshore FPU and onshore Pluto Train 2, the Scarborough Energy Project is expected to be one of the lowest carbon intensity sources of LNG delivered into north Asian markets.1 At the end of 2024, the Scarborough Energy Project was 78% complete, excluding Pluto Train 1 modifications, and remains on track for first LNG cargo in 2026. Fabrication of the FPU continued to progress through 2024. The topsides structure was completed and the flare boom, monoethylene glycol module and living quarters module were installed on the topsides. Commissioning of services and utilities is in progress. Hull fabrication and installation scope are proceeding ahead of FPU integration activities planned in 2025. The installation of the trunkline was successfully completed in October 2024. Approximately 36,000 lengths of pipe were fabricated and welded together for the 433 km trunkline, which has been dried and inerted. The trunkline will transport gas from the Scarborough field to the onshore processing facilities. The installation and testing of the three subsea flowlines was completed, and the next phase of the subsea installation campaign is underway. All 20 suction piles were installed and subsequent to the period, all FPU mooring chains were successfully pre-installed. The drilling campaign continued with two of the eight wells reaching completion. The first Pluto Train 2 module was delivered from the Batam module yard in Indonesia to the Pluto site in February 2024 and the fifty-first and final module arrived in December 2024. All modules have been set in position and site activity is now focused on the safe execution of the remaining construction scope. All engineering reviews for Pluto Train 1 modifications were completed. Mobilisation of personnel to both the module yard in Thailand and Pluto site commenced. Module construction is in progress and site preparation works for the modifications to Pluto Train 1 continue. The Integrated Remote Operations Centre building works were completed with the fit out progressing throughout 2024. The centre will allow Scarborough and the Pluto facility to be remotely operated from Woodside’s headquarters in Perth. In March 2024, Woodside completed the sale of a 10% non-operating participating interest in the Scarborough Joint Venture (SJV) to LNG Japan for $910 million. In October 2024, Woodside completed the sale of a 15.1% non-operating participating interest in the SJV to JERA for $1.4 billion. These transactions reflect the long-term value that LNG customers in Japan are placing on energy security. Woodside is operator and holds a 74.9% participating interest in Scarborough, 51% participating interest in Pluto Train 2 and 90% participating interest in Pluto Train 1. 1. Wood Mackenzie, Emissions Benchmarking, June 2023. 34 WOODSIDE ENERGY GROUP LTD Pluto Train 2 construction progress, Western Australia, December 2024
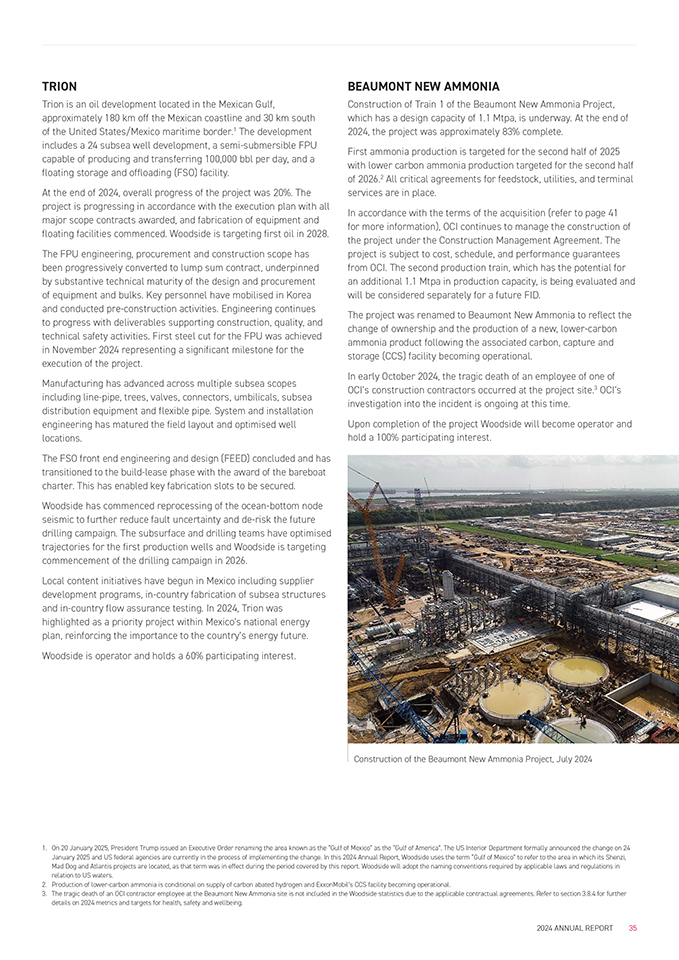
TRION Trion is an oil development located in the Mexican Gulf, approximately 180 km off the Mexican coastline and 30 km south of the United States/Mexico maritime border.1 The development includes a 24 subsea well development, a semi-submersible FPU capable of producing and transferring 100,000 bbl per day, and a floating storage and offloading (FSO) facility. At the end of 2024, overall progress of the project was 20%. The project is progressing in accordance with the execution plan with all major scope contracts awarded, and fabrication of equipment and floating facilities commenced. Woodside is targeting first oil in 2028. The FPU engineering, procurement and construction scope has been progressively converted to lump sum contract, underpinned by substantive technical maturity of the design and procurement of equipment and bulks. Key personnel have mobilised in Korea and conducted pre-construction activities. Engineering continues to progress with deliverables supporting construction, quality, and technical safety activities. First steel cut for the FPU was achieved in November 2024 representing a significant milestone for the execution of the project. Manufacturing has advanced across multiple subsea scopes including line-pipe, trees, valves, connectors, umbilicals, subsea distribution equipment and flexible pipe. System and installation engineering has matured the field layout and optimised well locations. The FSO front end engineering and design (FEED) concluded and has transitioned to the build-lease phase with the award of the bareboat charter. This has enabled key fabrication slots to be secured. Woodside has commenced reprocessing of the ocean-bottom node seismic to further reduce fault uncertainty and de-risk the future drilling campaign. The subsurface and drilling teams have optimised trajectories for the first production wells and Woodside is targeting commencement of the drilling campaign in 2026. Local content initiatives have begun in Mexico including supplier development programs, in-country fabrication of subsea structures and in-country flow assurance testing. In 2024, Trion was highlighted as a priority project within Mexico’s national energy plan, reinforcing the importance to the country’s energy future. Woodside is operator and holds a 60% participating interest. BEAUMONT NEW AMMONIA Construction of Train 1 of the Beaumont New Ammonia Project, which has a design capacity of 1.1 Mtpa, is underway. At the end of 2024, the project was approximately 83% complete. First ammonia production is targeted for the second half of 2025 with lower carbon ammonia production targeted for the second half of 2026.2 All critical agreements for feedstock, utilities, and terminal services are in place. In accordance with the terms of the acquisition (refer to page 41 for more information), OCI continues to manage the construction of the project under the Construction Management Agreement. The project is subject to cost, schedule, and performance guarantees from OCI. The second production train, which has the potential for an additional 1.1 Mtpa in production capacity, is being evaluated and will be considered separately for a future FID. The project was renamed to Beaumont New Ammonia to reflect the change of ownership and the production of a new, lower-carbon ammonia product following the associated carbon, capture and storage (CCS) facility becoming operational. In early October 2024, the tragic death of an employee of one of OCI’s construction contractors occurred at the project site.3 OCI’s investigation into the incident is ongoing at this time. Upon completion of the project Woodside will become operator and hold a 100% participating interest. Construction of the Beaumont New Ammonia Project, July 2024 1. On 20 January 2025, President Trump issued an Executive Order renaming the area known as the “Gulf of Mexico” as the “Gulf of America”. The US Interior Department formally announced the change on 24 January 2025 and US federal agencies are currently in the process of implementing the change. In this 2024 Annual Report, Woodside uses the term “Gulf of Mexico” to refer to the area in which its Shenzi, Mad Dog and Atlantis projects are located, as that term was in effect during the period covered by this report. Woodside will adopt the naming conventions required by applicable laws and regulations in relation to US waters. 2. Production of lower-carbon ammonia is conditional on supply of carbon abated hydrogen and ExxonMobil’s CCS facility becoming operational. 3. The tragic death of an OCI contractor employee at the Beaumont New Ammonia site is not included in the Woodside statistics due to the applicable contractual agreements. Refer to section 3.8.4 for further details on 2024 metrics and targets for health, safety and wellbeing. 2024 ANNUAL REPORT 35
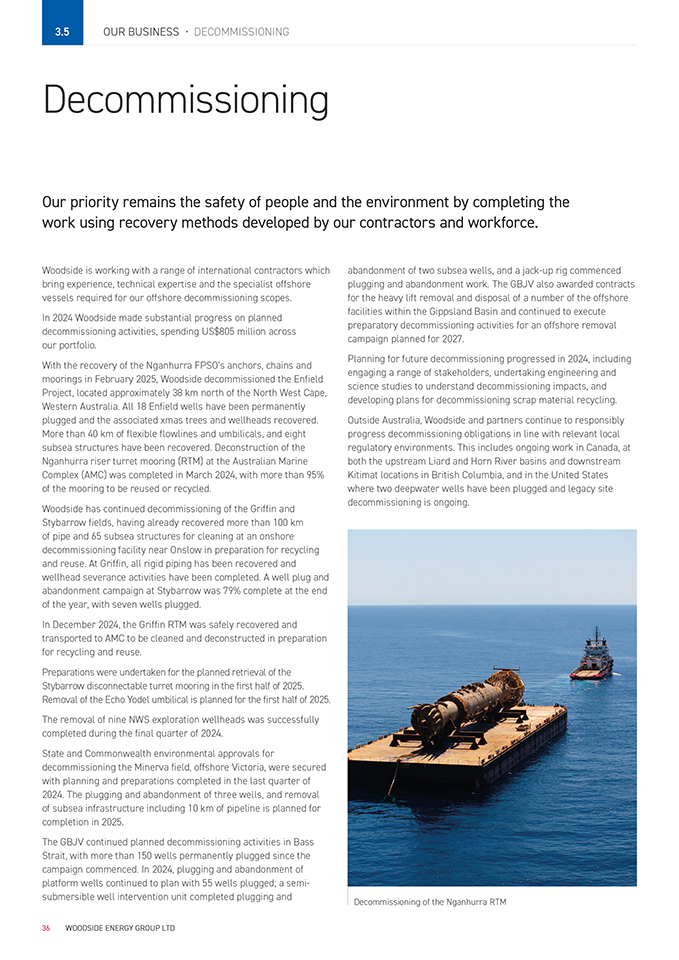
3.5 OUR BUSINESS • DECOMMISSIONING Decommissioning Our priority remains the safety of people and the environment by completing the work using recovery methods developed by our contractors and workforce. Woodside is working with a range of international contractors which bring experience, technical expertise and the specialist offshore vessels required for our offshore decommissioning scopes. In 2024 Woodside made substantial progress on planned decommissioning activities, spending US$805 million across our portfolio. With the recovery of the Nganhurra FPSO’s anchors, chains and moorings in February 2025, Woodside decommissioned the Enfield Project, located approximately 38 km north of the North West Cape, Western Australia. All 18 Enfield wells have been permanently plugged and the associated xmas trees and wellheads recovered. More than 40 km of flexible flowlines and umbilicals, and eight subsea structures have been recovered. Deconstruction of the Nganhurra riser turret mooring (RTM) at the Australian Marine Complex (AMC) was completed in March 2024, with more than 95% of the mooring to be reused or recycled. Woodside has continued decommissioning of the Griffin and Stybarrow fields, having already recovered more than 100 km of pipe and 65 subsea structures for cleaning at an onshore decommissioning facility near Onslow in preparation for recycling and reuse. At Griffin, all rigid piping has been recovered and wellhead severance activities have been completed. A well plug and abandonment campaign at Stybarrow was 79% complete at the end of the year, with seven wells plugged. In December 2024, the Griffin RTM was safely recovered and transported to AMC to be cleaned and deconstructed in preparation for recycling and reuse. Preparations were undertaken for the planned retrieval of the Stybarrow disconnectable turret mooring in the first half of 2025. Removal of the Echo Yodel umbilical is planned for the first half of 2025. The removal of nine NWS exploration wellheads was successfully completed during the final quarter of 2024. State and Commonwealth environmental approvals for decommissioning the Minerva field, offshore Victoria, were secured with planning and preparations completed in the last quarter of 2024. The plugging and abandonment of three wells, and removal of subsea infrastructure including 10 km of pipeline is planned for completion in 2025. The GBJV continued planned decommissioning activities in Bass Strait, with more than 150 wells permanently plugged since the campaign commenced. In 2024, plugging and abandonment of platform wells continued to plan with 55 wells plugged; a semi- submersible well intervention unit completed plugging and abandonment of two subsea wells, and a jack-up rig commenced plugging and abandonment work. The GBJV also awarded contracts for the heavy lift removal and disposal of a number of the offshore facilities within the Gippsland Basin and continued to execute preparatory decommissioning activities for an offshore removal campaign planned for 2027. Planning for future decommissioning progressed in 2024, including engaging a range of stakeholders, undertaking engineering and science studies to understand decommissioning impacts, and developing plans for decommissioning scrap material recycling. Outside Australia, Woodside and partners continue to responsibly progress decommissioning obligations in line with relevant local regulatory environments. This includes ongoing work in Canada, at both the upstream Liard and Horn River basins and downstream Kitimat locations in British Columbia, and in the United States where two deepwater wells have been plugged and legacy site decommissioning is ongoing. Decommissioning of the Nganhurra RTM 36 WOODSIDE ENERGY GROUP LTD

DEVELOPMENTS AND EXPL OR A TION Through targeted opportunities and strategic partnerships we are building a quality, diversified portfolio for long-term success. 37
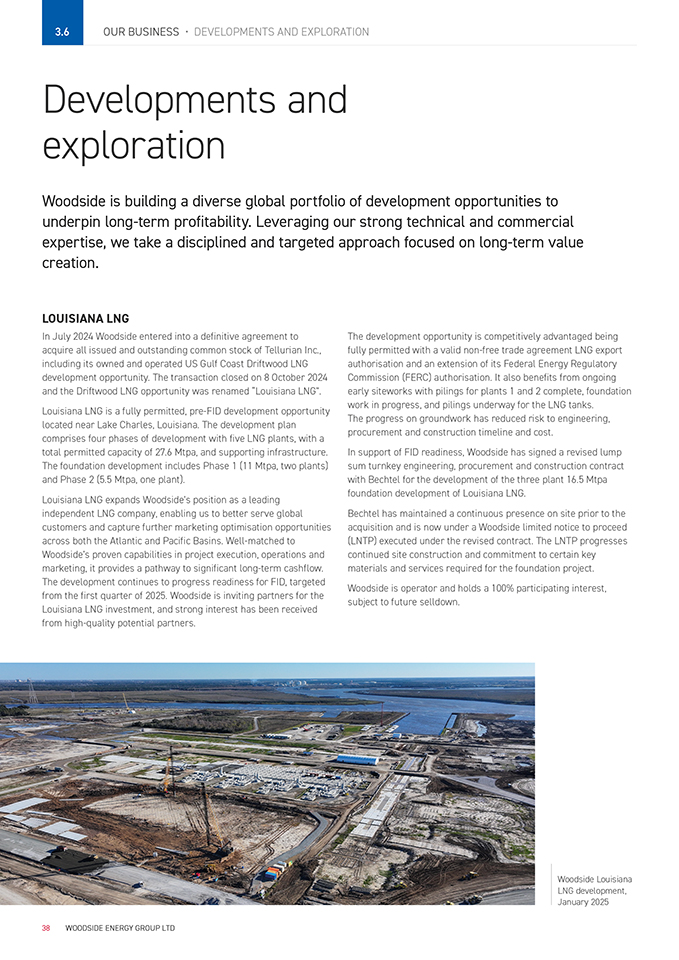
3.6 OUR BUSINESS • DEVELOPMENTS AND EXPLORATION Developments and exploration Woodside is building a diverse global portfolio of development opportunities to underpin long-term profitability. Leveraging our strong technical and commercial expertise, we take a disciplined and targeted approach focused on long-term value creation. LOUISIANA LNG In July 2024 Woodside entered into a definitive agreement to acquire all issued and outstanding common stock of Tellurian Inc., including its owned and operated US Gulf Coast Driftwood LNG development opportunity. The transaction closed on 8 October 2024 and the Driftwood LNG opportunity was renamed “Louisiana LNG”. Louisiana LNG is a fully permitted, pre-FID development opportunity located near Lake Charles, Louisiana. The development plan comprises four phases of development with five LNG plants, with a total permitted capacity of 27.6 Mtpa, and supporting infrastructure. The foundation development includes Phase 1 (11 Mtpa, two plants) and Phase 2 (5.5 Mtpa, one plant). Louisiana LNG expands Woodside’s position as a leading independent LNG company, enabling us to better serve global customers and capture further marketing optimisation opportunities across both the Atlantic and Pacific Basins. Well-matched to Woodside’s proven capabilities in project execution, operations and marketing, it provides a pathway to significant long-term cashflow. The development continues to progress readiness for FID, targeted from the first quarter of 2025. Woodside is inviting partners for the Louisiana LNG investment, and strong interest has been received from high-quality potential partners. The development opportunity is competitively advantaged being fully permitted with a valid non-free trade agreement LNG export authorisation and an extension of its Federal Energy Regulatory Commission (FERC) authorisation. It also benefits from ongoing early siteworks with pilings for plants 1 and 2 complete, foundation work in progress, and pilings underway for the LNG tanks. The progress on groundwork has reduced risk to engineering, procurement and construction timeline and cost. In support of FID readiness, Woodside has signed a revised lump sum turnkey engineering, procurement and construction contract with Bechtel for the development of the three plant 16.5 Mtpa foundation development of Louisiana LNG. Bechtel has maintained a continuous presence on site prior to the acquisition and is now under a Woodside limited notice to proceed (LNTP) executed under the revised contract. The LNTP progresses continued site construction and commitment to certain key materials and services required for the foundation project. Woodside is operator and holds a 100% participating interest, subject to future selldown. 38 WOODSIDE ENERGY GROUP LTD
Woodside Louisiana LNG development, January 2025 BROWSE The Browse to NWS Project involves the proposed development of the Calliance, Brecknock and Torosa gas and condensate fields in the offshore Browse Basin, located approximately 425 km north of Broome, Western Australia. The proposed concept includes two FPSO facilities and an approximately 900 km pipeline to existing infrastructure at the NWS Project’s KGP. The Browse to NWS Project aligns with key policy statements of both the Western Australian and Federal Governments which recognise the pivotal role of natural gas in Australia to 2050 and beyond. This could support domestic gas security for Western Australia at a time when there are forecast supply shortfalls. In December 2024, Woodside entered into an asset swap with Chevron for its interest in the NWS Project. This transaction which will simplify the NWS Joint Venture ownership and is expected to improve the Joint Venture alignment across the Browse to NWS Project.1 Key work activities continued during 2024 in support of progress towards FEED entry, including optimising the development concept to improve cost and schedule certainty, engagement with regulators on environmental and regulatory approvals and progressing commercial agreements. The development concept includes a CCS component, the Browse CCS Project, which is designed to sequester the majority of Browse reservoir CO2. In June 2024, a declaration of an identified greenhouse gas storage formation was made by the Australian Commonwealth Government over the Calliance storage formation within the G-8-AP greenhouse gas assessment permit. Woodside subsequently referred the Browse CCS Project to the environmental regulator for assessment. Woodside is operator and holds a 30.6% participating interest. CALYPSO Calypso is a proposed deepwater gas development in Trinidad and Tobago, located approximately 220 km off the coast of Trinidad in 2,100 m water depth. It involves the development of several gas discoveries in Block 23(a) and Block TTDAA 14. The development is located in a region with existing offshore and onshore infrastructure and a favourable demand outlook. In 2024, progress was made to mature the technical definition of the development concept. Fiscal negotiations advanced with the Government of Trinidad and Tobago and commercial discussions continued with key stakeholders to evaluate options to monetise the resource. Woodside is operator and holds a 70% participating interest. GREATER SUNRISE The Sunrise development comprises the Sunrise and Troubadour gas and condensate fields, which are located approximately 450 km North West of Darwin, Australia and 150 km south of Timor-Leste. In 2024, the Sunrise Joint Venture participants made progress with the Australian and Timor-Leste Governments on negotiating a new Production Sharing Contract, Petroleum Mining Code and fiscal regime. The Sunrise Joint Venture also completed a Concept Study Report, which incorporates previous work related to Sunrise by utilising the latest technologies (where relevant) and cost estimates, while considering the socio-economic, capacity building, safety, environmental, strategic and security benefits across potential development pathways. The Sunrise Joint Venture participants are reviewing the outcomes of the Concept Study Report and discussing next steps. Woodside is operator and holds a 33.44% participating interest. LIARD Liard is an unconventional gas field located in British Columbia Canada. Woodside is working with the operator, to develop a comprehensive strategy for full field development. Woodside is also working with its partners in Rockies LNG to potentially export LNG via the proposed Ksi Lisims project on the west coast of Canada. Woodside holds a 50% non-operating participating interest. EXPLORATION Woodside’s exploration strategy is focused on accessing and testing potential value accretive growth options with the potential to be developed at pace. The strategy balances a focus on exploring near current producing hubs with opportunities in new regions. In Australia, Woodside was awarded exploration permit WA-554-P. In the United States, Woodside was awarded 18 leases in Lease Sale 261 and participated in the drilling of the Corvus well (non- operated), which did not encounter commercial quantities of hydrocarbons. Woodside acquired new interests in the Nile Delta offshore Egypt and completed the Khendjer well (non-operated), which did not encounter hydrocarbons. In the Republic of the Congo, Woodside completed the unsuccessful Niamou well (non-operated). Woodside continued to optimise its exploration portfolio, exiting blocks no longer considered prospective. This included exiting the exploration acreage associated with Rufisque Offshore, Sangomar Offshore, and Sangomar Deep Offshore in Senegal, and initiating exit activities in Barbados and Red Sea Block 3 and Block 4 in Egypt. 1. Completion of the transaction is subject to customary conditions precedent, refer to section 3.1—Australian operations for details. 2024 ANNUAL REPORT 39
NEW ENERG Y OPPOR TUNITIES As the energy transition progresses we will continue to deliver affordable, reliable energy and progress lower-carbon projects. 40
3.7 OUR BUSINESS • NEW ENERGY OPPORTUNITIES New energy opportunities Complementing our investment in Beaumont New Ammonia and its potential to deliver future growth and value, Woodside is investing in new energy products and lower-carbon services to enable our base business and help our new and existing customers decarbonise. We take a disciplined approach to new investments that seeks to match the pace, scale and needs of our customers as they determine their own decarbonisation pathways. UNITED STATES Beaumont New Ammonia In September 2024, Woodside completed the acquisition of OCI’s Clean Ammonia Project in Beaumont, Texas. Beaumont New Ammonia is Woodside’s biggest investment in new energy1 and positions Woodside to be an early mover in the lower-carbon ammonia industry and meet growing global demand. First ammonia production is targeted for the second half of 2025 and lower-carbon ammonia production targeted for the second half of 2026.2 The acquisition represents a material step towards achieving our new energy and lower-carbon investment and abatement targets.3,4 Once in production, the project will be well placed to serve the US domestic market as well as European and Asia Pacific markets which are expected to lead adoption of lower-carbon ammonia due to increasing carbon cost requirements and stricter regulations. The configuration of the project means it has the potential to attract premium pricing when compared to conventional ammonia producers. H2OK H2OK is a proposed liquid hydrogen project to be located in Ardmore, Oklahoma, and is expected to produce up to 60 tonnes per day of liquid hydrogen by electrolysis. Woodside continues to take a disciplined approach to H2OK and has made a strategic decision to delay FID, prioritising Beaumont New Ammonia. Work will continue on improving project competitiveness, securing offtake and understanding the impacts of policy updates. Woodside is reviewing the final 45V Clean Hydrogen Production Tax Credit regulations released by the US Department of Treasury. Woodside is operator and holds a 100% participating interest. AUSTRALIA H2Perth H2Perth is a proposed liquid hydrogen production facility to be located in Perth, Western Australia. In 2024, Woodside changed the H2Perth concept from hydrogen and ammonia production to liquid hydrogen only, following feedback from potential customers. Woodside signed a conditional offtake term sheet in 2024 with Keppel for the supply and purchase of liquid hydrogen, aimed at powering Keppel’s data centre facilities in Singapore. The sources of liquid hydrogen would include Woodside’s proposed production facilities, including H2Perth. Woodside is operator and holds a 100% participating interest. Hydrogen Refueller @H2Perth The Hydrogen Refueller @H2Perth is a self-contained hydrogen production, storage and refuelling station located in Perth, Western Australia. In 2024, all primary environmental approvals were secured for the project. Woodside awarded the major services contract which includes detailed engineering, construction, commissioning, and startup work scopes to enable progression towards being ready for startup. The project has received funding from the Hydrogen Fuelled Transport Project Funding Process as part of the Western Australian Government’s Renewable Hydrogen Strategy. Woodside is operator and holds a 100% participating interest. NeoSmelt The NeoSmelt project is a proposed direct reduced iron electric smelting furnace pilot plant to be located in Perth, Western Australia. Woodside will join BHP, Rio Tinto, and BlueScope as part of the NeoSmelt project and as energy supplier subject to finalising commercial arrangements.5 1. Cumulative spend against the investment target at the end of 2024 includes 80% of the total $2,350 million for the Beaumont New Ammonia Project acquisition. The remaining 20% will be paid at Project completion 2. Production of lower-carbon ammonia is conditional on supply of carbon abated hydrogen and ExxonMobil’s CCS facility becoming operational. 3. Scope 3 emissions abatement capacity of 1.6 Mtpa CO2-e assumes supply of carbon abated hydrogen and CCS operational for phase 1 of the Beaumont New Ammonia project. Woodside has made the assumption to estimate the avoided emissions through the displacement of conventional marine fuel. Actual displaced emissions may differ based on actual use case. 4. Scope 3 targets are subject to commercial arrangements, commercial feasibility, regulatory and Joint Venture approvals, and third-party activities (which may or may not proceed). Individual investment decisions are subject to Woodside’s investment targets. Not guidance. Potentially includes both organic and inorganic investment. 5. Energy supply may include hydrogen, natural gas and electricity. 2024 ANNUAL REPORT 41
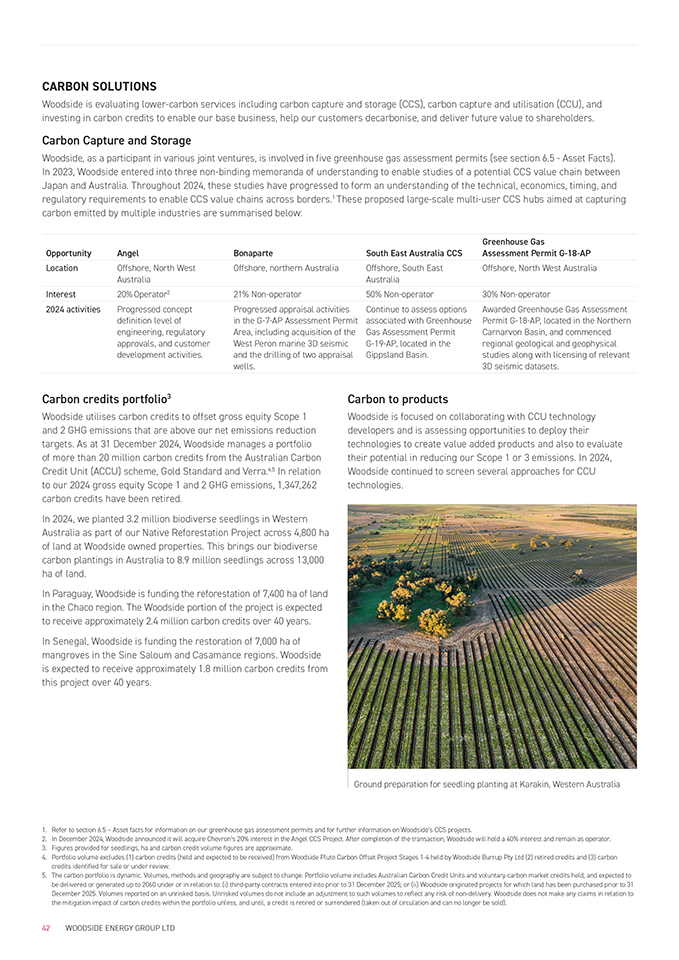
CARBON SOLUTIONS Woodside is evaluating lower-carbon services including carbon capture and storage (CCS), carbon capture and utilisation (CCU), and investing in carbon credits to enable our base business, help our customers decarbonise, and deliver future value to shareholders. Carbon Capture and Storage Woodside, as a participant in various joint ventures, is involved in five greenhouse gas assessment permits (see section 6.5—Asset Facts). In 2023, Woodside entered into three non-binding memoranda of understanding to enable studies of a potential CCS value chain between Japan and Australia. Throughout 2024, these studies have progressed to form an understanding of the technical, economics, timing, and regulatory requirements to enable CCS value chains across borders.1 These proposed large-scale multi-user CCS hubs aimed at capturing carbon emitted by multiple industries are summarised below: Opportunity Angel Bonaparte South East Australia CCSGreenhouse Gas Assessment Permit G-18-AP Location Offshore, North West Offshore, northern AustraliaOffshore, South EastOffshore, North West Australia Australia Australia Interest 20% Operator2 21% Non-operator50% Non-operator30% Non-operator 2024 activities Progressed concept Progressed appraisal activitiesContinue to assess optionsAwarded Greenhouse Gas Assessment definition level of in the G-7-AP Assessment Permit associated with GreenhousePermit G-18-AP, located in the Northern engineering, regulatory Area, including acquisition of the Gas Assessment PermitCarnarvon Basin, and commenced approvals, and customer West Peron marine 3D seismic G-19-AP, located in theregional geological and geophysical development activities. and the drilling of two appraisal Gippsland Basin.studies along with licensing of relevant wells. 3D seismic datasets. Carbon credits portfolio3 Woodside utilises carbon credits to offset gross equity Scope 1 and 2 GHG emissions that are above our net emissions reduction targets. As at 31 December 2024, Woodside manages a portfolio of more than 20 million carbon credits from the Australian Carbon Credit Unit (ACCU) scheme, Gold Standard and Verra.4,5 In relation to our 2024 gross equity Scope 1 and 2 GHG emissions, 1,347,262 carbon credits have been retired. In 2024, we planted 3.2 million biodiverse seedlings in Western Australia as part of our Native Reforestation Project across 4,800 ha of land at Woodside owned properties. This brings our biodiverse carbon plantings in Australia to 8.9 million seedlings across 13,000 ha of land. In Paraguay, Woodside is funding the reforestation of 7,400 ha of land in the Chaco region. The Woodside portion of the project is expected to receive approximately 2.4 million carbon credits over 40 years. In Senegal, Woodside is funding the restoration of 7,000 ha of mangroves in the Sine Saloum and Casamance regions. Woodside is expected to receive approximately 1.8 million carbon credits from this project over 40 years. Carbon to products Woodside is focused on collaborating with CCU technology developers and is assessing opportunities to deploy their technologies to create value added products and also to evaluate their potential in reducing our Scope 1 or 3 emissions. In 2024, Woodside continued to screen several approaches for CCU technologies. Ground preparation for seedling planting at Karakin, Western Australia 1. Refer to section 6.5 – Asset facts for information on our greenhouse gas assessment permits and for further information on Woodside’s CCS projects. 2. In December 2024, Woodside announced it will acquire Chevron’s 20% interest in the Angel CCS Project. After completion of the transaction, Woodside will hold a 40% interest and remain as operator. 3. Figures provided for seedlings, ha and carbon credit volume figures are approximate. 4. Portfolio volume excludes (1) carbon credits (held and expected to be received) from Woodside Pluto Carbon Offset Project Stages 1-4 held by Woodside Burrup Pty Ltd (2) retired credits and (3) carbon credits identified for sale or under review. 5. The carbon portfolio is dynamic. Volumes, methods and geography are subject to change. Portfolio volume includes Australian Carbon Credit Units and voluntary carbon market credits held, and expected to be delivered or generated up to 2060 under or in relation to: (i) third-party contracts entered into prior to 31 December 2025; or (ii) Woodside originated projects for which land has been purchased prior to 31 December 2025. Volumes reported on an unrisked basis. Unrisked volumes do not include an adjustment to such volumes to reflect any risk of non-delivery. Woodside does not make any claims in relation to the mitigation impact of carbon credits within the portfolio unless, and until, a credit is retired or surrendered (taken out of circulation and can no longer be sold). 42 WOODSIDE ENERGY GROUP LTD
SUSTAINABILITY REPORT Conducting our business sustainably underpins our strategy to thrive through the energy transition. 43
3.8 OUR BUSINESS • SUSTAINABILITY REPORT Sustainability Report We are in an exciting period for Woodside, as we expand and evolve our business to continue providing reliable, affordable and lower-carbon energy through the energy transition. In the past year, we have continued our track record of operational excellence, financial discipline and project execution that is fundamental to our business success. We have also made transformative acquisitions that provide the foundation for Woodside’s next chapter of growth and value. Underpinning all of these achievements is Woodside’s sustainability performance, which remains woven into all aspects of our business. With this in mind, the Sustainability Committee (Committee) plays a critical role in Woodside’s business strategy and performance by supporting the Board’s oversight of sustainability topics, identifying priorities and reviewing Woodside’s policies and performance, while seeking internal and external advice and expertise. Core sustainability topics such as safety and climate change are on the agenda at every Committee meeting, reflecting Directors’ recognition of the importance of these issues to creating long-term value for shareholders. The Committee also has a structured process to systematically identify, review and assess other material sustainability risks and opportunities including First Nations communities and cultural heritage, environment and biodiversity, and a wide range of other current and emerging environmental, social and governance topics. This report provides updates on our most material topics and is supported by more detail and additional topics on our website. I encourage you to read this information, and we welcome your feedback as Woodside seeks continuous improvement in these areas. Safety remains our highest priority, and everyone who works at Woodside should expect to go home safely. In 2024, we renewed efforts to strengthen our safety culture, simplify our processes and improve our systems. We are seeing early results from these efforts, but we must remain vigilant and strive for further improvement. Ann Pickard Climate change, and the way that the world responds to it, creates both risks and opportunities for Woodside. It is no surprise that on such a complex topic there is a wide range of divergent views in the community, including among our shareholders. The vote on our Climate Transition Action Plan at our 2024 AGM was disappointing and is taken seriously by every Director. We continue to listen and engage with investors as we take forward a considered, pragmatic and action-oriented climate strategy for our shareholders. We have also taken steps to further increase our transparency on this topic, by issuing a separate report that describes our systematic approach to investor engagement, the issues raised by investors, and the continued evolution of our climate strategy in recent years. A key role of the Committee is to monitor the development of sustainability reporting standards, including those recommended by the International Financial Reporting Standards Foundation’s International Sustainability Standards Board, and those adopted by the Australian Accounting Standards Board with effect from 1 January 2025. We look forward to the development of standardised approaches to sustainability reporting which should enable consistent and comparable assessment of company performance. We have structured this Sustainability Report and included it within our Annual Report, in part to anticipate the changes that these reporting standards will bring. I am proud of Woodside’s contribution as a responsible supplier of energy as societies pursue prosperity, positive environmental outcomes and climate goals. For Woodside to continue playing this role through the energy transition, our sustainability performance has never been more important. With my fellow Directors, I am fully committed to maintaining our strong governance in the years ahead. Ann Pickard Chair of the Sustainability Committee 25 February 2025 44 WOODSIDE ENERGY GROUP LTD
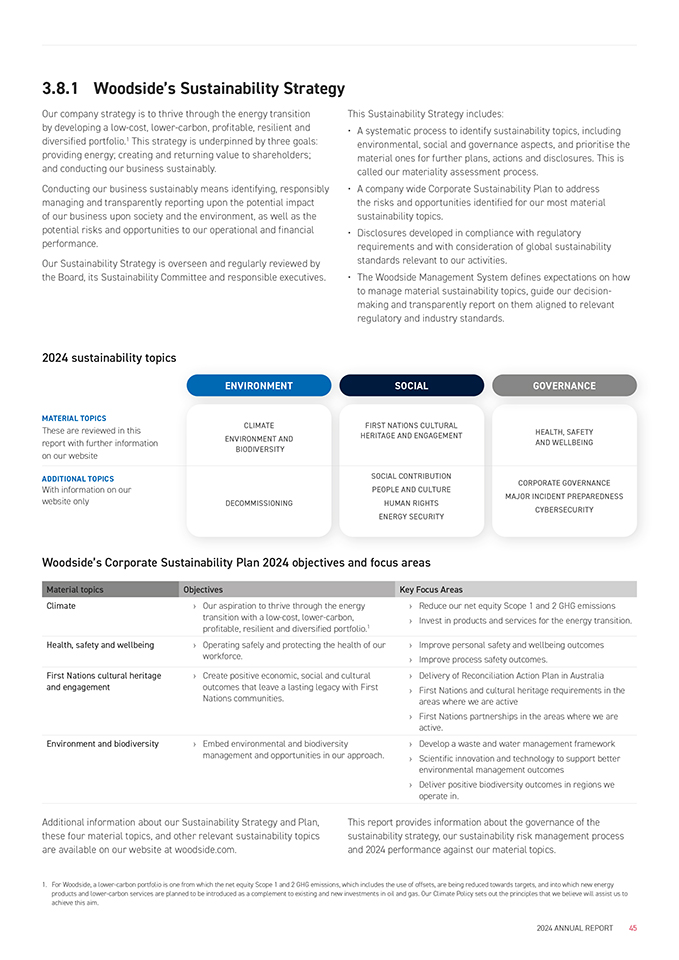
3.8.1 Woodside’s Sustainability Strategy Our company strategy is to thrive through the energy transition by developing a low-cost, lower-carbon, profitable, resilient and diversified portfolio.1 This strategy is underpinned by three goals: providing energy; creating and returning value to shareholders; and conducting our business sustainably. Conducting our business sustainably means identifying, responsibly managing and transparently reporting upon the potential impact of our business upon society and the environment, as well as the potential risks and opportunities to our operational and financial performance. Our Sustainability Strategy is overseen and regularly reviewed by the Board, its Sustainability Committee and responsible executives. This Sustainability Strategy includes: • A systematic process to identify sustainability topics, including environmental, social and governance aspects, and prioritise the material ones for further plans, actions and disclosures. This is called our materiality assessment process. • A company wide Corporate Sustainability Plan to address the risks and opportunities identified for our most material sustainability topics. • Disclosures developed in compliance with regulatory requirements and with consideration of global sustainability standards relevant to our activities. • The Woodside Management System defines expectations on how to manage material sustainability topics, guide our decision- making and transparently report on them aligned to relevant regulatory and industry standards. 2024 sustainability topics ENVIRONMENT SOCIAL GOVERNANCE MATERIAL TOPICS These are reviewed in this report with further information on our website ADDITIONAL TOPICS With information on our website only CLIMATE ENVIRONMENT AND BIODIVERSITY DECOMMISSIONING FIRST NATIONS CULTURAL HERITAGE AND ENGAGEMENT SOCIAL CONTRIBUTION PEOPLE AND CULTURE HUMAN RIGHTS ENERGY SECURITY HEALTH, SAFETY AND WELLBEING CORPORATE GOVERNANCE MAJOR INCIDENT PREPAREDNESS CYBERSECURITY Woodside’s Corporate Sustainability Plan 2024 objectives and focus areas Material topicsObjectivesKey Focus Areas Climate› Our aspiration to thrive through the energy transition with a low-cost, lower-carbon, profitable, resilient and diversified portfolio.1 Health, safety and wellbeing› Operating safely and protecting the health of our workforce. › Reduce our net equity Scope 1 and 2 GHG emissions › Invest in products and services for the energy transition. › Improve personal safety and wellbeing outcomes › Improve process safety outcomes. First Nations cultural heritage and engagement › Create positive economic, social and cultural outcomes that leave a lasting legacy with First Nations communities. › Delivery of Reconciliation Action Plan in Australia › First Nations and cultural heritage requirements in the areas where we are active › First Nations partnerships in the areas where we are active. Environment and biodiversity› Embed environmental and biodiversity management and opportunities in our approach. › Develop a waste and water management framework › Scientific innovation and technology to support better environmental management outcomes › Deliver positive biodiversity outcomes in regions we operate in. Additional information about our Sustainability Strategy and Plan, these four material topics, and other relevant sustainability topics are available on our website at woodside.com. This report provides information about the governance of the sustainability strategy, our sustainability risk management process and 2024 performance against our material topics. 1. For Woodside, a lower-carbon portfolio is one from which the net equity Scope 1 and 2 GHG emissions, which includes the use of offsets, are being reduced towards targets, and into which new energy products and lower-carbon services are planned to be introduced as a complement to existing and new investments in oil and gas. Our Climate Policy sets out the principles that we believe will assist us to achieve this aim. 2024 ANNUAL REPORT 45
3.8.2 Governance This section of the Sustainability Report provides information about Woodside’s governance of sustainability-related risks and opportunities. This includes the Board’s oversight of them and management’s role in assessing and managing them. Board oversight The Board oversees and considers recommendations from the Sustainability Committee on the Company’s policy and performance in relation to health, safety, process safety, the environment, climate change, human rights, heritage and land access, security and emergency management and community relations. This includes approving relevant sustainability-related targets, monitoring performance against them, and approving recommendations from the Human Resources & Compensation Committee about the inclusion of sustainability-related metrics in executive remuneration. Board composition The Non-Executive Directors contribute diverse operational and international experience, an understanding of the industry in which Woodside operates, knowledge of financial markets, decarbonisation technologies and strategies, and an understanding of the health, safety, environmental, community and other sustainability-related matters that are important to Woodside. The Board supplements its sustainability awareness by seeking the input of executives, external advisers and specialists to further inform its decisions. Changes to the membership of Woodside’s Board of Directors are part of the continuous review of Board skills and composition. Changes are intended to enhance Woodside’s Board and Committees so that they are best placed to support Woodside’s global operations and strategic growth opportunities through the energy transition. Further information on Board skills and composition is included in the Corporate Governance Statement in section 4.1 of this report. Board skills The competencies and skills of the Directors are set out in the competencies matrix set out in the Corporate Governance Statement. The Director competencies matrix includes energy transition and climate-related components to reflect the increasing importance of these issues to Woodside’s operations. The Board uses this competencies matrix to assess the skills and experience of each Director and the combined capabilities of the Board, to identify potential areas of focus for Director recruitment and to identify any professional development opportunities that may benefit Directors. Board committees The Board has four standing committees to assist in the discharge of its responsibilities, including on sustainability-related matters. The Sustainability Committee’s responsibilities include reviewing, and making recommendations to the Board on the company’s policy and performance in relation to sustainability-related matters. This includes oversight of material sustainability-related risks and opportunities; reviewing and monitoring compliance with applicable sustainability- related laws and regulations; and reviewing and recommending to the Board for approval material public sustainability-related targets and monitoring progress against those targets. The Audit & Risk Committee assists the Board to meet its oversight responsibilities in relation to the company’s financial reporting, compliance with legal and regulatory requirements, internal control structure, risk management and insurance procedures and the internal and external audit functions. Given the importance of sustainability-related risks and opportunities to Woodside, and potential implications relating to financial reporting, they are considered by the Audit & Risk Committee during the review of the Company’s risk management framework. The Committee also considers the inclusion of sustainability-related risks within Woodside’s internal audit program and the appropriateness of disclosures on climate-related risk within the consolidated Financial Statements. The Nominations & Governance Committee assists the Board with reviewing Board composition, performance and succession planning. This includes identifying, evaluating and recommending candidates for the Board, taking into account the factors set out in the Director competencies matrix in section 4.1 of this report. The Human Resources & Compensation Committee assists the Board with establishing human resources and compensation policies and practices. Performance based remuneration for the CEO, senior leadership team and all other permanent employees include metrics related to climate and health and safety. Further details are provided in the Remuneration Report in section 4.3 of this report. Sustainability-related Board discussions A structured calendar provides the Board and its relevant Committees with regular scheduled updates on the four material topics outlined in section 3.8.1 and other sustainability topics as appropriate. Information is presented by management, external advisers or third party specialists where appropriate. Examples of topics considered by the Board and its relevant Committees in 2024 include: • An annual Major Incident Prevention update which informs Directors how potential process safety related risks are being managed • Sustainability-related aspects of the investment decisions to acquire Louisiana LNG and the Beaumont New Ammonia Project • Investor feedback on Board composition, Remuneration Report, climate disclosures and other topics • Performance against net equity Scope 1 and 2 GHG emissions targets and the progress of emissions reduction initiatives • Energy markets and the energy transition • Performance against the targets in Woodside’s Reconciliation Action Plan • Developments in international policy, including insights from the COP29 climate summit in Baku, Azerbaijan and the COP16 biodiversity summit in Cali, Columbia • Developments in sustainability reporting frameworks, including the International Sustainability Standards Board (ISSB), the Taskforce on Nature-related Financial Disclosures (TNFD), Australian mandatory climate reporting standards, and European and United States current and proposed requirements. 46 WOODSIDE ENERGY GROUP LTD
CEO and Executive remuneration Executive remuneration is an important tool to reward management performance in line with company priorities, including sustainability. In 2024, safety and climate metrics were each a distinct component of Company Scorecard impacting Variable Annual Reward. Safety metrics make up 15% of the total scorecard to ensure a focus on our aim to prevent all injuries and the critical importance of effective process safety management and leadership to avoid major accident and environmental events. Climate metrics make up 15% of the total scorecard, and is based on gross Scope 1 and 2 GHG emissions performance and on new energy project progress.1,2 Individual key performance indicators (KPIs) may also be added to Executive performance agreements in accordance with their roles and responsibilities. Management accountabilities The Chief Executive Officer and Managing Director (CEO) is responsible for the implementation of strategy, including the Sustainability Strategy and Plan, and reports directly to the Board. The CEO is supported by the Executive Leadership Team. The position of Executive Vice President Sustainability, Policy and External Affairs reports directly to the CEO and is a member of the Executive Leadership Team. The Executive Leadership Team is informed about and monitors progress on sustainability matters by senior leaders through channels such as presentations and papers to the Executive Leadership Team, and by distribution of Board papers and other periodic updates. The strategic nature of sustainability-related topics means that many different groups have a role to play in the delivery of sustainability-related performance. Activities include: • Setting a capital allocation framework and investment decision making processes • Liaising with debt and equity investors, including on sustainability-related matters • Incorporating sustainability-related considerations, in particular climate and the energy transition, into development of company strategy • Defining technical company minimum standards • Preparing Asset Decarbonisation Plans • Building a portfolio of carbon credits which is subject to integrity due diligence • Preparing a Sustainability Plan for approval by the Board, including recommending targets • Monitoring and updating the Board on the Sustainability Strategy and the Sustainability Plan and related internal and external developments • Designing company-wide processes to assist business delivery (e.g. integrated emissions accounting and forecasting). Accessing global knowledge Woodside management supplements its knowledge and expertise by joining and/or engaging with external organisations. This helps to ensure that management is aware of emerging trends and developments, including in jurisdictions where we do not have a direct operational footprint, and can learn from the experience of others. In 2024, Woodside engaged with organisations including Ipieca, the global oil and gas association dedicated to advancing environmental and social performance across the energy transition, including its Climate Change, Social, and Environment committees. Woodside is also a member of the International Association of Oil & Gas Producers (IOGP). Woodside participates in IOGP’s standing committees and expert working groups, and utilises industry accepted metrics and standards where possible, particularly in the areas of health and safety, which enables sharing of best practice and benchmarking. We are also members of a number of other Australian and international industry associations and organisations. Further information about these is available on our website. Mandatory sustainability reporting requirements Woodside complies with regulatory requirements in jurisdictions that apply to our activities. We also monitor the development of global sustainability reporting standards, relevant to our activities around the world. These include: • Australian Sustainability Reporting Standards issued by the Australian Accounting Standards Board (AASB), including the relevant climate standard (AASB S2) and sustainability standard (AASB S1) • European Corporate Sustainability Reporting Directive (CSRD) and its European Sustainability Reporting Standards (ESRS) including the Corporate Sustainability Due Diligence Directive (CSDDD) • International Financial Reporting Standards (IFRS) Foundation’s International Sustainable Standards Board (ISSB) recommended standards. As a calendar year reporter, Woodside will be required under the Corporations Act 2001 (Cth) to include further climate-related disclosures in the Sustainability Report which forms part of the 2025 Annual Report to be released in the first quarter of 2026, in compliance with AASB S2. We expect that Woodside will be amongst the first companies in Australia to report in accordance with the new standards. 1. Gross equity emissions are calculated prior to retirement of carbon credits as offsets, focusing the organisational priorities on avoiding and reducing emissions. 2. New energy project progress (which includes new energy products and lower-carbon services) is subject to commercial arrangements, commercial feasibility, regulatory and joint venture approvals, and third party activities (which may or may not proceed). Individual investment decisions are subject to Woodside’s investment targets. Not guidance. Potentially includes both organic and inorganic investment. 2024 ANNUAL REPORT 47
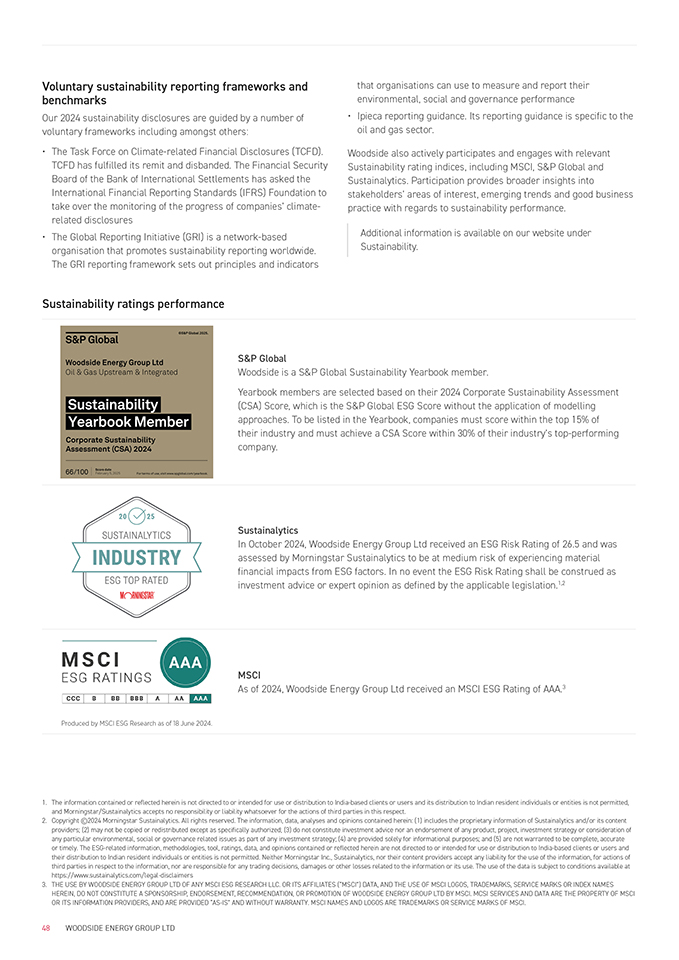
Voluntary sustainability reporting frameworks and benchmarks Our 2024 sustainability disclosures are guided by a number of voluntary frameworks including amongst others: • The Task Force on Climate-related Financial Disclosures (TCFD). TCFD has fulfilled its remit and disbanded. The Financial Security Board of the Bank of International Settlements has asked the International Financial Reporting Standards (IFRS) Foundation to take over the monitoring of the progress of companies’ climate- related disclosures • The Global Reporting Initiative (GRI) is a network-based organisation that promotes sustainability reporting worldwide. The GRI reporting framework sets out principles and indicators that organisations can use to measure and report their environmental, social and governance performance • Ipieca reporting guidance. Its reporting guidance is specific to the oil and gas sector. Woodside also actively participates and engages with relevant Sustainability rating indices, including MSCI, S&P Global and Sustainalytics. Participation provides broader insights into stakeholders’ areas of interest, emerging trends and good business practice with regards to sustainability performance. Additional information is available on our website under Sustainability. Sustainability ratings performance Produced by MSCI ESG Research as of 18 June 2024. S&P Global Woodside is a S&P Global Sustainability Yearbook member. Yearbook members are selected based on their 2024 Corporate Sustainability Assessment (CSA) Score, which is the S&P Global ESG Score without the application of modelling approaches. To be listed in the Yearbook, companies must score within the top 15% of their industry and must achieve a CSA Score within 30% of their industry’s top-performing company. Sustainalytics In October 2024, Woodside Energy Group Ltd received an ESG Risk Rating of 26.5 and was assessed by Morningstar Sustainalytics to be at medium risk of experiencing material financial impacts from ESG factors. In no event the ESG Risk Rating shall be construed as investment advice or expert opinion as defined by the applicable legislation.1,2 MSCI As of 2024, Woodside Energy Group Ltd received an MSCI ESG Rating of AAA.3 1. The information contained or reflected herein is not directed to or intended for use or distribution to India-based clients or users and its distribution to Indian resident individuals or entities is not permitted, and Morningstar/Sustainalytics accepts no responsibility or liability whatsoever for the actions of third parties in this respect. 2. Copyright ©2024 Morningstar Sustainalytics. All rights reserved. The information, data, analyses and opinions contained herein: (1) includes the proprietary information of Sustainalytics and/or its content providers; (2) may not be copied or redistributed except as specifically authorized; (3) do not constitute investment advice nor an endorsement of any product, project, investment strategy or consideration of any particular environmental, social or governance related issues as part of any investment strategy; (4) are provided solely for informational purposes; and (5) are not warranted to be complete, accurate or timely. The ESG-related information, methodologies, tool, ratings, data, and opinions contained or reflected herein are not directed to or intended for use or distribution to India-based clients or users and their distribution to Indian resident individuals or entities is not permitted. Neither Morningstar Inc., Sustainalytics, nor their content providers accept any liability for the use of the information, for actions of third parties in respect to the information, nor are responsible for any trading decisions, damages or other losses related to the information or its use. The use of the data is subject to conditions available at https://www.sustainalytics.com/legal-disclaimers 3. THE USE BY WOODSIDE ENERGY GROUP LTD OF ANY MSCI ESG RESEARCH LLC. OR ITS AFFILIATES (“MSCI”) DATA, AND THE USE OF MSCI LOGOS, TRADEMARKS, SERVICE MARKS OR INDEX NAMES HEREIN, DO NOT CONSTITUTE A SPONSORSHIP, ENDORSEMENT, RECOMMENDATION, OR PROMOTION OF WOODSIDE ENERGY GROUP LTD BY MSCI. MCSI SERVICES AND DATA ARE THE PROPERTY OF MSCI OR ITS INFORMATION PROVIDERS, AND ARE PROVIDED “AS-IS” AND WITHOUT WARRANTY. MSCI NAMES AND LOGOS ARE TRADEMARKS OR SERVICE MARKS OF MSCI. 48 WOODSIDE ENERGY GROUP LTD
3.8.3 Risk Management Risk management process Woodside’s risk management process is described in section 3.9—Risk Factors of this report. As a business, Woodside categorises its risks in three ways: • strategic (those within our sphere of influence that could affect our ability to achieve strategic objectives) • emerging (those capturing external threats or factors that have a high degree of uncertainty and are not readily controlled by Woodside) • current (those that could affect our ability to deliver our objectives). Woodside’s strategic risks align with several of its material sustainability topics. Risks categorised as ‘strategic’ are reviewed by the Board, its Audit & Risk Committee and the Executive Leadership Team at least twice a year, and the Board confirms its risk appetite in relation to each strategic risk. Management actions that need to be taken in order to address the risks are incorporated into Woodside’s internal management system. Materiality assessment process for sustainability topics Woodside also conducts a materiality assessment process which is aligned to our risk management process but has a specific focus on sustainability-related topics. It is intended to inform our understanding of which sustainability-related topics are most relevant to our business performance, activities and stakeholders. It considers potential risks, opportunities and impacts of sustainability topics on our business, the economy, the environment and upon people, including impacts on human rights. In the materiality assessment, management undertake analysis drawing upon internal and external inputs, including from our Executive Leadership Team and Directors and our monitoring of developments, trends and stakeholder views throughout the year. In addition, some specific engagements with stakeholders (such as investors, customers, communities, and governments) can help us to verify our analysis. When topics have been identified, they are prioritised. The highest priority topics are determined to be material.1 Following endorsement by the Executive and the Sustainability Committee, actions to address the material topics are included in a Corporate Sustainability Plan which is implemented and monitored by the Executive and the Sustainability Committee. Potential risks associated with the material topics are incorporated into the Woodside risk management process. Our materiality assessment process is also informed by Our Values which guide everything we do. Further information is available on our website under Sustainability. 1. For the purposes of Woodside’s 2024 sustainability disclosures we determine which topics are material we classify the topics into three categories of material, significant or important. For these purposes, ‘material topic’ means a 2024 sustainability topic described in this report, determined as part of the 2024 materiality assessment process undertaken by Woodside. From 2025, we will only classify which topics are material. Classification of any topic as material, significant or important should not be read as a determination of whether that topic may necessarily rise to the level of materiality of disclosures required by law, including the laws of Australia, and the United States.
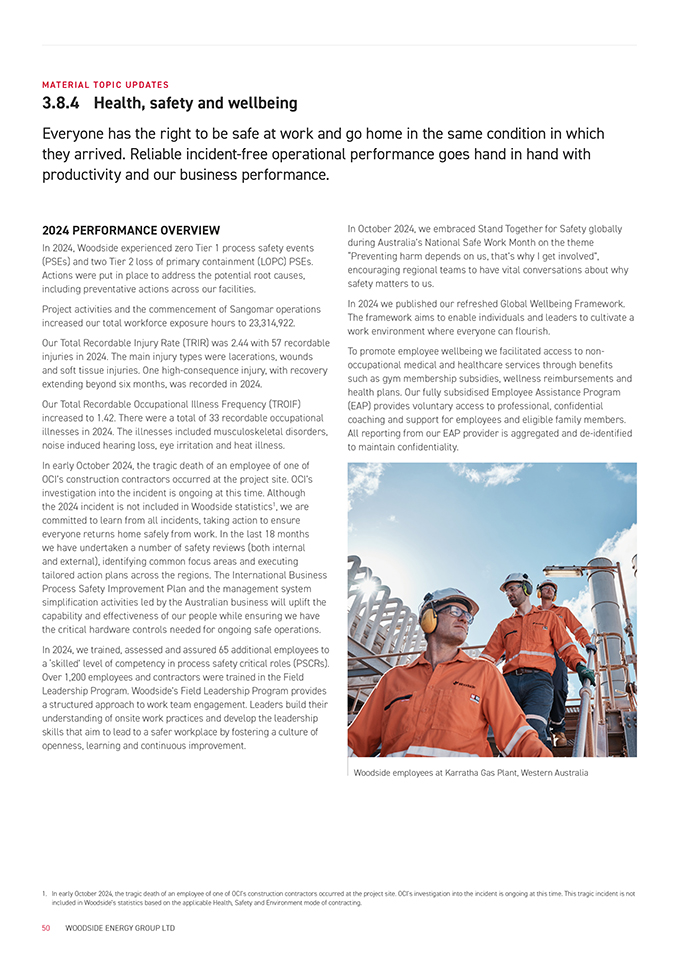
MATERIAL TOPIC UPDATES 3.8.4 Health, safety and wellbeing Everyone has the right to be safe at work and go home in the same condition in which they arrived. Reliable incident-free operational performance goes hand in hand with productivity and our business performance. 2024 PERFORMANCE OVERVIEW In 2024, Woodside experienced zero Tier 1 process safety events (PSEs) and two Tier 2 loss of primary containment (LOPC) PSEs. Actions were put in place to address the potential root causes, including preventative actions across our facilities. Project activities and the commencement of Sangomar operations increased our total workforce exposure hours to 23,314,922. Our Total Recordable Injury Rate (TRIR) was 2.44 with 57 recordable injuries in 2024. The main injury types were lacerations, wounds and soft tissue injuries. One high-consequence injury, with recovery extending beyond six months, was recorded in 2024. Our Total Recordable Occupational Illness Frequency (TROIF) increased to 1.42. There were a total of 33 recordable occupational illnesses in 2024. The illnesses included musculoskeletal disorders, noise induced hearing loss, eye irritation and heat illness. In early October 2024, the tragic death of an employee of one of OCI’s construction contractors occurred at the project site. OCI’s investigation into the incident is ongoing at this time. Although the 2024 incident is not included in Woodside statistics1, we are committed to learn from all incidents, taking action to ensure everyone returns home safely from work. In the last 18 months we have undertaken a number of safety reviews (both internal and external), identifying common focus areas and executing tailored action plans across the regions. The International Business Process Safety Improvement Plan and the management system simplification activities led by the Australian business will uplift the capability and effectiveness of our people while ensuring we have the critical hardware controls needed for ongoing safe operations. In 2024, we trained, assessed and assured 65 additional employees to a ‘skilled’ level of competency in process safety critical roles (PSCRs). Over 1,200 employees and contractors were trained in the Field Leadership Program. Woodside’s Field Leadership Program provides a structured approach to work team engagement. Leaders build their understanding of onsite work practices and develop the leadership skills that aim to lead to a safer workplace by fostering a culture of openness, learning and continuous improvement. In October 2024, we embraced Stand Together for Safety globally during Australia’s National Safe Work Month on the theme “Preventing harm depends on us, that’s why I get involved”, encouraging regional teams to have vital conversations about why safety matters to us. In 2024 we published our refreshed Global Wellbeing Framework. The framework aims to enable individuals and leaders to cultivate a work environment where everyone can flourish. To promote employee wellbeing we facilitated access to non- occupational medical and healthcare services through benefits such as gym membership subsidies, wellness reimbursements and health plans. Our fully subsidised Employee Assistance Program (EAP) provides voluntary access to professional, confidential coaching and support for employees and eligible family members. All reporting from our EAP provider is aggregated and de-identified to maintain confidentiality. Woodside employees at Karratha Gas Plant, Western Australia 1. In early October 2024, the tragic death of an employee of one of OCI’s construction contractors occurred at the project site. OCI’s investigation into the incident is ongoing at this time. This tragic incident is not included in Woodside’s statistics based on the applicable Health, Safety and Environment mode of contracting. 2024 ANNUAL REPORT49
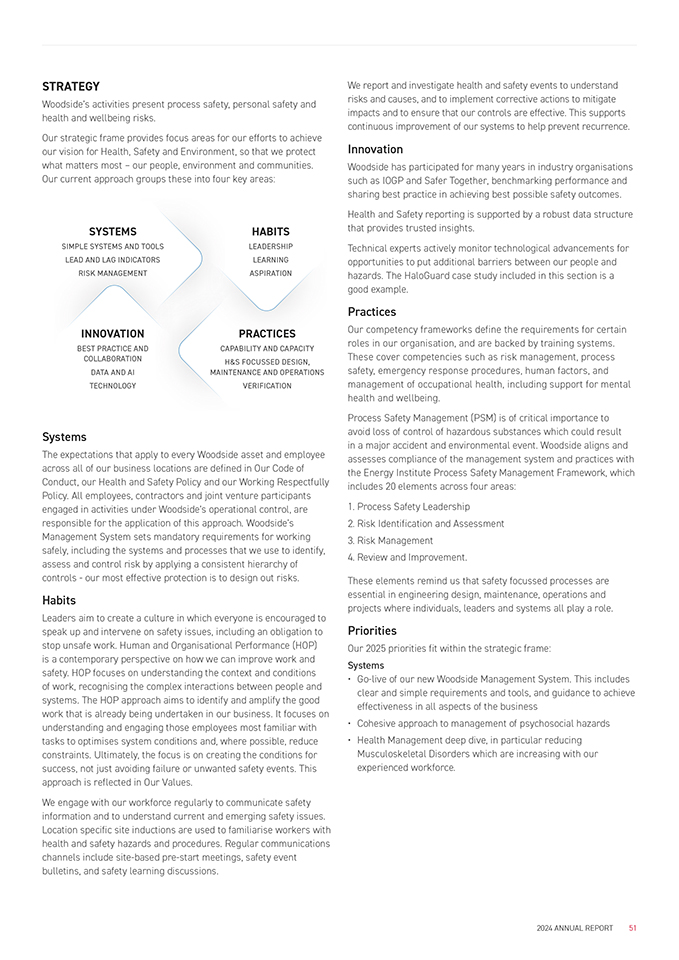
STRATEGY Woodside’s activities present process safety, personal safety and health and wellbeing risks. Our strategic frame provides focus areas for our efforts to achieve our vision for Health, Safety and Environment, so that we protect what matters most – our people, environment and communities. Our current approach groups these into four key areas: Systems The expectations that apply to every Woodside asset and employee across all of our business locations are defined in Our Code of Conduct, our Health and Safety Policy and our Working Respectfully Policy. All employees, contractors and joint venture participants engaged in activities under Woodside’s operational control, are responsible for the application of this approach. Woodside’s Management System sets mandatory requirements for working safely, including the systems and processes that we use to identify, assess and control risk by applying a consistent hierarchy of controls - our most effective protection is to design out risks. Habits Leaders aim to create a culture in which everyone is encouraged to speak up and intervene on safety issues, including an obligation to stop unsafe work. Human and Organisational Performance (HOP) is a contemporary perspective on how we can improve work and safety. HOP focuses on understanding the context and conditions of work, recognising the complex interactions between people and systems. The HOP approach aims to identify and amplify the good work that is already being undertaken in our business. It focuses on understanding and engaging those employees most familiar with tasks to optimises system conditions and, where possible, reduce constraints. Ultimately, the focus is on creating the conditions for success, not just avoiding failure or unwanted safety events. This approach is reflected in Our Values. We engage with our workforce regularly to communicate safety information and to understand current and emerging safety issues. Location specific site inductions are used to familiarise workers with health and safety hazards and procedures. Regular communications channels include site-based pre-start meetings, safety event bulletins, and safety learning discussions. We report and investigate health and safety events to understand risks and causes, and to implement corrective actions to mitigate impacts and to ensure that our controls are effective. This supports continuous improvement of our systems to help prevent recurrence. Innovation Woodside has participated for many years in industry organisations such as IOGP and Safer Together, benchmarking performance and sharing best practice in achieving best possible safety outcomes. Health and Safety reporting is supported by a robust data structure that provides trusted insights. Technical experts actively monitor technological advancements for opportunities to put additional barriers between our people and hazards. The HaloGuard case study included in this section is a good example. Practices Our competency frameworks define the requirements for certain roles in our organisation, and are backed by training systems. These cover competencies such as risk management, process safety, emergency response procedures, human factors, and management of occupational health, including support for mental health and wellbeing. Process Safety Management (PSM) is of critical importance to avoid loss of control of hazardous substances which could result in a major accident and environmental event. Woodside aligns and assesses compliance of the management system and practices with the Energy Institute Process Safety Management Framework, which includes 20 elements across four areas: 1. Process Safety Leadership 2. Risk Identification and Assessment 3. Risk Management 4. Review and Improvement. These elements remind us that safety focussed processes are essential in engineering design, maintenance, operations and projects where individuals, leaders and systems all play a role. Priorities Our 2025 priorities fit within the strategic frame: Systems • Go-live of our new Woodside Management System. This includes clear and simple requirements and tools, and guidance to achieve effectiveness in all aspects of the business • Cohesive approach to management of psychosocial hazards • Health Management deep dive, in particular reducing Musculoskeletal Disorders which are increasing with our experienced workforce. 2024 ANNUAL REPORT 51
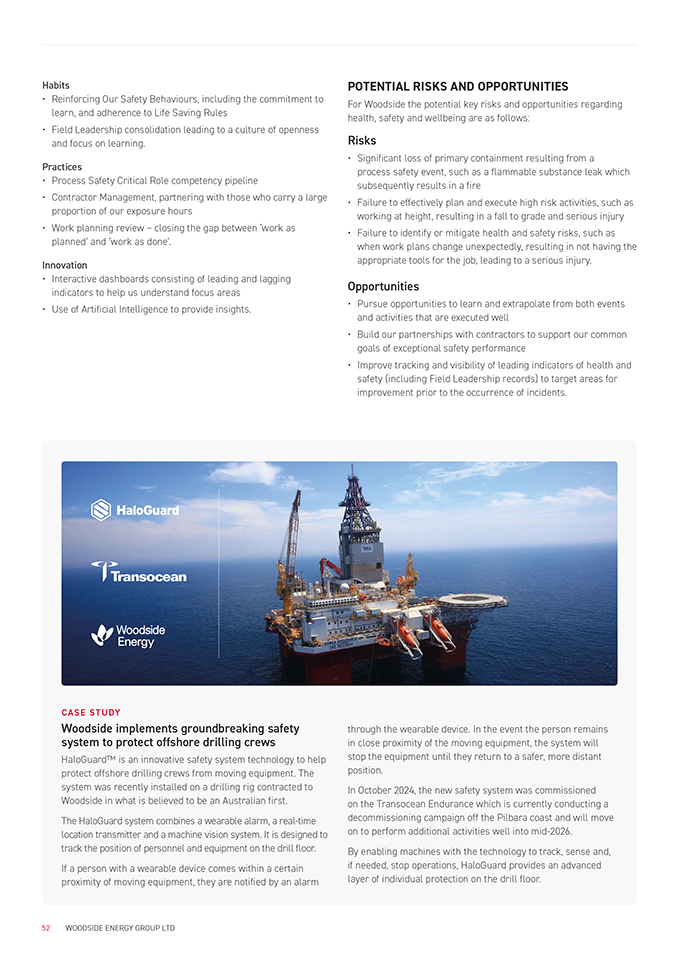
Habits • Reinforcing Our Safety Behaviours, including the commitment to learn, and adherence to Life Saving Rules • Field Leadership consolidation leading to a culture of openness and focus on learning. Practices • Process Safety Critical Role competency pipeline • Contractor Management, partnering with those who carry a large proportion of our exposure hours • Work planning review – closing the gap between ‘work as planned’ and ‘work as done’. Innovation • Interactive dashboards consisting of leading and lagging indicators to help us understand focus areas • Use of Artificial Intelligence to provide insights. POTENTIAL RISKS AND OPPORTUNITIES For Woodside the potential key risks and opportunities regarding health, safety and wellbeing are as follows: Risks • Significant loss of primary containment resulting from a process safety event, such as a flammable substance leak which subsequently results in a fire • Failure to effectively plan and execute high risk activities, such as working at height, resulting in a fall to grade and serious injury • Failure to identify or mitigate health and safety risks, such as when work plans change unexpectedly, resulting in not having the appropriate tools for the job, leading to a serious injury. Opportunities • Pursue opportunities to learn and extrapolate from both events and activities that are executed well • Build our partnerships with contractors to support our common goals of exceptional safety performance • Improve tracking and visibility of leading indicators of health and safety (including Field Leadership records) to target areas for improvement prior to the occurrence of incidents. C ASE S TUD Y Woodside implements groundbreaking safety system to protect offshore drilling crews HaloGuard™ is an innovative safety system technology to help protect offshore drilling crews from moving equipment. The system was recently installed on a drilling rig contracted to Woodside in what is believed to be an Australian first. The HaloGuard system combines a wearable alarm, a real-time location transmitter and a machine vision system. It is designed to track the position of personnel and equipment on the drill floor. If a person with a wearable device comes within a certain proximity of moving equipment, they are notified by an alarm through the wearable device. In the event the person remains in close proximity of the moving equipment, the system will stop the equipment until they return to a safer, more distant position. In October 2024, the new safety system was commissioned on the Transocean Endurance which is currently conducting a decommissioning campaign off the Pilbara coast and will move on to perform additional activities well into mid-2026. By enabling machines with the technology to track, sense and, if needed, stop operations, HaloGuard provides an advanced layer of individual protection on the drill floor. 52 WOODSIDE ENERGY GROUP LTD
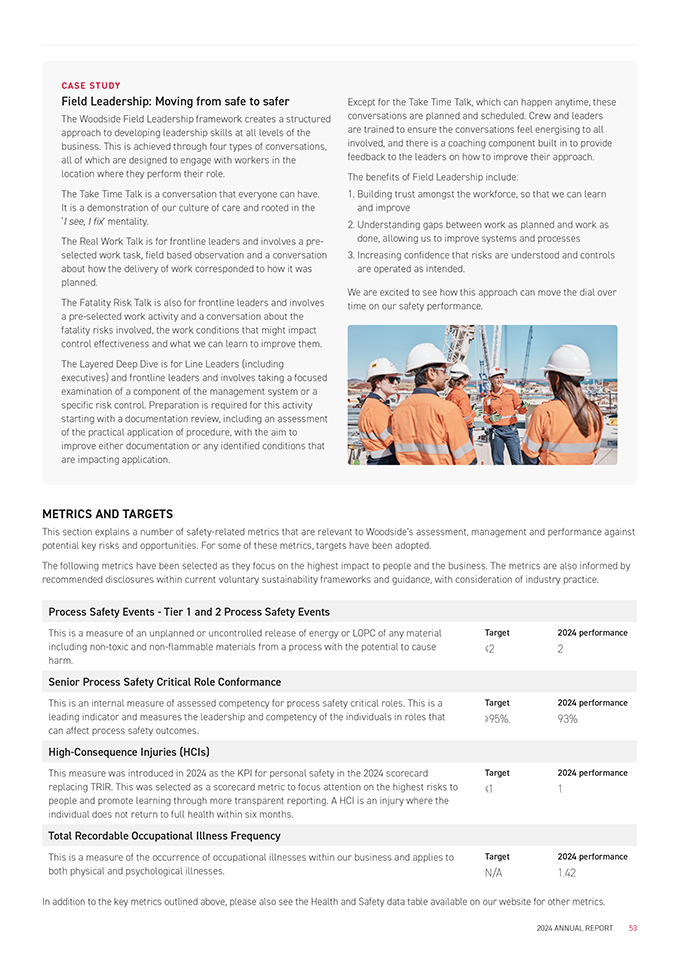
C ASE S TUD Y Field Leadership: Moving from safe to safer The Woodside Field Leadership framework creates a structured approach to developing leadership skills at all levels of the business. This is achieved through four types of conversations, all of which are designed to engage with workers in the location where they perform their role. The Take Time Talk is a conversation that everyone can have. It is a demonstration of our culture of care and rooted in the ‘I see, I fix’ mentality. The Real Work Talk is for frontline leaders and involves a pre- selected work task, field based observation and a conversation about how the delivery of work corresponded to how it was planned. The Fatality Risk Talk is also for frontline leaders and involves a pre-selected work activity and a conversation about the fatality risks involved, the work conditions that might impact control effectiveness and what we can learn to improve them. The Layered Deep Dive is for Line Leaders (including executives) and frontline leaders and involves taking a focused examination of a component of the management system or a specific risk control. Preparation is required for this activity starting with a documentation review, including an assessment of the practical application of procedure, with the aim to improve either documentation or any identified conditions that are impacting application. Except for the Take Time Talk, which can happen anytime, these conversations are planned and scheduled. Crew and leaders are trained to ensure the conversations feel energising to all involved, and there is a coaching component built in to provide feedback to the leaders on how to improve their approach. The benefits of Field Leadership include: 1. Building trust amongst the workforce, so that we can learn and improve 2. Understanding gaps between work as planned and work as done, allowing us to improve systems and processes 3. Increasing confidence that risks are understood and controls are operated as intended. We are excited to see how this approach can move the dial over time on our safety performance. METRICS AND TARGETS This section explains a number of safety-related metrics that are relevant to Woodside’s assessment, management and performance against potential key risks and opportunities. For some of these metrics, targets have been adopted. The following metrics have been selected as they focus on the highest impact to people and the business. The metrics are also informed by recommended disclosures within current voluntary sustainability frameworks and guidance, with consideration of industry practice. Process Safety Events—Tier 1 and 2 Process Safety Events This is a measure of an unplanned or uncontrolled release of energy or LOPC of any material including non-toxic and non-flammable materials from a process with the potential to cause harm. Senior Process Safety Critical Role Conformance This is an internal measure of assessed competency for process safety critical roles. This is a leading indicator and measures the leadership and competency of the individuals in roles that can affect process safety outcomes. High-Consequence Injuries (HCIs) This measure was introduced in 2024 as the KPI for personal safety in the 2024 scorecard replacing TRIR. This was selected as a scorecard metric to focus attention on the highest risks to people and promote learning through more transparent reporting. A HCI is an injury where the individual does not return to full health within six months. Total Recordable Occupational Illness Frequency This is a measure of the occurrence of occupational illnesses within our business and applies to both physical and psychological illnesses. Target ≤2 Target ≥95%. Target ≤1 Target N/A 2024 performance 2 2024 performance 93% 2024 performance 1 2024 performance 1.42 In addition to the key metrics outlined above, please also see the Health and Safety data table available on our website for other metrics. 2024 ANNUAL REPORT 53
MATERIAL TOPIC UPDATES 3.8.5 Climate Climate change is a strategic risk and opportunity for Woodside. We anticipate that energy markets will continue to evolve, creating investment opportunities in existing and new products. We recognise that natural gas can support more renewables to replace coal, by ‘firming’ up their intermittent supply along with batteries. We also anticipate that regulation will impact upon the GHG emissions from our operations, potentially affecting costs whilst also creating the opportunity to be competitively advantaged as an efficient supplier. 2024 PERFORMANCE OVERVIEW Our net equity Scope 1 and 2 GHG emissions were 5,437 kt CO2-e, 14% below the starting base, on track to meet our 2025 target of 15%.1,2 Gross equity Scope 1 and 2 GHG emissions volumes were 6,784 kt CO2-e compared to 6,190 kt CO2-e in 2023. This includes an increase due to the commencement of Sangomar production, including expected one-off emissions from startup and production during the second half of 2024. This performance was better than expected due to high reliability and lower flaring on Pluto, NWS and FPSOs and Sangomar’s lower flaring in December. This facility performance was supplemented by the retirement of 1,347 kt CO2-e carbon credits as offsets. Woodside’s gross Scope 1 and 2 GHG emissions intensity, which measures our emissions performance per unit of production remains better than industry benchmark.3 We progressed decarbonisation plans across our portfolio of operated assets, including implementing or sanctioning projects that are expected to achieve approximately 40% of the emissions reductions identified in asset decarbonisation plans to date. We also progressed engineering studies of large scale abatement opportunities at the Pluto facility, although the cost of these opportunities remains significantly above Woodside’s internal cost of carbon. We joined OGMP 2.0, the UN Environment Program’s flagship oil and gas methane mitigation and measurement programme in January 2024, and are preparing our implementation plan. In 2024, the first Australian Carbon Credit Units (ACCUs) were issued from our Native Reforestation Project which commenced in 2020. We progressed our plan to invest in products and services for the energy transition, strengthening our portfolio of competitive oil and gas assets whilst developing our new energy business. At the end of 2024, we had spent $2.461 billion cumulatively on new energy products and lower-carbon services, making disciplined progress towards our target to invest $5 billion by 2030.4,5,6 The Beaumont New Ammonia Project is our biggest investment in new energy to date ($2.35 billion) and Phase 1 of this project, which is post-FID, has a design capacity of 1.1 Mtpa of ammonia.6 First ammonia production is targeted for the second half of 2025 with lower-carbon ammonia production targeted for the second half of 2026. The project will target conventional ammonia customers at startup and will target lower-carbon ammonia customers in Europe and Asia when CCS is operational. Phase 1 has the potential to contribute up to 1.6 Mtpa of CO2-e abatement.7,8 We put our CTAP to a non-binding advisory vote of shareholders at the 2024 AGM. Disappointingly, the CTAP did not achieve majority support. Subsequently, the Board and Management have continued to engage with shareholders, and Woodside has published a Climate-related Investor Engagement document to provide greater transparency about investor feedback. Additional information is available on our website under Sustainability/Climate. 1. Targets and aspiration are for net equity Scope 1 and 2 GHG emissions relative to a starting base of 6.32 Mt CO2 -e which is representative of the gross annual average equity Scope 1 and 2 GHG emissions over 2016-2020 and which may be adjusted (up or down) for potential equity changes in producing or sanctioned assets with a final investment decision prior to 2021. Net equity emissions include the utilisation of carbon credits as offsets. 2. This means net equity for the 12-month period ending 31 December 2025 are targeted to be 15% lower than the starting base. 3. Woodside analysis, based on Woodside Scope 1 and 2 GHG emissions data for 2024 relative to a comparable portfolio of upstream oil, upstream natural gas and LNG liquefaction assets, based on the average emissions intensity of these project categories reported in Table 3.1 of IEA’s “The Oil and Gas Industry in Net Zero Transitions” (November 2023). 4. Scope 3 targets are subject to commercial arrangements, commercial feasibility, regulatory and Joint Venture approvals, and third party activities (which may or may not proceed). Individual investment decisions are subject to Woodside’s investment targets. Not guidance. Potentially includes both organic and inorganic investment. 5. Includes pre-RFSU spend on new energy products and lower carbon services that can help our customers decarbonise by using these products and services. It is not used to fund reductions of Woodside’s net equity Scope 1 and 2 emissions which are managed separately through asset decarbonisation plans. 6. Cumulative spend against the investment target at the end of 2024 includes 80% of the total $2,350 million for the Beaumont New Ammonia project acquisition. The remaining 20% will be paid at Project completion. 7. The information regarding Beaumont New Ammonia (BNA) in this report does not contain all the underlying context and details that is included in the announcement “Woodside to acquire OCI’s Clean Ammonia Project”, released 5 August 2024. Refer to the announcement for the full explanation of the underpinning assumptions, uncertainties, and context relevant to BNA. https://www.woodside.com/docs/ default-source/asx-announcements/2024/woodside-to-acquire-oci’s-clean-ammonia-project.pdf?sfvrsn=cf35e9ed_1 8. Scope 3 emissions abatement capacity of 1.6 Mtpa CO2-e assumes supply of carbon abated hydrogen and CCS operational for phase 1 of the Beaumont New Ammonia Project. Woodside has made the assumption to estimate the avoided emissions through the displacement of conventional marine fuel. Actual displaced emissions may differ based on actual use case. 54 WOODSIDE ENERGY GROUP LTD
STRATEGY Woodside’s climate strategy is integrated throughout our company strategy: our aspiration to thrive through the energy transition with a low-cost, lower-carbon, profitable, resilient and diversified portfolio.1 Our climate strategy contains two key elements: • Reducing our net equity Scope 1 and 2 GHG emissions; and • Investing in products and services for the energy transition. Reducing our net equity Scope 1 and 2 GHG emissions is supported by three levers: avoiding emissions in design, reducing emissions in operations, and offsetting the remainder with carbon credits. Investing in products and services for the energy transition is also supported by three levers: assessing investments for their resilience to the energy transition; diversifying our products and services; and supporting our customers and suppliers to reduce their emissions. These levers are further supported by our work to promote global measurement and reporting – including our own publication of transparent disclosures. Targets We have set a target for reducing our net equity Scope 1 and 2 GHG emissions. This is to reduce these emissions by 15% (in 2025) and 30% (in 2030) below the starting base, which is representative of our gross annual average Scope 1 and 2 emissions over the 2016-2020 period. We have set two related Scope 3 targets. The first to invest $5 billion in new energy products and lower-carbon services by year end 2030 (investment target). The second, to take FID on new energy products and lower-carbon services by year end 2030, with total abatement capacity of 5 Mtpa CO2-e (emissions abatement target). The investment target tracks our work to develop these projects and bring them to market. The emissions abatement target will track their potential impact on customer emissions. The Board and Sustainability Committee regularly review our progress towards these targets. We also consider the need to adjust these targets in response to our progress, our prospects of successfully meeting them, or in response to external developments. Some investors have asked Woodside to consider setting a target for the period beyond 2030, such as for 2035. National governments are expected to publish their next Nationally Determined Contributions (NDCs) to the Paris Agreement during 2025, and these may contain commitments beyond 2030. These updated NDCs will be a component of the information needed to inform analysis of potential targets beyond 2030, and we expect to further consider this topic during 2025. Reducing net equity Scope 1 and 2 GHG emissions Emissions reduction at facilities can be achieved through the way they are designed (‘design out emissions’) or by changes to the way they are operated after construction (‘operate out emissions’). Asset decarbonisation plans Each asset identifies its opportunities to reduce emissions in an Asset decarbonisation plan. The main opportunities include energy efficiency, methane reduction, flaring reduction and the use of renewables. These have identified some 28 Mt CO2-e (cumulative to 2050) of emissions reduction opportunities over the remaining life of assets, mainly at a cost below $80/t CO -e.2 These are included in asset decarbonisation plans. Of these, 15 Mt CO2-e (cumulative to 2050) were implemented during the design phase of Scarborough, Pluto Train 2 and Trion. The remaining 13 Mt CO2-e (cumulative to 2050) are being pursued through around 80 projects.3 Projects which will deliver around 40% of these emissions reductions were completed or sanctioned at the end of 2024, and 100% completion is expected by the end of 2030.4 Focus on methane Management of methane emissions receives particular focus within our asset decarbonisation plans. Methane has a higher global warming potential than carbon dioxide so its management is important in efforts to limit global warming, especially in the near term. Our focus on methane has also been long standing because leaks, if they occur at sufficient volume, would be a loss to our production and a potential safety hazard. Woodside’s reported methane emissions are around 0.1% of production by volume. This calculation is supported by our improving ability to directly monitor and measure methane at our facilities. It is lower than the Oil and Gas Climate Initiative (OGCI) 2025 target of below 0.2%. The 2024 Climate Update presents Woodside’s methane intensity performance against this OGCI target. We continue to strive for further reductions through our methane emissions management plan. This methane emissions management plan includes improving our ability to measure methane emissions, taking action to reduce them where identified, transparent reporting of data, and supporting the adoption of best practice across industry and regulation. We report methane emissions using the relevant regulatory standard. However, in our asset decarbonisation planning, when we assess emissions reduction opportunities, we multiply our internal cost of carbon of $80/t CO2-e (real terms 2024) by 84 representing the higher global warming potential of methane in the near-term. This results in an effective price for methane of $6,720/t emitted. Woodside is a member of the UN Environment Programme’s (UNEP) reporting and mitigation program, the Oil and Gas Methane Partnership (OGMP 2.0). Woodside is also a member of initiatives aiming to promote knowledge sharing and technical collaboration across the natural gas value chain, including the global Methane Guiding Principles, the Association of 1. For Woodside, a lower-carbon portfolio is one from which the net equity Scope 1 and 2 GHG emissions, which includes the use of offsets, are being reduced towards targets, and into which new energy products and lower-carbon services are planned to be introduced as a complement to existing and new investments in oil and gas. Our Climate Policy sets out the principles that we believe will assist us achieve this aim. 2. Woodside’s assumption on carbon cost pricing include a long-term carbon price of US$80/tonne of emissions (real terms 2024). Woodside continues to monitor the uncertainty around climate change risks and will revise carbon pricing assumptions accordingly. 3. These updated figures are based on 74.9% equity in Scarborough. Previous figures in the 2023 CTAP were based on 90% equity in Scarborough. 4. Indicative only, not guidance. Potential impact of opportunities identified in asset decarbonisation plans assuming all opportunities identified progress to execution, which is not certain and remains subject to further maturity of cost and engineering definition. Greenhouse gas quantities are estimated using engineering judgement by Woodside engineers. Please refer to section 6.8—Information about this report for important cautionary information relating to forward-looking statements. 2024 ANNUAL REPORT 55
Southeast Asian Nations (ASEAN) Methane Leadership Programme and an initiative by the Australian Climate Leaders Coalition. Large scale abatement Electrification, hydrogen fuelling and carbon capture utilisation and storage (CCUS) are all methods for reducing emissions from our electrical and mechanical turbines. However, they are expensive to retrofit onto existing plant and equipment, with estimates in the range of $200-$500 tCO2-e. This involves continuing engineering assessment in order to reduce costs. In 2024, hydrogen fuelling of turbines emerged as the leading opportunity, with hydrogen generated from natural gas (steam methane reforming with CCS). The unit abatement costs remain significantly higher than that of alternatives such as utilising carbon credits as offsets. Carbon credits The use of carbon credits as offsets remains an important part of Woodside’s approach to Scope 1 and 2 GHG emissions, due to the high potential cost of large scale abatement options. We both originate (i.e. invest in our own carbon projects) and acquire carbon credits, to maintain a diverse portfolio differentiated by underlying abatement method, geography and vintage. We prioritise abatement at facilities before we utilise carbon credits as offsets. One way that we do this is that the $80/t threshold for assessing opportunities for implementation in asset decarbonisation plans is above the most recent generic ACCU spot price of around A$36.60/t (approximately US$25/t).1 A second way that we prioritise abatement at facilities over the utilisation of carbon credits is to set executive remuneration targets on gross Scope 1 and 2 GHG emissions, which do not include the use of carbon credits. Investing in products and services for the energy transition Woodside is an oil, gas and emerging new energy company. We assess that there will be continued demand for these products in the decades ahead, but that the levels of demand will change as the world pursues an energy transition in order to limit global temperature increase whilst pursuing economic development. There are many potential energy transition pathways that could result, and therefore Woodside does not adopt a single scenario as a planning assumption, but rather assesses many scenarios and the plans of its customers and their governments. As a result we expect: • Sustained demand for natural gas, especially LNG, during the period in which countries invest in renewables and other lower- carbon power options to meet increased demand as well as substituting coal in power generation; • Growing demand for new energy products (such as hydrogen and hydrogen derivatives like ammonia) and lower-carbon services (like CCUS and nature based solutions); • Demand for oil is expected by some agencies to peak in the 2030s (e.g. due to electrification of vehicles), but in most scenarios will still require investment in supply.2,3 Investment discipline Woodside recognises that as demand varies it will continue to be important to be a low-cost, lower-carbon provider in order to compete effectively for market share. That is why we carefully assess our new investment opportunities for their resilience to the energy transition, prior to taking a FID. It is also why we are working to diversify our portfolio through the introduction of new energy products and lower-carbon services, so that we can respond to anticipated growth in demand. We test the resilience of our investments for both organic and inorganic opportunities. These are informed by energy market analysis including supply, demand and price outlooks. We test the robustness of potential investments against a wide range of scenarios to support our investment decisions. Scenario analysis Scenario analysis is a tool which contributes to our assessment of the risks and opportunities related to climate change. There are many different scenarios and methodologies for producing them. Typically they are not forecasts, but they can provide a view of different potential futures – if used in the right application with an awareness of their underlying approach, assumptions, limitations and inputs. Scenario analysis on its own does not provide sufficient insight into future risk and opportunities on which to base business planning. Woodside does not adopt a single scenario for planning purposes. Rather, the assumptions used for Woodside’s internal business planning, such as for investment decisions and asset valuation, require a broader range of inputs. These inputs include consideration of climate-related factors, including both Paris- aligned and non Paris-aligned outcomes. They must also include other factors such as economic growth, inflation, exchange rates, interest rates and geopolitics. They consider the specific role of LNG (as opposed to aggregate gas use) and regional differentiations (as opposed to globalised data). Together these factors can inform a broad based consideration of risks, opportunities, competitiveness and resilience. They contribute to understanding the potential impact of climate-related risks alongside other risks to our strategy, business and financial planning. One element of this process is to stress-test the potential future cashflows from our portfolio of producing assets and sanctioned projects. As part of the transition case methodology which forms part of investment decisions, we can assess how a potential new investment might change the outcome of this portfolio stress test. We have also disclosed the annual results of the stress test, as part of our disclosure of TCFD aligned climate-related information. For the 2024 assessment, we have continued to utilise pricing assumptions derived from the three main scenarios in the International Energy Agency’s World Energy Outlook (IEA), updated for its latest edition. These span a range of temperature outcomes: STEPS (2.4ºC), IEA Announced Pledges Scenario (APS) (1.7ºC) and Net Zero Emissions by 2050 (NZE) (1.5ºC).4 It is important to note that the assumptions which underpin these scenarios do not constitute the only potential pathway to achieving those outcomes. 1. Australian Government Clean Energy Regulator—The Quarterly Carbon Market Report – December 2024. 2. IPCC, 2022. “Climate Change 2022: Mitigation of Climate Change. Contribution of Working Group III to the Sixth Assessment Report of the Intergovernmental Panel on Climate Change”, pg. 699. https://www. ipcc.ch/report/ar6/wg3/downloads/report/IPCC_AR6_WGIII_FullReport.pdf 3. IEA 2024. “World Energy Outlook 2024” (WEO). The WEO includes investment in oil out to 2050 in all three IEA scenarios, including the 1.5°C aligned “Net Zero Emissions” scenario. Refer to pg. 136. https://www. iea.org/reports/world-energy-outlook-2024 4. IEA, 2024. “World Energy Outlook 2024.” All rights reserved. https://www.iea.org/reports/world-energy-outlook-2024 56 WOODSIDE ENERGY GROUP LTD
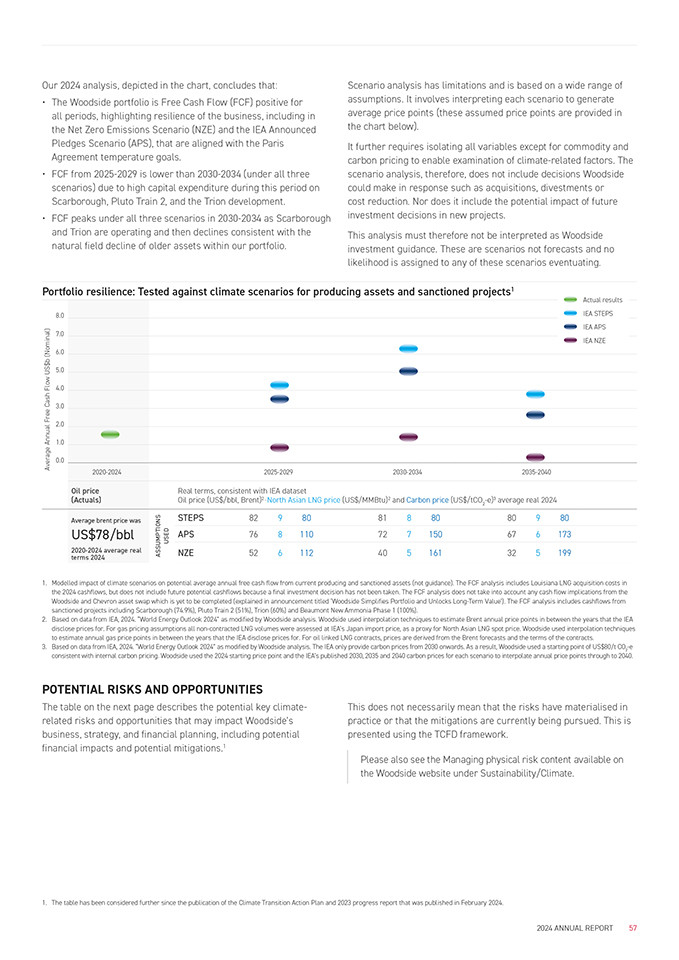
Our 2024 analysis, depicted in the chart, concludes that: • The Woodside portfolio is Free Cash Flow (FCF) positive for all periods, highlighting resilience of the business, including in the Net Zero Emissions Scenario (NZE) and the IEA Announced Pledges Scenario (APS), that are aligned with the Paris Agreement temperature goals. • FCF from 2025-2029 is lower than 2030-2034 (under all three scenarios) due to high capital expenditure during this period on Scarborough, Pluto Train 2, and the Trion development. • FCF peaks under all three scenarios in 2030-2034 as Scarborough and Trion are operating and then declines consistent with the natural field decline of older assets within our portfolio. Scenario analysis has limitations and is based on a wide range of assumptions. It involves interpreting each scenario to generate average price points (these assumed price points are provided in the chart below). It further requires isolating all variables except for commodity and carbon pricing to enable examination of climate-related factors. The scenario analysis, therefore, does not include decisions Woodside could make in response such as acquisitions, divestments or cost reduction. Nor does it include the potential impact of future investment decisions in new projects. This analysis must therefore not be interpreted as Woodside investment guidance. These are scenarios not forecasts and no likelihood is assigned to any of these scenarios eventuating. Portfolio resilience: Tested against climate scenarios for producing assets and sanctioned projects1 Actual results IEA STEPS IEA APS IEA NZE 1. Modelled impact of climate scenarios on potential average annual free cash flow from current producing and sanctioned assets (not guidance). The FCF analysis includes Louisiana LNG acquisition costs in the 2024 cashflows, but does not include future potential cashflows because a final investment decision has not been taken. The FCF analysis does not take into account any cash flow implications from the Woodside and Chevron asset swap which is yet to be completed (explained in announcement titled ‘Woodside Simplifies Portfolio and Unlocks Long-Term Value’). The FCF analysis includes cashflows from sanctioned projects including Scarborough (74.9%), Pluto Train 2 (51%), Trion (60%) and Beaumont New Ammonia Phase 1 (100%). 2. Based on data from IEA, 2024. “World Energy Outlook 2024” as modified by Woodside analysis. Woodside used interpolation techniques to estimate Brent annual price points in between the years that the IEA disclose prices for. For gas pricing assumptions all non-contracted LNG volumes were assessed at IEA’s Japan import price, as a proxy for North Asian LNG spot price. Woodside used interpolation techniques to estimate annual gas price points in between the years that the IEA disclose prices for. For oil linked LNG contracts, prices are derived from the Brent forecasts and the terms of the contracts. 3. Based on data from IEA, 2024. “World Energy Outlook 2024” as modified by Woodside analysis. The IEA only provide carbon prices from 2030 onwards. As a result, Woodside used a starting point of US$80/t CO2-e consistent with internal carbon pricing. Woodside used the 2024 starting price point and the IEA’s published 2030, 2035 and 2040 carbon prices for each scenario to interpolate annual price points through to 2040. POTENTIAL RISKS AND OPPORTUNITIES The table on the next page describes the potential key climate- related risks and opportunities that may impact Woodside’s business, strategy, and financial planning, including potential financial impacts and potential mitigations.1 This does not necessarily mean that the risks have materialised in practice or that the mitigations are currently being pursued. This is presented using the TCFD framework. Please also see the Managing physical risk content available on the Woodside website under Sustainability/Climate. 1. The table has been considered further since the publication of the Climate Transition Action Plan and 2023 progress report that was published in February 2024. 2024 ANNUAL REPORT 57
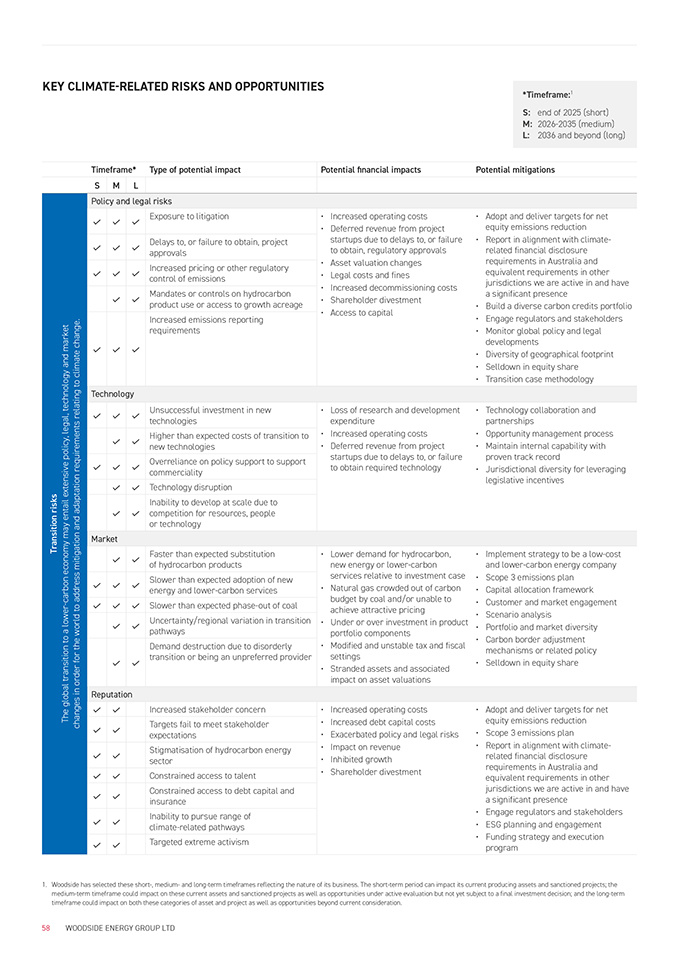
KEY CLIMATE-RELATED RISKS AND OPPORTUNITIES *Timeframe:1 S: end of 2025 (short) M: 2026-2035 (medium) L: 2036 and beyond (long) Timeframe* Type of potential impact Potential financial impactsPotential mitigations SML Transition risks The global transition to a lower-carbon economy may entail extensive policy, legal, technology and market changes in order for the world to address mitigation and adaptation requirements relating to climate change.Policy and legal risks Exposure to litigation• Increased operating costs• Adopt and deliver targets for net • Deferred revenue from projectequity emissions reduction startups due to delays to, or failure• Report in alignment with climate- to obtain, regulatory approvalsrelated financial disclosure • Asset valuation changesrequirements in Australia and • Legal costs and finesequivalent requirements in other • Increased decommissioning costsjurisdictions we are active in and have a significant presence • Shareholder divestment• Build a diverse carbon credits portfolio • Access to capital• Engage regulators and stakeholders • Monitor global policy and legal developments • Diversity of geographical footprint • Selldown in equity share • Transition case methodology Delays to, or failure to obtain, project approvals Increased pricing or other regulatory control of emissions Mandates or controls on hydrocarbon product use or access to growth acreage Increased emissions reporting requirements Technology Unsuccessful investment in new technologies• Loss of research and development• Technology collaboration and expenditurepartnerships • Increased operating costs• Opportunity management process • Deferred revenue from project• Maintain internal capability with startups due to delays to, or failureproven track record to obtain required technology• Jurisdictional diversity for leveraging legislative incentives Higher than expected costs of transition to new technologies Overreliance on policy support to support commerciality Technology disruption Inability to develop at scale due to competition for resources, people or technology Market Faster than expected substitution of hydrocarbon products• Lower demand for hydrocarbon,• Implement strategy to be a low-cost new energy or lower-carbonand lower-carbon energy company services relative to investment case • Scope 3 emissions plan • Natural gas crowded out of carbon• Capital allocation framework budget by coal and/or unable to• Customer and market engagement achieve attractive pricing• Scenario analysis • Under or over investment in product • Portfolio and market diversity portfolio components • Modified and unstable tax and fiscal • Carbon border adjustment settingsmechanisms or related policy • Stranded assets and associated• Selldown in equity share impact on asset valuations Slower than expected adoption of new energy and lower-carbon services Slower than expected phase-out of coal Uncertainty/regional variation in transition pathways Demand destruction due to disorderly transition or being an unpreferred provider Reputation Increased stakeholder concern• Increased operating costs• Adopt and deliver targets for net • Increased debt capital costsequity emissions reduction • Exacerbated policy and legal risks• Scope 3 emissions plan • Impact on revenue• Report in alignment with climate- • Inhibited growthrelated financial disclosure • Shareholder divestmentrequirements in Australia and equivalent requirements in other jurisdictions we are active in and have a significant presence • Engage regulators and stakeholders • ESG planning and engagement • Funding strategy and execution program Targets fail to meet stakeholder expectations Stigmatisation of hydrocarbon energy sector Constrained access to talent Constrained access to debt capital and insurance Inability to pursue range of climate-related pathways Targeted extreme activism 1. Woodside has selected these short-, medium- and long-term timeframes reflecting the nature of its business. The short-term period can impact its current producing assets and sanctioned projects; the medium-term timeframe could impact on these current assets and sanctioned projects as well as opportunities under active evaluation but not yet subject to a final investment decision; and the long-term timeframe could impact on both these categories of asset and project as well as opportunities beyond current consideration. 58 WOODSIDE ENERGY GROUP LTD
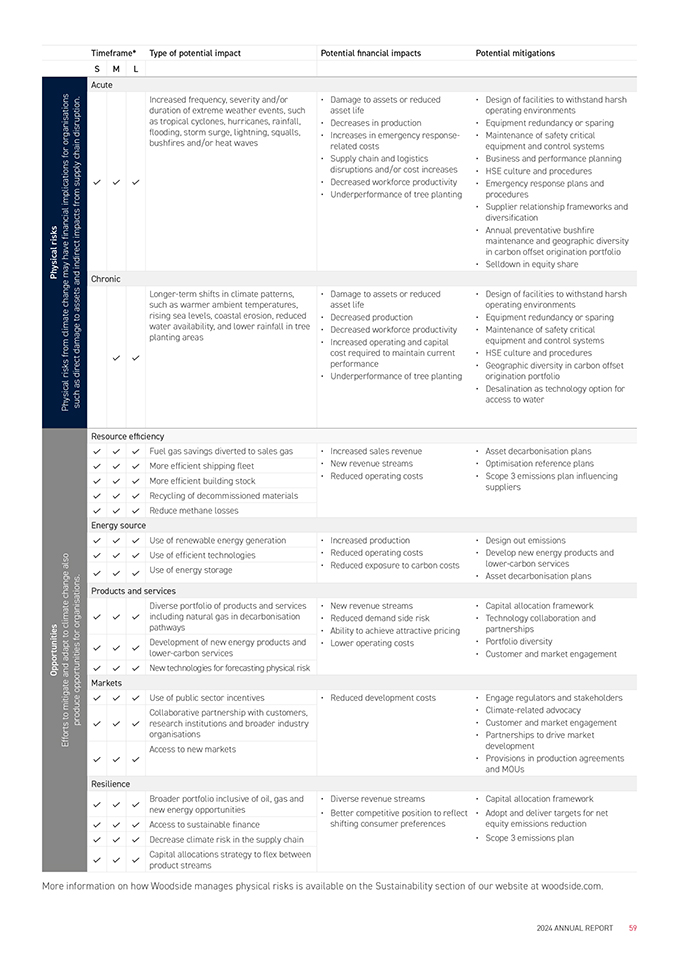
Timeframe* Type of potential impact Potential financial impactsPotential mitigations SML Physical risks Physical risks from climate change may have financial implications for organisations such as direct damage to assets and indirect impacts from supply chain disruption.Acute Increased frequency, severity and/or duration of extreme weather events, such as tropical cyclones, hurricanes, rainfall, flooding, storm surge, lightning, squalls, bushfires and/or heat waves• Damage to assets or reduced• Design of facilities to withstand harsh asset lifeoperating environments • Decreases in production• Equipment redundancy or sparing • Increases in emergency response-• Maintenance of safety critical related costsequipment and control systems • Supply chain and logistics• Business and performance planning disruptions and/or cost increases• HSE culture and procedures • Decreased workforce productivity• Emergency response plans and • Underperformance of tree plantingprocedures • Supplier relationship frameworks and diversification • Annual preventative bushfire maintenance and geographic diversity in carbon offset origination portfolio • Selldown in equity share Chronic Longer-term shifts in climate patterns, such as warmer ambient temperatures, rising sea levels, coastal erosion, reduced water availability, and lower rainfall in tree planting areas• Damage to assets or reduced• Design of facilities to withstand harsh asset lifeoperating environments • Decreased production• Equipment redundancy or sparing • Decreased workforce productivity• Maintenance of safety critical • Increased operating and capitalequipment and control systems cost required to maintain current• HSE culture and procedures performance• Geographic diversity in carbon offset • Underperformance of tree plantingorigination portfolio • Desalination as technology option for access to water Opportunities Efforts to mitigate and adapt to climate change also produce opportunities for organisations.Resource efficiency Fuel gas savings diverted to sales gas• Increased sales revenue• Asset decarbonisation plans • New revenue streams• Optimisation reference plans • Reduced operating costs• Scope 3 emissions plan influencing suppliers More efficient shipping fleet More efficient building stock Recycling of decommissioned materials Reduce methane losses Energy source Use of renewable energy generation• Increased production• Design out emissions • Reduced operating costs• Develop new energy products and • Reduced exposure to carbon costslower-carbon services • Asset decarbonisation plans Use of efficient technologies Use of energy storage Products and services Diverse portfolio of products and services including natural gas in decarbonisation pathways• New revenue streams• Capital allocation framework • Reduced demand side risk• Technology collaboration and • Ability to achieve attractive pricingpartnerships • Lower operating costs• Portfolio diversity • Customer and market engagement Development of new energy products and lower-carbon services New technologies for forecasting physical risk Markets Use of public sector incentives• Reduced development costs• Engage regulators and stakeholders • Climate-related advocacy • Customer and market engagement • Partnerships to drive market development • Provisions in production agreements and MOUs Collaborative partnership with customers, research institutions and broader industry organisations Access to new markets Resilience Broader portfolio inclusive of oil, gas and new energy opportunities• Diverse revenue streams• Capital allocation framework • Better competitive position to reflect • Adopt and deliver targets for net shifting consumer preferencesequity emissions reduction • Scope 3 emissions plan Access to sustainable finance Decrease climate risk in the supply chain Capital allocations strategy to flex between product streams More information on how Woodside manages physical risks is available on the Sustainability section of our website at woodside.com. 2024 ANNUAL REPORT 59
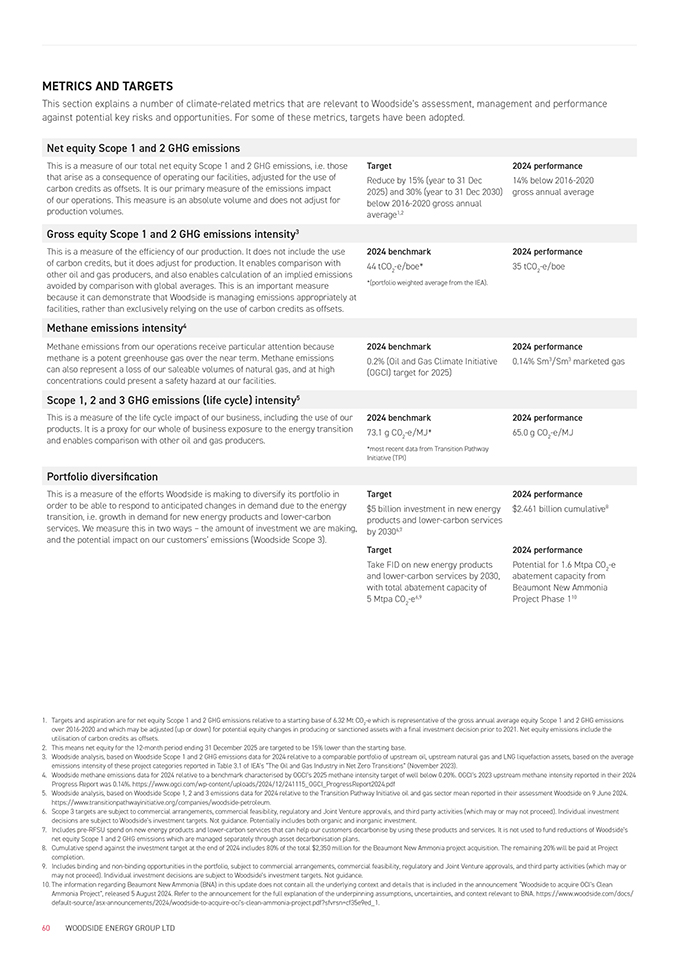
METRICS AND TARGETS This section explains a number of climate-related metrics that are relevant to Woodside’s assessment, management and performance against potential key risks and opportunities. For some of these metrics, targets have been adopted. Net equity Scope 1 and 2 GHG emissions This is a measure of our total net equity Scope 1 and 2 GHG emissions, i.e. those that arise as a consequence of operating our facilities, adjusted for the use of carbon credits as offsets. It is our primary measure of the emissions impact of our operations. This measure is an absolute volume and does not adjust for production volumes. Gross equity Scope 1 and 2 GHG emissions intensity3 This is a measure of the efficiency of our production. It does not include the use of carbon credits, but it does adjust for production. It enables comparison with other oil and gas producers, and also enables calculation of an implied emissions avoided by comparison with global averages. This is an important measure because it can demonstrate that Woodside is managing emissions appropriately at facilities, rather than exclusively relying on the use of carbon credits as offsets. Methane emissions intensity4 Methane emissions from our operations receive particular attention because methane is a potent greenhouse gas over the near term. Methane emissions can also represent a loss of our saleable volumes of natural gas, and at high concentrations could present a safety hazard at our facilities. Scope 1, 2 and 3 GHG emissions (life cycle) intensity5 This is a measure of the life cycle impact of our business, including the use of our products. It is a proxy for our whole of business exposure to the energy transition and enables comparison with other oil and gas producers. Portfolio diversification This is a measure of the efforts Woodside is making to diversify its portfolio in order to be able to respond to anticipated changes in demand due to the energy transition, i.e. growth in demand for new energy products and lower-carbon services. We measure this in two ways – the amount of investment we are making, and the potential impact on our customers’ emissions (Woodside Scope 3). Target Reduce by 15% (year to 31 Dec 2025) and 30% (year to 31 Dec 2030) below 2016-2020 gross annual average1,2 2024 benchmark 44 tCO2-e/boe* *(portfolio weighted average from the IEA). 2024 benchmark 0.2% (Oil and Gas Climate Initiative (OGCI) target for 2025) 2024 benchmark 73.1 g CO2-e/MJ* *most recent data from Transition Pathway Initiative (TPI) Target $5 billion investment in new energy products and lower-carbon services by 20306,7 Target Take FID on new energy products and lower-carbon services by 2030, with total abatement capacity of 5 Mtpa CO -e6,9 2024 performance 14% below 2016-2020 gross annual average 2024 performance 35 tCO2-e/boe 2024 performance 0.14% Sm3/Sm3 marketed gas 2024 performance 65.0 g CO2-e/MJ 2024 performance $2.461 billion cumulative8 2024 performance Potential for 1.6 Mtpa CO2-e abatement capacity from Beaumont New Ammonia Project Phase 110 1. Targets and aspiration are for net equity Scope 1 and 2 GHG emissions relative to a starting base of 6.32 Mt CO2-e which is representative of the gross annual average equity Scope 1 and 2 GHG emissions over 2016-2020 and which may be adjusted (up or down) for potential equity changes in producing or sanctioned assets with a final investment decision prior to 2021. Net equity emissions include the utilisation of carbon credits as offsets. 2. This means net equity for the 12-month period ending 31 December 2025 are targeted to be 15% lower than the starting base. 3. Woodside analysis, based on Woodside Scope 1 and 2 GHG emissions data for 2024 relative to a comparable portfolio of upstream oil, upstream natural gas and LNG liquefaction assets, based on the average emissions intensity of these project categories reported in Table 3.1 of IEA’s “The Oil and Gas Industry in Net Zero Transitions” (November 2023). 4. Woodside methane emissions data for 2024 relative to a benchmark characterised by OGCI’s 2025 methane intensity target of well below 0.20%. OGCI’s 2023 upstream methane intensity reported in their 2024 Progress Report was 0.14%. https://www.ogci.com/wp-content/uploads/2024/12/241115_OGCI_ProgressReport2024.pdf 5. Woodside analysis, based on Woodside Scope 1, 2 and 3 emissions data for 2024 relative to the Transition Pathway Initiative oil and gas sector mean reported in their assessment Woodside on 9 June 2024. https://www.transitionpathwayinitiative.org/companies/woodside-petroleum. 6. Scope 3 targets are subject to commercial arrangements, commercial feasibility, regulatory and Joint Venture approvals, and third party activities (which may or may not proceed). Individual investment decisions are subject to Woodside’s investment targets. Not guidance. Potentially includes both organic and inorganic investment. 7. Includes pre-RFSU spend on new energy products and lower-carbon services that can help our customers decarbonise by using these products and services. It is not used to fund reductions of Woodside’s net equity Scope 1 and 2 GHG emissions which are managed separately through asset decarbonisation plans. 8. Cumulative spend against the investment target at the end of 2024 includes 80% of the total $2,350 million for the Beaumont New Ammonia project acquisition. The remaining 20% will be paid at Project completion. 9. Includes binding and non-binding opportunities in the portfolio, subject to commercial arrangements, commercial feasibility, regulatory and Joint Venture approvals, and third party activities (which may or may not proceed). Individual investment decisions are subject to Woodside’s investment targets. Not guidance. 10. The information regarding Beaumont New Ammonia (BNA) in this update does not contain all the underlying context and details that is included in the announcement “Woodside to acquire OCI’s Clean Ammonia Project”, released 5 August 2024. Refer to the announcement for the full explanation of the underpinning assumptions, uncertainties, and context relevant to BNA. https://www.woodside.com/docs/ default-source/asx-announcements/2024/woodside-to-acquire-oci’s-clean-ammonia-project.pdf?sfvrsn=cf35e9ed_1. 60 WOODSIDE ENERGY GROUP LTD
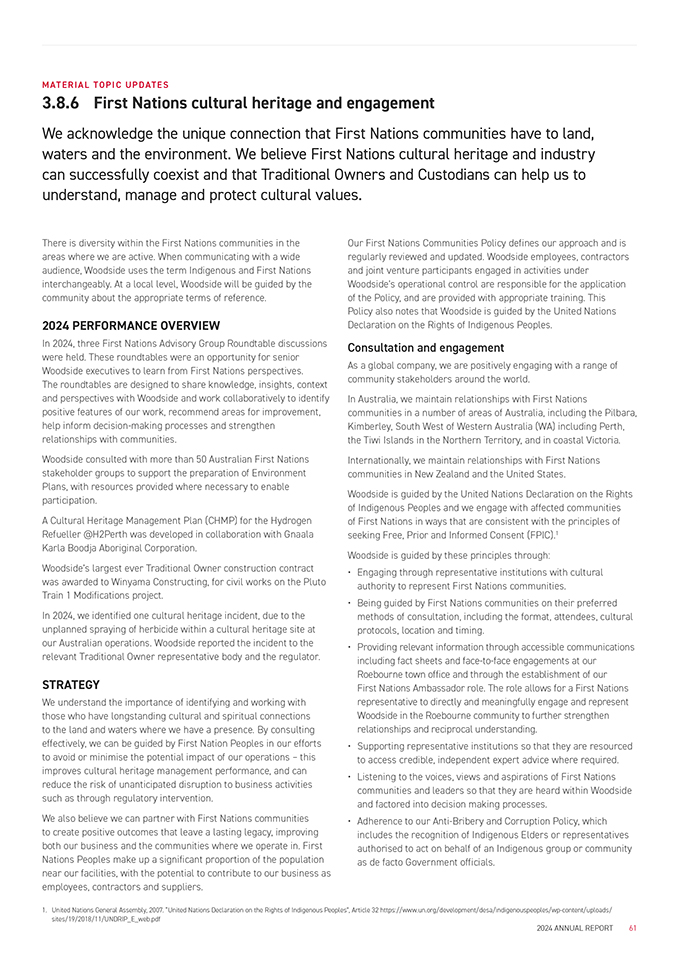
MATERIAL TOPIC UPD A TES 3.8.6 First Nations cultural heritage and engagement We acknowledge the unique connection that First Nations communities have to land, waters and the environment. We believe First Nations cultural heritage and industry can successfully coexist and that Traditional Owners and Custodians can help us to understand, manage and protect cultural values. There is diversity within the First Nations communities in the areas where we are active. When communicating with a wide audience, Woodside uses the term Indigenous and First Nations interchangeably. At a local level, Woodside will be guided by the community about the appropriate terms of reference. 2024 PERFORMANCE OVERVIEW In 2024, three First Nations Advisory Group Roundtable discussions were held. These roundtables were an opportunity for senior Woodside executives to learn from First Nations perspectives. The roundtables are designed to share knowledge, insights, context and perspectives with Woodside and work collaboratively to identify positive features of our work, recommend areas for improvement, help inform decision-making processes and strengthen relationships with communities. Woodside consulted with more than 50 Australian First Nations stakeholder groups to support the preparation of Environment Plans, with resources provided where necessary to enable participation. A Cultural Heritage Management Plan (CHMP) for the Hydrogen Refueller @H2Perth was developed in collaboration with Gnaala Karla Boodja Aboriginal Corporation. Woodside’s largest ever Traditional Owner construction contract was awarded to Winyama Constructing, for civil works on the Pluto Train 1 Modifications project. In 2024, we identified one cultural heritage incident, due to the unplanned spraying of herbicide within a cultural heritage site at our Australian operations. Woodside reported the incident to the relevant Traditional Owner representative body and the regulator. STRATEGY We understand the importance of identifying and working with those who have longstanding cultural and spiritual connections to the land and waters where we have a presence. By consulting effectively, we can be guided by First Nation Peoples in our efforts to avoid or minimise the potential impact of our operations – this improves cultural heritage management performance, and can reduce the risk of unanticipated disruption to business activities such as through regulatory intervention. We also believe we can partner with First Nations communities to create positive outcomes that leave a lasting legacy, improving both our business and the communities where we operate in. First Nations Peoples make up a significant proportion of the population near our facilities, with the potential to contribute to our business as employees, contractors and suppliers. Our First Nations Communities Policy defines our approach and is regularly reviewed and updated. Woodside employees, contractors and joint venture participants engaged in activities under Woodside’s operational control are responsible for the application of the Policy, and are provided with appropriate training. This Policy also notes that Woodside is guided by the United Nations Declaration on the Rights of Indigenous Peoples. Consultation and engagement As a global company, we are positively engaging with a range of community stakeholders around the world. In Australia, we maintain relationships with First Nations communities in a number of areas of Australia, including the Pilbara, Kimberley, South West of Western Australia (WA) including Perth, the Tiwi Islands in the Northern Territory, and in coastal Victoria. Internationally, we maintain relationships with First Nations communities in New Zealand and the United States. Woodside is guided by the United Nations Declaration on the Rights of Indigenous Peoples and we engage with affected communities of First Nations in ways that are consistent with the principles of seeking Free, Prior and Informed Consent (FPIC).1 Woodside is guided by these principles through: • Engaging through representative institutions with cultural authority to represent First Nations communities. • Being guided by First Nations communities on their preferred methods of consultation, including the format, attendees, cultural protocols, location and timing. • Providing relevant information through accessible communications including fact sheets and face-to-face engagements at our Roebourne town office and through the establishment of our First Nations Ambassador role. The role allows for a First Nations representative to directly and meaningfully engage and represent Woodside in the Roebourne community to further strengthen relationships and reciprocal understanding. • Supporting representative institutions so that they are resourced to access credible, independent expert advice where required. • Listening to the voices, views and aspirations of First Nations communities and leaders so that they are heard within Woodside and factored into decision making processes. • Adherence to our Anti-Bribery and Corruption Policy, which includes the recognition of Indigenous Elders or representatives authorised to act on behalf of an Indigenous group or community as de facto Government officials. 1. United Nations General Assembly, 2007. “United Nations Declaration on the Rights of Indigenous Peoples”, Article 32 https://www.un.org/development/desa/indigenouspeoples/wp-content/uploads/ sites/19/2018/11/UNDRIP_E_web.pdf 2024 ANNUAL REPORT 61
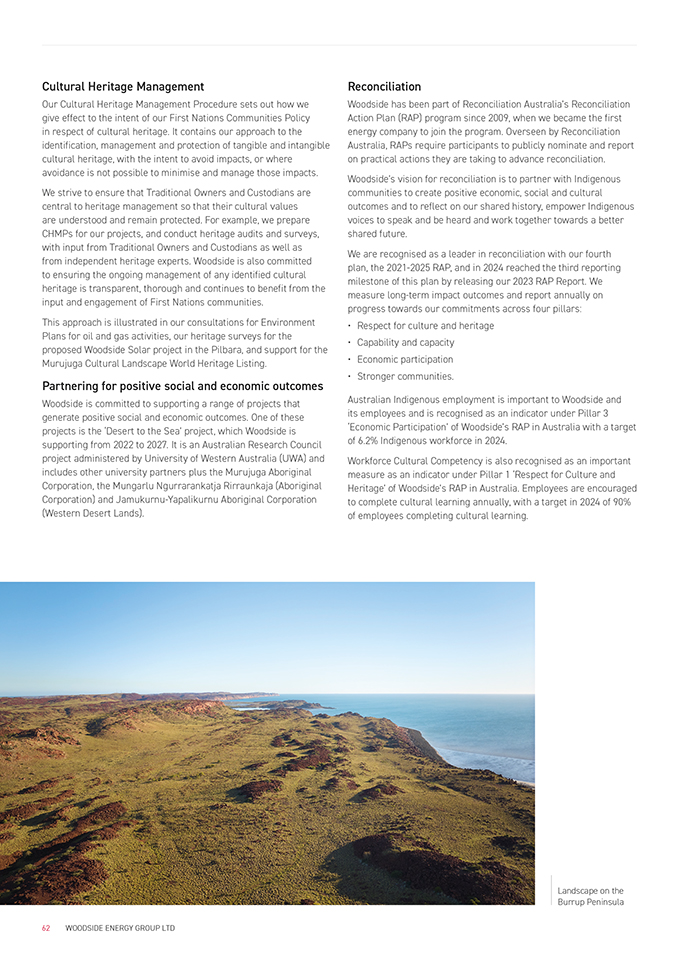
Cultural Heritage Management Our Cultural Heritage Management Procedure sets out how we give effect to the intent of our First Nations Communities Policy in respect of cultural heritage. It contains our approach to the identification, management and protection of tangible and intangible cultural heritage, with the intent to avoid impacts, or where avoidance is not possible to minimise and manage those impacts. We strive to ensure that Traditional Owners and Custodians are central to heritage management so that their cultural values are understood and remain protected. For example, we prepare CHMPs for our projects, and conduct heritage audits and surveys, with input from Traditional Owners and Custodians as well as from independent heritage experts. Woodside is also committed to ensuring the ongoing management of any identified cultural heritage is transparent, thorough and continues to benefit from the input and engagement of First Nations communities. This approach is illustrated in our consultations for Environment Plans for oil and gas activities, our heritage surveys for the proposed Woodside Solar project in the Pilbara, and support for the Murujuga Cultural Landscape World Heritage Listing. Partnering for positive social and economic outcomes Woodside is committed to supporting a range of projects that generate positive social and economic outcomes. One of these projects is the ‘Desert to the Sea’ project, which Woodside is supporting from 2022 to 2027. It is an Australian Research Council project administered by University of Western Australia (UWA) and includes other university partners plus the Murujuga Aboriginal Corporation, the Mungarlu Ngurrarankatja Rirraunkaja (Aboriginal Corporation) and Jamukurnu-Yapalikurnu Aboriginal Corporation (Western Desert Lands). Reconciliation Woodside has been part of Reconciliation Australia’s Reconciliation Action Plan (RAP) program since 2009, when we became the first energy company to join the program. Overseen by Reconciliation Australia, RAPs require participants to publicly nominate and report on practical actions they are taking to advance reconciliation. Woodside’s vision for reconciliation is to partner with Indigenous communities to create positive economic, social and cultural outcomes and to reflect on our shared history, empower Indigenous voices to speak and be heard and work together towards a better shared future. We are recognised as a leader in reconciliation with our fourth plan, the 2021-2025 RAP, and in 2024 reached the third reporting milestone of this plan by releasing our 2023 RAP Report. We measure long-term impact outcomes and report annually on progress towards our commitments across four pillars: • Respect for culture and heritage • Capability and capacity • Economic participation • Stronger communities. Australian Indigenous employment is important to Woodside and its employees and is recognised as an indicator under Pillar 3 ‘Economic Participation’ of Woodside’s RAP in Australia with a target of 6.2% Indigenous workforce in 2024. Workforce Cultural Competency is also recognised as an important measure as an indicator under Pillar 1 ‘Respect for Culture and Heritage’ of Woodside’s RAP in Australia. Employees are encouraged to complete cultural learning annually, with a target in 2024 of 90% of employees completing cultural learning. Landscape on the Burrup Peninsula 62 WOODSIDE ENERGY GROUP LTD
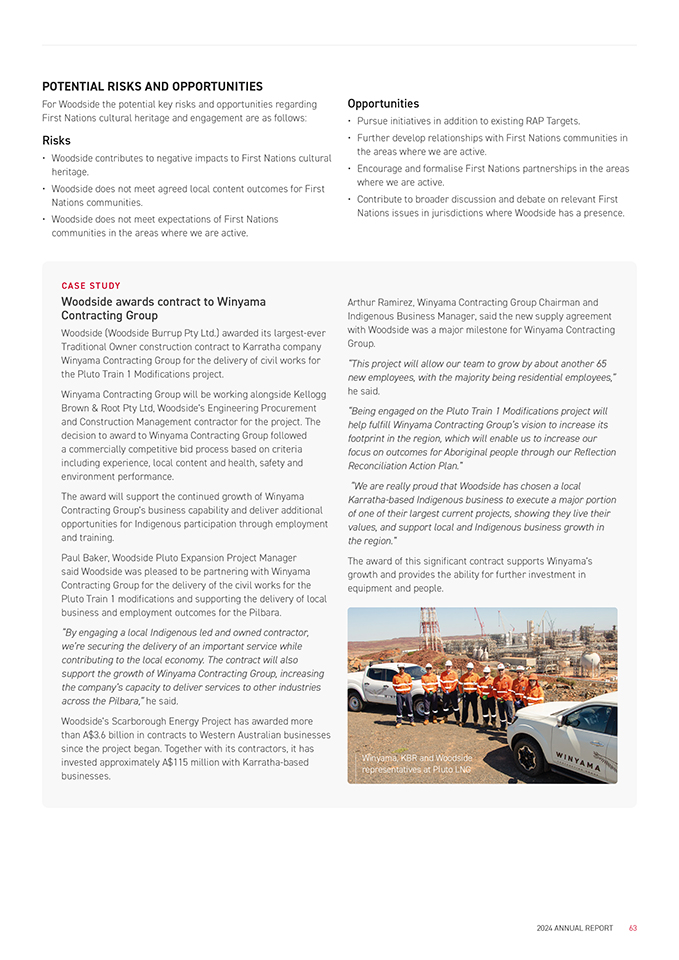
POTENTIAL RISKS AND OPPORTUNITIES For Woodside the potential key risks and opportunities regarding First Nations cultural heritage and engagement are as follows: Risks • Woodside contributes to negative impacts to First Nations cultural heritage. • Woodside does not meet agreed local content outcomes for First Nations communities. • Woodside does not meet expectations of First Nations communities in the areas where we are active. Opportunities • Pursue initiatives in addition to existing RAP Targets. • Further develop relationships with First Nations communities in the areas where we are active. • Encourage and formalise First Nations partnerships in the areas where we are active. • Contribute to broader discussion and debate on relevant First Nations issues in jurisdictions where Woodside has a presence. C ASE S TUD Y Woodside awards contract to Winyama Contracting Group Woodside (Woodside Burrup Pty Ltd.) awarded its largest-ever Traditional Owner construction contract to Karratha company Winyama Contracting Group for the delivery of civil works for the Pluto Train 1 Modifications project. Winyama Contracting Group will be working alongside Kellogg Brown & Root Pty Ltd, Woodside’s Engineering Procurement and Construction Management contractor for the project. The decision to award to Winyama Contracting Group followed a commercially competitive bid process based on criteria including experience, local content and health, safety and environment performance. The award will support the continued growth of Winyama Contracting Group’s business capability and deliver additional opportunities for Indigenous participation through employment and training. Paul Baker, Woodside Pluto Expansion Project Manager said Woodside was pleased to be partnering with Winyama Contracting Group for the delivery of the civil works for the Pluto Train 1 modifications and supporting the delivery of local business and employment outcomes for the Pilbara. “By engaging a local Indigenous led and owned contractor, we’re securing the delivery of an important service while contributing to the local economy. The contract will also support the growth of Winyama Contracting Group, increasing the company’s capacity to deliver services to other industries across the Pilbara,” he said. Woodside’s Scarborough Energy Project has awarded more than A$3.6 billion in contracts to Western Australian businesses since the project began. Together with its contractors, it has invested approximately A$115 million with Karratha-based businesses. Arthur Ramirez, Winyama Contracting Group Chairman and Indigenous Business Manager, said the new supply agreement with Woodside was a major milestone for Winyama Contracting Group. “This project will allow our team to grow by about another 65 new employees, with the majority being residential employees,” he said. “Being engaged on the Pluto Train 1 Modifications project will help fulfill Winyama Contracting Group’s vision to increase its footprint in the region, which will enable us to increase our focus on outcomes for Aboriginal people through our Reflection Reconciliation Action Plan.” “We are really proud that Woodside has chosen a local Karratha-based Indigenous business to execute a major portion of one of their largest current projects, showing they live their values, and support local and Indigenous business growth in the region.” The award of this significant contract supports Winyama’s growth and provides the ability for further investment in equipment and people. Winyama, KBR and Woodside representatives at Pluto LNG 2024 ANNUAL REPORT 63
METRICS AND TARGETS This section explains a number of metrics that are relevant to Woodside’s assessment, management and performance against potential key risks and opportunities. For some of these metrics, targets have been adopted. Indigenous employment This metric applies to our Australian Indigenous workforce. This measure is important to Woodside and its employees and is an indicator under Pillar 3 of Woodside’s RAP in Australia, namely ‘Economic Participation’. Woodside increased its Indigenous workforce to 5.8%, with Pilbara-based Indigenous representation reaching 11%. Target 6.2% 2024 performance 5.8%1 Cultural heritage This measure is important to Woodside, noting effective cultural heritage management allows cultural values to be understood and remain protected. Impacts to cultural heritage carry possible significant reputational and financial impacts to the business, highlighting the importance of the effective management of this measure. Target • Support two cultural heritage management initiatives proposed by Australian First Nation Traditional Custodians through engagement and consultation. • Conduct two First Nations Advisory Group Roundtables. 2024 performance • In 2024, Woodside supported ten cultural heritage management initiatives proposed by Australian First Nations Traditional Custodians. In addition, independent cultural heritage audits of Pluto and the North West Shelf facilities were completed, in collaboration with Australian First Nation Traditional Custodians. • In 2024, three First Nations Advisory Group Roundtables were held. Workforce cultural competency This measure is important to Woodside as it is an indicator under Pillar 1 of Woodside’s RAP in Australia, namely ‘Respect for Culture and Heritage’. Target • 90% of employees complete cultural learning annually 2024 performance • 93.3% training completion rate for 2024 Additional First Nations cultural heritage and engagement content is available on the First Nations cultural heritage and engagement page of the Sustainability section of the Woodside website. 1. Indigenous Australian employment continues to be part of our RAP commitments and our Inclusion and Diversity Strategy 2021-2025. Targeted actions are planned in 2025, to increase representation in our workforce. 64 WOODSIDE ENERGY GROUP LTD
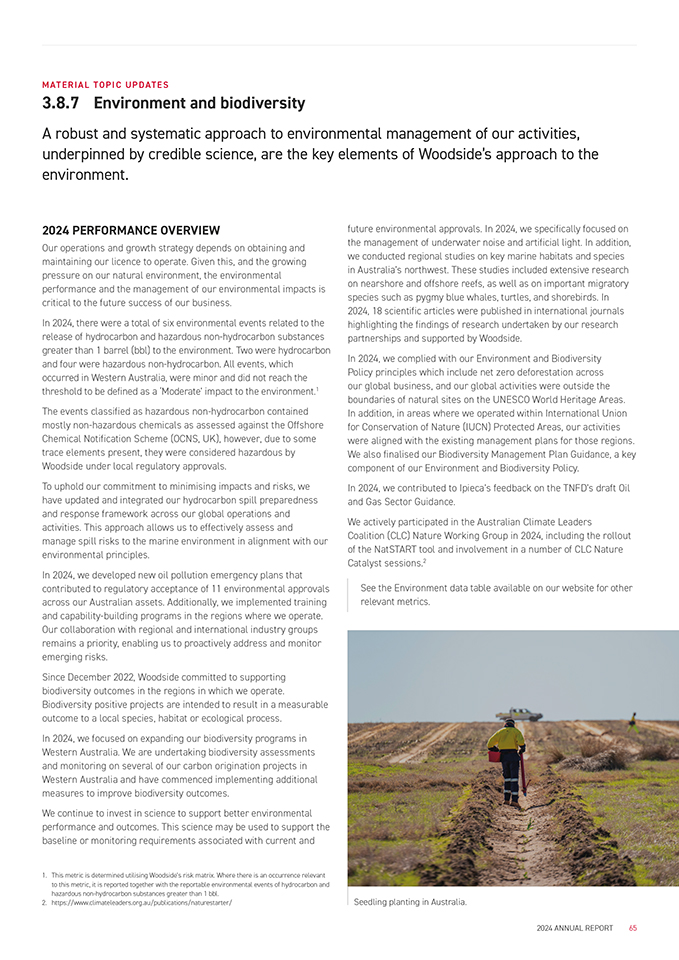
MA TERIAL T OPIC UPD A TES 3.8.7 Environment and biodiversity A robust and systematic approach to environmental management of our activities, underpinned by credible science, are the key elements of Woodside’s approach to the environment. 2024 PERFORMANCE OVERVIEW Our operations and growth strategy depends on obtaining and maintaining our licence to operate. Given this, and the growing pressure on our natural environment, the environmental performance and the management of our environmental impacts is critical to the future success of our business. In 2024, there were a total of six environmental events related to the release of hydrocarbon and hazardous non-hydrocarbon substances greater than 1 barrel (bbl) to the environment. Two were hydrocarbon and four were hazardous non-hydrocarbon. All events, which occurred in Western Australia, were minor and did not reach the threshold to be defined as a ‘Moderate’ impact to the environment.1 The events classified as hazardous non-hydrocarbon contained mostly non-hazardous chemicals as assessed against the Offshore Chemical Notification Scheme (OCNS, UK), however, due to some trace elements present, they were considered hazardous by Woodside under local regulatory approvals. To uphold our commitment to minimising impacts and risks, we have updated and integrated our hydrocarbon spill preparedness and response framework across our global operations and activities. This approach allows us to effectively assess and manage spill risks to the marine environment in alignment with our environmental principles. In 2024, we developed new oil pollution emergency plans that contributed to regulatory acceptance of 11 environmental approvals across our Australian assets. Additionally, we implemented training and capability-building programs in the regions where we operate. Our collaboration with regional and international industry groups remains a priority, enabling us to proactively address and monitor emerging risks. Since December 2022, Woodside committed to supporting biodiversity outcomes in the regions in which we operate. Biodiversity positive projects are intended to result in a measurable outcome to a local species, habitat or ecological process. In 2024, we focused on expanding our biodiversity programs in Western Australia. We are undertaking biodiversity assessments and monitoring on several of our carbon origination projects in Western Australia and have commenced implementing additional measures to improve biodiversity outcomes. We continue to invest in science to support better environmental performance and outcomes. This science may be used to support the baseline or monitoring requirements associated with current and future environmental approvals. In 2024, we specifically focused on the management of underwater noise and artificial light. In addition, we conducted regional studies on key marine habitats and species in Australia’s northwest. These studies included extensive research on nearshore and offshore reefs, as well as on important migratory species such as pygmy blue whales, turtles, and shorebirds. In 2024, 18 scientific articles were published in international journals highlighting the findings of research undertaken by our research partnerships and supported by Woodside. In 2024, we complied with our Environment and Biodiversity Policy principles which include net zero deforestation across our global business, and our global activities were outside the boundaries of natural sites on the UNESCO World Heritage Areas. In addition, in areas where we operated within International Union for Conservation of Nature (IUCN) Protected Areas, our activities were aligned with the existing management plans for those regions. We also finalised our Biodiversity Management Plan Guidance, a key component of our Environment and Biodiversity Policy. In 2024, we contributed to Ipieca’s feedback on the TNFD’s draft Oil and Gas Sector Guidance. We actively participated in the Australian Climate Leaders Coalition (CLC) Nature Working Group in 2024, including the rollout of the NatSTART tool and involvement in a number of CLC Nature Catalyst sessions.2 See the Environment data table available on our website for other relevant metrics. 1. This metric is determined utilising Woodside’s risk matrix. Where there is an occurrence relevant to this metric, it is reported together with the reportable environmental events of hydrocarbon and hazardous non-hydrocarbon substances greater than 1 bbl. 2. https://www.climateleaders.org.au/publications/naturestarter/ Seedling planting in Australia. 2024 ANNUAL REPORT 65
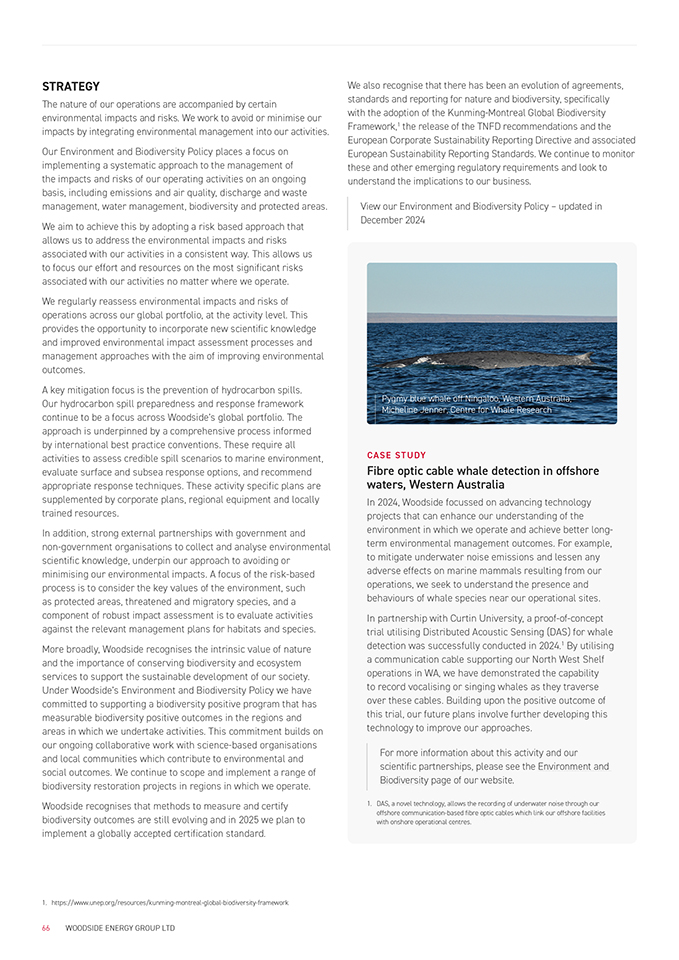
STRATEGY The nature of our operations are accompanied by certain environmental impacts and risks. We work to avoid or minimise our impacts by integrating environmental management into our activities. Our Environment and Biodiversity Policy places a focus on implementing a systematic approach to the management of the impacts and risks of our operating activities on an ongoing basis, including emissions and air quality, discharge and waste management, water management, biodiversity and protected areas. We aim to achieve this by adopting a risk based approach that allows us to address the environmental impacts and risks associated with our activities in a consistent way. This allows us to focus our effort and resources on the most significant risks associated with our activities no matter where we operate. We regularly reassess environmental impacts and risks of operations across our global portfolio, at the activity level. This provides the opportunity to incorporate new scientific knowledge and improved environmental impact assessment processes and management approaches with the aim of improving environmental outcomes. A key mitigation focus is the prevention of hydrocarbon spills. Our hydrocarbon spill preparedness and response framework continue to be a focus across Woodside’s global portfolio. The approach is underpinned by a comprehensive process informed by international best practice conventions. These require all activities to assess credible spill scenarios to marine environment, evaluate surface and subsea response options, and recommend appropriate response techniques. These activity specific plans are supplemented by corporate plans, regional equipment and locally trained resources. In addition, strong external partnerships with government and non-government organisations to collect and analyse environmental scientific knowledge, underpin our approach to avoiding or minimising our environmental impacts. A focus of the risk-based process is to consider the key values of the environment, such as protected areas, threatened and migratory species, and a component of robust impact assessment is to evaluate activities against the relevant management plans for habitats and species. More broadly, Woodside recognises the intrinsic value of nature and the importance of conserving biodiversity and ecosystem services to support the sustainable development of our society. Under Woodside’s Environment and Biodiversity Policy we have committed to supporting a biodiversity positive program that has measurable biodiversity positive outcomes in the regions and areas in which we undertake activities. This commitment builds on our ongoing collaborative work with science-based organisations and local communities which contribute to environmental and social outcomes. We continue to scope and implement a range of biodiversity restoration projects in regions in which we operate. Woodside recognises that methods to measure and certify biodiversity outcomes are still evolving and in 2025 we plan to implement a globally accepted certification standard. 1. https://www.unep.org/resources/kunming-montreal-global-biodiversity-framework We also recognise that there has been an evolution of agreements, standards and reporting for nature and biodiversity, specifically with the adoption of the Kunming-Montreal Global Biodiversity Framework,1 the release of the TNFD recommendations and the European Corporate Sustainability Reporting Directive and associated European Sustainability Reporting Standards. We continue to monitor these and other emerging regulatory requirements and look to understand the implications to our business. View our Environment and Biodiversity Policy – updated in December 2024 Pygmy blue whale off Ningaloo, Western Australia, Micheline Jenner, Centre for Whale Research C ASE S TUD Y Fibre optic cable whale detection in offshore waters, Western Australia In 2024, Woodside focussed on advancing technology projects that can enhance our understanding of the environment in which we operate and achieve better long- term environmental management outcomes. For example, to mitigate underwater noise emissions and lessen any adverse effects on marine mammals resulting from our operations, we seek to understand the presence and behaviours of whale species near our operational sites. In partnership with Curtin University, a proof-of-concept trial utilising Distributed Acoustic Sensing (DAS) for whale detection was successfully conducted in 2024.1 By utilising a communication cable supporting our North West Shelf operations in WA, we have demonstrated the capability to record vocalising or singing whales as they traverse over these cables. Building upon the positive outcome of this trial, our future plans involve further developing this technology to improve our approaches. For more information about this activity and our scientific partnerships, please see the Environment and Biodiversity page of our website. 1. DAS, a novel technology, allows the recording of underwater noise through our offshore communication-based fibre optic cables which link our offshore facilities with onshore operational centres. Kangaroo on the Burrup Peninsula 66 WOODSIDE ENERGY GROUP LTD
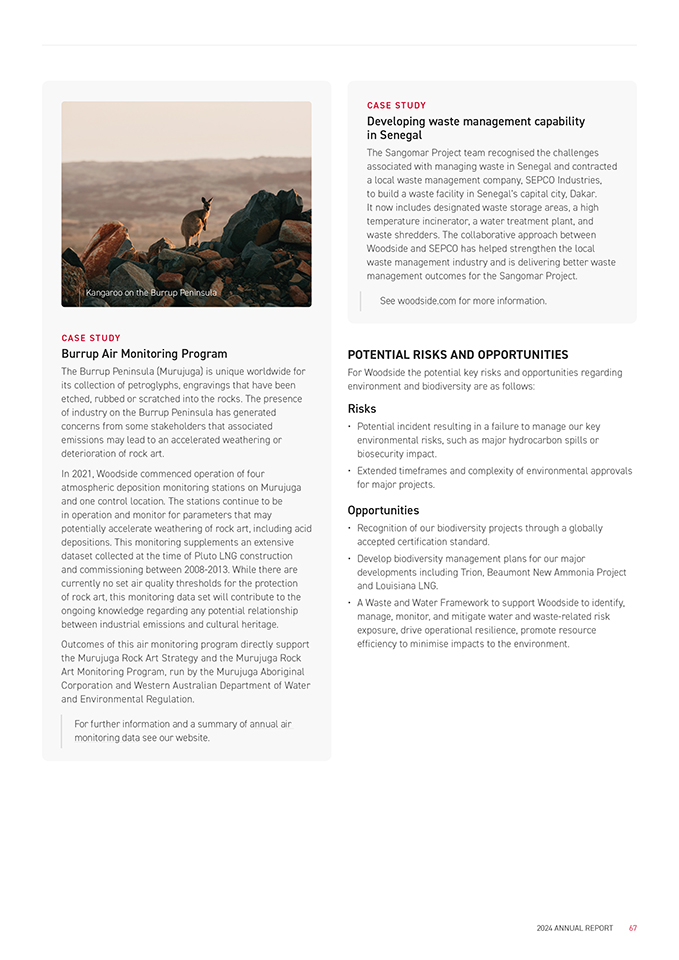
C ASE S TUD Y Burrup Air Monitoring Program The Burrup Peninsula (Murujuga) is unique worldwide for its collection of petroglyphs, engravings that have been etched, rubbed or scratched into the rocks. The presence of industry on the Burrup Peninsula has generated concerns from some stakeholders that associated emissions may lead to an accelerated weathering or deterioration of rock art. In 2021, Woodside commenced operation of four atmospheric deposition monitoring stations on Murujuga and one control location. The stations continue to be in operation and monitor for parameters that may potentially accelerate weathering of rock art, including acid depositions. This monitoring supplements an extensive dataset collected at the time of Pluto LNG construction and commissioning between 2008-2013. While there are currently no set air quality thresholds for the protection of rock art, this monitoring data set will contribute to the ongoing knowledge regarding any potential relationship between industrial emissions and cultural heritage. Outcomes of this air monitoring program directly support the Murujuga Rock Art Strategy and the Murujuga Rock Art Monitoring Program, run by the Murujuga Aboriginal Corporation and Western Australian Department of Water and Environmental Regulation. For further information and a summary of annual air monitoring data see our website. C ASE S TUD Y Developing waste management capability in Senegal The Sangomar Project team recognised the challenges associated with managing waste in Senegal and contracted a local waste management company, SEPCO Industries, to build a waste facility in Senegal’s capital city, Dakar. It now includes designated waste storage areas, a high temperature incinerator, a water treatment plant, and waste shredders. The collaborative approach between Woodside and SEPCO has helped strengthen the local waste management industry and is delivering better waste management outcomes for the Sangomar Project. See woodside.com for more information. POTENTIAL RISKS AND OPPORTUNITIES For Woodside the potential key risks and opportunities regarding environment and biodiversity are as follows: Risks • Potential incident resulting in a failure to manage our key environmental risks, such as major hydrocarbon spills or biosecurity impact. • Extended timeframes and complexity of environmental approvals for major projects. Opportunities • Recognition of our biodiversity projects through a globally accepted certification standard. • Develop biodiversity management plans for our major developments including Trion, Beaumont New Ammonia Project and Louisiana LNG. • A Waste and Water Framework to support Woodside to identify, manage, monitor, and mitigate water and waste-related risk exposure, drive operational resilience, promote resource efficiency to minimise impacts to the environment. 2024 ANNUAL REPORT 67
METRICS AND TARGETS This section explains a number of environment and biodiversity metrics that are relevant to Woodside’s assessment, management and performance against potential key risks and opportunities. For some of these metrics, targets have been adopted. These metrics have been selected as they aligned with our objectives and focus areas outlined in our Environment and Biodiversity Policy and guided by our sustainability reporting frameworks. No hydrocarbon and hazardous non-hydrocarbon spills that cause a ‘Moderate’ impact to the environment1 This metric measures any moderate impact to the environment from Woodside’s operations from a hydrocarbon or hazardous non-hydrocarbon spill. Environmental penalties This metric measures compliance against our regulatory commitments. Target 0 Target 0 2024 performance 0 2024 performance There were no significant fines and non-monetary sanctions for non-compliance with environmental laws and/or regulations in terms of: • total number of significant fines with monetary value greater than US$10,000; • total number of non-monetary sanctions; • cases brought through dispute resolution mechanisms in relation to environmental impact. Compliance with Environment and Biodiversity Policy principles – net zero deforestation for new activities2 Deforestation can lead to significant biodiversity loss. Woodside has committed to have net zero deforestation loss from operated global activities and operations as such is expected to be considered key to the readers of this report. Compliance with IUCN Protected Areas management plans To support the protection of the key environmental values of IUCN Protected Areas, Woodside complies with all relevant management plans as such is expected to be considered key to the readers of this report. No activities within natural World Heritage Areas (WHA) This metric is to avoid any activities within the boundaries of natural WHA to protect its outstanding universal values. Target Net zero deforestation for new activities Target Compliance achieved Target Compliance achieved 2024 performance Complied with Environment and Biodiversity Policy principles with net zero deforestation for new activities 2024 performance Compliance achieved 2024 performance Compliance achieved Further Environment and biodiversity information is available on the Environment and Biodiversity page of the Sustainability section of the Woodside website. 1. This metric is determined utilising Woodside’s risk matrix. Where there is an occurrence relevant to this metric, it is reported together with the reportable environmental events of hydrocarbon and hazardous non-hydrocarbon substances greater than 1 bbl 2. Woodside’s Environment and Biodiversity Policy outlines our deforestation principles and definition of a forest. 68 WOODSIDE ENERGY GROUP LTD
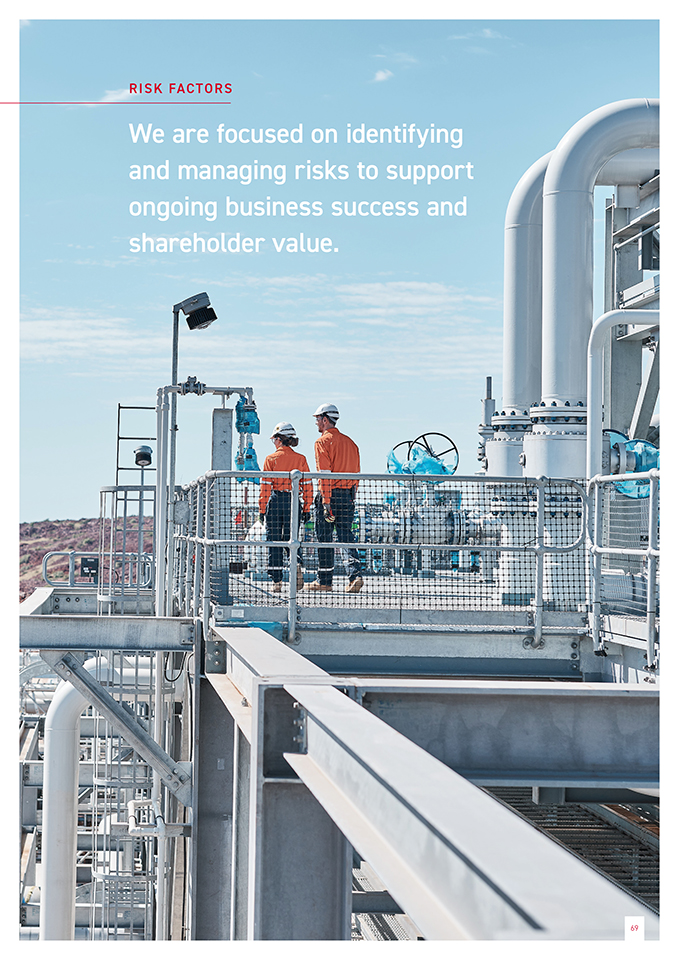
RISK FACTORS We are focused on identifying and managing risks to support ongoing business success and shareholder value. 2024 ANNUAL REPORT 69
3.9 OUR BUSINESS • RISK FACTORS Risk factors Woodside recognises that taking risk is necessary for our business and that effective risk management is vital to meeting our objectives. We are committed to managing risks in a proactive, informed and effective manner as a source of competitive advantage. Our approach is intended to enable risk-informed decision making, which protects us against potential negative impacts and enables us to seek the right opportunities. The objective of our risk management framework is to provide a consolidated view of risks across the company to understand our full risk exposure and prioritise risk management and governance. Woodside’s Risk Appetite Statement is a vital element of our risk framework. It sets out the Board’s appetite to take risk in pursuit of our strategic objectives. It provides guidance to the executive and senior management teams on the type and amount of risk that is acceptable when making decisions, consistent with other company policies. Woodside’s risk management process is designed to identify, assess and control risks across the organisation. Company-wide risk management activities occur throughout the year and are reported to the Audit & Risk Committee and executive twice annually, in addition to deep dives on particular risk areas that occur throughout the year. We categorise risks in three different ways: 1. Strategic risks These are risks within Woodside’s sphere of influence that could affect our ability to achieve our strategic objectives. Management and the Board consider a range of risks and opportunities that have the potential to deliver or erode value for our organisation in both the near and longer term. We factor these risks into our strategic decision-making, as the decisions we make can create, amplify, reduce, or remove current risks and improve our resilience to emerging risks. Examples of strategic risks and opportunities relevant to Woodside include delivering growth and long-term value through acquisitions and divestments, and the competitiveness of our portfolio mix under a range of scenarios. 2. Emerging risks These risks capture external threats or factors that have a high degree of uncertainty, are not readily controlled by Woodside and may be unpredictable or rapidly changing. They have the potential to materially affect the achievement of our strategic objectives. Examples include a shifting geopolitical landscape or rapid technological change. 3. Current risks These quantifiable risks could affect Woodside’s ability to deliver our objectives and require appropriate control and management. Informed by the International Standard ISO31000 for Risk Management, our risk management process involves these features: • Communicating and consulting • Defining risk scope, context and criteria • Assessing risk • Treating risk • Monitoring and review • Recording and reporting risks. The risk management process provides a consistent way of identifying, managing and reporting risks that have the potential to materially affect the achievement of Woodside’s objectives. Potential impacts of these risks, were they to eventuate, include those related to health and safety, the environment, the community and culture, our reputation and brand, legal and compliance, and financial. These impacts may lead to a loss in shareholder value, loss of market share to competitors, decreases in the value of assets, delays or stoppages in our operations, loss of revenue, increased expenses, infringements on our ability to execute and complete transactions, reduced capacity to fund capital projects, delayed or suspended regulatory approvals, legal liabilities and adverse impacts on Woodside’s reputation, social licence to operate and on the delivery of our strategy. Woodside prioritises risk management actions and governance through use of a risk register. The functionality within the register provides transparency and enhances the ability of senior leaders to effectively manage and govern risks, including checking that identified actions to address, manage or remove risk have been closed out. WOODSIDE’S RISK MANAGEMENT PROCESS The Audit & Risk Committee plays a crucial role in enabling the Board to meet its oversight responsibility in relation to Woodside’s risk management. The Sustainability Committee also focuses on sustainability-related risk management. Refer to section 4.1.3—Board committees for more information on the Audit & Risk Committee and the Sustainability Committee. For more information on Woodside’s risk management process, refer to our Risk Management Policy, available on our website at woodside.com. 70 WOODSIDE ENERGY GROUP LTD
OVERVIEW OF OUR RISK FACTORS HEALTH AND SAFETY Our business is subject to risks related to safety or major hazard events associated with our activities or facilities. These may include unanticipated or unforeseeable adverse events that affect our ability to respond, manage and recover from such events. How is this factor relevant to Woodside? At Woodside, we believe that our ability to operate safely is critical to our competitiveness. Failure to continue to do so could result in potential impacts on people, as well as reputational damage with customers, employees, commercial partners and other stakeholders, and sustained production interruptions leading to an inability to meet production forecasts. Examples of how this factor may impact Woodside • A loss of containment event or other operational incident on or related to our property or operations could occur, which could have significant impacts including to human health and safety, from personal health, safety and wellbeing through to fatalities. This could result in financial, legal and reputational impacts. • Natural disasters and severe weather events, such as cyclones, floods, freezes and heatwaves, droughts, earthquakes or other acts of nature, social unrest, pandemic diseases, and criminal actions by external parties could result in injuries, loss of life, disruption of our operations or the loss or suspension of permits or other approvals. Coastal operations may be particularly susceptible to severe weather events. • Woodside’s operations are subject to numerous laws and regulations relating to public and occupational health and safety. The requirements of these laws and regulations are becoming increasingly complex, stringent and expensive to implement and comply with. Other risks and opportunities are outlined in section 3.8 – Sustainability Report; Health, safety and wellbeing material sustainability topic. How is Woodside managing these risks? We implement a systematic approach to health, personal safety, and process safety risk management to minimise adverse health and safety risk related impacts. Our Code of Conduct, our Health and Safety Policy and our Working Respectfully Policy set the expectations that apply to all employees, contractors and joint venture participants engaged in activities under Woodside’s operational control. Leaders aim to create a culture in which everyone is encouraged to speak up and intervene on safety issues. Our competency framework includes risk management, process safety, emergency response procedures, human factors, and management of occupational health. We identify, assess and control risk by applying a consistent hierarchy of controls. Refer to section 3.8 – Sustainability Report; Health, safety and wellbeing material sustainability topic and the Sustainability section of our website for further information. 2024 ANNUAL REPORT 71
ENVIRONMENT Risks associated with major environmental incidents in connection with our activities or facilities include potential incidents resulting in significant loss of hydrocarbon. We are also subject to risks associated with biodiversity and failure to deliver emission reductions in a timely manner, consistent with regulatory and stakeholder expectations. How is this factor relevant to Woodside? Woodside’s operations are subject to environmental impacts or risks that can arise as a result of the nature of our operations. Examples of how this factor may impact Woodside • An incident may result in a significant loss of hydrocarbon to the environment including when caused by factors that are outside Woodside’s direct control. These factors include natural disasters, severe weather events, such as cyclones, floods, freezes and heatwaves, droughts, earthquakes or other acts of nature, pandemics, well blowouts, fires, explosions, pipeline ruptures, chemical releases, oil releases including maritime releases, releases into navigable waters and groundwater contamination, material or mechanical failure, power outages, industrial accidents, physical or cyber attacks, abnormally pressured or structured formations and other events that cause operations to cease or be curtailed. This may negatively affect Woodside’s businesses and the communities in which we operate. • Woodside’s operations are subject to numerous laws and regulations relating to environmental protection. The requirements of these laws and regulations are becoming increasingly complex, stringent and expensive to implement. Costs of compliance with these laws and regulations are significant and can be unpredictable. • Applicable laws and regulations may obligate Woodside to adjust our various operational practices, plans or strategies, which in turn could cause uncertainty and delay, materially adversely affect our business, financial condition or results of operations. We may also be required to maintain financial assurance through bonds or insurance. • Third-party insurance may not provide adequate coverage or Woodside may be self-insured with respect to the related losses. Other risks and opportunities are outlined in section 3.8 – Sustainability Report; Environment and biodiversity material sustainability topic. How is Woodside managing these risks? We work to avoid incidents and prevent harm to the environment by integrating environmental management into our activities, including the design, construction, operation and decommissioning of our facilities. Our Environment and Biodiversity Policy sets the expectation to implement a systematic approach to the management of environmental impacts and risks. Our hydrocarbon spill preparedness and response framework is underpinned by a comprehensive process informed by international best practice conventions. Our risk-based approach is supported through strong external partnerships with government and non-government organisations to collect and analyse environmental scientific knowledge. Refer to section 3.8 – Sustainability Report; Environment and biodiversity material sustainability topic and the Sustainability section of our website for further information. 72 WOODSIDE ENERGY GROUP LTD
CLIMATE The global response to climate change is changing the way the world produces and consumes energy. The inherent uncertainty of potential societal responses to climate change may create a systemic risk to the global economy. Legislative and regulatory programs to reduce emissions have been introduced, or are pending, in response to political, social and industry attention on climate change. Climate change may also create significant physical risks, such as increased frequency and severity of storms, wildfires, floods and other climatic events, as well as chronic shifts in temperature and precipitation patterns. How is this factor relevant to Woodside? Woodside’s risks associated with climate change and the transition to a lower-carbon economy include possible impacts to demand (and pricing) for oil, gas and their substitutes, as well as reputation. Examples of how this factor may affect Woodside • Physical impacts or disruptions to our assets or those of our suppliers, customers or communities. • Over and under investment in oil and gas reserves leading to an imbalance between supply and global demand. • Failure to transition to new energy at a pace that serves the global demand, or to develop and implement lower-carbon technologies. • Successful implementation of new and existing technologies on an industrial scale, may require more capital, or take longer than currently expected. • Climate-driven changes to legislation, regulation and policy or climate-related litigation resulting in additional costs, preventing or restricting Woodside from conducting activities. • Failure of other organisations to meet emissions targets across industry and the reputational impacts for the industry as a whole. Other risks and opportunities are outlined in section 3.8 – Sustainability Report; Climate material sustainability topic. How is Woodside managing these risks? Woodside is working to meet its net equity Scope 1 and 2 GHG emissions reduction targets, and to invest in products and services for the energy transition in accordance with our capital allocation framework. This includes oil, gas, new energy products and lower-carbon services. We engage and advocate with key industry and governance stakeholders to understand and consult on key policies and legislation and to inform our strategic decision-making. An index of our various 2024 climate-related disclosures is provided in the Sustainability section of our website at woodside.com. Refer to section 3.8 – Sustainability Report; Climate material sustainability topic and the Sustainability section of our website for further information. 2024 ANNUAL REPORT 73
PRODUCTION AND OPERATIONS We manage a range of risks within our operations, including commercial risks relating to third-party relationships such as joint venture partners, contract counterparties and our supply chain. Woodside is subject to extensive governmental oversight and regulation in the jurisdictions in which we operate, and such regulations may change in ways that adversely affect our business, results of operations and financial condition. In addition, we are required to comply with securities regulations in Australia, the United States and elsewhere. We manage the estimation of proved oil and gas reserves by using judgement and the application of complex rules. How is this factor relevant to Woodside? Our operating assets are subject to a range of risks associated with process safety incidents, breaches of cybersecurity, extreme weather events and supply chain disruptions, potentially impacting our production, operations, financial performance and reputation. Joint ventures may limit our control over, and our ability to effectively manage risks associated with our major projects. For projects where we are not the operator, we may be unable to directly control the behaviour, performance and cost of operations. Our operations are subject to operating and capital expenditures to comply with various national and local laws, regulations and approvals. More stringent standards for greenhouse gas emissions could lead to operational restrictions, increased compliance costs and changes in product pricing and demand. Examples of how this factor may impact Woodside • Our joint venture participants (JVP) may have the ability to exercise veto rights to block certain key decisions or actions that we believe are in our or the joint venture’s best interests or approve those matters without our support. • Our JVP and contractual counterparties may not be able to meet their financial or other obligations and their actions could result in legal liability and financial loss for Woodside. • The suspension, revocation, failure to renew or alteration of, or challenges to, the terms of the licences, permits, government contracts or approvals required for our operations. • Government policy objectives in the countries in which we do business, now or in the future, could take the form of increased governmental regulations relating to environment, biodiversity, climate, taxation, lease retention, contracts and other commercial matters. • A failure to comply with applicable laws, regulations and approvals may result in action, including fines and sanctions being taken against Woodside that could result in cost increases, schedule delays or stoppages or production and operation impacts. Actual or alleged violations of the securities laws that we are subject to could result in private or governmental litigation, civil penalties, regulatory action and shareholder class actions. • Supply chain disruptions such as extended lead times for critical spares or imposition of trade sanctions or export controls on key suppliers, may cause outages at our operations, increased costs or delays on our projects. • The geographical locations for our operations may present challenges and risks. For example, certain activities undertaken in deep waters are more difficult and costly than in shallower waters and require significant time between the discovery and the time that Woodside can market its production. • Joint participants or contractual counterparties may be primarily responsible for the adequacy of the human or technical competencies and capabilities which they bring to bear on the joint project, which may not be adequate. • Actual or alleged violations of the securities laws that we are subject to could result in private or governmental litigation, civil penalties, regulatory action and shareholder class actions. 74 WOODSIDE ENERGY GROUP LTD

PRODUCTION AND OPERATIONS (CONT’D) How is Woodside managing these risks? Safe and sustainable operation is fundamentally embedded through an extensive framework of controls that deliver strong operational performance in our base business. The framework includes production, drilling and completions and well-integrity management processes, inspection and maintenance procedures and performance standards. The framework is supported and inspected on an ongoing basis by our regulators. The process of estimating oil and natural gas reserves is complex and requires significant decisions and assumptions. Actual production, revenues, expenditures, prices of hydrocarbons and taxes with respect to Woodside’s reserves may vary from estimates and the variance may be material. Woodside may record impairments resulting from declines in oil and gas prices or other factors. Downward adjustments of our reported reserves estimates could indicate lower future production volumes or the impairment of assets. Decommissioning is integrated into project planning. We work with our partners and technical experts to identify sustainable post- closure options that minimise financial, social and environmental impacts. We adapt our execution and contractor management strategies to mitigate the impacts of supply chain risks. The framework is adaptable to enable us to maintain and improve our operating model and performance, target reliability, cost discipline, emissions reductions and strong safety and environmental performance for both our existing business and future growth opportunities. 2024 ANNUAL REPORT 75
GROWTH Growth risks associated with delivery of both major and complex multi-year execution project activities and transactions (including acquisitions and divestments) across multiple locations around the world, including a reliance on third parties for materials, products and services. How is this factor relevant to Woodside? Oil and gas Woodside must continue to identify growth opportunities, organic and inorganic, and commercialise them. Woodside competes with a wide range of companies as we seek to continue to expand Woodside’s current operations and deliver shareholder value. Woodside effectively manages relationships with industry partners, including when we enter joint ventures with organisations that may also be competing oil and gas suppliers. In addition, our current and planned projects involve uncertainties and operating risks that could prevent us from realising profits or result in the total or partial loss of our investment. New energy We have set targets for our new energy products and lower-carbon services.1 There is uncertainty around the pace of required technological innovation and the reliability of technologies that will be needed to transition to a lower-carbon economy. New sources of energy, such as hydrogen or ammonia, may be more difficult to commercialise than expected or may not be able to be commercialised safely or as efficiently as expected at scale. Woodside may also face unforeseen obstacles in the commercialisation of a future carbon capture business and in the implementation of other lower-carbon services and emission reduction efforts. Examples of how this factor may impact Woodside • An unbalanced portfolio of oil and gas and new energy, which may not meet the market’s needs. • Limited or reduced market share resulting in a loss of shareholder value and a failure to deliver expected returns. • Project schedule delays or cost increases due to labour or material shortages, geopolitical conflicts, regulatory approvals or other unanticipated events. • Failure to identify, execute or implement strategic transactions, including acquisitions and divestments, or to achieve the full benefits of those transactions. • The development of acquired assets may lead to significant capital and operating expenses being incurred. This may result in a requirement to incur additional debt, and we may not be able to obtain financing in the future on acceptable terms. • Credit rating agencies could downgrade our credit ratings below currently expected levels. • Woodside may be unable to compete with other larger companies in the industry with greater resources at their disposal. How is Woodside managing these risks? We aim to identify and progress a suite of commercially attractive and sustainable opportunities that complement our existing assets, enable portfolio diversity and optimise our commercial position. Our opportunity management framework is flexible and adaptable. The primary objective of this framework is to realise the value of an opportunity while mitigating the risk of a suboptimal outcome for our organisation, our shareholders and our communities. 1. Scope 3 targets are subject to commercial arrangements, commercial feasibility, regulatory and Joint Venture approvals, and third-party activities (which may or may not proceed). Individual investment decisions are subject to Woodside’s investment targets. Not guidance. Potentially includes both organic and inorganic investment. 76 WOODSIDE ENERGY GROUP LTD
SOCIAL LICENCE Social licence risks are associated with actual or perceived deviation from social or business expectations of ethical behaviour (including breaches of laws or regulations) and social responsibility (including community contribution and impacts on the environment, climate, biodiversity, human rights or cultural heritage), particularly as these expectations evolve and as Woodside expands its operations around the world. Communities, First Nations Peoples including Traditional Owners and Custodians, government authorities, investors and other groups form significant relationships with our organisation on the basis that Woodside will meet our stakeholders’ expectations. Examples of how this factor may impact Woodside • Lost or limited stakeholder support for our current business and future opportunities, resulting in refusal or delay in approvals, permits or authorisations and potential cost overruns. • New or amended laws and regulations, or new or different applications or interpretations of existing laws and regulations. • Risks related to the violation of certain laws and regulations, including class action lawsuits, litigation and activism, allegations of legal compliance failures and greenwashing. • Reductions in the availability of, or less favourable terms for, financing and other forms of capital. • Third-party risks that are outside of our control could negatively affect our reputation and licence to operate, including reputational damage to the oil and gas industry at large. Other risks and opportunities are outlined in section 3.8 – Sustainability Report; First Nations cultural heritage and engagement material sustainability topic. How is Woodside managing these risks? Woodside proactively maintains and builds our social licence to operate through the application of our values, effective stakeholder engagement strategies, our regulatory compliance framework and our anti-fraud and corruption program. Our business conduct is informed by the UN Guiding Principles on Business and Human Rights, which set a global standard of conduct for all businesses wherever they operate. These principles apply in addition to compliance with national laws and regulations protecting human rights. Refer to section 3.8 – Sustainability Report; First Nations cultural heritage and engagement material sustainability topic and the Sustainability section of our website for further information. 2024 ANNUAL REPORT 77
PEOPLE AND CULTURE These risks are associated with the ability to attract, retain, develop and motivate employees to succeed and safeguard both current and future performance and growth. How is this factor relevant to Woodside? People are key to the success of Woodside. We must build and maintain a capable workforce if we are to achieve our objectives. An effective operating model with a balanced organisational structure will allow us to conduct our operations and pursue new opportunities. For Woodside to remain an employer of choice, our culture must support our current employees and attract the best new candidates. The conduct of Woodside, our employees and our third-party partners could result in actual or alleged breaches of laws, regulations and approvals, including fraud, corruption, anti-competitive behaviour, money laundering, breaching trade or financial sanctions, market manipulation, privacy breaches, ethical misconduct and wider organisational cultural failings. Examples of how this factor may impact Woodside • During periods of high demand for skilled resources, Woodside may be unable to fill critical roles at acceptable costs or at all, leading to operational impacts. • A limited ability to operate due to our people leaving critical roles. • An inability to pursue innovation opportunities due to a skills shortage. • Loss of key personnel or expert knowledge. • Actual or alleged misconduct, including fraud and corruption. • An inability to reach timely agreements with employees including where representation by third parties may result in industrial action. How is Woodside managing these risks? Woodside has a set of resourcing frameworks to attract, retain and develop our workforce to support both existing business and growth opportunities. We recognise and value the benefits of creating an inclusive and diverse working environment. We set the expectation for ethical behaviour through the application of Our Values, Code of Conduct and other relevant policies. This is supported by a framework of monitoring, governance and training. We employ a direct engagement model to maintain effective employee and industrial relations. We engage with employees and their representatives where required and strive to maintain positive relationships. We proactively engage our major contractors and suppliers to strengthen alignment with expectations, securing capability and pricing to meet future business needs. Further information on this topic can be found in the People and Culture section of our website. 78 WOODSIDE ENERGY GROUP LTD
FINANCIAL MANAGEMENT These risks are those associated with interest rates, inflation, and fluctuations in commodity price and foreign exchange. How is this factor relevant to Woodside? Woodside must be financially well positioned in order to pursue our strategic objectives and remain resilient during times of economic challenge. Several factors can affect our position. Woodside must be financially well positioned in order to pursue our strategic objectives and remain resilient during times of economic challenge. Several factors can affect our position. Capital management For Woodside to operate sustainably we must make risk informed decisions related to allocation of capital. We seek to apply a disciplined and balanced approach to capital management through the commodity price cycle. Section 2.2 – Capital management contains further information. From time to time, Woodside has relied on access to capital markets for funding. Our ability to obtain additional financing or refinancing will be subject to a number of factors, including general economic and market conditions such as rising interest rates, inflation or unstable or illiquid market conditions. Foreign exchange risk Woodside is exposed to foreign currency risk from future commitments, financial assets and financial liabilities that are not denominated in US dollars. Section A in the Notes to the Financial Statements also provides further information. Interest rate risk This is the risk that Woodside’s financial position will fluctuate due to changes in market interest rates. Woodside’s risk relates primarily to financial instruments with floating interest rates including long-term debt obligations, cash and short-term deposits. Section C in the Notes to the Financial Statements contain further information. Examples of how this factor may impact Woodside • A reduced ability to fund our strategy including our projects. • Impairments of assets, goodwill or other intangible assets, or a significant increase in capital and operational expenditure as a result of acquisitions, could have a significant negative effect on our reported net income and our ability to pay dividends in one or more accounting periods if the level of impairment were to exceed profits available for distribution. How is Woodside managing these risks? A flexible approach to capital management enables the overall level of investment in the different areas of our business and the mix to be adjusted with consideration of the external environment. Our capital management strategy focuses on capital allocation, capital discipline and efficiency, and active balance sheet management including commodity and foreign exchange hedging. Woodside hedges to protect the balance sheet against downside commodity price risk, particularly during periods of high capital expenditure. The US dollar reflects the majority of Woodside’s underlying cash flows and is used in our financial reporting, reducing our exposure to currency fluctuations. We maintain insurance in line with industry practice and sufficient to cover normal operational risks. Woodside is not insured against all potential risks because not all risks can be insured and because of constraints on the availability of commercial insurance in global markets. Insurance coverage is determined by the availability of commercial options and cost-benefit analysis, taking into account Woodside’s risk management program. Losses that are not insured could affect Woodside’s financial performance. For example, Woodside does not purchase insurance for the loss of revenue arising from an operational interruption. Our extensive framework of financial controls, including monitoring of counterparties, enables the management of these risks. 2024 ANNUAL REPORT 79
COMMERCIAL AND MARKET Commercial and market risks are associated with the ability to capture value whether markets are stable or volatile. Generally, Woodside does not have control over the factors that affect market development and prices. How is this factor relevant to Woodside? Woodside’s revenues are primarily derived from the sale of oil and gas. The prices Woodside receives for these products are variable and are affected by global economic factors beyond Woodside’s control. We seek to forecast changes in the economic factors to enable us to maintain a strong market position during challenging economic times. Section 6.3—Additional disclosures and section A in the Notes to the Financial Statements provides further information. Examples of how this factor may impact Woodside • Significant volatility in energy prices, such as the volatility experienced in recent years, may increase the challenges associated with future revenue and delivery of our strategy • An imbalance in supply and demand can affect commodity prices; our ability to forecast market conditions determines whether we are affected positively or negatively. • Woodside may become a less attractive joint venture participant. • Shareholder returns are reduced due to lower commodity prices. • Woodside’s acquisition activities carry risks that it may not fully realise anticipated benefits due to less-than-expected reserves or production or changed circumstances, such as price decline or an inability to capture market optimisation opportunities; bear unexpected integration costs or experience other integration difficulties; experience share price declines based on the market’s evaluation of the activity; or be subject to liabilities that are greater than anticipated. • If we inaccurately forecast the global demand for our LNG products we may face difficulties obtaining longer-term sales contracts with desirable commercial terms. • If counterparties to our derivative instruments are unable to fulfil their obligations, a larger percentage of our future oil and gas production could be subject to price changes. How is Woodside managing these risks? The delivery of our strategic portfolio objectives requires significant capital expenditure, supported by strong underlying cash flows. Uncertainty associated with product demand is mitigated by selling LNG in a portfolio manner and under long-term take or pay sale agreements, in addition to the spot market. Our low cost of production and prudent approach to balance sheet risk management further mitigates this exposure. Refer to section 6.3—Additional disclosures and section A in the Notes to the Financial Statements for further information. 80 WOODSIDE ENERGY GROUP LTD
These risks are associated with adopting and implementing new technologies, while safeguarding our digital information and landscape (including from cyber threats) across our value chain. Woodside must protect the confidentiality, integrity and availability of digital information and operational technologies. Woodside’s technology systems, including artificial intelligence and machine learning, may be targeted by an internal or external malicious act or our systems may be disrupted unintentionally. Additionally, the cost of implementing and maintaining effective technology systems may be higher than anticipated. While our technology controls are designed to protect against all causes of disruption, we cannot be certain that they will protect our systems in all cases. Examples of how this factor may impact Woodside • In the event of a cyber attack, Woodside’s confidential or sensitive information may be made public or held for ransom. • Our operations may be disrupted if unauthorised access to our process control systems, or the systems of vendors on which we rely, occurs. • Litigation and governmental investigations may arise from the occurrence of a cyber attack. • There may be potential adverse impacts on our reputation, the safety and privacy of our employees and the communities in which we operate. How is Woodside managing these risks? We are committed to the protection of our people, assets, reputation and brand through securely enabled digital technologies. Digital risks are identified, assessed and managed based on the business criticality of our people, data and systems, and may be required to be segregated and isolated. This process also applies to digital risks relating to third parties, including suppliers and service providers, within our supply chain. Our operating model aims to continuously assess and determine access permissions to critical information or data, while consolidating, simplifying and automating security controls. Our exposure to cyber risk is managed by a control framework to identify, contain and recover from cyber events in a timely manner, and embeds a cyber-safe culture across the company, with our joint venture partners and in our supply chain. But, due to the rapid evolution of cyber threats, there can be no certainty that such controls will be sufficient to prevent all security breaches. Refer to section 4.1.6—Risk management and internal control and section 6.3—Additional disclosures and the Cybersecurity section of our website for further information on cybersecurity. 2024 ANNUAL REPORT 81
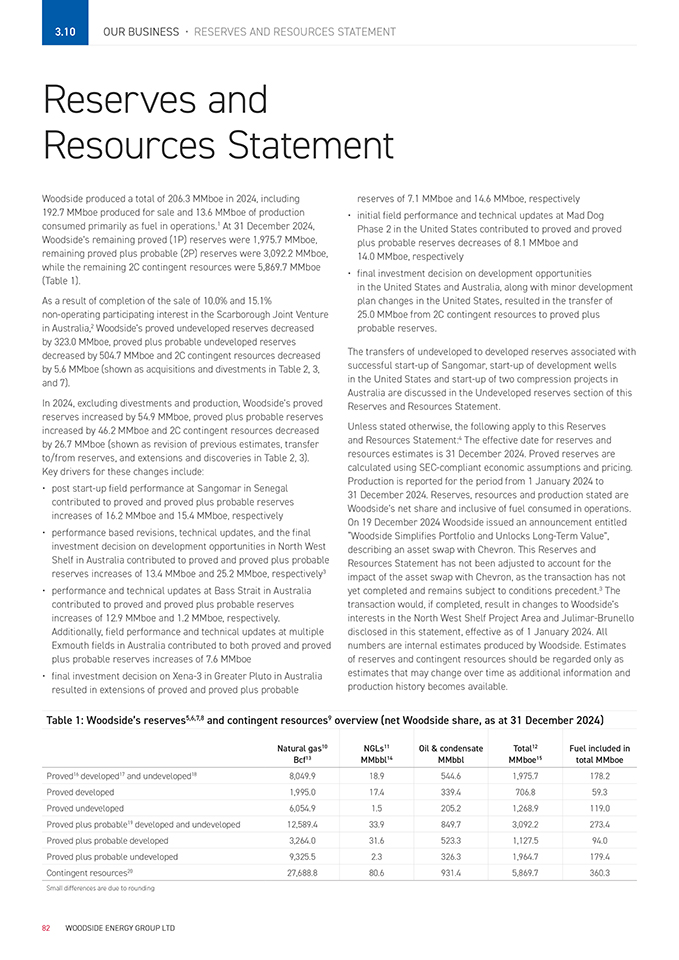
3.10 OUR BUSINESS • RESERVES AND RESOURCES STATEMENT Reserves and Resources Statement Woodside produced a total of 206.3 MMboe in 2024, including 192.7 MMboe produced for sale and 13.6 MMboe of production consumed primarily as fuel in operations.1 At 31 December 2024, Woodside’s remaining proved (1P) reserves were 1,975.7 MMboe, remaining proved plus probable (2P) reserves were 3,092.2 MMboe, while the remaining 2C contingent resources were 5,869.7 MMboe (Table 1). As a result of completion of the sale of 10.0% and 15.1% non-operating participating interest in the Scarborough Joint Venture in Australia,2 Woodside’s proved undeveloped reserves decreased by 323.0 MMboe, proved plus probable undeveloped reserves decreased by 504.7 MMboe and 2C contingent resources decreased by 5.6 MMboe (shown as acquisitions and divestments in Table 2, 3, and 7). In 2024, excluding divestments and production, Woodside’s proved reserves increased by 54.9 MMboe, proved plus probable reserves increased by 46.2 MMboe and 2C contingent resources decreased by 26.7 MMboe (shown as revision of previous estimates, transfer to/from reserves, and extensions and discoveries in Table 2, 3). Key drivers for these changes include: • post start-up field performance at Sangomar in Senegal contributed to proved and proved plus probable reserves increases of 16.2 MMboe and 15.4 MMboe, respectively • performance based revisions, technical updates, and the final investment decision on development opportunities in North West Shelf in Australia contributed to proved and proved plus probable reserves increases of 13.4 MMboe and 25.2 MMboe, respectively3 • performance and technical updates at Bass Strait in Australia contributed to proved and proved plus probable reserves increases of 12.9 MMboe and 1.2 MMboe, respectively. Additionally, field performance and technical updates at multiple Exmouth fields in Australia contributed to both proved and proved plus probable reserves increases of 7.6 MMboe • final investment decision on Xena-3 in Greater Pluto in Australia resulted in extensions of proved and proved plus probable reserves of 7.1 MMboe and 14.6 MMboe, respectively • initial field performance and technical updates at Mad Dog Phase 2 in the United States contributed to proved and proved plus probable reserves decreases of 8.1 MMboe and 14.0 MMboe, respectively • final investment decision on development opportunities in the United States and Australia, along with minor development plan changes in the United States, resulted in the transfer of 25.0 MMboe from 2C contingent resources to proved plus probable reserves. The transfers of undeveloped to developed reserves associated with successful start-up of Sangomar, start-up of development wells in the United States and start-up of two compression projects in Australia are discussed in the Undeveloped reserves section of this Reserves and Resources Statement. Unless stated otherwise, the following apply to this Reserves and Resources Statement:4 The effective date for reserves and resources estimates is 31 December 2024. Proved reserves are calculated using SEC-compliant economic assumptions and pricing. Production is reported for the period from 1 January 2024 to 31 December 2024. Reserves, resources and production stated are Woodside’s net share and inclusive of fuel consumed in operations. On 19 December 2024 Woodside issued an announcement entitled “Woodside Simplifies Portfolio and Unlocks Long-Term Value”, describing an asset swap with Chevron. This Reserves and Resources Statement has not been adjusted to account for the impact of the asset swap with Chevron, as the transaction has not yet completed and remains subject to conditions precedent.3 The transaction would, if completed, result in changes to Woodside’s interests in the North West Shelf Project Area and Julimar-Brunello disclosed in this statement, effective as of 1 January 2024. All numbers are internal estimates produced by Woodside. Estimates of reserves and contingent resources should be regarded only as estimates that may change over time as additional information and production history becomes available. Table 1: Woodside’s reserves5,6,7,8 and contingent resources9 overview (net Woodside share, as at 31 December 2024) Natural gas10 Bcf13 NGLs11 MMbbl14 Oil & condensate MMbbl Total12 MMboe15 Fuel included in total MMboe Proved16 developed17 and undeveloped188,049.918.9544.61,975.7178.2 Proved developed1,995.017.4339.4706.859.3 Proved undeveloped6,054.91.5205.21,268.9119.0 Proved plus probable19 developed and undeveloped12,589.433.9849.73,092.2273.4 Proved plus probable developed3,264.031.6523.31,127.594.0 Proved plus probable undeveloped9,325.52.3326.31,964.7179.4 Contingent resources2027,688.880.6931.45,869.7360.3 Small differences are due to rounding 82 WOODSIDE ENERGY GROUP LTD
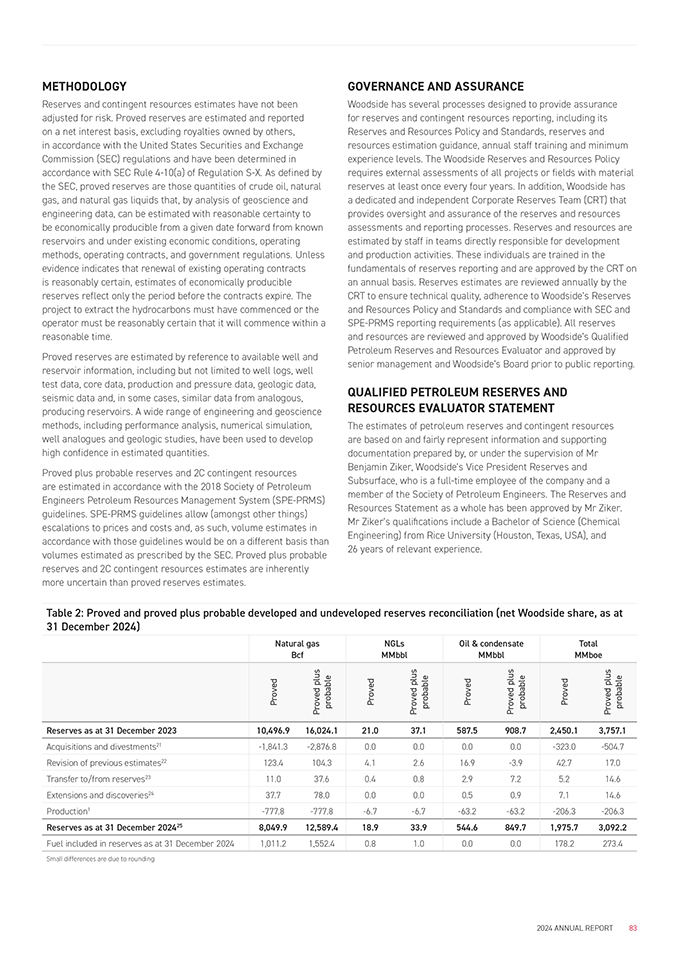
METHODOLOGY Reserves and contingent resources estimates have not been adjusted for risk. Proved reserves are estimated and reported on a net interest basis, excluding royalties owned by others, in accordance with the United States Securities and Exchange Commission (SEC) regulations and have been determined in accordance with SEC Rule 4-10(a) of Regulation S-X. As defined by the SEC, proved reserves are those quantities of crude oil, natural gas, and natural gas liquids that, by analysis of geoscience and engineering data, can be estimated with reasonable certainty to be economically producible from a given date forward from known reservoirs and under existing economic conditions, operating methods, operating contracts, and government regulations. Unless evidence indicates that renewal of existing operating contracts is reasonably certain, estimates of economically producible reserves reflect only the period before the contracts expire. The project to extract the hydrocarbons must have commenced or the operator must be reasonably certain that it will commence within a reasonable time. Proved reserves are estimated by reference to available well and reservoir information, including but not limited to well logs, well test data, core data, production and pressure data, geologic data, seismic data and, in some cases, similar data from analogous, producing reservoirs. A wide range of engineering and geoscience methods, including performance analysis, numerical simulation, well analogues and geologic studies, have been used to develop high confidence in estimated quantities. Proved plus probable reserves and 2C contingent resources are estimated in accordance with the 2018 Society of Petroleum Engineers Petroleum Resources Management System (SPE-PRMS) guidelines. SPE-PRMS guidelines allow (amongst other things) escalations to prices and costs and, as such, volume estimates in accordance with those guidelines would be on a different basis than volumes estimated as prescribed by the SEC. Proved plus probable reserves and 2C contingent resources estimates are inherently more uncertain than proved reserves estimates. GOVERNANCE AND ASSURANCE Woodside has several processes designed to provide assurance for reserves and contingent resources reporting, including its Reserves and Resources Policy and Standards, reserves and resources estimation guidance, annual staff training and minimum experience levels. The Woodside Reserves and Resources Policy requires external assessments of all projects or fields with material reserves at least once every four years. In addition, Woodside has a dedicated and independent Corporate Reserves Team (CRT) that provides oversight and assurance of the reserves and resources assessments and reporting processes. Reserves and resources are estimated by staff in teams directly responsible for development and production activities. These individuals are trained in the fundamentals of reserves reporting and are approved by the CRT on an annual basis. Reserves estimates are reviewed annually by the CRT to ensure technical quality, adherence to Woodside’s Reserves and Resources Policy and Standards and compliance with SEC and SPE-PRMS reporting requirements (as applicable). All reserves and resources are reviewed and approved by Woodside’s Qualified Petroleum Reserves and Resources Evaluator and approved by senior management and Woodside’s Board prior to public reporting. QUALIFIED PETROLEUM RESERVES AND RESOURCES EVALUATOR STATEMENT The estimates of petroleum reserves and contingent resources are based on and fairly represent information and supporting documentation prepared by, or under the supervision of Mr Benjamin Ziker, Woodside’s Vice President Reserves and Subsurface, who is a full-time employee of the company and a member of the Society of Petroleum Engineers. The Reserves and Resources Statement as a whole has been approved by Mr Ziker. Mr Ziker’s qualifications include a Bachelor of Science (Chemical Engineering) from Rice University (Houston, Texas, USA), and 26 years of relevant experience. Table 2: Proved and proved plus probable developed and undeveloped reserves reconciliation (net Woodside share, as at 31 December 2024) Natural gas Bcf NGLs MMbblOil & condensate MMbblTotal MMboe Proved Proved plus probable Proved Proved plus probable Proved Proved plus probable Proved Proved plus probable Reserves as at 31 December 202310,496.916,024.121.037.1587.5908.72,450.13,757.1 Acquisitions and divestments21-1,841.3-2,876.80.00.00.00.0-323.0-504.7 Revision of previous estimates22123.4104.34.12.616.9-3.942.717.0 Transfer to/from reserves2311.037.60.40.82.97.25.214.6 Extensions and discoveries2437.778.00.00.00.50.97.114.6 Production1-777.8-777.8-6.7-6.7-63.2-63.2-206.3-206.3 Reserves as at 31 December 2024258,049.912,589.418.933.9544.6849.71,975.73,092.2 Fuel included in reserves as at 31 December 20241,011.21,552.40.81.00.00.0178.2273.4 Small differences are due to rounding 2024 ANNUAL REPORT 83
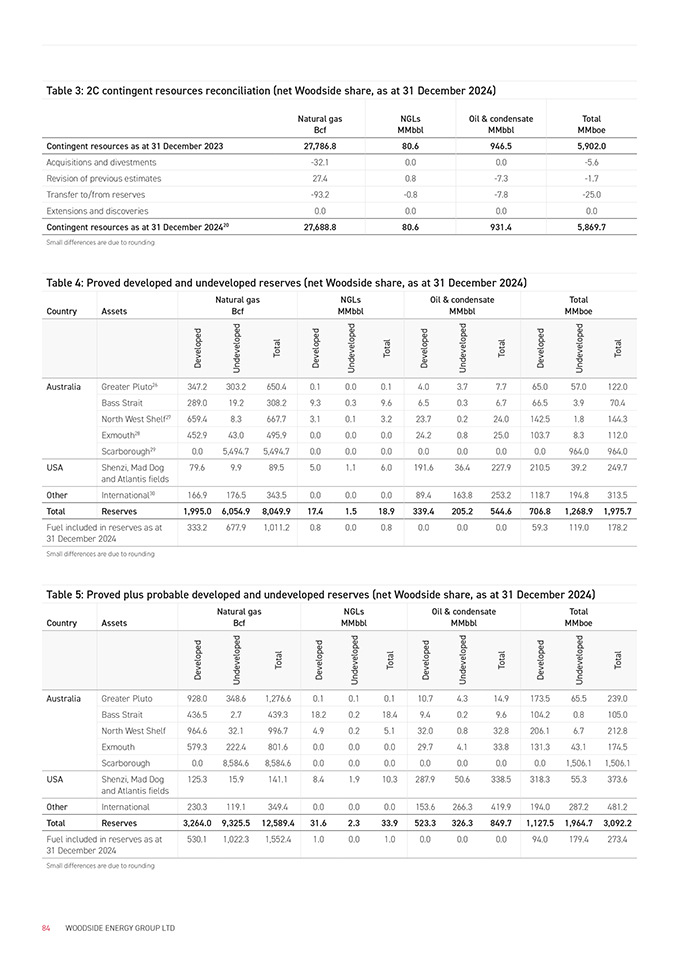
Table 3: 2C contingent resources reconciliation (net Woodside share, as at 31 December 2024) Natural gas Bcf NGLs MMbbl Oil & condensate MMbbl Total MMboe Contingent resources as at 31 December 202327,786.880.6946.55,902.0 Acquisitions and divestments-32.10.00.0-5.6 Revision of previous estimates27.40.8-7.3-1.7 Transfer to/from reserves-93.2-0.8-7.8-25.0 Extensions and discoveries0.00.00.00.0 Contingent resources as at 31 December 20242027,688.880.6931.45,869.7 Small differences are due to rounding Table 4: Proved developed and undeveloped reserves (net Woodside share, as at 31 December 2024) Country AssetsNatural gas BcfNGLs MMbblOil & condensate MMbblTotal MMboe Developed Undeveloped Total Developed Undeveloped Total Developed Undeveloped Total Developed Undeveloped Total AustraliaGreater Pluto26347.2303.2650.40.10.00.14.03.77.765.057.0122.0 Bass Strait289.019.2308.29.30.39.66.50.36.766.53.970.4 North West Shelf27659.48.3667.73.10.13.223.70.224.0142.51.8144.3 Exmouth28452.943.0495.90.00.00.024.20.825.0103.78.3112.0 Scarborough290.05,494.75,494.70.00.00.00.00.00.00.0964.0964.0 USAShenzi, Mad Dog and Atlantis fields79.69.989.55.01.16.0191.636.4227.9210.539.2249.7 OtherInternational30166.9176.5343.50.00.00.089.4163.8253.2118.7194.8313.5 TotalReserves1,995.0 6,054.98,049.917.41.518.9339.4205.2544.6706.81,268.9 1,975.7 Fuel included in reserves as at 31 December 2024333.2677.91,011.20.80.00.80.00.00.059.3119.0178.2 Small differences are due to rounding Table 5: Proved plus probable developed and undeveloped reserves (net Woodside share, as at 31 December 2024) Country AssetsNatural gas BcfNGLs MMbblOil & condensate MMbblTotal MMboe Developed Undeveloped Total Developed Undeveloped Total Developed Undeveloped Total Developed Undeveloped Total AustraliaGreater Pluto928.0348.61,276.60.10.10.110.74.314.9173.565.5239.0 Bass Strait436.52.7439.318.20.218.49.40.29.6104.20.8105.0 North West Shelf964.632.1996.74.90.25.132.00.832.8206.16.7212.8 Exmouth579.3222.4801.60.00.00.029.74.133.8131.343.1174.5 Scarborough0.08,584.68,584.60.00.00.00.00.00.00.01,506.11,506.1 USAShenzi, Mad Dog and Atlantis fields125.315.9141.18.41.910.3287.950.6338.5318.355.3373.6 OtherInternational230.3119.1349.40.00.00.0153.6266.3419.9194.0287.2481.2 TotalReserves3,264.0 9,325.5 12,589.431.62.333.9523.3326.3849.71,127.5 1,964.7 3,092.2 Fuel included in reserves as at 31 December 2024530.11,022.31,552.41.00.01.00.00.00.094.0179.4273.4 Small differences are due to rounding 84 WOODSIDE ENERGY GROUP LTD
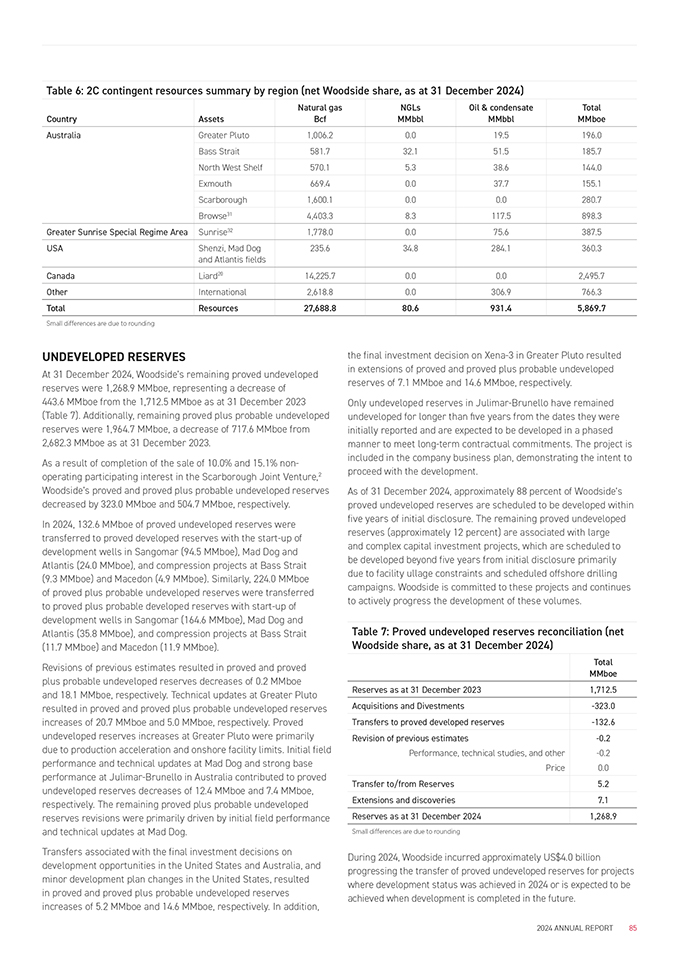
Table 6: 2C contingent resources summary by region (net Woodside share, as at 31 December 2024) Country Assets Natural gas BcfNGLs MMbblOil & condensate MMbblTotal MMboe AustraliaGreater Pluto1,006.20.019.5196.0 Bass Strait581.732.151.5185.7 North West Shelf570.15.338.6144.0 Exmouth669.40.037.7155.1 Scarborough1,600.10.00.0280.7 Browse314,403.38.3117.5898.3 Greater Sunrise Special Regime AreaSunrise321,778.00.075.6387.5 USAShenzi, Mad Dog and Atlantis fields235.634.8284.1360.3 CanadaLiard2014,225.70.00.02,495.7 OtherInternational2,618.80.0306.9766.3 TotalResources27,688.880.6931.45,869.7 Small differences are due to rounding UNDEVELOPED RESERVES At 31 December 2024, Woodside’s remaining proved undeveloped reserves were 1,268.9 MMboe, representing a decrease of 443.6 MMboe from the 1,712.5 MMboe as at 31 December 2023 (Table 7). Additionally, remaining proved plus probable undeveloped reserves were 1,964.7 MMboe, a decrease of 717.6 MMboe from 2,682.3 MMboe as at 31 December 2023. As a result of completion of the sale of 10.0% and 15.1% non- operating participating interest in the Scarborough Joint Venture,2 Woodside’s proved and proved plus probable undeveloped reserves decreased by 323.0 MMboe and 504.7 MMboe, respectively. In 2024, 132.6 MMboe of proved undeveloped reserves were transferred to proved developed reserves with the start-up of development wells in Sangomar (94.5 MMboe), Mad Dog and Atlantis (24.0 MMboe), and compression projects at Bass Strait (9.3 MMboe) and Macedon (4.9 MMboe). Similarly, 224.0 MMboe of proved plus probable undeveloped reserves were transferred to proved plus probable developed reserves with start-up of development wells in Sangomar (164.6 MMboe), Mad Dog and Atlantis (35.8 MMboe), and compression projects at Bass Strait (11.7 MMboe) and Macedon (11.9 MMboe). Revisions of previous estimates resulted in proved and proved plus probable undeveloped reserves decreases of 0.2 MMboe and 18.1 MMboe, respectively. Technical updates at Greater Pluto resulted in proved and proved plus probable undeveloped reserves increases of 20.7 MMboe and 5.0 MMboe, respectively. Proved undeveloped reserves increases at Greater Pluto were primarily due to production acceleration and onshore facility limits. Initial field performance and technical updates at Mad Dog and strong base performance at Julimar-Brunello in Australia contributed to proved undeveloped reserves decreases of 12.4 MMboe and 7.4 MMboe, respectively. The remaining proved plus probable undeveloped reserves revisions were primarily driven by initial field performance and technical updates at Mad Dog. Transfers associated with the final investment decisions on development opportunities in the United States and Australia, and minor development plan changes in the United States, resulted in proved and proved plus probable undeveloped reserves increases of 5.2 MMboe and 14.6 MMboe, respectively. In addition, the final investment decision on Xena-3 in Greater Pluto resulted in extensions of proved and proved plus probable undeveloped reserves of 7.1 MMboe and 14.6 MMboe, respectively. Only undeveloped reserves in Julimar-Brunello have remained undeveloped for longer than five years from the dates they were initially reported and are expected to be developed in a phased manner to meet long-term contractual commitments. The project is included in the company business plan, demonstrating the intent to proceed with the development. As of 31 December 2024, approximately 88 percent of Woodside’s proved undeveloped reserves are scheduled to be developed within five years of initial disclosure. The remaining proved undeveloped reserves (approximately 12 percent) are associated with large and complex capital investment projects, which are scheduled to be developed beyond five years from initial disclosure primarily due to facility ullage constraints and scheduled offshore drilling campaigns. Woodside is committed to these projects and continues to actively progress the development of these volumes. Table 7: Proved undeveloped reserves reconciliation (net Woodside share, as at 31 December 2024) Total MMboe Reserves as at 31 December 20231,712.5 Acquisitions and Divestments-323.0 Transfers to proved developed reserves-132.6 Revision of previous estimates Performance, technical studies, and other Price-0.2 -0.2 0.0 Transfer to/from Reserves5.2 Extensions and discoveries7.1 Reserves as at 31 December 20241,268.9 Small differences are due to rounding During 2024, Woodside incurred approximately US$4.0 billion progressing the transfer of proved undeveloped reserves for projects where development status was achieved in 2024 or is expected to be achieved when development is completed in the future. 2024 ANNUAL REPORT 85
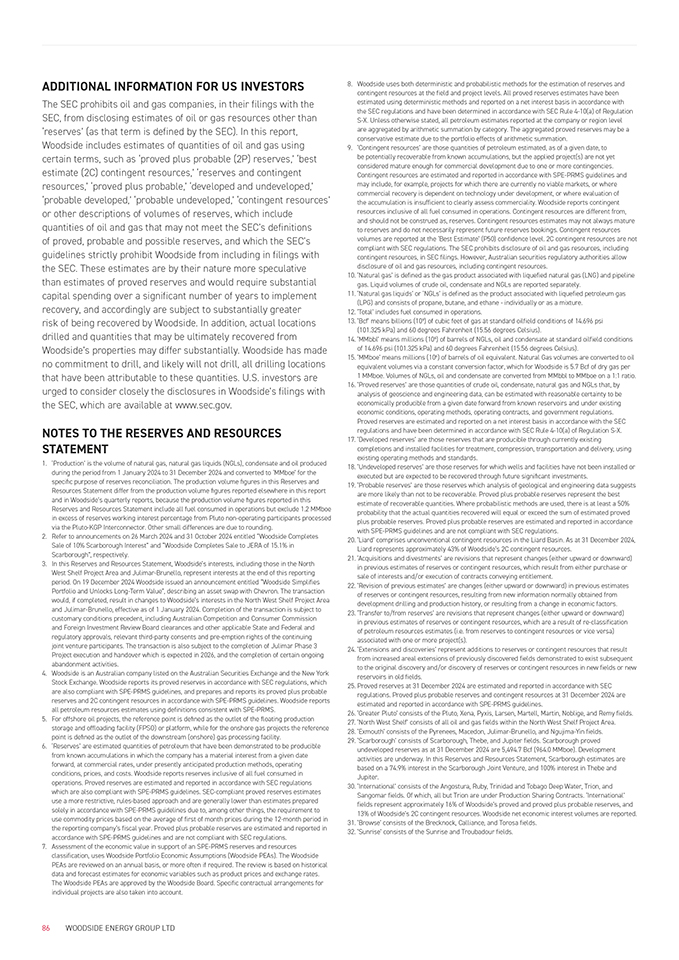
ADDITIONAL INFORMATION FOR US INVESTORS The SEC prohibits oil and gas companies, in their filings with the SEC, from disclosing estimates of oil or gas resources other than ‘reserves’ (as that term is defined by the SEC). In this report, Woodside includes estimates of quantities of oil and gas using certain terms, such as ‘proved plus probable (2P) reserves,’ ‘best estimate (2C) contingent resources,’ ‘reserves and contingent resources,’ ‘proved plus probable,’ ‘developed and undeveloped,’ ‘probable developed,’ ‘probable undeveloped,’ ‘contingent resources’ or other descriptions of volumes of reserves, which include quantities of oil and gas that may not meet the SEC’s definitions of proved, probable and possible reserves, and which the SEC’s guidelines strictly prohibit Woodside from including in filings with the SEC. These estimates are by their nature more speculative than estimates of proved reserves and would require substantial capital spending over a significant number of years to implement recovery, and accordingly are subject to substantially greater risk of being recovered by Woodside. In addition, actual locations drilled and quantities that may be ultimately recovered from Woodside’s properties may differ substantially. Woodside has made no commitment to drill, and likely will not drill, all drilling locations that have been attributable to these quantities. U.S. investors are urged to consider closely the disclosures in Woodside’s filings with the SEC, which are available at www.sec.gov. NOTES TO THE RESERVES AND RESOURCES STATEMENT 1. ‘Production’ is the volume of natural gas, natural gas liquids (NGLs), condensate and oil produced during the period from 1 January 2024 to 31 December 2024 and converted to ‘MMboe’ for the specific purpose of reserves reconciliation. The production volume figures in this Reserves and Resources Statement differ from the production volume figures reported elsewhere in this report and in Woodside’s quarterly reports, because the production volume figures reported in this Reserves and Resources Statement include all fuel consumed in operations but exclude 1.2 MMboe in excess of reserves working interest percentage from Pluto non-operating participants processed via the Pluto-KGP Interconnector. Other small differences are due to rounding. 2. Refer to announcements on 26 March 2024 and 31 October 2024 entitled “Woodside Completes Sale of 10% Scarborough Interest” and “Woodside Completes Sale to JERA of 15.1% in Scarborough”, respectively. 3. In this Reserves and Resources Statement, Woodside’s interests, including those in the North West Shelf Project Area and Julimar-Brunello, represent interests at the end of this reporting period. On 19 December 2024 Woodside issued an announcement entitled “Woodside Simplifies Portfolio and Unlocks Long-Term Value”, describing an asset swap with Chevron. The transaction would, if completed, result in changes to Woodside’s interests in the North West Shelf Project Area and Julimar-Brunello, effective as of 1 January 2024. Completion of the transaction is subject to customary conditions precedent, including Australian Competition and Consumer Commission and Foreign Investment Review Board clearances and other applicable State and Federal and regulatory approvals, relevant third-party consents and pre-emption rights of the continuing joint venture participants. The transaction is also subject to the completion of Julimar Phase 3 Project execution and handover which is expected in 2026, and the completion of certain ongoing abandonment activities. 4. Woodside is an Australian company listed on the Australian Securities Exchange and the New York Stock Exchange. Woodside reports its proved reserves in accordance with SEC regulations, which are also compliant with SPE-PRMS guidelines, and prepares and reports its proved plus probable reserves and 2C contingent resources in accordance with SPE-PRMS guidelines. Woodside reports all petroleum resources estimates using definitions consistent with SPE-PRMS. 5. For offshore oil projects, the reference point is defined as the outlet of the floating production storage and offloading facility (FPSO) or platform, while for the onshore gas projects the reference point is defined as the outlet of the downstream (onshore) gas processing facility. 6. ‘Reserves’ are estimated quantities of petroleum that have been demonstrated to be producible from known accumulations in which the company has a material interest from a given date forward, at commercial rates, under presently anticipated production methods, operating conditions, prices, and costs. Woodside reports reserves inclusive of all fuel consumed in operations. Proved reserves are estimated and reported in accordance with SEC regulations which are also compliant with SPE-PRMS guidelines. SEC-compliant proved reserves estimates use a more restrictive, rules-based approach and are generally lower than estimates prepared solely in accordance with SPE-PRMS guidelines due to, among other things, the requirement to use commodity prices based on the average of first of month prices during the 12-month period in the reporting company’s fiscal year. Proved plus probable reserves are estimated and reported in accordance with SPE-PRMS guidelines and are not compliant with SEC regulations. 7. Assessment of the economic value in support of an SPE-PRMS reserves and resources classification, uses Woodside Portfolio Economic Assumptions (Woodside PEAs). The Woodside PEAs are reviewed on an annual basis, or more often if required. The review is based on historical data and forecast estimates for economic variables such as product prices and exchange rates. The Woodside PEAs are approved by the Woodside Board. Specific contractual arrangements for individual projects are also taken into account. 8. Woodside uses both deterministic and probabilistic methods for the estimation of reserves and contingent resources at the field and project levels. All proved reserves estimates have been estimated using deterministic methods and reported on a net interest basis in accordance with the SEC regulations and have been determined in accordance with SEC Rule 4-10(a) of Regulation S-X. Unless otherwise stated, all petroleum estimates reported at the company or region level are aggregated by arithmetic summation by category. The aggregated proved reserves may be a conservative estimate due to the portfolio effects of arithmetic summation. 9. ‘Contingent resources’ are those quantities of petroleum estimated, as of a given date, to be potentially recoverable from known accumulations, but the applied project(s) are not yet considered mature enough for commercial development due to one or more contingencies. Contingent resources are estimated and reported in accordance with SPE-PRMS guidelines and may include, for example, projects for which there are currently no viable markets, or where commercial recovery is dependent on technology under development, or where evaluation of the accumulation is insufficient to clearly assess commerciality. Woodside reports contingent resources inclusive of all fuel consumed in operations. Contingent resources are different from, and should not be construed as, reserves. Contingent resources estimates may not always mature to reserves and do not necessarily represent future reserves bookings. Contingent resources volumes are reported at the ‘Best Estimate’ (P50) confidence level. 2C contingent resources are not compliant with SEC regulations. The SEC prohibits disclosure of oil and gas resources, including contingent resources, in SEC filings. However, Australian securities regulatory authorities allow disclosure of oil and gas resources, including contingent resources. 10. ‘Natural gas’ is defined as the gas product associated with liquefied natural gas (LNG) and pipeline gas. Liquid volumes of crude oil, condensate and NGLs are reported separately. 11. ‘Natural gas liquids’ or ‘NGLs’ is defined as the product associated with liquefied petroleum gas (LPG) and consists of propane, butane, and ethane—individually or as a mixture. 12. ‘Total’ includes fuel consumed in operations. 13. ‘Bcf’ means billions (109) of cubic feet of gas at standard oilfield conditions of 14.696 psi (101.325 kPa) and 60 degrees Fahrenheit (15.56 degrees Celsius). 14. ‘MMbbl’ means millions (106) of barrels of NGLs, oil and condensate at standard oilfield conditions of 14.696 psi (101.325 kPa) and 60 degrees Fahrenheit (15.56 degrees Celsius). 15. ‘MMboe’ means millions (106) of barrels of oil equivalent. Natural Gas volumes are converted to oil equivalent volumes via a constant conversion factor, which for Woodside is 5.7 Bcf of dry gas per 1 MMboe. Volumes of NGLs, oil and condensate are converted from MMbbl to MMboe on a 1:1 ratio. 16. ‘Proved reserves’ are those quantities of crude oil, condensate, natural gas and NGLs that, by analysis of geoscience and engineering data, can be estimated with reasonable certainty to be economically producible from a given date forward from known reservoirs and under existing economic conditions, operating methods, operating contracts, and government regulations. Proved reserves are estimated and reported on a net interest basis in accordance with the SEC regulations and have been determined in accordance with SEC Rule 4-10(a) of Regulation S-X. 17. ‘Developed reserves’ are those reserves that are producible through currently existing completions and installed facilities for treatment, compression, transportation and delivery, using existing operating methods and standards. 18. ‘Undeveloped reserves’ are those reserves for which wells and facilities have not been installed or executed but are expected to be recovered through future significant investments. 19. ‘Probable reserves’ are those reserves which analysis of geological and engineering data suggests are more likely than not to be recoverable. Proved plus probable reserves represent the best estimate of recoverable quantities. Where probabilistic methods are used, there is at least a 50% probability that the actual quantities recovered will equal or exceed the sum of estimated proved plus probable reserves. Proved plus probable reserves are estimated and reported in accordance with SPE-PRMS guidelines and are not compliant with SEC regulations. 20. ‘Liard’ comprises unconventional contingent resources in the Liard Basin. As at 31 December 2024, Liard represents approximately 43% of Woodside’s 2C contingent resources. 21. ‘Acquisitions and divestments’ are revisions that represent changes (either upward or downward) in previous estimates of reserves or contingent resources, which result from either purchase or sale of interests and/or execution of contracts conveying entitlement. 22. ‘Revision of previous estimates’ are changes (either upward or downward) in previous estimates of reserves or contingent resources, resulting from new information normally obtained from development drilling and production history, or resulting from a change in economic factors. 23. ‘Transfer to/from reserves’ are revisions that represent changes (either upward or downward) in previous estimates of reserves or contingent resources, which are a result of re-classification of petroleum resources estimates (i.e. from reserves to contingent resources or vice versa) associated with one or more project(s). 24. ‘Extensions and discoveries’ represent additions to reserves or contingent resources that result from increased areal extensions of previously discovered fields demonstrated to exist subsequent to the original discovery and/or discovery of reserves or contingent resources in new fields or new reservoirs in old fields. 25. Proved reserves at 31 December 2024 are estimated and reported in accordance with SEC regulations. Proved plus probable reserves and contingent resources at 31 December 2024 are estimated and reported in accordance with SPE-PRMS guidelines. 26. ‘Greater Pluto’ consists of the Pluto, Xena, Pyxis, Larsen, Martell, Martin, Noblige, and Remy fields. 27. ‘North West Shelf’ consists of all oil and gas fields within the North West Shelf Project Area. 28. ‘Exmouth’ consists of the Pyrenees, Macedon, Julimar-Brunello, and Ngujima-Yin fields. 29. ‘Scarborough’ consists of Scarborough, Thebe, and Jupiter fields. Scarborough proved undeveloped reserves as at 31 December 2024 are 5,494.7 Bcf (964.0 MMboe). Development activities are underway. In this Reserves and Resources Statement, Scarborough estimates are based on a 74.9% interest in the Scarborough Joint Venture, and 100% interest in Thebe and Jupiter. 30. ‘International’ consists of the Angostura, Ruby, Trinidad and Tobago Deep Water, Trion, and Sangomar fields. Of which, all but Trion are under Production Sharing Contracts. ‘International’ fields represent approximately 16% of Woodside’s proved and proved plus probable reserves, and 13% of Woodside’s 2C contingent resources. Woodside net economic interest volumes are reported. 31. ‘Browse’ consists of the Brecknock, Calliance, and Torosa fields. 32. ‘Sunrise’ consists of the Sunrise and Troubadour fields. 86 WOODSIDE ENERGY GROUP LTD

GOVERNANCE Woodside’s commitment to corporate governance is critical to our strong and sustainable business performance. 2024 ANNUAL REPORT 87
4.1 GOVERNANCE • CORPORATE GOVERNANCE STATEMENT Corporate Governance Statement Woodside is committed to high levels of corporate governance and fostering a culture of ethical behaviour, integrity and respect. A key responsibility of the Board is the overall corporate governance of Woodside. This Corporate Governance Statement summarises the activities and processes underpinning the high standards of corporate governance followed by Woodside. Our focus at Woodside is not just on what we do, but how we do it. Everything we do is guided by Our Values, inspired by our purpose, and in accordance with a strong corporate governance architecture. We recognise that good corporate governance starts at the top. It is essential that Woodside is led by a Board that engages openly and productively with management and facilitates robust dialogue and constructive challenge in response to critical and emerging issues and risks faced by the business. The Nominations and Governance Committee (Committee) assists the Board with reviewing Board composition, performance and succession planning. An important factor in succession planning is to ensure that the Board has the right mix of Directors with the skills and experience to lead Woodside in accordance with high standards of corporate governance, and to identify and understand strategic opportunities and risk to deliver long-term sustainable value. This is particularly important given Woodside’s role in meeting the global challenge of supplying reliable, affordable and lower-carbon energy. Also relevant is continuity and corporate memory underpinning the decisions made by the Board and significant professional experience in our sector, especially given the long-term perspective required by the Directors. This is balanced by renewal of the Board to bring in new skills, experiences and perspectives. Richard Goyder, AO We have been actively renewing the membership of the Board and have appointed six directors since 2020. In 2024, we also changed Chairs of the Human Resources and Compensation Committee and the Audit and Risk Committee. The Committee works closely with the Board on recommendations relating to Woodside’s corporate governance policies, helping to inform the Board’s direction on corporate governance framework and practices. Another key responsibility of the Committee is to review and, where appropriate, enhance our corporate governance policies and practices. We frequently consider developments arising in the markets where Woodside securities are listed, being the Australian Securities Exchange (ASX) and New York Stock Exchange (NYSE). Our practices will evolve as we continually look to strengthen our governance framework in the context of our multi-jurisdictional business. Given our commitment to corporate governance and its direct link to creating and protecting shareholder value, I encourage you to read this Corporate Governance Statement. And, as always, we welcome your feedback. Richard Goyder, AO Chair of the Nominations and Governance Committee 25 February 2025 88 WOODSIDE ENERGY GROUP LTD
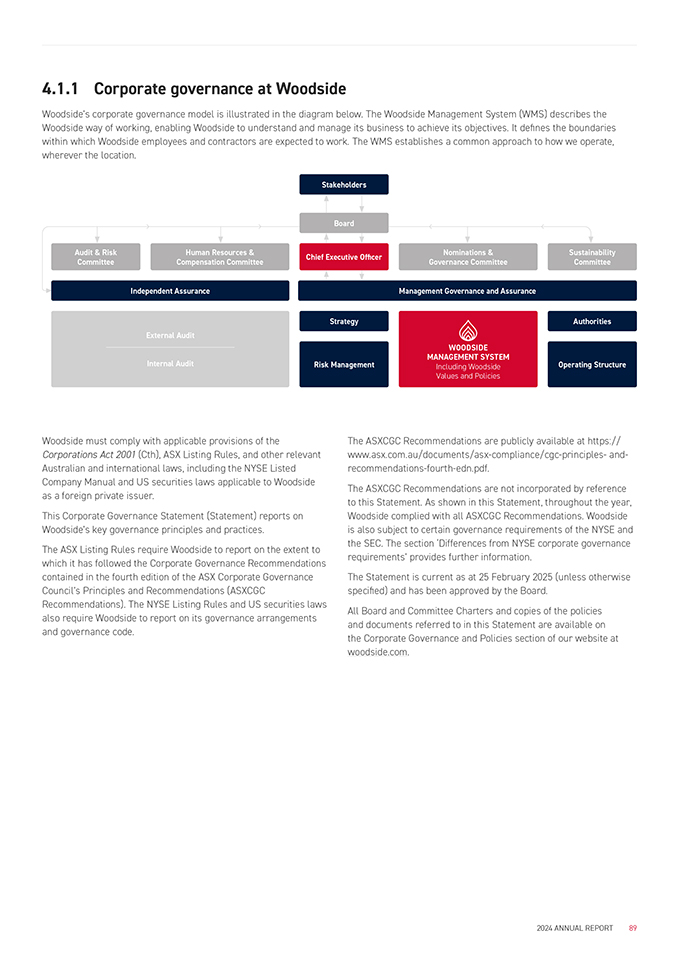
4.1.1 Corporate governance at Woodside Woodside’s corporate governance model is illustrated in the diagram below. The Woodside Management System (WMS) describes the Woodside way of working, enabling Woodside to understand and manage its business to achieve its objectives. It defines the boundaries within which Woodside employees and contractors are expected to work. The WMS establishes a common approach to how we operate, wherever the location. Stakeholders Board Audit & Risk Committee Human Resources & Compensation Committee Chief Executive Officer Nominations & Governance Committee Sustainability Committee Independent Assurance Management Governance and Assurance External Audit StrategyAuthorities WOODSIDE MANAGEMENT SYSTEM Internal Audit Risk Management Including Woodside Values and Policies Operating Structure Woodside must comply with applicable provisions of the Corporations Act 2001 (Cth), ASX Listing Rules, and other relevant Australian and international laws, including the NYSE Listed Company Manual and US securities laws applicable to Woodside as a foreign private issuer. This Corporate Governance Statement (Statement) reports on Woodside’s key governance principles and practices. The ASX Listing Rules require Woodside to report on the extent to which it has followed the Corporate Governance Recommendations contained in the fourth edition of the ASX Corporate Governance Council’s Principles and Recommendations (ASXCGC Recommendations). The NYSE Listing Rules and US securities laws also require Woodside to report on its governance arrangements and governance code. The ASXCGC Recommendations are publicly available at https:// www.asx.com.au/documents/asx-compliance/cgc-principles- and- recommendations-fourth-edn.pdf. The ASXCGC Recommendations are not incorporated by reference to this Statement. As shown in this Statement, throughout the year, Woodside complied with all ASXCGC Recommendations. Woodside is also subject to certain governance requirements of the NYSE and the SEC. The section ‘Differences from NYSE corporate governance requirements’ provides further information. The Statement is current as at 25 February 2025 (unless otherwise specified) and has been approved by the Board. All Board and Committee Charters and copies of the policies and documents referred to in this Statement are available on the Corporate Governance and Policies section of our website at woodside.com. 2024 ANNUAL REPORT 89
4.1.2 Board of Directors BOARD ROLE AND RESPONSIBILITIES The Woodside Energy Group Ltd Constitution provides that the business and affairs of Woodside are to be managed by or under the direction of the Board. The central role of the Board is to set Woodside’s strategic direction, to select and appoint a Chief Executive Officer (CEO) and to oversee Woodside’s management and business activities. The Board’s role, powers, duties and functions are formalised in a Board Charter. The Charter sets out the matters and functions that are specifically reserved to the Board and the powers that are delegated to the CEO and management. The Board Charter and the delegation of Board authority to the CEO and management are reviewed regularly. Some of the key activities of the Board undertaken during the year include overseeing: • The review of Woodside’s strategy and providing input and guidance including on management’s execution of strategy • Monitoring the potential impacts of certain macroeconomic and geopolitical events on the global energy market • Woodside’s plans to support its emissions targets and goals • Management’s response to key safety events, including the tragic death of an employee of one of OCI’s construction contractors at the Beaumont New Ammonia site1 • Management’s response to policy and regulatory developments, including legal challenges to regulatory decision making in Australia • The acquisition of OCI Clean Ammonia Holding B.V. and its 1.1 Mtpa lower-carbon ammonia project in Beaumont, Texas • The sale of a 15.1% non-operating participating interest in the Scarborough Joint Venture to JERA2 • The acquisition of Tellurian Inc. and its US Gulf Coast Driftwood LNG development opportunity • The acquisition of Chevron’s interests in the North West Shelf (NWS) Project, the NWS Oil Project and the Angel Carbon Capture and Storage (CCS) Project, in exchange for Woodside’s interests in the Wheatstone Project and the Julimar-Brunello Project3 • The progression of CCS studies and the H2OK hydrogen project • The progression of the Scarborough Energy Project • The progression of the Trion Project • The commencement of production from the Sangomar Project • The appointment of two new Directors to the Board • The appointment of a new Group Company Secretary • Revisions to the leadership structure and Executive Leadership Team effective August 20244 • Woodside’s de-listing from the London Stock Exchange.5 BOARD COMPOSITION The Woodside Energy Group Ltd Constitution provides that Woodside Energy Group Ltd is not to have more than 12, nor less than three Directors. At the date of this report, the Board is comprised of 10 independent Non-Executive Directors and the CEO. The following page shows each of the current Directors and those Directors who served during the year and the date of their appointment as a Director. 1. OCI’s investigation into the incident is ongoing at this time. 2. The transaction completed on 31 October 2024 as announced on the same date. 3. Completion of the transaction is subject to customary conditions precedent, including applicable State and Federal regulatory approvals, relevant third-party consents and pre-emption rights of the continuing joint venture participants. 4. Details of Woodside’s senior executives are set out in section 4.1.4 – Executive Leadership Team. 5. As announced on 16 October 2024, as of 08:00 (GMT) on 20 November 2024, Woodside delisted from the London Stock Exchange (LSE). Information about Woodside’s material activities as previously disclosed to the LSE are available on Woodside’s website. 90 WOODSIDE ENERGY GROUP LTD

Richard Goyder, AO BCom, FAICD Chair: Chair since April 2018. Term of office: Director since August 2017, re- election required at AGM in 2027. Independent: Yes Country of residence: Australia Experience: Mr Goyder spent 24 years with Wesfarmers Limited, where he served as Managing Director and Chief Executive Officer from 2005 to late 2017. Mr Goyder also served as Chair of the Australian B20 (the key business advisory body to the international economic forum which includes business leaders from all G20 economies) from February 2013 to December 2014. Committee membership: Chair of the Nominations & Governance Committee. Attends other Board Committee meetings. Current directorships/other interests: Chair: Perron Group (from March 2025), Channel 7 Telethon Trust (since 2018), West Australian Symphony Orchestra (WASO) (since 2018) and Australian Football League Commission (since 2017). Other directorships of listed entities within the past three years: Qantas Airways Limited (2018 until September 2024). Meg O’Neill BSc (Ocean Engineering), BSc (Chemical Engineering), MSc (Ocean Systems Management) CEO and Managing Director Term of office: Director since August 2021. Independent: No Country of residence: Australia Experience: Ms O’Neill joined Woodside in 2018 and has performed a number of senior executive positions including Chief Operations Officer, Executive Vice President Development and Executive Vice President Development and Marketing. From April 2021 to August 2021, Ms O’Neill was acting CEO until she was formally appointed to the position. Prior to joining Woodside, Ms O’Neill spent 23 years with ExxonMobil in a variety of technical, operational and senior leadership roles. Committee membership: Attends Board Committee meetings. Current directorships/other interests: Chair: Australian Energy Producers (since 2022). Director: American Petroleum Institute (API) (since 2022), WA Venues & Events Pty Ltd (WAVE) (since 2019), West Australian Symphony Orchestra (WASO) (since 2019), Business Council of Australia (since November 2024) and Reconciliation Western Australia (from 2021 until December 2024). Member: Chief Executive Women, National Petroleum Council (US) and UWA Business School Advisory Board (resigned January 2025). Other: Honorary Governor of the American Chamber of Commerce (AmCham). Other directorships of listed entities within the past three years: Nil. Larry Archibald BSc (Geosciences), BA (Geology), MBA Term of office: Director since February 2017, re-election required at AGM in 2026. Independent: Yes Country of residence: USA Experience: Mr Archibald previously worked at ConocoPhillips, where he spent eight years in senior executive positions including Senior Vice President, Business Development and Exploration and Senior Vice President, Exploration. Prior to joining ConocoPhillips, Mr Archibald spent 29 years at Amoco from 1980 to 1998 and BP from 1998 to 2008 in various positions including leading exploration programs covering many world regions. Committee membership: Audit & Risk, Sustainability and Nominations & Governance Committees. Current directorships/other interests: Chair: University of Arizona Geosciences Advisory Board (since 2019). Other directorships of listed entities within the past three years: Nil. 2024 ANNUAL REPORT 91
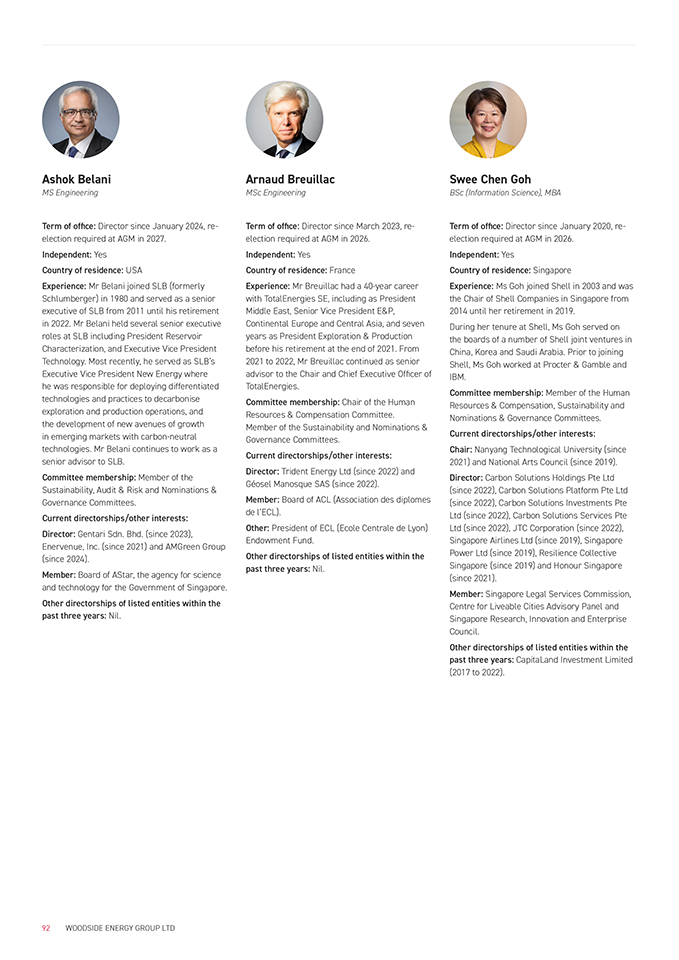
Ashok Belani MS Engineering Term of office: Director since January 2024, re- election required at AGM in 2027. Independent: Yes Country of residence: USA Experience: Mr Belani joined SLB (formerly Schlumberger) in 1980 and served as a senior executive of SLB from 2011 until his retirement in 2022. Mr Belani held several senior executive roles at SLB including President Reservoir Characterization, and Executive Vice President Technology. Most recently, he served as SLB’s Executive Vice President New Energy where he was responsible for deploying differentiated technologies and practices to decarbonise exploration and production operations, and the development of new avenues of growth in emerging markets with carbon-neutral technologies. Mr Belani continues to work as a senior advisor to SLB. Committee membership: Member of the Sustainability, Audit & Risk and Nominations & Governance Committees. Current directorships/other interests: Director: Gentari Sdn. Bhd. (since 2023), Enervenue, Inc. (since 2021) and AMGreen Group (since 2024). Member: Board of AStar, the agency for science and technology for the Government of Singapore. Other directorships of listed entities within the past three years: Nil. Arnaud Breuillac MSc Engineering Term of office: Director since March 2023, re- election required at AGM in 2026. Independent: Yes Country of residence: France Experience: Mr Breuillac had a 40-year career with TotalEnergies SE, including as President Middle East, Senior Vice President E&P, Continental Europe and Central Asia, and seven years as President Exploration & Production before his retirement at the end of 2021. From 2021 to 2022, Mr Breuillac continued as senior advisor to the Chair and Chief Executive Officer of TotalEnergies. Committee membership: Chair of the Human Resources & Compensation Committee. Member of the Sustainability and Nominations & Governance Committees. Current directorships/other interests: Director: Trident Energy Ltd (since 2022) and Géosel Manosque SAS (since 2022). Member: Board of ACL (Association des diplomes de l’ECL). Other: President of ECL (Ecole Centrale de Lyon) Endowment Fund. Other directorships of listed entities within the past three years: Nil. Swee Chen Goh BSc (Information Science), MBA Term of office: Director since January 2020, re- election required at AGM in 2026. Independent: Yes Country of residence: Singapore Experience: Ms Goh joined Shell in 2003 and was the Chair of Shell Companies in Singapore from 2014 until her retirement in 2019. During her tenure at Shell, Ms Goh served on the boards of a number of Shell joint ventures in China, Korea and Saudi Arabia. Prior to joining Shell, Ms Goh worked at Procter & Gamble and IBM. Committee membership: Member of the Human Resources & Compensation, Sustainability and Nominations & Governance Committees. Current directorships/other interests: Chair: Nanyang Technological University (since 2021) and National Arts Council (since 2019). Director: Carbon Solutions Holdings Pte Ltd (since 2022), Carbon Solutions Platform Pte Ltd (since 2022), Carbon Solutions Investments Pte Ltd (since 2022), Carbon Solutions Services Pte Ltd (since 2022), JTC Corporation (since 2022), Singapore Airlines Ltd (since 2019), Singapore Power Ltd (since 2019), Resilience Collective Singapore (since 2019) and Honour Singapore (since 2021). Member: Singapore Legal Services Commission, Centre for Liveable Cities Advisory Panel and Singapore Research, Innovation and Enterprise Council. Other directorships of listed entities within the past three years: CapitaLand Investment Limited (2017 to 2022). 92 WOODSIDE ENERGY GROUP LTD
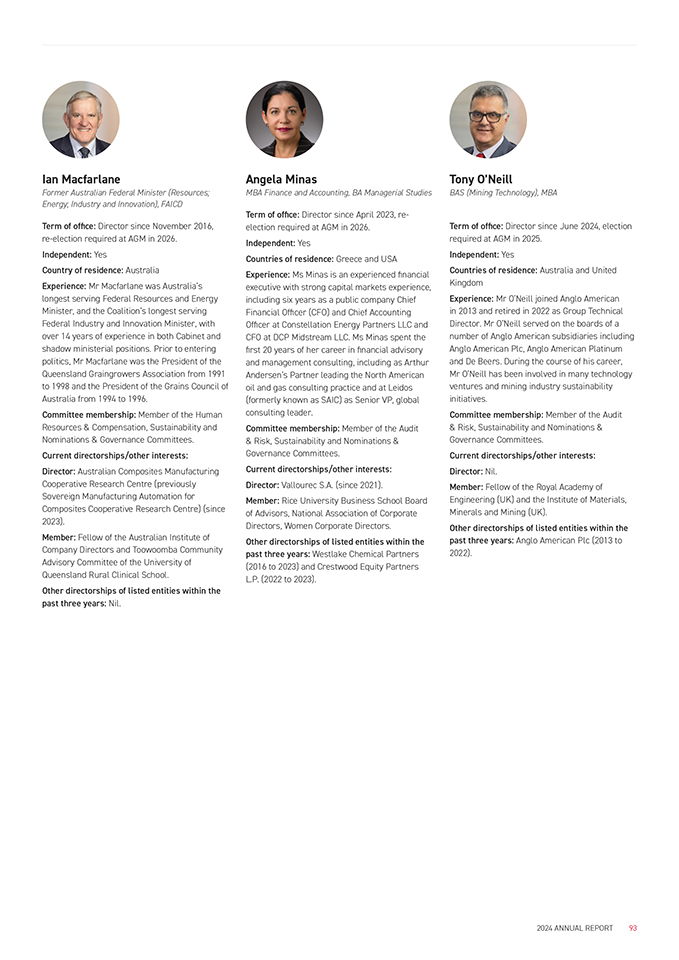
Ian Macfarlane Former Australian Federal Minister (Resources; Energy; Industry and Innovation), FAICD Term of office: Director since November 2016, re-election required at AGM in 2026. Independent: Yes Country of residence: Australia Experience: Mr Macfarlane was Australia’s longest serving Federal Resources and Energy Minister, and the Coalition’s longest serving Federal Industry and Innovation Minister, with over 14 years of experience in both Cabinet and shadow ministerial positions. Prior to entering politics, Mr Macfarlane was the President of the Queensland Graingrowers Association from 1991 to 1998 and the President of the Grains Council of Australia from 1994 to 1996. Committee membership: Member of the Human Resources & Compensation, Sustainability and Nominations & Governance Committees. Current directorships/other interests: Director: Australian Composites Manufacturing Cooperative Research Centre (previously Sovereign Manufacturing Automation for Composites Cooperative Research Centre) (since 2023). Member: Fellow of the Australian Institute of Company Directors and Toowoomba Community Advisory Committee of the University of Queensland Rural Clinical School. Other directorships of listed entities within the past three years: Nil. Angela Minas MBA Finance and Accounting, BA Managerial Studies Term of office: Director since April 2023, re- election required at AGM in 2026. Independent: Yes Countries of residence: Greece and USA Experience: Ms Minas is an experienced financial executive with strong capital markets experience, including six years as a public company Chief Financial Officer (CFO) and Chief Accounting Officer at Constellation Energy Partners LLC and CFO at DCP Midstream LLC. Ms Minas spent the first 20 years of her career in financial advisory and management consulting, including as Arthur Andersen’s Partner leading the North American oil and gas consulting practice and at Leidos (formerly known as SAIC) as Senior VP, global consulting leader. Committee membership: Member of the Audit & Risk, Sustainability and Nominations & Governance Committees. Current directorships/other interests: Director: Vallourec S.A. (since 2021). Member: Rice University Business School Board of Advisors, National Association of Corporate Directors, Women Corporate Directors. Other directorships of listed entities within the past three years: Westlake Chemical Partners (2016 to 2023) and Crestwood Equity Partners L.P. (2022 to 2023). Tony O’Neill BAS (Mining Technology), MBA Term of office: Director since June 2024, election required at AGM in 2025. Independent: Yes Countries of residence: Australia and United Kingdom Experience: Mr O’Neill joined Anglo American in 2013 and retired in 2022 as Group Technical Director. Mr O’Neill served on the boards of a number of Anglo American subsidiaries including Anglo American Plc, Anglo American Platinum and De Beers. During the course of his career, Mr O’Neill has been involved in many technology ventures and mining industry sustainability initiatives. Committee membership: Member of the Audit & Risk, Sustainability and Nominations & Governance Committees. Current directorships/other interests: Director: Nil. Member: Fellow of the Royal Academy of Engineering (UK) and the Institute of Materials, Minerals and Mining (UK). Other directorships of listed entities within the past three years: Anglo American Plc (2013 to 2022). 2024 ANNUAL REPORT 93

Ann Pickard BA, MA Ben Wyatt LLB, MSc Term of office: Director since February 2016, re- election required at AGM in 2025. Independent: Yes Country of residence: USA Experience: Ms Pickard joined Shell in 2000 and served in a number of senior executive positions including as the Director, Global Business and Strategy and as a member of the Shell Gas & Power Executive Committee. Ms Pickard retired from Shell in 2016. Prior to joining Shell, Ms Pickard spent 11 years with Mobil before its merger with Exxon in 1999. Committee membership: Chair of the Sustainability Committee. Member of the Human Resources & Compensation and Nominations & Governance Committees. Current directorships/other interests: Director: Noble Corporation Plc. (from 2021 until May 2025) and KBR Inc (since 2015). Member: University of Wyoming Foundation Board. Other directorships of listed entities within the past three years: Nil. Term of office: Director since June 2021, re- election required at AGM in 2025. Independent: Yes Country of residence: Australia Experience: Mr Wyatt served in the Western Australian Legislative Assembly for 15 years, including as the Western Australian Treasurer and Minister for Finance, Energy, Aboriginal Affairs and Lands. Additionally, Mr Wyatt held various shadow cabinet portfolios including Shadow Treasurer (2008 to 2017) and responsibility for Native Title and the Pilbara. Prior to entering Parliament, Mr Wyatt practised as a lawyer in both private practice and with the Western Australian Office of the Director of Public Prosecutions. Committee membership: Chair of the Audit & Risk Committee. Member of the Human Resources & Compensation and Nominations & Governance Committees. Current directorships/other interests: Director: Rio Tinto Ltd (since 2021), West Coast Eagles (since 2021), Perth International Arts Festival (since 2021) and Telethon Kids Institute (since 2021). Member: UWA Business School Advisory Board, Australian Institute of Company Directors and Australian Capital Equity Pty Ltd Advisory Committee Board. Other directorships of listed entities within the past three years: APM Group (2022 until 2024). Frank Cooper, AO BCom, FCA, FAICD Independent: Yes Experience: Mr Cooper retired on 24 April 2024 after having served more than 11 years on Woodside’s Board of Directors. Throughout his tenure, Mr Cooper served on a number of Woodside Board Committees including as Chair of the Audit & Risk Committee and as a member of the Human Resources & Compensation and Nominations & Governance Committees. Gene Tilbrook BSc, MBA, FAICD Independent: Yes Experience: Mr Tilbrook retired on 28 February 2024 after having served more than nine years on Woodside’s Board of Directors. Mr Tilbrook served on a number of Woodside Board Committees as a member of the Audit & Risk, Human Resources & Compensation (of which he was appointed Chair from 2019 to 2023) and Nominations & Governance Committees. Woodside acknowledged Mr Tilbrook’s significant contribution to the company on his passing in August 2024. 94 WOODSIDE ENERGY GROUP LTD
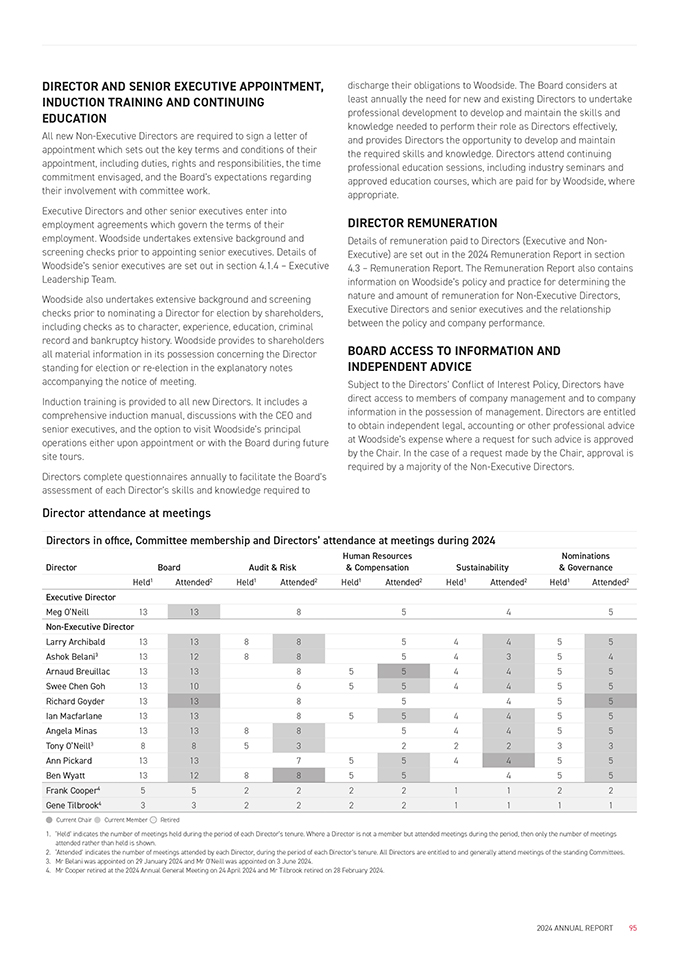
DIRECTOR AND SENIOR EXECUTIVE APPOINTMENT, INDUCTION TRAINING AND CONTINUING EDUCATION All new Non-Executive Directors are required to sign a letter of appointment which sets out the key terms and conditions of their appointment, including duties, rights and responsibilities, the time commitment envisaged, and the Board’s expectations regarding their involvement with committee work. Executive Directors and other senior executives enter into employment agreements which govern the terms of their employment. Woodside undertakes extensive background and screening checks prior to appointing senior executives. Details of Woodside’s senior executives are set out in section 4.1.4 – Executive Leadership Team. Woodside also undertakes extensive background and screening checks prior to nominating a Director for election by shareholders, including checks as to character, experience, education, criminal record and bankruptcy history. Woodside provides to shareholders all material information in its possession concerning the Director standing for election or re-election in the explanatory notes accompanying the notice of meeting. Induction training is provided to all new Directors. It includes a comprehensive induction manual, discussions with the CEO and senior executives, and the option to visit Woodside’s principal operations either upon appointment or with the Board during future site tours. Directors complete questionnaires annually to facilitate the Board’s assessment of each Director’s skills and knowledge required to Director attendance at meetings discharge their obligations to Woodside. The Board considers at least annually the need for new and existing Directors to undertake professional development to develop and maintain the skills and knowledge needed to perform their role as Directors effectively, and provides Directors the opportunity to develop and maintain the required skills and knowledge. Directors attend continuing professional education sessions, including industry seminars and approved education courses, which are paid for by Woodside, where appropriate. DIRECTOR REMUNERATION Details of remuneration paid to Directors (Executive and Non- Executive) are set out in the 2024 Remuneration Report in section 4.3 – Remuneration Report. The Remuneration Report also contains information on Woodside’s policy and practice for determining the nature and amount of remuneration for Non-Executive Directors, Executive Directors and senior executives and the relationship between the policy and company performance. BOARD ACCESS TO INFORMATION AND INDEPENDENT ADVICE Subject to the Directors’ Conflict of Interest Policy, Directors have direct access to members of company management and to company information in the possession of management. Directors are entitled to obtain independent legal, accounting or other professional advice at Woodside’s expense where a request for such advice is approved by the Chair. In the case of a request made by the Chair, approval is required by a majority of the Non-Executive Directors. Directors in office, Committee membership and Directors’ attendance at meetings during 2024 Human Resources Nominations DirectorBoardAudit & Risk& CompensationSustainability& Governance Executive Director Held1Attended2Held1Attended2Held1Attended2Held1Attended2Held1Attended2 Meg O’Neill 13138545 Non-Executive Director Larry Archibald13138854455 Ashok Belani313128854354 Arnaud Breuillac13138554455 Swee Chen Goh13106554455 Richard Goyder131385455 Ian Macfarlane13138554455 Angela Minas13138854455 Tony O’Neill3 885322233 Ann Pickard13137554455 Ben Wyatt13128855455 Frank Cooper45522221122 Gene Tilbrook43322221111 Current ChairCurrent MemberRetired 1. ‘Held’ indicates the number of meetings held during the period of each Director’s tenure. Where a Director is not a member but attended meetings during the period, then only the number of meetings attended rather than held is shown. 2. ‘Attended’ indicates the number of meetings attended by each Director, during the period of each Director’s tenure. All Directors are entitled to and generally attend meetings of the standing Committees. 3. Mr Belani was appointed on 29 January 2024 and Mr O’Neill was appointed on 3 June 2024. 4. Mr Cooper retired at the 2024 Annual General Meeting on 24 April 2024 and Mr Tilbrook retired on 28 February 2024. 2024 ANNUAL REPORT 95
BOARD PERFORMANCE EVALUATION The Nominations & Governance Committee is responsible for determining the process for evaluating Board performance. Board performance evaluations are conducted annually. In 2024, an external consultant was engaged to conduct a Board performance evaluation. The evaluation process involves questionnaires and interviews with Directors. The report on Board and Committee performance is provided to all Directors and discussed by the Board. The report on the Chair’s performance is provided to the Chair and two Committee Chairs for discussion. A report on each individual Director is also provided to the individual and to the Chair. The Chair meets individually with each Director to discuss the findings of their report. The Board, through the Nominations & Governance Committee, considers and discusses the final report in detail. The performance of each Director retiring at the next AGM is taken into account by the Board in determining whether or not the Board should support the re-election of the Director. The Directors seeking re-election will be asked to reconfirm that they have sufficient time to meet their responsibilities. The Human Resources & Compensation Committee reviews and makes recommendations to the Board on the criteria for the evaluation of the performance of the CEO. The Board conducts the evaluation of the performance of the CEO and considers senior executive succession planning. In 2024, performance evaluations for the Board, its Committees, Directors and senior executives took place in accordance with the process disclosed above, and in the section on ‘Performance evaluation of Executive Leadership Team’ on page 103 and in the Remuneration Report. DIRECTORS’ RETIREMENT AND RE-ELECTION The Woodside Energy Group Ltd Constitution sets out the requirements for the retirement and re-election of Directors. With the exception of the CEO/Managing Director, Directors must retire at the third AGM following their election or most recent re-election. At least one Director must stand for election at each AGM. Board support for a Director’s re-election is not automatic and is subject to satisfactory Director performance and assessment of overall Board composition and capabilities. DIRECTOR INDEPENDENCE In accordance with the Policy on Independence of Directors, the Board assesses independence with reference to whether a Director is non-executive, not a member of management and is free of any business or other relationship that could materially interfere with, or could reasonably be perceived to materially interfere with, the independent exercise of their judgement. In making this assessment, the Board considers all relevant facts and circumstances. In particular, the Board focuses on the factors relevant to assessing the independence of a Director set out in Box 2.3 of the ASXCGC Recommendations. The Board has reviewed the independence of each of the Non- Executive Directors in office at the date of this Statement and determined that they are all independent. The CEO, Meg O’Neill, is not considered independent as she is an Executive Director and a member of management. CONFLICTS OF INTEREST The Board has approved a Directors’ Conflict of Interest Policy which applies if there is, or may be, a conflict between the personal interests of a Director, or the duties a Director owes to another company, and the duties the Director owes to Woodside. Directors are required to disclose circumstances that may affect, or be perceived to affect, their ability to exercise independent judgement so that the Board can assess independence on a regular basis. Under the Woodside Energy Group Ltd Constitution, Directors must comply with the Corporations Act 2001 (Cth) in relation to disclosure and voting on matters involving material personal interests. Subject to the Corporations Act 2001 (Cth): • a Director may be counted in a quorum at a Board meeting that considers, and may vote on, any matter in which that Director has an interest. • Woodside may proceed with any transaction that relates to the interest and the Director may participate in the execution of any relevant document by or on behalf of Woodside. • the Director may retain benefits under the transaction even though the Director has an interest. • Woodside cannot avoid the transaction merely because of the existence of the interest. AREAS OF COMPETENCE AND SKILLS OF THE BOARD OF DIRECTORS Each year, the Board, on the recommendation of the Nomination & Governance Committee, reviews and determines the composition and size of the Board, including succession plans, such that the Non-Executive Directors collectively bring the skills, knowledge and experience necessary to direct Woodside going forward. To assist with this review, each year the Nomination & Governance Committee evaluates and adopts a Director competencies matrix that the Committee determines is appropriate for Woodside’s operations, strategy and risks. In 2024, Directors were asked to confirm their competencies against the competencies matrix, through a process coordinated by an external consultant. As part of this process, three classifications were established for each competency, being ‘Expert/ Advanced’ and ‘General’ and ’Limited’, along with criteria for each of these classifications. Directors then participated in interviews facilitated by the external consultant, who assisted in the calibration of each Director’s individual competence and skill. Based on the outcome of the 2024 review, the Board considers that they collectively have a combination of skills and experience which are necessary to direct Woodside in accordance with high standards of corporate governance and oversee Woodside’s management and business activities. The Director competencies matrix and the outcome of the 2024 review are set out below. The Board also uses this competencies matrix to identify potential areas of focus for Director recruitment and to identify any professional development opportunities that may benefit Directors. 96 WOODSIDE ENERGY GROUP LTD
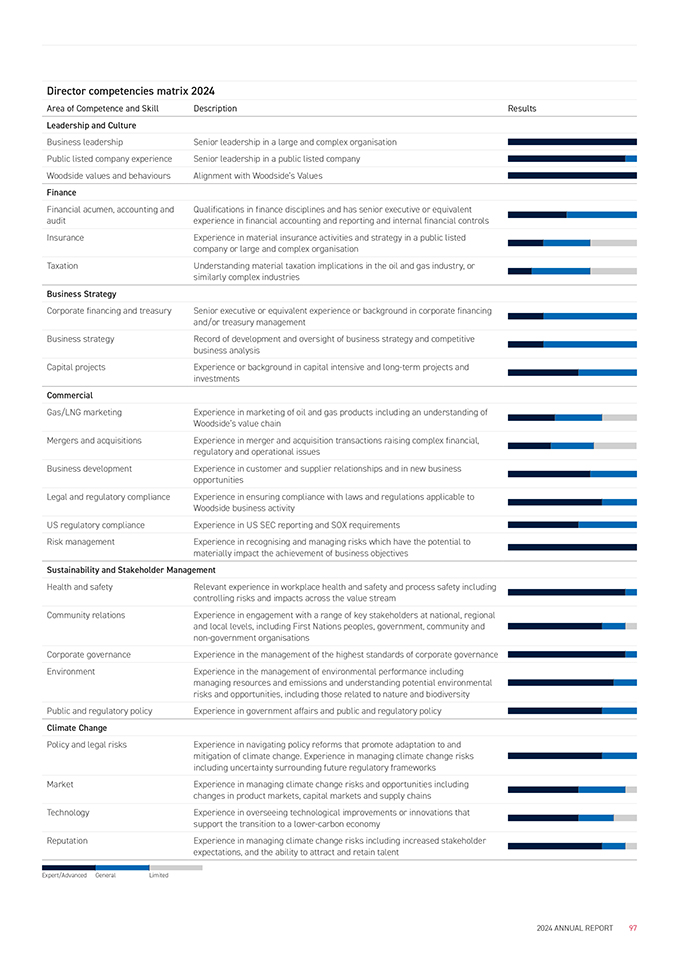
Director competencies matrix 2024 Area of Competence and Skill Description Results Leadership and Culture Business leadershipSenior leadership in a large and complex organisation Public listed company experienceSenior leadership in a public listed company Woodside values and behavioursAlignment with Woodside’s Values Finance Financial acumen, accounting and audit Qualifications in finance disciplines and has senior executive or equivalent experience in financial accounting and reporting and internal financial controls InsuranceExperience in material insurance activities and strategy in a public listed company or large and complex organisation TaxationUnderstanding material taxation implications in the oil and gas industry, or similarly complex industries Business Strategy Corporate financing and treasurySenior executive or equivalent experience or background in corporate financing and/or treasury management Business strategyRecord of development and oversight of business strategy and competitive business analysis Capital projectsExperience or background in capital intensive and long-term projects and investments Commercial Gas/LNG marketingExperience in marketing of oil and gas products including an understanding of Woodside’s value chain Mergers and acquisitionsExperience in merger and acquisition transactions raising complex financial, regulatory and operational issues Business developmentExperience in customer and supplier relationships and in new business opportunities Legal and regulatory complianceExperience in ensuring compliance with laws and regulations applicable to Woodside business activity US regulatory complianceExperience in US SEC reporting and SOX requirements Risk managementExperience in recognising and managing risks which have the potential to materially impact the achievement of business objectives Sustainability and Stakeholder Management Health and safetyRelevant experience in workplace health and safety and process safety including controlling risks and impacts across the value stream Community relationsExperience in engagement with a range of key stakeholders at national, regional and local levels, including First Nations peoples, government, community and non-government organisations Corporate governanceExperience in the management of the highest standards of corporate governance EnvironmentExperience in the management of environmental performance including managing resources and emissions and understanding potential environmental risks and opportunities, including those related to nature and biodiversity Public and regulatory policyExperience in government affairs and public and regulatory policy Climate Change Policy and legal risksExperience in navigating policy reforms that promote adaptation to and mitigation of climate change. Experience in managing climate change risks including uncertainty surrounding future regulatory frameworks MarketExperience in managing climate change risks and opportunities including changes in product markets, capital markets and supply chains TechnologyExperience in overseeing technological improvements or innovations that support the transition to a lower-carbon economy Reputation Experience in managing climate change risks including increased stakeholder expectations, and the ability to attract and retain talent Expert/Advanced GeneralLimited 2024 ANNUAL REPORT 97
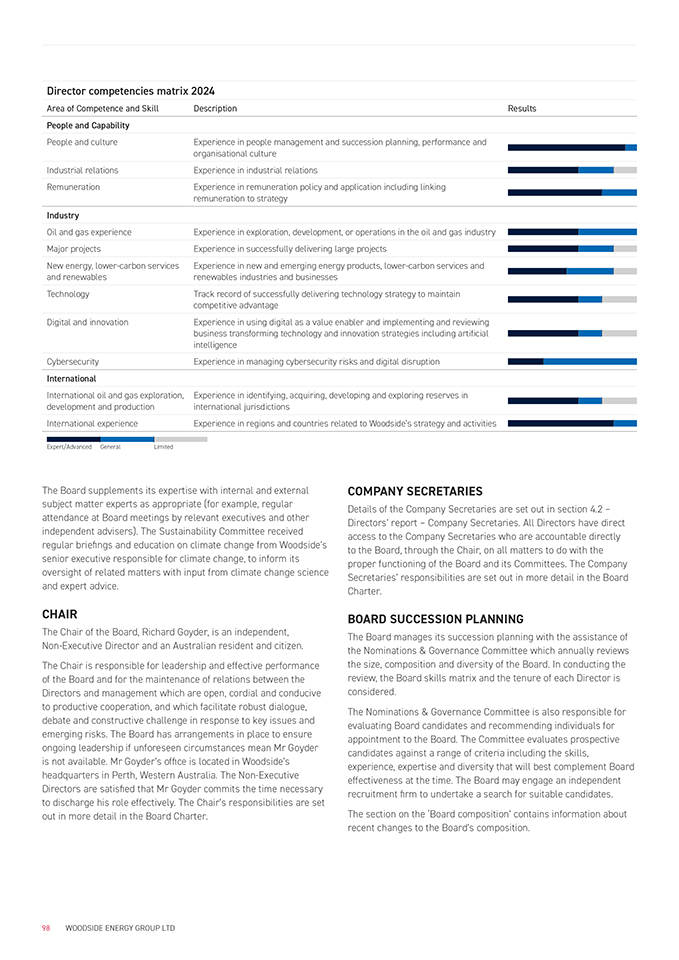
Director competencies matrix 2024 Area of Competence and Skill Description Results People and Capability People and cultureExperience in people management and succession planning, performance and organisational culture Industrial relationsExperience in industrial relations Remuneration Experience in remuneration policy and application including linking remuneration to strategy Industry Oil and gas experienceExperience in exploration, development, or operations in the oil and gas industry Major projectsExperience in successfully delivering large projects New energy, lower-carbon services and renewables Experience in new and emerging energy products, lower-carbon services and renewables industries and businesses TechnologyTrack record of successfully delivering technology strategy to maintain competitive advantage Digital and innovation Experience in using digital as a value enabler and implementing and reviewing business transforming technology and innovation strategies including artificial intelligence Cybersecurity Experience in managing cybersecurity risks and digital disruption International International oil and gas exploration, development and production Experience in identifying, acquiring, developing and exploring reserves in international jurisdictions International experienceExperience in regions and countries related to Woodside’s strategy and activities Expert/Advanced GeneralLimited The Board supplements its expertise with internal and external subject matter experts as appropriate (for example, regular attendance at Board meetings by relevant executives and other independent advisers). The Sustainability Committee received regular briefings and education on climate change from Woodside’s senior executive responsible for climate change, to inform its oversight of related matters with input from climate change science and expert advice. CHAIR The Chair of the Board, Richard Goyder, is an independent, Non-Executive Director and an Australian resident and citizen. The Chair is responsible for leadership and effective performance of the Board and for the maintenance of relations between the Directors and management which are open, cordial and conducive to productive cooperation, and which facilitate robust dialogue, debate and constructive challenge in response to key issues and emerging risks. The Board has arrangements in place to ensure ongoing leadership if unforeseen circumstances mean Mr Goyder is not available. Mr Goyder’s office is located in Woodside’s headquarters in Perth, Western Australia. The Non-Executive Directors are satisfied that Mr Goyder commits the time necessary to discharge his role effectively. The Chair’s responsibilities are set out in more detail in the Board Charter. COMPANY SECRETARIES Details of the Company Secretaries are set out in section 4.2 – Directors’ report – Company Secretaries. All Directors have direct access to the Company Secretaries who are accountable directly to the Board, through the Chair, on all matters to do with the proper functioning of the Board and its Committees. The Company Secretaries’ responsibilities are set out in more detail in the Board Charter. BOARD SUCCESSION PLANNING The Board manages its succession planning with the assistance of the Nominations & Governance Committee which annually reviews the size, composition and diversity of the Board. In conducting the review, the Board skills matrix and the tenure of each Director is considered. The Nominations & Governance Committee is also responsible for evaluating Board candidates and recommending individuals for appointment to the Board. The Committee evaluates prospective candidates against a range of criteria including the skills, experience, expertise and diversity that will best complement Board effectiveness at the time. The Board may engage an independent recruitment firm to undertake a search for suitable candidates. The section on the ‘Board composition’ contains information about recent changes to the Board’s composition. 98 WOODSIDE ENERGY GROUP LTD

4.1.3 Board Committees The Board has four standing committees to assist in the discharge of its responsibilities. The Committees operate principally in a review or advisory capacity, except in cases where powers are specifically conferred on a Committee by the Board. Each Committee has a Charter, detailing its role, duties and membership requirements. The Committee Charters are reviewed regularly and updated as required. Membership of the Committees is based on Directors’ qualifications, skills and experience. Each Standing Committee is comprised of: • only Non-Executive Directors • at least three members, the majority of whom are independent • a Chair appointed by the Board who is one of the independent Non-Executive Directors. The Audit & Risk Committee, the Human Resources & Compensation Committee and the Sustainability Committee have additional membership requirements as set out in their respective Charters. Each Committee is entitled to seek information from any employee of Woodside and to obtain any professional advice it requires in order to perform its duties. All Directors are entitled to and generally attend meetings of the Standing Committees. Directors’ attendance at Board and Committee meetings can be found on page 95. Audit & Risk Committee Assists with overseeing Woodside’s financial reporting, compliance with legal and regulatory requirements, risk management and the internal and external audit functions in accordance with the Committee Charter. Members • Ben Wyatt (Committee Chair from 25 April 2024, following the retirement of Frank Cooper) • Larry Archibald • Ashok Belani (from January 2024) • Angela Minas • Tony O’Neill (from June 2024) Some of the 2024 key activities undertaken by the Committee include: • Overseeing developments in accounting, financial reporting and taxation relevant to Woodside • Reviewing significant accounting policies and practices • Reviewing and making recommendations to the Board for the adoption of the Group’s half-year and annual Financial Statements • Approving the fees and reviewing the external auditor’s scope and plan for the 2024 external audit, considering and approving non-audit services provided by the external auditor and reviewing the independence and performance of the external auditor • Reviewing Internal Audit reports and material post-investment reviews and approval of the 2025/2026 Internal Audit program • Overseeing the ongoing integration activities in connection with the merger with BHP Petroleum including Sarbanes-Oxley compliance and monitoring SAP S/4 HANA migration • Overseeing the ongoing integration activities in connection with Woodside’s acquisition of Tellurian Inc. and OCI Clean Ammonia Holding B.V. • Reviewing Woodside’s future dividend approach and operation of the distributable profits reserve • Reviewing the Group’s key risks and management of contemporary and emerging risks such as cybersecurity, conduct risk, technology and innovation, privacy and data breaches, sustainability and climate change • Overseeing matters and informing the Board of any material concerns raised under the Code of Conduct, the Anti-Bribery and Corruption Policy and the Whistleblower Policy which call into question the culture of the organisation • Reviewing and endorsing amendments to the Reserves and Resources Policy, Code of Conduct and the Whistleblower Policy • Undertaking ongoing shareholder and other external and internal stakeholder engagement • Informing the Board of Woodside’s compliance with material legal and regulatory requirements and any conduct that is materially inconsistent with Woodside’s Values or Code of Conduct. Audit committee financial expert Woodside’s Board has determined that Angela Minas, who currently serves as a member of the Audit & Risk Committee, meets the audit committee financial expert requirements under SEC Rules. The Board has also determined that she is independent under applicable NYSE Listing Rules. 2024 ANNUAL REPORT 99
Nominations & Governance Committee Assists the Board with reviewing Board composition, performance and succession planning, including identifying, evaluating and recommending candidates for the Board in accordance with the Committee Charter. Members • Richard Goyder (Committee Chair) • Larry Archibald • Ashok Belani (from January 2024) • Arnaud Breuillac • Swee Chen Goh • Ian Macfarlane • Angela Minas • Tony O’Neill (from June 2024) • Ann Pickard • Ben Wyatt Some of the 2024 key activities undertaken by the Committee include: • Identifying and recommending to the Board new Directors to join the Woodside Board in 2024 • Reviewing the size and composition of the Board • Reviewing the Director skills and competencies matrix • Reviewing the Directors’ material interests • Overseeing Board succession planning • Recommending to the Board Directors for re-election • Recommending for Board approval the Woodside Corporate Governance Statement • Approving the process for the annual Board performance evaluation • Reviewing Woodside’s governance framework and practices. Human Resources & Compensation Committee Assists with establishing human resources and compensation policies and practices in accordance with the Committee Charter. Members • Arnaud Breuillac (Committee Chair) • Swee Chen Goh • Ian Macfarlane • Ann Pickard • Ben Wyatt Some of the 2024 key activities undertaken by the Committee include: • Considering industrial relations issues relevant to Woodside’s onshore and offshore assets • Approving changes to the leadership structure, including the appointment and remuneration packages of executives reporting directly to the CEO • Considering Woodside’s organisation design and policy changes required to meet changing regulatory requirements • Overseeing amendments to Woodside’s employee and executive equity plans • Overseeing Woodside’s response to Australian and US legislative and corporate governance developments, including Workplace Gender Equality Agency legislation reforms, and stakeholder feedback, in relation to employment and remuneration matters relevant to Woodside • Reviewing and endorsing amendments to the Remuneration Policy • Reviewing Woodside’s remuneration policies globally and practices and considering advice on the remuneration of Woodside’s key management personnel • Reviewing Woodside’s recruitment and retention strategies • Oversight of programs to assess and monitor culture (such as survey findings), including across all areas of our Integrated Culture Framework (values, safety, risk and compliance) • Reviewing progress against the 2021-2025 Inclusion and Diversity strategy and consideration of global differences • Reviewing and making recommendations to the Board on: › remuneration of Non-Executive Directors › remuneration of the CEO › criteria for the evaluation of the CEO’s performance › incentives payable to the CEO › employee equity-based plans › the annual Remuneration Report. 100 WOODSIDE ENERGY GROUP LTD
Sustainability Committee
Assists the Board in meeting its oversight responsibilities in relation to Woodsides’s sustainability policies and practices in accordance with the
Committee Charter.
Members
Ann Pickard (Committee Chair)
Larry Archibald
Ashok Belani (from January 2024)
Arnaud Breuillac
Swee Chen Goh
Ian Macfarlane
Angela Minas
Tony O’Neill (from June 2024)
Some of the 2024 key activities undertaken by the Committee include:
Overseeing Woodside’s response to key safety events
Overseeing Woodside’s in-year Scope 1 and 2 GHG emissions performance, and its plans for meeting emissions reduction targets
Reviewing Woodside’s environmental performance, including major incident prevention
Overseeing the Group’s health and personal safety performance
Considering for Board approval Woodside’s approach to climate reporting
Overseeing Woodside’s process safety performance including major incident prevention
Reviewing Woodside’s quality management
Considering security and emergency management performance, including major incident prevention and response and business continuity
Reviewing delivery against Woodside’s 2021-2025 Reconciliation Action
Plan
Considering Woodside’s management of climate change risk and opportunities
Overseeing and reviewing the performance of Woodside’s Climate
Transition Action Plan
Overseeing and reviewing the preparation of the 2024 Climate Update, and approach to climate-related disclosures
Keeping up to date with Woodside’s implementation plan in relation to
its involvement in the Oil & Gas Methane Partnership 2.0 (OGMP 2.0) and the UN Environment Program
Considering First Nations affairs, including cultural heritage and land access matters
Reviewing Woodside’s activities supporting local content in our supply chain
Overseeing Woodside’s social performance and social contribution in our host communities
Reviewing Woodside’s reputational performance and issues of signi?cance to our communities and stakeholders
Overseeing publication of the Reconciliation Action Plan Report 2023
Endorsing for Board approval Woodside’s Modern Slavery Statement
2023 and reviewing related human rights issues.

4.1.4 Executive Leadership Team
Mark Abbotsford Executive Vice President and Chief Commercial Officer1
BEc (Hons), MPhil, MBA, AMP
Tony Cudmore
Executive Vice President Sustainability, Policy and External Affairs
BA, GCIR
Andy Drummond
Executive Vice President Strategy
BEng (Hons) (ChemEng)
Joined Woodside: 2002 Joined Woodside: 2022 Joined Woodside: 2022
Experience: Mark leads Woodside’s commercial, marketing and trading teams and is responsible for developing Woodside’s growth opportunities through his leadership of mergers and acquisitions, new energy business development, exploration and new venture teams. Mark has over 20 years of industry experience and has held a number of senior leadership positions across commercial, ?nance and marketing
in various global locations. Prior to joining Woodside, Mark held roles at Treasury (Western Australia) and BHP Iron Ore.
External directorships: Board member of the Chamber of Commerce and Industry (WA), GLX Digital and Asia Natural Gas and Energy Association (ANGEA).
Experience: Tony leads Sustainability, Policy & External Affairs. He joined Woodside in 2022 as Executive Vice President Strategy and Climate. Tony has over 20 years of industry experience. Prior to joining Woodside, Tony held senior leadership positions at ExxonMobil and BHP including Chief Public Affairs Of?cer, and Group Sustainability and Public Policy Of?cer.
External directorships: Nil.
Experience: Andy is responsible for delivering a global portfolio of growth options. Andy has over 25 years of industry experience. Prior to joining Woodside, Andy held senior leadership positions at BHP and Marathon Oil Corporation, including Vice President of Sustainability and Innovation for BHP’s petroleum business.
External directorships: Nil.
Julie Fallon
Executive Vice President Technical and
Energy Development
BEng (Hons), (ChemEng), GAICD
Daniel Kalms
Executive Vice President and
Chief Operating Officer, International1
BEng (Hons) (ChemEng), MBA, GAICD
Ruth Lyall
Senior Vice President Human Resources
BA (Hons), MHRM, GAICD
Joined Woodside: 1998 Joined Woodside: 2001 Joined Woodside: 2010
Experience: Julie is responsible for a range of areas including project development, reserves and subsurface, well and seismic engineering and technology, digital, IT and cybersecurity, and health, safety and environment. Julie has
30 years of industry experience and has held a number of senior leadership roles at Woodside, including Executive Vice President Corporate Services, Senior Vice President Pluto and Senior Vice President Engineering.
External directorships: Director and President of the Australian Resources and Energy Employer Association (since August 2024). Advisory Board member of the Chamber of Minerals and Energy of Western Australia.
Experience: Daniel is responsible for Woodside’s projects and business operations in the
United States, Senegal, Trinidad and Tobago, Mexico and Canada. Daniel has over 25 years of industry experience and has held roles across the breadth of Woodside’s business. Most recently he was Executive Vice President Technical Services and oversaw Woodside’s technical services including engineering, subsurface, technology and digital.
External directorships: Board member of United
Way of Greater Houston.
Experience: Ruth is responsible for human resources and security and global workplace. Prior to her current appointment, Ruth served
as Woodside’s Vice President Human Resources, and was the regional head of Human Resources for Woodside’s Australian region. Ruth is a human resources professional with more
than 20 years of experience and since joining Woodside in 2010, has led several different parts of the Human Resources function including business partnering and organisational development.
External directorships: Nil.
1. Identified as key management personnel (KMP)

Rebecca McNicol
Senior Vice President Legal and
Group General Counsel
BCom, LLB
Graham Tiver Executive Vice President and Chief Financial Officer1
BBus, FCPA
Elizabeth (Liz) Westcott
Executive Vice President and
Chief Operating Officer Australia1
BCom, BEng (Hons), GAICD
Joined Woodside: 2011 Joined Woodside: 2022 Joined Woodside: 2023
Experience: Rebecca is responsible for legal, ethics and compliance, company secretariat and internal audit. Rebecca is a solicitor with more than 25 years of legal, mergers and
acquisitions and commercial experience and has held a number of senior roles within Woodside including Vice President Legal, Vice President Mergers and Acquisitions and Vice President Commercial. Prior to joining Woodside, Rebecca practised law at Mallesons Stephen Jaques
(now King & Wood Mallesons) with a focus on mergers and acquisitions, energy, corporate law and governance.
External directorships: Nil.
Experience: Graham is responsible for ?nance; ?nancial control; treasury; tax; investor relations; governance, risk and compliance; contracting
and procurement and business improvement planning. Prior to joining Woodside, Graham spent 28 years with BHP and WMC Resources where he held signi?cant ?nancial, commercial and leadership roles across multiple business sectors. Graham has extensive international experience, having worked in North and South America as well as in a variety of roles around Australia.
External directorships: Advisory Board member of UWA Business School (from March 2025).
Experience: Liz leads Woodside’s projects and business operations for Australia, focusing
on optimising value across the portfolio and throughout an asset’s lifecycle. Liz joined Woodside in 2023 as Executive Vice President Australian Operations, with responsibility for the safe, ef?cient and reliable operation of Woodside’s portfolio of assets across Australia. Liz has over 30 years of industry experience
in operations and project roles. Prior to joining Woodside, Liz held senior leadership roles at EnergyAustralia and ExxonMobil spanning strategic planning, operations, project management, and safety, technical and commercial leadership.
External directorships: Nil.
Performance evaluation of Executive Leadership Team
Senior executive performance is reviewed annually, which considers and assesses the executive’s performance against a list of key performance indicators.
All senior executives had a performance evaluation in FY2024 and further details are set out in section 4.3 – Remuneration Report. Details of the CEO’s performance evaluation (process and outcomes) are set out in section 4.3 – Remuneration Report and
‘Board Performance Evaluation’ on page 96.
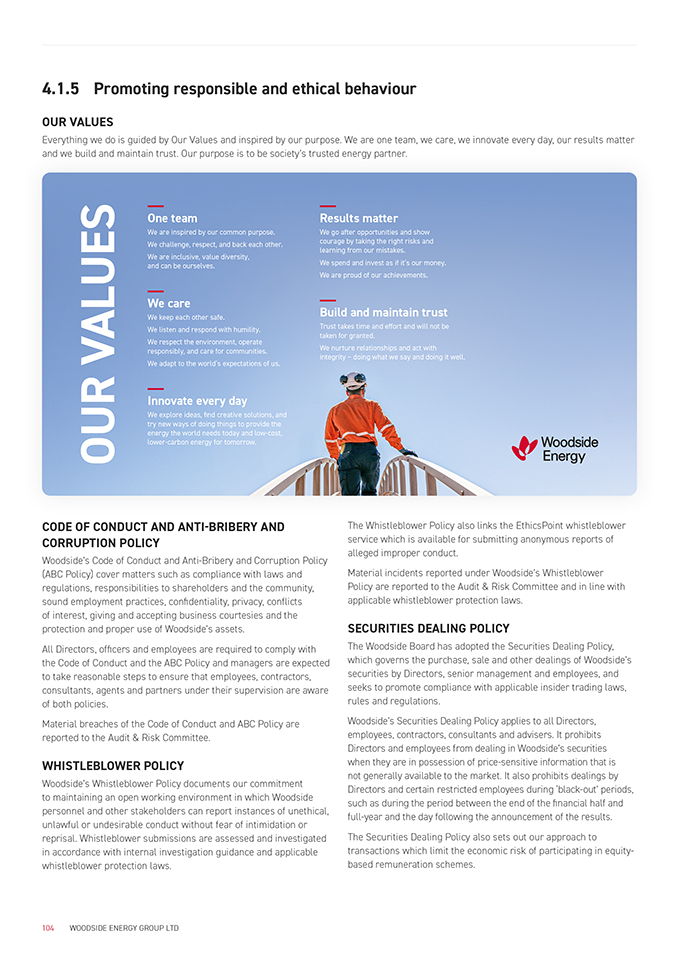
1. Identified as key management personnel (KMP)
4.1.5 Promoting responsible and ethical behaviour
OUR VALUES
Everything we do is guided by Our Values and inspired by our purpose. We are one team, we care, we innovate every day, our results matter
One team
We are inspired by our common purpose. We challenge, respect, and back each other.
We are inclusive, value diversity, and can be ourselves.
Results matter
We go after opportunities and show courage by taking the right risks and learning from our mistakes.
We spend and invest as if it’s our money. We are proud of our achievements.
We care
We keep each other safe.
We listen and respond with humility. We respect the environment, operate
responsibly, and care for communities.
We adapt to the world’s expectations of us.
Build and maintain trust Trust takes time and effort and will not be taken for granted.
We nurture relationships and act with
integrity – doing what we say and doing it well.
Innovate every day
We explore ideas, find creative solutions, and try new ways of doing things to provide the energy the world needs today and low-cost, lower-carbon energy for tomorrow.
CODE OF CONDUCT AND ANTI-BRIBERY AND CORRUPTION POLICY
Woodside’s Code of Conduct and Anti-Bribery and Corruption Policy (ABC Policy) cover matters such as compliance with laws and regulations, responsibilities to shareholders and the community, sound employment practices, con?dentiality, privacy, conflicts
of interest, giving and accepting business courtesies and the protection and proper use of Woodside’s assets.
All Directors, of?cers and employees are required to comply with
the Code of Conduct and the ABC Policy and managers are expected to take reasonable steps to ensure that employees, contractors, consultants, agents and partners under their supervision are aware of both policies.
Material breaches of the Code of Conduct and ABC Policy are reported to the Audit & Risk Committee.
WHISTLEBLOWER POLICY
Woodside’s Whistleblower Policy documents our commitment
to maintaining an open working environment in which Woodside personnel and other stakeholders can report instances of unethical, unlawful or undesirable conduct without fear of intimidation or reprisal. Whistleblower submissions are assessed and investigated in accordance with internal investigation guidance and applicable whistleblower protection laws.33
The Whistleblower Policy also links the EthicsPoint whistleblower service which is available for submitting anonymous reports of alleged improper conduct.
Material incidents reported under Woodside’s Whistleblower Policy are reported to the Audit & Risk Committee and in line with applicable whistleblower protection laws.
SECURITIES DEALING POLICY
The Woodside Board has adopted the Securities Dealing Policy, which governs the purchase, sale and other dealings of Woodside’s securities by Directors, senior management and employees, and seeks to promote compliance with applicable insider trading laws, rules and regulations.
Woodside’s Securities Dealing Policy applies to all Directors, employees, contractors, consultants and advisers. It prohibits Directors and employees from dealing in Woodside’s securities when they are in possession of price-sensitive information that is not generally available to the market. It also prohibits dealings by
Directors and certain restricted employees during ‘black-out’ periods, such as during the period between the end of the ?nancial half and full-year and the day following the announcement of the results.
The Securities Dealing Policy also sets out our approach to transactions which limit the economic risk of participating in equity- based remuneration schemes.
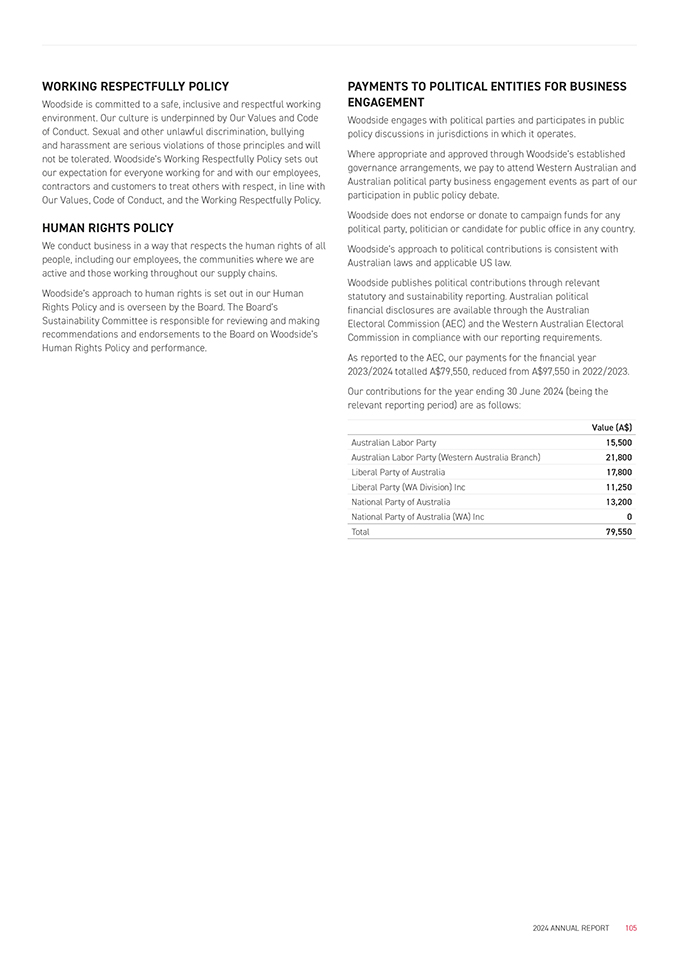
WORKING RESPECTFULLY POLICY
Woodside is committed to a safe, inclusive and respectful working environment. Our culture is underpinned by Our Values and Code of Conduct. Sexual and other unlawful discrimination, bullying
and harassment are serious violations of those principles and will not be tolerated. Woodside’s Working Respectfully Policy sets out our expectation for everyone working for and with our employees, contractors and customers to treat others with respect, in line with Our Values, Code of Conduct, and the Working Respectfully Policy.
HUMAN RIGHTS POLICY
We conduct business in a way that respects the human rights of all people, including our employees, the communities where we are active and those working throughout our supply chains.
Woodside’s approach to human rights is set out in our Human Rights Policy and is overseen by the Board. The Board’s Sustainability Committee is responsible for reviewing and making recommendations and endorsements to the Board on Woodside’s Human Rights Policy and performance.
PAYMENTS TO POLITICAL ENTITIES FOR BUSINESS ENGAGEMENT
Woodside engages with political parties and participates in public policy discussions in jurisdictions in which it operates.
Where appropriate and approved through Woodside’s established governance arrangements, we pay to attend Western Australian and Australian political party business engagement events as part of our participation in public policy debate.
Woodside does not endorse or donate to campaign funds for any political party, politician or candidate for public office in any country.
Woodside’s approach to political contributions is consistent with
Australian laws and applicable US law.
Woodside publishes political contributions through relevant statutory and sustainability reporting. Australian political financial disclosures are available through the Australian
Electoral Commission (AEC) and the Western Australian Electoral
Commission in compliance with our reporting requirements.
As reported to the AEC, our payments for the ?nancial year
2023/2024 totalled A$79,550, reduced from A$97,550 in 2022/2023.
Our contributions for the year ending 30 June 2024 (being the relevant reporting period) are as follows:
Value (A$)
Australian Labor Party 15,500
Australian Labor Party (Western Australia Branch) 21,800
Liberal Party of Australia 17,800
Liberal Party (WA Division) Inc 11,250
National Party of Australia 13,200
National Party of Australia (WA) Inc 0
Total 79,550
4.1.6 Risk management and internal control
RISK MANAGEMENT
Approach to risk management
Woodside is committed to managing risks in a proactive and effective manner as a source of competitive advantage. Our approach is intended to protect us against potential negative impacts and improve our resilience against emerging risks. These include conduct risk, technology and innovation, cybersecurity, privacy and data breaches, sustainability and climate change.
Woodside’s Risk Management Policy describes the manner in which
Woodside:
provides a consolidated view of risks across Woodside to understand risk exposure and prioritise risk management and governance
confers responsibility on Woodside staff at all levels to pro- actively identify, assess and treat risks relating to the objectives they are accountable for delivering.
The role of the Board and Audit & Risk Committee in risk management
The Board is responsible for reviewing and approving Woodside’s risk management framework, policy and performance. The Board is also responsible for satisfying itself that management has developed and implemented a sound system of risk management and internal control.
The Board has delegated oversight of the Risk Management Policy, including review (at least annually) of the effectiveness of Woodside’s internal control system and risk management framework, to the Audit & Risk Committee. The Audit & Risk Committee also regularly reviews Woodside’s Risk Appetite
Statement, oversees Internal Audit’s activities and reviews Internal
Audit’s performance.
Management is responsible for promoting and applying the Risk
Management Policy.
In 2024, the Audit & Risk Committee reviewed and con?rmed Woodside’s risk management framework was sound, and that Woodside was operating with due regard to the risk appetite endorsed by the Board.
Internal audit function
Internal Audit provides assurance that the design and operation of the Group’s risk management and internal control system is effective. A risk-based audit approach is used to ensure that higher risk activities are prioritised in the audit program.
Internal Audit is independent of both business management and of the activities it reviews and has all necessary access to management and information to fulfil its role. Internal Audit is staffed by industry professionals including quali?ed accountants and engineers. The head of Internal Audit is jointly accountable to
the Audit & Risk Committee and the Senior Vice President Legal and
Group General Counsel.
Governance, risk and compliance function
The Governance, Risk and Compliance function is responsible for Woodside’s risk management framework, development of risk management capability, and providing risk management oversight to senior levels of management and the Audit & Risk Committee on the strategic risk pro?le and the Group’s risk management performance.
Material risks
Our material exposure to risks (including environmental and social risks) and how they are managed are disclosed in section 3.9 – Risk factors.
EXTERNAL AUDIT AND REPORTING
External auditor
In accordance with Woodside’s External Auditor Policy, the Audit
& Risk Committee oversees the engagement of Woodside’s
external auditor, governed by the External Auditor Guidance Policy. PricewaterhouseCoopers (PwC) is the external auditor of the Group. Internal audit and external audit are separate and independent of each other.
The Audit & Risk Committee evaluates the objectivity and independence of the external auditor and the quality and effectiveness of the external audit arrangements, including through:
review of all non-audit services for actual and perceived independence threats;
con?rmation that non-audit service fee commitment does not exceed 70% of audit fees for the year;
con?rmation that Woodside fees do not exceed 10% of PwC Perth aggregate revenues for the prior period; and
annual review of auditor performance.
External auditor independence
Woodside’s External Auditor Guidance Policy includes provisions directed at maintaining the independence of the external auditor and assessing whether the proposed provision of any non-audit services by the external auditor is appropriate. It classi?es a range of non-audit services which could potentially be provided by the external auditor as acceptable within limits, requiring Audit & Risk Committee pre-approval or are not acceptable. The Audit & Risk Committee reviews the auditor independence annually.
The Audit & Risk Committee did not waive the pre-approval requirement under paragraph (c)(7)(i) of Rule 2-01 of SEC Regulation S-X in 2024.
Under SEC regulations, the remuneration of the external auditors have been disclosed in Note E.4 to the Financial Statements.
The nature of the services comprising each category of fees is described below:
Audit – work that constitutes the agreed fees for the audit of Woodside’s consolidated ?nancial statements, report on Woodside’s internal controls over ?nancial reporting, and statutory audits of Woodside’s controlled entities (including interim reviews).
Audit-related – includes assurance services and agreed upon procedures. This is work that is outside the scope of the statutory audits of Woodside and its controlled entities but is consistent with the role of the external statutory auditor. The work is reasonably related to the performance of an audit or review, is of a compliance or procedural nature, and is work that the external auditors must or are best placed to undertake and is permissible within the framework of the Sarbanes-Oxley Act and other relevant independence standards.
Tax services – tax related work, including tax compliance services, that is outside the scope of the statutory audits of Woodside and its controlled entities but is permissible within the framework of the Sarbanes-Oxley Act and other relevant independence standards.
Other services – other work that is permissible within the framework of the Sarbanes-Oxley Act and other relevant independence standards.
Verification of periodic corporate reports
The Board has adopted a Continuous Disclosure and Market Communications Policy (Disclosure Policy) that applies to all disclosures to the market, including periodic corporate reports that are not reviewed or audited by an external auditor. Management has developed practices and guidance material that are intended
to verify the integrity of and ensure that periodic corporate reports provide clear, concise and effective disclosure, in accordance
with the Disclosure Policy. Authority has been delegated to
the Disclosure Committee to ensure the implementation of the reporting and communications processes and controls set out in the Disclosure Policy and associated guidance material.
Reports are prepared by, or under the supervision of, subject matter experts and material statements in the reports are reviewed for accuracy. Reports are also reviewed for compliance with applicable legal and regulatory requirements. This process is intended to ensure that all applicable laws, regulations and company policies have been complied with, and that appropriate approvals are obtained before a report is released to the market.
CEO and CFO assurance
Before approving the Financial Statements for a ?nancial period, the
Board receives from the CEO and CFO a declaration stating that:
in their opinion Woodside’s financial records have been properly maintained, comply with the appropriate accounting standards and give a true and fair view of Woodside’s financial position and performance; and
the above opinion has been formed on the basis of a sound system of risk management and internal control which is operating effectively; and
the consolidated entity disclosure statement required by section
295(3A) of the Corporations Act 2001 (Cth) is true and correct as at 31 December 2024.
4.1.7 Inclusion and diversity
INCLUSION AND DIVERSITY POLICY
Our Inclusion and Diversity (I&D) Policy outlines our commitment to an inclusive workplace culture and applies throughout Woodside, including the Board and its Committees. The Human Resources & Compensation Committee is responsible for monitoring Woodside’s I&D Policy, and for delivering its other objectives as set out in the Human Resources & Compensation Committee Charter which is available on our website at woodside.com.
We focus on creating a culture which encompasses differences in age, nationality, race, ethnicity, national origin, religious beliefs, sex, sexual orientation, intersex status, gender identity or expression, relationship status, disability, neurodiversity, cultural background, thinking styles, experience, family background (including caregiving commitments) and education.
Initiatives to promote inclusion and diversity
Woodside aims to drive I&D and implement the objectives set out in the I&D Policy by, among other things:
respecting the unique attributes that every individual brings to the workplace and fostering a values-based and leader-led inclusive culture
providing education and training to better understand inclusivity in the workplace, as well as conducting reviews, undertaking initiatives and measuring the culture of the organisation
amplifying the voices of employees to inform our activities by enabling Employee Impact Groups and conducting employee surveys
conducting annual remuneration reviews to gauge equity in compensation, and providing resources and processes to improve the equity of opportunity
the Board annually reviewing the aspirational goals it has set
for achieving improvement in Woodside’s I&D indicators and the progress in achieving those objectives:
› reporting gender equality indicators in accordance with the Workplace Gender Equality Act 2012 (Cth). Further information is contained in our 2024 submission available on our website at woodside.com
› focusing on recruiting, developing and retaining Indigenous Australian talent to better represent the communities in which we operate.
2024 MEASURABLE OBJECTIVES
Our 2024 measurable objectives include objectives set out in our I&D Policy. Further information about Board and executive management diversity, including Board commitments to and progress on reaching Board gender equality of 40% male / 40% female / 20% either gender, is on page 110.
2024 measurable objective Progress
Continue to track the perceived level of inclusion and use inclusion survey insights to inform initiatives to continually improve
Embed Respectful Behaviours at Woodside via increasing a ‘speak up’ culture and proactive employee engagement on this topic
Ensure diversity of the Board with consideration for gender, racial and cultural diversity
Increase the percentage of Indigenous Australian people employed in leadership roles, mid-career and senior roles and overall
Make progress towards our aspirations to increase the percentage of females employed in leadership roles, trade and technician roles and overall
The Our Voice employee survey was completed twice in 2024, with belonging, inclusive culture and inclusive leadership measured. The feedback from this survey has informed our efforts in 2024 and will inform our 2025 priorities.
This year 447 people completed the 3.5 hour Working Better Together – Respectful Behaviours program and 54 people completed the 1.5-hour Respect at Woodside education session.
During 2024, through the Navigator Leadership Program, 1071 employees completed leadership program immersions; and 80 leaders completed the Inclusive Leadership Six Signature Traits course (2 x 1⁄2 day sessions).
The Our Voice Survey recorded improvements in employee perception of feeling safe to speak up
(62%), and of working in an environment which is free from harassment and discrimination (83%).
As of 31 December 2024, Board diversity included:
› 36.4% female representation
› 9% LGBTIQA+ representation
› country based cultural diversity – Indigenous and non-Indigenous Australian, American, Singaporean Chinese, Indian, Greek and French
› racial diversity – 18% Asian, 9% Indigenous Australian, 73% white/Caucasian.
Establishment of a specialised role dedicated to sourcing Indigenous talent saw mid-career representation rise from 0.8% in 2023 to 1.3% in 2024 (+58%).
Overall participation (including pathway program participants) increased to 5.8% (from 5.7%).
The percentage of females employed by Woodside in:
› trade and technician roles increased to 11.7% (from 11.2%)
› leadership roles increased to 27.8% (from 27.7%)
There was an overall increase to 33.8% (from 33.6%)
Trion I&D strategy developed and moved into implementation phase.
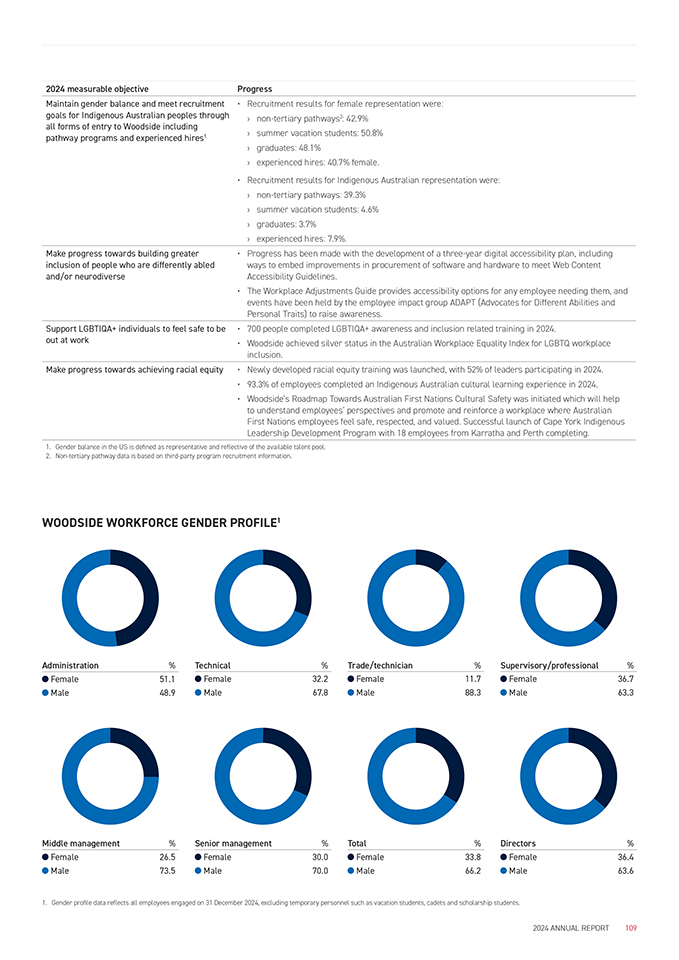
2024 measurable objective Progress
Maintain gender balance and meet recruitment goals for Indigenous Australian peoples through all forms of entry to Woodside including
pathway programs and experienced hires1
Make progress towards building greater inclusion of people who are differently abled and/or neurodiverse
Support LGBTIQA+ individuals to feel safe to be out at work
Recruitment results for female representation were:
› non-tertiary pathways2: 42.9%
› summer vacation students: 50.8%
› graduates: 48.1%
› experienced hires: 40.7% female.
Recruitment results for Indigenous Australian representation were:
› non-tertiary pathways: 39.3%
› summer vacation students: 4.6%
› graduates: 3.7%
› experienced hires: 7.9%.
Progress has been made with the development of a three-year digital accessibility plan, including ways to embed improvements in procurement of software and hardware to meet Web Content Accessibility Guidelines.
The Workplace Adjustments Guide provides accessibility options for any employee needing them, and events have been held by the employee impact group ADAPT (Advocates for Different Abilities and Personal Traits) to raise awareness.
700 people completed LGBTIQA+ awareness and inclusion related training in 2024.
Woodside achieved silver status in the Australian Workplace Equality Index for LGBTQ workplace inclusion.
Make progress towards achieving racial equity • Newly developed racial equity training was launched, with 52% of leaders participating in 2024.
93.3% of employees completed an Indigenous Australian cultural learning experience in 2024.
Woodside’s Roadmap Towards Australian First Nations Cultural Safety was initiated which will help to understand employees’ perspectives and promote and reinforce a workplace where Australian First Nations employees feel safe, respected, and valued. Successful launch of Cape York Indigenous Leadership Development Program with 18 employees from Karratha and Perth completing.
1. Gender balance in the US is de?ned as representative and reflective of the available talent pool.
2. Non-tertiary pathway data is based on third-party program recruitment information.
WOODSIDE WORKFORCE GENDER PROFILE1
Administration%
Female 51.1
Male 48.9
Middle management%
Female 26.5
Male 73.5
1. Gender pro?le data reflects all employees engaged on 31 December 2024, excluding temporary personnel such as vacation students, cadets and scholarship students.
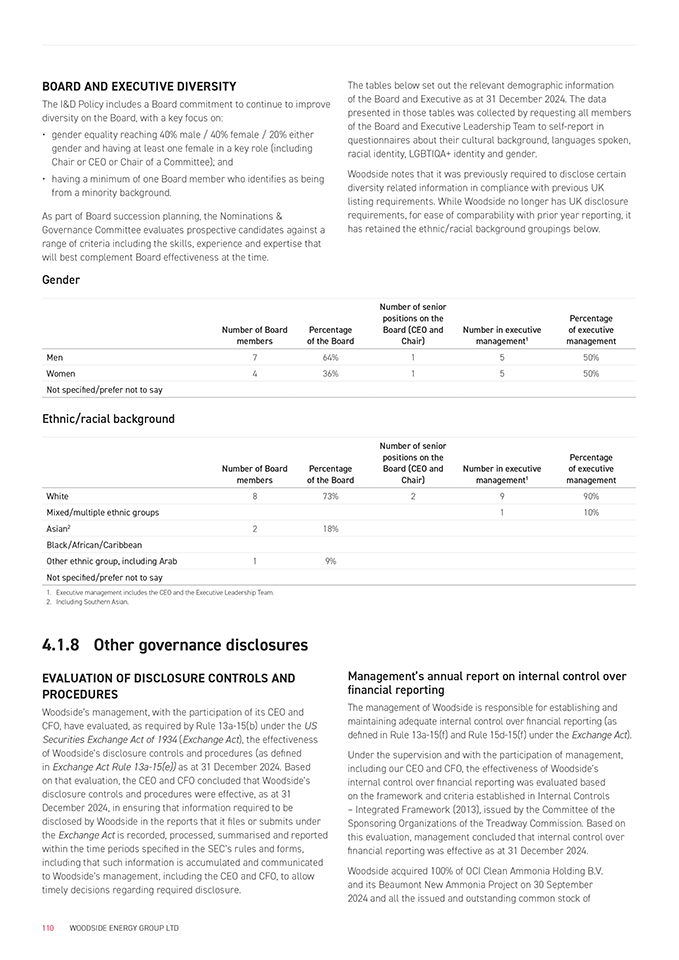
BOARD AND EXECUTIVE DIVERSITY
The I&D Policy includes a Board commitment to continue to improve diversity on the Board, with a key focus on:
gender equality reaching 40% male / 40% female / 20% either gender and having at least one female in a key role (including Chair or CEO or Chair of a Committee); and
having a minimum of one Board member who identifies as being from a minority background.
As part of Board succession planning, the Nominations & Governance Committee evaluates prospective candidates against a range of criteria including the skills, experience and expertise that will best complement Board effectiveness at the time.
Gender
The tables below set out the relevant demographic information of the Board and Executive as at 31 December 2024. The data presented in those tables was collected by requesting all members of the Board and Executive Leadership Team to self-report in questionnaires about their cultural background, languages spoken, racial identity, LGBTIQA+ identity and gender.
Woodside notes that it was previously required to disclose certain diversity related information in compliance with previous UK
listing requirements. While Woodside no longer has UK disclosure requirements, for ease of comparability with prior year reporting, it has retained the ethnic/racial background groupings below.
Number of senior
positions on the Percentage
Number of Board Percentage Board (CEO and Number in executive of executive
members of the Board Chair) management1 management
Men 7 64% 1 5 50%
Women 4 36% 1 5 50%
Not specified/prefer not to say
Ethnic/racial background
Number of Board members
Percentage of the Board Number of senior positions on the Board (CEO and Chair)
Number in executive management1
Percentage of executive management
White 8 73% 2 9 90%
Mixed/multiple ethnic groups 1 10%
Asian2 2 18%
Black/African/Caribbean
Other ethnic group, including Arab 1 9%
Not specified/prefer not to say
1. Executive management includes the CEO and the Executive Leadership Team.
2. Including Southern Asian.
4.1.8 Other governance disclosures
EVALUATION OF DISCLOSURE CONTROLS AND PROCEDURES
Woodside’s management, with the participation of its CEO and CFO, have evaluated, as required by Rule 13a-15(b) under the US Securities Exchange Act of 1934 (Exchange Act), the effectiveness of Woodside’s disclosure controls and procedures (as de?ned
in Exchange Act Rule 13a-15(e)) as at 31 December 2024. Based on that evaluation, the CEO and CFO concluded that Woodside’s disclosure controls and procedures were effective, as at 31
December 2024, in ensuring that information required to be disclosed by Woodside in the reports that it ?les or submits under the Exchange Act is recorded, processed, summarised and reported within the time periods speci?ed in the SEC’s rules and forms, including that such information is accumulated and communicated to Woodside’s management, including the CEO and CFO, to allow timely decisions regarding required disclosure.
Management’s annual report on internal control over financial reporting
The management of Woodside is responsible for establishing and maintaining adequate internal control over ?nancial reporting (as de?ned in Rule 13a-15(f) and Rule 15d-15(f) under the Exchange Act).
Under the supervision and with the participation of management, including our CEO and CFO, the effectiveness of Woodside’s internal control over ?nancial reporting was evaluated based
on the framework and criteria established in Internal Controls
– Integrated Framework (2013), issued by the Committee of the Sponsoring Organizations of the Treadway Commission. Based on this evaluation, management concluded that internal control over ?nancial reporting was effective as at 31 December 2024.
Woodside acquired 100% of OCI Clean Ammonia Holding B.V. and its Beaumont New Ammonia Project on 30 September
2024 and all the issued and outstanding common stock of
Tellurian Inc. on 8 October 2024 (Acquisitions). As permitted by the SEC Staff interpretative guidance that an assessment of internal controls over financial reporting of a recently acquired business may be excluded from management’s evaluation of disclosure controls and procedures for up to one year from
the date of acquisition, Woodside has excluded the Acquisitions from management’s report on internal control over financial reporting as of 31 December 2024. The Acquisitions, collectively, represented approximately 7% of Woodside’s consolidated
total assets as of 31 December 2024 and approximately 0% of
Woodside’s consolidated total revenues as of 31 December 2024.
Because of its inherent limitations, internal control over ?nancial reporting may not prevent or detect misstatements and, even when determined to be effective, can only provide reasonable assurance with respect to ?nancial statement preparation and presentation. Projections of any evaluation of effectiveness to future periods are subject to the risk that controls may become inadequate because of changes in conditions, or the degree of compliance with the policies or procedures may deteriorate.
Changes in internal control over financial reporting Effective 1 January 2024, we implemented an updated enterprise resource planning (ERP) system. As a result, we have evaluated
and made corresponding changes to our business processes and
information systems, updating applicable internal controls over financial reporting as necessary.
There were no other changes in our internal control over ?nancial reporting during FY2024 that materially affected or were reasonably likely to materially affect our internal control over ?nancial
reporting.
Attestation report of the registered public accounting firm
The effectiveness of internal control over ?nancial reporting as of 31 December 2024 has been audited by PwC, an independent registered accounting ?rm that also audits Woodside’s Financial Statements. Their audit report on the internal control over ?nancial reporting is included in the Form 20-F.
DIFFERENCES FROM NYSE CORPORATE GOVERNANCE REQUIREMENTS
Woodside’s American Depository Shares are listed on the New York
Stock Exchange (NYSE) and, accordingly, Woodside is subject to the listing standards of the NYSE (NYSE Listing Rules). The NYSE Listing Rules include certain accommodations in the corporate governance requirements that allow foreign private issuers, such as Woodside, to follow ‘home country’ corporate governance practices in lieu of the otherwise applicable corporate governance standards of the NYSE. Woodside has elected to comply with certain home country rules instead of the applicable NYSE requirements, as more fully described below.
Woodside may in the future decide to use other foreign private issuer exemptions with respect to other NYSE Listing Rules. Following Woodside’s home country governance practices, as opposed to the requirements that would otherwise apply to a company listed on the NYSE, may provide less protection than is accorded to investors under the NYSE Listing Rules applicable to
US domestic issuers. If, at any time, Woodside ceases to be a foreign private issuer, it would be subject to the SEC and NYSE Listing
Rules applicable to US domestic companies.
Quorum
The NYSE Listing Rules generally require that a listed company’s by-laws provide for a quorum for any meeting of the holders of such company’s voting shares that is suf?ciently high to ensure
a representative vote. Pursuant to the NYSE Listing Rules, Woodside, as a foreign private issuer, has elected to comply with practices that are permitted under Australian securities laws in lieu of the provisions of the NYSE Listing Rules. The Woodside Energy Group Ltd Constitution provides that a quorum for a meeting of Woodside shareholders is three eligible Woodside shareholders entitled to vote.
Audit committee requirements
Under section 303A.06 of the NYSE Listing Rules and the requirements of Rule 10A-3 under the Exchange Act (Rule 10A- 3),
a US listed company is required to have an audit committee of such company’s board of Directors consisting entirely of independent members that comply with the requirements of Rule 10A-3. In addition, the audit committee must have a written charter which
is compliant with the requirements of Section 303A.07(b) of the NYSE Listing Rules, the listed company must have an internal audit function and the listed company must ful?ll all other requirements of the NYSE Listing Rules and Rule 10A-3. Foreign
private issuers must comply with the audit committee standard set forth in Rule 10A-3, subject to limited exemptions, but may elect
to follow ‘home country’ practices in lieu of the additional audit committee requirements in the NYSE Listing Rules. Rule 10A-3 requires NYSE-listed companies to ensure their audit committees are directly responsible for the appointment, compensation, retention and oversight of the work of the external auditor unless Woodside’s governing law or documents or other home country legal requirements require or permit shareholders to ultimately vote on or approve these matters. While Woodside’s Audit & Risk Committee is directly responsible for remuneration and oversight of the external auditor, ultimate responsibility for the appointment of the external auditor rests with Woodside shareholders, in
accordance with Australian law and the Woodside Energy Group Ltd
Constitution. However, in accordance with the limited exemptions set forth in Rule 10A-3, the Audit & Risk Committee is responsible for the annual auditor engagement and if there is any proposal
to change auditors, the Committee does make recommendations to the Woodside Board on any change of auditor, which are then considered by Woodside shareholders at the annual meeting of Woodside shareholders.
Further information on Audit and Risk Committee requirements under the ASX Recommendations is contained in section 4.1.3 – Board committees – Audit & Risk Committee.”
Code of Ethics
The Woodside Board has adopted the Code of Conduct, which applies to the Woodside Board and Woodside’s CEO and CFO, along with all other Woodside employees.
Further information on the Code of Conduct is contained in section
4.1.5 – Promoting responsible and ethical behaviour.

4.1.9 Shareholders
Shareholder communications Our website provides up-to-date information about Woodside, our corporate governance and policies, the Board and management, ASX announcements, SEC reports, the share price, dividend distributions and other relevant information.
Shareholders are encouraged to receive electronic communications from Woodside and can elect to receive email noti?cation when key materials are posted to our website. Shareholders can also receive an email noti?cation of Woodside’s announcements and media releases.
Shareholders can communicate directly with Woodside by submitting questions or comments on the ‘Contact’ section of our website. The ‘Investors’ section of our website also sets out the contact details for Woodside’s share registry, Computershare.
Investor relations program Woodside has an investor relations program to facilitate effective two-way communication with investors.
Our Continuous Disclosure and Market Communications Policy facilitates this by requiring:
the full and timely disclosure of information about Woodside’s material activities to the ASX
and NYSE, and our website (where they are retained for at least three years)
that all disclosures, including notices of meetings and other shareholder communications, are drafted clearly and concisely
the conduct of brie?ngs for investors from time to time (such as the annual and half-year results, and investor brie?ng days).
Major investor brie?ngs are webcast and presentation material for brie?ngs or speeches containing new and substantive information is ?rst disclosed to the market and other relevant exchanges and posted to our website.
Shareholder meetings Woodside recognises the importance of shareholder participation in general meetings and facilitates and encourages that participation. Woodside has direct voting arrangements in
place, allowing shareholders unable to attend the AGM to vote on resolutions without having to appoint someone else as a proxy. Voting on any substantial resolution at an AGM is conducted by poll.
Continuous disclosure and market communications
Woodside’s Continuous Disclosure and Market Communications Policy and associated guidelines reinforce Woodside’s commitment to continuous disclosure and outline management’s accountabilities and the processes to be followed for ensuring compliance.
A Disclosure Committee manages compliance with market disclosure obligations and is responsible for implementing and overseeing reporting processes and controls and setting guidelines for the release of information. The Disclosure Committee is comprised of senior leaders. Employees considered to hold higher risk roles are required to participate in annual continuous disclosure training.
The Board and senior executives are provided with copies of all information disclosed pursuant to all applicable stock exchange rules promptly after their disclosure.
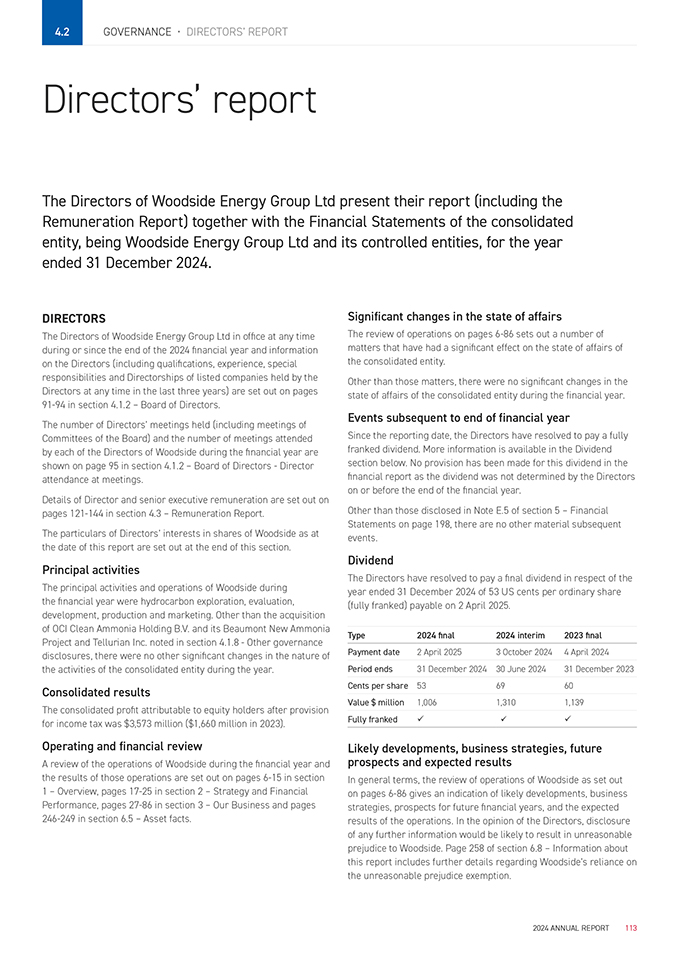
4.2
GOVERNANCE • DIRECTORS’ REPORT
Directors’ report
The Directors of Woodside Energy Group Ltd present their report (including the Remuneration Report) together with the Financial Statements of the consolidated entity, being Woodside Energy Group Ltd and its controlled entities, for the year ended 31 December 2024.
DIRECTORS
The Directors of Woodside Energy Group Ltd in of?ce at any time during or since the end of the 2024 ?nancial year and information on the Directors (including quali?cations, experience, special responsibilities and Directorships of listed companies held by the Directors at any time in the last three years) are set out on pages
91-94 in section 4.1.2 – Board of Directors.
The number of Directors’ meetings held (including meetings of Committees of the Board) and the number of meetings attended by each of the Directors of Woodside during the ?nancial year are shown on page 95 in section 4.1.2 – Board of Directors—Director attendance at meetings.
Details of Director and senior executive remuneration are set out on pages 121-144 in section 4.3 – Remuneration Report.
The particulars of Directors’ interests in shares of Woodside as at the date of this report are set out at the end of this section.
Principal activities
The principal activities and operations of Woodside during the ?nancial year were hydrocarbon exploration, evaluation, development, production and marketing. Other than the acquisition of OCI Clean Ammonia Holding B.V. and its Beaumont New Ammonia Project and Tellurian Inc. noted in section 4.1.8—Other governance disclosures, there were no other signi?cant changes in the nature of the activities of the consolidated entity during the year.
Consolidated results
The consolidated pro?t attributable to equity holders after provision for income tax was $3,573 million ($1,660 million in 2023).
Operating and financial review
A review of the operations of Woodside during the ?nancial year and the results of those operations are set out on pages 6-15 in section
1 – Overview, pages 17-25 in section 2 – Strategy and Financial
Performance, pages 27-86 in section 3 – Our Business and pages
246-249 in section 6.5 – Asset facts.
Significant changes in the state of affairs
The review of operations on pages 6-86 sets out a number of matters that have had a signi?cant effect on the state of affairs of the consolidated entity.
Other than those matters, there were no signi?cant changes in the state of affairs of the consolidated entity during the financial year.
Events subsequent to end of financial year
Since the reporting date, the Directors have resolved to pay a fully franked dividend. More information is available in the Dividend section below. No provision has been made for this dividend in the ?nancial report as the dividend was not determined by the Directors on or before the end of the ?nancial year.
Other than those disclosed in Note E.5 of section 5 – Financial Statements on page 198, there are no other material subsequent events.
Dividend
The Directors have resolved to pay a ?nal dividend in respect of the year ended 31 December 2024 of 53 US cents per ordinary share (fully franked) payable on 2 April 2025.
Type 2024 final 2024 interim 2023 final
Payment date 2 April 2025 3 October 2024 4 April 2024
Period ends 31 December 2024 30 June 2024 31 December 2023
Cents per share 53 69 60
Value $ million 1,006 1,310 1,139
Fully franked ? ? ? ?
Likely developments, business strategies, future prospects and expected results
In general terms, the review of operations of Woodside as set out on pages 6-86 gives an indication of likely developments, business strategies, prospects for future ?nancial years, and the expected results of the operations. In the opinion of the Directors, disclosure of any further information would be likely to result in unreasonable prejudice to Woodside. Page 258 of section 6.8 – Information about
this report includes further details regarding Woodside’s reliance on the unreasonable prejudice exemption.
Environmental compliance
Woodside is subject to a range of environmental legislation in Australia and other countries in which it operates, further details of which are set out in ‘Government Regulation’ in section
6.3—Additional disclosures. At Woodside, we are committed to conducting our operations in an environmentally responsible manner and maintaining compliance with all applicable environmental laws and regulations. Our goal is to minimise our impact on the environment and continually improve our environmental performance.
Through its Environment and Biodiversity Policy, Woodside commits to compliance with relevant environmental laws and regulations, permits and applying responsible standards where laws do not
exist. Woodside has established management systems to identify and mitigate environmental risks, implement pollution prevention measures and manage environmental compliance requirements for all activities.
For the financial year ending 31 December 2024, we recorded no fines or prosecutions relating to our environmental performance. Further information about Woodside’s environmental performance can be found in section 3.8.7—Environment and biodiversity
on page 68.
Research and development
Woodside is leveraging technology to drive cost ef?ciencies and exploring a range of technology options to support step change abatement. Woodside has a number of technology collaborations and pursues opportunities through technology across operations including for emissions reduction.
For further information on examples of the Group’s activities in the ?eld of research and development see section 3.7 – New energy opportunities on page 41.
Company Secretaries
The following individuals have acted as Company Secretary during
2024:
Damien Gare LLB, LLM, MBA, GAICD
Group Company Secretary
Mr Gare joined Woodside in 2007 and was appointed Group
Company Secretary effective 27 August 2024. Prior to this he served as Vice President & Chief of Staff from 2022. Mr Gare has held a number of senior positions at Woodside, including as Vice President Investor Relations and Vice President Risk & Compliance. Prior
to joining Woodside, Mr Gare was a Partner at Minter Ellison. He
is a fellow of the Governance Institute of Australia and a graduate member of the Australian Institute of Company Directors.
Lucy Bowman MA (Oxon), Jurisprudence
Deputy Company Secretary
Ms Bowman joined Woodside in 2021 as Senior Legal Counsel
and was appointed Joint Company Secretary effective 20 October
2022. Prior to joining Woodside, Ms Bowman worked as a banking and finance lawyer in private practice and held legal roles with companies in the financial and mining industries. Ms Bowman is
a fellow of the Governance Institute of Australia and a graduate member of the Australian Institute of Company Directors.
Warren Baillie LLB, BCom, Grad. Dip. CSP
Group Company Secretary
Mr Baillie joined Woodside in 2005 and was appointed Group Company Secretary effective 1 February 2012. Mr Baillie is a solicitor and chartered secretary. He is a former President of the Board of the Governance Institute of Australia. Mr Baillie ceased to be Group Company Secretary effective 27 August 2024.
Branches
Woodside, through various subsidiaries, has established branches in a number of countries.
Indemnification and insurance of Directors and officers Woodside Energy Group Ltd’s Constitution requires Woodside Energy Group Ltd to indemnify each Director, secretary, executive
of?cer or employee of Woodside Energy Group Ltd or its wholly
owned subsidiaries against liabilities (to the extent Woodside Energy Group Ltd is not precluded by law from doing so) incurred in or arising out of the conduct of the business of Woodside Energy Group Ltd or the discharge of the duties of any such person. Woodside Energy Group Ltd enters into deeds of indemnity with Directors, secretaries, certain senior executives and employees serving as of?cers on wholly owned or partly owned companies of
Woodside Energy Group Ltd on terms consistent with the indemnity provided under Woodside Energy Group Ltd’s Constitution.
From time to time, Woodside engages its external auditor, PwC,
to conduct non-statutory audit work and provide other services in accordance with Woodside’s External Auditor Guidance Policy. The terms of engagement include an indemnity in favour of PwC:
against all losses, claims, costs, expenses, actions, demands, damages, liabilities or any proceedings (liabilities) incurred by PwC in respect of third-party claims arising from a breach by Woodside under the engagement terms
for all liabilities PwC has to Woodside or any third party as a result of reliance on information provided by Woodside that is false, misleading or incomplete.
Woodside Energy Group Ltd has paid a premium under a contract insuring each Director, of?cer, secretary and employee who is concerned with the management of Woodside Energy Group Ltd or its subsidiaries against liability incurred in that capacity.
Disclosure of the nature of the liability covered by and the
amount of the premium payable for such insurance is subject to a con?dentiality clause under the contract of insurance. Woodside Energy Group Ltd has not provided any insurance for the external auditor of Woodside Energy Group Ltd or a body corporate related to the external auditor.
During the ?nancial year ended 31 December 2024 and as at the date of this Directors’ report, no indemnity in favour of a current or former Director, of?cer or external auditor of the Group has been called on.
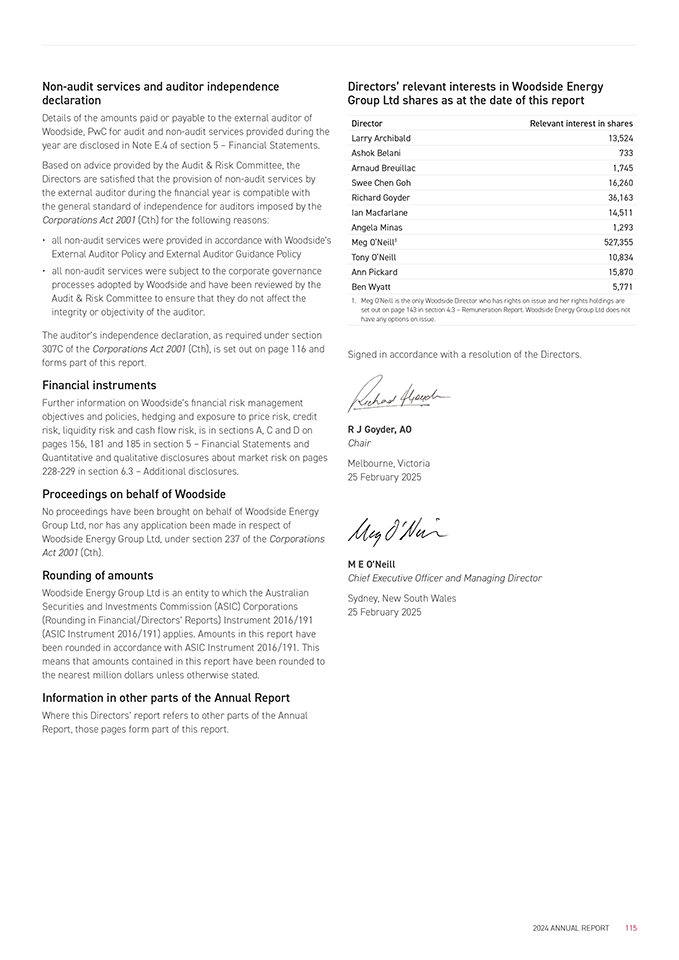
Non-audit services and auditor independence declaration
Details of the amounts paid or payable to the external auditor of Woodside, PwC for audit and non-audit services provided during the year are disclosed in Note E.4 of section 5 – Financial Statements.
Based on advice provided by the Audit & Risk Committee, the Directors are satis?ed that the provision of non-audit services by the external auditor during the ?nancial year is compatible with the general standard of independence for auditors imposed by the Corporations Act 2001 (Cth) for the following reasons:
all non-audit services were provided in accordance with Woodside’s
External Auditor Policy and External Auditor Guidance Policy
all non-audit services were subject to the corporate governance processes adopted by Woodside and have been reviewed by the Audit & Risk Committee to ensure that they do not affect the integrity or objectivity of the auditor.
The auditor’s independence declaration, as required under section
307C of the Corporations Act 2001 (Cth), is set out on page 116 and forms part of this report.
Financial instruments
Further information on Woodside’s ?nancial risk management objectives and policies, hedging and exposure to price risk, credit risk, liquidity risk and cash flow risk, is in sections A, C and D on pages 156, 181 and 185 in section 5 – Financial Statements and Quantitative and qualitative disclosures about market risk on pages
228-229 in section 6.3 – Additional disclosures.
Proceedings on behalf of Woodside
No proceedings have been brought on behalf of Woodside Energy Group Ltd, nor has any application been made in respect of Woodside Energy Group Ltd, under section 237 of the Corporations Act 2001 (Cth).
Rounding of amounts
Woodside Energy Group Ltd is an entity to which the Australian Securities and Investments Commission (ASIC) Corporations (Rounding in Financial/Directors’ Reports) Instrument 2016/191 (ASIC Instrument 2016/191) applies. Amounts in this report have been rounded in accordance with ASIC Instrument 2016/191. This means that amounts contained in this report have been rounded to the nearest million dollars unless otherwise stated.
Information in other parts of the Annual Report Where this Directors’ report refers to other parts of the Annual Report, those pages form part of this report.
Directors’ relevant interests in Woodside Energy
Group Ltd shares as at the date of this report
set out on page 143 in section 4.3 – Remuneration Report. Woodside Energy Group Ltd does not have any options on issue.
Signed in accordance with a resolution of the Directors.
R J Goyder, AO
Chair
Melbourne, Victoria
25 February 2025
M E O’Neill
Chief Executive Officer and Managing Director
Sydney, New South Wales
25 February 2025
Auditor independence declaration to the Directors of Woodside Energy Group Ltd
Auditor’s Independence Declaration
As lead auditor for the audit of Woodside Energy Group Ltd for the year ended 31 December 2024, I
declare that to the best of my knowledge and belief, there have been:
(a) no contraventions of the auditor independence requirements of the Corporations Act 2001 in relation to the audit; and
(b) no contraventions of any applicable code of professional conduct in relation to the audit.
This declaration is in respect of Woodside Energy Group Ltd and the entities it controlled during the period.
N M Henry Perth
Partner
PricewaterhouseCoopers
25 February 2025
PricewaterhouseCoopers, ABN 52 780 433 757
Brookfield Place, Level 15, 125 St Georges Terrace, PERTH WA 6000, GPO Box D198, PERTH WA 6840
T: +61 8 9238 3000, F: +61 8 9238 3999, www.pwc.com.au
Liability limited by a scheme approved under Professional Standards Legislation.

REMUNER A TION
Woodside’s remuneration outcomes reflect our strong performance and align with shareholder returns.
4.3
GOVERNANCE • REMUNERATION REPORT
Remuneration
Report
C ONTENTS
4.3.1 Committee Chair’s letter 119
4.3.2 Remuneration Report (audited) 121
KMP and summary of Woodside’s five-year performance 121
Executive KMP 122
Remuneration Policy 122
Executive Incentive Scheme 122
Executive KMP remuneration structure 124
Other equity plans 126
Minimum Shareholding Requirements (MSR) Policy 126
Remuneration changes and benchmarking 127
Corporate Scorecard measures and outcomes for 2024 128
Executive KMP KPIs and outcomes for 2024 129
Contracts for Executive KMP 136
Non-Executive Directors (NEDs) 137
Remuneration Policy 137
MSR Policy 137
NEDs remuneration structure 137
Human Resources & Compensation Committee 138
Loans and transactions 138
Use of remuneration consultants 138
Reporting notes 138
Reporting in United States dollars 138
Statutory tables 139
4.3.3 Glossary 144
4.3.1 COMMITTEE CHAIR’S LETTER
25 February 2025
Dear Shareholders
On behalf of the Board, I am pleased to present the Remuneration
Report for the year ended 31 December 2024.
Business performance
I am pleased to report that in 2024, Woodside performed well across the key metrics that underpin company performance.
Woodside’s 2024 Corporate Scorecard was based on five individually weighted measures comprised of financial, base business, growth, safety and climate. Safety and climate were elevated to standalone measures to reflect an increased focus on leadership contribution to Woodside’s safety performance and delivery against climate plans.
In 2024 we delivered an annual net profit after tax (NPAT) of
$3.6 billion and underlying NPAT of $2.9 billion. We returned a full- year dividend to shareholders of 122 US cents per share, at the top end of our payout range. Operating Expenditure was better than target at US$2,183 million, while earnings before interest, taxes, depreciation and amortisation (EBITDA) excluding impairment was US$9,276 million, below target due to lower realised prices.
Woodside’s global portfolio delivered record production in 2024 of 193.9 MMboe, above target and at the top end of our guidance range. This was driven by outstanding production performance at Sangomar and strong LNG reliability at our operated assets.
We made excellent progress on key growth projects, with the Scarborough and Pluto Train 2 Project advancing to 78% completion and on target for first LNG cargo in 2026.1 The Trion Project reached
20% completion and is targeting first oil in 2028.
Woodside also took transformative decisions during 2024 to underpin our next wave of growth and value. We completed the acquisition of Louisiana LNG, which leverages Woodside’s proven capabilities and positions us as a leading LNG company with exposure to the Pacific and Atlantic basins. We completed equity sell-downs in Scarborough to JERA and LNG Japan, and agreed an Australian asset swap with Chevron. We also acquired the
Beaumont New Ammonia Project, positioning Woodside as an early mover in a growing global market for lower-carbon ammonia.
Safety of our people is our priority. Personal and process safety targets were met, with process safety critical role conformance marginally below target. In October 2024, the tragic death of an employee of one of OCI’s construction contractors occurred at the project site in Texas.
Arnaud Breuillac
Chair of Human Resources
& Compensation
Committee
While this fatality is not included in the 2024 Corporate Scorecard assessment based on the applicable Health, Safety and Environment mode of contracting, it reminds us that safety must come before everything else we do.
We continued to deliver on our emissions targets in 2024. High reliability and lower flaring across our assets resulted in gross equity Scope 1 and 2 emissions of 6.784 Mt CO2-e, 8% better than
the target level of performance set under the 2024 Corporate
Scorecard. The purchase of Beaumont New Ammonia represents a step-change towards delivery of our new energy and lower- carbon investment and abatement targets. Since the purchase
in the second half of 2024, exciting progress has been made with construction of Train 1 underway.
Overall, Woodside’s performance across the five Corporate Scorecard measures resulted in a performance outcome of 6.1 (out of a maximum of 10). No discretion has been applied to the outcome.
The 2025 Corporate Scorecard has been approved by the Board and reflects Woodside’s balanced approach to setting measures aligned with our strategy to thrive through the energy transition.
2024 Executive Incentive Scheme (EIS) outcomes
Each Executive’s award under the EIS is based on their individual performance and the company’s performance through the Corporate Scorecard. The individual performance of the CEO and each Senior Executive was assessed against five individually weighted measures of growth agenda, effective execution, enterprise capability, culture and reputation, and shareholder focus, with individual KPIs set relevant to each Executive’s area
of responsibility.
At the end of the year, the Board reviewed the CEO’s performance, which together with the Corporate Scorecard outcome, resulted
in an EIS award of 122.7% of the target opportunity (81.8% of the maximum opportunity). Senior Executive EIS awards ranged from
122.6% to 127.1% of target opportunity (76.7% to 79.5% of maximum opportunity). The Board has approved the 2024 EIS outcomes
and believes they appropriately align with overall corporate performance and shareholder experience.
1. The completion % excludes the Pluto Train 1 modifications project.
2018 Performance Rights Relative Total Shareholder Return
(RTSR) outcome
The five-year performance period for the Performance Rights awarded in respect of the 2018 EIS ended on 19 February 2024. Performance Rights comprised 30% of the 2018 award and were subject to a RTSR hurdle tested over a 5-year period. One-third of the Performance Rights were tested against a comparator group comprised of entities within the ASX 50 index as of 1 December
2018, while the remaining two-thirds were tested against an international group of oil and gas companies. Woodside’s RTSR percentile position was below the 50th percentile within each comparator group. Consequently, all Performance Rights awarded to the CEO and other eligible Senior Executives lapsed.
The Board believes this component of the EIS award continues to align EIS outcomes with shareholder experience, while being the best measure of long-term value creation across the commodity price cycle of our industry.
Executive KMP changes
In June 2024 Woodside announced a revised leadership structure, aggregating core business activities into a simplified operating model and continuing to build a team with strong capabilities, experience and diverse perspectives.
As a result, effective 1 August 2024 Mr Graham Tiver continued
as Woodside’s Executive Vice President (EVP) and Chief Financial Officer. Ms Liz Westcott continued as an Executive KMP and was appointed to the role of EVP and Chief Operating Officer Australia, with responsibility for all project execution and operational activities in the Australian region.
Mr Daniel Kalms was appointed to the role of EVP and Chief Operating Officer International and Mr Mark Abbotsford was appointed to the role of EVP and Chief Commercial Officer. Ms Shiva McMahon ceased being an Executive KMP on 31 July 2024. Details
of the remuneration and key contract terms for each Executive KMP
are set out in this report.
Executive remuneration outcomes
The Board annually reviews remuneration for the CEO and Senior Executives. In 2024, remuneration was assessed based on accountability, experience and individual performance and
considered Woodside’s growing global footprint and broader range of business activities. External benchmarking conducted against ASX 20 companies, selected peers in the Australian materials and energy sector, and international oil and gas companies, informed each review.
Following the review of CEO remuneration in December 2024, the Board set Ms Meg O’Neill’s Fixed Annual Reward (FAR) at A$2,600,000, effective 1 January 2025, representing a 5.2% increase. This adjustment maintains a balance between FAR and Total Target Reward (TTR) to ensure competitive remuneration both domestically and internationally.
Senior Executive remuneration was reviewed in February 2024 with the Board approving a 3% increase for Mr Tiver and Ms Westcott, effective 1 April 2024. A subsequent review, following the 1 August changes to the leadership structure, considered the broadened accountabilities of each position and external benchmarking. This review informed the FAR on appointment for Mr Kalms and Mr Abbotsford. Ms Westcott’s FAR was increased by 3% reflecting the broadened responsibility of the role.
Chair and Non-Executive Directors
Woodside continued to refresh its Board membership during 2024. Mr Frank Cooper and Mr Gene Tilbrook retired from the Board, having given exceptional service and contributing to Woodside’s success. We were pleased to welcome Mr Ashok Belani and Mr Tony O’Neill as Non-Executive Directors and appoint Mr Ben Wyatt as Chair of the Audit & Risk Committee. These appointments continue to bring new experience and expertise in areas including decarbonisation and sustainability.
Fees for the Chair and Non-Executive Directors were reviewed in December 2024. As a result, the Board approved an increase to annual Board and Committee fees ranging between 2% and 3% effective 1January 2025. Additionally, an increase to international travel allowances was approved and the Sustainability Committee Chair and member fee was adjusted to recognise the increased workload and to align with the Human Resources & Compensation Committee fees. These increases ensure NEDs fees remain competitive in the market and consider the broader range of business responsibilities and work requirements.
Conclusion
The Committee continues to review Woodside’s remuneration policies and practices globally to ensure these remain competitive and meet changing regulatory requirements. We believe the remuneration outcomes of our Executive KMP, detailed in this report, reflect Woodside’s strong performance
and align with shareholder returns while maintaining Woodside’s ability to attract and retain talented executive capability in a globally competitive market.
In the fourth quarter of 2024, I met with Woodside shareholders, who collectively represented nearly 30% of issued share capital, to discuss Woodside’s remuneration policies. There was broad support for Woodside’s remuneration structure given its weighting towards equity and long-term value and elevation of Safety and Climate into individual segments in the Corporate Scorecard.
We will continue to engage with you as we focus on Woodside’s long-term success and enduring value for our shareholders.
Arnaud Breuillac
Chair of Human Resources & Compensation Committee
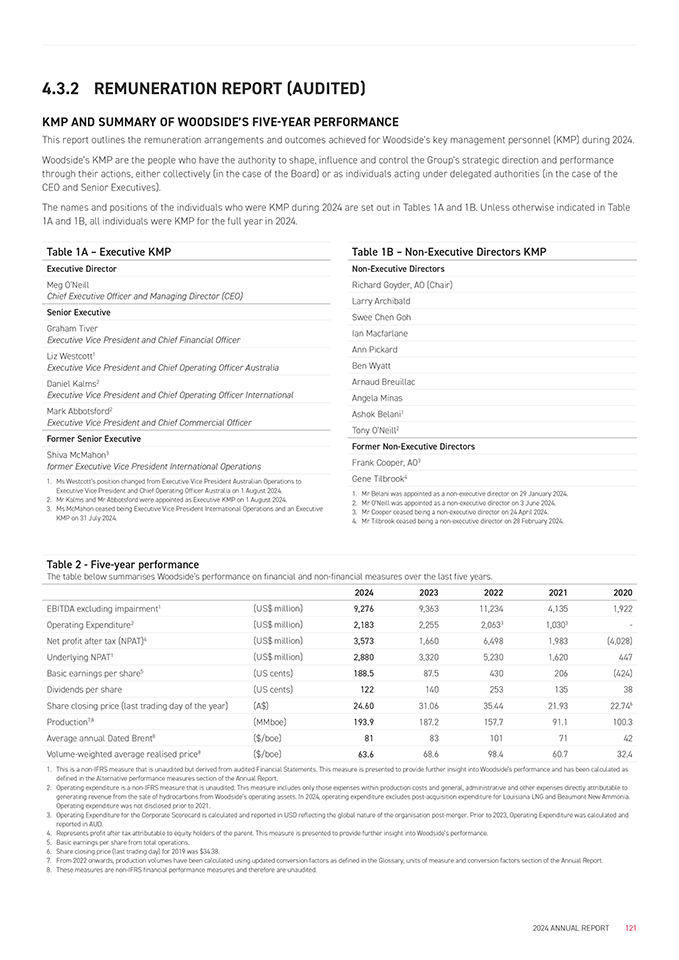
4.3.2 REMUNERATION REPORT (AUDITED)
KMP AND SUMMARY OF WOODSIDE’S FIVE-YEAR PERFORMANCE
This report outlines the remuneration arrangements and outcomes achieved for Woodside’s key management personnel (KMP) during 2024.
Woodside’s KMP are the people who have the authority to shape, influence and control the Group’s strategic direction and performance through their actions, either collectively (in the case of the Board) or as individuals acting under delegated authorities (in the case of the CEO and Senior Executives).
The names and positions of the individuals who were KMP during 2024 are set out in Tables 1A and 1B. Unless otherwise indicated in Table
1A and 1B, all individuals were KMP for the full year in 2024.
Table 1A – Executive KMP
Executive Director
Meg O’Neill
Chief Executive Officer and Managing Director (CEO)
Senior Executive
Graham Tiver
Executive Vice President and Chief Financial Officer
Liz Westcott1
Executive Vice President and Chief Operating Officer Australia
Daniel Kalms2
Executive Vice President and Chief Operating Officer International
Mark Abbotsford2
Executive Vice President and Chief Commercial Officer
Former Senior Executive
Shiva McMahon3
former Executive Vice President International Operations
1. Ms Westcott’s position changed from Executive Vice President Australian Operations to
Executive Vice President and Chief Operating Officer Australia on 1 August 2024.
2. Mr Kalms and Mr Abbotsford were appointed as Executive KMP on 1 August 2024.
3. Ms McMahon ceased being Executive Vice President International Operations and an Executive
KMP on 31 July 2024.
Table 1B – Non-Executive Directors KMP
Non-Executive Directors Richard Goyder, AO (Chair) Larry Archibald
Swee Chen Goh Ian Macfarlane Ann Pickard
Ben Wyatt Arnaud Breuillac Angela Minas Ashok Belani1
Tony O’Neill2
Former Non-Executive Directors
Frank Cooper, AO3
Gene Tilbrook4
1. Mr Belani was appointed as a non-executive director on 29 January 2024.
2. Mr O’Neill was appointed as a non-executive director on 3 June 2024.
3. Mr Cooper ceased being a non-executive director on 24 April 2024.
4. Mr Tilbrook ceased being a non-executive director on 28 February 2024.
Table 2—Five-year performance
The table below summarises Woodside’s performance on financial and non-financial measures over the last five years.
2024 2023 2022 2021 2020
EBITDA excluding impairment1(US$ million) 9,276 9,363 11,234 4,135 1,922
Operating Expenditure2(US$ million) 2,183 2,255 2,0633 1,0303 -
Net profit after tax (NPAT)4(US$ million) 3,573 1,660 6,498 1,983(4,028)
Underlying NPAT1(US$ million) 2,880 3,320 5,230 1,620 447
Basic earnings per share5(US cents) 188.5 87.5 430 206(424)
Dividends per share(US cents) 122 140 253 135 38
Share closing price (last trading day of the year)(A$) 24.60 31.06 35.44 21.93 22.746
Production7,8(MMboe) 193.9 187.2 157.7 91.1 100.3
Average annual Dated Brent8($/boe) 81 83 101 71 42
Volume-weighted average realised price8($/boe) 63.6 68.6 98.4 60.7 32.4
1. This is a non-IFRS measure that is unaudited but derived from audited Financial Statements. This measure is presented to provide further insight into Woodside’s performance and has been calculated as defined in the Alternative performance measures section of the Annual Report.
2. Operating expenditure is a non-IFRS measure that is unaudited. This measure includes only those expenses within production costs and general, administrative and other expenses directly attributable to generating revenue from the sale of hydrocarbons from Woodside’s operating assets. In 2024, operating expenditure excludes post-acquisition expenditure for Louisiana LNG and Beaumont New Ammonia. Operating expenditure was not disclosed prior to 2021.
3. Operating Expenditure for the Corporate Scorecard is calculated and reported in USD reflecting the global nature of the organisation post-merger. Prior to 2023, Operating Expenditure was calculated and reported in AUD.
4. Represents profit after tax attributable to equity holders of the parent. This measure is presented to provide further insight into Woodside’s performance.
5. Basic earnings per share from total operations.
6. Share closing price (last trading day) for 2019 was $34.38.
7. From 2022 onwards, production volumes have been calculated using updated conversion factors as defined in the Glossary, units of measure and conversion factors section of the Annual Report.
8. These measures are non-IFRS financial performance measures and therefore are unaudited.
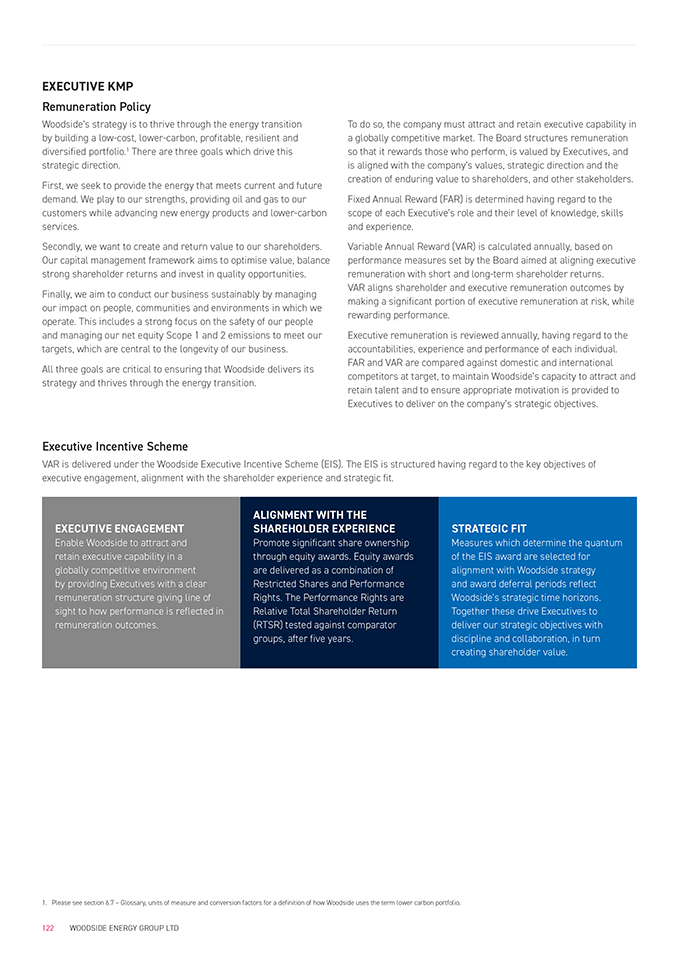
EXECUTIVE KMP
Remuneration Policy
Woodside’s strategy is to thrive through the energy transition by building a low-cost, lower-carbon, profitable, resilient and diversified portfolio.1 There are three goals which drive this strategic direction.
First, we seek to provide the energy that meets current and future demand. We play to our strengths, providing oil and gas to our customers while advancing new energy products and lower-carbon services.
Secondly, we want to create and return value to our shareholders. Our capital management framework aims to optimise value, balance strong shareholder returns and invest in quality opportunities.
Finally, we aim to conduct our business sustainably by managing our impact on people, communities and environments in which we operate. This includes a strong focus on the safety of our people and managing our net equity Scope 1 and 2 emissions to meet our targets, which are central to the longevity of our business.
All three goals are critical to ensuring that Woodside delivers its strategy and thrives through the energy transition.
To do so, the company must attract and retain executive capability in a globally competitive market. The Board structures remuneration
so that it rewards those who perform, is valued by Executives, and is aligned with the company’s values, strategic direction and the creation of enduring value to shareholders, and other stakeholders.
Fixed Annual Reward (FAR) is determined having regard to the scope of each Executive’s role and their level of knowledge, skills and experience.
Variable Annual Reward (VAR) is calculated annually, based on performance measures set by the Board aimed at aligning executive remuneration with short and long-term shareholder returns.
VAR aligns shareholder and executive remuneration outcomes by making a significant portion of executive remuneration at risk, while rewarding performance.
Executive remuneration is reviewed annually, having regard to the accountabilities, experience and performance of each individual. FAR and VAR are compared against domestic and international
competitors at target, to maintain Woodside’s capacity to attract and retain talent and to ensure appropriate motivation is provided to
Executives to deliver on the company’s strategic objectives.
Executive Incentive Scheme
VAR is delivered under the Woodside Executive Incentive Scheme (EIS). The EIS is structured having regard to the key objectives of executive engagement, alignment with the shareholder experience and strategic fit.
EXECUTIVE ENGAGEMENT Enable Woodside to attract and retain executive capability in a globally competitive environment
by providing Executives with a clear remuneration structure giving line of sight to how performance is reflected in remuneration outcomes.
ALIGNMENT WITH THE SHAREHOLDER EXPERIENCE Promote significant share ownership through equity awards. Equity awards are delivered as a combination of Restricted Shares and Performance Rights. The Performance Rights are Relative Total Shareholder Return (RTSR) tested against comparator groups, after five years.
STRATEGIC FIT
Measures which determine the quantum of the EIS award are selected for alignment with Woodside strategy
and award deferral periods reflect Woodside’s strategic time horizons. Together these drive Executives to deliver our strategic objectives with discipline and collaboration, in turn
creating shareholder value.
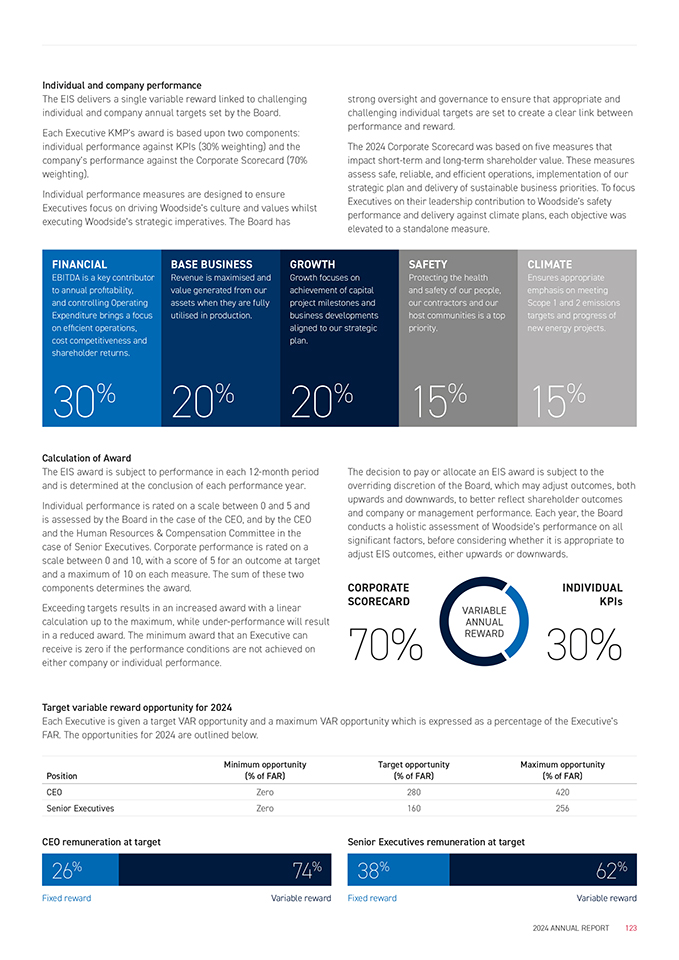
1. Please see section 6.7 – Glossary, units of measure and conversion factors for a definition of how Woodside uses the term lower carbon portfolio.
Individual and company performance
The EIS delivers a single variable reward linked to challenging individual and company annual targets set by the Board.
Each Executive KMP’s award is based upon two components: individual performance against KPIs (30% weighting) and the company’s performance against the Corporate Scorecard (70% weighting).
Individual performance measures are designed to ensure Executives focus on driving Woodside’s culture and values whilst executing Woodside’s strategic imperatives. The Board has
strong oversight and governance to ensure that appropriate and challenging individual targets are set to create a clear link between performance and reward.
The 2024 Corporate Scorecard was based on five measures that impact short-term and long-term shareholder value. These measures assess safe, reliable, and efficient operations, implementation of our strategic plan and delivery of sustainable business priorities. To focus Executives on their leadership contribution to Woodside’s safety performance and delivery against climate plans, each objective was elevated to a standalone measure.
FINANCIAL
EBITDA is a key contributor to annual pro?tability,
and controlling Operating Expenditure brings a focus on ef?cient operations,
cost competitiveness and shareholder returns.
30%
BASE BUSINESS Revenue is maximised and value generated from our assets when they are fully utilised in production.
20%
GROWTH Growth focuses on achievement of capital project milestones and business developments aligned to our strategic plan.
20%
SAFETY
Protecting the health
and safety of our people, our contractors and our host communities is a top priority.
15%
CLIMATE
Ensures appropriate emphasis on meeting Scope 1 and 2 emissions targets and progress of new energy projects.
15%
Calculation of Award
The EIS award is subject to performance in each 12-month period and is determined at the conclusion of each performance year.
Individual performance is rated on a scale between 0 and 5 and is assessed by the Board in the case of the CEO, and by the CEO and the Human Resources & Compensation Committee in the case of Senior Executives. Corporate performance is rated on a
scale between 0 and 10, with a score of 5 for an outcome at target
and a maximum of 10 on each measure. The sum of these two
The decision to pay or allocate an EIS award is subject to the overriding discretion of the Board, which may adjust outcomes, both upwards and downwards, to better reflect shareholder outcomes and company or management performance. Each year, the Board conducts a holistic assessment of Woodside’s performance on all significant factors, before considering whether it is appropriate to adjust EIS outcomes, either upwards or downwards.
components determines the award.
Exceeding targets results in an increased award with a linear calculation up to the maximum, while under-performance will result in a reduced award. The minimum award that an Executive can receive is zero if the performance conditions are not achieved on either company or individual performance.
CORPORATE SCORECARD
70%
VARIABLE ANNUAL REWARD
INDIVIDUAL KPIs
30%
Target variable reward opportunity for 2024
Each Executive is given a target VAR opportunity and a maximum VAR opportunity which is expressed as a percentage of the Executive’s
FAR. The opportunities for 2024 are outlined below.
Position
Minimum opportunity
(% of FAR)
Target opportunity
(% of FAR)
Maximum opportunity
(% of FAR)
CEO Zero 280 420
Senior Executives Zero 160 256
CEO remuneration at target
26% 74%
Senior Executives remuneration at target
38% 62%
Fixed reward Variable reward
Fixed reward Variable reward
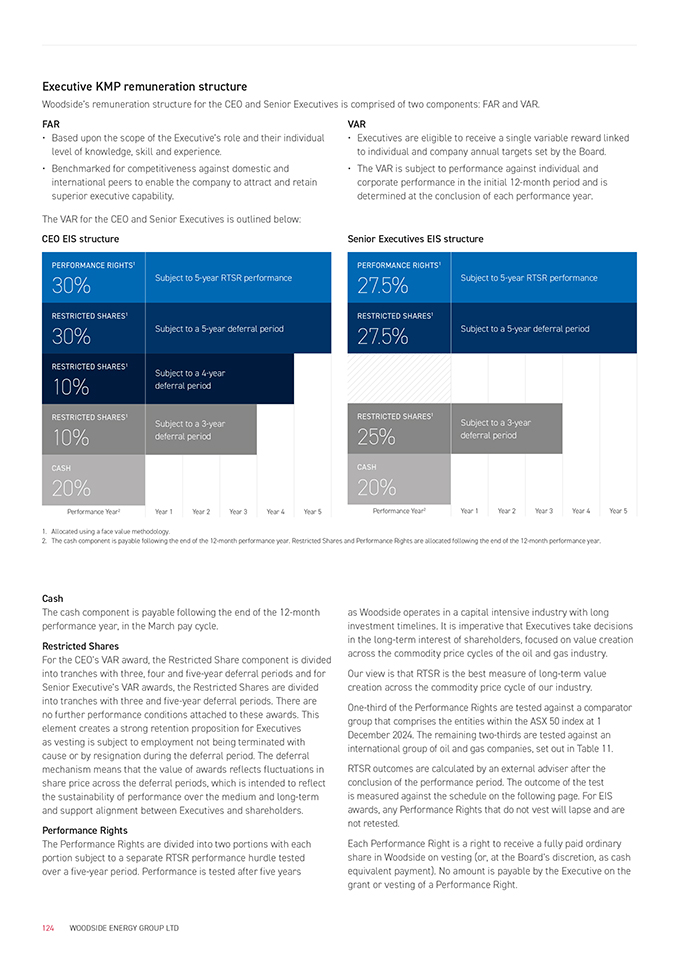
Executive KMP remuneration structure
Woodside’s remuneration structure for the CEO and Senior Executives is comprised of two components: FAR and VAR.
FAR
Based upon the scope of the Executive’s role and their individual level of knowledge, skill and experience.
Benchmarked for competitiveness against domestic and international peers to enable the company to attract and retain superior executive capability.
VAR
Executives are eligible to receive a single variable reward linked to individual and company annual targets set by the Board.
The VAR is subject to performance against individual and corporate performance in the initial 12-month period and is determined at the conclusion of each performance year.
The VAR for the CEO and Senior Executives is outlined below:
CEO EIS structure
PERFORMANCE RIGHTS1
30% Subject to 5-year RTSR performance
RESTRICTED SHARES1
30% Subject to a 5-year deferral period
Senior Executives EIS structure
PERFORMANCE RIGHTS1
27.5% Subject to 5-year RTSR performance
RESTRICTED SHARES1
27.5% Subject to a 5-year deferral period
RESTRICTED SHARES1
10%
Subject to a 4-year deferral period
RESTRICTED SHARES1
10%
Subject to a 3-year deferral period
RESTRICTED SHARES1
25%
Subject to a 3-year deferral period
CASH
20%
Performance Year2 Year 1 Year 2 Year 3 Year 4 Year 5
CASH
20%
Performance Year2 Year 1 Year 2 Year 3 Year 4 Year 5
1. Allocated using a face value methodology.
2. The cash component is payable following the end of the 12-month performance year. Restricted Shares and Performance Rights are allocated following the end of the 12-month performance year.
Cash
The cash component is payable following the end of the 12-month performance year, in the March pay cycle.
Restricted Shares
For the CEO’s VAR award, the Restricted Share component is divided into tranches with three, four and five-year deferral periods and for Senior Executive’s VAR awards, the Restricted Shares are divided into tranches with three and five-year deferral periods. There are
no further performance conditions attached to these awards. This element creates a strong retention proposition for Executives
as vesting is subject to employment not being terminated with cause or by resignation during the deferral period. The deferral mechanism means that the value of awards reflects fluctuations in share price across the deferral periods, which is intended to reflect the sustainability of performance over the medium and long-term and support alignment between Executives and shareholders.
Performance Rights
The Performance Rights are divided into two portions with each portion subject to a separate RTSR performance hurdle tested over a five-year period. Performance is tested after five years
as Woodside operates in a capital intensive industry with long investment timelines. It is imperative that Executives take decisions in the long-term interest of shareholders, focused on value creation across the commodity price cycles of the oil and gas industry.
Our view is that RTSR is the best measure of long-term value creation across the commodity price cycle of our industry.
One-third of the Performance Rights are tested against a comparator group that comprises the entities within the ASX 50 index at 1
December 2024. The remaining two-thirds are tested against an international group of oil and gas companies, set out in Table 11.
RTSR outcomes are calculated by an external adviser after the conclusion of the performance period. The outcome of the test
is measured against the schedule on the following page. For EIS awards, any Performance Rights that do not vest will lapse and are not retested.
Each Performance Right is a right to receive a fully paid ordinary share in Woodside on vesting (or, at the Board’s discretion, as cash equivalent payment). No amount is payable by the Executive on the grant or vesting of a Performance Right.
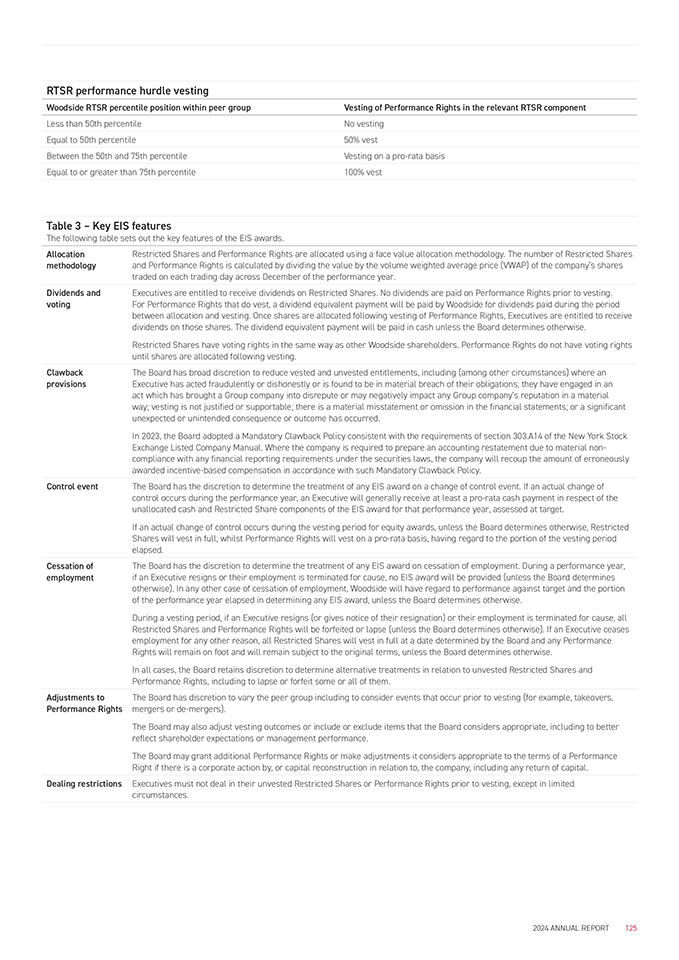
RTSR performance hurdle vesting
Woodside RTSR percentile position within peer group Vesting of Performance Rights in the relevant RTSR component
Less than 50th percentile No vesting
Equal to 50th percentile 50% vest
Between the 50th and 75th percentile Vesting on a pro-rata basis
Equal to or greater than 75th percentile 100% vest
Table 3 – Key EIS features
The following table sets out the key features of the EIS awards.
Allocation methodology
Dividends and voting
Clawback provisions
Restricted Shares and Performance Rights are allocated using a face value allocation methodology. The number of Restricted Shares and Performance Rights is calculated by dividing the value by the volume weighted average price (VWAP) of the company’s shares traded on each trading day across December of the performance year.
Executives are entitled to receive dividends on Restricted Shares. No dividends are paid on Performance Rights prior to vesting. For Performance Rights that do vest, a dividend equivalent payment will be paid by Woodside for dividends paid during the period between allocation and vesting. Once shares are allocated following vesting of Performance Rights, Executives are entitled to receive dividends on those shares. The dividend equivalent payment will be paid in cash unless the Board determines otherwise.
Restricted Shares have voting rights in the same way as other Woodside shareholders. Performance Rights do not have voting rights until shares are allocated following vesting.
The Board has broad discretion to reduce vested and unvested entitlements, including (among other circumstances) where an Executive has acted fraudulently or dishonestly or is found to be in material breach of their obligations; they have engaged in an act which has brought a Group company into disrepute or may negatively impact any Group company’s reputation in a material
way; vesting is not justified or supportable; there is a material misstatement or omission in the financial statements; or a significant unexpected or unintended consequence or outcome has occurred.
In 2023, the Board adopted a Mandatory Clawback Policy consistent with the requirements of section 303.A14 of the New York Stock Exchange Listed Company Manual. Where the company is required to prepare an accounting restatement due to material non- compliance with any financial reporting requirements under the securities laws, the company will recoup the amount of erroneously awarded incentive-based compensation in accordance with such Mandatory Clawback Policy.
Control event The Board has the discretion to determine the treatment of any EIS award on a change of control event. If an actual change of control occurs during the performance year, an Executive will generally receive at least a pro-rata cash payment in respect of the unallocated cash and Restricted Share components of the EIS award for that performance year, assessed at target.
If an actual change of control occurs during the vesting period for equity awards, unless the Board determines otherwise, Restricted Shares will vest in full, whilst Performance Rights will vest on a pro-rata basis, having regard to the portion of the vesting period elapsed.
Cessation of employment
Adjustments to
Performance Rights
The Board has the discretion to determine the treatment of any EIS award on cessation of employment. During a performance year, if an Executive resigns or their employment is terminated for cause, no EIS award will be provided (unless the Board determines otherwise). In any other case of cessation of employment, Woodside will have regard to performance against target and the portion of the performance year elapsed in determining any EIS award, unless the Board determines otherwise.
During a vesting period, if an Executive resigns (or gives notice of their resignation) or their employment is terminated for cause, all Restricted Shares and Performance Rights will be forfeited or lapse (unless the Board determines otherwise). If an Executive ceases employment for any other reason, all Restricted Shares will vest in full at a date determined by the Board and any Performance Rights will remain on foot and will remain subject to the original terms, unless the Board determines otherwise.
In all cases, the Board retains discretion to determine alternative treatments in relation to unvested Restricted Shares and
Performance Rights, including to lapse or forfeit some or all of them.
The Board has discretion to vary the peer group including to consider events that occur prior to vesting (for example, takeovers, mergers or de-mergers).
The Board may also adjust vesting outcomes or include or exclude items that the Board considers appropriate, including to better reflect shareholder expectations or management performance.
The Board may grant additional Performance Rights or make adjustments it considers appropriate to the terms of a Performance
Right if there is a corporate action by, or capital reconstruction in relation to, the company, including any return of capital.
Dealing restrictions Executives must not deal in their unvested Restricted Shares or Performance Rights prior to vesting, except in limited circumstances.
Other equity plans
Woodside has a history of providing employees with the opportunity to participate in ownership of shares in the company and using equity to support a competitive base remuneration position.
Details of prior year allocations are provided in Table 12. The terms applying to prior year grants are described in past Woodside Annual Reports.
Woodside Equity Plan (WEP)
The purpose of the WEP is to enable eligible employees to build up a holding of equity in Woodside as they progress through their career. The WEP is offered to permanent employees who do not participate in the EIS.
The number of Equity Rights (ERs) offered to each eligible employee is determined by the Board, and based on individual performance
as assessed under the performance review process. There are no further ongoing performance conditions.
The linking of performance to an allocation allows Woodside to recognise and reward eligible employees for high performance.
Each ER entitles the participant to receive a Woodside share on the vesting date. For offers prior to 2022, the terms of the Plan allowed for 75% vesting of the ERs three years after the effective grant date and the remaining 25% of ERs five years after the effective grant date. For subsequent awards, the Board amended the terms of the Plan to entitle the participant to receive a Woodside share on the vesting date three years after the effective grant date.
Subject to overarching Board discretion, ERs under the WEP may vest prior to the vesting date on a change of control or on a pro- rata basis if a participating employee ceases employment due to redundancy, genuine retirement, total and permanent disablement, medical illness, incapacity, death or any other reason the Board determines. Any unvested ERs held by an employee whose employment is terminated by resignation or for cause prior to the vesting date will lapse unless the Board determines otherwise.
The other key terms of WEP ERs are similar to the terms of the
Performance Rights granted under the EIS.
Supplementary Woodside Equity Plan (SWEP)
In October 2011, the Board approved the establishment of the SWEP to enable the offering of targeted retention awards of ERs for key capability.
The SWEP was updated in 2022 to broaden eligibility to all employees of a subsidiary of Woodside Energy Group Ltd and ensure compliance in all jurisdictions in which Woodside operates.
The SWEP awards have service conditions and no performance conditions. Each ER entitles the participant to receive a Woodside share on vesting.
Subject to an overarching Board discretion, ERs under SWEP may vest prior to the vesting date on a change of control or on a pro-rata basis if a participating employee ceases employment in the following circumstances: redundancy, death, medical illness or incapacity or total and permanent disablement. Any unvested ERs held by an employee whose employment is terminated by
resignation or for cause prior to the vesting date will lapse unless the Board determines otherwise.
There is no entitlement to dividends on ERs, and they do not carry voting rights.
Minimum Shareholding Requirements (MSR) Policy The Executive KMP MSR Policy reflects the long-term focus of management and aims to further strengthen alignment with
shareholders.
The MSR Policy requires Senior Executives to have acquired and maintained Woodside shares for a minimum total purchase price of at least 100% of their FAR after a period of five years, and in the case of the CEO a minimum of 200% of FAR after a period of five years.
All the Executive KMP except Ms Westcott meet the MSR requirements. Ms Westcott commenced employment with Woodside in 2023 and will continue to acquire Woodside shares to meet MSR requirements. See Table 14 for details.
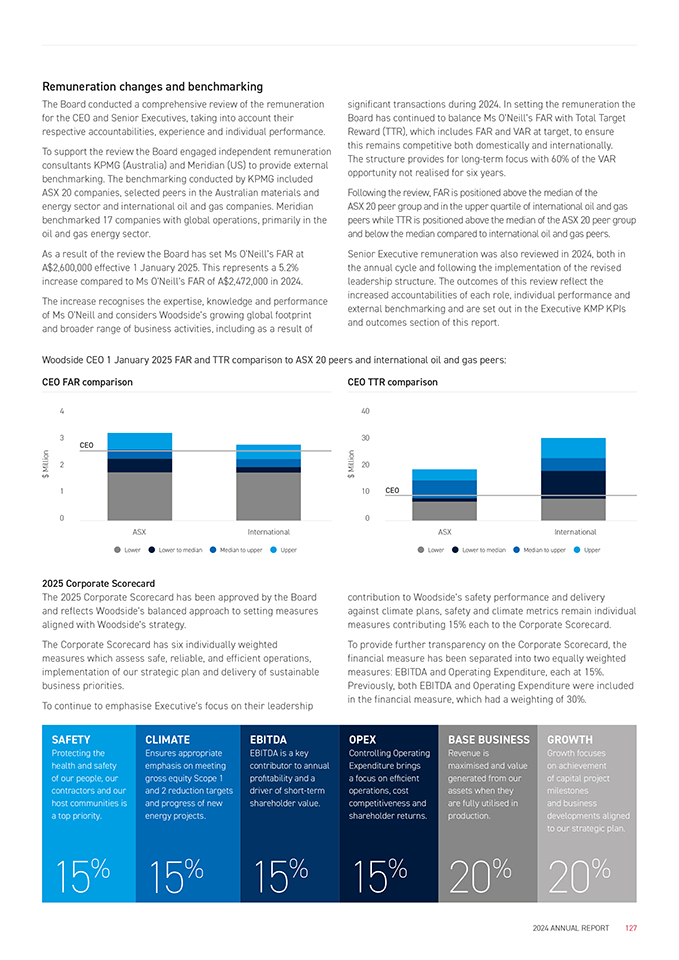
Remuneration changes and benchmarking
The Board conducted a comprehensive review of the remuneration for the CEO and Senior Executives, taking into account their respective accountabilities, experience and individual performance.
To support the review the Board engaged independent remuneration consultants KPMG (Australia) and Meridian (US) to provide external benchmarking. The benchmarking conducted by KPMG included
ASX 20 companies, selected peers in the Australian materials and energy sector and international oil and gas companies. Meridian benchmarked 17 companies with global operations, primarily in the oil and gas energy sector.
As a result of the review the Board has set Ms O’Neill’s FAR at A$2,600,000 effective 1 January 2025. This represents a 5.2% increase compared to Ms O’Neill’s FAR of A$2,472,000 in 2024.
The increase recognises the expertise, knowledge and performance of Ms O’Neill and considers Woodside’s growing global footprint
and broader range of business activities, including as a result of
significant transactions during 2024. In setting the remuneration the Board has continued to balance Ms O’Neill’s FAR with Total Target Reward (TTR), which includes FAR and VAR at target, to ensure
this remains competitive both domestically and internationally. The structure provides for long-term focus with 60% of the VAR opportunity not realised for six years.
Following the review, FAR is positioned above the median of the
ASX 20 peer group and in the upper quartile of international oil and gas peers while TTR is positioned above the median of the ASX 20 peer group and below the median compared to international oil and gas peers.
Senior Executive remuneration was also reviewed in 2024, both in the annual cycle and following the implementation of the revised leadership structure. The outcomes of this review reflect the increased accountabilities of each role, individual performance and external benchmarking and are set out in the Executive KMP KPIs and outcomes section of this report.
Woodside CEO 1 January 2025 FAR and TTR comparison to ASX 20 peers and international oil and gas peers:
CEO FAR comparison
CEO TTR comparison
4 40
3 30
CEO
2 20
1 10
0
ASX International
0
ASX International
Lower
Lower to median
Median to upper
Upper
Lower
Lower to median
Median to upper
Upper
2025 Corporate Scorecard
The 2025 Corporate Scorecard has been approved by the Board and reflects Woodside’s balanced approach to setting measures aligned with Woodside’s strategy.
The Corporate Scorecard has six individually weighted measures which assess safe, reliable, and efficient operations, implementation of our strategic plan and delivery of sustainable business priorities.
To continue to emphasise Executive’s focus on their leadership
contribution to Woodside’s safety performance and delivery
against climate plans, safety and climate metrics remain individual measures contributing 15% each to the Corporate Scorecard.
To provide further transparency on the Corporate Scorecard, the financial measure has been separated into two equally weighted measures: EBITDA and Operating Expenditure, each at 15%. Previously, both EBITDA and Operating Expenditure were included in the financial measure, which had a weighting of 30%.
SAFETY Protecting the health and safety of our people, our
contractors and our host communities is a top priority.
15%
CLIMATE
Ensures appropriate emphasis on meeting gross equity Scope 1 and 2 reduction targets and progress of new energy projects.
15%
EBITDA EBITDA is a key contributor to annual pro?tability and a driver of short-term shareholder value.
15%
OPEX
Controlling Operating
Expenditure brings a focus on ef?cient operations, cost competitiveness and shareholder returns.
15%
BASE BUSINESS
Revenue is maximised and value generated from our assets when they
are fully utilised in production.
20%
GROWTH Growth focuses on achievement of capital project milestones
and business developments aligned to our strategic plan.
20%
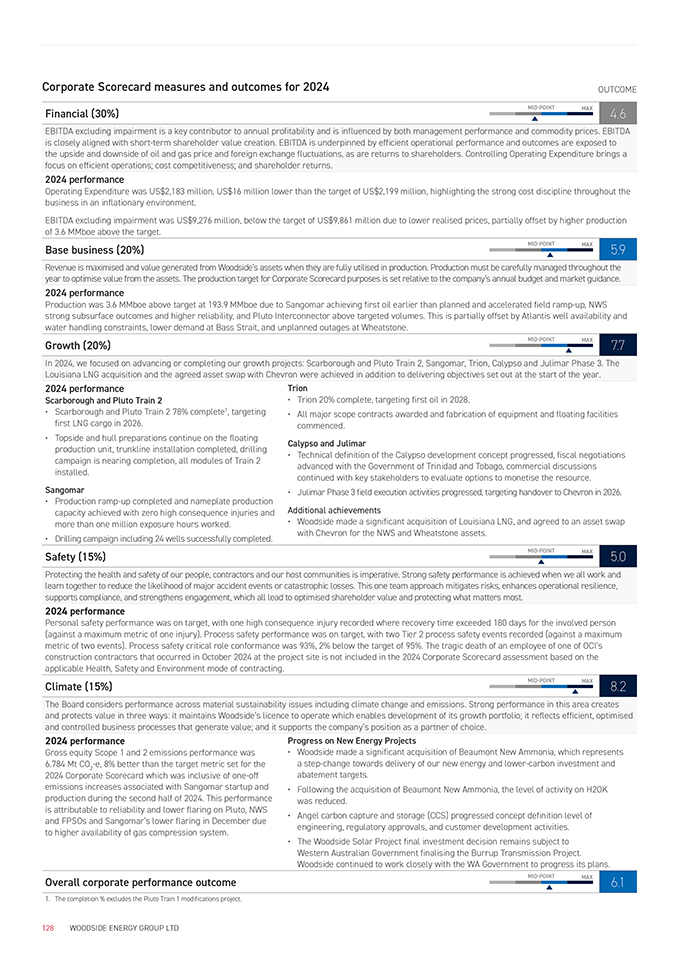
Corporate Scorecard measures and outcomes for 2024
OUTCOME
Financial (30%)
MID-POINT MAX
4.6
EBITDA excluding impairment is a key contributor to annual profitability and is influenced by both management performance and commodity prices. EBITDA
is closely aligned with short-term shareholder value creation. EBITDA is underpinned by efficient operational performance and outcomes are exposed to
the upside and downside of oil and gas price and foreign exchange fluctuations, as are returns to shareholders. Controlling Operating Expenditure brings a focus on efficient operations; cost competitiveness; and shareholder returns.
2024 performance
Operating Expenditure was US$2,183 million, US$16 million lower than the target of US$2,199 million, highlighting the strong cost discipline throughout the business in an inflationary environment.
EBITDA excluding impairment was US$9,276 million, below the target of US$9,861 million due to lower realised prices, partially offset by higher production of 3.6 MMboe above the target.
Base business (20%)
MID-POINT MAX
5.9
Revenue is maximised and value generated from Woodside’s assets when they are fully utilised in production. Production must be carefully managed throughout the year to optimise value from the assets. The production target for Corporate Scorecard purposes is set relative to the company’s annual budget and market guidance.
2024 performance
Production was 3.6 MMboe above target at 193.9 MMboe due to Sangomar achieving first oil earlier than planned and accelerated field ramp-up, NWS strong subsurface outcomes and higher reliability, and Pluto Interconnector above targeted volumes. This is partially offset by Atlantis well availability and water handling constraints, lower demand at Bass Strait, and unplanned outages at Wheatstone.
Growth (20%)
MID-POINT MAX
7.7
In 2024, we focused on advancing or completing our growth projects: Scarborough and Pluto Train 2, Sangomar, Trion, Calypso and Julimar Phase 3. The
Louisiana LNG acquisition and the agreed asset swap with Chevron were achieved in addition to delivering objectives set out at the start of the year.
2024 performance
Scarborough and Pluto Train 2
Scarborough and Pluto Train 2 78% complete1, targeting first LNG cargo in 2026.
Topside and hull preparations continue on the floating production unit, trunkline installation completed, drilling campaign is nearing completion, all modules of Train 2 installed.
Sangomar
Production ramp-up completed and nameplate production capacity achieved with zero high consequence injuries and more than one million exposure hours worked.
Drilling campaign including 24 wells successfully completed.
Trion
Trion 20% complete, targeting first oil in 2028.
All major scope contracts awarded and fabrication of equipment and floating facilities commenced.
Calypso and Julimar
Technical definition of the Calypso development concept progressed, fiscal negotiations advanced with the Government of Trinidad and Tobago, commercial discussions continued with key stakeholders to evaluate options to monetise the resource.
Julimar Phase 3 field execution activities progressed, targeting handover to Chevron in 2026.
Additional achievements
Woodside made a significant acquisition of Louisiana LNG, and agreed to an asset swap with Chevron for the NWS and Wheatstone assets.
Safety (15%)
MID-POINT MAX
5.0
Protecting the health and safety of our people, contractors and our host communities is imperative. Strong safety performance is achieved when we all work and learn together to reduce the likelihood of major accident events or catastrophic losses. This one team approach mitigates risks, enhances operational resilience, supports compliance, and strengthens engagement, which all lead to optimised shareholder value and protecting what matters most.
2024 performance
Personal safety performance was on target, with one high consequence injury recorded where recovery time exceeded 180 days for the involved person (against a maximum metric of one injury). Process safety performance was on target, with two Tier 2 process safety events recorded (against a maximum metric of two events). Process safety critical role conformance was 93%, 2% below the target of 95%. The tragic death of an employee of one of OCI’s construction contractors that occurred in October 2024 at the project site is not included in the 2024 Corporate Scorecard assessment based on the applicable Health, Safety and Environment mode of contracting.
Climate (15%)
MID-POINT MAX
8.2
The Board considers performance across material sustainability issues including climate change and emissions. Strong performance in this area creates
and protects value in three ways: it maintains Woodside’s licence to operate which enables development of its growth portfolio; it reflects efficient, optimised and controlled business processes that generate value; and it supports the company’s position as a partner of choice.
2024 performance
Gross equity Scope 1 and 2 emissions performance was
6.784 Mt CO2-e, 8% better than the target metric set for the
2024 Corporate Scorecard which was inclusive of one-off
emissions increases associated with Sangomar startup and production during the second half of 2024. This performance is attributable to reliability and lower flaring on Pluto, NWS and FPSOs and Sangomar’s lower flaring in December due
to higher availability of gas compression system.
Overall corporate performance outcome
1. The completion % excludes the Pluto Train 1 modifications project.
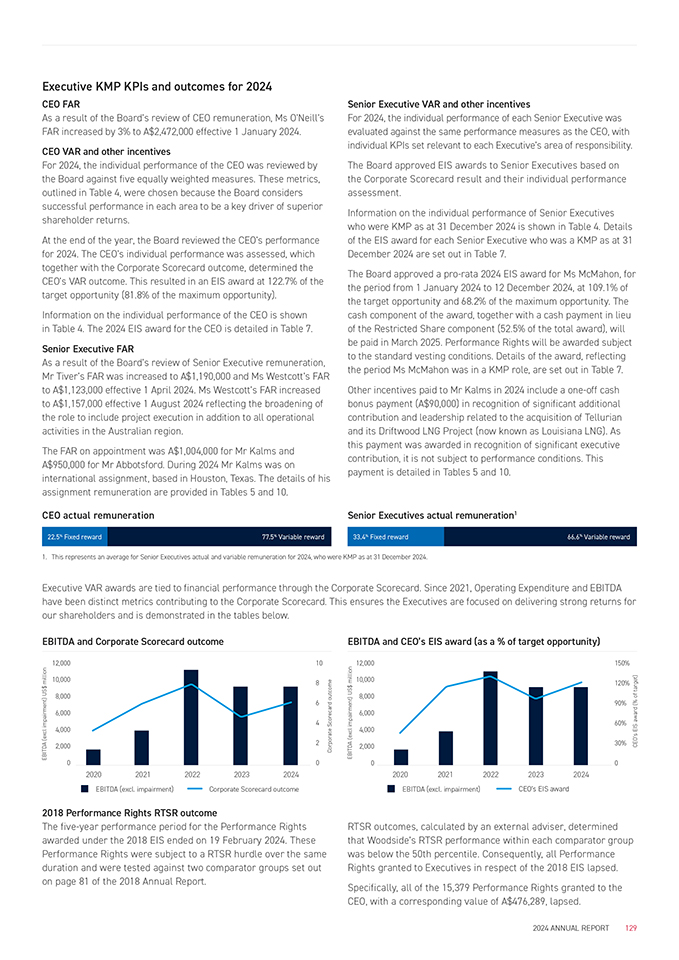
Progress on New Energy Projects
Woodside made a significant acquisition of Beaumont New Ammonia, which represents a step-change towards delivery of our new energy and lower-carbon investment and abatement targets.
Following the acquisition of Beaumont New Ammonia, the level of activity on H2OK
was reduced.
Angel carbon capture and storage (CCS) progressed concept definition level of engineering, regulatory approvals, and customer development activities.
The Woodside Solar Project final investment decision remains subject to Western Australian Government finalising the Burrup Transmission Project. Woodside continued to work closely with the WA Government to progress its plans.
MID-POINT MAX
Executive KMP KPIs and outcomes for 2024
CEO FAR
As a result of the Board’s review of CEO remuneration, Ms O’Neill’s
FAR increased by 3% to A$2,472,000 effective 1 January 2024.
CEO VAR and other incentives
For 2024, the individual performance of the CEO was reviewed by the Board against five equally weighted measures. These metrics, outlined in Table 4, were chosen because the Board considers successful performance in each area to be a key driver of superior shareholder returns.
At the end of the year, the Board reviewed the CEO’s performance for 2024. The CEO’s individual performance was assessed, which together with the Corporate Scorecard outcome, determined the CEO’s VAR outcome. This resulted in an EIS award at 122.7% of the target opportunity (81.8% of the maximum opportunity).
Information on the individual performance of the CEO is shown in Table 4. The 2024 EIS award for the CEO is detailed in Table 7.
Senior Executive FAR
As a result of the Board’s review of Senior Executive remuneration, Mr Tiver’s FAR was increased to A$1,190,000 and Ms Westcott’s FAR to A$1,123,000 effective 1 April 2024. Ms Westcott’s FAR increased
to A$1,157,000 effective 1 August 2024 reflecting the broadening of the role to include project execution in addition to all operational activities in the Australian region.
The FAR on appointment was A$1,004,000 for Mr Kalms and A$950,000 for Mr Abbotsford. During 2024 Mr Kalms was on international assignment, based in Houston, Texas. The details of his assignment remuneration are provided in Tables 5 and 10.
Senior Executive VAR and other incentives
For 2024, the individual performance of each Senior Executive was evaluated against the same performance measures as the CEO, with individual KPIs set relevant to each Executive’s area of responsibility.
The Board approved EIS awards to Senior Executives based on the Corporate Scorecard result and their individual performance assessment.
Information on the individual performance of Senior Executives
who were KMP as at 31 December 2024 is shown in Table 4. Details of the EIS award for each Senior Executive who was a KMP as at 31
December 2024 are set out in Table 7.
The Board approved a pro-rata 2024 EIS award for Ms McMahon, for the period from 1 January 2024 to 12 December 2024, at 109.1% of the target opportunity and 68.2% of the maximum opportunity. The cash component of the award, together with a cash payment in lieu of the Restricted Share component (52.5% of the total award), will
be paid in March 2025. Performance Rights will be awarded subject to the standard vesting conditions. Details of the award, reflecting the period Ms McMahon was in a KMP role, are set out in Table 7.
Other incentives paid to Mr Kalms in 2024 include a one-off cash bonus payment (A$90,000) in recognition of significant additional contribution and leadership related to the acquisition of Tellurian and its Driftwood LNG Project (now known as Louisiana LNG). As this payment was awarded in recognition of significant executive contribution, it is not subject to performance conditions. This payment is detailed in Tables 5 and 10.
CEO actual remuneration Senior Executives actual remuneration1
22.5% Fixed reward
77.5% Variable reward
33.4% Fixed reward
66.6% Variable reward
1. This represents an average for Senior Executives actual and variable remuneration for 2024, who were KMP as at 31 December 2024.
Executive VAR awards are tied to financial performance through the Corporate Scorecard. Since 2021, Operating Expenditure and EBITDA have been distinct metrics contributing to the Corporate Scorecard. This ensures the Executives are focused on delivering strong returns for our shareholders and is demonstrated in the tables below.
EBITDA and Corporate Scorecard outcome
EBITDA and CEO’s EIS award (as a % of target opportunity)
12,000
10,000
8,000
6,000
4,000
2,000
10 12,000
8 10,000
8,000
6
6,000
4
4,000
2 2,000
150%
120%
90%
60%
30%
0 0
2020 2021 2022 2023 2024
EBITDA (excl. impairment) Corporate Scorecard outcome
0 0
2020 2021 2022 2023 2024
EBITDA (excl. impairment) CEO’s EIS award
2018 Performance Rights RTSR outcome
The five-year performance period for the Performance Rights awarded under the 2018 EIS ended on 19 February 2024. These Performance Rights were subject to a RTSR hurdle over the same duration and were tested against two comparator groups set out on page 81 of the 2018 Annual Report.
RTSR outcomes, calculated by an external adviser, determined
that Woodside’s RTSR performance within each comparator group was below the 50th percentile. Consequently, all Performance Rights granted to Executives in respect of the 2018 EIS lapsed.
Specifically, all of the 15,379 Performance Rights granted to the
CEO, with a corresponding value of A$476,289, lapsed.
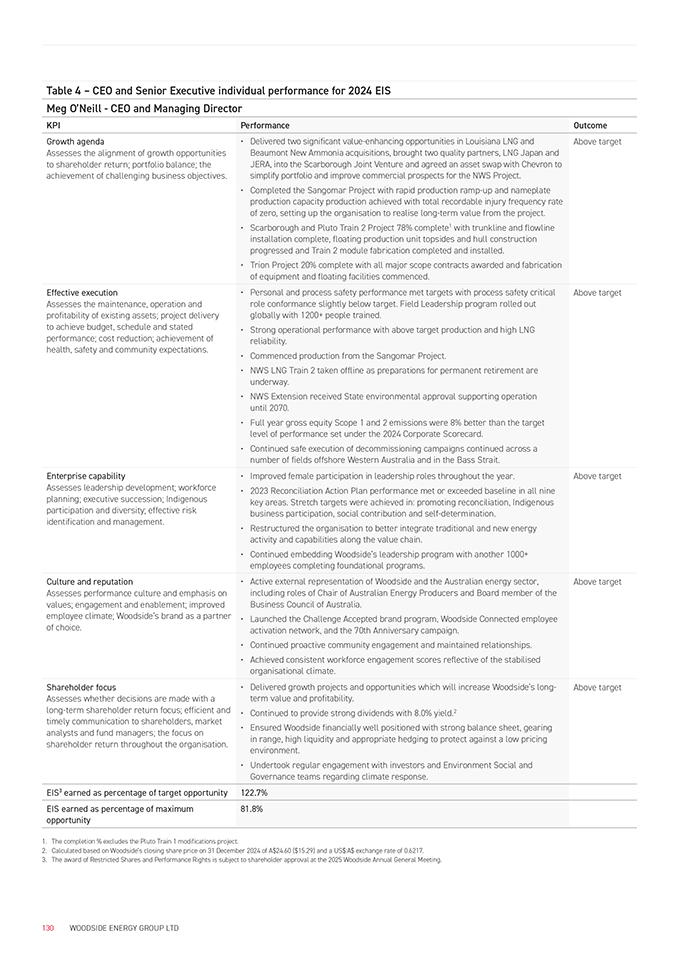
Table 4 – CEO and Senior Executive individual performance for 2024 EIS Meg O’Neill—CEO and Managing Director
KPI Performance Outcome
Growth agenda
Assesses the alignment of growth opportunities to shareholder return; portfolio balance; the achievement of challenging business objectives. • Delivered two significant value-enhancing opportunities in Louisiana LNG and Beaumont New Ammonia acquisitions, brought two quality partners, LNG Japan and JERA, into the Scarborough Joint Venture and agreed an asset swap with Chevron to simplify portfolio and improve commercial prospects for the NWS Project.
Completed the Sangomar Project with rapid production ramp-up and nameplate production capacity production achieved with total recordable injury frequency rate of zero, setting up the organisation to realise long-term value from the project.
Scarborough and Pluto Train 2 Project 78% complete1 with trunkline and flowline installation complete, floating production unit topsides and hull construction progressed and Train 2 module fabrication completed and installed.
Trion Project 20% complete with all major scope contracts awarded and fabrication of equipment and floating facilities commenced. Above target
Effective execution
Assesses the maintenance, operation and profitability of existing assets; project delivery to achieve budget, schedule and stated performance; cost reduction; achievement of health, safety and community expectations. • Personal and process safety performance met targets with process safety critical role conformance slightly below target. Field Leadership program rolled out globally with 1200+ people trained.
Strong operational performance with above target production and high LNG
reliability.
Commenced production from the Sangomar Project.
NWS LNG Train 2 taken offline as preparations for permanent retirement are underway.
NWS Extension received State environmental approval supporting operation until 2070.
Full year gross equity Scope 1 and 2 emissions were 8% better than the target level of performance set under the 2024 Corporate Scorecard.
Continued safe execution of decommissioning campaigns continued across a number of fields offshore Western Australia and in the Bass Strait. Above target
Enterprise capability
Assesses leadership development; workforce planning; executive succession; Indigenous participation and diversity; effective risk identification and management. • Improved female participation in leadership roles throughout the year.
2023 Reconciliation Action Plan performance met or exceeded baseline in all nine key areas. Stretch targets were achieved in: promoting reconciliation, Indigenous business participation, social contribution and self-determination.
Restructured the organisation to better integrate traditional and new energy activity and capabilities along the value chain.
Continued embedding Woodside’s leadership program with another 1000+
employees completing foundational programs. Above target
Culture and reputation
Assesses performance culture and emphasis on values; engagement and enablement; improved employee climate; Woodside’s brand as a partner of choice. • Active external representation of Woodside and the Australian energy sector, including roles of Chair of Australian Energy Producers and Board member of the Business Council of Australia.
Launched the Challenge Accepted brand program, Woodside Connected employee activation network, and the 70th Anniversary campaign.
Continued proactive community engagement and maintained relationships.
Achieved consistent workforce engagement scores reflective of the stabilised organisational climate. Above target
Shareholder focus
Assesses whether decisions are made with a
long-term shareholder return focus; efficient and timely communication to shareholders, market analysts and fund managers; the focus on shareholder return throughout the organisation. • Delivered growth projects and opportunities which will increase Woodside’s long- term value and profitability.
Continued to provide strong dividends with 8.0% yield.2
Ensured Woodside financially well positioned with strong balance sheet, gearing in range, high liquidity and appropriate hedging to protect against a low pricing environment.
Undertook regular engagement with investors and Environment Social and
Governance teams regarding climate response. Above target
EIS3 earned as percentage of target opportunity 122.7%
EIS earned as percentage of maximum opportunity 81.8%
1. The completion % excludes the Pluto Train 1 modifications project.
2. Calculated based on Woodside’s closing share price on 31 December 2024 of A$24.60 ($15.29) and a US$:A$ exchange rate of 0.6217.
3. The award of Restricted Shares and Performance Rights is subject to shareholder approval at the 2025 Woodside Annual General Meeting.
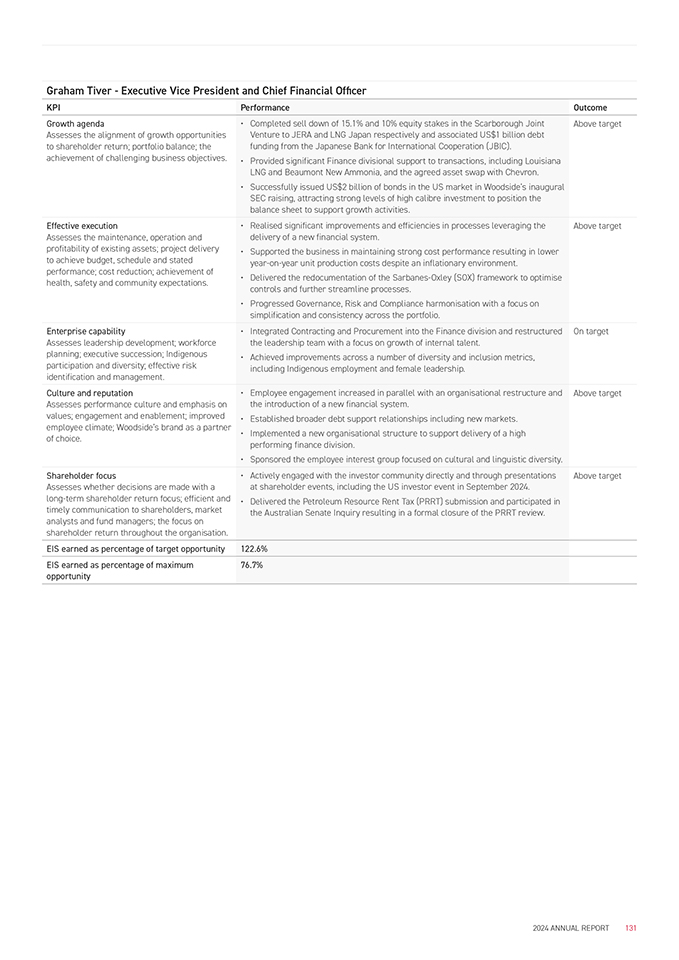
Graham Tiver—Executive Vice President and Chief Financial Officer
KPI Performance Outcome
Growth agenda
Assesses the alignment of growth opportunities to shareholder return; portfolio balance; the achievement of challenging business objectives. • Completed sell down of 15.1% and 10% equity stakes in the Scarborough Joint Venture to JERA and LNG Japan respectively and associated US$1 billion debt funding from the Japanese Bank for International Cooperation (JBIC).
Provided significant Finance divisional support to transactions, including Louisiana
LNG and Beaumont New Ammonia, and the agreed asset swap with Chevron.
Successfully issued US$2 billion of bonds in the US market in Woodside’s inaugural SEC raising, attracting strong levels of high calibre investment to position the balance sheet to support growth activities. Above target
Effective execution
Assesses the maintenance, operation and profitability of existing assets; project delivery to achieve budget, schedule and stated performance; cost reduction; achievement of health, safety and community expectations. • Realised significant improvements and efficiencies in processes leveraging the delivery of a new financial system.
Supported the business in maintaining strong cost performance resulting in lower year-on-year unit production costs despite an inflationary environment.
Delivered the redocumentation of the Sarbanes-Oxley (SOX) framework to optimise controls and further streamline processes.
Progressed Governance, Risk and Compliance harmonisation with a focus on simplification and consistency across the portfolio. Above target
Enterprise capability
Assesses leadership development; workforce planning; executive succession; Indigenous participation and diversity; effective risk identification and management. • Integrated Contracting and Procurement into the Finance division and restructured the leadership team with a focus on growth of internal talent.
Achieved improvements across a number of diversity and inclusion metrics, including Indigenous employment and female leadership. On target
Culture and reputation
Assesses performance culture and emphasis on values; engagement and enablement; improved employee climate; Woodside’s brand as a partner of choice. • Employee engagement increased in parallel with an organisational restructure and the introduction of a new financial system.
Established broader debt support relationships including new markets.
Implemented a new organisational structure to support delivery of a high performing finance division.
Sponsored the employee interest group focused on cultural and linguistic diversity. Above target
Shareholder focus
Assesses whether decisions are made with a
long-term shareholder return focus; efficient and timely communication to shareholders, market analysts and fund managers; the focus on shareholder return throughout the organisation. • Actively engaged with the investor community directly and through presentations at shareholder events, including the US investor event in September 2024.
Delivered the Petroleum Resource Rent Tax (PRRT) submission and participated in the Australian Senate Inquiry resulting in a formal closure of the PRRT review. Above target
EIS earned as percentage of target opportunity 122.6%
EIS earned as percentage of maximum opportunity 76.7%
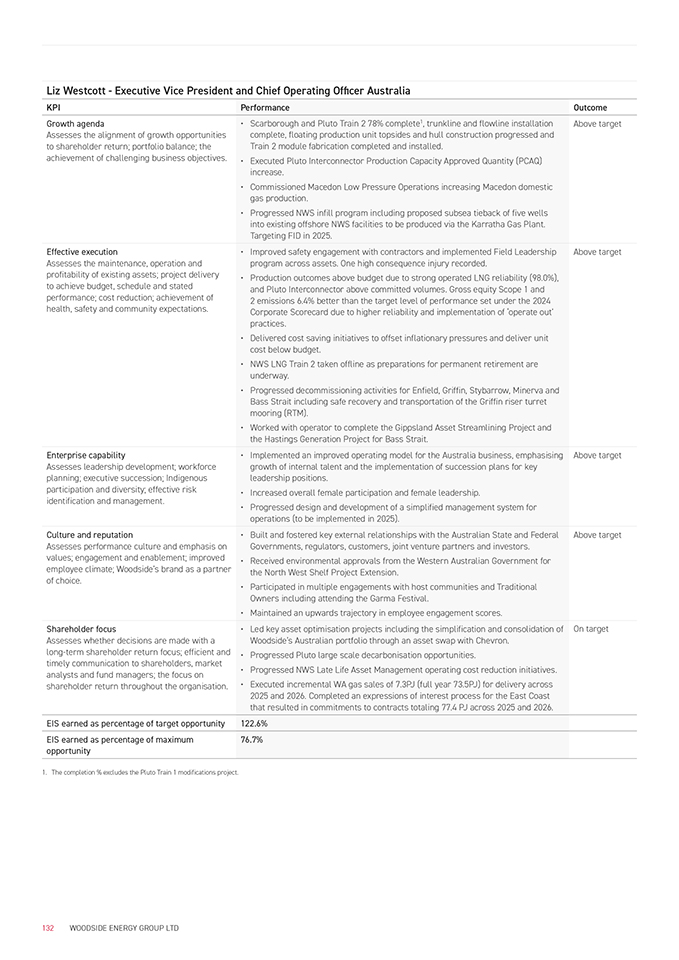
KPI Performance Outcome
Growth agenda
Assesses the alignment of growth opportunities to shareholder return; portfolio balance; the achievement of challenging business objectives. • Scarborough and Pluto Train 2 78% complete1, trunkline and flowline installation complete, floating production unit topsides and hull construction progressed and Train 2 module fabrication completed and installed.
Executed Pluto Interconnector Production Capacity Approved Quantity (PCAQ)
increase.
Commissioned Macedon Low Pressure Operations increasing Macedon domestic gas production.
Progressed NWS infill program including proposed subsea tieback of five wells into existing offshore NWS facilities to be produced via the Karratha Gas Plant. Targeting FID in 2025. Above target
Effective execution
Assesses the maintenance, operation and profitability of existing assets; project delivery to achieve budget, schedule and stated performance; cost reduction; achievement of health, safety and community expectations. • Improved safety engagement with contractors and implemented Field Leadership program across assets. One high consequence injury recorded.
Production outcomes above budget due to strong operated LNG reliability (98.0%), and Pluto Interconnector above committed volumes. Gross equity Scope 1 and
2 emissions 6.4% better than the target level of performance set under the 2024
Corporate Scorecard due to higher reliability and implementation of ‘operate out’
practices.
Delivered cost saving initiatives to offset inflationary pressures and deliver unit cost below budget.
NWS LNG Train 2 taken offline as preparations for permanent retirement are underway.
Progressed decommissioning activities for Enfield, Griffin, Stybarrow, Minerva and Bass Strait including safe recovery and transportation of the Griffin riser turret mooring (RTM).
Worked with operator to complete the Gippsland Asset Streamlining Project and the Hastings Generation Project for Bass Strait. Above target
Enterprise capability
Assesses leadership development; workforce planning; executive succession; Indigenous participation and diversity; effective risk identification and management. • Implemented an improved operating model for the Australia business, emphasising growth of internal talent and the implementation of succession plans for key leadership positions.
Increased overall female participation and female leadership.
Progressed design and development of a simplified management system for operations (to be implemented in 2025). Above target
Culture and reputation
Assesses performance culture and emphasis on values; engagement and enablement; improved employee climate; Woodside’s brand as a partner of choice. • Built and fostered key external relationships with the Australian State and Federal
Governments, regulators, customers, joint venture partners and investors.
Received environmental approvals from the Western Australian Government for the North West Shelf Project Extension.
Participated in multiple engagements with host communities and Traditional
Owners including attending the Garma Festival.
Maintained an upwards trajectory in employee engagement scores. Above target
Shareholder focus
Assesses whether decisions are made with a
long-term shareholder return focus; efficient and timely communication to shareholders, market analysts and fund managers; the focus on shareholder return throughout the organisation. • Led key asset optimisation projects including the simplification and consolidation of
Woodside’s Australian portfolio through an asset swap with Chevron.
Progressed Pluto large scale decarbonisation opportunities.
Progressed NWS Late Life Asset Management operating cost reduction initiatives.
Executed incremental WA gas sales of 7.3PJ (full year 73.5PJ) for delivery across
2025 and 2026. Completed an expressions of interest process for the East Coast that resulted in commitments to contracts totaling 77.4 PJ across 2025 and 2026. On target
EIS earned as percentage of target opportunity 122.6%
EIS earned as percentage of maximum opportunity 76.7%
1. The completion % excludes the Pluto Train 1 modifications project.
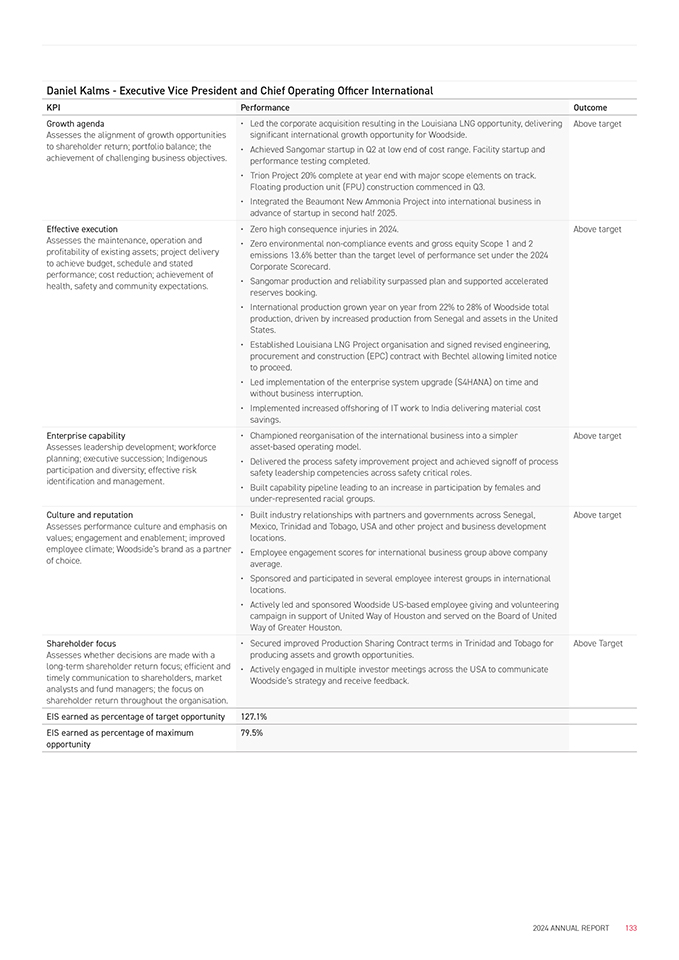
KPI Performance Outcome
Growth agenda
Assesses the alignment of growth opportunities to shareholder return; portfolio balance; the achievement of challenging business objectives. • Led the corporate acquisition resulting in the Louisiana LNG opportunity, delivering significant international growth opportunity for Woodside.
Achieved Sangomar startup in Q2 at low end of cost range. Facility startup and performance testing completed.
Trion Project 20% complete at year end with major scope elements on track. Floating production unit (FPU) construction commenced in Q3.
Integrated the Beaumont New Ammonia Project into international business in advance of startup in second half 2025. Above target
Effective execution
Assesses the maintenance, operation and profitability of existing assets; project delivery to achieve budget, schedule and stated performance; cost reduction; achievement of health, safety and community expectations. • Zero high consequence injuries in 2024.
Zero environmental non-compliance events and gross equity Scope 1 and 2 emissions 13.6% better than the target level of performance set under the 2024
Corporate Scorecard.
Sangomar production and reliability surpassed plan and supported accelerated reserves booking.
International production grown year on year from 22% to 28% of Woodside total production, driven by increased production from Senegal and assets in the United States.
Established Louisiana LNG Project organisation and signed revised engineering, procurement and construction (EPC) contract with Bechtel allowing limited notice to proceed.
Led implementation of the enterprise system upgrade (S4HANA) on time and without business interruption.
Implemented increased offshoring of IT work to India delivering material cost savings. Above target
Enterprise capability
Assesses leadership development; workforce planning; executive succession; Indigenous participation and diversity; effective risk identification and management. • Championed reorganisation of the international business into a simpler asset-based operating model.
Delivered the process safety improvement project and achieved signoff of process safety leadership competencies across safety critical roles.
Built capability pipeline leading to an increase in participation by females and under-represented racial groups. Above target
Culture and reputation
Assesses performance culture and emphasis on values; engagement and enablement; improved employee climate; Woodside’s brand as a partner of choice. • Built industry relationships with partners and governments across Senegal, Mexico, Trinidad and Tobago, USA and other project and business development locations.
Employee engagement scores for international business group above company average.
Sponsored and participated in several employee interest groups in international locations.
Actively led and sponsored Woodside US-based employee giving and volunteering campaign in support of United Way of Houston and served on the Board of United Way of Greater Houston. Above target
Shareholder focus
Assesses whether decisions are made with a
long-term shareholder return focus; efficient and timely communication to shareholders, market analysts and fund managers; the focus on shareholder return throughout the organisation. • Secured improved Production Sharing Contract terms in Trinidad and Tobago for producing assets and growth opportunities.
Actively engaged in multiple investor meetings across the USA to communicate
Woodside’s strategy and receive feedback. Above Target
EIS earned as percentage of target opportunity 127.1%
EIS earned as percentage of maximum opportunity 79.5%
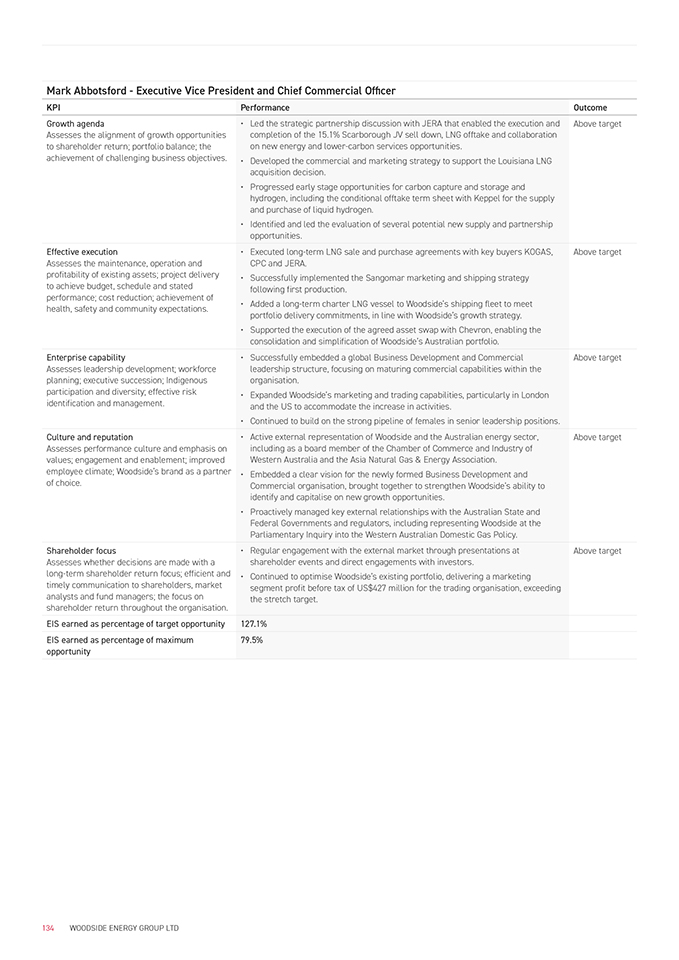
KPI Performance Outcome
Growth agenda
Assesses the alignment of growth opportunities to shareholder return; portfolio balance; the achievement of challenging business objectives. • Led the strategic partnership discussion with JERA that enabled the execution and completion of the 15.1% Scarborough JV sell down, LNG offtake and collaboration on new energy and lower-carbon services opportunities.
Developed the commercial and marketing strategy to support the Louisiana LNG
acquisition decision.
Progressed early stage opportunities for carbon capture and storage and hydrogen, including the conditional offtake term sheet with Keppel for the supply and purchase of liquid hydrogen.
Identified and led the evaluation of several potential new supply and partnership opportunities. Above target
Effective execution
Assesses the maintenance, operation and profitability of existing assets; project delivery to achieve budget, schedule and stated performance; cost reduction; achievement of health, safety and community expectations. • Executed long-term LNG sale and purchase agreements with key buyers KOGAS, CPC and JERA.
Successfully implemented the Sangomar marketing and shipping strategy following first production.
Added a long-term charter LNG vessel to Woodside’s shipping fleet to meet portfolio delivery commitments, in line with Woodside’s growth strategy.
Supported the execution of the agreed asset swap with Chevron, enabling the consolidation and simplification of Woodside’s Australian portfolio. Above target
Enterprise capability
Assesses leadership development; workforce planning; executive succession; Indigenous participation and diversity; effective risk identification and management. • Successfully embedded a global Business Development and Commercial leadership structure, focusing on maturing commercial capabilities within the organisation.
Expanded Woodside’s marketing and trading capabilities, particularly in London and the US to accommodate the increase in activities.
Continued to build on the strong pipeline of females in senior leadership positions. Above target
Culture and reputation
Assesses performance culture and emphasis on values; engagement and enablement; improved employee climate; Woodside’s brand as a partner of choice. • Active external representation of Woodside and the Australian energy sector, including as a board member of the Chamber of Commerce and Industry of Western Australia and the Asia Natural Gas & Energy Association.
Embedded a clear vision for the newly formed Business Development and Commercial organisation, brought together to strengthen Woodside’s ability to identify and capitalise on new growth opportunities.
Proactively managed key external relationships with the Australian State and Federal Governments and regulators, including representing Woodside at the Parliamentary Inquiry into the Western Australian Domestic Gas Policy. Above target
Shareholder focus
Assesses whether decisions are made with a
long-term shareholder return focus; efficient and timely communication to shareholders, market analysts and fund managers; the focus on shareholder return throughout the organisation. • Regular engagement with the external market through presentations at shareholder events and direct engagements with investors.
Continued to optimise Woodside’s existing portfolio, delivering a marketing segment profit before tax of US$427 million for the trading organisation, exceeding the stretch target. Above target
EIS earned as percentage of target opportunity 127.1%
EIS earned as percentage of maximum opportunity 79.5%
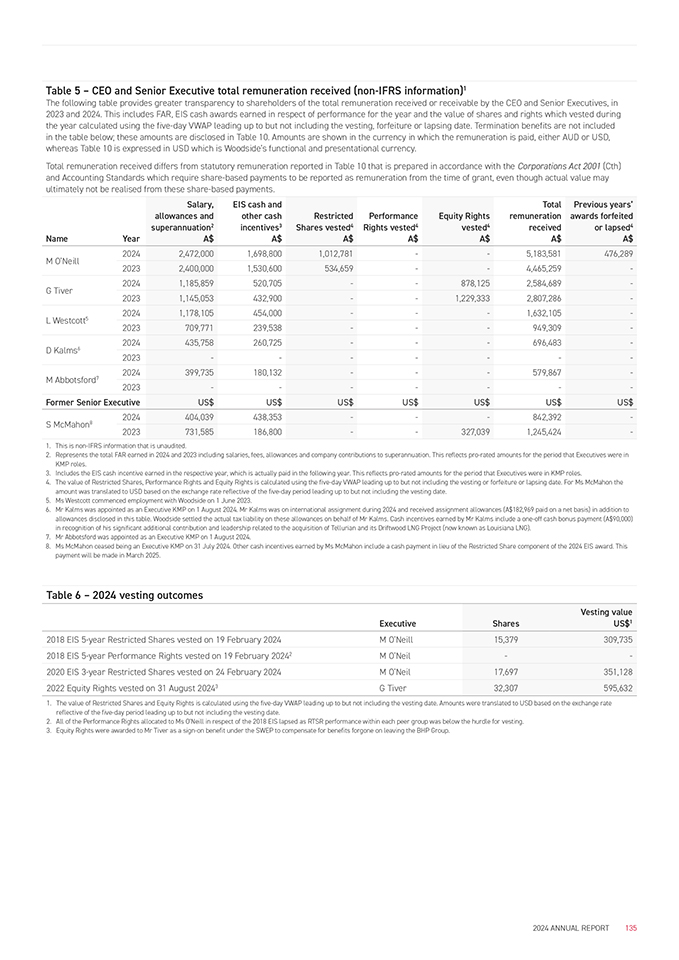
The following table provides greater transparency to shareholders of the total remuneration received or receivable by the CEO and Senior Executives, in
2023 and 2024. This includes FAR, EIS cash awards earned in respect of performance for the year and the value of shares and rights which vested during the year calculated using the five-day VWAP leading up to but not including the vesting, forfeiture or lapsing date. Termination benefits are not included
in the table below; these amounts are disclosed in Table 10. Amounts are shown in the currency in which the remuneration is paid, either AUD or USD, whereas Table 10 is expressed in USD which is Woodside’s functional and presentational currency.
Total remuneration received differs from statutory remuneration reported in Table 10 that is prepared in accordance with the Corporations Act 2001 (Cth) and Accounting Standards which require share-based payments to be reported as remuneration from the time of grant, even though actual value may ultimately not be realised from these share-based payments.
Name Year Salary, allowances and superannuation2
A$ EIS cash and other cash incentives3
A$
Restricted
Shares vested4
A$
Performance
Rights vested4
A$
Equity Rights vested4
A$ Total remuneration received
A$ Previous years’ awards forfeited or lapsed4
A$
M O’Neill 2024 2,472,000 1,698,800 1,012,781 — 5,183,581 476,289
2023 2,400,000 1,530,600 534,659 — 4,465,259 -
G Tiver 2024 1,185,859 520,705 — 878,125 2,584,689 -
2023 1,145,053 432,900 — 1,229,333 2,807,286 -
L Westcott5 2024 1,178,105 454,000 ——1,632,105 -
2023 709,771 239,538 ——949,309 -
D Kalms6 2024 435,758 260,725 ——696,483 -
2023 — — — -
M Abbotsford7 2024 399,735 180,132 ——579,867 -
2023 — — — -
Former Senior Executive US$ US$ US$ US$ US$ US$ US$
S McMahon8 2024 404,039 438,353 ——842,392 -
2023 731,585 186,800 — 327,039 1,245,424 -
1. This is non-IFRS information that is unaudited.
2. Represents the total FAR earned in 2024 and 2023 including salaries, fees, allowances and company contributions to superannuation. This reflects pro-rated amounts for the period that Executives were in
KMP roles.
3. Includes the EIS cash incentive earned in the respective year, which is actually paid in the following year. This reflects pro-rated amounts for the period that Executives were in KMP roles.
4. The value of Restricted Shares, Performance Rights and Equity Rights is calculated using the five-day VWAP leading up to but not including the vesting or forfeiture or lapsing date. For Ms McMahon the amount was translated to USD based on the exchange rate reflective of the five-day period leading up to but not including the vesting date.
5. Ms Westcott commenced employment with Woodside on 1 June 2023.
6. Mr Kalms was appointed as an Executive KMP on 1 August 2024. Mr Kalms was on international assignment during 2024 and received assignment allowances (A$182,969 paid on a net basis) in addition to allowances disclosed in this table. Woodside settled the actual tax liability on these allowances on behalf of Mr Kalms. Cash incentives earned by Mr Kalms include a one-off cash bonus payment (A$90,000) in recognition of his significant additional contribution and leadership related to the acquisition of Tellurian and its Driftwood LNG Project (now known as Louisiana LNG).
7. Mr Abbotsford was appointed as an Executive KMP on 1 August 2024.
8. Ms McMahon ceased being an Executive KMP on 31 July 2024. Other cash incentives earned by Ms McMahon include a cash payment in lieu of the Restricted Share component of the 2024 EIS award. This payment will be made in March 2025.
Table 6 – 2024 vesting outcomes
Executive Vesting value
Shares US$1
2018 EIS 5-year Restricted Shares vested on 19 February 2024 M O’Neill 15,379 309,735
2018 EIS 5-year Performance Rights vested on 19 February 20242 M O’Neil —
2020 EIS 3-year Restricted Shares vested on 24 February 2024 M O’Neil 17,697 351,128
2022 Equity Rights vested on 31 August 20243 G Tiver 32,307 595,632
1. The value of Restricted Shares and Equity Rights is calculated using the five-day VWAP leading up to but not including the vesting date. Amounts were translated to USD based on the exchange rate reflective of the five-day period leading up to but not including the vesting date.
2. All of the Performance Rights allocated to Ms O’Neill in respect of the 2018 EIS lapsed as RTSR performance within each peer group was below the hurdle for vesting.
3. Equity Rights were awarded to Mr Tiver as a sign-on benefit under the SWEP to compensate for benefits forgone on leaving the BHP Group.
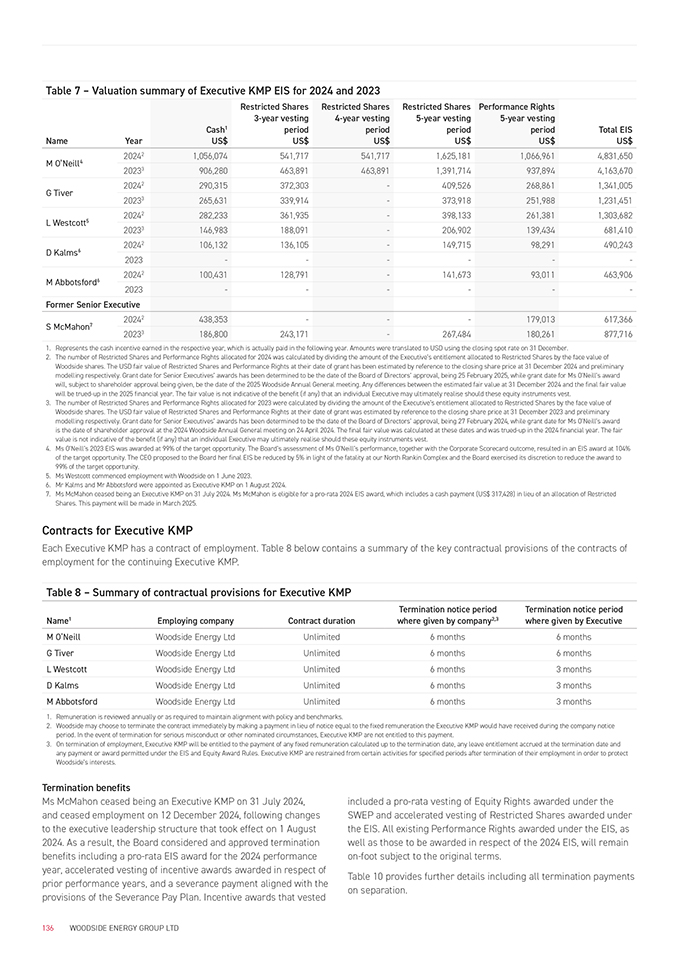
Name Year
Cash1
US$ Restricted Shares
3-year vesting period US$ Restricted Shares
4-year vesting period US$ Restricted Shares
5-year vesting period US$ Performance Rights
5-year vesting period US$
Total EIS US$
M O’Neill4 20242 1,056,074 541,717 541,717 1,625,181 1,066,961 4,831,650
20233 906,280 463,891 463,891 1,391,714 937,894 4,163,670
G Tiver 20242 290,315 372,303—409,526 268,861 1,341,005
20233 265,631 339,914—373,918 251,988 1,231,451
L Westcott5 20242 282,233 361,935—398,133 261,381 1,303,682
20233 146,983 188,091—206,902 139,434 681,410
D Kalms6 20242 106,132 136,105—149,715 98,291 490,243
2023 — — —
M Abbotsford6 20242 100,431 128,791—141,673 93,011 463,906
2023 — — —
Former Senior Executive
S McMahon7 20242 438,353 ——179,013 617,366
20233 186,800 243,171—267,484 180,261 877,716
1. Represents the cash incentive earned in the respective year, which is actually paid in the following year. Amounts were translated to USD using the closing spot rate on 31 December.
2. The number of Restricted Shares and Performance Rights allocated for 2024 was calculated by dividing the amount of the Executive’s entitlement allocated to Restricted Shares by the face value of Woodside shares. The USD fair value of Restricted Shares and Performance Rights at their date of grant has been estimated by reference to the closing share price at 31 December 2024 and preliminary modelling respectively. Grant date for Senior Executives’ awards has been determined to be the date of the Board of Directors’ approval, being 25 February 2025, while grant date for Ms O’Neill’s award will, subject to shareholder approval being given, be the date of the 2025 Woodside Annual General meeting. Any differences between the estimated fair value at 31 December 2024 and the final fair value will be trued-up in the 2025 financial year. The fair value is not indicative of the benefit (if any) that an individual Executive may ultimately realise should these equity instruments vest.
3. The number of Restricted Shares and Performance Rights allocated for 2023 were calculated by dividing the amount of the Executive’s entitlement allocated to Restricted Shares by the face value of Woodside shares. The USD fair value of Restricted Shares and Performance Rights at their date of grant was estimated by reference to the closing share price at 31 December 2023 and preliminary modelling respectively. Grant date for Senior Executives’ awards has been determined to be the date of the Board of Directors’ approval, being 27 February 2024, while grant date for Ms O’Neill’s award is the date of shareholder approval at the 2024 Woodside Annual General meeting on 24 April 2024. The final fair value was calculated at these dates and was trued-up in the 2024 financial year. The fair value is not indicative of the benefit (if any) that an individual Executive may ultimately realise should these equity instruments vest.
4. Ms O’Neill’s 2023 EIS was awarded at 99% of the target opportunity. The Board’s assessment of Ms O’Neill’s performance, together with the Corporate Scorecard outcome, resulted in an EIS award at 104%
of the target opportunity. The CEO proposed to the Board her final EIS be reduced by 5% in light of the fatality at our North Rankin Complex and the Board exercised its discretion to reduce the award to
99% of the target opportunity.
5. Ms Westcott commenced employment with Woodside on 1 June 2023.
6. Mr Kalms and Mr Abbotsford were appointed as Executive KMP on 1 August 2024.
7. Ms McMahon ceased being an Executive KMP on 31 July 2024. Ms McMahon is eligible for a pro-rata 2024 EIS award, which includes a cash payment (US$ 317,428) in lieu of an allocation of Restricted
Shares. This payment will be made in March 2025.
Contracts for Executive KMP
Each Executive KMP has a contract of employment. Table 8 below contains a summary of the key contractual provisions of the contracts of employment for the continuing Executive KMP.
Table 8 – Summary of contractual provisions for Executive KMP
Name1
Employing company
Contract duration Termination notice period where given by company2,3 Termination notice period where given by Executive
M O’Neill Woodside Energy Ltd Unlimited 6 months 6 months
G Tiver Woodside Energy Ltd Unlimited 6 months 6 months
L Westcott Woodside Energy Ltd Unlimited 6 months 3 months
D Kalms Woodside Energy Ltd Unlimited 6 months 3 months
M Abbotsford Woodside Energy Ltd Unlimited 6 months 3 months
1. Remuneration is reviewed annually or as required to maintain alignment with policy and benchmarks.
2. Woodside may choose to terminate the contract immediately by making a payment in lieu of notice equal to the fixed remuneration the Executive KMP would have received during the company notice period. In the event of termination for serious misconduct or other nominated circumstances, Executive KMP are not entitled to this payment.
3. On termination of employment, Executive KMP will be entitled to the payment of any fixed remuneration calculated up to the termination date, any leave entitlement accrued at the termination date and any payment or award permitted under the EIS and Equity Award Rules. Executive KMP are restrained from certain activities for specified periods after termination of their employment in order to protect Woodside’s interests.
Termination benefits
Ms McMahon ceased being an Executive KMP on 31 July 2024,
and ceased employment on 12 December 2024, following changes to the executive leadership structure that took effect on 1 August
2024. As a result, the Board considered and approved termination benefits including a pro-rata EIS award for the 2024 performance year, accelerated vesting of incentive awards awarded in respect of prior performance years, and a severance payment aligned with the provisions of the Severance Pay Plan. Incentive awards that vested
included a pro-rata vesting of Equity Rights awarded under the SWEP and accelerated vesting of Restricted Shares awarded under the EIS. All existing Performance Rights awarded under the EIS, as well as those to be awarded in respect of the 2024 EIS, will remain on-foot subject to the original terms.
Table 10 provides further details including all termination payments on separation.
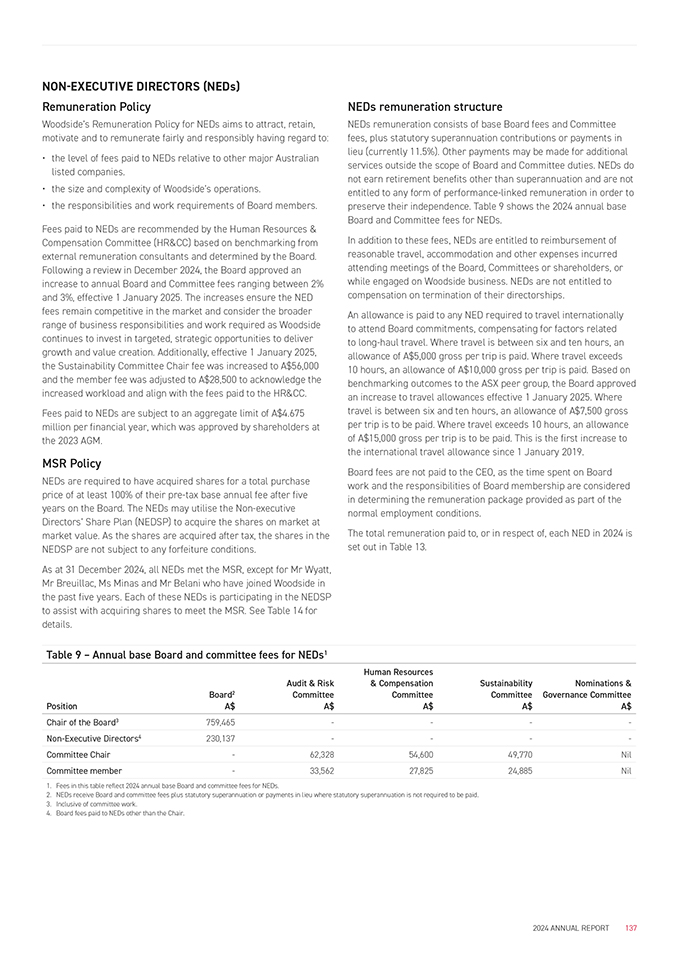
NON-EXECUTIVE DIRECTORS (NEDs)
Remuneration Policy
Woodside’s Remuneration Policy for NEDs aims to attract, retain, motivate and to remunerate fairly and responsibly having regard to:
the level of fees paid to NEDs relative to other major Australian listed companies.
the size and complexity of Woodside’s operations.
the responsibilities and work requirements of Board members.
Fees paid to NEDs are recommended by the Human Resources & Compensation Committee (HR&CC) based on benchmarking from external remuneration consultants and determined by the Board. Following a review in December 2024, the Board approved an increase to annual Board and Committee fees ranging between 2% and 3%, effective 1 January 2025. The increases ensure the NED fees remain competitive in the market and consider the broader range of business responsibilities and work required as Woodside continues to invest in targeted, strategic opportunities to deliver growth and value creation. Additionally, effective 1 January 2025, the Sustainability Committee Chair fee was increased to A$56,000 and the member fee was adjusted to A$28,500 to acknowledge the increased workload and align with the fees paid to the HR&CC.
Fees paid to NEDs are subject to an aggregate limit of A$4.675 million per financial year, which was approved by shareholders at the 2023 AGM.
MSR Policy
NEDs are required to have acquired shares for a total purchase price of at least 100% of their pre-tax base annual fee after five years on the Board. The NEDs may utilise the Non-executive Directors’ Share Plan (NEDSP) to acquire the shares on market at
market value. As the shares are acquired after tax, the shares in the
NEDSP are not subject to any forfeiture conditions.
As at 31 December 2024, all NEDs met the MSR, except for Mr Wyatt, Mr Breuillac, Ms Minas and Mr Belani who have joined Woodside in the past five years. Each of these NEDs is participating in the NEDSP to assist with acquiring shares to meet the MSR. See Table 14 for details.
NEDs remuneration structure
NEDs remuneration consists of base Board fees and Committee fees, plus statutory superannuation contributions or payments in lieu (currently 11.5%). Other payments may be made for additional services outside the scope of Board and Committee duties. NEDs do not earn retirement benefits other than superannuation and are not entitled to any form of performance-linked remuneration in order to preserve their independence. Table 9 shows the 2024 annual base Board and Committee fees for NEDs.
In addition to these fees, NEDs are entitled to reimbursement of reasonable travel, accommodation and other expenses incurred attending meetings of the Board, Committees or shareholders, or while engaged on Woodside business. NEDs are not entitled to compensation on termination of their directorships.
An allowance is paid to any NED required to travel internationally to attend Board commitments, compensating for factors related
to long-haul travel. Where travel is between six and ten hours, an allowance of A$5,000 gross per trip is paid. Where travel exceeds
10 hours, an allowance of A$10,000 gross per trip is paid. Based on benchmarking outcomes to the ASX peer group, the Board approved an increase to travel allowances effective 1 January 2025. Where travel is between six and ten hours, an allowance of A$7,500 gross per trip is to be paid. Where travel exceeds 10 hours, an allowance
of A$15,000 gross per trip is to be paid. This is the first increase to the international travel allowance since 1 January 2019.
Board fees are not paid to the CEO, as the time spent on Board work and the responsibilities of Board membership are considered in determining the remuneration package provided as part of the normal employment conditions.
The total remuneration paid to, or in respect of, each NED in 2024 is set out in Table 13.
Table 9 – Annual base Board and committee fees for NEDs1
Human Resources
Audit & Risk & Compensation Sustainability Nominations &
Board2 Committee Committee Committee Governance Committee
Position A$ A$ A$ A$ A$
Chair of the Board3 759,465 — —
Non-Executive Directors4 230,137 — —
Committee Chair—62,328 54,600 49,770 Nil
Committee member—33,562 27,825 24,885 Nil
1. Fees in this table reflect 2024 annual base Board and committee fees for NEDs.
2. NEDs receive Board and committee fees plus statutory superannuation or payments in lieu where statutory superannuation is not required to be paid.
3. Inclusive of committee work.
4. Board fees paid to NEDs other than the Chair.
HUMAN RESOURCES & COMPENSATION COMMITTEE The Committee assists the Board to determine appropriate remuneration policies and structures for NEDs and Executives.
Further information on the role of the Committee is described in the
Corporate Governance Statement in the Annual Report.
LOANS AND TRANSACTIONS
No loans or transactions (other than as described in this report) have been made, guaranteed or secured, directly or indirectly, by Woodside or any of its subsidiaries at any time throughout the year, to any Executive KMP including to an Executive KMP related party.
USE OF REMUNERATION CONSULTANTS
From time-to-time, the Committee directly engages independent external advisers to provide input to the process of reviewing the remuneration for NEDs and Executives. The Committee may receive executive remuneration advice directly from external independent remuneration consultants.
Under communications and engagement protocols adopted by Woodside, market data reports are provided directly to the Committee Chair, and a consultant provides a statement to the Committee that reports have been prepared free of undue influence from Executive KMP. This process ensures the Committee has full oversight of the review process and therefore it, and the Board, can be satisfied
that the work undertaken by external independent remuneration consultants is free from undue influence by Executive KMP.
External remuneration benchmarking in 2024 was obtained from independent remuneration consultants KPMG to assist with the NED fee review, and from KPMG and Meridian for the CEO and Senior Executive review. No remuneration recommendations were received during 2024.
REPORTING NOTES
Reporting in United States dollars
In this report, the remuneration and benefits reported have been presented in US dollars, unless otherwise stated. This is consistent with the functional and presentation currency of the company.
Compensation for Australian-based employees and Australian- based Executive KMP is paid in Australian dollars and, for reporting purposes, converted to US dollars based on the exchange rate reflective of the service period. Compensation for US-based employees and US-based Executive KMP is paid in US dollars. Valuation of equity awards is converted at the spot rate applying when the equity award is granted.
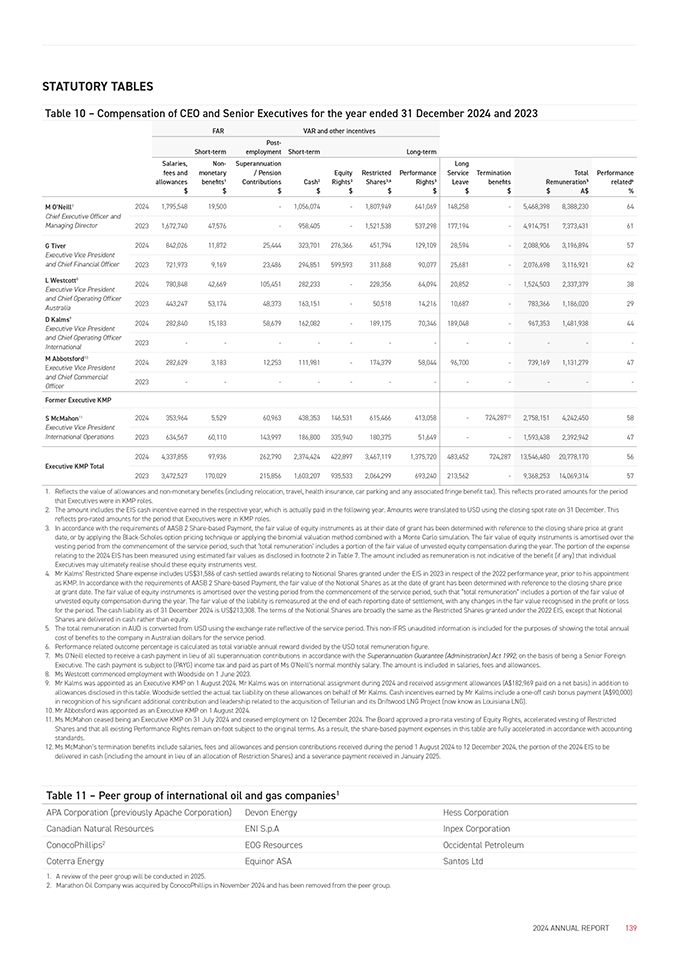
STATUTORY TABLES
Table 10 – Compensation of CEO and Senior Executives for the year ended 31 December 2024 and 2023
FAR VAR and other incentives
Post-
Salaries,
Short-term
Non-
employment Short-term Long-term
Superannuation
Long
fees and allowances
$
monetary benefits1
$
/ Pension
Contributions
$
Cash2
$
Equity
Rights3
$
Restricted
Shares3,4
$
Performance
Rights3
$
Service
Leave
$
Termination benefits
$
Total
Remuneration5
$ A$
Performance related6
%
M O’Neill7
Chief Executive Officer and
Managing Director
2024 1,795,548 19,500—1,056,074—1,807,949 641,069 148,258—5,468,398 8,388,230 64
2023 1,672,740 47,576—958,405—1,521,538 537,298 177,194—4,914,751 7,373,431 61
G Tiver
Executive Vice President and Chief Financial Officer
L Westcott8
Executive Vice President and Chief Operating Officer Australia
D Kalms9
Executive Vice President and Chief Operating Officer International
M Abbotsford10
Executive Vice President and Chief Commercial Officer
2024 842,026 11,872 25,444 323,701 276,366 451,794 129,109 28,594—2,088,906 3,196,894 57
2023 721,973 9,169 23,486 294,851 599,593 311,868 90,077 25,681—2,076,698 3,116,921 62
2024 780,848 42,669 105,451 282,233—228,356 64,094 20,852—1,524,503 2,337,379 38
2023 443,247 53,174 48,373 163,151—50,518 14,216 10,687—783,366 1,186,020 29
2024 282,840 15,183 58,679 162,082—189,175 70,346 189,048—967,353 1,481,938 44
2023 — — — — — —
2024 282,629 3,183 12,253 111,981—174,379 58,044 96,700—739,169 1,131,279 47
2023 — — — — — —
Former Executive KMP
S McMahon11
Executive Vice President
International Operations
2024 353,964 5,529 60,963 438,353 146,531 615,466 413,058—724,28712 2,758,151 4,242,450 58
2023 634,567 60,110 143,997 186,800 335,940 180,375 51,649 — 1,593,438 2,392,942 47
Executive KMP Total
2024 4,337,855 97,936 262,790 2,374,424 422,897 3,467,119 1,375,720 483,452 724,287 13,546,480 20,778,170 56
2023 3,472,527 170,029 215,856 1,603,207 935,533 2,064,299 693,240 213,562—9,368,253 14,069,314 57
1. Reflects the value of allowances and non-monetary benefits (including relocation, travel, health insurance, car parking and any associated fringe benefit tax). This reflects pro-rated amounts for the period that Executives were in KMP roles.
2. The amount includes the EIS cash incentive earned in the respective year, which is actually paid in the following year. Amounts were translated to USD using the closing spot rate on 31 December. This reflects pro-rated amounts for the period that Executives were in KMP roles.
3. In accordance with the requirements of AASB 2 Share-based Payment, the fair value of equity instruments as at their date of grant has been determined with reference to the closing share price at grant date, or by applying the Black-Scholes option pricing technique or applying the binomial valuation method combined with a Monte Carlo simulation. The fair value of equity instruments is amortised over the vesting period from the commencement of the service period, such that ‘total remuneration’ includes a portion of the fair value of unvested equity compensation during the year. The portion of the expense relating to the 2024 EIS has been measured using estimated fair values as disclosed in footnote 2 in Table 7. The amount included as remuneration is not indicative of the benefit (if any) that individual Executives may ultimately realise should these equity instruments vest.
4. Mr Kalms’ Restricted Share expense includes US$31,586 of cash settled awards relating to Notional Shares granted under the EIS in 2023 in respect of the 2022 performance year, prior to his appointment as KMP. In accordance with the requirements of AASB 2 Share-based Payment, the fair value of the Notional Shares as at the date of grant has been determined with reference to the closing share price
at grant date. The fair value of equity instruments is amortised over the vesting period from the commencement of the service period, such that “total remuneration” includes a portion of the fair value of unvested equity compensation during the year. The fair value of the liability is remeasured at the end of each reporting date of settlement, with any changes in the fair value recognised in the profit or loss for the period. The cash liability as of 31 December 2024 is US$213,308. The terms of the Notional Shares are broadly the same as the Restricted Shares granted under the 2022 EIS, except that Notional Shares are delivered in cash rather than equity.
5. The total remuneration in AUD is converted from USD using the exchange rate reflective of the service period. This non-IFRS unaudited information is included for the purposes of showing the total annual cost of benefits to the company in Australian dollars for the service period.
6. Performance related outcome percentage is calculated as total variable annual reward divided by the USD total remuneration figure.
7. Ms O’Neill elected to receive a cash payment in lieu of all superannuation contributions in accordance with the Superannuation Guarantee (Administration) Act 1992, on the basis of being a Senior Foreign
Executive. The cash payment is subject to (PAYG) income tax and paid as part of Ms O’Neill’s normal monthly salary. The amount is included in salaries, fees and allowances.
8. Ms Westcott commenced employment with Woodside on 1 June 2023.
9. Mr Kalms was appointed as an Executive KMP on 1 August 2024. Mr Kalms was on international assignment during 2024 and received assignment allowances (A$182,969 paid on a net basis) in addition to allowances disclosed in this table. Woodside settled the actual tax liability on these allowances on behalf of Mr Kalms. Cash incentives earned by Mr Kalms include a one-off cash bonus payment (A$90,000) in recognition of his significant additional contribution and leadership related to the acquisition of Tellurian and its Driftwood LNG Project (now know as Louisiana LNG).
10. Mr Abbotsford was appointed as an Executive KMP on 1 August 2024.
11. Ms McMahon ceased being an Executive KMP on 31 July 2024 and ceased employment on 12 December 2024. The Board approved a pro-rata vesting of Equity Rights, accelerated vesting of Restricted Shares and that all existing Performance Rights remain on-foot subject to the original terms. As a result, the share-based payment expenses in this table are fully accelerated in accordance with accounting standards.
12. Ms McMahon’s termination benefits include salaries, fees and allowances and pension contributions received during the period 1 August 2024 to 12 December 2024, the portion of the 2024 EIS to be delivered in cash (including the amount in lieu of an allocation of Restriction Shares) and a severance payment received in January 2025.
Table 11 – Peer group of international oil and gas companies1
APA Corporation (previously Apache Corporation) Devon Energy Hess Corporation
Canadian Natural Resources ENI S.p.A Inpex Corporation
ConocoPhillips2 EOG Resources Occidental Petroleum
Coterra Energy Equinor ASA Santos Ltd
1. A review of the peer group will be conducted in 2025.
2. Marathon Oil Company was acquired by ConocoPhillips in November 2024 and has been removed from the peer group.
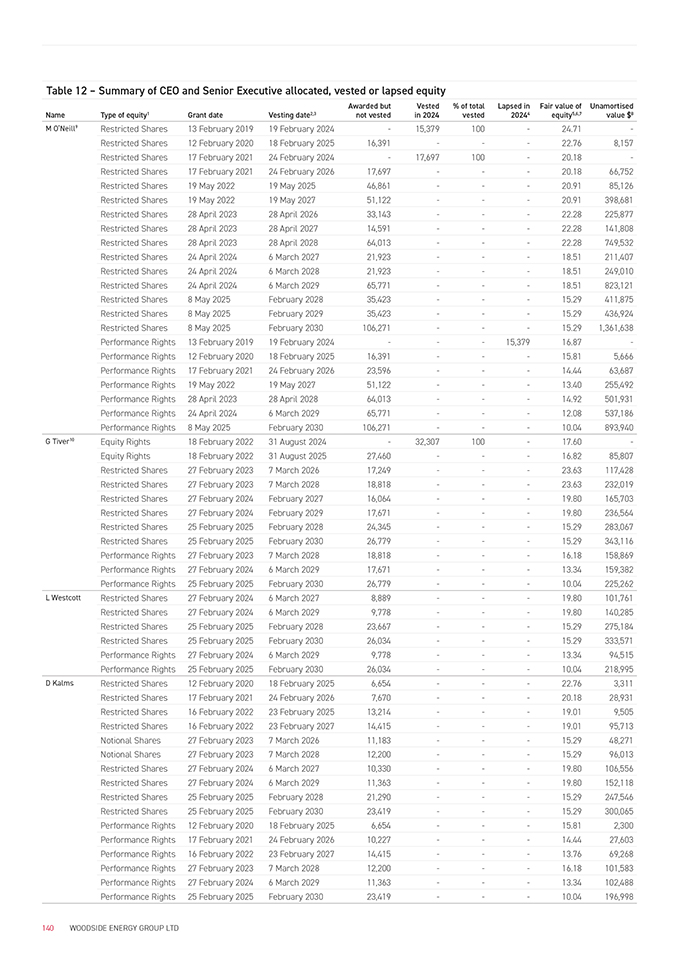
Table 12 – Summary of CEO and Senior Executive allocated, vested or lapsed equity
Name
Type of equity1
Grant date
Vesting date2,3 Awarded but not vested Vested in 2024% of total vested Lapsed in
20244 Fair value of equity5,6,7 Unamortised value $8
M O’Neill9 Restricted Shares 13 February 2019 19 February 2024—15,379 100—24.71 -
Restricted Shares 12 February 2020 18 February 2025 16,391 ——22.76 8,157
Restricted Shares 17 February 2021 24 February 2024—17,697 100—20.18 -
Restricted Shares 17 February 2021 24 February 2026 17,697 ——20.18 66,752
Restricted Shares 19 May 2022 19 May 2025 46,861 ——20.91 85,126
Restricted Shares 19 May 2022 19 May 2027 51,122 ——20.91 398,681
Restricted Shares 28 April 2023 28 April 2026 33,143 ——22.28 225,877
Restricted Shares 28 April 2023 28 April 2027 14,591 ——22.28 141,808
Restricted Shares 28 April 2023 28 April 2028 64,013 ——22.28 749,532
Restricted Shares 24 April 2024 6 March 2027 21,923 ——18.51 211,407
Restricted Shares 24 April 2024 6 March 2028 21,923 ——18.51 249,010
Restricted Shares 24 April 2024 6 March 2029 65,771 ——18.51 823,121
Restricted Shares 8 May 2025 February 2028 35,423 ——15.29 411,875
Restricted Shares 8 May 2025 February 2029 35,423 ——15.29 436,924
Restricted Shares 8 May 2025 February 2030 106,271 ——15.29 1,361,638
Performance Rights 13 February 2019 19 February 2024 ——15,379 16.87 -
Performance Rights 12 February 2020 18 February 2025 16,391 ——15.81 5,666
Performance Rights 17 February 2021 24 February 2026 23,596 ——14.44 63,687
Performance Rights 19 May 2022 19 May 2027 51,122 ——13.40 255,492
Performance Rights 28 April 2023 28 April 2028 64,013 ——14.92 501,931
Performance Rights 24 April 2024 6 March 2029 65,771 ——12.08 537,186
Performance Rights 8 May 2025 February 2030 106,271 ——10.04 893,940
G Tiver10 Equity Rights 18 February 2022 31 August 2024—32,307 100—17.60 -
Equity Rights 18 February 2022 31 August 2025 27,460 ——16.82 85,807
Restricted Shares 27 February 2023 7 March 2026 17,249 ——23.63 117,428
Restricted Shares 27 February 2023 7 March 2028 18,818 ——23.63 232,019
Restricted Shares 27 February 2024 February 2027 16,064 ——19.80 165,703
Restricted Shares 27 February 2024 February 2029 17,671 ——19.80 236,564
Restricted Shares 25 February 2025 February 2028 24,345 ——15.29 283,067
Restricted Shares 25 February 2025 February 2030 26,779 ——15.29 343,116
Performance Rights 27 February 2023 7 March 2028 18,818 ——16.18 158,869
Performance Rights 27 February 2024 6 March 2029 17,671 ——13.34 159,382
Performance Rights 25 February 2025 February 2030 26,779 ——10.04 225,262
L Westcott Restricted Shares 27 February 2024 6 March 2027 8,889 ——19.80 101,761
Restricted Shares 27 February 2024 6 March 2029 9,778 ——19.80 140,285
Restricted Shares 25 February 2025 February 2028 23,667 ——15.29 275,184
Restricted Shares 25 February 2025 February 2030 26,034 ——15.29 333,571
Performance Rights 27 February 2024 6 March 2029 9,778 ——13.34 94,515
Performance Rights 25 February 2025 February 2030 26,034 ——10.04 218,995
D Kalms Restricted Shares 12 February 2020 18 February 2025 6,654 ——22.76 3,311
Restricted Shares 17 February 2021 24 February 2026 7,670 ——20.18 28,931
Restricted Shares 16 February 2022 23 February 2025 13,214 ——19.01 9,505
Restricted Shares 16 February 2022 23 February 2027 14,415 ——19.01 95,713
Notional Shares 27 February 2023 7 March 2026 11,183 ——15.29 48,271
Notional Shares 27 February 2023 7 March 2028 12,200 ——15.29 96,013
Restricted Shares 27 February 2024 6 March 2027 10,330 ——19.80 106,556
Restricted Shares 27 February 2024 6 March 2029 11,363 ——19.80 152,118
Restricted Shares 25 February 2025 February 2028 21,290 ——15.29 247,546
Restricted Shares 25 February 2025 February 2030 23,419 ——15.29 300,065
Performance Rights 12 February 2020 18 February 2025 6,654 ——15.81 2,300
Performance Rights 17 February 2021 24 February 2026 10,227 ——14.44 27,603
Performance Rights 16 February 2022 23 February 2027 14,415 ——13.76 69,268
Performance Rights 27 February 2023 7 March 2028 12,200 ——16.18 101,583
Performance Rights 27 February 2024 6 March 2029 11,363 ——13.34 102,488
Performance Rights 25 February 2025 February 2030 23,419 ——10.04 196,998
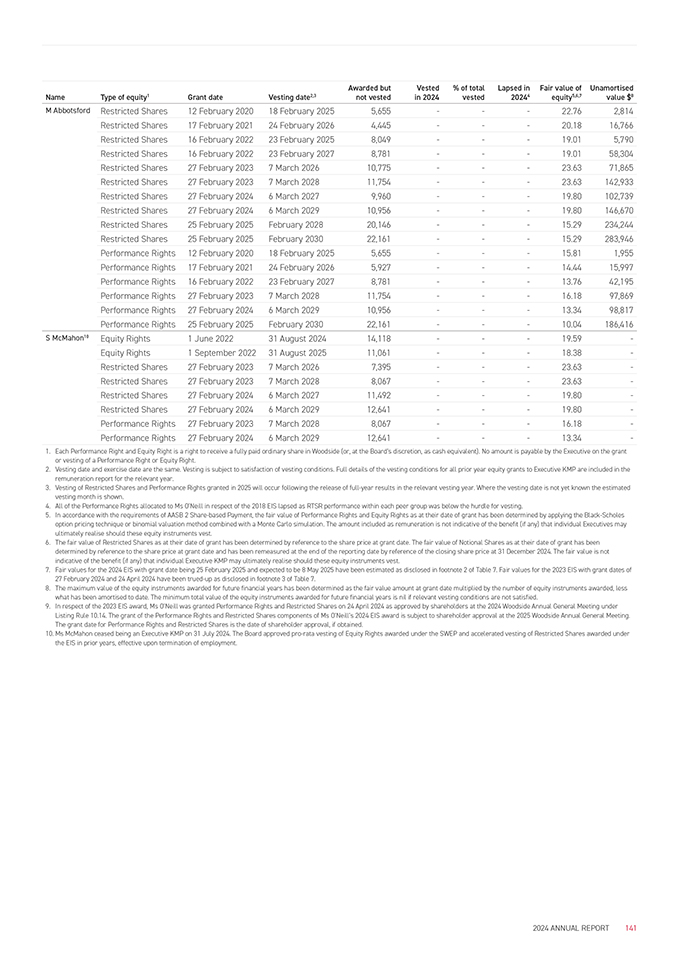
Name
Type of equity1
Grant date
Vesting date2,3 Awarded but not vested Vested in 2024% of total vested Lapsed in
20244 Fair value of equity5,6,7 Unamortised value $8
M Abbotsford Restricted Shares 12 February 2020 18 February 2025 5,655 ——22.76 2,814
Restricted Shares 17 February 2021 24 February 2026 4,445 ——20.18 16,766
Restricted Shares 16 February 2022 23 February 2025 8,049 ——19.01 5,790
Restricted Shares 16 February 2022 23 February 2027 8,781 ——19.01 58,304
Restricted Shares 27 February 2023 7 March 2026 10,775 ——23.63 71,865
Restricted Shares 27 February 2023 7 March 2028 11,754 ——23.63 142,933
Restricted Shares 27 February 2024 6 March 2027 9,960 ——19.80 102,739
Restricted Shares 27 February 2024 6 March 2029 10,956 ——19.80 146,670
Restricted Shares 25 February 2025 February 2028 20,146 ——15.29 234,244
Restricted Shares 25 February 2025 February 2030 22,161 ——15.29 283,946
Performance Rights 12 February 2020 18 February 2025 5,655 ——15.81 1,955
Performance Rights 17 February 2021 24 February 2026 5,927 ——14.44 15,997
Performance Rights 16 February 2022 23 February 2027 8,781 ——13.76 42,195
Performance Rights 27 February 2023 7 March 2028 11,754 ——16.18 97,869
Performance Rights 27 February 2024 6 March 2029 10,956 ——13.34 98,817
Performance Rights 25 February 2025 February 2030 22,161 ——10.04 186,416
S McMahon10 Equity Rights 1 June 2022 31 August 2024 14,118 ——19.59 -
Equity Rights 1 September 2022 31 August 2025 11,061 ——18.38 -
Restricted Shares 27 February 2023 7 March 2026 7,395 ——23.63 -
Restricted Shares 27 February 2023 7 March 2028 8,067 ——23.63 -
Restricted Shares 27 February 2024 6 March 2027 11,492 ——19.80 -
Restricted Shares 27 February 2024 6 March 2029 12,641 ——19.80 -
Performance Rights 27 February 2023 7 March 2028 8,067 ——16.18 -
Performance Rights 27 February 2024 6 March 2029 12,641 ——13.34 -
1. Each Performance Right and Equity Right is a right to receive a fully paid ordinary share in Woodside (or, at the Board’s discretion, as cash equivalent). No amount is payable by the Executive on the grant or vesting of a Performance Right or Equity Right.
2. Vesting date and exercise date are the same. Vesting is subject to satisfaction of vesting conditions. Full details of the vesting conditions for all prior year equity grants to Executive KMP are included in the remuneration report for the relevant year.
3. Vesting of Restricted Shares and Performance Rights granted in 2025 will occur following the release of full-year results in the relevant vesting year. Where the vesting date is not yet known the estimated vesting month is shown.
4. All of the Performance Rights allocated to Ms O’Neill in respect of the 2018 EIS lapsed as RTSR performance within each peer group was below the hurdle for vesting.
5. In accordance with the requirements of AASB 2 Share-based Payment, the fair value of Performance Rights and Equity Rights as at their date of grant has been determined by applying the Black-Scholes option pricing technique or binomial valuation method combined with a Monte Carlo simulation. The amount included as remuneration is not indicative of the benefit (if any) that individual Executives may ultimately realise should these equity instruments vest.
6. The fair value of Restricted Shares as at their date of grant has been determined by reference to the share price at grant date. The fair value of Notional Shares as at their date of grant has been determined by reference to the share price at grant date and has been remeasured at the end of the reporting date by reference of the closing share price at 31 December 2024. The fair value is not indicative of the benefit (if any) that individual Executive KMP may ultimately realise should these equity instruments vest.
7. Fair values for the 2024 EIS with grant date being 25 February 2025 and expected to be 8 May 2025 have been estimated as disclosed in footnote 2 of Table 7. Fair values for the 2023 EIS with grant dates of
27 February 2024 and 24 April 2024 have been trued-up as disclosed in footnote 3 of Table 7.
8. The maximum value of the equity instruments awarded for future financial years has been determined as the fair value amount at grant date multiplied by the number of equity instruments awarded, less what has been amortised to date. The minimum total value of the equity instruments awarded for future financial years is nil if relevant vesting conditions are not satisfied.
9. In respect of the 2023 EIS award, Ms O’Neill was granted Performance Rights and Restricted Shares on 24 April 2024 as approved by shareholders at the 2024 Woodside Annual General Meeting under Listing Rule 10.14. The grant of the Performance Rights and Restricted Shares components of Ms O’Neill’s 2024 EIS award is subject to shareholder approval at the 2025 Woodside Annual General Meeting. The grant date for Performance Rights and Restricted Shares is the date of shareholder approval, if obtained.
10. Ms McMahon ceased being an Executive KMP on 31 July 2024. The Board approved pro-rata vesting of Equity Rights awarded under the SWEP and accelerated vesting of Restricted Shares awarded under the EIS in prior years, effective upon termination of employment.
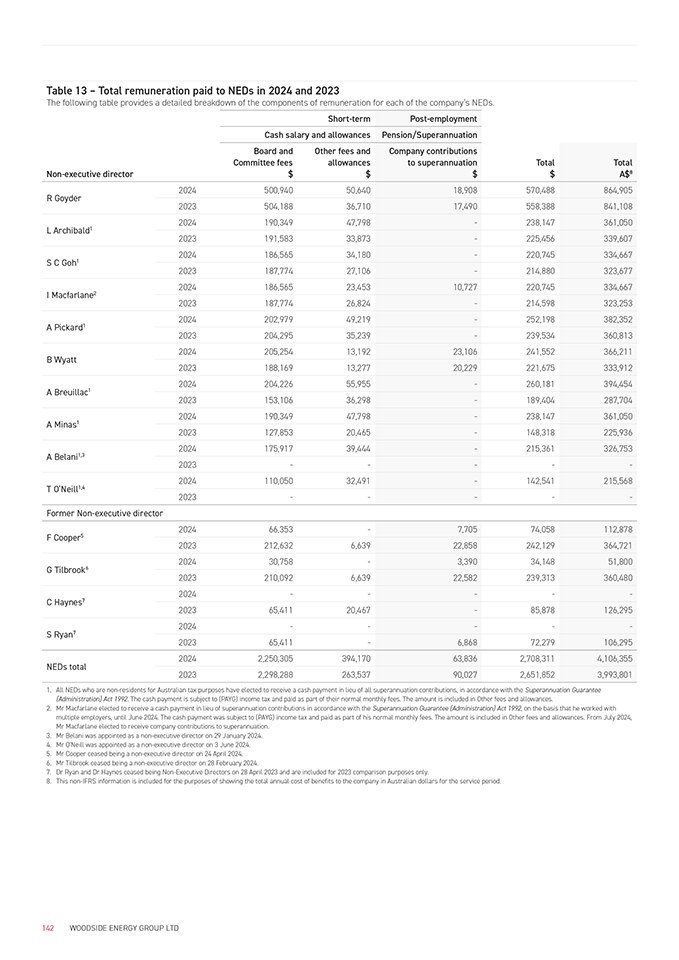
Table 13 – Total remuneration paid to NEDs in 2024 and 2023
The following table provides a detailed breakdown of the components of remuneration for each of the company’s NEDs.
Short-term Post-employment
Cash salary and allowances Pension/Superannuation
Non-executive director
Board and
Committee fees
$
Other fees and allowances
$
Company contributions to superannuation
$
Total
$
Total
A$8
R Goyder
L Archibald1
S C Goh1
I Macfarlane2
A Pickard1
B Wyatt
A Breuillac1
A Minas1
A Belani1,3
T O’Neill1,4
Former Non-executive director
2024 500,940 50,640 18,908 570,488 864,905
2023 504,188 36,710 17,490 558,388 841,108
2024 190,349 47,798—238,147 361,050
2023 191,583 33,873—225,456 339,607
2024 186,565 34,180—220,745 334,667
2023 187,774 27,106—214,880 323,677
2024 186,565 23,453 10,727 220,745 334,667
2023 187,774 26,824—214,598 323,253
2024 202,979 49,219—252,198 382,352
2023 204,295 35,239—239,534 360,813
2024 205,254 13,192 23,106 241,552 366,211
2023 188,169 13,277 20,229 221,675 333,912
2024 204,226 55,955—260,181 394,454
2023 153,106 36,298—189,404 287,704
2024 190,349 47,798—238,147 361,050
2023 127,853 20,465—148,318 225,936
2024 175,917 39,444—215,361 326,753
2023 — — -
2024 110,050 32,491—142,541 215,568
2023 — — -
F Cooper5 2024 66,353—7,705 74,058 112,878
2023 212,632 6,639 22,858 242,129 364,721
G Tilbrook6 2024 30,758—3,390 34,148 51,800
2023 210,092 6,639 22,582 239,313 360,480
C Haynes7 2024 — — -
2023 65,411 20,467—85,878 126,295
S Ryan7 2024 — — -
2023 65,411—6,868 72,279 106,295
NEDs total 2024 2,250,305 394,170 63,836 2,708,311 4,106,355
2023 2,298,288 263,537 90,027 2,651,852 3,993,801
1. All NEDs who are non-residents for Australian tax purposes have elected to receive a cash payment in lieu of all superannuation contributions, in accordance with the Superannuation Guarantee
(Administration) Act 1992. The cash payment is subject to (PAYG) income tax and paid as part of their normal monthly fees. The amount is included in Other fees and allowances.
2. Mr Macfarlane elected to receive a cash payment in lieu of superannuation contributions in accordance with the Superannuation Guarantee (Administration) Act 1992, on the basis that he worked with multiple employers, until June 2024. The cash payment was subject to (PAYG) income tax and paid as part of his normal monthly fees. The amount is included in Other fees and allowances. From July 2024, Mr Macfarlane elected to receive company contributions to superannuation.
3. Mr Belani was appointed as a non-executive director on 29 January 2024.
4. Mr O’Neill was appointed as a non-executive director on 3 June 2024.
5. Mr Cooper ceased being a non-executive director on 24 April 2024.
6. Mr Tilbrook ceased being a non-executive director on 28 February 2024.
7. Dr Ryan and Dr Haynes ceased being Non-Executive Directors on 28 April 2023 and are included for 2023 comparison purposes only.
8. This non-IFRS information is included for the purposes of showing the total annual cost of benefits to the company in Australian dollars for the service period.
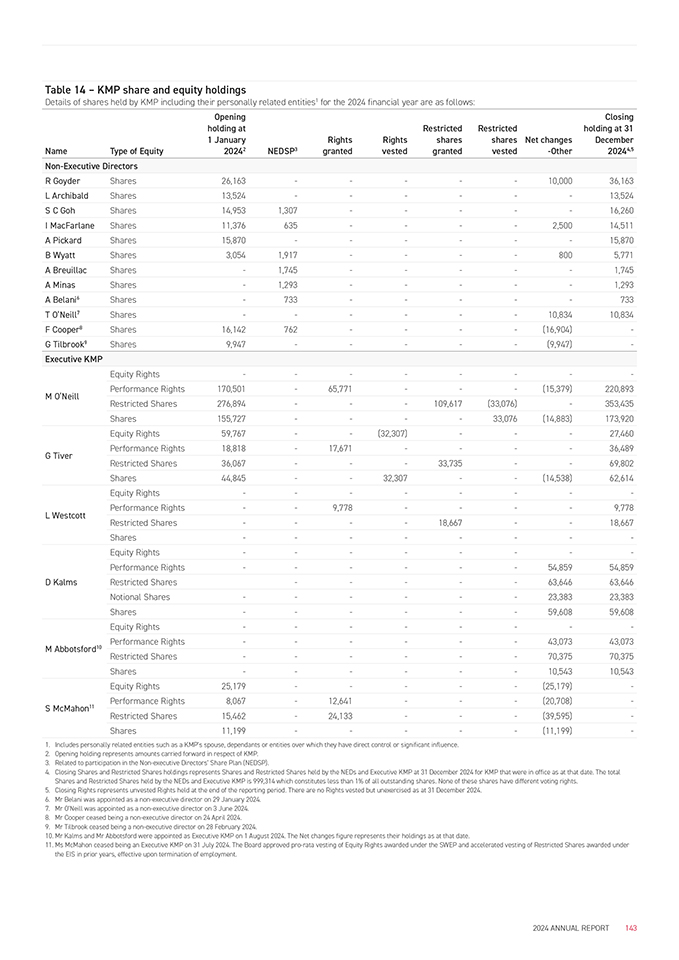
Table 14 – KMP share and equity holdings
Details of shares held by KMP including their personally related entities1 for the 2024 financial year are as follows:
Opening
Closing
Name Type of Equity
Non-Executive Directors
holding at
1 January
20242 NEDSP3
Rights granted
Rights vested
Restricted shares granted
Restricted shares vested
Net changes
-Other
holding at 31
December
20244,5
R Goyder Shares 26,163 — — — — — 10,000 36,163
L Archibald Shares 13,524 — — — — — — 13,524
S C Goh Shares 14,953 1,307 — — — — — 16,260
I MacFarlane Shares 11,376 635 — — — — 2,500 14,511
A Pickard Shares 15,870 — — — — — — 15,870
B Wyatt Shares 3,054 1,917 — — — — 800 5,771
A Breuillac Shares — 1,745 — — — — — 1,745
A Minas Shares — 1,293 — — — — — 1,293
A Belani6 Shares — 733 — — — — — 733
T O’Neill7 Shares — — — — — — 10,834 10,834
F Cooper8 Shares 16,142 762 — — — — (16,904) —G Tilbrook9 Shares 9,947 — — — — — (9,947) —Executive KMP
M O’Neill
G Tiver
L Westcott
D Kalms
Equity Rights — — — — — — — —Performance Rights 170,501 — 65,771 — — — (15,379) 220,893
Restricted Shares 276,894 — — — 109,617 (33,076) — 353,435
Shares 155,727 — — — — 33,076 (14,883) 173,920
Equity Rights 59,767 — — (32,307) — — — 27,460
Performance Rights 18,818 — 17,671 — — — — 36,489
Restricted Shares 36,067 — — — 33,735 — — 69,802
Shares 44,845 — — 32,307 — — (14,538) 62,614
Equity Rights — — — — — — — —Performance Rights — — 9,778 — — — — 9,778
Restricted Shares — — — — 18,667 — — 18,667
Shares — — — — — — — —Equity Rights — — — — — — — —Performance Rights — — — — — — 54,859 54,859
Restricted Shares — — — — — 63,646 63,646
Notional Shares — — — — — — 23,383 23,383
Shares — — — — — — 59,608 59,608
Equity Rights — — — — — — — —Performance Rights — — — — — — 43,073 43,073
M Abbotsford10
S McMahon11
1. Includes personally related entities such as a KMP’s spouse, dependants or entities over which they have direct control or significant influence.
2. Opening holding represents amounts carried forward in respect of KMP.
3. Related to participation in the Non-executive Directors’ Share Plan (NEDSP).
4. Closing Shares and Restricted Shares holdings represents Shares and Restricted Shares held by the NEDs and Executive KMP at 31 December 2024 for KMP that were in office as at that date. The total
Shares and Restricted Shares held by the NEDs and Executive KMP is 999,314 which constitutes less than 1% of all outstanding shares. None of these shares have different voting rights.
5. Closing Rights represents unvested Rights held at the end of the reporting period. There are no Rights vested but unexercised as at 31 December 2024.
6. Mr Belani was appointed as a non-executive director on 29 January 2024.
7. Mr O’Neill was appointed as a non-executive director on 3 June 2024.
8. Mr Cooper ceased being a non-executive director on 24 April 2024.
9. Mr Tilbrook ceased being a non-executive director on 28 February 2024.
10. Mr Kalms and Mr Abbotsford were appointed as Executive KMP on 1 August 2024. The Net changes figure represents their holdings as at that date.
11. Ms McMahon ceased being an Executive KMP on 31 July 2024. The Board approved pro-rata vesting of Equity Rights awarded under the SWEP and accelerated vesting of Restricted Shares awarded under the EIS in prior years, effective upon termination of employment.
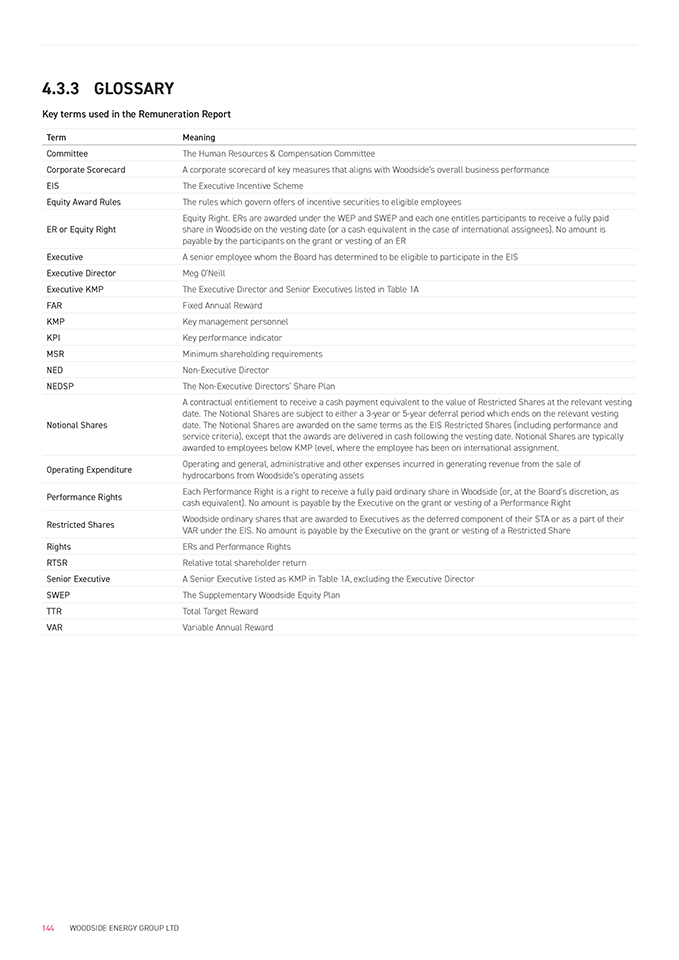
4.3.3 GLOSSARY
Key terms used in the Remuneration Report
Term Meaning
Committee The Human Resources & Compensation Committee
Corporate Scorecard A corporate scorecard of key measures that aligns with Woodside’s overall business performance
EIS The Executive Incentive Scheme
Equity Award Rules The rules which govern offers of incentive securities to eligible employees
Equity Right. ERs are awarded under the WEP and SWEP and each one entitles participants to receive a fully paid
ER or Equity Right
share in Woodside on the vesting date (or a cash equivalent in the case of international assignees). No amount is payable by the participants on the grant or vesting of an ER
Executive A senior employee whom the Board has determined to be eligible to participate in the EIS
Executive Director Meg O’Neill
Executive KMP The Executive Director and Senior Executives listed in Table 1A
FAR Fixed Annual Reward
KMP Key management personnel
KPI Key performance indicator
MSR Minimum shareholding requirements
NED Non-Executive Director
NEDSP The Non-Executive Directors’ Share Plan
A contractual entitlement to receive a cash payment equivalent to the value of Restricted Shares at the relevant vesting date. The Notional Shares are subject to either a 3-year or 5-year deferral period which ends on the relevant vesting
Notional Shares
date. The Notional Shares are awarded on the same terms as the EIS Restricted Shares (including performance and service criteria), except that the awards are delivered in cash following the vesting date. Notional Shares are typically awarded to employees below KMP level, where the employee has been on international assignment.
Operating Expenditure Operating and general, administrative and other expenses incurred in generating revenue from the sale of hydrocarbons from Woodside’s operating assets
Performance Rights Each Performance Right is a right to receive a fully paid ordinary share in Woodside (or, at the Board’s discretion, as cash equivalent). No amount is payable by the Executive on the grant or vesting of a Performance Right
Restricted Shares Woodside ordinary shares that are awarded to Executives as the deferred component of their STA or as a part of their
VAR under the EIS. No amount is payable by the Executive on the grant or vesting of a Restricted Share
Rights ERs and Performance Rights
RTSR Relative total shareholder return
Senior Executive A Senior Executive listed as KMP in Table 1A, excluding the Executive Director
SWEP The Supplementary Woodside Equity Plan
TTR Total Target Reward
VAR Variable Annual Reward
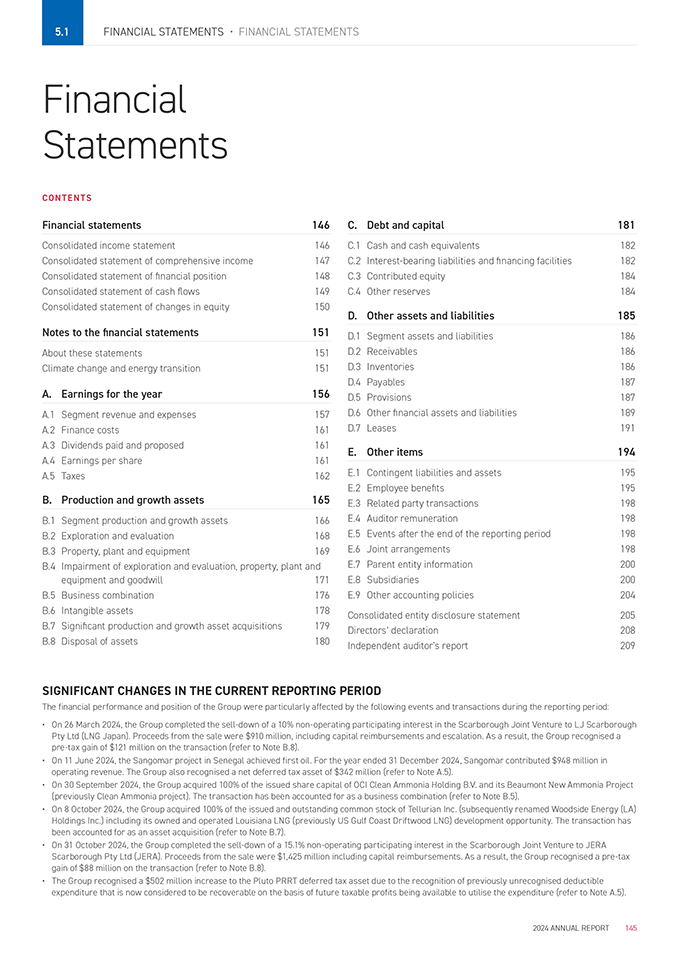
5.1
FINANCIAL STATEMENTS • FINANCIAL STATEMENTS
Financial
Statements
C ONTENTS
Financial statements 146
Consolidated income statement 146
Consolidated statement of comprehensive income 147
Consolidated statement of ?nancial position 148
Consolidated statement of cash flows 149
Consolidated statement of changes in equity 150
N otes to the financial statements 151
About these statements 151
Climate change and energy transition 151
A . Earnings for the year 156
A.1 Segment revenue and expenses 157
A.2 Finance costs 161
A.3 Dividends paid and proposed 161
A.4 Earnings per share 161
A.5 Taxes 162
B . Production and growth assets 165
B.1 Segment production and growth assets 166
B.2 Exploration and evaluation 168
B.3 Property, plant and equipment 169
B.4 Impairment of exploration and evaluation, property, plant and
C. Debt and capital 181
C.1 Cash and cash equivalents 182
C.2 Interest-bearing liabilities and ?nancing facilities 182
C.3 Contributed equity 184
C.4 Other reserves 184
D. Other assets and liabilities 185
D.1 Segment assets and liabilities 186
D.2 Receivables 186
D.3 Inventories 186
D.4 Payables 187
D.5 Provisions 187
D.6 Other ?nancial assets and liabilities 189
D.7 Leases 191
E. Other items 194
E.1 Contingent liabilities and assets 195
E.2 Employee bene?ts 195
E.3 Related party transactions 198
E.4 Auditor remuneration 198
E.5 Events after the end of the reporting period 198
E.6 Joint arrangements 198
E.7 Parent entity information 200
E.8 Subsidiaries 200
E.9 Other accounting policies 204
Consolidated entity disclosure statement 205
Directors’ declaration 208
Independent auditor’s report 209
SIGNIFICANT CHANGES IN THE CURRENT REPORTING PERIOD
The financial performance and position of the Group were particularly affected by the following events and transactions during the reporting period:
On 26 March 2024, the Group completed the sell-down of a 10% non-operating participating interest in the Scarborough Joint Venture to LJ Scarborough
Pty Ltd (LNG Japan). Proceeds from the sale were $910 million, including capital reimbursements and escalation. As a result, the Group recognised a pre-tax gain of $121 million on the transaction (refer to Note B.8).
On 11 June 2024, the Sangomar project in Senegal achieved first oil. For the year ended 31 December 2024, Sangomar contributed $948 million in operating revenue. The Group also recognised a net deferred tax asset of $342 million (refer to Note A.5).
On 30 September 2024, the Group acquired 100% of the issued share capital of OCI Clean Ammonia Holding B.V. and its Beaumont New Ammonia Project
(previously Clean Ammonia project). The transaction has been accounted for as a business combination (refer to Note B.5).
On 8 October 2024, the Group acquired 100% of the issued and outstanding common stock of Tellurian Inc. (subsequently renamed Woodside Energy (LA) Holdings Inc.) including its owned and operated Louisiana LNG (previously US Gulf Coast Driftwood LNG) development opportunity. The transaction has been accounted for as an asset acquisition (refer to Note B.7).
On 31 October 2024, the Group completed the sell-down of a 15.1% non-operating participating interest in the Scarborough Joint Venture to JERA Scarborough Pty Ltd (JERA). Proceeds from the sale were $1,425 million including capital reimbursements. As a result, the Group recognised a pre-tax gain of $88 million on the transaction (refer to Note B.8).
The Group recognised a $502 million increase to the Pluto PRRT deferred tax asset due to the recognition of previously unrecognised deductible expenditure that is now considered to be recoverable on the basis of future taxable profits being available to utilise the expenditure (refer to Note A.5).
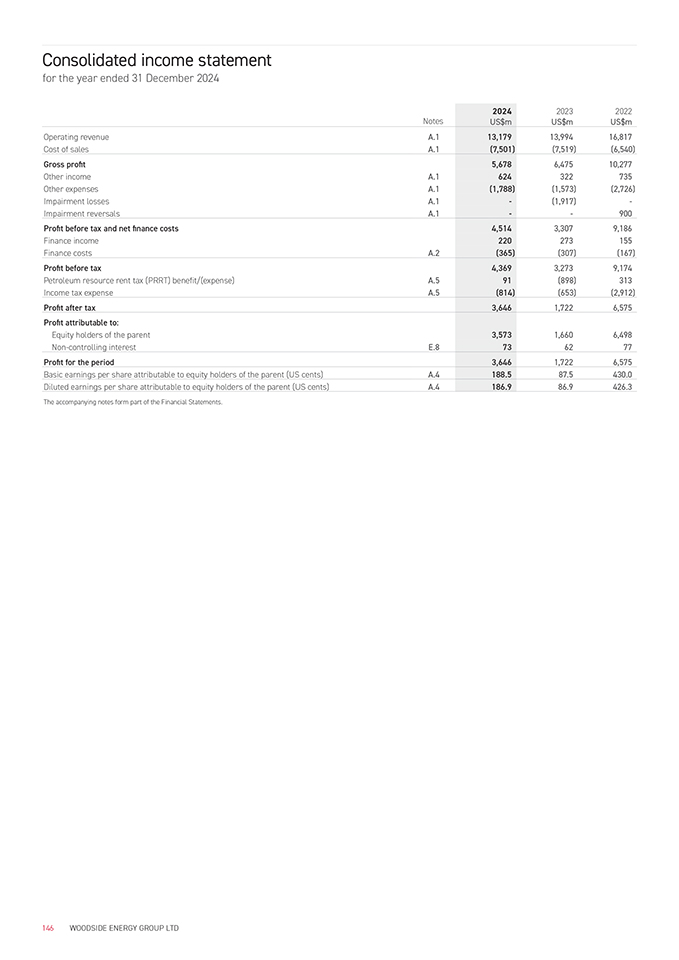
Consolidated income statement
for the year ended 31 December 2024
Notes 2024
US$m 2023 2022
US$m US$m
Operating revenue A.1
Cost of sales A.1 13,179 (7,501) 13,994 16,817 (7,519) (6,540)
Gross profit
Other income A.1
Other expenses A.1
Impairment losses A.1
Impairment reversals A.1 5,678
624 (1,788)
-
- 6,475 10,277
322 735 (1,573)(2,726) (1,917) -
- 900
Profit before tax and net finance costs
Finance income
Finance costs A.2 4,514
220 (365) 3,307 9,186
273 155 (307) (167)
Profit before tax
Petroleum resource rent tax (PRRT) benefit/(expense) A.5
Income tax expense A.5 4,369
91 (814) 3,273 9,174 (898) 313 (653)(2,912)
Profit after tax 3,646 1,722 6,575
Profit attributable to:
Equity holders of the parent
Non-controlling interest E.8
3,573
73
1,660 6,498
62 77
Profit for the period 3,646 1,722 6,575
Basic earnings per share attributable to equity holders of the parent (US cents) A.4 188.5 87.5 430.0
Diluted earnings per share attributable to equity holders of the parent (US cents) A.4 186.9 86.9 426.3
The accompanying notes form part of the Financial Statements.
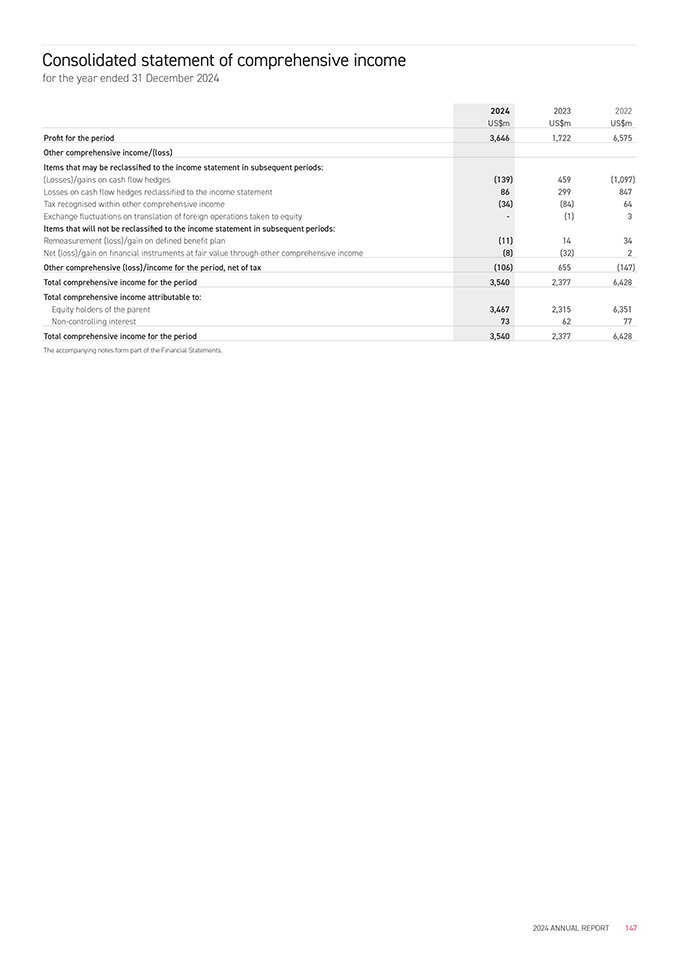
Consolidated statement of comprehensive income
for the year ended 31 December 2024
2024
US$m 2023 2022
US$m US$m
Profit for the period 3,646 1,722 6,575
Other comprehensive income/(loss)
Items that may be reclassified to the income statement in subsequent periods:
(Losses)/gains on cash flow hedges
Losses on cash flow hedges reclassified to the income statement
Tax recognised within other comprehensive income
Exchange fluctuations on translation of foreign operations taken to equity
Items that will not be reclassified to the income statement in subsequent periods:
Remeasurement (loss)/gain on defined benefit plan
Net (loss)/gain on financial instruments at fair value through other comprehensive income
(139)
86 (34)
-
(11) (8)
459(1,097)
299 847 (84) 64 (1) 3
14 34 (32) 2
Other comprehensive (loss)/income for the period, net of tax(106) 655(147)
Total comprehensive income for the period 3,540 2,377 6,428
Total comprehensive income attributable to:
Equity holders of the parent
Non-controlling interest
3,467
73
2,315 6,351
62 77
Total comprehensive income for the period 3,540 2,377 6,428
The accompanying notes form part of the Financial Statements.
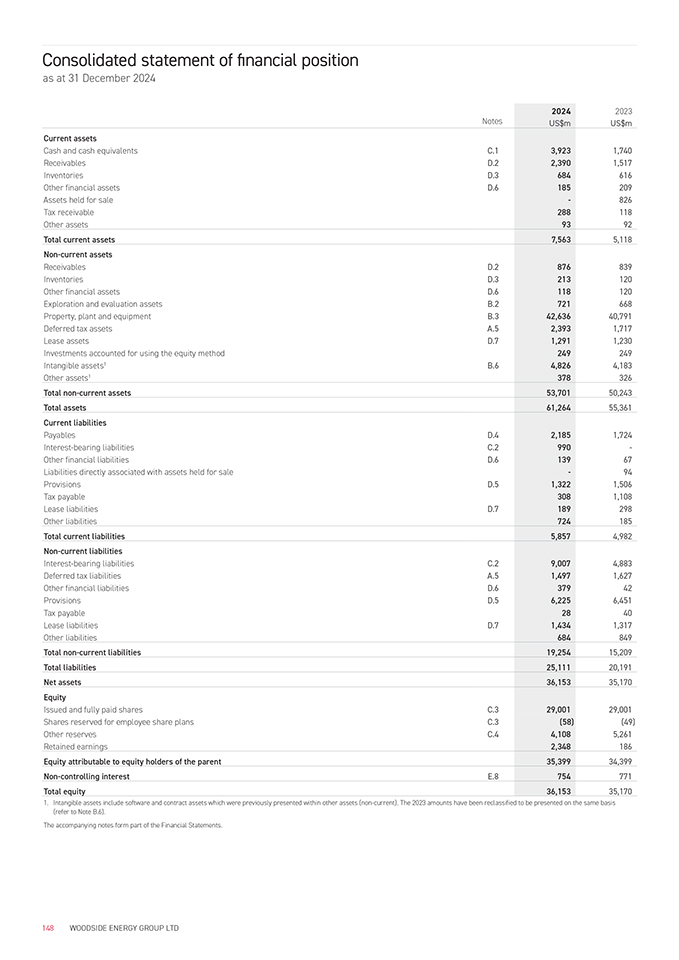
Consolidated statement of financial position
as at 31 December 2024
Notes 2024
US$m 2023
US$m
Current assets
Cash and cash equivalents C.1
Receivables D.2
Inventories D.3
Other financial assets D.6
Assets held for sale
Tax receivable
Other assets
3,923
2,390
684
185
-
288
93
1,740
1,517
616
209
826
118
92
Total current assets 7,563 5,118
Non-current assets
Receivables D.2
Inventories D.3
Other financial assets D.6
Exploration and evaluation assets B.2
Property, plant and equipment B.3
Deferred tax assets A.5
Lease assets D.7
Investments accounted for using the equity method
Intangible assets1 B.6
Other assets1
876
213
118
721
42,636
2,393
1,291
249
4,826
378
839
120
120
668
40,791
1,717
1,230
249
4,183
326
Total non-current assets 53,701 50,243
Total assets 61,264 55,361
Current liabilities
Payables D.4
Interest-bearing liabilities C.2
Other financial liabilities D.6
Liabilities directly associated with assets held for sale
Provisions D.5
Tax payable
Lease liabilities D.7
Other liabilities
2,185
990
139
-
1,322
308
189
724
1,724
-
67
94
1,506
1,108
298
185
Total current liabilities 5,857 4,982
Non-current liabilities
Interest-bearing liabilities C.2
Deferred tax liabilities A.5
Other financial liabilities D.6
Provisions D.5
Tax payable
Lease liabilities D.7
Other liabilities
9,007
1,497
379
6,225
28
1,434
684
4,883
1,627
42
6,451
40
1,317
849
Total non-current liabilities 19,254 15,209
Total liabilities 25,111 20,191
Net assets 36,153 35,170
Equity
Issued and fully paid shares C.3
Shares reserved for employee share plans C.3
Other reserves C.4
Retained earnings
29,001 (58)
4,108
2,348
29,001 (49)
5,261
186
Equity attributable to equity holders of the parent 35,399 34,399
Non-controlling interest E.8 754 771
Total equity 36,153 35,170
1. Intangible assets include software and contract assets which were previously presented within other assets (non-current). The 2023 amounts have been reclassified to be presented on the same basis
(refer to Note B.6).
The accompanying notes form part of the Financial Statements.
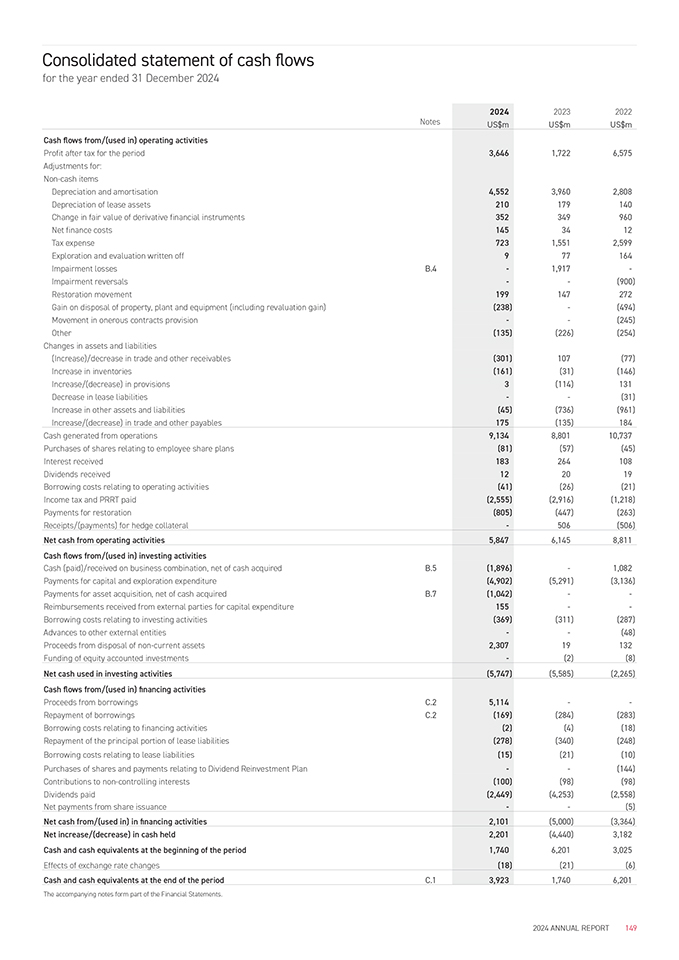
Consolidated statement of cash flows
for the year ended 31 December 2024
Notes 2024
US$m 2023 2022
US$m US$m
Cash flows from/(used in) operating activities
Profit after tax for the period
Adjustments for: Non-cash items
Depreciation and amortisation
Depreciation of lease assets
Change in fair value of derivative financial instruments
Net finance costs
Tax expense
Exploration and evaluation written off
Impairment losses B.4
Impairment reversals
Restoration movement
Gain on disposal of property, plant and equipment (including revaluation gain) Movement in onerous contracts provision
Other
Changes in assets and liabilities
(Increase)/decrease in trade and other receivables
Increase in inventories Increase/(decrease) in provisions Decrease in lease liabilities
Increase in other assets and liabilities
Increase/(decrease) in trade and other payables
3,646
4,552
210
352
145
723
9
-
-
199 (238)
- (135)
(301) (161)
3
- (45)
175
1,722 6,575
3,960 2,808
179 140
349 960
34 12
1,551 2,599
77 164
1,917 -
-(900)
147 272
-(494)
-(245) (226)(254)
107 (77) (31) (146) (114) 131
- (31) (736)(961)
(135) 184
Cash generated from operations
Purchases of shares relating to employee share plans
Interest received
Dividends received
Borrowing costs relating to operating activities
Income tax and PRRT paid Payments for restoration Receipts/(payments) for hedge collateral 9,134 (81)
183
12 (41)
(2,555) (805)
- 8,801 10,737 (57)(45)
264 108
20 19 (26)(21)
(2,916)(1,218) (447)(263)
506(506)
Net cash from operating activities 5,847 6,145 8,811
Cash flows from/(used in) investing activities
Cash (paid)/received on business combination, net of cash acquired B.5
Payments for capital and exploration expenditure
Payments for asset acquisition, net of cash acquired B.7
Reimbursements received from external parties for capital expenditure
Borrowing costs relating to investing activities
Advances to other external entities
Proceeds from disposal of non-current assets
Funding of equity accounted investments
(1,896) (4,902) (1,042)
155 (369)
-
2,307
-
— 1,082 (5,291)(3,136)
—
— (311)(287)
-(48)
19 132 (2) (8)
Net cash used in investing activities
(5,747)
(5,585)(2,265)
Cash flows from/(used in) financing activities
Proceeds from borrowings C.2
Repayment of borrowings C.2
Borrowing costs relating to financing activities Repayment of the principal portion of lease liabilities Borrowing costs relating to lease liabilities
Purchases of shares and payments relating to Dividend Reinvestment Plan
Contributions to non-controlling interests
Dividends paid
Net payments from share issuance
5,114 (169)
(2) (278) (15)
- (100)
(2,449)
-
— (284)(283)
(4)(18) (340)(248) (21)(10)
- (144) (98)(98) (4,253)(2,558)
-(5)
Net cash from/(used in) in financing activities 2,101(5,000)(3,364)
Net increase/(decrease) in cash held
Cash and cash equivalents at the beginning of the period
Effects of exchange rate changes 2,201
1,740 (18)(4,440) 3,182
6,201 3,025 (21)(6)
Cash and cash equivalents at the end of the period C.1 3,923 1,740 6,201
The accompanying notes form part of the Financial Statements.
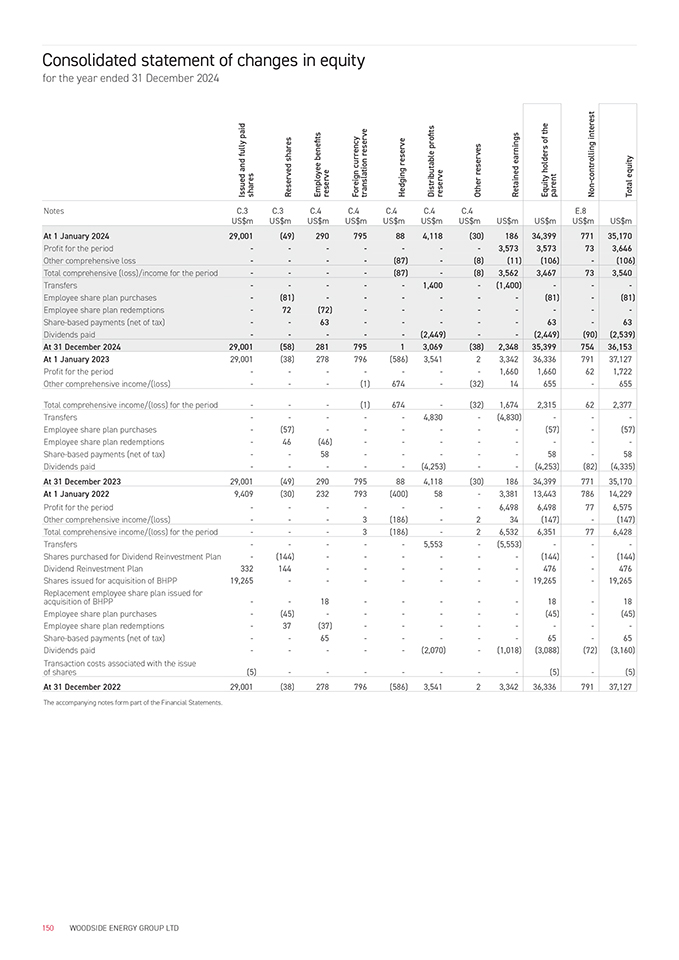
Consolidated statement of changes in equity
for the year ended 31 December 2024
Notes C.3 C.3 C.4 C.4 C.4 C.4 C.4 E.8
US$m US$m US$m US$m US$m US$m US$m US$m US$m US$m US$m
At 1 January 2024 29,001(49) 290 795 88 4,118(30) 186 34,399 771 35,170
Profit for the period — — ——3,573 3,573 73 3,646
Other comprehensive loss — —(87) -(8)(11)(106) -(106)
Total comprehensive (loss)/income for the period — —(87) -(8) 3,562 3,467 73 3,540
Transfers — ——1,400 -(1,400) ——Employee share plan purchases -(81) — — —(81) -(81) Employee share plan redemptions— 72(72) — — — — Share-based payments (net of tax) — 63 — —— 63— 63
Dividends paid — — -(2,449) — (2,449)(90) (2,539) At 31 December 2024 29,001(58) 281 795 1 3,069(38) 2,348 35,399 754 36,153
At 1 January 2023 29,001(38) 278 796(586) 3,541 2 3,342 36,336 791 37,127
Profit for the period — — ——1,660 1,660 62 1,722
Other comprehensive income/(loss) — -(1) 674 -(32) 14 655—655
Total comprehensive income/(loss) for the period — -(1) 674 -(32) 1,674 2,315 62 2,377
Transfers — ——4,830 -(4,830) ——Employee share plan purchases -(57) — — —(57) -(57) Employee share plan redemptions— 46(46) — — — — Share-based payments (net of tax) — 58 — —— 58— 58
Dividends paid — — -(4,253) —(4,253)(82)(4,335)
At 31 December 2023 29,001(49) 290 795 88 4,118(30) 186 34,399 771 35,170
At 1 January 2022 9,409(30) 232 793(400) 58—3,381 13,443 786 14,229
Profit for the period — — ——6,498 6,498 77 6,575
Other comprehensive income/(loss) ——3(186)—2 34(147) -(147)
Total comprehensive income/(loss) for the period ——3(186)—2 6,532 6,351 77 6,428
Transfers — ——5,553 -(5,553) ——Shares purchased for Dividend Reinvestment Plan -(144) — — —(144) -(144) Dividend Reinvestment Plan 332 144 — — — 476—476
Shares issued for acquisition of BHPP 19,265 — — ——19,265—19,265
Replacement employee share plan issued for
acquisition of BHPP — 18 — ——18—18
Employee share plan purchases -(45) — — —(45) -(45) Employee share plan redemptions— 37(37) — — — — Share-based payments (net of tax) — 65 — —— 65— 65
Dividends paid — — -(2,070) -(1,018)(3,088)(72)(3,160)
Transaction costs associated with the issue
of shares(5) — — — -(5) -(5)
At 31 December 2022 29,001(38) 278 796(586) 3,541 2 3,342 36,336 791 37,127
The accompanying notes form part of the Financial Statements.
Notes to the financial statements Notes to the financial statements for the year ended 31 December 2024 ABOUT THESE STATEMENTS Woodside Energy Group Ltd and its controlled entities (Woodside or the Group) is a for-profit entity limited by shares, incorporated and domiciled in Australia. Its shares are publicly traded on the Australian Securities Exchange (ASX) and on the New York Stock Exchange (NYSE) (in the form of Woodside American Depositary Shares). On 19 November 2024, the Group delisted its shares from the Main Market for listed securities of the London Stock Exchange (LSE). The nature of the operations and the principal activities of the Group are described in the Directors’ Report and in the segment information in Note A.1. The financial statements were authorised for issue in accordance with a resolution of the Directors on 25 February 2025. Statement of compliance The financial statements are general purpose financial statements, which have been prepared in accordance with the requirements of the Corporations Act 2001, Australian Accounting Standards and other authoritative pronouncements of the Australian Accounting Standards Board (AASB). The financial statements comply with International Financial Reporting Standards (IFRS) as issued by the International Accounting Standards Board. They also include additional disclosures required for foreign registrants by the United States Securities and Exchange Commission (US SEC). The Group’s accounting policies are materially consistent with those disclosed in the Group’s 2023 Financial Statements. Adoption of new or amended standards and interpretations effective 1 January 2024 did not result in any significant changes to the Group’s accounting policies. Estimates have been revised, where required, to reflect current market conditions including the impact of climate change. Updated assumptions used for impairment assessments and restoration are disclosed in Notes B.4 and D.5 respectively; these assumptions could change in the future. New estimates and judgements relating to a business combination and asset acquisition are disclosed in Notes B.5 and B.7 respectively. Currency The functional and presentation currency of Woodside and all its material subsidiaries is the US dollar. Transactions in foreign currencies are initially recorded in the functional currency of the transacting entity at the exchange rates ruling at the date of transaction. Monetary assets and liabilities denominated in foreign currencies at the reporting date are translated at the rates of exchange ruling at that date. Exchange differences in the consolidated financial statements are taken to the income statement. Rounding of amounts The amounts contained in these financial statements have been rounded to the nearest million dollars under the option available to the Group under Australian Securities and Investments Commission (ASIC) Corporations (Rounding in Financial/Directors’ Reports) Instrument 2016/191, unless otherwise stated. Basis of preparation The financial statements have been prepared on a historical cost basis, except for derivative financial instruments and certain other financial assets and financial liabilities, which have been measured at fair value or amortised cost adjusted for changes in fair value attributable to the risks that are being hedged in effective hedge relationships. Where not carried at fair value, if the carrying value of financial assets and financial liabilities does not approximate their fair value, the fair value has been included in the notes to the financial statements. Subsidiaries are fully consolidated from the date on which control is obtained by the Group and cease to be consolidated from the date at which the Group ceases to have control. The financial statements comprise the financial position and results of the Group as at and for the year ended 31 December 2024 (refer to Note E.8). The material subsidiaries of the Group apply the same reporting period and accounting policies as the parent company in their financial statements. All intercompany balances and transactions, including unrealised profits and losses arising from intra-group transactions, have been eliminated in full. Non-controlling interests are allocated their share of the net profit after tax in the consolidated income statement and their share of other comprehensive income net of tax in the consolidated statement of comprehensive income, and are presented within equity in the consolidated statement of financial position, separately from parent shareholders’ equity. The consolidated financial statements provide comparative information in respect of the previous periods. Where required, a reclassification of items in the financial statements of the previous periods has been made in accordance with the classification of items in the financial statements of the current period. CLIMATE CHANGE AND ENERGY TRANSITION Climate considerations Woodside’s global portfolio includes oil, gas and new energy assets across Australia, the United States, Trinidad and Tobago, Senegal, Mexico, Timor-Leste and Canada. Woodside has considered the impact of climate and the energy transition in assessing the carrying values of its assets and liabilities. This note describes climate-related assumptions that underpin key areas of the financial statements and the potential short-term and long-term impacts differing scenarios could have on the financial results and financial position of Woodside. 2024 ANNUAL REPORT 151
Notes to the financial statements for the year ended 31 December 2024 CLIMATE CHANGE AND ENERGY TRANSITION (CONT.) Financial planning and assumptions Woodside considers a range of climate and macroeconomic scenarios to help benchmark our long-term price assumptions and inform our decision making to maintain a resilient financial position. These scenarios are informed by a wide range of externally published data, including Paris-aligned and non-Paris-aligned outcomes, and are part of a broad consideration of risks, opportunities, competitiveness and resilience. The assumptions applied in assessing amounts within the financial statements require significant judgement and are in each case calculated in accordance with the requirements of the applicable accounting standards. Our long-term price assumptions reflect management’s current ‘best estimate’ scenario in which global governments pursue decarbonisation goals as well as other goals such as energy security and economic development. Price assumptions consider current legislation in the locations where Woodside operates and place some weight on scenarios in which the transition to a lower carbon energy system is sufficiently rapid to meet the goals of the Paris Agreement, as well as scenarios in which the transition is not, or may not be, sufficiently rapid. They also place some weight on a range of other assumptions which can drive prices (e.g. inflation) and which are not related to the Paris goals. Woodside’s oil and gas facilities are subject to physical risks such as metocean conditions and are located in regions that experience tropical cyclones, hurricanes and high ambient temperatures. Woodside has significant experience designing and operating facilities located in harsh environments. Physical risks could also impact emerging new business in the new energy products and lower carbon services such as bushfire or drought risk for nature-based carbon origination projects, or access to water for use in electrolysis for hydrogen. The high degree of uncertainty around the nature, timing and magnitude of climate-related risks, and the uncertainty as to how the energy transition will evolve, makes it difficult to determine the risks and their potential impacts with precision. Woodside continues to monitor the uncertainty around climate change risks and expects to take into account ongoing developments into its assumptions, including assumptions concerning commodity and carbon pricing, as considered appropriate. Investment cases include a carbon price assumption which takes into consideration uncertainty around the impact of climate change. Commodity pricing assumptions are key value drivers with greater significance to assets and liabilities than carbon pricing. Impairment of exploration and evaluation, property, plant and equipment and goodwill In accordance with the Group’s accounting policies and applicable accounting standards, elements of Woodside’s financial statements are based on reasonable and supportable assumptions that represent management’s current best estimate of the range of economic conditions that may exist in the foreseeable future. The estimation of recoverable amounts for impairment testing includes estimating what an independent market participant would pay to acquire the asset as at the reporting date. Market participants will be guided by their own views on future economic and technical conditions and therefore Woodside considers a range of data sources in determining a future price forecast, including industry and market benchmarks along with asset sales transaction data to support the recoverable amount. The completion of the sale of the 10% and 15.1% non-operating participating interest in the Scarborough Joint Venture to LNG Japan and JERA respectively in 2024, is a clear example of an independent market valuation fully supporting the carrying value of the multi-decade asset. Price forecasts are adjusted for premiums and discounts based on the nature and quality of the product. Commodity oil price estimates have considered the impacts of climate policies along with other factors such as industry investment and cost trends. There remains significant uncertainty around how society will respond to the climate challenge. The energy transition is expected to bring volatility and there is uncertainty as to how commodity prices will develop. The IEA’s World Energy Outlook 2024 (WEO) explores three main climate change scenarios. The IEA scenarios are not predictions and the IEA does not have a single view on the future of the energy system. There is significant uncertainty as to whether any of these scenarios will eventuate. As Woodside considers what a market participant would pay to acquire an asset in assessing impairments, these external scenarios are not necessarily consistent with the pricing assumptions used for the Group’s impairment assessment as disclosed in Table A below and Note B.4. 152 WOODSIDE ENERGY GROUP LTD
Notes to the financial statements for the year ended 31 December 2024 CLIMATE CHANGE AND ENERGY TRANSITION (CONT.) Impairment of exploration and evaluation, property, plant and equipment and goodwill (cont.) The WEO explores three main scenarios¹: • The Net Zero Emissions by 2050 Scenario (NZE) • The Announced Pledges Scenario (APS) •The Stated Policies Scenario (STEPS) Table A: Average real terms 2024 oil price (US$/bbl, Brent)2, North Asian LNG price (US$/MMBtu)2 and carbon price (US$/tCO2-e)3 consistent with IEA dataset compared against Woodside’s assumptions: Average Brent2025-20292030-20342035-2040 (RT US$/bbl) NZE524032 APS767267 STEPS828180 Woodside787878 Average North Asian LNG2025-20292030-20342035-2040 (RT US$/MMBtu) NZE655 APS876 STEPS989 Woodside101011 Average Carbon2025-20292030-20342035-2040 (RT US$/tonne) NZE112161199 APS110150173 STEPS808080 Woodside808080 1.IEA 2024. ‘World Energy Outlook 2024’. All rights reserved. 2.Based on data from IEA 2024. ‘World Energy Outlook 2024’ as modified by Woodside analysis. Woodside used interpolation techniques to estimate Brent annual price points in between the years that the IEA disclose prices for. For gas pricing assumptions all non-contracted LNG volumes were assessed at IEA’s Japan import price, as a proxy for North Asian LNG spot price. Woodside used interpolation techniques to estimate annual gas price points in between the years that the IEA disclose prices for. For oil linked LNG contracts, prices are derived from the Brent forecasts and the terms of the contracts. 3.Based on data from IEA 2024. ‘World Energy Outlook 2024’ as modified by Woodside analysis. The IEA only provide carbon prices from 2030 onwards. As a result, Woodside used a starting point of US$80/tCO2-e consistent with internal carbon pricing. Woodside used the 2024 starting price point and the IEA’s published 2030, 2035 and 2040 carbon prices for each scenario to interpolate annual price points through to 2040. Woodside’s assumptions for Brent and JKM sit within the range of various external scenarios, including but not limited to NZE, APS and STEPS, considered by management. These include scenarios consistent with the temperature goals of the Paris climate change agreement as well as industry outlooks. The benchmarked pricing above has limitations and is based on a wide range of assumptions. The impact of the benchmark pricing assumptions may be addressed to varying degrees by decisions Woodside could make in response such as acquisitions, divestments or cost reductions as well as other consequential changes. The scenarios must therefore not be interpreted as Woodside’s investment guidance. These are scenarios, not forecasts, and no likelihood or probability is assigned to any of these scenarios eventuating. Impact on remaining life of assets Oil and gas properties, included within property, plant and equipment, are depreciated using the unit of production basis over either proved or proved plus probable reserves. The energy transition may result in changes to the expected useful life of oil and gas properties and economically recoverable reserves and resources thereby accelerating depreciation charges or resulting in an impairment. New energy assets under development still require significant capital expenditure. The Group will review depreciation methodology and useful life of new energy assets as they are brought into use. Carbon credits Woodside utilises certified carbon credits to offset equity Scope 1 and 2 emissions that are above our targets in a given year, after design out and operate out measures have been taken. The Group’s portfolio of carbon credits enables our base business to manage the price risk associated with regulations and our corporate net equity Scope 1 and 2 emissions targets. The Group has available carbon credits that can be used in the short and medium term for emissions which are otherwise not technically or economically viable to avoid or reduce. One carbon credit is intended to represent a tonne of emissions avoided, reduced or removed outside of our facilities. As at 31 December 2024, the Group recognised $202 million (2023: $123 million) of carbon credits within inventory. Restoration and other provisions The energy transition may result in restoration activities occurring earlier than expected. 53% (2023: 55%) of the Group’s non-current restoration liabilities are expected to be settled more than 10 years in the future. Restoration cost estimates require judgemental assumptions regarding removal date, environmental legislation and regulations and the extent of restoration activities required. These cost estimates may change in the future, as a result of increased regulatory scrutiny and the energy transition. This includes the demand and related costs for offshore services which can be influenced by renewable energy construction. Woodside continues to monitor the uncertainty around climate change risks to assess if additional changes to restoration provisions should be recognised. Refer to Note D.5 for further details. Long-term contracts Climate risks may impact underlying assumptions used to assess the forecast cash flows of long-term contracts. These judgemental assumptions include pricing forecast and discount rate adjustments based on the nature of the product. As at 31 December 2024, the Corpus Christi contract has a positive value and therefore is not currently onerous (2023: not onerous). This and other contractual arrangements could be impacted by adverse market conditions arising from climate-related factors. Given the uncertainty in climate events, Woodside continues to review the forecast cash flows of long-term contracts. 2024 ANNUAL REPORT153
Notes to the financial statements for the year ended 31 December 2024 CLIMATE CHANGE AND ENERGY TRANSITION (CONT.) Deferred tax assets The Group has determined that it is probable that sufficient future taxable income will be available to utilise the deferred tax assets relating to carry forward unused tax losses and credits recognised as at 31 December 2024. The recoverability of deferred tax assets is dependent on the Group’s future taxable income which can be impacted by the uncertainty of commodity and carbon pricing. Regulatory environment Regulation of climate-related emissions can change over time. Woodside is not currently aware of any specific proposal that would materially affect the information in these financial statements. Woodside continues to monitor the development of global sustainability standards relevant to our activities around the world to ensure compliance. This includes the Australian Sustainability Reporting Standards issued by the Australian Accounting Standards Board (AASB) climate standard (AASB S2) and sustainability standard (AASB S1), the US SEC climate rules, the International Financial Reporting Standards (IFRS) Foundation’s International Sustainability Standards Board (ISSB) standards relevant to sustainability and climate related disclosures and the European Corporate Sustainability Reporting Directive and associated European Sustainability Reporting Standards including the Corporate Sustainability Due Diligence Directive. 154 WOODSIDE ENERGY GROUP LTD
Notes to the financial statements for the year ended 31 December 2024 Financial and capital risk management The Board of Directors has overall responsibility for the establishment and oversight of the Group’s risk management framework, including review and approval of the Group’s risk management strategy, policy and key risk parameters. The Board of Directors and the Audit and Risk Committee have oversight of the Group’s internal control system and risk management process, including oversight of the internal audit function. The Group’s management of financial and capital risks is aimed at ensuring that available capital, funding and cash flows are sufficient to: • meet the Group’s financial commitments as and when they fall due; • maintain the capacity to fund its committed project developments; •pay a reasonable dividend; and •maintain a long-term credit rating of not less than investment grade. The Group monitors and tests its forecast financial position against these criteria and, in general, will undertake hedging activity when necessary to ensure that these objectives are achieved. Other circumstances that may lead to hedging include the management of exposures relating to trading activities. Group Treasury policy does not permit speculative trading in financial derivatives. Refer to Section 3.9 – Risk factors for more information on the Group’s objectives, policies and processes for managing financial risk. The below risks arise in the normal course of the Group’s business. Risk information can be found in the following sections: Section ACommodity price risk managementPage 156 Section AForeign exchange risk managementPage 156 Section C Capital risk managementPage 181 Section C Liquidity risk managementPage 181 Section C Interest rate risk managementPage 181 Section DCredit risk managementPage 185 Key estimates and judgements In applying the Group’s accounting policies, management regularly evaluates judgements, estimates and assumptions based on experience and other factors, including expectations of future events that may have an impact on the Group. All judgements, estimates and assumptions made are believed to be reasonable based on the most current set of circumstances known to management, and actual results may differ. Significant judgements, estimates and assumptions made by management in the preparation of these financial statements are found in the following notes: Note A.1Segment revenue and expensesPage 157 Note A.5TaxesPage 162 Note B.2Exploration and evaluationPage 168 Note B.3Property, plant and equipmentPage 169 Note B.4Impairment of exploration and evaluation,Page 171 property, plant and equipment and goodwill Note B.5Business combinationPage 176 Note B.6Intangible assetsPage 178 Note B.7Significant production and growth assetPage 179 acquisitions Note D.5ProvisionsPage 187 Note D.6Other financial assets and liabilitiesPage 189 Note D.7LeasesPage 191 Note E.6Joint arrangementsPage 198 2024 ANNUAL REPORT155
Notes to the financial statements for the year ended 31 December 2024 A. Earnings for the year IN THIS SECTION This section addresses financial performance of the Group for the reporting period including, where applicable, the accounting policies applied and the key estimates and judgements made. This section also includes the tax position of the Group for and at the end of the reporting period. A. Earnings for the year A.1Segment revenue and expensesPage 157 A.2Finance costsPage 161 A.3Dividends paid and proposedPage 161 A.4Earnings per sharePage 161 A.5TaxesPage 162 KEY FINANCIAL AND CAPITAL RISKS IN THIS SECTION Commodity price risk management The Group’s revenue is exposed to commodity price fluctuations through the sale of hydrocarbons. Commodity price risks are measured by monitoring and stress testing the Group’s forecast financial position to sustained periods of low commodity prices. This analysis is regularly performed on the Group’s portfolio and as required for discrete projects and transactions. The Group’s management of commodity price risk includes the use of commodity derivatives to hedge its exposure (refer to Note D.6). The hedged exposure includes oil-linked revenue related to produced volumes and revenues derived from trading operations. Commodity derivatives protect the Group against downside price risk within its corporate and trading portfolios. As at the reporting date, the Group held commodity hedging financial instruments with a net asset carrying value of $27 million (2023: $123 million net asset) exposed to commodity price risk. An increase in relevant commodity prices of 10% would decrease the instruments’ carrying value by $239 million, the effect of which would be recognised within reserves and/or the income statement in accordance with hedge accounting application. A 10% decrease would have the same but opposite effect. This analysis assumes that all other variables remain constant (including the price on underlying physical exposures). Foreign exchange risk management Foreign exchange risk arises from future commitments, financial assets and financial liabilities that are not denominated in US dollars. The majority of the Group’s revenue is denominated in US dollars. The Group is exposed to foreign currency risk arising from operating and capital expenditure incurred in currencies other than US dollars, particularly Australian dollars. The Group’s management of foreign exchange risk relating to capital expenditure includes the use of forward exchange contract derivatives to hedge its exposure (refer to Note D.6). The Group entered into foreign exchange forward contracts to fix the Australian dollar to US dollar exchange rate in relation to a portion of the Australian dollar denominated capital expenditure incurred or expected to be incurred under the Scarborough development (refer to Note D.6). Through the use of foreign exchange forward contracts, the Group also hedged its Australian dollar to US dollar exchange rate exposure in relation to the Australian dollar denominated tax and dividend payments. As at the reporting date, the Group held hedging foreign currency financial instruments with a net liability carrying value of $45 million (2023: net asset carrying value of $8 million) exposed to foreign exchange risk. Measuring the exposure to foreign exchange risk is achieved by regularly monitoring and performing sensitivity analysis on the Group’s financial position. A reasonably possible change in the exchange rate of the US dollar to the Australian dollar (+10%/-10% (2023: +12%/-12%)), with all other variables held constant, would not have a material impact on the Group’s equity or the income statement. Refer to Notes C1, C2, D2, D4 and D7 for details of the denominations of cash and cash equivalents, interest-bearing liabilities, receivables, payables and lease liabilities held at 31 December 2024. 156WOODSIDE ENERGY GROUP LTD
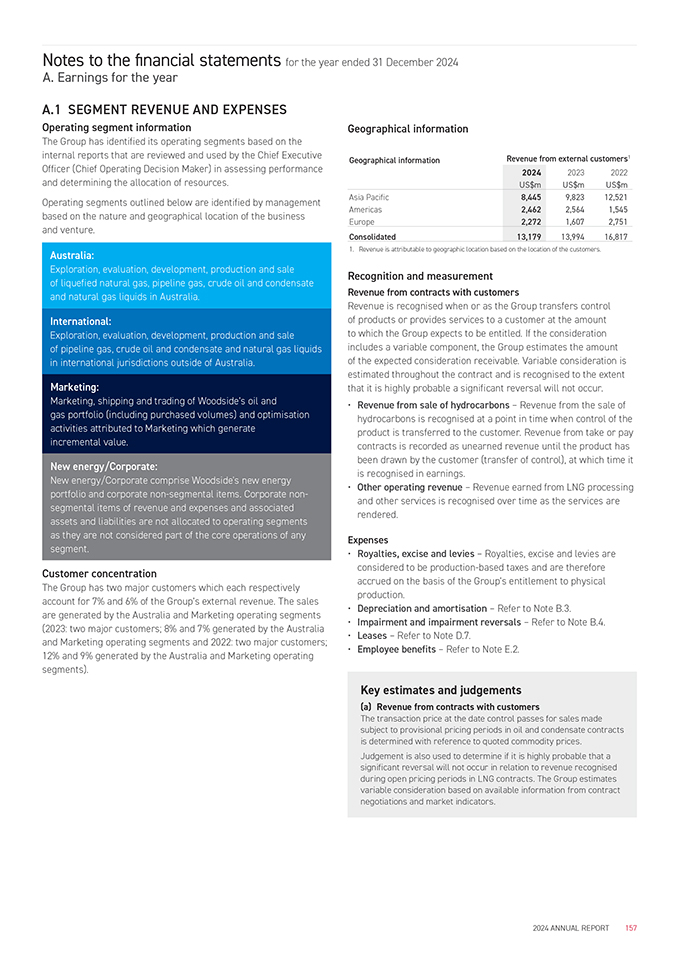
Notes to the financial statements for the year ended 31 December 2024 A. Earnings for the year A.1 SEGMENT REVENUE AND EXPENSES Operating segment information The Group has identified its operating segments based on the internal reports that are reviewed and used by the Chief Executive Officer (Chief Operating Decision Maker) in assessing performance and determining the allocation of resources. Operating segments outlined below are identified by management based on the nature and geographical location of the business and venture. Geographical information Geographical information Revenue from external customers1 202420232022 US$mUS$mUS$m Asia Pacific8,4459,82312,521 Americas2,4622,5641,545 Europe2,2721,6072,751 Consolidated13,17913,99416,817 Australia: Exploration, evaluation, development, production and sale of liquefied natural gas, pipeline gas, crude oil and condensate and natural gas liquids in Australia. International: Exploration, evaluation, development, production and sale of pipeline gas, crude oil and condensate and natural gas liquids in international jurisdictions outside of Australia. Marketing: Marketing, shipping and trading of Woodside’s oil and gas portfolio (including purchased volumes) and optimisation activities attributed to Marketing which generate incremental value. New energy/Corporate: New energy/Corporate comprise Woodside’s new energy portfolio and corporate non-segmental items. Corporate non-segmental items of revenue and expenses and associated assets and liabilities are not allocated to operating segments as they are not considered part of the core operations of any segment. Customer concentration The Group has two major customers which each respectively account for 7% and 6% of the Group’s external revenue. The sales are generated by the Australia and Marketing operating segments (2023: two major customers; 8% and 7% generated by the Australia and Marketing operating segments and 2022: two major customers; 12% and 9% generated by the Australia and Marketing operating segments). 1. Revenue is attributable to geographic location based on the location of the customers. Recognition and measurement Revenue from contracts with customers Revenue is recognised when or as the Group transfers control of products or provides services to a customer at the amount to which the Group expects to be entitled. If the consideration includes a variable component, the Group estimates the amount of the expected consideration receivable. Variable consideration is estimated throughout the contract and is recognised to the extent that it is highly probable a significant reversal will not occur. •Revenue from sale of hydrocarbons – Revenue from the sale of hydrocarbons is recognised at a point in time when control of the product is transferred to the customer. Revenue from take or pay contracts is recorded as unearned revenue until the product has been drawn by the customer (transfer of control), at which time it is recognised in earnings. •Other operating revenue – Revenue earned from LNG processing and other services is recognised over time as the services are rendered. Expenses •Royalties, excise and levies – Royalties, excise and levies are considered to be production-based taxes and are therefore accrued on the basis of the Group’s entitlement to physical production. •Depreciation and amortisation – Refer to Note B.3. •Impairment and impairment reversals – Refer to Note B.4. •Leases – Refer to Note D.7. •Employee benefits – Refer to Note E.2. Key estimates and judgements (a) Revenue from contracts with customers The transaction price at the date control passes for sales made subject to provisional pricing periods in oil and condensate contracts is determined with reference to quoted commodity prices. Judgement is also used to determine if it is highly probable that a significant reversal will not occur in relation to revenue recognised during open pricing periods in LNG contracts. The Group estimates variable consideration based on available information from contract negotiations and market indicators. 2024 ANNUAL REPORT157
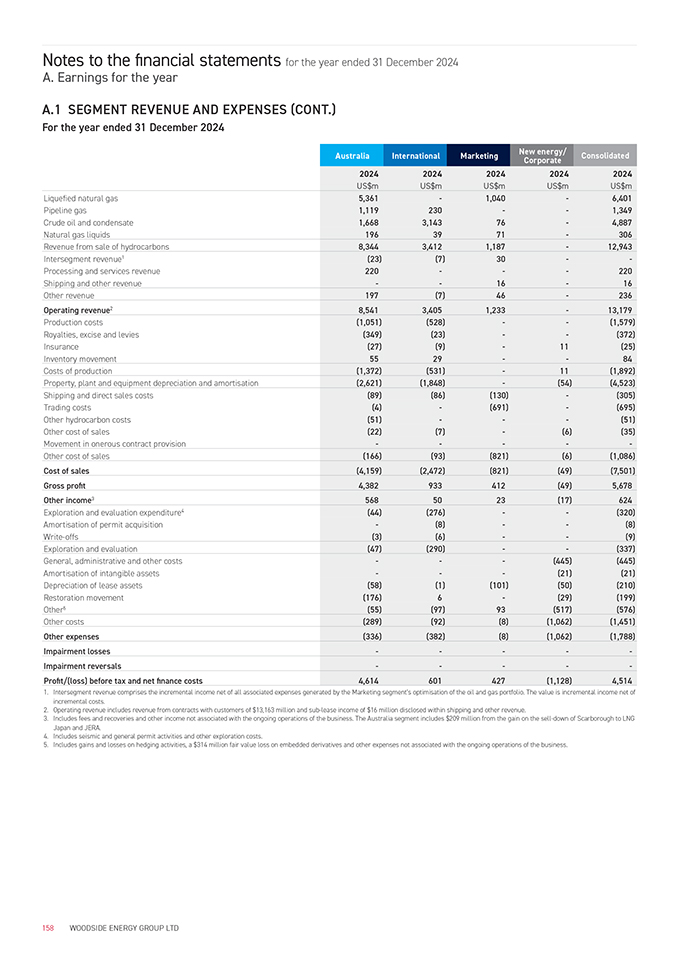
Notes to the financial statements for the year ended 31 December 2024 A. Earnings for the year A.1 SEGMENT REVENUE AND EXPENSES (CONT.) For the year ended 31 December 2024 Australia InternationalMarketingNew energy/Consolidated Corporate 20242024202420242024 US$mUS$mUS$mUS$mUS$m Liquefied natural gas5,361-1,040-6,401 Pipeline gas1,119230--1,349 Crude oil and condensate1,6683,14376-4,887 Natural gas liquids1963971-306 Revenue from sale of hydrocarbons8,3443,4121,187-12,943 Intersegment revenue1(23)(7)30-- Processing and services revenue220---220 Shipping and other revenue--16-16 Other revenue197(7)46-236 Operating revenue28,5413,4051,233-13,179 Production costs(1,051)(528)--(1,579) Royalties, excise and levies(349)(23)--(372) Insurance(27)(9)-11(25) Inventory movement5529--84 Costs of production(1,372)(531)-11(1,892) Property, plant and equipment depreciation and amortisation(2,621)(1,848)-(54)(4,523) Shipping and direct sales costs(89)(86)(130)-(305) Trading costs(4)-(691)-(695) Other hydrocarbon costs(51)---(51) Other cost of sales(22)(7)-(6)(35) Movement in onerous contract provision----- Other cost of sales(166)(93)(821)(6)(1,086) Cost of sales(4,159)(2,472)(821)(49)(7,501) Gross profit4,382933412(49)5,678 Other income35685023(17)624 Exploration and evaluation expenditure4(44)(276)--(320) Amortisation of permit acquisition-(8)--(8) Write-offs(3)(6)--(9) Exploration and evaluation(47)(290)--(337) General, administrative and other costs---(445)(445) Amortisation of intangible assets---(21)(21) Depreciation of lease assets(58)(1)(101)(50)(210) Restoration movement(176)6-(29)(199) Other5(55)(97)93(517)(576) Other costs(289)(92)(8)(1,062)(1,451) Other expenses(336)(382)(8)(1,062)(1,788) Impairment losses----- Impairment reversals----- Profit/(loss) before tax and net finance costs4,614601427(1,128)4,514 1.Intersegment revenue comprises the incremental income net of all associated expenses generated by the Marketing segment’s optimisation of the oil and gas portfolio. The value is incremental income net of incremental costs. 2.Operating revenue includes revenue from contracts with customers of $13,163 million and sub-lease income of $16 million disclosed within shipping and other revenue. 3.Includes fees and recoveries and other income not associated with the ongoing operations of the business. The Australia segment includes $209 million from the gain on the sell-down of Scarborough to LNG Japan and JERA. 4.Includes seismic and general permit activities and other exploration costs. 5.Includes gains and losses on hedging activities, a $314 million fair value loss on embedded derivatives and other expenses not associated with the ongoing operations of the business. 158WOODSIDE ENERGY GROUP LTD
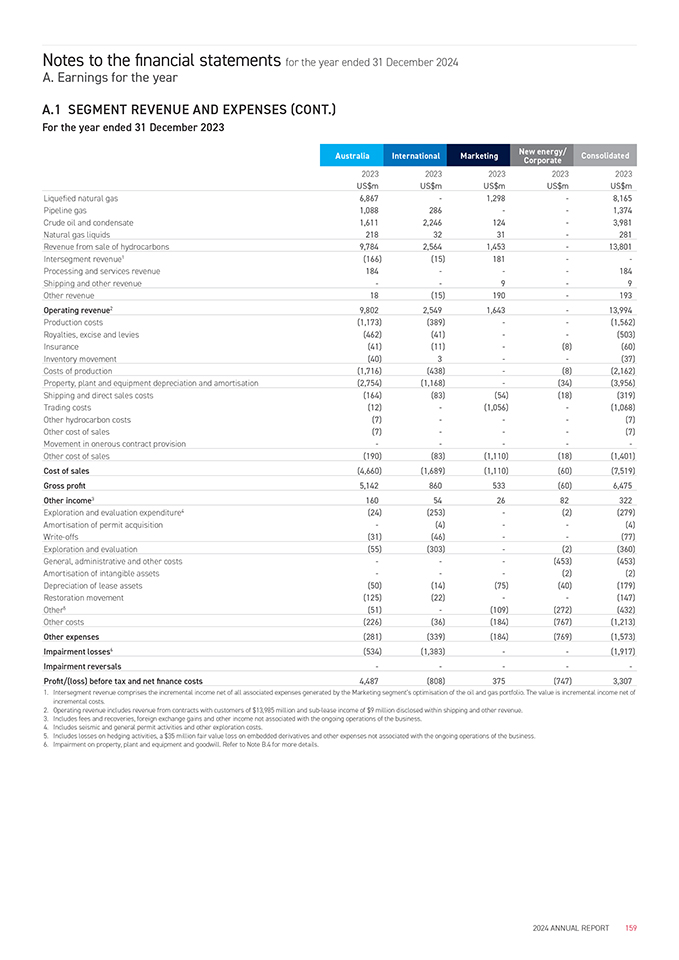
Notes to the financial statements for the year ended 31 December 2024 A. Earnings for the year A.1 SEGMENT REVENUE AND EXPENSES (CONT.) For the year ended 31 December 2023 Australia InternationalMarketingNew energy/Consolidated Corporate 20232023202320232023 US$mUS$mUS$mUS$mUS$m Liquefied natural gas6,867-1,298-8,165 Pipeline gas1,088286--1,374 Crude oil and condensate1,6112,246124-3,981 Natural gas liquids2183231-281 Revenue from sale of hydrocarbons9,7842,5641,453-13,801 Intersegment revenue1(166)(15)181-- Processing and services revenue184---184 Shipping and other revenue--9-9 Other revenue18(15)190-193 Operating revenue29,8022,5491,643-13,994 Production costs(1,173)(389)--(1,562) Royalties, excise and levies(462)(41)--(503) Insurance(41)(11)-(8)(60) Inventory movement(40)3--(37) Costs of production(1,716)(438)-(8)(2,162) Property, plant and equipment depreciation and amortisation(2,754)(1,168)-(34)(3,956) Shipping and direct sales costs(164)(83)(54)(18)(319) Trading costs(12)-(1,056)-(1,068) Other hydrocarbon costs(7)---(7) Other cost of sales(7)---(7) Movement in onerous contract provision----- Other cost of sales(190)(83)(1,110)(18)(1,401) Cost of sales(4,660)(1,689)(1,110)(60)(7,519) Gross profit5,142860533(60)6,475 Other income3160542682322 Exploration and evaluation expenditure4(24)(253)-(2)(279) Amortisation of permit acquisition-(4)--(4) Write-offs(31)(46)--(77) Exploration and evaluation(55)(303)-(2)(360) General, administrative and other costs---(453)(453) Amortisation of intangible assets---(2)(2) Depreciation of lease assets(50)(14)(75)(40)(179) Restoration movement(125)(22)--(147) Other5(51)-(109)(272)(432) Other costs(226)(36)(184)(767)(1,213) Other expenses(281)(339)(184)(769)(1,573) Impairment losses6(534)(1,383)--(1,917) Impairment reversals----- Profit/(loss) before tax and net finance costs4,487(808)375(747)3,307 1.Intersegment revenue comprises the incremental income net of all associated expenses generated by the Marketing segment’s optimisation of the oil and gas portfolio. The value is incremental income net of incremental costs. 2.Operating revenue includes revenue from contracts with customers of $13,985 million and sub-lease income of $9 million disclosed within shipping and other revenue. 3.Includes fees and recoveries, foreign exchange gains and other income not associated with the ongoing operations of the business. 4.Includes seismic and general permit activities and other exploration costs. 5.Includes losses on hedging activities, a $35 million fair value loss on embedded derivatives and other expenses not associated with the ongoing operations of the business. 6.Impairment on property, plant and equipment and goodwill. Refer to Note B.4 for more details. 2024 ANNUAL REPORT159
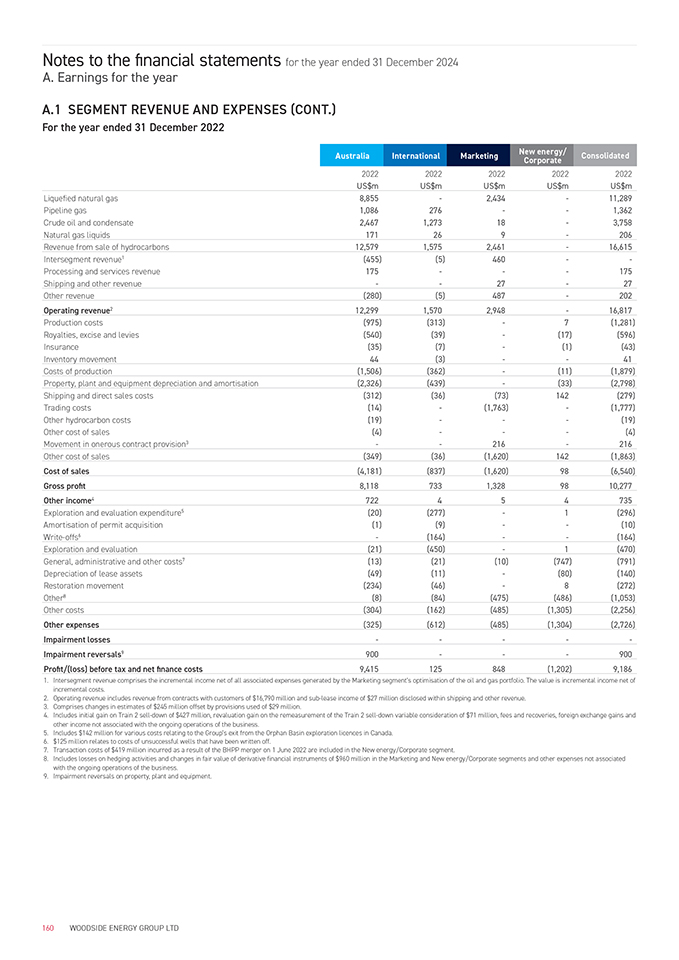
Notes to the financial statements for the year ended 31 December 2024 A. Earnings for the year A.1 SEGMENT REVENUE AND EXPENSES (CONT.) For the year ended 31 December 2022 Australia InternationalMarketingNew energy/Consolidated Corporate 20222022202220222022 US$mUS$mUS$mUS$mUS$m Liquefied natural gas8,855-2,434-11,289 Pipeline gas1,086276--1,362 Crude oil and condensate2,4671,27318-3,758 Natural gas liquids171269-206 Revenue from sale of hydrocarbons12,5791,5752,461-16,615 Intersegment revenue1(455)(5)460-- Processing and services revenue175---175 Shipping and other revenue--27-27 Other revenue(280)(5)487-202 Operating revenue212,2991,5702,948-16,817 Production costs(975)(313)-7(1,281) Royalties, excise and levies(540)(39)-(17)(596) Insurance(35)(7)-(1)(43) Inventory movement44(3)--41 Costs of production(1,506)(362)-(11)(1,879) Property, plant and equipment depreciation and amortisation(2,326)(439)-(33)(2,798) Shipping and direct sales costs(312)(36)(73)142(279) Trading costs(14)-(1,763)-(1,777) Other hydrocarbon costs(19)---(19) Other cost of sales(4)---(4) Movement in onerous contract provision3--216-216 Other cost of sales(349)(36)(1,620)142(1,863) Cost of sales(4,181)(837)(1,620)98(6,540) Gross profit8,1187331,3289810,277 Other income4722454735 Exploration and evaluation expenditure5(20)(277)-1(296) Amortisation of permit acquisition(1)(9)--(10) Write-offs6-(164)--(164) Exploration and evaluation(21)(450)-1(470) General, administrative and other costs7(13)(21)(10)(747)(791) Depreciation of lease assets(49)(11)-(80)(140) Restoration movement(234)(46)-8(272) Other8(8)(84)(475)(486)(1,053) Other costs(304)(162)(485)(1,305)(2,256) Other expenses(325)(612)(485)(1,304)(2,726) Impairment losses----- Impairment reversals9900---900 Profit/(loss) before tax and net finance costs9,415125848(1,202)9,186 1.Intersegment revenue comprises the incremental income net of all associated expenses generated by the Marketing segment’s optimisation of the oil and gas portfolio. The value is incremental income net of incremental costs. 2.Operating revenue includes revenue from contracts with customers of $16,790 million and sub-lease income of $27 million disclosed within shipping and other revenue. 3.Comprises changes in estimates of $245 million offset by provisions used of $29 million. 4.Includes initial gain on Train 2 sell-down of $427 million, revaluation gain on the remeasurement of the Train 2 sell-down variable consideration of $71 million, fees and recoveries, foreign exchange gains and other income not associated with the ongoing operations of the business. 5.Includes $142 million for various costs relating to the Group’s exit from the Orphan Basin exploration licences in Canada. 6.$125 million relates to costs of unsuccessful wells that have been written off. 7.Transaction costs of $419 million incurred as a result of the BHPP merger on 1 June 2022 are included in the New energy/Corporate segment. 8.Includes losses on hedging activities and changes in fair value of derivative financial instruments of $960 million in the Marketing and New energy/Corporate segments and other expenses not associated with the ongoing operations of the business. 9.Impairment reversals on property, plant and equipment. 160WOODSIDE ENERGY GROUP LTD
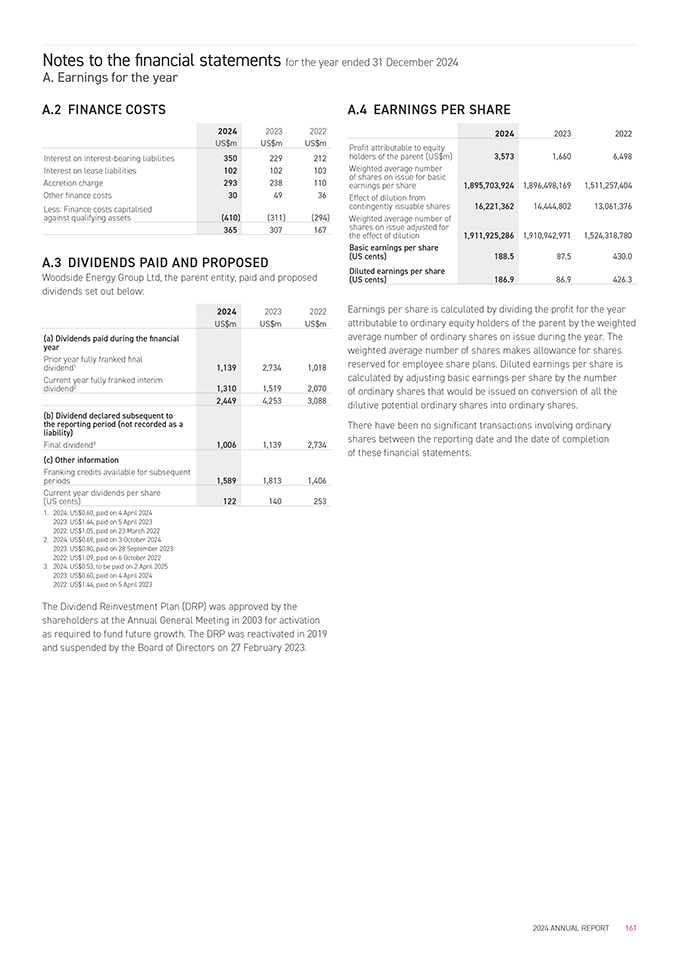
Notes to the financial statements for the year ended 31 December 2024 A. Earnings for the year A.2 FINANCE COSTS A.4 EARNINGS PER SHARE 202420232022 US$mUS$mUS$m Interest on interest-bearing liabilities350229212 Interest on lease liabilities102102103 Accretion charge293238110 Other finance costs304936 Less: Finance costs capitalised(410)(311)(294) against qualifying assets 365307167 A.3 DIVIDENDS PAID AND PROPOSED Woodside Energy Group Ltd, the parent entity, paid and proposed dividends set out below: 202420232022 Profit attributable to equity3,5731,6606,498 holders of the parent (US$m) Weighted average number of shares on issue for basic1,895,703,9241,896,498,1691,511,257,404 earnings per share Effect of dilution from16,221,36214,444,80213,061,376 contingently issuable shares Weighted average number of shares on issue adjusted for1,911,925,2861,910,942,9711,524,318,780 the effect of dilution Basic earnings per share188.5 (US cents)87.5430.0 Diluted earnings per share186.9 (US cents)86.9426.3 202420232022 US$mUS$mUS$m (a) Dividends paid during the financial year Prior year fully franked fnal1,1392,7341,018 dividend1 Current year fully franked interim1,3101,5192,070 dividend2 2,4494,2533,088 (b) Dividend declared subsequent to the reporting period (not recorded as a liability) Final dividend31,0061,1392,734 (c) Other information Franking credits available for subsequent1,5891,8131,406 periods Current year dividends per share122140253 (US cents) 1.2024: US$0.60, paid on 4 April 2024 2023: US$1.44, paid on 5 April 2023 2022: US$1.05, paid on 23 March 2022 2.2024: US$0.69, paid on 3 October 2024 2023: US$0.80, paid on 28 September 2023 2022: US$1.09, paid on 6 October 2022 3.2024: US$0.53, to be paid on 2 April 2025 2023: US$0.60, paid on 4 April 2024 2022: US$1.44, paid on 5 April 2023 Earnings per share is calculated by dividing the profit for the year attributable to ordinary equity holders of the parent by the weighted average number of ordinary shares on issue during the year. The weighted average number of shares makes allowance for shares reserved for employee share plans. Diluted earnings per share is calculated by adjusting basic earnings per share by the number of ordinary shares that would be issued on conversion of all the dilutive potential ordinary shares into ordinary shares. There have been no significant transactions involving ordinary shares between the reporting date and the date of completion of these financial statements. The Dividend Reinvestment Plan (DRP) was approved by the shareholders at the Annual General Meeting in 2003 for activation as required to fund future growth. The DRP was reactivated in 2019 and suspended by the Board of Directors on 27 February 2023. 2024 ANNUAL REPORT161
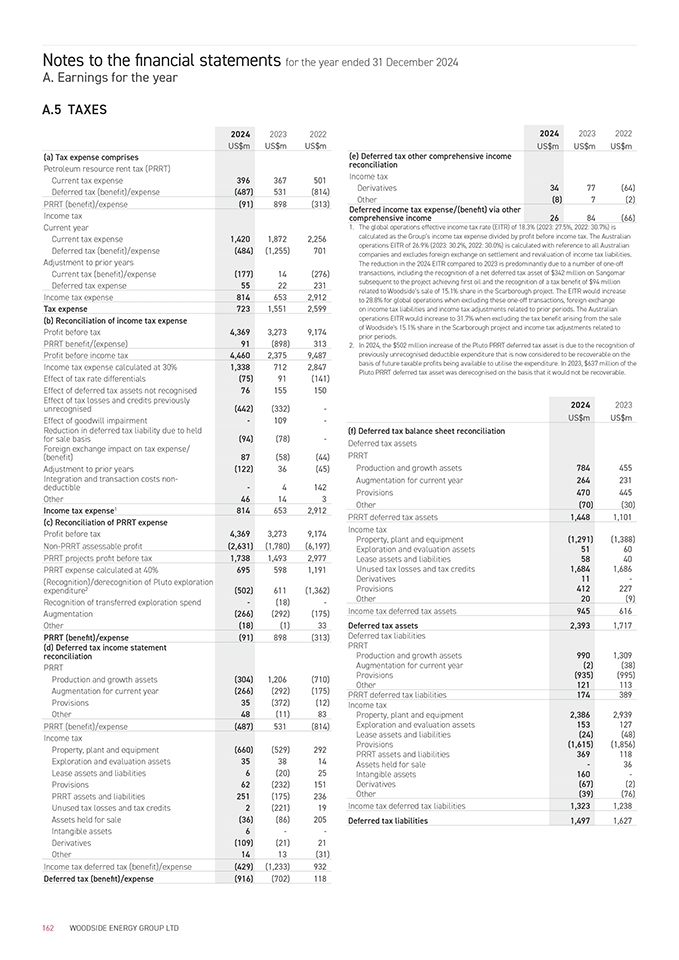
Notes to the financial statements for the year ended 31 December 2024 A. Earnings for the year A.5 TAXES 2024 20232022 US$mUS$mUS$m (a) Tax expense comprises Petroleum resource rent tax (PRRT) Current tax expense396367501 Deferred tax (benefit)/expense(487)531(814) PRRT (benefit)/expense(91)898(313) Income tax Current year Current tax expense1,4201,8722,256 Deferred tax (benefit)/expense(484)(1,255)701 Adjustment to prior years Current tax (benefit)/expense(177)14(276) Deferred tax expense5522231 Income tax expense8146532,912 Tax expense7231,5512,599 (b) Reconciliation of income tax expense Profit before tax4,3693,2739,174 PRRT benefit/(expense)91(898)313 Profit before income tax4,4602,3759,487 Income tax expense calculated at 30%1,3387122,847 Effect of tax rate differentials(75)91(141) Effect of deferred tax assets not recognised76155150 Effect of tax losses and credits previously(442)(332)- unrecognised Effect of goodwill impairment-109- Reduction in deferred tax liability due to held(94)(78)- for sale basis Foreign exchange impact on tax expense/87(58)(44) (benefit) Adjustment to prior years(122)36(45) Integration and transaction costs non--4142 deductible Other46143 Income tax expense18146532,912 (c) Reconciliation of PRRT expense Profit before tax4,3693,2739,174 Non-PRRT assessable profit(2,631)(1,780)(6,197) PRRT projects proft before tax1,7381,4932,977 PRRT expense calculated at 40%6955981,191 (Recognition)/derecognition of Pluto exploration(502)611(1,362) expenditure2 Recognition of transferred exploration spend-(18)- Augmentation(266)(292)(175) Other(18)(1)33 PRRT (benefit)/expense(91)898(313) (d) Deferred tax income statement reconciliation PRRT Production and growth assets(304)1,206(710) Augmentation for current year(266)(292)(175) Provisions35(372)(12) Other48(11)83 PRRT (benefit)/expense(487)531(814) Income tax Property, plant and equipment(660)(529)292 Exploration and evaluation assets353814 Lease assets and liabilities6(20)25 Provisions62(232)151 PRRT assets and liabilities251(175)236 Unused tax losses and tax credits2(221)19 Assets held for sale(36)(86)205 Intangible assets6-- Derivatives(109)(21)21 Other1413(31) Income tax deferred tax (benefit)/expense(429)(1,233)932 Deferred tax (benefit)/expense(916)(702)118 202420232022 US$mUS$mUS$m (e) Deferred tax other comprehensive income reconciliation Income tax Derivatives3477(64) Other(8)7(2) Deferred income tax expense/(benefit) via other26 comprehensive income84(66) 1.The global operations effective income tax rate (EITR) of 18.3% (2023: 27.5%, 2022: 30.7%) is calculated as the Group’s income tax expense divided by profit before income tax. The Australian operations EITR of 26.9% (2023: 30.2%, 2022: 30.0%) is calculated with reference to all Australian companies and excludes foreign exchange on settlement and revaluation of income tax liabilities. The reduction in the 2024 EITR compared to 2023 is predominantly due to a number of one-off transactions, including the recognition of a net deferred tax asset of $342 million on Sangomar subsequent to the project achieving first oil and the recognition of a tax benefit of $94 million related to Woodside’s sale of 15.1% share in the Scarborough project. The EITR would increase to 28.8% for global operations when excluding these one-off transactions, foreign exchange on income tax liabilities and income tax adjustments related to prior periods. The Australian operations EITR would increase to 31.7% when excluding the tax benefit arising from the sale of Woodside’s 15.1% share in the Scarborough project and income tax adjustments related to prior periods. 2.In 2024, the $502 million increase of the Pluto PRRT deferred tax asset is due to the recognition of previously unrecognised deductible expenditure that is now considered to be recoverable on the basis of future taxable profits being available to utilise the expenditure. In 2023, $637 million of the Pluto PRRT deferred tax asset was derecognised on the basis that it would not be recoverable. 20242023 US$mUS$m (f) Deferred tax balance sheet reconciliation Deferred tax assets PRRT Production and growth assets784455 Augmentation for current year264231 Provisions470445 Other(70)(30) PRRT deferred tax assets1,4481,101 Income tax(1,291)(1,388) Property, plant and equipment Exploration and evaluation assets5160 Lease assets and liabilities5840 Unused tax losses and tax credits1,6841,686 Derivatives11- Provisions412227 Other20(9) Income tax deferred tax assets945616 Deferred tax assets2,3931,717 Deferred tax liabilities PRRT9901,309 Production and growth assets Augmentation for current year(2)(38) Provisions(935)(995) Other121113 PRRT deferred tax liabilities174389 Income tax2,3862,939 Property, plant and equipment Exploration and evaluation assets153127 Lease assets and liabilities(24)(48) Provisions(1,615)(1,856) PRRT assets and liabilities369118 Assets held for sale-36 Intangible assets160- Derivatives(67)(2) Other(39)(76) Income tax deferred tax liabilities1,3231,238 Deferred tax liabilities1,4971,627 162WOODSIDE ENERGY GROUP LTD
Notes to the financial statements for the year ended 31 December 2024 A. Earnings for the year A.5 TAXES (CONT.) Tax transparency code Woodside participates in the Australian Board of Taxation’s voluntary Tax Transparency Code (TTC). To increase public confidence in the contributions and compliance of corporate taxpayers, the TTC recommends public disclosure of tax information. Part A of the recommended disclosures is addressed within this Taxes note and Part B disclosed within the Sustainability section on our website. Recognition and measurement Current tax assets and liabilities are measured at the amount expected to be recovered from or paid to the taxation authorities. Deferred tax assets and liabilities are measured at the tax rates that are expected to apply in the period in which the liability is settled or the asset is realised. The tax rates and laws used to determine the amount are based on those that have been enacted or substantively enacted by the end of the reporting period. Income taxes relating to items recognised directly in equity are recognised in equity. Current taxes Current tax expense is the expected tax payable on the taxable income for the current year and any adjustment to tax paid in respect of previous years. Deferred taxes Deferred tax expense represents movements in the temporary differences between the carrying amount of an asset or liability in the consolidated statement of financial position and its tax base. With the exception of those noted below, deferred tax liabilities are recognised for all taxable temporary differences. Deferred tax assets are recognised for deductible temporary differences, unused tax losses and tax credits only if it is probable that sufficient future taxable income will be available to utilise those temporary differences and losses. Deferred tax is not recognised if the temporary difference arises from goodwill or from the initial recognition (other than in a business combination) of assets and liabilities in a transaction that affects neither accounting profit nor the taxable profit. In relation to PRRT, the impact of future augmentation on expenditure is included in the determination of future taxable profits when assessing the extent to which a deferred tax asset can be recognised in the consolidated statement of financial position. Offsetting deferred tax balances Deferred tax assets and liabilities are offset only if there is a legally enforceable right to offset current tax assets and liabilities and when they relate to income taxes levied by the same taxation authority on either the same taxable entity or different taxable entities that the Group intends to settle its current tax assets and liabilities on a net basis. Refer to Notes E.8 and E.9 for detail on the tax consolidated groups. PRRT deductions cap In May 2024, the Parliament of Australia enacted the Treasury Laws Amendment (Tax Accountability and Fairness) Act 2024 for the PRRT deductions cap which takes effect from 1 July 2023. If an entity is an LNG producer and its petroleum projects meet the criteria of the deduction cap, the entity will have a taxable profit of 10% of the projects’ assessable receipts in the year of tax. The new legislation has impacted the Pluto and Wheatstone projects resulting in the Group making payments of $163 million and recognising a further $27 million as a current tax payable as at 31 December 2024. Pillar Two legislation In December 2021, the Organisation for Economic Co-operation and Development (OECD) published its Pillar Two legislation rules. The Pillar Two legislation rules aim to ensure that large multinational groups pay a minimum of 15% tax for each jurisdiction in which they operate. Pillar Two legislation has been enacted or substantively enacted in a number of jurisdictions in which the Group operates with effect from 1 January 2024. The Group applies the exception to recognising and disclosing information about deferred tax assets and liabilities related to Pillar Two income taxes. The Group has estimated that the Pillar Two effective tax rates exceed 15% or satisfies transitional safe harbour measures in all jurisdictions in which it operates. On this basis, the Group has not recognised any Pillar Two tax expense for the year ended 31 December 2024. 2024 ANNUAL REPORT 163
Notes to the financial statements for the year ended 31 December 2024 A. Earnings for the year A.5 TAXES (CONT.) Key estimates and judgements (a) Income tax classification Judgement is required when determining whether a particular tax is an income tax or another type of tax. PRRT is considered, for accounting purposes, to be an income tax. Accounting for deferred tax is applied to income taxes as described above, but is not applied to other types of taxes, e.g. North West Shelf royalties, excise and levies which are recognised in cost of sales in the income statement. (b) Deferred tax asset recognition Income tax losses and credits: Deferred tax assets (DTAs) relating to carry forward unused tax losses and credits arising from the USA Tax Consolidation Group (USA TCG) of $1,274 million (2023: $1,248 million) and $410 million (2023: $333 million) arising from countries other than Australia and the USA have been recognised. The Group has determined that it is probable that sufficient future taxable income will be available to utilise those losses and credits within those countries. Refer to Note E.9(a) for details of tax consolidated groups. DTAs relating to carry forward unused tax losses and credits of $366 million (2023: $232 million) from the USA TCG, $343 million (2023: $189 million) from USA entities outside of the USA TCG and $715 million (2023: $763 million) from countries other than Australia and the USA have not been recognised as it is not currently probable that the losses and credits will be utilised based on current planned activities in those countries. Subsequent to achieving first oil on the Sangomar project in June 2024, the Group has recognised a net deferred tax asset of $342 million. In the prior year, as a result of the final investment decision to develop the Trion resource, the Group recognised deferred tax assets of $319 million. PRRT: The recoverability of PRRT deferred tax assets is primarily assessed with regard to future oil price assumptions impacting forecast future taxable profits. During the year ended 31 December 2024, the Group increased the Pluto PRRT DTA by $502 million ($351 million post-tax) on the basis of future taxable profits being available to utilise the deductible expenditure. This is primarily driven by increases in forecast pricing assumptions and actual pricing realised during the year ended 31 December 2024. In determining the amount of DTA that is considered probable and eligible for recognition, forecast future taxable profits are risk-adjusted where appropriate by a market premium risk rate to reflect uncertainty inherent in long-term forecasts. A long-term bond rate of 3.2% (31 December 2023: 3.2%) was used for the purposes of augmentation. Certain deferred tax assets on deductible temporary differences have not been recognised on the basis that deductions from future augmentation of the recognised deductible temporary difference will be sufficient to offset future taxable profits. $7,490 million (2023: $7,428 million) relates to the North West Shelf Project, $601 million (2023: $872 million) relates to remaining Pluto deductible balances and $795 million (2023: $758 million) relates to Wheatstone. A long-term bond rate of 3.2% (31 December 2023: 3.2%) was used for the purposes of augmentation. Had an alternative approach been used to assess recovery of the deferred tax assets, whereby future augmentation was not included in the assessment, additional deferred tax assets would be recognised, with a corresponding benefit to tax expense. It was determined that the approach adopted provides the most meaningful information on the implications of the PRRT regime, whilst ensuring compliance with AASB 112/IAS 12 Income Taxes. (c) Uncertain tax positions The Group has tax matters, litigation and other claims, for which the timing of resolution and potential economic outflows are uncertain. Where the Group assesses an outcome for any tax matter, litigation or other claim as more likely than not to be accepted by the relevant tax authority, the position is adopted in the reported tax balances. Because of the complexity of some of these positions, the ultimate outcome may differ from the current estimate of the position. These differences will be reflected as increases or decreases to tax expense in the period in which new information is available. Tax matters without a probable economic outflow and/or presently cannot be measured reliably are contingent liabilities and disclosed in Note E.1 Contingent liabilities and assets. 164 WOODSIDE ENERGY GROUP LTD

Notes to the financial statements for the year ended 31 December 2024 B. Production and growth assets IN THIS SECTION This section addresses the strategic growth (exploration and evaluation), core producing, development and new energy (property, plant and equipment) assets position of the Group at the end of the reporting period including, where applicable, the accounting policies and key estimates and judgements applied. This section also includes the impairment position of the Group at the end of the reporting period. B. Production and growth assets B.1Segment production and growth assetsPage 166 B.2Exploration and evaluationPage 168 B.3Property, plant and equipmentPage 169 B.4Impairment of exploration and evaluation, property, plant and equipment and goodwillPage 171 B.5Business combinationPage 176 B.6Intangible assetsPage 178 B.7Significant production and growth asset acquisitionsPage 179 B.8Disposal of assetsPage 180 2024 ANNUAL REPORT165
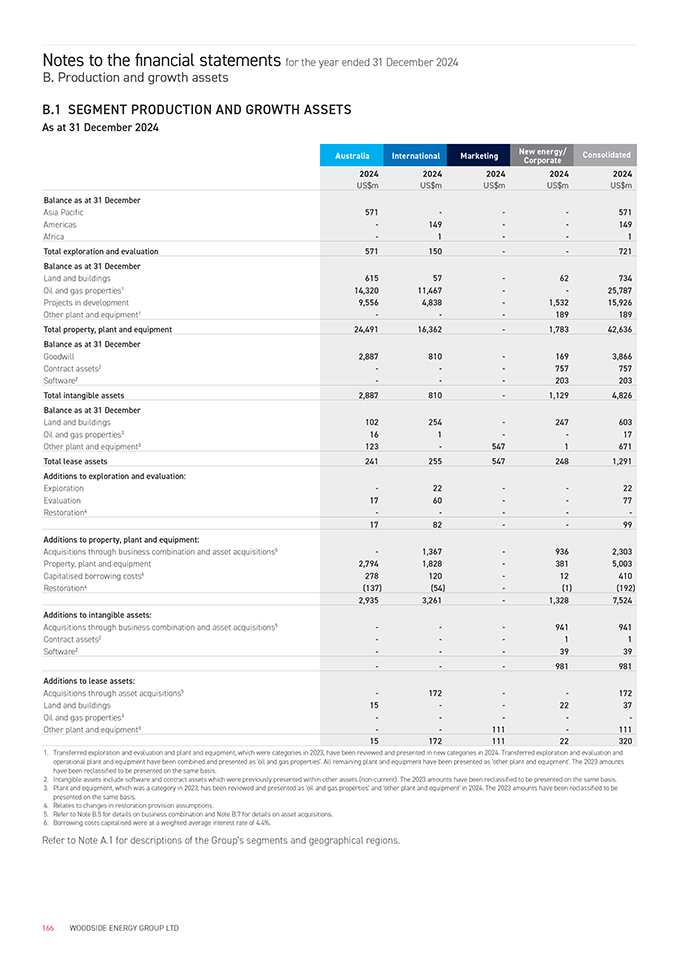
Notes to the financial statements for the year ended 31 December 2024 B. Production and growth assets B.1 SEGMENT PRODUCTION AND GROWTH ASSETS As at 31 December 2024 Australia InternationalMarketingNew energy/Consolidated Corporate 20242024202420242024 US$mUS$mUS$mUS$mUS$m Balance as at 31 December Asia Pacific571---571 Americas-149--149 Africa-1--1 Total exploration and evaluation571150--721 Balance as at 31 December Land and buildings61557-62734 Oil and gas properties114,32011,467--25,787 Projects in development9,5564,838-1,53215,926 Other plant and equipment1---189189 Total property, plant and equipment24,49116,362-1,78342,636 Balance as at 31 December Goodwill2,887810-1693,866 Contract assets2---757757 Software2---203203 Total intangible assets2,887810-1,1294,826 Balance as at 31 December Land and buildings102254-247603 Oil and gas properties3161--17 Other plant and equipment3123-5471671 Total lease assets2412555472481,291 Additions to exploration and evaluation: Exploration-22--22 Evaluation1760--77 Restoration4----- 1782--99 Additions to property, plant and equipment: Acquisitions through business combination and asset acquisitions5-1,367-9362,303 Property, plant and equipment2,7941,828-3815,003 Capitalised borrowing costs6278120-12410 Restoration4(137)(54)-(1)(192) 2,9353,261-1,3287,524 Additions to intangible assets: Acquisitions through business combination and asset acquisitions5---941941 Contract assets2---11 Software2---3939 ---981981 Additions to lease assets: Acquisitions through asset acquisitions5-172--172 Land and buildings15--2237 Oil and gas properties3----- Other plant and equipment3--111-111 1517211122320 1.Transferred exploration and evaluation and plant and equipment, which were categories in 2023, have been reviewed and presented in new categories in 2024. Transferred exploration and evaluation and operational plant and equipment have been combined and presented as ‘oil and gas properties’. All remaining plant and equipment have been presented as ‘other plant and equipment’. The 2023 amounts have been reclassified to be presented on the same basis. 2.Intangible assets include software and contract assets which were previously presented within other assets (non-current). The 2023 amounts have been reclassified to be presented on the same basis. 3.Plant and equipment, which was a category in 2023, has been reviewed and presented as ‘oil and gas properties’ and ‘other plant and equipment’ in 2024. The 2023 amounts have been reclassified to be presented on the same basis. 4.Relates to changes in restoration provision assumptions. 5.Refer to Note B.5 for details on business combination and Note B.7 for details on asset acquisitions. 6.Borrowing costs capitalised were at a weighted average interest rate of 4.4%. Refer to Note A.1 for descriptions of the Group’s segments and geographical regions. 166WOODSIDE ENERGY GROUP LTD
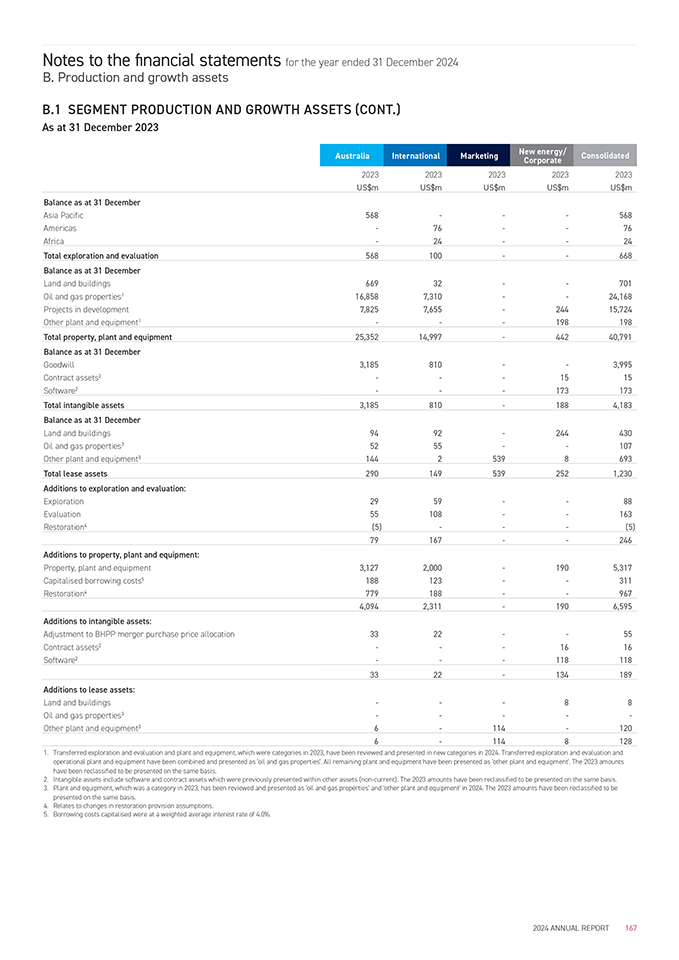
Notes to the financial statements for the year ended 31 December 2024 B. Production and growth assets B.1 SEGMENT PRODUCTION AND GROWTH ASSETS (CONT.) As at 31 December 2023 Australia InternationalMarketingNew energy/Consolidated Corporate 20232023202320232023 US$mUS$mUS$mUS$mUS$m Balance as at 31 December Asia Pacific568---568 Americas-76--76 Africa-24--24 Total exploration and evaluation568100--668 Balance as at 31 December Land and buildings66932--701 Oil and gas properties116,8587,310--24,168 Projects in development7,8257,655-24415,724 Other plant and equipment1---198198 Total property, plant and equipment25,35214,997-44240,791 Balance as at 31 December Goodwill3,185810--3,995 Contract assets2---1515 Software2---173173 Total intangible assets3,185810-1884,183 Balance as at 31 December Land and buildings9492-244430 Oil and gas properties35255--107 Other plant and equipment314425398693 Total lease assets2901495392521,230 Additions to exploration and evaluation: Exploration2959--88 Evaluation55108--163 Restoration4(5)---(5) 79167--246 Additions to property, plant and equipment: Property, plant and equipment3,1272,000-1905,317 Capitalised borrowing costs5188123--311 Restoration4779188--967 4,0942,311-1906,595 Additions to intangible assets: Adjustment to BHPP merger purchase price allocation3322--55 Contract assets2---1616 Software2---118118 3322-134189 Additions to lease assets: Land and buildings---88 Oil and gas properties3----- Other plant and equipment36-114-120 6-1148128 1.Transferred exploration and evaluation and plant and equipment, which were categories in 2023, have been reviewed and presented in new categories in 2024. Transferred exploration and evaluation and operational plant and equipment have been combined and presented as ‘oil and gas properties’. All remaining plant and equipment have been presented as ‘other plant and equipment’. The 2023 amounts have been reclassified to be presented on the same basis. 2.Intangible assets include software and contract assets which were previously presented within other assets (non-current). The 2023 amounts have been reclassified to be presented on the same basis. 3.Plant and equipment, which was a category in 2023, has been reviewed and presented as ‘oil and gas properties’ and ‘other plant and equipment’ in 2024. The 2023 amounts have been reclassified to be presented on the same basis. 4.Relates to changes in restoration provision assumptions. 5.Borrowing costs capitalised were at a weighted average interest rate of 4.0%. 2024 ANNUAL REPORT167
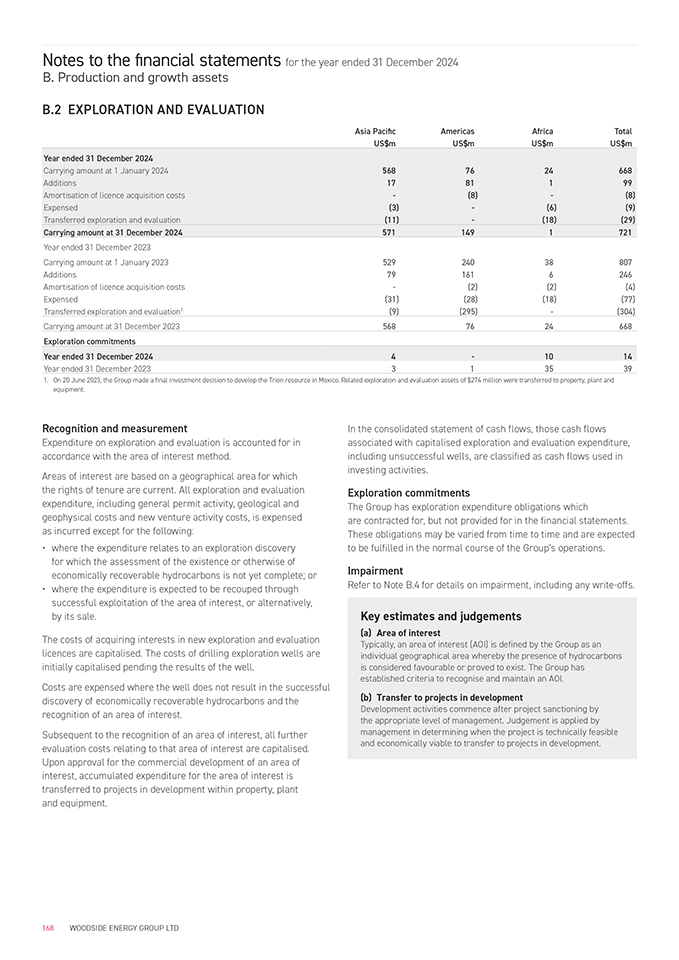
Notes to the financial statements for the year ended 31 December 2024 B. Production and growth assets B.2 EXPLORATION AND EVALUATION Asia Pacific AmericasAfricaTotal US$mUS$mUS$mUS$m Year ended 31 December 2024 Carrying amount at 1 January 20245687624668 Additions1781199 Amortisation of licence acquisition costs-(8)-(8) Expensed(3)-(6)(9) Transferred exploration and evaluation(11)-(18)(29) Carrying amount at 31 December 20245711491721 Year ended 31 December 2023 Carrying amount at 1 January 202352924038807 Additions791616246 Amortisation of licence acquisition costs-(2)(2)(4) Expensed(31)(28)(18)(77) Transferred exploration and evaluation1(9)(295)-(304) Carrying amount at 31 December 20235687624668 Exploration commitments Year ended 31 December 20244-1014 Year ended 31 December 2023313539 1.On 20 June 2023, the Group made a final investment decision to develop the Trion resource in Mexico. Related exploration and evaluation assets of $274 million were transferred to property, plant and equipment. Recognition and measurement Expenditure on exploration and evaluation is accounted for in accordance with the area of interest method. Areas of interest are based on a geographical area for which the rights of tenure are current. All exploration and evaluation expenditure, including general permit activity, geological and geophysical costs and new venture activity costs, is expensed as incurred except for the following: •where the expenditure relates to an exploration discovery for which the assessment of the existence or otherwise of economically recoverable hydrocarbons is not yet complete; or •where the expenditure is expected to be recouped through successful exploitation of the area of interest, or alternatively, by its sale. The costs of acquiring interests in new exploration and evaluation licences are capitalised. The costs of drilling exploration wells are initially capitalised pending the results of the well. Costs are expensed where the well does not result in the successful discovery of economically recoverable hydrocarbons and the recognition of an area of interest. Subsequent to the recognition of an area of interest, all further evaluation costs relating to that area of interest are capitalised. Upon approval for the commercial development of an area of interest, accumulated expenditure for the area of interest is transferred to projects in development within property, plant and equipment. In the consolidated statement of cash flows, those cash flows associated with capitalised exploration and evaluation expenditure, including unsuccessful wells, are classified as cash flows used in investing activities. Exploration commitments The Group has exploration expenditure obligations which are contracted for, but not provided for in the financial statements. These obligations may be varied from time to time and are expected to be fulfilled in the normal course of the Group’s operations. Impairment Refer to Note B.4 for details on impairment, including any write-offs. Key estimates and judgements (a) Area of interest Typically, an area of interest (AOI) is defined by the Group as an individual geographical area whereby the presence of hydrocarbons is considered favourable or proved to exist. The Group has established criteria to recognise and maintain an AOI. (b) Transfer to projects in development Development activities commence after project sanctioning by the appropriate level of management. Judgement is applied by management in determining when the project is technically feasible and economically viable to transfer to projects in development. 168WOODSIDE ENERGY GROUP LTD
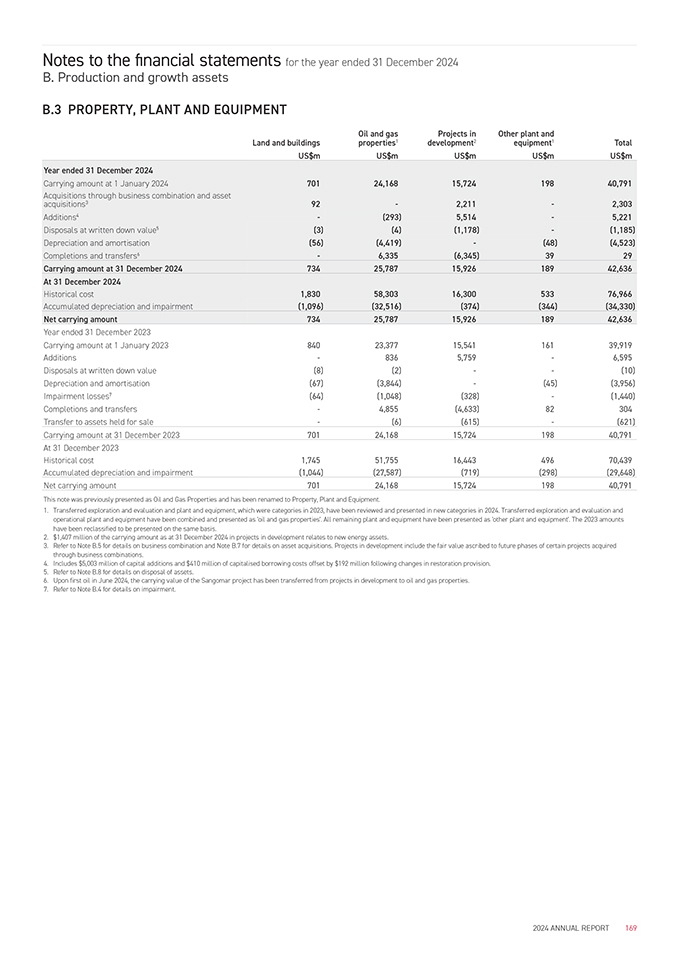
Notes to the financial statements for the year ended 31 December 2024 B. Production and growth assets B.3 PROPERTY, PLANT AND EQUIPMENT Oil and gasProjects inOther plant and Land and buildingsproperties1development2equipment1Total US$mUS$mUS$mUS$mUS$m Year ended 31 December 2024 Carrying amount at 1 January 202470124,16815,72419840,791 Acquisitions through business combination and asset92-2,211-2,303 acquisitions3 Additions4-(293)5,514-5,221 Disposals at written down value5(3)(4)(1,178)-(1,185) Depreciation and amortisation(56)(4,419)-(48)(4,523) Completions and transfers6-6,335(6,345)3929 Carrying amount at 31 December 202473425,78715,92618942,636 At 31 December 2024 Historical cost1,83058,30316,30053376,966 Accumulated depreciation and impairment(1,096)(32,516)(374)(344)(34,330) Net carrying amount73425,78715,92618942,636 Year ended 31 December 2023 Carrying amount at 1 January 202384023,37715,54116139,919 Additions-8365,759-6,595 Disposals at written down value(8)(2)--(10) Depreciation and amortisation(67)(3,844)-(45)(3,956) Impairment losses7(64)(1,048)(328)-(1,440) Completions and transfers-4,855(4,633)82304 Transfer to assets held for sale-(6)(615)-(621) Carrying amount at 31 December 202370124,16815,72419840,791 At 31 December 2023 Historical cost1,74551,75516,44349670,439 Accumulated depreciation and impairment(1,044)(27,587)(719)(298)(29,648) Net carrying amount70124,16815,72419840,791 This note was previously presented as Oil and Gas Properties and has been renamed to Property, Plant and Equipment. 1.Transferred exploration and evaluation and plant and equipment, which were categories in 2023, have been reviewed and presented in new categories in 2024. Transferred exploration and evaluation and operational plant and equipment have been combined and presented as ‘oil and gas properties’. All remaining plant and equipment have been presented as ‘other plant and equipment’. The 2023 amounts have been reclassified to be presented on the same basis. 2.$1,407 million of the carrying amount as at 31 December 2024 in projects in development relates to new energy assets. 3.Refer to Note B.5 for details on business combination and Note B.7 for details on asset acquisitions. Projects in development include the fair value ascribed to future phases of certain projects acquired through business combinations. 4.Includes $5,003 million of capital additions and $410 million of capitalised borrowing costs offset by $192 million following changes in restoration provision. 5.Refer to Note B.8 for details on disposal of assets. 6.Upon first oil in June 2024, the carrying value of the Sangomar project has been transferred from projects in development to oil and gas properties. 7.Refer to Note B.4 for details on impairment. 2024 ANNUAL REPORT169
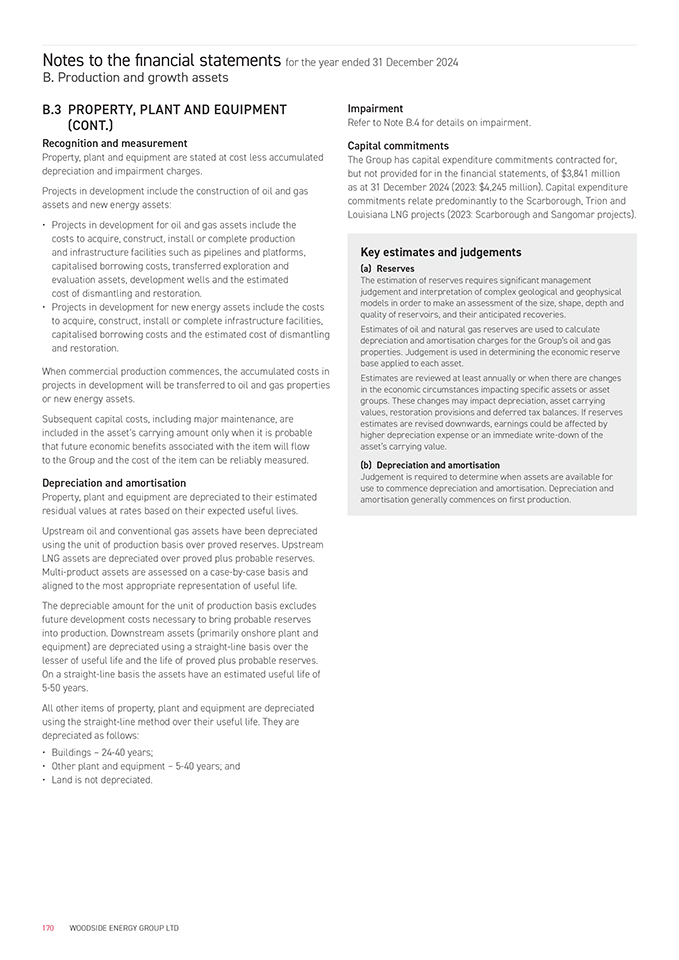
Notes to the financial statements for the year ended 31 December 2024 B. Production and growth assets B.3 PROPERTY, PLANT AND EQUIPMENT (CONT.) Recognition and measurement Property, plant and equipment are stated at cost less accumulated depreciation and impairment charges. Projects in development include the construction of oil and gas assets and new energy assets: • Projects in development for oil and gas assets include the costs to acquire, construct, install or complete production and infrastructure facilities such as pipelines and platforms, capitalised borrowing costs, transferred exploration and evaluation assets, development wells and the estimated cost of dismantling and restoration. • Projects in development for new energy assets include the costs to acquire, construct, install or complete infrastructure facilities, capitalised borrowing costs and the estimated cost of dismantling and restoration. When commercial production commences, the accumulated costs in projects in development will be transferred to oil and gas properties or new energy assets. Subsequent capital costs, including major maintenance, are included in the asset’s carrying amount only when it is probable that future economic benefits associated with the item will flow to the Group and the cost of the item can be reliably measured. Depreciation and amortisation Property, plant and equipment are depreciated to their estimated residual values at rates based on their expected useful lives. Upstream oil and conventional gas assets have been depreciated using the unit of production basis over proved reserves. Upstream LNG assets are depreciated over proved plus probable reserves. Multi-product assets are assessed on a case-by-case basis and aligned to the most appropriate representation of useful life. The depreciable amount for the unit of production basis excludes future development costs necessary to bring probable reserves into production. Downstream assets (primarily onshore plant and equipment) are depreciated using a straight-line basis over the lesser of useful life and the life of proved plus probable reserves. On a straight-line basis the assets have an estimated useful life of 5-50 years. All other items of property, plant and equipment are depreciated using the straight-line method over their useful life. They are depreciated as follows: •Buildings – 24-40 years; •Other plant and equipment – 5-40 years; and •Land is not depreciated. Impairment Refer to Note B.4 for details on impairment. Capital commitments The Group has capital expenditure commitments contracted for, but not provided for in the financial statements, of $3,841 million as at 31 December 2024 (2023: $4,245 million). Capital expenditure commitments relate predominantly to the Scarborough, Trion and Louisiana LNG projects (2023: Scarborough and Sangomar projects). Key estimates and judgements (a) Reserves The estimation of reserves requires significant management judgement and interpretation of complex geological and geophysical models in order to make an assessment of the size, shape, depth and quality of reservoirs, and their anticipated recoveries. Estimates of oil and natural gas reserves are used to calculate depreciation and amortisation charges for the Group’s oil and gas properties. Judgement is used in determining the economic reserve base applied to each asset. Estimates are reviewed at least annually or when there are changes in the economic circumstances impacting specific assets or asset groups. These changes may impact depreciation, asset carrying values, restoration provisions and deferred tax balances. If reserves estimates are revised downwards, earnings could be affected by higher depreciation expense or an immediate write-down of the asset’s carrying value. (b) Depreciation and amortisation Judgement is required to determine when assets are available for use to commence depreciation and amortisation. Depreciation and amortisation generally commences on first production. 170WOODSIDE ENERGY GROUP LTD
Notes to the financial statements for the year ended 31 December 2024 B. Production and growth assets B.4 IMPAIRMENT OF EXPLORATION AND EVALUATION, PROPERTY, PLANT AND EQUIPMENT AND GOODWILL Exploration and evaluation Impairment testing The recoverability of the carrying amount of exploration and evaluation assets is dependent on successful development and commercial exploitation, or alternatively sale of the respective AOI. Each AOI is reviewed half-yearly to determine whether economic quantities of hydrocarbons have been found, or whether further exploration and evaluation work is underway or planned to support continued carry forward of capitalised costs. Where a potential impairment is indicated for an AOI, an assessment is performed using a fair value less costs to dispose (FVLCD) method to determine its recoverable amount. Upon approval for commercial development, exploration and evaluation assets are assessed for impairment before they are transferred to property, plant and equipment. Impairment calculations If the carrying amount of an AOI exceeds its recoverable amount, the AOI is written down to its recoverable amount and an impairment loss is recognised in the consolidated income statement. Property, plant and equipment Impairment testing The carrying amounts of property, plant and equipment are assessed half-yearly to determine whether there is an indicator of impairment or impairment reversal for those assets which have previously been impaired. Indicators of impairment and impairment reversals include changes in reserves for oil and gas assets, expected future sales prices or costs. Property, plant and equipment are assessed for impairment indicators and impairments on a cash-generating unit (CGU) basis. CGUs are determined as offshore and onshore facilities, infrastructure and associated oil and/or gas fields and new energy assets. If there is an indicator of impairment or impairment reversal for a CGU, its recoverable amount is calculated and compared with the CGU’s carrying value (refer to impairment calculations below). Goodwill For the purpose of impairment testing, goodwill acquired in a business combination is, from the acquisition date, allocated to each of the Group’s cash-generating units (CGUs) that are expected to benefit from the combination, irrespective of whether other assets or liabilities of the acquiree are assigned to those units. Goodwill is tested for impairment at least annually and more frequently if events or changes in circumstances indicate that it might be impaired. Impairment of goodwill is determined by assessing the recoverable amount of each CGU to which the goodwill relates and comparing it with its carrying value, which includes deferred taxes (refer to impairment calculations below and Note B.5). When part of an operation is disposed of, any goodwill associated with the disposed operation is included in the carrying amount of the operation in determining the gain or loss on disposal. Goodwill and property, plant and equipment impairment calculations The recoverable amount of an asset or CGU is determined as the higher of its value in use (VIU) and FVLCD. VIU is determined by estimating future cash flows after taking into account the risks specific to the asset and discounting to present value using an appropriate discount rate. FVLCD is the price that would be received to sell the asset in an orderly transaction between market participants and does not reflect the effects of factors that may be specific to the Group. In determining FVLCD, recent market transactions are considered. If no such transactions can be identified, an appropriate valuation model, such as discounted cash flow techniques, is applied on a post-tax basis using an appropriate discount rate and estimates are made about the assumptions market participants would use when pricing the asset or CGU. If the carrying amount of an asset or CGU, including any allocated goodwill, exceeds its recoverable amount, the asset or CGU is written down to its recoverable amount and an impairment loss is recognised in the consolidated income statement. Any impairment losses are first allocated to reduce the carrying amount of any goodwill allocated, with the remaining impairment losses allocated to the relevant assets. If the recoverable amount of an asset or CGU exceeds its carrying amount, and that asset has previously been impaired, the impairment is reversed. The carrying amount of the asset or CGU is increased to its recoverable amount, but only to the extent that the carrying amount does not exceed the value that would have been determined, net of depreciation or amortisation, if no impairment had been recognised. Impairments of goodwill are not reversed. 2024 ANNUAL REPORT 171
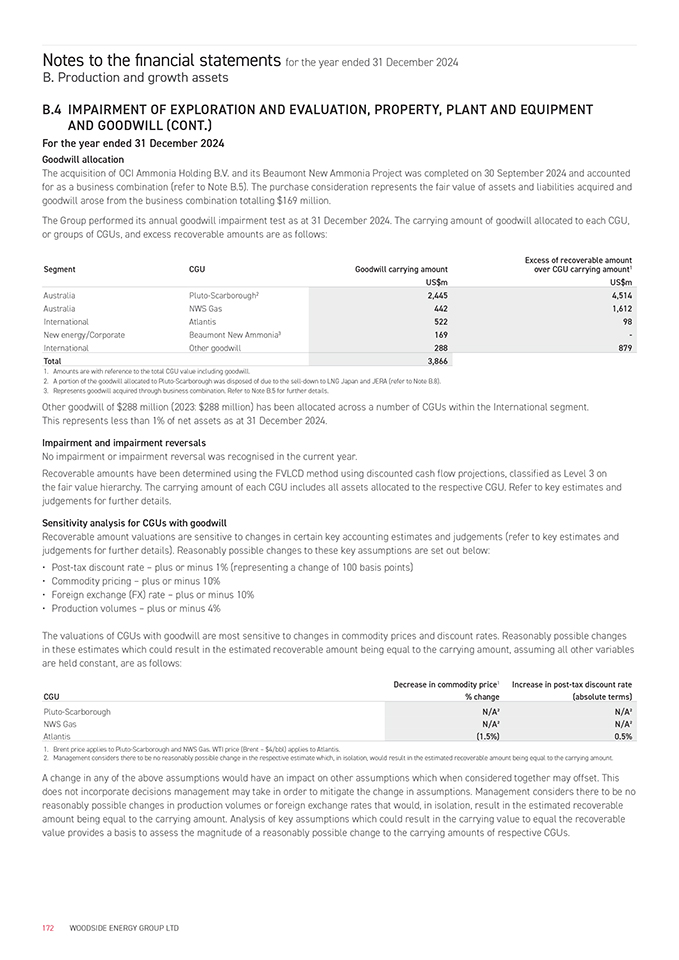
Notes to the financial statements for the year ended 31 December 2024 B. Production and growth assets B.4 IMPAIRMENT OF EXPLORATION AND EVALUATION, PROPERTY, PLANT AND EQUIPMENT AND GOODWILL (CONT.) For the year ended 31 December 2024 Goodwill allocation The acquisition of OCI Ammonia Holding B.V. and its Beaumont New Ammonia Project was completed on 30 September 2024 and accounted for as a business combination (refer to Note B.5). The purchase consideration represents the fair value of assets and liabilities acquired and goodwill arose from the business combination totalling $169 million. The Group performed its annual goodwill impairment test as at 31 December 2024. The carrying amount of goodwill allocated to each CGU, or groups of CGUs, and excess recoverable amounts are as follows: Excess of recoverable amount SegmentCGUGoodwill carrying amountover CGU carrying amount1 US$mUS$m AustraliaPluto-Scarborough22,4454,514 AustraliaNWS Gas4421,612 InternationalAtlantis52298 New energy/CorporateBeaumont New Ammonia3169- InternationalOther goodwill288879 Total3,866 1.Amounts are with reference to the total CGU value including goodwill. 2.A portion of the goodwill allocated to Pluto-Scarborough was disposed of due to the sell-down to LNG Japan and JERA (refer to Note B.8). 3.Represents goodwill acquired through business combination. Refer to Note B.5 for further details. Other goodwill of $288 million (2023: $288 million) has been allocated across a number of CGUs within the International segment. This represents less than 1% of net assets as at 31 December 2024. Impairment and impairment reversals No impairment or impairment reversal was recognised in the current year. Recoverable amounts have been determined using the FVLCD method using discounted cash flow projections, classified as Level 3 on the fair value hierarchy. The carrying amount of each CGU includes all assets allocated to the respective CGU. Refer to key estimates and judgements for further details. Sensitivity analysis for CGUs with goodwill Recoverable amount valuations are sensitive to changes in certain key accounting estimates and judgements (refer to key estimates and judgements for further details). Reasonably possible changes to these key assumptions are set out below: •Post-tax discount rate – plus or minus 1% (representing a change of 100 basis points) •Commodity pricing – plus or minus 10% •Foreign exchange (FX) rate – plus or minus 10% •Production volumes – plus or minus 4% The valuations of CGUs with goodwill are most sensitive to changes in commodity prices and discount rates. Reasonably possible changes in these estimates which could result in the estimated recoverable amount being equal to the carrying amount, assuming all other variables are held constant, are as follows: Decrease in commodity price1Increase in post-tax discount rate CGU% change(absolute terms) Pluto-ScarboroughN/A²N/A² NWS GasN/A²N/A² Atlantis(1.5%)0.5% 1.Brent price applies to Pluto-Scarborough and NWS Gas. WTI price (Brent – $4/bbl) applies to Atlantis. 2.Management considers there to be no reasonably possible change in the respective estimate which, in isolation, would result in the estimated recoverable amount being equal to the carrying amount. A change in any of the above assumptions would have an impact on other assumptions which when considered together may offset. This does not incorporate decisions management may take in order to mitigate the change in assumptions. Management considers there to be no reasonably possible changes in production volumes or foreign exchange rates that would, in isolation, result in the estimated recoverable amount being equal to the carrying amount. Analysis of key assumptions which could result in the carrying value to equal the recoverable value provides a basis to assess the magnitude of a reasonably possible change to the carrying amounts of respective CGUs. 172WOODSIDE ENERGY GROUP LTD
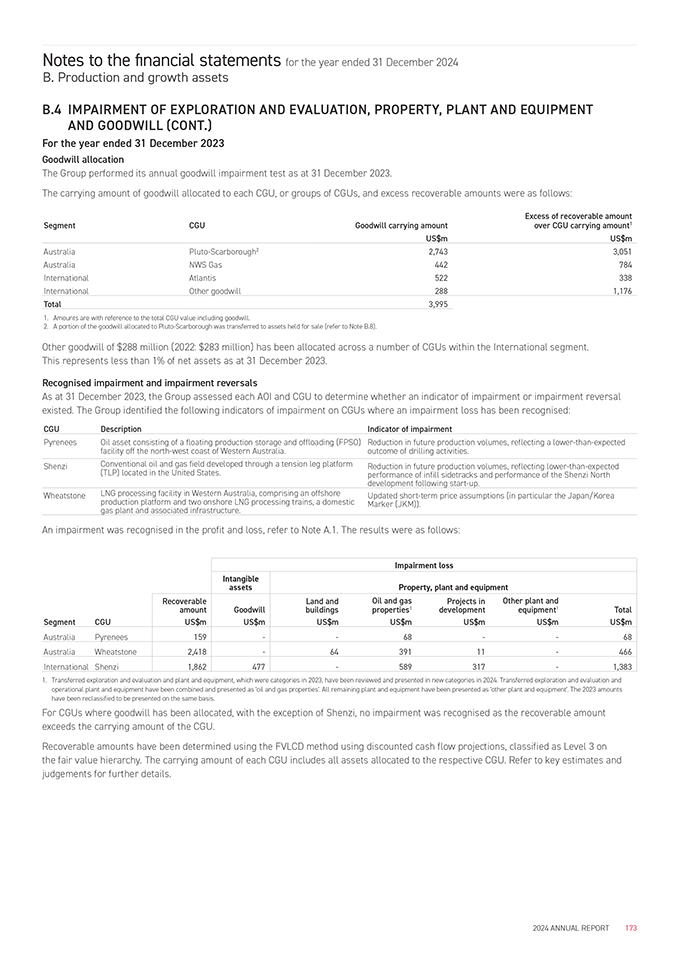
Notes to the financial statements for the year ended 31 December 2024 B. Production and growth assets B.4 IMPAIRMENT OF EXPLORATION AND EVALUATION, PROPERTY, PLANT AND EQUIPMENT AND GOODWILL (CONT.) For the year ended 31 December 2023 Goodwill allocation The Group performed its annual goodwill impairment test as at 31 December 2023. The carrying amount of goodwill allocated to each CGU, or groups of CGUs, and excess recoverable amounts were as follows: Excess of recoverable amount SegmentCGUGoodwill carrying amountover CGU carrying amount1 US$mUS$m AustraliaPluto-Scarborough22,7433,051 AustraliaNWS Gas442784 InternationalAtlantis522338 InternationalOther goodwill2881,176 Total3,995 1.Amounts are with reference to the total CGU value including goodwill. 2.A portion of the goodwill allocated to Pluto-Scarborough was transferred to assets held for sale (refer to Note B.8). Other goodwill of $288 million (2022: $283 million) has been allocated across a number of CGUs within the International segment. This represents less than 1% of net assets as at 31 December 2023. Recognised impairment and impairment reversals As at 31 December 2023, the Group assessed each AOI and CGU to determine whether an indicator of impairment or impairment reversal existed. The Group identified the following indicators of impairment on CGUs where an impairment loss has been recognised: CGUDescriptionIndicator of impairment PyreneesOil asset consisting of a floating production storage and offloading (FPSO)Reduction in future production volumes, reflecting a lower-than-expected facility off the north-west coast of Western Australia.outcome of drilling activities. ShenziConventional oil and gas field developed through a tension leg platformReduction in future production volumes, reflecting lower-than-expected (TLP) located in the United States.performance of infill sidetracks and performance of the Shenzi North development following start-up. WheatstoneLNG processing facility in Western Australia, comprising an offshoreUpdated short-term price assumptions (in particular the Japan/Korea production platform and two onshore LNG processing trains, a domesticMarker (JKM)). gas plant and associated infrastructure. An impairment was recognised in the profit and loss, refer to Note A.1. The results were as follows: Impairment loss IntangibleProperty, plant and equipment assets RecoverableGoodwillLand andOil and gasProjects inOther plant andTotal amountbuildingsproperties1developmentequipment1 SegmentCGUUS$mUS$mUS$mUS$mUS$mUS$mUS$m AustraliaPyrenees159--68--68 AustraliaWheatstone2,418-6439111-466 InternationalShenzi1,862477-589317-1,383 1.Transferred exploration and evaluation and plant and equipment, which were categories in 2023, have been reviewed and presented in new categories in 2024. Transferred exploration and evaluation and operational plant and equipment have been combined and presented as ‘oil and gas properties’. All remaining plant and equipment have been presented as ‘other plant and equipment’. The 2023 amounts have been reclassified to be presented on the same basis. For CGUs where goodwill has been allocated, with the exception of Shenzi, no impairment was recognised as the recoverable amount exceeds the carrying amount of the CGU. Recoverable amounts have been determined using the FVLCD method using discounted cash flow projections, classified as Level 3 on the fair value hierarchy. The carrying amount of each CGU includes all assets allocated to the respective CGU. Refer to key estimates and judgements for further details. 2024 ANNUAL REPORT173
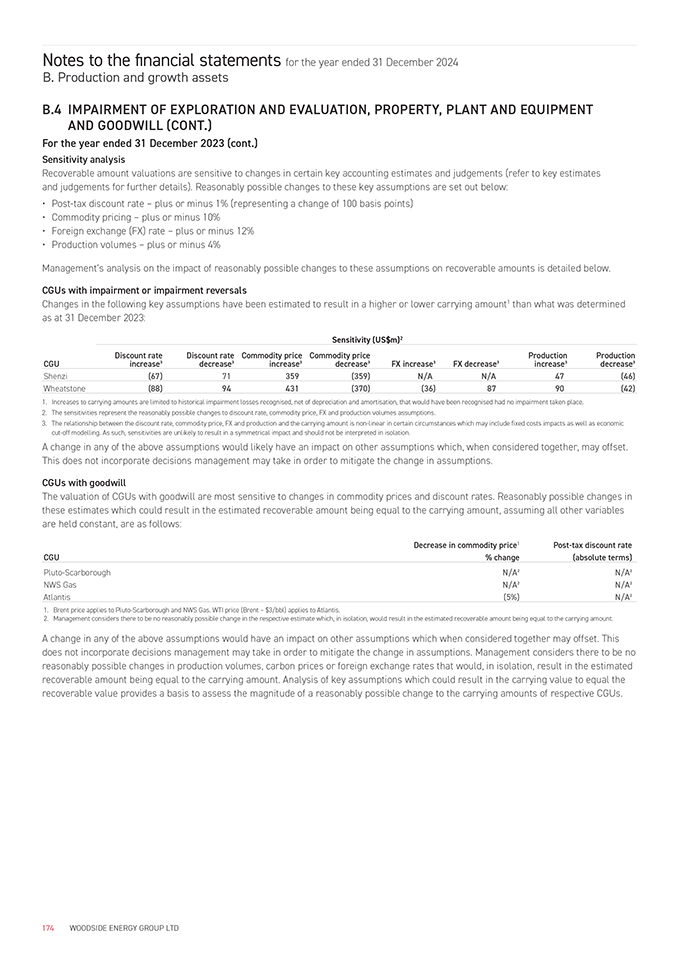
Notes to the financial statements for the year ended 31 December 2024 B. Production and growth assets B.4 IMPAIRMENT OF EXPLORATION AND EVALUATION, PROPERTY, PLANT AND EQUIPMENT AND GOODWILL (CONT.) For the year ended 31 December 2023 (cont.) Sensitivity analysis Recoverable amount valuations are sensitive to changes in certain key accounting estimates and judgements (refer to key estimates and judgements for further details). Reasonably possible changes to these key assumptions are set out below: • Post-tax discount rate – plus or minus 1% (representing a change of 100 basis points) • Commodity pricing – plus or minus 10% •Foreign exchange (FX) rate – plus or minus 12% •Production volumes – plus or minus 4% Management’s analysis on the impact of reasonably possible changes to these assumptions on recoverable amounts is detailed below. CGUs with impairment or impairment reversals Changes in the following key assumptions have been estimated to result in a higher or lower carrying amount1 than what was determined as at 31 December 2023: Sensitivity (US$m)2 CGUDiscount rateDiscount rateCommodity priceCommodity priceFX increase³FX decrease³ProductionProduction increase³decrease³increase³decrease³increase³decrease³ Shenzi(67)71359(359)N/AN/A47(46) Wheatstone(88)94431(370)(36)8790(42) 1.Increases to carrying amounts are limited to historical impairment losses recognised, net of depreciation and amortisation, that would have been recognised had no impairment taken place. 2.The sensitivities represent the reasonably possible changes to discount rate, commodity price, FX and production volumes assumptions. 3.The relationship between the discount rate, commodity price, FX and production and the carrying amount is non-linear in certain circumstances which may include fixed costs impacts as well as economic cut-off modelling. As such, sensitivities are unlikely to result in a symmetrical impact and should not be interpreted in isolation. A change in any of the above assumptions would likely have an impact on other assumptions which, when considered together, may offset. This does not incorporate decisions management may take in order to mitigate the change in assumptions. CGUs with goodwill The valuation of CGUs with goodwill are most sensitive to changes in commodity prices and discount rates. Reasonably possible changes in these estimates which could result in the estimated recoverable amount being equal to the carrying amount, assuming all other variables are held constant, are as follows: Decrease in commodity price1Post-tax discount rate CGU% change(absolute terms) Pluto-ScarboroughN/A²N/A² NWS GasN/A²N/A² Atlantis(5%)N/A² 1.Brent price applies to Pluto-Scarborough and NWS Gas. WTI price (Brent – $3/bbl) applies to Atlantis. 2.Management considers there to be no reasonably possible change in the respective estimate which, in isolation, would result in the estimated recoverable amount being equal to the carrying amount. A change in any of the above assumptions would have an impact on other assumptions which when considered together may offset. This does not incorporate decisions management may take in order to mitigate the change in assumptions. Management considers there to be no reasonably possible changes in production volumes, carbon prices or foreign exchange rates that would, in isolation, result in the estimated recoverable amount being equal to the carrying amount. Analysis of key assumptions which could result in the carrying value to equal the recoverable value provides a basis to assess the magnitude of a reasonably possible change to the carrying amounts of respective CGUs. 174WOODSIDE ENERGY GROUP LTD
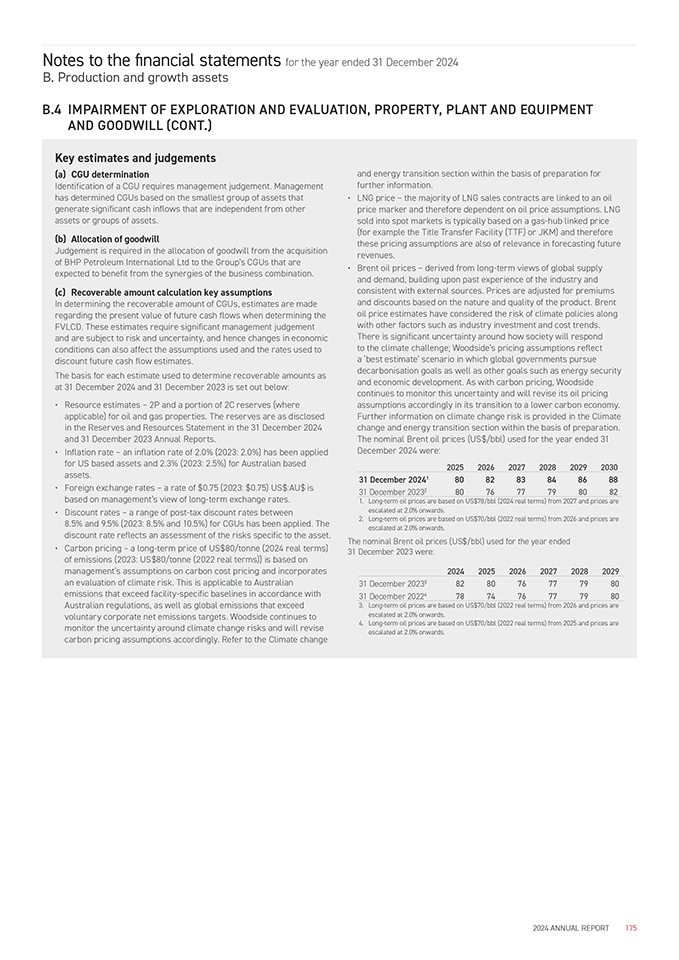
Notes to the financial statements for the year ended 31 December 2024 B. Production and growth assets B.4 IMPAIRMENT OF EXPLORATION AND EVALUATION, PROPERTY, PLANT AND EQUIPMENT AND GOODWILL (CONT.) Key estimates and judgements (a) CGU determination Identification of a CGU requires management judgement. Management has determined CGUs based on the smallest group of assets that generate significant cash inflows that are independent from other assets or groups of assets. (b) Allocation of goodwill Judgement is required in the allocation of goodwill from the acquisition of BHP Petroleum International Ltd to the Group’s CGUs that are expected to benefit from the synergies of the business combination. (c) Recoverable amount calculation key assumptions In determining the recoverable amount of CGUs, estimates are made regarding the present value of future cash flows when determining the FVLCD. These estimates require significant management judgement and are subject to risk and uncertainty, and hence changes in economic conditions can also affect the assumptions used and the rates used to discount future cash flow estimates. The basis for each estimate used to determine recoverable amounts as at 31 December 2024 and 31 December 2023 is set out below: • Resource estimates – 2P and a portion of 2C reserves (where applicable) for oil and gas properties. The reserves are as disclosed in the Reserves and Resources Statement in the 31 December 2024 and 31 December 2023 Annual Reports. • Inflation rate – an inflation rate of 2.0% (2023: 2.0%) has been applied for US based assets and 2.3% (2023: 2.5%) for Australian based assets. •Foreign exchange rates – a rate of $0.75 (2023: $0.75) US$:AU$ is based on management’s view of long-term exchange rates. •Discount rates – a range of post-tax discount rates between 8.5% and 9.5% (2023: 8.5% and 10.5%) for CGUs has been applied. The discount rate reflects an assessment of the risks specific to the asset. •Carbon pricing – a long-term price of US$80/tonne (2024 real terms) of emissions (2023: US$80/tonne (2022 real terms)) is based on management’s assumptions on carbon cost pricing and incorporates an evaluation of climate risk. This is applicable to Australian emissions that exceed facility-specific baselines in accordance with Australian regulations, as well as global emissions that exceed voluntary corporate net emissions targets. Woodside continues to monitor the uncertainty around climate change risks and will revise carbon pricing assumptions accordingly. Refer to the Climate change and energy transition section within the basis of preparation for further information. •LNG price – the majority of LNG sales contracts are linked to an oil price marker and therefore dependent on oil price assumptions. LNG sold into spot markets is typically based on a gas-hub linked price (for example the Title Transfer Facility (TTF) or JKM) and therefore these pricing assumptions are also of relevance in forecasting future revenues. •Brent oil prices – derived from long-term views of global supply and demand, building upon past experience of the industry and consistent with external sources. Prices are adjusted for premiums and discounts based on the nature and quality of the product. Brent oil price estimates have considered the risk of climate policies along with other factors such as industry investment and cost trends. There is significant uncertainty around how society will respond to the climate challenge; Woodside’s pricing assumptions reflect a ‘best estimate’ scenario in which global governments pursue decarbonisation goals as well as other goals such as energy security and economic development. As with carbon pricing, Woodside continues to monitor this uncertainty and will revise its oil pricing assumptions accordingly in its transition to a lower carbon economy. Further information on climate change risk is provided in the Climate change and energy transition section within the basis of preparation. The nominal Brent oil prices (US$/bbl) used for the year ended 31 December 2024 were: 202520262027202820292030 31 December 20241808283848688 31 December 20232807677798082 1.Long-term oil prices are based on US$78/bbl (2024 real terms) from 2027 and prices are escalated at 2.0% onwards. 2.Long-term oil prices are based on US$70/bbl (2022 real terms) from 2026 and prices are escalated at 2.0% onwards. The nominal Brent oil prices (US$/bbl) used for the year ended 31 December 2023 were: 202420252026202720282029 31 December 20233828076777980 31 December 20224787476777980 3.Long-term oil prices are based on US$70/bbl (2022 real terms) from 2026 and prices are escalated at 2.0% onwards. 4.Long-term oil prices are based on US$70/bbl (2022 real terms) from 2025 and prices are escalated at 2.0% onwards. 2024 ANNUAL REPORT175
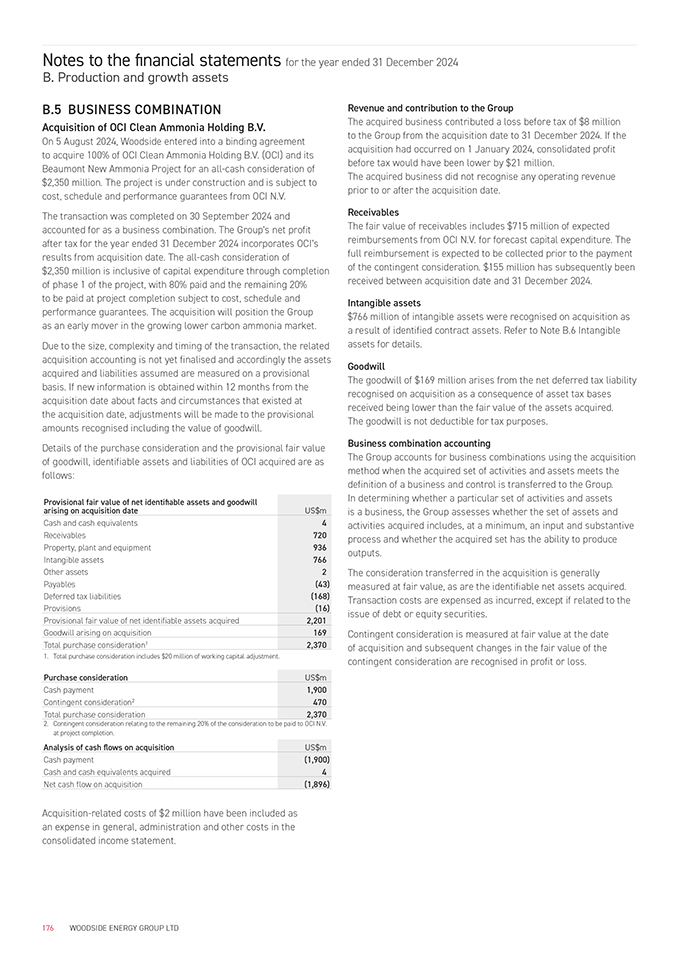
Notes to the financial statements for the year ended 31 December 2024 B. Production and growth assets B.5 BUSINESS COMBINATION Acquisition of OCI Clean Ammonia Holding B.V. On 5 August 2024, Woodside entered into a binding agreement to acquire 100% of OCI Clean Ammonia Holding B.V. (OCI) and its Beaumont New Ammonia Project for an all-cash consideration of $2,350 million. The project is under construction and is subject to cost, schedule and performance guarantees from OCI N.V. The transaction was completed on 30 September 2024 and accounted for as a business combination. The Group’s net profit after tax for the year ended 31 December 2024 incorporates OCI’s results from acquisition date. The all-cash consideration of $2,350 million is inclusive of capital expenditure through completion of phase 1 of the project, with 80% paid and the remaining 20% to be paid at project completion subject to cost, schedule and performance guarantees. The acquisition will position the Group as an early mover in the growing lower carbon ammonia market. Due to the size, complexity and timing of the transaction, the related acquisition accounting is not yet finalised and accordingly the assets acquired and liabilities assumed are measured on a provisional basis. If new information is obtained within 12 months from the acquisition date about facts and circumstances that existed at the acquisition date, adjustments will be made to the provisional amounts recognised including the value of goodwill. Details of the purchase consideration and the provisional fair value of goodwill, identifiable assets and liabilities of OCI acquired are as follows: Provisional fair value of net identifiable assets and goodwill arising on acquisition date US$m Cash and cash equivalents4 Receivables720 Property, plant and equipment936 Intangible assets766 Other assets2 Payables(43) Deferred tax liabilities(168) Provisions(16) Provisional fair value of net identifiable assets acquired2,201 Goodwill arising on acquisition169 Total purchase consideration12,370 1. Total purchase consideration includes $20 million of working capital adjustment. Purchase considerationUS$m Cash payment1,900 Contingent consideration2470 Total purchase consideration2,370 Revenue and contribution to the Group The acquired business contributed a loss before tax of $8 million to the Group from the acquisition date to 31 December 2024. If the acquisition had occurred on 1 January 2024, consolidated profit before tax would have been lower by $21 million. The acquired business did not recognise any operating revenue prior to or after the acquisition date. Receivables The fair value of receivables includes $715 million of expected reimbursements from OCI N.V. for forecast capital expenditure. The full reimbursement is expected to be collected prior to the payment of the contingent consideration. $155 million has subsequently been received between acquisition date and 31 December 2024. Intangible assets $766 million of intangible assets were recognised on acquisition as a result of identified contract assets. Refer to Note B.6 Intangible assets for details. Goodwill The goodwill of $169 million arises from the net deferred tax liability recognised on acquisition as a consequence of asset tax bases received being lower than the fair value of the assets acquired. The goodwill is not deductible for tax purposes. Business combination accounting The Group accounts for business combinations using the acquisition method when the acquired set of activities and assets meets the definition of a business and control is transferred to the Group. In determining whether a particular set of activities and assets is a business, the Group assesses whether the set of assets and activities acquired includes, at a minimum, an input and substantive process and whether the acquired set has the ability to produce outputs. The consideration transferred in the acquisition is generally measured at fair value, as are the identifiable net assets acquired. Transaction costs are expensed as incurred, except if related to the issue of debt or equity securities. Contingent consideration is measured at fair value at the date of acquisition and subsequent changes in the fair value of the contingent consideration are recognised in profit or loss. 2.Contingent consideration relating to the remaining 20% of the consideration to be paid to OCI N.V. at project completion. Analysis of cash flows on acquisitionUS$m Cash payment(1,900) Cash and cash equivalents acquired4 Net cash flow on acquisition(1,896) Acquisition-related costs of $2 million have been included as an expense in general, administration and other costs in the consolidated income statement. 176WOODSIDE ENERGY GROUP LTD

Notes to the financial statements for the year ended 31 December 2024 B. Production and growth assets B.5 BUSINESS COMBINATION (CONT.) Key estimates and judgements (a) Nature of acquisition Judgement is required to determine if the acquisition is a business combination due to the stage of completion of the project and the timing of transfer of employees. The project is under construction, with agreements in place to complete construction and transfer a fully operational asset together with a workforce to the Group in 2025. The agreements are in place at acquisition date and provide Woodside with control over the future economic benefits of the project, and the necessary inputs and processes to create outputs, meeting the definition of a business combination. (b) Fair value determination for net assets acquired Judgement is required to determine the fair value of assets acquired and liabilities assumed in a business combination, which can have a material impact on resultant goodwill. This includes the use of a cash flow model to estimate the expected future cash flows and the discount rate used. On acquisition date, the reproduction cost method was used to fair value the property, plant and equipment in its construction phase. The reproduction cost method calculates the cost to construct an equivalent asset with the same specifications. (c) Contingent consideration Judgement is required to determine the fair value of the contingent consideration which includes consideration on the construction progress, estimates to complete compared to the schedule and performance guarantees. 2024 ANNUAL REPORT 177
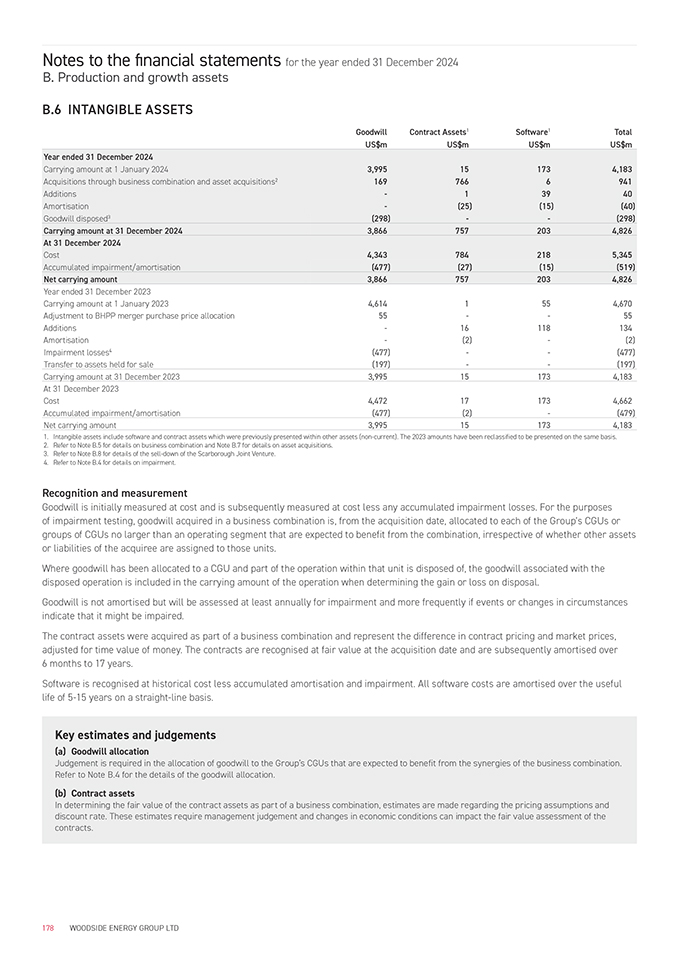
Notes to the financial statements for the year ended 31 December 2024 B. Production and growth assets B.6 INTANGIBLE ASSETS Goodwill Contract Assets1Software1Total US$mUS$mUS$mUS$m Year ended 31 December 2024 Carrying amount at 1 January 20243,995151734,183 Acquisitions through business combination and asset acquisitions21697666941 Additions-13940 Amortisation-(25)(15)(40) Goodwill disposed3(298)--(298) Carrying amount at 31 December 20243,8667572034,826 At 31 December 2024 Cost4,3437842185,345 Accumulated impairment/amortisation(477)(27)(15)(519) Net carrying amount3,8667572034,826 Year ended 31 December 2023 Carrying amount at 1 January 20234,6141554,670 Adjustment to BHPP merger purchase price allocation55--55 Additions-16118134 Amortisation-(2)-(2) Impairment losses4(477)--(477) Transfer to assets held for sale(197)--(197) Carrying amount at 31 December 20233,995151734,183 At 31 December 2023 Cost4,472171734,662 Accumulated impairment/amortisation(477)(2)-(479) Net carrying amount3,995151734,183 1.Intangible assets include software and contract assets which were previously presented within other assets (non-current). The 2023 amounts have been reclassified to be presented on the same basis. 2.Refer to Note B.5 for details on business combination and Note B.7 for details on asset acquisitions. 3.Refer to Note B.8 for details of the sell-down of the Scarborough Joint Venture. 4.Refer to Note B.4 for details on impairment. Recognition and measurement Goodwill is initially measured at cost and is subsequently measured at cost less any accumulated impairment losses. For the purposes of impairment testing, goodwill acquired in a business combination is, from the acquisition date, allocated to each of the Group’s CGUs or groups of CGUs no larger than an operating segment that are expected to benefit from the combination, irrespective of whether other assets or liabilities of the acquiree are assigned to those units. Where goodwill has been allocated to a CGU and part of the operation within that unit is disposed of, the goodwill associated with the disposed operation is included in the carrying amount of the operation when determining the gain or loss on disposal. Goodwill is not amortised but will be assessed at least annually for impairment and more frequently if events or changes in circumstances indicate that it might be impaired. The contract assets were acquired as part of a business combination and represent the difference in contract pricing and market prices, adjusted for time value of money. The contracts are recognised at fair value at the acquisition date and are subsequently amortised over 6 months to 17 years. Software is recognised at historical cost less accumulated amortisation and impairment. All software costs are amortised over the useful life of 5-15 years on a straight-line basis. Key estimates and judgements (a) Goodwill allocation Judgement is required in the allocation of goodwill to the Group’s CGUs that are expected to benefit from the synergies of the business combination. Refer to Note B.4 for the details of the goodwill allocation. (b) Contract assets In determining the fair value of the contract assets as part of a business combination, estimates are made regarding the pricing assumptions and discount rate. These estimates require management judgement and changes in economic conditions can impact the fair value assessment of the contracts. 178WOODSIDE ENERGY GROUP LTD
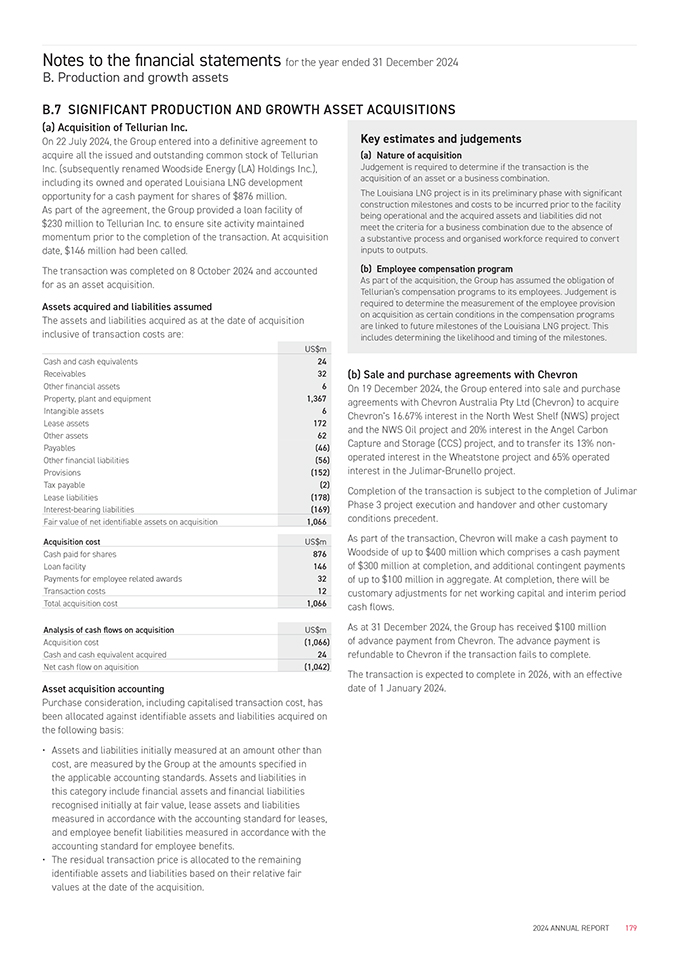
Notes to the financial statements for the year ended 31 December 2024 B. Production and growth assets B.7 SIGNIFICANT PRODUCTION AND GROWTH ASSET ACQUISITIONS (a) Acquisition of Tellurian Inc. On 22 July 2024, the Group entered into a definitive agreement to acquire all the issued and outstanding common stock of Tellurian Inc. (subsequently renamed Woodside Energy (LA) Holdings Inc.), including its owned and operated Louisiana LNG development opportunity for a cash payment for shares of $876 million. As part of the agreement, the Group provided a loan facility of $230 million to Tellurian Inc. to ensure site activity maintained momentum prior to the completion of the transaction. At acquisition date, $146 million had been called. The transaction was completed on 8 October 2024 and accounted for as an asset acquisition. Assets acquired and liabilities assumed The assets and liabilities acquired as at the date of acquisition inclusive of transaction costs are: US$m Cash and cash equivalents24 Receivables32 Other financial assets6 Property, plant and equipment1,367 Intangible assets6 Lease assets172 Other assets62 Payables(46) Other financial liabilities(56) Provisions(152) Tax payable(2) Lease liabilities(178) Interest-bearing liabilities(169) Fair value of net identifiable assets on acquisition1,066 Acquisition costUS$m Cash paid for shares876 Loan facility146 Payments for employee related awards32 Transaction costs12 Total acquisition cost1,066 Analysis of cash flows on acquisitionUS$m Acquisition cost(1,066) Cash and cash equivalent acquired24 Net cash flow on aquisition(1,042) Asset acquisition accounting Purchase consideration, including capitalised transaction cost, has been allocated against identifiable assets and liabilities acquired on the following basis: •Assets and liabilities initially measured at an amount other than cost, are measured by the Group at the amounts specified in the applicable accounting standards. Assets and liabilities in this category include financial assets and financial liabilities recognised initially at fair value, lease assets and liabilities measured in accordance with the accounting standard for leases, and employee benefit liabilities measured in accordance with the accounting standard for employee benefits. •The residual transaction price is allocated to the remaining identifiable assets and liabilities based on their relative fair values at the date of the acquisition. Key estimates and judgements (a) Nature of acquisition Judgement is required to determine if the transaction is the acquisition of an asset or a business combination. The Louisiana LNG project is in its preliminary phase with significant construction milestones and costs to be incurred prior to the facility being operational and the acquired assets and liabilities did not meet the criteria for a business combination due to the absence of a substantive process and organised workforce required to convert inputs to outputs. (b) Employee compensation program As part of the acquisition, the Group has assumed the obligation of Tellurian’s compensation programs to its employees. Judgement is required to determine the measurement of the employee provision on acquisition as certain conditions in the compensation programs are linked to future milestones of the Louisiana LNG project. This includes determining the likelihood and timing of the milestones. (b) Sale and purchase agreements with Chevron On 19 December 2024, the Group entered into sale and purchase agreements with Chevron Australia Pty Ltd (Chevron) to acquire Chevron’s 16.67% interest in the North West Shelf (NWS) project and the NWS Oil project and 20% interest in the Angel Carbon Capture and Storage (CCS) project, and to transfer its 13% non-operated interest in the Wheatstone project and 65% operated interest in the Julimar-Brunello project. Completion of the transaction is subject to the completion of Julimar Phase 3 project execution and handover and other customary conditions precedent. As part of the transaction, Chevron will make a cash payment to Woodside of up to $400 million which comprises a cash payment of $300 million at completion, and additional contingent payments of up to $100 million in aggregate. At completion, there will be customary adjustments for net working capital and interim period cash flows. As at 31 December 2024, the Group has received $100 million of advance payment from Chevron. The advance payment is refundable to Chevron if the transaction fails to complete. The transaction is expected to complete in 2026, with an effective date of 1 January 2024. 2024 ANNUAL REPORT179

Notes to the financial statements for the year ended 31 December 2024 B. Production and growth assets B.8 DISPOSAL OF ASSETS (a) Sell-down of Scarborough Joint Venture to LNG Japan On 8 August 2023 the Group entered into a sale and purchase agreement with LNG Japan for the sale of a 10% non-operating participating interest in the Scarborough Joint Venture. As at 31 December 2023, the Group reclassified $823 million of assets, being the carrying value of the 10% interest in the Scarborough Joint Venture, to assets held for sale. Liabilities of $94 million were reclassified to liabilities directly associated with assets held for sale. The transaction completed on 26 March 2024, reducing the Group’s participating interest from 100% to 90%. Proceeds from the sale were $910 million, including capital reimbursements and escalation. Delays to the first cargo or cost overruns in specific circumstances may result in payments by Woodside to LNG Japan of up to a maximum of $50 million. For the year ended 31 December 2024, the Group recognised a pre-tax gain on sale of $121 million. (b) Sell-down of Scarborough Joint Venture to JERA On 23 February 2024, the Group entered into a sale and purchase agreement with JERA for the sale of a 15.1% non-operating participating interest in the Scarborough Joint Venture. As at 30 June 2024, the Group reclassified $1,378 million of assets, being the carrying value of the 15.1% interest in the Scarborough Joint Venture within the Australia segment, to assets held for sale. Liabilities of $119 million were reclassified to liabilities directly associated with assets held for sale. No impairment of assets occurred on reclassification to held for sale. The transaction completed on 31 October 2024, reducing the Group’s participating interest from 90% to 74.9%. Proceeds from the sale were $1,425 million which includes the reimbursement from JERA for its share of expenditure for the Scarborough project from the effective date of 1 January 2022. For the year ended 31 December 2024, the Group recognised a pre-tax gain on sale of $88 million. 180 WOODSIDE ENERGY GROUP LTD
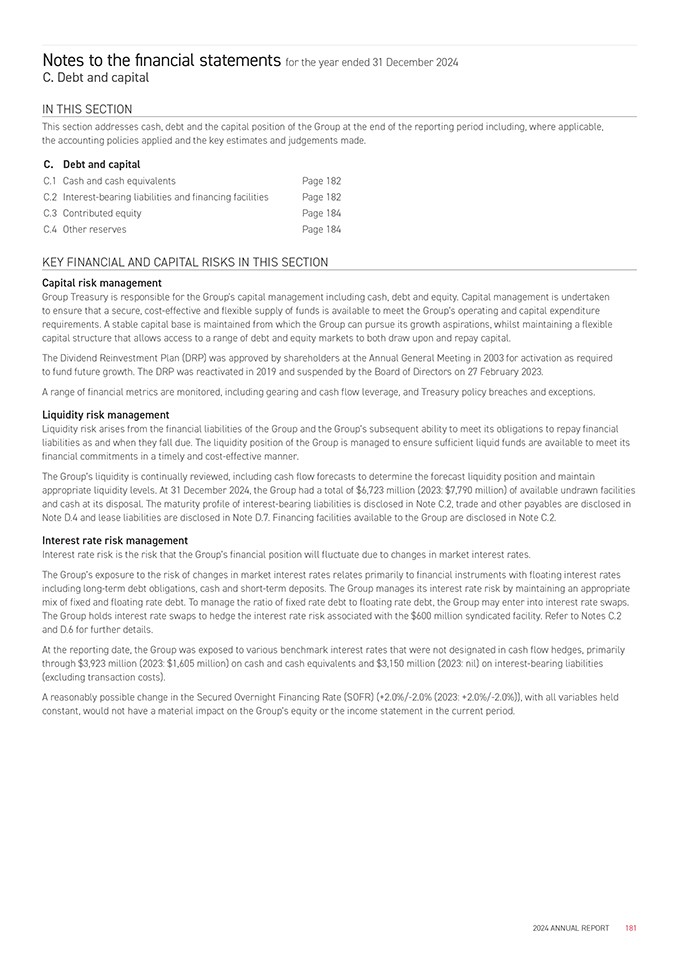
Notes to the financial statements for the year ended 31 December 2024 C. Debt and capital IN THIS SECTION This section addresses cash, debt and the capital position of the Group at the end of the reporting period including, where applicable, the accounting policies applied and the key estimates and judgements made. C. Debt and capital C.1Cash and cash equivalentsPage 182 C.2Interest-bearing liabilities and financing facilitiesPage 182 C.3Contributed equityPage 184 C.4Other reservesPage 184 KEY FINANCIAL AND CAPITAL RISKS IN THIS SECTION Capital risk management Group Treasury is responsible for the Group’s capital management including cash, debt and equity. Capital management is undertaken to ensure that a secure, cost-effective and flexible supply of funds is available to meet the Group’s operating and capital expenditure requirements. A stable capital base is maintained from which the Group can pursue its growth aspirations, whilst maintaining a flexible capital structure that allows access to a range of debt and equity markets to both draw upon and repay capital. The Dividend Reinvestment Plan (DRP) was approved by shareholders at the Annual General Meeting in 2003 for activation as required to fund future growth. The DRP was reactivated in 2019 and suspended by the Board of Directors on 27 February 2023. A range of financial metrics are monitored, including gearing and cash flow leverage, and Treasury policy breaches and exceptions. Liquidity risk management Liquidity risk arises from the financial liabilities of the Group and the Group’s subsequent ability to meet its obligations to repay financial liabilities as and when they fall due. The liquidity position of the Group is managed to ensure sufficient liquid funds are available to meet its financial commitments in a timely and cost-effective manner. The Group’s liquidity is continually reviewed, including cash flow forecasts to determine the forecast liquidity position and maintain appropriate liquidity levels. At 31 December 2024, the Group had a total of $6,723 million (2023: $7,790 million) of available undrawn facilities and cash at its disposal. The maturity profile of interest-bearing liabilities is disclosed in Note C.2, trade and other payables are disclosed in Note D.4 and lease liabilities are disclosed in Note D.7. Financing facilities available to the Group are disclosed in Note C.2. Interest rate risk management Interest rate risk is the risk that the Group’s financial position will fluctuate due to changes in market interest rates. The Group’s exposure to the risk of changes in market interest rates relates primarily to financial instruments with floating interest rates including long-term debt obligations, cash and short-term deposits. The Group manages its interest rate risk by maintaining an appropriate mix of fixed and floating rate debt. To manage the ratio of fixed rate debt to floating rate debt, the Group may enter into interest rate swaps. The Group holds interest rate swaps to hedge the interest rate risk associated with the $600 million syndicated facility. Refer to Notes C.2 and D.6 for further details. At the reporting date, the Group was exposed to various benchmark interest rates that were not designated in cash flow hedges, primarily through $3,923 million (2023: $1,605 million) on cash and cash equivalents and $3,150 million (2023: nil) on interest-bearing liabilities (excluding transaction costs). A reasonably possible change in the Secured Overnight Financing Rate (SOFR) (+2.0%/-2.0% (2023: +2.0%/-2.0%)), with all variables held constant, would not have a material impact on the Group’s equity or the income statement in the current period. 2024 ANNUAL REPORT181
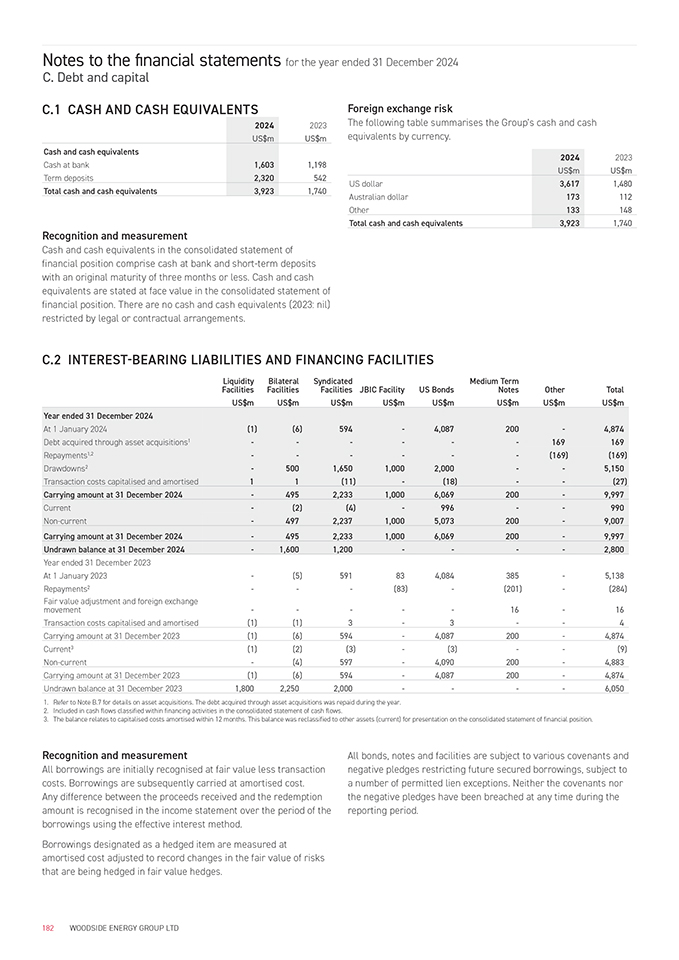
Notes to the financial statements for the year ended 31 December 2024 C. Debt and capital C.1 CASH AND CASH EQUIVALENTS 2024 2023 US$mUS$m Cash and cash equivalents Cash at bank1,6031,198 Term deposits2,320542 Total cash and cash equivalents3,9231,740 Recognition and measurement Foreign exchange risk The following table summarises the Group’s cash and cash equivalents by currency. 20242023 US$mUS$m US dollar3,6171,480 Australian dollar173112 Other133148 Total cash and cash equivalents3,9231,740 Cash and cash equivalents in the consolidated statement of financial position comprise cash at bank and short-term deposits with an original maturity of three months or less. Cash and cash equivalents are stated at face value in the consolidated statement of financial position. There are no cash and cash equivalents (2023: nil) restricted by legal or contractual arrangements. C.2 INTEREST-BEARING LIABILITIES AND FINANCING FACILITIES LiquidityBilateralSyndicatedJBIC FacilityUS BondsMedium TermOtherTotal FacilitiesFacilitiesFacilitiesNotes US$mUS$mUS$mUS$mUS$mUS$mUS$mUS$m Year ended 31 December 2024 At 1 January 2024(1)(6)594-4,087200-4,874 Debt acquired through asset acquisitions1------169169 Repayments1,2------(169)(169) Drawdowns2-5001,6501,0002,000--5,150 Transaction costs capitalised and amortised11(11)-(18)--(27) Carrying amount at 31 December 2024-4952,2331,0006,069200-9,997 Current-(2)(4)-996--990 Non-current-4972,2371,0005,073200-9,007 Carrying amount at 31 December 2024-4952,2331,0006,069200-9,997 Undrawn balance at 31 December 2024-1,6001,200----2,800 Year ended 31 December 2023 At 1 January 2023-(5)591834,084385-5,138 Repayments2---(83)-(201)-(284) Fair value adjustment and foreign exchange-----16-16 movement Transaction costs capitalised and amortised(1)(1)3-3--4 Carrying amount at 31 December 2023(1)(6)594-4,087200-4,874 Current3(1)(2)(3)-(3)--(9) Non-current-(4)597-4,090200-4,883 Carrying amount at 31 December 2023(1)(6)594-4,087200-4,874 Undrawn balance at 31 December 20231,8002,2502,000----6,050 1.Refer to Note B.7 for details on asset acquisitions. The debt acquired through asset acquisitions was repaid during the year. 2.Included in cash flows classified within financing activities in the consolidated statement of cash flows. 3.The balance relates to capitalised costs amortised within 12 months. This balance was reclassified to other assets (current) for presentation on the consolidated statement of financial position. Recognition and measurement All borrowings are initially recognised at fair value less transaction costs. Borrowings are subsequently carried at amortised cost. Any difference between the proceeds received and the redemption amount is recognised in the income statement over the period of the borrowings using the effective interest method. Borrowings designated as a hedged item are measured at amortised cost adjusted to record changes in the fair value of risks that are being hedged in fair value hedges. All bonds, notes and facilities are subject to various covenants and negative pledges restricting future secured borrowings, subject to a number of permitted lien exceptions. Neither the covenants nor the negative pledges have been breached at any time during the reporting period. 182WOODSIDE ENERGY GROUP LTD
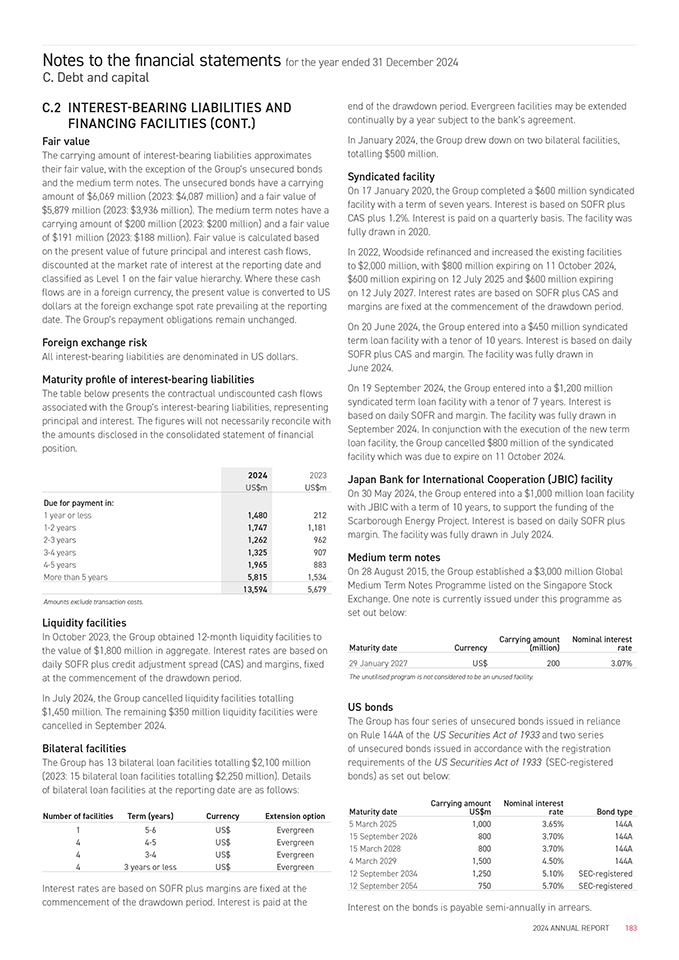
Notes to the financial statements for the year ended 31 December 2024 C. Debt and capital C.2 INTEREST-BEARING LIABILITIES AND FINANCING FACILITIES (CONT.) Fair value The carrying amount of interest-bearing liabilities approximates their fair value, with the exception of the Group’s unsecured bonds and the medium term notes. The unsecured bonds have a carrying amount of $6,069 million (2023: $4,087 million) and a fair value of $5,879 million (2023: $3,936 million). The medium term notes have a carrying amount of $200 million (2023: $200 million) and a fair value of $191 million (2023: $188 million). Fair value is calculated based on the present value of future principal and interest cash flows, discounted at the market rate of interest at the reporting date and classified as Level 1 on the fair value hierarchy. Where these cash flows are in a foreign currency, the present value is converted to US dollars at the foreign exchange spot rate prevailing at the reporting date. The Group’s repayment obligations remain unchanged. Foreign exchange risk All interest-bearing liabilities are denominated in US dollars. Maturity profile of interest-bearing liabilities The table below presents the contractual undiscounted cash flows associated with the Group’s interest-bearing liabilities, representing principal and interest. The figures will not necessarily reconcile with the amounts disclosed in the consolidated statement of financial position. 2024 2023 US$mUS$m Due for payment in: 1 year or less1,480212 1-2 years1,7471,181 2-3 years1,262962 3-4 years1,325907 4-5 years1,965883 More than 5 years5,8151,534 13,5945,679 Amounts exclude transaction costs. Liquidity facilities end of the drawdown period. Evergreen facilities may be extended continually by a year subject to the bank’s agreement. In January 2024, the Group drew down on two bilateral facilities, totalling $500 million. Syndicated facility On 17 January 2020, the Group completed a $600 million syndicated facility with a term of seven years. Interest is based on SOFR plus CAS plus 1.2%. Interest is paid on a quarterly basis. The facility was fully drawn in 2020. In 2022, Woodside refinanced and increased the existing facilities to $2,000 million, with $800 million expiring on 11 October 2024, $600 million expiring on 12 July 2025 and $600 million expiring on 12 July 2027. Interest rates are based on SOFR plus CAS and margins are fixed at the commencement of the drawdown period. On 20 June 2024, the Group entered into a $450 million syndicated term loan facility with a tenor of 10 years. Interest is based on daily SOFR plus CAS and margin. The facility was fully drawn in June 2024. On 19 September 2024, the Group entered into a $1,200 million syndicated term loan facility with a tenor of 7 years. Interest is based on daily SOFR and margin. The facility was fully drawn in September 2024. In conjunction with the execution of the new term loan facility, the Group cancelled $800 million of the syndicated facility which was due to expire on 11 October 2024. Japan Bank for International Cooperation (JBIC) facility On 30 May 2024, the Group entered into a $1,000 million loan facility with JBIC with a term of 10 years, to support the funding of the Scarborough Energy Project. Interest is based on daily SOFR plus margin. The facility was fully drawn in July 2024. Medium term notes On 28 August 2015, the Group established a $3,000 million Global Medium Term Notes Programme listed on the Singapore Stock Exchange. One note is currently issued under this programme as set out below: In October 2023, the Group obtained 12-month liquidity facilities to the value of $1,800 million in aggregate. Interest rates are based on daily SOFR plus credit adjustment spread (CAS) and margins, fixed at the commencement of the drawdown period. In July 2024, the Group cancelled liquidity facilities totalling $1,450 million. The remaining $350 million liquidity facilities were cancelled in September 2024. Bilateral facilities The Group has 13 bilateral loan facilities totalling $2,100 million (2023: 15 bilateral loan facilities totalling $2,250 million). Details of bilateral loan facilities at the reporting date are as follows: Number of facilitiesTerm (years)CurrencyExtension option 15-6US$Evergreen 44-5US$Evergreen 43-4US$Evergreen 43 years or lessUS$Evergreen Interest rates are based on SOFR plus margins are fixed at the commencement of the drawdown period. Interest is paid at the Maturity dateCurrencyCarrying amountNominal interest (million)rate 29 January 2027US$2003.07% The unutilised program is not considered to be an unused facility. US bonds The Group has four series of unsecured bonds issued in reliance on Rule 144A of the US Securities Act of 1933 and two series of unsecured bonds issued in accordance with the registration requirements of the US Securities Act of 1933 (SEC-registered bonds) as set out below: Maturity dateCarrying amountNominal interestBond type US$mrate 5 March 20251,0003.65%144A 15 September 20268003.70%144A 15 March 20288003.70%144A 4 March 20291,5004.50%144A 12 September 20341,2505.10%SEC-registered 12 September 20547505.70%SEC-registered Interest on the bonds is payable semi-annually in arrears. 2024 ANNUAL REPORT183
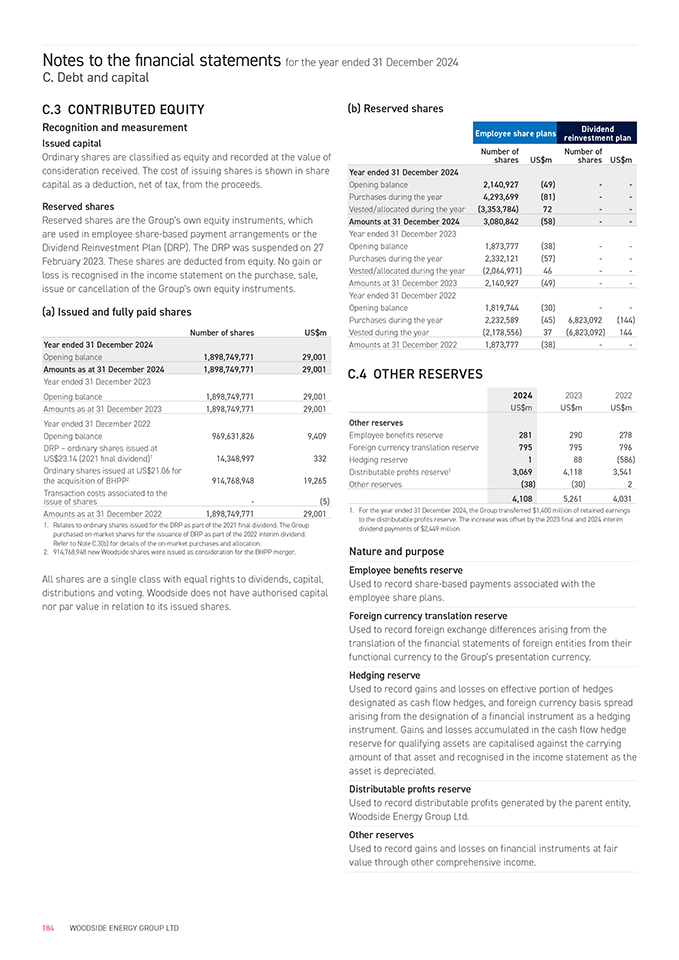
Notes to the financial statements for the year ended 31 December 2024 C. Debt and capital C.3 CONTRIBUTED EQUITY Recognition and measurement Issued capital Ordinary shares are classified as equity and recorded at the value of consideration received. The cost of issuing shares is shown in share capital as a deduction, net of tax, from the proceeds. Reserved shares Reserved shares are the Group’s own equity instruments, which are used in employee share-based payment arrangements or the Dividend Reinvestment Plan (DRP). The DRP was suspended on 27 February 2023. These shares are deducted from equity. No gain or loss is recognised in the income statement on the purchase, sale, issue or cancellation of the Group’s own equity instruments. (a) Issued and fully paid shares Number of shares US$m Year ended 31 December 2024 Opening balance1,898,749,77129,001 (b) Reserved shares Employee share plansDividend reinvestment plan Number ofUS$mNumber ofUS$m sharesshares Year ended 31 December 2024 Opening balance2,140,927(49)-- Purchases during the year4,293,699(81)-- Vested/allocated during the year(3,353,784)72-- Amounts at 31 December 20243,080,842(58)-- Year ended 31 December 2023 Opening balance1,873,777(38)-- Purchases during the year2,332,121(57)-- Vested/allocated during the year(2,064,971)46-- Amounts at 31 December 20232,140,927(49)-- Year ended 31 December 2022 Opening balance1,819,744(30)-- Purchases during the year2,232,589(45)6,823,092(144) Vested during the year(2,178,556)37(6,823,092)144 Amounts at 31 December 20221,873,777(38)-- Amounts as at 31 December 20241,898,749,77129,001 C.4 OTHER RESERVES Year ended 31 December 2023 Opening balance1,898,749,77129,001 Amounts as at 31 December 20231,898,749,77129,001 Year ended 31 December 2022 Opening balance969,631,8269,409 DRP – ordinary shares issued at14,348,997332 US$23.14 (2021 fnal dividend)1 Ordinary shares issued at US$21.06 for914,768,94819,265 the acquisition of BHPP2 Transaction costs associated to the-(5) issue of shares Amounts as at 31 December 20221,898,749,77129,001 1.Relates to ordinary shares issued for the DRP as part of the 2021 final dividend. The Group purchased on-market shares for the issuance of DRP as part of the 2022 interim dividend. Refer to Note C.3(b) for details of the on-market purchases and allocation. 2.914,768,948 new Woodside shares were issued as consideration for the BHPP merger. All shares are a single class with equal rights to dividends, capital, distributions and voting. Woodside does not have authorised capital nor par value in relation to its issued shares. 202420232022 US$mUS$mUS$m Other reserves Employee benefits reserve281290278 Foreign currency translation reserve795795796 Hedging reserve188(586) Distributable profts reserve13,0694,1183,541 Other reserves(38)(30)2 4,1085,2614,031 1.For the year ended 31 December 2024, the Group transferred $1,400 million of retained earnings to the distributable profits reserve. The increase was offset by the 2023 final and 2024 interim dividend payments of $2,449 million. Nature and purpose Employee benefits reserve Used to record share-based payments associated with the employee share plans. Foreign currency translation reserve Used to record foreign exchange differences arising from the translation of the financial statements of foreign entities from their functional currency to the Group’s presentation currency. Hedging reserve Used to record gains and losses on effective portion of hedges designated as cash flow hedges, and foreign currency basis spread arising from the designation of a financial instrument as a hedging instrument. Gains and losses accumulated in the cash flow hedge reserve for qualifying assets are capitalised against the carrying amount of that asset and recognised in the income statement as the asset is depreciated. Distributable profits reserve Used to record distributable profits generated by the parent entity, Woodside Energy Group Ltd. Other reserves Used to record gains and losses on financial instruments at fair value through other comprehensive income. 184WOODSIDE ENERGY GROUP LTD
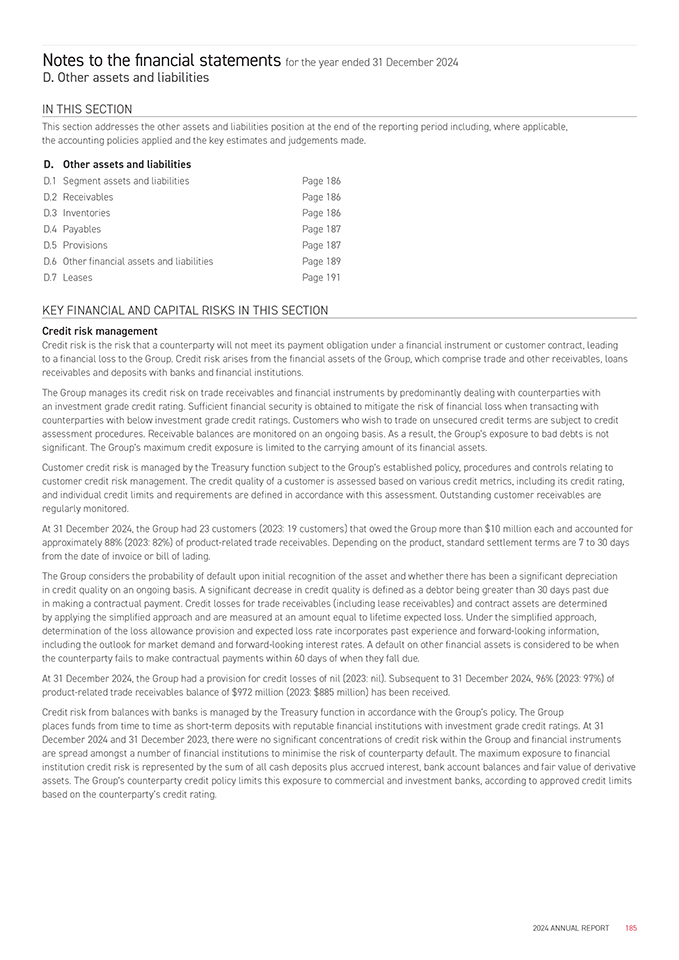
Notes to the financial statements for the year ended 31 December 2024 D. Other assets and liabilities IN THIS SECTION This section addresses the other assets and liabilities position at the end of the reporting period including, where applicable, the accounting policies applied and the key estimates and judgements made. D. Other assets and liabilities D.1Segment assets and liabilitiesPage 186 D.2ReceivablesPage 186 D.3InventoriesPage 186 D.4PayablesPage 187 D.5ProvisionsPage 187 D.6Other financial assets and liabilitiesPage 189 D.7LeasesPage 191 KEY FINANCIAL AND CAPITAL RISKS IN THIS SECTION Credit risk management Credit risk is the risk that a counterparty will not meet its payment obligation under a financial instrument or customer contract, leading to a financial loss to the Group. Credit risk arises from the financial assets of the Group, which comprise trade and other receivables, loans receivables and deposits with banks and financial institutions. The Group manages its credit risk on trade receivables and financial instruments by predominantly dealing with counterparties with an investment grade credit rating. Sufficient financial security is obtained to mitigate the risk of financial loss when transacting with counterparties with below investment grade credit ratings. Customers who wish to trade on unsecured credit terms are subject to credit assessment procedures. Receivable balances are monitored on an ongoing basis. As a result, the Group’s exposure to bad debts is not significant. The Group’s maximum credit exposure is limited to the carrying amount of its financial assets. Customer credit risk is managed by the Treasury function subject to the Group’s established policy, procedures and controls relating to customer credit risk management. The credit quality of a customer is assessed based on various credit metrics, including its credit rating, and individual credit limits and requirements are defined in accordance with this assessment. Outstanding customer receivables are regularly monitored. At 31 December 2024, the Group had 23 customers (2023: 19 customers) that owed the Group more than $10 million each and accounted for approximately 88% (2023: 82%) of product-related trade receivables. Depending on the product, standard settlement terms are 7 to 30 days from the date of invoice or bill of lading. The Group considers the probability of default upon initial recognition of the asset and whether there has been a significant depreciation in credit quality on an ongoing basis. A significant decrease in credit quality is defined as a debtor being greater than 30 days past due in making a contractual payment. Credit losses for trade receivables (including lease receivables) and contract assets are determined by applying the simplified approach and are measured at an amount equal to lifetime expected loss. Under the simplified approach, determination of the loss allowance provision and expected loss rate incorporates past experience and forward-looking information, including the outlook for market demand and forward-looking interest rates. A default on other financial assets is considered to be when the counterparty fails to make contractual payments within 60 days of when they fall due. At 31 December 2024, the Group had a provision for credit losses of nil (2023: nil). Subsequent to 31 December 2024, 96% (2023: 97%) of product-related trade receivables balance of $972 million (2023: $885 million) has been received. Credit risk from balances with banks is managed by the Treasury function in accordance with the Group’s policy. The Group places funds from time to time as short-term deposits with reputable financial institutions with investment grade credit ratings. At 31 December 2024 and 31 December 2023, there were no significant concentrations of credit risk within the Group and financial instruments are spread amongst a number of financial institutions to minimise the risk of counterparty default. The maximum exposure to financial institution credit risk is represented by the sum of all cash deposits plus accrued interest, bank account balances and fair value of derivative assets. The Group’s counterparty credit policy limits this exposure to commercial and investment banks, according to approved credit limits based on the counterparty’s credit rating. 2024 ANNUAL REPORT185
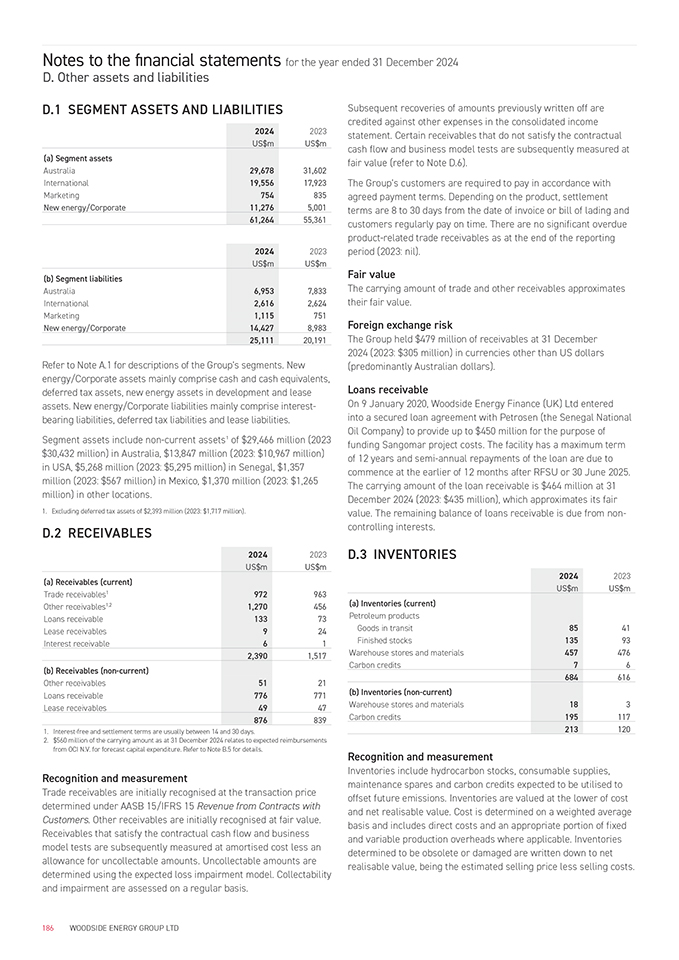
Notes to the financial statements for the year ended 31 December 2024 D. Other assets and liabilities D.1 SEGMENT ASSETS AND LIABILITIES 2024 2023 US$mUS$m (a) Segment assets Australia29,67831,602 International19,55617,923 Marketing754835 New energy/Corporate11,2765,001 61,26455,361 20242023 US$mUS$m (b) Segment liabilities Australia6,9537,833 International2,6162,624 Marketing1,115751 New energy/Corporate14,4278,983 25,11120,191 Refer to Note A.1 for descriptions of the Group’s segments. New energy/Corporate assets mainly comprise cash and cash equivalents, deferred tax assets, new energy assets in development and lease assets. New energy/Corporate liabilities mainly comprise interest-bearing liabilities, deferred tax liabilities and lease liabilities. Segment assets include non-current assets¹ of $29,466 million (2023 $30,432 million) in Australia, $13,847 million (2023: $10,967 million) in USA, $5,268 million (2023: $5,295 million) in Senegal, $1,357 million (2023: $567 million) in Mexico, $1,370 million (2023: $1,265 million) in other locations. 1. Excluding deferred tax assets of $2,393 million (2023: $1,717 million). D.2 RECEIVABLES 20242023 US$mUS$m (a) Receivables (current) Trade receivables1972963 Other receivables1,21,270456 Loans receivable13373 Lease receivables924 Interest receivable61 2,3901,517 (b) Receivables (non-current) Other receivables5121 Loans receivable776771 Lease receivables4947 876839 1.Interest-free and settlement terms are usually between 14 and 30 days. 2.$560 million of the carrying amount as at 31 December 2024 relates to expected reimbursements from OCI N.V. for forecast capital expenditure. Refer to Note B.5 for details. Subsequent recoveries of amounts previously written off are credited against other expenses in the consolidated income statement. Certain receivables that do not satisfy the contractual cash flow and business model tests are subsequently measured at fair value (refer to Note D.6). The Group’s customers are required to pay in accordance with agreed payment terms. Depending on the product, settlement terms are 8 to 30 days from the date of invoice or bill of lading and customers regularly pay on time. There are no significant overdue product-related trade receivables as at the end of the reporting period (2023: nil). Fair value The carrying amount of trade and other receivables approximates their fair value. Foreign exchange risk The Group held $479 million of receivables at 31 December 2024 (2023: $305 million) in currencies other than US dollars (predominantly Australian dollars). Loans receivable On 9 January 2020, Woodside Energy Finance (UK) Ltd entered into a secured loan agreement with Petrosen (the Senegal National Oil Company) to provide up to $450 million for the purpose of funding Sangomar project costs. The facility has a maximum term of 12 years and semi-annual repayments of the loan are due to commence at the earlier of 12 months after RFSU or 30 June 2025. The carrying amount of the loan receivable is $464 million at 31 December 2024 (2023: $435 million), which approximates its fair value. The remaining balance of loans receivable is due from non-controlling interests. D.3 INVENTORIES 20242023 US$mUS$m (a) Inventories (current) Petroleum products Goods in transit8541 Finished stocks13593 Warehouse stores and materials457476 Carbon credits76 684616 (b) Inventories (non-current) Warehouse stores and materials183 Carbon credits195117 213120 Recognition and measurement Recognition and measurement Trade receivables are initially recognised at the transaction price determined under AASB 15/IFRS 15 Revenue from Contracts with Customers. Other receivables are initially recognised at fair value. Receivables that satisfy the contractual cash flow and business model tests are subsequently measured at amortised cost less an allowance for uncollectable amounts. Uncollectable amounts are determined using the expected loss impairment model. Collectability and impairment are assessed on a regular basis. Inventories include hydrocarbon stocks, consumable supplies, maintenance spares and carbon credits expected to be utilised to offset future emissions. Inventories are valued at the lower of cost and net realisable value. Cost is determined on a weighted average basis and includes direct costs and an appropriate portion of fixed and variable production overheads where applicable. Inventories determined to be obsolete or damaged are written down to net realisable value, being the estimated selling price less selling costs. 186WOODSIDE ENERGY GROUP LTD
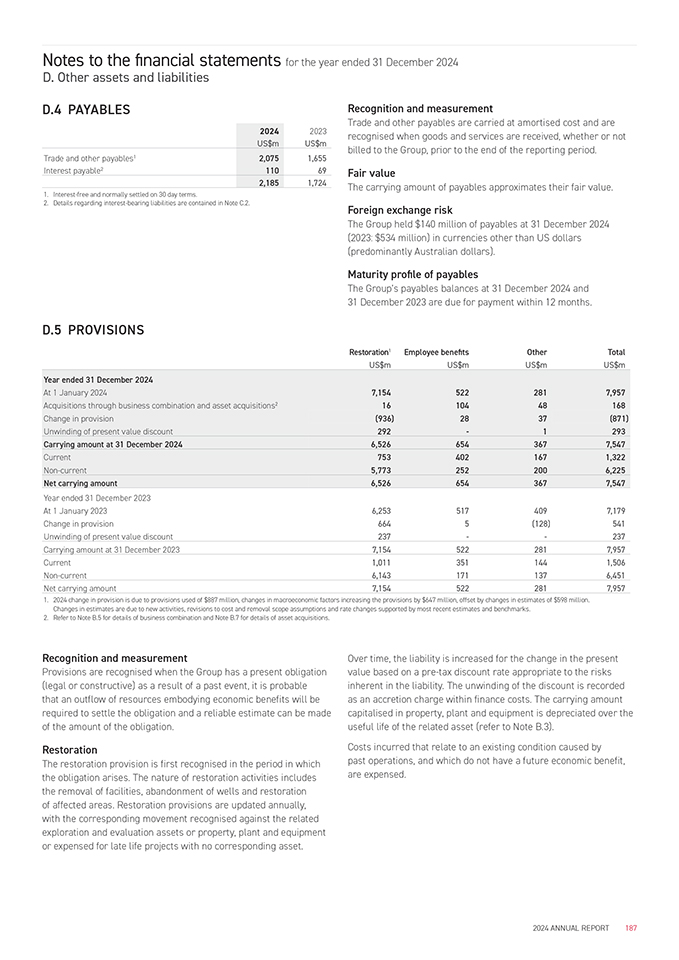
Notes to the financial statements for the year ended 31 December 2024 D. Other assets and liabilities D.4 PAYABLES 2024 2023 US$mUS$m Trade and other payables12,0751,655 Interest payable211069 2,1851,724 1.Interest-free and normally settled on 30 day terms. 2.Details regarding interest-bearing liabilities are contained in Note C.2. Recognition and measurement Trade and other payables are carried at amortised cost and are recognised when goods and services are received, whether or not billed to the Group, prior to the end of the reporting period. Fair value The carrying amount of payables approximates their fair value. Foreign exchange risk The Group held $140 million of payables at 31 December 2024 (2023: $534 million) in currencies other than US dollars (predominantly Australian dollars). Maturity profile of payables The Group’s payables balances at 31 December 2024 and 31 December 2023 are due for payment within 12 months. D.5 PROVISIONS Restoration1Employee benefitsOtherTotal US$mUS$mUS$mUS$m Year ended 31 December 2024 At 1 January 20247,1545222817,957 Acquisitions through business combination and asset acquisitions21610448168 Change in provision(936)2837(871) Unwinding of present value discount292-1293 Carrying amount at 31 December 20246,5266543677,547 Current7534021671,322 Non-current5,7732522006,225 Net carrying amount6,5266543677,547 Year ended 31 December 2023 At 1 January 20236,2535174097,179 Change in provision6645(128)541 Unwinding of present value discount237--237 Carrying amount at 31 December 20237,1545222817,957 Current1,0113511441,506 Non-current6,1431711376,451 Net carrying amount7,1545222817,957 1.2024 change in provision is due to provisions used of $887 million, changes in macroeconomic factors increasing the provisions by $647 million, offset by changes in estimates of $598 million. Changes in estimates are due to new activities, revisions to cost and removal scope assumptions and rate changes supported by most recent estimates and benchmarks. 2.Refer to Note B.5 for details of business combination and Note B.7 for details of asset acquisitions. Recognition and measurement Provisions are recognised when the Group has a present obligation (legal or constructive) as a result of a past event, it is probable that an outflow of resources embodying economic benefits will be required to settle the obligation and a reliable estimate can be made of the amount of the obligation. Restoration The restoration provision is first recognised in the period in which the obligation arises. The nature of restoration activities includes the removal of facilities, abandonment of wells and restoration of affected areas. Restoration provisions are updated annually, with the corresponding movement recognised against the related exploration and evaluation assets or property, plant and equipment or expensed for late life projects with no corresponding asset. Over time, the liability is increased for the change in the present value based on a pre-tax discount rate appropriate to the risks inherent in the liability. The unwinding of the discount is recorded as an accretion charge within finance costs. The carrying amount capitalised in property, plant and equipment is depreciated over the useful life of the related asset (refer to Note B.3). Costs incurred that relate to an existing condition caused by past operations, and which do not have a future economic benefit, are expensed. 2024 ANNUAL REPORT187
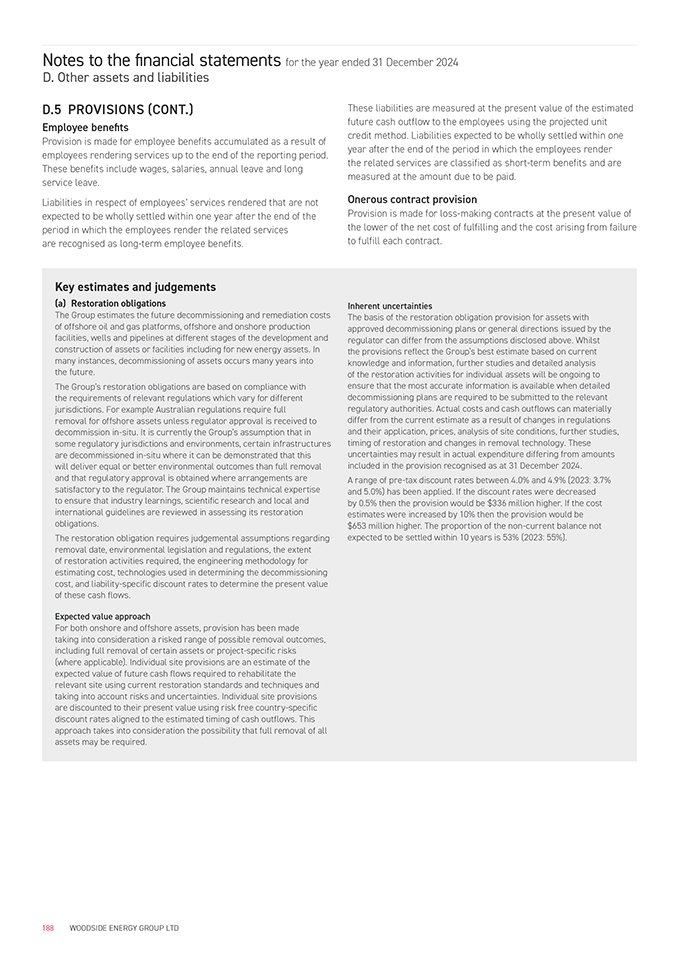
Notes to the financial statements for the year ended 31 December 2024 D. Other assets and liabilities D.5 PROVISIONS (CONT.) Employee benefits Provision is made for employee benefits accumulated as a result of employees rendering services up to the end of the reporting period. These benefits include wages, salaries, annual leave and long service leave. Liabilities in respect of employees’ services rendered that are not expected to be wholly settled within one year after the end of the period in which the employees render the related services are recognised as long-term employee benefits. These liabilities are measured at the present value of the estimated future cash outflow to the employees using the projected unit credit method. Liabilities expected to be wholly settled within one year after the end of the period in which the employees render the related services are classified as short-term benefits and are measured at the amount due to be paid. Onerous contract provision Provision is made for loss-making contracts at the present value of the lower of the net cost of fulfilling and the cost arising from failure to fulfill each contract. Key estimates and judgements (a) Restoration obligations The Group estimates the future decommissioning and remediation costs of offshore oil and gas platforms, offshore and onshore production facilities, wells and pipelines at different stages of the development and construction of assets or facilities including for new energy assets. In many instances, decommissioning of assets occurs many years into the future. The Group’s restoration obligations are based on compliance with the requirements of relevant regulations which vary for different jurisdictions. For example Australian regulations require full removal for offshore assets unless regulator approval is received to decommission in-situ. It is currently the Group’s assumption that in some regulatory jurisdictions and environments, certain infrastructures are decommissioned in-situ where it can be demonstrated that this will deliver equal or better environmental outcomes than full removal and that regulatory approval is obtained where arrangements are satisfactory to the regulator. The Group maintains technical expertise to ensure that industry learnings, scientific research and local and international guidelines are reviewed in assessing its restoration obligations. The restoration obligation requires judgemental assumptions regarding removal date, environmental legislation and regulations, the extent of restoration activities required, the engineering methodology for estimating cost, technologies used in determining the decommissioning cost, and liability-specific discount rates to determine the present value of these cash flows. Expected value approach For both onshore and offshore assets, provision has been made taking into consideration a risked range of possible removal outcomes, including full removal of certain assets or project-specific risks (where applicable). Individual site provisions are an estimate of the expected value of future cash flows required to rehabilitate the relevant site using current restoration standards and techniques and taking into account risks and uncertainties. Individual site provisions are discounted to their present value using risk free country-specific discount rates aligned to the estimated timing of cash outflows. This approach takes into consideration the possibility that full removal of all assets may be required. Inherent uncertainties The basis of the restoration obligation provision for assets with approved decommissioning plans or general directions issued by the regulator can differ from the assumptions disclosed above. Whilst the provisions reflect the Group’s best estimate based on current knowledge and information, further studies and detailed analysis of the restoration activities for individual assets will be ongoing to ensure that the most accurate information is available when detailed decommissioning plans are required to be submitted to the relevant regulatory authorities. Actual costs and cash outflows can materially differ from the current estimate as a result of changes in regulations and their application, prices, analysis of site conditions, further studies, timing of restoration and changes in removal technology. These uncertainties may result in actual expenditure differing from amounts included in the provision recognised as at 31 December 2024. A range of pre-tax discount rates between 4.0% and 4.9% (2023: 3.7% and 5.0%) has been applied. If the discount rates were decreased by 0.5% then the provision would be $336 million higher. If the cost estimates were increased by 10% then the provision would be $653 million higher. The proportion of the non-current balance not expected to be settled within 10 years is 53% (2023: 55%). 188 WOODSIDE ENERGY GROUP LTD
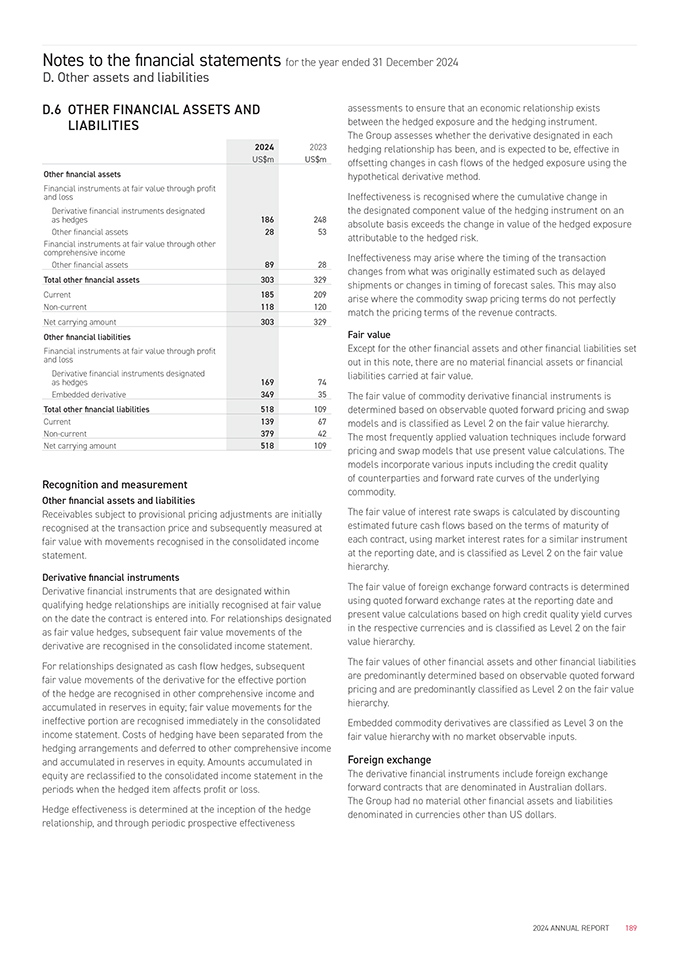
Notes to the financial statements for the year ended 31 December 2024 D. Other assets and liabilities D.6 OTHER FINANCIAL ASSETS AND LIABILITIES 2024 2023 US$mUS$m Other financial assets Financial instruments at fair value through profit and loss Derivative financial instruments designated186248 as hedges Other financial assets2853 Financial instruments at fair value through other comprehensive income Other financial assets8928 Total other financial assets303329 Current185209 Non-current118120 Net carrying amount303329 assessments to ensure that an economic relationship exists between the hedged exposure and the hedging instrument. The Group assesses whether the derivative designated in each hedging relationship has been, and is expected to be, effective in offsetting changes in cash flows of the hedged exposure using the hypothetical derivative method. Ineffectiveness is recognised where the cumulative change in the designated component value of the hedging instrument on an absolute basis exceeds the change in value of the hedged exposure attributable to the hedged risk. Ineffectiveness may arise where the timing of the transaction changes from what was originally estimated such as delayed shipments or changes in timing of forecast sales. This may also arise where the commodity swap pricing terms do not perfectly match the pricing terms of the revenue contracts. Other financial liabilities Financial instruments at fair value through profit and loss Derivative financial instruments designated16974 as hedges Embedded derivative34935 Total other financial liabilities518109 Current13967 Non-current37942 Net carrying amount518109 Recognition and measurement Other financial assets and liabilities Receivables subject to provisional pricing adjustments are initially recognised at the transaction price and subsequently measured at fair value with movements recognised in the consolidated income statement. Derivative financial instruments Derivative financial instruments that are designated within qualifying hedge relationships are initially recognised at fair value on the date the contract is entered into. For relationships designated as fair value hedges, subsequent fair value movements of the derivative are recognised in the consolidated income statement. For relationships designated as cash flow hedges, subsequent fair value movements of the derivative for the effective portion of the hedge are recognised in other comprehensive income and accumulated in reserves in equity; fair value movements for the ineffective portion are recognised immediately in the consolidated income statement. Costs of hedging have been separated from the hedging arrangements and deferred to other comprehensive income and accumulated in reserves in equity. Amounts accumulated in equity are reclassified to the consolidated income statement in the periods when the hedged item affects profit or loss. Hedge effectiveness is determined at the inception of the hedge relationship, and through periodic prospective effectiveness Fair value Except for the other financial assets and other financial liabilities set out in this note, there are no material financial assets or financial liabilities carried at fair value. The fair value of commodity derivative financial instruments is determined based on observable quoted forward pricing and swap models and is classified as Level 2 on the fair value hierarchy. The most frequently applied valuation techniques include forward pricing and swap models that use present value calculations. The models incorporate various inputs including the credit quality of counterparties and forward rate curves of the underlying commodity. The fair value of interest rate swaps is calculated by discounting estimated future cash flows based on the terms of maturity of each contract, using market interest rates for a similar instrument at the reporting date, and is classified as Level 2 on the fair value hierarchy. The fair value of foreign exchange forward contracts is determined using quoted forward exchange rates at the reporting date and present value calculations based on high credit quality yield curves in the respective currencies and is classified as Level 2 on the fair value hierarchy. The fair values of other financial assets and other financial liabilities are predominantly determined based on observable quoted forward pricing and are predominantly classified as Level 2 on the fair value hierarchy. Embedded commodity derivatives are classified as Level 3 on the fair value hierarchy with no market observable inputs. Foreign exchange The derivative financial instruments include foreign exchange forward contracts that are denominated in Australian dollars. The Group had no material other financial assets and liabilities denominated in currencies other than US dollars. 2024 ANNUAL REPORT189
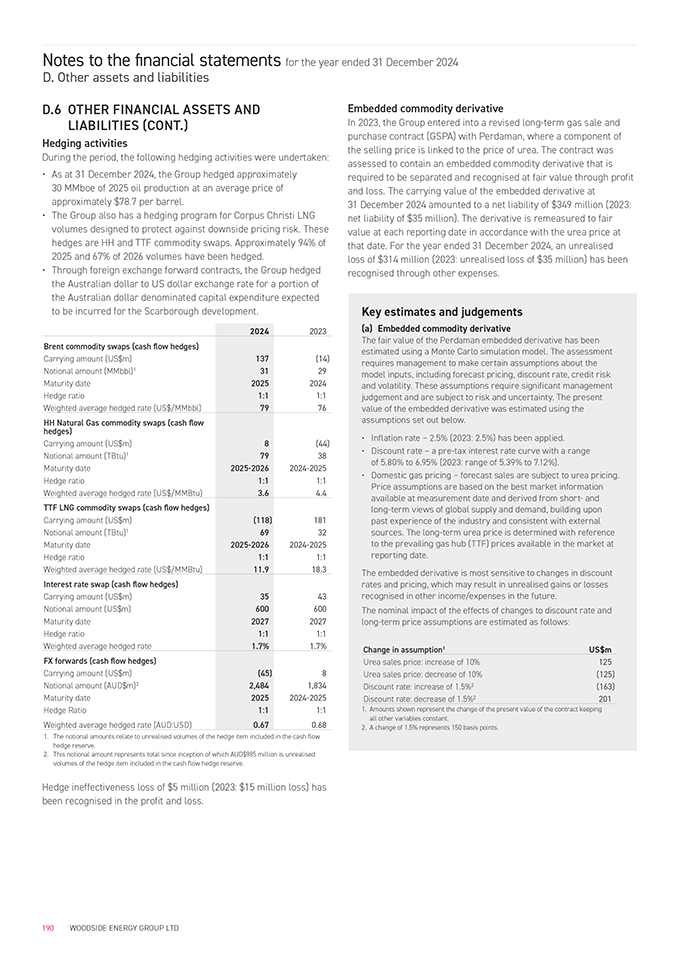
Notes to the financial statements for the year ended 31 December 2024 D. Other assets and liabilities D.6 OTHER FINANCIAL ASSETS AND Embedded commodity derivative LIABILITIES (CONT.)In 2023, the Group entered into a revised long-term gas sale and Hedging activitiespurchase contract (GSPA) with Perdaman, where a component of the selling price is linked to the price of urea. The contract was During the period, the following hedging activities were undertaken: assessed to contain an embedded commodity derivative that is • As at 31 December 2024, the Group hedged approximately required to be separated and recognised at fair value through profit 30 MMboe of 2025 oil production at an average price of and loss. The carrying value of the embedded derivative at approximately $78.7 per barrel. 31 December 2024 amounted to a net liability of $349 million (2023: • The Group also has a hedging program for Corpus Christi LNG net liability of $35 million). The derivative is remeasured to fair volumes designed to protect against downside pricing risk. These value at each reporting date in accordance with the urea price at hedges are HH and TTF commodity swaps. Approximately 94% of that date. For the year ended 31 December 2024, an unrealised 2025 and 67% of 2026 volumes have been hedged. loss of $314 million (2023: unrealised loss of $35 million) has been • Through foreign exchange forward contracts, the Group hedged recognised through other expenses. the Australian dollar to US dollar exchange rate for a portion of the Australian dollar denominated capital expenditure expected Key estimates and judgements to be incurred for the Scarborough development. 20242023(a) Embedded commodity derivative The fair value of the Perdaman embedded derivative has been Brent commodity swaps (cash flow hedges) estimated using a Monte Carlo simulation model. The assessment Carrying amount (US$m)137(14) requires management to make certain assumptions about the Notional amount (MMbbl)13129 model inputs, including forecast pricing, discount rate, credit risk Maturity date20252024 and volatility. These assumptions require significant management Hedge ratio1:11:1judgement and are subject to risk and uncertainty. The present Weighted average hedged rate (US$/MMbbl)7976value of the embedded derivative was estimated using the HH Natural Gas commodity swaps (cash flowassumptions set out below. hedges)• Inflation rate – 2.5% (2023: 2.5%) has been applied. Carrying amount (US$m)8(44) • Discount rate – a pre-tax interest rate curve with a range Notional amount (TBtu)17938 Maturity date2025-20262024-2025of 5.80% to 6.95% (2023: range of 5.39% to 7.12%). • Domestic gas pricing – forecast sales are subject to urea pricing. Hedge ratio1:11:1 Price assumptions are based on the best market information Weighted average hedged rate (US$/MMBtu)3.64.4 available at measurement date and derived from short- and TTF LNG commodity swaps (cash flow hedges) (118)181long-term views of global supply and demand, building upon Carrying amount (US$m)past experience of the industry and consistent with external Notional amount (TBtu)16932sources. The long-term urea price is determined with reference Maturity date2025-20262024-2025to the prevailing gas hub (TTF) prices available in the market at Hedge ratio1:11:1reporting date. Weighted average hedged rate (US$/MMBtu)11.918.3The embedded derivative is most sensitive to changes in discount Interest rate swap (cash flow hedges) rates and pricing, which may result in unrealised gains or losses Carrying amount (US$m)3543recognised in other income/expenses in the future. Notional amount (US$m)600600The nominal impact of the effects of changes to discount rate and Maturity date20272027long-term price assumptions are estimated as follows: Hedge ratio1:11:1 Weighted average hedged rate1.7%1.7% Change in assumption1US$m FX forwards (cash flow hedges) Urea sales price: increase of 10%125 Carrying amount (US$m)(45)8Urea sales price: decrease of 10%(125) Notional amount (AUD$m)22,4841,834Discount rate: increase of 1.5%2(163) Maturity date20252024-2025Discount rate: decrease of 1.5%2201 Hedge Ratio1:11:11. Amounts shown represent the change of the present value of the contract keeping Weighted average hedged rate (AUD:USD)0.670.68all other variables constant. 2. A change of 1.5% represents 150 basis points. 1.The notional amounts relate to unrealised volumes of the hedge item included in the cash flow hedge reserve. 2.This notional amount represents total since inception of which AUD$985 million is unrealised volumes of the hedge item included in the cash flow hedge reserve. Hedge ineffectiveness loss of $5 million (2023: $15 million loss) has been recognised in the profit and loss. 190WOODSIDE ENERGY GROUP LTD
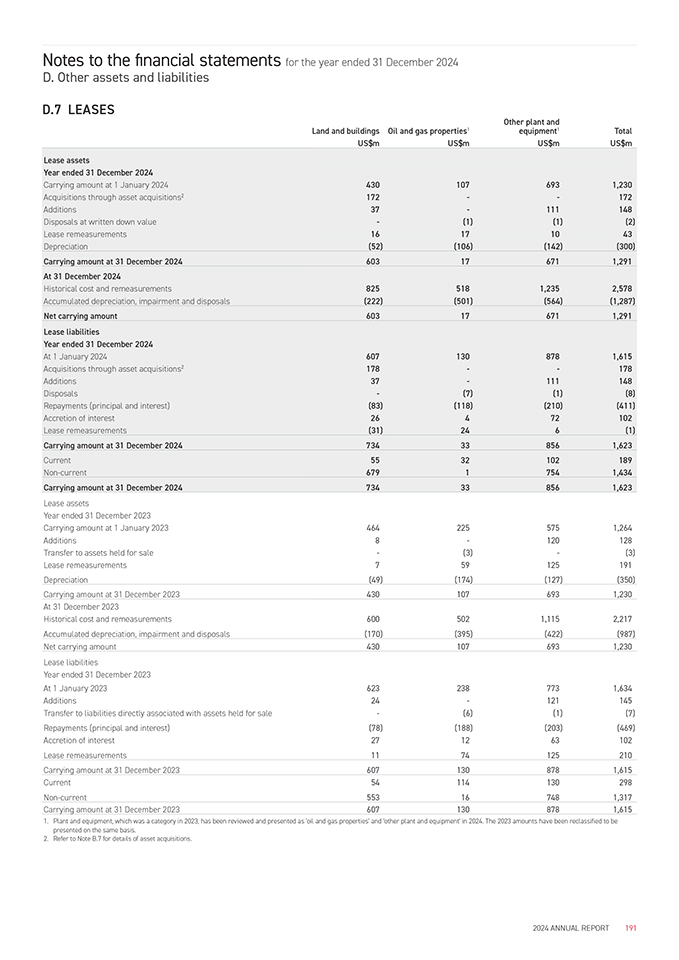
Notes to the financial statements for the year ended 31 December 2024 D. Other assets and liabilities D.7 LEASES Other plant and Land and buildingsOil and gas properties1equipment1Total US$mUS$mUS$mUS$m Lease assets Year ended 31 December 2024 Carrying amount at 1 January 20244301076931,230 Acquisitions through asset acquisitions2172--172 Additions37-111148 Disposals at written down value-(1)(1)(2) Lease remeasurements16171043 Depreciation(52)(106)(142)(300) Carrying amount at 31 December 2024603176711,291 At 31 December 2024 Historical cost and remeasurements8255181,2352,578 Accumulated depreciation, impairment and disposals(222)(501)(564)(1,287) Net carrying amount603176711,291 Lease liabilities Year ended 31 December 2024 At 1 January 20246071308781,615 Acquisitions through asset acquisitions2178--178 Additions37-111148 Disposals-(7)(1)(8) Repayments (principal and interest)(83)(118)(210)(411) Accretion of interest26472102 Lease remeasurements(31)246(1) Carrying amount at 31 December 2024734338561,623 Current5532102189 Non-current67917541,434 Carrying amount at 31 December 2024734338561,623 Lease assets Year ended 31 December 2023 Carrying amount at 1 January 20234642255751,264 Additions8-120128 Transfer to assets held for sale-(3)-(3) Lease remeasurements759125191 Depreciation(49)(174)(127)(350) Carrying amount at 31 December 20234301076931,230 At 31 December 2023 Historical cost and remeasurements6005021,1152,217 Accumulated depreciation, impairment and disposals(170)(395)(422)(987) Net carrying amount4301076931,230 Lease liabilities Year ended 31 December 2023 At 1 January 20236232387731,634 Additions24-121145 Transfer to liabilities directly associated with assets held for sale-(6)(1)(7) Repayments (principal and interest)(78)(188)(203)(469) Accretion of interest271263102 Lease remeasurements1174125210 Carrying amount at 31 December 20236071308781,615 Current54114130298 Non-current553167481,317 Carrying amount at 31 December 20236071308781,615 1.Plant and equipment, which was a category in 2023, has been reviewed and presented as ‘oil and gas properties’ and ‘other plant and equipment’ in 2024. The 2023 amounts have been reclassified to be presented on the same basis. 2.Refer to Note B.7 for details of asset acquisitions. 2024 ANNUAL REPORT191
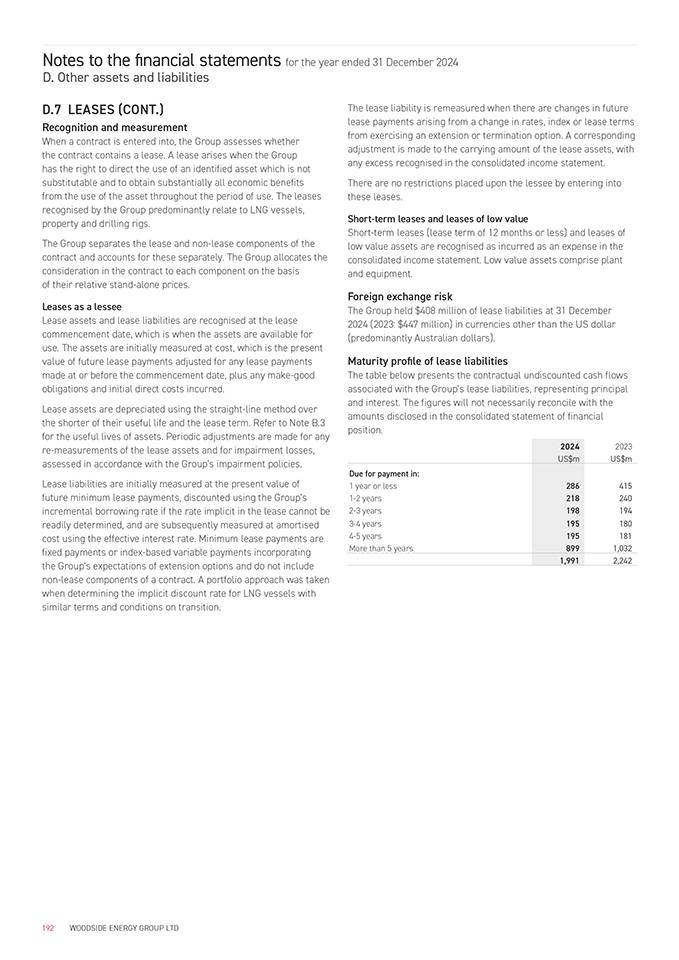
Notes to the financial statements for the year ended 31 December 2024 D. Other assets and liabilities D.7 LEASES (CONT.) Recognition and measurement When a contract is entered into, the Group assesses whether the contract contains a lease. A lease arises when the Group has the right to direct the use of an identified asset which is not substitutable and to obtain substantially all economic benefits from the use of the asset throughout the period of use. The leases recognised by the Group predominantly relate to LNG vessels, property and drilling rigs. The Group separates the lease and non-lease components of the contract and accounts for these separately. The Group allocates the consideration in the contract to each component on the basis of their relative stand-alone prices. Leases as a lessee Lease assets and lease liabilities are recognised at the lease commencement date, which is when the assets are available for use. The assets are initially measured at cost, which is the present value of future lease payments adjusted for any lease payments made at or before the commencement date, plus any make-good obligations and initial direct costs incurred. Lease assets are depreciated using the straight-line method over the shorter of their useful life and the lease term. Refer to Note B.3 for the useful lives of assets. Periodic adjustments are made for any re-measurements of the lease assets and for impairment losses, assessed in accordance with the Group’s impairment policies. Lease liabilities are initially measured at the present value of future minimum lease payments, discounted using the Group’s incremental borrowing rate if the rate implicit in the lease cannot be readily determined, and are subsequently measured at amortised cost using the effective interest rate. Minimum lease payments are fixed payments or index-based variable payments incorporating the Group’s expectations of extension options and do not include non-lease components of a contract. A portfolio approach was taken when determining the implicit discount rate for LNG vessels with similar terms and conditions on transition. The lease liability is remeasured when there are changes in future lease payments arising from a change in rates, index or lease terms from exercising an extension or termination option. A corresponding adjustment is made to the carrying amount of the lease assets, with any excess recognised in the consolidated income statement. There are no restrictions placed upon the lessee by entering into these leases. Short-term leases and leases of low value Short-term leases (lease term of 12 months or less) and leases of low value assets are recognised as incurred as an expense in the consolidated income statement. Low value assets comprise plant and equipment. Foreign exchange risk The Group held $408 million of lease liabilities at 31 December 2024 (2023: $447 million) in currencies other than the US dollar (predominantly Australian dollars). Maturity profile of lease liabilities The table below presents the contractual undiscounted cash flows associated with the Group’s lease liabilities, representing principal and interest. The figures will not necessarily reconcile with the amounts disclosed in the consolidated statement of financial position. 2024 2023 US$mUS$m Due for payment in: 1 year or less286415 1-2 years218240 2-3 years198194 3-4 years195180 4-5 years195181 More than 5 years8991,032 1,9912,242 192WOODSIDE ENERGY GROUP LTD
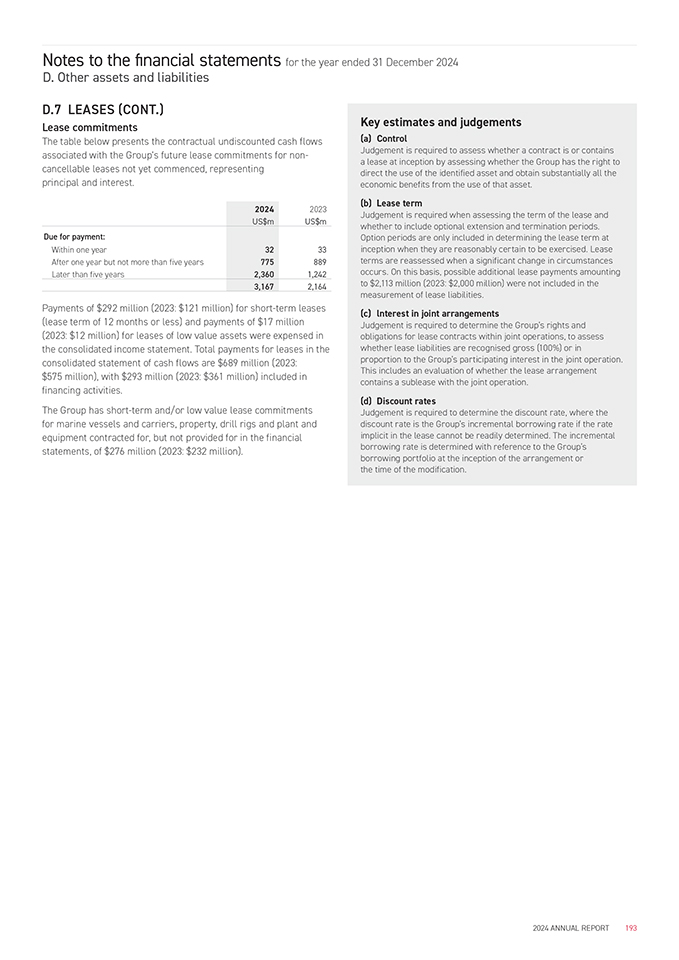
Notes to the financial statements for the year ended 31 December 2024 D. Other assets and liabilities D.7 LEASES (CONT.)Key estimates and judgements Lease commitments (a) Control The table below presents the contractual undiscounted cash flows associated with the Group’s future lease commitments for non-Judgement is required to assess whether a contract is or contains a lease at inception by assessing whether the Group has the right to cancellable leases not yet commenced, representing direct the use of the identified asset and obtain substantially all the principal and interest. economic benefits from the use of that asset. 20242023(b) Lease term Judgement is required when assessing the term of the lease and US$mUS$m whether to include optional extension and termination periods. Due for payment: Option periods are only included in determining the lease term at Within one year3233inception when they are reasonably certain to be exercised. Lease After one year but not more than five years775889terms are reassessed when a significant change in circumstances Later than five years2,3601,242occurs. On this basis, possible additional lease payments amounting 3,1672,164to $2,113 million (2023: $2,000 million) were not included in the measurement of lease liabilities. Payments of $292 million (2023: $121 million) for short-term leases (lease term of 12 months or less) and payments of $17 million (2023: $12 million) for leases of low value assets were expensed in the consolidated income statement. Total payments for leases in the consolidated statement of cash flows are $689 million (2023: $575 million), with $293 million (2023: $361 million) included in financing activities. The Group has short-term and/or low value lease commitments for marine vessels and carriers, property, drill rigs and plant and equipment contracted for, but not provided for in the financial statements, of $276 million (2023: $232 million). (c) lnterest in joint arrangements Judgement is required to determine the Group’s rights and obligations for lease contracts within joint operations, to assess whether lease liabilities are recognised gross (100%) or in proportion to the Group’s participating interest in the joint operation. This includes an evaluation of whether the lease arrangement contains a sublease with the joint operation. (d) Discount rates Judgement is required to determine the discount rate, where the discount rate is the Group’s incremental borrowing rate if the rate implicit in the lease cannot be readily determined. The incremental borrowing rate is determined with reference to the Group’s borrowing portfolio at the inception of the arrangement or the time of the modification. 2024 ANNUAL REPORT193

Notes to the financial statements for the year ended 31 December 2024 E. Other items IN THIS SECTION This section addresses information on items which require disclosure to comply with Australian Accounting Standards and the Corporations Act 2001, however are not considered critical in understanding the financial performance or position of the Group. This section includes Group structure information and other disclosures. E. Other items E.1Contingent liabilities and assetsPage 195 E.2Employee benefitsPage 195 E.3Related party transactionsPage 198 E.4Auditor remunerationPage 198 E.5Events after the end of the reporting periodPage 198 E.6Joint arrangementsPage 198 E.7Parent entity informationPage 200 E.8SubsidiariesPage 200 E.9Other accounting policiesPage 204 194WOODSIDE ENERGY GROUP LTD
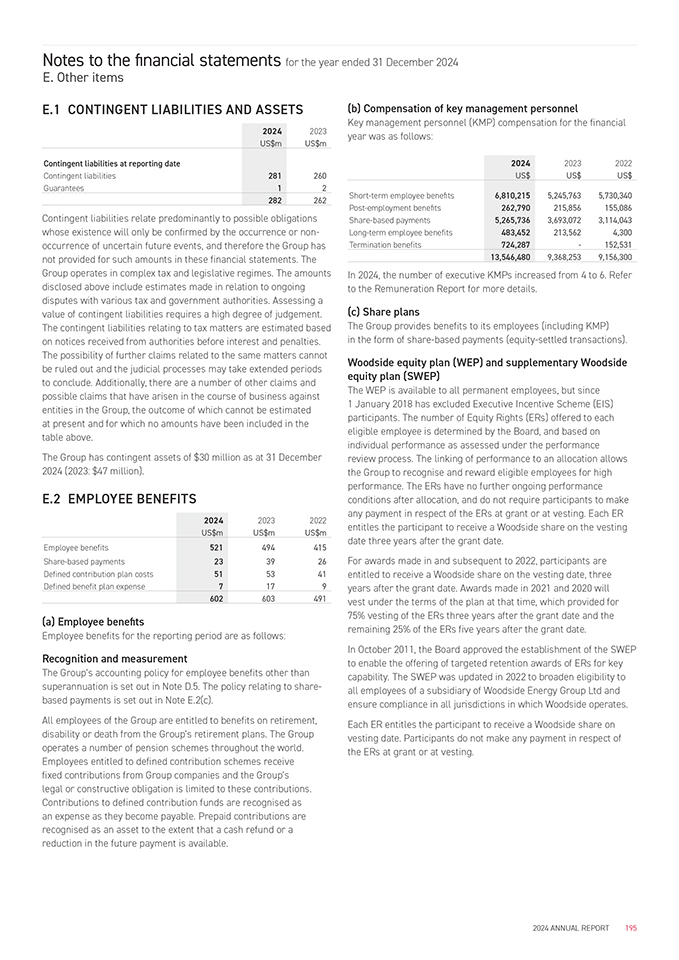
Notes to the financial statements for the year ended 31 December 2024 E. Other items E.1 CONTINGENT LIABILITIES AND ASSETS 2024 2023 US$mUS$m Contingent liabilities at reporting date Contingent liabilities281260 Guarantees12 282262 Contingent liabilities relate predominantly to possible obligations whose existence will only be confirmed by the occurrence or non-occurrence of uncertain future events, and therefore the Group has not provided for such amounts in these financial statements. The Group operates in complex tax and legislative regimes. The amounts disclosed above include estimates made in relation to ongoing disputes with various tax and government authorities. Assessing a value of contingent liabilities requires a high degree of judgement. The contingent liabilities relating to tax matters are estimated based on notices received from authorities before interest and penalties. The possibility of further claims related to the same matters cannot be ruled out and the judicial processes may take extended periods to conclude. Additionally, there are a number of other claims and possible claims that have arisen in the course of business against entities in the Group, the outcome of which cannot be estimated at present and for which no amounts have been included in the table above. The Group has contingent assets of $30 million as at 31 December 2024 (2023: $47 million). E.2 EMPLOYEE BENEFITS 202420232022 US$mUS$mUS$m Employee benefits521494415 Share-based payments233926 Defined contribution plan costs515341 Defined benefit plan expense7179 602603491 (a) Employee benefits Employee benefits for the reporting period are as follows: Recognition and measurement The Group’s accounting policy for employee benefits other than superannuation is set out in Note D.5. The policy relating to share-based payments is set out in Note E.2(c). All employees of the Group are entitled to benefits on retirement, disability or death from the Group’s retirement plans. The Group operates a number of pension schemes throughout the world. Employees entitled to defined contribution schemes receive fixed contributions from Group companies and the Group’s legal or constructive obligation is limited to these contributions. Contributions to defined contribution funds are recognised as an expense as they become payable. Prepaid contributions are recognised as an asset to the extent that a cash refund or a reduction in the future payment is available. (b) Compensation of key management personnel Key management personnel (KMP) compensation for the financial year was as follows: 202420232022 US$US$US$ Short-term employee benefts6,810,2155,245,7635,730,340 Post-employment benefts262,790215,856155,086 Share-based payments5,265,7363,693,0723,114,043 Long-term employee benefits483,452213,5624,300 Termination benefits724,287-152,531 13,546,4809,368,2539,156,300 In 2024, the number of executive KMPs increased from 4 to 6. Refer to the Remuneration Report for more details. (c) Share plans The Group provides benefits to its employees (including KMP) in the form of share-based payments (equity-settled transactions). Woodside equity plan (WEP) and supplementary Woodside equity plan (SWEP) The WEP is available to all permanent employees, but since 1 January 2018 has excluded Executive Incentive Scheme (EIS) participants. The number of Equity Rights (ERs) offered to each eligible employee is determined by the Board, and based on individual performance as assessed under the performance review process. The linking of performance to an allocation allows the Group to recognise and reward eligible employees for high performance. The ERs have no further ongoing performance conditions after allocation, and do not require participants to make any payment in respect of the ERs at grant or at vesting. Each ER entitles the participant to receive a Woodside share on the vesting date three years after the grant date. For awards made in and subsequent to 2022, participants are entitled to receive a Woodside share on the vesting date, three years after the grant date. Awards made in 2021 and 2020 will vest under the terms of the plan at that time, which provided for 75% vesting of the ERs three years after the grant date and the remaining 25% of the ERs five years after the grant date. In October 2011, the Board approved the establishment of the SWEP to enable the offering of targeted retention awards of ERs for key capability. The SWEP was updated in 2022 to broaden eligibility to all employees of a subsidiary of Woodside Energy Group Ltd and ensure compliance in all jurisdictions in which Woodside operates. Each ER entitles the participant to receive a Woodside share on vesting date. Participants do not make any payment in respect of the ERs at grant or at vesting. 2024 ANNUAL REPORT195
Notes to the financial statements for the year ended 31 December 2024 E. Other items E.2 EMPLOYEE BENEFITS (CONT.) Performance Based Pay Plus (PBP Plus) Executive Incentive Scheme (EIS)PBP Plus is available to senior, permanent employees who are not Executives. Participants receive an annual award of cash and The EIS was introduced for the 2018 performance year for all Restricted Shares based on corporate and individual performance, Executives including Executive KMP. The EIS is delivered in the recognising and rewarding eligible employees for high performance. form of a cash incentive, Restricted Shares and Performance Rights. The grant date of the Restricted Shares and Performance RightsThe grant date of the Restricted Shares has been determined to be has been determined to be subsequent to the performance year,subsequent to the performance year, being the date of the Board of being the date of the Board of Directors’ approval. Accordingly, theDirectors’ approval. Accordingly, the 2023 Restricted Shares were 2023 Restricted Shares and Performance Rights were granted ongranted on 27 February 2024 and have been included in the table 27 February 2024 for Executives and 24 April 2024 for the CEO andbelow. The expense estimated as at 31 December 2023 in relation to have been included in the table below. The expense estimated as atthe 2023 performance year was updated to the fair value on grant 31 December 2023 in relation to the 2023 performance yeardate during the period. was updated to the fair value on grant date during the period.The 2024 Restricted Shares have not been included in the table The 2024 Restricted Shares and Performance Rights have not been below as they have not been approved as at 31 December 2024. An included in the table below as they have not been approved as atexpense related to the 2024 performance year has been estimated 31 December 2024. An expense related to the 2024 performancefor the Restricted Shares, using fair value estimates based on inputs year has been estimated for the Restricted Shares and Performanceat 31 December 2024. Rights, using fair value estimates based on inputs at 31 DecemberRecognition and measurement 2024. All compensation under WEP, SWEP, PBP Plus and EIS Restricted Shares and Performance Rights is accounted for as share-based payments to employees for services provided. The cost of equity- settled transactions with employees is measured by reference to the fair values of the equity instruments at the date at which they are granted. The fair value of share-based payments is recognised, together with the corresponding increase in equity, over the period in which the vesting conditions are fulfilled, ending on the date on which the relevant employee becomes fully entitled to the shares. At each balance sheet date, the Group reassesses the number of awards that are expected to vest based on service conditions. The expense recognised each year takes into account the most recent estimate. The fair value of the benefit provided for the WEP and SWEP is estimated using the Black-Scholes option pricing technique. The fair value of the Restricted Shares is estimated as the closing share price at grant date. The fair value of the benefit provided for the relative total shareholder return Performance Rights is calculated using the Binomial or Black-Scholes option pricing technique combined with a Monte Carlo simulation methodology, where relevant, using historical volatility to estimate the volatility of the share price in the future. 196WOODSIDE ENERGY GROUP LTD
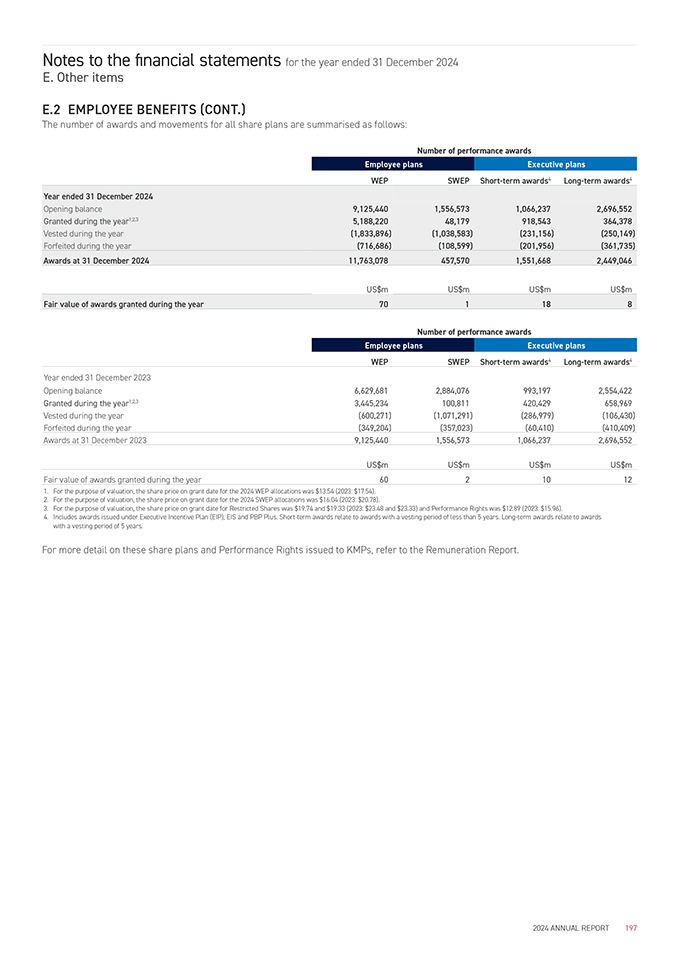
Notes to the financial statements for the year ended 31 December 2024 E. Other items E.2 EMPLOYEE BENEFITS (CONT.) The number of awards and movements for all share plans are summarised as follows: Number of performance awards Employee plansExecutive plans WEPSWEPShort-term awards4Long-term awards4 Year ended 31 December 2024 Opening balance9,125,4401,556,5731,066,2372,696,552 Granted during the year1,2,35,188,22048,179918,543364,378 Vested during the year(1,833,896)(1,038,583)(231,156)(250,149) Forfeited during the year(716,686)(108,599)(201,956)(361,735) Awards at 31 December 202411,763,078457,5701,551,6682,449,046 US$mUS$mUS$mUS$m Fair value of awards granted during the year701188 Number of performance awards Employee plansExecutive plans WEPSWEPShort-term awards4Long-term awards4 Year ended 31 December 2023 Opening balance6,629,6812,884,076993,1972,554,422 Granted during the year1,2,33,445,234100,811420,429658,969 Vested during the year(600,271)(1,071,291)(286,979)(106,430) Forfeited during the year(349,204)(357,023)(60,410)(410,409) Awards at 31 December 20239,125,4401,556,5731,066,2372,696,552 US$mUS$mUS$mUS$m Fair value of awards granted during the year6021012 1.For the purpose of valuation, the share price on grant date for the 2024 WEP allocations was $13.54 (2023: $17.54). 2.For the purpose of valuation, the share price on grant date for the 2024 SWEP allocations was $16.04 (2023: $20.78). 3.For the purpose of valuation, the share price on grant date for Restricted Shares was $19.74 and $19.33 (2023: $23.48 and $23.33) and Performance Rights was $12.89 (2023: $15.96). 4.Includes awards issued under Executive Incentive Plan (EIP), EIS and PBP Plus. Short-term awards relate to awards with a vesting period of less than 5 years. Long-term awards relate to awards with a vesting period of 5 years. For more detail on these share plans and Performance Rights issued to KMPs, refer to the Remuneration Report. 2024 ANNUAL REPORT197
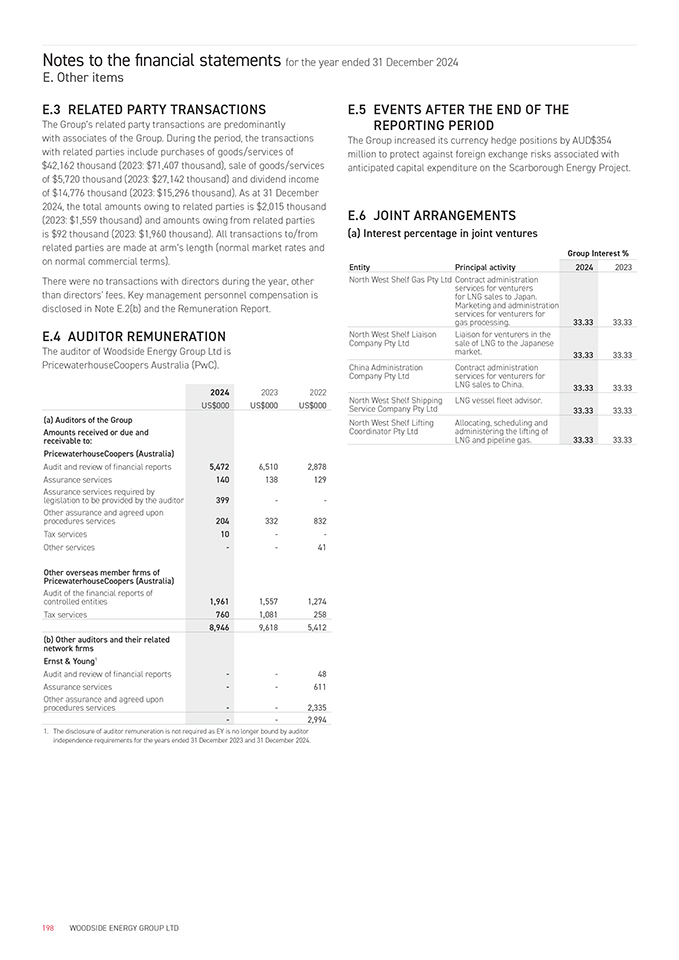
Notes to the financial statements for the year ended 31 December 2024 E. Other items E.3 RELATED PARTY TRANSACTIONS The Group’s related party transactions are predominantly with associates of the Group. During the period, the transactions with related parties include purchases of goods/services of $42,162 thousand (2023: $71,407 thousand), sale of goods/services of $5,720 thousand (2023: $27,142 thousand) and dividend income of $14,776 thousand (2023: $15,296 thousand). As at 31 December 2024, the total amounts owing to related parties is $2,015 thousand (2023: $1,559 thousand) and amounts owing from related parties is $92 thousand (2023: $1,960 thousand). All transactions to/from related parties are made at arm’s length (normal market rates and on normal commercial terms). There were no transactions with directors during the year, other than directors’ fees. Key management personnel compensation is disclosed in Note E.2(b) and the Remuneration Report. E.4 AUDITOR REMUNERATION The auditor of Woodside Energy Group Ltd is PricewaterhouseCoopers Australia (PwC). 2024 2023 2022 US$000US$000US$000 (a) Auditors of the Group Amounts received or due and receivable to: PricewaterhouseCoopers (Australia) E.5EVENTS AFTER THE END OF THE REPORTING PERIOD The Group increased its currency hedge positions by AUD$354 million to protect against foreign exchange risks associated with anticipated capital expenditure on the Scarborough Energy Project. E.6 JOINT ARRANGEMENTS (a) Interest percentage in joint ventures Group Interest % EntityPrincipal activity20242023 North West Shelf Gas Pty Ltd Contract administration services for venturers for LNG sales to Japan. Marketing and administration services for venturers for33.3333.33 gas processing. North West Shelf LiaisonLiaison for venturers in the Company Pty Ltdsale of LNG to the Japanese market.33.3333.33 China AdministrationContract administration Company Pty Ltdservices for venturers for LNG sales to China.33.3333.33 North West Shelf ShippingLNG vessel fleet advisor. Service Company Pty Ltd33.3333.33 North West Shelf LiftingAllocating, scheduling and Coordinator Pty Ltdadministering the lifting of33.3333.33 LNG and pipeline gas. Audit and review of financial reports5,4726,5102,878 Assurance services140138129 Assurance services required by399-- legislation to be provided by the auditor Other assurance and agreed upon204332832 procedures services Tax services10-- Other services--41 Other overseas member firms of PricewaterhouseCoopers (Australia) Audit of the financial reports of1,9611,5571,274 controlled entities Tax services7601,081258 8,9469,6185,412 (b) Other auditors and their related network firms Ernst & Young1 Audit and review of financial reports--48 Assurance services--611 Other assurance and agreed upon--2,335 procedures services --2,994 1.The disclosure of auditor remuneration is not required as EY is no longer bound by auditor independence requirements for the years ended 31 December 2023 and 31 December 2024. 198WOODSIDE ENERGY GROUP LTD
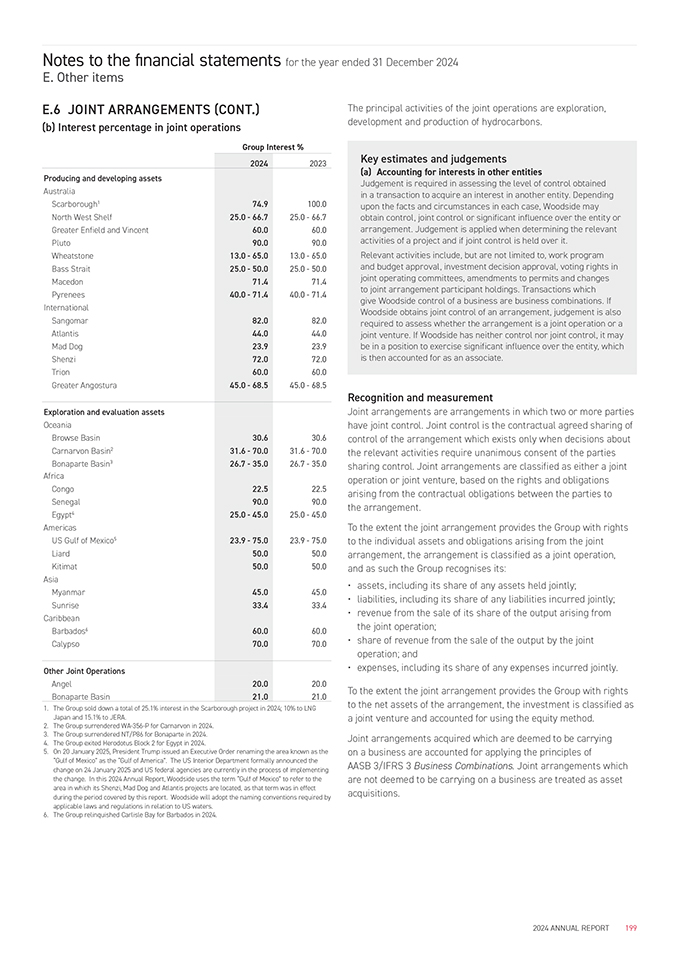
Notes to the financial statements for the year ended 31 December 2024 E. Other items E.6 JOINT ARRANGEMENTS (CONT.) (b) Interest percentage in joint operations Group Interest % 20242023 Producing and developing assets Australia Scarborough174.9100.0 North West Shelf25.0—66.725.0—66.7 Greater Enfield and Vincent60.060.0 Pluto90.090.0 Wheatstone13.0—65.013.0—65.0 Bass Strait25.0—50.025.0—50.0 Macedon71.471.4 Pyrenees40.0—71.440.0—71.4 International Sangomar82.082.0 Atlantis44.044.0 Mad Dog23.923.9 Shenzi72.072.0 Trion60.060.0 Greater Angostura45.0—68.545.0—68.5 The principal activities of the joint operations are exploration, development and production of hydrocarbons. Key estimates and judgements (a) Accounting for interests in other entities Judgement is required in assessing the level of control obtained in a transaction to acquire an interest in another entity. Depending upon the facts and circumstances in each case, Woodside may obtain control, joint control or significant influence over the entity or arrangement. Judgement is applied when determining the relevant activities of a project and if joint control is held over it. Relevant activities include, but are not limited to, work program and budget approval, investment decision approval, voting rights in joint operating committees, amendments to permits and changes to joint arrangement participant holdings. Transactions which give Woodside control of a business are business combinations. If Woodside obtains joint control of an arrangement, judgement is also required to assess whether the arrangement is a joint operation or a joint venture. If Woodside has neither control nor joint control, it may be in a position to exercise significant influence over the entity, which is then accounted for as an associate. Recognition and measurement Exploration and evaluation assets Oceania Browse Basin30.630.6 Carnarvon Basin231.6—70.031.6—70.0 Bonaparte Basin326.7—35.026.7—35.0 Africa Congo22.522.5 Senegal90.090.0 Egypt425.0—45.025.0—45.0 Americas US Gulf of Mexico523.9—75.023.9—75.0 Liard50.050.0 Kitimat50.050.0 Asia Myanmar45.045.0 Sunrise33.433.4 Caribbean Barbados660.060.0 Calypso70.070.0 Other Joint Operations Angel20.020.0 Bonaparte Basin21.021.0 1.The Group sold down a total of 25.1% interest in the Scarborough project in 2024; 10% to LNG Japan and 15.1% to JERA. 2.The Group surrendered WA-356-P for Carnarvon in 2024. 3.The Group surrendered NT/P86 for Bonaparte in 2024. 4.The Group exited Herodotus Block 2 for Egypt in 2024. 5.On 20 January 2025, President Trump issued an Executive Order renaming the area known as the “Gulf of Mexico” as the “Gulf of America”. The US Interior Department formally announced the change on 24 January 2025 and US federal agencies are currently in the process of implementing the change. In this 2024 Annual Report, Woodside uses the term “Gulf of Mexico” to refer to the area in which its Shenzi, Mad Dog and Atlantis projects are located, as that term was in effect during the period covered by this report. Woodside will adopt the naming conventions required by applicable laws and regulations in relation to US waters. 6.The Group relinquished Carlisle Bay for Barbados in 2024. Joint arrangements are arrangements in which two or more parties have joint control. Joint control is the contractual agreed sharing of control of the arrangement which exists only when decisions about the relevant activities require unanimous consent of the parties sharing control. Joint arrangements are classified as either a joint operation or joint venture, based on the rights and obligations arising from the contractual obligations between the parties to the arrangement. To the extent the joint arrangement provides the Group with rights to the individual assets and obligations arising from the joint arrangement, the arrangement is classified as a joint operation, and as such the Group recognises its: •assets, including its share of any assets held jointly; •liabilities, including its share of any liabilities incurred jointly; •revenue from the sale of its share of the output arising from the joint operation; •share of revenue from the sale of the output by the joint operation; and •expenses, including its share of any expenses incurred jointly. To the extent the joint arrangement provides the Group with rights to the net assets of the arrangement, the investment is classified as a joint venture and accounted for using the equity method. Joint arrangements acquired which are deemed to be carrying on a business are accounted for applying the principles of AASB 3/IFRS 3 Business Combinations. Joint arrangements which are not deemed to be carrying on a business are treated as asset acquisitions. 2024 ANNUAL REPORT199
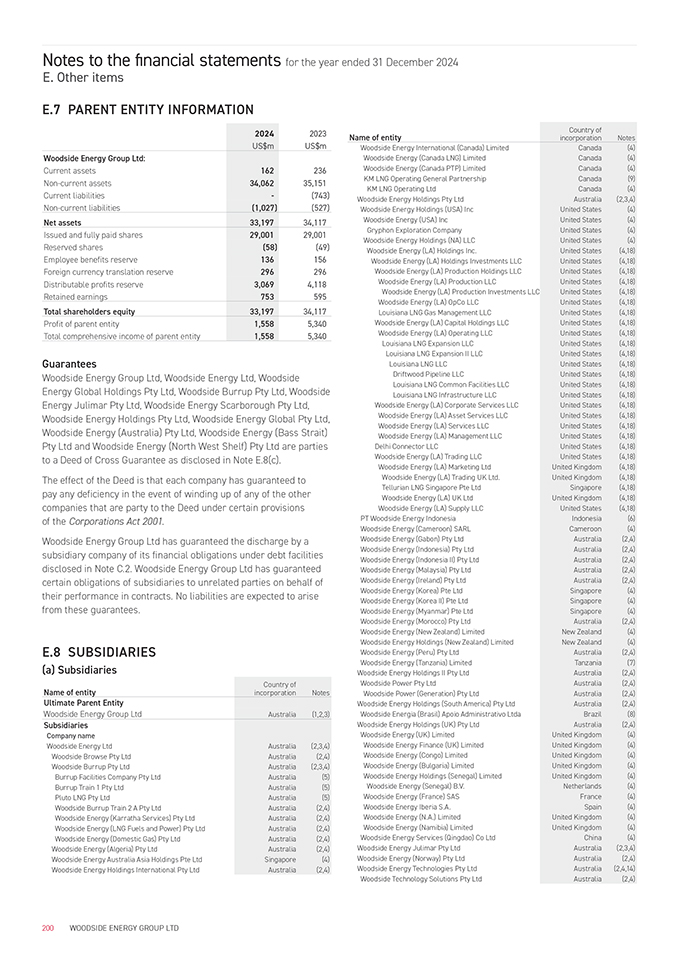
Notes to the financial statements for the year ended 31 December 2024 E. Other items E.7 PARENT ENTITY INFORMATION 2024 2023 US$mUS$m Woodside Energy Group Ltd: Current assets162236 Non-current assets34,06235,151 Current liabilities-(743) Non-current liabilities(1,027)(527) Net assets33,19734,117 Issued and fully paid shares29,00129,001 Reserved shares(58)(49) Employee benefits reserve136156 Foreign currency translation reserve296296 Distributable profits reserve3,0694,118 Retained earnings753595 Total shareholders equity33,19734,117 Profit of parent entity1,5585,340 Total comprehensive income of parent entity1,5585,340 Guarantees Woodside Energy Group Ltd, Woodside Energy Ltd, Woodside Energy Global Holdings Pty Ltd, Woodside Burrup Pty Ltd, Woodside Energy Julimar Pty Ltd, Woodside Energy Scarborough Pty Ltd, Woodside Energy Holdings Pty Ltd, Woodside Energy Global Pty Ltd, Woodside Energy (Australia) Pty Ltd, Woodside Energy (Bass Strait) Pty Ltd and Woodside Energy (North West Shelf) Pty Ltd are parties to a Deed of Cross Guarantee as disclosed in Note E.8(c). The effect of the Deed is that each company has guaranteed to pay any deficiency in the event of winding up of any of the other companies that are party to the Deed under certain provisions of the Corporations Act 2001. Woodside Energy Group Ltd has guaranteed the discharge by a subsidiary company of its financial obligations under debt facilities disclosed in Note C.2. Woodside Energy Group Ltd has guaranteed certain obligations of subsidiaries to unrelated parties on behalf of their performance in contracts. No liabilities are expected to arise from these guarantees. E.8 SUBSIDIARIES (a) Subsidiaries Name of entityCountry of incorporationNotes Ultimate Parent Entity Woodside Energy Group LtdAustralia(1,2,3) Subsidiaries Company name Woodside Energy LtdAustralia(2,3,4) Woodside Browse Pty LtdAustralia(2,4) Woodside Burrup Pty LtdAustralia(2,3,4) Burrup Facilities Company Pty LtdAustralia(5) Burrup Train 1 Pty LtdAustralia(5) Pluto LNG Pty LtdAustralia(5) Woodside Burrup Train 2 A Pty LtdAustralia(2,4) Woodside Energy (Karratha Services) Pty LtdAustralia(2,4) Woodside Energy (LNG Fuels and Power) Pty LtdAustralia(2,4) Woodside Energy (Domestic Gas) Pty LtdAustralia(2,4) Woodside Energy (Algeria) Pty LtdAustralia(2,4) Woodside Energy Australia Asia Holdings Pte LtdSingapore(4) Woodside Energy Holdings International Pty LtdAustralia(2,4) Name of entityCountry of incorporationNotes Woodside Energy International (Canada) LimitedCanada(4) Woodside Energy (Canada LNG) LimitedCanada(4) Woodside Energy (Canada PTP) LimitedCanada(4) KM LNG Operating General PartnershipCanada(9) KM LNG Operating LtdCanada(4) Woodside Energy Holdings Pty LtdAustralia(2,3,4) Woodside Energy Holdings (USA) IncUnited States(4) Woodside Energy (USA) IncUnited States(4) Gryphon Exploration CompanyUnited States(4) Woodside Energy Holdings (NA) LLCUnited States(4) Woodside Energy (LA) Holdings Inc.United States(4,18) Woodside Energy (LA) Holdings Investments LLCUnited States(4,18) Woodside Energy (LA) Production Holdings LLCUnited States(4,18) Woodside Energy (LA) Production LLCUnited States(4,18) Woodside Energy (LA) Production Investments LLCUnited States(4,18) Woodside Energy (LA) OpCo LLCUnited States(4,18) Louisiana LNG Gas Management LLCUnited States(4,18) Woodside Energy (LA) Capital Holdings LLCUnited States(4,18) Woodside Energy (LA) Operating LLCUnited States(4,18) Louisiana LNG Expansion LLCUnited States(4,18) Louisiana LNG Expansion II LLCUnited States(4,18) Louisiana LNG LLCUnited States(4,18) Driftwood Pipeline LLCUnited States(4,18) Louisiana LNG Common Facilities LLCUnited States(4,18) Louisiana LNG Infrastructure LLCUnited States(4,18) Woodside Energy (LA) Corporate Services LLCUnited States(4,18) Woodside Energy (LA) Asset Services LLCUnited States(4,18) Woodside Energy (LA) Services LLCUnited States(4,18) Woodside Energy (LA) Management LLCUnited States(4,18) Delhi Connector LLCUnited States(4,18) Woodside Energy (LA) Trading LLCUnited States(4,18) Woodside Energy (LA) Marketing LtdUnited Kingdom(4,18) Woodside Energy (LA) Trading UK Ltd.United Kingdom(4,18) Tellurian LNG Singapore Pte LtdSingapore(4,18) Woodside Energy (LA) UK LtdUnited Kingdom(4,18) Woodside Energy (LA) Supply LLCUnited States(4,18) PT Woodside Energy IndonesiaIndonesia(6) Woodside Energy (Cameroon) SARLCameroon(4) Woodside Energy (Gabon) Pty LtdAustralia(2,4) Woodside Energy (Indonesia) Pty LtdAustralia(2,4) Woodside Energy (Indonesia II) Pty LtdAustralia(2,4) Woodside Energy (Malaysia) Pty LtdAustralia(2,4) Woodside Energy (Ireland) Pty LtdAustralia(2,4) Woodside Energy (Korea) Pte LtdSingapore(4) Woodside Energy (Korea II) Pte LtdSingapore(4) Woodside Energy (Myanmar) Pte LtdSingapore(4) Woodside Energy (Morocco) Pty LtdAustralia(2,4) Woodside Energy (New Zealand) LimitedNew Zealand(4) Woodside Energy Holdings (New Zealand) LimitedNew Zealand(4) Woodside Energy (Peru) Pty LtdAustralia(2,4) Woodside Energy (Tanzania) LimitedTanzania(7) Woodside Energy Holdings II Pty LtdAustralia(2,4) Woodside Power Pty LtdAustralia(2,4) Woodside Power (Generation) Pty LtdAustralia(2,4) Woodside Energy Holdings (South America) Pty LtdAustralia(2,4) Woodside Energia (Brasil) Apoio Administrativo LtdaBrazil(8) Woodside Energy Holdings (UK) Pty LtdAustralia(2,4) Woodside Energy (UK) LimitedUnited Kingdom(4) Woodside Energy Finance (UK) LimitedUnited Kingdom(4) Woodside Energy (Congo) LimitedUnited Kingdom(4) Woodside Energy (Bulgaria) LimitedUnited Kingdom(4) Woodside Energy Holdings (Senegal) LimitedUnited Kingdom(4) Woodside Energy (Senegal) B.V.Netherlands(4) Woodside Energy (France) SASFrance(4) Woodside Energy Iberia S.A.Spain(4) Woodside Energy (N.A.) LimitedUnited Kingdom(4) Woodside Energy (Namibia) LimitedUnited Kingdom(4) Woodside Energy Services (Qingdao) Co LtdChina(4) Woodside Energy Julimar Pty LtdAustralia(2,3,4) Woodside Energy (Norway) Pty LtdAustralia(2,4) Woodside Energy Technologies Pty LtdAustralia(2,4,14) Woodside Technology Solutions Pty LtdAustralia(2,4) 200WOODSIDE ENERGY GROUP LTD
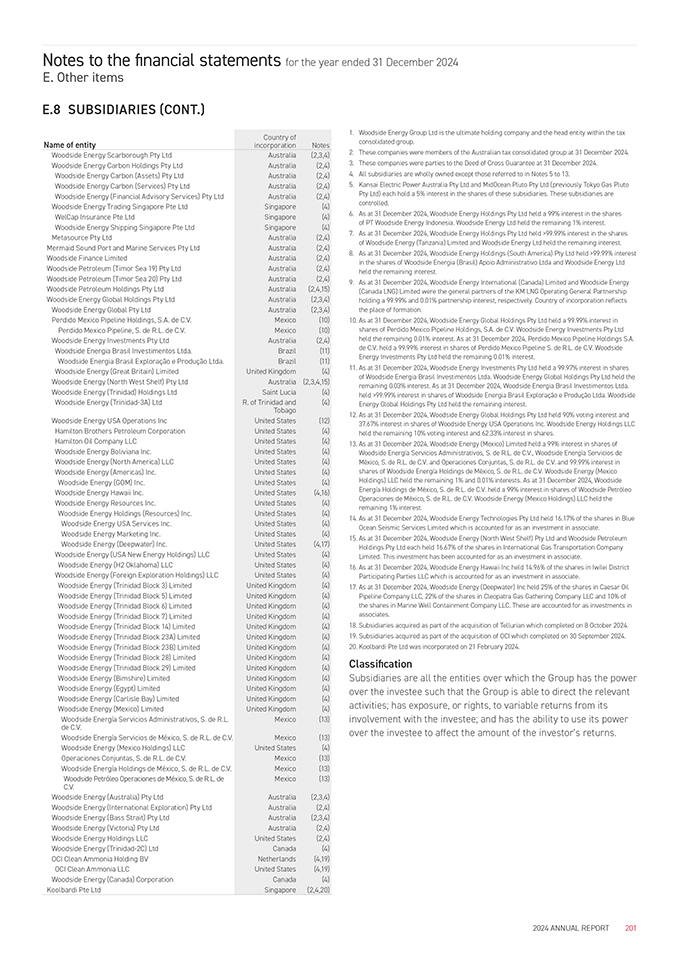
Notes to the financial statements for the year ended 31 December 2024 E. Other items E.8 SUBSIDIARIES (CONT.) Name of entity Country of incorporation Notes Woodside Energy Scarborough Pty Ltd Australia (2,3,4) Woodside Energy Carbon Holdings Pty Ltd Australia (2,4) Woodside Energy Carbon (Assets) Pty Ltd Australia (2,4) Woodside Energy Carbon (Services) Pty Ltd Australia (2,4) Woodside Energy (Financial Advisory Services) Pty Ltd Australia (2,4) Woodside Energy Trading Singapore Pte Ltd Singapore (4) WelCap Insurance Pte Ltd Singapore (4) Woodside Energy Shipping Singapore Pte Ltd Singapore (4) Metasource Pty Ltd Australia (2,4) Mermaid Sound Port and Marine Services Pty Ltd Australia (2,4) Woodside Finance Limited Australia (2,4) Woodside Petroleum (Timor Sea 19) Pty Ltd Australia (2,4) Woodside Petroleum (Timor Sea 20) Pty Ltd Australia (2,4) Woodside Petroleum Holdings Pty Ltd Australia (2,4,15) Woodside Energy Global Holdings Pty Ltd Australia (2,3,4) Woodside Energy Global Pty Ltd Australia (2,3,4) Perdido Mexico Pipeline Holdings, S.A. de C.V. Mexico (10) Perdido Mexico Pipeline, S. de R.L. de C.V. Mexico (10) Woodside Energy Investments Pty Ltd Australia (2,4) Woodside Energia Brasil Investimentos Ltda. Brazil (11) Woodside Energia Brasil Exploração e Produção Ltda. Brazil (11) Woodside Energy (Great Britain) Limited United Kingdom (4) Woodside Energy (North West Shelf) Pty Ltd Australia (2,3,4,15) Woodside Energy (Trinidad) Holdings Ltd Saint Lucia (4) Woodside Energy (Trinidad-3A) Ltd R. of Trinidad and (4) Tobago Woodside Energy USA Operations Inc United States (12) Hamilton Brothers Petroleum Corporation United States (4) Hamilton Oil Company LLC United States (4) Woodside Energy Boliviana Inc. United States (4) Woodside Energy (North America) LLC United States (4) Woodside Energy (Americas) Inc. United States (4) Woodside Energy (GOM) Inc. United States (4) Woodside Energy Hawaii Inc. United States (4,16) Woodside Energy Resources Inc. United States (4) Woodside Energy Holdings (Resources) Inc. United States (4) Woodside Energy USA Services Inc. United States (4) Woodside Energy Marketing Inc. United States (4) Woodside Energy (Deepwater) Inc. United States (4,17) Woodside Energy (USA New Energy Holdings) LLC United States (4) Woodside Energy (H2 Oklahoma) LLC United States (4) Woodside Energy (Foreign Exploration Holdings) LLC United States (4) Woodside Energy (Trinidad Block 3) Limited United Kingdom (4) Woodside Energy (Trinidad Block 5) Limited United Kingdom (4) Woodside Energy (Trinidad Block 6) Limited United Kingdom (4) Woodside Energy (Trinidad Block 7) Limited United Kingdom (4) Woodside Energy (Trinidad Block 14) Limited United Kingdom (4) Woodside Energy (Trinidad Block 23A) Limited United Kingdom (4) Woodside Energy (Trinidad Block 23B) Limited United Kingdom (4) Woodside Energy (Trinidad Block 28) Limited United Kingdom (4) Woodside Energy (Trinidad Block 29) Limited United Kingdom (4) Woodside Energy (Bimshire) Limited United Kingdom (4) Woodside Energy (Egypt) Limited United Kingdom (4) Woodside Energy (Carlisle Bay) Limited United Kingdom (4) Woodside Energy (Mexico) Limited United Kingdom (4) Woodside Energía Servicios Administrativos, S. de R.L. Mexico (13) de C.V. Woodside Energía Servicios de México, S. de R.L. de C.V. Mexico (13) Woodside Energy (Mexico Holdings) LLC United States (4) Operaciones Conjuntas, S. de R.L. de C.V. Mexico (13) Woodside Energía Holdings de México, S. de R.L. de C.V. Mexico (13) Woodside Petróleo Operaciones de México, S. de R.L. de Mexico (13) C.V. Woodside Energy (Australia) Pty Ltd Australia (2,3,4) Woodside Energy (International Exploration) Pty Ltd Australia (2,4) Woodside Energy (Bass Strait) Pty Ltd Australia (2,3,4) Woodside Energy (Victoria) Pty Ltd Australia (2,4) Woodside Energy Holdings LLC United States (2,4) Woodside Energy (Trinidad-2C) Ltd Canada (4) OCI Clean Ammonia Holding BV Netherlands (4,19) OCI Clean Ammonia LLC United States (4,19) Woodside Energy (Canada) Corporation Canada (4) Koolbardi Pte Ltd Singapore (2,4,20) 1. Woodside Energy Group Ltd is the ultimate holding company and the head entity within the tax consolidated group. 2. These companies were members of the Australian tax consolidated group at 31 December 2024. 3. These companies were parties to the Deed of Cross Guarantee at 31 December 2024. 4. All subsidiaries are wholly owned except those referred to in Notes 5 to 13. 5. Kansai Electric Power Australia Pty Ltd and MidOcean Pluto Pty Ltd (previously Tokyo Gas Pluto Pty Ltd) each hold a 5% interest in the shares of these subsidiaries. These subsidiaries are controlled. 6. As at 31 December 2024, Woodside Energy Holdings Pty Ltd held a 99% interest in the shares of PT Woodside Energy Indonesia. Woodside Energy Ltd held the remaining 1% interest. 7. As at 31 December 2024, Woodside Energy Holdings Pty Ltd held >99.99% interest in the shares of Woodside Energy (Tanzania) Limited and Woodside Energy Ltd held the remaining interest. 8. As at 31 December 2024, Woodside Energy Holdings (South America) Pty Ltd held >99.99% interest in the shares of Woodside Energia (Brasil) Apoio Administrativo Ltda and Woodside Energy Ltd held the remaining interest. 9. As at 31 December 2024, Woodside Energy International (Canada) Limited and Woodside Energy (Canada LNG) Limited were the general partners of the KM LNG Operating General Partnership holding a 99.99% and 0.01% partnership interest, respectively. Country of incorporation reflects the place of formation. 10. As at 31 December 2024, Woodside Energy Global Holdings Pty Ltd held a 99.99% interest in shares of Perdido Mexico Pipeline Holdings, S.A. de C.V. Woodside Energy Investments Pty Ltd held the remaining 0.01% interest. As at 31 December 2024, Perdido Mexico Pipeline Holdings S.A. de C.V. held a 99.99% interest in shares of Perdido Mexico Pipeline S. de R.L. de C.V. Woodside Energy Investments Pty Ltd held the remaining 0.01% interest. 11. As at 31 December 2024, Woodside Energy Investments Pty Ltd held a 99.97% interest in shares of Woodside Energia Brasil Investimentos Ltda. Woodside Energy Global Holdings Pty Ltd held the remaining 0.03% interest. As at 31 December 2024, Woodside Energia Brasil Investimentos Ltda. held >99.99% interest in shares of Woodside Energia Brasil Exploração e Produção Ltda. Woodside Energy Global Holdings Pty Ltd held the remaining interest. 12. As at 31 December 2024, Woodside Energy Global Holdings Pty Ltd held 90% voting interest and 37.67% interest in shares of Woodside Energy USA Operations Inc. Woodside Energy Holdings LLC held the remaining 10% voting interest and 62.33% interest in shares. 13. As at 31 December 2024, Woodside Energy (Mexico) Limited held a 99% interest in shares of Woodside Energía Servicios Administrativos, S. de R.L. de C.V., Woodside Energía Servicios de México, S. de R.L. de C.V. and Operaciones Conjuntas, S. de R.L. de C.V. and 99.99% interest in shares of Woodside Energía Holdings de México, S. de R.L. de C.V. Woodside Energy (Mexico Holdings) LLC held the remaining 1% and 0.01% interests. As at 31 December 2024, Woodside Energía Holdings de México, S. de R.L. de C.V. held a 99% interest in shares of Woodside Petróleo Operaciones de México, S. de R.L. de C.V. Woodside Energy (Mexico Holdings) LLC held the remaining 1% interest. 14. As at 31 December 2024, Woodside Energy Technologies Pty Ltd held 16.17% of the shares in Blue Ocean Seismic Services Limited which is accounted for as an investment in associate. 15. As at 31 December 2024, Woodside Energy (North West Shelf) Pty Ltd and Woodside Petroleum Holdings Pty Ltd each held 16.67% of the shares in International Gas Transportation Company Limited. This investment has been accounted for as an investment in associate. 16. As at 31 December 2024, Woodside Energy Hawaii Inc held 14.96% of the shares in Iwilei District Participating Parties LLC which is accounted for as an investment in associate. 17. As at 31 December 2024, Woodside Energy (Deepwater) Inc held 25% of the shares in Caesar Oil Pipeline Company LLC, 22% of the shares in Cleopatra Gas Gathering Company LLC and 10% of the shares in Marine Well Containment Company LLC. These are accounted for as investments in associates. 18. Subsidiaries acquired as part of the acquisition of Tellurian which completed on 8 October 2024. 19. Subsidiaries acquired as part of the acquisition of OCI which completed on 30 September 2024. 20. Koolbardi Pte Ltd was incorporated on 21 February 2024. Classification Subsidiaries are all the entities over which the Group has the power over the investee such that the Group is able to direct the relevant activities; has exposure, or rights, to variable returns from its involvement with the investee; and has the ability to use its power over the investee to affect the amount of the investor’s returns. 2024 ANNUAL REPORT 201
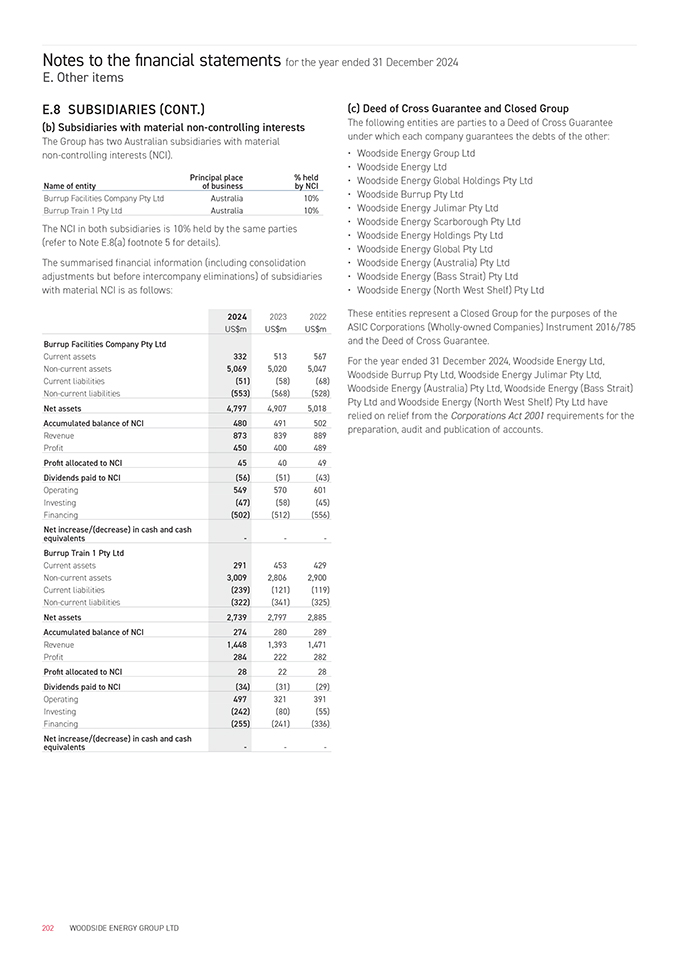
Notes to the financial statements for the year ended 31 December 2024 E. Other items E.8 SUBSIDIARIES (CONT.) (b) Subsidiaries with material non-controlling interests The Group has two Australian subsidiaries with material non-controlling interests (NCI). Name of entity Principal place % held of business by NCI Burrup Facilities Company Pty Ltd Australia 10% Burrup Train 1 Pty Ltd Australia 10% The NCI in both subsidiaries is 10% held by the same parties (refer to Note E.8(a) footnote 5 for details). The summarised financial information (including consolidation adjustments but before intercompany eliminations) of subsidiaries with material NCI is as follows: 2024 2023 2022 US$m US$m US$m Burrup Facilities Company Pty Ltd Current assets 332 513 567 Non-current assets 5,069 5,020 5,047 Current liabilities (51) (58) (68) Non-current liabilities (553) (568) (528) Net assets 4,797 4,907 5,018 Accumulated balance of NCI 480 491 502 Revenue 873 839 889 Profit 450 400 489 Profit allocated to NCI 45 40 49 Dividends paid to NCI (56) (51) (43) Operating 549 570 601 Investing (47) (58) (45) Financing (502) (512) (556) Net increase/(decrease) in cash and cash— equivalents — Burrup Train 1 Pty Ltd Current assets 291 453 429 Non-current assets 3,009 2,806 2,900 Current liabilities (239) (121) (119) Non-current liabilities (322) (341) (325) Net assets 2,739 2,797 2,885 Accumulated balance of NCI 274 280 289 Revenue 1,448 1,393 1,471 Profit 284 222 282 Profit allocated to NCI 28 22 28 Dividends paid to NCI (34) (31) (29) Operating 497 321 391 Investing (242) (80) (55) Financing (255) (241) (336) Net increase/(decrease) in cash and cash— equivalents — (c) Deed of Cross Guarantee and Closed Group The following entities are parties to a Deed of Cross Guarantee under which each company guarantees the debts of the other: • Woodside Energy Group Ltd • Woodside Energy Ltd • Woodside Energy Global Holdings Pty Ltd • Woodside Burrup Pty Ltd • Woodside Energy Julimar Pty Ltd • Woodside Energy Scarborough Pty Ltd • Woodside Energy Holdings Pty Ltd • Woodside Energy Global Pty Ltd • Woodside Energy (Australia) Pty Ltd • Woodside Energy (Bass Strait) Pty Ltd • Woodside Energy (North West Shelf) Pty Ltd These entities represent a Closed Group for the purposes of the ASIC Corporations (Wholly-owned Companies) Instrument 2016/785 and the Deed of Cross Guarantee. For the year ended 31 December 2024, Woodside Energy Ltd, Woodside Burrup Pty Ltd, Woodside Energy Julimar Pty Ltd, Woodside Energy (Australia) Pty Ltd, Woodside Energy (Bass Strait) Pty Ltd and Woodside Energy (North West Shelf) Pty Ltd have relied on relief from the Corporations Act 2001 requirements for the preparation, audit and publication of accounts. 202 WOODSIDE ENERGY GROUP LTD
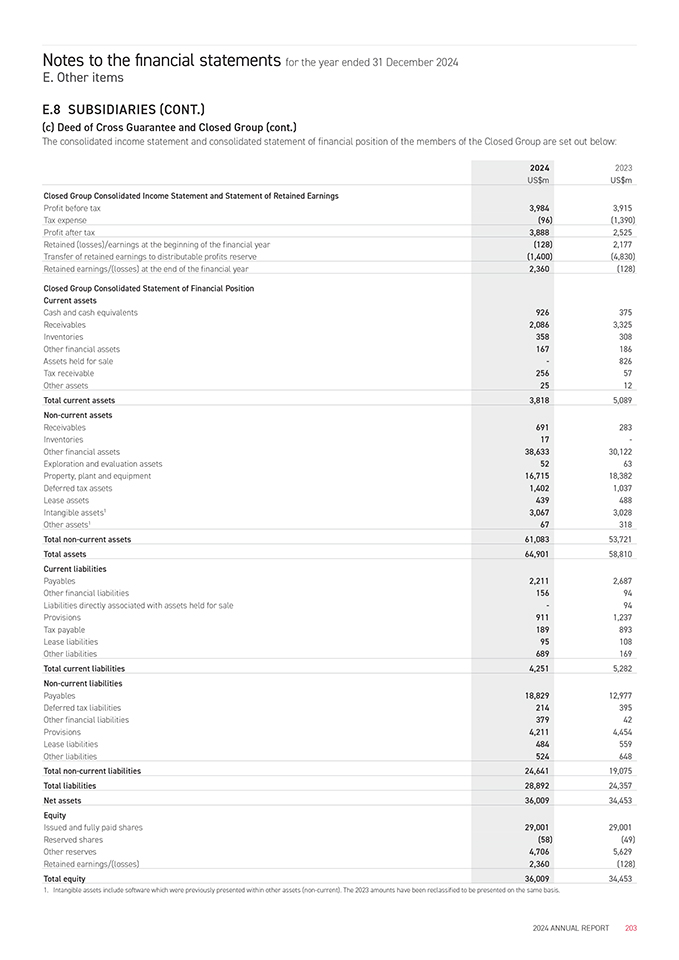
Notes to the financial statements for the year ended 31 December 2024 E. Other items E.8 SUBSIDIARIES (CONT.) (c) Deed of Cross Guarantee and Closed Group (cont.) The consolidated income statement and consolidated statement of financial position of the members of the Closed Group are set out below: 2024 2023 US$m US$m Closed Group Consolidated Income Statement and Statement of Retained Earnings Profit before tax 3,984 3,915 Tax expense (96) (1,390) Profit after tax 3,888 2,525 Retained (losses)/earnings at the beginning of the financial year (128) 2,177 Transfer of retained earnings to distributable profits reserve (1,400) (4,830) Retained earnings/(losses) at the end of the financial year 2,360 (128) Closed Group Consolidated Statement of Financial Position Current assets Cash and cash equivalents 926 375 Receivables 2,086 3,325 Inventories 358 308 Other financial assets 167 186 Assets held for sale—826 Tax receivable 256 57 Other assets 25 12 Total current assets 3,818 5,089 Non-current assets Receivables 691 283 Inventories 17—Other financial assets 38,633 30,122 Exploration and evaluation assets 52 63 Property, plant and equipment 16,715 18,382 Deferred tax assets 1,402 1,037 Lease assets 439 488 Intangible assets1 3,067 3,028 Other assets1 67 318 Total non-current assets 61,083 53,721 Total assets 64,901 58,810 Current liabilities Payables 2,211 2,687 Other financial liabilities 156 94 Liabilities directly associated with assets held for sale—94 Provisions 911 1,237 Tax payable 189 893 Lease liabilities 95 108 Other liabilities 689 169 Total current liabilities 4,251 5,282 Non-current liabilities Payables 18,829 12,977 Deferred tax liabilities 214 395 Other financial liabilities 379 42 Provisions 4,211 4,454 Lease liabilities 484 559 Other liabilities 524 648 Total non-current liabilities 24,641 19,075 Total liabilities 28,892 24,357 Net assets 36,009 34,453 Equity Issued and fully paid shares 29,001 29,001 Reserved shares (58) (49) Other reserves 4,706 5,629 Retained earnings/(losses) 2,360 (128) Total equity 36,009 34,453 1. Intangible assets include software which were previously presented within other assets (non-current). The 2023 amounts have been reclassified to be presented on the same basis. 2024 ANNUAL REPORT 203
Notes to the financial statements for the year ended 31 December 2024 E. Other items E.9 OTHER ACCOUNTING POLICIES (a) Summary of other material accounting policies Australia tax consolidation The parent and its wholly owned Australian controlled entities have elected to enter a tax consolidation, with Woodside Energy Group Ltd as the head entity of the tax consolidated group. The members of the Australian tax consolidated group are identified in Note E.8(a). The tax expense/benefit, deferred tax liabilities and deferred tax assets arising from temporary differences of the members of the tax consolidated group are recognised in the separate financial statements of the members of the tax consolidated group, using the stand-alone approach. Entities within the tax consolidated group have entered into a tax funding arrangement and a tax sharing agreement with the head entity. Under the tax funding agreement, Woodside Energy Group Ltd and each of the entities in the tax consolidated group have agreed to pay or receive a tax equivalent payment to or from the head entity, based on the current tax liability or current tax asset of the entity. The tax sharing agreement entered into between members of the tax consolidated group provides for the determination of the allocation of income tax liabilities between the entities, should the head entity default on its tax payment obligations. No amounts have been recognised in the financial statements in respect of this agreement as payment of any amounts under the tax sharing agreement is considered remote. US tax consolidation The Group has two separate USA Tax Consolidation Groups as at 31 December 2024: • Woodside Energy USA Operations Inc. and its wholly owned USA controlled entities have elected to file a consolidated tax return, with Woodside Energy USA Operations Inc. as the parent of the tax consolidated group. • Woodside Energy Holdings (USA) Inc. and its wholly owned USA controlled entities have elected to file a consolidated tax return, with Woodside Energy Holdings (USA) Inc. as the parent of the tax consolidated group. The consolidated tax return will include the subsidiaries acquired as part of the Tellurian acquisition from acquisition date. The deferred tax assets and liabilities arising from temporary differences of the members of this tax consolidated group have not been recognised. The tax expense/benefit, deferred tax liabilities and deferred tax assets arising from temporary differences of the members of the tax consolidated group are computed on a separate company basis. Entities within the tax consolidated group have entered into a tax sharing agreement. Under the tax sharing agreement, the tax liability for the consolidated group or the utilisation of tax attributes are settled periodically between the members of the group. No amounts have been recognised in the financial statements in respect of this agreement as payment of any amounts under the tax sharing agreement is considered remote. (b) New standards and interpretations New and amended accounting standards adopted A number of amended standards became applicable for the current reporting period. The Group did not make any significant changes to its accounting policies and did not make retrospective adjustments as a result of adopting these amended standards. These amendments did not materially impact the accounting policies or amounts disclosed in the year end financial statements of the Group. New standards and interpretations not yet adopted Certain new accounting standards, amendments to accounting standards and interpretations have been published that are not mandatory for the 31 December 2024 reporting period and have not been early adopted by the Group. These standards, amendments or interpretations are not expected to have a material impact to the Group in the current or future reporting periods and on foreseeable future transactions. The assessment of the impact of AASB 18/IFRS 18 Presentation and Disclosure in Financial Statements effective from 1 January 2027 is currently in progress. 204 WOODSIDE ENERGY GROUP LTD
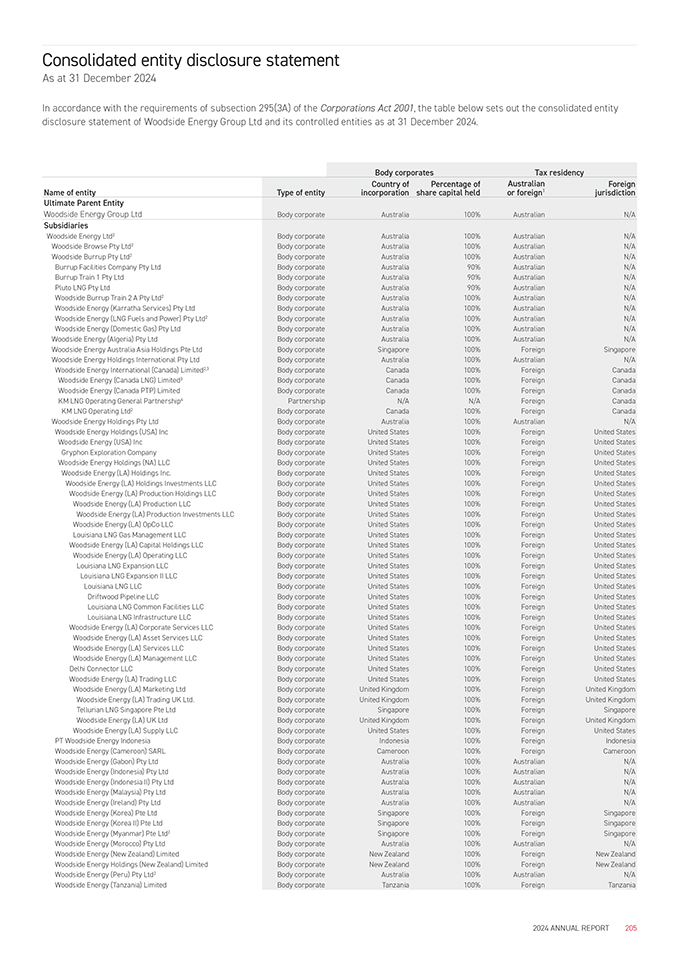
Consolidated entity disclosure statement As at 31 December 2024 In accordance with the requirements of subsection 295(3A) of the Corporations Act 2001, the table below sets out the consolidated entity disclosure statement of Woodside Energy Group Ltd and its controlled entities as at 31 December 2024. Body corporates Tax residency Name of entity Type of entity Country of Percentage of Australian Foreign incorporation share capital held or foreign1 jurisdiction Ultimate Parent Entity Woodside Energy Group Ltd Body corporate Australia 100% Australian N/A Subsidiaries Woodside Energy Ltd2 Body corporate Australia 100% Australian N/A Woodside Browse Pty Ltd2 Body corporate Australia 100% Australian N/A Woodside Burrup Pty Ltd2 Body corporate Australia 100% Australian N/A Burrup Facilities Company Pty Ltd Body corporate Australia 90% Australian N/A Burrup Train 1 Pty Ltd Body corporate Australia 90% Australian N/A Pluto LNG Pty Ltd Body corporate Australia 90% Australian N/A Woodside Burrup Train 2 A Pty Ltd2 Body corporate Australia 100% Australian N/A Woodside Energy (Karratha Services) Pty Ltd Body corporate Australia 100% Australian N/A Woodside Energy (LNG Fuels and Power) Pty Ltd2 Body corporate Australia 100% Australian N/A Woodside Energy (Domestic Gas) Pty Ltd Body corporate Australia 100% Australian N/A Woodside Energy (Algeria) Pty Ltd Body corporate Australia 100% Australian N/A Woodside Energy Australia Asia Holdings Pte Ltd Body corporate Singapore 100% Foreign Singapore Woodside Energy Holdings International Pty Ltd Body corporate Australia 100% Australian N/A Woodside Energy International (Canada) Limited2,3 Body corporate Canada 100% Foreign Canada Woodside Energy (Canada LNG) Limited3 Body corporate Canada 100% Foreign Canada Woodside Energy (Canada PTP) Limited Body corporate Canada 100% Foreign Canada KM LNG Operating General Partnership4 Partnership N/A N/A Foreign Canada KM LNG Operating Ltd2 Body corporate Canada 100% Foreign Canada Woodside Energy Holdings Pty Ltd Body corporate Australia 100% Australian N/A Woodside Energy Holdings (USA) Inc Body corporate United States 100% Foreign United States Woodside Energy (USA) Inc Body corporate United States 100% Foreign United States Gryphon Exploration Company Body corporate United States 100% Foreign United States Woodside Energy Holdings (NA) LLC Body corporate United States 100% Foreign United States Woodside Energy (LA) Holdings Inc. Body corporate United States 100% Foreign United States Woodside Energy (LA) Holdings Investments LLC Body corporate United States 100% Foreign United States Woodside Energy (LA) Production Holdings LLC Body corporate United States 100% Foreign United States Woodside Energy (LA) Production LLC Body corporate United States 100% Foreign United States Woodside Energy (LA) Production Investments LLC Body corporate United States 100% Foreign United States Woodside Energy (LA) OpCo LLC Body corporate United States 100% Foreign United States Louisiana LNG Gas Management LLC Body corporate United States 100% Foreign United States Woodside Energy (LA) Capital Holdings LLC Body corporate United States 100% Foreign United States Woodside Energy (LA) Operating LLC Body corporate United States 100% Foreign United States Louisiana LNG Expansion LLC Body corporate United States 100% Foreign United States Louisiana LNG Expansion II LLC Body corporate United States 100% Foreign United States Louisiana LNG LLC Body corporate United States 100% Foreign United States Driftwood Pipeline LLC Body corporate United States 100% Foreign United States Louisiana LNG Common Facilities LLC Body corporate United States 100% Foreign United States Louisiana LNG Infrastructure LLC Body corporate United States 100% Foreign United States Woodside Energy (LA) Corporate Services LLC Body corporate United States 100% Foreign United States Woodside Energy (LA) Asset Services LLC Body corporate United States 100% Foreign United States Woodside Energy (LA) Services LLC Body corporate United States 100% Foreign United States Woodside Energy (LA) Management LLC Body corporate United States 100% Foreign United States Delhi Connector LLC Body corporate United States 100% Foreign United States Woodside Energy (LA) Trading LLC Body corporate United States 100% Foreign United States Woodside Energy (LA) Marketing Ltd Body corporate United Kingdom 100% Foreign United Kingdom Woodside Energy (LA) Trading UK Ltd. Body corporate United Kingdom 100% Foreign United Kingdom Tellurian LNG Singapore Pte Ltd Body corporate Singapore 100% Foreign Singapore Woodside Energy (LA) UK Ltd Body corporate United Kingdom 100% Foreign United Kingdom Woodside Energy (LA) Supply LLC Body corporate United States 100% Foreign United States PT Woodside Energy Indonesia Body corporate Indonesia 100% Foreign Indonesia Woodside Energy (Cameroon) SARL Body corporate Cameroon 100% Foreign Cameroon Woodside Energy (Gabon) Pty Ltd Body corporate Australia 100% Australian N/A Woodside Energy (Indonesia) Pty Ltd Body corporate Australia 100% Australian N/A Woodside Energy (Indonesia II) Pty Ltd Body corporate Australia 100% Australian N/A Woodside Energy (Malaysia) Pty Ltd Body corporate Australia 100% Australian N/A Woodside Energy (Ireland) Pty Ltd Body corporate Australia 100% Australian N/A Woodside Energy (Korea) Pte Ltd Body corporate Singapore 100% Foreign Singapore Woodside Energy (Korea II) Pte Ltd Body corporate Singapore 100% Foreign Singapore Woodside Energy (Myanmar) Pte Ltd2 Body corporate Singapore 100% Foreign Singapore Woodside Energy (Morocco) Pty Ltd Body corporate Australia 100% Australian N/A Woodside Energy (New Zealand) Limited Body corporate New Zealand 100% Foreign New Zealand Woodside Energy Holdings (New Zealand) Limited Body corporate New Zealand 100% Foreign New Zealand Woodside Energy (Peru) Pty Ltd2 Body corporate Australia 100% Australian N/A Woodside Energy (Tanzania) Limited Body corporate Tanzania 100% Foreign Tanzania 2024 ANNUAL REPORT 205
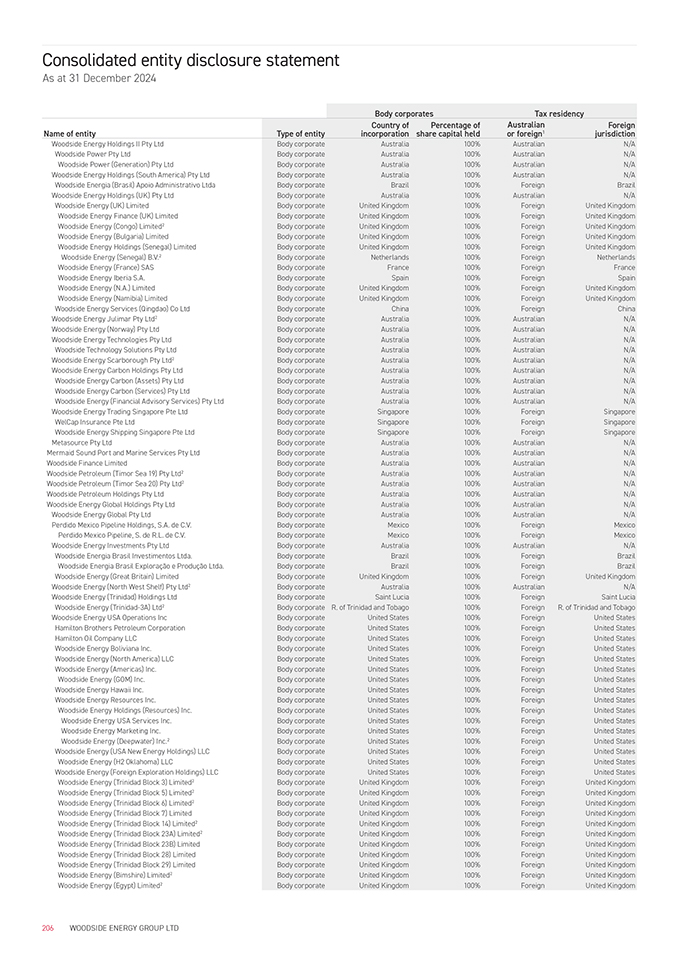
Consolidated entity disclosure statement As at 31 December 2024 Body corporates Tax residency Name of entity Type of entity Country of Percentage of Australian Foreign incorporation share capital held or foreign1 jurisdiction Woodside Energy Holdings II Pty Ltd Body corporate Australia 100% Australian N/A Woodside Power Pty Ltd Body corporate Australia 100% Australian N/A Woodside Power (Generation) Pty Ltd Body corporate Australia 100% Australian N/A Woodside Energy Holdings (South America) Pty Ltd Body corporate Australia 100% Australian N/A Woodside Energia (Brasil) Apoio Administrativo Ltda Body corporate Brazil 100% Foreign Brazil Woodside Energy Holdings (UK) Pty Ltd Body corporate Australia 100% Australian N/A Woodside Energy (UK) Limited Body corporate United Kingdom 100% Foreign United Kingdom Woodside Energy Finance (UK) Limited Body corporate United Kingdom 100% Foreign United Kingdom Woodside Energy (Congo) Limited2 Body corporate United Kingdom 100% Foreign United Kingdom Woodside Energy (Bulgaria) Limited Body corporate United Kingdom 100% Foreign United Kingdom Woodside Energy Holdings (Senegal) Limited Body corporate United Kingdom 100% Foreign United Kingdom Woodside Energy (Senegal) B.V.2 Body corporate Netherlands 100% Foreign Netherlands Woodside Energy (France) SAS Body corporate France 100% Foreign France Woodside Energy Iberia S.A. Body corporate Spain 100% Foreign Spain Woodside Energy (N.A.) Limited Body corporate United Kingdom 100% Foreign United Kingdom Woodside Energy (Namibia) Limited Body corporate United Kingdom 100% Foreign United Kingdom Woodside Energy Services (Qingdao) Co Ltd Body corporate China 100% Foreign China Woodside Energy Julimar Pty Ltd2 Body corporate Australia 100% Australian N/A Woodside Energy (Norway) Pty Ltd Body corporate Australia 100% Australian N/A Woodside Energy Technologies Pty Ltd Body corporate Australia 100% Australian N/A Woodside Technology Solutions Pty Ltd Body corporate Australia 100% Australian N/A Woodside Energy Scarborough Pty Ltd2 Body corporate Australia 100% Australian N/A Woodside Energy Carbon Holdings Pty Ltd Body corporate Australia 100% Australian N/A Woodside Energy Carbon (Assets) Pty Ltd Body corporate Australia 100% Australian N/A Woodside Energy Carbon (Services) Pty Ltd Body corporate Australia 100% Australian N/A Woodside Energy (Financial Advisory Services) Pty Ltd Body corporate Australia 100% Australian N/A Woodside Energy Trading Singapore Pte Ltd Body corporate Singapore 100% Foreign Singapore WelCap Insurance Pte Ltd Body corporate Singapore 100% Foreign Singapore Woodside Energy Shipping Singapore Pte Ltd Body corporate Singapore 100% Foreign Singapore Metasource Pty Ltd Body corporate Australia 100% Australian N/A Mermaid Sound Port and Marine Services Pty Ltd Body corporate Australia 100% Australian N/A Woodside Finance Limited Body corporate Australia 100% Australian N/A Woodside Petroleum (Timor Sea 19) Pty Ltd2 Body corporate Australia 100% Australian N/A Woodside Petroleum (Timor Sea 20) Pty Ltd2 Body corporate Australia 100% Australian N/A Woodside Petroleum Holdings Pty Ltd Body corporate Australia 100% Australian N/A Woodside Energy Global Holdings Pty Ltd Body corporate Australia 100% Australian N/A Woodside Energy Global Pty Ltd Body corporate Australia 100% Australian N/A Perdido Mexico Pipeline Holdings, S.A. de C.V. Body corporate Mexico 100% Foreign Mexico Perdido Mexico Pipeline, S. de R.L. de C.V. Body corporate Mexico 100% Foreign Mexico Woodside Energy Investments Pty Ltd Body corporate Australia 100% Australian N/A Woodside Energia Brasil Investimentos Ltda. Body corporate Brazil 100% Foreign Brazil Woodside Energia Brasil Exploração e Produção Ltda. Body corporate Brazil 100% Foreign Brazil Woodside Energy (Great Britain) Limited Body corporate United Kingdom 100% Foreign United Kingdom Woodside Energy (North West Shelf) Pty Ltd2 Body corporate Australia 100% Australian N/A Woodside Energy (Trinidad) Holdings Ltd Body corporate Saint Lucia 100% Foreign Saint Lucia Woodside Energy (Trinidad-3A) Ltd2 Body corporate R. of Trinidad and Tobago 100% Foreign R. of Trinidad and Tobago Woodside Energy USA Operations Inc Body corporate United States 100% Foreign United States Hamilton Brothers Petroleum Corporation Body corporate United States 100% Foreign United States Hamilton Oil Company LLC Body corporate United States 100% Foreign United States Woodside Energy Boliviana Inc. Body corporate United States 100% Foreign United States Woodside Energy (North America) LLC Body corporate United States 100% Foreign United States Woodside Energy (Americas) Inc. Body corporate United States 100% Foreign United States Woodside Energy (GOM) Inc. Body corporate United States 100% Foreign United States Woodside Energy Hawaii Inc. Body corporate United States 100% Foreign United States Woodside Energy Resources Inc. Body corporate United States 100% Foreign United States Woodside Energy Holdings (Resources) Inc. Body corporate United States 100% Foreign United States Woodside Energy USA Services Inc. Body corporate United States 100% Foreign United States Woodside Energy Marketing Inc. Body corporate United States 100% Foreign United States Woodside Energy (Deepwater) Inc.2 Body corporate United States 100% Foreign United States Woodside Energy (USA New Energy Holdings) LLC Body corporate United States 100% Foreign United States Woodside Energy (H2 Oklahoma) LLC Body corporate United States 100% Foreign United States Woodside Energy (Foreign Exploration Holdings) LLC Body corporate United States 100% Foreign United States Woodside Energy (Trinidad Block 3) Limited2 Body corporate United Kingdom 100% Foreign United Kingdom Woodside Energy (Trinidad Block 5) Limited2 Body corporate United Kingdom 100% Foreign United Kingdom Woodside Energy (Trinidad Block 6) Limited2 Body corporate United Kingdom 100% Foreign United Kingdom Woodside Energy (Trinidad Block 7) Limited Body corporate United Kingdom 100% Foreign United Kingdom Woodside Energy (Trinidad Block 14) Limited2 Body corporate United Kingdom 100% Foreign United Kingdom Woodside Energy (Trinidad Block 23A) Limited2 Body corporate United Kingdom 100% Foreign United Kingdom Woodside Energy (Trinidad Block 23B) Limited Body corporate United Kingdom 100% Foreign United Kingdom Woodside Energy (Trinidad Block 28) Limited Body corporate United Kingdom 100% Foreign United Kingdom Woodside Energy (Trinidad Block 29) Limited Body corporate United Kingdom 100% Foreign United Kingdom Woodside Energy (Bimshire) Limited2 Body corporate United Kingdom 100% Foreign United Kingdom Woodside Energy (Egypt) Limited2 Body corporate United Kingdom 100% Foreign United Kingdom 206 WOODSIDE ENERGY GROUP LTD
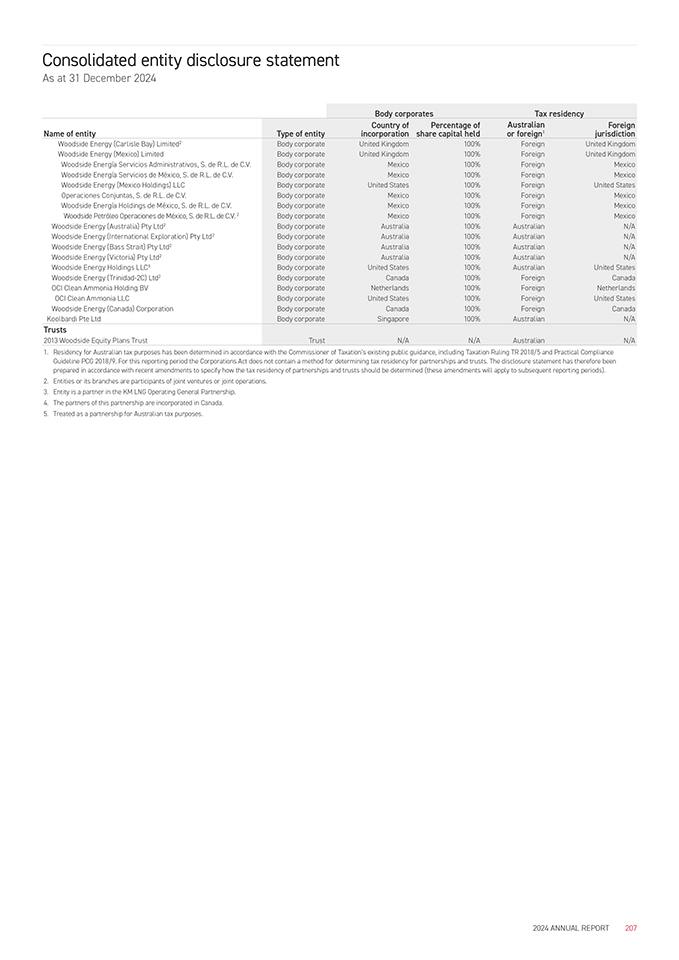
Consolidated entity disclosure statement As at 31 December 2024 Body corporates Tax residency Name of entity Type of entity Country of Percentage of Australian Foreign incorporation share capital held or foreign1 jurisdiction Woodside Energy (Carlisle Bay) Limited2 Body corporate United Kingdom 100% Foreign United Kingdom Woodside Energy (Mexico) Limited Body corporate United Kingdom 100% Foreign United Kingdom Woodside Energía Servicios Administrativos, S. de R.L. de C.V. Body corporate Mexico 100% Foreign Mexico Woodside Energía Servicios de México, S. de R.L. de C.V. Body corporate Mexico 100% Foreign Mexico Woodside Energy (Mexico Holdings) LLC Body corporate United States 100% Foreign United States Operaciones Conjuntas, S. de R.L. de C.V. Body corporate Mexico 100% Foreign Mexico Woodside Energía Holdings de México, S. de R.L. de C.V. Body corporate Mexico 100% Foreign Mexico Woodside Petróleo Operaciones de México, S. de R.L. de C.V. 2 Body corporate Mexico 100% Foreign Mexico Woodside Energy (Australia) Pty Ltd2 Body corporate Australia 100% Australian N/A Woodside Energy (International Exploration) Pty Ltd2 Body corporate Australia 100% Australian N/A Woodside Energy (Bass Strait) Pty Ltd2 Body corporate Australia 100% Australian N/A Woodside Energy (Victoria) Pty Ltd2 Body corporate Australia 100% Australian N/A Woodside Energy Holdings LLC5 Body corporate United States 100% Australian United States Woodside Energy (Trinidad-2C) Ltd2 Body corporate Canada 100% Foreign Canada OCI Clean Ammonia Holding BV Body corporate Netherlands 100% Foreign Netherlands OCI Clean Ammonia LLC Body corporate United States 100% Foreign United States Woodside Energy (Canada) Corporation Body corporate Canada 100% Foreign Canada Koolbardi Pte Ltd Body corporate Singapore 100% Australian N/A Trusts 2013 Woodside Equity Plans Trust Trust N/A N/A Australian N/A 1. Residency for Australian tax purposes has been determined in accordance with the Commissioner of Taxation’s existing public guidance, including Taxation Ruling TR 2018/5 and Practical Compliance Guideline PCG 2018/9. For this reporting period the Corporations Act does not contain a method for determining tax residency for partnerships and trusts. The disclosure statement has therefore been prepared in accordance with recent amendments to specify how the tax residency of partnerships and trusts should be determined (these amendments will apply to subsequent reporting periods). 2. Entities or its branches are participants of joint ventures or joint operations. 3. Entity is a partner in the KM LNG Operating General Partnership. 4. The partners of this partnership are incorporated in Canada. 5. Treated as a partnership for Australian tax purposes. 2024 ANNUAL REPORT 207
Directors’ declaration In accordance with a resolution of directors of Woodside Energy Group Ltd, we state that: 1. In the opinion of the directors: (a) the financial statements and notes thereto, and the disclosures included in the audited 2024 Remuneration Report, comply with Australian Accounting Standards and the Corporations Act 2001; (b) the financial statements and notes thereto give a true and fair view of the financial position of the Group as at 31 December 2024 and of the performance of the Group for the financial year ended 31 December 2024; (c) the financial statements and notes thereto also comply with International Financial Reporting Standards as disclosed in the ‘About these statements’ section within the notes to the 2024 Financial Statements; (d) the consolidated entity disclosure statement required by subsection 295(3A) of the Corporations Act 2001 disclosed on pages 205-207 is true and correct; (e) there are reasonable grounds to believe that Woodside Energy Group Ltd will be able to pay its debts as and when they become due and payable; and (f) there are reasonable grounds to believe that the members of the Closed Group identified in Note E.8 will be able to meet any obligations or liabilities which they are or may become subject to, by virtue of the Deed of Cross Guarantee. 2. This declaration has been made after receiving the declarations required to be made to the directors in accordance with section 295A of the Corporations Act 2001 for the year ended 31 December 2024. For and on behalf of the Board R J Goyder, AO M E O’Neill Chair of the Board Chief Executive Officer and Managing Director Melbourne, Victoria Sydney, New South Wales 25 February 2025 25 February 2025 208 WOODSIDE ENERGY GROUP LTD
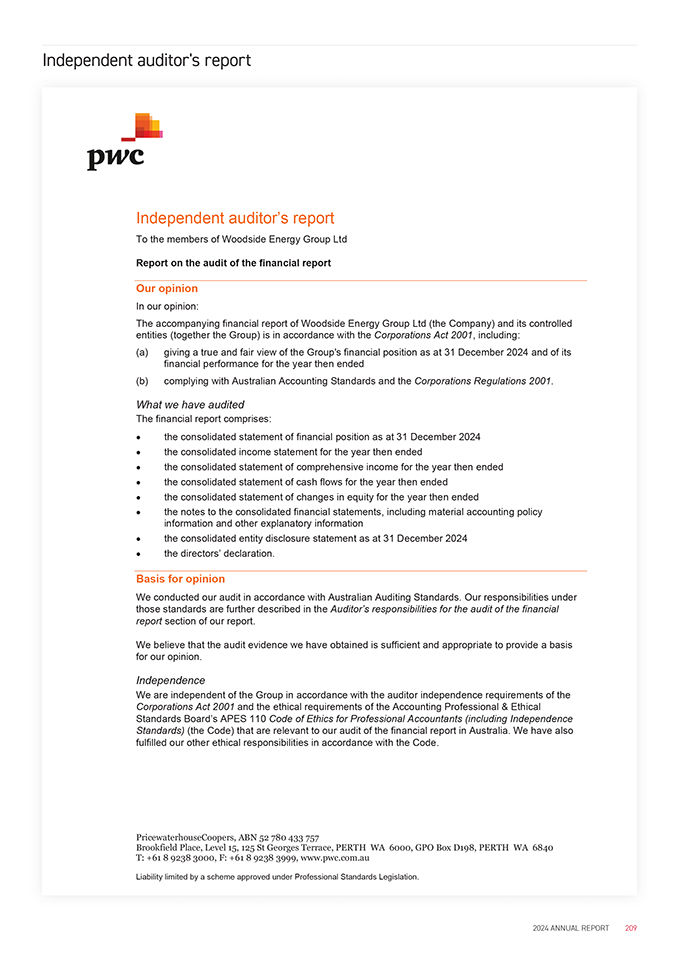
Independent auditor’s report Independent auditor’s report To the members of Woodside Energy Group Ltd Report on the audit of the financial report Our opinion In our opinion: The accompanying financial report of Woodside Energy Group Ltd (the Company) and its controlled entities (together the Group) is in accordance with the Corporations Act 2001, including: (a) giving a true and fair view of the Group’s financial position as at 31 December 2024 and of its financial performance for the year then ended (b) complying with Australian Accounting Standards and the Corporations Regulations 2001. What we have audited The financial report comprises: the consolidated statement of financial position as at 31 December 2024 the consolidated income statement for the year then ended the consolidated statement of comprehensive income for the year then ended the consolidated statement of cash flows for the year then ended the consolidated statement of changes in equity for the year then ended the notes to the consolidated financial statements, including material accounting policy information and other explanatory information the consolidated entity disclosure statement as at 31 December 2024 the directors’ declaration. Basis for opinion We conducted our audit in accordance with Australian Auditing Standards. Our responsibilities under those standards are further described in the Auditor’s responsibilities for the audit of the financial report section of our report. We believe that the audit evidence we have obtained is sufficient and appropriate to provide a basis for our opinion. Independence We are independent of the Group in accordance with the auditor independence requirements of the Corporations Act 2001 and the ethical requirements of the Accounting Professional & Ethical Standards Board’s APES 110 Code of Ethics for Professional Accountants (including Independence Standards) (the Code) that are relevant to our audit of the financial report in Australia. We have also fulfilled our other ethical responsibilities in accordance with the Code. PricewaterhouseCoopers, ABN 52 780 433 757 Brookfield Place, Level 15, 125 St Georges Terrace, PERTH WA 6000, GPO Box D198, PERTH WA 6840 T: +61 8 9238 3000, F: +61 8 9238 3999, www.pwc.com.au Liability limited by a scheme approved under Professional Standards Legislation. 2024 ANNUAL REPORT 209
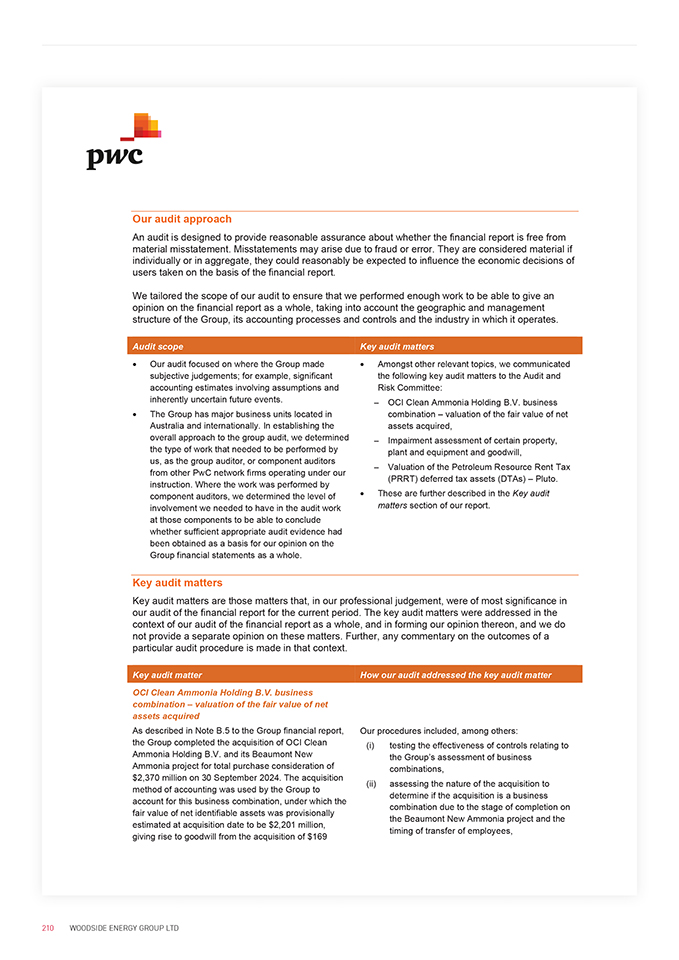
Our audit approach An audit is designed to provide reasonable assurance about whether the financial report is free from material misstatement. Misstatements may arise due to fraud or error. They are considered material if individually or in aggregate, they could reasonably be expected to influence the economic decisions of users taken on the basis of the financial report. We tailored the scope of our audit to ensure that we performed enough work to be able to give an opinion on the financial report as a whole, taking into account the geographic and management structure of the Group, its accounting processes and controls and the industry in which it operates. Audit scope Our audit focused on where the Group made subjective judgements; for example, significant accounting estimates involving assumptions and inherently uncertain future events. The Group has major business units located in Australia and internationally. In establishing the overall approach to the group audit, we determined the type of work that needed to be performed by us, as the group auditor, or component auditors from other PwC network firms operating under our instruction. Where the work was performed by component auditors, we determined the level of involvement we needed to have in the audit work at those components to be able to conclude whether sufficient appropriate audit evidence had been obtained as a basis for our opinion on the Group financial statements as a whole. Key audit matters Amongst other relevant topics, we communicated the following key audit matters to the Audit and Risk Committee: OCI Clean Ammonia Holding B.V. business combination – valuation of the fair value of net assets acquired, Impairment assessment of certain property, plant and equipment and goodwill, Valuation of the Petroleum Resource Rent Tax (PRRT) deferred tax assets (DTAs) – Pluto. These are further described in the Key audit matters section of our report. Key audit matters Key audit matters are those matters that, in our professional judgement, were of most significance in our audit of the financial report for the current period. The key audit matters were addressed in the context of our audit of the financial report as a whole, and in forming our opinion thereon, and we do not provide a separate opinion on these matters. Further, any commentary on the outcomes of a particular audit procedure is made in that context. Key audit matter OCI Clean Ammonia Holding B.V. business combination – valuation of the fair value of net assets acquired As described in Note B.5 to the Group financial report, the Group completed the acquisition of OCI Clean Ammonia Holding B.V. and its Beaumont New Ammonia project for total purchase consideration of $2,370 million on 30 September 2024. The acquisition method of accounting was used by the Group to account for this business combination, under which the fair value of net identifiable assets was provisionally estimated at acquisition date to be $2,201 million, giving rise to goodwill from the acquisition of $169 How our audit addressed the key audit matter Our procedures included, among others: (i) testing the effectiveness of controls relating to the Group’s assessment of business combinations, (ii) assessing the nature of the acquisition to determine if the acquisition is a business combination due to the stage of completion on the Beaumont New Ammonia project and the timing of transfer of employees, 210 WOODSIDE ENERGY GROUP LTD
Key audit matter million. Estimating the fair value of net assets acquired requires the selection of appropriate valuation methodologies which included the reproduction cost method to value the property, plant and equipment acquired, and the use of cash flow models underpinned by significant estimates and assumptions to value the acquired intangible assets. The principal considerations for our determination that performing procedures relating to the valuation of the fair value of net assets acquired as part of the OCI Clean Ammonia Holding B.V. business combination is a key audit matter are: (i) there is a significant level of judgment applied by the Group in determining the fair value of net assets acquired, including the use of the Group’s experts to assist in the estimation of fair value, (ii) this in turn led to a high degree of auditor judgement, effort and subjectivity in performing procedures and evaluating the Group’s valuation methodology, significant assumptions and estimates, and (iii) the nature and extent of audit effort required to perform the procedures and evaluate the Group’s valuation methodology, significant assumptions and estimates required the use of professionals with specialised skill and knowledge. Impairment assessment of certain property, plant and equipment and goodwill As described in Notes B.3 and B.4 to the Group financial report, the Group’s property, plant and equipment (PP&E) balance was $42,636 million, and the Group’s goodwill balance was $3,866 million as of 31 December 2024. As further described in Note B.4 to the Group financial report, cash-generating units (CGUs) with allocated goodwill are tested for impairment at least annually, while CGUs without allocated goodwill are tested for impairment when there is an indicator of impairment. Certain CGUs meeting those criteria were tested for impairment as at 31 December 2024, whereby the recoverable amount of the CGU is compared with its carrying value. The recoverable amounts of those CGUs were estimated using the fair value less costs of disposal approach, utilising cash flow models. The Group’s cash flow models included significant judgments and assumptions relating to oil and gas reserves and resources, estimates of future production and How our audit addressed the key audit matter (iii) evaluating the Group’s accounting for the fair value of net assets acquired in a business combination against the requirements of Australian Accounting Standards, and our understanding of the acquisition agreement and the acquired net assets of OCI Clean Ammonia Holding B.V., (iv) assessing the valuation methodology applied by the Group to estimate the fair value of net assets acquired at 30 September 2024, including assessing the appropriateness of significant estimates and assumptions, (v) evaluating the work of the Group’s experts involved in the determination of significant assumptions and estimates, (vi) evaluating the disclosures made regarding the business combination in the Group financial report against the requirements of Australian Accounting Standards, and (vii) professionals with specialised skill and knowledge were used to assist in evaluating the appropriateness of the Group’s fair value estimates. Our procedures included, among others: (i) testing the effectiveness of controls relating to the Group’s assessment of the significant estimates and assumptions included within the impairment models, (ii) assessing the appropriateness of significant estimates and assumptions applied by the Group, (iii) evaluating the work of the Group’s experts involved in the determination of significant estimates and assumptions, (iv) evaluating the disclosures made regarding the impairment assessment of PP&E and goodwill in the consolidated financial statements against the requirements of Australian Accounting Standards, and (v) professionals with specialised skill and knowledge were used to assist in evaluating the 2024 ANNUAL REPORT 211
Key audit matter commodity prices, forecast expenditures incorporating expected inflation and foreign exchange rates, discount rate assumptions, and estimates of carbon costs. The principal considerations for our determination that performing procedures relating to the impairment assessment of certain PP&E and goodwill is a key audit matter are: (i) there is a significant level of judgment applied by the Group, including the use of the Group’s experts, in the determination of the significant estimates and assumptions included in the impairment models, (ii) this in turn led to a high degree of auditor judgment, effort and subjectivity in performing procedures and evaluating the Group’s significant assumptions and estimates, and (iii) the nature and extent of audit effort required to perform the procedures and evaluate the Group’s significant assumptions and estimates required the use of professionals with specialised skill and knowledge. Valuation of the Petroleum Resource Rent Tax (PRRT) deferred tax assets (DTAs)—Pluto As described in Note A.5 to the Group financial report, the Company has recognised deferred tax assets of $2,393 million as of 31 December 2024, of which $1,448 million relates to PRRT, including the Pluto PRRT DTA which increased by $502 million during the year on the basis of future taxable profits being available to utilise the deductible expenditure. PRRT is considered, for accounting purposes, to be an income tax. PRRT DTAs are based on estimates of future taxable profits available to recover incurred general and exploration expenditure. The Group’s estimation of the PRRT DTAs involves significant judgments and assumptions including assessing the forecast future taxable profits (which are risk-adjusted where appropriate by a market premium risk rate to reflect uncertainty inherent in long-term forecasts) generated from the Australian assets, which have regard to the future commodity price assumptions, future augmentation and forecast assessable revenues, exploration and general expenditure. The principal considerations for our determination that performing procedures relating to valuation of the Pluto PRRT DTAs is a key audit matter are: (i) there is a significant level of judgment applied by the Group in determining the recoverability of How our audit addressed the key audit matter appropriateness of the Group’s recoverable amount estimates. Our procedures included, among others: (i) testing the effectiveness of controls relating to the Group’s assessment of the significant judgments and assumptions included within the PRRT modelling and recoverability assessment, (ii) assessing the appropriateness of significant judgments and assumptions applied by the Group to estimate the recoverable amount of DTAs, (iii) evaluating the work of the Group’s experts involved in the determination of significant judgments and estimates, (iv) evaluating the disclosures made regarding the PRRT DTAs recognised in the Group financial report against the requirements of Australian Accounting Standards, and (v) professionals with specialised skill and knowledge were used to assist in evaluating the appropriateness of the Group’s assessment of recoverability of the PRRT DTAs including certain significant assumptions. 212 WOODSIDE ENERGY GROUP LTD
Key audit matter How our audit addressed the key audit matter the PRRT DTAs, including having regard to the judgments and assumptions mentioned above, and considering the specialised knowledge and input of the Group’s experts informing significant estimates and assumptions, (ii) this in turn led to a high degree of auditor judgment, effort and subjectivity in performing procedures and evaluating the Group’s methodology, significant assumptions and estimates, and (iii) the nature and extent of audit effort required to perform the procedures and evaluate the Group’s methodology, significant assumptions and estimates required the use of professionals with specialised skill and knowledge. Other information The directors are responsible for the other information. The other information comprises the information included in the annual report for the year ended 31 December 2024, but does not include the financial report and our auditor’s report thereon. Our opinion on the financial report does not cover the other information and accordingly we do not express any form of assurance conclusion thereon through our opinion on the financial report. We have issued a separate opinion on the remuneration report. In connection with our audit of the financial report, our responsibility is to read the other information and, in doing so, consider whether the other information is materially inconsistent with the financial report or our knowledge obtained in the audit, or otherwise appears to be materially misstated. If, based on the work we have performed on the other information that we obtained prior to the date of this auditor’s report, we conclude that there is a material misstatement of this other information, we are required to report that fact. We have nothing to report in this regard. Responsibilities of the directors for the financial report The directors of the Company are responsible for the preparation of the financial report in accordance with Australian Accounting Standards and the Corporations Act 2001, including giving a true and fair view, and for such internal control as the directors determine is necessary to enable the preparation of the financial report that is free from material misstatement, whether due to fraud or error. In preparing the financial report, the directors are responsible for assessing the ability of the Group to continue as a going concern, disclosing, as applicable, matters related to going concern and using the going concern basis of accounting unless the directors either intend to liquidate the Group or to cease operations, or have no realistic alternative but to do so. 2024 ANNUAL REPORT 213
Auditor’s responsibilities for the audit of the financial report Our objectives are to obtain reasonable assurance about whether the financial report as a whole is free from material misstatement, whether due to fraud or error, and to issue an auditor’s report that includes our opinion. Reasonable assurance is a high level of assurance, but is not a guarantee that an audit conducted in accordance with the Australian Auditing Standards will always detect a material misstatement when it exists. Misstatements can arise from fraud or error and are considered material if, individually or in the aggregate, they could reasonably be expected to influence the economic decisions of users taken on the basis of the financial report. A further description of our responsibilities for the audit of the financial report is located at the Auditing and Assurance Standards Board website at: https://auasb.gov.au/media/bwvjcgre/ar1_2024.pdf. This description forms part of our auditor’s report. Report on the remuneration report Our opinion on the remuneration report We have audited the remuneration report included in the directors’ report for the year ended 31 December 2024. In our opinion, the remuneration report of Woodside Energy Group Ltd for the year ended 31 December 2024 complies with section 300A of the Corporations Act 2001. Responsibilities The directors of the Company are responsible for the preparation and presentation of the remuneration report in accordance with section 300A of the Corporations Act 2001 . Our responsibility is to express an opinion on the remuneration report, based on our audit conducted in accordance with Australian Auditing Standards. PricewaterhouseCoopers N M Henry A G B Hodge Partner Partner Perth, Western Australia Perth, Western Australia 25 February 2025 25 February 2025 214 WOODSIDE ENERGY GROUP LTD
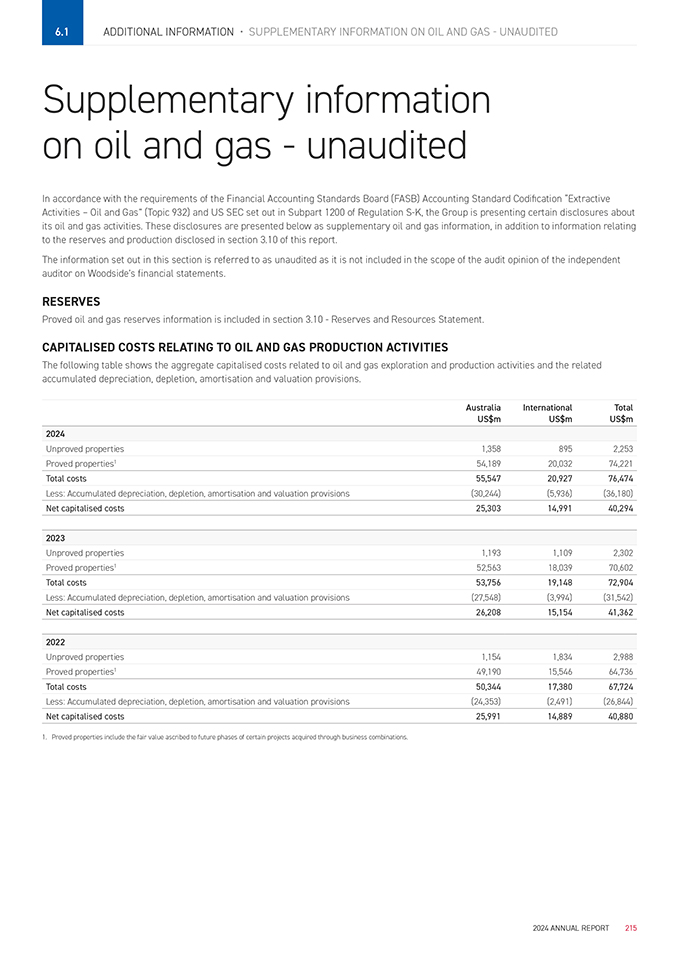
6.1 Additional Information • Supplementary information on oil and gas—unaudited Supplementary information on oil and gas—unaudited In accordance with the requirements of the Financial Accounting Standards Board (FASB) Accounting Standard Codification “Extractive Activities – Oil and Gas” (Topic 932) and US SEC set out in Subpart 1200 of Regulation S-K, the Group is presenting certain disclosures about its oil and gas activities. These disclosures are presented below as supplementary oil and gas information, in addition to information relating to the reserves and production disclosed in section 3.10 of this report. The information set out in this section is referred to as unaudited as it is not included in the scope of the audit opinion of the independent auditor on Woodside’s financial statements. RESERVES Proved oil and gas reserves information is included in section 3.10—Reserves and Resources Statement. CAPITALISED COSTS RELATING TO OIL AND GAS PRODUCTION ACTIVITIES The following table shows the aggregate capitalised costs related to oil and gas exploration and production activities and the related accumulated depreciation, depletion, amortisation and valuation provisions. Australia International Total US$m US$m US$m 2024 Unproved properties 1,358 895 2,253 Proved properties1 54,189 20,032 74,221 Total costs 55,547 20,927 76,474 Less: Accumulated depreciation, depletion, amortisation and valuation provisions (30,244) (5,936) (36,180) Net capitalised costs 25,303 14,991 40,294 2023 Unproved properties 1,193 1,109 2,302 Proved properties1 52,563 18,039 70,602 Total costs 53,756 19,148 72,904 Less: Accumulated depreciation, depletion, amortisation and valuation provisions (27,548) (3,994) (31,542) Net capitalised costs 26,208 15,154 41,362 2022 Unproved properties 1,154 1,834 2,988 Proved properties1 49,190 15,546 64,736 Total costs 50,344 17,380 67,724 Less: Accumulated depreciation, depletion, amortisation and valuation provisions (24,353) (2,491) (26,844) Net capitalised costs 25,991 14,889 40,880 1. Proved properties include the fair value ascribed to future phases of certain projects acquired through business combinations. 2024 ANNUAL REPORT 215
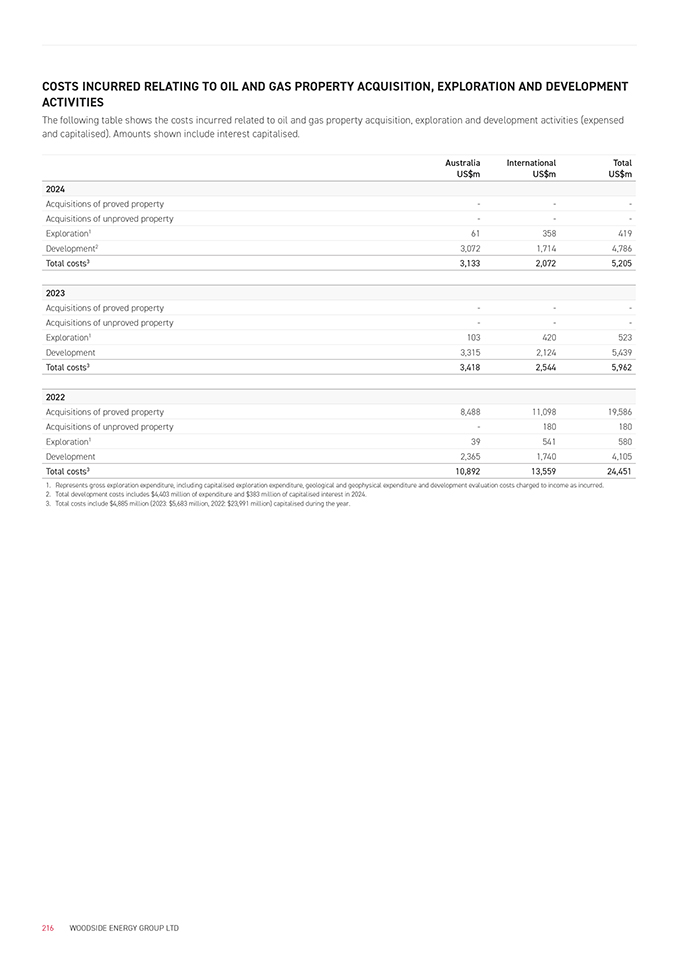
COSTS INCURRED RELATING TO OIL AND GAS PROPERTY ACQUISITION, EXPLORATION AND DEVELOPMENT ACTIVITIES The following table shows the costs incurred related to oil and gas property acquisition, exploration and development activities (expensed and capitalised). Amounts shown include interest capitalised. Australia International Total US$m US$m US$m 2024 Acquisitions of proved property —— Acquisitions of unproved property —— Exploration1 61 358 419 Development2 3,072 1,714 4,786 Total costs3 3,133 2,072 5,205 2023 Acquisitions of proved property —— Acquisitions of unproved property —— Exploration1 103 420 523 Development 3,315 2,124 5,439 Total costs3 3,418 2,544 5,962 2022 Acquisitions of proved property 8,488 11,098 19,586 Acquisitions of unproved property—180 180 Exploration1 39 541 580 Development 2,365 1,740 4,105 Total costs3 10,892 13,559 24,451 1. Represents gross exploration expenditure, including capitalised exploration expenditure, geological and geophysical expenditure and development evaluation costs charged to income as incurred. 2. Total development costs includes $4,403 million of expenditure and $383 million of capitalised interest in 2024. 3. Total costs include $4,885 million (2023: $5,683 million, 2022: $23,991 million) capitalised during the year. 216 WOODSIDE ENERGY GROUP LTD
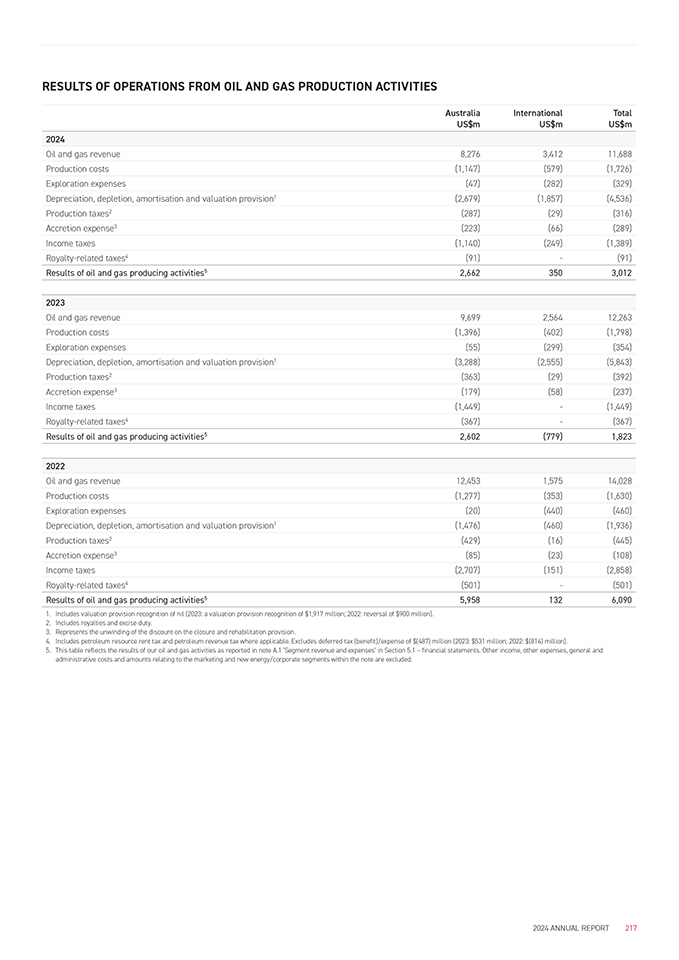
RESULTS OF OPERATIONS FROM OIL AND GAS PRODUCTION ACTIVITIES Australia International Total US$m US$m US$m 2024 Oil and gas revenue 8,276 3,412 11,688 Production costs (1,147) (579) (1,726) Exploration expenses (47) (282) (329) Depreciation, depletion, amortisation and valuation provision1 (2,679) (1,857) (4,536) Production taxes2 (287) (29) (316) Accretion expense3 (223) (66) (289) Income taxes (1,140) (249) (1,389) Royalty-related taxes4 (91)—(91) Results of oil and gas producing activities5 2,662 350 3,012 2023 Oil and gas revenue 9,699 2,564 12,263 Production costs (1,396) (402) (1,798) Exploration expenses (55) (299) (354) Depreciation, depletion, amortisation and valuation provision1 (3,288) (2,555) (5,843) Production taxes2 (363) (29) (392) Accretion expense3 (179) (58) (237) Income taxes (1,449)—(1,449) Royalty-related taxes4 (367)—(367) Results of oil and gas producing activities5 2,602 (779) 1,823 2022 Oil and gas revenue 12,453 1,575 14,028 Production costs (1,277) (353) (1,630) Exploration expenses (20) (440) (460) Depreciation, depletion, amortisation and valuation provision1 (1,476) (460) (1,936) Production taxes2 (429) (16) (445) Accretion expense3 (85) (23) (108) Income taxes (2,707) (151) (2,858) Royalty-related taxes4 (501)—(501) Results of oil and gas producing activities5 5,958 132 6,090 1. Includes valuation provision recognition of nil (2023: a valuation provision recognition of $1,917 million; 2022: reversal of $900 million). 2. Includes royalties and excise duty. 3. Represents the unwinding of the discount on the closure and rehabilitation provision. 4. Includes petroleum resource rent tax and petroleum revenue tax where applicable. Excludes deferred tax (benefit)/expense of $(487) million (2023: $531 million; 2022: $(814) million). 5. This table reflects the results of our oil and gas activities as reported in note A.1 ‘Segment revenue and expenses’ in Section 5.1 – financial statements. Other income, other expenses, general and administrative costs and amounts relating to the marketing and new energy/corporate segments within the note are excluded. 2024 ANNUAL REPORT 217
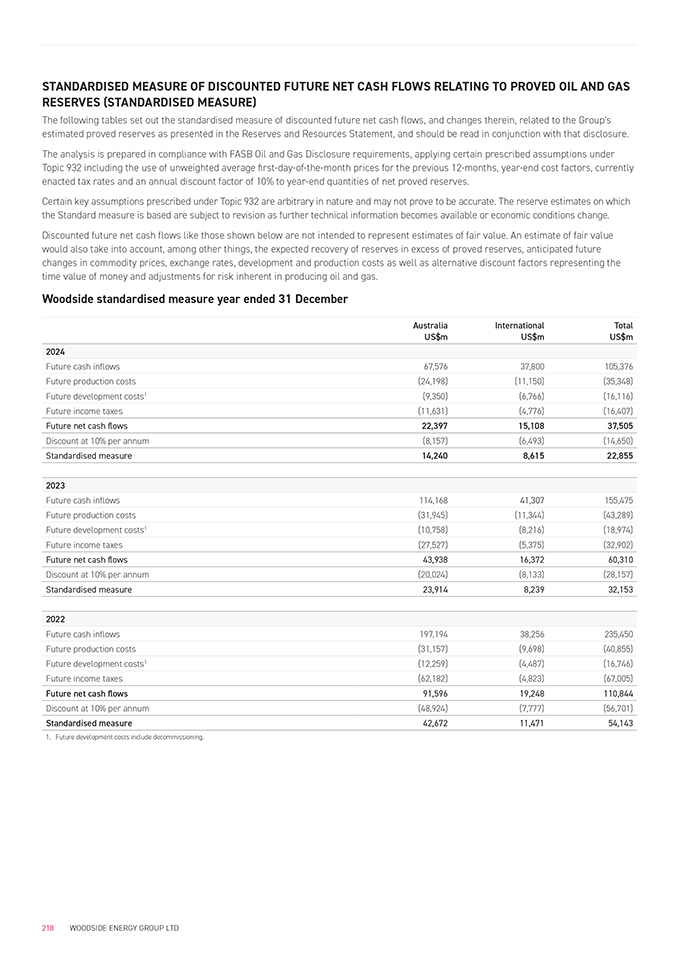
STANDARDISED MEASURE OF DISCOUNTED FUTURE NET CASH FLOWS RELATING TO PROVED OIL AND GAS RESERVES (STANDARDISED MEASURE) The following tables set out the standardised measure of discounted future net cash flows, and changes therein, related to the Group’s estimated proved reserves as presented in the Reserves and Resources Statement, and should be read in conjunction with that disclosure. The analysis is prepared in compliance with FASB Oil and Gas Disclosure requirements, applying certain prescribed assumptions under Topic 932 including the use of unweighted average first-day-of-the-month prices for the previous 12-months, year-end cost factors, currently enacted tax rates and an annual discount factor of 10% to year-end quantities of net proved reserves. Certain key assumptions prescribed under Topic 932 are arbitrary in nature and may not prove to be accurate. The reserve estimates on which the Standard measure is based are subject to revision as further technical information becomes available or economic conditions change. Discounted future net cash flows like those shown below are not intended to represent estimates of fair value. An estimate of fair value would also take into account, among other things, the expected recovery of reserves in excess of proved reserves, anticipated future changes in commodity prices, exchange rates, development and production costs as well as alternative discount factors representing the time value of money and adjustments for risk inherent in producing oil and gas. Woodside standardised measure year ended 31 December Australia International Total US$m US$m US$m 2024 Future cash inflows 67,576 37,800 105,376 Future production costs (24,198) (11,150) (35,348) Future development costs1 (9,350) (6,766) (16,116) Future income taxes (11,631) (4,776) (16,407) Future net cash flows 22,397 15,108 37,505 Discount at 10% per annum (8,157) (6,493) (14,650) Standardised measure 14,240 8,615 22,855 2023 Future cash inflows 114,168 41,307 155,475 Future production costs (31,945) (11,344) (43,289) Future development costs1 (10,758) (8,216) (18,974) Future income taxes (27,527) (5,375) (32,902) Future net cash flows 43,938 16,372 60,310 Discount at 10% per annum (20,024) (8,133) (28,157) Standardised measure 23,914 8,239 32,153 2022 Future cash inflows 197,194 38,256 235,450 Future production costs (31,157) (9,698) (40,855) Future development costs1 (12,259) (4,487) (16,746) Future income taxes (62,182) (4,823) (67,005) Future net cash flows 91,596 19,248 110,844 Discount at 10% per annum (48,924) (7,777) (56,701) Standardised measure 42,672 11,471 54,143 1. Future development costs include decommissioning. 218 WOODSIDE ENERGY GROUP LTD
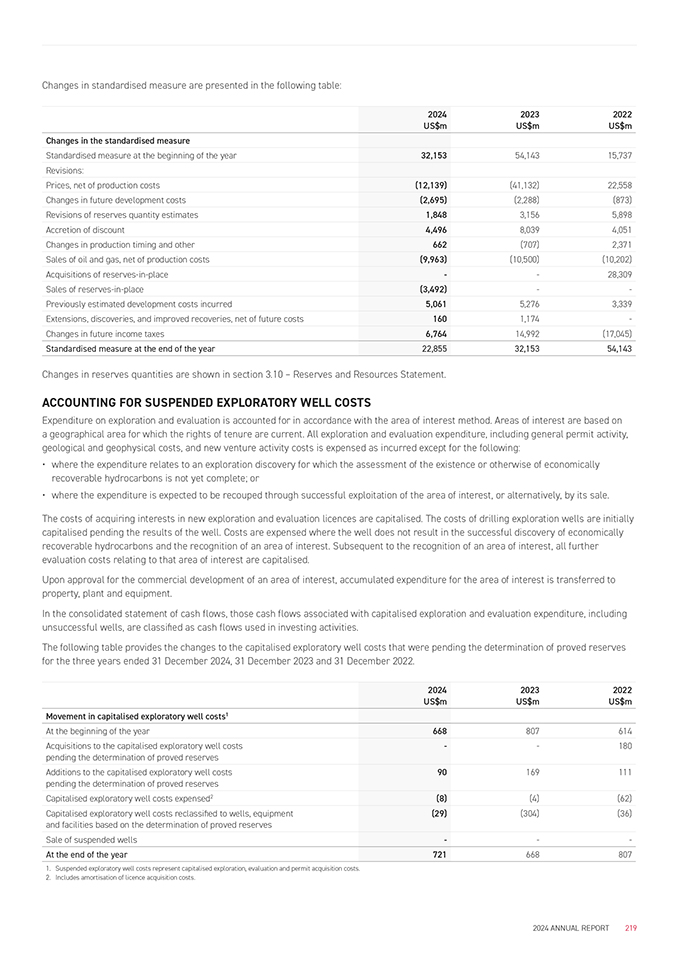
Changes in standardised measure are presented in the following table: 2024 2023 2022 US$m US$m US$m Changes in the standardised measure Standardised measure at the beginning of the year 32,153 54,143 15,737 Revisions: Prices, net of production costs (12,139) (41,132) 22,558 Changes in future development costs (2,695) (2,288) (873) Revisions of reserves quantity estimates 1,848 3,156 5,898 Accretion of discount 4,496 8,039 4,051 Changes in production timing and other 662 (707) 2,371 Sales of oil and gas, net of production costs (9,963) (10,500) (10,202) Acquisitions of reserves-in-place — 28,309 Sales of reserves-in-place (3,492) — Previously estimated development costs incurred 5,061 5,276 3,339 Extensions, discoveries, and improved recoveries, net of future costs 160 1,174—Changes in future income taxes 6,764 14,992 (17,045) Standardised measure at the end of the year 22,855 32,153 54,143 Changes in reserves quantities are shown in section 3.10 – Reserves and Resources Statement. ACCOUNTING FOR SUSPENDED EXPLORATORY WELL COSTS Expenditure on exploration and evaluation is accounted for in accordance with the area of interest method. Areas of interest are based on a geographical area for which the rights of tenure are current. All exploration and evaluation expenditure, including general permit activity, geological and geophysical costs, and new venture activity costs is expensed as incurred except for the following: • where the expenditure relates to an exploration discovery for which the assessment of the existence or otherwise of economically recoverable hydrocarbons is not yet complete; or • where the expenditure is expected to be recouped through successful exploitation of the area of interest, or alternatively, by its sale. The costs of acquiring interests in new exploration and evaluation licences are capitalised. The costs of drilling exploration wells are initially capitalised pending the results of the well. Costs are expensed where the well does not result in the successful discovery of economically recoverable hydrocarbons and the recognition of an area of interest. Subsequent to the recognition of an area of interest, all further evaluation costs relating to that area of interest are capitalised. Upon approval for the commercial development of an area of interest, accumulated expenditure for the area of interest is transferred to property, plant and equipment. In the consolidated statement of cash flows, those cash flows associated with capitalised exploration and evaluation expenditure, including unsuccessful wells, are classified as cash flows used in investing activities. The following table provides the changes to the capitalised exploratory well costs that were pending the determination of proved reserves for the three years ended 31 December 2024, 31 December 2023 and 31 December 2022. 2024 2023 2022 US$m US$m US$m Movement in capitalised exploratory well costs1 At the beginning of the year 668 807 614 Acquisitions to the capitalised exploratory well costs — 180 pending the determination of proved reserves Additions to the capitalised exploratory well costs 90 169 111 pending the determination of proved reserves Capitalised exploratory well costs expensed2 (8) (4) (62) Capitalised exploratory well costs reclassified to wells, equipment (29) (304) (36) and facilities based on the determination of proved reserves Sale of suspended wells ——At the end of the year 721 668 807 1. Suspended exploratory well costs represent capitalised exploration, evaluation and permit acquisition costs. 2. Includes amortisation of licence acquisition costs. 2024 ANNUAL REPORT 219
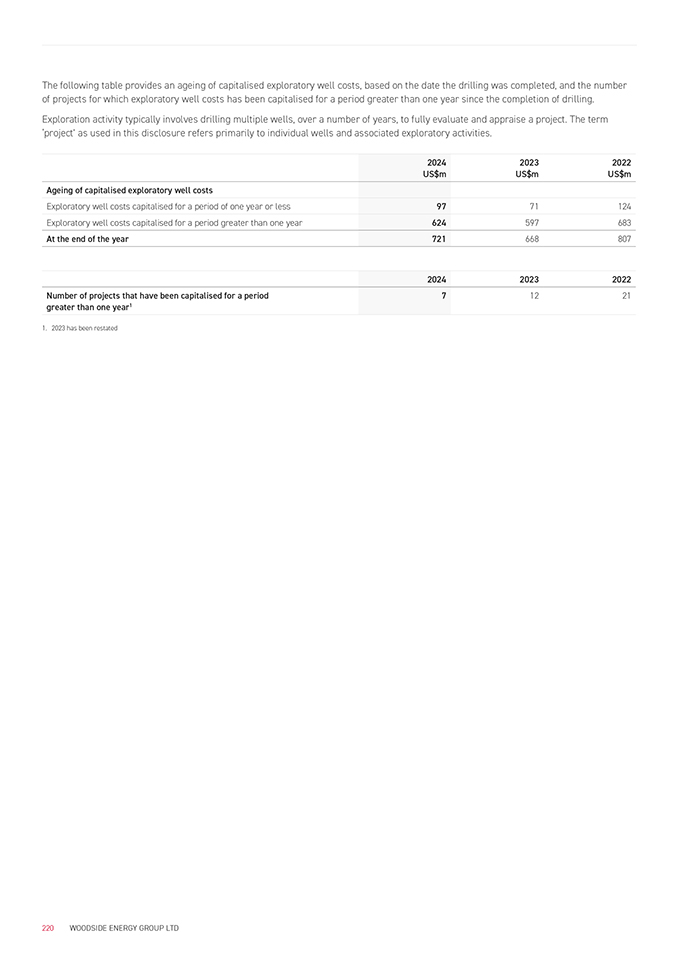
The following table provides an ageing of capitalised exploratory well costs, based on the date the drilling was completed, and the number of projects for which exploratory well costs has been capitalised for a period greater than one year since the completion of drilling. Exploration activity typically involves drilling multiple wells, over a number of years, to fully evaluate and appraise a project. The term ‘project’ as used in this disclosure refers primarily to individual wells and associated exploratory activities. 2024 2023 2022 US$m US$m US$m Ageing of capitalised exploratory well costs Exploratory well costs capitalised for a period of one year or less 97 71 124 Exploratory well costs capitalised for a period greater than one year 624 597 683 At the end of the year 721 668 807 2024 2023 2022 Number of projects that have been capitalised for a period 7 12 21 greater than one year1 1. 2023 has been restated 220 WOODSIDE ENERGY GROUP LTD
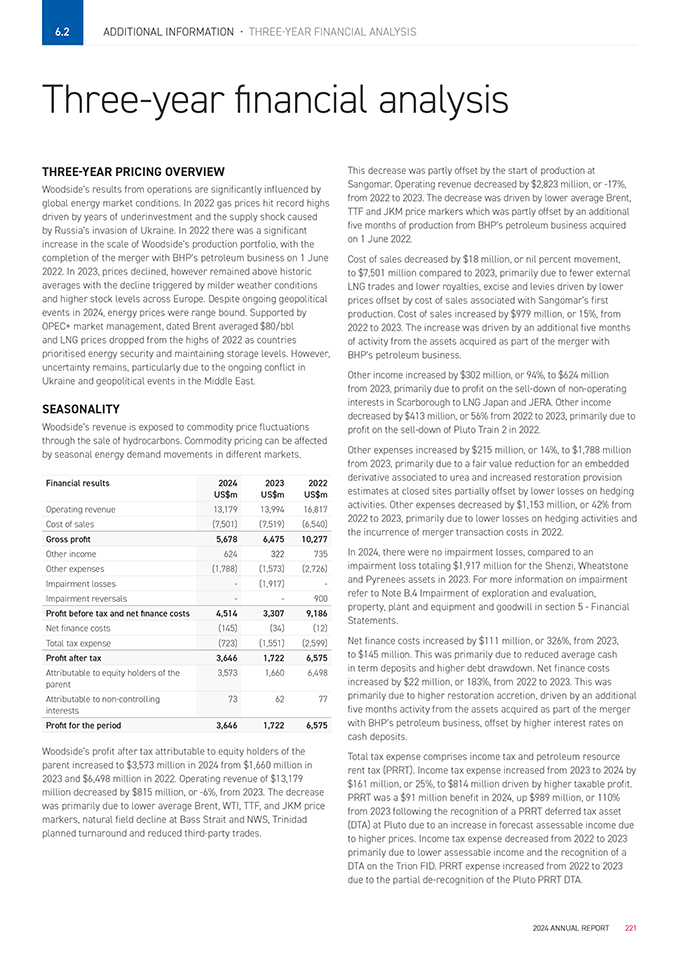
6.2 Additional Information • Three-year financial analysis Three-year fnancial analysis THREE-YEAR PRICING OVERVIEW Woodside’s results from operations are significantly influenced by global energy market conditions. In 2022 gas prices hit record highs driven by years of underinvestment and the supply shock caused by Russia’s invasion of Ukraine. In 2022 there was a significant increase in the scale of Woodside’s production portfolio, with the completion of the merger with BHP’s petroleum business on 1 June 2022. In 2023, prices declined, however remained above historic averages with the decline triggered by milder weather conditions and higher stock levels across Europe. Despite ongoing geopolitical events in 2024, energy prices were range bound. Supported by OPEC+ market management, dated Brent averaged $80/bbl and LNG prices dropped from the highs of 2022 as countries prioritised energy security and maintaining storage levels. However, uncertainty remains, particularly due to the ongoing conflict in Ukraine and geopolitical events in the Middle East. SEASONALITY Woodside’s revenue is exposed to commodity price fluctuations through the sale of hydrocarbons. Commodity pricing can be affected by seasonal energy demand movements in different markets. Financial results 2024 2023 2022 US$m US$m US$m Operating revenue 13,179 13,994 16,817 Cost of sales (7,501) (7,519) (6,540) Gross profit 5,678 6,475 10,277 Other income 624 322 735 Other expenses (1,788) (1,573) (2,726) Impairment losses—(1,917)— Impairment reversals — 900 Profit before tax and net finance costs 4,514 3,307 9,186 Net finance costs (145) (34) (12) Total tax expense (723) (1,551) (2,599) Profit after tax 3,646 1,722 6,575 Attributable to equity holders of the 3,573 1,660 6,498 parent Attributable to non-controlling 73 62 77 interests Profit for the period 3,646 1,722 6,575 Woodside’s profit after tax attributable to equity holders of the parent increased to $3,573 million in 2024 from $1,660 million in 2023 and $6,498 million in 2022. Operating revenue of $13,179 million decreased by $815 million, or -6%, from 2023. The decrease was primarily due to lower average Brent, WTI, TTF, and JKM price markers, natural field decline at Bass Strait and NWS, Trinidad planned turnaround and reduced third-party trades. This decrease was partly offset by the start of production at Sangomar. Operating revenue decreased by $2,823 million, or -17%, from 2022 to 2023. The decrease was driven by lower average Brent, TTF and JKM price markers which was partly offset by an additional five months of production from BHP’s petroleum business acquired on 1 June 2022. Cost of sales decreased by $18 million, or nil percent movement, to $7,501 million compared to 2023, primarily due to fewer external LNG trades and lower royalties, excise and levies driven by lower prices offset by cost of sales associated with Sangomar’s first production. Cost of sales increased by $979 million, or 15%, from 2022 to 2023. The increase was driven by an additional five months of activity from the assets acquired as part of the merger with BHP’s petroleum business. Other income increased by $302 million, or 94%, to $624 million from 2023, primarily due to profit on the sell-down of non-operating interests in Scarborough to LNG Japan and JERA. Other income decreased by $413 million, or 56% from 2022 to 2023, primarily due to profit on the sell-down of Pluto Train 2 in 2022. Other expenses increased by $215 million, or 14%, to $1,788 million from 2023, primarily due to a fair value reduction for an embedded derivative associated to urea and increased restoration provision estimates at closed sites partially offset by lower losses on hedging activities. Other expenses decreased by $1,153 million, or 42% from 2022 to 2023, primarily due to lower losses on hedging activities and the incurrence of merger transaction costs in 2022. In 2024, there were no impairment losses, compared to an impairment loss totaling $1,917 million for the Shenzi, Wheatstone and Pyrenees assets in 2023. For more information on impairment refer to Note B.4 Impairment of exploration and evaluation, property, plant and equipment and goodwill in section 5—Financial Statements. Net finance costs increased by $111 million, or 326%, from 2023, to $145 million. This was primarily due to reduced average cash in term deposits and higher debt drawdown. Net finance costs increased by $22 million, or 183%, from 2022 to 2023. This was primarily due to higher restoration accretion, driven by an additional five months activity from the assets acquired as part of the merger with BHP’s petroleum business, offset by higher interest rates on cash deposits. Total tax expense comprises income tax and petroleum resource rent tax (PRRT). Income tax expense increased from 2023 to 2024 by $161 million, or 25%, to $814 million driven by higher taxable profit. PRRT was a $91 million benefit in 2024, up $989 million, or 110% from 2023 following the recognition of a PRRT deferred tax asset (DTA) at Pluto due to an increase in forecast assessable income due to higher prices. Income tax expense decreased from 2022 to 2023 primarily due to lower assessable income and the recognition of a DTA on the Trion FID. PRRT expense increased from 2022 to 2023 due to the partial de-recognition of the Pluto PRRT DTA. 2024 ANNUAL REPORT 221
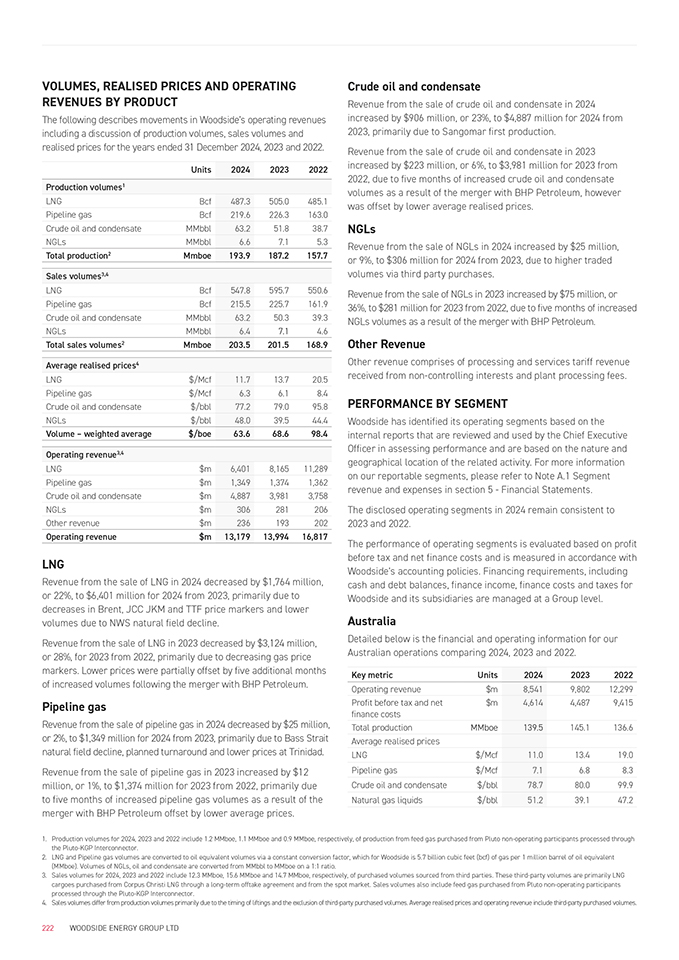
VOLUMES, REALISED PRICES AND OPERATING REVENUES BY PRODUCT The following describes movements in Woodside’s operating revenues including a discussion of production volumes, sales volumes and realised prices for the years ended 31 December 2024, 2023 and 2022. Units 2024 2023 2022 Production volumes1 LNG Bcf 487.3 505.0 485.1 Pipeline gas Bcf 219.6 226.3 163.0 Crude oil and condensate MMbbl 63.2 51.8 38.7 NGLs MMbbl 6.6 7.1 5.3 Total production2 Mmboe 193.9 187.2 157.7 Sales volumes3,4 LNG Bcf 547.8 595.7 550.6 Pipeline gas Bcf 215.5 225.7 161.9 Crude oil and condensate MMbbl 63.2 50.3 39.3 NGLs MMbbl 6.4 7.1 4.6 Total sales volumes2 Mmboe 203.5 201.5 168.9 Average realised prices4 LNG $/Mcf 11.7 13.7 20.5 Pipeline gas $/Mcf 6.3 6.1 8.4 Crude oil and condensate $/bbl 77.2 79.0 95.8 NGLs $/bbl 48.0 39.5 44.4 Volume – weighted average $/boe 63.6 68.6 98.4 Operating revenue3,4 LNG $m 6,401 8,165 11,289 Pipeline gas $m 1,349 1,374 1,362 Crude oil and condensate $m 4,887 3,981 3,758 NGLs $m 306 281 206 Other revenue $m 236 193 202 Operating revenue $m 13,179 13,994 16,817 LNG Revenue from the sale of LNG in 2024 decreased by $1,764 million, or 22%, to $6,401 million for 2024 from 2023, primarily due to decreases in Brent, JCC JKM and TTF price markers and lower volumes due to NWS natural field decline. Revenue from the sale of LNG in 2023 decreased by $3,124 million, or 28%, for 2023 from 2022, primarily due to decreasing gas price markers. Lower prices were partially offset by five additional months of increased volumes following the merger with BHP Petroleum. Pipeline gas Revenue from the sale of pipeline gas in 2024 decreased by $25 million, or 2%, to $1,349 million for 2024 from 2023, primarily due to Bass Strait natural field decline, planned turnaround and lower prices at Trinidad. Revenue from the sale of pipeline gas in 2023 increased by $12 million, or 1%, to $1,374 million for 2023 from 2022, primarily due to five months of increased pipeline gas volumes as a result of the merger with BHP Petroleum offset by lower average prices. Crude oil and condensate Revenue from the sale of crude oil and condensate in 2024 increased by $906 million, or 23%, to $4,887 million for 2024 from 2023, primarily due to Sangomar first production. Revenue from the sale of crude oil and condensate in 2023 increased by $223 million, or 6%, to $3,981 million for 2023 from 2022, due to five months of increased crude oil and condensate volumes as a result of the merger with BHP Petroleum, however was offset by lower average realised prices. NGLs Revenue from the sale of NGLs in 2024 increased by $25 million, or 9%, to $306 million for 2024 from 2023, due to higher traded volumes via third party purchases. Revenue from the sale of NGLs in 2023 increased by $75 million, or 36%, to $281 million for 2023 from 2022, due to five months of increased NGLs volumes as a result of the merger with BHP Petroleum. Other Revenue Other revenue comprises of processing and services tariff revenue received from non-controlling interests and plant processing fees. PERFORMANCE BY SEGMENT Woodside has identified its operating segments based on the internal reports that are reviewed and used by the Chief Executive Officer in assessing performance and are based on the nature and geographical location of the related activity. For more information on our reportable segments, please refer to Note A.1 Segment revenue and expenses in section 5—Financial Statements. The disclosed operating segments in 2024 remain consistent to 2023 and 2022. The performance of operating segments is evaluated based on profit before tax and net finance costs and is measured in accordance with Woodside’s accounting policies. Financing requirements, including cash and debt balances, finance income, finance costs and taxes for Woodside and its subsidiaries are managed at a Group level. Australia Detailed below is the financial and operating information for our Australian operations comparing 2024, 2023 and 2022. Key metric Units 2024 2023 2022 Operating revenue $m 8,541 9,802 12,299 Profit before tax and net $m 4,614 4,487 9,415 finance costs Total production MMboe 139.5 145.1 136.6 Average realised prices LNG $/Mcf 11.0 13.4 19.0 Pipeline gas $/Mcf 7.1 6.8 8.3 Crude oil and condensate $/bbl 78.7 80.0 99.9 Natural gas liquids $/bbl 51.2 39.1 47.2 1. Production volumes for 2024, 2023 and 2022 include 1.2 MMboe, 1.1 MMboe and 0.9 MMboe, respectively, of production from feed gas purchased from Pluto non-operating participants processed through the Pluto-KGP Interconnector. 2. LNG and Pipeline gas volumes are converted to oil equivalent volumes via a constant conversion factor, which for Woodside is 5.7 billion cubic feet (bcf) of gas per 1 million barrel of oil equivalent (MMboe). Volumes of NGLs, oil and condensate are converted from MMbbl to MMboe on a 1:1 ratio. 3. Sales volumes for 2024, 2023 and 2022 include 12.3 MMboe, 15.6 MMboe and 14.7 MMboe, respectively, of purchased volumes sourced from third parties. These third-party volumes are primarily LNG cargoes purchased from Corpus Christi LNG through a long-term offtake agreement and from the spot market. Sales volumes also include feed gas purchased from Pluto non-operating participants processed through the Pluto-KGP Interconnector. 4. Sales volumes differ from production volumes primarily due to the timing of liftings and the exclusion of third-party purchased volumes. Average realised prices and operating revenue include third-party purchased volumes. 222 WOODSIDE ENERGY GROUP LTD
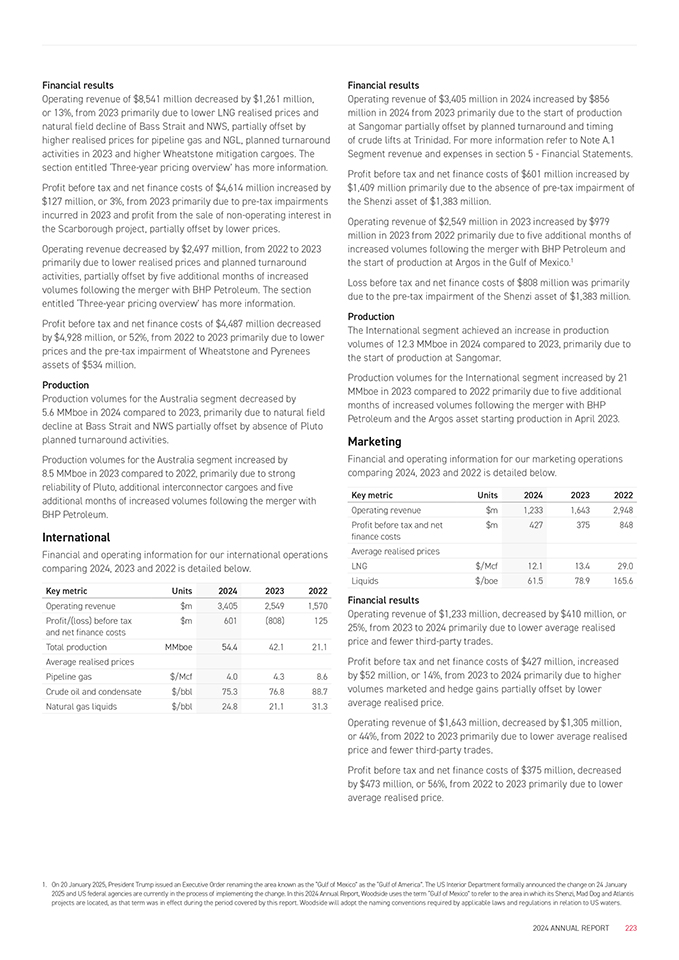
Financial results Operating revenue of $8,541 million decreased by $1,261 million, or 13%, from 2023 primarily due to lower LNG realised prices and natural field decline of Bass Strait and NWS, partially offset by higher realised prices for pipeline gas and NGL, planned turnaround activities in 2023 and higher Wheatstone mitigation cargoes. The section entitled ‘Three-year pricing overview’ has more information. Profit before tax and net finance costs of $4,614 million increased by $127 million, or 3%, from 2023 primarily due to pre-tax impairments incurred in 2023 and profit from the sale of non-operating interest in the Scarborough project, partially offset by lower prices. Operating revenue decreased by $2,497 million, from 2022 to 2023 primarily due to lower realised prices and planned turnaround activities, partially offset by five additional months of increased volumes following the merger with BHP Petroleum. The section entitled ‘Three-year pricing overview’ has more information. Profit before tax and net finance costs of $4,487 million decreased by $4,928 million, or 52%, from 2022 to 2023 primarily due to lower prices and the pre-tax impairment of Wheatstone and Pyrenees assets of $534 million. Production Production volumes for the Australia segment decreased by 5.6 MMboe in 2024 compared to 2023, primarily due to natural field decline at Bass Strait and NWS partially offset by absence of Pluto planned turnaround activities. Production volumes for the Australia segment increased by 8.5 MMboe in 2023 compared to 2022, primarily due to strong reliability of Pluto, additional interconnector cargoes and five additional months of increased volumes following the merger with BHP Petroleum. International Financial and operating information for our international operations comparing 2024, 2023 and 2022 is detailed below. Key metric Units 2024 2023 2022 Operating revenue $m 3,405 2,549 1,570 Profit/(loss) before tax $m 601 (808) 125 and net finance costs Total production MMboe 54.4 42.1 21.1 Average realised prices Pipeline gas $/Mcf 4.0 4.3 8.6 Crude oil and condensate $/bbl 75.3 76.8 88.7 Natural gas liquids $/bbl 24.8 21.1 31.3 Financial results Operating revenue of $3,405 million in 2024 increased by $856 million in 2024 from 2023 primarily due to the start of production at Sangomar partially offset by planned turnaround and timing of crude lifts at Trinidad. For more information refer to Note A.1 Segment revenue and expenses in section 5—Financial Statements. Profit before tax and net finance costs of $601 million increased by $1,409 million primarily due to the absence of pre-tax impairment of the Shenzi asset of $1,383 million. Operating revenue of $2,549 million in 2023 increased by $979 million in 2023 from 2022 primarily due to five additional months of increased volumes following the merger with BHP Petroleum and the start of production at Argos in the Gulf of Mexico.1 Loss before tax and net finance costs of $808 million was primarily due to the pre-tax impairment of the Shenzi asset of $1,383 million. Production The International segment achieved an increase in production volumes of 12.3 MMboe in 2024 compared to 2023, primarily due to the start of production at Sangomar. Production volumes for the International segment increased by 21 MMboe in 2023 compared to 2022 primarily due to five additional months of increased volumes following the merger with BHP Petroleum and the Argos asset starting production in April 2023. Marketing Financial and operating information for our marketing operations comparing 2024, 2023 and 2022 is detailed below. Key metric Units 2024 2023 2022 Operating revenue $m 1,233 1,643 2,948 Profit before tax and net $m 427 375 848 finance costs Average realised prices LNG $/Mcf 12.1 13.4 29.0 Liquids $/boe 61.5 78.9 165.6 Financial results Operating revenue of $1,233 million, decreased by $410 million, or 25%, from 2023 to 2024 primarily due to lower average realised price and fewer third-party trades. Profit before tax and net finance costs of $427 million, increased by $52 million, or 14%, from 2023 to 2024 primarily due to higher volumes marketed and hedge gains partially offset by lower average realised price. Operating revenue of $1,643 million, decreased by $1,305 million, or 44%, from 2022 to 2023 primarily due to lower average realised price and fewer third-party trades. Profit before tax and net finance costs of $375 million, decreased by $473 million, or 56%, from 2022 to 2023 primarily due to lower average realised price. 1. On 20 January 2025, President Trump issued an Executive Order renaming the area known as the “Gulf of Mexico” as the “Gulf of America”. The US Interior Department formally announced the change on 24 January 2025 and US federal agencies are currently in the process of implementing the change. In this 2024 Annual Report, Woodside uses the term “Gulf of Mexico” to refer to the area in which its Shenzi, Mad Dog and Atlantis projects are located, as that term was in effect during the period covered by this report. Woodside will adopt the naming conventions required by applicable laws and regulations in relation to US waters. 2024 ANNUAL REPORT 223
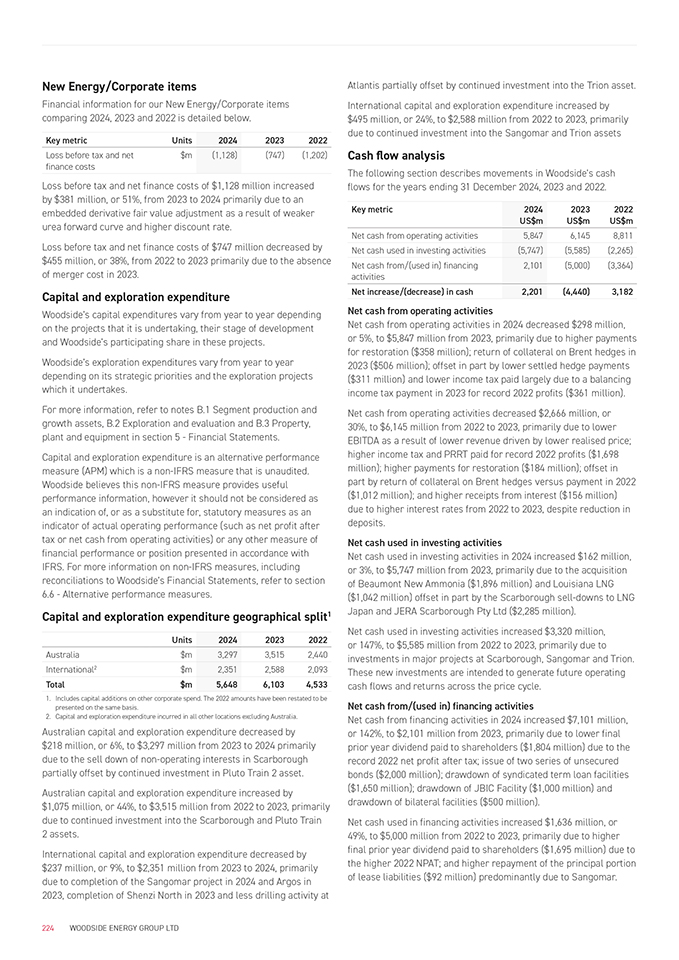
New Energy/Corporate items Financial information for our New Energy/Corporate items comparing 2024, 2023 and 2022 is detailed below. Key metric Units 2024 2023 2022 Loss before tax and net $m (1,128) (747) (1,202) finance costs Loss before tax and net finance costs of $1,128 million increased by $381 million, or 51%, from 2023 to 2024 primarily due to an embedded derivative fair value adjustment as a result of weaker urea forward curve and higher discount rate. Loss before tax and net finance costs of $747 million decreased by $455 million, or 38%, from 2022 to 2023 primarily due to the absence of merger cost in 2023. Capital and exploration expenditure Woodside’s capital expenditures vary from year to year depending on the projects that it is undertaking, their stage of development and Woodside’s participating share in these projects. Woodside’s exploration expenditures vary from year to year depending on its strategic priorities and the exploration projects which it undertakes. For more information, refer to notes B.1 Segment production and growth assets, B.2 Exploration and evaluation and B.3 Property, plant and equipment in section 5—Financial Statements. Capital and exploration expenditure is an alternative performance measure (APM) which is a non-IFRS measure that is unaudited. Woodside believes this non-IFRS measure provides useful performance information, however it should not be considered as an indication of, or as a substitute for, statutory measures as an indicator of actual operating performance (such as net profit after tax or net cash from operating activities) or any other measure of financial performance or position presented in accordance with IFRS. For more information on non-IFRS measures, including reconciliations to Woodside’s Financial Statements, refer to section 6.6—Alternative performance measures. Capital and exploration expenditure geographical split1 Units 2024 2023 2022 Australia $m 3,297 3,515 2,440 International2 $m 2,351 2,588 2,093 Total $m 5,648 6,103 4,533 1. Includes capital additions on other corporate spend. The 2022 amounts have been restated to be presented on the same basis. 2. Capital and exploration expenditure incurred in all other locations excluding Australia. Australian capital and exploration expenditure decreased by $218 million, or 6%, to $3,297 million from 2023 to 2024 primarily due to the sell down of non-operating interests in Scarborough partially offset by continued investment in Pluto Train 2 asset. Australian capital and exploration expenditure increased by $1,075 million, or 44%, to $3,515 million from 2022 to 2023, primarily due to continued investment into the Scarborough and Pluto Train 2 assets. International capital and exploration expenditure decreased by $237 million, or 9%, to $2,351 million from 2023 to 2024, primarily due to completion of the Sangomar project in 2024 and Argos in 2023, completion of Shenzi North in 2023 and less drilling activity at Atlantis partially offset by continued investment into the Trion asset. International capital and exploration expenditure increased by $495 million, or 24%, to $2,588 million from 2022 to 2023, primarily due to continued investment into the Sangomar and Trion assets Cash flow analysis The following section describes movements in Woodside’s cash flows for the years ending 31 December 2024, 2023 and 2022. Key metric 2024 2023 2022 US$m US$m US$m Net cash from operating activities 5,847 6,145 8,811 Net cash used in investing activities (5,747) (5,585) (2,265) Net cash from/(used in) financing 2,101 (5,000) (3,364) activities Net increase/(decrease) in cash 2,201 (4,440) 3,182 Net cash from operating activities Net cash from operating activities in 2024 decreased $298 million, or 5%, to $5,847 million from 2023, primarily due to higher payments for restoration ($358 million); return of collateral on Brent hedges in 2023 ($506 million); offset in part by lower settled hedge payments ($311 million) and lower income tax paid largely due to a balancing income tax payment in 2023 for record 2022 profits ($361 million). Net cash from operating activities decreased $2,666 million, or 30%, to $6,145 million from 2022 to 2023, primarily due to lower EBITDA as a result of lower revenue driven by lower realised price; higher income tax and PRRT paid for record 2022 profits ($1,698 million); higher payments for restoration ($184 million); offset in part by return of collateral on Brent hedges versus payment in 2022 ($1,012 million); and higher receipts from interest ($156 million) due to higher interest rates from 2022 to 2023, despite reduction in deposits. Net cash used in investing activities Net cash used in investing activities in 2024 increased $162 million, or 3%, to $5,747 million from 2023, primarily due to the acquisition of Beaumont New Ammonia ($1,896 million) and Louisiana LNG ($1,042 million) offset in part by the Scarborough sell-downs to LNG Japan and JERA Scarborough Pty Ltd ($2,285 million). Net cash used in investing activities increased $3,320 million, or 147%, to $5,585 million from 2022 to 2023, primarily due to investments in major projects at Scarborough, Sangomar and Trion. These new investments are intended to generate future operating cash flows and returns across the price cycle. Net cash from/(used in) financing activities Net cash from financing activities in 2024 increased $7,101 million, or 142%, to $2,101 million from 2023, primarily due to lower final prior year dividend paid to shareholders ($1,804 million) due to the record 2022 net profit after tax; issue of two series of unsecured bonds ($2,000 million); drawdown of syndicated term loan facilities ($1,650 million); drawdown of JBIC Facility ($1,000 million) and drawdown of bilateral facilities ($500 million). Net cash used in financing activities increased $1,636 million, or 49%, to $5,000 million from 2022 to 2023, primarily due to higher final prior year dividend paid to shareholders ($1,695 million) due to the higher 2022 NPAT; and higher repayment of the principal portion of lease liabilities ($92 million) predominantly due to Sangomar. 224 WOODSIDE ENERGY GROUP LTD
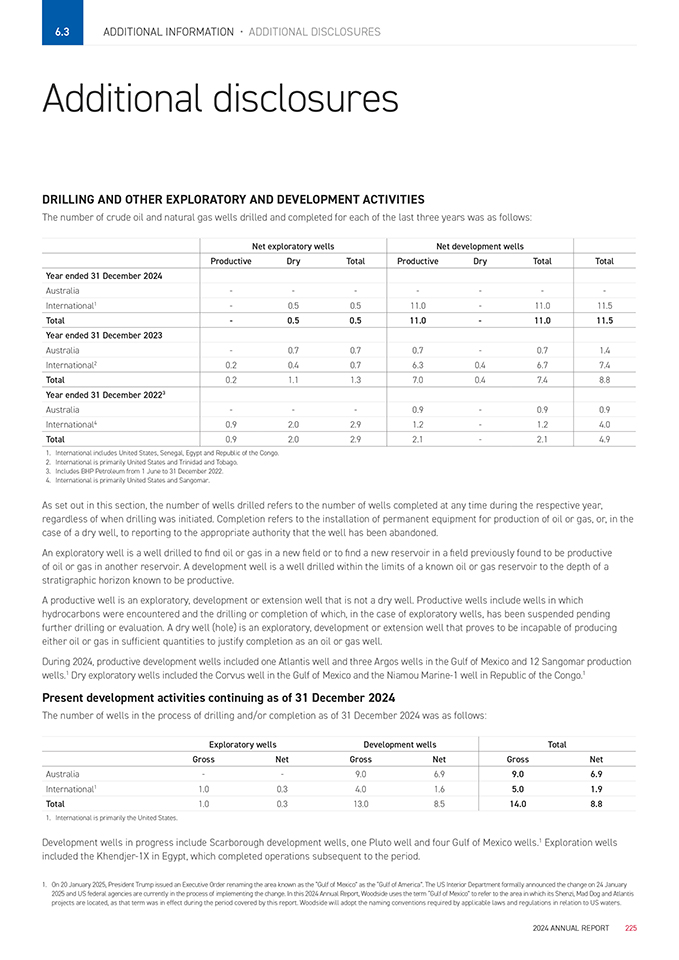
6.3 Additional Information • Additional disclosures Additional disclosures DRILLING AND OTHER EXPLORATORY AND DEVELOPMENT ACTIVITIES The number of crude oil and natural gas wells drilled and completed for each of the last three years was as follows: Net exploratory wells Net development wells Productive Dry Total Productive Dry Total Total Year ended 31 December 2024 Australia — — —— International1—0.5 0.5 11.0—11.0 11.5 Total—0.5 0.5 11.0—11.0 11.5 Year ended 31 December 2023 Australia—0.7 0.7 0.7—0.7 1.4 International2 0.2 0.4 0.7 6.3 0.4 6.7 7.4 Total 0.2 1.1 1.3 7.0 0.4 7.4 8.8 Year ended 31 December 20223 Australia ——0.9—0.9 0.9 International4 0.9 2.0 2.9 1.2—1.2 4.0 Total 0.9 2.0 2.9 2.1—2.1 4.9 1. International includes United States, Senegal, Egypt and Republic of the Congo. 2. International is primarily United States and Trinidad and Tobago. 3. Includes BHP Petroleum from 1 June to 31 December 2022. 4. International is primarily United States and Sangomar. As set out in this section, the number of wells drilled refers to the number of wells completed at any time during the respective year, regardless of when drilling was initiated. Completion refers to the installation of permanent equipment for production of oil or gas, or, in the case of a dry well, to reporting to the appropriate authority that the well has been abandoned. An exploratory well is a well drilled to find oil or gas in a new field or to find a new reservoir in a field previously found to be productive of oil or gas in another reservoir. A development well is a well drilled within the limits of a known oil or gas reservoir to the depth of a stratigraphic horizon known to be productive. A productive well is an exploratory, development or extension well that is not a dry well. Productive wells include wells in which hydrocarbons were encountered and the drilling or completion of which, in the case of exploratory wells, has been suspended pending further drilling or evaluation. A dry well (hole) is an exploratory, development or extension well that proves to be incapable of producing either oil or gas in sufficient quantities to justify completion as an oil or gas well. During 2024, productive development wells included one Atlantis well and three Argos wells in the Gulf of Mexico and 12 Sangomar production wells.1 Dry exploratory wells included the Corvus well in the Gulf of Mexico and the Niamou Marine-1 well in Republic of the Congo.1 Present development activities continuing as of 31 December 2024 The number of wells in the process of drilling and/or completion as of 31 December 2024 was as follows: Exploratory wells Development wells Total Gross Net Gross Net Gross Net Australia — 9.0 6.9 9.0 6.9 International1 1.0 0.3 4.0 1.6 5.0 1.9 Total 1.0 0.3 13.0 8.5 14.0 8.8 1. International is primarily the United States. Development wells in progress include Scarborough development wells, one Pluto well and four Gulf of Mexico wells.1 Exploration wells included the Khendjer-1X in Egypt, which completed operations subsequent to the period. 1. On 20 January 2025, President Trump issued an Executive Order renaming the area known as the “Gulf of Mexico” as the “Gulf of America”. The US Interior Department formally announced the change on 24 January 2025 and US federal agencies are currently in the process of implementing the change. In this 2024 Annual Report, Woodside uses the term “Gulf of Mexico” to refer to the area in which its Shenzi, Mad Dog and Atlantis projects are located, as that term was in effect during the period covered by this report. Woodside will adopt the naming conventions required by applicable laws and regulations in relation to US waters. 2024 ANNUAL REPORT 225
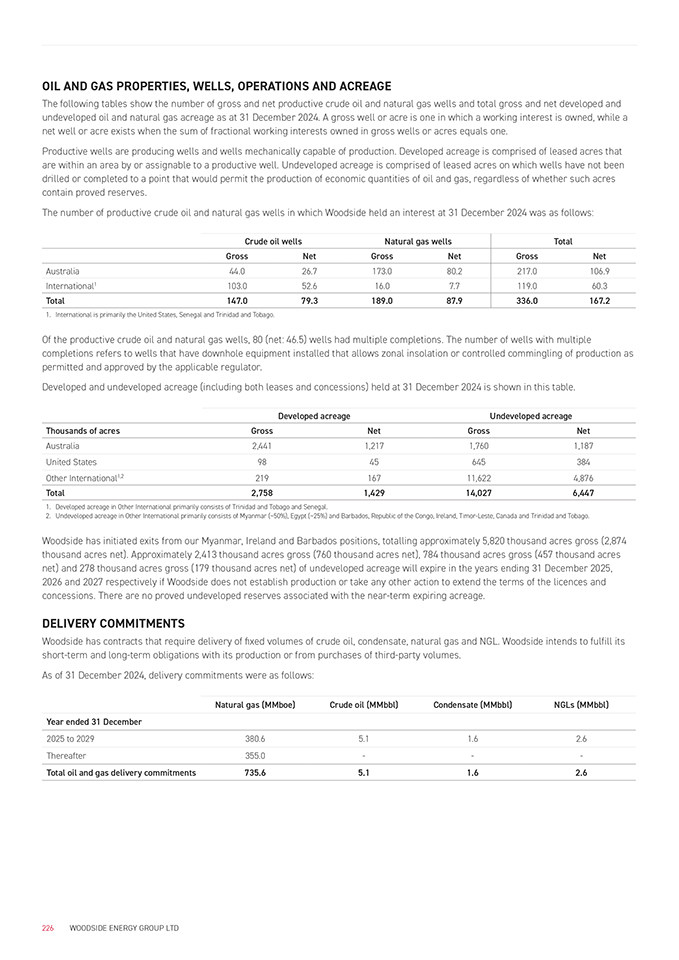
OIL AND GAS PROPERTIES, WELLS, OPERATIONS AND ACREAGE The following tables show the number of gross and net productive crude oil and natural gas wells and total gross and net developed and undeveloped oil and natural gas acreage as at 31 December 2024. A gross well or acre is one in which a working interest is owned, while a net well or acre exists when the sum of fractional working interests owned in gross wells or acres equals one. Productive wells are producing wells and wells mechanically capable of production. Developed acreage is comprised of leased acres that are within an area by or assignable to a productive well. Undeveloped acreage is comprised of leased acres on which wells have not been drilled or completed to a point that would permit the production of economic quantities of oil and gas, regardless of whether such acres contain proved reserves. The number of productive crude oil and natural gas wells in which Woodside held an interest at 31 December 2024 was as follows: Crude oil wells Natural gas wells Total Gross Net Gross Net Gross Net Australia 44.0 26.7 173.0 80.2 217.0 106.9 International1 103.0 52.6 16.0 7.7 119.0 60.3 Total 147.0 79.3 189.0 87.9 336.0 167.2 1. International is primarily the United States, Senegal and Trinidad and Tobago. Of the productive crude oil and natural gas wells, 80 (net: 46.5) wells had multiple completions. The number of wells with multiple completions refers to wells that have downhole equipment installed that allows zonal insolation or controlled commingling of production as permitted and approved by the applicable regulator. Developed and undeveloped acreage (including both leases and concessions) held at 31 December 2024 is shown in this table. Developed acreage Undeveloped acreage Thousands of acres Gross Net Gross Net Australia 2,441 1,217 1,760 1,187 United States 98 45 645 384 Other International1,2 219 167 11,622 4,876 Total 2,758 1,429 14,027 6,447 1. Developed acreage in Other International primarily consists of Trinidad and Tobago and Senegal. 2. Undeveloped acreage in Other International primarily consists of Myanmar (~50%), Egypt (~25%) and Barbados, Republic of the Congo, Ireland, Timor-Leste, Canada and Trinidad and Tobago. Woodside has initiated exits from our Myanmar, Ireland and Barbados positions, totalling approximately 5,820 thousand acres gross (2,874 thousand acres net). Approximately 2,413 thousand acres gross (760 thousand acres net), 784 thousand acres gross (457 thousand acres net) and 278 thousand acres gross (179 thousand acres net) of undeveloped acreage will expire in the years ending 31 December 2025, 2026 and 2027 respectively if Woodside does not establish production or take any other action to extend the terms of the licences and concessions. There are no proved undeveloped reserves associated with the near-term expiring acreage. DELIVERY COMMITMENTS Woodside has contracts that require delivery of fixed volumes of crude oil, condensate, natural gas and NGL. Woodside intends to fulfill its short-term and long-term obligations with its production or from purchases of third-party volumes. As of 31 December 2024, delivery commitments were as follows: Natural gas (MMboe) Crude oil (MMbbl) Condensate (MMbbl) NGLs (MMbbl) Year ended 31 December 2025 to 2029 380.6 5.1 1.6 2.6 Thereafter 355.0 —— Total oil and gas delivery commitments 735.6 5.1 1.6 2.6 226 WOODSIDE ENERGY GROUP LTD
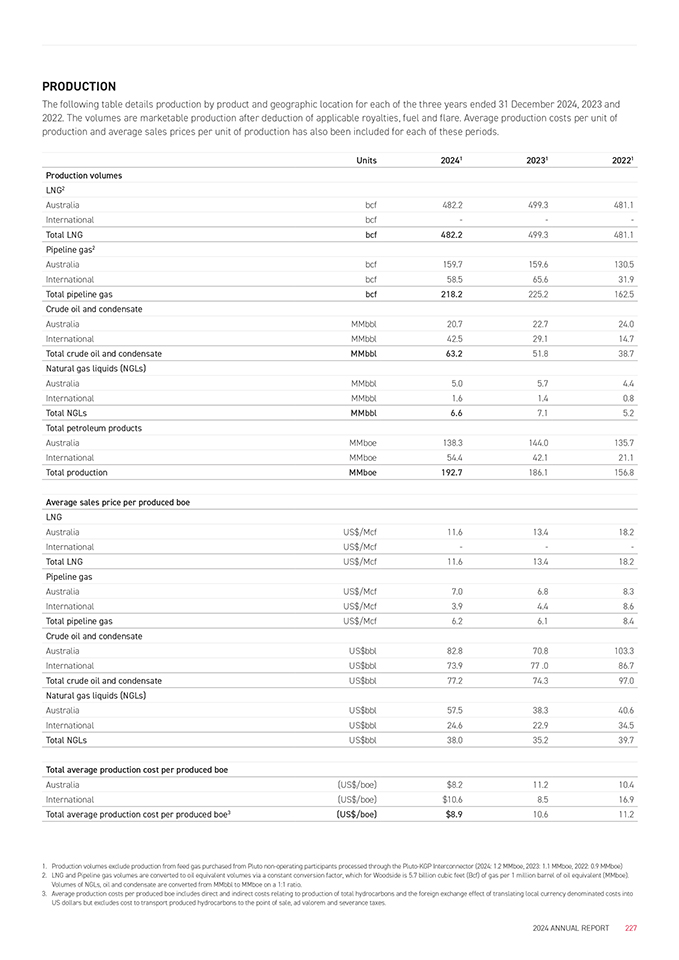
PRODUCTION The following table details production by product and geographic location for each of the three years ended 31 December 2024, 2023 and 2022. The volumes are marketable production after deduction of applicable royalties, fuel and flare. Average production costs per unit of production and average sales prices per unit of production has also been included for each of these periods. Units 20241 20231 20221 Production volumes LNG2 Australia bcf 482.2 499.3 481.1 International bcf —— Total LNG bcf 482.2 499.3 481.1 Pipeline gas2 Australia bcf 159.7 159.6 130.5 International bcf 58.5 65.6 31.9 Total pipeline gas bcf 218.2 225.2 162.5 Crude oil and condensate Australia MMbbl 20.7 22.7 24.0 International MMbbl 42.5 29.1 14.7 Total crude oil and condensate MMbbl 63.2 51.8 38.7 Natural gas liquids (NGLs) Australia MMbbl 5.0 5.7 4.4 International MMbbl 1.6 1.4 0.8 Total NGLs MMbbl 6.6 7.1 5.2 Total petroleum products Australia MMboe 138.3 144.0 135.7 International MMboe 54.4 42.1 21.1 Total production MMboe 192.7 186.1 156.8 Average sales price per produced boe LNG Australia US$/Mcf 11.6 13.4 18.2 International US$/Mcf —— Total LNG US$/Mcf 11.6 13.4 18.2 Pipeline gas Australia US$/Mcf 7.0 6.8 8.3 International US$/Mcf 3.9 4.4 8.6 Total pipeline gas US$/Mcf 6.2 6.1 8.4 Crude oil and condensate Australia US$bbl 82.8 70.8 103.3 International US$bbl 73.9 77 .0 86.7 Total crude oil and condensate US$bbl 77.2 74.3 97.0 Natural gas liquids (NGLs) Australia US$bbl 57.5 38.3 40.6 International US$bbl 24.6 22.9 34.5 Total NGLs US$bbl 38.0 35.2 39.7 Total average production cost per produced boe Australia (US$/boe) $8.2 11.2 10.4 International (US$/boe) $10.6 8.5 16.9 Total average production cost per produced boe3 (US$/boe) $8.9 10.6 11.2 1. Production volumes exclude production from feed gas purchased from Pluto non-operating participants processed through the Pluto-KGP Interconnector (2024: 1.2 MMboe, 2023: 1.1 MMboe, 2022: 0.9 MMboe) 2. LNG and Pipeline gas volumes are converted to oil equivalent volumes via a constant conversion factor, which for Woodside is 5.7 billion cubic feet (Bcf) of gas per 1 million barrel of oil equivalent (MMboe). Volumes of NGLs, oil and condensate are converted from MMbbl to MMboe on a 1:1 ratio. 3. Average production costs per produced boe includes direct and indirect costs relating to production of total hydrocarbons and the foreign exchange effect of translating local currency denominated costs into US dollars but excludes cost to transport produced hydrocarbons to the point of sale, ad valorem and severance taxes. 2024 ANNUAL REPORT 227
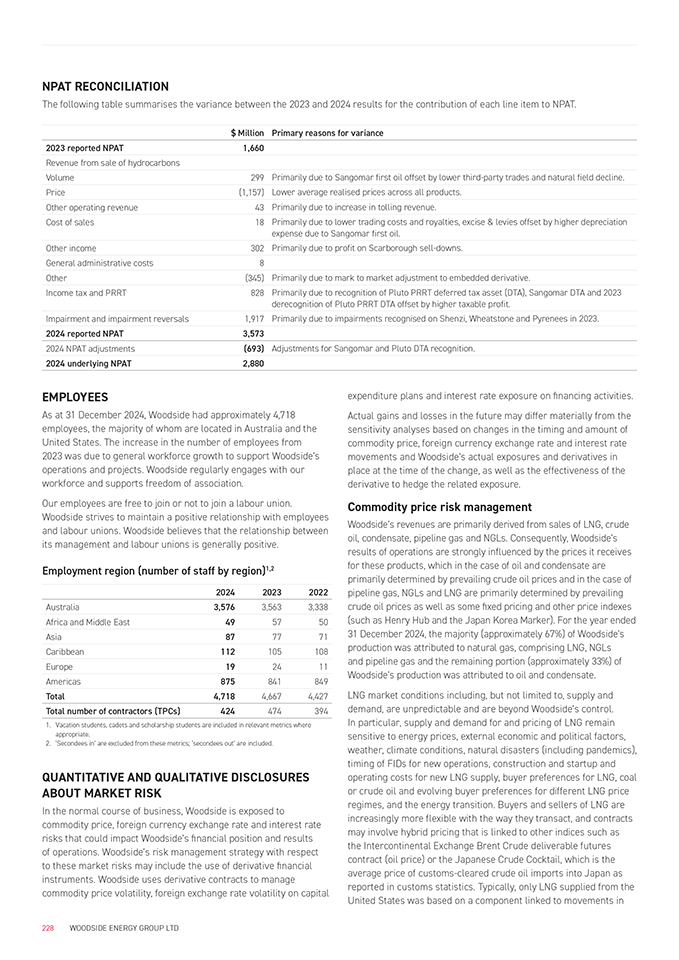
NPAT RECONCILIATION The following table summarises the variance between the 2023 and 2024 results for the contribution of each line item to NPAT. $ Million Primary reasons for variance 2023 reported NPAT 1,660 Revenue from sale of hydrocarbons Volume 299 Primarily due to Sangomar first oil offset by lower third-party trades and natural field decline. Price (1,157) Lower average realised prices across all products. Other operating revenue 43 Primarily due to increase in tolling revenue. Cost of sales 18 Primarily due to lower trading costs and royalties, excise & levies offset by higher depreciation expense due to Sangomar first oil. Other income 302 Primarily due to profit on Scarborough sell-downs. General administrative costs 8 Other (345) Primarily due to mark to market adjustment to embedded derivative. Income tax and PRRT 828 Primarily due to recognition of Pluto PRRT deferred tax asset (DTA), Sangomar DTA and 2023 derecognition of Pluto PRRT DTA offset by higher taxable profit. Impairment and impairment reversals 1,917 Primarily due to impairments recognised on Shenzi, Wheatstone and Pyrenees in 2023. 2024 reported NPAT 3,573 2024 NPAT adjustments (693) Adjustments for Sangomar and Pluto DTA recognition. 2024 underlying NPAT 2,880 EMPLOYEES As at 31 December 2024, Woodside had approximately 4,718 employees, the majority of whom are located in Australia and the United States. The increase in the number of employees from 2023 was due to general workforce growth to support Woodside’s operations and projects. Woodside regularly engages with our workforce and supports freedom of association. Our employees are free to join or not to join a labour union. Woodside strives to maintain a positive relationship with employees and labour unions. Woodside believes that the relationship between its management and labour unions is generally positive. Employment region (number of staff by region)1,2 2024 2023 2022 Australia 3,576 3,563 3,338 Africa and Middle East 49 57 50 Asia 87 77 71 Caribbean 112 105 108 Europe 19 24 11 Americas 875 841 849 Total 4,718 4,667 4,427 Total number of contractors (TPCs) 424 474 394 1. Vacation students, cadets and scholarship students are included in relevant metrics where appropriate. 2. ‘Secondees in’ are excluded from these metrics; ‘secondees out’ are included. QUANTITATIVE AND QUALITATIVE DISCLOSURES ABOUT MARKET RISK In the normal course of business, Woodside is exposed to commodity price, foreign currency exchange rate and interest rate risks that could impact Woodside’s financial position and results of operations. Woodside’s risk management strategy with respect to these market risks may include the use of derivative financial instruments. Woodside uses derivative contracts to manage commodity price volatility, foreign exchange rate volatility on capital expenditure plans and interest rate exposure on financing activities. Actual gains and losses in the future may differ materially from the sensitivity analyses based on changes in the timing and amount of commodity price, foreign currency exchange rate and interest rate movements and Woodside’s actual exposures and derivatives in place at the time of the change, as well as the effectiveness of the derivative to hedge the related exposure. Commodity price risk management Woodside’s revenues are primarily derived from sales of LNG, crude oil, condensate, pipeline gas and NGLs. Consequently, Woodside’s results of operations are strongly influenced by the prices it receives for these products, which in the case of oil and condensate are primarily determined by prevailing crude oil prices and in the case of pipeline gas, NGLs and LNG are primarily determined by prevailing crude oil prices as well as some fixed pricing and other price indexes (such as Henry Hub and the Japan Korea Marker). For the year ended 31 December 2024, the majority (approximately 67%) of Woodside’s production was attributed to natural gas, comprising LNG, NGLs and pipeline gas and the remaining portion (approximately 33%) of Woodside’s production was attributed to oil and condensate. LNG market conditions including, but not limited to, supply and demand, are unpredictable and are beyond Woodside’s control. In particular, supply and demand for and pricing of LNG remain sensitive to energy prices, external economic and political factors, weather, climate conditions, natural disasters (including pandemics), timing of FIDs for new operations, construction and startup and operating costs for new LNG supply, buyer preferences for LNG, coal or crude oil and evolving buyer preferences for different LNG price regimes, and the energy transition. Buyers and sellers of LNG are increasingly more flexible with the way they transact, and contracts may involve hybrid pricing that is linked to other indices such as the Intercontinental Exchange Brent Crude deliverable futures contract (oil price) or the Japanese Crude Cocktail, which is the average price of customs-cleared crude oil imports into Japan as reported in customs statistics. Typically, only LNG supplied from the United States was based on a component linked to movements in 228 WOODSIDE ENERGY GROUP LTD
the US Henry Hub plus certain fixed and variable components. This type of pricing structure may become a component of the weighted average price into Asia and other markets. This is since LNG supply and trade has globalised and increasingly the lowest cost supply is setting the floor for long-term average global natural gas prices with transportation costs accounting for regional differences. This marginal supply is predominantly from the United States, indirectly pegging global gas prices and Asian spot LNG prices to the Henry Hub marker which could adversely affect the pricing of new LNG contracts and potential future price reviews of existing LNG contracts. Tenders may also be used by suppliers and buyers, typically for shorter-term contracts. In addition, long-term LNG contracts typically contain price review mechanisms that sometimes need to be resolved by expert determination or arbitration. The use of these independent resolution mechanisms is likely to be more prevalent in volatile commodity markets. Alternatives to fossil fuel-based products for the generation of electricity (for example nuclear power and renewable energy sources) are continually under development and, if these alternatives continue to gain market share, they could also have a material impact on demand for LNG, which in turn may negatively impact Woodside’s business, results of operations and financial condition in the longer-term. Oil prices can be very volatile, and periods of sustained low prices could result in changes to Woodside’s carrying value assumptions and may also reduce the reported net profit for the relevant period. The price of crude oil may be affected by factors beyond Woodside’s control. These include worldwide oil supply and demand, the level of economic activity in the markets Woodside serves, regional political developments and military conflicts (including the ongoing Russia-Ukraine conflict), weather conditions and natural disasters, conservation and environmental protection efforts, the level of crude oil inventories, the ability of OPEC and other major oil-producing or oil-consuming nations to influence global production levels and prices, sanctions on the production or export of oil, governmental regulations and actions (including the imposition of taxes), trade restrictions, market uncertainty and speculative activities by those who buy and sell oil and gas on the world markets, commodity futures trading, availability and capacity of infrastructure, supply chain disruptions, processing facilities and necessary transportation, the price and availability of new technology, the availability and cost of alternative sources of energy, and the impact of climate change considerations and actions towards energy transition on the demand for key commodities which Woodside produces. The transition to lower-carbon sources of energy in many parts of the world (driven by environmental, social, governance and climate change concerns) may affect demand for Woodside’s products including crude oil, natural gas and LNG. In turn, this may affect the price received (or expected to be received) for these products. Material adverse price impacts (including as a result of the energy transition) may affect the economic performance (including as to margins and cash flows) of, and longevity of production from, Woodside’s existing and future production assets, and ultimately the financial performance of Woodside. It is impossible to predict future crude oil, LNG and natural gas price movements with certainty. A low crude oil price environment or declines in the price of crude oil, LNG and natural gas prices, could adversely affect Woodside’s business, results of operations and financial condition and liquidity. They could also negatively impact its ability to access sources of capital, including equity and debt markets. Those circumstances may also adversely impact Woodside’s ability to finance planned capital expenditures, including development projects, and may change the economics of operating certain wells, which could result in a reduction in the volume of Woodside’s reserves. Declines in crude oil, LNG and natural gas prices, especially sustained declines, may also reduce the amount of oil and gas that we can produce economically, reduce the economic viability of planned projects or assets that we plan to acquire or have acquired, and may reduce the expected value and the potential commerciality of exploration and appraisal assets. Those reductions may result in substantial downward adjustments to Woodside’s estimated proved reserves and require additional write-downs of the value of its property, plant and equipment. Sales contracts with the National Gas Company of Trinidad and Tobago relating to production from Woodside’s Trinidad and Tobago operations are partially linked to ammonia pricing. In addition, there is a Western Australian domestic gas sales contract linked to urea pricing. Similar to crude oil, LNG and natural gas, it is impossible to predict future ammonia and urea prices with certainty. There can be no assurance that Woodside will successfully manage its exposure to commodity prices. There is also counterparty risk associated with derivative contracts. If any counterparty to Woodside’s derivative instruments were to default or seek bankruptcy protection, it could subject a larger percentage of Woodside’s future oil and gas production to price changes and could have a negative effect on Woodside’s financial performance, including its ability to fund future projects. Whether Woodside engages in hedging and other oil and gas derivative contracts on a limited basis or otherwise, Woodside will remain exposed to fluctuations in crude oil prices. Foreign exchange and interest rate risk management Note A and note C in the Notes to the financial statements contain further information on foreign exchange and interest rate risks. CYBERSECURITY Our Cyber Resilience Process and risk management Woodside’s approach to managing material risks from cybersecurity threats is integrated into our overall risk management processes as disclosed in section 4.1.6—Risk management and internal control. Woodside’s cybersecurity resilience and risk management strategy and process are based on the National Institute of Standards and Technology Cybersecurity Framework. Woodside’s Cyber Resilience Process consists of various Group-wide policies, procedures and guidelines concerning cybersecurity matters. These documents, published within the Woodside Management System (WMS), have these aims: 1. to design, build and maintain Woodside’s Information Technology (IT), Operational Technology (OT) and Industrial Internet of Things systems with the right cybersecurity controls to support confidentiality, integrity and availability. 2. to monitor and strengthen Woodside’s cybersecurity posture while preventing, detecting, analysing and responding to cybersecurity incidents. 3. to embed a cyber-safe culture across Woodside and foster industry collaboration. 4. to enable compliance with all applicable legislation. 2024 ANNUAL REPORT 229
The process involves five key activities: identify, protect, detect, respond and recover. In addition to the Cyber Resilience Process, the Data, Information and Systems Management process documented within the WMS, includes the Woodside Information Technology Systems – Conditions of Use Procedure. This procedure sets out Woodside’s mandatory conditions applicable to the use of Woodside’s IT, OT and digital systems. Woodside manages cybersecurity risks utilising the same Woodside risk management process as described in section 3.9—Risk factors. Our Cyber Resilience Process assurance Woodside’s cybersecurity team engages third-party vendors as part of our Cyber Resilience Process to perform a variety of technical assessments such as penetration testing. As part of these assessments, the third parties test our internal and external defences and help us with identifying weaknesses and vulnerabilities within our environment. These assessment findings are risk ranked and prioritised for remediation. Woodside’s internal audit team conducts audits on cybersecurity on a biennial basis. The internal audit function engages external expertise to conduct the audits. The most recent cybersecurity audit concluded in 2023. Third-party cybersecurity risk management Woodside identifies and manages risks from cybersecurity threats associated with third parties accessing, storing and processing Woodside data. This is done through up-front cybersecurity assessment processes that leverage independently verified security programs including ISO 27001 certification and SOC 2 Type II compliance, and through contractual terms and conditions. Woodside manages risk of third-party access to Woodside systems through on-boarding and induction processes for personnel including mandatory training. Third-party personnel accessing Woodside systems are subject to the same cyber security controls as Woodside staff. This includes the requirement to complete annual cybersecurity training and additional role based training if applicable. Higher risk scenarios such as direct network connectivity from third-party networks are not permitted. Material impact from cybersecurity risks, threats or previous cybersecurity incidents Cybersecurity threats have the potential to materially affect Woodside’s business strategy, results of operations and financial conditions. This risk is described in section 3.9—Risk factors. Woodside continuously monitors its digital information landscape and has various threat detection measures in place. Woodside is not aware of any cybersecurity incidents or threats that have materially affected or are reasonably likely to materially affect our business strategy, results of operations or financial conditions. Cybersecurity governance and internal control As part of its oversight of the Risk Management Policy, the Audit & Risk Committee oversees risks from cybersecurity threats. The Audit & Risk Committee aims to hold at least five regular meetings a year at which cybersecurity risks and the Group’s management of such risks are reviewed as part of those meetings. The identification and direct management of cybersecurity risks and threats are performed by Woodside’s cybersecurity function, with subject matter expertise provided as part of our cyber resilience process. The cybersecurity function is led by Woodside’s VP Digital and a group of competent and experienced cybersecurity professionals. Our VP Digital has over a decade of industry experience and has held multiple technology and business facing roles. The cyber resilience process as described previously includes the monitoring, prevention, detection, mitigation and remediation of cybersecurity risks and incidents. The Woodside Board and the Audit & Risk Committee are kept informed of any material cybersecurity risks and incidents through formal risk registers, briefing papers, internal audit reports, periodic reporting in person at Audit & Risk Committee meetings or as required through Woodside’s crisis and emergency management process. Woodside’s cybersecurity resilience and risk management strategy and process are based on the National Institute of Standards and Technology Cybersecurity Framework. This process is documented within the WMS. GOVERNMENT REGULATIONS Woodside’s assets and exploration, development, extraction and production and decommissioning operations are subject to a wide range of laws and regulations imposed by governments and regulatory bodies. These regulations touch all aspects of our businesses, including how we extract, process and explore for oil and natural gas and how we conduct our business, including regulations governing matters related to environmental protection, land rehabilitation, facility decommissioning, occupational health and safety, human rights, the rights and interests of First Nations and Indigenous Peoples, competition, foreign investment, export, marketing of our products, royalties and taxes. The ability to extract and process oil and natural gas is fundamental to our business. In most jurisdictions, where we operate or have assets, the rights to explore for and to extract petroleum deposits are owned by the government. We obtain the right to access the land and extract the product by entering into licences or leases with the government that owns the oil or natural gas deposit. Usually, the right to explore for oil and natural gas carries with it the obligation to spend a defined amount of money on petroleum exploration or to undertake particular exploration activities. We also rely on governments to grant the rights necessary to transport and treat the extracted petroleum to prepare it for sale. The terms of the right, including the time period of the right, vary depending on the laws of the relevant government or terms negotiated with the relevant government. Many of the laws and regulations to which we are subject require us to obtain permits or other authorisations from state and/or federal agencies before initiating exploration, certain drilling, construction, production, operation, or other activities, and to maintain these permits and compliance with their requirements for on-going operations. These permits are generally subject to protest, appeal, or litigation, which can in certain cases delay or halt projects and cease production or operation of wells, pipelines, and other operations. In certain jurisdictions where we have assets, such as Trinidad and Tobago and Senegal, a production sharing contract governs 230 WOODSIDE ENERGY GROUP LTD
the relationship between the government and companies (typically referred to as “contractor”) concerning, among other things, how much of the oil and gas extracted from the country each party will receive. Under production sharing contracts, the government awards exclusive rights for the execution of exploration, development and production activities to the contractor in accordance with the contract’s terms. Generally speaking, the contractor bears the financial risk of the initiative to explore, develop and ultimately produce the resource. When successful, the contractor is permitted to use a specified percentage of produced oil and gas to recover its capital and operational expenditures, often called “cost oil”. The remaining production is split between the government and the contractor at a rate determined by the government and set out in the contract. The production sharing contract may also include additional fiscal terms such as royalties, production bonuses and tax treatment, and other contractual terms addressing domestic supply obligations, local content, measurement and valuation. Production sharing contracts are bilateral contracts negotiated between the contractor and the government and so each is necessarily on different terms. Applicable laws and regulations, and any permits that Woodside is required to obtain under these laws, may obligate Woodside to identify, avoid, mitigate and disclose environmental risks in various operational practices, including (among others), through pursuing and obtaining permits before commencing activities; restricting air and water emissions and waste discharges; limiting the type, quantity and concentration of various substances that can be utilised or released into the environment; addressing potential or actual impacts to protected flora and fauna species or cultural resources; monitoring or remediating contamination under certain circumstances; establishing and following certain inspection, testing, maintenance and decommissioning protocols; and disclosing certain operational practices. Moreover, environmental permits required for our operations may be subject to legal challenges by third parties, and such challenges can materially and adversely affect our operations to the extent they delay or prevent obtaining approvals or permits required for our operations, or otherwise require incurring increased costs in order to obtain such approvals or permits. Applicable environmental laws and regulations may also dictate amenity considerations relating to noise, odour and dust, worker health and community notification procedures. In addition, from time to time, certain trade sanctions are adopted by the United Nations (UN) Security Council or various governments, including in the United Kingdom, the United States, the European Union (EU), China and Australia against certain countries, entities or individuals, that may restrict our ability to sell oil or natural gas to or to purchase goods or services from these countries, entities or individuals. This summary focuses on the Australian and United States regulatory regimes, as well as certain regulations in Senegal. It is not a full summary of the regulatory regimes in those jurisdictions nor is it a complete list of the legislation and regulation that applies to Woodside. Woodside is also subject to environmental and other regulations to varying degrees in each of the jurisdictions in which it has assets and operations. Australia In Australia, petroleum exploration and production takes place within a legal framework characterised by a division of responsibilities between the federal and the state or territory governments. Exploration and production activities conducted onshore and within three nautical miles of the territorial sea baseline of the relevant state or territory are the responsibility of the individual state or territory governments. The Australian Government has legislative responsibility for Australian offshore petroleum exploration and production beyond the three nautical mile territorial sea, which encompasses the area of most relevance to Woodside’s offshore activities. In addition, Woodside has certain onshore operations in Victoria and Western Australia that are subject to various pieces of state and federal legislation. Environmental regulation Woodside’s Australian operations are subject to federal, state and local environmental laws and regulations. For offshore petroleum activities, these laws and regulations generally require an approval before an activity commences, and require that for an activity, environmental risks are identified and controls put in place to reduce or eliminate the risks. For exploration drilling and seismic activities in the federal jurisdiction, this is outlined in an environment plan accepted by the National Offshore Petroleum Safety and Environmental Management Authority (NOPSEMA), an independent statutory authority. As an operation goes into construction, commissioning and production, an offshore project proposal and new or revised environment plan may be required. Subsequent environment plans for each activity are required to be submitted after an offshore project proposal has been approved. These laws and regulations also restrict the type, quantity and concentration of various substances that can be utilised or released into the environment in connection with marine and land-based activities; limit or prohibit drilling and seismic or production activities in and near certain environmentally sensitive or protected areas; and impose criminal and civil liabilities for pollution or other unauthorised impacts to the environment resulting from oil, natural gas and petrochemical operations. The National Greenhouse and Energy Reporting Act 2007 (Cth) requires corporations that meet certain reporting thresholds to report company information about GHG emissions and energy production and consumption as part of a single, national reporting scheme. The National Greenhouse and Energy Reporting (Safeguard Mechanism) Rule 2015 establishes the Safeguard Mechanism which aims to keep certain GHG emissions at or below legislated limits, known as baselines, for Australia’s largest industrial facilities. In March 2023, the Safeguard Mechanism (Crediting) Amendment Bill 2023 was passed, which applied reforms to the Safeguard Mechanism from 1 July 2023 intended to reduce Scope 1 GHG emissions from Australia’s largest industrial facilities on a trajectory consistent with achieving Australia’s GHG emission reduction targets of 43% below 2005 levels by 2030 and net zero by 2050. There remains uncertainty regarding future changes to climate change regulation in Australia and the effect it may have on Woodside’s business. In addition, Australian environmental laws and regulations also include restrictions on air emissions and water discharges resulting from the operation of drilling equipment, processing facilities, pipelines and transport vessels. These laws also regulate the use, management and disposal of hazardous materials and 2024 ANNUAL REPORT 231
general waste; prohibit the clearing of native vegetation without approval; manage biodiversity and manage and authorise impacts to Aboriginal heritage; and require Woodside to prepare and implement safety and environmental management plans. Woodside is required to provide bonds or maintain other forms of financial assurance for rehabilitation, cleaning-up or pollution prevention work that may be necessary as a result of the construction, operation, decommissioning or removal of a pipeline or other infrastructure and to report, monitor or remediate contamination under certain circumstances. Woodside is subject to “strict liability” for oil spills, rendering it liable without regard to potential negligence or fault and may be subject to fines and other penalties for breaches of laws, regulations, licences or other approvals. The requirements imposed by environmental laws and regulations are subject to change and have tended to become increasingly restrictive over time. The modification of existing foreign or domestic laws or regulations or the adoption of new laws or regulations curtailing exploratory or development drilling for oil and gas for economic, political, social, environmental or other reasons could have a material adverse effect on Woodside’s business, financial condition or results of operations. Fair Work Act and other related amendments A significant number of changes to the Fair Work Act 2009 (Cth) and other related laws have been introduced over the past year or two. In December 2022, the Australian Government passed the Fair Work Legislation Amendment (Secure Jobs, Better Pay) Act 2022 (Cth) (SJBP Act) which introduced a raft of amendments into the Fair Work Act with phased commencement dates over the course of 2023. All key provisions of the SJBP Act have now become effective. Key material employment changes to the Fair Work Act arising from the SJBP Act included expanded rights for employees to enforce flexible working arrangements, new restrictions on the use of fixed term (including ‘maximum term’) employment contracts, prohibitions against pay secrecy, expanding the list of protected attributes in the anti-discrimination provisions (namely, by introducing gender identity, intersex status and breastfeeding), broadening the ability of employees to extend and request access to unpaid parental leave, and providing additional avenues for workers to seek recourse against sexual harassment. The sexual harassment-related amendments in particular complement the commencement in December 2022 of a new positive duty to prevent sexual harassment in the Sex Discrimination Act 1984 (Cth) which the Australian Human Rights Commission has the power to enforce from 12 December 2023. Additionally, the Australian Human Rights Commission Amendment (Costs Protection) Bill 2024 (Cth) has commenced, a key purpose of which is to reduce the financial barriers for sexual harassment complainants to bring claims. The SJBP Act also introduced a series of significant industrial relations changes to enterprise bargaining, including expanding the ability of employees and unions to seek multi-employer enterprise agreements, broadening the power of the Fair Work Commission to resolve (through mediation or conciliation) bargaining disputes before industrial action is taken and to intervene and make workplace determinations where bargaining becomes “intractable”. Other changes to bargaining introduced by the SJBP Act included amendments making it easier for employee bargaining representatives to commence bargaining to renew existing single-enterprise agreements, changes to the Fair Work Commission’s requirements for approving enterprise agreements (including consideration of whether a proposed agreement has been genuinely agreed to and passes the “better-off-overall” test) and substantially restricting the ability of employers to terminate nominally-expired enterprise agreements. In June 2023, the Fair Work Legislation Amendment (Protecting Worker Entitlements) Act 2023 (Cth) was introduced, bringing further changes to the Fair Work Act. Key changes arising from this Act include the expansion of unpaid parental leave rights (from 1 July 2023) and enshrining superannuation payments as an enforceable National Employment Standard under the Fair Work Act (from 1 January 2024). A further package of significant reforms is contained in the Australian Government’s Fair Work Legislation Amendment (Closing Loopholes) Act 2023 (Cth) (Closing Loopholes Act). To secure the passage of the Closing Loopholes Act, the Government split the legislation into two tranches, the first passing both Houses on 7 December 2023 and the second on 12 February 2024. The first tranche dealt with matters including: ‘same job, same pay’ for labour hire workers; workplace delegate rights (except those relating to regulated workers); criminalisation of intentional wage and superannuation theft; enhanced discrimination protections; amendments regarding conciliation conferences related to industrial action; a new federal criminal offence of industrial manslaughter; and right of entry changes for union officials assisting health and safety representatives. The second tranche dealt with matters including: changes to intractable bargaining powers, provisions relating to multi-enterprise agreements, casual employment, the definition of employee, workplace delegate rights for regulated workers and the introduction of a right to disconnect. Both tranches of reforms have passed both Houses and have commenced operation (except for one limited change relating to model enterprise agreement flexibility, consultation and dispute terms, which will commence on 26 February 2025). The “same job, same pay” provisions give the Fair Work Commission the ability to make orders upon application requiring employers (excluding service contractors) to pay their employees who perform work for a “regulated host” the same rate of pay as direct employees of that host (provided that the host’s employees perform work of the same kind). The new rights for workplace delegates to paid time off to attend training as well as reasonable time and access to employer facilities to communicate with eligible union members is also significant as is the new criminal wage theft offence in respect of intentional underpayments. Woodside believes that it is well placed to comply with the numerous new employment and industrial relations obligations that have been introduced over the past year. Moving forward, as these reforms have now taken effect, compliance costs are anticipated to increase in 2025. Santos Barossa decision and Environment Plans In December 2022, the Full Court of the Federal Court of Australia handed down its decision in Santos NA Barossa Pty Ltd v Tipakalippa [2002] FCAFC 193 (Appeal Decision). The Appeal Decision decided certain aspects of the requirements for consultation associated with the acceptance of environment plans for offshore petroleum activities by the National Offshore Petroleum 232 WOODSIDE ENERGY GROUP LTD
Safety and Environmental Management Authority, as required under the OPGGSA. Subsequently, the management authority published a guideline for industry entitled “Consultation in the course of preparing an environment plan”. As a consequence of these events, Woodside has experienced delays in obtaining environment plans for petroleum activities in Commonwealth waters. Refer to section 3.9 – Risk factors for further information on risks related to government regulations and other legal developments. Domestic gas reservation policy Under a Western Australian State Government policy (WA Domestic Gas Policy), introduced in 2006, gas equivalent to 15% of LNG production from LNG export projects is required to be reserved for domestic use as a condition of State approvals required for LNG projects. The policy is typically implemented through domestic gas commitment agreements entered into between project proponents and the State, allowing negotiations to occur on a case-by-case basis regarding the method by which the LNG project proponents fulfil their domestic gas commitments, including from alternative sources. Woodside and (where applicable) its joint venture participants have domestic gas contractual commitments in place with the Western Australian State Government in respect to the North West Shelf (NWS), Pluto LNG, Scarborough and Wheatstone projects. In 2015, the NWS State Agreement (North West Gas Development (Woodside) Agreement 1979) was amended to include a new domestic gas commitment of 15% (or lesser approved amount) of total LNG quantity approved for use, supply or sale overseas to bring the NWS Project in line with the WA Domestic Gas Policy. In 2006, in connection with the FID taken in respect of the Pluto LNG project, Woodside entered into an arrangement with the Western Australian State Government to market and make available for supply a quantity of domestic gas from Pluto, provided that Woodside was not required to supply domestic gas if it is not commercially viable to do so. In January 2021, Woodside signed a further agreement with the Western Australian State Government in which Woodside agreed to market and make available 45.6 PJ of additional domestic gas from its share of NWS Project gas, separate and in addition to the 2015 commitment from the NWS Joint Venture. In November 2021, Woodside signed a further domestic gas commitment agreement with the Western Australian State Government with respect to the Scarborough project pursuant to which, consistent with the WA Domestic Gas Policy, the Scarborough Joint Venture will make gas equivalent to 15% of its LNG exports available to the domestic market. In January 2021, Woodside signed a further domestic gas commitment agreement with the Western Australian State Government with respect to the Pluto acceleration project pursuant to which, consistent with the WA Domestic Gas Policy, Woodside will make gas equivalent to 15% of its LNG exports processed at the NWS Project as part of the Pluto acceleration project available to the domestic market. Woodside also has domestic gas commitments in respect to its interest in the Wheatstone LNG Project under a 2011 agreement with the Western Australian State Government. Additional major legislation and regulations Woodside’s Australian offshore operations beyond coastal waters are primarily governed by the OPGGSA and related legislation, which establishes a joint authority whereby relevant Australian state, territory and federal governments cooperate in the administration and supervision of petroleum activities in offshore areas beyond coastal waters. The OPGGSA provides for the grant of exploration permits, retention leases, production licences, pipeline licences and facilities licences within the areas of the OPGGSA’s jurisdictional operation. Petroleum decommissioning activities are also subject to the OPGGSA. This includes the trailing liability regime, whereby the NOPSEMA and the responsible Commonwealth Minister have the ability to recall any titleholders, former titleholders and their respective related bodies corporate and ‘related persons’ to undertake decommissioning activities on a title or former title area. Trailing liability applies to titles that are currently in force as well as to titles that ceased to be in force on or after 1 January 2021. Within the coastal waters, petroleum operations are covered by the relevant state or Northern Territory legislation that is substantively similar to the OPGGSA, including the Offshore Petroleum and Greenhouse Gas Storage Act 2010 (Vic) in Victoria and the Petroleum and Geothermal Energy Resources Act 1967 (WA) in Western Australia. The Offshore Petroleum and Greenhouse Gas Storage (Resource Management and Administration) Regulations 2011 (Cth) contain resource management provisions, including a requirement for the holder of a production licence to have in place a Field Development Plan approved by the Joint Authority before petroleum production can commence. Many of Woodside’s operations rely on pipeline licences to transport oil and gas from the point of production to processing facilities and relevant markets. As mentioned above, the OPGGSA also provides for the grant of pipeline licences within the areas of the OPGGSA’s jurisdictional operation. Pipelines within the coastal waters of Western Australia are licensed under the Petroleum (Submerged Lands) Act 1982 (WA) and pipelines within the coastal waters of Victoria are licensed under the Offshore Petroleum and Greenhouse Gas Storage Act 2010 (Vic). Onshore pipelines in Western Australia are licensed under the Petroleum Pipelines Act 1969 (WA) and onshore pipelines in Victoria are licensed under the Pipelines Act 2005 (Vic). Woodside is also subject to the following laws, among others: • Various petroleum taxes, including royalties, excise taxes, temporary levies, and the PRRT. In relation to PRRT, in 2024, the Federal Government enacted the Treasury Laws Amendment (Tax Accountability and Fairness) Act 2024 (Cth) which introduced a PRRT deductions cap effective from 1 July 2023. Relevant LNG projects will be subject to the deductions cap seven years after the year of first production or from 1 July 2023, whichever is later. Once the deductions cap applies, the cap limits the use of deductions to offset assessable PRRT income. The Wheatstone and Pluto projects will be subject to this new regime. Related amendments to the PRRT legislation were introduced including the Treasury Laws Amendment (Delivering Better Financial Outcomes and Other Measures) Act 2024, which aligns PRRT anti-avoidance rules with the general anti-avoidance provisions in Part IVA of the Income Tax Assessment Act 1936 (Cth), and the Petroleum Resource Rent Tax Assessment Regulations 2024 (Cth), which accommodate commercial tolling arrangements and enhance the integrity rules. • Australia’s competition laws contained in the Competition and Consumer Act 2010 (Cth), which prohibit, among other things, 2024 ANNUAL REPORT 233
engaging in conduct with the purpose or effect of substantially lessening competition, price fixing, cartel conduct, market sharing, concerted practices or bid rigging. The Act is supplemented by the Competition and Consumer (Gas Market Code) Regulations 2023 (Cth) (Gas Code), which allow for the imposition of gas price controls in the eastern Australian gas market. The price cap may be updated by the Australian Competition and Consumer Commission every two years. The Gas Code also introduces a mandatory code of conduct that establishes minimum conduct and process standards for commercial negotiations for wholesale gas contracts, including good faith obligations and a ‘reasonable pricing’ provision. On 15 January 2024, Woodside was granted a conditional Ministerial exemption pursuant to the Gas Code. The exemption relates to the price rules in Division 2 of Part 4 of the Gas Code. • The Australian Domestic Gas Security Mechanism, established pursuant to the Customs (Prohibited Exports) Regulations 1958 (Cth) and the Customs (Prohibited Exports) (Operation of the Australian Domestic Gas Security Mechanism) Guidelines 2023 (Cth), by which the Australian Government can require LNG projects to prohibit exports or find offsetting sources of gas, to ensure that there are sufficient supplies of natural gas for domestic use. The mechanism is intended to be a measure of last resort where market-based solutions and other regulatory interventions have failed. • Laws protecting the rights and interests of First Nations Australians and their cultural heritage. Since 1992, Australian common law has recognised that, in certain circumstances, First Nations Australians may have rights and interests over land and waters in accordance with their traditional laws and customs. The Native Title Act 1993 (Cth) and complementary state legislation recognise and protect the native title rights and interests of native title holders and registered native title claimants. Multiple pieces of Australian state and federal government legislation protect Aboriginal cultural heritage, rights and access to land in Australia and many of these laws are subject to review and change to ensure a greater level of involvement of First Nations Australians in decisions that may impact cultural heritage and other rights and interests. • The Greater Sunrise Special Regime (GSSR) established pursuant to the Maritime Boundaries Treaty which came into force on 30 August 2019. Woodside holds production sharing contracts and retention leases covering its petroleum interests within the special regime under joint Australian/Timor-Leste administrative control. • The Foreign Acquisitions and Takeovers Act 1975 (Cth), associated regulations and Australia’s Foreign Investment Policy, all of which are intended to encourage foreign investment in Australia that is not contrary to the Australian national interest. As Woodside is a reporting entity of a critical gas asset within the meaning of the Security of Critical Infrastructure Act 2018 (Cth), it is considered a “national security business” under the Foreign Acquisitions and Takeovers Act , meaning that certain investments by foreign investors (including foreign government investors) must be notified to the Australian Government and require prior approval from the Australian Treasurer in accordance with the Act. • There is legislation covering work health and safety in both state and federal jurisdictions, with separate onshore and offshore regulations. These laws aim to protect workers’ health and safety by imposing obligations on all parties who are in a position to contribute to the management of workplace risks, including manufacturers and suppliers of equipment and substances, as well as employers and workers (including employees and contractors). Among other things, Woodside, as operator of both onshore and offshore facilities, is required to develop and comply with a comprehensive “safety case” for each facility that describes the facility and provides details on the hazards and risks associated with the facility, the risk controls and the safety management system that will be used to minimise relevant risks. • State legislation regulates matters such as long service leave and workers’ compensation, as well as anti-discrimination and equal opportunity matters. • The OPGGSA also provides the legislative framework for CCS and carbon capture utilisation and storage (CCUS) projects in offshore areas beyond coastal waters and the grant of assessment permits, holding leases and injection licences. The Western Australian petroleum legislation provides for a substantively similar CCS regulatory regime onshore and in the coastal waters of Western Australia. On 14 May 2024, the Petroleum Legislation Amendment Act 2024 (WA) was enacted to enable the transportation and geological storage of greenhouse gases in Western Australia. United States In the United States, numerous federal agencies regulate specific portions of the industry and Woodside’s US operations. The US Federal Government directly regulates the development of hydrocarbon interests on federal lands, including those in the US Gulf of Mexico and elsewhere in the Outer Continental Shelf.1 Federal leasing activities in recent years have been subject to political scrutiny and motivations, material uncertainties, delays, and legal challenges relating to potential impacts from climate change related to new offshore exploration and production or the adequacy of federal environmental reviews performed in connection with Gulf of Mexico lease auctions.1 Woodside is also subject to the following laws and regulatory agencies, among others. Outer Continental Shelf regulation The Outer Continental Shelf Lands Act governs Woodside’s hydrocarbon activities on federal offshore oil and natural gas leases in the Gulf of Mexico.1 The Act empowers the Department of the Interior, through its agencies the Bureau of Safety and Environmental Enforcement (BSEE), the Bureau of Ocean Energy Management (BOEM) and the Office of Natural Resources Revenue, to administer and create regulations concerning the exploration and development of minerals in the outer continental shelf. Leases, which contain relatively standardised terms, on the outer continental shelf are awarded under authority of the Act through scheduled lease sales by BOEM based on competitive bidding and require compliance with detailed BSEE and BOEM regulations and orders issued pursuant to various federal laws, including the National Environmental Policy Act (NEPA) and the Coastal Zone Management Act. For certain exploration and development activities, 1. On 20 January 2025, President Trump issued an Executive Order renaming the area known as the “Gulf of Mexico” as the “Gulf of America”. The US Interior Department formally announced the change on 24 January 2025 and US federal agencies are currently in the process of implementing the change. In this 2024 Annual Report, Woodside uses the term “Gulf of Mexico” to refer to the area in which its Shenzi, Mad Dog and Atlantis projects are located, as that term was in effect during the period covered by this report. Woodside will adopt the naming conventions required by applicable laws and regulations in relation to US waters. 234 WOODSIDE ENERGY GROUP LTD
lessees are also required to obtain environmental permits from agencies such as the US Environmental Protection Agency (EPA). On 20 January 2025, President Trump issued an executive order directing the White House’s Council on Environmental Quality to issue guidance and propose rescinding existing NEPA regulations to “expedite and simplify the permitting process”. While the impact of this development is unclear at this time, any disruption in our ability to obtain permits could adversely impact our business. Certain activities on the outer continental shelf are also subject to regulation under US Maritime Law by the US Coast Guard. In addition, offshore pipelines, including those located in the Gulf of Mexico, are subject to federal regulation including under the jurisdiction of the Federal Energy Regulatory Commission (FERC) and the Pipeline and Hazardous Materials Safety Administration, under the US Department of Transportation.1 BSEE has also adopted regulations for offshore pipelines under its jurisdiction covering similar matters. Moreover, US operations in the Gulf of Mexico are subject to extensive requirements related to the plugging and abandonment of wells and decommissioning of offshore structures and equipment.1 We may be required to post substantial financial assurance, such as surety bonds, or to otherwise demonstrate financial capability to support these decommissioning obligations. Further, on 15 April 2024, BOEM announced a final rule increasing the amount of supplemental financial assurance required from lessees and grant holders conducting operations on the OCS. As a result of the final rule, BOEM will no longer consider or rely upon the financial strength of predecessors in determining whether, or how much, supplemental financial assurance will be required by current lessees and grant holders. The final rule, which became effective on 29 June 2024, adopts a three-year phased compliance period for full payment of a supplemental financial assurance demand. The final rule was challenged in the US District Court for the Western District of Louisiana by multiple oil and gas industry groups and the States of Mississippi, Louisiana, and Texas. Although implementation of the rule is not currently stayed, the outcome of these challenges remains uncertain. The increased supplemental bonding requirements could generally drive up our operating costs by increasing the amount of security we are required to post and/or, in turn, stress the capacity of the surety bond market to provide sufficient bonds to meet resulting demands from the offshore oil and gas industry. However, Woodside may be exempted from the supplemental financial assurance requirements by meeting an investment grade credit rating for our entity which holds our current Gulf of Mexico assets. A parent company guarantee from an investment grade rated company can also satisfy the supplemental assurance requirements. Environmental regulation The Clean Air Act and comparable state laws and regulations govern emissions of various air pollutants through the issuance of permits and other authorisation requirements. Since 2009, the EPA has been monitoring and regulating greenhouse gas emissions, including carbon dioxide and methane, from certain sources in the oil and gas sector due to their association with climate change. At the international level, the 2015 Paris Agreement requires member states to individually determine and submit non-binding emissions reduction targets every five years beginning in 2020. Although the United States withdrew from the Paris Agreement under the first Trump administration, President Biden recommitted the United States in February 2021, and, in April 2021, established a goal of reducing the United States’ greenhouse gas emissions by 50-52% below 2005 levels by 2030. However, on 20 January 2025, President Trump signed an executive order once again withdrawing the United States from the Paris Agreement and from any other commitments made under the United Nations Framework Convention on Climate Change. Additionally, President Trump revoked any purported financial commitments made by the United States pursuant to the same. The full impact of these recent developments is uncertain at this time. In August 2022, President Biden signed into law the Inflation Reduction Act of 2022, which expanded policy support and incentives for deployment of CCUS, hydrogen and other low-carbon projects, including several enhancements to federal tax credits. The Inflation Reduction Act also established a charge on methane emissions above a certain methane intensity threshold for facilities that report their greenhouse gas emissions under the EPA’s Greenhouse Gas Emissions Reporting Program Part 98 regulations, beginning with methane emissions reported in calendar year 2024. The Inflation Reduction Act and/or its related impact may be impacted by challenges, repeals, revisions or other modifications, by the US Congress or presidential administration, and we cannot predict at this time when or whether any modification will take effect, or the impact of any modification on our business. As adopted, the methane emissions charge could increase our operating costs, which could adversely impact our business, financial condition and cash flows. In December 2023, the EPA published a final rule to reduce methane and other pollution from oil and natural gas operations and facilities. Among other things, the final rule requires the phase-out of routine flaring of natural gas from new oil wells, requires all well sites and compressor stations to be routinely monitored for leaks and provides companies greater flexibility to use innovative and cost effective methane detection technologies. The final rule is currently subject to legal challenges, and the US presidential administration may seek to revise or repeal the rule; however, we cannot predict with certainty what actions the new administration may take or how they might affect our business or results of operations. The exploration, production, and transportation of crude oil and natural gas involves risk that hazardous liquids or flammable gases may be released into the environment and may cause substantial harm to the environment, natural resources, or human health and safety. Such incidents, as well as failure to comply with applicable environmental laws and regulations, may result in material expenditures for response actions, significant government civil or criminal fines and penalties, liability to government agencies for natural resources damages, and significant business interruption. In addition, a spill on or related to our properties and operations could expose us to joint and several and strict liability, without regard to fault. Existing and new laws and regulations could require us to evaluate and upgrade existing infrastructure and operational practices on an accelerated basis or pursue additional capital projects, any or all of which could result in increased operating costs, which in turn could have a material adverse effect on our business, financial condition or results of operations. Laws and regulations are frequently subject to change, and the general trend in the United States has been for these governmental agencies to continue to evaluate and, as necessary, develop and implement new permitting, performance and disclosure requirements, particularly with respect to the environment, greenhouse gas emissions, natural 2024 ANNUAL REPORT 235
resources, and worker health and safety. The recent change in US presidential administration contributes to uncertainty on the future direction of regulatory change. For example, existing climate change-related regulation has already become a focus of the new Trump administration. On his first day in office, President Trump signed several executive orders rescinding many of the previous administration’s climate-related executive orders and associated initiatives. President Trump’s directives included, amongst others, directing the EPA to reconsider its 2009 endangerment findings relating to greenhouse gas emissions, which provides regulatory justification for federal greenhouse gas permitting and methane emission control requirements, and directing the EPA to reconsider its use of Social Cost of Greenhouse Gas estimates in federal permitting decisions. We cannot predict with certainty the impact of, and changes in, government policies, laws and regulations, including any changes or other actions resulting from the change in US presidential administration. Export of LNG The design, construction, operation, maintenance and expansion of our liquefaction facilities and the transportation of LNG are highly regulated activities subject to the jurisdiction of the FERC pursuant to the Natural Gas Act of 1938. On 26 January 2024, President Biden announced a temporary pause on pending decisions on new exports of LNG to countries that the United States does not have free trade agreements with, pending the US Department of Energy’s (“DOE”) review of the underlying analyses for authorisations. On 1 July 2024, the federal court for the Western District of Louisiana ordered that the DOE was enjoined and restrained from halting or pausing the approval process for pending and future applications for LNG exports to non-FTA countries. On December 17, 2024, the DOE released an updated study of US LNG exports with a 60-day comment period that was later extended to March 20, 2025. On 20 January 2025, President Trump issued the Unleashing American Energy executive order directing the DOE Secretary to restart reviews of applications for approvals of LNG export projects as expeditiously as possible, consistent with applicable law. On 21 January 2025, the DOE announced that it was ending the moratorium imposed by the Biden administration on the approvals of LNG export authorisations by the DOE following direction given by President Trump in the Unleashing American Energy executive order. At this time, we cannot predict with certainty what actions the US presidential administration may take, if any at all, with respect to the DOE study. Ammonia in the United States Woodside’s Beaumont New Ammonia (BNA) project in Beaumont, Texas is subject to a number of onshore and offshore regulations from both federal and state US agencies. Both the Federal Clean Air Act and Texas Clean Air Act, and associated federal and state regulations, govern emissions of various air pollutants through the issuance of permits and other authorisation requirements. BNA is subject to the Texas Commission on Environmental Quality (TCEQ) air quality management for the state of Texas. TCEQ issues regulations under authority in the Texas Clean Air Act and BNA will require a permit issued under this framework. Further, the Clean Water Act prohibits discharges of pollutants from a point source into the waters of the United States without a permit. TCEQ manages the pollutant discharge process under authority assumed from the Environmental Protection Agency, BNA will require a wastewater discharge permit under this framework and a construction general permit for certain stormwater discharges. In addition, the Department of the Army, acting through the US Army Corps of Engineers, has authority to permit work and the placement of structures in navigable waters of the US under the Rivers and Harbors Act of 1899. BNA requires a Nationwide Permit under this framework. The Jones Act governs the transportation of goods between US ports by requiring that vessels involved in such trade be US-built, US-owned, and US-crewed. The US Coast Guard and the US Maritime Administration ensure compliance with these regulations to safeguard the US maritime industry and national security. Domestic shipments from BNA must be transported on Jones Act-compliant vessels, which are US-built, US-flagged, US-owned, and crewed by US citizens or permanent residents. The Federal Occupational Safety and Health Administration (OSHA), established pursuant to the Occupational Safety and Health Act of 1970, establishes and enforces workplace safety standards for manufacturing facilities in Texas. OSHA regulations address areas such as hazardous materials handling, machine guarding, personal protective equipment, and emergency preparedness. As Texas does not have its own state-run OSHA plan, workplace safety enforcement is under the jurisdiction of Federal OSHA. For BNA, OSHA’s responsibilities include setting safety standards, conducting inspections, issuing citations for violations, and offering training and outreach programs. Senegal In Senegal, Woodside’s production sharing contract and the prospecting, exploration, exploitation and transportation of hydrocarbons, as well as the tax rules for such activities, are primarily governed by Law no. 98- 05, dated 8 January 1998 (Petroleum Code) and its implementing decree no. 98-810, dated 6 October 1998. The Petroleum Code determines that the Senegalese Ministry of Petroleum and Energy is the competent authority for its implementation and is responsible for authorising activities for oil and gas prospecting, exploration, exploitation and transportation. While a revised Petroleum Code was introduced in 2019, the terms of that legislation state that any production sharing contract PSC issued before the introduction of the 2019 Petroleum Code retains its legal regime, and, as such, the 1998 Petroleum Code continues to apply to Woodside’s contract. There is also other legislation and regulation that applies to Woodside’s activities in Senegal including, without limitation, in respect of the environment and local content requirements. MATERIAL LIMITATIONS Woodside has certain obligations as part of its operations in Western Australia to provide natural gas into the Western Australian domestic market. Please refer to “Government regulations—domestic gas reservation policy” in this section for further information. Woodside is subject to ordinary course production sharing contract limitations in Senegal. Refer to “Government regulations—Senegal” in this section for further information. SUMMARY OF MATERIAL LEGAL PROCEEDINGS Woodside is involved from time to time in legal proceedings and governmental investigations of a character normally incidental to its business, including claims and pending actions against it seeking damages, or clarification or prosecution of legal rights and regulatory inquiries regarding business practices. Insurance or other indemnification protection may offset the financial impact on 236 WOODSIDE ENERGY GROUP LTD

Woodside of a successful claim. Except as set forth below, there are no governmental, legal or arbitral proceedings (including any such proceedings that are pending or threatened and of which Woodside is aware) that may have, or have had during the 12 months prior to the date of this report, a significant effect on Woodside’s financial position or profitability: • In June 2022, the Australian Conservation Foundation Incorporated (ACF) (represented by the Environmental Defenders Office Ltd) commenced Federal Court of Australia proceedings in relation to the environmental assessment of the Scarborough project. The ACF was seeking a final injunction to restrain Woodside from carrying out offshore project activities for the Scarborough project. The action was dismissed by consent on 20 August 2024. 2024 ANNUAL REPORT 237
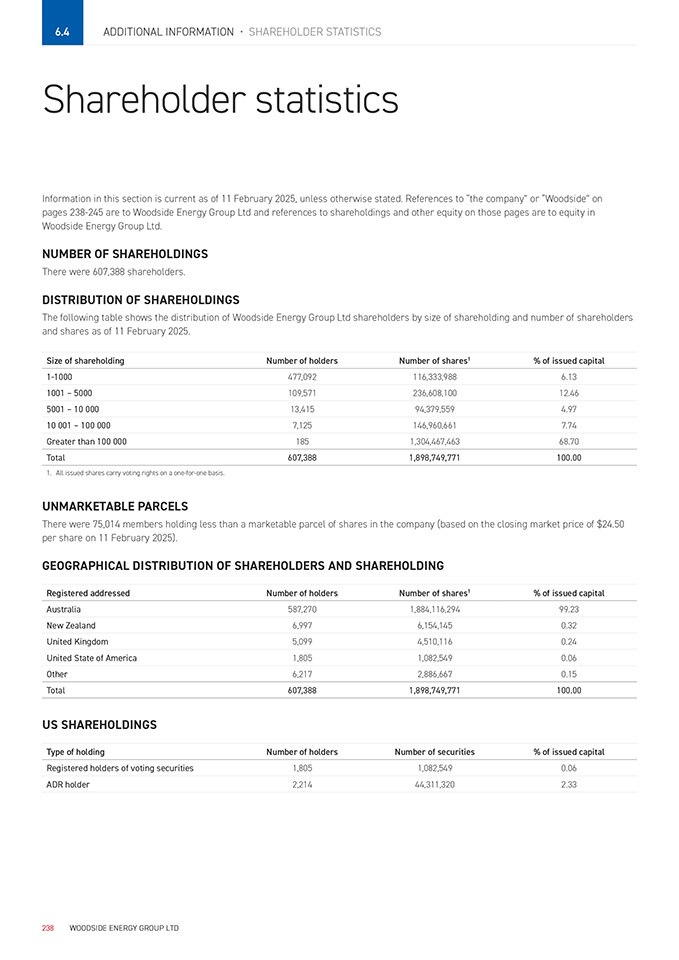
6.4 Additional Information • Shareholder statistics Shareholder statistics Information in this section is current as of 11 February 2025, unless otherwise stated. References to “the company” or “Woodside” on pages 238-245 are to Woodside Energy Group Ltd and references to shareholdings and other equity on those pages are to equity in Woodside Energy Group Ltd. NUMBER OF SHAREHOLDINGS There were 607,388 shareholders. DISTRIBUTION OF SHAREHOLDINGS The following table shows the distribution of Woodside Energy Group Ltd shareholders by size of shareholding and number of shareholders and shares as of 11 February 2025. Size of shareholding Number of holders Number of shares1 % of issued capital 1-1000 477,092 116,333,988 6.13 1001 – 5000 109,571 236,608,100 12.46 5001 – 10 000 13,415 94,379,559 4.97 10 001 – 100 000 7,125 146,960,661 7.74 Greater than 100 000 185 1,304,467,463 68.70 Total 607,388 1,898,749,771 100.00 1. All issued shares carry voting rights on a one-for-one basis. UNMARKETABLE PARCELS There were 75,014 members holding less than a marketable parcel of shares in the company (based on the closing market price of $24.50 per share on 11 February 2025). GEOGRAPHICAL DISTRIBUTION OF SHAREHOLDERS AND SHAREHOLDING Registered addressed Number of holders Number of shares1 % of issued capital Australia 587,270 1,884,116,294 99.23 New Zealand 6,997 6,154,145 0.32 United Kingdom 5,099 4,510,116 0.24 United State of America 1,805 1,082,549 0.06 Other 6,217 2,886,667 0.15 Total 607,388 1,898,749,771 100.00 US SHAREHOLDINGS Type of holding Number of holders Number of securities % of issued capital Registered holders of voting securities 1,805 1,082,549 0.06 ADR holder 2,214 44,311,320 2.33 238 WOODSIDE ENERGY GROUP LTD
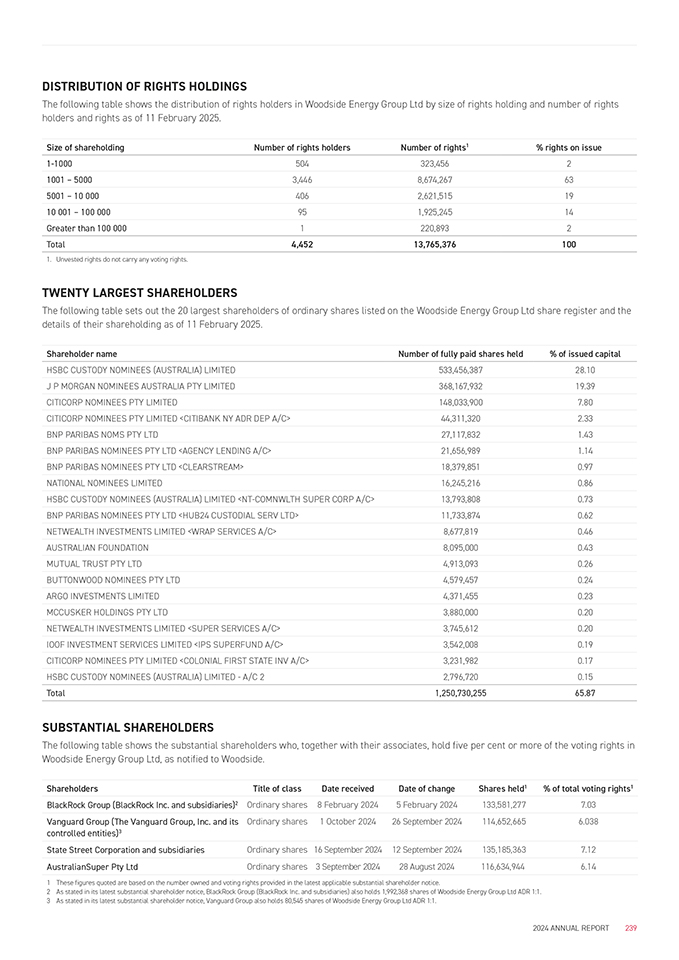
DISTRIBUTION OF RIGHTS HOLDINGS The following table shows the distribution of rights holders in Woodside Energy Group Ltd by size of rights holding and number of rights holders and rights as of 11 February 2025. Size of shareholding Number of rights holders Number of rights1 % rights on issue 1-1000 504 323,456 2 1001 – 5000 3,446 8,674,267 63 5001 – 10 000 406 2,621,515 19 10 001 – 100 000 95 1,925,245 14 Greater than 100 000 1 220,893 2 Total 4,452 13,765,376 100 1. Unvested rights do not carry any voting rights. TWENTY LARGEST SHAREHOLDERS The following table sets out the 20 largest shareholders of ordinary shares listed on the Woodside Energy Group Ltd share register and the details of their shareholding as of 11 February 2025. Shareholder name Number of fully paid shares held % of issued capital HSBC CUSTODY NOMINEES (AUSTRALIA) LIMITED 533,456,387 28.10 J P MORGAN NOMINEES AUSTRALIA PTY LIMITED 368,167,932 19.39 CITICORP NOMINEES PTY LIMITED 148,033,900 7.80 CITICORP NOMINEES PTY LIMITED <CITIBANK NY ADR DEP A/C> 44,311,320 2.33 BNP PARIBAS NOMS PTY LTD 27,117,832 1.43 BNP PARIBAS NOMINEES PTY LTD <AGENCY LENDING A/C> 21,656,989 1.14 BNP PARIBAS NOMINEES PTY LTD <CLEARSTREAM> 18,379,851 0.97 NATIONAL NOMINEES LIMITED 16,245,216 0.86 HSBC CUSTODY NOMINEES (AUSTRALIA) LIMITED <NT-COMNWLTH SUPER CORP A/C> 13,793,808 0.73 BNP PARIBAS NOMINEES PTY LTD <HUB24 CUSTODIAL SERV LTD> 11,733,874 0.62 NETWEALTH INVESTMENTS LIMITED <WRAP SERVICES A/C> 8,677,819 0.46 AUSTRALIAN FOUNDATION 8,095,000 0.43 MUTUAL TRUST PTY LTD 4,913,093 0.26 BUTTONWOOD NOMINEES PTY LTD 4,579,457 0.24 ARGO INVESTMENTS LIMITED 4,371,455 0.23 MCCUSKER HOLDINGS PTY LTD 3,880,000 0.20 NETWEALTH INVESTMENTS LIMITED <SUPER SERVICES A/C> 3,745,612 0.20 IOOF INVESTMENT SERVICES LIMITED <IPS SUPERFUND A/C> 3,542,008 0.19 CITICORP NOMINEES PTY LIMITED <COLONIAL FIRST STATE INV A/C> 3,231,982 0.17 HSBC CUSTODY NOMINEES (AUSTRALIA) LIMITED—A/C 2 2,796,720 0.15 Total 1,250,730,255 65.87 SUBSTANTIAL SHAREHOLDERS The following table shows the substantial shareholders who, together with their associates, hold five per cent or more of the voting rights in Woodside Energy Group Ltd, as notified to Woodside. Shareholders Title of class Date received Date of change Shares held1 % of total voting rights1 BlackRock Group (BlackRock Inc. and subsidiaries)2 Ordinary shares 8 February 2024 5 February 2024 133,581,277 7.03 Vanguard Group (The Vanguard Group, Inc. and its Ordinary shares 1 October 2024 26 September 2024 114,652,665 6.038 controlled entities)3 State Street Corporation and subsidiaries Ordinary shares 16 September 2024 12 September 2024 135,185,363 7.12 AustralianSuper Pty Ltd Ordinary shares 3 September 2024 28 August 2024 116,634,944 6.14 1 These figures quoted are based on the number owned and voting rights provided in the latest applicable substantial shareholder notice. 2 As stated in its latest substantial shareholder notice, BlackRock Group (BlackRock Inc. and subsidiaries) also holds 1,992,368 shares of Woodside Energy Group Ltd ADR 1:1. 3 As stated in its latest substantial shareholder notice, Vanguard Group also holds 80,545 shares of Woodside Energy Group Ltd ADR 1:1. 2024 ANNUAL REPORT 239
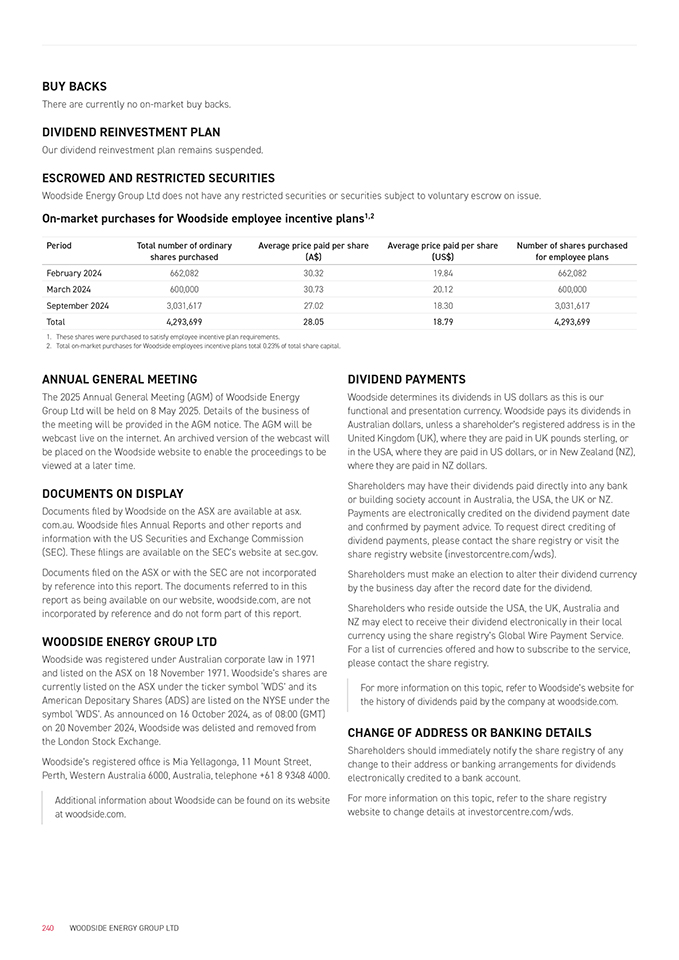
BUY BACKS There are currently no on-market buy backs. DIVIDEND REINVESTMENT PLAN Our dividend reinvestment plan remains suspended. ESCROWED AND RESTRICTED SECURITIES Woodside Energy Group Ltd does not have any restricted securities or securities subject to voluntary escrow on issue. On-market purchases for Woodside employee incentive plans1,2 Period Total number of ordinary Average price paid per share Average price paid per share Number of shares purchased shares purchased (A$) (US$) for employee plans February 2024 662,082 30.32 19.84 662,082 March 2024 600,000 30.73 20.12 600,000 September 2024 3,031,617 27.02 18.30 3,031,617 Total 4,293,699 28.05 18.79 4,293,699 1. These shares were purchased to satisfy employee incentive plan requirements. 2. Total on-market purchases for Woodside employees incentive plans total 0.23% of total share capital. ANNUAL GENERAL MEETING The 2025 Annual General Meeting (AGM) of Woodside Energy Group Ltd will be held on 8 May 2025. Details of the business of the meeting will be provided in the AGM notice. The AGM will be webcast live on the internet. An archived version of the webcast will be placed on the Woodside website to enable the proceedings to be viewed at a later time. DOCUMENTS ON DISPLAY Documents filed by Woodside on the ASX are available at asx. com.au. Woodside files Annual Reports and other reports and information with the US Securities and Exchange Commission (SEC). These filings are available on the SEC’s website at sec.gov. Documents filed on the ASX or with the SEC are not incorporated by reference into this report. The documents referred to in this report as being available on our website, woodside.com, are not incorporated by reference and do not form part of this report. WOODSIDE ENERGY GROUP LTD Woodside was registered under Australian corporate law in 1971 and listed on the ASX on 18 November 1971. Woodside’s shares are currently listed on the ASX under the ticker symbol ‘WDS’ and its American Depositary Shares (ADS) are listed on the NYSE under the symbol ‘WDS’. As announced on 16 October 2024, as of 08:00 (GMT) on 20 November 2024, Woodside was delisted and removed from the London Stock Exchange. Woodside’s registered office is Mia Yellagonga, 11 Mount Street, Perth, Western Australia 6000, Australia, telephone +61 8 9348 4000. Additional information about Woodside can be found on its website at woodside.com. DIVIDEND PAYMENTS Woodside determines its dividends in US dollars as this is our functional and presentation currency. Woodside pays its dividends in Australian dollars, unless a shareholder’s registered address is in the United Kingdom (UK), where they are paid in UK pounds sterling, or in the USA, where they are paid in US dollars, or in New Zealand (NZ), where they are paid in NZ dollars. Shareholders may have their dividends paid directly into any bank or building society account in Australia, the USA, the UK or NZ. Payments are electronically credited on the dividend payment date and confirmed by payment advice. To request direct crediting of dividend payments, please contact the share registry or visit the share registry website (investorcentre.com/wds). Shareholders must make an election to alter their dividend currency by the business day after the record date for the dividend. Shareholders who reside outside the USA, the UK, Australia and NZ may elect to receive their dividend electronically in their local currency using the share registry’s Global Wire Payment Service. For a list of currencies offered and how to subscribe to the service, please contact the share registry. For more information on this topic, refer to Woodside’s website for the history of dividends paid by the company at woodside.com. CHANGE OF ADDRESS OR BANKING DETAILS Shareholders should immediately notify the share registry of any change to their address or banking arrangements for dividends electronically credited to a bank account. For more information on this topic, refer to the share registry website to change details at investorcentre.com/wds. 240 WOODSIDE ENERGY GROUP LTD
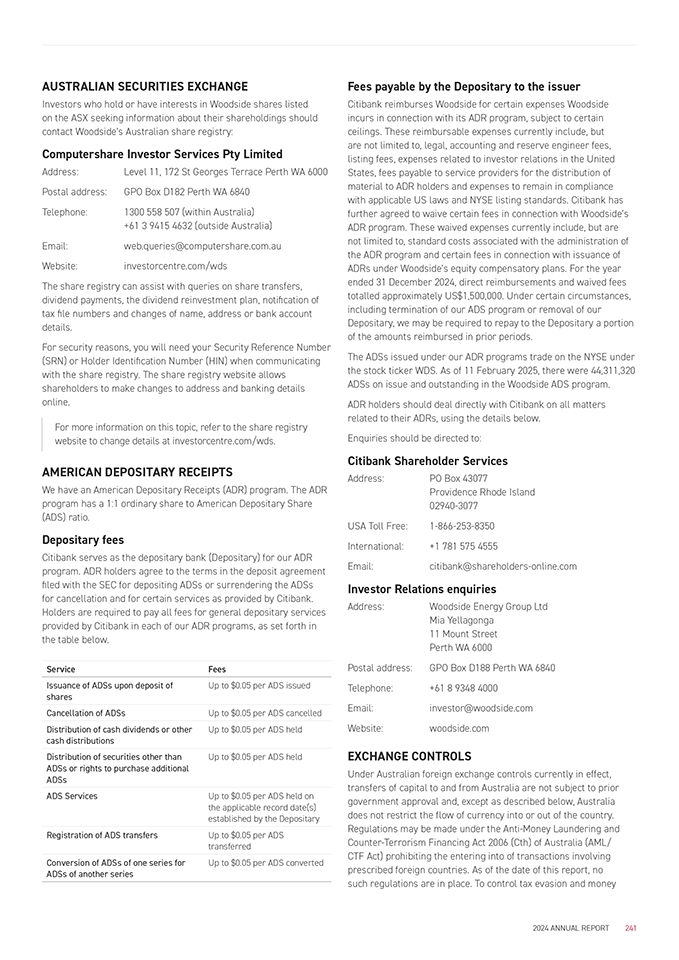
AUSTRALIAN SECURITIES EXCHANGE Investors who hold or have interests in Woodside shares listed on the ASX seeking information about their shareholdings should contact Woodside’s Australian share registry: Computershare Investor Services Pty Limited Address: Level 11, 172 St Georges Terrace Perth WA 6000 Postal address: GPO Box D182 Perth WA 6840 Telephone: 1300 558 507 (within Australia) +61 3 9415 4632 (outside Australia) Email: web.queries@computershare.com.au Website: investorcentre.com/wds The share registry can assist with queries on share transfers, dividend payments, the dividend reinvestment plan, notification of tax file numbers and changes of name, address or bank account details. For security reasons, you will need your Security Reference Number (SRN) or Holder Identification Number (HIN) when communicating with the share registry. The share registry website allows shareholders to make changes to address and banking details online. For more information on this topic, refer to the share registry website to change details at investorcentre.com/wds. AMERICAN DEPOSITARY RECEIPTS We have an American Depositary Receipts (ADR) program. The ADR program has a 1:1 ordinary share to American Depositary Share (ADS) ratio. Depositary fees Citibank serves as the depositary bank (Depositary) for our ADR program. ADR holders agree to the terms in the deposit agreement filed with the SEC for depositing ADSs or surrendering the ADSs for cancellation and for certain services as provided by Citibank. Holders are required to pay all fees for general depositary services provided by Citibank in each of our ADR programs, as set forth in the table below. Service Fees Issuance of ADSs upon deposit of Up to $0.05 per ADS issued shares Cancellation of ADSs Up to $0.05 per ADS cancelled Distribution of cash dividends or other Up to $0.05 per ADS held cash distributions Distribution of securities other than Up to $0.05 per ADS held ADSs or rights to purchase additional ADSs ADS Services Up to $0.05 per ADS held on the applicable record date(s) established by the Depositary Registration of ADS transfers Up to $0.05 per ADS transferred Conversion of ADSs of one series for Up to $0.05 per ADS converted ADSs of another series Fees payable by the Depositary to the issuer Citibank reimburses Woodside for certain expenses Woodside incurs in connection with its ADR program, subject to certain ceilings. These reimbursable expenses currently include, but are not limited to, legal, accounting and reserve engineer fees, listing fees, expenses related to investor relations in the United States, fees payable to service providers for the distribution of material to ADR holders and expenses to remain in compliance with applicable US laws and NYSE listing standards. Citibank has further agreed to waive certain fees in connection with Woodside’s ADR program. These waived expenses currently include, but are not limited to, standard costs associated with the administration of the ADR program and certain fees in connection with issuance of ADRs under Woodside’s equity compensatory plans. For the year ended 31 December 2024, direct reimbursements and waived fees totalled approximately US$1,500,000. Under certain circumstances, including termination of our ADS program or removal of our Depositary, we may be required to repay to the Depositary a portion of the amounts reimbursed in prior periods. The ADSs issued under our ADR programs trade on the NYSE under the stock ticker WDS. As of 11 February 2025, there were 44,311,320 ADSs on issue and outstanding in the Woodside ADS program. ADR holders should deal directly with Citibank on all matters related to their ADRs, using the details below. Enquiries should be directed to: Citibank Shareholder Services Address: PO Box 43077 Providence Rhode Island 02940-3077 USA Toll Free: 1-866-253-8350 International: +1 781 575 4555 Email: citibank@shareholders-online.com Investor Relations enquiries Address: Woodside Energy Group Ltd Mia Yellagonga 11 Mount Street Perth WA 6000 Postal address: GPO Box D188 Perth WA 6840 Telephone: +61 8 9348 4000 Email: investor@woodside.com Website: woodside.com EXCHANGE CONTROLS Under Australian foreign exchange controls currently in effect, transfers of capital to and from Australia are not subject to prior government approval and, except as described below, Australia does not restrict the flow of currency into or out of the country. Regulations may be made under the Anti-Money Laundering and Counter-Terrorism Financing Act 2006 (Cth) of Australia (AML/ CTF Act) prohibiting the entering into of transactions involving prescribed foreign countries. As of the date of this report, no such regulations are in place. To control tax evasion and money 2024 ANNUAL REPORT 241
laundering, the AML/CTF Act also requires certain transactions to be reported to the Australian Transaction Reports and Analysis Centre (AUSTRAC) and prohibits reporting entities from providing certain ‘designated services’ to customers without having complied with certain obligations under the AML/CTF Act (for example ‘know your customer’ checks). In addition, the AML/CTF Act imposes certain obligations on ‘designated service’ providers to report ‘threshold transactions. The Autonomous Sanctions Regulations 2011 (Cth) promulgated under the Autonomous Sanctions Act 2011 (Cth) of Australia, the Charter of the United Nations Act 1945 (Cth) of Australia and other acts and regulations in Australia restrict or prohibit payments, transactions or other dealings with assets having a proscribed connection with certain countries or named individuals or entities subject to financial sanctions or identified with terrorism. The Australian Department of Foreign Affairs and Trade (DFAT) maintains a list of all persons and entities subject to financial sanctions or having a proscribed connection with terrorism which is available to the public at DFAT’s website. There are no specific restrictions regarding the remittance of profits, dividends or capital. TAXATION This section describes the material United States and Australian Federal income tax consequences to a US holder (as defined below) of owning shares or ADSs (together, ‘Woodside Securities’). It applies to you only if you acquire your shares or ADSs and you hold your shares or ADSs as capital assets for tax purposes. This discussion addresses only United States and Australian Federal income taxation and does not discuss all of the tax consequences that may be relevant to you in light of your individual circumstances, including foreign, state or local tax consequences, estate and gift tax consequences, and tax consequences arising under the Medicare contribution tax on net investment income or the alternative minimum tax. This section does not apply to you if you are a member of a special class of holders subject to special rules, including: • a dealer in securities, • a trader in securities that elects to use a mark-to-market method of accounting for securities holdings, • a tax-exempt organisation, • a life insurance company, • a person that actually or constructively owns 10% or more of the combined voting power of our voting stock or of the total value of our stock, • a person that holds shares or ADSs as part of a straddle or a hedging or conversion transaction, • a person that purchases or sells shares or ADSs as part of a wash sale for tax purposes, or • a person whose functional currency is not the US dollar. This section is based on the Internal Revenue Code of 1986, as amended, its legislative history, existing and proposed regulations, published rulings and court decisions, all as currently in effect, as well as on the Convention Between the United States of America and Australia (the ‘Treaty’). These authorities are subject to change, possibly on a retroactive basis. In addition, this section is based in part upon the representations of the Depositary and the assumption that each obligation in the deposit agreement will be performed in accordance with its terms. You are a US holder if you are a beneficial owner of shares or ADSs and you are, for United States Federal income tax purposes: • a citizen or resident of the United States, • a domestic corporation, • an estate whose income is subject to United States Federal income tax regardless of its source, or • a trust if a United States court can exercise primary supervision over the trust’s administration and one or more United States persons are authorised to control all substantial decisions of the trust. If an entity or arrangement that is treated as a partnership for United States Federal income tax purposes holds the shares or ADSs, the United States Federal income tax treatment of a partner will generally depend on the status of the partner and the tax treatment of the partnership. A partner in a partnership holding the shares or ADSs should consult its tax advisor with regard to the United States Federal income tax treatment of an investment in the shares or ADSs. You should consult your own tax advisor regarding the United States Federal, state and local and Australian Federal tax consequences of owning and disposing of shares and ADSs in your particular circumstances. In particular, you should confirm whether you qualify for the benefits of the Treaty and the consequences of failing to do so. In general, and taking into account the earlier assumptions, for United States Federal income tax purposes, if you hold ADRs evidencing ADSs, you will be treated as the owner of the shares represented by those ADRs. Exchanges of shares for ADRs, and ADRs for shares, generally will not be subject to United States Federal income tax. Material United States Federal income tax consequences The tax treatment of your shares or ADSs will depend in part on whether or not we are classified as a passive foreign investment company, or PFIC, for United States Federal income tax purposes. Except as discussed below under ‘PFIC Classification’, this discussion assumes that we are not classified as a PFIC for United States Federal income tax purposes. Taxation of distributions Under the United States Federal income tax laws, the gross amount of any distribution we pay out of our current or accumulated earnings and profits (as determined for United States Federal income tax purposes), other than certain pro-rata distributions of our shares, will be treated as a dividend that is subject to United States Federal income taxation. If you are a non-corporate US holder, dividends that constitute qualified dividend income will be taxable to you at the preferential rates applicable to long-term capital gains provided that you hold the shares or ADSs for more than 60 days during the 121-day period beginning 60 days before the ex-dividend date and meet other holding period requirements. Dividends we pay with respect to the shares or ADSs generally will be qualified dividend income provided that, in the year that you receive the dividend, we are eligible for the benefits of the Treaty. We believe that we are currently eligible for the benefits of the Treaty, and we therefore expect that dividends on the shares and ADS will be qualified dividend income, but there can be no 242 WOODSIDE ENERGY GROUP LTD
assurance that we will continue to be eligible for the benefits of the Treaty. You must include any Australian tax withheld from the dividend payment in this gross amount even though you do not in fact receive it. The dividend is taxable to you when you, in the case of shares, or the Depositary, in the case of ADSs, receive the dividend, actually or constructively. The dividend will not be eligible for the dividends-received deduction generally allowed to United States corporations in respect of dividends received from other United States corporations. The amount of the dividend distribution that you must include in your income will be the US dollar value of the Australian dollar payments made, determined at the spot Australian dollar/US dollar rate on the date the dividend is distributed, regardless of whether the payment is in fact converted into US dollars. Generally, any gain or loss resulting from currency exchange fluctuations during the period from the date the dividend is distributed to the date you convert the payment into US dollars will be treated as ordinary income or loss and will not be eligible for the special tax rate applicable to qualified dividend income. The gain or loss generally will be income or loss from sources within the United States for foreign tax credit limitation purposes. Distributions in excess of current and accumulated earnings and profits, as determined for United States Federal income tax purposes, will be treated as a non- taxable return of capital to the extent of your basis in the shares or ADSs and thereafter as capital gain. However, we do not expect to calculate earnings and profits in accordance with United States Federal income tax principles. Accordingly, you should expect to generally treat distributions we make as dividends. Subject to certain limitations, the Australian tax withheld in accordance with the Treaty and paid over to Australia will generally be creditable against your United States Federal income tax liability. To the extent a reduction or refund of the tax withheld is available to you under Australian law or under the Treaty, the amount of tax withheld that could have been reduced or that is refundable will not be eligible for credit against your United States Federal income tax liability. Dividends will generally be income from sources outside the United States and will generally be ‘passive’ income for purposes of computing the foreign tax credit allowable to you. Taxation of capital gains If you are a US holder and you sell or otherwise dispose of your shares or ADSs, you will recognise capital gain or loss for United States Federal income tax purposes equal to the difference between the US dollar value of the amount that you realise and your tax basis, determined in US dollars, in your shares or ADSs. Your tax basis would generally equal the cost of your shares or ADSs, or if you received the shares or ADSs pursuant to a taxable distribution, the fair market value of the shares or ADSs at the time of such distribution, reduced by any distributions on the shares or ADSs that were treated as a return of capital for United States Federal income tax purposes. Capital gain of a non- corporate US holder is generally taxed at preferential rates where the property is held for more than one year. The gain or loss will generally be income or loss from sources within the United States for foreign tax credit limitation purposes. Your ability to deduct capital losses is subject to limitations. PFIC classification We believe that we should not be currently classified as a PFIC for United States Federal income tax purposes and we do not expect to become a PFIC in the foreseeable future. However, this conclusion is a factual determination that is made annually and thus may be subject to change. It is therefore possible that we could become a PFIC in a future taxable year. In general, we will be a PFIC in a taxable year if: • at least 75% of our gross income for the taxable year is passive income; or • at least 50% of the value, determined on the basis of a quarterly average, of our assets in such taxable year is attributable to assets that produce or are held for the production of passive income. If we were to be treated as a PFIC and you are a US holder, gain realised on the sale or other disposition of your shares or ADSs would in general not be treated as capital gain. Instead, you would generally be treated as if you had realised such gain and certain ‘excess distributions’ ratably over your holding period for the shares or ADSs and would be taxed at the highest tax rate in effect for each previous year to which the gain was allocated in which we were a PFIC with respect to you, together with an interest charge in respect of the tax attributable to each such year. With certain exceptions, your shares or ADSs will be treated as stock in a PFIC if we were a PFIC at any time during your holding period in your shares or ADSs. Dividends that you receive from us will not be eligible for the special tax rates applicable to qualified dividend income if we are a PFIC or are treated as a PFIC with respect to you either in the taxable year of the distribution or the preceding taxable year, but instead will be taxable at rates applicable to ordinary income. If you own shares or ADSs during any year that we are a PFIC with respect to you, you may be required to file Internal Revenue Service (‘IRS’) Form 8621. Material Australian tax considerations This section is based on the Income Tax Assessment Act 1936 (Cth) and the Income Tax Assessment Act 1997 (Cth), as amended, its legislative history, existing and proposed regulations, published rulings and court decisions, all as currently in effect, as well as on the Convention Between the United States of America and Australia (the ‘Treaty’). These authorities are subject to change, possibly on a retroactive basis. Dividends (including other distributions treated as dividends for Australian tax purposes) paid by Woodside to a US holder that is not an Australian resident for Australian tax purposes will generally not be subject to Australian withholding tax if they are fully franked (broadly, where a dividend is franked, tax paid by Woodside is imputed to the shareholders). Dividends paid to such US holders, which are not fully franked, will generally be subject to Australian withholding tax not exceeding 15% only to the extent (if any) that the dividend is neither: • franked; nor • declared by Woodside to be conduit foreign income. (Broadly, this means that the relevant part of the dividend is declared to have been paid out of foreign source amounts received by Woodside that are not subject to tax in Australia, such as dividends remitted to Australia by foreign subsidiaries). 2024 ANNUAL REPORT 243
The Australian withholding tax outcome described above applies to US holders who are eligible for benefits under the Tax Convention between Australia and the US as to the Avoidance of Double Taxation (the Australian Tax Treaty). Otherwise, the rate of Australian withholding tax may be 30%. In contrast, dividends (including other distributions treated as dividends for Australian tax purposes) paid by Woodside to a US holder may instead by taxed by assessment in Australia if the US holder: • is an Australian resident for Australian tax purposes (although tax will generally not exceed 15% where the US holder is eligible for benefits under the Australian Tax Treaty as a treaty resident of the US and any franking credits may be creditable against their Australian income tax liability); or • carries on business in Australia through a permanent establishment as defined in the Australian Tax Treaty, or performs personal services from a fixed base in Australia, and the shareholding in respect of which the dividend is paid is effectively connected with that permanent establishment or fixed base, (however, in such a case any franking credits may be creditable against the Australian income tax liability). The treatment of dividends outlined above may be modified where the shareholding in Woodside is held through a trust, limited partnership, limited liability company, pension fund, sovereign wealth fund or other investment vehicle. Affected US holders should seek their own advice in relation to such arrangements. Material Australian tax considerations – disposals of Woodside Securities Gains made by US holders on the sale of Woodside Securities will generally not be taxed in Australia. However, the precise Australian tax treatment of gains made by US holders on the sale of Woodside Securities generally depends on whether or not the gain is an Australian sourced gain of an income nature for Australian income tax purposes. Where the gain is of an income nature, a US holder will generally only be liable to Australian income tax on an assessment basis (whether or not they are also an Australian resident for Australian tax purposes) if: • they are not eligible for benefits under the Australian Tax Treaty and the gain is sourced in Australia for Australian tax purposes; or • they are eligible for benefits under the Australian Tax Treaty, but the gain constitutes any of the following (in which case the gain will be deemed to have an Australian source): › Business profits of an enterprise attributable to a permanent establishment situated in Australia through which the enterprise carries on business in Australia; or › Income or gains from the alienation of property that form part of the business property of a permanent establishment of an enterprise that the US holder has in Australia or pertain to a fixed base available to the US holder in Australia for the purpose of performing independent personal services; or › Income derived from the disposition of shares in a company, the assets of which consist wholly or principally of real property (which includes rights to exploit or to explore for nature resources) situated in Australia, whether such assets are held directly or indirectly through one or more interposed entities. Where the gain is not taxed as Australian sourced income, the US holder will generally only be liable to Australian capital gains tax on an assessment basis if they acquired (or are deemed to have acquired) their Woodside Securities after 19 September 1985 and one or more of the following applies: • the US holder is an Australian resident for Australian tax purposes; or • the Woodside Securities have been used by the US holder in carrying on a business through permanent establishment in Australia; or • the Woodside Securities constitute an ‘indirect Australian real properly interest’ for Australian CGT purposes – this will generally be the case if the US holder (either alone or together with associates) directly or indirectly owns or owned 10% or more of the issued share capital of Woodside at the time of disposal or throughout a 12-month period during the two years prior to the time of disposal and, at the time of the disposal, the sum of market values of Woodside’s assets (held directly or through interposed entities) that are not taxable Australian real property at that time (which, for these purposes includes mining, quarrying or prospecting rights in respect of minerals, petroleum or quarry materials situated in Australia); or • the US holder is an individual who is not eligible for benefits under the Australian Tax Treaty as a treaty resident of the US and elected on becoming a non-resident of Australia to continue to have the Woodside Securities subject to Australian capital gains tax. In certain circumstances, if the Woodside Securities constitute an ‘indirect Australian real property interest’ for Australian CGT purposes, the purchaser may be required to withhold under the non-resident CGT withholding regime an amount equal to 15% of the purchase price in situations including where the acquisition is undertaken by way of an off-market transfer. It has been announced this withholding rate will be increased to 15% in respect of sale contracts entered into on or after 1 January 2025. Affected US holders should seek their own advice in relation to how this withholding regime may apply to them. The comments above on the sale of Woodside Securities do not apply: • to temporary residents of Australia who should seek advice that is specific to their circumstances; or • if the Investment Management Regime (IMR) applies to the US holder, which exempts from the Australian income tax and capital gains tax gains made on disposal by certain categories of non-resident funds – called IMR entities – of (relevantly) portfolio interests in Australian public companies (subject to a number of conditions). The IMR exemptions broadly apply to widely held IMR entities in relation to their direct investments and indirect investments made through an independent Australian fund manager. The exemptions apply to gains made by IMR entities that are treated as companies for Australian tax purposes as well as gains made by non-resident investors in IMR entities that are treated as trusts and partnerships for Australian tax purposes. THE FOREGOING DISCUSSION IS NOT TAX ADVICE OR A COMPREHENSIVE DISCUSSION OF ALL US AND AUSTRALIAN FEDERAL INCOME TAX CONSEQUENCES TO US HOLDERS OF WOODSIDE SECURITIES. SUCH HOLDERS SHOULD CONSULT WITH, AND RELY SOLELY UPON, THEIR OWN TAX ADVISERS TO DETERMINE THE SPECIFIC TAX CONSEQUENCES TO THEM OF THE OWNERSHIP AND DISPOSITION OF WOODSIDE SECURITIES, INCLUDING THE EFFECT OF ANY US FEDERAL, STATE, LOCAL, NON-US, OR OTHER TAX LAWS. 244 WOODSIDE ENERGY GROUP LTD
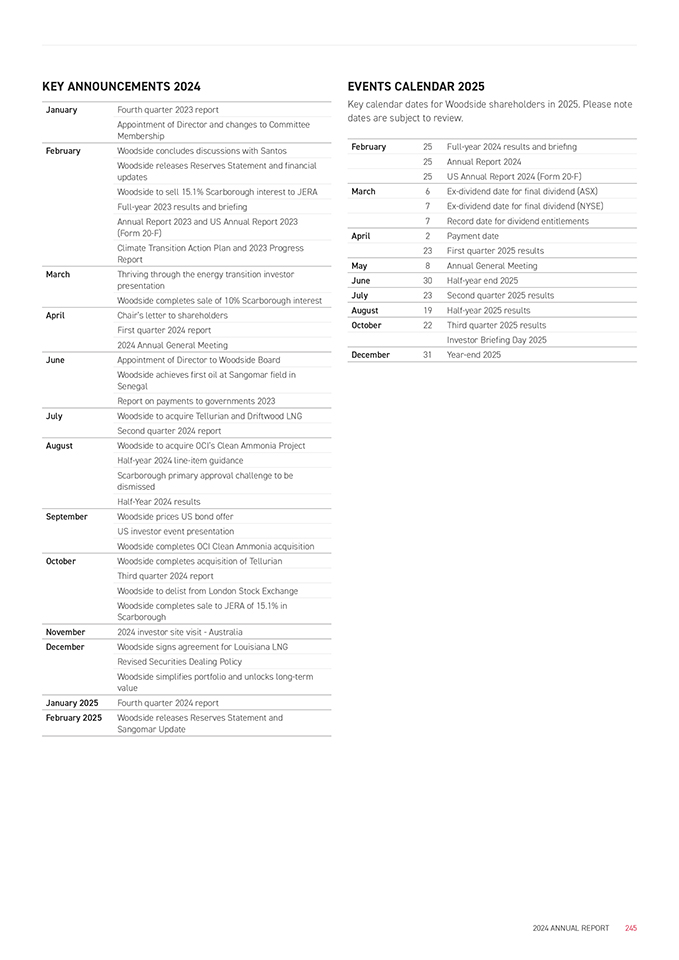
KEY ANNOUNCEMENTS 2024 January Fourth quarter 2023 report Appointment of Director and changes to Committee Membership February Woodside concludes discussions with Santos Woodside releases Reserves Statement and financial updates Woodside to sell 15.1% Scarborough interest to JERA Full-year 2023 results and briefing Annual Report 2023 and US Annual Report 2023 (Form 20-F) Climate Transition Action Plan and 2023 Progress Report March Thriving through the energy transition investor presentation Woodside completes sale of 10% Scarborough interest April Chair’s letter to shareholders First quarter 2024 report 2024 Annual General Meeting June Appointment of Director to Woodside Board Woodside achieves first oil at Sangomar field in Senegal Report on payments to governments 2023 July Woodside to acquire Tellurian and Driftwood LNG Second quarter 2024 report August Woodside to acquire OCI’s Clean Ammonia Project Half-year 2024 line-item guidance Scarborough primary approval challenge to be dismissed Half-Year 2024 results September Woodside prices US bond offer US investor event presentation Woodside completes OCI Clean Ammonia acquisition October Woodside completes acquisition of Tellurian Third quarter 2024 report Woodside to delist from London Stock Exchange Woodside completes sale to JERA of 15.1% in Scarborough November 2024 investor site visit—Australia December Woodside signs agreement for Louisiana LNG Revised Securities Dealing Policy Woodside simplifies portfolio and unlocks long-term value January 2025 Fourth quarter 2024 report February 2025 Woodside releases Reserves Statement and Sangomar Update EVENTS CALENDAR 2025 Key calendar dates for Woodside shareholders in 2025. Please note dates are subject to review. February 25 Full-year 2024 results and briefing 25 Annual Report 2024 25 US Annual Report 2024 (Form 20-F) March 6 Ex-dividend date for final dividend (ASX) 7 Ex-dividend date for final dividend (NYSE) 7 Record date for dividend entitlements April 2 Payment date 23 First quarter 2025 results May 8 Annual General Meeting June 30 Half-year end 2025 July 23 Second quarter 2025 results August 19 Half-year 2025 results October 22 Third quarter 2025 results Investor Briefing Day 2025 December 31 Year-end 2025 2024 ANNUAL REPORT 245
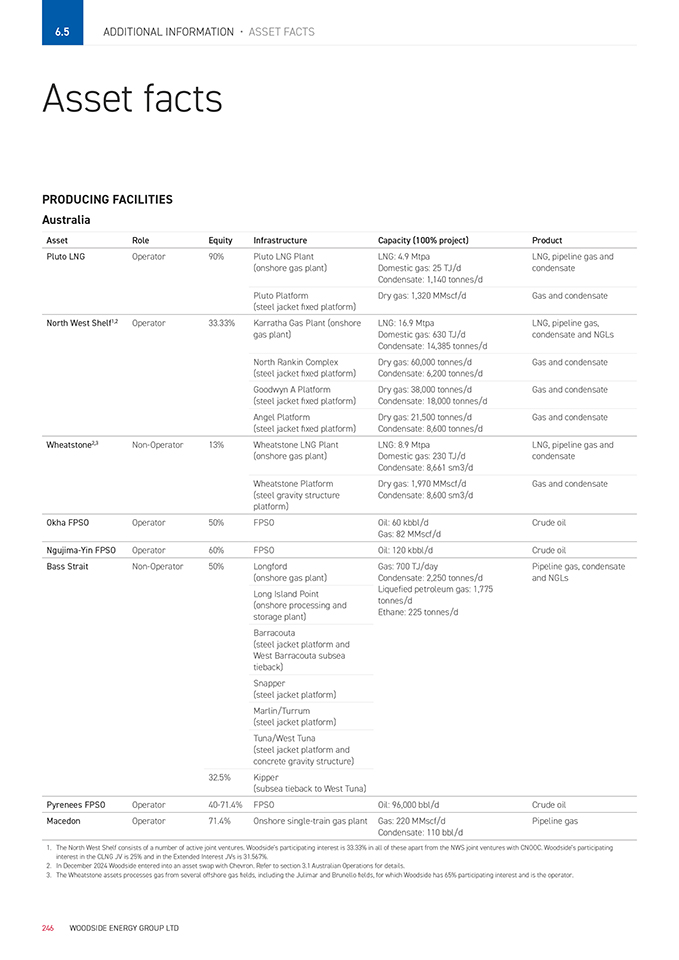
6.5 Additional Information • Asset facts Asset facts PRODUCING FACILITIES Australia Asset Role Equity Infrastructure Capacity (100% project) Product Pluto LNG Operator 90% Pluto LNG Plant LNG: 4.9 Mtpa LNG, pipeline gas and (onshore gas plant) Domestic gas: 25 TJ/d condensate Condensate: 1,140 tonnes/d Pluto Platform Dry gas: 1,320 MMscf/d Gas and condensate (steel jacket fixed platform) North West Shelf1,2 Operator 33.33% Karratha Gas Plant (onshore LNG: 16.9 Mtpa LNG, pipeline gas, gas plant) Domestic gas: 630 TJ/d condensate and NGLs Condensate: 14,385 tonnes/d North Rankin Complex Dry gas: 60,000 tonnes/d Gas and condensate (steel jacket fixed platform) Condensate: 6,200 tonnes/d Goodwyn A Platform Dry gas: 38,000 tonnes/d Gas and condensate (steel jacket fixed platform) Condensate: 18,000 tonnes/d Angel Platform Dry gas: 21,500 tonnes/d Gas and condensate (steel jacket fixed platform) Condensate: 8,600 tonnes/d Wheatstone2,3 Non-Operator 13% Wheatstone LNG Plant LNG: 8.9 Mtpa LNG, pipeline gas and (onshore gas plant) Domestic gas: 230 TJ/d condensate Condensate: 8,661 sm3/d Wheatstone Platform Dry gas: 1,970 MMscf/d Gas and condensate (steel gravity structure Condensate: 8,600 sm3/d platform) Okha FPSO Operator 50% FPSO Oil: 60 kbbl/d Crude oil Gas: 82 MMscf/d Ngujima-Yin FPSO Operator 60% FPSO Oil: 120 kbbl/d Crude oil Bass Strait Non-Operator 50% Longford Gas: 700 TJ/day Pipeline gas, condensate (onshore gas plant) Condensate: 2,250 tonnes/d and NGLs Liquefied petroleum gas: 1,775 Long Island Point tonnes/d (onshore processing and Ethane: 225 tonnes/d storage plant) Barracouta (steel jacket platform and West Barracouta subsea tieback) Snapper (steel jacket platform) Marlin/Turrum (steel jacket platform) Tuna/West Tuna (steel jacket platform and concrete gravity structure) 32.5% Kipper (subsea tieback to West Tuna) Pyrenees FPSO Operator 40-71.4% FPSO Oil: 96,000 bbl/d Crude oil Macedon Operator 71.4% Onshore single-train gas plant Gas: 220 MMscf/d Pipeline gas Condensate: 110 bbl/d 1. The North West Shelf consists of a number of active joint ventures. Woodside’s participating interest is 33.33% in all of these apart from the NWS joint ventures with CNOOC. Woodside’s participating interest in the CLNG JV is 25% and in the Extended Interest JVs is 31.567%. 2. In December 2024 Woodside entered into an asset swap with Chevron. Refer to section 3.1 Australian Operations for details. 3. The Wheatstone assets processes gas from several offshore gas fields, including the Julimar and Brunello fields, for which Woodside has 65% participating interest and is the operator. 246 WOODSIDE ENERGY GROUP LTD
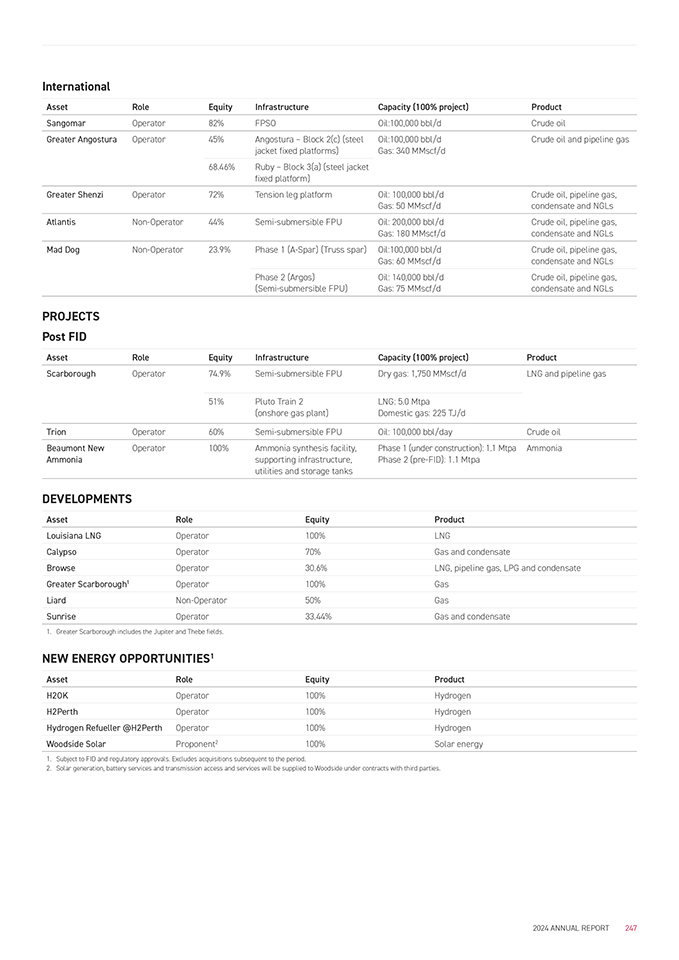
International Asset Role Equity Infrastructure Capacity (100% project) Product Sangomar Operator 82% FPSO Oil:100,000 bbl/d Crude oil Greater Angostura Operator 45% Angostura – Block 2(c) (steel Oil:100,000 bbl/d Crude oil and pipeline gas jacket fixed platforms) Gas: 340 MMscf/d 68.46% Ruby – Block 3(a) (steel jacket fixed platform) Greater Shenzi Operator 72% Tension leg platform Oil: 100,000 bbl/d Crude oil, pipeline gas, Gas: 50 MMscf/d condensate and NGLs Atlantis Non-Operator 44% Semi-submersible FPU Oil: 200,000 bbl/d Crude oil, pipeline gas, Gas: 180 MMscf/d condensate and NGLs Mad Dog Non-Operator 23.9% Phase 1 (A-Spar) (Truss spar) Oil:100,000 bbl/d Crude oil, pipeline gas, Gas: 60 MMscf/d condensate and NGLs Phase 2 (Argos) Oil: 140,000 bbl/d Crude oil, pipeline gas, (Semi-submersible FPU) Gas: 75 MMscf/d condensate and NGLs PROJECTS Post FID Asset Role Equity Infrastructure Capacity (100% project) Product Scarborough Operator 74.9% Semi-submersible FPU Dry gas: 1,750 MMscf/d LNG and pipeline gas 51% Pluto Train 2 LNG: 5.0 Mtpa (onshore gas plant) Domestic gas: 225 TJ/d Trion Operator 60% Semi-submersible FPU Oil: 100,000 bbl/day Crude oil Beaumont New Operator 100% Ammonia synthesis facility, Phase 1 (under construction): 1.1 Mtpa Ammonia Ammonia supporting infrastructure, Phase 2 (pre-FID): 1.1 Mtpa utilities and storage tanks DEVELOPMENTS Asset Role Equity Product Louisiana LNG Operator 100% LNG Calypso Operator 70% Gas and condensate Browse Operator 30.6% LNG, pipeline gas, LPG and condensate Greater Scarborough1 Operator 100% Gas Liard Non-Operator 50% Gas Sunrise Operator 33.44% Gas and condensate 1. Greater Scarborough includes the Jupiter and Thebe fields. NEW ENERGY OPPORTUNITIES1 Asset Role Equity Product H2OK Operator 100% Hydrogen H2Perth Operator 100% Hydrogen Hydrogen Refueller @H2Perth Operator 100% Hydrogen Woodside Solar Proponent2 100% Solar energy 1. Subject to FID and regulatory approvals. Excludes acquisitions subsequent to the period. 2. Solar generation, battery services and transmission access and services will be supplied to Woodside under contracts with third parties. 2024 ANNUAL REPORT 247
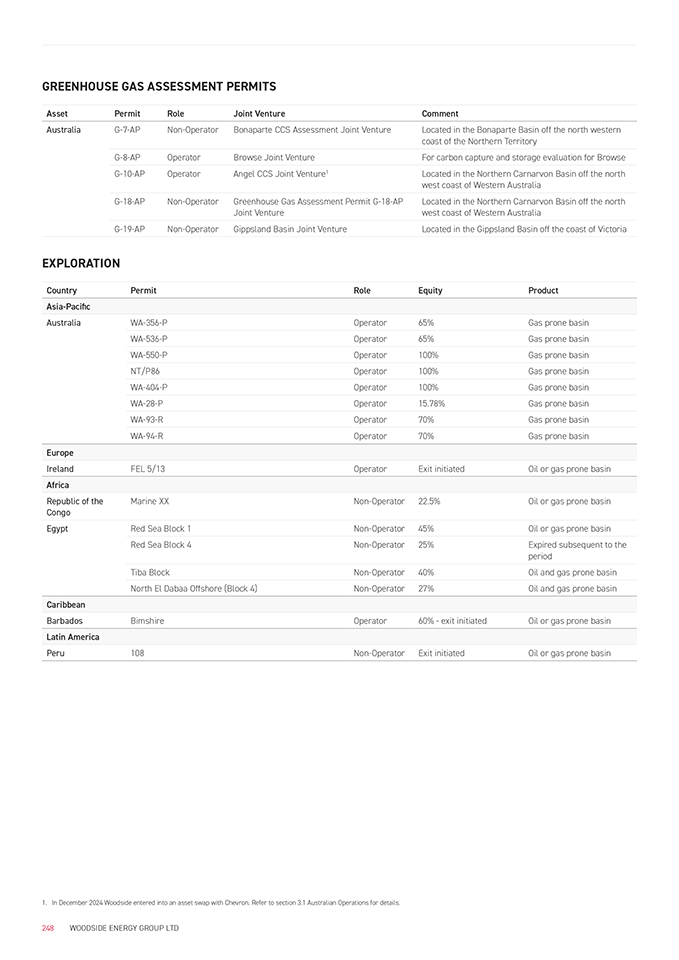
GREENHOUSE GAS ASSESSMENT PERMITS Asset Permit Role Joint Venture Comment Australia G-7-AP Non-Operator Bonaparte CCS Assessment Joint Venture Located in the Bonaparte Basin off the north western coast of the Northern Territory G-8-AP Operator Browse Joint Venture For carbon capture and storage evaluation for Browse G-10-AP Operator Angel CCS Joint Venture1 Located in the Northern Carnarvon Basin off the north west coast of Western Australia G-18-AP Non-Operator Greenhouse Gas Assessment Permit G-18-AP Located in the Northern Carnarvon Basin off the north Joint Venture west coast of Western Australia G-19-AP Non-Operator Gippsland Basin Joint Venture Located in the Gippsland Basin off the coast of Victoria EXPLORATION Country Permit Role Equity Product Asia-Pacific Australia WA-356-P Operator 65% Gas prone basin WA-536-P Operator 65% Gas prone basin WA-550-P Operator 100% Gas prone basin NT/P86 Operator 100% Gas prone basin WA-404-P Operator 100% Gas prone basin WA-28-P Operator 15.78% Gas prone basin WA-93-R Operator 70% Gas prone basin WA-94-R Operator 70% Gas prone basin Europe Ireland FEL 5/13 Operator Exit initiated Oil or gas prone basin Africa Republic of the Marine XX Non-Operator 22.5% Oil or gas prone basin Congo Egypt Red Sea Block 1 Non-Operator 45% Oil or gas prone basin Red Sea Block 4 Non-Operator 25% Expired subsequent to the period Tiba Block Non-Operator 40% Oil and gas prone basin North El Dabaa Offshore (Block 4) Non-Operator 27% Oil and gas prone basin Caribbean Barbados Bimshire Operator 60%—exit initiated Oil or gas prone basin Latin America Peru 108 Non-Operator Exit initiated Oil or gas prone basin 1. In December 2024 Woodside entered into an asset swap with Chevron. Refer to section 3.1 Australian Operations for details. 248 WOODSIDE ENERGY GROUP LTD
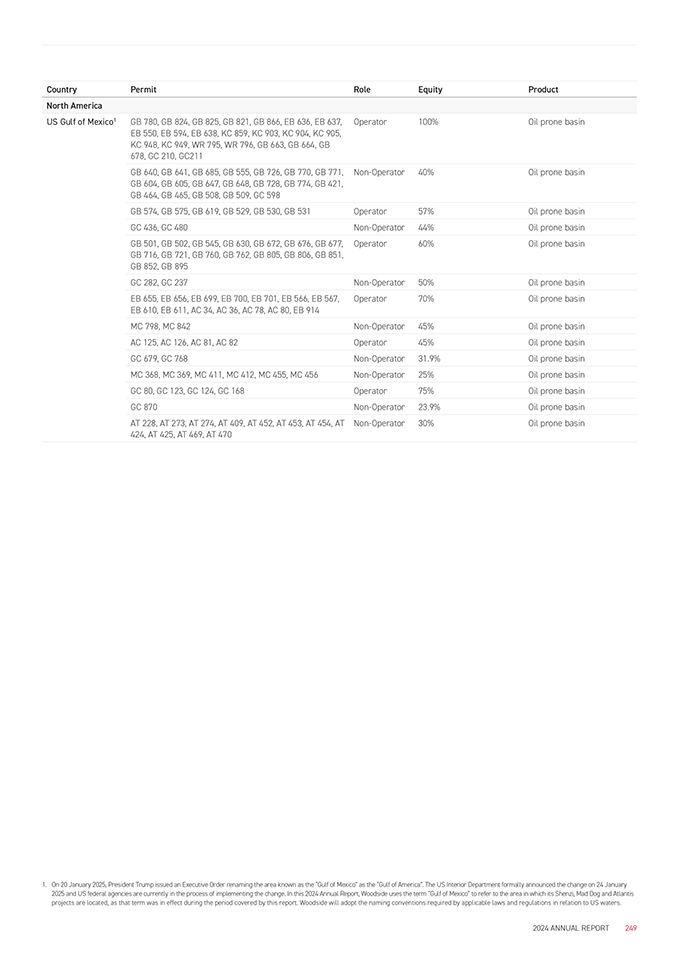
Country Permit Role Equity Product North America US Gulf of Mexico1 GB 780, GB 824, GB 825, GB 821, GB 866, EB 636, EB 637, Operator 100% Oil prone basin EB 550, EB 594, EB 638, KC 859, KC 903, KC 904, KC 905, KC 948, KC 949, WR 795, WR 796, GB 663, GB 664, GB 678, GC 210, GC211 GB 640, GB 641, GB 685, GB 555, GB 726, GB 770, GB 771, Non-Operator 40% Oil prone basin GB 604, GB 605, GB 647, GB 648, GB 728, GB 774, GB 421, GB 464, GB 465, GB 508, GB 509, GC 598 GB 574, GB 575, GB 619, GB 529, GB 530, GB 531 Operator 57% Oil prone basin GC 436, GC 480 Non-Operator 44% Oil prone basin GB 501, GB 502, GB 545, GB 630, GB 672, GB 676, GB 677, Operator 60% Oil prone basin GB 716, GB 721, GB 760, GB 762, GB 805, GB 806, GB 851, GB 852, GB 895 GC 282, GC 237 Non-Operator 50% Oil prone basin EB 655, EB 656, EB 699, EB 700, EB 701, EB 566, EB 567, Operator 70% Oil prone basin EB 610, EB 611, AC 34, AC 36, AC 78, AC 80, EB 914 MC 798, MC 842 Non-Operator 45% Oil prone basin AC 125, AC 126, AC 81, AC 82 Operator 45% Oil prone basin GC 679, GC 768 Non-Operator 31.9% Oil prone basin MC 368, MC 369, MC 411, MC 412, MC 455, MC 456 Non-Operator 25% Oil prone basin GC 80, GC 123, GC 124, GC 168 Operator 75% Oil prone basin GC 870 Non-Operator 23.9% Oil prone basin AT 228, AT 273, AT 274, AT 409, AT 452, AT 453, AT 454, AT Non-Operator 30% Oil prone basin 424, AT 425, AT 469, AT 470 1. On 20 January 2025, President Trump issued an Executive Order renaming the area known as the “Gulf of Mexico” as the “Gulf of America”. The US Interior Department formally announced the change on 24 January 2025 and US federal agencies are currently in the process of implementing the change. In this 2024 Annual Report, Woodside uses the term “Gulf of Mexico” to refer to the area in which its Shenzi, Mad Dog and Atlantis projects are located, as that term was in effect during the period covered by this report. Woodside will adopt the naming conventions required by applicable laws and regulations in relation to US waters. 2024 ANNUAL REPORT 249
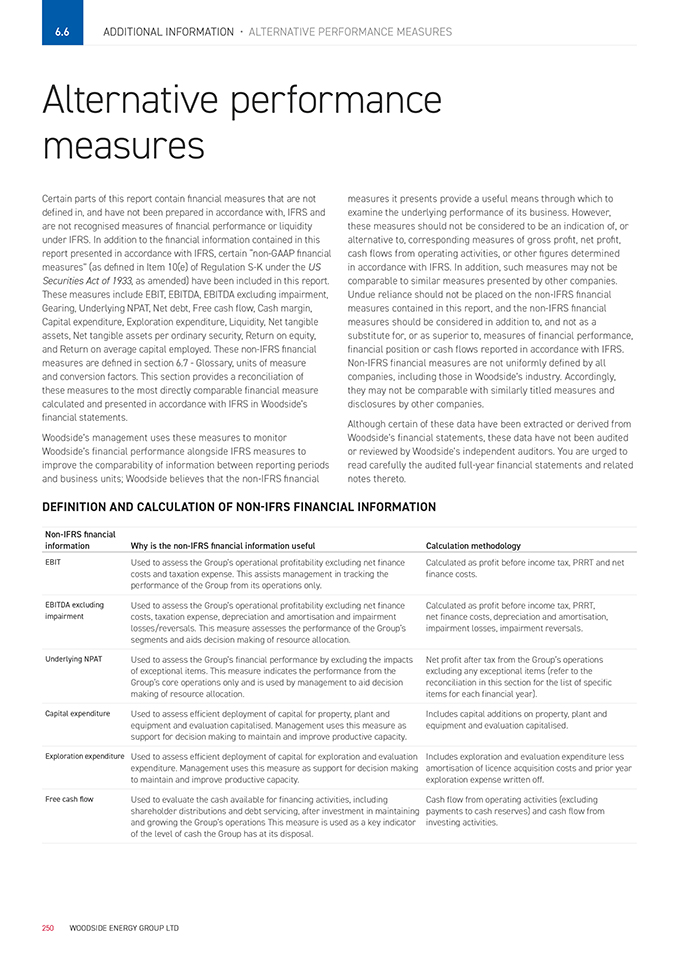
6.6 Additional Information • Alternative performance measures Alternative performance measures Certain parts of this report contain financial measures that are not defined in, and have not been prepared in accordance with, IFRS and are not recognised measures of financial performance or liquidity under IFRS. In addition to the financial information contained in this report presented in accordance with IFRS, certain “non-GAAP financial measures” (as defined in Item 10(e) of Regulation S-K under the US Securities Act of 1933, as amended) have been included in this report. These measures include EBIT, EBITDA, EBITDA excluding impairment, Gearing, Underlying NPAT, Net debt, Free cash flow, Cash margin, Capital expenditure, Exploration expenditure, Liquidity, Net tangible assets, Net tangible assets per ordinary security, Return on equity, and Return on average capital employed. These non-IFRS financial measures are defined in section 6.7—Glossary, units of measure and conversion factors. This section provides a reconciliation of these measures to the most directly comparable financial measure calculated and presented in accordance with IFRS in Woodside’s financial statements. Woodside’s management uses these measures to monitor Woodside’s financial performance alongside IFRS measures to improve the comparability of information between reporting periods and business units; Woodside believes that the non-IFRS financial measures it presents provide a useful means through which to examine the underlying performance of its business. However, these measures should not be considered to be an indication of, or alternative to, corresponding measures of gross profit, net profit, cash flows from operating activities, or other figures determined in accordance with IFRS. In addition, such measures may not be comparable to similar measures presented by other companies. Undue reliance should not be placed on the non-IFRS financial measures contained in this report, and the non-IFRS financial measures should be considered in addition to, and not as a substitute for, or as superior to, measures of financial performance, financial position or cash flows reported in accordance with IFRS. Non-IFRS financial measures are not uniformly defined by all companies, including those in Woodside’s industry. Accordingly, they may not be comparable with similarly titled measures and disclosures by other companies. Although certain of these data have been extracted or derived from Woodside’s financial statements, these data have not been audited or reviewed by Woodside’s independent auditors. You are urged to read carefully the audited full-year financial statements and related notes thereto. DEFINITION AND CALCULATION OF NON-IFRS FINANCIAL INFORMATION Non-IFRS financial information Why is the non-IFRS financial information useful Calculation methodology EBIT Used to assess the Group’s operational profitability excluding net finance Calculated as profit before income tax, PRRT and net costs and taxation expense. This assists management in tracking the finance costs. performance of the Group from its operations only. EBITDA excluding Used to assess the Group’s operational profitability excluding net finance impairment costs, taxation expense, depreciation and amortisation and impairment losses/reversals. This measure assesses the performance of the Group’s segments and aids decision making of resource allocation. Calculated as profit before income tax, PRRT, net finance costs, depreciation and amortisation, impairment losses, impairment reversals. Underlying NPAT Used to assess the Group’s financial performance by excluding the impacts Net profit after tax from the Group’s operations of exceptional items. This measure indicates the performance from the excluding any exceptional items (refer to the Group’s core operations only and is used by management to aid decision reconciliation in this section for the list of specific making of resource allocation. items for each financial year). Capital expenditure Used to assess efficient deployment of capital for property, plant and Includes capital additions on property, plant and equipment and evaluation capitalised. Management uses this measure as equipment and evaluation capitalised. support for decision making to maintain and improve productive capacity. Exploration expenditure Used to assess efficient deployment of capital for exploration and evaluation Includes exploration and evaluation expenditure less expenditure. Management uses this measure as support for decision making amortisation of licence acquisition costs and prior year to maintain and improve productive capacity. exploration expense written off. Free cash flow Used to evaluate the cash available for financing activities, including Cash flow from operating activities (excluding shareholder distributions and debt servicing, after investment in maintaining payments to cash reserves) and cash flow from and growing the Group’s operations This measure is used as a key indicator investing activities. of the level of cash the Group has at its disposal. 250 WOODSIDE ENERGY GROUP LTD
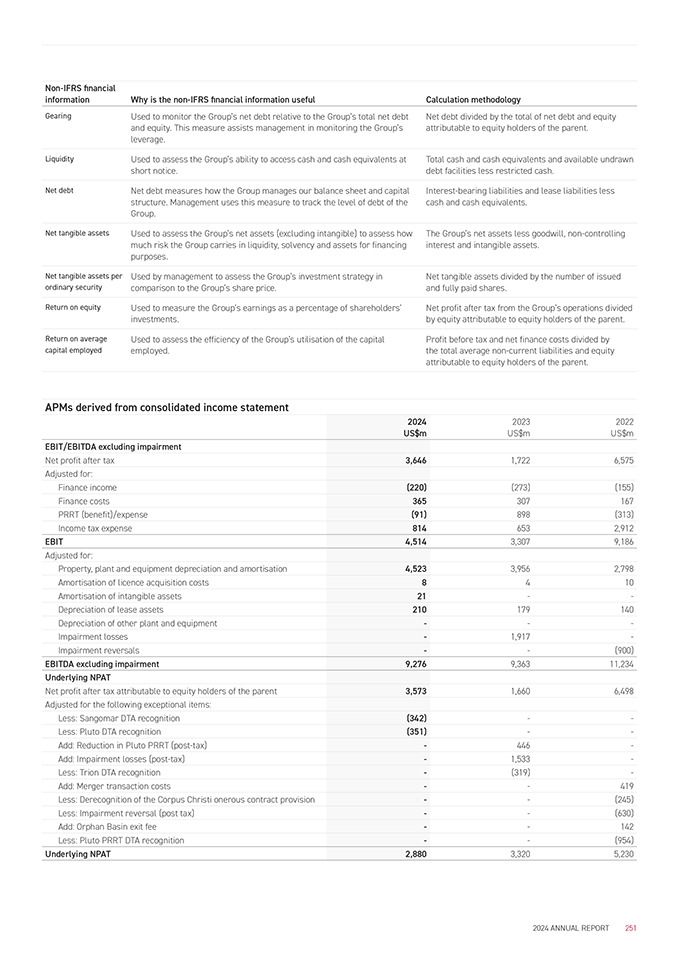
Non-IFRS financial information Why is the non-IFRS financial information useful Calculation methodology Gearing Used to monitor the Group’s net debt relative to the Group’s total net debt Net debt divided by the total of net debt and equity and equity. This measure assists management in monitoring the Group’s attributable to equity holders of the parent. leverage. Liquidity Used to assess the Group’s ability to access cash and cash equivalents at Total cash and cash equivalents and available undrawn short notice. debt facilities less restricted cash. Net debt Net debt measures how the Group manages our balance sheet and capital Interest-bearing liabilities and lease liabilities less structure. Management uses this measure to track the level of debt of the cash and cash equivalents. Group. Net tangible assets Used to assess the Group’s net assets (excluding intangible) to assess how much risk the Group carries in liquidity, solvency and assets for financing purposes. The Group’s net assets less goodwill, non-controlling interest and intangible assets. Net tangible assets per Used by management to assess the Group’s investment strategy in Net tangible assets divided by the number of issued ordinary security comparison to the Group’s share price. and fully paid shares. Return on equity Used to measure the Group’s earnings as a percentage of shareholders’ Net profit after tax from the Group’s operations divided investments. by equity attributable to equity holders of the parent. Return on average Used to assess the efficiency of the Group’s utilisation of the capital Profit before tax and net finance costs divided by capital employed employed. the total average non-current liabilities and equity attributable to equity holders of the parent. APMs derived from consolidated income statement 2024 2023 2022 US$m US$m US$m EBIT/EBITDA excluding impairment Net profit after tax 3,646 1,722 6,575 Adjusted for: Finance income (220) (273) (155) Finance costs 365 307 167 PRRT (benefit)/expense (91) 898 (313) Income tax expense 814 653 2,912 EBIT 4,514 3,307 9,186 Adjusted for: Property, plant and equipment depreciation and amortisation 4,523 3,956 2,798 Amortisation of licence acquisition costs 8 4 10 Amortisation of intangible assets 21 — Depreciation of lease assets 210 179 140 Depreciation of other plant and equipment ——Impairment losses—1,917—Impairment reversals — (900) EBITDA excluding impairment 9,276 9,363 11,234 Underlying NPAT Net profit after tax attributable to equity holders of the parent 3,573 1,660 6,498 Adjusted for the following exceptional items: Less: Sangomar DTA recognition (342) — Less: Pluto DTA recognition (351) — Add: Reduction in Pluto PRRT (post-tax)—446—Add: Impairment losses (post-tax)—1,533—Less: Trion DTA recognition—(319)—Add: Merger transaction costs — 419 Less: Derecognition of the Corpus Christi onerous contract provision — (245) Less: Impairment reversal (post tax) — (630) Add: Orphan Basin exit fee — 142 Less: Pluto PRRT DTA recognition — (954) Underlying NPAT 2,880 3,320 5,230 2024 ANNUAL REPORT 251
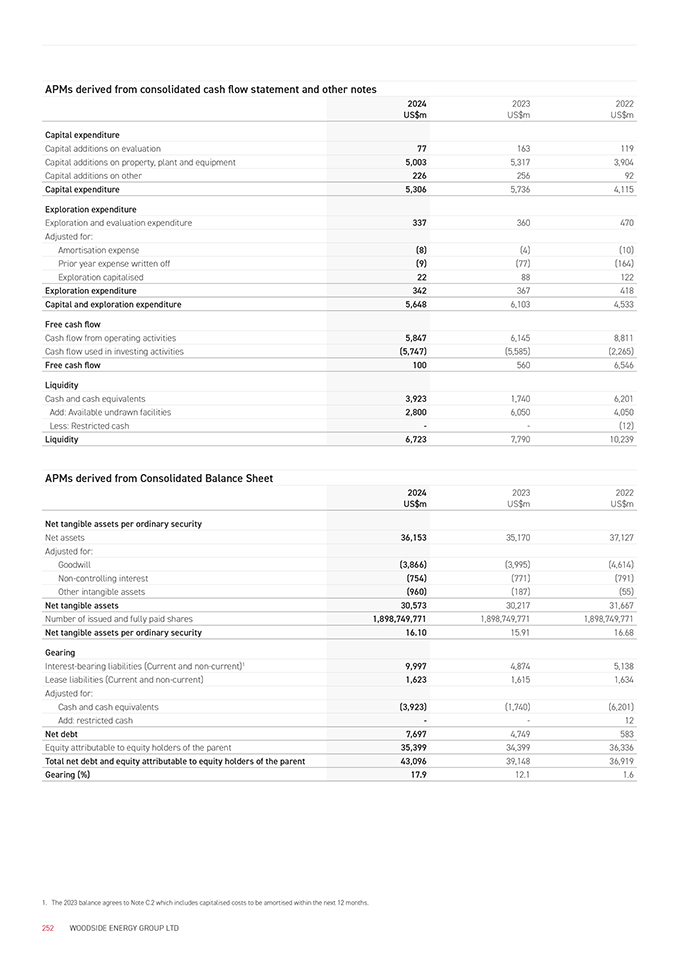
APMs derived from consolidated cash flow statement and other notes 2024 2023 2022 US$m US$m US$m Capital expenditure Capital additions on evaluation 77 163 119 Capital additions on property, plant and equipment 5,003 5,317 3,904 Capital additions on other 226 256 92 Capital expenditure 5,306 5,736 4,115 Exploration expenditure Exploration and evaluation expenditure 337 360 470 Adjusted for: Amortisation expense (8) (4) (10) Prior year expense written off (9) (77) (164) Exploration capitalised 22 88 122 Exploration expenditure 342 367 418 Capital and exploration expenditure 5,648 6,103 4,533 Free cash flow Cash flow from operating activities 5,847 6,145 8,811 Cash flow used in investing activities (5,747) (5,585) (2,265) Free cash flow 100 560 6,546 Liquidity Cash and cash equivalents 3,923 1,740 6,201 Add: Available undrawn facilities 2,800 6,050 4,050 Less: Restricted cash — (12) Liquidity 6,723 7,790 10,239 APMs derived from Consolidated Balance Sheet 2024 2023 2022 US$m US$m US$m Net tangible assets per ordinary security Net assets 36,153 35,170 37,127 Adjusted for: Goodwill (3,866) (3,995) (4,614) Non-controlling interest (754) (771) (791) Other intangible assets (960) (187) (55) Net tangible assets 30,573 30,217 31,667 Number of issued and fully paid shares 1,898,749,771 1,898,749,771 1,898,749,771 Net tangible assets per ordinary security 16.10 15.91 16.68 Gearing Interest-bearing liabilities (Current and non-current)1 9,997 4,874 5,138 Lease liabilities (Current and non-current) 1,623 1,615 1,634 Adjusted for: Cash and cash equivalents (3,923) (1,740) (6,201) Add: restricted cash — 12 Net debt 7,697 4,749 583 Equity attributable to equity holders of the parent 35,399 34,399 36,336 Total net debt and equity attributable to equity holders of the parent 43,096 39,148 36,919 Gearing (%) 17.9 12.1 1.6 1. The 2023 balance agrees to Note C.2 which includes capitalised costs to be amortised within the next 12 months. 252 WOODSIDE ENERGY GROUP LTD
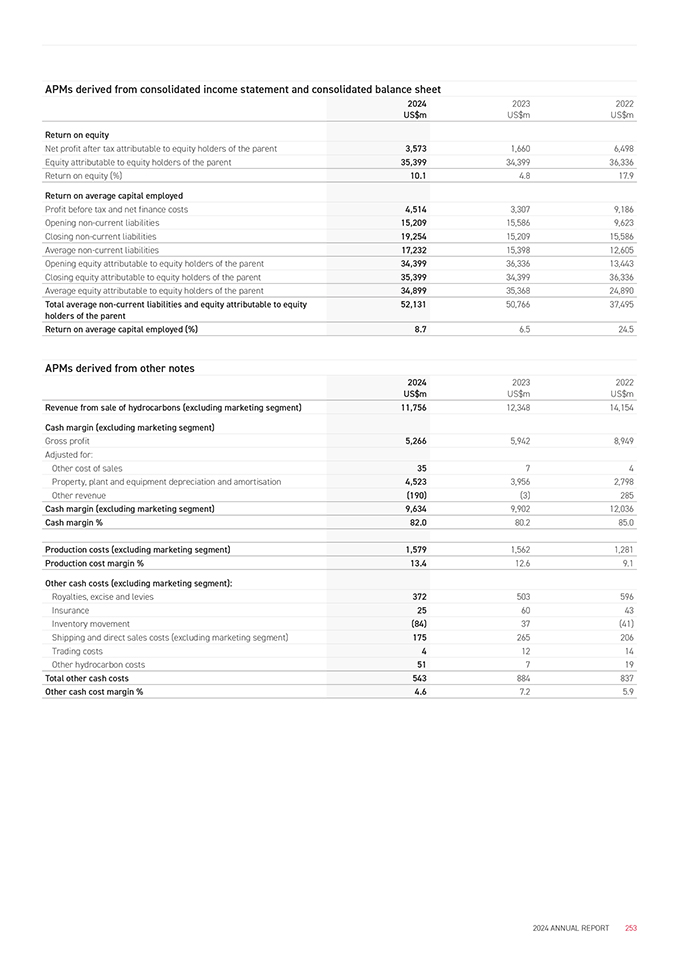
APMs derived from consolidated income statement and consolidated balance sheet 2024 2023 2022 US$m US$m US$m Return on equity Net profit after tax attributable to equity holders of the parent 3,573 1,660 6,498 Equity attributable to equity holders of the parent 35,399 34,399 36,336 Return on equity (%) 10.1 4.8 17.9 Return on average capital employed Profit before tax and net finance costs 4,514 3,307 9,186 Opening non-current liabilities 15,209 15,586 9,623 Closing non-current liabilities 19,254 15,209 15,586 Average non-current liabilities 17,232 15,398 12,605 Opening equity attributable to equity holders of the parent 34,399 36,336 13,443 Closing equity attributable to equity holders of the parent 35,399 34,399 36,336 Average equity attributable to equity holders of the parent 34,899 35,368 24,890 Total average non-current liabilities and equity attributable to equity 52,131 50,766 37,495 holders of the parent Return on average capital employed (%) 8.7 6.5 24.5 APMs derived from other notes 2024 2023 2022 US$m US$m US$m Revenue from sale of hydrocarbons (excluding marketing segment) 11,756 12,348 14,154 Cash margin (excluding marketing segment) Gross profit 5,266 5,942 8,949 Adjusted for: Other cost of sales 35 7 4 Property, plant and equipment depreciation and amortisation 4,523 3,956 2,798 Other revenue (190) (3) 285 Cash margin (excluding marketing segment) 9,634 9,902 12,036 Cash margin % 82.0 80.2 85.0 Production costs (excluding marketing segment) 1,579 1,562 1,281 Production cost margin % 13.4 12.6 9.1 Other cash costs (excluding marketing segment): Royalties, excise and levies 372 503 596 Insurance 25 60 43 Inventory movement (84) 37 (41) Shipping and direct sales costs (excluding marketing segment) 175 265 206 Trading costs 4 12 14 Other hydrocarbon costs 51 7 19 Total other cash costs 543 884 837 Other cash cost margin % 4.6 7.2 5.9 2024 ANNUAL REPORT 253
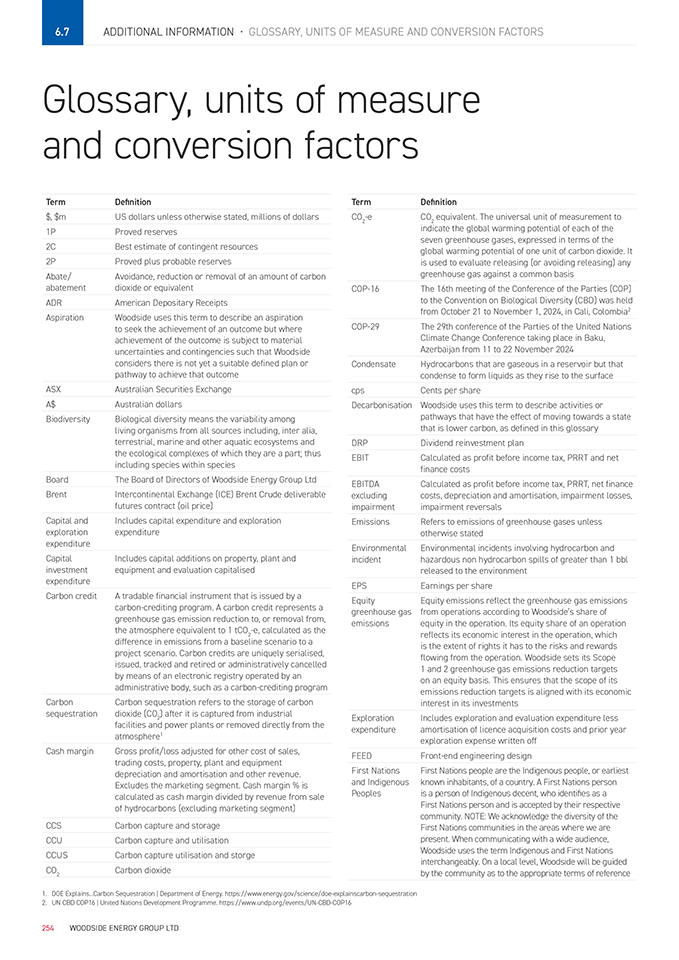
6.7 Additional Information • Glossary, units of measure and conversion factors Glossary, units of measure and conversion factors Term Definition $, $m US dollars unless otherwise stated, millions of dollars 1P Proved reserves 2C Best estimate of contingent resources 2P Proved plus probable reserves Abate/ Avoidance, reduction or removal of an amount of carbon abatement dioxide or equivalent ADR American Depositary Receipts Aspiration Woodside uses this term to describe an aspiration to seek the achievement of an outcome but where achievement of the outcome is subject to material uncertainties and contingencies such that Woodside considers there is not yet a suitable defined plan or pathway to achieve that outcome ASX Australian Securities Exchange A$ Australian dollars Biodiversity Biological diversity means the variability among living organisms from all sources including, inter alia, terrestrial, marine and other aquatic ecosystems and the ecological complexes of which they are a part; thus including species within species Board The Board of Directors of Woodside Energy Group Ltd Brent Intercontinental Exchange (ICE) Brent Crude deliverable futures contract (oil price) Capital and Includes capital expenditure and exploration exploration expenditure expenditure Capital Includes capital additions on property, plant and investment equipment and evaluation capitalised expenditure Carbon credit A tradable financial instrument that is issued by a carbon-crediting program. A carbon credit represents a greenhouse gas emission reduction to, or removal from, the atmosphere equivalent to 1 tCO2-e, calculated as the difference in emissions from a baseline scenario to a project scenario. Carbon credits are uniquely serialised, issued, tracked and retired or administratively cancelled by means of an electronic registry operated by an administrative body, such as a carbon-crediting program Carbon Carbon sequestration refers to the storage of carbon sequestration dioxide (CO2) after it is captured from industrial facilities and power plants or removed directly from the atmosphere1 Cash margin Gross profit/loss adjusted for other cost of sales, trading costs, property, plant and equipment depreciation and amortisation and other revenue. Excludes the marketing segment. Cash margin % is calculated as cash margin divided by revenue from sale of hydrocarbons (excluding marketing segment) CCS Carbon capture and storage CCU Carbon capture and utilisation CCUS Carbon capture utilisation and storge CO2 Carbon dioxide Term Definition CO2-e CO2 equivalent. The universal unit of measurement to indicate the global warming potential of each of the seven greenhouse gases, expressed in terms of the global warming potential of one unit of carbon dioxide. It is used to evaluate releasing (or avoiding releasing) any greenhouse gas against a common basis COP-16 The 16th meeting of the Conference of the Parties (COP) to the Convention on Biological Diversity (CBD) was held from October 21 to November 1, 2024, in Cali, Colombia2 COP-29 The 29th conference of the Parties of the United Nations Climate Change Conference taking place in Baku, Azerbaijan from 11 to 22 November 2024 Condensate Hydrocarbons that are gaseous in a reservoir but that condense to form liquids as they rise to the surface cps Cents per share Decarbonisation Woodside uses this term to describe activities or pathways that have the effect of moving towards a state that is lower carbon, as defined in this glossary DRP Dividend reinvestment plan EBIT Calculated as profit before income tax, PRRT and net finance costs EBITDA Calculated as profit before income tax, PRRT, net finance excluding costs, depreciation and amortisation, impairment losses, impairment impairment reversals Emissions Refers to emissions of greenhouse gases unless otherwise stated Environmental Environmental incidents involving hydrocarbon and incident hazardous non hydrocarbon spills of greater than 1 bbl released to the environment EPS Earnings per share Equity Equity emissions reflect the greenhouse gas emissions greenhouse gas from operations according to Woodside’s share of emissions equity in the operation. Its equity share of an operation reflects its economic interest in the operation, which is the extent of rights it has to the risks and rewards flowing from the operation. Woodside sets its Scope 1 and 2 greenhouse gas emissions reduction targets on an equity basis. This ensures that the scope of its emissions reduction targets is aligned with its economic interest in its investments Exploration Includes exploration and evaluation expenditure less expenditure amortisation of licence acquisition costs and prior year exploration expense written off FEED Front-end engineering design First Nations First Nations people are the Indigenous people, or earliest and Indigenous known inhabitants, of a country. A First Nations person Peoples is a person of Indigenous decent, who identifies as a First Nations person and is accepted by their respective community. NOTE: We acknowledge the diversity of the First Nations communities in the areas where we are present. When communicating with a wide audience, Woodside uses the term Indigenous and First Nations interchangeably. On a local level, Woodside will be guided by the community as to the appropriate terms of reference 1. DOE Explains...Carbon Sequestration | Department of Energy. https://www.energy.gov/science/doe-explainscarbon-sequestration 2. UN CBD COP16 | United Nations Development Programme. https://www.undp.org/events/UN-CBD-COP16 254 WOODSIDE ENERGY GROUP LTD
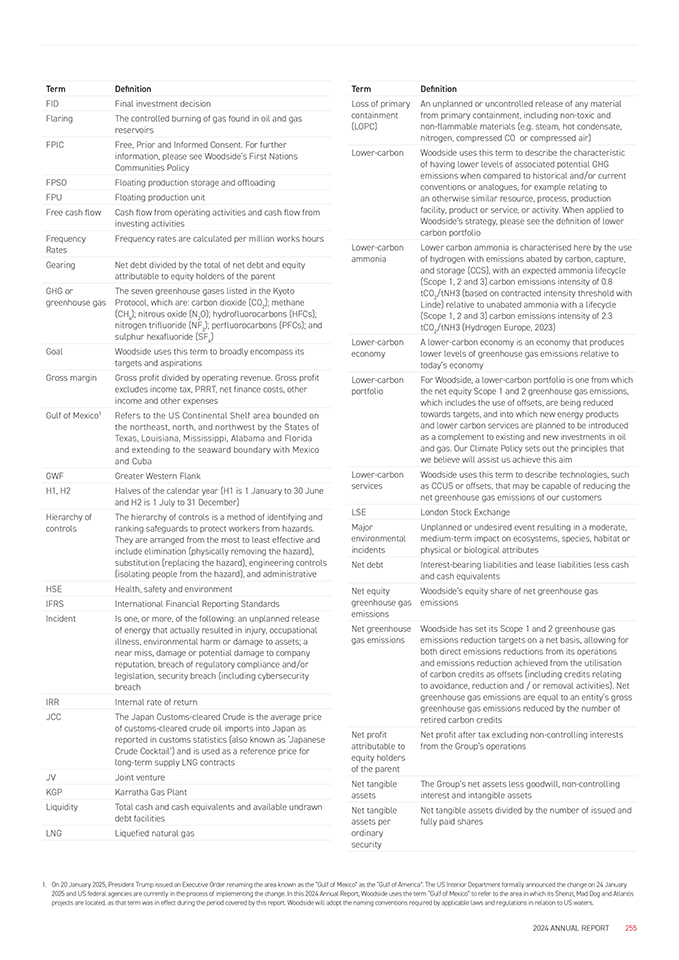
Term Definition FID Final investment decision Flaring The controlled burning of gas found in oil and gas reservoirs FPIC Free, Prior and Informed Consent. For further information, please see Woodside’s First Nations Communities Policy FPSO Floating production storage and offloading FPU Floating production unit Free cash flow Cash flow from operating activities and cash flow from investing activities Frequency Frequency rates are calculated per million works hours Rates Gearing Net debt divided by the total of net debt and equity attributable to equity holders of the parent GHG or The seven greenhouse gases listed in the Kyoto greenhouse gas Protocol, which are: carbon dioxide (CO2); methane (CH4); nitrous oxide (N2O); hydrofluorocarbons (HFCs); nitrogen trifluoride (NF3); perfluorocarbons (PFCs); and sulphur hexafluoride (SF6) Goal Woodside uses this term to broadly encompass its targets and aspirations Gross margin Gross profit divided by operating revenue. Gross profit excludes income tax, PRRT, net finance costs, other income and other expenses Gulf of Mexico1 Refers to the US Continental Shelf area bounded on the northeast, north, and northwest by the States of Texas, Louisiana, Mississippi, Alabama and Florida and extending to the seaward boundary with Mexico and Cuba GWF Greater Western Flank H1, H2 Halves of the calendar year (H1 is 1 January to 30 June and H2 is 1 July to 31 December) Hierarchy of The hierarchy of controls is a method of identifying and controls ranking safeguards to protect workers from hazards. They are arranged from the most to least effective and include elimination (physically removing the hazard), substitution (replacing the hazard), engineering controls (isolating people from the hazard), and administrative HSE Health, safety and environment IFRS International Financial Reporting Standards Incident Is one, or more, of the following: an unplanned release of energy that actually resulted in injury, occupational illness, environmental harm or damage to assets; a near miss, damage or potential damage to company reputation, breach of regulatory compliance and/or legislation, security breach (including cybersecurity breach IRR Internal rate of return JCC The Japan Customs-cleared Crude is the average price of customs-cleared crude oil imports into Japan as reported in customs statistics (also known as ‘Japanese Crude Cocktail’) and is used as a reference price for long-term supply LNG contracts JV Joint venture KGP Karratha Gas Plant Liquidity Total cash and cash equivalents and available undrawn debt facilities LNG Liquefied natural gas Term Definition Loss of primary An unplanned or uncontrolled release of any material containment from primary containment, including non-toxic and (LOPC) non-flammable materials (e.g. steam, hot condensate, nitrogen, compressed COâ,, or compressed air) Lower-carbon Woodside uses this term to describe the characteristic of having lower levels of associated potential GHG emissions when compared to historical and/or current conventions or analogues, for example relating to an otherwise similar resource, process, production facility, product or service, or activity. When applied to Woodside’s strategy, please see the definition of lower carbon portfolio Lower-carbon Lower carbon ammonia is characterised here by the use ammonia of hydrogen with emissions abated by carbon, capture, and storage (CCS), with an expected ammonia lifecycle (Scope 1, 2 and 3) carbon emissions intensity of 0.8 tCO2/tNH3 (based on contracted intensity threshold with Linde) relative to unabated ammonia with a lifecycle (Scope 1, 2 and 3) carbon emissions intensity of 2.3 tCO2/tNH3 (Hydrogen Europe, 2023) Lower-carbon A lower-carbon economy is an economy that produces economy lower levels of greenhouse gas emissions relative to today’s economy Lower-carbon For Woodside, a lower-carbon portfolio is one from which portfolio the net equity Scope 1 and 2 greenhouse gas emissions, which includes the use of offsets, are being reduced towards targets, and into which new energy products and lower carbon services are planned to be introduced as a complement to existing and new investments in oil and gas. Our Climate Policy sets out the principles that we believe will assist us achieve this aim Lower-carbon Woodside uses this term to describe technologies, such services as CCUS or offsets, that may be capable of reducing the net greenhouse gas emissions of our customers LSE London Stock Exchange Major Unplanned or undesired event resulting in a moderate, environmental medium-term impact on ecosystems, species, habitat or incidents physical or biological attributes Net debt Interest-bearing liabilities and lease liabilities less cash and cash equivalents Net equity Woodside’s equity share of net greenhouse gas greenhouse gas emissions emissions Net greenhouse Woodside has set its Scope 1 and 2 greenhouse gas gas emissions emissions reduction targets on a net basis, allowing for both direct emissions reductions from its operations and emissions reduction achieved from the utilisation of carbon credits as offsets (including credits relating to avoidance, reduction and / or removal activities). Net greenhouse gas emissions are equal to an entity’s gross greenhouse gas emissions reduced by the number of retired carbon credits Net profit Net profit after tax excluding non-controlling interests attributable to from the Group’s operations equity holders of the parent Net tangible The Group’s net assets less goodwill, non-controlling assets interest and intangible assets Net tangible Net tangible assets divided by the number of issued and assets per fully paid shares ordinary security 1. On 20 January 2025, President Trump issued an Executive Order renaming the area known as the “Gulf of Mexico” as the “Gulf of America”. The US Interior Department formally announced the change on 24 January 2025 and US federal agencies are currently in the process of implementing the change. In this 2024 Annual Report, Woodside uses the term “Gulf of Mexico” to refer to the area in which its Shenzi, Mad Dog and Atlantis projects are located, as that term was in effect during the period covered by this report. Woodside will adopt the naming conventions required by applicable laws and regulations in relation to US waters. 2024 ANNUAL REPORT 255
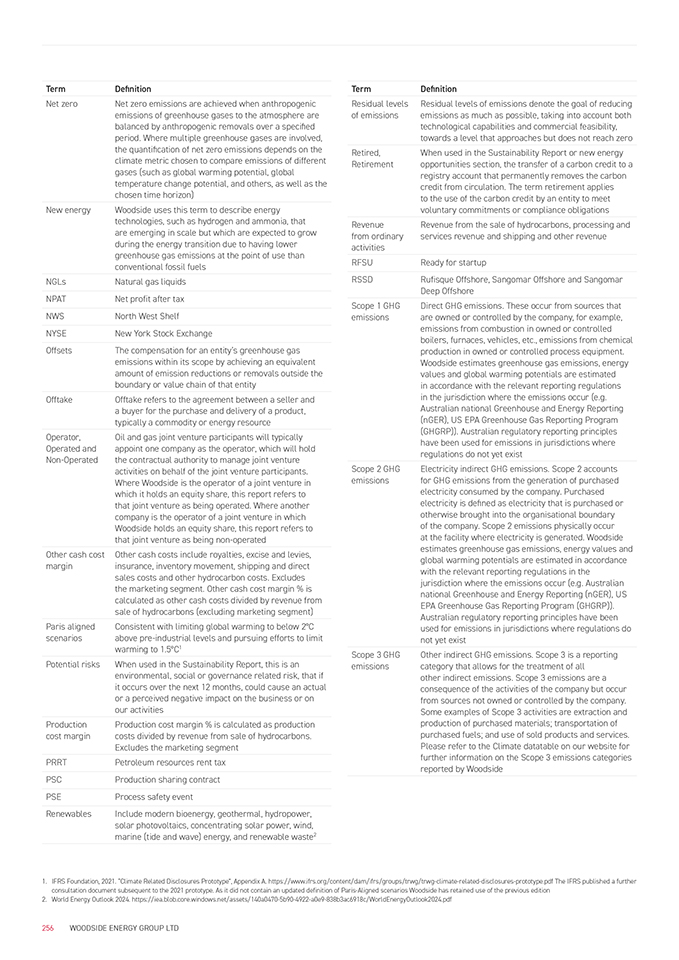
Term Definition Net zero Net zero emissions are achieved when anthropogenic emissions of greenhouse gases to the atmosphere are balanced by anthropogenic removals over a specified period. Where multiple greenhouse gases are involved, the quantification of net zero emissions depends on the climate metric chosen to compare emissions of different gases (such as global warming potential, global temperature change potential, and others, as well as the chosen time horizon) New energy Woodside uses this term to describe energy technologies, such as hydrogen and ammonia, that are emerging in scale but which are expected to grow during the energy transition due to having lower greenhouse gas emissions at the point of use than conventional fossil fuels NGLs Natural gas liquids NPAT Net profit after tax NWS North West Shelf NYSE New York Stock Exchange Offsets The compensation for an entity’s greenhouse gas emissions within its scope by achieving an equivalent amount of emission reductions or removals outside the boundary or value chain of that entity Offtake Offtake refers to the agreement between a seller and a buyer for the purchase and delivery of a product, typically a commodity or energy resource Operator, Oil and gas joint venture participants will typically Operated and appoint one company as the operator, which will hold Non-Operated the contractual authority to manage joint venture activities on behalf of the joint venture participants. Where Woodside is the operator of a joint venture in which it holds an equity share, this report refers to that joint venture as being operated. Where another company is the operator of a joint venture in which Woodside holds an equity share, this report refers to that joint venture as being non-operated Other cash cost Other cash costs include royalties, excise and levies, margin insurance, inventory movement, shipping and direct sales costs and other hydrocarbon costs. Excludes the marketing segment. Other cash cost margin % is calculated as other cash costs divided by revenue from sale of hydrocarbons (excluding marketing segment) Paris aligned Consistent with limiting global warming to below 2°C scenarios above pre-industrial levels and pursuing efforts to limit warming to 1.5°C1 Potential risks When used in the Sustainability Report, this is an environmental, social or governance related risk, that if it occurs over the next 12 months, could cause an actual or a perceived negative impact on the business or on our activities Production Production cost margin % is calculated as production cost margin costs divided by revenue from sale of hydrocarbons. Excludes the marketing segment PRRT Petroleum resources rent tax PSC Production sharing contract PSE Process safety event Renewables Include modern bioenergy, geothermal, hydropower, solar photovoltaics, concentrating solar power, wind, marine (tide and wave) energy, and renewable waste2 Term Definition Residual levels Residual levels of emissions denote the goal of reducing of emissions emissions as much as possible, taking into account both technological capabilities and commercial feasibility, towards a level that approaches but does not reach zero Retired, When used in the Sustainability Report or new energy Retirement opportunities section, the transfer of a carbon credit to a registry account that permanently removes the carbon credit from circulation. The term retirement applies to the use of the carbon credit by an entity to meet voluntary commitments or compliance obligations Revenue Revenue from the sale of hydrocarbons, processing and from ordinary services revenue and shipping and other revenue activities RFSU Ready for startup RSSD Rufisque Offshore, Sangomar Offshore and Sangomar Deep Offshore Scope 1 GHG Direct GHG emissions. These occur from sources that emissions are owned or controlled by the company, for example, emissions from combustion in owned or controlled boilers, furnaces, vehicles, etc., emissions from chemical production in owned or controlled process equipment. Woodside estimates greenhouse gas emissions, energy values and global warming potentials are estimated in accordance with the relevant reporting regulations in the jurisdiction where the emissions occur (e.g. Australian national Greenhouse and Energy Reporting (nGER), US EPA Greenhouse Gas Reporting Program (GHGRP)). Australian regulatory reporting principles have been used for emissions in jurisdictions where regulations do not yet exist Scope 2 GHG Electricity indirect GHG emissions. Scope 2 accounts emissions for GHG emissions from the generation of purchased electricity consumed by the company. Purchased electricity is defined as electricity that is purchased or otherwise brought into the organisational boundary of the company. Scope 2 emissions physically occur at the facility where electricity is generated. Woodside estimates greenhouse gas emissions, energy values and global warming potentials are estimated in accordance with the relevant reporting regulations in the jurisdiction where the emissions occur (e.g. Australian national Greenhouse and Energy Reporting (nGER), US EPA Greenhouse Gas Reporting Program (GHGRP)). Australian regulatory reporting principles have been used for emissions in jurisdictions where regulations do not yet exist Scope 3 GHG Other indirect GHG emissions. Scope 3 is a reporting emissions category that allows for the treatment of all other indirect emissions. Scope 3 emissions are a consequence of the activities of the company but occur from sources not owned or controlled by the company. Some examples of Scope 3 activities are extraction and production of purchased materials; transportation of purchased fuels; and use of sold products and services. Please refer to the Climate datatable on our website for further information on the Scope 3 emissions categories reported by Woodside 1. IFRS Foundation, 2021. “Climate Related Disclosures Prototype”, Appendix A. https://www.ifrs.org/content/dam/ifrs/groups/trwg/trwg-climate-related-disclosures-prototype.pdf The IFRS published a further consultation document subsequent to the 2021 prototype. As it did not contain an updated definition of Paris-Aligned scenarios Woodside has retained use of the previous edition 2. World Energy Outlook 2024. https://iea.blob.core.windows.net/assets/140a0470-5b90-4922-a0e9-838b3ac6918c/WorldEnergyOutlook2024.pdf 256 WOODSIDE ENERGY GROUP LTD
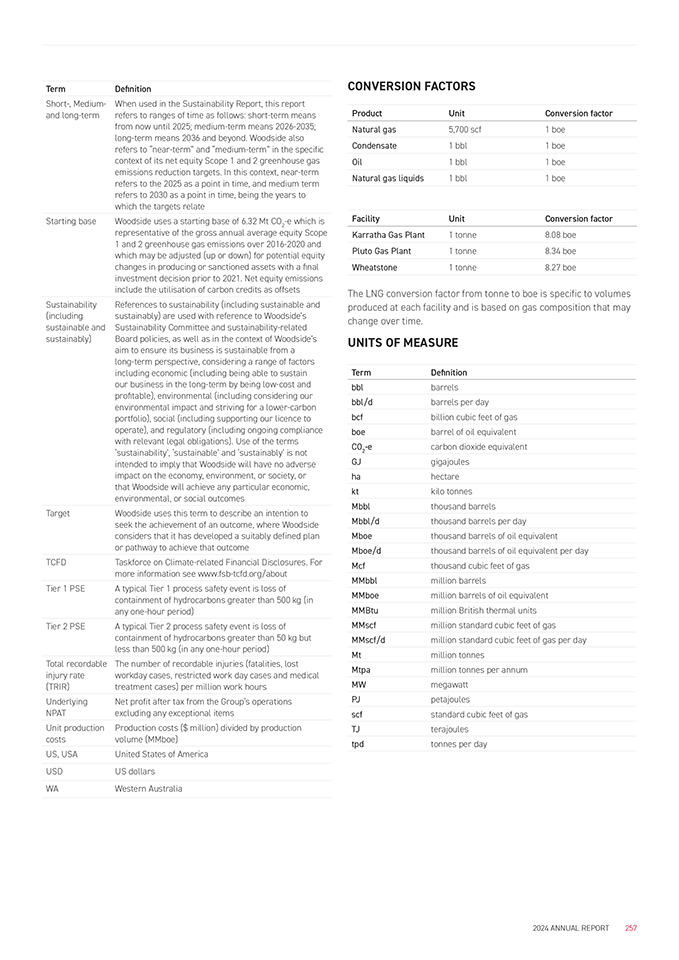
Term Definition Short-, Medium- When used in the Sustainability Report, this report and long-term refers to ranges of time as follows: short-term means from now until 2025; medium-term means 2026-2035; long-term means 2036 and beyond. Woodside also refers to “near-term” and “medium-term” in the specific context of its net equity Scope 1 and 2 greenhouse gas emissions reduction targets. In this context, near-term refers to the 2025 as a point in time, and medium term refers to 2030 as a point in time, being the years to which the targets relate Starting base Woodside uses a starting base of 6.32 Mt CO2-e which is representative of the gross annual average equity Scope 1 and 2 greenhouse gas emissions over 2016-2020 and which may be adjusted (up or down) for potential equity changes in producing or sanctioned assets with a final investment decision prior to 2021. Net equity emissions include the utilisation of carbon credits as offsets Sustainability References to sustainability (including sustainable and (including sustainably) are used with reference to Woodside’s sustainable and Sustainability Committee and sustainability-related sustainably) Board policies, as well as in the context of Woodside’s aim to ensure its business is sustainable from a long-term perspective, considering a range of factors including economic (including being able to sustain our business in the long-term by being low-cost and profitable), environmental (including considering our environmental impact and striving for a lower-carbon portfolio), social (including supporting our licence to operate), and regulatory (including ongoing compliance with relevant legal obligations). Use of the terms ‘sustainability’, ‘sustainable’ and ‘sustainably’ is not intended to imply that Woodside will have no adverse impact on the economy, environment, or society, or that Woodside will achieve any particular economic, environmental, or social outcomes Target Woodside uses this term to describe an intention to seek the achievement of an outcome, where Woodside considers that it has developed a suitably defined plan or pathway to achieve that outcome TCFD Taskforce on Climate-related Financial Disclosures. For more information see www.fsb-tcfd.org/about Tier 1 PSE A typical Tier 1 process safety event is loss of containment of hydrocarbons greater than 500 kg (in any one-hour period) Tier 2 PSE A typical Tier 2 process safety event is loss of containment of hydrocarbons greater than 50 kg but less than 500 kg (in any one-hour period) Total recordable The number of recordable injuries (fatalities, lost injury rate workday cases, restricted work day cases and medical (TRIR) treatment cases) per million work hours Underlying Net profit after tax from the Group’s operations NPAT excluding any exceptional items Unit production Production costs ($ million) divided by production costs volume (MMboe) US, USA United States of America USD US dollars WA Western Australia CONVERSION FACTORS Product Unit Conversion factor Natural gas 5,700 scf 1 boe Condensate 1 bbl 1 boe Oil 1 bbl 1 boe Natural gas liquids 1 bbl 1 boe Facility Unit Conversion factor Karratha Gas Plant 1 tonne 8.08 boe Pluto Gas Plant 1 tonne 8.34 boe Wheatstone 1 tonne 8.27 boe The LNG conversion factor from tonne to boe is specific to volumes produced at each facility and is based on gas composition that may change over time. UNITS OF MEASURE Term Definition bbl barrels bbl/d barrels per day bcf billion cubic feet of gas boe barrel of oil equivalent CO2-e carbon dioxide equivalent GJ gigajoules ha hectare kt kilo tonnes Mbbl thousand barrels Mbbl/d thousand barrels per day Mboe thousand barrels of oil equivalent Mboe/d thousand barrels of oil equivalent per day Mcf thousand cubic feet of gas MMbbl million barrels MMboe million barrels of oil equivalent MMBtu million British thermal units MMscf million standard cubic feet of gas MMscf/d million standard cubic feet of gas per day Mt million tonnes Mtpa million tonnes per annum MW megawatt PJ petajoules scf standard cubic feet of gas TJ terajoules tpd tonnes per day 2024 ANNUAL REPORT 257
6.8 Additional Information • Information about this report Information about this report UNREASONABLE PREJUDICE As permitted by sections 299(3) and 299A(3) of the Corporations Act 2001, we have omitted certain information from our operating and financial review and Directors’ report in relation to our business strategy, future prospects and likely developments in our operations and the expected results of those operations in future financial years. We have done this on the basis that such information, if disclosed, would be likely to result in unreasonable prejudice to Woodside (for example, because the information is premature, commercially sensitive, confidential or could give a third party a commercial advantage). The omitted information relates to our internal budgets, forecasts and estimates, details of our business strategy, and LNG contractual pricing. FORWARD-LOOKING STATEMENTS This report contains forward-looking statements with respect to Woodside’s business and operations, market conditions, results of operations and financial condition, including, for example, but not limited to, outcomes of transactions, statements regarding long-term demand for Woodside’s products, development, completion and execution of Woodside’s projects, expectations regarding future capital expenditures, the payment of future dividends and the amount thereof, future results of projects, operating activities and new energy products, expectations and plans for renewables production capacity and investments in, and development of, renewables projects, expectations and guidance with respect to production, capital and exploration expenditure and gas hub exposure, and expectations regarding the achievement of Woodside’s net equity Scope 1 and 2 greenhouse gas emissions reduction and new energy investment targets and other climate and sustainability goals. All statements, other than statements of historical or present facts, are forward-looking statements and generally may be identified by the use of forward-looking words such as “guidance”, “foresee”, “likely”, “potential”, “anticipate”, “believe”, “aim”, “aspire”, “estimate”, “expect”, “intend”, “may”, “target”, “plan”, “strategy”, “forecast”, “outlook”, “project”, “schedule”, “will”, “should”, “seek” and other similar words or expressions. Similarly, statements that describe the objectives, plans, goals or expectations of Woodside are forward-looking statements. Forward-looking statements in this report are not guidance, forecasts, guarantees or predictions of future events or performance, but are in the nature of future expectations that are based on management’s current expectations and assumptions. Those statements and any assumptions on which they are based are subject to change without notice and are subject to inherent known and unknown risks, uncertainties, contingencies and other factors, many of which are beyond the control of Woodside, its related bodies corporate and their respective officers, directors, employees, advisers or representatives. Important factors that could cause actual results to differ materially from those in the forward-looking statements and assumptions on which they are based include, but are not limited to, fluctuations in commodity prices, actual demand for Woodside products, currency fluctuations, geotechnical factors, drilling and production results, gas commercialisation, development progress, operating results, engineering estimates, reserve and resource estimates, loss of market, industry competition, sustainability and environmental risks, climate related transition and physical risks, safety and personnel risks, changes in accounting standards, economic and financial markets conditions in various countries and regions the actions of third parties, project delay or advancement, regulatory approvals, political risks and the impact of armed conflict and political instability (such as the ongoing conflict in Ukraine) on economic activity and oil and gas supply and demand, cost estimates, legislative, fiscal and regulatory developments and the effect of future regulatory or legislative actions on Woodside or the industries in which it operates, including potential changes to tax laws, the impact of general economic conditions, inflationary conditions, prevailing exchange rates and interest rates and conditions in financial markets, and risks associated with acquisitions, mergers and joint ventures, including difficulties integrating or separating businesses, uncertainty associated with financial projections, restructuring, increased costs and adverse tax consequences, and uncertainties and liabilities associated with acquired and divested properties and businesses. A more detailed summary of the key risks relating to Woodside and its business can be found in section 3.9—Risk factors. You should review and have regard to these risks when considering the information contained in this report. If any of the assumptions on which a forward-looking statement is based were to change or be found to be incorrect, this would likely cause outcomes to differ from the statements made in this report. Investors are strongly cautioned not to place undue reliance on any forward-looking statements. Actual results or performance may vary materially from those expressed in, or implied by, any forward-looking statements. None of Woodside nor any of its related bodies corporate, nor any of their respective officers, directors, employees, advisers or representatives, nor any person named in this report or involved in the preparation of the information in this report, makes any representation, assurance, guarantee or warranty (either express or implied) as to the accuracy or likelihood of fulfilment of any forward-looking statement, or any outcomes, events or results expressed or implied in any forward-looking statement in this report. All forward-looking statements contained in this report reflect Woodside’s views held as at the date of this report and, except as required by applicable law, neither Woodside, its related bodies corporate, nor any of their respective officers, directors, employees, advisers or representatives nor any person named in this report or involved in the preparation of the information in this report 258 WOODSIDE ENERGY GROUP LTD
intends to, undertakes to, or assumes any obligation to, provide any additional information or update or revise any of these statements after the date of this report, either to make them conform to actual results or as a result of new information, future events or results, changes in Woodside’s expectations or otherwise. Past performance (including historical financial and operational information) is given for illustrative purposes only. It should not be relied on as, and is not necessarily, a reliable indicator of future performance, including future security prices. CLIMATE STRATEGY AND EMISSIONS DATA All greenhouse gas emissions data in this report are estimates, due to the inherent uncertainty and limitations in measuring or quantifying greenhouse gas emissions, and our methodologies for measuring or quantifying greenhouse gas emissions may evolve as best practices continue to develop and data quality and quantity continue to improve. Woodside ‘greenhouse gas’ or ‘emissions’ information reported are net equity Scope 1 GHG emissions, Scope 2 GHG emissions, and/or Scope 3 GHG emissions, as the context requires. Actual performance against Woodside’s targets (including items that are described as a target) and aspirations or goals may be affected by various risks associated with the Woodside business, the uncertainty as to how the global energy transition to a lower carbon economy will evolve, and physical risks associated with climate change, many of which are beyond Woodside’s control. The glossary and footnotes to this report provide further clarification of “lower-carbon” where applicable. Woodside uses the term “lower-carbon services” to describe technologies, such as CCUS or offsets, that may be capable of reducing the net greenhouse gas emissions of our customers. Additionally, the developments of environmental and climate change-related issues discussed in this report are based on various frameworks and the interests of various stakeholders that are subject to evolve independently of our will. Moreover, our disclosures on such issues, including climate-related disclosures, may include information that is not necessarily “material” under US securities laws for SEC reporting purposes or under applicable securities law. Scope 3 targets are subject to commercial arrangements, commercial feasibility, regulatory and joint venture approvals, and third party activities (which may or may not proceed). Individual investment decisions are subject to Woodside’s investment targets. Such targets are not guidance. Scope 3 targets potentially include both organic and inorganic investment. For more information on Woodside’s climate strategy, including references to “lower-carbon” as part of that strategy, and emissions data, refer to the Sustainability section at woodside.com. INDUSTRY AND MARKET DATA This report contains industry, market and competitive position data based on industry publications and studies conducted by third parties, as well as Woodside’s internal estimates and research. These industry publications and third-party studies generally state that the information they contain has been obtained from sources believed to be reliable, although they do not guarantee the accuracy or completeness of such information. While Woodside believes that each of these publications and third-party studies is reliable and has been prepared by a reputable source, Woodside has not independently verified the market and industry data obtained from these third-party sources and cannot guarantee the accuracy or completeness of such data. Accordingly, undue reliance should not be placed on any of the industry, market and competitive position data contained in this report. Forecasts and other forward-looking information obtained from these sources are subject to the same qualifications and uncertainties as the other forward-looking statements contained in this report and may differ among third-party sources. These forecasts and forward-looking information are subject to uncertainty and risk due to a variety of factors, including those described in section 3.9—Risk factors, section 6.8 – Information about this report and in this section. These and other factors could cause results to differ materially from those expressed in Woodside’s forecasts or estimates or those of independent third parties. While Woodside believes its internal research is reliable and its selection of industry publications and third-party studies and the description of its market and industry are appropriate, neither such research nor these descriptions have been verified by any independent source. BASIS OF PRESENTATION Woodside’s financial statements are prepared in accordance with the Australian Accounting Standards and other authoritative pronouncements of the Australian Accounting Standards Board (AASB) and comply with the International Financial Reporting Standards (IFRS) as issued by the International Accounting Standards Board (IASB). OTHER IMPORTANT INFORMATION In this report, references to a year are to the calendar and financial year ended 31 December 2024 unless otherwise stated. All references to dollars, cents of $ in this report are references to US currency and are stated in Woodside share, unless otherwise stated. Unless otherwise stated, all Woodside results set out in this Annual Report 2024 include the performance of the interests acquired as part of the merger with BHP’s petroleum business from 1 June 2022. 2024 ANNUAL REPORT 259
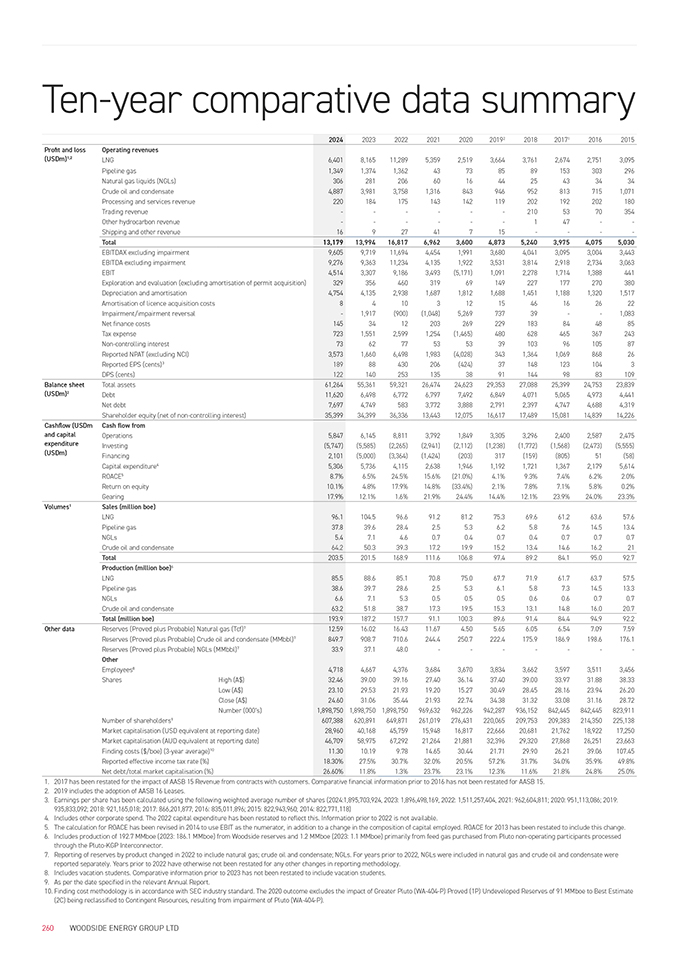
Ten-year comparative data summary 2024 2023 2022 2021 2020 20192 2018 20171 2016 2015 Profit and loss Operating revenues (USDm)1,2 LNG 6,401 8,165 11,289 5,359 2,519 3,664 3,761 2,674 2,751 3,095 Pipeline gas 1,349 1,374 1,362 43 73 85 89 153 303 296 Natural gas liquids (NGLs) 306 281 206 60 16 44 25 43 34 34 Crude oil and condensate 4,887 3,981 3,758 1,316 843 946 952 813 715 1,071 Processing and services revenue 220 184 175 143 142 119 202 192 202 180 Trading revenue — — — 210 53 70 354 Other hydrocarbon revenue — — — 1 47 — Shipping and other revenue 16 9 27 41 7 15 — — Total 13,179 13,994 16,817 6,962 3,600 4,873 5,240 3,975 4,075 5,030 EBITDAX excluding impairment 9,605 9,719 11,694 4,454 1,991 3,680 4,041 3,095 3,004 3,443 EBITDA excluding impairment 9,276 9,363 11,234 4,135 1,922 3,531 3,814 2,918 2,734 3,063 EBIT 4,514 3,307 9,186 3,493 (5,171) 1,091 2,278 1,714 1,388 441 Exploration and evaluation (excluding amortisation of permit acquisition) 329 356 460 319 69 149 227 177 270 380 Depreciation and amortisation 4,754 4,135 2,938 1,687 1,812 1,688 1,451 1,188 1,320 1,517 Amortisation of licence acquisition costs 8 4 10 3 12 15 46 16 26 22 Impairment/impairment reversal —1,917 (900) (1,048) 5,269 737 39 — 1,083 Net finance costs 145 34 12 203 269 229 183 84 48 85 Tax expense 723 1,551 2,599 1,254 (1,465) 480 628 465 367 243 Non-controlling interest 73 62 77 53 53 39 103 96 105 87 Reported NPAT (excluding NCI) 3,573 1,660 6,498 1,983 (4,028) 343 1,364 1,069 868 26 Reported EPS (cents)3 189 88 430 206 (424) 37 148 123 104 3 DPS (cents) 122 140 253 135 38 91 144 98 83 109 Balance sheet Total assets 61,264 55,361 59,321 26,474 24,623 29,353 27,088 25,399 24,753 23,839 (USDm)2 Debt 11,620 6,498 6,772 6,797 7,492 6,849 4,071 5,065 4,973 4,441 Net debt 7,697 4,749 583 3,772 3,888 2,791 2,397 4,747 4,688 4,319 Shareholder equity (net of non-controlling interest) 35,399 34,399 36,336 13,443 12,075 16,617 17,489 15,081 14,839 14,226 Cashflow (USDm Cash flow from and capital Operations 5,847 6,145 8,811 3,792 1,849 3,305 3,296 2,400 2,587 2,475 expenditure Investing (5,747) (5,585) (2,265) (2,941) (2,112) (1,238) (1,772) (1,568) (2,473) (5,555) (USDm) Financing 2,101 (5,000) (3,364) (1,424) (203) 317 (159) (805) 51 (58) Capital expenditure4 5,306 5,736 4,115 2,638 1,946 1,192 1,721 1,367 2,179 5,614 ROACE5 8.7% 6.5% 24.5% 15.6% (21.0%) 4.1% 9.3% 7.4% 6.2% 2.0% Return on equity 10.1% 4.8% 17.9% 14.8% (33.4%) 2.1% 7.8% 7.1% 5.8% 0.2% Gearing 17.9% 12.1% 1.6% 21.9% 24.4% 14.4% 12.1% 23.9% 24.0% 23.3% Volumes1 Sales (million boe) LNG 96.1 104.5 96.6 91.2 81.2 75.3 69.6 61.2 63.6 57.6 Pipeline gas 37.8 39.6 28.4 2.5 5.3 6.2 5.8 7.6 14.5 13.4 NGLs 5.4 7.1 4.6 0.7 0.4 0.7 0.4 0.7 0.7 0.7 Crude oil and condensate 64.2 50.3 39.3 17.2 19.9 15.2 13.4 14.6 16.2 21 Total 203.5 201.5 168.9 111.6 106.8 97.4 89.2 84.1 95.0 92.7 Production (million boe)6 LNG 85.5 88.6 85.1 70.8 75.0 67.7 71.9 61.7 63.7 57.5 Pipeline gas 38.6 39.7 28.6 2.5 5.3 6.1 5.8 7.3 14.5 13.3 NGLs 6.6 7.1 5.3 0.5 0.5 0.5 0.6 0.6 0.7 0.7 Crude oil and condensate 63.2 51.8 38.7 17.3 19.5 15.3 13.1 14.8 16.0 20.7 Total (million boe) 193.9 187.2 157.7 91.1 100.3 89.6 91.4 84.4 94.9 92.2 Other data Reserves (Proved plus Probable) Natural gas (Tcf)7 12.59 16.02 16.43 11.67 4.50 5.65 6.05 6.54 7.09 7.59 Reserves (Proved plus Probable) Crude oil and condensate (MMbbl)7 849.7 908.7 710.6 244.4 250.7 222.4 175.9 186.9 198.6 176.1 Reserves (Proved plus Probable) NGLs (MMbbl)7 33.9 37.1 48.0 — — —— Other Employees8 4,718 4,667 4,376 3,684 3,670 3,834 3,662 3,597 3,511 3,456 Shares High (A$) 32.46 39.00 39.16 27.40 36.14 37.40 39.00 33.97 31.88 38.33 Low (A$) 23.10 29.53 21.93 19.20 15.27 30.49 28.45 28.16 23.94 26.20 Close (A$) 24.60 31.06 35.44 21.93 22.74 34.38 31.32 33.08 31.16 28.72 Number (000’s) 1,898,750 1,898,750 1,898,750 969,632 962,226 942,287 936,152 842,445 842,445 823,911 Number of shareholders9 607,388 620,891 649,871 261,019 276,431 220,065 209,753 209,383 214,350 225,138 Market capitalisation (USD equivalent at reporting date) 28,960 40,168 45,759 15,948 16,817 22,666 20,681 21,762 18,922 17,250 Market capitalisation (AUD equivalent at reporting date) 46,709 58,975 67,292 21,264 21,881 32,396 29,320 27,868 26,251 23,663 Finding costs ($/boe) (3-year average)10 11.30 10.19 9.78 14.65 30.44 21.71 29.90 26.21 39.06 107.45 Reported effective income tax rate (%) 18.30% 27.5% 30.7% 32.0% 20.5% 57.2% 31.7% 34.0% 35.9% 49.8% Net debt/total market capitalisation (%) 26.60% 11.8% 1.3% 23.7% 23.1% 12.3% 11.6% 21.8% 24.8% 25.0% 1. 2017 has been restated for the impact of AASB 15 Revenue from contracts with customers. Comparative financial information prior to 2016 has not been restated for AASB 15. 2. 2019 includes the adoption of AASB 16 Leases. 3. Earnings per share has been calculated using the following weighted average number of shares (2024:1,895,703,924, 2023: 1,896,498,169, 2022: 1,511,257,404, 2021: 962,604,811; 2020: 951,113,086; 2019: 935,833,092; 2018: 921,165,018; 2017: 866,201,877; 2016: 835,011,896; 2015: 822,943,960; 2014: 822,771,118) 4. Includes other corporate spend. The 2022 capital expenditure has been restated to reflect this. Information prior to 2022 is not available. 5. The calculation for ROACE has been revised in 2014 to use EBIT as the numerator, in addition to a change in the composition of capital employed. ROACE for 2013 has been restated to include this change. 6. Includes production of 192.7 MMboe (2023: 186.1 MMboe) from Woodside reserves and 1.2 MMboe (2023: 1.1 MMboe) primarily from feed gas purchased from Pluto non-operating participants processed through the Pluto-KGP Interconnector. 7. Reporting of reserves by product changed in 2022 to include natural gas; crude oil and condensate; NGLs. For years prior to 2022, NGLs were included in natural gas and crude oil and condensate were reported separately. Years prior to 2022 have otherwise not been restated for any other changes in reporting methodology. 8. Includes vacation students. Comparative information prior to 2023 has not been restated to include vacation students. 9. As per the date specified in the relevant Annual Report. 10. Finding cost methodology is in accordance with SEC industry standard. The 2020 outcome excludes the impact of Greater Pluto (WA-404-P) Proved (1P) Undeveloped Reserves of 91 MMboe to Best Estimate (2C) being reclassified to Contingent Resources, resulting from impairment of Pluto (WA-404-P). 260 WOODSIDE ENERGY GROUP LTD

Head Office Woodside Energy Group Ltd Mia Yellagonga 11 Mount Street Perth WA 6000 Postal Address GPO Box D188 Perth WA 6840 Australia Woodside Energy Group Ltd T +61 8 9348 4000 ABN 55 004 898 962 E companyinfo@woodside.com woodside.com