UNITED STATES
SECURITIES AND EXCHANGE COMMISSION
Washington, D.C. 20549
FORM N-CSRS
CERTIFIED SHAREHOLDER REPORT OF REGISTERED
MANAGEMENT INVESTMENT COMPANIES
Investment Company Act file number 811-05742
Name of Fund: BlackRock Funds
All-Cap Energy & Resources Portfolio
Asset Allocation Portfolio
Aurora Portfolio
Capital Appreciation Portfolio
Energy & Resources Portfolio
Global Opportunities Portfolio
Health Sciences Opportunities Portfolio
International Opportunities Portfolio
Mid-Cap Growth Equity Portfolio
Mid-Cap Value Equity Portfolio
Science & Technology Opportunities Portfolio
Small Cap Core Equity Portfolio
Small Cap Growth Equity Portfolio
Small/Mid-Cap Growth Portfolio
U.S. Opportunities Portfolio
Fund Address: 100 Bellevue Parkway, Wilmington, DE 19809
Name and address of agent for service: Anne F. Ackerley, Chief Executive Officer, BlackRock Funds, 55 East 52nd Street, New York, NY 10055.
Registrant’s telephone number, including area code: (800) 441-7762
Date of fiscal year end: 09/30/2010
Date of reporting period: 03/31/2010
| | | | |
| Item 1 | | – | | Report to Stockholders |
| | |
| BlackRock FundsSM | |  |
| |
| SEMI-ANNUAL REPORT | MARCH 31, 2010 (UNAUDITED) | | |
BlackRock All-Cap Energy & Resources Portfolio
BlackRock Aurora Portfolio
BlackRock Capital Appreciation Portfolio
BlackRock Energy & Resources Portfolio
NOT FDIC INSURED
MAY LOSE VALUE
NO BANK GUARANTEE
Table of Contents
| | | | | | |
| 2 | | BLACKROCK FUNDS | | MARCH 31, 2010 | | |
Dear Shareholder
The past year has seen a remarkable turnaround from the conditions that plagued the global economy and financial markets in 2008 through early 2009. In our opinion, the “Great Recession” likely ended at some point last summer, thanks primarily to massive fiscal and monetary stimulus. From that point, the global economy has moved into recovery mode and, we believe, is getting ready to start transitioning into an expansion.
Global equity markets bottomed in early 2009 and since that time have soared dramatically higher as investors were lured back into the markets by depressed valuations, desire for higher yields and increasing confidence that all-out financial disaster had been averted. There have been several corrections along the way and volatility levels have remained elevated — reflections of mixed economic data, lingering deflation issues (especially in Europe) and concerns over the future direction of interest rates. On balance, however, strong corporate earnings and a positive macro backdrop have helped keep the equity bull market intact. From a geographic perspective, US equities have generally outpaced their international counterparts in recent months, as the domestic economic recovery has been more pronounced.
Within fixed income markets, improving economic conditions, concerns over the US deficit and a lack of demand at recent Treasury auctions have recently conspired to push Treasury yields higher (and prices correspondingly lower). In this environment, Treasuries have dramatically underperformed other areas of the bond market, particularly the high yield sector, which has been benefiting from increased investor demand. Meanwhile, municipal bonds outperformed taxable sectors over the twelve-month period thanks to continued high demand levels, but have struggled in recent months against a weak fundamental backdrop marked by ongoing state and local budget problems. As in the taxable arena, high yield municipals have been outperforming the rest of the market.
Regarding cash investments, yields on money market securities remain near all-time lows (producing returns only marginally above zero percent), with the Federal Open Market Committee reiterating that economic circumstances are likely to necessitate an accommodative interest rate stance for an “extended period.”
Against this backdrop, the major market averages posted the following returns:
| | | | | | |
Total Returns as of March 31, 2010 | | 6-month | | | 12-month | |
US equities (S&P 500 Index) | | 11.75 | % | | 49.77 | % |
Small cap US equities (Russell 2000 Index) | | 13.07 | | | 62.76 | |
International equities (MSCI Europe, Australasia, Far East Index) | | 3.06 | | | 54.44 | |
3-month Treasury bill (BofA Merrill Lynch 3-Month Treasury Bill Index) | | 0.05 | | | 0.17 | |
US Treasury securities (BofA Merrill Lynch 10-Year US Treasury Index) | | (2.62 | ) | | (6.30 | ) |
Taxable fixed income (Barclays Capital US Aggregate Bond Index) | | 1.99 | | | 7.69 | |
Tax-exempt fixed income (Barclays Capital Municipal Bond Index) | | 0.28 | | | 9.69 | |
High yield bonds (Barclays Capital US Corporate High Yield 2% Issuer Capped Index) | | 10.97 | | | 55.64 | |
Past performance is no guarantee of future results. Index performance shown for illustrative purposes only. You cannot invest directly in an index.
Global financial markets continue to show signs of improvement, but questions about the strength and sustainability of the recovery abound. Through periods of uncertainty, as ever, BlackRock’s full resources are dedicated to the management of our clients’ assets. For additional market perspective and investment insight, visit www.blackrock.com/shareholdermagazine, where you’ll find the most recent issue of our award-winning Shareholder® magazine, as well as its quarterly companion newsletter, Shareholder Perspectives. As always, we thank you for entrusting BlackRock with your investments, and we look forward to your continued partnership in the months and years ahead.
|
| Sincerely, |
|
 |
| Rob Kapito |
| President, BlackRock Advisors, LLC |
THIS PAGE NOT PART OF YOUR FUND REPORT
| | |
| Fund Summary as of March 31, 2010 | | BlackRock All-Cap Energy & Resources Portfolio |
| |
Portfolio Management Commentary | | |
How did the Fund perform?
| | • | | During the six-month period, the Fund outperformed its custom blended benchmark, which is comprised 70% of the Wilshire 5000 Modified Energy Cap Weighted Index and 30% of the MSCI All-Country World Energy Index, but underperformed the broad-market S&P 500 Index. The following discussion of relative performance pertains to the Fund’s custom blended benchmark. |
What factors influenced performance?
| | • | | Coal stocks have been an area of leadership within energy over the past couple of quarters. Pricing in Asia strengthened substantially – especially for metallurgical coal – due to strong coal demand. Accordingly, stocks with metallurgical exposure, such as Massey Energy Co., have been strong performers. On the whole, the Fund’s overweight allocation to coal and our strong stock selection within the segment powered both absolute and relative returns during the reporting period. Additionally, our modest overweight exposure to the diversified metals/ mining complex generated positive relative returns, as demand for industrial metals improved during the six months. |
| | • | | Conversely, the Fund’s gold allocation hurt relative returns. The segment had been strong on US dollar (USD) weakness, but the USD experienced a countertrend rally during the period, and gold prices and gold producers suffered. In particular, Agnico-Eagle Mines Ltd. declined more than 16%. Additionally, the Fund’s long-standing underweight in the oil and gas storage and transportation segment hurt relative returns. |
Describe recent portfolio activity.
| | • | | Natural gas prices have lagged the rally in the majority of natural resources. As a result, we selectively added to certain gas producers late in the reporting period. We are emphasizing shale gas producers, as we believe they represent good value at current prices, with significant upside due to strong production growth and the eventual recovery of gas prices. |
Describe Fund positioning at period end.
| | • | | At period end, we continue to be aggressively positioned, with a preference for coal and oil and gas exploration and production stocks. In the current environment, the equities across the energy complex are discounting long-term commodity price expectations far below what we expect given reasonable worldwide economic growth. |
The views expressed reflect the opinions of BlackRock as of the date of this report and are subject to change based on changes in market, economic or other conditions. These views are not intended to be a forecast of future events and are no guarantee of future results.
Portfolio Information
| | | |
Ten Largest Holdings | | Percent of
Long-Term
Investments | |
Massey Energy Co. | | 5 | % |
CONSOL Energy, Inc. | | 4 | |
Whiting Petroleum Corp. | | 4 | |
Occidental Petroleum Corp. | | 3 | |
Apache Corp. | | 3 | |
EOG Resources, Inc. | | 3 | |
Core Laboratories NV | | 3 | |
FMC Technologies, Inc. | | 3 | |
Peabody Energy Corp. | | 3 | |
Penn West Energy Trust | | 3 | |
| |
Industry Allocation | | Percent of
Long-Term
Investments | |
Oil, Gas & Consumable Fuels | | 66 | % |
Energy Equipment & Services | | 18 | |
Metals & Mining | | 9 | |
Gas Utilities | | 4 | |
Chemicals | | 3 | |
For Fund compliance purposes, the Fund’s industry classifications refer to any one or more of the industry sub-classifications used by one or more widely recognized market indexes or ratings group indexes, and/or as defined by Fund management. This definition may not apply for purposes of this report, which may combine industry sub-classifications for reporting ease.
| | | | | | |
| 4 | | BLACKROCK FUNDS | | MARCH 31, 2010 | | |
BlackRock All-Cap Energy & Resources Portfolio
Total Return Based on a $10,000 Investment
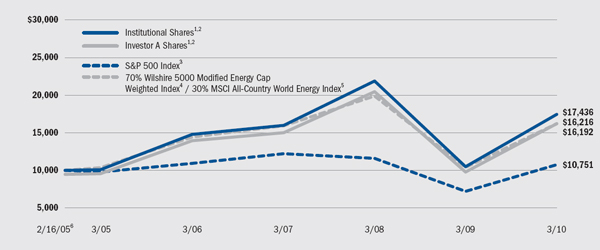
| 1 | Assuming maximum sales charge, if any, transaction costs and other operating expenses, including advisory fees. Institutional Shares do not have a sales charge. |
| 2 | Under normal market conditions, the Fund invests at least 80% of its total assets in securities of global energy and natural resources companies and companies in associated businesses, as well as utilities (such as gas, water, cable, electrical and telecommunications utilities). |
| 3 | This unmanaged total return index covers 500 industrial, utility, transportation and financial companies of the US markets (mostly New York Stock Exchange (“NYSE”) issues) representing about 75% of NYSE market capitalization and 30% of NYSE issues. S&P 500 is a trademark of the McGraw-Hill Companies. |
| 4 | The Wilshire 5000 Modified Energy Cap Weighted Index is a customized index comprised of the energy sector constituents of the Wilshire 5000 (Full Cap) Index which have been market capitalization weighted and the six largest securities and all securities that have a percentage market value below 0.01% have been removed. |
| 5 | The MSCI All-Country World Energy Index is comprised of the energy sector constituents of the MSCI All-Country World Index, a free float-adjusted market capitalization weighted index designed to measure the equity market performance of developed and emerging markets. |
| 6 | Commencement of operations. |
Performance Summary for the Period Ended March 31, 2010
| | | | | | | | | | | | | | | | | | | | | |
| | | | | | Average Annual Total Returns7 | |
| | | | | | 1 Year | | | 5 Year | | | Since Inception8 | |
| | | 6-Month
Total Returns | | | w/o sales
charge | | | w/ sales
charge | | | w/o sales
charge | | | w/ sales
charge | | | w/o sales
charge | | | w/ sales
charge | |
Institutional | | 10.51 | % | | 66.10 | % | | N/A | | | 11.63 | % | | N/A | | | 11.48 | % | | N/A | |
Service | | 10.29 | | | 65.44 | | | N/A | | | 11.18 | | | N/A | | | 11.04 | | | N/A | |
Investor A | | 10.26 | | | 65.39 | | | 56.75 | % | | 11.17 | | | 9.97 | % | | 11.03 | | | 9.87 | % |
Investor B | | 9.88 | | | 64.27 | | | 59.77 | | | 10.38 | | | 10.11 | | | 10.21 | | | 10.08 | |
Investor C | | 9.87 | | | 64.19 | | | 63.19 | | | 10.36 | | | 10.36 | | | 10.24 | | | 10.24 | |
S&P 500 Index | | 11.75 | | | 49.77 | | | N/A | | | 1.92 | | | N/A | | | 1.42 | | | N/A | |
70% Wilshire 5000 Modified Energy Cap Weighted Index / 30% MSCI All-Country World Energy Index | | 8.66 | | | 56.31 | | | N/A | | | 9.36 | | | N/A | | | 9.89 | | | N/A | |
| 7 | Assuming maximum sales charges, if any. Average annual total returns with and without sales charges reflect reductions for distribution and service fees. See “About Fund Performance” on page 12 for a detailed description of share classes, including any related sales charges and fees. |
| 8 | The Fund commenced operations on February 16, 2005. |
N/A - Not applicable as share class and index do not have a sales charge.
Past performance is not indicative of future results.
Expense Example
| | | | | | | | | | | | | | | | | | |
| | | Actual | | Hypothetical10 |
| | | Beginning
Account Value
October 1, 2009 | | Ending
Account Value
March 31, 2010 | | Expenses Paid
During the Period9 | | Beginning
Account Value
October 1, 2009 | | Ending
Account Value
March 31, 2010 | | Expenses Paid
During the Period9 |
Institutional | | $ | 1,000 | | $ | 1,105.10 | | $ | 4.88 | | $ | 1,000 | | $ | 1,020.29 | | $ | 4.68 |
Service | | $ | 1,000 | | $ | 1,102.90 | | $ | 7.03 | | $ | 1,000 | | $ | 1,018.25 | | $ | 6.74 |
Investor A | | $ | 1,000 | | $ | 1,102.60 | | $ | 7.02 | | $ | 1,000 | | $ | 1,018.25 | | $ | 6.74 |
Investor B | | $ | 1,000 | | $ | 1,098.80 | | $ | 10.99 | | $ | 1,000 | | $ | 1,014.46 | | $ | 10.55 |
Investor C | | $ | 1,000 | | $ | 1,098.70 | | $ | 10.88 | | $ | 1,000 | | $ | 1,014.56 | | $ | 10.45 |
| 9 | For each class of the Fund, expenses are equal to the annualized expense ratio for the class (0.93% for Institutional, 1.34% for Service, 1.34% for Investor A, 2.10% for Investor B and 2.08% for Investor C), multiplied by the average account value over the period, multiplied by 182/365 (to reflect the one-half year period shown). |
| 10 | Hypothetical 5% annual return before expenses is calculated by pro rating the number of days in the most recent fiscal half-year divided by 365. |
See “Disclosure of Expenses” on page 13 for further information on how expenses were calculated.
| | | | | | |
| | | BLACKROCK FUNDS | | MARCH 31, 2010 | | 5 |
| | |
| Fund Summary as of March 31, 2010 | | BlackRock Aurora Portfolio |
| |
Portfolio Management Commentary | | |
How did the Fund perform?
| | • | | The Fund generated strong results for the six-month period, but underperformed its benchmark, Russell 2500 Value Index. |
What factors influenced performance?
| | • | | Positive stock selection in the health care sector, particularly among health care providers, pharmaceutical makers and health care equipment manufacturers, boosted Fund performance for the period. Notable individual contributors included respiratory therapy provider Lincare Holdings, Inc. and Lifepoint Hospitals, Inc. Strong overall selection in the energy sector also added value, even though natural gas related holdings slumped in conjunction with falling gas prices. In the more defensive utilities sector, an underweight in independent power producers and stock selection among water utilities contributed to results. An underweight in the financials sector and strong performance from the Fund’s metals and mining holdings also benefited performance comparisons. |
| | • | | In contrast, poor relative returns from the Fund’s holdings in the industrials sector hampered performance. In particular, prison operator Corrections Corp. of America and Mueller Water Products, Inc. - Class A stumbled, weighing on overall results. Consumer discretionary stocks rallied during the period on a pickup in consumer spending levels and increasing optimism around the broader economic outlook. Although the Fund’s consumer discretionary holdings produced strong absolute returns, they trailed their benchmark counterparts. Weakness was most pronounced among restaurants and gaming-related names. Lottery ticket maker Scientific Games Corp. - Class A was a notable individual detractor as shares slid in response to disappointing quarterly earnings. Lastly, the Fund’s cash position had a negative impact on performance, given the strong upward move in stock prices during the period. |
Describe recent portfolio activity.
| | • | | During the six months, we reduced an underweight in the financials sector by adding positions in the capital markets, thrifts and mortgage finance and insurance sub-sectors. In utilities, we added several electric utilities names, including Northeast Utilities and NV Energy, Inc. Conversely, we pared an overweight in information technology by selling electronic equipment, instruments and components and semiconductor-related names, such as Tech Data Corp. and Fairchild Semiconductor International, Inc. Similarly, we reduced our weighting in consumer discretionary, closing positions in leisure products manufacturer Hasbro, Inc. and apparel retailer Guess?, Inc. |
Describe Fund positioning at period end.
| | • | | At period end, the Fund continued to maintain a pro-cyclical bias, with overweights in the consumer discretionary, industrials and information technology sectors, and underweights in financials and utilities. While we continue to believe recovery is underway, the road ahead will likely be bumpy. We remain focused on identifying attractively-valued stocks of companies that have rationalized their cost structure, but have the opportunity to increase revenues and maximize operating leverage in a slow-growth environment. We also expect merger and acquisition activity to accelerate this year, which could provide an additional catalyst for stock prices among small- to mid-capitalization companies. |
��
| | • | | On February 23, 2010, the Board of Trustees approved a plan of reorganization, subject to shareholder approval and certain other conditions, whereby BlackRock Mid-Cap Value Equity Portfolio of BlackRock FundsSM will acquire substantially all of the assets and assume certain stated liabilities of the Fund in exchange for newly issued shares of BlackRock Mid-Cap Value Equity Portfolio. |
The views expressed reflect the opinions of BlackRock as of the date of this report and are subject to change based on changes in market, economic or other conditions. These views are not intended to be a forecast of future events and are no guarantee of future results.
Portfolio Information
| | | |
Ten Largest Holdings | | Percent of
Long-Term
Investments | |
Arbitron, Inc. | | 2 | % |
PHH Corp. | | 2 | |
Donaldson Co., Inc. | | 2 | |
Alpha Natural Resources, Inc. | | 2 | |
CVB Financial Corp. | | 1 | |
Lincare Holdings, Inc. | | 1 | |
Corrections Corp. of America | | 1 | |
TreeHouse Foods, Inc. | | 1 | |
Affiliated Managers Group, Inc. | | 1 | |
Cablevision Systems Corp. - Class A | | 1 | |
| | | |
Sector Allocation | | Percent of
Long-Term
Investments | |
Financials | | 28 | % |
Consumer Discretionary | | 16 | |
Industrials | | 15 | |
Information Technology | | 12 | |
Materials | | 6 | |
Health Care | | 6 | |
Energy | | 6 | |
Utilities | | 5 | |
Consumer Staples | | 5 | |
Telecommunication Services | | 1 | |
For Fund compliance purposes, the Fund’s sector classifications refer to any one or more of the sector sub-classifications used by one or more widely recognized market indexes or ratings group indexes, and/or as defined by Fund management. This definition may not apply for purposes of this report, which may combine sector sub-classifications for reporting ease.
| | | | | | |
| 6 | | BLACKROCK FUNDS | | MARCH 31, 2010 | | |
BlackRock Aurora Portfolio
Total Return Based on a $10,000 Investment
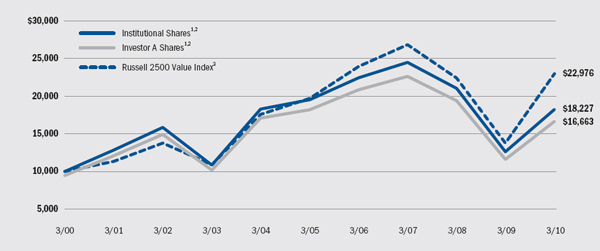
| 1 | Assuming maximum sales charge, if any, transaction costs and other operating expenses, including advisory fees. Institutional Shares do not have a sales charge. |
| 2 | Under normal market conditions, the Fund invests at least 80% of its total assets in small- and mid-capitalization common and preferred stocks and securities convertible into common and preferred stocks. |
| 3 | An index composed of the Russell 2500 companies with lower price-to-book ratios and lower forecasted growth values. |
Performance Summary for the Period Ended March 31, 2010
| | | | | | | | | | | | | | | | | | | | | |
| | | | | | Average Annual Total Returns4 | |
| | | | | | 1 Year | | | 5 Years | | | 10 Years | |
| | | 6-Month
Total Returns | | | w/o sales
charge | | | w/ sales
charge | | | w/o sales
charge | | | w/ sales
charge | | | w/o sales
charge | | | w/ sales
charge | |
Institutional | | 13.68 | % | | 44.60 | % | | N/A | | | (1.37 | )% | | N/A | | | 6.19 | % | | N/A | |
Investor A | | 13.45 | | | 44.02 | | | 36.45 | % | | (1.74 | ) | | (2.79 | )% | | 5.81 | | | 5.24 | % |
Investor B | | 13.00 | | | 42.94 | | | 38.44 | | | (2.49 | ) | | (2.65 | ) | | 5.20 | | | 5.20 | |
Investor C | | 13.08 | | | 42.93 | | | 41.93 | | | (2.47 | ) | | (2.47 | ) | | 5.04 | | | 5.04 | |
Class R | | 13.30 | | | 43.61 | | | N/A | | | (1.90 | ) | | N/A | | | 5.60 | | | N/A | |
Russell 2500 Value Index | | 14.66 | | | 67.17 | | | N/A | | | 3.14 | | | N/A | | | 8.67 | | | N/A | |
| 4 | Assuming maximum sales charges, if any. Average annual total returns with and without sales charges reflect reductions for distribution and service fees. See “About Fund Performance” on page 12 for a detailed description of share classes, including any related sales charges and fees. |
N/A - Not applicable as share class and index do not have a sales charge.
Past performance is not indicative of future results.
Expense Example
| | | | | | | | | | | | | | | | | | |
| | | Actual | | Hypothetical6 |
| | | Beginning
Account Value
October 1, 2009 | | Ending
Account Value
March 31, 2010 | | Expenses Paid
During the Period5 | | Beginning
Account Value
October 1, 2009 | | Ending
Account Value
March 31, 2010 | | Expenses Paid
During the Period5 |
Institutional | | $ | 1,000 | | $ | 1,136.80 | | $ | 5.75 | | $ | 1,000 | | $ | 1,019.55 | | $ | 5.44 |
Investor A | | $ | 1,000 | | $ | 1,134.50 | | $ | 7.88 | | $ | 1,000 | | $ | 1,017.55 | | $ | 7.44 |
Investor B | | $ | 1,000 | | $ | 1,130.00 | | $ | 12.00 | | $ | 1,000 | | $ | 1,013.66 | | $ | 11.35 |
Investor C | | $ | 1,000 | | $ | 1,130.80 | | $ | 12.01 | | $ | 1,000 | | $ | 1,013.66 | | $ | 11.35 |
Class R | | $ | 1,000 | | $ | 1,133.00 | | $ | 8.77 | | $ | 1,000 | | $ | 1,016.70 | | $ | 8.30 |
| 5 | For each class of the Fund, expenses are equal to the annualized expense ratio for the class (1.08% for Institutional, 1.48% for Investor A, 2.26% for Investor B, 2.26% for Investor C and 1.65% for Class R), multiplied by the average account value over the period, multiplied by 182/365 (to reflect the one-half year period shown). |
| 6 | Hypothetical 5% annual return before expenses is calculated by pro rating the number of days in the most recent fiscal half-year divided by 365. |
See “Disclosure of Expenses” on page 13 for further information on how expenses were calculated.
| | | | | | |
| | | BLACKROCK FUNDS | | MARCH 31, 2010 | | 7 |
| | |
| Fund Summary as of March 31, 2010 | | BlackRock Capital Appreciation Portfolio |
| |
Portfolio Management Commentary | | |
How did the Fund perform?
| | • | | The Fund generated strong returns for the six-month period, but underperformed its benchmark, Russell 1000 Growth Index. |
What factors influenced performance?
| | • | | Stock selection in the industrials sector provided the greatest contribution to the Fund’s relative performance during the reporting period. Within the sector, the Fund’s significant investment in transportation-related companies accounted for the outperformance. Delta Air Lines, Inc. and truck engine manufacturer Cummins, Inc. both surged higher, as the companies continue to experience strong industry growth cycles. |
| | • | | Sector allocation also added value during the period, due to modest overweights in the industrials and consumer discretionary sectors and an underweight exposure to the declining utilities sector. |
| | • | | Despite positive results in the health care providers and services industry, the health care sector detracted significantly from the Fund’s relative returns. Stock-specific fundamental disappointments at Boston Scientific Corp. and Genzyme Corp. accounted for much of the weakness. |
| | • | | Stock selection in information technology detracted, as poor performance in the communications equipment industry overshadowed stock selection success in several other industries. In communications equipment, competition in the smartphone market produced underperformance at both wireless chip manufacturer QUALCOMM, Inc. and smartphone maker Palm, Inc. |
| | • | | Stock selection in the financials and energy sectors also detracted, to a lesser degree. |
Describe recent portfolio activity.
| | • | | The Fund’s sector allocation remained quite stable during the six months. Allocations to the industrials and consumer discretionary sectors increased modestly, while the investment in the energy and financials sectors declined. |
Describe Fund positioning at period end.
| | • | | At period end, our largest overweights relative to the Russell 1000 Growth Index were in the consumer discretionary and industrials sectors, while our most substantial underweight was in consumer staples. |
| | • | | On February 9, 2010, the Board of Trustees approved a plan of reorganization, subject to shareholder approval and certain other conditions, whereby BlackRock Fundamental Growth Fund, Inc. will acquire substantially all of the assets and assume certain stated liabilities of the Fund in exchange for newly issued shares of BlackRock Fundamental Growth Fund, Inc. |
The views expressed reflect the opinions of BlackRock as of the date of this report and are subject to change based on changes in market, economic or other conditions. These views are not intended to be a forecast of future events and are no guarantee of future results.
Portfolio Information
| | | |
Ten Largest Holdings | | Percent of
Long-Term
Investments | |
Apple, Inc. | | 5 | % |
Microsoft Corp. | | 5 | |
Google, Inc. - Class A | | 4 | |
Hewlett-Packard Co. | | 3 | |
The Procter & Gamble Co. | | 3 | |
Amazon.com, Inc. | | 3 | |
Danaher Corp. | | 3 | |
The Coca-Cola Co. | | 2 | |
Delta Air Lines, Inc. | | 2 | |
Abbott Laboratories | | 2 | |
| | | |
Sector Allocation | | Percent of
Long-Term
Investments | |
Information Technology | | 34 | % |
Health Care | | 16 | |
Consumer Discretionary | | 14 | |
Industrials | | 13 | |
Consumer Staples | | 11 | |
Financials | | 4 | |
Energy | | 4 | |
Materials | | 3 | |
Telecommunication Services | | 1 | |
For Fund compliance purposes, the Fund’s sector classifications refer to any one or more of the sector sub-classifications used by one or more widely recognized market indexes or ratings group indexes, and/or as defined by Fund management. This definition may not apply for purposes of this report, which may combine sector sub-classifications for reporting ease.
| | | | | | |
| 8 | | BLACKROCK FUNDS | | MARCH 31, 2010 | | |
| | |
| | BlackRock Capital Appreciation Portfolio |
| |
Total Return Based on a $10,000 Investment | | |
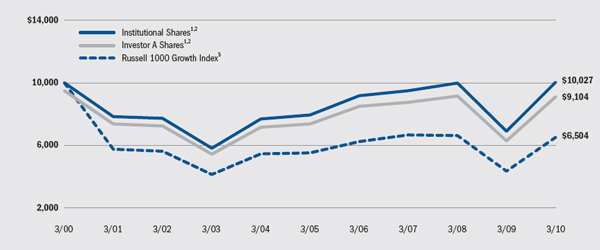
| 1 | Assuming maximum sales charge, if any, transaction costs and other operating expenses, including advisory fees. Institutional Shares do not have a sales charge. |
| 2 | Under normal market conditions, the Fund invests at least 80% of total assets in common and preferred stock and securities convertible into common and preferred stock of mid- and large-size companies. |
| 3 | An index composed of those Russell 1000 securities with greater-than-average growth orientation, generally having higher price-to-book and price-to-earnings ratios, lower dividend yields and higher forecasted growth values. |
Performance Summary for the Period Ended March 31, 2010
| | | | | | | | | | | | | | | | | | | | | |
| | | | | | Average Annual Total Returns4 | |
| | | | | | 1 Year | | | 5 Years | | | 10 Years | |
| | | 6-Month
Total Returns | | | w/o sales
charge | | | w/sales
charge | | | w/o sales
charge | | | w/sales
charge | | | w/o sales
charge | | | w/sales
charge | |
Institutional | | 10.85 | % | | 45.77 | % | | N/A | | | 4.82 | % | | N/A | | | 0.03 | % | | N/A | |
Investor A | | 10.59 | | | 45.07 | | | 37.43 | % | | 4.35 | | | 3.24 | % | | (0.40 | ) | | (0.93 | )% |
Investor B | | 10.10 | | | 43.71 | | | 39.21 | | | 3.51 | | | 3.16 | | | (0.99 | ) | | (0.99 | ) |
Investor C | | 10.19 | | | 44.13 | | | 43.13 | | | 3.66 | | | 3.66 | | | (1.08 | ) | | (1.08 | ) |
Russell 1000 Growth Index | | 12.96 | | | 49.75 | | | N/A | | | 3.42 | | | N/A | | | (4.21 | ) | | N/A | |
| 4 | Assuming maximum sales charges, if any. Average annual total returns with and without sales charges reflect reductions for distribution and service fees. See “About Fund Performance” on page 12 for a detailed description of share classes, including any related sales charges and fees. |
N/A - Not applicable as share class and index do not have a sales charge.
Past performance is not indicative of future results.
Expense Example
| | | | | | | | | | | | | | | | | | |
| | | Actual | | Hypothetical6 |
| | | Beginning
Account Value
October 1, 2009 | | Ending
Account Value
March 31, 2010 | | Expenses Paid
During the Period5 | | Beginning
Account Value
October 1, 2009 | | Ending
Account Value
March 31, 2010 | | Expenses Paid
During the Period5 |
Institutional | | $ | 1,000 | | $ | 1,108.50 | | $ | 3.78 | | $ | 1,000 | | $ | 1,021.34 | | $ | 3.63 |
Investor A | | $ | 1,000 | | $ | 1,105.90 | | $ | 6.09 | | $ | 1,000 | | $ | 1,019.15 | | $ | 5.84 |
Investor B | | $ | 1,000 | | $ | 1,101.00 | | $ | 11.16 | | $ | 1,000 | | $ | 1,014.31 | | $ | 10.70 |
Investor C | | $ | 1,000 | | $ | 1,101.90 | | $ | 9.90 | | $ | 1,000 | | $ | 1,015.51 | | $ | 9.50 |
| 5 | For each class of the Fund, expenses are equal to the annualized expense ratio for the class (0.72% for Institutional, 1.16% for Investor A, 2.13% for Investor B and 1.89% for Investor C), multiplied by the average account value over the period, multiplied by 182/365 (to reflect the one-half year period shown). |
| 6 | Hypothetical 5% annual return before expenses is calculated by pro rating the number of days in the most recent fiscal half-year divided by 365. See “Disclosure of Expenses” on page 13 for further information on how expenses were calculated. |
| | | | | | |
| | | BLACKROCK FUNDS | | MARCH 31, 2010 | | 9 |
| | |
| Fund Summary as of March 31, 2010 | | BlackRock Energy & Resources Portfolio |
| |
Portfolio Management Commentary | | |
How did the Fund perform?
| | • | | During the six-month period, the Fund’s Institutional Shares performed in line with its custom benchmark, the Wilshire 5000 Modified Energy Equal Weighted Index, while Investor A, Investor B and Investor C Shares underperformed the index. Meanwhile, the Fund outperformed the broad-market S&P 500 Index. The following discussion of relative performance pertains to the Fund’s custom benchmark. |
What factors influenced performance?
| | • | | Coal stocks have been an area of leadership within energy over the past couple of quarters. Pricing in Asia strengthened substantially – especially for metallurgical coal – due to strong coal demand; accordingly, stocks with metallurgical exposure, such as Massey Energy Co., have been strong performers. Notably, shares of Massey Energy Co. rose more than 85% during the six months. On the whole, our overweight allocation to coal and our strong stock selection within the segment powered both absolute and relative returns during the reporting period. |
| | • | | Conversely, the Fund’s long-standing underweight in the oil and gas storage and transportation segment hurt relative returns. Our focus on natural gas shale producers also hurt relative performance, as natural gas prices significantly lagged other energy commodities during the period. Nevertheless, natural gas prices are notoriously volatile, and we feel that they cannot go much lower than current pricing at around $4/Mcf (one thousand cubic feet). |
Describe recent portfolio activity.
| | • | | Sub-industry exposures relative to the custom benchmark have been unchanged for quite some time, thus, turnover is very low. We did take some profits in the metals segment and directed the sales proceeds to areas within energy that we continue to find attractive, such as coal and exploration and production stocks. |
Describe Fund positioning at period end.
| | • | | At period end, we continue to be aggressively positioned, with a preference for coal and oil and gas exploration and production stocks. In the current environment, the equities across the energy complex are discounting long-term commodity price expectations far below what we expect given reasonable worldwide economic growth. |
The views expressed reflect the opinions of BlackRock as of the date of this report and are subject to change based on changes in market, economic or other conditions. These views are not intended to be a forecast of future events and are no guarantee of future results.
Portfolio Information
| | | |
Ten Largest Holdings | | Percent of
Long-Term
Investments | |
Massey Energy Co. | | 9 | % |
Southwestern Energy Co. | | 4 | |
CONSOL Energy, Inc. | | 4 | |
Plains Exploration & Production Co. | | 4 | |
Petrohawk Energy Corp. | | 4 | |
Peabody Energy Corp. | | 4 | |
Alpha Natural Resources, Inc. | | 4 | |
Penn Virginia Corp. | | 4 | |
Newfield Exploration Co. | | 3 | |
Chesapeake Energy Corp. | | 3 | |
| | | |
Industry Allocation | | Percent of
Long-Term
Investments | |
Oil, Gas & Consumable Fuels | | 83 | % |
Metals & Mining | | 11 | |
Energy Equipment & Services | | 4 | |
Gas Utilities | | 2 | |
For Fund compliance purposes, the Fund’s industry classifications refer to any one or more of the industry sub-classifications used by one or more widely recognized market indexes or ratings group indexes, and/or as defined by Fund management. This definition may not apply for purposes of this report, which may combine industry sub-classifications for reporting ease.
| | | | | | |
| 10 | | BLACKROCK FUNDS | | MARCH 31, 2010 | | |
| | |
| | BlackRock Energy & Resources Portfolio |
| |
Total Return Based on a $10,000 Investment | | |

| 1 | Assuming maximum sales charge, if any, transaction costs and other operating expenses, including advisory fees. Institutional Shares do not have a sales charge. |
| 2 | Under normal market conditions, the Fund invests at least 80% of its total assets in securities of global energy and natural resources companies and companies in associated businesses, as well as utilities (such as gas, water, cable, electrical and telecommunications utilities). |
| 3 | This unmanaged total return index covers 500 industrial, utility, transportation and financial companies of the US markets (mostly NYSE issues) representing about 75% of NYSE market capitalization and 30% of NYSE issues. S&P 500 is a trademark of the McGraw-Hill Companies. |
| 4 | The Wilshire 5000 Modified Energy Equal Weighted Index is a customized index comprised of the energy sector constituents of the Wilshire 5000 (Full Cap) Index which have been equally weighted and the six largest securities and all securities that have a percentage market value below 0.01% have been removed. |
Performance Summary for the Period Ended March 31, 2010
| | | | | | | | | | | | | | | | | | | | | |
| | | | | | Average Annual Total Returns5 | |
| | | | | | 1 Year | | | 5 Years | | | 10 Years | |
| | | 6-Month
Total Returns | | | w/o sales
charge | | | w/sales
charge | | | w/o sales
charge | | | w/sales
charge | | | w/o sales
charge | | | w/sales
charge | |
Institutional | | 13.71 | % | | 91.43 | % | | N/A | | | 10.32 | % | | N/A | | | 22.02 | % | | N/A | |
Investor A | | 13.50 | | | 90.74 | | | 80.68 | % | | 9.98 | | | 8.80 | % | | 21.59 | | | 20.93 | % |
Investor B | | 13.03 | | | 89.21 | | | 84.71 | | | 9.16 | | | 9.02 | | | 20.92 | | | 20.92 | |
Investor C | | 13.06 | | | 89.26 | | | 88.26 | | | 9.19 | | | 9.19 | | | 20.76 | | | 20.76 | |
S&P 500 Index | | 11.75 | | | 49.77 | | | N/A | | | 1.92 | | | N/A | | | (0.65 | ) | | N/A | |
Wilshire 5000 Modified Energy Equal Weighted Index | | 13.68 | | | 91.89 | | | N/A | | | 9.93 | | | N/A | | | 16.07 | | | N/A | |
| 5 | Assuming maximum sales charges, if any. Average annual total returns with and without sales charges reflect reductions for distribution and service fees. See “About Fund Performance” on page 12 for a detailed description of share classes, including any related sales charges and fees. |
N/A - Not applicable as share class and index do not have a sales charge.
Past performance is not indicative of future results.
Expense Example
| | | | | | | | | | | | | | | | | | |
| | | Actual | | Hypothetical7 |
| | | Beginning
Account Value
October 1, 2009 | | Ending
Account Value
March 31, 2010 | | Expenses Paid
During the Period6 | | Beginning
Account Value
October 1, 2009 | | Ending
Account Value
March 31, 2010 | | Expenses Paid
During the Period6 |
Institutional | | $ | 1,000 | | $ | 1,137.10 | | $ | 4.96 | | $ | 1,000 | | $ | 1,020.29 | | $ | 4.68 |
Investor A | | $ | 1,000 | | $ | 1,135.00 | | $ | 7.13 | | $ | 1,000 | | $ | 1,018.25 | | $ | 6.74 |
Investor B | | $ | 1,000 | | $ | 1,130.30 | | $ | 11.10 | | $ | 1,000 | | $ | 1,014.51 | | $ | 10.50 |
Investor C | | $ | 1,000 | | $ | 1,130.60 | | $ | 10.84 | | $ | 1,000 | | $ | 1,014.76 | | $ | 10.25 |
| 6 | For each class of the Fund, expenses are equal to the annualized expense ratio for the class (0.93% for Institutional, 1.34% for Investor A, 2.09% Investor B and 2.04% for Investor C), multiplied by the average account value over the period, multiplied by 182/365 (to reflect the one-half year period shown). |
| 7 | Hypothetical 5% annual return before expenses is calculated by pro rating the number of days in the most recent fiscal half-year divided by 365. See “Disclosure of Expenses” on page 13 for further information on how expenses were calculated. |
| | | | | | |
| | | BLACKROCK FUNDS | | MARCH 31, 2010 | | 11 |
About Fund Performance
| | • | | Institutional Shares are not subject to any sales charge. Institutional Shares bear no ongoing distribution or service fees and are available only to eligible investors. |
| | • | | Service Shares are not subject to any sales charge (front-end load) or deferred sales charge. Service Shares are subject to a service fee of 0.25% per year (but no distribution fee). |
| | • | | Investor A Shares incur a maximum initial sales charge (front-end load) of 5.25% and a service fee of 0.25% per year (but no distribution fee). |
| | • | | Investor B Shares are subject to a maximum contingent deferred sales charge of 4.50% declining to 0% after six years. In addition, Investor B Shares are subject to a distribution fee of 0.75% per year and a service fee of 0.25% per year. Investor B Shares automatically convert to Investor A Shares after approximately eight years. (There is no initial sales charge for automatic share conversions.) All returns for periods greater than eight years reflect this conversion. Investor B Shares are only available for purchase through exchanges, dividend reinvestment or for purchase by certain qualified employee benefit plans. |
| | • | | Investor C Shares are subject to a 1.00% contingent deferred sales charge if redeemed within one year of purchase. In addition, Investor C Shares are subject to a distribution fee of 0.75% per year and a service fee of 0.25% per year. |
| | • | | Class R Shares are not subject to any sales charge. Class R Shares are subject to a distribution fee of 0.25% per year and a service fee of 0.25% per year. Class R Shares are available only to certain retirement and other similar plans. Prior to October 2, 2006, BlackRock Aurora Portfolio’s Class R Share performance results are those of Institutional Shares (which have no distribution or service fees) restated to reflect Class R Share fees. |
Performance information reflects past performance and does not guarantee future results. Current performance may be lower or higher than the performance data quoted. Refer to www.blackrock.com/funds to obtain performance data current to the most recent month-end. Performance results do not reflect the deduction of taxes that a shareholder would pay on fund distributions or the redemption of fund shares. Each Fund other than BlackRock Capital Appreciation Portfolio may charge a 2% redemption fee for sales or exchanges of shares within 30 days of purchase or exchange. Performance data does not reflect this potential fee. Figures shown in each of the performance tables on the previous pages assume reinvestment of all dividends and distributions, if any, at net asset value on the payable date. Investment return and principal value of shares will fluctuate so that shares, when redeemed, may be worth more or less than their original cost.
Performance for BlackRock Aurora, BlackRock Capital Appreciation and BlackRock Energy & Resources Portfolios for the periods prior to January 31, 2005 is based on performance of certain former State Street Research mutual funds that reorganized with the Funds on that date.
The Funds’ investment advisor waived or reimbursed a portion of each Fund’s expenses. Without such waiver and reimbursement, a Fund’s performance would have been lower. BlackRock Advisors, LLC is under no obligation to waive or continue waiving its fees after February 1, 2011. Dividends paid to each class of shares will vary because of the different levels of service, distribution and transfer agency fees applicable to each class, which are deducted from the income available to be paid to shareholders.
| | | | | | |
| 12 | | BLACKROCK FUNDS | | MARCH 31, 2010 | | |
Disclosure of Expenses
Shareholders of these Funds may incur the following charges: (a) expenses related to transactions, including sales charges, redemption fees and exchange fees; and (b) operating expenses including advisory fees, service and distribution fees, including 12b-1 fees, and other Fund expenses. The expense examples on the previous pages (which are based on a hypothetical investment of $1,000 invested on October 1, 2009 and held through March 31, 2010) are intended to assist shareholders both in calculating expenses based on an investment in each Fund and in comparing these expenses with similar costs of investing in other mutual funds.
The tables provide information about actual account values and actual expenses. In order to estimate the expenses a shareholder paid during the period covered by this report, shareholders can divide their account value by $1,000 and then multiply the result by the number corresponding to their Fund and share class under the headings entitled “Expenses Paid During the Period.”
The tables also provide information about hypothetical account values and hypothetical expenses based on a Fund’s actual expense ratio and an assumed rate of return of 5% per year before expenses. In order to assist shareholders in comparing the ongoing expenses of investing in these Funds and other funds, compare the 5% hypothetical example with the 5% hypothetical examples that appear in other funds’ shareholder reports.
The expenses shown in the tables are intended to highlight shareholders’ ongoing costs only and do not reflect any transactional expenses, such as sales charges, redemption fees or exchange fees. Therefore, the hypothetical examples are useful in comparing ongoing expenses only, and will not help shareholders determine the relative total expenses of owning different funds. If these transactional expenses were included, shareholder expenses would have been higher.
Derivative Financial Instruments
The Funds may invest in various derivative instruments, including foreign currency exchange contracts, as specified in Note 2 of the Notes to Financial Statements, which constitute forms of economic leverage. Such instruments are used to obtain exposure to a market without owning or taking physical custody of securities or to hedge market and/or foreign currency exchange rate risks. Such derivative instruments involve risks, including the imperfect correlation between the value of a derivative instrument and the underlying asset, possible default of counterparty to the transaction or illiquidity of the derivative instrument. A Fund’s ability to successfully use a derivative instrument depends on the investment advisor’s ability to accurately predict pertinent market movements, which cannot be assured. The use of derivative instruments may result in losses greater than if they had not been used, may require a Fund to sell or purchase portfolio securities at inopportune times or for distressed values, may limit the amount of appreciation a Fund can realize on an investment or may cause a Fund to hold a security that it might otherwise sell. The Funds’ investments in these instruments are discussed in detail in the Notes to Financial Statements.
| | | | | | |
| | | BLACKROCK FUNDS | | MARCH 31, 2010 | | 13 |
| | |
| Schedule of Investments March 31, 2010 (Unaudited) | | BlackRock All-Cap Energy & Resources Portfolio |
| | (Percentages shown are based on Net Assets) |
| | | | | |
| | | Shares | | Value |
Common Stocks | | | | | |
Chemicals — 2.5% | | | | | |
Potash Corp. of Saskatchewan, Inc. | | 154,100 | | $ | 18,391,835 |
Energy Equipment & Services — 18.3% | | | | | |
Calfrac Well Services Ltd. | | 55,100 | | | 1,150,120 |
Cameron International Corp. (a) | | 243,230 | | | 10,424,838 |
Core Laboratories NV | | 170,050 | | | 22,242,540 |
FMC Technologies, Inc. (a)(b) | | 335,290 | | | 21,669,793 |
Halliburton Co. | | 625,100 | | | 18,834,263 |
Key Energy Services, Inc. (a) | | 718,300 | | | 6,859,765 |
Noble Corp. (a) | | 191,110 | | | 7,992,220 |
Schlumberger Ltd. (b) | | 249,180 | | | 15,812,963 |
Smith International, Inc. | | 187,740 | | | 8,039,027 |
Technip SA | | 76,200 | | | 6,185,467 |
Transocean Ltd. (a) | | 130,240 | | | 11,250,131 |
Trican Well Service Ltd. | | 297,300 | | | 3,846,327 |
| | | | | |
| | | | | 134,307,454 |
| | | | | |
Gas Utilities — 4.1% | | | | | |
EQT Corp. | | 401,510 | | | 16,461,910 |
Questar Corp. | | 310,730 | | | 13,423,536 |
| | | | | |
| | | | | 29,885,446 |
| | | | | |
Metals & Mining — 9.2% | | | | | |
Agnico-Eagle Mines Ltd. (b) | | 168,690 | | | 9,390,972 |
BHP Billiton Ltd. - ADR (b) | | 191,110 | | | 15,349,955 |
Eldorado Gold Corp. (a) | | 652,120 | | | 7,916,743 |
Goldcorp, Inc. | | 411,052 | | | 15,299,356 |
Silver Wheaton Corp. (a) | | 1,220,824 | | | 19,142,520 |
| | | | | |
| | | | | 67,099,546 |
| | | | | |
Oil, Gas & Consumable Fuels — 65.1% | | | | | |
Alpha Natural Resources, Inc. (a) | | 198,100 | | | 9,883,209 |
Apache Corp. | | 240,930 | | | 24,454,395 |
Arch Coal, Inc. | | 381,100 | | | 8,708,135 |
Cabot Oil & Gas Corp. | | 236,300 | | | 8,695,840 |
Cameco Corp. | | 82,770 | | | 2,268,726 |
Cenovus Energy, Inc. | | 267,660 | | | 7,015,369 |
CONSOL Energy, Inc. | | 602,830 | | | 25,716,728 |
Crescent Point Energy Corp. | | 423,470 | | | 16,248,339 |
Denbury Resources, Inc. (a) | | 843,890 | | | 14,236,424 |
EnCana Corp. (b) | | 267,660 | | | 8,305,490 |
EOG Resources, Inc. (b) | | 260,470 | | | 24,208,082 |
Forest Oil Corp. (a) | | 365,190 | | | 9,429,206 |
Galleon Energy, Inc. - Class A (a) | | 776,694 | | | 5,268,962 |
Gasco Energy, Inc. (a) | | 1,596,500 | | | 510,880 |
Hess Corp. | | 145,370 | | | 9,092,893 |
Hugoton Royalty Trust | | 1 | | | 17 |
Massey Energy Co. | | 713,739 | | | 37,321,412 |
Newfield Exploration Co. (a) | | 349,000 | | | 18,165,450 |
Noble Energy, Inc. | | 198,600 | | | 14,497,800 |
Occidental Petroleum Corp. (b) | | 294,050 | | | 24,858,987 |
OGX Petroleo e Gas Participacoes SA | | 1,600,000 | | | 14,971,181 |
Oil, Gas & Consumable Fuels (concluded) | | | | | |
Patriot Coal Corp. (a) | | 67,116 | | | 1,373,193 |
Peabody Energy Corp. | | 467,790 | | | 21,378,003 |
Penn West Energy Trust (b) | | 972,400 | | | 20,537,088 |
PetroBakken Energy Ltd. - Class A | | 107,042 | | | 2,795,012 |
PetroChina Co. Ltd. - ADR (b) | | 35,990 | | | 4,218,748 |
Petroleo Brasileiro SA - ADR | | 291,840 | | | 12,983,962 |
Plains Exploration & Production Co. (a) | | 465,710 | | | 13,966,643 |
Premier Oil Plc (a) | | 279,937 | | | 5,247,990 |
Quicksilver Resources, Inc. (a)(b) | | 875,400 | | | 12,316,878 |
Range Resources Corp. (b) | | 374,600 | | | 17,557,502 |
Southwestern Energy Co. (a) | | 471,700 | | | 19,207,624 |
StatoilHydro ASA | | 402,522 | | | 9,366,432 |
StatoilHydro ASA - ADR | | 169,840 | | | 3,962,367 |
Suncor Energy, Inc. | | 281,080 | | | 9,146,343 |
Talisman Energy, Inc. | | 827,500 | | | 14,117,150 |
Whiting Petroleum Corp. (a)(b) | | 316,730 | | | 25,604,453 |
| | | | | |
| | | | | 477,636,913 |
| | | | | |
Total Long-Term Investments (Cost — $592,667,214) — 99.2% | | | | | 727,321,194 |
| | | | | |
| | | | | | |
| | | Shares/
Beneficial
Interest | | | |
Short-Term Securities | | | | | | |
BlackRock Liquidity Funds, TempFund, Institutional Class, 0.11% (c)(d) | | 4,676,731 | | | 4,676,731 | |
BlackRock Liquidity Series, LLC Money Market Series, 0.22% (c)(d)(e) | | 112,684,650 | | | 112,684,650 | |
| | | | | | |
Total Short-Term Securities (Cost — $117,361,381) — 16.0% | | | | | 117,361,381 | |
| | | | | | |
Total Investments (Cost — $710,028,595*) — 115.2% | | | 844,682,575 | |
Liabilities in Excess of Other Assets — (15.2)% | | | | | (111,193,298 | ) |
| | | | | | |
Net Assets — 100.0% | | | | $ | 733,489,277 | |
| | | | | | |
| * | The cost and unrealized appreciation (depreciation) of investments as of March 31, 2010, as computed for federal income tax purposes, were as follows: |
| | | | |
Aggregate cost | | $ | 712,574,094 | |
| | | | |
Gross unrealized appreciation | | $ | 179,351,038 | |
Gross unrealized depreciation | | | (47,242,557 | ) |
| | | | |
Net unrealized appreciation | | $ | 132,108,481 | |
| | | | |
| (a) | Non-income producing security. |
| (b) | Security, or a portion of security, is on loan. |
Portfolio Abbreviations
| | | | | | |
| To simplify the listings of portfolio holdings in the Schedules of Investments, the names and descriptions of many of the securities have been abbreviated according to the following list: | | ADR American Depositary Receipts CAD Canadian Dollar USD US Dollar | | | | |
See Notes to Financial Statements.
| | | | | | |
| 14 | | BLACKROCK FUNDS | | MARCH 31, 2010 | | |
| | |
| Schedule of Investments (concluded) | | BlackRock All-Cap Energy & Resources Portfolio |
| | |
| (c) | Investments in companies considered to be an affiliate of the Fund, for purposes of Section 2(a)(3) of the Investment Company Act of 1940, were as follows: |
| | | | | | | | | | |
Affiliate | | Net
Activity | | | Realized
Gain | | Income |
BlackRock Liquidity Funds, TempFund, Institutional Class | | $ | (30,959,333 | ) | | $ | 26 | | $ | 18,587 |
BlackRock Liquidity Series, LLC Money Market Series | | $ | 62,927,900 | | | | — | | $ | 67,069 |
| (d) | Represents the current yield as of report date. |
| (e) | Security was purchased with the cash collateral from loaned securities. |
| • | | For Fund compliance purposes, the Fund’s industry classifications refer to any one or more of the industry sub-classifications used by one or more widely recognized market indexes or ratings group indexes, and/or as defined by Fund management. This definition may not apply for purposes of this report, which may combine industry sub-classifications for reporting ease. |
| • | | Fair Value Measurements — Various inputs are used in determining the fair value of investments, which are as follows: |
| | • | | Level 1 – price quotations in active markets/exchanges for identical assets and liabilities |
| | • | | Level 2 – other observable inputs (including, but not limited to: quoted prices for similar assets or liabilities in markets that are active, quoted prices for identical or similar assets or liabilities in markets that are not active, inputs other than quoted prices that are observable for the assets or liabilities (such as interest rates, yield curves, volatilities, prepayment speeds, loss severities, credit risks and default rates) or other market–corroborated inputs) |
| | • | | Level 3 – unobservable inputs based on the best information available in the circumstances, to the extent observable inputs are not available (including the Fund’s own assumptions used in determining the fair value of investments) |
The inputs or methodologies used for valuing securities are not necessarily an indication of the risk associated with investing in those securities. For information about the Fund’s policy regarding valuation of investments and other significant accounting policies, please refer to Note 1 of the Notes to Financial Statements.
The following table summarizes the inputs used as of March 31, 2010 in determining the fair valuation of the Fund’s investments:
| | | | | | | | | | | |
| | | Investments in Securities |
Valuation Inputs | | Level 1 | | Level 2 | | Level 3 | | Total |
Assets: | | | | | | | | | | | |
Long-Term Investments: | | | | | | | | | | | |
Chemicals | | $ | 18,391,835 | | | — | | — | | $ | 18,391,835 |
Energy Equipment & Services | | | 128,121,987 | | $ | 6,185,467 | | — | | | 134,307,454 |
Gas Utilities | | | 29,885,446 | | | — | | — | | | 29,885,446 |
Metals & Mining | | | 67,099,546 | | | — | | — | | | 67,099,546 |
Oil, Gas & Consumable Fuels | | | 463,022,491 | | | 14,614,422 | | — | | | 477,636,913 |
Short-Term Securities | | | 4,676,731 | | | 112,684,650 | | — | | | 117,361,381 |
| | | | | | | | | | | |
Total | | $ | 711,198,036 | | $ | 133,484,539 | | — | | $ | 844,682,575 |
| | | | | | | | | | | |
See Notes to Financial Statements.
| | | | | | |
| | | BLACKROCK FUNDS | | MARCH 31, 2010 | | 15 |
| | |
| Schedule of Investments March 31, 2010 (Unaudited) | | BlackRock Aurora Portfolio |
| | (Percentages shown are based on Net Assets) |
| | | | | |
Common Stocks | | Shares | | Value |
Aerospace & Defense — 1.0% | | | | | |
Orbital Sciences Corp.(a) | | 252,677 | | $ | 4,803,390 |
| | | | | |
Auto Components — 1.1% | | | | | |
Dana Holding Corp.(a) | | 238,200 | | | 2,829,816 |
Federal Mogul Corp.(a) | | 125,400 | | | 2,302,344 |
| | | | | |
| | | | | 5,132,160 |
| | | | | |
Building Products — 1.5% | | | | | |
Masco Corp.(b) | | 275,700 | | | 4,278,864 |
Owens Corning(a) | | 97,500 | | | 2,480,400 |
| | | | | |
| | | | | 6,759,264 |
| | | | | |
Capital Markets — 2.9% | | | | | |
Affiliated Managers Group, Inc.(a)(b) | | 79,700 | | | 6,296,300 |
Invesco Ltd. | | 211,500 | | | 4,633,965 |
KBW, Inc.(a) | | 87,000 | | | 2,340,300 |
| | | | | |
| | | | | 13,270,565 |
| | | | | |
Chemicals — 2.6% | | | | | |
Cytec Industries, Inc. | | 20,000 | | | 934,800 |
FMC Corp. | | 81,800 | | | 4,952,172 |
Olin Corp.(b) | | 313,300 | | | 6,146,946 |
| | | | | |
| | | | | 12,033,918 |
| | | | | |
Commercial Banks — 7.8% | | | | | |
Associated Banc-Corp. | | 314,300 | | | 4,337,340 |
Boston Private Financial Holdings, Inc. | | 400,000 | | | 2,948,000 |
Cathay General Bancorp(b) | | 312,100 | | | 3,635,965 |
CVB Financial Corp.(b) | | 676,100 | | | 6,713,673 |
Fulton Financial Corp.(b) | | 372,100 | | | 3,791,699 |
KeyCorp | | 758,600 | | | 5,879,150 |
TCF Financial Corp.(b) | | 314,100 | | | 5,006,754 |
Zions Bancorporation(b) | | 166,000 | | | 3,622,120 |
| | | | | |
| | | | | 35,934,701 |
| | | | | |
Commercial Services & Supplies — 3.1% | | | | | |
Clean Harbors, Inc.(a) | | 42,200 | | | 2,344,632 |
Corrections Corp. of America(a) | | 329,300 | | | 6,539,898 |
The GEO Group, Inc.(a) | | 265,200 | | | 5,256,264 |
| | | | | |
| | | | | 14,140,794 |
| | | | | |
Communications Equipment — 2.6% | | | | | |
ADTRAN, Inc.(b) | | 205,900 | | | 5,425,465 |
Arris Group, Inc.(a) | | 287,600 | | | 3,454,076 |
Ciena Corp.(a)(b) | | 196,600 | | | 2,996,184 |
| | | | | |
| | | | | 11,875,725 |
| | | | | |
Construction & Engineering — 1.6% | | | | | |
KBR, Inc. | | 202,400 | | | 4,485,184 |
Tutor Perini Corp.(a) | | 141,300 | | | 3,073,275 |
| | | | | |
| | | | | 7,558,459 |
| | | | | |
Consumer Finance — 0.6% | | | | | |
SLM Corp.(a) | | 202,400 | | | 2,534,048 |
| | | | | |
Containers & Packaging — 1.0% | | | | | |
Owens-Illinois, Inc.(a) | | 129,200 | | | 4,591,768 |
| | | | | |
Diversified Financial Services — 2.2% | | | | | |
PHH Corp.(a) | | 438,016 | | | 10,324,037 |
| | | | | |
Electric Utilities — 2.0% | | | | | |
Northeast Utilities | | 132,000 | | | 3,648,480 |
NV Energy, Inc. | | 236,200 | | | 2,912,346 |
Westar Energy, Inc. | | 109,700 | | | 2,446,310 |
| | | | | |
| | | | | 9,007,136 |
| | | | | |
Electrical Equipment — 1.9% | | | | | |
AMETEK, Inc. | | 116,900 | | | 4,846,674 |
Polypore International, Inc.(a) | | 226,300 | | | 3,951,198 |
| | | | | |
| | | | | 8,797,872 |
| | | | | |
Electronic Equipment, Instruments & Components — 1.5% | | | | | |
Anixter International, Inc.(a) | | 84,000 | | | 3,935,400 |
Ingram Micro, Inc. - Class A(a) | | 169,000 | | | 2,965,950 |
| | | | | |
| | | | | 6,901,350 |
| | | | | |
Energy Equipment & Services — 2.2% | | | | | |
Complete Production Services, Inc.(a) | | 450,100 | | | 5,198,655 |
Oil States International, Inc.(a) | | 106,500 | | | 4,828,710 |
| | | | | |
| | | | | 10,027,365 |
| | | | | |
Food & Staples Retailing — 1.1% | | | | | |
BJ’s Wholesale Club, Inc.(a) | | 136,100 | | | 5,034,339 |
| | | | | |
Food Products — 3.5% | | | | | |
Chiquita Brands International, Inc.(a)(b) | | 106,600 | | | 1,676,818 |
Del Monte Foods Co. | | 283,230 | | | 4,135,158 |
The J.M. Smucker Co. | | 61,000 | | | 3,675,860 |
TreeHouse Foods, Inc.(a)(b) | | 146,892 | | | 6,444,152 |
| | | | | |
| | | | | 15,931,988 |
| | | | | |
Gas Utilities — 0.8% | | | | | |
New Jersey Resources Corp. | | 97,100 | | | 3,647,076 |
| | | | | |
Health Care Equipment & Supplies — 0.9% | | | | | |
The Cooper Cos., Inc. | | 111,800 | | | 4,346,784 |
| | | | | |
Health Care Providers & Services — 4.3% | | | | | |
Amedisys, Inc.(a)(b) | | 85,600 | | | 4,726,832 |
LifePoint Hospitals, Inc.(a)(b) | | 160,000 | | | 5,884,800 |
Lincare Holdings, Inc.(a) | | 146,000 | | | 6,552,480 |
Tenet Healthcare Corp.(a) | | 436,100 | | | 2,494,492 |
| | | | | |
| | | | | 19,658,604 |
| | | | | |
Hotels, Restaurants & Leisure — 4.2% | | | | | |
Papa John’s International, Inc.(a) | | 149,700 | | | 3,848,787 |
Penn National Gaming, Inc.(a) | | 140,000 | | | 3,892,000 |
Pinnacle Entertainment, Inc.(a) | | 429,700 | | | 4,185,278 |
Scientific Games Corp. - Class A(a) | | 226,829 | | | 3,193,753 |
Vail Resorts, Inc.(a)(b) | | 98,600 | | | 3,952,874 |
| | | | | |
| | | | | 19,072,692 |
| | | | | |
Household Durables — 2.3% | | | | | |
Jarden Corp. | | 178,300 | | | 5,935,607 |
MDC Holdings, Inc. | | 72,100 | | | 2,495,381 |
Newell Rubbermaid, Inc.(b) | | 155,500 | | | 2,363,600 |
| | | | | |
| | | | | 10,794,588 |
| | | | | |
Industrial Conglomerates — 0.5% | | | | | |
Textron, Inc.(b) | | 117,894 | | | 2,502,890 |
| | | | | |
Insurance — 5.7% | | | | | |
Flagstone Reinsurance Holdings Ltd. | | 220,900 | | | 2,531,514 |
The Hanover Insurance Group, Inc. | | 137,330 | | | 5,988,961 |
HCC Insurance Holdings, Inc. | | 84,200 | | | 2,323,920 |
Lincoln National Corp. | | 143,800 | | | 4,414,660 |
Navigators Group, Inc.(a) | | 64,300 | | | 2,528,919 |
See Notes to Financial Statements.
| | | | | | |
| 16 | | BLACKROCK FUNDS | | MARCH 31, 2010 | | |
| | |
| Schedule of Investments (continued) | | BlackRock Aurora Portfolio |
| | (Percentages shown are based on Net Assets) |
| | | | | | |
Common Stocks | | Shares | | Value | |
Insurance (concluded) | | | | | | |
Platinum Underwriters Holdings Ltd. | | 131,923 | | $ | 4,891,705 | |
Primerica, Inc.(a) | | 31,600 | | | 474,000 | |
Tower Group, Inc. | | 142,800 | | | 3,165,876 | |
| | | | | | |
| | | | | 26,319,555 | |
| | | | | | |
IT Services — 1.2% | | | | | | |
Lender Processing Services, Inc. | | 145,500 | | | 5,492,625 | |
| | | | | | |
Machinery — 4.5% | | | | | | |
Donaldson Co., Inc. | | 161,900 | | | 7,304,928 | |
Mueller Water Products, Inc. - Class A | | 854,300 | | | 4,083,554 | |
Snap-On, Inc. | | 84,800 | | | 3,675,232 | |
Terex Corp.(a) | | 244,300 | | | 5,548,053 | |
| | | | | | |
| | | | | 20,611,767 | |
| | | | | | |
Media — 4.2% | | | | | | |
Arbitron, Inc. | | 395,500 | | | 10,544,030 | |
Cablevision Systems Corp. - Class A | | 256,500 | | | 6,191,910 | |
Lions Gate Entertainment Corp.(a) | | 397,700 | | | 2,481,648 | |
| | | | | | |
| | | | | 19,217,588 | |
| | | | | | |
Metals & Mining — 2.5% | | | | | | |
Horsehead Holding Corp.(a) | | 344,580 | | | 4,079,827 | |
Steel Dynamics, Inc. | | 230,800 | | | 4,032,076 | |
Thompson Creek Metals Co., Inc.(a)(b) | | 249,700 | | | 3,378,441 | |
| | | | | | |
| | | | | 11,490,344 | |
| | | | | | |
Multiline Retail — 1.1% | | | | | | |
Saks, Inc.(a)(b) | | 581,500 | | | 5,000,900 | |
| | | | | | |
Multi-Utilities — 1.3% | | | | | | |
Wisconsin Energy Corp. | | 118,400 | | | 5,850,144 | |
| | | | | | |
Oil, Gas & Consumable Fuels — 3.7% | | | | | | |
Alpha Natural Resources, Inc.(a) | | 145,600 | | | 7,263,984 | |
Newfield Exploration Co.(a) | | 95,400 | | | 4,965,570 | |
Rex Energy Corp.(a) | | 128,500 | | | 1,463,615 | |
SandRidge Energy, Inc.(a)(b) | | 442,800 | | | 3,409,560 | |
| | | | | | |
| | | | | 17,102,729 | |
| | | | | | |
Pharmaceuticals — 0.7% | | | | | | |
Watson Pharmaceuticals, Inc.(a) | | 78,800 | | | 3,291,476 | |
| | | | | | |
Real Estate Investment Trusts (REITs) — 5.0% | | | | | | |
Chimera Investment Corp. | | 635,000 | | | 2,470,150 | |
DCT Industrial Trust, Inc. | | 918,240 | | | 4,802,395 | |
The Macerich Co.(b) | | 151,981 | | | 5,822,392 | |
MFA Financial, Inc. | | 834,500 | | | 6,141,920 | |
Redwood Trust, Inc.(b) | | 238,400 | | | 3,676,128 | |
| | | | | | |
| | | | | 22,912,985 | |
| | | | | | |
Real Estate Management & Development — 1.0% | | | | | | |
Forestar Group, Inc.(a) | | 232,000 | | | 4,380,160 | |
| | | | | | |
Road & Rail — 1.0% | | | | | | |
Con-way, Inc. | | 58,400 | | | 2,051,008 | |
Genesee & Wyoming, Inc. - Class A(a) | | 76,000 | | | 2,593,120 | |
| | | | | | |
| | | | | 4,644,128 | |
| | | | | | |
Semiconductors & Semiconductor Equipment — 3.6% | | | | | | |
Intersil Corp. - Class A | | 298,200 | | | 4,401,432 | |
ON Semiconductor Corp.(a) | | 599,200 | | | 4,793,600 | |
Teradyne, Inc.(a) | | 483,900 | | | 5,405,163 | |
Verigy Ltd.(a) | | 185,300 | | | 2,071,654 | |
| | | | | | |
| | | | | 16,671,849 | |
| | | | | | |
Software — 3.3% | | | | | | |
Lawson Software, Inc.(a) | | 625,275 | | | 4,133,068 | |
Novell, Inc.(a) | | 409,592 | | | 2,453,456 | |
Take-Two Interactive Software, Inc.(a) | | 361,900 | | | 3,564,715 | |
TiVo, Inc.(a) | | 279,910 | | | 4,792,059 | |
| | | | | | |
| | | | | 14,943,298 | |
| | | | | | |
Specialty Retail — 3.3% | | | | | | |
Collective Brands, Inc.(a) | | 271,500 | | | 6,173,910 | |
JoS. A. Bank Clothiers, Inc.(a)(b) | | 78,000 | | | 4,262,700 | |
O’Reilly Automotive, Inc.(a) | | 55,400 | | | 2,310,734 | |
Pacific Sunwear of California, Inc.(a) | | 471,200 | | | 2,502,072 | |
| | | | | | |
| | | | | 15,249,416 | |
| | | | | | |
Thrifts & Mortgage Finance — 1.9% | | | | | | |
First Niagara Financial Group, Inc. | | 393,100 | | | 5,589,882 | |
People’s United Financial, Inc. | | 210,300 | | | 3,289,092 | |
| | | | | | |
| | | | | 8,878,974 | |
| | | | | | |
Water Utilities — 1.2% | | | | | | |
American Water Works Co., Inc. | | 244,800 | | | 5,326,848 | |
| | | | | | |
Wireless Telecommunication Services — 0.6% | | | | | | |
Syniverse Holdings, Inc.(a) | | 136,700 | | | 2,661,549 | |
| | | | | | |
Total Long-Term Investments
(Cost — $388,787,831) — 99.0% | | | | | 454,727,848 | |
| | | | | | |
Short-Term Securities | | Shares/
Beneficial
Interest | | | |
BlackRock Liquidity Funds, TempFund, Institutional Class, 0.11%(c)(d) | | 22,884,148 | | | 22,884,148 | |
BlackRock Liquidity Series, LLC Money Market Series, 0.22%(c)(d)(e) | | 77,589,190 | | | 77,589,190 | |
| | | | | | |
Total Short-Term Securities
(Cost — $100,473,338) — 21.9% | | | | | 100,473,338 | |
| | | | | | |
Total Investments (Cost — $489,261,169*) — 120.9% | | | 555,201,186 | |
Liabilities in Excess of Other Assets — (20.9)% | | | | | (96,028,504 | ) |
| | | | | | |
Net Assets — 100.0% | | | | $ | 459,172,682 | |
| | | | | | |
| * | The cost and unrealized appreciation (depreciation) of investments as of March 31, 2010, as computed for federal income tax purposes, were as follows: |
| | | | |
Aggregate cost | | $ | 496,172,963 | |
| | | | |
Gross unrealized appreciation | | $ | 64,798,421 | |
Gross unrealized depreciation | | | (5,770,198 | ) |
| | | | |
Net unrealized appreciation | | $ | 59,028,223 | |
| | | | |
| (a) | Non-income producing security. |
| (b) | Security, or a portion of security, is on loan. |
| (c) | Investments in companies considered to be an affiliate of the Fund, for purposes of Section 2(a)(3) of the Investment Company Act of 1940, were as follows: |
See Notes to Financial Statements.
| | | | | | |
| | | BLACKROCK FUNDS | | March 31, 2010 | | 17 |
| | |
| Schedule of Investments (concluded) | | BlackRock Aurora Portfolio |
| | |
| | | | | | | | | |
Affiliate | | Net
Activity | | Realized
Gain | | Income |
BlackRock Liquidity Funds, TempFund, Institutional Class | | $ | 14,370,957 | | $ | 67 | | $ | 3,449 |
BlackRock Liquidity Series, LLC Money Market Series | | $ | 48,985,590 | | | — | | $ | 121,552 |
| (d) | Represents the current yield as of report date. |
| (e) | Security was purchased with the cash collateral from loaned securities. |
| • | | For Fund compliance purposes, the Fund’s industry classifications refer to any one or more of the industry sub-classifications used by one or more widely recognized market indexes or ratings group indexes, and/or as defined by Fund management. This definition may not apply for purposes of this report, which may combine industry sub-classifications for reporting ease. |
| • | | Fair Value Measurements — Various inputs are used in determining the fair value of investments, which are as follows: |
| | • | | Level 1 – price quotations in active markets/exchanges for identical assets and liabilities |
| | • | | Level 2 – other observable inputs (including, but not limited to: quoted prices for similar assets or liabilities in markets that are active, quoted prices for identical or similar assets or liabilities in markets that are not active, inputs other than quoted prices that are observable for the assets or liabilities (such as interest rates, yield curves, volatilities, prepayment speeds, loss severities, credit risks and default rates) or other market–corroborated inputs) |
| | • | | Level 3 – unobservable inputs based on the best information available in the circumstances, to the extent observable inputs are not available (including the Fund’s own assumptions used in determining the fair value of investments) |
The inputs or methodologies used for valuing securities are not necessarily an indication of the risk associated with investing in those securities. For information about the Fund’s policy regarding valuation of investments and other significant accounting policies, please refer to Note 1 of the Notes to Financial Statements.
The following table summarizes the inputs used as of March 31, 2010 in determining the fair valuation of the Fund’s investments:
| | | | | | | | | | | |
| | | Investments in Securities |
Valuation Inputs | | Level 1 | | Level 2 | | Level 3 | | Total |
Assets: | | | | | | | | | | | |
Long-Term Investments1 | | $ | 454,727,848 | | | — | | — | | $ | 454,727,848 |
Short-Term Securities | | | 22,884,148 | | $ | 77,589,190 | | — | | | 100,473,338 |
| | | | | | | | | | | |
Total | | $ | 477,611,996 | | $ | 77,589,190 | | — | | $ | 555,201,186 |
| | | | | | | | | | | |
| 1 | See above Schedule of Investments for values in each industry. |
See Notes to Financial Statements.
| | | | | | |
| 18 | | BLACKROCK FUNDS | | MARCH 31, 2010 | | |
| | |
| Schedule of Investments March 31, 2010 (Unaudited) | | BlackRock Capital Appreciation Portfolio |
| | (Percentages shown are based on Net Assets) |
| | | | | |
Common Stocks | | Shares | | Value |
Air Freight & Logistics — 2.0% | | | | | |
United Parcel Service, Inc. - Class B | | 155,400 | | $ | 10,009,314 |
| | | | | |
Airlines — 2.6% | | | | | |
Delta Air Lines, Inc.(a)(b) | | 744,600 | | | 10,863,714 |
UAL Corp.(a)(b) | | 128,000 | | | 2,502,400 |
| | | | | |
| | | | | 13,366,114 |
| | | | | |
Beverages — 2.2% | | | | | |
The Coca-Cola Co. | | 208,354 | | | 11,459,470 |
| | | | | |
Biotechnology — 3.2% | | | | | |
Amgen, Inc.(a) | | 155,900 | | | 9,316,584 |
Gilead Sciences, Inc.(a) | | 155,600 | | | 7,076,688 |
| | | | | |
| | | | | 16,393,272 |
| | | | | |
Building Products — 0.1% | | | | | |
Masco Corp. | | 44,800 | | | 695,296 |
| | | | | |
Capital Markets — 0.9% | | | | | |
The Goldman Sachs Group, Inc. | | 26,500 | | | 4,521,695 |
| | | | | |
Chemicals — 0.7% | | | | | |
Ecolab, Inc.(b) | | 81,300 | | | 3,573,135 |
| | | | | |
Commercial Banks — 1.5% | | | | | |
Wells Fargo & Co. | | 241,100 | | | 7,503,032 |
| | | | | |
Communications Equipment — 4.2% | | | | | |
Cisco Systems, Inc.(a) | | 344,321 | | | 8,962,675 |
F5 Networks, Inc.(a) | | 58,900 | | | 3,622,939 |
QUALCOMM, Inc. | | 206,323 | | | 8,663,503 |
| | | | | |
| | | | | 21,249,117 |
| | | | | |
Computers & Peripherals — 11.0% | | | | | |
Apple, Inc.(a) | | 111,818 | | | 26,269,403 |
EMC Corp.(a) | | 149,000 | | | 2,687,960 |
Hewlett-Packard Co. | | 278,700 | | | 14,812,905 |
NetApp, Inc.(a)(b) | | 234,900 | | | 7,648,344 |
Seagate Technology(a) | | 251,100 | | | 4,585,086 |
| | | | | |
| | | | | 56,003,698 |
| | | | | |
Diversified Financial Services — 1.9% | | | | | |
JPMorgan Chase & Co. | | 105,400 | | | 4,716,650 |
Moody’s Corp. | | 166,100 | | | 4,941,475 |
| | | | | |
| | | | | 9,658,125 |
| | | | | |
Energy Equipment & Services — 1.3% | | | | | |
Schlumberger Ltd. | | 53,617 | | | 3,402,535 |
Transocean Ltd.(a) | | 34,405 | | | 2,971,904 |
| | | | | |
| | | | | 6,374,439 |
| | | | | |
Food & Staples Retailing — 2.6% | | | | | |
Wal-Mart Stores, Inc. | | 188,386 | | | 10,474,262 |
Whole Foods Market, Inc.(a)(b) | | 77,800 | | | 2,812,470 |
| | | | | |
| | | | | 13,286,732 |
| | | | | |
Health Care Equipment & Supplies — 2.7% | | | | | |
St. Jude Medical, Inc.(a) | | 156,000 | | | 6,403,800 |
Zimmer Holdings, Inc.(a) | | 122,700 | | | 7,263,840 |
| | | | | |
| | | | | 13,667,640 |
| | | | | |
Health Care Providers & Services — 2.0% | | | | | |
Express Scripts, Inc.(a) | | 100,900 | | | 10,267,584 |
| | | | | |
Health Care Technology — 1.2% | | | | | |
Cerner Corp.(a)(b) | | 73,700 | | | 6,268,922 |
| | | | | |
Hotels, Restaurants & Leisure — 3.9% | | | | | |
Darden Restaurants, Inc. | | 65,200 | | | 2,904,008 |
Las Vegas Sands Corp.(a)(b) | | 268,900 | | | 5,687,235 |
Starbucks Corp. | | 225,800 | | | 5,480,166 |
Starwood Hotels & Resorts Worldwide, Inc. | | 122,900 | | | 5,732,056 |
| | | | | |
| | | | | 19,803,465 |
| | | | | |
Household Products — 2.9% | | | | | |
The Procter & Gamble Co. | | 233,386 | | | 14,766,332 |
| | | | | |
Internet & Catalog Retail — 2.6% | | | | | |
Amazon.com, Inc.(a) | | 97,540 | | | 13,239,104 |
| | | | | |
Internet Software & Services — 4.8% | | | | | |
Baidu, Inc. - ADR(a)(b) | | 8,700 | | | 5,193,900 |
Google, Inc. - Class A(a) | | 33,954 | | | 19,252,258 |
| | | | | |
| | | | | 24,446,158 |
| | | | | |
IT Services — 0.9% | | | | | |
Mastercard, Inc. - Class A | | 19,000 | | | 4,826,000 |
| | | | | |
Life Sciences Tools & Services — 2.1% | | | | | |
Covance, Inc.(a)(b) | | 95,100 | | | 5,838,189 |
Life Technologies Corp.(a) | | 95,300 | | | 4,981,331 |
| | | | | |
| | | | | 10,819,520 |
| | | | | |
Machinery — 7.5% | | | | | |
Cummins, Inc. | | 107,700 | | | 6,672,015 |
Danaher Corp. | | 159,722 | | | 12,763,385 |
Joy Global, Inc. | | 172,300 | | | 9,752,180 |
PACCAR, Inc. | | 205,900 | | | 8,923,706 |
| | | | | |
| | | | | 38,111,286 |
| | | | | |
Media — 2.9% | | | | | |
CBS Corp. - Class B(b) | | 400,800 | | | 5,587,152 |
Comcast Corp. - Class A | | 489,500 | | | 9,212,390 |
| | | | | |
| | | | | 14,799,542 |
| | | | | |
Metals & Mining — 1.9% | | | | | |
Agnico-Eagle Mines Ltd. | | 32,900 | | | 1,831,543 |
Freeport-McMoRan Copper & Gold, Inc. | | 38,737 | | | 3,236,089 |
United States Steel Corp.(b) | | 75,000 | | | 4,764,000 |
| | | | | |
| | | | | 9,831,632 |
| | | | | |
Multiline Retail — 1.8% | | | | | |
Kohl’s Corp.(a) | | 163,868 | | | 8,976,689 |
| | | | | |
Oil, Gas & Consumable Fuels — 2.4% | | | | | |
Anadarko Petroleum Corp. | | 77,800 | | | 5,666,174 |
EOG Resources, Inc. | | 72,000 | | | 6,691,680 |
| | | | | |
| | | | | 12,357,854 |
| | | | | |
Personal Products — 1.4% | | | | | |
Avon Products, Inc.(b) | | 204,000 | | | 6,909,480 |
| | | | | |
Pharmaceuticals — 4.5% | | | | | |
Abbott Laboratories | | 203,500 | | | 10,720,380 |
Pfizer, Inc. | | 378,100 | | | 6,484,415 |
Teva Pharmaceutical Industries Ltd. - ADR | | 86,700 | | | 5,469,036 |
| | | | | |
| | | | | 22,673,831 |
| | | | | |
See Notes to Financial Statements.
| | | | | | |
| | | BLACKROCK FUNDS | | MARCH 31, 2010 | | 19 |
| | |
| Schedule of Investments (concluded) | | BlackRock Capital Appreciation Portfolio |
| | (Percentages shown are based on Net Assets) |
| | | | | | |
Common Stocks | | Shares | | Value | |
Professional Services — 0.7% | | | | | | |
Manpower, Inc. | | 65,400 | | $ | 3,735,648 | |
| | | | | | |
Semiconductors & Semiconductor Equipment — 4.5% | | | | | | |
Broadcom Corp. - Class A(b) | | 153,027 | | | 5,077,436 | |
Cree, Inc.(a) | | 25,000 | | | 1,755,500 | |
Lam Research Corp.(a) | | 128,817 | | | 4,807,450 | |
Micron Technology, Inc.(a) | | 645,200 | | | 6,703,628 | |
NVIDIA Corp.(a) | | 250,400 | | | 4,351,952 | |
| | | | | | |
| | | | | 22,695,966 | |
| | | | | | |
Software — 7.7% | | | | | | |
Check Point Software Technologies(a)(b) | | 214,200 | | | 7,509,852 | |
Microsoft Corp. | | 807,042 | | | 23,622,119 | |
Salesforce.com, Inc.(a)(b) | | 109,379 | | | 8,143,267 | |
| | | | | | |
| | | | | 39,275,238 | |
| | | | | | |
Specialty Retail — 2.0% | | | | | | |
CarMax, Inc.(a) | | 152,500 | | | 3,830,800 | |
The Home Depot, Inc. | | 200,700 | | | 6,492,645 | |
| | | | | | |
| | | | | 10,323,445 | |
| | | | | | |
Tobacco — 1.4% | | | | | | |
Philip Morris International, Inc. | | 132,540 | | | 6,913,286 | |
| | | | | | |
Wireless Telecommunication Services — 0.5% | | | | | | |
NII Holdings, Inc.(a) | | 60,900 | | | 2,537,094 | |
| | | | | | |
Total Long-Term Investments
(Cost — $383,011,393) — 96.5% | | | | | 491,339,155 | |
| | | | | | |
| | |
Short-Term Securities | | Beneficial
Interest | | | |
BlackRock Liquidity Series, LLC Money Market Series, | | 61,558,700 | | | 61,558,700 | |
| | | | | | |
0.22%(c)(d)(e) | | | | | | |
Total Short-Term Securities
(Cost — $61,558,700) — 12.1% | | | | | 61,558,700 | |
| | | | | | |
Total Investments
(Cost — $444,570,093*) — 108.6% | | | | | 552,897,855 | |
Liabilities in Excess of Other Assets — (8.6)% | | | | | (43,874,354 | ) |
| | | | | | |
Net Assets — 100.0% | | | | $ | 509,023,501 | |
| | | | | | |
| * | The cost and unrealized appreciation (depreciation) of investments as of March 31, 2010, as computed for federal income tax purposes, were as follows: |
| | | | |
Aggregate cost | | $ | 450,840,909 | |
| | | | |
Gross unrealized appreciation | | $ | 102,442,934 | |
Gross unrealized depreciation | | | (385,988 | ) |
| | | | |
Net unrealized appreciation | | $ | 102,056,946 | |
| | | | |
| (a) | Non-income producing security. |
| (b) | Security, or a portion of security, is on loan. |
| (c) | Investments in companies considered to be an affiliate of the Fund, for purposes of Section 2(a)(3) of the Investment Company Act of 1940, were as follows: |
| | | | | | | | | | |
Affiliate | | Net
Activity | | | Realized
Gain | | Income |
BlackRock Liquidity Funds, TempFund, Institutional Class | | $ | (8,129,215 | ) | | $ | 38 | | $ | 4,475 |
BlackRock Liquidity Series, LLC Money Market Series | | $ | 43,622,200 | | | | — | | $ | 32,133 |
| (d) | Security was purchased with the cash collateral from loaned securities. |
| (e) | Represents the current yield as of report date. |
| • | | For Fund compliance purposes, the Fund’s industry classifications refer to any one or more of the industry sub-classifications used by one or more widely recognized market indexes or ratings group indexes, and/or as defined by Fund management. This definition may not apply for purposes of this report, which may combine industry sub-classifications for reporting ease. |
| • | | Fair Value Measurements — Various inputs are used in determining the fair value of investments, which are as follows: |
| | • | | Level 1 – price quotations in active markets/exchanges for identical assets and liabilities |
| | • | | Level 2 – other observable inputs (including, but not limited to: quoted prices for similar assets or liabilities in markets that are active, quoted prices for identical or similar assets or liabilities in markets that are not active, inputs other than quoted prices that are observable for the assets or liabilities (such as interest rates, yield curves, volatilities, prepayment speeds, loss severities, credit risks and default rates) or other market–corroborated inputs) |
| | • | | Level 3 – unobservable inputs based on the best information available in the circumstances, to the extent observable inputs are not available (including the Fund’s own assumptions used in determining the fair value of investments) |
The inputs or methodologies used for valuing securities are not necessarily an indication of the risk associated with investing in those securities. For information about the Fund’s policy regarding valuation of investments and other significant accounting policies, please refer to Note 1 of the Notes to Financial Statements.
The following table summarizes the inputs used as of March 31, 2010 in determining the fair valuation of the Fund’s investments:
| | | | | | | | | | | |
| | | Investments in Securities |
Valuation Inputs | | Level 1 | | Level 2 | | Level 3 | | Total |
Assets: | | | | | | | | | | | |
Long-Term Investments1 | | $ | 491,339,155 | | | — | | — | | $ | 491,339,155 |
Short-Term Securities | | | — | | $ | 61,558,700 | | — | | | 61,558,700 |
| | | | | | | | | | | |
Total | | $ | 491,339,155 | | $ | 61,558,700 | | — | | $ | 552,897,855 |
| | | | | | | | | | | |
| 1 | See above Schedule of Investments for values in each industry. |
See Notes to Financial Statements.
| | | | | | |
| 20 | | BLACKROCK FUNDS | | MARCH 31, 2010 | | |
| | |
| Schedule of Investments March 31, 2010 (Unaudited) | | BlackRock Energy & Resources Portfolio |
| | (Percentages shown are based on Net Assets) |
| | | | | |
Common Stocks | | Shares | | Value |
Auto Components — 0.1% | | | | | |
Westport Innovations, Inc. (acquired 12/19/03 through 12/31/03, cost $183,679)(a)(b) | | 53,057 | | $ | 875,011 |
| | | | | |
Capital Markets — 0.0% | | | | | |
Treasure Island Royalty Trust(a) | | 366,922 | | | 385,268 |
| | | | | |
Commercial Services & Supplies — 0.3% | | | | | |
Alexco Resource Corp.(a) | | 967,683 | | | 3,339,913 |
Republic Resources, Inc.(a) | | 28,750 | | | — |
| | | | | |
| | | | | 3,339,913 |
| | | | | |
Diversified Financial Services — 0.0% | | | | | |
Quest Capital Corp.(a) | | 61,000 | | | 79,279 |
| | | | | |
Electrical Equipment — 0.0% | | | | | |
ITM Power Plc(a) | | 525,200 | | | 157,926 |
| | | | | |
Electronic Equipment, Instruments & Components — 0.1% | | | | | |
Opsens, Inc.(a) | | 2,175,000 | | | 1,284,891 |
| | | | | |
Energy Equipment & Services — 3.5% | | | | | |
Baker Hughes, Inc.(c) | | 135,200 | | | 6,332,768 |
ENSCO International Plc - ADR | | 94,100 | | | 4,213,798 |
Halliburton Co. | | 316,326 | | | 9,530,902 |
Technicoil Corp.(a) | | 547,800 | | | 323,616 |
Technicoil Corp. (acquired 6/15/04, cost $548,935)(a)(b) | | 753,100 | | | 444,897 |
Weatherford International Ltd.(a) | | 1,093,196 | | | 17,338,089 |
Xtreme Coil Drilling Corp.(a) | | 527,700 | | | 2,067,884 |
| | | | | |
| | | | | 40,251,954 |
| | | | | |
Gas Utilities — 2.0% | | | | | |
EQT Corp. | | 546,000 | | | 22,386,000 |
| | | | | |
Machinery — 0.0% | | | | | |
Railpower Technologies Corp.(a) | | 360,600 | | | — |
| | | | | |
Metals & Mining — 10.5% | | | | | |
Archipelago Resources Plc(a) | | 2,247,400 | | | 1,239,621 |
Baja Mining Corp.(a) | | 3,654,800 | | | 2,914,772 |
BHP Billiton Ltd. - ADR(c) | | 300,000 | | | 24,096,000 |
Crosshair Exploration & Mining Corp.(a) | | 352,800 | | | 65,999 |
Crosshair Exploration & Mining Corp. (acquired 4/01/08, cost $248,613)(a)(b) | | 206,800 | | | 38,687 |
Eastern Platinum Ltd.(a) | | 1,500,000 | | | 2,185,792 |
Eastmain Resources, Inc.(a) | | 1,300,000 | | | 1,855,954 |
Eldorado Gold Corp.(a) | | 368,965 | | | 4,479,238 |
Erdene Gold, Inc. (acquired 4/10/07, cost $959,233)(a)(b) | | 1,100,000 | | | 541,525 |
European Goldfields Ltd.(a) | | 561,400 | | | 3,863,719 |
Freeport-McMoRan Copper & Gold, Inc. | | 250,000 | | | 20,885,000 |
Fronteer Development Group, Inc.(a) | | 500,000 | | | 2,564,860 |
Gold Reserve, Inc.(a) | | 123,948 | | | 135,103 |
Goldcorp, Inc. | | 4,600 | | | 171,880 |
Golden Star Resources Ltd.(a) | | 789,408 | | | 3,023,480 |
Grande Cache Coal Corp.(a) | | 306,300 | | | 2,491,053 |
Helio Resource Corp.(a) | | 2,000,000 | | | 955,053 |
Imperial Metals Corp.(a) | | 60,462 | | | 1,184,654 |
Kilo Goldmines Ltd.(a) | | 820,000 | | | 395,609 |
Kinross Gold Corp. | | 111,175 | | | 1,899,981 |
Kodiak Exploration Ltd.(a) | | 1,000,000 | | | 315,069 |
Lake Shore Gold Corp.(a) | | 1,294,602 | | | 3,212,127 |
Linear Gold Corp.(a) | | 1,000,000 | | | 1,693,497 |
MAG Silver Corp.(a) | | 964,000 | | | 7,308,423 |
Minefinders Corp. Ltd.(a)(c) | | 250,000 | | | 2,315,000 |
Nevsun Resources Ltd.(a) | | 554,800 | | | 1,649,679 |
Northern Star Mining Corp.(a) | | 1,633,500 | | | 450,332 |
Oromin Explorations Ltd.(a) | | 1,850,000 | | | 1,275,046 |
Polymet Mining Corp.(a) | | 2,250,000 | | | 4,962,339 |
Q2 Gold Resources, Inc. (acquired 6/18/07, cost $0)(a)(b) | | 327,600 | | | 645 |
Rainy River Resources Ltd.(a) | | 1,000,000 | | | 5,759,858 |
Romarco Minerals, Inc.(a) | | 223,000 | | | 428,150 |
Sunridge Gold Corp.(a) | | 3,325,559 | | | 1,473,442 |
Vale SA - ADR(c) | | 300,000 | | | 9,657,000 |
Virginia Mines, Inc.(a) | | 216,350 | | | 1,520,936 |
Western Coal Corp.(a) | | 360,400 | | | 2,157,468 |
X-Cal Resources Ltd.(a) | | 1,755,500 | | | 216,056 |
| | | | | |
| | | | | 119,383,047 |
| | | | | |
Oil, Gas & Consumable Fuels — 81.4% | | | | | |
Advantage Oil & Gas Ltd. (acquired 6/26/09, cost $5,214,217)(a)(b) | | 1,000,000 | | | 6,773,987 |
Alpha Natural Resources, Inc.(a) | | 799,128 | | | 39,868,496 |
American Oil & Gas, Inc.(a) | | 460,486 | | | 3,131,305 |
Approach Resources, Inc.(a) | | 93,700 | | | 850,796 |
Arcan Resources Ltd.(a) | | 369,200 | | | 1,461,314 |
Arch Coal, Inc. | | 1,324,400 | | | 30,262,540 |
Atlas Energy, Inc.(a)(c) | | 750,000 | | | 23,340,000 |
ATP Oil & Gas Corp.(a)(c) | | 168,800 | | | 3,175,128 |
Baytex Energy Trust | | 421,948 | | | 14,270,579 |
Bellatrix Exploration Ltd.(a) | | 188,332 | | | 700,925 |
Canadian Superior Energy, Inc.(a) | | 6,230,300 | | | 3,778,677 |
Canadian Superior Energy, Inc. (acquired 1/15/10, cost $3,034,134)(a)(b) | | 6,000,000 | | | 3,040,023 |
Canext Energy Ltd.(a) | | 207,829 | | | 106,406 |
Carrizo Oil & Gas, Inc.(a)(c) | | 400,400 | | | 9,189,180 |
Chesapeake Energy Corp. | | 1,300,000 | | | 30,732,000 |
Cinch Energy Corp. (acquired 6/07/04 through 7/07/05, cost $1,418,282)(a)(b) | | 901,980 | | | 1,190,029 |
Clayton Williams Energy, Inc.(a) | | 349,421 | | | 12,222,747 |
Compton Petroleum Corp. (acquired 9/24/04, cost $727,951)(a)(b) | | 104,300 | | | 96,531 |
Comstock Resources, Inc.(a) | | 203,300 | | | 6,464,940 |
CONSOL Energy, Inc. | | 1,097,600 | | | 46,823,616 |
Continental Resources, Inc.(a)(c) | | 135,000 | | | 5,744,250 |
Corridor Resources, Inc.(a) | | 1,046,600 | | | 4,750,481 |
Crew Energy, Inc.(a) | | 880,537 | | | 15,059,251 |
Crew Energy, Inc.(acquired 6/24/98 through 10/19/98, cost $184,988)(a)(b) | | 191,300 | | | 3,271,679 |
Daylight Resources Trust | | 1,021,464 | | | 10,580,221 |
Delphi Energy Corp.(a) | | 955,200 | | | 2,445,252 |
Denbury Resources, Inc.(a) | | 595,200 | | | 10,041,024 |
Energy XXI Bermuda Ltd.(a) | | 366,280 | | | 6,560,075 |
EOG Resources, Inc.(c) | | 227,200 | | | 21,115,968 |
EXCO Resources, Inc. | | 1,568,800 | | | 28,834,544 |
Fairborne Energy Ltd.(a) | | 712,958 | | | 2,674,514 |
Forest Oil Corp.(a) | | 100,000 | | | 2,582,000 |
Galleon Energy, Inc. - Class A(a) | | 1,808,482 | | | 12,268,440 |
Gastar Exploration Ltd.(a) | | 211,060 | | | 1,025,752 |
GMX Resources, Inc.(a)(c) | | 530,789 | | | 4,363,086 |
Goodrich Petroleum Corp.(a)(c) | | 1,009,700 | | | 15,791,708 |
Gran Tierra Energy, Inc.(a) | | 574,000 | | | 3,390,932 |
Heritage Oil Plc(a) | | 2,523,000 | | | 21,468,701 |
International Coal Group, Inc.(a) | | 1,700,000 | | | 7,769,000 |
Ithaca Energy, Inc.(a) | | 237,200 | | | 485,774 |
See Notes to Financial Statements.
| | | | | | |
| | | BLACKROCK FUNDS | | MARCH 31, 2010 | | 21 |
| | |
| Schedule of Investments (continued) | | BlackRock Energy & Resources Portfolio |
| | (Percentages shown are based on Net Assets) |
| | | | | | | |
Common Stocks | | Shares | | Value | |
Oil, Gas & Consumable Fuels (concluded) | | | | | | | |
James River Coal Co. (a) | | | 131,100 | | $ | 2,084,490 | |
Longview Energy Co. (acquired 8/13/04, cost $1,281,000) (a)(b) | | | 85,400 | | | 892,430 | |
Lynden Energy Corp. (a) | | | 200,400 | | | 147,984 | |
Magnum Hunter Resources Corp. (a) | | | 1,436,900 | | | 4,368,176 | |
Massey Energy Co. | | | 1,944,840 | | | 101,695,684 | |
Matador Resources Co. (acquired 10/14/03 through 4/13/06, cost $2,957,155) (a)(b) | | | 513,393 | | | 7,089,957 | |
Midnight Oil Exploration Ltd. (a) | | | 3,650,300 | | | 3,845,637 | |
Midnight Oil Exploration Ltd. (acquired 9/29/05, cost $1,971,490) (a)(b) | | | 577,400 | | | 608,298 | |
Midway Energy Ltd. (a) | | | 21,717 | | | 70,134 | |
NAL Oil & Gas Trust | | | 7,526 | | | 95,960 | |
Newfield Exploration Co. (a) | | | 709,310 | | | 36,919,585 | |
Niko Resources Ltd. (acquired 5/02/03 through 11/10/03, cost $689,948) (a)(b) | | | 39,000 | | | 4,159,770 | |
Open Range Energy Corp. (a) | | | 48,061 | | | 78,079 | |
Pacific Rodera Energy, Inc. (a) | | | 990,200 | | | 292,483 | |
Pan Orient Energy Corp. (a) | | | 1,167,100 | | | 7,239,433 | |
Paramount Resources Ltd. - Class A (a) | | | 849,150 | | | 14,188,033 | |
Patriot Coal Corp. (a) | | | 377,346 | | | 7,720,499 | |
Peabody Energy Corp. | | | 895,436 | | | 40,921,425 | |
Penn Virginia Corp. | | | 1,608,300 | | | 39,403,350 | |
Penn West Energy Trust | | | 153,333 | | | 3,247,371 | |
Petrohawk Energy Corp. (a) | | | 2,256,500 | | | 45,761,820 | |
Petrolifera Petroleum Ltd. (a) | | | 892,415 | | | 843,517 | |
Pioneer Natural Resources Co. (c) | | | 209,200 | | | 11,782,144 | |
Plains Exploration & Production Co. (a) | | | 1,555,525 | | | 46,650,195 | |
ProspEx Resources Ltd. (a) | | | 1,504,120 | | | 2,191,796 | |
Quicksilver Resources, Inc. (a)(c) | | | 364,400 | | | 5,127,108 | |
Range Resources Corp. (c) | | | 200,000 | | | 9,374,000 | |
Rosetta Resources, Inc. (a) | | | 579,000 | | | 13,635,450 | |
Ship Finance International Ltd. | | | 27 | | | 479 | |
Southwestern Energy Co. (a) | | | 1,182,300 | | | 48,143,256 | |
St. Mary Land & Exploration Co. | | | 143,400 | | | 4,991,754 | |
Stone Energy Corp. (a) | | | 27,274 | | | 484,113 | |
Toreador Resources Corp. (a) | | | 300,000 | | | 2,454,000 | |
Trilogy Energy Corp. | | | 152,791 | | | 1,283,225 | |
Tullow Oil Plc | | | 544,198 | | | 10,326,898 | |
Ultra Petroleum Corp. (a) | | | 346,900 | | | 16,175,947 | |
Uranium One, Inc. (a) | | | 1,005,765 | | | 2,653,916 | |
Vero Energy, Inc. (a) | | | 55,374 | | | 316,766 | |
Vero Energy, Inc. (acquired 11/28/05, cost $68,972) (a)(b) | | | 36,268 | | | 207,470 | |
Warren Resources, Inc. (a) | | | 222,282 | | | 560,151 | |
West Energy Ltd. (a) | | | 1,199,235 | | | 5,856,551 | |
Western Energy Services Corp. (acquired 2/25/10, cost $3,752,521) (a)(b) | | | 20,000,000 | | | 5,218,333 | |
Yoho Resources, Inc. (a) | | | 1,000,000 | | | 2,599,321 | |
| | | | | | | |
| | | | | | 929,408,859 | |
| | | | | | | |
Total Common Stocks — 97.9% | | | | | | 1,117,552,148 | |
| | | | | | | |
| | |
| | | Par
(000) | | | |
Corporate Bonds | | | | | | | |
Oil, Gas & Consumable Fuels — 0.5% | | | | | | | |
BPZ Resources, Inc., | | | | | | | |
6.50%, 3/01/15 | | $ | 5,000 | | | 6,225,000 | |
| | | | | | | |
Total Long-Term Investments
(Cost — $840,050,554) — 98.4% | | | | | | 1,123,777,148 | |
| | | | | | | |
| | |
Short-Term Securities | | Shares/
Beneficial
Interest | | Value | |
BlackRock Liquidity Funds, TempFund, Institutional Class, 0.11% (d)(e) | | | 21,810,363 | | $ | 21,810,363 | |
BlackRock Liquidity Series, LLC Money Market Series, 0.22% (d)(e)(f) | | | 90,824,750 | | | 90,824,750 | |
| | | | | | | |
Total Short-Term Securities
(Cost — $112,635,113) — 9.9% | | | | | | 112,635,113 | |
| | | | | | | |
Total Investments (Cost — $952,685,667*) — 108.3% | | | 1,236,412,261 | |
Liabilities in Excess of Other Assets — (8.3)% | | | | | | (94,985,125 | ) |
| | | | | | | |
Net Assets — 100.0% | | | | | $ | 1,141,427,136 | |
| | | | | | | |
| * | The cost and unrealized appreciation (depreciation) of investments as of March 31, 2010, as computed for federal income tax purposes, were as follows: |
| | | | |
Aggregate cost | | $ | 976,239,838 | |
| | | | |
Gross unrealized appreciation | | $ | 373,738,841 | |
Gross unrealized depreciation | | | (113,566,418 | ) |
| | | | |
Net unrealized appreciation | | $ | 260,172,423 | |
| | | | |
| (a) | Non-income producing security. |
| (b) | Restricted security as to resale. As of report date the Fund held 3.0% of its net assets, with a current value of $34,449,272 and an original cost of $23,241,118 in these securities. |
| (c) | Security, or a portion of security, is on loan. |
| (d) | Investments in companies considered to be an affiliate of the Fund, for purposes of Section 2(a)(3) of the Investment Company Act of 1940, were as follows: |
| | | | | | | | | | |
Affiliate | | Net
Activity | | | Realized
Gain | | Income |
BlackRock Liquidity Funds, TempFund, Institutional Class | | $ | (5,032,426 | ) | | $ | 175 | | $ | 18,237 |
BlackRock Liquidity Series, LLC Money Market Series | | $ | (4,337,750 | ) | | | — | | $ | 85,164 |
| (e) | Represents the current yield as of report date. |
| (f) | Security was purchased with the cash collateral from loaned securities. |
| • | | Foreign currency exchange contracts as of March 31, 2010 were as follows: |
| | | | | | | | | | | |
Currency Purchased | | Currency
Sold | | Counterparty | | Settlement
Date | | Unrealized
Appreciation
(Depreciation) | |
CAD 1,162,000 | | USD | 1,142,805 | | Citibank, N.A. | | 4/01/10 | | $ | 1,289 | |
CAD 2,790,000 | | USD | 2,749,321 | | Citibank, N.A. | | 4/05/10 | | | (2,311 | ) |
| | | | | | | | | | | |
Total | | | | | | | | | $ | (1,022 | ) |
| | | | | | | | | | | |
| • | | For Fund compliance purposes, the Fund’s industry classifications refer to any one or more of the industry sub-classifications used by one or more widely recognized market indexes or ratings group indexes, and/or as defined by Fund management. This definition may not apply for purposes of this report, which may combine industry sub-classifications for reporting ease. |
See Notes to Financial Statements.
| | | | | | |
| 22 | | BLACKROCK FUNDS | | MARCH 31, 2010 | | |
| | |
| Schedule of Investments (concluded) | | BlackRock Energy & Resources Portfolio |
| | |
| • | | Fair Value Measurements — Various inputs are used in determining the fair value of investments, which are as follows: |
| | • | | Level 1 – price quotations in active markets/exchanges for identical assets and liabilities |
| | • | | Level 2 – other observable inputs (including, but not limited to: quoted prices for similar assets or liabilities in markets that are active, quoted prices for identical or similar assets or liabilities in markets that are not active, inputs other than quoted prices that are observable for the assets or liabilities (such as interest rates, yield curves, volatilities, prepayment speeds, loss severities, credit risks and default rates) or other market–corroborated inputs) |
| | • | | Level 3 – unobservable inputs based on the best information available in the circumstances, to the extent observable inputs are not available (including the Fund’s own assumptions used in determining the fair value of investments) |
The inputs or methodologies used for valuing securities are not necessarily an indication of the risk associated with investing in those securities. For information about the Fund’s policy regarding valuation of investments and other significant accounting policies, please refer to Note 1 of the Notes to Financial Statements.
The following tables summarize the inputs used as of March 31, 2010 in determining the fair valuation of the Fund’s investments:
| | | | | | | | | | | | |
| | | Investments in Securities |
Valuation Inputs | | Level 1 | | Level 2 | | Level 3 | | Total |
Assets: | | | | | | | | | | | | |
Common Stocks: | | | | | | | | | | | | |
Auto Components | | $ | 875,011 | | | — | | | — | | $ | 875,011 |
Capital Markets | | | 385,268 | | | — | | | — | | | 385,268 |
Commercial Services & Supplies | | | 3,339,913 | | | — | | | — | | | 3,339,913 |
Diversified Financial Services | | | 79,279 | | | — | | | — | | | 79,279 |
Electrical Equipment | | | — | | $ | 157,926 | | | — | | | 157,926 |
Electrical Equipment, Instruments & Components | | | 1,284,891 | | | — | | | — | | | 1,284,891 |
Energy & Utilities | | | 7,769,000 | | | — | | | — | | | 7,769,000 |
Energy Equipment & Services | | | 40,251,954 | | | — | | | — | | | 40,251,954 |
Gas Utilities | | | 22,386,000 | | | — | | | — | | | 22,386,000 |
Metals & Mining | | | 118,142,781 | | | 1,239,621 | | $ | 645 | | | 119,383,047 |
Oil, Gas & Consumable Fuels | | | 878,821,850 | | | 31,795,599 | | | 11,022,410 | | | 921,639,859 |
Corporate Bonds | | | — | | | 6,225,000 | | | | | | 6,225,000 |
Short-Term Securities. | | | 21,810,363 | | | 90,824,750 | | | — | | | 112,635,113 |
| | | | | | | | | | | | |
Total | | $ | 1,095,146,310 | | $ | 130,242,896 | | $ | 11,023,055 | | $ | 1,236,412,261 |
| | | | | | | | | | | | |
| | | | | | | | | | | | |
| | | Other Financial Instruments1 | |
Valuation Inputs | | Level 1 | | Level 2 | | | Level 3 | | Total | |
Assets | | — | | $ | 1,289 | | | — | | $ | 1,289 | |
Liabilities | | — | | | (2,311 | ) | | — | | | (2,311 | ) |
| | | | | | | | | | | | |
Total | | — | | $ | (1,022 | ) | | — | | $ | (1,022 | ) |
| | | | | | | | | | | | |
| 1 | Other financial instruments are foreign currency exchange contracts which are shown at the unrealized appreciation/depreciation on the instrument. |
The following table is a reconciliation of Level 3 investments for the six months ended March 31, 2010:
| | | | | | | | | | | | | | | |
| | | Long-Term Investments | |
| | | Metals &
Mining | | Oil, Gas &
Consumable
Fuels | | | Warrants | | | Total | |
Balance, as of September 30, 2009 | | | — | | $ | 13,231,132 | | | $ | 2 | | | $ | 13,231,134 | |
Realized gain/loss | | | — | | | — | | | | — | | | | — | |
Change in unrealized appreciation/depreciation2 | | $ | 645 | | | 1,531,131 | | | | — | | | | 1,531,776 | |
Net purchases/sales | | | — | | | 3,034,134 | | | $ | (2 | ) | | | 3,034,132 | |
Transfers in/out of Level 3 | | | — | | | (6,773,987 | ) | | | — | | | | (6,773,987 | ) |
| | | | | | | | | | | | | | | |
Balance, as of March 31, 2010 | | $ | 645 | | $ | 11,022,410 | | | | — | | | $ | 11,023,055 | |
| | | | | | | | | | | | | | | |
| 2 | Included in the related net change in unrealized appreciation/depreciation in the Statements of Operations. The change in unrealized appreciation/depreciation on securities still held at March 31, 2010 was $1,121,215. |
See Notes to Financial Statements.
| | | | | | |
| | | BLACKROCK FUNDS | | MARCH 31, 2010 | | 23 |
Statements of Assets and Liabilities
| | | | | | | | | | | | | | | | |
March 31, 2010 (Unaudited) | | BlackRock
All-Cap Energy &
Resources
Portfolio | | | BlackRock
Aurora
Portfolio | | | BlackRock
Capital
Appreciation
Portfolio | | | BlackRock
Energy &
Resources
Portfolio | |
Assets | | | | | | | | | | | | | | | | |
Investments at value - unaffiliated1,2 | | $ | 727,321,194 | | | $ | 454,727,848 | | | $ | 491,339,155 | | | $ | 1,123,777,148 | |
Investments at value - affiliated3 | | | 117,361,381 | | | | 100,473,338 | | | | 61,558,700 | | | | 112,635,113 | |
Foreign currency at value4 | | | 2,082 | | | | 103 | | | | — | | | | 563 | |
Unrealized appreciation on foreign currency exchange contracts | | | — | | | | — | | | | — | | | | 1,289 | |
Capital shares sold receivable | | | 1,604,628 | | | | 206,731 | | | | 11,364,111 | | | | 4,731,099 | |
Investments sold receivable | | | 1,440,135 | | | | 4,873,726 | | | | 9,107,715 | | | | — | |
Dividends and reclaims receivable | | | 384,371 | | | | 439,911 | | | | 297,311 | | | | 263,091 | |
Securities lending income receivable - affiliated | | | 40,645 | | | | 80,721 | | | | 20,074 | | | | 28,404 | |
Receivable from advisor | | | — | | | | 10,726 | | | | 14,222 | | | | — | |
Dividends receivable - affiliated | | | 1,072 | | | | 475 | | | | 700 | | | | 1,660 | |
Interest receivable | | | — | | | | — | | | | — | | | | 46,486 | |
Prepaid expenses | | | 106,275 | | | | 89,040 | | | | 56,783 | | | | 120,961 | |
| | | | | | | | | | | | | | | | |
Total assets | | | 848,261,783 | | | | 560,902,619 | | | | 573,758,771 | | | | 1,241,605,814 | |
| | | | | | | | | | | | | | | | |
Liabilities | | | | | | | | | | | | | | | | |
Collateral at value - securities loaned | | | 112,684,650 | | | | 77,589,190 | | | | 61,558,700 | | | | 90,824,750 | |
Bank overdraft | | | — | | | | — | | | | 1,357,510 | | | | — | |
Investments purchased payable | | | — | | | | 6,972,284 | | | | 695,476 | | | | 3,891,041 | |
Capital shares redeemed payable | | | 1,066,590 | | | | 16,060,789 | | | | 649,855 | | | | 3,707,154 | |
Investment advisory fees payable | | | 497,148 | | | | 339,144 | | | | 239,089 | | | | 940,486 | |
Other affiliates payable | | | 276,060 | | | | 509,054 | | | | 117,178 | | | | 415,916 | |
Service and distribution fees payable | | | 177,759 | | | | 184,128 | | | | 74,757 | | | | 317,379 | |
Officer’s and Trustees’ fees payable | | | 10,394 | | | | 12,380 | | | | 8,458 | | | | 10,781 | |
Unrealized depreciation on foreign currency exchange contracts | | | — | | | | — | | | | — | | | | 2,311 | |
Other accrued expenses payable | | | 59,905 | | | | 62,968 | | | | 34,247 | | | | 68,860 | |
| | | | | | | | | | | | | | | | |
Total liabilities | | | 114,772,506 | | | | 101,729,937 | | | | 64,735,270 | | | | 100,178,678 | |
| | | | | | | | | | | | | | | | |
Net Assets | | $ | 733,489,277 | | | $ | 459,172,682 | | | $ | 509,023,501 | | | $ | 1,141,427,136 | |
| | | | | | | | | | | | | | | | |
Net Assets Consist of | | | | | | | | | | | | | | | | |
Paid-in capital | | $ | 756,061,874 | | | $ | 692,193,435 | | | $ | 499,216,306 | | | $ | 1,047,569,415 | |
Undistributed (accumulated) net investment income (loss) | | | (1,528,608 | ) | | | (432,194 | ) | | | 31,752 | | | | (19,661,645 | ) |
Accumulated net realized loss | | | (155,698,241 | ) | | | (298,528,581 | ) | | | (98,552,319 | ) | | | (170,193,633 | ) |
Net unrealized appreciation/depreciation | | | 134,654,252 | | | | 65,940,022 | | | | 108,327,762 | | | | 283,712,999 | |
| | | | | | | | | | | | | | | | |
Net Assets | | $ | 733,489,277 | | | $ | 459,172,682 | | | $ | 509,023,501 | | | $ | 1,141,427,136 | |
| | | | | | | | | | | | | | | | |
1 Investments at cost - unaffiliated | | $ | 592,667,214 | | | $ | 388,787,831 | | | $ | 383,011,393 | | | $ | 840,050,554 | |
2 Securities loaned | | $ | 110,114,635 | | | $ | 74,758,114 | | | $ | 59,819,935 | | | $ | 88,377,397 | |
3 Investments at cost - affiliated | | $ | 117,361,381 | | | $ | 100,473,338 | | | $ | 61,558,700 | | | $ | 112,635,113 | |
4 Foreign currency at cost | | $ | 2,088 | | | $ | 98 | | | | — | | | $ | 465 | |
See Notes to Financial Statements.
| | | | | | |
| 24 | | BLACKROCK FUNDS | | MARCH 31, 2010 | | |
Statements of Assets and Liabilities (concluded)
| | | | | | | | | | | | |
March 31, 2010 (Unaudited) | | BlackRock
All-Cap Energy &
Resources
Portfolio | | BlackRock
Aurora
Portfolio | | BlackRock
Capital
Appreciation
Portfolio | | BlackRock
Energy &
Resources
Portfolio |
Net Asset Value | | | | | | | | | | | | |
Institutional | | | | | | | | | | | | |
Net assets | | $ | 371,675,605 | | $ | 30,424,529 | | $ | 279,330,833 | | $ | 210,865,598 |
| | | | | | | | | | | | |
Shares outstanding1 | | | 27,200,493 | | | 1,693,223 | | | 16,799,525 | | | 5,687,107 |
| | | | | | | | | | | | |
Net asset value | | $ | 13.66 | | $ | 17.97 | | $ | 16.63 | | $ | 37.08 |
| | | | | | | | | | | | |
Service | | | | | | | | | | | | |
Net assets | | $ | 4,090,311 | | | — | | | — | | | — |
| | | | | | | | | | | | |
Shares outstanding1 | | | 304,598 | | | — | | | — | | | — |
| | | | | | | | | | | | |
Net asset value | | $ | 13.43 | | | — | | | — | | | — |
| | | | | | | | | | | | |
Investor A | | | | | | | | | | | | |
Net assets | | $ | 203,733,221 | | $ | 331,172,968 | | $ | 191,366,737 | | $ | 743,754,817 |
| | | | | | | | | | | | |
Shares outstanding1 | | | 15,168,813 | | | 20,170,482 | | | 12,031,302 | | | 22,858,799 |
| | | | | | | | | | | | |
Net asset value | | $ | 13.43 | | $ | 16.42 | | $ | 15.91 | | $ | 32.54 |
| | | | | | | | | | | | |
Investor B | | | | | | | | | | | | |
Net assets | | $ | 30,153,548 | | $ | 32,973,264 | | $ | 8,804,423 | | $ | 32,913,680 |
| | | | | | | | | | | | |
Shares outstanding1 | | | 2,317,179 | | | 2,522,361 | | | 607,380 | | | 1,350,463 |
| | | | | | | | | | | | |
Net asset value | | $ | 13.01 | | $ | 13.07 | | $ | 14.50 | | $ | 24.37 |
| | | | | | | | | | | | |
Investor C | | | | | | | | | | | | |
Net assets | | $ | 123,836,592 | | $ | 63,741,684 | | $ | 29,521,508 | | $ | 153,893,041 |
| | | | | | | | | | | | |
Shares outstanding1 | | | 9,508,436 | | | 4,904,801 | | | 2,022,582 | | | 6,327,805 |
| | | | | | | | | | | | |
Net asset value | | $ | 13.02 | | $ | 13.00 | | $ | 14.60 | | $ | 24.32 |
| | | | | | | | | | | | |
Class R | | | | | | | | | | | | |
Net assets | | | — | | $ | 860,237 | | | — | | | — |
| | | | | | | | | | | | |
Shares outstanding1 | | | — | | | 52,889 | | | — | | | — |
| | | | | | | | | | | | |
Net asset value | | | — | | $ | 16.26 | | | — | | | — |
| | | | | | | | | | | | |
| 1 | Unlimited number of shares authorized, $0.001 par value. |
See Notes to Financial Statements.
| | | | | | |
| | | BLACKROCK FUNDS | | MARCH 31, 2010 | | 25 |
Statements of Operations
| | | | | | | | | | | | | | | | |
Six Months Ended March 31, 2010 (Unaudited) | | BlackRock
All-Cap Energy &
Resources
Portfolio | | | BlackRock
Aurora
Portfolio | | | BlackRock
Capital
Appreciation
Portfolio | | | BlackRock
Energy &
Resources
Portfolio | |
Investment Income | | | | | | | | | | | | | | | | |
Dividends and reclaims | | $ | 3,358,062 | | | $ | 3,037,705 | | | $ | 2,312,807 | | | $ | 3,140,984 | |
Foreign taxes withheld | | | (277,556 | ) | | | (285 | ) | | | (5,401 | ) | | | (183,291 | ) |
Securities lending - affiliated | | | 67,069 | | | | 121,552 | | | | 32,133 | | | | 85,164 | |
Dividends - affiliated | | | 18,587 | | | | 3,449 | | | | 4,475 | | | | 18,237 | |
Interest | | | — | | | | — | | | | — | | | | 46,586 | |
| | | | | | | | | | | | | | | | |
Total income | | | 3,166,162 | | | | 3,162,421 | | | | 2,344,014 | | | | 3,107,680 | |
| | | | | | | | | | | | | | | | |
Expenses | | | | | | | | | | | | | | | | |
Investment advisory | | | 2,692,790 | | | | 1,943,697 | | | | 1,451,096 | | | | 3,972,152 | |
Service and distribution - class specific | | | 1,007,531 | | | | 886,801 | | | | 397,147 | | | | 1,772,615 | |
Transfer agent - class specific | | | 392,667 | | | | 750,272 | | | | 283,563 | | | | 729,679 | |
Administration | | | 258,307 | | | | 171,503 | | | | 167,433 | | | | 367,048 | |
Printing | | | 62,121 | | | | 65,778 | | | | 30,049 | | | | 74,842 | |
Administration - class specific | | | 89,722 | | | | 57,249 | | | | 55,758 | | | | 122,330 | |
Registration | | | 26,847 | | | | 20,414 | | | | 22,762 | | | | 41,155 | |
Custodian | | | 29,075 | | | | 18,701 | | | | 22,780 | | | | 37,293 | |
Professional | | | 33,487 | | | | 30,562 | | | | 33,393 | | | | 38,125 | |
Officer and Trustees | | | 13,608 | | | | 11,644 | | | | 10,836 | | | | 16,661 | |
Miscellaneous | | | 19,819 | | | | 13,976 | | | | 8,299 | | | | 29,301 | |
Recoupment of past waived fees - class specific | | | 22,975 | | | | — | | | | 1,073 | | | | 217,866 | |
| | | | | | | | | | | | | | | | |
Total expenses | | | 4,648,949 | | | | 3,970,597 | | | | 2,484,189 | | | | 7,419,067 | |
Less fees waived by advisor | | | (8,624 | ) | | | (1,792 | ) | | | (187,113 | ) | | | (9,064 | ) |
Less administration fees waived - class specific | | | (3,948 | ) | | | (51,208 | ) | | | (29,155 | ) | | | (1,906 | ) |
Less transfer agent fees waived - class specific | | | (2,774 | ) | | | (29,174 | ) | | | (1,068 | ) | | | (331 | ) |
Less transfer agent fees reimbursed - class specific | | | (5,778 | ) | | | (200,436 | ) | | | (50,774 | ) | | | (5 | ) |
Less fees paid indirectly | | | (525 | ) | | | (894 | ) | | | (312 | ) | | | (747 | ) |
| | | | | | | | | | | | | | | | |
Total expenses after fees waived, reimbursed and paid indirectly | | | 4,627,300 | | | | 3,687,093 | | | | 2,215,767 | | | | 7,407,014 | |
| | | | | | | | | | | | | | | | |
Net investment income (loss) | | | (1,461,138 | ) | | | (524,672 | ) | | | 128,247 | | | | (4,299,334 | ) |
| | | | | | | | | | | | | | | | |
Realized and Unrealized Gain (Loss) | | | | | | | | | | | | | | | | |
Net realized gain (loss) from: | | | | | | | | | | | | | | | | |
Investments | | | 9,387,786 | | | | 46,624,635 | | | | 6,788,102 | | | | 12,971,942 | |
Foreign currency transactions | | | (353,549 | ) | | | — | | | | — | | | | (45,750 | ) |
| | | | | | | | | | | | | | | | |
| | | 9,034,237 | | | | 46,624,635 | | | | 6,788,102 | | | | 12,926,192 | |
| | | | | | | | | | | | | | | | |
Net change in unrealized appreciation/depreciation on: | | | | | | | | | | | | | | | | |
Investments | | | 58,024,214 | | | | 11,455,996 | | | | 39,463,282 | | | | 116,063,156 | |
Foreign currency transactions | | | (1,154 | ) | | | 5 | | | | — | | | | (14,838 | ) |
| | | | | | | | | | | | | | | | |
| | | 58,023,060 | | | | 11,456,001 | | | | 39,463,282 | | | | 116,048,318 | |
| | | | | | | | | | | | | | | | |
Total realized and unrealized gain | | | 67,057,297 | | | | 58,080,636 | | | | 46,251,384 | | | | 128,974,510 | |
| | | | | | | | | | | | | | | | |
Net Increase in Net Assets Resulting from Operations | | $ | 65,596,159 | | | $ | 57,555,964 | | | $ | 46,379,631 | | | $ | 124,675,176 | |
| | | | | | | | | | | | | | | | |
See Notes to Financial Statements.
| | | | | | |
| 26 | | BLACKROCK FUNDS | | MARCH 31, 2010 | | |
Statements of Changes in Net Assets
| | | | | | | | | | | | | | | | |
| | | BlackRock
All-Cap Energy &
Resources
Portfolio | | | BlackRock
Aurora
Portfolio | |
Increase (Decrease) in Net Assets: | | Six Months
Ended
March 31, 2010
(Unaudited) | | | Year Ended
September 30,
2009 | | | Six Months
Ended
March 31, 2010
(Unaudited) | | | Year Ended
September 30,
2009 | |
Operations | | | | | | | | | | | | | | | | |
Net investment loss | | $ | (1,461,138 | ) | | $ | (994,402 | ) | | $ | (524,672 | ) | | $ | (440,745 | ) |
Net realized gain (loss) | | | 9,034,237 | | | | (165,602,132 | ) | | | 46,624,635 | | | | (215,713,078 | ) |
Net change in unrealized appreciation/depreciation | | | 58,023,060 | | | | 14,102,151 | | | | 11,456,001 | | | | 53,000,747 | |
| | | | | | | | | | | | | | | | |
Net increase (decrease) in net assets resulting from operations | | | 65,596,159 | | | | (152,494,383 | ) | | | 57,555,964 | | | | (163,153,076 | ) |
| | | | | | | | | | | | | | | | |
Dividends and Distributions to Shareholders From | | | | | | | | | | | | | | | | |
Net investment income: | | | | | | | | | | | | | | | | |
Institutional | | | (2,738,372 | ) | | | — | | | | (641,490 | ) | | | — | |
Service | | | (17,725 | ) | | | — | | | | — | | | | — | |
Investor A | | | (922,018 | ) | | | — | | | | (3,666,418 | ) | | | — | |
Investor B | | | — | | | | — | | | | (114,872 | ) | | | — | |
Investor C | | | — | | | | — | | | | (496,374 | ) | | | — | |
Class R | | | — | | | | — | | | | (9,253 | ) | | | — | |
Net realized gain: | | | | | | | | | | | | | | | | |
Institutional | | | — | | | | (46,056,785 | ) | | | — | | | | — | |
Service | | | — | | | | (320,003 | ) | | | — | | | | — | |
Investor A | | | — | | | | (21,057,088 | ) | | | — | | | | — | |
Investor B | | | — | | | | (3,991,135 | ) | | | — | | | | — | |
Investor C | | | — | | | | (13,578,949 | ) | | | — | | | | — | |
| | | | | | | | | | | | | | | | |
Decrease in net assets resulting from dividends and distributions to shareholders | | | (3,678,115 | ) | | | (85,003,960 | ) | | | (4,928,407 | ) | | | — | |
| | | | | | | | | | | | | | | | |
Capital Share Transactions | | | | | | | | | | | | | | | | |
Net increase (decrease) in net assets derived from capital share transactions | | | 17,092,653 | | | | (87,080,928 | ) | | | (71,901,244 | ) | | | (149,128,618 | ) |
| | | | | | | | | | | | | | | | |
Redemption Fees | | | | | | | | | | | | | | | | |
Redemption fees | | | 34,942 | | | | 50,517 | | | | 1,493 | | | | 9,271 | |
| | | | | | | | | | | | | | | | |
Net Assets | | | | | | | | | | | | | | | | |
Total increase (decrease) in net assets | | | 79,045,639 | | | | (324,528,754 | ) | | | (19,272,194 | ) | | | (312,272,423 | ) |
Beginning of period | | | 654,443,638 | | | | 978,972,392 | | | | 478,444,876 | | | | 790,717,299 | |
| | | | | | | | | | | | | | | | |
End of period | | $ | 733,489,277 | | | $ | 654,443,638 | | | $ | 459,172,682 | | | $ | 478,444,876 | |
| | | | | | | | | | | | | | | | |
Undistributed (accumulated) net investment income (loss) | | $ | (1,528,608 | ) | | $ | 3,610,645 | | | $ | (432,194 | ) | | $ | 5,020,885 | |
| | | | | | | | | | | | | | | | |
See Notes to Financial Statements.
| | | | | | |
| | | BLACKROCK FUNDS | | MARCH 31, 2010 | | 27 |
Statements of Changes in Net Assets (concluded)
| | | | | | | | | | | | | | | | |
| | | BlackRock
Capital
Appreciation
Portfolio | | | BlackRock
Energy &
Resources
Portfolio | |
Increase (Decrease) in Net Assets: | | Six Months Ended
March 31, 2010
(Unaudited) | | | Year Ended
September 30,
2009 | | | Six Months Ended
March 31, 2010
(Unaudited) | | | Year Ended
September 30,
2009 | |
Operations | | | | | | | | | | | | | | | | |
Net investment income (loss) | | $ | 128,247 | | | $ | 528,727 | | | $ | (4,299,334 | ) | | $ | (4,361,236 | ) |
Net realized gain (loss) | | | 6,788,102 | | | | (52,364,329 | ) | | | 12,926,192 | | | | (178,077,880 | ) |
Net change in unrealized appreciation/depreciation | | | 39,463,282 | | | | 70,125,354 | | | | 116,048,318 | | | | 105,616,664 | |
| | | | | | | | | | | | | | | | |
Net increase (decrease) in net assets resulting from operations | | | 46,379,631 | | | | 18,289,752 | | | | 124,675,176 | | | | (76,822,452 | ) |
| | | | | | | | | | | | | | | | |
Dividends and Distributions to Shareholders From | | | | | | | | | | | | | | | | |
Net investment income: | | | | | | | | | | | | | | | | |
Institutional | | | (1,050,157 | ) | | | — | | | | — | | | | — | |
Investor A | | | (49,880 | ) | | | — | | | | — | | | | — | |
Net realized gain: | | | | | | | | | | | | | | | | |
Institutional | | | — | | | | — | | | | — | | | | (8,049,448 | ) |
Investor A | | | — | | | | — | | | | — | | | | (118,212,244 | ) |
Investor B | | | — | | | | — | | | | — | | | | (11,269,678 | ) |
Investor C | | | — | | | | — | | | | — | | | | (30,833,705 | ) |
| | | | | | | | | | | | | | | | |
Decrease in net assets resulting from dividends and distributions to shareholders | | | (1,100,037 | ) | | | — | | | | — | | | | (168,365,075 | ) |
| | | | | | | | | | | | | | | | |
Capital Share Transactions | | | | | | | | | | | | | | | | |
Net increase in net assets derived from capital share transactions | | | 67,999,278 | | | | 142,586,366 | | | | 82,265,410 | | | | 198,931,044 | |
| | | | | | | | | | | | | | | | |
Redemption Fees | | | | | | | | | | | | | | | | |
Redemption fees | | | — | | | | — | | | | 87,975 | | | | 278,520 | |
| | | | | | | | | | | | | | | | |
Net Assets | | | | | | | | | | | | | | | | |
Total increase (decrease) in net assets | | | 113,278,872 | | | | 160,876,118 | | | | 207,028,561 | | | | (45,977,963 | ) |
Beginning of period | | | 395,744,629 | | | | 234,868,511 | | | | 934,398,575 | | | | 980,376,538 | |
| | | | | | | | | | | | | | | | |
End of period | | $ | 509,023,501 | | | $ | 395,744,629 | | | $ | 1,141,427,136 | | | $ | 934,398,575 | |
| | | | | | | | | | | | | | | | |
Undistributed (accumulated) net investment income (loss) | | $ | 31,752 | | | $ | 1,003,542 | | | $ | (19,661,645 | ) | | $ | (15,362,311 | ) |
| | | | | | | | | | | | | | | | |
See Notes to Financial Statements.
| | | | | | |
| 28 | | BLACKROCK FUNDS | | MARCH 31, 2010 | | |
| | |
| Financial Highlights | | BlackRock All-Cap Energy & Resources Portfolio |
| | |
| | | | | | | | | | | | | | | | | | | | | | | | | | | | | | | | | | | | | | | | | | | | | | | | |
| | | Institutional | | | Service | |
| | | Six Months
Ended March 31, 2010 | | | Year Ended September 30, | | | Period
February 16,
20051 to
September 30, | | | Six Months
Ended
March 31,
2010 | | | Year Ended September 30, | | | Period
February 16,
20051 to
September 30, | |
| | | (Unaudited) | | | 2009 | | | 2008 | | | 2007 | | | 2006 | | | 2005 | | | (Unaudited) | | | 2009 | | | 2008 | | | 2007 | | | 2006 | | | 2005 | |
Per Share Operating Performance | | | | | |
Net asset value, beginning of period | | $ | 12.46 | | | $ | 16.20 | | | $ | 19.40 | | | $ | 13.85 | | | $ | 13.56 | | | $ | 10.00 | | | $ | 12.24 | | | $ | 16.01 | | | $ | 19.19 | | | $ | 13.75 | | | $ | 13.52 | | | $ | 10.00 | |
| | | | | | | | | | | | | | | | | | | | | | | | | | | | | | | | | | | | | | | | | | | | | | | | |
Net investment income (loss)2 | | | (0.00 | )3 | | | 0.02 | | | | 0.24 | | | | 0.05 | | | | 0.02 | | | | 0.02 | | | | (0.03 | ) | | | (0.03 | ) | | | 0.12 | | | | (0.02 | ) | | | (0.02 | ) | | | 0.03 | |
Net realized and unrealized gain (loss) | | | 1.30 | | | | (2.14 | ) | | | (2.90 | ) | | | 5.90 | | | | 0.26 | | | | 3.54 | | | | 1.29 | | | | (2.12 | ) | | | (2.83 | ) | | | 5.86 | | | | 0.24 | | | | 3.49 | |
| | | | | | | | | | | | | | | | | | | | | | | | | | | | | | | | | | | | | | | | | | | | | | | | |
Net increase (decrease) from investment operations | | | 1.30 | | | | (2.12 | ) | | | (2.66 | ) | | | 5.95 | | | | 0.28 | | | | 3.56 | | | | 1.26 | | | | (2.15 | ) | | | (2.71 | ) | | | 5.84 | | | | 0.22 | | | | 3.52 | |
| | | | | | | | | | | | | | | | | | | | | | | | | | | | | | | | | | | | | | | | | | | | | | | | |
Dividends and distributions from: | | | | | | | | | | | | | | | | | | | | | | | | | | | | | | | | | | | | | | | | | | | | | | | | |
Net investment income | | | (0.10 | ) | | | — | | | | (0.23 | ) | | | — | | | | — | | | | — | | | | (0.07 | ) | | | — | | | | (0.16 | ) | | | — | | | | — | | | | — | |
Net realized gain | | | — | | | | (1.62 | ) | | | (0.31 | ) | | | (0.40 | ) | | | — | | | | — | | | | — | | | | (1.62 | ) | | | (0.31 | ) | | | (0.40 | ) | | | — | | | | — | |
| | | | | | | | | | | | | | | | | | | | | | | | | | | | | | | | | | | | | | | | | | | | | | | | |
Total dividends and distributions | | | (0.10 | ) | | | (1.62 | ) | | | (0.54 | ) | | | (0.40 | ) | | | — | | | | — | | | | (0.07 | ) | | | (1.62 | ) | | | (0.47 | ) | | | (0.40 | ) | | | — | | | | — | |
| | | | | | | | | | | | | | | | | | | | | | | | | | | | | | | | | | | | | | | | | | | | | | | | |
Redemption fees added to paid-in capital | | | 0.00 | 3 | | | 0.00 | 3 | | | 0.00 | 3 | | | 0.00 | 3 | | | 0.01 | | | | 0.00 | 3 | | | 0.00 | 3 | | | 0.00 | 3 | | | 0.00 | 3 | | | 0.00 | 3 | | | 0.01 | | | | 0.00 | 3 |
| | | | | | | | | | | | | | | | | | | | | | | | | | | | | | | | | | | | | | | | | | | | | | | | |
Net asset value, end of period | | $ | 13.66 | | | $ | 12.46 | | | $ | 16.20 | | | $ | 19.40 | | | $ | 13.85 | | | $ | 13.56 | | | $ | 13.43 | | | $ | 12.24 | | | $ | 16.01 | | | $ | 19.19 | | | $ | 13.75 | | | $ | 13.52 | |
| | | | | | | | | | | | | | | | | | | | | | | | | | | | | | | | | | | | | | | | | | | | | | | | |
Total Investment Return4 | | | | | |
Based on net asset value | | | 10.51 | %5,6 | | | (7.53 | )%5 | | | (14.25 | )%5 | | | 43.66 | %5 | | | 2.14 | %7 | | | 35.60 | %5,6 | | | 10.29 | %5,6 | | | (7.85 | )%5 | | | (14.59 | )%5 | | | 43.16 | %5 | | | 1.70 | %8 | | | 35.20 | %5,6 |
| | | | | | | | | | | | | | | | | | | | | | | | | | | | | | | | | | | | | | | | | | | | | | | | |
Ratios to Average Net Assets | | | | | |
Total expenses | | | 0.93 | %9 | | | 0.98 | % | | | 0.89 | % | | | 0.93 | % | | | 1.01 | % | | | 1.54 | %9 | | | 1.34 | %9 | | | 1.54 | % | | | 1.25 | % | | | 1.42 | % | | | 1.40 | % | | | 1.77 | %9 |
| | | | | | | | | | | | | | | | | | | | | | | | | | | | | | | | | | | | | | | | | | | | | | | | |
Total expenses excluding recoupment of past waived fees | | | 0.93 | %9 | | | 0.97 | % | | | 0.89 | % | | | 0.93 | % | | | 1.01 | % | | | 1.54 | %9 | | | 1.27 | %9 | | | 1.47 | % | | | 1.25 | % | | | 1.42 | % | | | 1.40 | % | | | 1.77 | %9 |
| | | | | | | | | | | | | | | | | | | | | | | | | | | | | | | | | | | | | | | | | | | | | | | | |
Total expenses after fees waived, reimbursed and paid indirectly | | | 0.93 | %9 | | | 0.93 | % | | | 0.89 | % | | | 0.93 | % | | | 0.99 | % | | | 1.04 | %9 | | | 1.34 | %9 | | | 1.35 | % | | | 1.25 | % | | | 1.33 | % | | | 1.34 | % | | | 1.34 | %9 |
| | | | | | | | | | | | | | | | | | | | | | | | | | | | | | | | | | | | | | | | | | | | | | | | |
Net investment income (loss) | | | (0.05 | )%9 | | | 0.17 | % | | | 1.14 | % | | | 0.31 | % | | | 0.17 | % | | | 0.25 | %9 | | | (0.46 | )%9 | | | (0.26 | )% | | | 0.56 | % | | | (0.11 | )% | | | (0.17 | )% | | | 0.01 | %9 |
| | | | | | | | | | | | | | | | | | | | | | | | | | | | | | | | | | | | | | | | | | | | | | | | |
Supplemental Data | | | | | |
Net assets, end of period (000) | | $ | 371,676 | | | $ | 328,434 | | | $ | 510,804 | | | $ | 598,747 | | | $ | 337,771 | | | $ | 92,147 | | | $ | 4,090 | | | $ | 3,426 | | | $ | 4,836 | | | $ | 3,435 | | | $ | 2,368 | | | $ | — | 10 |
| | | | | | | | | | | | | | | | | | | | | | | | | | | | | | | | | | | | | | | | | | | | | | | | |
Portfolio turnover | | | 23 | % | | | 22 | % | | | 38 | % | | | 31 | % | | | 41 | % | | | 12 | % | | | 23 | % | | | 22 | % | | | 38 | % | | | 31 | % | | | 41 | % | | | 12 | % |
| | | | | | | | | | | | | | | | | | | | | | | | | | | | | | | | | | | | | | | | | | | | | | | | |
| 1 | Commencement of operations. |
| 2 | Based on average shares outstanding. |
| 3 | Less than $0.01 per share. |
| 4 | Where applicable, total investment returns exclude the effects of any sales charges and include the reinvestment of dividends and distributions. |
| 5 | Redemption fee of 2.00% is reflected in total return calculations. There was no impact to the return. |
| 6 | Aggregate total investment return. |
| 7 | Redemption fee of 2.00% is reflected in total return calculations. The impact to the return from redemption fees received during the period was an increase of 0.08%. |
| 8 | Redemption fee of 2.00% is reflected in total return calculations. The impact to the return from redemption fees received during the period was an increase of 0.07%. |
| 10 | Net assets end of period are less than $500. |
See Notes to Financial Statements.
| | | | | | |
| | | BLACKROCK FUNDS | | MARCH 31, 2010 | | 29 |
| | |
| Financial Highlights (continued) | | BlackRock All-Cap Energy & Resources Portfolio |
| | |
| | | | | | | | | | | | | | | | | | | | | | | | | | | | | | | | | | | | | | | | | | | | | | | | |
| | | Investor A | | | Investor B | |
| | | Six Months
Ended
March 31,
2010 | | | Year Ended September 30, | | | Period
February 16,
20051 to
September 30, | | | Six Months
Ended
March 31,
2010 | | | Year Ended September 30, | | | Period
February 16,
20051 to
September 30, | |
| | | (Unaudited) | | | 2009 | | | 2008 | | | 2007 | | | 2006 | | | 2005 | | | (Unaudited) | | | 2009 | | | 2008 | | | 2007 | | | 2006 | | | 2005 | |
Per Share Operating Performance | | | | | |
Net asset value, beginning of period | | $ | 12.24 | | | $ | 16.01 | | | $ | 19.18 | | | $ | 13.75 | | | $ | 13.50 | | | $ | 10.00 | | | $ | 11.84 | | | $ | 15.68 | | | $ | 18.82 | | | $ | 13.59 | | | $ | 13.44 | | | $ | 10.00 | |
| | | | | | | | | | | | | | | | | | | | | | | | | | | | | | | | | | | | | | | | | | | | | | | | |
Net investment income (loss)2 | | | (0.03 | ) | | | (0.02 | ) | | | 0.17 | | | | (0.02 | ) | | | (0.02 | ) | | | 0.00 | 3 | | | (0.08 | ) | | | (0.09 | ) | | | 0.01 | | | | (0.13 | ) | | | (0.12 | ) | | | (0.05 | ) |
Net realized and unrealized gain (loss) | | | 1.28 | | | | (2.13 | ) | | | (2.87 | ) | | | 5.85 | | | | 0.26 | | | | 3.50 | | | | 1.25 | | | | (2.13 | ) | | | (2.81 | ) | | | 5.76 | | | | 0.26 | | | | 3.49 | |
| | | | | | | | | | | | | | | | | | | | | | | | | | | | | | | | | | | | | | | | | | | | | | | | |
Net increase (decrease) from investment operations | | | 1.25 | | | | (2.15 | ) | | | (2.70 | ) | | | 5.83 | | | | 0.24 | | | | 3.50 | | | | 1.17 | | | | (2.22 | ) | | | (2.80 | ) | | | 5.63 | | | | 0.14 | | | | 3.44 | |
| | | | | | | | | | | | | | | | | | | | | | | | | | | | | | | | | | | | | | | | | | | | | | | | |
Dividends and distributions from: | | | | | | | | | | | | | | | | | | | | | | | | | | | | | | | | | | | | | | | | | | | | | | | | |
Net investment income | | | (0.06 | ) | | | — | | | | (0.16 | ) | | | — | | | | — | | | | — | | | | — | | | | — | | | | (0.03 | ) | | | — | | | | — | | | | — | |
Net realized gain | | | — | | | | (1.62 | ) | | | (0.31 | ) | | | (0.40 | ) | | | — | | | | — | | | | — | | | | (1.62 | ) | | | (0.31 | ) | | | (0.40 | ) | | | — | | | | — | |
| | | | | | | | | | | | | | | | | | | | | | | | | | | | | | | | | | | | | | | | | | | | | | | | |
Total dividends and distributions | | | (0.06 | ) | | | (1.62 | ) | | | (0.47 | ) | | | (0.40 | ) | | | — | | | | — | | | | — | | | | (1.62 | ) | | | (0.34 | ) | | | (0.40 | ) | | | — | | | | — | |
| | | | | | | | | | | | | | | | | | | | | | | | | | | | | | | | | | | | | | | | | | | | | | | | |
Redemption fees added to paid-in capital | | | 0.00 | 3 | | | 0.00 | 3 | | | 0.00 | 3 | | | 0.00 | 3 | | | 0.01 | | | | 0.00 | 3 | | | 0.00 | 3 | | | 0.00 | 3 | | | 0.00 | 3 | | | 0.00 | 3 | | | 0.01 | | | | 0.00 | 3 |
| | | | | | | | | | | | | | | | | | | | | | | | | | | | | | | | | | | | | | | | | | | | | | | | |
Net asset value, end of period | | $ | 13.43 | | | $ | 12.24 | | | $ | 16.01 | | | $ | 19.18 | | | $ | 13.75 | | | $ | 13.50 | | | $ | 13.01 | | | $ | 11.84 | | | $ | 15.68 | | | $ | 18.82 | | | $ | 13.59 | | | $ | 13.44 | |
| | | | | | | | | | | | | | | | | | | | | | | | | | | | | | | | | | | | | | | | | | | | | | | | |
Total Investment Return4 | | | | | |
Based on net asset value | | | 10.26 | %5,6 | | | (7.85 | )%5 | | | (14.55 | )%5 | | | 43.09 | %5 | | | 1.85 | %7 | | | 35.00 | %5,6 | | | 9.88 | %5,6 | | | (8.56 | )%5 | | | (15.23 | )%5 | | | 42.11 | %5 | | | 1.12 | %8 | | | 34.40 | %5,6 |
| | | | | | | | | | | | | | | | | | | | | | | | | | | | | | | | | | | | | | | | | | | | | | | | |
Ratios to Average Net Assets | | | | | |
Total expenses | | | 1.34 | %9 | | | 1.48 | % | | | 1.27 | % | | | 1.34 | % | | | 1.46 | % | | | 1.87 | %9 | | | 2.18 | %9 | | | 2.35 | % | | | 2.09 | % | | | 2.23 | % | | | 2.13 | % | | | 2.49 | %9 |
| | | | | | | | | | | | | | | | | | | | | | | | | | | | | | | | | | | | | | | | | | | | | | | | |
Total expenses excluding recoupment of past waived fees | | | 1.33 | %9 | | | 1.45 | % | | | 1.27 | % | | | 1.34 | % | | | 1.46 | % | | | 1.87 | %9 | | | 2.18 | %9 | | | 2.33 | % | | | 2.09 | % | | | 2.23 | % | | | 2.13 | % | | | 2.49 | %9 |
| | | | | | | | | | | | | | | | | | | | | | | | | | | | | | | | | | | | | | | | | | | | | | | | |
Total expenses after fees waived, reimbursed and paid indirectly | | | 1.34 | %9 | | | 1.34 | % | | | 1.26 | % | | | 1.31 | % | | | 1.34 | % | | | 1.34 | %9 | | | 2.10 | %9 | | | 2.06 | % | | | 2.04 | % | | | 2.04 | % | | | 2.04 | % | | | 2.04 | %9 |
| | | | | | | | | | | | | | | | | | | | | | | | | | | | | | | | | | | | | | | | | | | | | | | | |
Net investment income (loss) | | | (0.46 | )%9 | | | (0.25 | )% | | | 0.81 | % | | | (0.10 | )% | | | (0.16 | )% | | | 0.01 | %9 | | | (1.22 | )%9 | | | (0.95 | )% | | | 0.06 | % | | | (0.82 | )% | | | (0.86 | )% | | | (0.64 | )%9 |
| | | | | | | | | | | | | | | | | | | | | | | | | | | | | | | | | | | | | | | | | | | | | | | | |
Supplemental Data | | | | | |
Net assets, end of period (000) | | $ | 203,733 | | | $ | 178,364 | | | $ | 267,422 | | | $ | 347,598 | | | $ | 248,557 | | | $ | 87,949 | | | $ | 30,154 | | | $ | 30,873 | | | $ | 42,399 | | | $ | 55,538 | | | $ | 43,477 | | | $ | 16,019 | |
| | | | | | | | | | | | | | | | | | | | | | | | | | | | | | | | | | | | | | | | | | | | | | | | |
Portfolio turnover | | | 23 | % | | | 22 | % | | | 38 | % | | | 31 | % | | | 41 | % | | | 12 | % | | | 23 | % | | | 22 | % | | | 38 | % | | | 31 | % | | | 41 | % | | | 12 | % |
| | | | | | | | | | | | | | | | | | | | | | | | | | | | | | | | | | | | | | | | | | | | | | | | |
See Notes to Financial Statements.
| | | | | | |
| 30 | | BLACKROCK FUNDS | | MARCH 31, 2010 | | |
| | |
| Financial Highlights (continued) | | BlackRock All-Cap Energy & Resources Portfolio |
| | |
| | | | | | | | | | | | | | | | | | | | | | | | |
| | | Investor C | |
| | | Six Months
Ended
March 31, 2010 | | | Year Ended September 30, | | | Period
February 16,
20051 to
September 30, | |
| | | (Unaudited) | | | 2009 | | | 2008 | | | 2007 | | | 2006 | | | 2005 | |
Per Share Operating Performance | | | | | | | | | | | | | | | | | | | | | | | | |
Net asset value, beginning of period | | $ | 11.85 | | | $ | 15.69 | | | $ | 18.84 | | | $ | 13.60 | | | $ | 13.46 | | | $ | 10.00 | |
| | | | | | | | | | | | | | | | | | | | | | | | |
Net investment income (loss)2 | | | (0.08 | ) | | | (0.09 | ) | | | 0.02 | | | | (0.13 | ) | | | (0.12 | ) | | | (0.05 | ) |
Net realized and unrealized gain (loss) | | | 1.25 | | | | (2.13 | ) | | | (2.82 | ) | | | 5.77 | | | | 0.25 | | | | 3.51 | |
| | | | | | | | | | | | | | | | | | | | | | | | |
Net increase (decrease) from investment operations | | | 1.17 | | | | (2.22 | ) | | | (2.80 | ) | | | 5.64 | | | | 0.13 | | | | 3.46 | |
| | | | | | | | | | | | | | | | | | | | | | | | |
Dividends and distributions from: | | | | | | | | | | | | | | | | | | | | | | | | |
Net investment income | | | — | | | | — | | | | (0.04 | ) | | | — | | | | — | | | | — | |
Net realized gain | | | — | | | | (1.62 | ) | | | (0.31 | ) | | | (0.40 | ) | | | — | | | | — | |
| | | | | | | | | | | | | | | | | | | | | | | | |
Total dividends and distributions | | | — | | | | (1.62 | ) | | | (0.35 | ) | | | (0.40 | ) | | | — | | | | — | |
| | | | | | | | | | | | | | | | | | | | | | | | |
Redemption fees added to paid-in capital | | | 0.00 | 3 | | | 0.00 | 3 | | | 0.00 | 3 | | | 0.00 | 3 | | | 0.01 | | | | 0.00 | 3 |
| | | | | | | | | | | | | | | | | | | | | | | | |
Net asset value, end of period | | $ | 13.02 | | | $ | 11.85 | | | $ | 15.69 | | | $ | 18.84 | | | $ | 13.60 | | | $ | 13.46 | |
| | | | | | | | | | | | | | | | | | | | | | | | |
Total Investment Return4 | | | | | | | | | | | | | | | | | | | | | | | | |
Based on net asset value | | | 9.87 | %5,6 | | | (8.54 | )%5 | | | (15.21 | )%5 | | | 42.15 | %5 | | | 1.04 | %7 | | | 34.60 | %5,6 |
| | | | | | | | | | | | | | | | | | | | | | | | |
Ratios to Average Net Assets | | | | | | | | | | | | | | | | | | | | | | | | |
Total expenses | | | 2.08 | %9 | | | 2.23 | % | | | 2.02 | % | | | 2.12 | % | | | 2.09 | % | | | 2.48 | %9 |
| | | | | | | | | | | | | | | | | | | | | | | | |
Total expenses excluding recoupment of past waived fees | | | 2.08 | %9 | | | 2.21 | % | | | 2.02 | % | | | 2.12 | % | | | 2.09 | % | | | 2.48 | %9 |
| | | | | | | | | | | | | | | | | | | | | | | | |
Total expenses after fees waived, reimbursed and paid indirectly | | | 2.08 | %9 | | | 2.05 | % | | | 2.01 | % | | | 2.04 | % | | | 2.04 | % | | | 2.04 | %9 |
| | | | | | | | | | | | | | | | | | | | | | | | |
Net investment income (loss) | | | (1.19 | )%9 | | | (0.95 | )% | | | 0.08 | % | | | (0.83 | )% | | | (0.86 | )% | | | (0.70 | )%9 |
| | | | | | | | | | | | | | | | | | | | | | | | |
Supplemental Data | | | | | | | | | | | | | | | | | | | | | | | | |
Net assets, end of period (000) | | $ | 123,837 | | | $ | 113,347 | | | $ | 153,512 | | | $ | 207,194 | | | $ | 136,120 | | | $ | 48,288 | |
| | | | | | | | | | | | | | | | | | | | | | | | |
Portfolio turnover | | | 23 | % | | | 22 | % | | | 38 | % | | | 31 | % | | | 41 | % | | | 12 | % |
| | | | | | | | | | | | | | | | | | | | | | | | |
| 1 | Commencement of operations. |
| 2 | Based on average shares outstanding. |
| 3 | Less than $0.01 per share. |
| 4 | Where applicable, total investment returns exclude the effects of any sales charges and include the reinvestment of dividends and distributions. |
| 5 | Redemption fee of 2.00% is reflected in total return calculations. There was no impact to the return. |
| 6 | Aggregate total investment return. |
| 7 | Redemption fee of 2.00% is reflected in total return calculations. The impact to the return from redemption fees received during the period was an increase of 0.07%. |
| 8 | Redemption fee of 2.00% is reflected in total return calculations. The impact to the return from redemption fees received during the period was an increase of 0.08%. |
See Notes to Financial Statements.
| | | | | | |
| | | BLACKROCK FUNDS | | MARCH 31, 2010 | | 31 |
| | |
| Financial Highlights (continued) | | BlackRock Aurora Portfolio |
| | |
| | | | | | | | | | | | | | | | | | | | | | | | |
| | | Institutional | |
| | | Six Months
Ended
March 31, 2010 | | | Year Ended September 30, | |
| | | (Unaudited) | | | 2009 | | | 2008 | | | 2007 | | | 2006 | | | 2005 | |
Per Share Operating Performance | | | | | | | | | | | | | | | | | | | | | | | | |
Net asset value, beginning of period | | $ | 16.04 | | | $ | 19.49 | | | $ | 30.87 | | | $ | 37.15 | | | $ | 43.43 | | | $ | 40.71 | |
| | | | | | | | | | | | | | | | | | | | | | | | |
Net investment income (loss)1 | | | 0.02 | | | | 0.06 | | | | (0.02 | ) | | | 0.10 | | | | 0.08 | | | | (0.04 | ) |
Net realized and unrealized gain (loss)2 | | | 2.14 | | | | (3.51 | ) | | | (5.34 | ) | | | 4.82 | | | | 1.13 | | | | 6.60 | |
| | | | | | | | | | | | | | | | | | | | | | | | |
Net increase (decrease) from investment operations | | | 2.16 | | | | (3.45 | ) | | | (5.36 | ) | | | 4.92 | | | | 1.21 | | | | 6.56 | |
| | | | | | | | | | | | | | | | | | | | | | | | |
Dividends and distributions from: | | | | | | | | | | | | | | | | | | | | | | | | |
Net investment income | | | (0.23 | ) | | | — | | | | — | | | | — | | | | — | | | | — | |
Tax return of capital | | | — | | | | — | | | | (0.21 | ) | | | — | | | | — | | | | — | |
Net realized gain | | | — | | | | — | | | | (5.81 | ) | | | (11.20 | ) | | | (7.49 | ) | | | (3.84 | ) |
| | | | | | | | | | | | | | | | | | | | | | | | |
Total dividends and distributions | | | (0.23 | ) | | | — | | | | (6.02 | ) | | | (11.20 | ) | | | (7.49 | ) | | | (3.84 | ) |
| | | | | | | | | | | | | | | | | | | | | | | | |
Net asset value, end of period | | $ | 17.97 | | | $ | 16.04 | | | $ | 19.49 | | | $ | 30.87 | | | $ | 37.15 | | | $ | 43.43 | |
| | | | | | | | | | | | | | | | | | | | | | | | |
Total Investment Return3,4 | | | | | | | | | | | | | | | | | | | | | | | | |
Based on net asset value | | | 13.68 | %5 | | | (17.70 | )%6 | | | (21.60 | )%7 | | | 14.86 | % | | | 3.40 | % | | | 16.62 | % |
| | | | | | | | | | | | | | | | | | | | | | | | |
Ratios to Average Net Assets | | | | | | | | | | | | | | | | | | | | | | | | |
Total expenses | | | 1.26 | %8 | | | 1.28 | % | | | 1.28 | % | | | 1.11 | % | | | 1.07 | % | | | 1.14 | % |
| | | | | | | | | | | | | | | | | | | | | | | | |
Total expenses excluding recoupment of past waived fees | | | 1.26 | %8 | | | 1.25 | % | | | 1.28 | % | | | 1.11 | % | | | 1.07 | % | | | 1.14 | % |
| | | | | | | | | | | | | | | | | | | | | | | | |
Total expenses after fees waived, reimbursed and paid indirectly | | | 1.08 | %8 | | | 1.05 | % | | | 1.05 | % | | | 1.01 | % | | | 1.06 | % | | | 1.14 | % |
| | | | | | | | | | | | | | | | | | | | | | | | |
Net investment income (loss) | | | 0.31 | %8 | | | 0.46 | % | | | (0.08 | )% | | | 0.32 | % | | | 0.22 | % | | | (0.09 | )% |
| | | | | | | | | | | | | | | | | | | | | | | | |
Supplemental Data | | | | | | | | | | | | | | | | | | | | | | | | |
Net assets, end of period (000) | | $ | 30,425 | | | $ | 47,964 | | | $ | 81,400 | | | $ | 169,479 | | | $ | 153,103 | | | $ | 165,837 | |
| | | | | | | | | | | | | | | | | | | | | | | | |
Portfolio turnover | | | 76 | % | | | 289 | % | | | 147 | % | | | 134 | % | | | 142 | % | | | 73 | % |
| | | | | | | | | | | | | | | | | | | | | | | | |
See Notes to Financial Statements.
| | | | | | |
| 32 | | BLACKROCK FUNDS | | MARCH 31, 2010 | | |
| | |
| Financial Highlights (continued) | | BlackRock Aurora Portfolio |
| | | | | | | | | | | | | | | | | | | | | | | | | | | | | | | | | | | | | | | | | | | | | | | | |
| | | Investor A | | | Investor B | |
| | | Six Months
Ended
March 31, 2010
(Unaudited) | | | | | | | | | | | | | | | | | | Six Months
Ended
March 31, 2010
(Unaudited) | | | | | | | | | | | | | | | | |
| | | | Year Ended September 30, | | | | Year Ended September 30, | |
| | | | 2009 | | | 2008 | | | 2007 | | | 2006 | | | 2005 | | | | 2009 | | | 2008 | | | 2007 | | | 2006 | | | 2005 | |
Per Share Operating Performance | |
Net asset value, beginning of period | | $ | 14.65 | | | $ | 17.86 | | | $ | 28.75 | | | $ | 35.39 | | | $ | 41.88 | | | $ | 39.49 | | | $ | 11.60 | | | $ | 14.26 | | | $ | 24.06 | | | $ | 31.48 | | | $ | 38.32 | | | $ | 36.67 | |
| | | | | | | | | | | | | | | | | | | | | | | | | | | | | | | | | | | | | | | | | | | | | | | | |
Net investment income (loss)1 | | | (0.01 | ) | | | 0.01 | | | | (0.10 | ) | | | 0.01 | | | | (0.05 | ) | | | (0.16 | ) | | | (0.05 | ) | | | (0.07 | ) | | | (0.21 | ) | | | (0.19 | ) | | | (0.29 | ) | | | (0.40 | ) |
Net realized and unrealized gain (loss)2 | | | 1.96 | | | | (3.22 | ) | | | (4.91 | ) | | | 4.55 | | | | 1.05 | | | | 6.39 | | | | 1.55 | | | | (2.59 | ) | | | (3.92 | ) | | | 3.97 | | | | 0.94 | | | | 5.89 | |
| | | | | | | | | | | | | | | | | | | | | | | | | | | | | | | | | | | | | | | | | | | | | | | | |
Net increase (decrease) from investment operations | | | 1.95 | | | | (3.21 | ) | | | (5.01 | ) | | | 4.56 | | | | 1.00 | | | | 6.23 | | | | 1.50 | | | | (2.66 | ) | | | (4.13 | ) | | | 3.78 | | | | 0.65 | | | | 5.49 | |
| | | | | | | | | | | | | | | | | | | | | | | | | | | | | | | | | | | | | | | | | | | | | | | | |
Dividends and distributions from: | | | | | | | | | | | | | | | | | | | | | | | | | | | | | | | | | | | | | | | | | | | | | | | | |
Net investment income | | | (0.18 | ) | | | — | | | | — | | | | — | | | | — | | | | — | | | | (0.03 | ) | | | — | | | | — | | | | — | | | | — | | | | — | |
Tax return of capital | | | — | | | | — | | | | (0.21 | ) | | | — | | | | — | | | | — | | | | — | | | | — | | | | (0.21 | ) | | | — | | | | — | | | | — | |
Net realized gain | | | — | | | | — | | | | (5.67 | ) | | | (11.20 | ) | | | (7.49 | ) | | | (3.84 | ) | | | — | | | | — | | | | (5.46 | ) | | | (11.20 | ) | | | (7.49 | ) | | | (3.84 | ) |
| | | | | | | | | | | | | | | | | | | | | | | | | | | | | | | | | | | | | | | | | | | | | | | | |
Total dividends and distributions | | | (0.18 | ) | | | — | | | | (5.88 | ) | | | (11.20 | ) | | | (7.49 | ) | | | (3.84 | ) | | | (0.03 | ) | | | — | | | | (5.67 | ) | | | (11.20 | ) | | | (7.49 | ) | | | (3.84 | ) |
| | | | | | | | | | | | | | | | | | | | | | | | | | | | | | | | | | | | | | | | | | | | | | | | |
Net asset value, end of period | | $ | 16.42 | | | $ | 14.65 | | | $ | 17.86 | | | $ | 28.75 | | | $ | 35.39 | | | $ | 41.88 | | | $ | 13.07 | | | $ | 11.60 | | | $ | 14.26 | | | $ | 24.06 | | | $ | 31.48 | | | $ | 38.32 | |
| | | | | | | | | | | | | | | | | | | | | | | | | | | | | | | | | | | | | | | | | | | | | | | | |
Total Investment Return3,4 | |
Based on net asset value | | | 13.45 | %5 | | | (17.97 | )%9 | | | (21.92 | )%7 | | | 14.48 | % | | | 2.95 | % | | | 16.28 | % | | | 13.00 | %5 | | | (18.65 | )%10 | | | (22.47 | )%7 | | | 13.56 | % | | | 2.18 | % | | | 15.44 | % |
| | | | | | | | | | | | | | | | | | | | | | | | | | | | | | | | | | | | | | | | | | | | | | | | |
Ratios to Average Net Assets | |
Total expenses | | | 1.58 | %8 | | | 1.60 | % | | | 1.45 | % | | | 1.40 | % | | | 1.56 | % | | | 1.47 | % | | | 2.55 | %8 | | | 2.56 | % | | | 2.32 | % | | | 2.24 | % | | | 2.23 | % | | | 2.15 | % |
| | | | | | | | | | | | | | | | | | | | | | | | | | | | | | | | | | | | | | | | | | | | | | | | |
Total expenses excluding recoupment of past waived fees | | | 1.58 | %8 | | | 1.58 | % | | | 1.45 | % | | | 1.40 | % | | | 1.56 | % | | | 1.47 | % | | | 2.55 | %8 | | | 2.53 | % | | | 2.32 | % | | | 2.24 | % | | | 2.23 | % | | | 2.15 | % |
| | | | | | | | | | | | | | | | | | | | | | | | | | | | | | | | | | | | | | | | | | | | | | | | |
Total expenses after fees waived, reimbursed and paid indirectly | | | 1.48 | %8 | | | 1.45 | % | | | 1.42 | % | | | 1.39 | % | | | 1.44 | % | | | 1.40 | % | | | 2.26 | %8 | | | 2.20 | % | | | 2.18 | % | | | 2.16 | % | | | 2.19 | % | | | 2.14 | % |
| | | | | | | | | | | | | | | | | | | | | | | | | | | | | | | | | | | | | | | | | | | | | | | | |
Net investment income (loss) | | | (0.10 | )%8 | | | 0.06 | % | | | (0.44 | )% | | | 0.03 | % | | | (0.15 | )% | | | (0.36 | )% | | | (0.85 | )%8 | | | (0.66 | )% | | | (1.21 | )% | | | (0.75 | )% | | | (0.90 | )% | | | (1.10 | )% |
| | | | | | | | | | | | | | | | | | | | | | | | | | | | | | | | | | | | | | | | | | | | | | | | |
Supplemental Data | | | | | | | | | | | | | | | | | | | | | | | | | | | | | | | | | | | | | | | | | | | | | | | | |
Net assets, end of period (000) | | $ | 331,173 | | | $ | 319,656 | | | $ | 481,193 | | | $ | 871,699 | | | $ | 1,189,440 | | | $ | 1,690,497 | | | $ | 32,973 | | | $ | 44,974 | | | $ | 119,213 | | | $ | 250,672 | | | $ | 329,207 | | | $ | 436,642 | |
| | | | | | | | | | | | | | | | | | | | | | | | | | | | | | | | | | | | | | | | | | | | | | | | |
Portfolio turnover | | | 76 | % | | | 289 | % | | | 147 | % | | | 134 | % | | | 142 | % | | | 73 | % | | | 76 | % | | | 289 | % | | | 147 | % | | | 134 | % | | | 142 | % | | | 73 | % |
| | | | | | | | | | | | | | | | | | | | | | | | | | | | | | | | | | | | | | | | | | | | | | | | |
| 1 | Based on average shares outstanding. |
| 2 | Includes redemption fees, which are less than $0.01 per share. |
| 3 | Where applicable, total investment returns exclude the effects of any sales charges and include the reinvestment of dividends and distributions. |
| 4 | Redemption fee of 2.00% is reflected in total return calculations. There was no impact to the return. |
| 5 | Aggregate total investment return. |
| 6 | Includes proceeds received from a settlement of litigation, which impacted the Fund’s total return. Not including these proceeds, the Fund’s total return would have been (17.96)%. |
| 7 | Payment from affiliate of $139,965 received by the Fund is reflected in total return calculations. There was no impact to the return. |
| 9 | Includes proceeds received from a settlement of litigation, which impacted the Fund’s total return. Not including these proceeds, the Fund’s total return would have been (18.25)%. |
| 10 | Includes proceeds received from a settlement of litigation, which impacted the Fund’s total return. Not including these proceeds, the Fund’s total return would have been (19.00)%. |
See Notes to Financial Statements.
| | | | | | |
| | | BLACKROCK FUNDS | | MARCH 31, 2010 | | 33 |
| | |
| Financial Highlights (continued) | | BlackRock Aurora Portfolio |
| | | | | | | | | | | | | | | | | | | | | | | | | | | | | | | | | | | | | | | | |
| | | Investor C | | | Class R | |
| | | Six Months
Ended
March 31, 2010
(Unaudited) | | | Year Ended September 30, | | | Six Months
Ended
March 31, 2010
(Unaudited) | | | Year Ended
September 30, | | | Period
October 2, 20061 to
September 30, 2007 | |
| | | | 2009 | | | 2008 | | | 2007 | | | 2006 | | | 2005 | | | | 2009 | | | 2008 | | |
Per Share Operating Performance | |
Net asset value, beginning of period | | $ | 11.59 | | | $ | 14.25 | | | $ | 24.07 | | | $ | 31.47 | | | $ | 38.32 | | | $ | 36.67 | | | $ | 14.50 | | | $ | 17.72 | | | $ | 28.70 | | | $ | 35.21 | |
| | | | | | | | | | | | | | | | | | | | | | | | | | | | | | | | | | | | | | | | |
Net investment loss2 | | | (0.05 | ) | | | (0.07 | ) | | | (0.21 | ) | | | (0.18 | ) | | | (0.29 | ) | | | (0.42 | ) | | | (0.02 | ) | | | (0.01 | ) | | | (0.13 | ) | | | (0.16 | ) |
Net realized and unrealized gain (loss)3 | | | 1.55 | | | | (2.59 | ) | | | (3.93 | ) | | | 3.98 | | | | 0.93 | | | | 5.91 | | | | 1.93 | | | | (3.21 | ) | | | (4.83 | ) | | | 4.85 | |
| | | | | | | | | | | | | | | | | | | | | | | | | | | | | | | | | | | | | | | | |
Net increase (decrease) from investment operations | | | 1.50 | | | | (2.66 | ) | | | (4.14 | ) | | | 3.80 | | | | 0.64 | | | | 5.49 | | | | 1.91 | | | | (3.22 | ) | | | (4.96 | ) | | | 4.69 | |
| | | | | | | | | | | | | | | | | | | | | | | | | | | | | | | | | | | | | | | | |
Dividends and distributions from: | | | | | | | | | | | | | | | | | | | | | | | | | | | | | | | | | | | | | | | | |
Net investment income | | | (0.09 | ) | | | — | | | | — | | | | — | | | | — | | | | — | | | | (0.15 | ) | | | — | | | | — | | | | — | |
Tax return of capital | | | — | | | | — | | | | (0.21 | ) | | | — | | | | — | | | | — | | | | — | | | | — | | | | (0.21 | ) | | | — | |
Net realized gain | | | — | | | | — | | | �� | (5.47 | ) | | | (11.20 | ) | | | (7.49 | ) | | | (3.84 | ) | | | — | | | | — | | | | (5.81 | ) | | | (11.20 | ) |
| | | | | | | | | | | | | | | | | | | | | | | | | | | | | | | | | | | | | | | | |
Total dividends and distributions | | | (0.09 | ) | | | — | | | | (5.68 | ) | | | (11.20 | ) | | | (7.49 | ) | | | (3.84 | ) | | | (0.15 | ) | | | — | | | | (6.02 | ) | | | (11.20 | ) |
| | | | | | | | | | | | | | | | | | | | | | | | | | | | | | | | | | | | | | | | |
Net asset value, end of period | | $ | 13.00 | | | $ | 11.59 | | | $ | 14.25 | | | $ | 24.07 | | | $ | 31.47 | | | $ | 38.32 | | | $ | 16.26 | | | $ | 14.50 | | | $ | 17.72 | | | $ | 28.70 | |
| | | | | | | | | | | | | | | | | | | | | | | | | | | | | | | | | | | | | | | | |
Total Investment Return4,5 | |
Based on net asset value | | | 13.08 | %6 | | | (18.67 | )%7 | | | (22.50 | )%8 | | | 13.64 | % | | | 2.16 | % | | | 15.45 | % | | | 13.30 | %6 | | | (18.17 | )%9 | | | (21.90 | )%8 | | | 14.87 | %6 |
| | | | | | | | | | | | | | | | | | | | | | | | | | | | | | | | | | | | | | | | |
Ratios to Average Net Assets | |
Total expenses | | | 2.37 | %10 | | | 2.40 | % | | | 2.23 | % | | | 2.17 | % | | | 2.22 | % | | | 2.15 | % | | | 1.85 | %10 | | | 1.86 | % | | | 1.71 | % | | | 1.50 | %10 |
| | | | | | | | | | | | | | | | | | | | | | | | | | | | | | | | | | | | | | | | |
Total expenses excluding recoupment of past waived fees | | | 2.37 | %10 | | | 2.38 | % | | | 2.23 | % | | | 2.17 | % | | | 2.22 | % | | | 2.15 | % | | | 1.85 | %10 | | | 1.86 | % | | | 1.71 | % | | | 1.50 | %10 |
| | | | | | | | | | | | | | | | | | | | | | | | | | | | | | | | | | | | | | | | |
Total expenses after fees waived, reimbursed and paid indirectly | | | 2.26 | %10 | | | 2.20 | % | | | 2.17 | % | | | 2.13 | % | | | 2.19 | % | | | 2.14 | % | | | 1.65 | %10 | | | 1.62 | % | | | 1.58 | % | | | 1.50 | %10 |
| | | | | | | | | | | | | | | | | | | | | | | | | | | | | | | | | | | | | | | | |
Net investment loss | | | (0.88 | )%10 | | | (0.69 | )% | | | (1.20 | )% | | | (0.72 | )% | | | (0.90 | )% | | | (1.10 | )% | | | (0.25 | )%10 | | | (0.11 | )% | | | (0.60 | )% | | | (0.57 | )%10 |
| | | | | | | | | | | | | | | | | | | | | | | | | | | | | | | | | | | | | | | | |
Supplemental Data | |
Net assets, end of period (000) | | $ | 63,742 | | | $ | 64,812 | | | $ | 107,555 | | | $ | 209,820 | | | $ | 283,562 | | | $ | 405,952 | | | $ | 860 | | | $ | 1,038 | | | $ | 1,356 | | | $ | 1,141 | |
| | | | | | | | | | | | | | | | | | | | | | | | | | | | | | | | | | | | | | | | |
Portfolio turnover | | | 76 | % | | | 289 | % | | | 147 | % | | | 134 | % | | | 142 | % | | | 73 | % | | | 76 | % | | | 289 | % | | | 147 | % | | | 134 | % |
| | | | | | | | | | | | | | | | | | | | | | | | | | | | | | | | | | | | | | | | |
| 1 | Commencement of operations. |
| 2 | Based on average shares outstanding. |
| 3 | Includes redemption fees, which are less than $0.01 per share. |
| 4 | Where applicable, total investment returns exclude the effects of any sales charges and include the reinvestment of dividends and distributions. |
| 5 | Redemption fee of 2.00% is reflected in total return calculations. There was no impact to the return. |
| 6 | Aggregate total investment return. |
| 7 | Includes proceeds received from a settlement of litigation, which impacted the Fund’s total return. Not including these proceeds, the Fund’s total return would have been (19.02)%. |
| 8 | Payment from affiliate of $139,965 received by the Fund is reflected in total return calculations. There was no impact to the return. |
| 9 | Includes proceeds received from a settlement of litigation, which impacted the Fund’s total return. Not including these proceeds, the Fund’s total return would have been (18.45)%. |
See Notes to Financial Statements.
| | | | | | |
| 34 | | BLACKROCK FUNDS | | MARCH 31, 2010 | | |
| | |
| Financial Highlights (continued) | | BlackRock Capital Appreciation Portfolio |
| | | | | | | | | | | | | | | | | | | | | | | | | | | | |
| | | Institutional | |
| | | Six Months
Ended
March 31, 2010 | | | Year Ended September 30, | | | Period
November 1, 2004 to
September 30, 2005 | | | Year Ended
October 31, | |
| | | (Unaudited) | | | 2009 | | | 2008 | | | 2007 | | | 2006 | | | | 2004 | |
Per Share Operating Performance | | | | | | | | | | | | | | | | | | | | | | | | | | | | |
Net asset value, beginning of period | | $ | 15.07 | | | $ | 15.25 | | | $ | 18.21 | | | $ | 14.91 | | | $ | 14.19 | | | $ | 12.78 | | | $ | 12.17 | |
| | | | | | | | | | | | | | | | | | | | | | | | | | | | |
Net investment income (loss) | | | 0.03 | 1 | | | 0.07 | 1 | | | 0.07 | 1 | | | 0.06 | 1 | | | 0.00 | 1,2 | | | 0.05 | 1 | | | (0.04 | ) |
Net realized and unrealized gain (loss) | | | 1.60 | | | | (0.25 | )3 | | | (3.03 | )3 | | | 3.24 | | | | 0.72 | 3 | | | 1.36 | 3 | | | 0.65 | |
| | | | | | | | | | | | | | | | | | | | | | | | | | | | |
Net increase (decrease) from investment operations | | | 1.63 | | | | (0.18 | ) | | | (2.96 | ) | | | 3.30 | | | | 0.72 | | | | 1.41 | | | | 0.61 | |
| | | | | | | | | | | | | | | | | | | | | | | | | | | | |
Dividends from net investment income | | | (0.07 | ) | | | — | | | | — | | | | — | | | | — | | | | — | | | | — | |
| | | | | | | | | | | | | | | | | | | | | | | | | | | | |
Net asset value, end of period | | $ | 16.63 | | | $ | 15.07 | | | $ | 15.25 | | | $ | 18.21 | | | $ | 14.91 | | | $ | 14.19 | | | $ | 12.78 | |
| | | | | | | | | | | | | | | | | | | | | | | | | | | | |
Total Investment Return4 | | | | | | | | | | | | | | | | | | | | | | | | | | | | |
Based on net asset value | | | 10.85 | %5 | | | (1.18 | )%6,7 | | | (16.26 | )%7 | | | 22.13 | % | | | 5.07 | %7 | | | 11.03 | %5,7,8 | | | 5.01 | % |
| | | | | | | | | | | | | | | | | | | | | | | | | | | | |
Ratios to Average Net Assets | | | | | | | | | | | | | | | | | | | | | | | | | | | | |
Total expenses | | | 0.87 | %9 | | | 0.92 | % | | | 0.85 | % | | | 0.88 | % | | | 1.00 | % | | | 1.15 | %9 | | | 1.14 | % |
| | | | | | | | | | | | | | | | | | | | | | | | | | | | |
Total expenses after fees waived, reimbursed and paid indirectly | | | 0.72 | %9 | | | 0.71 | % | | | 0.70 | % | | | 0.75 | % | | | 0.95 | % | | | 1.05 | %9 | | | 1.14 | % |
| | | | | | | | | | | | | | | | | | | | | | | | | | | | |
Net investment income (loss) | | | 0.33 | %9 | | | 0.59 | % | | | 0.42 | % | | | 0.38 | % | | | 0.00 | %10 | | | 0.43 | %9 | | | (0.31 | )% |
| | | | | | | | | | | | | | | | | | | | | | | | | | | | |
Supplemental Data | | | | | | | | | | | | | | | | | | | | | | | | | | | | |
Net assets, end of period (000) | | $ | 279,331 | | | $ | 192,614 | | | $ | 77,323 | | | $ | 71,072 | | | $ | 48,146 | | | $ | 52,154 | | | $ | 52,399 | |
| | | | | | | | | | | | | | | | | | | | | | | | | | | | |
Portfolio turnover | | | 38 | % | | | 87 | % | | | 80 | % | | | 97 | % | | | 87 | % | | | 70 | % | | | 91 | % |
| | | | | | | | | | | | | | | | | | | | | | | | | | | | |
| 1 | Based on average shares outstanding. |
| 2 | Less than $0.01 per share. |
| 3 | Includes redemption fees, which are less than $0.01 per share. |
| 4 | Where applicable, total investment returns exclude the effects of any sales charges and include the reinvestment of dividends and distributions. |
| 5 | Aggregate total investment return. |
| 6 | Includes proceeds received from a settlement of litigation, which impacted the Fund’s total return. Not including these proceeds, the Fund’s total return would have been (1.31)%. |
| 7 | Redemption fee of 2.00% is reflected in total return calculations. There was no impact to the return. |
| 8 | The total return includes an increase of 0.08% related to payments made by the previous investment advisor prior to January 31, 2005. |
See Notes to Financial Statements.
| | | | | | |
| | | BLACKROCK FUNDS | | MARCH 31, 2010 | | 35 |
| | |
| Financial Highlights (continued) | | BlackRock Capital Appreciation Portfolio |
| | | | | | | | | | | | | | | | | | | | | | | | | | | | |
| | | Investor A | |
| | | Six Months
Ended
March 31, 2010
(Unaudited) | | | Year Ended September 30, | | | Period
November 1, 2004 to
September 30, 2005 | | | Year Ended
October 31,
2004 | |
| | | | 2009 | | | 2008 | | | 2007 | | | 2006 | | | |
Per Share Operating Performance | | | | | | | | | | | | | | | | | | | | | | | | | | | | |
Net asset value, beginning of period | | $ | 14.39 | | | $ | 14.59 | | | $ | 17.56 | | | $ | 14.46 | | | $ | 13.82 | | | $ | 12.47 | | | $ | 11.91 | |
| | | | | | | | | | | | | | | | | | | | | | | | | | | | |
Net investment income (loss) | | | (0.01 | )1 | | | 0.01 | 1 | | | (0.02 | )1 | | | (0.02 | )1 | | | (0.06 | )1 | | | 0.02 | 1 | | | (0.08 | ) |
Net realized and unrealized gain (loss) | | | 1.53 | | | | (0.21 | )2 | | | (2.95 | )2 | | | 3.12 | | | | 0.70 | 2 | | | 1.33 | 2 | | | 0.64 | |
| | | | | | | | | | | | | | | | | | | | | | | | | | | | |
Net increase (decrease) from investment operations | | | 1.52 | | | | (0.20 | ) | | | (2.97 | ) | | | 3.10 | | | | 0.64 | | | | 1.35 | | | | 0.56 | |
| | | | | | | | | | | | | | | | | | | | | | | | | | | | |
Dividends from net investment income | | | (0.00 | )3 | | | — | | | | — | | | | — | | | | — | | | | — | | | | — | |
| | | | | | | | | | | | | | | | | | | | | | | | | | | | |
Net asset value, end of period | | $ | 15.91 | | | $ | 14.39 | | | $ | 14.59 | | | $ | 17.56 | | | $ | 14.46 | | | $ | 13.82 | | | $ | 12.47 | |
| | | | | | | | | | | | | | | | | | | | | | | | | | | | |
Total Investment Return4 | | | | | | | | | | | | | | | | | | | | | | | | | | | | |
Based on net asset value | | | 10.59 | %5 | | | (1.37 | )%6,7 | | | (16.91 | )%7 | | | 21.44 | % | | | 4.63 | %7 | | | 10.83 | %5,7,8 | | | 4.70 | % |
| | | | | | | | | | | | | | | | | | | | | | | | | | | | |
Ratios to Average Net Assets | | | | | | | | | | | | | | | | | | | | | | | | | | | | |
Total expenses | | | 1.24 | %9 | | | 1.35 | % | | | 1.33 | % | | | 1.35 | % | | | 1.53 | % | | | 1.48 | %9 | | | 1.44 | % |
| | | | | | | | | | | | | | | | | | | | | | | | | | | | |
Total expenses excluding recoupment of past waived fees | | | 1.24 | %9 | | | 1.35 | % | | | 1.33 | % | | | 1.35 | % | | | 1.53 | % | | | 1.48 | %9 | | | 1.44 | % |
| | | | | | | | | | | | | | | | | | | | | | | | | | | | |
Total expenses after fees waived, reimbursed and paid indirectly | | | 1.16 | %9 | | | 1.23 | % | | | 1.23 | % | | | 1.28 | % | | | 1.35 | % | | | 1.31 | %9 | | | 1.44 | % |
| | | | | | | | | | | | | | | | | | | | | | | | | | | | |
Net investment income (loss) | | | (0.11 | )%9 | | | 0.07 | % | | | (0.10 | )% | | | (0.16 | )% | | | (0.40 | )% | | | 0.21 | %9 | | | (0.62 | )% |
| | | | | | | | | | | | | | | | | | | | | | | | | | | | |
Supplemental Data | | | | | | | | | | | | | | | | | | | | | | | | | | | | |
Net assets, end of period (000) | | $ | 191,367 | | | $ | 169,865 | | | $ | 125,521 | | | $ | 131,712 | | | $ | 112,737 | | | $ | 120,371 | | | $ | 99,435 | |
| | | | | | | | | | | | | | | | | | | | | | | | | | | | |
Portfolio turnover | | | 38 | % | | | 87 | % | | | 80 | % | | | 97 | % | | | 87 | % | | | 70 | % | | | 91 | % |
| | | | | | | | | | | | | | | | | | | | | | | | | | | | |
| |
| | | Investor B | |
| | | Six Months
Ended
March 31, 2010
(Unaudited) | | | Year Ended September 30, | | | Period
November 1, 2004 to
September 30, 2005 | | | Year Ended
October 31,
2004 | |
| | | | 2009 | | | 2008 | | | 2007 | | | 2006 | | | |
Per Share Operating Performance | | | | | | | | | | | | | | | | | | | | | | | | | | | | |
Net asset value, beginning of period | | $ | 13.17 | | | $ | 13.51 | | | $ | 16.34 | | | $ | 13.56 | | | $ | 13.06 | | | $ | 11.86 | | | $ | 11.41 | |
| | | | | | | | | | | | | | | | | | | | | | | | | | | | |
Net investment loss | | | (0.07 | )1 | | | (0.08 | )1 | | | (0.14 | )1 | | | (0.14 | )1 | | | (0.16 | )1 | | | (0.06 | )1 | | | (0.15 | ) |
Net realized and unrealized gain (loss) | | | 1.40 | | | | (0.26 | )2 | | | (2.69 | )2 | | | 2.92 | | | | 0.66 | 2 | | | 1.26 | 2 | | | 0.60 | |
| | | | | | | | | | | | | | | | | | | | | | | | | | | | |
Net increase (decrease) from investment operations | | | 1.33 | | | | (0.34 | ) | | | (2.83 | ) | | | 2.78 | | | | 0.50 | | | | 1.20 | | | | 0.45 | |
| | | | | | | | | | | | | | | | | | | | | | | | | | | | |
Net asset value, end of period | | $ | 14.50 | | | $ | 13.17 | | | $ | 13.51 | | | $ | 16.34 | | | $ | 13.56 | | | $ | 13.06 | | | $ | 11.86 | |
| | | | | | | | | | | | | | | | | | | | | | | | | | | | |
Total Investment Return4 | | | | | | | | | | | | | | | | | | | | | | | | | | | | |
Based on net asset value | | | 10.10 | %5 | | | (2.52 | )%7,10 | | | (17.32 | )%7 | | | 20.50 | % | | | 3.83 | %7 | | | 10.12 | %5,7,11 | | | 3.94 | % |
| | | | | | | | | | | | | | | | | | | | | | | | | | | | |
Ratios to Average Net Assets | | | | | | | | | | | | | | | | | | | | | | | | | | | | |
Total expenses | | | 2.22 | %9 | | | 2.36 | % | | | 2.11 | % | | | 2.20 | % | | | 2.20 | % | | | 2.15 | %9 | | | 2.14 | % |
| | | | | | | | | | | | | | | | | | | | | | | | | | | | |
Total expenses excluding recoupment of past waived fees | | | 2.22 | %9 | | | 2.27 | % | | | 2.11 | % | | | 2.20 | % | | | 2.20 | % | | | 2.15 | %9 | | | 2.14 | % |
| | | | | | | | | | | | | | | | | | | | | | | | | | | | |
Total expenses after fees waived, reimbursed and paid indirectly | | | 2.13 | %9 | | | 2.11 | % | | | 2.00 | % | | | 2.07 | % | | | 2.10 | % | | | 2.05 | %9 | | | 2.14 | % |
| | | | | | | | | | | | | | | | | | | | | | | | | | | | |
Net investment loss | | | (1.08 | )%9 | | | (0.77 | )% | | | (0.87 | )% | | | (0.95 | )% | | | (1.16 | )% | | | (0.53 | )%9 | | | (1.31 | )% |
| | | | | | | | | | | | | | | | | | | | | | | | | | | | |
Supplemental Data | | | | | | | | | | | | | | | | | | | | | | | | | | | | |
Net assets, end of period (000) | | $ | 8,804 | | | $ | 10,279 | | | $ | 19,663 | | | $ | 48,260 | | | $ | 71,078 | | | $ | 85,465 | | | $ | 97,938 | |
| | | | | | | | | | | | | | | | | | | | | | | | | | | | |
Portfolio turnover | | | 38 | % | | | 87 | % | | | 80 | % | | | 97 | % | | | 87 | % | | | 70 | % | | | 91 | % |
| | | | | | | | | | | | | | | | | | | | | | | | | | | | |
See Notes to Financial Statements.
| | | | | | |
| 36 | | BLACKROCK FUNDS | | MARCH 31, 2010 | | |
| | |
| Financial Highlights (continued) | | BlackRock Capital Appreciation Portfolio |
| | | | | | | | | | | | | | | | | | | | | | | | | | | | |
| | | Investor C | |
| | | Six Months
Ended
March 31, 2010
(Unaudited) | | | Year Ended September 30, | | | Period
November 1, 2004 to
September 30, 2005 | | | Year Ended
October 31,
2004 | |
| | | | 2009 | | | 2008 | | | 2007 | | | 2006 | | | |
Per Share Operating Performance | | | | | | | | | | | | | | | | | | | | | | | | | | | | |
Net asset value, beginning of period | | $ | 13.25 | | | $ | 13.56 | | | $ | 16.38 | | | $ | 13.57 | | | $ | 13.06 | | | $ | 11.86 | | | $ | 11.41 | |
| | | | | | | | | | | | | | | | | | | | | | | | | | | | |
Net investment loss | | | (0.06 | )1 | | | (0.07 | )1 | | | (0.11 | )1 | | | (0.12 | )1 | | | (0.15 | )1 | | | (0.06 | )1 | | | (0.15 | ) |
Net realized and unrealized gain (loss) | | | 1.41 | | | | (0.24 | )2 | | | (2.71 | )2 | | | 2.93 | | | | 0.66 | 2 | | | 1.26 | 2 | | | 0.60 | |
| | | | | | | | | | | | | | | | | | | | | | | | | | | | |
Net increase (decrease) from investment operations | | | 1.35 | | | | (0.31 | ) | | | (2.82 | ) | | | 2.81 | | | | 0.51 | | | | 1.20 | | | | 0.45 | |
| | | | | | | | | | | | | | | | | | | | | | | | | | | | |
Net asset value, end of period | | $ | 14.60 | | | $ | 13.25 | | | $ | 13.56 | | | $ | 16.38 | | | $ | 13.57 | | | $ | 13.06 | | | $ | 11.86 | |
| | | | | | | | | | | | | | | | | | | | | | | | | | | | |
Total Investment Return4 | | | | | | | | | | | | | | | | | | | | | | | | | | | | |
Based on net asset value | | | 10.19 | %5 | | | (2.29 | )%7,12 | | | (17.22 | )%7 | | | 20.71 | % | | | 3.91 | %7 | | | 10.12 | %5,7,11 | | | 3.94 | % |
| | | | | | | | | | | | | | | | | | | | | | | | | | | | |
Ratios to Average Net Assets | | | | | | | | | | | | | | | | | | | | | | | | | | | | |
Total expenses | | | 1.98 | %9 | | | 2.04 | % | | | 1.96 | % | | | 1.99 | % | | | 2.10 | % | | | 2.15 | %9 | | | 2.14 | % |
| | | | | | | | | | | | | | | | | | | | | | | | | | | | |
Total expenses after waivers, reimbursement and paid indirectly | | | 1.89 | %9 | | | 1.92 | % | | | 1.85 | % | | | 1.92 | % | | | 2.04 | % | | | 2.05 | %9 | | | 2.14 | % |
| | | | | | | | | | | | | | | | | | | | | | | | | | | | |
Net investment loss | | | (0.85 | )%9 | | | (0.61 | )% | | | (0.73 | )% | | | (0.80 | )% | | | (1.10 | )% | | | (0.51 | )%9 | | | (1.30 | )% |
| | | | | | | | | | | | | | | | | | | | | | | | | | | | |
Supplemental Data | | | | | | | | | | | | | | | | | | | | | | | | | | | | |
Net assets, end of period (000) | | $ | 29,522 | | | $ | 22,986 | | | $ | 12,361 | | | $ | 15,160 | | | $ | 17,079 | | | $ | 20,570 | | | $ | 23,854 | |
| | | | | | | | | | | | | | | | | | | | | | | | | | | | |
Portfolio turnover | | | 38 | % | | | 87 | % | | | 80 | % | | | 97 | % | | | 87 | % | | | 70 | % | | | 91 | % |
| | | | | | | | | | | | | | | | | | | | | | | | | | | | |
| 1 | Based on average shares outstanding. |
| 2 | Includes redemption fees, which are less than $0.01 per share. |
| 3 | Less than $0.01 per share. |
| 4 | Where applicable, total investment returns exclude the effects of any sales charges and include the reinvestment of dividends and distributions. |
| 5 | Aggregate total investment return. |
| 6 | Includes proceeds received from a settlement of litigation, which impacted the Fund’s total return. Not including these proceeds, the Fund’s total return would have been (1.51)%. |
| 7 | Redemption fee of 2.00% is reflected in total return calculations. There was no impact to the return. |
| 8 | The total return includes an increase of 0.08% related to payments made by the previous investment advisor prior to January 31, 2005. |
| 10 | Includes proceeds received from a settlement of litigation, which impacted the Fund’s total return. Not including these proceeds, the Fund’s total return would have been (2.67)%. |
| 11 | The total return includes an increase of 0.09% related to payments made by the previous investment advisor prior to January 31, 2005. |
| 12 | Includes proceeds received from a settlement of litigation, which impacted the Fund’s total return. Not including these proceeds, the Fund’s total return would have been (2.43)%. |
See Notes to Financial Statements.
| | | | | | |
| | | BLACKROCK FUNDS | | MARCH 31, 2010 | | 37 |
| | |
| Financial Highlights (continued) | | BlackRock Energy & Resources Portfolio |
| | | | | | | | | | | | | | | | | | | | | | | | | | | | |
| | | Institutional | |
| | | Six Months
Ended
March 31, 2010
(Unaudited) | | | Year Ended September 30, | | | Period
March 1, 2005 to
September 30, 2005 | | | Period
July 1, 2004 to
February 28, 2005 | |
| | | | 2009 | | | 2008 | | | 2007 | | | 2006 | | | |
Per Share Operating Performance | | | | | | | | | | | | | | | | | | | | | | | | | | | | |
Net asset value, beginning of period | | $ | 32.61 | | | $ | 51.31 | | | $ | 63.42 | | | $ | 68.57 | | | $ | 79.62 | | | $ | 58.80 | | | $ | 41.25 | |
| | | | | | | | | | | | | | | | | | | | | | | | | | | | |
Net investment income (loss) | | | (0.06 | )1 | | | (0.07 | )1 | | | (0.13 | )1 | | | (0.02 | )1 | | | 0.57 | 1 | | | 0.15 | 1 | | | (0.08 | ) |
Net realized and unrealized gain (loss) | | | 4.53 | | | | (9.60 | ) | | | (2.78 | ) | | | 14.26 | | | | (2.50 | ) | | | 20.67 | | | | 19.52 | |
| | | | | | | | | | | | | | | | | | | | | | | | | | | | |
Net increase (decrease) from investment operations | | | 4.47 | | | | (9.67 | ) | | | (2.91 | ) | | | 14.24 | | | | (1.93 | ) | | | 20.82 | | | | 19.44 | |
| | | | | | | | | | | | | | | | | | | | | | | | | | | | |
Dividends and distributions from: | | | | | | | | | | | | | | | | | | | | | | | | | | | | |
Net investment income | | | — | | | | — | | | | (2.01 | ) | | | (0.81 | ) | | | (0.53 | ) | | | — | | | | (0.34 | ) |
Net realized gain | | | — | | | | (9.04 | ) | | | (7.22 | ) | | | (18.58 | ) | | | (8.60 | ) | | | — | | | | (1.55 | ) |
| | | | | | | | | | | | | | | | | | | | | | | | | | | | |
Total dividends and distributions | | | — | | | | (9.04 | ) | | | (9.23 | ) | | | (19.39 | ) | | | (9.13 | ) | | | — | | | | (1.89 | ) |
| | | | | | | | | | | | | | | | | | | | | | | | | | | | |
Redemption fees added to paid-in capital | | | 0.00 | 2 | | | 0.01 | | | | 0.03 | | | | 0.00 | 2 | | | 0.01 | | | | 0.00 | 2 | | | — | |
| | | | | | | | | | | | | | | | | | | | | | | | | | | | |
Net asset value, end of period | | $ | 37.08 | | | $ | 32.61 | | | $ | 51.31 | | | $ | 63.42 | | | $ | 68.57 | | | $ | 79.62 | | | $ | 58.80 | |
| | | | | | | | | | | | | | | | | | | | | | | | | | | | |
Total Investment Return3 | | | | | | | | | | | | | | | | | | | | | | | | | | | | |
Based on net asset value | | | 13.71 | %4,5 | | | (7.64 | )%6,7 | | | (6.77 | )%8 | | | 23.55 | %4 | | | (2.89 | )%7 | | | 35.41 | %4,5 | | | 47.95 | %5 |
| | | | | | | | | | | | | | | | | | | | | | | | | | | | |
Ratios to Average Net Assets | | | | | | | | | | | | | | | | | | | | | | | | | | | | |
Total expenses | | | 0.94 | %9 | | | 1.00 | % | | | 0.92 | % | | | 1.07 | % | | | 1.02 | % | | | 1.18 | %9 | | | 1.02 | %9 |
| | | | | | | | | | | | | | | | | | | | | | | | | | | | |
Total expenses excluding recoupment of past waived fees | | | 0.93 | %9 | | | 0.98 | % | | | 0.92 | % | | | 1.07 | % | | | 1.02 | % | | | 1.18 | %9 | | | 1.02 | %9 |
| | | | | | | | | | | | | | | | | | | | | | | | | | | | |
Total expenses after fees waived, reimbursed and paid indirectly | | | 0.93 | %9 | | | 0.99 | % | | | 0.92 | % | | | 1.03 | % | | | 0.98 | % | | | 1.04 | %9 | | | 1.01 | %9 |
| | | | | | | | | | | | | | | | | | | | | | | | | | | | |
Net investment income (loss) | | | (0.35 | )%9 | | | (0.25 | )% | | | (0.18 | )% | | | (0.03 | )% | | | 0.76 | % | | | 0.42 | %9 | | | (0.16 | )%9 |
| | | | | | | | | | | | | | | | | | | | | | | | | | | | |
Supplemental Data | | | | | | | | | | | | | | | | | | | | | | | | | | | | |
Net assets, end of period (000) | | $ | 210,866 | | | $ | 134,187 | | | $ | 82,147 | | | $ | 37,498 | | | $ | 35,010 | | | $ | 40,906 | | | $ | 29,188 | |
| | | | | | | | | | | | | | | | | | | | | | | | | | | | |
Portfolio turnover | | | 11 | % | | | 25 | % | | | 32 | % | | | 15 | % | | | 27 | % | | | 9 | % | | | 22 | % |
| | | | | | | | | | | | | | | | | | | | | | | | | | | | |
See Notes to Financial Statements.
| | | | | | |
| 38 | | BLACKROCK FUNDS | | MARCH 31, 2010 | | |
| | |
| Financial Highlights (continued) | | BlackRock Energy & Resources Portfolio |
| | | | | | | | | | | | | | | | | | | | | | | | | | | | |
| | | Investor A | |
| | | Six Months
Ended
March 31, 2010
(Unaudited) | | | Year Ended September 30, | | | Period
March 1, 2005 to
September 30, 2005 | | | Period
July 1, 2004 to
February 28, 2005 | |
| | | | 2009 | | | 2008 | | | 2007 | | | 2006 | | | |
Per Share Operating Performance | | | | | | | | | | | | | | | | | | | | | | | | | | | | |
Net asset value, beginning of period | | $ | 28.67 | | | $ | 47.29 | | | $ | 59.02 | | | $ | 64.90 | | | $ | 76.01 | | | $ | 56.23 | | | $ | 39.58 | |
| | | | | | | | | | | | | | | | | | | | | | | | | | | | |
Net investment income (loss) | | | (0.12 | )1 | | | (0.13 | )1 | | | (0.32 | )1 | | | (0.16 | )1 | | | 0.32 | 1 | | | 0.03 | 1 | | | (0.15 | ) |
Net realized and unrealized gain (loss) | | | 3.99 | | | | (9.46 | ) | | | (2.29 | ) | | | 13.41 | | | | (2.36 | ) | | | 19.75 | | | | 18.69 | |
| | | | | | | | | | | | | | | | | | | | | | | | | | | | |
Net increase (decrease) from investment operations | | | 3.87 | | | | (9.59 | ) | | | (2.61 | ) | | | 13.25 | | | | (2.04 | ) | | | 19.78 | | | | 18.54 | |
| | | | | | | | | | | | | | | | | | | | | | | | | | | | |
Dividends and distributions from: | | | | | | | | | | | | | | | | | | | | | | | | | | | | |
Net investment income | | | — | | | | — | | | | (1.92 | ) | | | (0.55 | ) | | | (0.48 | ) | | | — | | | | (0.34 | ) |
Net realized gain | | | — | | | | (9.04 | ) | | | (7.22 | ) | | | (18.58 | ) | | | (8.60 | ) | | | — | | | | (1.55 | ) |
| | | | | | | | | | | | | | | | | | | | | | | | | | | | |
Total dividends and distributions | | | — | | | | (9.04 | ) | | | (9.14 | ) | | | (19.13 | ) | | | (9.08 | ) | | | — | | | | (1.89 | ) |
| | | | | | | | | | | | | | | | | | | | | | | | | | | | |
Redemption fees added to paid-in capital | | | 0.00 | 2 | | | 0.01 | | | | 0.02 | | | | 0.00 | 2 | | | 0.01 | | | | 0.00 | 2 | | | — | |
| | | | | | | | | | | | | | | | | | | | | | | | | | | | |
Net asset value, end of period | | $ | 32.54 | | | $ | 28.67 | | | $ | 47.29 | | | $ | 59.02 | | | $ | 64.90 | | | $ | 76.01 | | | $ | 56.23 | |
| | | | | | | | | | | | | | | | | | | | | | | | | | | | |
Total Investment Return3 | | | | | | | | | | | | | | | | | | | | | | | | | | | | |
Based on net asset value | | | 13.50 | %4,5 | | | (8.20 | )%8,10 | | | (6.78 | )%7 | | | 23.25 | %4 | | | (3.20 | )%7 | | | 35.18 | %4,5 | | | 47.69 | %5 |
| | | | | | | | | | | | | | | | | | | | | | | | | | | | |
Ratios to Average Net Assets | | | | | | | | | | | | | | | | | | | | | | | | | | | | |
Total expenses | | | 1.34 | %9 | | | 1.40 | % | | | 1.25 | % | | | 1.30 | % | | | 1.41 | % | | | 1.52 | %9 | | | 1.38 | %9 |
| | | | | | | | | | | | | | | | | | | | | | | | | | | | |
Total expenses excluding recoupment of past waived fees | | | 1.29 | %9 | | | 1.38 | % | | | 1.25 | % | | | 1.30 | % | | | 1.41 | % | | | 1.52 | %9 | | | 1.38 | %9 |
| | | | | | | | | | | | | | | | | | | | | | | | | | | | |
Total expenses after fees waived, reimbursed and paid indirectly | | | 1.34 | %9 | | | 1.31 | % | | | 1.25 | % | | | 1.29 | % | | | 1.30 | % | | | 1.34 | %9 | | | 1.36 | %9 |
| | | | | | | | | | | | | | | | | | | | | | | | | | | | |
Net investment income (loss) | | | (0.76 | )%9 | | | (0.55 | )% | | | (0.49 | )% | | | (0.28 | )% | | | 0.44 | % | | | 0.10 | %9 | | | (0.52 | )%9 |
| | | | | | | | | | | | | | | | | | | | | | | | | | | | |
Supplemental Data | | | | | | | | | | | | | | | | | | | | | | | | | | | | |
Net assets, end of period (000) | | $ | 743,755 | | | $ | 636,437 | | | $ | 689,646 | | | $ | 685,590 | | | $ | 683,417 | | | $ | 877,120 | | | $ | 676,234 | |
| | | | | | | | | | | | | | | | | | | | | | | | | | | | |
Portfolio turnover | | | 11 | % | | | 25 | % | | | 32 | % | | | 15 | % | | | 27 | % | | | 9 | % | | | 22 | % |
| | | | | | | | | | | | | | | | | | | | | | | | | | | | |
| 1 | Based on average shares outstanding. |
| 2 | Less than $0.01 per share. |
| 3 | Where applicable, total investment returns exclude the effects of any sales charges and include the reinvestment of dividends and distributions. |
| 4 | Redemption fee of 2.00% is reflected in total return calculations. There was no impact to the return. |
| 5 | Aggregate total investment return. |
| 6 | Includes proceeds received from a settlement of litigation, which impacted the Fund’s total return. Not including these proceeds, the Fund’s total return would have been (7.66)%. |
| 7 | Redemption fee of 2.00% is reflected in total return calculations. The impact to the return from redemption fees received during the period was an increase of 0.02%. |
| 8 | Redemption fee of 2.00% is reflected in total return calculations. The impact to the return from redemption fees received during the period was an increase of 0.03%. |
| 10 | Includes proceeds received from a settlement of litigation, which impacted the Fund’s total return. Not including these proceeds, the Fund’s total return would have been (8.23)%. |
See Notes to Financial Statements.
| | | | | | |
| | | BLACKROCK FUNDS | | MARCH 31, 2010 | | 39 |
| | |
| Financial Highlights (continued) | | BlackRock Energy & Resources Portfolio |
| | | | | | | | | | | | | | | | | | | | | | | | | | | | |
| | | Investor B | |
| | | Six Months
Ended
March 31, 2010
(Unaudited) | | | Year Ended September 30, | | | Period
March 1, 2005 to
September 30, 2005 | | | Period
July 1, 2004 to
February 28, 2005 | |
| | | | 2009 | | | 2008 | | | 2007 | | | 2006 | | | |
Per Share Operating Performance | | | | | | | | | | | | | | | | | | | | | | | | | | | | |
Net asset value, beginning of period | | $ | 21.56 | | | $ | 39.68 | | | $ | 50.87 | | | $ | 58.19 | | | $ | 69.43 | | | $ | 51.58 | | | $ | 36.52 | |
| | | | | | | | | | | | | | | | | | | | | | | | | | | | |
Net investment loss | | | (0.18 | )1 | | | (0.22 | )1 | | | (0.67 | )1 | | | (0.50 | )1 | | | (0.18 | )1 | | | (0.19 | )1 | | | (0.32 | ) |
Net realized and unrealized gain (loss) | | | 2.99 | | | | (8.87 | ) | | | (1.81 | ) | | | 11.82 | | | | (2.09 | ) | | | 18.04 | | | | 17.18 | |
| | | | | | | | | | | | | | | | | | | | | | | | | | | | |
Net increase (decrease) from investment operations | | | 2.81 | | | | (9.09 | ) | | | (2.48 | ) | | | 11.32 | | | | (2.27 | ) | | | 17.85 | | | | 16.86 | |
| | | | | | | | | | | | | | | | | | | | | | | | | | | | |
Dividends and distributions from: | | | | | | | | | | | | | | | | | | | | | | | | | | | | |
Net investment income | | | — | | | | — | | | | (1.51 | ) | | | (0.06 | ) | | | (0.38 | ) | | | — | | | | (0.25 | ) |
Net realized gain | | | — | | | | (9.04 | ) | | | (7.22 | ) | | | (18.58 | ) | | | (8.60 | ) | | | — | | | | (1.55 | ) |
Total dividends and distributions | | | — | | | | (9.04 | ) | | | (8.73 | ) | | | (18.64 | ) | | | (8.98 | ) | | | — | | | | (1.80 | ) |
| | | | | | | | | | | | | | | | | | | | | | | | | | | | |
Redemption fees added to paid-in capital | | | 0.00 | 2 | | | 0.01 | | | | 0.02 | | | | 0.00 | 2 | | | 0.01 | | | | 0.00 | 2 | | | — | |
| | | | | | | | | | | | | | | | | | | | | | | | | | | | |
Net asset value, end of period | | $ | 24.37 | | | $ | 21.56 | | | $ | 39.68 | | | $ | 50.87 | | | $ | 58.19 | | | $ | 69.43 | | | $ | 51.58 | |
| | | | | | | | | | | | | | | | | | | | | | | | | | | | |
Total Investment Return3 | | | | | | | | | | | | | | | | | | | | | | | | | | | | |
Based on net asset value | | | 13.03 | %4,5 | | | (8.74 | )%6,7 | | | (7.63 | )%8 | | | 22.35 | %4 | | | (3.91 | )%8 | | | 34.60 | %4,5 | | | 47.09 | %5 |
| | | | | | | | | | | | | | | | | | | | | | | | | | | | |
Ratios to Average Net Assets | | | | | | | | | | | | | | | | | | | | | | | | | | | | |
Total expenses | | | 2.11 | %9 | | | 2.25 | % | | | 2.01 | % | | | 2.08 | % | | | 2.09 | % | | | 2.18 | %9 | | | 2.02 | %9 |
| | | | | | | | | | | | | | | | | | | | | | | | | | | | |
Total expenses excluding recoupment of past waived fees | | | 2.11 | %9 | | | 2.23 | % | | | 2.01 | % | | | 2.08 | % | | | 2.09 | % | | | 2.18 | %9 | | | 2.02 | %9 |
| | | | | | | | | | | | | | | | | | | | | | | | | | | | |
Total expenses after fees waived, reimbursed and paid indirectly | | | 2.09 | %9 | | | 2.05 | % | | | 2.00 | % | | | 2.03 | % | | | 2.02 | % | | | 2.04 | %9 | | | 2.01 | %9 |
| | | | | | | | | | | | | | | | | | | | | | | | | | | | |
Net investment loss | | | (1.51 | )%9 | | | (1.28 | )% | | | (1.24 | )% | | | (1.01 | )% | | | (0.27 | )% | | | (0.60 | )%9 | | | (1.17 | )%9 |
| | | | | | | | | | | | | | | | | | | | | | | | | | | | |
Supplemental Data | | | | | | | | | | | | | | | | | | | | | | | | | | | | |
Net assets, end of period (000) | | $ | 32,914 | | | $ | 34,218 | | | $ | 57,174 | | | $ | 80,178 | | | $ | 87,636 | | | $ | 117,845 | | | $ | 94,506 | |
| | | | | | | | | | | | | | | | | | | | | | | | | | | | |
Portfolio turnover | | | 11 | % | | | 25 | % | | | 32 | % | | | 15 | % | | | 27 | % | | | 9 | % | | | 22 | % |
| | | | | | | | | | | | | | | | | | | | | | | | | | | | |
See Notes to Financial Statements.
| | | | | | |
| 40 | | BLACKROCK FUNDS | | MARCH 31, 2010 | | |
| | |
| Financial Highlights (concluded) | | BlackRock Energy & Resources Portfolio |
| | | | | | | | | | | | | | | | | | | | | | | | | | | | |
| | | Investor C | |
| | | Six Months
Ended
March 31, 2010
(Unaudited) | | | Year Ended September 30, | | | Period
March 1, 2005 to
September 30, 2005 | | | Period
July 1, 2004 to
February 28, 2005 | |
| | | | 2009 | | | 2008 | | | 2007 | | | 2006 | | | |
Per Share Operating Performance | | | | | | | | | | | | | | | | | | | | | | | | | | | | |
Net asset value, beginning of period | | $ | 21.51 | | | $ | 39.61 | | | $ | 50.84 | | | $ | 58.13 | | | $ | 69.37 | | | $ | 51.53 | | | $ | 36.48 | |
| | | | | | | | | | | | | | | | | | | | | | | | | | | | |
Net investment loss | | | (0.17 | )1 | | | (0.22 | )1 | | | (0.66 | )1 | | | (0.50 | )1 | | | (0.17 | )1 | | | (0.19 | )1 | | | (0.30 | ) |
Net realized and unrealized gain (loss) | | | 2.98 | | | | (8.85 | ) | | | (1.79 | ) | | | 11.83 | | | | (2.10 | ) | | | 18.03 | | | | 17.14 | |
| | | | | | | | | | | | | | | | | | | | | | | | | | | | |
Net increase (decrease) from investment operations | | | 2.81 | | | | (9.07 | ) | | | (2.45 | ) | | | 11.33 | | | | (2.27 | ) | | | 17.84 | | | | 16.84 | |
| | | | | | | | | | | | | | | | | | | | | | | | | | | | |
Dividends and distributions from: | | | | | | | | | | | | | | | | | | | | | | | | | | | | |
Net investment income | | | — | | | | — | | | | (1.58 | ) | | | (0.04 | ) | | | (0.38 | ) | | | — | | | | (0.24 | ) |
Net realized gain | | | — | | | | (9.04 | ) | | | (7.22 | ) | | | (18.58 | ) | | | (8.60 | ) | | | — | | | | (1.55 | ) |
| | | | | | | | | | | | | | | | | | | | | | | | | | | | |
Total dividends and distributions | | | — | | | | (9.04 | ) | | | (8.80 | ) | | | (18.62 | ) | | | (8.98 | ) | | | — | | | | (1.79 | ) |
| | | | | | | | | | | | | | | | | | | | | | | | | | | | |
Redemption fees added to paid-in capital | | | 0.00 | 2 | | | 0.01 | | | | 0.02 | | | | 0.00 | 2 | | | 0.01 | | | | 0.00 | 2 | | | — | |
| | | | | | | | | | | | | | | | | | | | | | | | | | | | |
Net asset value, end of period | | $ | 24.32 | | | $ | 21.51 | | | $ | 39.61 | | | $ | 50.84 | | | $ | 58.13 | | | $ | 69.37 | | | $ | 51.53 | |
| | | | | | | | | | | | | | | | | | | | | | | | | | | | |
Total Investment Return3 | | | | | | | | | | | | | | | | | | | | | | | | | | | | |
Based on net asset value | | | 13.06 | %4,5 | | | (8.68 | )%7,10 | | | (7.57 | )%8 | | | 22.36 | %4 | | | (3.92 | )%11 | | | 34.62 | %4,5 | | | 47.01 | %5 |
| | | | | | | | | | | | | | | | | | | | | | | | | | | | |
Ratios to Average Net Assets | | | | | | | | | | | | | | | | | | | | | | | | | | | | |
Total expenses | | | 2.04 | %9 | | | 2.16 | % | | | 1.96 | % | | | 2.02 | % | | | 2.05 | % | | | 2.17 | %9 | | | 2.02 | %9 |
| | | | | | | | | | | | | | | | | | | | | | | | | | | | |
Total expenses excluding recoupment of past waived fees | | | 2.03 | %9 | | | 2.16 | % | | | 1.96 | % | | | 2.02 | % | | | 2.05 | % | | | 2.17 | %9 | | | 2.02 | %9 |
| | | | | | | | | | | | | | | | | | | | | | | | | | | | |
Total expenses after fees waived, reimbursed and paid indirectly | | | 2.04 | %9 | | | 2.05 | % | | | 1.96 | % | | | 2.01 | % | | | 2.01 | % | | | 2.04 | %9 | | | 2.01 | %9 |
| | | | | | | | | | | | | | | | | | | | | | | | | | | | |
Net investment loss | | | (1.46 | )%9 | | | (1.29 | )% | | | (1.21 | )% | | | (1.00 | )% | | | (0.26 | )% | | | (0.61 | )%9 | | | (1.17 | )%9 |
| | | | | | | | | | | | | | | | | | | | | | | | | | | | |
Supplemental Data | | | | | | | | | | | | | | | | | | | | | | | | | | | | |
Net assets, end of period (000) | | $ | 153,893 | | | $ | 129,556 | | | $ | 151,409 | | | $ | 144,300 | | | $ | 147,723 | | | $ | 201,265 | | | $ | 169,871 | |
| | | | | | | | | | | | | | | | | | | | | | | | | | | | |
Portfolio turnover | | | 11 | % | | | 25 | % | | | 32 | % | | | 15 | % | | | 27 | % | | | 9 | % | | | 22 | % |
| | | | | | | | | | | | | | | | | | | | | | | | | | | | |
| 1 | Based on average shares outstanding. |
| 2 | Less than $0.01 per share. |
| 3 | Where applicable, total investment returns exclude the effects of any sales charges and include the reinvestment of dividends and distributions. |
| 4 | Redemption fee of 2.00% is reflected in total return calculations. There was no impact to the return. |
| 5 | Aggregate total investment return. |
| 6 | Includes proceeds received from a settlement of litigation, which impacted the Fund’s total return. Not including these proceeds, the Fund’s total return would have been (8.77)%. |
| 7 | Redemption fee of 2.00% is reflected in total return calculations. The impact to the return from redemption fees received during the period was an increase of 0.04%. |
| 8 | Redemption fee of 2.00% is reflected in total return calculations. The impact to the return from redemption fees received during the period was an increase of 0.02%. |
| 10 | Includes proceeds received from a settlement of litigation, which impacted the Fund’s total return. Not including these proceeds, the Fund’s total return would have been (8.71)%. |
| 11 | Redemption fee of 2.00% is reflected in total return calculations. The impact to the return from redemption fees received during the period was an increase of 0.01%. |
See Notes to Financial Statements.
| | | | | | |
| | | BLACKROCK FUNDS | | MARCH 31, 2010 | | 41 |
Notes to Financial Statements (Unaudited)
1. Organization and Significant Accounting Policies:
BlackRock FundsSM (the “Trust”), a Massachusetts business trust, is registered under the Investment Company Act of 1940, as amended (the “1940 Act”), as an open-end management investment company. As of March 31, 2010, the Trust had 25 series, of which BlackRock All-Cap Energy & Resources Portfolio (“All-Cap Energy & Resources”), BlackRock Aurora Portfolio (“Aurora”), BlackRock Capital Appreciation Portfolio (“Capital Appreciation”) and BlackRock Energy & Resources Portfolio (“Energy & Resources”) (collectively the “Funds”) are included in these financial statements. Each of the Funds, except All-Cap Energy & Resources and Energy & Resources is diversified. The Funds’ financial statements are prepared in conformity with accounting principles generally accepted in the United States of America (“US GAAP”), which may require the use of management accruals and estimates. Actual results may differ from these estimates. Each Fund offers multiple classes of shares. Institutional Shares are sold without a sales charge and only to certain eligible investors. Service Shares are sold without a sales charge. Investor A Shares are generally sold with a front-end sales charge. Investor B and Investor C Shares may be subject to a contingent deferred sales charge. Class R Shares are sold without a sales charge and only to certain retirement and other similar plans. All classes of shares have identical voting, dividend, liquidation and other rights and the same terms and conditions, except that Service, Investor A, Investor B, Investor C and Class R Shares bear certain expenses related to the shareholder servicing of such shares, and Investor B, Investor C and Class R Shares also bear certain expenses related to the distribution of such shares. Investor B Shares automatically convert to Investor A Shares after approximately eight years. Investor B Shares are only available for purchase through exchanges, dividend reinvestment or for purchase by certain qualified employee benefit plans. Each class has exclusive voting rights with respect to matters relating to its shareholder servicing and distribution expenditures (except that Investor B shareholders may vote on material changes to the Investor A distribution plan).
Fund Reorganizations:
On February 9, 2010, the Board of Trustees (the “Board”) of the Trust approved approved a plan of reorganization, subject to shareholder approval and certain other conditions, whereby BlackRock Fundamental Growth Fund, Inc. will acquire substantially all of the assets and assume certain stated liabilities of Capital Appreciation in exchange for newly issued shares of BlackRock Fundamental Growth Fund, Inc.
On February 23, 2010, the Board approved a plan of reorganization, subject to shareholder approval and certain other conditions, whereby BlackRock Mid-Cap Value Equity Portfolio of the Trust will acquire substantially all of the assets and assume certain stated liabilities of Aurora in exchange for newly issued shares of BlackRock Mid-Cap Value Equity Portfolio.
The Board on behalf of Capital Appreciation and the shareholders of the PNC Equity Growth Fund, a series of the PNC Funds, Inc., approved a reorganization (the “Reorganization”), which was a tax-free event that took place on November 14, 2008.
| | |
Target Fund | | Acquiring Fund |
| PNC Equity Growth Fund | | Capital Appreciation |
Under the agreement and plan of reorganization with respect to the Reorganization, PNC Equity Growth Fund Investor A Shares, Investor C Shares and Institutional Shares were exchanged for Capital Appreciation Investor A Shares and Institutional Shares. The conversion ratio for each share class was as follows:
| | |
PNC Equity Growth Fund/Capital Appreciation | | |
Investor A/Investor A | | 0.43269926 |
Investor C/Investor A | | 0.41215351 |
Institutional/Institutional | | 0.42252433 |
The net assets before and after the Reorganization and shares issued and redeemed in the Reorganization were as follows:
| | | | | | | | | | |
BlackRock Fund | | Net Assets Combined
After Reorganization as of
November 14, 2008 | | Net Assets Prior to
Reorganization as of
November 14, 2008 | | Shares Issued | | PNC Equity Growth Fund
Shares Redeemed |
Capital Appreciation | | $ | 192,543,523 | | $ | 182,664,682 | | 868,487 | | 2,054,276 |
The net assets acquired were the following components:
| | | | | | | | | | | | | | |
PNC Fund | | Paid In Capital | | Accumulated
Net Realized
Loss | | | Net
Unrealized
Depreciation | | | Net Assets |
PNC Equity Growth Fund | | $ | 38,049,826 | | $ | (22,837,903 | ) | | $ | (5,333,082 | ) | | $ | 9,878,841 |
The following is a summary of significant accounting policies followed by the Funds:
Valuation: The Funds’ policy is to fair value their financial instruments at market value. Equity investments traded on a recognized securities exchange or the NASDAQ Global Market System are valued at the last reported sale price that day or the NASDAQ official closing price, if applicable. For equity investments traded on more than one exchange, the last reported sale price on the exchange where the stock is primarily traded is used. Equity investments traded on a recognized exchange for
| | | | | | |
| 42 | | BLACKROCK FUNDS | | MARCH 31, 2010 | | |
Notes to Financial Statements (continued)
which there were no sales on that day are valued at the last available bid price. If no bid price is available, the prior day’s price will be used, unless it is determined that such prior day’s price no longer reflects the fair value of the security. The Funds value their bond investments on the basis of last available bid prices or current market quotations provided by dealers or pricing services selected under the supervision of the Funds’ Board. In determining the value of a particular investment, pricing services may use certain information with respect to transactions in such investments, quotations from dealers, pricing matrixes, market transactions in comparable investments, various relationships observed in the market between investments and calculated yield measures based on valuation technology commonly employed in the market for such investments. Short-term securities with remaining maturities of 60 days or less may be valued at amortized cost, which approximates fair value. Investments in open-end investment companies are valued at net asset value each business day.
The Funds value their investments in BlackRock Liquidity Series, LLC Money Market Series (the “Money Market Series”) at fair value, which is ordinarily based upon their pro rata ownership in the net assets of the underlying fund. The Money Market Series seeks current income consistent with maintaining liquidity and preserving capital. Although the Money Market Series is not registered under the 1940 Act, its investments will follow the parameters of investments by a money market fund that is subject to Rule 2a-7 promulgated by the Securities and Exchange Commission (“SEC”) under the 1940 Act. The Funds may withdraw up to 25% of its investment daily, although the manager of the Money Market Series, in its sole discretion, may permit an investor to withdraw more than 25% on any one day.
Securities and other assets and liabilities denominated in foreign currencies are translated into US dollars using exchange rates determined as of the close of business on the New York Stock Exchange (“NYSE”). Foreign currency exchange contracts are valued at the mid between the bid and ask prices and are determined as of the close of business on the NYSE. Interpolated values are derived when the settlement date of the contract is an interim date for which quotations are not available.
In the event that application of these methods of valuation results in a price for an investment which is deemed not to be representative of the market value of such investment or is not available, the investment will be valued by a method approved by the Board as reflecting fair value (“Fair Value Assets”). When determining the price for Fair Value Assets, the investment advisor seeks to determine the price that each Fund might reasonably expect to receive from the current sale of that asset in an arm’s-length transaction. Fair value determinations shall be based upon all available factors that the investment advisor deems relevant. The pricing of all Fair Value Assets is subsequently reported to the Board or a committee thereof.
Generally, trading in foreign instruments is substantially completed each day at various times prior to the close of business on the NYSE. Occasionally, events affecting the values of such instruments may occur between the foreign market close and the close of business on the NYSE that may not be reflected in the computation of each Fund’s net assets. If events (for example, a company announcement, market volatility or a natural disaster) occur during such periods that are expected to materially affect the value of such instruments, those instruments may be Fair Value Assets and be valued at their fair value, as determined in good faith by the Board or by the investment advisor using a pricing service and/or procedures approved by the Board. Each business day, the Funds use a pricing service selected under the supervision of the Board to assist with the valuation of certain foreign exchange-traded equity securities and foreign exchange-traded and OTC options (the “Systematic Fair Value Price”). Using current market factors, the Systematic Fair Value Price is designed to value such foreign securities and foreign options at fair value as of the close of business on the NYSE, which follows the close of the local markets.
Foreign Currency Transactions: The Funds’ books and records are maintained in US dollars. Foreign currency amounts are translated into US dollars as follows: (i) market value of investment securities, assets and liabilities at the current rate of exchange; and (ii) purchases and sales of investment securities, income and expenses at the rates of exchange prevailing on the respective dates of such transactions. Generally, when the US dollar rises in value against foreign currency, the Funds’ investments denominated in that currency will lose value because its currency is worth fewer US dollars; the opposite effect occurs if the US dollar falls in relative value.
The Funds report foreign currency related transactions as components of realized gains/(loss) for financial reporting purposes, whereas such components are treated as ordinary income for federal income tax purposes.
Segregation and Collateralization: In cases in which the 1940 Act and the interpretive positions of the SEC require that a Fund either delivers collateral or segregates assets in connection with certain investments (e.g., foreign currency exchange contracts) each Fund will, consistent with SEC rules and/or certain interpretive letters issued by the SEC, segregate collateral or designate on its books and records cash or other liquid securities having a market value at least equal to the amount that would otherwise be required to be physically segregated. Furthermore, based on requirements and agreements with certain exchanges and third party broker-dealers, each party has requirements to deliver/ deposit securities as collateral for certain investments.
Investment Transactions and Investment Income: For financial reporting purposes, investment transactions are recorded on the dates the transactions are entered into (the trade dates). Realized gains and losses on investment transactions are determined on the identified cost basis. Dividend income is recorded on the ex-dividend dates. Dividends from foreign securities where the ex-dividend date may have passed are subsequently recorded when the Funds have determined the ex-dividend date. Under the applicable foreign tax laws, a withholding tax at various rates may be imposed on capital gains, dividends and interest. Upon notification from issuers, some of the dividend income received from a real estate investment trust may be redesignated as a reduction of cost
| | | | | | |
| | | BLACKROCK FUNDS | | MARCH 31, 2010 | | 43 |
Notes to Financial Statements (continued)
of the related investment and/or realized gain. Interest income, including amortization of premium and accretion of discount on debt securities, is recognized on the accrual basis. Income and realized and unrealized gains and losses are allocated daily to each class based on its relative net assets.
Dividends and Distributions: Dividends and distributions, if any, paid by the Funds are recorded on the ex-dividend dates. The amount and timing of dividends and distributions are determined in accordance with federal income tax regulations, which may differ from US GAAP.
Securities Lending: The Funds may lend securities to financial institutions that provide cash as collateral, which will be maintained at all times in an amount equal to at least 100% of the current market value of the loaned securities. The market value of the loaned securities is determined at the close of business of the Funds and any additional required collateral is delivered to the Funds on the next business day. Securities lending income, as disclosed in the Statements of Operations, represents the income earned from the investment of the cash collateral, net of rebates paid to, or fees paid by, borrowers and less the fees paid to the securities lending agent. Loans of securities are terminable at any time and the borrower, after notice, is required to return borrowed securities within the standard time period for settlement of securities transactions. In the event that the borrower defaults on its obligation to return borrowed securities because of insolvency or for any other reason, the Funds could experience delays and costs in gaining access to the collateral. The Funds also could suffer a loss if the value of an investment purchased with cash collateral falls below the market value of loaned securities or if the value of an investment purchased with cash collateral falls below the value of the original cash collateral received.
Income Taxes: It is the Funds’ policy to comply with the requirements of the Internal Revenue Code of 1986, as amended, applicable to regulated investment companies and to distribute substantially all of their taxable income to their shareholders. Therefore, no federal income tax provision is required.
The Funds file US federal and various state and local tax returns. No income tax returns are currently under examination. The statute of limitations on each Fund’s US federal tax returns remains open for each of the four years ended September 30, 2009. The statutes of limitations on each Fund’s state and local tax returns may remain open for an additional year depending upon the jurisdiction. There are no uncertain tax positions that require recognition of a tax liability.
Recent Accounting Standard: In January 2010, Financial Accounting Standards Board issued amended guidance to improve disclosure about fair value measurements which will require additional disclosures about transfers into and out of Levels 1 and 2 and separate disclosures about purchases, sales, issuances and settlements in the reconciliation for fair value measurements using significant unobservable inputs (Level 3). It also clarifies existing disclosure requirements relating to the levels of disaggregation for fair value measurement and inputs and valuation techniques used to measure fair value. The amended guidance is effective for financial statements for fiscal years beginning after December 15, 2009, and interim periods within those fiscal years, except for disclosures about purchases, sales, issuances and settlements in the rollforward of activity in Level 3 fair value measurements, which are effective for fiscal years beginning after December 15, 2010 and for interim periods within those fiscal years. The impact of this guidance on the Funds’ financial statements and disclosures is currently being assessed.
Bank Overdraft: As of March 31, 2010, Capital Appreciation recorded a bank overdraft resulting from the estimation of available cash. The overdraft balance results in fees charged by the custodian which are included in custodian on the Statements of Operations.
Other: Expenses directly related to a Fund or its classes are charged to that Fund or its classes. Other operating expenses shared by several funds are pro rated among those funds on the basis of relative net assets or other appropriate methods. Other expenses of a Fund are allocated daily to each class based on its relative net assets.
2. Derivative Financial Instruments:
The Funds may engage in various portfolio investment strategies both to increase the returns of the Funds and to economically hedge, or protect, their exposure to foreign currency exchange rate risk. Losses may arise if the value of the contract decreases due to an unfavorable change in the price of the underlying currency or if the counterparty does not perform under the contract. The Funds may mitigate counterparty risk through master netting agreements included within an International Swap and Derivatives Association, Inc. (“ISDA”) Master Agreement between a Fund and each of its counterparties. The ISDA Master Agreement allows each Fund to offset with its counterparty certain derivative financial instruments’ payables and/or receivables with collateral held with each counterparty. The amount of collateral moved to/from applicable counterparties is based upon minimum transfer amounts of up to $500,000. To the extent amounts due to the Funds from their counterparties are not fully collateralized contractually or otherwise, the Funds bear the risk of loss from counterparty non-performance. See Note 1 “Segregation and Collateralization” for information with respect to collateral practices. In addition, the Funds manage counterparty risk by entering into agreements only with counterparties that they believe have the financial resources to honor their obligations and by monitoring the financial stability of those counterparties.
Foreign Currency Exchange Contracts: Certain Funds may enter into foreign currency exchange contracts as an economic hedge against either specific transactions or portfolio instruments (foreign currency exchange rate risk). A foreign currency exchange contract is an agreement between two parties to buy and sell a currency at a set exchange rate on a future date. Foreign currency exchange contracts, when used by a Fund, help to manage the overall exposure to the currency backing some of the investments held by a Fund. The contract
| | | | | | |
| 44 | | BLACKROCK FUNDS | | MARCH 31, 2010 | | |
Notes to Financial Statements (continued)
is marked-to-market daily and the change in market value is recorded by a Fund as an unrealized gain or loss. When the contract is closed, a Fund records a realized gain or loss equal to the difference between the value at the time it was opened and the value at the time it was closed. The use of foreign currency exchange contracts involves the risk that counterparties may not meet the terms of the agreement or unfavorable movements in the value of a foreign currency relative to the US dollar.
Derivative Instruments Categorized by Risk Exposure:
| | | | | |
Fair Values of Derivative Instruments as of March 31, 2010* |
Asset Derivatives |
| | | Statements of Assets and Liabilities Location | | Energy &
Resources |
Foreign currency exchange contracts | | Unrealized appreciation on foreign currency exchange contracts | | $ | 1,289 |
|
Liability Derivatives |
| | | Statements of Assets and Liabilities Location | | Energy &
Resources |
Foreign currency exchange contracts | | Unrealized depreciation on foreign currency exchange contracts | | $ | 2,311 |
| | | | | | | | |
The Effect of Derivative Instruments on the Statements of Operations Six Months Ended March 31, 2010 | |
Net Realized Loss from | |
| | | All-Cap
Energy &
Resources | | | Energy &
Resources | |
Foreign currency transactions | | $ | (401,999 | ) | | $ | (107,644 | ) |
| | | | |
Net Change in Unrealized Appreciation/Depreciation on | |
| | | Energy &
Resources | |
Foreign currency transactions | | $ | (1,424 | ) |
For the six months ended March 31, 2010, the average activity of derivative financial instruments was as follows:
| | | | | | |
| | | All-Cap
Energy &
Resources | | Energy &
Resources |
Foreign currency exchange contracts: | | | | | | |
Average number of contracts - US dollars purchased | | | 1 | | | 1 |
Average number of contracts - US dollars sold | | | 1 | | | 1 |
Average US dollar amount purchased | | $ | 270,253 | | $ | 419,903 |
Average US dollar amount sold | | $ | 314,767 | | $ | 339,001 |
3. Investment Advisory Agreement and Other Transactions with Affiliates:
The PNC Financial Services Group, Inc. (“PNC”), Bank of America Corporation (“BAC”) and Barclays Bank PLC (“Barclays”) are the largest stockholders of BlackRock, Inc. (“BlackRock”). Due to the ownership structure, PNC is an affiliate of the Funds for 1940 Act purposes, but BAC and Barclays are not.
The Trust, on behalf of the Funds, entered into an Investment Advisory Agreement with BlackRock Advisors, LLC (the “Manager”), the Funds’ investment advisor, an indirect, wholly owned subsidiary of BlackRock, to provide investment advisory and administration services. The Manager is responsible for the management of each Fund’s portfolio and provides the necessary personnel, facilities, equipment and certain other services necessary to the operations of each Fund. For such services, each Fund pays the Manager a monthly fee at the following annual rates of each Fund’s average daily net assets:
| | | | | | | | | | | | |
Average Daily Net Assets | | All-Cap
Energy &
Resources | | | Aurora | | | Capital
Appreciation | | | Energy &
Resources | |
First $1 Billion | | 0.750 | % | | 0.850 | % | | 0.650 | % | | 0.750 | % |
$1 Billion—$2 Billion | | 0.700 | | | 0.800 | | | 0.600 | | | 0.700 | |
$2 Billion—$3 Billion | | 0.675 | | | 0.750 | | | 0.575 | | | 0.675 | |
Greater Than $3 Billion | | 0.650 | | | 0.700 | | | 0.550 | | | 0.650 | |
The Manager contractually agreed to waive or reimburse fees or expenses, excluding interest expense, dividend expense, acquired fund fees and expenses and certain other fund expenses, in order to limit expenses. The Manager has agreed not to reduce or discontinue this contractual waiver or reimbursement until February 1, 2011 unless approved by the Board, including a majority of the non-interested Trustees. The expense limitations as a percentage of net assets were as follows:
| | | | | | | | | | | | |
Share Classes | | All-Cap
Energy &
Resources | | | Aurora | | | Capital
Appreciation | | | Energy &
Resources | |
BlackRock | | 0.92 | %1 | | N/A | | | N/A | | | N/A | |
Institutional | | 0.96 | % | | 1.08 | % | | 0.72 | % | | 1.07 | % |
Service | | 1.38 | % | | 1.48 | %1 | | 1.39 | %1 | | 1.38 | %1 |
Investor A | | 1.38 | % | | 1.48 | % | | 1.39 | % | | 1.38 | % |
Investor B | | 2.10 | % | | 2.26 | % | | 2.16 | % | | 2.10 | % |
Investor C | | 2.10 | % | | 2.26 | % | | 2.16 | % | | 2.10 | % |
Class R | | 1.83 | %1 | | 1.65 | % | | 2.00 | %1 | | 1.94 | %1 |
| 1 | There were no shares outstanding as of March 31, 2010. |
These amounts are included in fees waived by advisor, fees waived by administrator — class specific and transfer agent fees reimbursed, respectively, in the Statements of Operations. For the six months ended March 31, 2010, the amounts included in fees waived by advisor were as follows:
| | | |
Capital Appreciation | | $ | 183,930 |
| | | | | | |
| | | BLACKROCK FUNDS | | MARCH 31, 2010 | | 45 |
Notes to Financial Statements (continued)
The Manager has voluntarily agreed to waive its advisory fees by the amount of investment advisory fees each Fund pays to the Manager indirectly through its investment in affiliated money market funds, however the Manager does not waive its advisory fees by the amount of investment advisory fees through its investment in other affiliated investment companies. These amounts are included in fees waived by advisor in the Statements of Operations. For the six months ended March 31, 2010, the amounts waived were as follows:
| | | |
All-Cap Energy & Resources | | $ | 8,624 |
Aurora | | $ | 1,792 |
Capital Appreciation | | $ | 3,183 |
Energy & Resources | | $ | 9,064 |
If during a Fund’s fiscal year the operating expenses of a share class that at any time during the prior two fiscal years received a waiver or reimbursement from the Manager, are less than the expense limit for that share class, the Manager is entitled to be reimbursed by such share class up to the amount of fees waived or expenses reimbursed during those prior two fiscal years under the agreement provided that: (1) the Fund of which the share class is a part has more than $50 million in assets and (2) the Manager or an affiliate continues to serve as the Fund’s investment advisor or administrator. In the event the expense limit for a share class is changed subsequent to a fiscal year in which the Manager becomes entitled to reimbursement for fees waived or reimbursed, the amount available to reimburse the Manager shall be calculated by reference to the expense limit for that share class in effect at the time the Manager became entitled to receive such reimbursement, rather than the subsequently changed expense limit for that share class.
For the six months ended March 31, 2010, the Manager recouped the following waivers previously recorded by the Funds:
Recoupment of Past Waived Fees
| | | | | | | | | |
Share Classes | | All-Cap
Energy &
Resources | | Capital
Appreciation | | Energy &
Resources |
Institutional | | $ | 11,310 | | | — | | $ | 7,938 |
Service | | | 1,264 | | | — | | | — |
Investor A | | | 10,401 | | $ | 1,017 | | | 198,445 |
Investor B | | | — | | | 56 | | | — |
Investor C | | | — | | | — | | | 11,483 |
| | | | | | | | | |
Total | | $ | 22,975 | | $ | 1,073 | | $ | 217,866 |
| | | | | | | | | |
On March��31, 2010, the amounts subject to possible future recoupment under the expense limitation agreement are as follows:
| | | | | | | | | |
| | | Expiring September 30, |
| | | 2010 | | 2011 | | 2012 |
All-Cap Energy & Resources | | $ | 54,224 | | $ | 546,026 | | $ | 12,499 |
Aurora | | $ | 842,238 | | $ | 939,370 | | $ | 280,818 |
Capital Appreciation | | $ | 314,604 | | $ | 406,138 | | $ | 264,928 |
Energy & Resources | | $ | 9,211 | | $ | 362,133 | | $ | 2,242 |
The Trust, on behalf of the Funds, has entered into a Distribution Agreement and Distribution Plan with BlackRock Investments, LLC (“BRIL”), an affiliate of BlackRock. Pursuant to the Distribution Plan and in accordance with Rule 12b-1 under the 1940 Act, the Funds pay BRIL ongoing service and distribution fees. The fees are accrued daily and paid monthly at annual rates based upon the average daily net assets of the shares of each Fund as follows:
| | | | | | |
| | | Service
Fee | | | Distribution
Fee | |
Service | | 0.25 | % | | — | |
Investor A | | 0.25 | % | | — | |
Investor B | | 0.25 | % | | 0.75 | % |
Investor C | | 0.25 | % | | 0.75 | % |
Class R | | 0.25 | % | | 0.25 | % |
Pursuant to sub-agreements with BRIL, broker-dealers and BRIL provide shareholder servicing and distribution services to each Fund. The ongoing service and/or distribution fee compensates BRIL and each broker-dealer for providing shareholder servicing and/or distribution related services to Service, Investor A, Investor B, Investor C and Class R shareholders.
For the six months ended March 31, 2010, affiliates earned underwriting discounts, direct commissions and dealer concessions on sales of each Fund’s Investor A Shares as follows:
| | | |
All-Cap Energy & Resources | | $ | 27,704 |
Aurora | | $ | 3,029 |
Capital Appreciation | | $ | 8,485 |
Energy & Resources | | $ | 63,170 |
For the six months ended March 31, 2010, affiliates received the following contingent deferred sales charges relating to transactions in Investor A, Investor B and Investor C Shares:
| | | | | | | | | |
| | | Investor A | | Investor B | | Investor C |
All-Cap Energy & Resources | | $ | 21,610 | | $ | 46,571 | | $ | 7,528 |
Aurora | | $ | 137 | | $ | 16,055 | | $ | 1,016 |
Capital Appreciation | | $ | 2,575 | | $ | 5,638 | | $ | 2,302 |
Energy & Resources | | $ | 34 | | $ | 17,991 | | $ | 15,357 |
PFPC Trust Company, an indirect wholly-owned subsidiary of PNC, serves as custodian for each Fund. For these services, the custodian receives a fee computed daily and payable monthly, based on a percentage of the average daily gross assets of each Fund. The fee is paid at the following annual rates: 0.005% of the first $400 million, 0.004% of the next $1.6 billion and 0.003% of average daily gross assets in excess of $2 billion; plus per transaction charges and other miscellaneous fees incurred on behalf of each Fund.
The Funds have an arrangement with the custodian whereby fees may be reduced by credits earned on uninvested cash balances, which if applicable are shown as fees paid indirectly in the Statements of Operations. The custodian imposes fees on overdrawn cash balances, which can be offset by accumulated credits earned or may result in additional custody charges.
PNC Global Investment Servicing (U.S.) Inc. (“PNCGIS”), an indirect, wholly owned subsidiary of PNC and an affiliate of the Manager, serves as transfer and dividend disbursing agent. Transfer agency fees borne by the Funds are comprised of those fees charged for all shareholder
| | | | | | |
| 46 | | BLACKROCK FUNDS | | MARCH 31, 2010 | | |
Notes to Financial Statements (continued)
communications including mailing of shareholder reports, dividend and distribution notices, and proxy materials for shareholders meetings, as well as per account and per transaction fees related to servicing and maintenance of shareholder accounts, including the issuing, redeeming and transferring of shares, check writing, anti-money laundering services, and customer identification services.
Pursuant to written agreements, certain affiliates provide the Funds with sub-accounting, recordkeeping, sub-transfer agency and other administrative services with respect to sub-accounts they service. For these services, these affiliates receive an annual fee per shareholder account which will vary depending on share class. For the six months ended March 31, 2010, the Funds paid the following in return for these services which is included in transfer agent — class specific in the Statements of Operations:
| | | |
All-Cap Energy & Resources | | $ | 291 |
Aurora | | $ | 3,744 |
Capital Appreciation | | $ | 53,957 |
Energy & Resources | | $ | 420 |
The Manager maintains a call center, which is responsible for providing certain shareholder services to the Funds, such as responding to shareholder inquiries and processing transactions based upon instructions from shareholders with respect to the subscription and redemption of Fund shares. For the six months ended March 31, 2010, each Fund reimbursed the Manager the following amounts for costs incurred in running the call center, which are included in transfer agent — class specific in the Statements of Operations.
| | | | | | | | | | | | | | | | | | | | | |
Call Center | | Share Classes | | |
| | | Institutional | | Service | | Investor A | | Investor B | | Investor C | | Class R | | Total |
All-Cap Energy & Resources | | $ | 1,859 | | $ | 121 | | $ | 11,980 | | $ | 2,774 | | $ | 5,696 | | | — | | $ | 22,430 |
Aurora | | $ | 564 | | | — | | $ | 25,830 | | $ | 814 | | $ | 5,173 | | $ | 18 | | $ | 32,399 |
Capital Appreciation | | $ | 1,068 | | | — | | $ | 10,781 | | $ | 171 | | $ | 675 | | | — | | $ | 12,695 |
Energy & Resources | | $ | 1,104 | | | — | | $ | 23,201 | | $ | 2,467 | | $ | 5,351 | | | — | | $ | 32,123 |
PNCGIS and the Manager act as co-administrators for the Funds. For these services, the co-administrators receive a combined administration fee computed daily and payable monthly, based on a percentage of the average daily net assets of each Fund. The combined administration fee is paid at the following annual rates: 0.075% of the first $500 million, 0.065% of the next $500 million and 0.055% of average daily net assets in excess of $1 billion. In addition, each of the share classes is charged an administration fee based on the following percentages of average daily net assets of each respective class: 0.025% of the first $500 million, 0.015% of the next $500 million and 0.005% of average daily net assets in excess of $1 billion. In addition, PNCGIS and the Manager may have, at their discretion, voluntarily waived all or any portion of their administration fees for a Fund or a share class which are included in administration fees waived and administration fees waived — class specific in the Statements of Operations.
The Funds have received an exemptive order from the SEC permitting, among other things, to pay an affiliated securities lending agent a fee based on a share of the income derived from the securities lending activities and has retained BlackRock Investment Management, LLC (“BIM”) as the securities lending agent. BIM may, on behalf of the Funds, invest cash collateral received by a Fund for such loans, among other things, in a private investment company managed by the Manager or in registered money market funds advised by the Manager or its affiliates. The market value of securities on loan and the value of the related collateral are shown on the Statements of Assets and Liabilities as securities loaned and collateral at value — securities loaned, respectively. The cash collateral invested by BIM is disclosed in the Schedules of Investments. The share of income earned by the Funds on such investments is shown as securities lending — affiliated in the Statements of Operations. For the six months ended March 31, 2010, BIM received $79,062 in securities lending agent fees related to securities lending activities for the Funds.
For the six months ended March 31, 2010, the following tables show the various types of class specific expenses borne directly by each class of each Fund and any associated waivers or reimbursements of those expenses.
| | | | | | | | | | | | | | | | | | | | | |
Administration Fees | | Share Classes | | |
| | | Institutional | | Service | | Investor A | | Investor B | | Investor C | | Class R | | Total |
All-Cap Energy & Resources | | $ | 45,535 | | $ | 465 | | $ | 24,700 | | $ | 3,909 | | $ | 15,113 | | | — | | $ | 89,722 |
Aurora | | $ | 5,551 | | | — | | $ | 38,994 | | $ | 4,839 | | $ | 7,755 | | $ | 110 | | $ | 57,249 |
Capital Appreciation | | $ | 29,073 | | | — | | $ | 22,285 | | $ | 1,198 | | $ | 3,202 | | | — | | $ | 55,758 |
Energy & Resources | | $ | 21,920 | | | — | | $ | 78,166 | | $ | 4,293 | | $ | 17,951 | | | — | | $ | 122,330 |
| | | |
Administration Fees Waived | | | | Share Classes | | |
| | | | | Institutional | | Investor A | | Investor B | | Investor C | | Class R | | Total |
All-Cap Energy & Resources | | | | | | — | | | — | | $ | 3,909 | | $ | 39 | | | — | | $ | 3,948 |
Aurora | | | | | $ | 5,551 | | $ | 32,953 | | $ | 4,839 | | $ | 7,755 | | $ | 110 | | $ | 51,208 |
Capital Appreciation | | | | | $ | 29,073 | | | — | | $ | 82 | | | — | | | — | | $ | 29,155 |
Energy & Resources | | | | | | — | | | — | | $ | 1,906 | | | — | | | — | | $ | 1,906 |
| | | | | | |
| | | BLACKROCK FUNDS | | MARCH 31, 2010 | | 47 |
Notes to Financial Statements (continued)
| | | | | | | | | | | | | | | | | | | | | |
Service and Distribution Fees | | | | Share Classes | | |
| | | | | Service | | Investor A | | Investor B | | Investor C | | Class R | | Total |
All-Cap Energy & Resources | | | | | $ | 4,647 | | $ | 245,623 | | $ | 155,546 | | $ | 601,715 | | | — | | $ | 1,007,531 |
Aurora | | | | | | — | | $ | 389,071 | | $ | 189,774 | | $ | 305,768 | | $ | 2,188 | | $ | 886,801 |
Capital Appreciation | | | | | | — | | $ | 222,196 | | $ | 47,168 | | $ | 127,783 | | | — | | $ | 397,147 |
Energy & Resources | | | | | | — | | $ | 885,740 | | $ | 170,671 | | $ | 716,204 | | | — | | $ | 1,772,615 |
| | |
Transfer Agent Fees | | Share Classes | | |
| | | Institutional | | Service | | Investor A | | Investor B | | Investor C | | Class R | | Total |
All-Cap Energy & Resources | | $ | 50,633 | | $ | 2,349 | | $ | 183,224 | | $ | 44,905 | | $ | 111,556 | | | — | | $ | 392,667 |
Aurora | | $ | 52,560 | | | — | | $ | 478,984 | | $ | 106,094 | | $ | 111,179 | | $ | 1,455 | | $ | 750,272 |
Capital Appreciation | | $ | 76,824 | | | — | | $ | 164,309 | | $ | 20,267 | | $ | 22,163 | | | — | | $ | 283,563 |
Energy & Resources | | $ | 37,497 | | | — | | $ | 549,039 | | $ | 39,135 | | $ | 104,008 | | | — | | $ | 729,679 |
| | | |
Transfer Agent Fees Waived | | | | Share Classes | | |
| | | | | Institutional | | Investor A | | Investor B | | Investor C | | Class R | | Total |
All-Cap Energy & Resources | | | | | | — | | | — | | $ | 2,774 | | | — | | | — | | $ | 2,774 |
Aurora | | | | | $ | 564 | | $ | 22,813 | | $ | 814 | | $ | 4,965 | | $ | 18 | | $ | 29,174 |
Capital Appreciation | | | | | $ | 1,068 | | | — | | | — | | | — | | | — | | $ | 1,068 |
Energy & Resources | | | | | | — | | | — | | $ | 331 | | | — | | | — | | $ | 331 |
| | | |
Transfer Agent Fees Reimbursed | | | | Share Classes | | |
| | | | | Institutional | | Investor A | | Investor B | | Investor C | | Class R | | Total |
All-Cap Energy & Resources | | | | | | — | | | — | | $ | 5,778 | | | — | | | — | | $ | 5,778 |
Aurora | | | | | $ | 33,037 | | $ | 95,831 | | $ | 50,545 | | $ | 20,265 | | $ | 758 | | $ | 200,436 |
Capital Appreciation | | | | | $ | 50,774 | | | — | | | — | | | — | | | — | | $ | 50,774 |
Energy & Resources | | | | | | — | | | — | | $ | 5 | | | — | | | — | | $ | 5 |
The Funds may also receive earnings credits related to cash balances with PNCGIS which are shown on the Statements of Operations as fees paid indirectly.
Certain officers and/or trustees of the Trust are officers and/or directors of BlackRock or its affiliates. The Funds reimburse the Manager for compensation paid to the Trust’s Chief Compliance Officer.
4. Investments:
Purchases and sales of investments, excluding short-term securities, for the six months ended March 31, 2010, were as follows:
| | | | | | |
| | | Purchases | | Sales |
All-Cap Energy & Resources | | $ | 197,160,162 | | $ | 154,282,922 |
Aurora | | $ | 338,128,186 | | $ | 418,967,321 |
Capital Appreciation | | $ | 218,285,206 | | $ | 164,015,631 |
Energy & Resources | | $ | 197,039,585 | | $ | 107,384,876 |
5. Borrowings:
The Funds, along with certain other funds managed by the Manager and its affiliates, is a party to a $500 million credit agreement with a group of lenders, which was renewed until November 2010. The Funds may borrow under the credit agreement to fund shareholder redemptions. Prior to its renewal, the credit agreement had the following terms: 0.02% upfront fee on the aggregate commitment amount which was allocated to the Funds based on its net assets as of October 31, 2008; a commitment fee of 0.08% per annum based on the Funds’ pro rata share of the unused portion of the credit agreement, which is included in miscellaneous in the Statements of Operations, and interest at a rate equal to the higher of the (a) federal funds effective rate and (b) reserve adjusted one-month LIBOR, plus, in each case, the higher of (i) 1.50% and (ii) 50% of the CDX Index (as defined in the credit agreement) on amounts borrowed. Effective November 2009, the credit agreement was renewed with the following terms: 0.02% upfront fee on the aggregate commitment amount which was allocated to the Funds based on its net assets as of October 31, 2009, a commitment fee of 0.10% per annum based on the Funds’ pro rata share of the unused portion of the credit agreement and interest at a rate equal to the higher of (a) the one-month LIBOR plus 1.25% per annum and (b) the Fed Funds rate plus 1.25% per annum on amounts borrowed. The Funds did not borrow under the credit agreement during the six months ended March 31, 2010.
| | | | | | |
| 48 | | BLACKROCK FUNDS | | MARCH 31, 2010 | | |
Notes to Financial Statements (continued)
6. Capital Loss Carryforward:
As of September 30, 2009, the Funds had capital loss carryforwards available to offset future realized capital gains through the indicated expiration dates:
| | | | | | | | | | | | |
Expires September 30, | | All-Cap
Energy &
Resources | | Aurora | | Capital
Appreciation | | Energy &
Resources |
2010 | | | — | | | — | | $ | 32,425,507 | | | — |
2011 | | | — | | | — | | | 18,377,786 | | | — |
2017 | | $ | 43,202,338 | | $ | 192,963,017 | | | 10,784,067 | | $ | 21,722,097 |
| | | | | | | | | | | | |
Total | | $ | 43,202,338 | | $ | 192,963,017 | | $ | 61,587,360 | | $ | 21,722,097 |
| | | | | | | | | | | | |
7. Concentration, Market and Credit Risk:
In the normal course of business, the Funds invest in securities and enter into transactions where risks exist due to fluctuations in the market (market risk) or failure of the issuer of a security to meet all its obligations (credit risk). The value of securities held by the Funds may decline in response to certain events, including those directly involving the issuers whose securities are owned by the Funds; conditions affecting the general economy; overall market changes; local, regional or global political, social or economic instability; and currency and interest rate and price fluctuations. Similar to credit risk, the Funds may be exposed to counterparty risk, or the risk that an entity with which the Funds have unsettled or open transactions may default. The Funds manage counterparty risk by entering into transactions only with counterparties that they believe have the financial resources to honor their obligations and by monitoring the financial stability of those counterparties. Financial assets, which potentially expose the Funds to credit and counterparty risks, consist principally of investments and cash due from counterparties. The extent of the Funds’ exposure to credit and counterparty risks with respect to these financial assets is generally approximated by their value recorded in the Funds’ Statements of Assets and Liabilities, less any collateral held by the Funds.
All-Cap Energy & Resources and Energy & Resources invest a significant portion of their assets in securities in the energy sector. Changes in economic conditions affecting the energy sector would have a greater impact on All-Cap Energy & Resources and Energy & Resources and could affect the value, income and/or liquidity of positions in such securities.
Aurora invests a significant portion of its assets in securities in the financials sector. Changes in economic conditions affecting the financials sector would have a greater impact on Aurora and could affect the value, income and/or liquidity of positions in such securities.
Capital Appreciation invests a significant portion of its assets in securities in the information technology sector. Changes in economic conditions affecting the information technology sector would have a greater impact on Capital Appreciation and could affect the value, income and/or liquidity of positions in such securities.
As of March 31, 2010, the Funds listed below had the following geographic allocations:
| | | | | | |
Geographic Allocations | | All-Cap
Energy &
Resources | | | Energy &
Resources | |
United States | | 68 | % | | 72 | % |
Canada | | 16 | | | 19 | |
Brazil | | 4 | | | 1 | |
Netherlands | | 3 | | | — | |
Australia | | 2 | | | 2 | |
Norway | | 2 | | | — | |
China | | 2 | | | — | |
Switzerland | | 1 | | | 2 | |
France | | 1 | | | — | |
United Kingdom | | 1 | | | 3 | |
Bermuda | | — | | | 1 | |
8. Capital Shares Transactions:
Transactions in capital shares for each class were as follows:
| | | | | | | | | | | | | | |
| | | Six Months Ended
March 31, 2010 | | | Year Ended
September 30, 2009 | |
All-Cap Energy & Resources | | Shares | | | Amount | | | Shares | | | Amount | |
Institutional | | | | | | | | | | | | |
Shares sold | | 4,489,527 | | | $ | 61,291,480 | | | 6,816,039 | | | $ | 66,330,383 | |
Shares issued in reinvestment of dividends and distributions | | 200,404 | | | | 2,539,121 | | | 5,705,653 | | | | 45,759,161 | |
| | | | | | | | | | | | | | |
Total issued | | 4,689,931 | | | | 63,830,601 | | | 12,521,692 | | | | 112,089,544 | |
Shares redeemed | | (3,846,516 | ) | | | (50,666,092 | ) | | (17,695,712 | ) | | | (168,499,591 | ) |
| | | | | | | | | | | | | | |
Net increase (decrease) | | 843,415 | | | $ | 13,164,509 | | | (5,174,020 | ) | | $ | (56,410,047 | ) |
| | | | | | | | | | | | | | |
| | | | | | |
| | | BLACKROCK FUNDS | | MARCH 31, 2010 | | 49 |
Notes to Financial Statements (continued)
| | | | | | | | | | | | | | |
| | | Six Months Ended
March 31, 2010 | | | Year Ended
September 30, 2009 | |
All-Cap Energy & Resources (concluded) | | Shares | | | Amount | | | Shares | | | Amount | |
| | | | |
Service | | | | | | | | | | | | | | |
Shares sold | | 75,560 | | | $ | 1,006,184 | | | 126,381 | | | $ | 1,357,643 | |
Shares issued in reinvestment of dividends and distributions | | 1,331 | | | | 16,588 | | | 36,296 | | | | 286,741 | |
| | | | | | | | | | | | | | |
Total issued | | 76,891 | | | | 1,022,772 | | | 162,677 | | | | 1,644,384 | |
Shares redeemed | | (52,309 | ) | | | (676,488 | ) | | (184,665 | ) | | | (1,761,798 | ) |
| | | | | | | | | | | | | | |
Net increase (decrease) | | 24,582 | | | $ | 346,284 | | | (21,988 | ) | | $ | (117,414 | ) |
| | | | | | | | | | | | | | |
| | | | |
Investor A | | | | | | | | | | | | | | |
Shares sold and automatic conversion of shares | | 2,465,734 | | | $ | 32,527,150 | | | 6,058,645 | | | $ | 59,640,495 | |
Shares issued in reinvestment of dividends and distributions | | 68,064 | | | | 848,743 | | | 2,485,169 | | | | 19,632,659 | |
| | | | | | | | | | | | | | |
Total issued | | 2,533,798 | | | | 33,375,893 | | | 8,543,814 | | | | 79,273,154 | |
Shares redeemed | | (1,942,999 | ) | | | (25,503,508 | ) | | (10,673,413 | ) | | | (103,741,777 | ) |
| | | | | | | | | | | | | | |
Net increase (decrease) | | 590,799 | | | $ | 7,872,385 | | | (2,129,599 | ) | | $ | (24,468,623 | ) |
| | | | | | | | | | | | | | |
| | | | |
Investor B | | | | | | | | | | | | | | |
Shares sold | | 33,335 | | | $ | 429,799 | | | 393,955 | | | $ | 3,681,132 | |
Shares issued in reinvestment of dividends and distributions | | — | | | | — | | | 474,990 | | | | 3,652,624 | |
| | | | | | | | | | | | | | |
Total issued | | 33,335 | | | | 429,799 | | | 868,945 | | | | 7,333,756 | |
Shares redeemed and automatic conversion of shares | | (323,297 | ) | | | (4,122,135 | ) | | (965,605 | ) | | | (9,019,109 | ) |
| | | | | | | | | | | | | | |
Net decrease | | (289,962 | ) | | $ | (3,692,336 | ) | | (96,660 | ) | | $ | (1,685,353 | ) |
| | | | | | | | | | | | | | |
| | | | |
Investor C | | | | | | | | | | | | | | |
Shares sold | | 951,084 | | | $ | 12,187,696 | | | 2,104,931 | | | $ | 20,094,619 | |
Shares issued in reinvestment of dividends and distributions | | — | | | | — | | | 1,666,587 | | | | 12,815,816 | |
| | | | | | | | | | | | | | |
Total issued | | 951,084 | | | | 12,187,696 | | | 3,771,518 | | | | 32,910,435 | |
Shares redeemed | | (1,007,746 | ) | | | (12,785,885 | ) | | (3,991,620 | ) | | | (37,309,926 | ) |
| | | | | | | | | | | | | | |
Net decrease | | (56,662 | ) | | $ | (598,189 | ) | | (220,102 | ) | | $ | (4,399,491 | ) |
| | | | | | | | | | | | | | |
| | | | |
Aurora | | | | | | | | | | | | | | |
Institutional | | | | | | | | | | | | | | |
Shares sold | | 306,009 | | | $ | 5,051,790 | | | 1,494,330 | | | $ | 20,882,726 | |
Shares issued in reinvestment of dividends | | 39,885 | | | | 627,398 | | | — | | | | — | |
| | | | | | | | | | | | | | |
Total issued | | 345,894 | | | | 5,679,188 | | | 1,494,330 | | | | 20,882,726 | |
Shares redeemed | | (1,643,433 | ) | | | (28,228,082 | ) | | (2,680,292 | ) | | | (38,091,147 | ) |
| | | | | | | | | | | | | | |
Net decrease | | (1,297,539 | ) | | $ | (22,548,894 | ) | | (1,185,962 | ) | | $ | (17,208,421 | ) |
| | | | | | | | | | | | | | |
| | | | |
Investor A | | | | | | | | | | | | | | |
Shares sold and automatic conversion of shares | | 1,383,110 | | | $ | 21,008,577 | | | 4,283,420 | | | $ | 53,250,940 | |
Shares issued in reinvestment of dividends | | 244,222 | | | | 3,514,359 | | | — | | | | — | |
| | | | | | | | | | | | | | |
Total issued | | 1,627,332 | | | | 24,522,936 | | | 4,283,420 | | | | 53,250,940 | |
Shares redeemed | | (3,280,463 | ) | | | (49,033,946 | ) | | (9,396,270 | ) | | | (120,775,988 | ) |
| | | | | | | | | | | | | | |
Net decrease | | (1,653,131 | ) | | $ | (24,511,010 | ) | | (5,112,850 | ) | | $ | (67,525,048 | ) |
| | | | | | | | | | | | | | |
| | | | | | |
| 50 | | BLACKROCK FUNDS | | MARCH 31, 2010 | | |
Notes to Financial Statements (continued)
| | | | | | | | | | | | | | |
| | | Six Months Ended
March 31, 2010 | | | Year Ended
September 30, 2009 | |
Aurora (concluded) | | Shares | | | Amount | | | Shares | | | Amount | |
| | | | |
Investor B | | | | | | | | | | | | | | |
Shares sold | | 6,181 | | | $ | 72,929 | | | 181,808 | | | $ | 1,891,388 | |
Shares issued in reinvestment of dividends | | 9,576 | | | | 110,027 | | | — | | | | — | |
| | | | | | | | | | | | | | |
Total issued | | 15,757 | | | | 182,956 | | | 181,808 | | | | 1,891,388 | |
Shares redeemed and automatic conversion of shares | | (1,370,972 | ) | | | (16,588,041 | ) | | (4,666,051 | ) | | | (46,312,237 | ) |
| | | | | | | | | | | | | | |
Net decrease | | (1,355,215 | ) | | $ | (16,405,085 | ) | | (4,484,243 | ) | | $ | (44,420,849 | ) |
| | | | | | | | | | | | | | |
| | | | |
Investor C | | | | | | | | | | | | | | |
Shares sold | | 66,926 | | | $ | 797,569 | | | 162,260 | | | $ | 1,653,368 | |
Shares issued in reinvestment of dividends | | 40,668 | | | | 464,434 | | | — | | | | — | |
| | | | | | | | | | | | | | |
Total issued | | 107,594 | | | | 1,262,003 | | | 162,260 | | | | 1,653,368 | |
Shares redeemed | | (793,823 | ) | | | (9,417,202 | ) | | (2,118,460 | ) | | | (21,560,019 | ) |
| | | | | | | | | | | | | | |
Net decrease | | (686,229 | ) | | $ | (8,155,199 | ) | | (1,956,200 | ) | | $ | (19,906,651 | ) |
| | | | | | | | | | | | | | |
| | | | |
Class R | | | | | | | | | | | | | | |
Shares sold | | 7,640 | | | $ | 111,990 | | | 21,464 | | | $ | 269,050 | |
Shares issued in reinvestment of dividends | | 649 | | | | 9,253 | | | — | | | | — | |
| | | | | | | | | | | | | | |
Total issued | | 8,289 | | | | 121,243 | | | 21,464 | | | | 269,050 | |
Shares redeemed | | (27,023 | ) | | | (402,299 | ) | | (26,344 | ) | | | (336,699 | ) |
| | | | | | | | | | | | | | |
Net decrease | | (18,734 | ) | | $ | (281,056 | ) | | (4,880 | ) | | $ | (67,649 | ) |
| | | | | | | | | | | | | | |
| | | | |
Capital Appreciation | | | | | | | | | | | | | | |
Institutional | | | | | | | | | | | | | | |
Shares issued from the reorganization | | — | | | | — | | | 846,171 | | | $ | 9,635,176 | |
Shares sold | | 5,502,568 | | | $ | 86,588,991 | | | 9,875,635 | | | | 129,243,301 | |
Shares issued in reinvestment of dividends | | 37,867 | | | | 591,491 | | | — | | | | — | |
| | | | | | | | | | | | | | |
Total issued | | 5,540,435 | | | | 87,180,482 | | | 10,721,806 | | | | 138,878,477 | |
Shares redeemed | | (1,521,172 | ) | | | (24,005,306 | ) | | (3,012,912 | ) | | | (38,201,163 | ) |
| | | | | | | | | | | | | | |
Net increase | | 4,019,263 | | | $ | 63,175,176 | | | 7,708,894 | | | $ | 100,677,314 | |
| | | | | | | | | | | | | | |
| | | | |
Investor A | | | | | | | | | | | | | | |
Shares issued from the reorganization | | — | | | | — | | | 22,316 | | | $ | 243,665 | |
Shares sold and automatic conversion of shares | | 1,851,324 | | | $ | 27,757,806 | | | 5,958,884 | | | | 72,327,030 | |
Shares issued in reinvestment of dividends | | 2,828 | | | | 42,319 | | | — | | | | — | |
| | | | | | | | | | | | | | |
Total issued | | 1,854,152 | | | | 27,800,125 | | | 5,981,200 | | | | 72,570,695 | |
Shares redeemed | | (1,630,783 | ) | | | (24,580,987 | ) | | (2,775,465 | ) | | | (32,434,950 | ) |
| | | | | | | | | | | | | | |
Net increase | | 223,369 | | | $ | 3,219,138 | | | 3,205,735 | | | $ | 40,135,745 | |
| | | | | | | | | | | | | | |
| | | | |
Investor B | | | | | | | | | | | | | | |
Shares sold | | 20,948 | | | $ | 288,504 | | | 126,411 | | | $ | 1,324,035 | |
Shares redeemed and automatic conversion of shares | | (194,082 | ) | | | (2,680,038 | ) | | (801,392 | ) | | | (8,408,255 | ) |
| | | | | | | | | | | | | | |
Net decrease | | (173,134 | ) | | $ | (2,391,534 | ) | | (674,981 | ) | | $ | (7,084,220 | ) |
| | | | | | | | | | | | | | |
| | | | | | |
| | | BLACKROCK FUNDS | | MARCH 31, 2010 | | 51 |
Notes to Financial Statements (concluded)
| | | | | | | | | | | | | | |
| | | Six Months Ended
March 31, 2010 | | | Year Ended
September 30, 2009 | |
Capital Appreciation (concluded) | | Shares | | | Amount | | | Shares | | | Amount | |
| | | | |
Investor C | | | | | | | | | | | | | | |
Shares sold | | 512,443 | | | $ | 7,112,557 | | | 1,351,275 | | | $ | 14,481,411 | |
Shares redeemed | | (225,290 | ) | | | (3,116,059 | ) | | (527,244 | ) | | | (5,623,884 | ) |
| | | | | | | | | | | | | | |
Net increase | | 287,153 | | | $ | 3,996,498 | | | 824,031 | | | $ | 8,857,527 | |
| | | | | | | | | | | | | | |
| | | | |
Energy & Resources | | | | | | | | | | | | | | |
Institutional | | | | | | | | | | | | | | |
Shares sold | | 2,215,473 | | | $ | 79,708,524 | | | 4,463,637 | | | $ | 109,578,802 | |
Shares issued in reinvestment of dividends and distributions | | — | | | | — | | | 380,846 | | | | 7,594,159 | |
| | | | | | | | | | | | | | |
Total issued | | 2,215,473 | | | | 79,708,524 | | | 4,844,483 | | | | 117,172,961 | |
Shares redeemed | | (643,423 | ) | | | (22,957,385 | ) | | (2,330,268 | ) | | | (66,100,545 | ) |
| | | | | | | | | | | | | | |
Net increase | | 1,572,050 | | | $ | 56,751,139 | | | 2,514,215 | | | $ | 51,072,416 | |
| | | | | | | | | | | | | | |
| | | | |
Investor A | | | | | | | | | | | | | | |
Shares sold and automatic conversion of shares | | 5,371,790 | | | $ | 170,980,247 | | | 13,818,064 | | | $ | 306,317,533 | |
Shares issued in reinvestment of dividends and distributions | | — | | | | — | | | 6,478,751 | | | | 113,896,782 | |
| | | | | | | | | | | | | | |
Total issued | | 5,371,790 | | | | 170,980,247 | | | 20,296,815 | | | | 420,214,315 | |
Shares redeemed | | (4,708,884 | ) | | | (147,463,996 | ) | | (12,684,001 | ) | | | (298,301,116 | ) |
| | | | | | | | | | | | | | |
Net increase | | 662,906 | | | $ | 23,516,251 | | | 7,612,814 | | | $ | 121,913,199 | |
| | | | | | | | | | | | | | |
| | | | |
Investor B | | | | | | | | | | | | | | |
Shares sold | | 23,721 | | | $ | 562,835 | | | 243,394 | | | $ | 4,023,536 | |
Shares issued in reinvestment of dividends and distributions | | — | | | | — | | | 785,430 | | | | 10,446,300 | |
| | | | | | | | | | | | | | |
Total issued | | 23,721 | | | | 562,835 | | | 1,028,824 | | | | 14,469,836 | |
Shares redeemed and automatic conversion of shares | | (260,429 | ) | | | (6,144,568 | ) | | (882,642 | ) | | | (15,559,229 | ) |
| | | | | | | | | | | | | | |
Net increase (decrease) | | (236,708 | ) | | $ | (5,581,733 | ) | | 146,182 | | | $ | (1,089,393 | ) |
| | | | | | | | | | | | | | |
| | | | |
Investor C | | | | | | | | | | | | | | |
Shares sold | | 1,038,601 | | | $ | 24,694,215 | | | 2,053,570 | | | $ | 36,134,223 | |
Shares issued in reinvestment of dividends and distributions | | — | | | | — | | | 2,181,238 | | | | 28,923,437 | |
| | | | | | | | | | | | | | |
Total issued | | 1,038,601 | | | | 24,694,215 | | | 4,234,808 | | | | 65,057,660 | |
Shares redeemed | | (734,367 | ) | | | (17,114,462 | ) | | (2,033,838 | ) | | | (38,022,838 | ) |
| | | | | | | | | | | | | | |
Net increase | | 304,234 | | | $ | 7,579,753 | | | 2,200,970 | | | $ | 27,034,822 | |
| | | | | | | | | | | | | | |
There is a 2% redemption fee on shares of certain Funds that are redeemed or exchanged within 30 days of purchase. The redemption fees are collected and retained by the Fund for the benefit of its remaining shareholders. The redemption fees are recorded as a credit to paid-in capital.
9. Subsequent Events:
Management has evaluated the impact of all subsequent events on the Funds through the date the financial statements were issued and has determined that there were no subsequent events requiring adjustment or additional disclosure in the financial statements.
| | | | | | |
| 52 | | BLACKROCK FUNDS | | MARCH 31, 2010 | | |
Officers and Trustees
Ronald W. Forbes, Co-Chairman of the Board and Trustee
Rodney D. Johnson, Co-Chairman of the Board and Trustee
David O. Beim, Trustee
Richard S. Davis, Trustee
Henry Gabbay, Trustee
Dr. Matina Horner, Trustee
Herbert I. London, Trustee and Member of the Audit Committee
Cynthia A. Montgomery, Trustee Joseph P. Platt, Jr., Trustee
Robert C. Robb, Jr., Trustee
Toby Rosenblatt, Trustee
Kenneth L. Urish, Chairman of the Audit Committee and Trustee
Frederick W. Winter, Trustee and Member of the Audit Committee
Anne F. Ackerley, President and Chief Executive Officer
Richard Hoerner, CFA, Vice President
Jeffrey Holland, CFA, Vice President
Brendan Kyne, Vice President
Simon Mendelson, Vice President
Brian Schmidt, Vice President
Christopher Stavrakos, CFA, Vice President
Neal J. Andrews, Chief Financial Officer
Jay M. Fife, Treasurer
Brian P. Kindelan, Chief Compliance Officer
Howard B. Surloff, Secretary
Investment Advisor and Co-Administrator
BlackRock Advisors, LLC
Wilmington, DE 19809
Accounting Agent, Co-Administrator and Transfer Agent
PNC Global Investment Servicing (U.S.) Inc.
Wilmington, DE 19809
Custodian
PFPC Trust Company
Philadelphia, PA 19153
Distributor
BlackRock Investments, LLC
New York, NY 10022
Legal Counsel
Sidley Austin LLP
New York, NY 10019
Independent Registered Public Accounting Firm
Deloitte & Touche LLP
Philadelphia, PA 19103
Address of the Trust
100 Bellevue Parkway
Wilmington, DE 19809
| | | | | | |
| | | BLACKROCK FUNDS | | MARCH 31, 2010 | | 53 |
Additional Information
General Information
Electronic Delivery
Electronic copies of most financial reports and prospectuses are available on the Fund’s website or shareholders can sign up for e-mail notifications of quarterly statements, annual and semi-annual reports and prospectuses by enrolling in the Fund’s electronic delivery program.
To enroll:
Shareholders Who Hold Accounts with Investment Advisors, Banks or Brokerages:
Please contact your financial advisor to enroll. Please note that not all investment advisors, banks or brokerages may offer this service.
Shareholders Who Hold Accounts Directly With BlackRock
| 1) | Access the BlackRock website at |
http://www.blackrock.com/ edelivery
| 2) | Select “eDelivery” under the “More Information” section |
Householding
The Funds will mail only one copy of shareholder documents, including annual and semi-annual reports and proxy statements, to shareholders with multiple accounts at the same address. This practice is commonly called “householding” and it is intended to reduce expenses and eliminate duplicate mailings of shareholder documents. Mailings of your shareholder documents may be householded indefinitely unless you instruct us otherwise. If you do not want the mailing of these documents to be combined with those for other members of your household, please contact the Funds at (800) 441-7762.
Availability of Quarterly Portfolio Schedule
The Funds file their complete schedule of portfolio holdings with the Securities and Exchange Commission (the “SEC”) for the first and third quarters of each fiscal year on Form N-Q. The Funds’ Forms N-Q are available on the SEC’s website at http://www.sec.gov and may also be reviewed and copied at the SEC’s Public Reference Room in Washington, D.C. Information on the operation of the Public Reference Room may be obtained by calling (800) SEC-0330. The Funds’ Forms N-Q may also be obtained upon request and without charge by calling (800) 441-7762.
Availability of Proxy Voting Policies and Procedures
A description of the policies and procedures that the Funds use to determine how to vote proxies relating to portfolio securities is available (1) without charge, upon request, by calling (800) 441-7762; (2) at www.blackrock.com; and (3) on the SEC’s website at http:// www.sec.gov.
Availability of Proxy Voting Record
Information about how the Funds voted proxies relating to securities held in the Funds’ portfolios during the most recent 12-month period ended June 30 is available upon request and without charge (1) at www.blackrock.com or by calling (800) 441-7762 and (2) on the SEC’s website at http://www.sec.gov.
Shareholder Privileges
Account Information
Call us at (800) 441-7762 from 8:00 AM to 6:00 PM EST on any business day to get information about your account balances, recent transactions and share prices. You can also reach us on the Web at www.blackrock.com/funds.
Automatic Investment Plans
Investor Class shareholders who want to invest regularly can arrange to have $50 or more automatically deducted from their checking or savings account and invested in any of the BlackRock funds.
Systematic Withdrawal Plan
Investor Class shareholders can establish a systematic withdrawal plan and receive periodic payments of $50 or more from their BlackRock funds, as long as their account balance is at least $10,000.
Retirement Plans
Shareholders may make investments in conjunction with Traditional, Rollover, Roth, Coverdell, Simple IRAs, SEP IRAs and 403(b) Plans.
| | | | | | |
| 54 | | BLACKROCK FUNDS | | MARCH 31, 2010 | | |
Additional Information (concluded)
BlackRock Privacy Principles
BlackRock is committed to maintaining the privacy of its current and former fund investors and individual clients (collectively, “Clients”) and to safeguarding their nonpublic personal information. The following information is provided to help you understand what personal information BlackRock collects, how we protect that information and why in certain cases we share such information with select parties.
If you are located in a jurisdiction where specific laws, rules or regulations require BlackRock to provide you with additional or different privacy-related rights beyond what is set forth below, then BlackRock will comply with those specific laws, rules or regulations.
BlackRock obtains or verifies personal nonpublic information from and about you from different sources, including the following: (i) information we receive from you or, if applicable, your financial intermediary, on applications, forms or other documents; (ii) information about your transactions with us, our affiliates, or others; (iii) information we receive from a consumer reporting agency; and (iv) from visits to our websites.
BlackRock does not sell or disclose to non-affiliated third parties any nonpublic personal information about its Clients, except as permitted by law or as is necessary to respond to regulatory requests or to service Client accounts. These non-affiliated third parties are required to protect the confidentiality and security of this information and to use it only for its intended purpose.
We may share information with our affiliates to service your account or to provide you with information about other BlackRock products or services that may be of interest to you. In addition, BlackRock restricts access to nonpublic personal information about its Clients to those BlackRock employees with a legitimate business need for the information. BlackRock maintains physical, electronic and procedural safeguards that are designed to protect the nonpublic personal information of its Clients, including procedures relating to the proper storage and disposal of such information.
| | | | | | |
| | | BLACKROCK FUNDS | | MARCH 31, 2010 | | 55 |
A World-Class Mutual Fund Family
BlackRock offers a diverse lineup of open-end mutual funds crossing all investment styles and managed by experts in equity, fixed income and tax-exempt investing.
| | | | |
Equity Funds | | | | |
| | |
BlackRock All-Cap Energy & Resources Portfolio | | BlackRock Global Growth Fund | | BlackRock Mid-Cap Value Equity Portfolio |
BlackRock Asset Allocation Portfolio† | | BlackRock Global Opportunities Portfolio | | BlackRock Mid Cap Value Opportunities Fund |
BlackRock Aurora Portfolio | | BlackRock Global SmallCap Fund | | BlackRock Natural Resources Trust |
BlackRock Balanced Capital Fund† | | BlackRock Health Sciences Opportunities Portfolio | | BlackRock Pacific Fund |
BlackRock Basic Value Fund | | BlackRock Healthcare Fund | | BlackRock Science & Technology |
BlackRock Capital Appreciation Portfolio | | BlackRock Index Equity Portfolio* | | Opportunities Portfolio |
BlackRock Energy & Resources Portfolio | | BlackRock International Fund | | BlackRock Small Cap Core Equity Portfolio |
BlackRock Equity Dividend Fund | | BlackRock International Index Fund | | BlackRock Small Cap Growth Equity Portfolio |
BlackRock EuroFund | | BlackRock International Opportunities Portfolio | | BlackRock Small Cap Growth Fund II |
BlackRock Focus Growth Fund | | BlackRock International Value Fund | | BlackRock Small Cap Index Fund |
BlackRock Focus Value Fund | | BlackRock Large Cap Core Fund | | BlackRock Small/Mid-Cap Growth Portfolio |
BlackRock Fundamental Growth Fund | | BlackRock Large Cap Core Plus Fund | | BlackRock S&P 500 Index Fund |
BlackRock Global Allocation Fund† | | BlackRock Large Cap Growth Fund | | BlackRock U.S. Opportunities Portfolio |
BlackRock Global Dynamic Equity Fund | | BlackRock Large Cap Value Fund | | BlackRock Utilities and Telecommunications Fund |
BlackRock Global Emerging Markets Fund | | BlackRock Latin America Fund | | BlackRock Value Opportunities Fund |
BlackRock Global Financial Services Fund | | BlackRock Mid-Cap Growth Equity Portfolio | | |
| | |
Fixed Income Funds | | | | |
| | |
BlackRock Bond Portfolio | | BlackRock Income Builder Portfolio† | | BlackRock Managed Income Portfolio |
BlackRock Emerging Market Debt Portfolio | | BlackRock Inflation Protected Bond Portfolio | | BlackRock Multi-Sector Bond Portfolio |
BlackRock GNMA Portfolio | | BlackRock Intermediate Government | | BlackRock Short-Term Bond Fund |
BlackRock Government Income Portfolio | | Bond Portfolio | | BlackRock Strategic Income Opportunities Portfolio |
BlackRock High Income Fund | | BlackRock International Bond Portfolio | | BlackRock Total Return Fund |
BlackRock High Yield Bond Portfolio | | BlackRock Long Duration Bond Portfolio | | BlackRock Total Return Portfolio II |
BlackRock Income Portfolio† | | BlackRock Low Duration Bond Portfolio | | BlackRock World Income Fund |
| | |
Municipal Bond Funds | | | | |
| | |
BlackRock AMT-Free Municipal Bond Portfolio | | BlackRock Kentucky Municipal Bond Portfolio | | BlackRock New York Municipal Bond Fund |
BlackRock California Insured Municipal Bond Fund | | BlackRock Municipal Insured Fund | | BlackRock Ohio Municipal Bond Portfolio |
BlackRock High Yield Municipal Fund | | BlackRock National Municipal Fund | | BlackRock Pennsylvania Municipal Bond Fund |
BlackRock Intermediate Municipal Fund | | BlackRock New Jersey Municipal Bond Fund | | BlackRock Short-Term Municipal Fund |
| | |
Target Risk & Target Date Funds | | | | |
| | |
BlackRock Prepared Portfolios | | BlackRock Lifecycle Prepared Portfolios | | |
Conservative Prepared Portfolio | | Prepared Portfolio 2010 | | Prepared Portfolio 2030 |
Moderate Prepared Portfolio | | Prepared Portfolio 2015 | | Prepared Portfolio 2035 |
Growth Prepared Portfolio | | Prepared Portfolio 2020 | | Prepared Portfolio 2040 |
Aggressive Growth Prepared Portfolio | | Prepared Portfolio 2025 | | Prepared Portfolio 2045 |
| | | | Prepared Portfolio 2050 |
| * | See the prospectus for information on specific limitations on investments in the fund. |
BlackRock mutual funds are distributed by BlackRock Investments, LLC. You should consider the investment objectives, risks, charges and expenses of the funds under consideration carefully before investing. Each fund’s prospectus contains this and other information and is available at www.blackrock.com or by calling (800) 441-7762 or from your financial advisor. The prospectus should be read carefully before investing.
| | | | | | |
| 56 | | BLACKROCK FUNDS | | MARCH 31, 2010 | | |
[THIS PAGE INTENTIONALLY LEFT BLANK.]
[THIS PAGE INTENTIONALLY LEFT BLANK.]
[THIS PAGE INTENTIONALLY LEFT BLANK.]

This report is transmitted to shareholders only. It is not authorized for use as an offer of sale or a solicitation of an offer to buy shares of the Funds unless accompanied or preceded by the Funds’ current prospectus. Past performance results shown in this report should not be considered a representation of future performance. Investment returns and principal value of shares will fluctuate so that shares, when redeemed, may be worth more or less than their original cost. Statements and other information herein are as dated and are subject to change.
Investment in foreign securities involves special risks including fluctuating foreign exchange rates, foreign government regulations, differing degrees of liquidity and the possibility of substantial volatility due to adverse political, economic or other developments.

EQUITY12-3/10-SAR
| | |
| BlackRock FundsSM | |  |
| SEMI-ANNUAL REPORT | MARCH 31, 2010 (UNAUDITED) | | |
BlackRock Small Cap Core Equity Portfolio
BlackRock Small Cap Growth Equity Portfolio
NOT FDIC INSURED
MAY LOSE VALUE
NO BANK GUARANTEE
Table of Contents
| | | | | | |
| 2 | | BLACKROCK FUNDS | | MARCH 31, 2010 | | |
Dear Shareholder
The past year has seen a remarkable turnaround from the conditions that plagued the global economy and financial markets in 2008 through early 2009. In our opinion, the “Great Recession” likely ended at some point last summer, thanks primarily to massive fiscal and monetary stimulus. From that point, the global economy has moved into recovery mode and, we believe, is getting ready to start transitioning into an expansion.
Global equity markets bottomed in early 2009 and since that time have soared dramatically higher as investors were lured back into the markets by depressed valuations, desire for higher yields and increasing confidence that all-out financial disaster had been averted. There have been several corrections along the way and volatility levels have remained elevated — reflections of mixed economic data, lingering deflation issues (especially in Europe) and concerns over the future direction of interest rates. On balance, however, strong corporate earnings and a positive macro backdrop have helped keep the equity bull market intact. From a geographic perspective, US equities have generally outpaced their international counterparts in recent months, as the domestic economic recovery has been more pronounced.
Within fixed income markets, improving economic conditions, concerns over the US deficit and a lack of demand at recent Treasury auctions have recently conspired to push Treasury yields higher (and prices correspondingly lower). In this environment, Treasuries have dramatically underperformed other areas of the bond market, particularly the high yield sector, which has been benefiting from increased investor demand. Meanwhile, municipal bonds outperformed taxable sectors over the twelve-month period thanks to continued high demand levels, but have struggled in recent months against a weak fundamental backdrop marked by ongoing state and local budget problems. As in the taxable arena, high yield municipals have been outperforming the rest of the market.
Regarding cash investments, yields on money market securities remain near all-time lows (producing returns only marginally above zero percent), with the Federal Open Market Committee reiterating that economic circumstances are likely to necessitate an accommodative interest rate stance for an “extended period.”
Against this backdrop, the major market averages posted the following returns:
| | | | | | |
Total Returns as of March 31, 2010 | | 6-month | | | 12-month | |
US equities (S&P 500 Index) | | 11.75 | % | | 49.77 | % |
Small cap US equities (Russell 2000 Index) | | 13.07 | | | 62.76 | |
International equities (MSCI Europe, Australasia, Far East Index) | | 3.06 | | | 54.44 | |
3-month Treasury bill (BofA Merrill Lynch 3-Month Treasury Bill Index) | | 0.05 | | | 0.17 | |
US Treasury securities (BofA Merrill Lynch 10-Year US Treasury Index) | | (2.62 | ) | | (6.30 | ) |
Taxable fixed income (Barclays Capital US Aggregate Bond Index) | | 1.99 | | | 7.69 | |
Tax-exempt fixed income (Barclays Capital Municipal Bond Index) | | 0.28 | | | 9.69 | |
High yield bonds (Barclays Capital US Corporate High Yield 2% Issuer Capped Index) | | 10.97 | | | 55.64 | |
Past performance is no guarantee of future results. Index performance shown for illustrative purposes only. You cannot invest directly in an index.
Global financial markets continue to show signs of improvement, but questions about the strength and sustainability of the recovery abound. Through periods of uncertainty, as ever, BlackRock’s full resources are dedicated to the management of our clients’ assets. For additional market perspective and investment insight, visit www.blackrock.com/shareholdermagazine, where you’ll find the most recent issue of our award-winning Shareholder® magazine, as well as its quarterly companion newsletter, Shareholder Perspectives. As always, we thank you for entrusting BlackRock with your investments, and we look forward to your continued partnership in the months and years ahead.
Sincerely,

Rob Kapito
President, BlackRock Advisors, LLC
THIS PAGE NOT PART OF YOUR FUND REPORT
| | |
| Fund Summary as of March 31, 2010 | | BlackRock Small Cap Core Equity Portfolio |
Portfolio Management Commentary
How did the Fund perform?
| | • | | The Fund generated solid results for the six-month period, but trailed the benchmark Russell 2000 Index. |
What factors influenced performance?
| | • | | Health care stocks rallied late in the reporting period as uncertainty surrounding health care reform diminished. Stock selection within the sector contributed to returns, with specialty pharmaceutical maker, Impax Laboratories, Inc., and managed care provider, Health Net, Inc., among the notable individual performers. Strong stock selection, particularly among chemicals producers and metals and mining companies, led to favorable results in the materials sector. Key contributors included Solutia, Inc., Cytec Industries, Inc. and RTI International Metals, Inc. Stock selection among food products makers and distributors added value in the consumer staples sector, while solid performance from the Fund’s energy equipment and service providers benefited relative results in energy. |
| | • | | Meanwhile, although the Fund’s commercial bank holdings outper-formed, overall stock selection in the financials sector detracted from results during the period. Primary areas of weakness included the capital markets and real estate investment trust (“REIT”) sub-sectors, where KBW, Inc., TradeStation Group, Inc. and mortgage REIT MFA Financial, Inc. stumbled. Disappointing stock selection also hampered returns in the information technology sector, with the most pronounced weakness among electronic equipment makers and software names. In telecommunication services, a position in Neutral Tandem, Inc. also weighed on relative performance, as shares of the maker of wireless network connection services fell due to concern over increased competition and potential merger activity in its customer base. Lastly, the Fund’s cash position had a negative impact on relative performance, given the strong gains in stock prices during the period. |
Describe recent portfolio activity.
| | • | | During the six months, we increased industrials exposure, adding to several existing holdings and establishing new positions in the temporary employment firm, SFN Group, Inc. and the truck and construction equipment maker, Rush Enterprises, Inc. - Class A. We also raised a weighting in technology as we believe solid corporate balance sheets, strong free cash flow generation, low inventory levels, a favorable product cycle and increased capital spending in the technology area will continue to drive improved profit margins across much of the sector. Conversely, we modestly reduced an allocation to the health care sector, most notably among health care providers. We also decreased a weighting in the more defensive consumer staples sector, selling a position in Chattem, Inc. and trimming our holding in Fresh Del Monte Produce, Inc. |
Describe Fund positioning at period end.
| | • | | At period end, the Fund continued to maintain a pro-cyclical bias, with overweights in the consumer discretionary and industrials sectors, and underweights in financials, health care and utilities. While we continue to believe recovery is underway, the road ahead will likely be bumpy. We remain focused on identifying attractively-valued stocks of companies that have rationalized their cost structure, but have the opportunity to increase revenues and maximize operating leverage in a slow-growth environment. We also expect merger and acquisition activity to accelerate this year, which could provide an additional catalyst for stock prices among small- to mid-capitalization companies. |
The views expressed reflect the opinions of BlackRock as of the date of this report and are subject to change based on changes in market, economic or other conditions. These views are not intended to be a forecast of future events and are no guarantee of future results.
Portfolio Information
| | | |
Ten Largest Holdings | | Percent of
Long-Term
Investments | |
Arbitron, Inc. | | 2 | % |
ArvinMeritor, Inc. | | 2 | |
TreeHouse Foods, Inc. | | 2 | |
Actuant Corp. - Class A | | 2 | |
Kaman Corp. | | 2 | |
Saks, Inc. | | 2 | |
KBW, Inc. | | 1 | |
Horsehead Holding Corp. | | 1 | |
PHH Corp. | | 1 | |
Jos. A. Bank Clothiers, Inc. | | 1 | |
| | | |
Sector Allocation | | Percent of
Long-Term
Investments | |
Consumer Discretionary | | 20 | % |
Industrials | | 19 | |
Information Technology | | 18 | |
Financials | | 18 | |
Health Care | | 11 | |
Energy | | 6 | |
Materials | | 5 | |
Consumer Staples | | 2 | |
Telecommunication Services | | 1 | |
For Fund compliance purposes, the Fund’s sector classifications refer to any one or more of the sector sub-classifications used by one or more widely recognized market indexes or ratings group indexes, and/or as defined by Fund management. This definition may not apply for purposes of this report, which may combine sector sub-classifications for reporting ease.
| | | | | | |
| 4 | | BLACKROCK FUNDS | | MARCH 31, 2010 | | |
| | |
| | BlackRock Small Cap Core Equity Portfolio |
| |
Total Return Based on a $10,000 Investment | | |
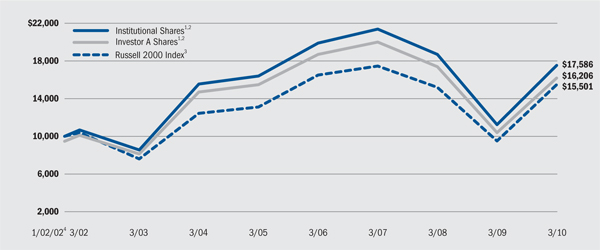
| 1 | Assuming maximum sales charge, if any, transaction costs and other operating expenses, including advisory fees. Institutional Shares do not have a sales charge. |
| 2 | The Fund normally invests at least 80% of its net assets in equity securities issued by US small capitalization companies (market capitalizations between approximately $38.8 million to $2.3 billion as of June 30, 2009), which the portfolio management team believes either have above-average earnings growth potential or are undervalued. |
| 3 | An index that measures the performance of the 2,000 smallest companies in the Russell 3000. |
| 4 | Commencement of operations. |
Performance Summary for the Period Ended March 31, 2010
| | | | | | | | | | | | | | | | | | | | | |
| | | | | | Average Annual Total Returns5 | |
| | | | | | 1 Year | | | 5 Years | | | Since Inception6 | |
| | | 6-Month
Total Returns | | | w/o sales
charge | | | w/sales
charge | | | w/o sales
charge | | | w/sales
charge | | | w/o sales
charge | | | w/sales
charge | |
Institutional | | 11.74 | % | | 56.33 | % | | N/A | | | 1.35 | % | | N/A | | | 7.09 | % | | N/A | |
Service | | 11.51 | | | 55.77 | | | N/A | | | 1.04 | | | N/A | | | 6.89 | | | N/A | |
Investor A | | 11.42 | | | 55.52 | | | 47.38 | % | | 0.89 | | | (0.19 | )% | | 6.72 | | | 6.03 | % |
Investor B | | 11.02 | | | 54.37 | | | 49.87 | | | 0.14 | | | (0.22 | ) | | 6.12 | | | 6.12 | |
Investor C | | 11.04 | | | 54.38 | | | 53.38 | | | 0.15 | | | 0.15 | | | 6.10 | | | 6.10 | |
Russell 2000 Index | | 13.07 | | | 62.76 | | | N/A | | | 3.36 | | | N/A | | | 5.46 | | | N/A | |
| 5 | Assuming maximum sales charges, if any. Average annual total returns with and without sales charges reflect reductions for distribution and service fees. See “About Fund Performance” on page 8 for a detailed description of share classes, including any related sales charges and fees. |
| 6 | The Fund commenced operations on January 2, 2002. |
N/A - Not applicable as share class and index do not have a sales charge.
Past performance is not indicative of future results.
Expense Example
| | | | | | | | | | | | | | | | | | |
| | | Actual | | Hypothetical8 |
| | | Beginning
Account Value
October 1, 2009 | | Ending
Account Value
March 31, 2010 | | Expenses Paid
During the Period7 | | Beginning
Account Value
October 1, 2009 | | Ending
Account Value
March 31, 2010 | | Expenses Paid
During the Period7 |
Institutional | | $ | 1,000 | | $ | 1,117.40 | | $ | 7.07 | | $ | 1,000 | | $ | 1,018.25 | | $ | 6.74 |
Service | | $ | 1,000 | | $ | 1,115.10 | | $ | 8.70 | | $ | 1,000 | | $ | 1,016.70 | | $ | 8.30 |
Investor A | | $ | 1,000 | | $ | 1,114.20 | | $ | 9.59 | | $ | 1,000 | | $ | 1,015.86 | | $ | 9.15 |
Investor B | | $ | 1,000 | | $ | 1,110.20 | | $ | 13.68 | | $ | 1,000 | | $ | 1,011.97 | | $ | 13.04 |
Investor C | | $ | 1,000 | | $ | 1,110.40 | | $ | 13.68 | | $ | 1,000 | | $ | 1,011.97 | | $ | 13.04 |
| 7 | For each class of the Fund, expenses are equal to the annualized expense ratio for the class (1.34% for Institutional, 1.65% for Service, 1.82% for Investor A, 2.60% for Investor B and 2.60% for Investor C), multiplied by the average account value over the period, multiplied by 182/365 (to reflect the period one-half year shown). |
| 8 | Hypothetical 5% annual return before expenses is calculated by pro rating the number of days in the most recent fiscal half-year divided by 365. |
See “Disclosure of Expenses” on page 8 for further information on how expenses were calculated.
| | | | | | |
| | | BLACKROCK FUNDS | | MARCH 31, 2010 | | 5 |
| | |
| Fund Summary as of March 31, 2010 | | BlackRock Small Cap Growth Equity Portfolio |
| |
Portfolio Management Commentary | | |
How did the Fund perform?
| | • | | The Fund outperformed the benchmark Russell 2000 Growth Index for the six-month period. |
What factors influenced performance?
| | • | | Stock selection in the industrials and health care sectors were the most significant contributors to relative performance during the reporting period. Within industrials, air freight transportation company, Atlas Air Worldwide Holdings, Inc., was up 59% given the global, cyclical recovery. Temporary staffing companies also benefited as employment numbers stabilized and companies began to hire once again. Within the Fund, staffing company, MPS Group, Inc., climbed over 28%. In health care, a number of holdings within biotechnology were the main contributors to the Fund’s outperformance within the space. In particular, cancer research company, OSI Pharmaceuticals, Inc., jumped over 60% upon receiving an acquisition bid from a larger pharmaceutical company. Elsewhere within the Fund, top conviction holding, TiVo, Inc., spiked 65% during the period, as a federal appeals court upheld and validated the company’s time warp technology patent. |
| | • | | In contrast, stock selection in the consumer discretionary sector slightly held back relative returns for the six-month period. Most notable was made-for-TV movie database provider, RHI Entertainment, Inc., whose shares sunk more than 80% on worries of potential bankruptcy due to slower than expected cash flow generation. |
Describe recent portfolio activity.
| | • | | During the six months, we increased our weighting in the health care sector as we continue to find a number of high conviction names with good risk/reward in the space, including HealthSouth Corp. and PerkinElmer, Inc. among others. Meanwhile, we decreased our overall weighting in the consumer discretionary sector, eliminating positions in DreamWorks Animation SKG, Inc. - Class A and lululemon athletica, inc. |
Describe Fund positioning at period end.
| | • | | At period end, the Fund’s most significant overweight relative to the Russell 2000 Growth Index is in the health care sector (by approximately 220 basis points), while its largest underweight is in consumer discretionary (by approximately 450 basis points). |
The views expressed reflect the opinions of BlackRock as of the date of this report and are subject to change based on changes in market, economic or other conditions. These views are not intended to be a forecast of future events and are no guarantee of future results.
Portfolio Information
| | | |
Ten Largest Holdings | | Percent of
Long-Term
Investments | |
TiVo, Inc. | | 4 | % |
Scientific Games Corp. - Class A | | 2 | |
CKX, Inc. | | 2 | |
SonicWALL, Inc. | | 2 | |
BE Aerospace, Inc. | | 2 | |
Atlas Air Worldwide Holdings, Inc. | | 2 | |
Dollar Financial Corp. | | 2 | |
Heckmann Corp. | | 2 | |
Lincare Holdings, Inc. | | 2 | |
ExlService Holdings, Inc. | | 2 | |
| | | |
Sector Allocation | | Percent of
Long-Term
Investments | |
Health Care | | 27 | % |
Information Technology | | 25 | |
Industrials | | 16 | |
Consumer Discretionary | | 13 | |
Energy | | 5 | |
Financials | | 5 | |
Consumer Staples | | 5 | |
Materials | | 3 | |
Telecommunication Services | | 1 | |
For Fund compliance purposes, the Fund’s sector classifications refer to any one or more of the sector sub-classifications used by one or more widely recognized market indexes or ratings group indexes, and/or as defined by Fund management. This definition may not apply for purposes of this report, which may combine sector sub-classifications for reporting ease.
| | | | | | |
| 6 | | BLACKROCK FUNDS | | MARCH 31, 2010 | | |
| | |
| | BlackRock Small Cap Growth Equity Portfolio |
| |
Total Return Based on a $10,000 Investment | | |
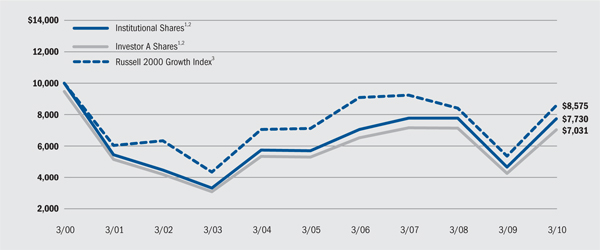
| 1 | Assuming maximum sales charge, if any, transaction costs and other operating expenses, including advisory fees. Institutional Shares do not have a sales charge. |
| 2 | The Fund normally invests at least 80% of its net assets in equity securities issued by US small capitalization companies (market capitalizations between approximately $52.0 million to $2.3 billion as of June 30, 2009), which the portfolio management team believes offer superior prospects for growth. |
| 3 | An index that contains those securities with greater-than-average growth orientations, generally having higher price-to-book and price-to-earnings ratios. |
Performance Summary for the Period Ended March 31, 2010
| | | | | | | | | | | | | | | | | | | | | |
| | | | | | Average Annual Total Returns4 | |
| | | | | | 1 Year | | | 5 Years | | | 10 Years | |
| | | 6-Month
Total Returns | | | w/o sales
charge | | | w/sales
charge | | | w/o sales
charge | | | w/sales
charge | | | w/o sales
charge | | | w/sales
charge | |
Institutional | | 15.86 | % | | 66.44 | % | | N/A | | | 6.33 | % | | N/A | | | (2.54 | )% | | N/A | |
Service | | 15.73 | | | 65.99 | | | N/A | | | 6.06 | | | N/A | | | (2.78 | ) | | N/A | |
Investor A | | 15.64 | | | 65.72 | | | 57.05 | % | | 5.94 | | | 4.81 | % | | (2.94 | ) | | (3.46 | )% |
Investor B | | 15.07 | | | 64.22 | | | 59.72 | | | 5.02 | | | 4.69 | | | (3.54 | ) | | (3.54 | ) |
Investor C | | 15.08 | | | 64.13 | | | 63.13 | | | 4.99 | | | 4.99 | | | (3.71 | ) | | (3.71 | ) |
Russell 2000 Growth Index | | 12.07 | | | 60.32 | | | N/A | | | 3.82 | | | N/A | | | (1.53 | ) | | N/A | |
| 4 | Assuming maximum sales charges, if any. Average annual total returns with and without sales charges reflect reductions for distribution and service fees. See “About Fund Performance” on page 8 for a detailed description of share classes, including any related sales charges and fees. |
N/A - Not applicable as share class and index do not have a sales charge.
Past performance is not indicative of future results.
Expense Example
| | | | | | | | | | | | | | | | | | |
| | | Actual | | Hypothetical6 |
| | | Beginning
Account Value
October 1, 2009 | | Ending
Account Value
March 31, 2010 | | Expenses Paid
During the Period5 | | Beginning
Account Value
October 1, 2009 | | Ending
Account Value
March 31, 2010 | | Expenses Paid
During the Period5 |
Institutional | | $ | 1,000 | | $ | 1,158.60 | | $ | 4.36 | | $ | 1,000 | | $ | 1,020.89 | | $ | 4.08 |
Service | | $ | 1,000 | | $ | 1,157.30 | | $ | 5.75 | | $ | 1,000 | | $ | 1,019.60 | | $ | 5.39 |
Investor A | | $ | 1,000 | | $ | 1,156.40 | | $ | 6.51 | | $ | 1,000 | | $ | 1,018.90 | | $ | 6.09 |
Investor B | | $ | 1,000 | | $ | 1,150.70 | | $ | 11.90 | | $ | 1,000 | | $ | 1,013.86 | | $ | 11.15 |
Investor C | | $ | 1,000 | | $ | 1,150.80 | | $ | 11.85 | | $ | 1,000 | | $ | 1,013.91 | | $ | 11.10 |
| 5 | For each class of the Fund, expenses are equal to the annualized expense ratio for the class (0.81% for Institutional, 1.07% for Service, 1.21% for Investor A, 2.22% for Investor B and 2.21% for Investor C), multiplied by the average account value over the period, multiplied by 182/365 (to reflect the one-half year period shown). |
| 6 | Hypothetical 5% annual return before expenses is calculated by pro rating the number of days in the most recent fiscal half-year divided by 365. |
See “Disclosure of Expenses” on page 8 for further information on how expenses were calculated.
| | | | | | |
| | | BLACKROCK FUNDS | | MARCH 31, 2010 | | 7 |
About Fund Performance
| | • | | Institutional Shares are not subject to any sales charge. Institutional Shares bear no ongoing distribution or service fees and are available only to eligible investors. |
| | • | | Service Shares are not subject to any sales charge (front-end load) or deferred sales charge. Service Shares are subject to a service fee of 0.25% per year (but no distribution fee). |
| | • | | Investor A Shares incur a maximum initial sales charge (front-end load) of 5.25% and a service fee of 0.25% per year (but no distribution fee). |
| | • | | Investor B Shares are subject to a maximum contingent deferred sales charge of 4.50% declining to 0% after six years. In addition, Investor B Shares are subject to a distribution fee of 0.75% per year and a service fee of 0.25% per year. Investor B Shares automatically convert to Investor A Shares after approximately eight years. (There is no initial sales charge for automatic share conversions.) All returns for periods greater than eight years reflect this conversion. Investor B Shares are only available for purchase through exchanges, dividend reinvestment or for purchase by certain qualified employee benefit plans. |
| | • | | Investor C Shares are subject to a 1.00% contingent deferred sales charge if redeemed within one year of purchase. In addition, Investor C Shares are subject to a distribution fee of 0.75% per year and a service fee of 0.25% per year. |
Performance information reflects past performance and does not guarantee future results. Current performance may be lower or higher than the performance data quoted. Refer to www.blackrock.com/funds to obtain performance data current to the most recent month-end. Performance results do not reflect the deduction of taxes that a shareholder would pay on fund distributions or the redemption of fund shares. Each Fund may charge a 2% redemption fee for sales or exchanges of shares within 30 days of purchase or exchange. Performance data does not reflect this potential fee. Figures shown in each of the performance tables on the previous pages assume reinvestment of all dividends and distributions, if any, at net asset value on the payable date. Investment return and principal value of shares will fluctuate so that shares, when redeemed, may be worth more or less than their original cost.
The Funds’ investment advisor waived or reimbursed a portion of each Fund’s expenses. Without such waiver and reimbursement, a Fund’s performance would have been lower. BlackRock Advisors, LLC is under no obligation to waive or continue waiving its fees after February 1, 2011. Dividends paid to each class of shares will vary because of the different levels of service, distribution and transfer agency fees applicable to each class, which are deducted from the income available to be paid to shareholders.
Disclosure of Expenses
Shareholders of these Funds may incur the following charges: (a) expenses related to transactions, including sales charges, redemption fees and exchange fees; and (b) operating expenses including advisory fees, service and distribution fees, including 12b-1 fees, and other Fund expenses. The expense examples on the previous pages (which are based on a hypothetical investment of $1,000 invested on October 1, 2009 and held through March 31, 2010) are intended to assist shareholders both in calculating expenses based on an investment in each Fund and in comparing these expenses with similar costs of investing in other mutual funds.
The tables provide information about actual account values and actual expenses. In order to estimate the expenses a shareholder paid during the period covered by this report, shareholders can divide their account value by $1,000 and then multiply the result by the number corresponding to their Fund and share class under the headings entitled “Expenses Paid During the Period.”
The tables also provide information about hypothetical account values and hypothetical expenses based on a Fund’s actual expense ratio and an assumed rate of return of 5% per year before expenses. In order to assist shareholders in comparing the ongoing expenses of investing in these Funds and other funds, compare the 5% hypothetical example with the 5% hypothetical examples that appear in other funds’ shareholder reports.
The expenses shown in the tables are intended to highlight shareholders’ ongoing costs only and do not reflect any transactional expenses, such as sales charges, redemption fees or exchange fees. Therefore, the hypothetical examples are useful in comparing ongoing expenses only, and will not help shareholders determine the relative total expenses of owning different funds. If these transactional expenses were included, shareholder expenses would have been higher.
| | | | | | |
| 8 | | BLACKROCK FUNDS | | MARCH 31, 2010 | | |
| | |
| Schedule of Investments March 31, 2010 (Unaudited) | | BlackRock Small Cap Core Equity Portfolio |
| | (Percentages shown are based on Net Assets) |
| | | | | |
| | | Shares | | Value |
Common Stocks | | | | | |
Air Freight & Logistics — 1.1% | | | | | |
Forward Air Corp. | | 35,900 | | $ | 944,170 |
| | | | | |
Auto Components — 2.8% | | | | | |
ArvinMeritor, Inc.(a) | | 97,200 | | | 1,297,620 |
Modine Manufacturing Co.(a) | | 95,000 | | | 1,067,800 |
| | | | | |
| | | | | 2,365,420 |
| | | | | |
Biotechnology — 0.5% | | | | | |
Cepheid, Inc.(a) | | 22,400 | | | 391,552 |
| | | | | |
Building Products — 1.9% | | | | | |
Ameron International Corp. | | 14,700 | | | 924,483 |
Simpson Manufacturing Co., Inc. | | 23,200 | | | 644,032 |
| | | | | |
| | | | | 1,568,515 |
| | | | | |
Capital Markets — 3.1% | | | | | |
Evercore Partners, Inc. - Class A | | 25,500 | | | 765,000 |
KBW, Inc.(a) | | 45,400 | | | 1,221,260 |
TradeStation Group, Inc.(a) | | 82,300 | | | 576,923 |
| | | | | |
| | | | | 2,563,183 |
| | | | | |
Chemicals — 2.7% | | | | | |
Cytec Industries, Inc. | | 15,900 | | | 743,166 |
Solutia, Inc.(a) | | 53,800 | | | 866,718 |
Spartech Corp.(a) | | 55,000 | | | 643,500 |
| | | | | |
| | | | | 2,253,384 |
| | | | | |
Commercial Banks — 6.9% | | | | | |
Boston Private Financial Holdings, Inc. | | 56,800 | | | 418,616 |
CoBiz Financial, Inc. | | 80,961 | | | 504,387 |
Columbia Banking System, Inc. | | 49,347 | | | 1,002,238 |
CVB Financial Corp.(b) | | 108,000 | | | 1,072,440 |
First Interstate BancSystem, Inc. | | 23,800 | | | 386,750 |
Independent Bank Corp. | | 20,700 | | | 510,462 |
PacWest Bancorp | | 45,000 | | | 1,026,900 |
Wintrust Financial Corp. | | 22,500 | | | 837,225 |
| | | | | |
| | | | | 5,759,018 |
| | | | | |
Commercial Services & Supplies — 2.3% | | | | | |
Clean Harbors, Inc.(a) | | 15,400 | | | 855,624 |
The GEO Group, Inc.(a) | | 53,780 | | | 1,065,919 |
| | | | | |
| | | | | 1,921,543 |
| | | | | |
Communications Equipment — 2.3% | | | | | |
ADTRAN, Inc. | | 26,100 | | | 687,735 |
Arris Group, Inc.(a) | | 68,800 | | | 826,288 |
Ciena Corp.(a) | | 28,600 | | | 435,864 |
| | | | | |
| | | | | 1,949,887 |
| | | | | |
Construction & Engineering — 1.0% | | | | | |
Tutor Perini Corp.(a) | | 37,400 | | | 813,450 |
| | | | | |
Diversified Financial Services — 1.4% | | | | | |
PHH Corp.(a) | | 49,600 | | | 1,169,072 |
| | | | | |
Diversified Telecommunication Services — 1.5% | | | | | |
Neutral Tandem, Inc.(a) | | 41,100 | | | 656,778 |
Premiere Global Services, Inc.(a) | | 74,900 | | | 618,674 |
| | | | | |
| | | | | 1,275,452 |
| | | | | |
Electrical Equipment — 1.6% | | | | | |
Generac Holdings, Inc.(a) | | 25,700 | | | 360,057 |
GrafTech International Ltd.(a) | | 72,400 | | | 989,708 |
| | | | | |
| | | | | 1,349,765 |
| | | | | |
Electronic Equipment, Instruments & Components — 4.9% | | | | | |
Anixter International, Inc.(a) | | 17,900 | | | 838,615 |
Insight Enterprises, Inc.(a) | | 63,600 | | | 913,296 |
Scansource, Inc.(a) | | 18,800 | | | 541,064 |
SYNNEX Corp.(a) | | 32,000 | | | 945,920 |
TTM Technologies, Inc.(a) | | 90,900 | | | 807,192 |
| | | | | |
| | | | | 4,046,087 |
| | | | | |
Energy Equipment & Services — 1.9% | | | | | |
Key Energy Services, Inc.(a) | | 107,400 | | | 1,025,670 |
Oil States International, Inc.(a) | | 12,300 | | | 557,682 |
| | | | | |
| | | | | 1,583,352 |
| | | | | |
Food Products — 1.9% | | | | | |
Fresh Del Monte Produce, Inc.(a) | | 16,700 | | | 338,175 |
TreeHouse Foods, Inc.(a) | | 28,900 | | | 1,267,843 |
| | | | | |
| | | | | 1,606,018 |
| | | | | |
Health Care Equipment & Supplies — 2.8% | | | | | |
Arthrocare Corp.(a) | | 13,800 | | | 410,136 |
ev3, Inc.(a) | | 48,100 | | | 762,866 |
Meridian Bioscience, Inc. | | 25,500 | | | 519,435 |
Orthofix International NV(a) | | 11,200 | | | 407,456 |
Symmetry Medical, Inc.(a) | | 22,400 | | | 224,896 |
| | | | | |
| | | | | 2,324,789 |
| | | | | |
Health Care Providers & Services — 3.5% | | | | | |
Alliance HealthCare Services, Inc.(a) | | 117,600 | | | 660,912 |
Amedisys, Inc.(a)(b) | | 12,500 | | | 690,250 |
Genoptix, Inc.(a) | | 17,400 | | | 617,526 |
Health Management Associates, Inc. - Class A(a) | | 60,700 | | | 522,020 |
Psychiatric Solutions, Inc.(a) | | 13,800 | | | 411,240 |
| | | | | |
| | | | | 2,901,948 |
| | | | | |
Health Care Technology — 2.2% | | | | | |
Phase Forward, Inc.(a) | | 63,100 | | | 824,717 |
Quality Systems, Inc.(b) | | 15,800 | | | 970,752 |
| | | | | |
| | | | | 1,795,469 |
| | | | | |
Hotels, Restaurants & Leisure — 3.2% | | | | | |
Bally Technologies, Inc.(a) | | 13,000 | | | 527,020 |
Papa John’s International, Inc.(a) | | 35,500 | | | 912,705 |
Penn National Gaming, Inc.(a) | | 19,800 | | | 550,440 |
Vail Resorts, Inc. (a)(b) | | 17,400 | | | 697,566 |
| | | | | |
| | | | | 2,687,731 |
| | | | | |
Household Durables — 0.3% | | | | | |
MDC Holdings, Inc. | | 6,600 | | | 228,426 |
| | | | | |
Portfolio Abbreviation
| ADR | American Depositary Receipts |
See Notes to Financial Statements.
| | | | | | |
| | | BLACKROCK FUNDS | | MARCH 31, 2010 | | 9 |
| | |
| Schedule of Investments (continued) | | BlackRock Small Cap Core Equity Portfolio |
| | (Percentages shown are based on Net Assets) |
| | | | | | |
| | | Shares | | Value | |
Common Stocks | | | | | | |
Insurance — 0.7% | | | | | | |
Flagstone Reinsurance Holdings Ltd. | | 45,600 | | $ | 522,576 | |
Primerica, Inc.(a) | | 3,600 | | | 54,000 | |
| | | | | | |
| | | | | 576,576 | |
| | | | | | |
Internet & Catalog Retail — 1.0% | | | | | | |
Orbitz Worldwide, Inc.(a) | | 117,900 | | | 838,269 | |
| | | | | | |
Internet Software & Services — 2.7% | | | | | | |
comScore, Inc.(a) | | 43,000 | | | 717,670 | |
Constant Contact, Inc.(a) | | 20,200 | | | 469,044 | |
LogMeIn, Inc.(a) | | 33,400 | | | 691,046 | |
LoopNet, Inc.(a) | | 36,400 | | | 409,136 | |
| | | | | | |
| | | | | 2,286,896 | |
| | | | | | |
IT Services — 1.1% | | | | | | |
NCI, Inc. - Class A(a) | | 29,689 | | | 897,498 | |
| | | | | | |
Life Sciences Tools & Services — 0.8% | | | | | | |
ICON Plc - ADR(a) | | 25,500 | | | 673,200 | |
| | | | | | |
Machinery — 3.6% | | | | | | |
Actuant Corp. - Class A | | 64,700 | | | 1,264,885 | |
Nordson Corp. | | 13,400 | | | 910,128 | |
Snap-On, Inc. | | 19,200 | | | 832,128 | |
| | | | | | |
| | | | | 3,007,141 | |
| | | | | | |
Media — 3.3% | | | | | | |
Arbitron, Inc. | | 55,200 | | | 1,471,632 | |
Ascent Media Corp. - Class A(a) | | 38,100 | | | 1,038,225 | |
Martha Stewart Living Omnimedia, Inc. - Class A(a) | | 50,100 | | | 279,558 | |
| | | | | | |
| | | | | 2,789,415 | |
| | | | | | |
Metals & Mining — 2.3% | | | | | | |
Horsehead Holding Corp.(a) | | 100,900 | | | 1,194,656 | |
Olympic Steel, Inc. | | 22,600 | | | 737,890 | |
| | | | | | |
| | | | | 1,932,546 | |
| | | | | | |
Multiline Retail — 1.5% | | | | | | |
Saks, Inc.(a)(b) | | 144,500 | | | 1,242,700 | |
| | | | | | |
Oil, Gas & Consumable Fuels — 3.9% | | | | | | |
Arena Resources, Inc.(a) | | 24,100 | | | 804,940 | |
Brigham Exploration Co.(a) | | 35,100 | | | 559,845 | |
James River Coal Co.(a) | | 46,400 | | | 737,760 | |
Penn Virginia Corp. | | 24,700 | | | 605,150 | |
Petroleum Development Corp.(a) | | 24,600 | | | 569,982 | |
| | | | | | |
| | | | | 3,277,677 | |
| | | | | | |
Paper & Forest Products — 0.5% | | | | | | |
Buckeye Technologies, Inc.(a) | | 34,100 | | | 446,028 | |
| | | | | | |
Pharmaceuticals — 1.0% | | | | | | |
Impax Laboratories, Inc.(a) | | 44,200 | | | 790,296 | |
| | | | | | |
Professional Services — 2.1% | | | | | | |
ICF International, Inc.(a) | | 3,500 | | | 86,940 | |
Mistras Group, Inc.(a) | | 37,900 | | | 378,621 | |
SFN Group, Inc.(a) | | 25,200 | | | 201,852 | |
TrueBlue, Inc.(a) | | 67,300 | | | 1,043,150 | |
| | | | | | |
| | | | | 1,710,563 | |
| | | | | | |
Real Estate Investment Trusts (REITs) — 5.1% | | | | | | |
DCT Industrial Trust, Inc. | | 153,800 | | | 804,374 | |
MFA Financial, Inc. | | 137,500 | | | 1,012,000 | |
Ramco-Gershenson Properties Trust | | 84,000 | | | 945,840 | |
Redwood Trust, Inc. | | 63,300 | | | 976,086 | |
U-Store-It Trust | | 72,700 | | | 523,440 | |
| | | | | | |
| | | | | 4,261,740 | |
| | | | | | |
Road & Rail — 1.6% | | | | | | |
Heartland Express, Inc. | | 25,000 | | | 412,500 | |
Landstar System, Inc. | | 22,400 | | | 940,352 | |
| | | | | | |
| | | | | 1,352,852 | |
| | | | | | |
Semiconductors & Semiconductor Equipment — 3.2% | | | | | | |
ATMI, Inc.(a) | | 53,700 | | | 1,036,947 | |
Fairchild Semiconductor International, Inc.(a) | | 56,900 | | | 605,985 | |
Teradyne, Inc.(a) | | 89,500 | | | 999,715 | |
| | | | | | |
| | | | | 2,642,647 | |
| | | | | | |
Software — 3.5% | | | | | | |
Blackboard, Inc.(a) | | 18,670 | | | 777,792 | |
Lawson Software, Inc.(a) | | 120,950 | | | 799,480 | |
Progress Software Corp.(a) | | 23,200 | | | 729,176 | |
Take-Two Interactive Software, Inc.(a) | | 64,500 | | | 635,325 | |
| | | | | | |
| | | | | 2,941,773 | |
| | | | | | |
Specialty Retail — 5.7% | | | | | | |
Aaron’s, Inc.(b) | | 31,900 | | | 1,063,547 | |
Gymboree Corp.(a) | | 16,000 | | | 826,080 | |
hhgregg, Inc.(a) | | 19,000 | | | 479,560 | |
HOT Topic, Inc.(a) | | 26,200 | | | 170,300 | |
JoS. A. Bank Clothiers, Inc.(a) | | 21,200 | | | 1,158,580 | |
Sally Beauty Holdings, Inc.(a)(b) | | 117,750 | | | 1,050,330 | |
| | | | | | |
| | | | | 4,748,397 | |
| | | | | | |
Textiles, Apparel & Luxury Goods — 1.5% | | | | | | |
Iconix Brand Group, Inc.(a) | | 61,600 | | | 946,176 | |
Movado Group, Inc.(a) | | 27,100 | | | 305,688 | |
| | | | | | |
| | | | | 1,251,864 | |
| | | | | | |
Trading Companies & Distributors — 3.4% | | | | | | |
Beacon Roofing Supply, Inc.(a) | | 42,300 | | | 809,199 | |
Kaman Corp. | | 49,800 | | | 1,245,498 | |
Rush Enterprises, Inc. - Class A(a) | | 59,900 | | | 791,279 | |
| | | | | | |
| | | | | 2,845,976 | |
| | | | | | |
Total Long-Term Investments
(Cost — $69,844,642) — 98.3% | | | | | 82,012,285 | |
| | | | | | |
| | |
| | | Shares/ | | | |
| | | Beneficial | | | |
| | | Interest | | | |
Short-Term Securities | | | | | | |
BlackRock Liquidity Funds, TempFund, Institutional Class, 0.11%(c)(d) | | 1,739,043 | | | 1,739,043 | |
BlackRock Liquidity Series, LLC Money Market Series, 0.22%(c)(d)(e) | | 4,924,250 | | | 4,924,250 | |
| | | | | | |
Total Short-Term Securities
(Cost — $6,663,293) — 8.0% | | | | | 6,663,293 | |
| | | | | | |
Total Investments (Cost — $76,507,935*) — 106.3% | | | | | 88,675,578 | |
Liabilities in Excess of Other Assets — (6.3)% | | | | | (5,233,344 | ) |
| | | | | | |
Net Assets — 100.0% | | | | $ | 83,442,234 | |
| | | | | | |
See Notes to Financial Statements.
| | | | | | |
| 10 | | BLACKROCK FUNDS | | MARCH 31, 2010 | | |
| | |
| Schedule of Investments (concluded) | | BlackRock Small Cap Core Equity Portfolio |
| | |
| * | The cost and unrealized appreciation (depreciation) of investments as of March 31, 2010, as computed for federal income tax purposes, were as follows: |
| | | | |
Aggregate cost | | $ | 77,999,064 | |
| | | | |
Gross unrealized appreciation | | $ | 11,860,063 | |
Gross unrealized depreciation | | | (1,183,549 | ) |
| | | | |
Net unrealized appreciation | | $ | 10,676,514 | |
| | | | |
| (a) | Non-income producing security. |
| (b) | Security, or a portion of security, is on loan. |
| (c) | Investments in companies considered to be an affiliate of the Fund, for purposes of Section 2(a)(3) of the Investment Company Act of 1940, were as follows: |
| | | | | | | | | | |
Affiliate | | Net
Activity | | | Realized
Gain | | Income |
BlackRock Liquidity Funds, TempFund, Institutional Class | | $ | 871,629 | | | $ | 15 | | $ | 829 |
BlackRock Liquidity Series, LLC Money Market Series | | $ | (366,250 | ) | | | — | | $ | 34,459 |
| (d) | Represents the current yield as of report date. |
| (e) | Security was purchased with the cash collateral from loaned securities. |
| • | | For Fund compliance purposes, the Fund’s industry classifications refer to any one or more of the industry sub-classifications used by one or more widely recognized market indexes or ratings group indexes, and/or as defined by Fund management. This definition may not apply for purposes of this report, which may combine industry sub-classifications for reporting ease. |
| • | | Fair Value Measurements – Various inputs are used in determining the fair value of investments, which are as follows: |
| | • | | Level 1 – price quotations in active markets/exchanges for identical assets and liabilities |
| | • | | Level 2 – other observable inputs (including, but not limited to: quoted prices for similar assets or liabilities in markets that are active, quoted prices for identical or similar assets or liabilities in markets that are not active, inputs other than quoted prices that are observable for the assets or liabilities (such as interest rates, yield curves, volatilities, prepayment speeds, loss severities, credit risks and default rates) or other market–corroborated inputs) |
| | • | | Level 3 – unobservable inputs based on the best information available in the circumstances, to the extent observable inputs are not available (including the Fund’s own assumptions used in determining the fair value of investments) |
The inputs or methodologies used for valuing securities are not necessarily an indication of the risk associated with investing in those securities. For information about the Fund’s policy regarding valuation of investments and other significant accounting policies, please refer to Note 1 of the Notes to Financial Statements.
The following table summarizes the inputs used as of March 31, 2010 in determining the fair valuation of the Fund’s investments:
| | | |
Valuation Inputs | | Investments
in Securities |
| | | Assets |
Level 1: | | | |
Long-Term Investments1 | | $ | 82,012,285 |
Short-Term Securities | | | 1,739,043 |
| | | |
Total Level 1 | | | 83,751,328 |
| | | |
Level 2 - Short-Term Securities | | | 4,924,250 |
Level 3 | | | — |
| | | |
Total | | $ | 88,675,578 |
| | | |
| 1 | See above Schedule of Investments for values in each industry. |
See Notes to Financial Statements.
| | | | | | |
| | | BLACKROCK FUNDS | | MARCH 31, 2010 | | 11 |
| | |
| Schedule of Investments March 31, 2010 (Unaudited) | | BlackRock Small Cap Growth Equity Portfolio |
| | (Percentages shown are based on Net Assets) |
| | | | | |
| | | Shares | | Value |
Common Stocks | | | | | |
Aerospace & Defense — 4.2% | | | | | |
Argon ST, Inc.(a) | | 541,613 | | $ | 14,412,322 |
BE Aerospace, Inc.(a) | | 936,460 | | | 28,515,207 |
Orbital Sciences Corp.(a) | | 698,056 | | | 13,270,044 |
| | | | | |
| | | | | 56,197,573 |
| | | | | |
Air Freight & Logistics — 3.6% | | | | | |
Atlas Air Worldwide Holdings, Inc.(a) | | 533,836 | | | 28,320,000 |
Forward Air Corp. | | 760,481 | | | 20,000,650 |
| | | | | |
| | | | | 48,320,650 |
| | | | | |
Beverages — 2.0% | | | | | |
Heckmann Corp.(a)(b) | | 4,682,007 | | | 27,155,641 |
| | | | | |
Biotechnology — 7.0% | | | | | |
Allos Therapeutics, Inc.(a) | | 345,800 | | | 2,569,294 |
Amylin Pharmaceuticals, Inc.(a)(b) | | 679,400 | | | 15,279,706 |
BioMarin Pharmaceutical, Inc.(a) | | 224,700 | | | 5,251,239 |
Cubist Pharmaceuticals, Inc.(a) | | 776,300 | | | 17,497,802 |
Dendreon Corp.(a)(b) | | 465,700 | | | 16,984,079 |
Incyte Corp. Ltd.(a)(b) | | 264,100 | | | 3,686,836 |
InterMune, Inc.(a) | | 138,100 | | | 6,155,117 |
Onyx Pharmaceuticals, Inc.(a) | | 607,300 | | | 18,389,044 |
Vanda Pharmaceuticals, Inc.(a) | | 658,518 | | | 7,599,298 |
| | | | | |
| | | | | 93,412,415 |
| | | | | |
Capital Markets — 1.8% | | | | | |
Financial Engines, Inc.(a) | | 134,300 | | | 2,269,670 |
Greenhill & Co., Inc.(b) | | 70,100 | | | 5,754,509 |
MF Global Holdings Ltd.(a) | | 167,800 | | | 1,354,146 |
SWS Group, Inc. | | 1,232,795 | | | 14,214,126 |
| | | | | |
| | | | | 23,592,451 |
| | | | | |
Chemicals — 1.3% | | | | | |
Georgia Gulf Corp.(a) | | 191,100 | | | 3,533,439 |
Intrepid Potash, Inc.(a)(b) | | 444,400 | | | 13,478,652 |
| | | | | |
| | | | | 17,012,091 |
| | | | | |
Commercial Services & Supplies — 2.4% | | | | | |
Clean Harbors, Inc.(a) | | 178,695 | | | 9,928,294 |
SYKES Enterprises, Inc.(a) | | 967,897 | | | 22,106,768 |
| | | | | |
| | | | | 32,035,062 |
| | | | | |
Communications Equipment — 0.3% | | | | | |
Calix, Inc.(a) | | 169,000 | | | 2,273,050 |
Meru Networks, Inc.(a) | | 78,600 | | | 1,506,762 |
| | | | | |
| | | | | 3,779,812 |
| | | | | |
Construction & Engineering — 0.9% | | | | | |
Chicago Bridge & Iron Co. NV(a) | | 525,000 | | | 12,211,500 |
| | | | | |
Consumer Finance — 2.1% | | | | | |
Dollar Financial Corp.(a) | | 1,154,893 | | | 27,786,726 |
| | | | | |
Containers & Packaging — 0.8% | | | | | |
BWAY Holding Co.(a) | | 497,900 | | | 10,007,790 |
| | | | | |
Diversified Consumer Services — 1.4% | | | | | |
Grand Canyon Education, Inc.(a) | | 709,600 | | | 18,548,944 |
| | | | | |
Diversified Telecommunication Services — 1.0% | | | | | |
Cbeyond, Inc.(a) | | 966,146 | | | 13,216,877 |
| | | | | |
Electrical Equipment — 0.3% | | | | | |
GT Solar International, Inc.(a)(b) | | 809,500 | | | 4,233,685 |
| | | | | |
Electronic Equipment, Instruments & Components — 1.2% | | | |
Cogent, Inc.(a) | | 1,521,025 | | | 15,514,455 |
| | | | | |
Energy Equipment & Services — 0.9% | | | | | |
Superior Energy Services, Inc.(a) | | 559,977 | | | 11,770,717 |
| | | | | |
Food Products — 2.5% | | | | | |
American Italian Pasta Co. - Class A(a) | | 453,900 | | | 17,643,093 |
Diamond Foods, Inc.(b) | | 384,000 | | | 16,143,360 |
| | | | | |
| | | | | 33,786,453 |
| | | | | |
Health Care Equipment & Supplies — 5.7% | | | |
Gen-Probe, Inc.(a) | | 341,400 | | | 17,070,000 |
Haemonetics Corp.(a) | | 92,900 | | | 5,309,235 |
Inverness Medical Innovations, Inc.(a)(b) | | 460,400 | | | 17,932,580 |
Merit Medical Systems, Inc.(a) | | 88,800 | | | 1,354,200 |
Sirona Dental Systems, Inc.(a) | | 401,248 | | | 15,259,461 |
SonoSite, Inc.(a)(b) | | 568,872 | | | 18,266,480 |
| | | | | |
| | | | | 75,191,956 |
| | | | | |
Health Care Providers & Services — 6.5% | | | |
Emergency Medical Services Corp. - Class A(a) | | 299,004 | | | 16,908,676 |
HealthSouth Corp.(a) | | 1,264,500 | | | 23,646,150 |
Lincare Holdings, Inc.(a) | | 604,383 | | | 27,124,709 |
Magellan Health Services, Inc.(a) | | 152,700 | | | 6,639,396 |
MEDNAX, Inc.(a) | | 211,407 | | | 12,301,774 |
| | | | | |
| | | | | 86,620,705 |
| | | | | |
Health Care Technology — 1.8% | | | |
MedAssets, Inc.(a) | | 658,055 | | | 13,819,155 |
Phase Forward, Inc.(a) | | 724,900 | | | 9,474,443 |
| | | | | |
| | | | | 23,293,598 |
| | | | | |
Hotels, Restaurants & Leisure — 4.1% | | | |
Bally Technologies, Inc.(a) | | 163,000 | | | 6,608,020 |
The Cheesecake Factory, Inc.(a)(b) | | 292,600 | | | 7,917,756 |
Jack in the Box, Inc.(a) | | 399,100 | | | 9,398,805 |
Scientific Games Corp. - Class A(a) | | 2,120,800 | | | 29,860,864 |
| | | | | |
| | | | | 53,785,445 |
| | | | | |
Insurance — 0.8% | | | |
Aspen Insurance Holdings Ltd. | | 365,300 | | | 10,535,252 |
Primerica, Inc.(a) | | 26,100 | | | 391,500 |
| | | | | |
| | | | | 10,926,752 |
| | | | | |
Internet & Catalog Retail — 0.9% | | | |
Shutterfly, Inc.(a) | | 481,400 | | | 11,596,926 |
| | | | | |
Internet Software & Services — 2.0% | | | | | |
Constant Contact, Inc.(a)(b) | | 446,591 | | | 10,369,843 |
GSI Commerce, Inc.(a)(b) | | 561,000 | | | 15,522,870 |
| | | | | |
| | | | | 25,892,713 |
| | | | | |
IT Services — 6.5% | | | |
ExlService Holdings, Inc.(a) | | 1,565,580 | | | 26,113,874 |
Gartner, Inc.(a) | | 911,000 | | | 20,260,640 |
Global Cash Access Holdings, Inc.(a) | | 2,656,727 | | | 21,705,460 |
Sapient Corp. | | 1,905,118 | | | 17,412,778 |
| | | | | |
| | | | | 85,492,752 |
| | | | | |
Life Sciences Tools & Services — 3.4% | | | |
Bruker Corp.(a) | | 618,500 | | | 9,061,025 |
ICON Plc - ADR(a) | | 657,400 | | | 17,355,360 |
See Notes to Financial Statements.
| | | | | | |
| 12 | | BLACKROCK FUNDS | | MARCH 31, 2010 | | |
| | |
| Schedule of Investments (continued) | | BlackRock Small Cap Growth Equity Portfolio |
| | (Percentages shown are based on Net Assets) |
| | | | | |
| | | Shares | | Value |
Common Stocks | | | | | |
Life Sciences Tools & Services (concluded) | | | | | |
PerkinElmer, Inc. | | 808,200 | | $ | 19,315,980 |
| | | | | |
| | | | | 45,732,365 |
| | | | | |
Machinery — 1.3% | | | | | |
The Manitowoc Co., Inc. | | 1,285,900 | | | 16,716,700 |
| | | | | |
Media — 3.8% | | | | | |
CKX, Inc.(a) | | 4,810,246 | | | 29,486,808 |
Live Nation Entertainment, Inc.(a) | | 1,404,819 | | | 20,369,875 |
| | | | | |
| | | | | 49,856,683 |
| | | | | |
Metals & Mining — 1.1% | | | | | |
Century Aluminum Co.(a) | | 1,027,800 | | | 14,142,528 |
| | | | | |
Oil, Gas & Consumable Fuels — 4.6% | | | | | |
Comstock Resources, Inc.(a) | | 398,310 | | | 12,666,258 |
Energy XXI Bermuda Ltd.(a) | | 267,800 | | | 4,796,298 |
EXCO Resources, Inc. | | 225,092 | | | 4,137,191 |
Massey Energy Co. | | 368,752 | | | 19,282,042 |
Plains Exploration & Production Co.(a) | | 656,200 | | | 19,679,438 |
| | | | | |
| | | | | 60,561,227 |
| | | | | |
Pharmaceuticals — 2.3% | | | | | |
Akorn, Inc.(a) | | 3,875,320 | | | 5,929,239 |
Auxilium Pharmaceuticals, Inc.(a)(b) | | 422,848 | | | 13,175,944 |
Cypress Bioscience, Inc.(a) | | 1,337,798 | | | 6,555,210 |
Depomed, Inc.(a) | | 1,466,865 | | | 5,207,371 |
| | | | | |
| | | | | 30,867,764 |
| | | | | |
Professional Services — 2.8% | | | | | |
The Corporate Executive Board Co. | | 86,600 | | | 2,302,694 |
Diamond Management & Technology Consultants, Inc. | | 1,773,695 | | | 13,923,506 |
Heidrick & Struggles International, Inc. | | 232,974 | | | 6,530,261 |
Kforce, Inc.(a) | | 516,100 | | | 7,849,881 |
TrueBlue, Inc.(a) | | 446,000 | | | 6,913,000 |
| | | | | |
| | | | | 37,519,342 |
| | | | | |
Semiconductors & Semiconductor Equipment — 4.7% | | | | | |
Entegris, Inc.(a) | | 2,797,900 | | | 14,101,416 |
MaxLinear, Inc.- Class A(a) | | 86,600 | | | 1,537,150 |
Microsemi Corp.(a) | | 818,800 | | | 14,197,992 |
Monolithic Power Systems, Inc.(a) | | 355,107 | | | 7,918,886 |
Netlogic Microsystems, Inc.(a) | | 334,200 | | | 9,835,506 |
Silicon Laboratories, Inc.(a) | | 312,600 | | | 14,901,642 |
| | | | | |
| | | | | 62,492,592 |
| | | | | |
Software — 9.9% | | | | | |
Blackboard, Inc.(a)(b) | | 453,752 | | | 18,903,308 |
DemandTec, Inc.(a) | | 1,333,045 | | | 9,264,663 |
SonicWALL, Inc.(a) | | 3,366,343 | | | 29,253,521 |
Taleo Corp. - Class A(a) | | 838,674 | | | 21,730,043 |
TiVo, Inc.(a) | | 3,063,880 | | | 52,453,626 |
| | | | | |
| | | | | 131,605,161 |
| | | | | |
Specialty Retail — 2.7% | | | | | |
Lumber Liquidators Holdings, Inc.(a) | | 616,300 | | | 16,436,721 |
The Wet Seal, Inc. - Class A (a) | | 3,970,000 | | | 18,897,200 |
| | | | | |
| | | | | 35,333,921 |
| | | | | |
Total Long-Term Investments | | | | | |
(Cost — $1,069,967,174) — 98.6% | | | | | 1,306,211,972 |
| | | | | |
| | | | | | |
| | | Shares/
Beneficial
Interest | | | |
Short-Term Securities | | | | | | |
BlackRock Liquidity Funds, TempFund, Institutional
Class, 0.11%(c)(d) | | 18,561,900 | | $ | 18,561,900 | |
BlackRock Liquidity Series, LLC Money Market
Series, 0.22%(c)(d)(e) | | 120,435,900 | | | 120,435,900 | |
| | | | | | |
Total Short-Term Securities
(Cost — $138,997,800) — 10.5% | | | | | 138,997,800 | |
| | | | | | |
Total Investments (Cost — $1,208,964,974*) — 109.1% | | | 1,445,209,772 | |
Liabilities in Excess of Other Assets — (9.1)% | | | | | (121,067,157 | ) |
| | | | | | |
Net Assets — 100.0% | | | | $ | 1,324,142,615 | |
| | | | | | |
| * | The cost and unrealized appreciation (depreciation) of investments as of March 31, 2010, as computed for federal income tax purposes, were as follows: |
| | | | |
Aggregate cost | | $ | 1,229,725,120 | |
| | | | |
Gross unrealized appreciation | | $ | 242,199,093 | |
Gross unrealized depreciation | | | (26,714,441 | ) |
| | | | |
Net unrealized appreciation | | $ | 215,484,652 | |
| | | | |
| (a) | Non-income producing security. |
| (b) | Security, or a portion of security, is on loan. |
| (c) | Investments in companies considered to be an affiliate of the Fund, for purposes of Section 2(a)(3) of the Investment Company Act of 1940, were as follows: |
| | | | | | | | | |
Affiliate | | Net
Activity | | Realized
Gain | | Income |
BlackRock Liquidity Funds, TempFund,
Institutional Class | | $ | 2,101,806 | | $ | 172 | | $ | 12,151 |
BlackRock Liquidity Series, LLC
Money Market Series | | $ | 36,858,873 | | | — | | $ | 95,743 |
| (d) | Represents the current yield as of report date. |
| (e) | Security was purchased with the cash collateral from loaned securities. |
| • | | For Fund compliance purposes, the Fund’s industry classifications refer to any one or more of the industry sub-classifications used by one or more widely recognized market indexes or ratings group indexes, and/or as defined by Fund management. This definition may not apply for purposes of this report, which may combine industry sub-classifications for reporting ease. |
| • | | Fair Value Measurements – Various inputs are used in determining the fair value of investments, which are as follows: |
| | • | | Level 1 – price quotations in active markets/exchanges for identical assets and liabilities |
| | • | | Level 2 – other observable inputs (including, but not limited to: quoted prices for similar assets or liabilities in markets that are active, quoted prices for identical or similar assets or liabilities in markets that are not active, inputs other than quoted prices that are observable for the assets or liabilities (such as interest rates, yield curves, volatilities, prepayment speeds, loss severities, credit risks and default rates) or other market–corroborated inputs) |
| | • | | Level 3 – unobservable inputs based on the best information available in the circumstances, to the extent observable inputs are not available (including the Fund’s own assumptions used in determining the fair value of investments) |
The inputs or methodologies used for valuing securities are not necessarily an indication of the risk associated with investing in those securities. For information about the Fund’s policy regarding valuation of investments and other significant accounting policies, please refer to Note 1 of the Notes to Financial Statements.
See Notes to Financial Statements.
| | | | | | |
| | | BLACKROCK FUNDS | | MARCH 31, 2010 | | 13 |
| | |
| Schedule of Investments (concluded) | | BlackRock Small Cap Growth Equity Portfolio |
| | |
The following table summarizes the inputs used as of March 31, 2010 in determining the fair valuation of the Fund’s investments:
| | | |
Valuation Inputs | | Investments
in Securities |
| | | Assets |
Level 1: | | | |
Long-Term Investments1 | | $ | 1,306,211,972 |
Short-Term Securities | | | 18,561,900 |
| | | |
Total Level 1 | | | 1,324,773,872 |
| | | |
Level 2 - Short-Term Securities | | | 120,435,900 |
Level 3 | | | — |
| | | |
Total | | $ | 1,445,209,772 |
| | | |
| 1 | See above Schedule of Investments for values in each industry. |
See Notes to Financial Statements.
| | | | | | |
| 14 | | BLACKROCK FUNDS | | MARCH 31, 2010 | | |
Statements of Assets and Liabilities
| | | | | | | | |
March 31, 2010 (Unaudited) | | BlackRock
Small Cap
Core Equity
Portfolio | | | BlackRock
Small Cap
Growth Equity
Portfolio | |
Assets | | | | | | | | |
Investments at value - unaffiliated1,2 | | $ | 82,012,285 | | | $ | 1,306,211,972 | |
Investments at value - affiliated3 | | | 6,663,293 | | | | 138,997,800 | |
Investments sold receivable | | | — | | | | 23,258,652 | |
Capital shares sold receivable | | | 311,534 | | | | 1,935,015 | |
Dividends receivable | | | 63,427 | | | | 110,952 | |
Securities lending income receivable - affiliated | | | 15,671 | | | | 43,165 | |
Receivable from advisor | | | 3,055 | | | | — | |
Dividends receivable - affiliated | | | 143 | | | | 2,094 | |
Prepaid expenses | | | 52,440 | | | | 91,200 | |
| | | | | | | | |
Total assets | | | 89,121,848 | | | | 1,470,650,850 | |
| | | | | | | | |
Liabilities | | | | | | | | |
Collateral at value - securities loaned | | | 4,924,250 | | | | 120,435,900 | |
Capital shares redeemed payable | | | 310,381 | | | | 2,543,265 | |
Investments purchased payable | | | 265,994 | | | | 22,199,340 | |
Investment advisory fees payable | | | 69,561 | | | | 606,049 | |
Other affiliates payable | | | 56,231 | | | | 525,639 | |
Service and distribution fees payable | | | 20,004 | | | | 96,754 | |
Officer’s and Trustees’ fees payable | | | 7,335 | | | | 12,450 | |
Other accrued expenses payable | | | 25,858 | | | | 88,838 | |
| | | | | | | | |
Total liabilities | | | 5,679,614 | | | | 146,508,235 | |
| | | | | | | | |
Net Assets | | $ | 83,442,234 | | | $ | 1,324,142,615 | |
| | | | | | | | |
Net Assets Consist of | | | | | | | | |
Paid-in capital | | $ | 101,501,299 | | | $ | 1,623,060,928 | |
Accumulated net investment loss | | | (310,299 | ) | | | (3,524,450 | ) |
Accumulated net realized loss | | | (29,916,409 | ) | | | (531,638,661 | ) |
Net unrealized appreciation/depreciation | | | 12,167,643 | | | | 236,244,798 | |
| | | | | | | | |
Net Assets | | $ | 83,442,234 | | | $ | 1,324,142,615 | |
| | | | | | | | |
1 Investments at cost - unaffiliated | | $ | 69,844,642 | | | $ | 1,069,967,174 | |
2 Securities loaned | | $ | 4,723,420 | | | $ | 116,558,033 | |
3 Investments at cost - affiliated | | $ | 6,663,293 | | | $ | 138,997,800 | |
See Notes to Financial Statements.
| | | | | | |
| | | BLACKROCK FUNDS | | MARCH 31, 2010 | | 15 |
Statements of Assets and Liabilities (concluded)
| | | | | | |
March 31, 2010 (Unaudited) | | BlackRock
Small Cap
Core Equity
Portfolio | | BlackRock
Small Cap
Growth Equity
Portfolio |
Net Asset Value | | | | | | |
Institutional | | | | | | |
Net assets | | $ | 46,950,194 | | $ | 957,545,030 |
| | | | | | |
Shares outstanding1 | | | 3,064,904 | | | 44,291,652 |
| | | | | | |
Net asset value | | $ | 15.32 | | $ | 21.62 |
| | | | | | |
Service | | | | | | |
Net assets | | $ | 301,233 | | $ | 54,084,335 |
| | | | | | |
Shares outstanding1 | | | 19,932 | | | 2,644,709 |
| | | | | | |
Net asset value | | $ | 15.11 | | $ | 20.45 |
| | | | | | |
Investor A | | | | | | |
Net assets | | $ | 17,265,634 | | $ | 279,498,710 |
| | | | | | |
Shares outstanding1 | | | 1,156,488 | | | 14,100,465 |
| | | | | | |
Net asset value | | $ | 14.93 | | $ | 19.82 |
| | | | | | |
Investor B | | | | | | |
Net assets | | $ | 3,215,601 | | $ | 3,026,517 |
| | | | | | |
Shares outstanding1 | | | 224,763 | | | 175,370 |
| | | | | | |
Net asset value | | $ | 14.31 | | $ | 17.26 |
| | | | | | |
Investor C | | | | | | |
Net assets | | $ | 15,709,572 | | $ | 29,988,023 |
| | | | | | |
Shares outstanding1 | | | 1,100,139 | | | 1,738,055 |
| | | | | | |
Net asset value | | $ | 14.28 | | $ | 17.25 |
| | | | | | |
| 1 | Unlimited number of shares authorized, $0.001 par value. |
See Notes to Financial Statements.
| | | | | | |
| 16 | | BLACKROCK FUNDS | | MARCH 31, 2010 | | |
Statements of Operations
| | | | | | | | |
Six Months Ended March 31, 2010 (Unaudited) | | BlackRock
Small Cap
Core Equity
Portfolio | | | BlackRock
Small Cap
Growth Equity
Portfolio | |
Investment Income | | | | | | | | |
Dividends | | $ | 301,458 | | | $ | 1,666,876 | |
Securities lending - affiliated | | | 34,459 | | | | 95,743 | |
Dividends - affiliated | | | 829 | | | | 12,151 | |
| | | | | | | | |
Total income | | | 336,746 | | | | 1,774,770 | |
| | | | | | | | |
Expenses | | | | | | | | |
Investment advisory | | | 379,683 | | | | 3,245,642 | |
Service and distribution - class specific | | | 116,031 | | | | 516,577 | |
Transfer agent - class specific | | | 90,411 | | | | 1,078,727 | |
Administration | | | 28,476 | | | | 404,390 | |
Professional | | | 24,914 | | | | 32,363 | |
Registration | | | 17,295 | | | | 29,465 | |
Printing | | | 10,360 | | | | 85,018 | |
Administration - class specific | | | 9,484 | | | | 131,214 | |
Custodian | | | 8,208 | | | | 43,298 | |
Officer and Trustees | | | 7,336 | | | | 18,969 | |
Miscellaneous | | | 6,621 | | | | 16,890 | |
Recoupment of past waived fees - class specific | | | — | | | | 15,661 | |
| | | | | | | | |
Total expenses | | | 698,819 | | | | 5,618,214 | |
Less fees waived by advisor | | | (453 | ) | | | (7,213 | ) |
Less administration fees waived - class specific | | | (9,124 | ) | | | — | |
Less transfer agent fees waived - class specific | | | (4,119 | ) | | | — | |
Less transfer agent fees reimbursed - class specific | | | (16,668 | ) | | | — | |
Less fees paid indirectly | | | (107 | ) | | | (428 | ) |
| | | | | | | | |
Total expenses after fees waived, reimbursed and paid indirectly | | | 668,348 | | | | 5,610,573 | |
| | | | | | | | |
Net investment loss | | | (331,602 | ) | | | (3,835,803 | ) |
| | | | | | | | |
Realized and Unrealized Gain | | | | | | | | |
Net realized gain from investments | | | 7,953,712 | | | | 116,412,932 | |
| | | | | | | | |
Net change in unrealized appreciation/depreciation on investments | | | 819,456 | | | | 67,643,562 | |
| | | | | | | | |
Total realized and unrealized gain | | | 8,773,168 | | | | 184,056,494 | |
| | | | | | | | |
Net Increase in Net Assets Resulting from Operations | | $ | 8,441,566 | | | $ | 180,220,691 | |
| | | | | | | | |
See Notes to Financial Statements.
| | | | | | |
| | | BLACKROCK FUNDS | | MARCH 31, 2010 | | 17 |
Statements of Changes in Net Assets
| | | | | | | | | | | | | | | | |
| | | BlackRock
Small Cap Core
Equity Portfolio | | | BlackRock
Small Cap
Growth Equity
Portfolio | |
Increase (Decrease) in Net Assets: | | Six Months Ended
March 31, 2010
(Unaudited) | | | Year Ended
September 30,
2009 | | | Six Months Ended
March 31, 2010
(Unaudited) | | | Year Ended
September 30,
2009 | |
Operations | | | | | | | | | | | | | | | | |
Net investment loss | | $ | (331,602 | ) | | $ | (374,747 | ) | | $ | (3,835,803 | ) | | $ | (5,341,612 | ) |
Net realized gain (loss) | | | 7,953,712 | | | | (26,133,388 | ) | | | 116,412,932 | | | | (193,721,585 | ) |
Net change in unrealized appreciation/depreciation | | | 819,456 | | | | 10,992,529 | | | | 67,643,562 | | | | 168,328,721 | |
| | | | | | | | | | | | | | | | |
Net increase (decrease) in net assets resulting from operations | | | 8,441,566 | | | | (15,515,606 | ) | | | 180,220,691 | | | | (30,734,476 | ) |
| | | | | | | | | | | | | | | | |
Capital Share Transactions | | | | | | | | | | | | | | | | |
Net increase (decrease) in net assets derived from capital share transactions | | | (694,796 | ) | | | (6,516,203 | ) | | | (25,176,422 | ) | | | 218,085,648 | |
| | | | | | | | | | | | | | | | |
Redemption Fees | | | | | | | | | | | | | | | | |
Redemption fees | | | 223 | | | | 14,507 | | | | 188,426 | | | | 91,702 | |
| | | | | | | | | | | | | | | | |
Net Assets | | | | | | | | | | | | | | | | |
Total increase (decrease) in net assets | | | 7,746,993 | | | | (22,017,302 | ) | | | 155,232,695 | | | | 187,442,874 | |
Beginning of period | | | 75,695,241 | | | | 97,712,543 | | | | 1,168,909,920 | | | | 981,467,046 | |
| | | | | | | | | | | | | | | | |
End of period | | $ | 83,442,234 | | | $ | 75,695,241 | | | $ | 1,324,142,615 | | | $ | 1,168,909,920 | |
| | | | | | | | | | | | | | | | |
Undistributed (accumulated) net investment income (loss) | | $ | (310,299 | ) | | $ | 21,303 | | | $ | (3,524,450 | ) | | $ | 311,353 | |
| | | | | | | | | | | | | | | | |
See Notes to Financial Statements.
| | | | | | |
| 18 | | BLACKROCK FUNDS | | MARCH 31, 2010 | | |
| | | | | | | | | | | | |
| Financial Highlights | | BlackRock Small Cap Core Equity Portfolio |
| | | | | | | | | | | | | | | | | | | | | | | | | | | | | | | | | | | | | | | | | | | | | | | | |
| | | Institutional | | | Service | |
| | | Six Months
Ended
March 31, 2010
(Unaudited) | | | Year Ended September 30, | | | Six Months
Ended
March 31, 2010
(Unaudited) | | | Year Ended September 30, | |
| | | | 2009 | | | 2008 | | | 2007 | | | 2006 | | | 2005 | | | | 2009 | | | 2008 | | | 2007 | | | 2006 | | | 2005 | |
Per Share Operating Performance | | | | | | | | | | | | | | | | | | | | | | | | | | | | | | | | | | | | | | | | | | | | | | | | |
Net asset value, beginning of period | | $ | 13.71 | | | $ | 15.86 | | | $ | 21.21 | | | $ | 18.50 | | | $ | 17.62 | | | $ | 14.77 | | | $ | 13.55 | | | $ | 15.73 | | | $ | 21.05 | | | $ | 18.41 | | | $ | 17.59 | | | $ | 14.73 | |
| | | | | | | | | | | | | | | | | | | | | | | | | | | | | | | | | | | | | | | | | | | | | | | | |
Net investment loss1 | | | (0.03 | ) | | | (0.01 | ) | | | (0.05 | ) | | | (0.13 | ) | | | (0.12 | ) | | | (0.10 | ) | | | (0.05 | ) | | | (0.07 | ) | | | (0.09 | ) | | | (0.18 | ) | | | (0.18 | ) | | | (0.13 | ) |
Net realized and unrealized gain (loss)2 | | | 1.64 | | | | (2.14 | ) | | | (3.63 | ) | | | 3.15 | | | | 1.30 | | | | 3.06 | | | | 1.61 | | | | (2.11 | ) | | | (3.61 | ) | | | 3.13 | | | | 1.30 | | | | 3.10 | |
| | | | | | | | | | | | | | | | | | | | | | | | | | | | | | | | | | | | | | | | | | | | | | | | |
Net increase (decrease) from investment operations | | | 1.61 | | | | (2.15 | ) | | | (3.68 | ) | | | 3.02 | | | | 1.18 | | | | 2.96 | | | | 1.56 | | | | (2.18 | ) | | | (3.70 | ) | | | 2.95 | | | | 1.12 | | | | 2.97 | |
| | | | | | | | | | | | | | | | | | | | | | | | | | | | | | | | | | | | | | | | | | | | | | | | |
Distributions from net realized gain | | | — | | | | — | | | | (1.67 | ) | | | (0.31 | ) | | | (0.30 | ) | | | (0.11 | ) | | | — | | | | — | | | | (1.62 | ) | | | (0.31 | ) | | | (0.30 | ) | | | (0.11 | ) |
| | | | | | | | | | | | | | | | | | | | | | | | | | | | | | | | | | | | | | | | | | | | | | | | |
Net asset value, end of period | | $ | 15.32 | | | $ | 13.71 | | | $ | 15.86 | | | $ | 21.21 | | | $ | 18.50 | | | $ | 17.62 | | | $ | 15.11 | | | $ | 13.55 | | | $ | 15.73 | | | $ | 21.05 | | | $ | 18.41 | | | $ | 17.59 | |
| | | | | | | | | | | | | | | | | | | | | | | | | | | | | | | | | | | | | | | | | | | | | | | | |
Total Investment Return3,4 | | | | | | | | | | | | | | | | | | | | | | | | | | | | | | | | | | | | | | | | | | | | | | | | |
Based on net asset value | | | 11.74 | %5 | | | (13.56 | )% | | | (18.37 | )% | | | 16.46 | % | | | 6.81 | % | | | 20.10 | % | | | 11.51 | %5 | | | (13.86 | )% | | | (18.59 | )% | | | 16.15 | % | | | 6.47 | % | | | 20.22 | % |
| | | | | | | | | | | | | | | | | | | | | | | | | | | | | | | | | | | | | | | | | | | | | | | | |
Ratios to Average Net Assets | | | | | | | | | | | | | | | | | | | | | | | | | | | | | | | | | | | | | | | | | | | | | | | | |
Total expenses | | | 1.39 | %6 | | | 1.48 | % | | | 1.40 | % | | | 1.38 | % | | | 1.47 | % | | | 1.81 | % | | | 1.73 | %6 | | | 1.88 | % | | | 1.64 | % | | | 1.59 | % | | | 1.64 | % | | | 2.01 | % |
| | | | | | | | | | | | | | | | | | | | | | | | | | | | | | | | | | | | | | | | | | | | | | | | |
Total expenses excluding recoupment of past waived fees | | | 1.39 | %6 | | | 1.48 | % | | | 1.40 | % | | | 1.38 | % | | | 1.47 | % | | | 1.81 | % | | | 1.73 | %6 | | | 1.81 | % | | | 1.64 | % | | | 1.59 | % | | | 1.64 | % | | | 2.01 | % |
| | | | | | | | | | | | | | | | | | | | | | | | | | | | | | | | | | | | | | | | | | | | | | | | |
Total expenses after fees waived, reimbursed and paid indirectly | | | 1.34 | %6 | | | 1.32 | % | | | 1.30 | % | | | 1.30 | % | | | 1.30 | % | | | 1.30 | % | | | 1.65 | %6 | | | 1.60 | % | | | 1.58 | % | | | 1.57 | % | | | 1.60 | % | | | 1.60 | % |
| | | | | | | | | | | | | | | | | | | | | | | | | | | | | | | | | | | | | | | | | | | | | | | | |
Net investment loss | | | (0.47 | )%6 | | | (0.07 | )% | | | (0.26 | )% | | | (0.62 | )% | | | (0.68 | )% | | | (0.59 | )% | | | (0.77 | )%6 | | | (0.61 | )% | | | (0.51 | )% | | | (0.88 | )% | | | (0.99 | )% | | | (0.80 | )% |
| | | | | | | | | | | | | | | | | | | | | | | | | | | | | | | | | | | | | | | | | | | | | | | | |
Supplemental Data | | | | | | | | | | | | | | | | | | | | | | | | | | | | | | | | | | | | | | | | | | | | | | | | |
Net assets, end of period (000) . | | $ | 46,950 | | | $ | 38,592 | | | $ | 38,685 | | | $ | 33,707 | | | $ | 24,172 | | | $ | 12,641 | | | $ | 301 | | | $ | 256 | | | $ | 3,430 | | | $ | 4,909 | | | $ | 2,776 | | | $ | 94 | |
| | | | | | | | | | | | | | | | | | | | | | | | | | | | | | | | | | | | | | | | | | | | | | | | |
Portfolio turnover | | | 64 | % | | | 158 | % | | | 103 | % | | | 103 | % | | | 111 | % | | | 118 | % | | | 64 | % | | | 158 | % | | | 103 | % | | | 103 | % | | | 111 | % | | | 118 | % |
| | | | | | | | | | | | | | | | | | | | | | | | | | | | | | | | | | | | | | | | | | | | | | | | |
| 1 | Based on average shares outstanding. |
| 2 | Includes redemption fees, which are less than $0.01 per share. |
| 3 | Where applicable, total investment returns exclude the effects of any sales charges and include the reinvestment of dividends and distributions. |
| 4 | Redemption fee of 2.00% is reflected in total return calculations. There was no impact to the return. |
| 5 | Aggregate total investment return. |
See Notes to Financial Statements.
| | | | | | |
| | | BLACKROCK FUNDS | | MARCH 31, 2010 | | 19 |
| | | | | | | | | | | | |
| Financial Highlights (continued) | | BlackRock Small Cap Core Equity Portfolio |
| | | | | | | | | | | | | | | | | | | | | | | | |
| | | Investor A | |
| | | Six Months
Ended
March 31, 2010
(Unaudited) | | | Year Ended September 30, | |
| | | 2009 | | | 2008 | | | 2007 | | | 2006 | | | 2005 | |
Per Share Operating Performance | | | | | | | | | | | | | | | | | | | | | | | | |
Net asset value, beginning of period | | $ | 13.40 | | | $ | 15.57 | | | $ | 20.86 | | | $ | 18.27 | | | $ | 17.49 | | | $ | 14.71 | |
| | | | | | | | | | | | | | | | | | | | | | | | |
Net investment loss1 | | | (0.06 | ) | | | (0.06 | ) | | | (0.12 | ) | | | (0.21 | ) | | | (0.20 | ) | | | (0.17 | ) |
Net realized and unrealized gain (loss)2 | | | 1.59 | | | | (2.11 | ) | | | (3.58 | ) | | | 3.11 | | | | 1.28 | | | | 3.06 | |
| | | | | | | | | | | | | | | | | | | | | | | | |
Net increase (decrease) from investment operations | | | 1.53 | | | | (2.17 | ) | | | (3.70 | ) | | | 2.90 | | | | 1.08 | | | | 2.89 | |
| | | | | | | | | | | | | | | | | | | | | | | | |
Distributions from net realized gain | | | — | | | | — | | | | (1.59 | ) | | | (0.31 | ) | | | (0.30 | ) | | | (0.11 | ) |
| | | | | | | | | | | | | | | | | | | | | | | | |
Net asset value, end of period | | $ | 14.93 | | | $ | 13.40 | | | $ | 15.57 | | | $ | 20.86 | | | $ | 18.27 | | | $ | 17.49 | |
| | | | | | | | | | | | | | | | | | | | | | | | |
Total Investment Return3,4 | | | | | | | | | | | | | | | | | | | | | | | | |
Based on net asset value | | | 11.42 | %5 | | | (13.94 | )% | | | (18.74 | )% | | | 16.00 | % | | | 6.28 | % | | | 19.71 | % |
| | | | | | | | | | | | | | | | | | | | | | | | |
Ratios to Average Net Assets | | | | | | | | | | | | | | | | | | | | | | | | |
Total expenses | | | 1.98 | %6 | | | 2.11 | % | | | 1.90 | % | | | 1.80 | % | | | 1.90 | % | | | 2.17 | % |
| | | | | | | | | | | | | | | | | | | | | | | | |
Total expenses excluding recoupment of past waived fees | | | 1.98 | %6 | | | 2.09 | % | | | 1.90 | % | | | 1.80 | % | | | 1.90 | % | | | 2.17 | % |
| | | | | | | | | | | | | | | | | | | | | | | | |
Total expenses after fees waived, reimbursed and paid indirectly | | | 1.82 | %6 | | | 1.78 | % | | | 1.76 | % | | | 1.74 | % | | | 1.73 | % | | | 1.71 | % |
| | | | | | | | | | | | | | | | | | | | | | | | |
Net investment loss | | | (0.92 | )%6 | | | (0.54 | )% | | | (0.69 | )% | | | (1.06 | )% | | | (1.11 | )% | | | (1.01 | )% |
| | | | | | | | | | | | | | | | | | | | | | | | |
Supplemental Data | | | | | | | | | | | | | | | | | | | | | | | | |
Net assets, end of period (000) | | $ | 17,266 | | | $ | 16,995 | | | $ | 23,687 | | | $ | 29,070 | | | $ | 20,973 | | | $ | 11,997 | |
| | | | | | | | | | | | | | | | | | | | | | | | |
Portfolio turnover | | | 64 | % | | | 158 | % | | | 103 | % | | | 103 | % | | | 111 | % | | | 118 | % |
| | | | | | | | | | | | | | | | | | | | | | | | |
| | | | | | | | | | | | | | | | | | | | | | | | |
| | | Investor B | |
| | | Six Months
Ended
March 31, 2010
(Unaudited) | | | Year Ended September 30, | |
| | | 2009 | | | 2008 | | | 2007 | | | 2006 | | | 2005 | |
Per Share Operating Performance | | | | | | | | | | | | | | | | | | | | | | | | |
Net asset value, beginning of period | | $ | 12.89 | | | $ | 15.09 | | | $ | 20.23 | | | $ | 17.87 | | | $ | 17.24 | | | $ | 14.61 | |
| | | | | | | | | | | | | | | | | | | | | | | | |
Net investment loss1 | | | (0.11 | ) | | | (0.14 | ) | | | (0.24 | ) | | | (0.36 | ) | | | (0.33 | ) | | | (0.28 | ) |
Net realized and unrealized gain (loss)2 | | | 1.53 | | | | (2.06 | ) | | | (3.48 | ) | | | 3.03 | | | | 1.26 | | | | 3.02 | |
| | | | | | | | | | | | | | | | | | | | | | | | |
Net increase (decrease) from investment operations | | | 1.42 | | | | (2.20 | ) | | | (3.72 | ) | | | 2.67 | | | | 0.93 | | | | 2.74 | |
| | | | | | | | | | | | | | | | | | | | | | | | |
Distributions from net realized gain | | | — | | | | — | | | | (1.42 | ) | | | (0.31 | ) | | | (0.30 | ) | | | (0.11 | ) |
| | | | | | | | | | | | | | | | | | | | | | | | |
Net asset value, end of period | | $ | 14.31 | | | $ | 12.89 | | | $ | 15.09 | | | $ | 20.23 | | | $ | 17.87 | | | $ | 17.24 | |
| | | | | | | | | | | | | | | | | | | | | | | | |
Total Investment Return3,4 | | | | | | | | | | | | | | | | | | | | | | | | |
Based on net asset value | | | 11.02 | %5 | | | (14.58 | )% | | | (19.36 | )% | | | 15.06 | % | | | 5.49 | % | | | 18.81 | % |
| | | | | | | | | | | | | | | | | | | | | | | | |
Ratios to Average Net Assets | | | | | | | | | | | | | | | | | | | | | | | | |
Total expenses | | | 2.70 | %6 | | | 2.81 | % | | | 2.60 | % | | | 2.57 | % | | | 2.55 | % | | | 2.81 | % |
| | | | | | | | | | | | | | | | | | | | | | | | |
Total expenses excluding recoupment of past waived fees | | | 2.70 | %6 | | | 2.80 | % | | | 2.60 | % | | | 2.57 | % | | | 2.55 | % | | | 2.81 | % |
| | | | | | | | | | | | | | | | | | | | | | | | |
Total expenses after fees waived, reimbursed and paid indirectly | | | 2.60 | %6 | | | 2.54 | % | | | 2.51 | % | | | 2.51 | % | | | 2.49 | % | | | 2.44 | % |
| | | | | | | | | | | | | | | | | | | | | | | | |
Net investment loss | | | (1.68 | )%6 | | | (1.30 | )% | | | (1.42 | )% | | | (1.84 | )% | | | (1.87 | )% | | | (1.74 | )% |
| | | | | | | | | | | | | | | | | | | | | | | | |
Supplemental Data | | | | | | | | | | | | | | | | | | | | | | | | |
Net assets, end of period (000) | | $ | 3,216 | | | $ | 3,547 | | | $ | 5,724 | | | $ | 8,956 | | | $ | 8,326 | | | $ | 6,303 | |
| | | | | | | | | | | | | | | | | | | | | | | | |
Portfolio turnover | | | 64 | % | | | 158 | % | | | 103 | % | | | 103 | % | | | 111 | % | | | 118 | % |
| | | | | | | | | | | | | | | | | | | | | | | | |
See Notes to Financial Statements.
| | | | | | |
| 20 | | BLACKROCK FUNDS | | MARCH 31, 2010 | | |
| | |
| Financial Highlights (continued) | | BlackRock Small Cap Core Equity Portfolio |
| | | | | | | | | | | | | | | | | | | | | | | | |
| | | Investor C | |
| | | Six Months
Ended
March 31, 2010
(Unaudited) | | | Year Ended September 30, | |
| | | 2009 | | | 2008 | | | 2007 | | | 2006 | | | 2005 | |
Per Share Operating Performance | | | | | | | | | | | | | | | | | | | | | | | | |
Net asset value, beginning of period | | $ | 12.86 | | | $ | 15.07 | | | $ | 20.25 | | | $ | 17.87 | | | $ | 17.23 | | | $ | 14.60 | |
| | | | | | | | | | | | | | | | | | | | | | | | |
Net investment loss1 | | | (0.11 | ) | | | (0.14 | ) | | | (0.24 | ) | | | (0.35 | ) | | | (0.32 | ) | | | (0.28 | ) |
Net realized and unrealized gain (loss)2 | | | 1.53 | | | | (2.07 | ) | | | (3.47 | ) | | | 3.04 | | | | 1.26 | | | | 3.02 | |
| | | | | | | | | | | | | | | | | | | | | | | | |
Net increase (decrease) from investment operations | | | 1.42 | | | | (2.21 | ) | | | (3.71 | ) | | | 2.69 | | | | 0.94 | | | | 2.74 | |
| | | | | | | | | | | | | | | | | | | | | | | | |
Distributions from net realized gain | | | — | | | | — | | | | (1.47 | ) | | | (0.31 | ) | | | (0.30 | ) | | | (0.11 | ) |
| | | | | | | | | | | | | | | | | | | | | | | | |
Net asset value, end of period | | $ | 14.28 | | | $ | 12.86 | | | $ | 15.07 | | | $ | 20.25 | | | $ | 17.87 | | | $ | 17.23 | |
| | | | | | | | | | | | | | | | | | | | | | | | |
Total Investment Return3,4 | | | | | | | | | | | | | | | | | | | | | | | | |
Based on net asset value | | | 11.04 | %5 | | | (14.67 | )% | | | (19.34 | )% | | | 15.17 | % | | | 5.55 | % | | | 18.82 | % |
| | | | | | | | | | | | | | | | | | | | | | | | |
Ratios to Average Net Assets | | | | | | | | | | | | | | | | | | | | | | | | |
Total expenses | | | 2.67 | %6 | | | 2.90 | % | | | 2.60 | % | | | 2.54 | % | | | 2.48 | % | | | 2.80 | % |
| | | | | | | | | | | | | | | | | | | | | | | | |
Total expenses excluding recoupment of past waived fees | | | 2.67 | %6 | | | 2.88 | % | | | 2.60 | % | | | 2.54 | % | | | 2.48 | % | | | 2.80 | % |
| | | | | | | | | | | | | | | | | | | | | | | | |
Total expenses after fees waived, reimbursed and paid indirectly | | | 2.60 | %6 | | | 2.54 | % | | | 2.50 | % | | | 2.48 | % | | | 2.44 | % | | | 2.44 | % |
| | | | | | | | | | | | | | | | | | | | | | | | |
Net investment loss | | | (1.69 | )%6 | | | (1.30 | )% | | | (1.43 | )% | | | (1.81 | )% | | | (1.81 | )% | | | (1.74 | )% |
| | | | | | | | | | | | | | | | | | | | | | | | |
Supplemental Data | | | | | | | | | | | | | | | | | | | | | | | | |
Net assets, end of period (000) | | $ | 15,710 | | | $ | 16,305 | | | $ | 26,187 | | | $ | 32,677 | | | $ | 26,151 | | | $ | 17,266 | |
| | | | | | | | | | | | | | | | | | | | | | | | |
Portfolio turnover | | | 64 | % | | | 158 | % | | | 103 | % | | | 103 | % | | | 111 | % | | | 118 | % |
| | | | | | | | | | | | | | | | | | | | | | | | |
| 1 | Based on average shares outstanding. |
| 2 | Includes redemption fees, which are less than $0.01 per share. |
| 3 | Where applicable, total investment returns exclude the effects of any sales charges and include the reinvestment of dividends and distributions. |
| 4 | Redemption fee of 2.00% is reflected in total return calculations. There was no impact to the return. |
| 5 | Aggregate total investment return. |
See Notes to Financial Statements.
| | | | | | |
| | | BLACKROCK FUNDS | | MARCH 31, 2010 | | 21 |
| | |
| Financial Highlights (continued) | | BlackRock Small Cap Growth Equity Portfolio |
| | | | | | | | | | | | | | | | | | | | | | | | | | | | | | | | | | | | | | | | | | | | | | | | |
| | | Institutional | | | Service | |
| | | Six Months
Ended
March 31, 2010
(Unaudited) | | | Year Ended September 30, | | | Six Months
Ended
March 31, 2010
(Unaudited) | | | Year Ended September 30, | |
| | | | 2009 | | | 2008 | | | 2007 | | | 2006 | | | 2005 | | | | 2009 | | | 2008 | | | 2007 | | | 2006 | | | 2005 | |
Per Share Operating Performance | | | | | | | | | | | | | | | | | | | | | | | | | | | | | | | | | | | | | | | | | |
Net asset value, beginning of period | | $ | 18.66 | | | $ | 20.33 | | | $ | 23.71 | | | $ | 19.26 | | | $ | 17.29 | | | $ | 14.52 | | | $ | 17.67 | | | $ | 19.30 | | | $ | 22.58 | | | $ | 18.38 | | | $ | 16.54 | | | $ | 13.92 | |
| | | | | | | | | | | | | | | | | | | | | | | | | | | | | | | | | | | | | | | | | | | | | | | | |
Net investment income (loss)1 | | | (0.05 | ) | | | (0.07 | ) | | | 0.03 | | | | (0.07 | ) | | | (0.09 | ) | | | (0.06 | ) | | | (0.07 | ) | | | (0.10 | ) | | | (0.03 | ) | | | (0.11 | ) | | | (0.13 | ) | | | (0.11 | ) |
Net realized and unrealized gain (loss) | | | 3.01 | | | | (1.60 | ) | | | (3.41 | ) | | | 4.52 | | | | 2.06 | | | | 2.82 | | | | 2.85 | | | | (1.53 | ) | | | (3.25 | ) | | | 4.31 | | | | 1.97 | | | | 2.72 | |
| | | | | | | | | | | | | | | | | | | | | | | | | | | | | | | | | | | | | | | | | | | | | | | | |
Net increase (decrease) from investment operations | | | 2.96 | | | | (1.67 | ) | | | (3.38 | ) | | | 4.45 | | | | 1.97 | | | | 2.76 | | | | 2.78 | | | | (1.63 | ) | | | (3.28 | ) | | | 4.20 | | | | 1.84 | | | | 2.61 | |
| | | | | | | | | | | | | | | | | | | | | | | | | | | | | | | | | | | | | | | | | | | | | | | | |
Redemption fees added to paid-in capital | | | 0.00 | 2 | | | 0.00 | 2 | | | 0.00 | 2 | | | 0.00 | 2 | | | 0.00 | 2 | | | 0.01 | | | | 0.00 | 2 | | | 0.00 | 2 | | | 0.00 | 2 | | | 0.00 | 2 | | | 0.00 | 2 | | | 0.01 | |
| | | | | | | | | | | | | | | | | | | | | | | | | | | | | | | | | | | | | | | | | | | | | | | | |
Net asset value, end of period | | $ | 21.62 | | | $ | 18.66 | | | $ | 20.33 $ | | | | 23.71 | | | $ | 19.26 | | | $ | 17.29 | | | $ | 20.45 | | | $ | 17.67 | | | $ | 19.30 | | | $ | 22.58 | | | $ | 18.38 | | | $ | 16.54 | |
| | | | | | | | | | | | | | | | | | | | | | | | | | | | | | | | | | | | | | | | | | | | | | | | |
Total Investment Return3 | | | | | | | | | | | | | | | | | | | | | | | | | | | | | | | | | | | | | | | | | | | | | | | | |
Based on net asset value | | | 15.86 | %4,5 | | | (8.22 | )%4,6 | | | (14.26 | )%4 | | | 23.11 | %4 | | | 11.39 | %4 | | | 19.08 | %7 | | | 15.73 | %4,5 | | | (8.45 | )%4,8 | | | (14.53 | )%4 | | | 22.85 | %4 | | | 11.12 | %4 | | | 18.82 | %7 |
| | | | | | | | | | | | | | | | | | | | | | | | | | | | | | | | | | | | | | | | | | | | | | | | |
Ratios to Average Net Assets | | | | | | | | | | | | | | | | | | | | | | | | | | | | | | | | | | | | | | | | | | | | | | | | |
Total expenses | | | 0.81 | %9 | | | 0.88 | % | | | 0.77 | % | | | 0.82 | % | | | 0.83 | % | | | 0.95 | % | | | 1.07 | %9 | | | 1.15 | % | | | 1.07 | % | | | 1.02 | % | | | 1.08 | % | | | 1.19 | % |
| | | | | | | | | | | | | | | | | | | | | | | | | | | | | | | | | | | | | | | | | | | | | | | | |
Total expenses excluding recoupment of past waived fees | | | 0.81 | %9 | | | 0.88 | % | | | 0.77 | % | | | 0.82 | % | | | 0.83 | % | | | 0.95 | % | | | 1.07 | %9 | | | 1.14 | % | | | 1.07 | % | | | 1.02 | % | | | 1.08 | % | | | 1.19 | % |
| | | | | | | | | | | | | | | | | | | | | | | | | | | | | | | | | | | | | | | | | | | | | | | | |
Total expenses after fees waived, reimbursed and paid indirectly | | | 0.81 | %9 | | | 0.88 | % | | | 0.77 | % | | | 0.82 | % | | | 0.83 | % | | | 0.94 | % | | | 1.07 | %9 | | | 1.11 | % | | | 1.07 | % | | | 1.02 | % | | | 1.08 | % | | | 1.19 | % |
| | | | | | | | | | | | | | | | | | | | | | | | | | | | | | | | | | | | | | | | | | | | | | | | |
Net investment income (loss) | | | (0.51 | )%9 | | | (0.48 | )% | | | 0.15 | % | | | (0.34 | )% | | | (0.48 | )% | | | (0.40 | )% | | | (0.77 | )%9 | | | (0.70 | )% | | | (0.14 | )% | | | (0.54 | )% | | | (0.73 | )% | | | (0.70 | )% |
| | | | | | | | | | | | | | | | | | | | | | | | | | | | | | | | | | | | | | | | | | | | | | | | |
Supplemental Data | | | | | | | | | | | | | | | | | | | | | | | | | | | | | | | | | | | | | | | | | | | | | | | | |
Net assets, end of period (000) | | $ | 957,545 | | | $ | 855,375 | | | $ | 699,761 | | | $ | 587,586 | | | $ | 426,000 | | | $ | 357,857 | | | $ | 54,084 | | | $ | 43,932 | | | $ | 40,514 | | | $ | 35,945 | | | $ | 26,422 | | | $ | 24,491 | |
| | | | | | | | | | | | | | | | | | | | | | | | | | | | | | | | | | | | | | | | | | | | | | | | |
Portfolio turnover | | | 75 | % | | | 82 | % | | | 81 | % | | | 81 | % | | | 74 | % | | | 91 | % | | | 75 | % | | | 82 | % | | | 81 | % | | | 81 | % | | | 74 | % | | | 91 | % |
| | | | | | | | | | | | | | | | | | | | | | | | | | | | | | | | | | | | | | | | | | | | | | | | |
| | |
| | | Investor A | | | Investor B | |
| | | Six Months
Ended
March 31, 2010
(Unaudited) | | | Year Ended September 30, | | | Six Months
Ended
March 31, 2010
(Unaudited) | | | Year Ended September 30, | |
| | | | 2009 | | | 2008 | | | 2007 | | | 2006 | | | 2005 | | | | 2009 | | | 2008 | | | 2007 | | | 2006 | | | 2005 | |
Per Share Operating Performance | | | | | | | | | | | | | | | | | | | | | | | | | | | | | | | | | | | | | | | | | |
Net asset value, beginning of period | | $ | 17.14 | | | $ | 18.76 | | | $ | 21.97 | | | $ | 17.90 | | | $ | 16.12 | | | $ | 13.57 | | | $ | 15.00 | | | $ | 16.56 | | | $ | 19.57 | | | $ | 16.07 | | | $ | 14.61 | | | $ | 12.39 | |
| | | | | | | | | | | | | | | | | | | | | | | | | | | | | | | | | | | | | | | | | | | | | | | | |
Net investment loss1 | | | (0.08 | ) | | | (0.13 | ) | | | (0.05 | ) | | | (0.13 | ) | | | (0.14 | ) | | | (0.10 | ) | | | (0.15 | ) | | | (0.21 | ) | | | (0.21 | ) | | | (0.26 | ) | | | (0.27 | ) | | | (0.20 | ) |
Net realized and unrealized gain (loss) | | | 2.76 | | | | (1.49 | ) | | | (3.16 | ) | | | 4.20 | | | | 1.92 | | | | 2.64 | | | | 2.41 | | | | (1.35 | ) | | | (2.80 | ) | | | 3.76 | | | | 1.73 | | | | 2.41 | |
| | | | | | | | | | | | | | | | | | | | | | | | | | | | | | | | | | | | | | | | | | | | | | | | |
Net increase (decrease) from investment operations | | | 2.68 | | | | (1.62 | ) | | | (3.21 | ) | | | 4.07 | | | | 1.78 | | | | 2.54 | | | | 2.26 | | | | (1.56 | ) | | | (3.01 | ) | | | 3.50 | | | | 1.46 | | | | 2.21 | |
| | | | | | | | | | | | | | | | | | | | | | | | | | | | | | | | | | | | | | | | | | | | | | | | |
Redemption fees added to paid-in capital | | | 0.00 | 2 | | | 0.00 | 2 | | | 0.00 | 2 | | | 0.00 | 2 | | | 0.00 | 2 | | | 0.01 | | | | 0.00 | 2 | | | 0.00 | 2 | | | 0.00 | 2 | | | 0.00 | 2 | | | 0.00 | 2 | | | 0.01 | |
| | | | | | | | | | | | | | | | | | | | | | | | | | | | | | | | | | | | | | | | | | | | | | | | |
Net asset value, end of period | | $ | 19.82 | | | $ | 17.14 | | | $ | 18.76 | | | $ | 21.97 | | | $ | 17.90 | | | $ | 16.12 | | | $ | 17.26 | | | $ | 15.00 | | | $ | 16.56 | | | $ | 19.57 | | | $ | 16.07 | | | $ | 14.61 | |
| | | | | | | | | | | | | | | | | | | | | | | | | | | | | | | | | | | | | | | | | | | | | | | | |
Total Investment Return3 | | | | | | | | | | | | | | | | | | | | | | | | | | | | | | | | | | | | | | | | | | | | | | | | |
Based on net asset value | | | 15.64 | %4,5 | | | (8.64 | )%4,10 | | | (14.61 | )%4 | | | 22.74 | %4 | | | 11.04 | %4 | | | 18.79 | %7 | | | 15.07 | %4,5 | | | (9.42 | )%4,11 | | | (15.38 | )%4 | | | 21.78 | %4 | | | 9.99 | %4 | | | 17.92 | %12 |
| | | | | | | | | | | | | | | | | | | | | | | | | | | | | | | | | | | | | | | | | | | | | | | | |
Ratios to Average Net Assets | | | | | | | | | | | | | | | | | | | | | | | | | | | | | | | | | | | | | | | | | | | | | | | | |
Total expenses | | | 1.21 | %9 | | | 1.33 | % | | | 1.16 | % | | | 1.12 | % | | | 1.25 | % | | | 1.29 | % | | | 2.22 | %9 | | | 2.30 | % | | | 2.08 | % | | | 2.02 | % | | | 2.30 | % | | | 1.94 | % |
| | | | | | | | | | | | | | | | | | | | | | | | | | | | | | | | | | | | | | | | | | | | | | | | |
Total expenses excluding recoupment of past waived fees | | | 1.21 | %9 | | | 1.33 | % | | | 1.16 | % | | | 1.12 | % | | | 1.25 | % | | | 1.29 | % | | | 2.19 | %9 | | | 2.20 | % | | | 2.08 | % | | | 2.02 | % | | | 2.30 | % | | | 1.94 | % |
| | | | | | | | | | | | | | | | | | | | | | | | | | | | | | | | | | | | | | | | | | | | | | | | |
Total expenses after fees waived, reimbursed and paid indirectly | | | 1.21 | %9 | | | 1.33 | % | | | 1.16 | % | | | 1.12 | % | | | 1.15 | % | | | 1.19 | % | | | 2.22 | %9 | | | 2.20 | % | | | 2.08 | % | | | 1.92 | % | | | 2.11 | % | | | 1.94 | % |
| | | | | | | | | | | | | | | | | | | | | | | | | | | | | | | | | | | | | | | | | | | | | | | | |
Net investment loss | | | (0.91 | )%9 | | | (0.92 | )% | | | (0.22 | )% | | | (0.64 | )% | | | (0.80 | )% | | | (0.66 | )% | | | (1.93 | )%9 | | | (1.72 | )% | | | (1.11 | )% | | | (1.44 | )% | | | (1.77 | )% | | | (1.45 | )% |
| | | | | | | | | | | | | | | | | | | | | | | | | | | | | | | | | | | | | | | | | | | | | | | | |
Supplemental Data | | | | | | | | | | | | | | | | | | | | | | | | | | | | | | | | | | | | | | | | | | | | | | | | |
Net assets, end of period (000) | | $ | 279,499 | | | $ | 240,361 | | | $ | 211,065 | | | $ | 189,575 | | | $ | 176,250 | | | $ | 160,374 | | | $ | 3,027 | | | $ | 3,327 | | | $ | 5,721 | | | $ | 10,222 | | | $ | 10,649 | | | $ | 15,516 | |
| | | | | | | | | | | | | | | | | | | | | | | | | | | | | | | | | | | | | | | | | | | | | | | | |
Portfolio turnover | | | 75 | % | | | 82 | % | | | 81 | % | | | 81 | % | | | 74 | % | | | 91 | % | | | 75 | % | | | 82 | % | | | 81 | % | | | 81 | % | | | 74 | % | | | 91 | % |
| | | | | | | | | | | | | | | | | | | | | | | | | | | | | | | | | | | | | | | | | | | | | | | | |
See Notes to Financial Statements.
| | | | | | |
| 22 | | BLACKROCK FUNDS | | MARCH 31, 2010 | | |
| | |
| Financial Highlights (concluded) | | BlackRock Small Cap Growth Equity Portfolio |
| | | | | | | | | | | | | | | | | | | | | | | | |
| | | Investor C | |
| | | Six Months
Ended
March 31, 2010
(Unaudited) | | | Year Ended September 30, | |
| | | | 2009 | | | 2008 | | | 2007 | | | 2006 | | | 2005 | |
Per Share Operating Performance | | | | | | | | | | | | | | | | | | | | | | | | |
Net asset value, beginning of period | | $ | 14.99 | | | $ | 16.56 | | | $ | 19.57 | | | $ | 16.09 | | | $ | 14.62 | | | $ | 12.40 | |
| | | | | | | | | | | | | | | | | | | | | | | | |
Net investment loss1 | | | (0.15 | ) | | | (0.22 | ) | | | (0.21 | ) | | | (0.29 | ) | | | (0.26 | ) | | | (0.19 | ) |
Net realized and unrealized gain (loss) | | | 2.41 | | | | (1.35 | ) | | | (2.80 | ) | | | 3.77 | | | | 1.73 | | | | 2.40 | |
| | | | | | | | | | | | | | | | | | | | | | | | |
Net increase (decrease) from investment operations | | | 2.26 | | | | (1.57 | ) | | | (3.01 | ) | | | 3.48 | | | | 1.47 | | | | 2.21 | |
| | | | | | | | | | | | | | | | | | | | | | | | |
Redemption fees added to paid-in capital | | | 0.00 | 2 | | | 0.00 | 2 | | | 0.00 | 2 | | | 0.00 | 2 | | | 0.00 | 2 | | | 0.01 | |
| | | | | | | | | | | | | | | | | | | | | | | | |
Net asset value, end of period | | $ | 17.25 | | | $ | 14.99 | | | $ | 16.56 | | | $ | 19.57 | | | $ | 16.09 | | | $ | 14.62 | |
| | | | | | | | | | | | | | | | | | | | | | | | |
Total Investment Return3 | | | | | | | | | | | | | | | | | | | | | | | | |
Based on net asset value | | | 15.08 | %4,5 | | | (9.48 | )%4,13 | | | (15.38 | )%4 | | | 21.63 | %4 | | | 10.05 | %4 | | | 17.90 | %12 |
| | | | | | | | | | | | | | | | | | | | | | | | |
Ratios to Average Net Assets | | | | | | | | | | | | | | | | | | | | | | | | |
Total expenses | | | 2.21 | %9 | | | 2.31 | % | | | 2.08 | % | | | 2.09 | % | | | 2.02 | % | | | 1.94 | % |
| | | | | | | | | | | | | | | | | | | | | | | | |
Total expenses excluding recoupment of past waived fees | | | 2.11 | %9 | | | 2.29 | % | | | 2.08 | % | | | 2.09 | % | | | 2.02 | % | | | 1.94 | % |
| | | | | | | | | | | | | | | | | | | | | | | | |
Total expenses after fees waived, reimbursed and paid indirectly | | | 2.21 | %9 | | | 2.22 | % | | | 2.08 | % | | | 2.04 | % | | | 2.02 | % | | | 1.94 | % |
| | | | | | | | | | | | | | | | | | | | | | | | |
Net investment loss | | | (1.92 | )%9 | | | (1.81 | )% | | | (1.14 | )% | | | (1.56 | )% | | | (1.68 | )% | | | (1.41 | )% |
| | | | | | | | | | | | | | | | | | | | | | | | |
Supplemental Data | | | | | | | | | | | | | | | | | | | | | | | | |
Net assets, end of period (000) | | $ | 29,988 | | | $ | 25,915 | | | $ | 24,405 | | | $ | 21,847 | | | $ | 15,667 | | | $ | 15,434 | |
| | | | | | | | | | | | | | | | | | | | | | | | |
Portfolio turnover | | | 75 | % | | | 82 | % | | | 81 | % | | | 81 | % | | | 74 | % | | | 91 | % |
| | | | | | | | | | | | | | | | | | | | | | | | |
| 1 | Based on average shares outstanding. |
| 2 | Less than $0.01 per share. |
| 3 | Where applicable, total investment returns exclude the effects of any sales charges and include the reinvestment of dividends and distributions. |
| 4 | Redemption fee of 2.00% is reflected in total return calculations. There was no impact to the return. |
| 5 | Aggregate total investment return. |
| 6 | Includes proceeds received from a settlement of litigation, which impacted the Fund’s total return. Not including these proceeds, the Fund’s total return would have been (8.26)%. |
| 7 | Redemption fee of 2.00% is reflected in total return calculations. The impact to the return from redemption fees received during the period was an increase of 0.07%. |
| 8 | Includes proceeds received from a settlement of litigation, which impacted the Fund’s total return. Not including these proceeds, the Fund’s total return would have been (8.50)%. |
| 10 | Includes proceeds received from a settlement of litigation, which impacted the Fund’s total return. Not including these proceeds, the Fund’s total return would have been (8.69)%. |
| 11 | Includes proceeds received from a settlement of litigation, which impacted the Fund’s total return. Not including these proceeds, the Fund’s total return would have been (9.48)%. |
| 12 | Redemption fee of 2.00% is reflected in total return calculations. The impact to the return from redemption fees received during the period was an increase of 0.08%. |
| 13 | Includes proceeds received from a settlement of litigation, which impacted the Fund’s total return. Not including these proceeds, the Fund’s total return would have been (9.54)%. |
See Notes to Financial Statements.
| | | | | | |
| | | BLACKROCK FUNDS | | MARCH 31, 2010 | | 23 |
Notes to Financial Statements (Unaudited)
1. Organization and Significant Accounting Policies:
BlackRock FundsSM (the “Trust”), a Massachusetts business trust, is registered under the Investment Company Act of 1940, as amended (the “1940 Act”), as an open-end management investment company. As of March 31, 2010, the Trust had 25 series, of which BlackRock Small Cap Core Equity Portfolio (“Small Cap Core Equity”) and BlackRock Small Cap Growth Equity Portfolio (“Small Cap Growth Equity”) (collectively the “Funds”) are included in these financial statements. Each of the Funds is diversified. The Funds’ financial statements are prepared in conformity with accounting principles generally accepted in the United States of America (“US GAAP”), which may require the use of management accruals and estimates. Actual results may differ from these estimates. Each Fund offers multiple classes of shares. Institutional Shares are sold without a sales charge and only to certain eligible investors. Service Shares are sold without a sales charge. Investor A Shares are generally sold with a front-end sales charge. Investor B and Investor C Shares may be subject to a contingent deferred sales charge. All classes of shares have identical voting, dividend, liquidation and other rights and the same terms and conditions, except that Service, Investor A, Investor B and Investor C Shares bear certain expenses related to the shareholder servicing of such shares, and Investor B and Investor C Shares also bear certain expenses related to the distribution of such shares. Investor B Shares automatically convert to Investor A Shares after approximately eight years. Investor B Shares are only available for purchase through exchanges, dividend reinvestment or for purchase by certain qualified employee benefit plans. Each class has exclusive voting rights with respect to matters relating to its shareholder servicing and distribution expenditures (except that Investor B shareholders may vote on material changes to the Investor A distribution plan).
The following is a summary of significant accounting policies followed by the Funds:
Valuation: The Funds’ policy is to fair value their financial instruments at market value. Equity investments traded on a recognized securities exchange or the NASDAQ Global Market System are valued at the last reported sale price that day or the NASDAQ official closing price, if applicable. For equity investments traded on more than one exchange, the last reported sale price on the exchange where the stock is primarily traded is used. Equity investments traded on a recognized exchange for which there were no sales on that day are valued at the last available bid price. If no bid price is available, the prior day’s price will be used, unless it is determined that such prior day’s price no longer reflects the fair value of the security. Short-term securities with remaining maturities of 60 days or less may be valued at amortized cost, which approximates fair value. Investments in open-end investment companies are valued at net asset value each business day.
The Funds value their investments in BlackRock Liquidity Series, LLC Money Market Series (the “Money Market Series”) at fair value, which is ordinarily based upon their pro rata ownership in the net assets of the underlying fund. The Money Market Series seeks current income consistent with maintaining liquidity and preserving capital. Although the Money Market Series is not registered under the 1940 Act, its investments will follow the parameters of investments by a money market fund that is subject to Rule 2a-7 promulgated by the Securities and Exchange Commission (“SEC”) under the 1940 Act. The Funds may withdraw up to 25% of its investment daily, although the manager of the Money Market Series, in its sole discretion, may permit an investor to withdraw more than 25% on any one day.
In the event that application of these methods of valuation results in a price for an investment which is deemed not to be representative of the market value of such investment or is not available, the investment will be valued by a method approved by the Board of Trustees (the “Board”) as reflecting fair value (“Fair Value Assets”). When determining the price for Fair Value Assets, the investment advisor seeks to determine the price that each Fund might reasonably expect to receive from the current sale of that asset in an arm’s-length transaction. Fair value determinations shall be based upon all available factors that the investment advisor deems relevant. The pricing of all Fair Value Assets is subsequently reported to the Board or a committee thereof.
Investment Transactions and Investment Income: For financial reporting purposes, investment transactions are recorded on the dates the transactions are entered into (the trade dates). Realized gains and losses on investment transactions are determined on the identified cost basis. Dividend income is recorded on the ex-dividend dates. Dividends from foreign securities where the ex-dividend date may have passed are subsequently recorded when the Funds have determined the ex-dividend date. Under the applicable foreign tax laws, a withholding tax at various rates may be imposed on capital gains, dividends and interest. Upon notification from issuers, some of the dividend income received from a real estate investment trust may be redesignated as a reduction of cost of the related investment and/or realized gain. Interest income, including amortization of premium and accretion of discount on debt securities, is recognized on the accrual basis. Income and realized and unrealized gains and losses are allocated daily to each class based on its relative net assets.
Dividends and Distributions: Dividends and distributions, if any, paid by the Funds are recorded on the ex-dividend dates. The amount and timing of dividends and distributions are determined in accordance with federal income tax regulations, which may differ from US GAAP.
Securities Lending: The Funds may lend securities to financial institutions that provide cash as collateral, which will be maintained at all times in an amount equal to at least 100% of the current market value of the loaned securities. The market value of the loaned securities is determined at the close of business of the Funds and any additional required collateral is delivered to the Funds on the next business day. Securities lending income, as disclosed in the Statements of Operations, represents the income earned from the investment of the cash collateral, net of rebates paid to, or fees paid by, borrowers and less the fees paid to the securities lending agent. Loans of securities are
| | | | | | |
| 24 | | BLACKROCK FUNDS | | MARCH 31, 2010 | | |
Notes to Financial Statements (continued)
terminable at any time and the borrower, after notice, is required to return borrowed securities within the standard time period for settlement of securities transactions. In the event that the borrower defaults on its obligation to return borrowed securities because of insolvency or for any other reason, the Funds could experience delays and costs in gaining access to the collateral. The Funds also could suffer a loss if the value of an investment purchased with cash collateral falls below the market value of loaned securities or if the value of an investment purchased with cash collateral falls below the value of the original cash collateral received.
Income Taxes: It is the Funds’ policy to comply with the requirements of the Internal Revenue Code of 1986, as amended, applicable to regulated investment companies and to distribute substantially all of their taxable income to their shareholders. Therefore, no federal income tax provision is required.
The Funds file US federal and various state and local tax returns. No income tax returns are currently under examination. The statute of limitations on each Fund’s US federal tax returns remains open for each of the four years ended September 30, 2009. The statutes of limitations on each Fund’s state and local tax returns may remain open for an additional year depending upon the jurisdiction. There are no uncertain tax positions that require recognition of a tax liability.
Recent Accounting Standard: In January 2010, Financial Accounting Standards Board issued amended guidance to improve disclosure about fair value measurements which will require additional disclosures about transfers into and out of Levels 1 and 2 and separate disclosures about purchases, sales, issuances and settlements in the reconciliation for fair value measurements using significant unobservable inputs (Level 3). It also clarifies existing disclosure requirements relating to the levels of disaggregation for fair value measurement and inputs and valuation techniques used to measure fair value. The amended guidance is effective for financial statements for fiscal years beginning after December 15, 2009, and interim periods within those fiscal years, except for disclosures about purchases, sales, issuances and settlements in the rollforward of activity in Level 3 fair value measurements, which are effective for fiscal years beginning after December 15, 2010 and for interim periods within those fiscal years. The impact of this guidance on the Funds’ financial statements and disclosures is currently being assessed.
Other: Expenses directly related to a Fund or its classes are charged to that Fund or its classes. Other operating expenses shared by several funds are pro rated among those funds on the basis of relative net assets or other appropriate methods. Other expenses of a Fund are allocated daily to each class based on its relative net assets.
2. Investment Advisory Agreement and Other Transactions with Affiliates:
The PNC Financial Services Group, Inc. (“PNC”), Bank of America Corporation (“BAC”) and Barclays Bank PLC (“Barclays”) are the largest stockholders of BlackRock, Inc. (“BlackRock”). Due to the ownership structure, PNC is an affiliate of the Funds for 1940 Act purposes, but BAC and Barclays are not.
The Trust, on behalf of the Funds, entered into an Investment Advisory Agreement with BlackRock Advisors, LLC (the “Manager”), the Funds’ investment advisor, an indirect, wholly owned subsidiary of BlackRock, to provide investment advisory and administration services. The Manager is responsible for the management of each Fund’s portfolio and provides the necessary personnel, facilities, equipment and certain other services necessary to the operations of each Fund. For such services, Small Cap Growth Equity pays the Manager a monthly fee at the following annual rates of the Fund’s average daily net assets:
| | | |
| | | Small Cap | |
Average Daily Net Assets | | Growth Equity | |
First $1 Billion | | 0.550 | % |
$1 Billion - $2 Billion | | 0.500 | |
$2 Billion - $3 Billion | | 0.475 | |
Greater Than $3 Billion | | 0.450 | |
Small Cap Core Equity pays an advisory fee at an annual rate of 1.00% of average daily net assets.
The Manager has agreed to contractually and/or voluntarily waive and/or reimburse fees or expenses, excluding interest expense, dividend expense, acquired fund fees and expenses and certain other fund expenses, in order to limit expenses. The expense limitations as a percentage of net assets were as follows:
| | | | | | | | | |
| | | Small Cap
Core Equity | | | Small Cap
Growth Equity | |
| | | Contractual1 | | | Contractual1 | | | Voluntary2 | |
Institutional | | 1.34 | % | | 1.02 | % | | — | |
Service | | 1.65 | % | | 1.29 | % | | 1.18 | % |
Investor A | | 1.82 | % | | 1.50 | % | | — | |
Investor B | | 2.60 | % | | 2.28 | % | | — | |
Investor C | | 2.60 | % | | 2.28 | % | | — | |
| 1 | The Manager has agreed not to reduce or discontinue this contractual waiver or reimbursement until February 1, 2011 unless approved by the Board, including a majority of the non-interested Trustees. |
| 2 | The voluntary waiver or reimbursement may be reduced or discontinued at any time. |
The Manager has voluntarily agreed to waive its advisory fee by the amount of investment advisory fees each Fund pays to the Manager indirectly through its investment in affiliated money market funds, however the Manager does not waive its advisory fees by the amount of investment advisory fees through its investment in other affiliated investment companies. These amounts are included in fees waived by advisor in the Statements of Operations. For the six months ended March 31, 2010, the amounts waived were as follows:
| | | |
Small Cap Core Equity | | $ | 453 |
Small Cap Growth Equity | | $ | 7,213 |
If during a Fund’s fiscal year the operating expenses of a share class that at any time during the prior two fiscal years received a waiver or
| | | | | | |
| | | BLACKROCK FUNDS | | MARCH 31, 2010 | | 25 |
Notes to Financial Statements (continued)
reimbursement from the Manager, are less than the expense limit for that share class, the Manager is entitled to be reimbursed by such share class up to the amount of fees waived or expenses reimbursed during those prior two fiscal years under the agreement provided that: (1) the Fund of which the share class is a part has more than $50 million in assets and (2) the Manager or an affiliate continues to serve as the Fund’s investment advisor or administrator. In the event the expense limit for a share class is changed subsequent to a fiscal year in which the Manager becomes entitled to reimbursement for fees waived or reimbursed, the amount available to reimburse the Manager shall be calculated by reference to the expense limit for that share class in effect at the time the Manager became entitled to receive such reimbursement, rather than the subsequently changed expense limit for that share class.
For the six months ended March 31, 2010, the Manager recouped the following waivers previously recorded by Small Cap Growth Equity:
Recoupment of Past Waived Fees
| | | |
| | | Small Cap |
Share Classes | | Growth Equity |
Service | | $ | 3 |
Investor A | | | 1,693 |
Investor B | | | 568 |
Investor C | | | 13,397 |
| | | |
Total | | $ | 15,661 |
| | | |
On March 31, 2010, the amounts subject to possible future recoupment under the expense limitation agreement are as follows:
| | | | | | | | | |
| | | Expiring September 30, |
| | | 2010 | | 2011 | | 2012 |
Small Cap Core Equity | | $ | 115,624 | | $ | 173,105 | | $ | 29,911 |
Small Cap Growth Equity | | | — | | $ | 6,926 | | | — |
The Trust, on behalf of the Funds, has entered into a Distribution Agreement and Distribution Plan with BlackRock Investments, LLC (“BRIL”), an affiliate of BlackRock. Pursuant to the Distribution Plan and in accordance with Rule 12b-1 under the 1940 Act, the Funds pay BRIL ongoing service and distribution fees. The fees are accrued daily and paid monthly at annual rates based upon the average daily net assets of the shares of each Fund as follows:
| | | | | | |
| | | Service
Fee | | | Distribution
Fee | |
Service | | 0.25 | % | | — | |
Investor A | | 0.25 | % | | — | |
Investor B | | 0.25 | % | | 0.75 | % |
Investor C | | 0.25 | % | | 0.75 | % |
Pursuant to sub-agreements with BRIL, broker-dealers and BRIL provide shareholder servicing and distribution services to each Fund. The ongoing service and/or distribution fee compensates BRIL and each broker-dealer for providing shareholder servicing and/or distribution related services to Service, Investor A, Investor B and Investor C shareholders.
For the six months ended March 31, 2010, affiliates earned underwriting discounts, direct commissions and dealer concessions on sales of each Fund’s Investor A Shares as follows:
| | | |
Small Cap Core Equity | | $ | 517 |
Small Cap Growth Equity | | $ | 6,998 |
For the six months ended March 31, 2010, affiliates received the following contingent deferred sales charges relating to transactions in Investor A, Investor B and Investor C Shares:
| | | | | | | | | |
| | | Investor A | | Investor B | | Investor C |
Small Cap Core Equity | | | — | | $ | 2,837 | | $ | 374 |
Small Cap Growth Equity | | $ | 750 | | $ | 1,454 | | $ | 2,845 |
PFPC Trust Company, an indirect, wholly owned subsidiary of PNC, serves as custodian for each Fund. For these services, the custodian receives a fee computed daily and payable monthly, based on a percentage of the average daily gross assets of each Fund. The fee is paid at the following annual rates: 0.005% of the first $400 million, 0.004% of the next $1.6 billion and 0.003% of average daily gross assets in excess of $2 billion; plus per transaction charges and other miscellaneous fees incurred on behalf of each Fund.
The Funds have an arrangement with the custodian whereby fees may be reduced by credits earned on uninvested cash balances, which if applicable are shown as fees paid indirectly in the Statements of Operations. The custodian imposes fees on overdrawn cash balances, which can be offset by accumulated credits earned or may result in additional custody charges.
PNC Global Investment Servicing (U.S.) Inc. (“PNCGIS”), an indirect, wholly owned subsidiary of PNC and an affiliate of the Manager, serves as transfer and dividend disbursing agent. Transfer agency fees borne by the Funds are comprised of those fees charged for all shareholder communications including mailing of shareholder reports, dividend and distribution notices, and proxy materials for shareholders meetings, as well as per account and per transaction fees related to servicing and maintenance of shareholder accounts, including the issuing, redeeming and transferring of shares, check writing, anti-money laundering services, and customer identification services.
Pursuant to written agreements, certain affiliates provide the Funds with sub-accounting, recordkeeping, sub-transfer agency and other administrative services with respect to sub-accounts they service. For these services, these affiliates receive an annual fee per shareholder account which will vary depending on share class. For the six months ended March 31, 2010, the Funds paid the following in return for these services which is included in transfer agent — class specific in the Statements of Operations:
| | | |
Small Cap Core Equity | | $ | 5,127 |
Small Cap Growth Equity | | $ | 111,029 |
| | | | | | |
| 26 | | BLACKROCK FUNDS | | MARCH 31, 2010 | | |
Notes to Financial Statements (continued)
The Manager maintains a call center, which is responsible for providing certain shareholder services to the Funds, such as responding to shareholder inquiries and processing transactions based upon instructions from shareholders with respect to the subscription and redemption of Fund shares. For the six months ended March 31, 2010, each Fund reimbursed the Manager the following amounts for costs incurred in running the call center, which are included in transfer agent — class specific in the Statements of Operations.
| | | | | | |
| | | Call Center |
Share Classes | | Small Cap
Core Equity | | Small Cap
Growth Equity |
Institutional | | $ | 280 | | $ | 8,917 |
Service | | | — | | | 411 |
Investor A | | | 2,533 | | | 8,813 |
Investor B | | | 329 | | | 298 |
Investor C | | | 1,134 | | | 2,069 |
| | | | | | |
Total | | $ | 4,276 | | $ | 20,508 |
| | | | | | |
PNCGIS and the Manager act as co-administrators for the Funds. For these services, the co-administrators receive a combined administration fee computed daily and payable monthly, based on a percentage of the average daily net assets of each Fund. The combined administration fee is paid at the following annual rates: 0.075% of the first $500 million, 0.065% of the next $500 million and 0.055% of average daily net assets in excess of $1 billion. In addition, each of the share classes is charged an administration fee based on the following percentages of average daily net assets of each respective class: 0.025% of the first $500 million, 0.015% of the next $500 million and 0.005% of average daily net assets in excess of $1 billion. In addition, PNCGIS and the Manager may have, at their discretion, voluntarily waived all or any portion of their administration fees for a Fund or a share class which are included in administration fees waived and administration fees waived — class specific in the Statements of Operations.
The Funds have received an exemptive order from the SEC permitting, among other things, to pay an affiliated securities lending agent a fee based on a share of the income derived from the securities lending activities and has retained BlackRock Investment Management, LLC (“BIM”) as the securities lending agent. BIM may, on behalf of the Funds, invest cash collateral received by a Fund for such loans, among other things, in a private investment company managed by the Manager or in registered money market funds advised by the Manager or its affiliates. The market value of securities on loan and the value of the related collateral are shown on the Statements of Assets and Liabilities as securities loaned and collateral at value — securities loaned, respectively. The cash collateral invested by BIM is disclosed in the Schedules of Investments. The share of income earned by the Funds on such investments is shown as securities lending — affiliated in the Statements of Operations. For the six months ended March 31, 2010, BIM received $32,114 in securities lending agent fees related to securities lending activities for the Funds.
For the six months ended March 31, 2010, the following tables show the various types of class specific expenses borne directly by each class of each Fund and any associated waivers or reimbursements of those expenses.
Administration Fees
| | | | | | |
Share Classes | | Small Cap
Core Equity | | Small Cap
Growth Equity |
Institutional | | $ | 5,008 | | $ | 90,266 |
Service | | | 33 | | | 5,827 |
Investor A | | | 2,061 | | | 31,424 |
Investor B | | | 416 | | | 393 |
Investor C | | | 1,966 | | | 3,304 |
| | | | | | |
Total | | $ | 9,484 | | $ | 131,214 |
| | | | | | |
Administration Fees Waived
| | | |
Share Classes | | Small Cap
Core Equity |
Institutional | | $ | 4,940 |
Service | | | 29 |
Investor A | | | 2,061 |
Investor B | | | 416 |
Investor C | | | 1,678 |
| | | |
Total | | $ | 9,124 |
| | | |
Service and Distribution Fees
| | | | | | |
Share Classes | | Small Cap
Core Equity | | Small Cap
Growth Equity |
Service | | $ | 325 | | $ | 58,264 |
Investor A | | | 20,596 | | | 310,540 |
Investor B | | | 16,640 | | | 15,634 |
Investor C | | | 78,470 | | | 132,139 |
| | | | | | |
Total | | $ | 116,031 | | $ | 516,577 |
| | | | | | |
Transfer Agent Fees
| | | | | | |
Share Classes | | Small Cap
Core Equity | | Small Cap
Growth Equity |
Institutional | | $ | 18,195 | | $ | 617,434 |
Service | | | 248 | | | 35,032 |
Investor A | | | 35,986 | | | 359,784 |
Investor B | | | 6,673 | | | 8,236 |
Investor C | | | 29,309 | | | 58,241 |
| | | | | | |
Total | | $ | 90,411 | | $ | 1,078,727 |
| | | | | | |
Transfer Agent Fees Waived
| | | |
Share Classes | | Small Cap
Core Equity |
Institutional | | $ | 231 |
Investor A | | | 2,533 |
Investor B | | | 328 |
Investor C | | | 1,027 |
| | | |
Total | | $ | 4,119 |
| | | |
| | | | | | |
| | | BLACKROCK FUNDS | | MARCH 31, 2010 | | 27 |
Notes to Financial Statements (continued)
Transfer Agent Fees Reimbursed
| | | |
Share Classes | | Small Cap
Core Equity |
Institutional | | $ | 4,110 |
Service | | | 75 |
Investor A | | | 8,774 |
Investor B | | | 895 |
Investor C | | | 2,814 |
| | | |
Total | | $ | 16,668 |
| | | |
The Funds may also receive earnings credits related to cash balances with PNCGIS which are shown on the Statements of Operations as fees paid indirectly.
Certain officers and/or trustees of the Trust are officers and/or directors of BlackRock or its affiliates. The Funds reimburse the Manager for compensation paid to the Trust’s Chief Compliance Officer.
3. Investments:
Purchases and sales of investments, excluding short-term securities, for the six months ended March 31, 2010 were as follows:
| | | | | | |
| | | Purchases | | Sales |
Small Cap Core Equity | | $ | 47,596,439 | | $ | 48,952,281 |
Small Cap Growth Equity | | $ | 880,508,619 | | $ | 905,653,285 |
4. Borrowings:
The Funds, along with certain other funds managed by the Manager and its affiliates, are a party to a $500 million credit agreement with a group of lenders, which was renewed until November 2010. The Funds may borrow under the credit agreement to fund shareholder redemptions. Prior to its renewal, the credit agreement had the following terms:
0.02% upfront fee on the aggregate commitment amount which was allocated to the Funds based on its net assets as of October 31, 2008; a commitment fee of 0.08% per annum based on the Funds’ pro rata share of the unused portion of the credit agreement, which is included in miscellaneous in the Statements of Operations, and interest at a rate equal to the higher of the (a) federal funds effective rate and (b) reserve adjusted one-month LIBOR, plus, in each case, the higher of (i) 1.50% and (ii) 50% of the CDX Index (as defined in the credit agreement) on amounts borrowed. Effective November 2009, the credit agreement was renewed with the following terms: 0.02% upfront fee on the aggregate commitment amount which was allocated to the Funds based on its net assets as of October 31, 2009, a commitment fee of 0.10% per annum based on the Funds’ pro rata share of the unused portion of the credit agreement and interest at a rate equal to the higher of (a) the one-month LIBOR plus 1.25% per annum and (b) the Fed Funds rate plus 1.25% per annum on amounts borrowed. The Funds did not borrow under the credit agreement during the six months ended March 31, 2010.
5. Capital Loss Carryforward:
As of September 30, 2009, the Funds had capital loss carryforwards available to offset future realized capital gains through the indicated expiration dates:
| | | | | | |
Expiring September 30, | | Small Cap
Core Equity | | Small Cap
Growth Equity |
2010 | | | — | | $ | 337,418,276 |
2011 | | | — | | | 104,987,092 |
2016 | | $ | 461,113 | | | — |
2017 | | | 17,481,071 | | | 19,294,816 |
| Total | | $ | 17,942,184 | | $ | 461,700,184 |
6. Concentration, Market and Credit Risk:
In the normal course of business, the Funds invest in securities and enter into transactions where risks exist due to fluctuations in the market (market risk) or failure of the issuer of a security to meet all its obligations (credit risk). The value of securities held by the Funds may decline in response to certain events, including those directly involving the issuers whose securities are owned by the Funds; conditions affecting the general economy; overall market changes; local, regional or global political, social or economic instability; and currency and interest rate and price fluctuations. Similar to credit risk, the Funds may be exposed to counterparty risk, or the risk that an entity with which the Funds have unsettled or open transactions may default. The Funds manage counterparty risk by entering into transactions only with counterparties that they believe have the financial resources to honor their obligations and by monitoring the financial stability of those counterparties. Financial assets, which potentially expose the Funds to credit and counterparty risks, consist principally of investments and cash due from counterparties. The extent of the Funds’ exposure to credit and counterparty risks with respect to these financial assets is generally approximated by their value recorded in the Funds’ Statements of Assets and Liabilities, less any collateral held by the Funds.
Small Cap Core Equity invests a significant portion of its assets in securities in the consumer discretionary sector. Changes in economic conditions affecting the consumer discretionary sector would have a greater impact on Small Cap Core Equity and could affect the value, income and/or liquidity of positions in such securities.
Small Cap Growth Equity invests a significant portion of its assets in securities in the health care and information technology sectors. Changes in economic conditions affecting the health care and information technology sectors would have a greater impact on Small Cap Growth Equity and could affect the value, income and/or liquidity of positions in such securities.
| | | | | | |
| 28 | | BLACKROCK FUNDS | | MARCH 31, 2010 | | |
Notes to Financial Statements (continued)
7. Capital Shares Transactions:
Transactions in capital shares for each class were as follows:
| | | | | | | | | | | | | | |
| | | Six Months Ended
March 31, 2010 | | | Year Ended
September 30, 2009 | |
Small Cap Core Equity | | Shares | | | Amount | | | Shares | | | Amount | |
Institutional | | | | | | | | | | | | | | |
Shares sold | | 850,179 | | | $ | 12,055,452 | | | 1,758,408 | | | $ | 20,427,130 | |
Shares redeemed | | (599,963 | ) | | | (8,335,891 | ) | | (1,382,403 | ) | | | (15,970,494 | ) |
| | | | | | | | | | | | | | |
Net increase | | 250,216 | | | $ | 3,719,561 | | | 376,005 | | | $ | 4,456,636 | |
| | | | | | | | | | | | | | |
Service | | | | | | | | | | | | | | |
Shares sold | | 2,086 | | | $ | 30,150 | | | 1,875 | | | $ | 24,788 | |
Shares redeemed | | (1,049 | ) | | | (14,518 | ) | | (201,071 | ) | | | (2,095,004 | ) |
| | | | | | | | | | | | | | |
Net increase (decrease) | | 1,037 | | | $ | 15,632 | | | (199,196 | ) | | $ | (2,070,216 | ) |
| | | | | | | | | | | | | | |
Investor A | | | | | | | | | | | | | | |
Shares sold and automatic conversion of shares | | 112,206 | | | $ | 1,551,262 | | | 548,033 | | | $ | 6,184,360 | |
Shares redeemed | | (224,401 | ) | | | (3,077,112 | ) | | (800,480 | ) | | | (8,879,333 | ) |
| | | | | | | | | | | | | | |
Net decrease | | (112,195 | ) | | $ | (1,525,850 | ) | | (252,447 | ) | | $ | (2,694,973 | ) |
| | | | | | | | | | | | | | |
Investor B | | | | | | | | | | | | | | |
Shares sold | | 1,444 | | | $ | 18,922 | | | 20,422 | | | $ | 221,427 | |
Shares redeemed and automatic conversion of shares | | (51,954 | ) | | | (695,363 | ) | | (124,419 | ) | | | (1,351,280 | ) |
| | | | | | | | | | | | | | |
Net decrease | | (50,510 | ) | | $ | (676,441 | ) | | (103,997 | ) | | $ | (1,129,853 | ) |
| | | | | | | | | | | | | | |
Investor C | | | | | | | | | | | | | | |
Shares sold | | 49,124 | | | $ | 652,054 | | | 335,644 | | | $ | 3,600,054 | |
Shares redeemed | | (216,758 | ) | | | (2,879,752 | ) | | (805,955 | ) | | | (8,677,851 | ) |
| | | | | | | | | | | | | | |
Net decrease | | (167,634 | ) | | $ | (2,227,698 | ) | | (470,311 | ) | | $ | (5,077,797 | ) |
| | | | | | | | | | | | | | |
Small Cap Growth Equity | | | | | | | | | | | | | | |
Institutional | | | | | | | | | | | | | | |
Shares sold | | 6,774,182 | | | $ | 132,542,872 | | | 21,900,414 | | | $ | 327,652,184 | |
Shares redeemed | | (8,326,594 | ) | | | (161,323,384 | ) | | (10,481,639 | ) | | | (154,571,251 | ) |
| | | | | | | | | | | | | | |
Net increase (decrease) | | (1,552,412 | ) | | $ | (28,780,512 | ) | | 11,418,775 | | | $ | 173,080,933 | |
| | | | | | | | | | | | | | |
Service | | | | | | | | | | | | | | |
Shares sold | | 421,691 | | | $ | 7,775,148 | | | 771,911 | | | $ | 11,226,147 | |
Shares redeemed | | (262,986 | ) | | | (4,822,744 | ) | | (384,928 | ) | | | (5,379,054 | ) |
| | | | | | | | | | | | | | |
Net increase | | 158,705 | | | $ | 2,952,404 | | | 386,983 | | | $ | 5,847,093 | |
| | | | | | | | | | | | | | |
| | | | | | |
| | | BLACKROCK FUNDS | | MARCH 31, 2010 | | 29 |
Notes to Financial Statements (concluded)
| | | | | | | | | | | | | | |
| | | Six Months Ended
March 31, 2010 | | | Year Ended
September 30, 2009 | |
Small Cap Growth Equity (concluded) | | Shares | | | Amount | | | Shares | | | Amount | |
Investor A | | | | | | | | | | | | | | |
Shares sold and automatic conversion of shares | | 2,366,396 | | | $ | 41,972,321 | | | 8,308,265 | | | $ | 113,395,899 | |
Shares redeemed | | (2,288,582 | ) | | | (40,787,983 | ) | | (5,536,858 | ) | | | (76,034,812 | ) |
| | | | | | | | | | | | | | |
Net increase | | 77,814 | | | $ | 1,184,338 | | | 2,771,407 | | | $ | 37,361,087 | |
| | | | | | | | | | | | | | |
Investor B | | | | | | | | | | | | | | |
Shares sold | | 6,050 | | | $ | 96,280 | | | 51,310 | | | $ | 629,797 | |
Shares redeemed and automatic conversion of shares | | (52,482 | ) | | | (840,723 | ) | | (175,040 | ) | | | (2,092,414 | ) |
| | | | | | | | | | | | | | |
Net increase decrease | | (46,432 | ) | | $ | (744,443 | ) | | (123,730 | ) | | $ | (1,462,617 | ) |
| | | | | | | | | | | | | | |
Investor C | | | | | | | | | | | | | | |
Shares sold | | 310,348 | | | $ | 4,812,111 | | | 736,351 | | | $ | 9,084,571 | |
Shares redeemed | | (300,604 | ) | | | (4,600,320 | ) | | (481,958 | ) | | | (5,825,419 | ) |
| | | | | | | | | | | | | | |
Net increase | | 9,744 | | | $ | 211,791 | | | 254,393 | | | $ | 3,259,152 | |
| | | | | | | | | | | | | | |
There is a 2% redemption fee on shares redeemed or exchanged within 30 days of purchase. The redemption fees are collected and retained by the Funds for the benefit of its remaining shareholders. The redemption fees are recorded as a credit to paid-in capital.
8. Subsequent Events:
Management has evaluated the impact of all subsequent events on the Funds through the date the financial statements were issued and has determined that there were no subsequent events requiring adjustment or additional disclosure in the financial statements.
| | | | | | |
| 30 | | BLACKROCK FUNDS | | MARCH 31, 2010 | | |
Officers and Trustees
Ronald W. Forbes, Co-Chairman of the Board and Trustee
Rodney D. Johnson, Co-Chairman of the Board and Trustee
David O. Beim, Trustee
Richard S. Davis, Trustee
Henry Gabbay, Trustee
Dr. Matina Horner, Trustee
Herbert I. London, Trustee and Member of the Audit Committee
Cynthia A. Montgomery, Trustee
Joseph P. Platt, Jr., Trustee
Robert C. Robb, Jr., Trustee
Toby Rosenblatt, Trustee
Kenneth L. Urish, Chairman of the Audit Committee and Trustee
Frederick W. Winter, Trustee and Member of the Audit Committee
Anne F. Ackerley, President and Chief Executive Officer
Richard Hoerner, CFA, Vice President
Jeffrey Holland, CFA, Vice President
Brendan Kyne, Vice President
Simon Mendelson, Vice President
Brian Schmidt, Vice President
Christopher Stavrakos, CFA, Vice President
Neal J. Andrews, Chief Financial Officer
Jay M. Fife, Treasurer
Brian P. Kindelan, Chief Compliance Officer
Howard B. Surloff, Secretary
Investment Advisor and Co-Administrator
BlackRock Advisors, LLC
Wilmington, DE 19809
Investment Advisor and Co-Administrator
BlackRock Advisors, LLC
Wilmington, DE 19809
Accounting Agent, Co-Administrator and Transfer Agent
PNC Global Investment Servicing (U.S.) Inc.
Wilmington, DE 19809
Custodian
PFPC Trust Company
Philadelphia, PA 19153
Distributor
BlackRock Investments, LLC
New York, NY 10022
Legal Counsel
Sidley Austin LLP
New York, NY 10019
Independent Registered Public Accounting Firm
Deloitte & Touche LLP
Philadelphia, PA 19103
Address of the Trust
100 Bellevue Parkway
Wilmington, DE 19809
| | | | | | |
| | | BLACKROCK FUNDS | | MARCH 31, 2010 | | 31 |
Additional Information
General Information
Electronic Delivery
Electronic copies of most financial reports and prospectuses are available on the Fund’s website or shareholders can sign up for e-mail notifications of quarterly statements, annual and semi-annual reports and prospectuses by enrolling in the Fund’s electronic delivery program.
To enroll:
Shareholders Who Hold Accounts with Investment Advisors, Banks or Brokerages:
Please contact your financial advisor to enroll. Please note that not all investment advisors, banks or brokerages may offer this service.
Shareholders Who Hold Accounts Directly With BlackRock
| 1) | Access the BlackRock website at |
http://www.blackrock.com/ edelivery
| 2) | Select “eDelivery” under the “More Information” section |
Householding
The Funds will mail only one copy of shareholder documents, including annual and semi-annual reports and proxy statements, to shareholders with multiple accounts at the same address. This practice is commonly called “householding” and it is intended to reduce expenses and eliminate duplicate mailings of shareholder documents. Mailings of your shareholder documents may be householded indefinitely unless you instruct us otherwise. If you do not want the mailing of these documents to be combined with those for other members of your household, please contact the Funds at (800) 441-7762.
Availability of Quarterly Portfolio Schedule
The Funds file their complete schedule of portfolio holdings with the Securities and Exchange Commission (the “SEC”) for the first and third quarters of each fiscal year on Form N-Q. The Funds’ Forms N-Q are available on the SEC’s website at http://www.sec.gov and may also be reviewed and copied at the SEC’s Public Reference Room in Washington, D.C. Information on the operation of the Public Reference Room may be obtained by calling (800) SEC-0330. The Funds’ Forms N-Q may also be obtained upon request and without charge by calling (800) 441-7762.
Availability of Proxy Voting Policies and Procedures
A description of the policies and procedures that the Funds use to determine how to vote proxies relating to portfolio securities is available (1) without charge, upon request, by calling (800) 441-7762; (2) at www.blackrock.com; and (3) on the SEC’s website at http:// www.sec.gov.
Availability of Proxy Voting Record
Information about how the Funds voted proxies relating to securities held in the Funds’ portfolios during the most recent 12-month period ended June 30 is available upon request, and without charge (1) at www.blackrock.com or by calling (800) 441-7762 and (2) on the SEC’s website at http://www.sec.gov.
Shareholder Privileges
Account Information
Call us at (800) 441-7762 from 8:00 AM to 6:00 PM EST on any business day to get information about your account balances, recent transactions and share prices. You can also reach us on the Web at www.blackrock.com/funds.
Automatic Investment Plans
Investor Class shareholders who want to invest regularly can arrange to have $50 or more automatically deducted from their checking or savings account and invested in any of the BlackRock funds.
Systematic Withdrawal Plan
Investor Class shareholders can establish a systematic withdrawal plan and receive periodic payments of $50 or more from their BlackRock funds, as long as their account balance is at least $10,000.
Retirement Plans
Shareholders may make investments in conjunction with Traditional, Rollover, Roth, Coverdell, Simple IRAs, SEP IRAs and 403(b) Plans.
| | | | | | |
| 32 | | BLACKROCK FUNDS | | MARCH 31, 2010 | | |
Additional Information (concluded)
BlackRock Privacy Principles
BlackRock is committed to maintaining the privacy of its current and former fund investors and individual clients (collectively, “Clients”) and to safeguarding their nonpublic personal information. The following information is provided to help you understand what personal information BlackRock collects, how we protect that information and why in certain cases we share such information with select parties.
If you are located in a jurisdiction where specific laws, rules or regulations require BlackRock to provide you with additional or different privacy-related rights beyond what is set forth below, then BlackRock will comply with those specific laws, rules or regulations.
BlackRock obtains or verifies personal nonpublic information from and about you from different sources, including the following: (i) information we receive from you or, if applicable, your financial intermediary, on applications, forms or other documents; (ii) information about your transactions with us, our affiliates, or others; (iii) information we receive from a consumer reporting agency; and (iv) from visits to our websites.
BlackRock does not sell or disclose to non-affiliated third parties any nonpublic personal information about its Clients, except as permitted by law or as is necessary to respond to regulatory requests or to service Client accounts. These non-affiliated third parties are required to protect the confidentiality and security of this information and to use it only for its intended purpose.
We may share information with our affiliates to service your account or to provide you with information about other BlackRock products or services that may be of interest to you. In addition, BlackRock restricts access to nonpublic personal information about its Clients to those BlackRock employees with a legitimate business need for the information. BlackRock maintains physical, electronic and procedural safeguards that are designed to protect the nonpublic personal information of its Clients, including procedures relating to the proper storage and disposal of such information.
| | | | | | |
| | | BLACKROCK FUNDS | | MARCH 31, 2010 | | 33 |
A World-Class Mutual Fund Family
BlackRock offers a diverse lineup of open-end mutual funds crossing all investment styles and managed by experts in equity, fixed income and tax-exempt investing.
| | | | |
Equity Funds | | | | |
| | |
BlackRock All-Cap Energy & Resources Portfolio | | BlackRock Global Growth Fund | | BlackRock Mid-Cap Value Equity Portfolio |
BlackRock Asset Allocation Portfolio† | | BlackRock Global Opportunities Portfolio | | BlackRock Mid Cap Value Opportunities Fund |
BlackRock Aurora Portfolio | | BlackRock Global SmallCap Fund | | BlackRock Natural Resources Trust |
BlackRock Balanced Capital Fund† | | BlackRock Health Sciences Opportunities Portfolio | | BlackRock Pacific Fund |
BlackRock Basic Value Fund | | BlackRock Healthcare Fund | | BlackRock Science & Technology |
BlackRock Capital Appreciation Portfolio | | BlackRock Index Equity Portfolio* | | Opportunities Portfolio |
BlackRock Energy & Resources Portfolio | | BlackRock International Fund | | BlackRock Small Cap Core Equity Portfolio |
BlackRock Equity Dividend Fund | | BlackRock International Index Fund | | BlackRock Small Cap Growth Equity Portfolio |
BlackRock EuroFund | | BlackRock International Opportunities Portfolio | | BlackRock Small Cap Growth Fund II |
BlackRock Focus Growth Fund | | BlackRock International Value Fund | | BlackRock Small Cap Index Fund |
BlackRock Focus Value Fund | | BlackRock Large Cap Core Fund | | BlackRock Small/Mid-Cap Growth Portfolio |
BlackRock Fundamental Growth Fund | | BlackRock Large Cap Core Plus Fund | | BlackRock S&P 500 Index Fund |
BlackRock Global Allocation Fund† | | BlackRock Large Cap Growth Fund | | BlackRock U.S. Opportunities Portfolio |
BlackRock Global Dynamic Equity Fund | | BlackRock Large Cap Value Fund | | BlackRock Utilities and Telecommunications Fund |
BlackRock Global Emerging Markets Fund | | BlackRock Latin America Fund | | BlackRock Value Opportunities Fund |
BlackRock Global Financial Services Fund | | BlackRock Mid-Cap Growth Equity Portfolio | | |
Fixed Income Funds
| | | | |
| | |
BlackRock Bond Portfolio | | BlackRock Income Builder Portfolio† | | BlackRock Managed Income Portfolio |
BlackRock Emerging Market Debt Portfolio | | BlackRock Inflation Protected Bond Portfolio | | BlackRock Multi-Sector Bond Portfolio |
BlackRock GNMA Portfolio | | BlackRock Intermediate Government | | BlackRock Short-Term Bond Fund |
BlackRock Government Income Portfolio | | Bond Portfolio | | BlackRock Strategic Income Opportunities Portfolio |
BlackRock High Income Fund | | BlackRock International Bond Portfolio | | BlackRock Total Return Fund |
BlackRock High Yield Bond Portfolio | | BlackRock Long Duration Bond Portfolio | | BlackRock Total Return Portfolio II |
BlackRock Income Portfolio† | | BlackRock Low Duration Bond Portfolio | | BlackRock World Income Fund |
Municipal Bond Funds
| | | | |
| | |
BlackRock AMT-Free Municipal Bond Portfolio | | BlackRock Kentucky Municipal Bond Portfolio | | BlackRock New York Municipal Bond Fund |
BlackRock California Municipal Bond Fund | | BlackRock Municipal Insured Fund | | BlackRock Ohio Municipal Bond Portfolio |
BlackRock High Yield Municipal Fund | | BlackRock National Municipal Fund | | BlackRock Pennsylvania Municipal Bond Fund |
BlackRock Intermediate Municipal Fund | | BlackRock New Jersey Municipal Bond Fund | | BlackRock Short-Term Municipal Fund |
Target Risk & Target Date Funds
| | | | |
| | |
BlackRock Prepared Portfolios | | BlackRock Lifecycle Prepared Portfolios | | |
Conservative Prepared Portfolio | | Prepared Portfolio 2010 | | Prepared Portfolio 2030 |
Moderate Prepared Portfolio | | Prepared Portfolio 2015 | | Prepared Portfolio 2035 |
Growth Prepared Portfolio | | Prepared Portfolio 2020 | | Prepared Portfolio 2040 |
Aggressive Growth Prepared Portfolio | | Prepared Portfolio 2025 | | Prepared Portfolio 2045 |
| | | | Prepared Portfolio 2050 |
| * | See the prospectus for information on specific limitations on investments in the fund. |
BlackRock mutual funds are distributed by BlackRock Investments, LLC. You should consider the investment objectives, risks, charges and expenses of the funds under consideration carefully before investing. Each fund’s prospectus contains this and other information and is available at www.blackrock.com or by calling (800) 441-7762 or from your financial advisor. The prospectus should be read carefully before investing.
| | | | | | |
| 34 | | BLACKROCK FUNDS | | MARCH 31, 2010 | | |
[THIS PAGE INTENTIONALLY LEFT BLANK.]

This report is transmitted to shareholders only. It is not authorized for use as an offer of sale or a solicitation of an offer to buy shares of the Funds unless accompanied or preceded by the Funds’ current prospectus. Past performance results shown in this report should not be considered a representation of future performance. Investment returns and principal value of shares will fluctuate so that shares, when redeemed, may be worth more or less than their original cost. Statements and other information herein are as dated and are subject to change.

EQUITY2-3/10-SAR
| | |
| BlackRock FundsSM | |  |
| |
| SEMI-ANNUAL REPORT MARCH 31, 2010 (UNAUDITED) | | |
BlackRock Mid-Cap Growth Equity Portfolio
BlackRock Mid-Cap Value Equity Portfolio
BlackRock Small/Mid-Cap Growth Portfolio
NOT FDIC INSURED
MAY LOSE VALUE
NO BANK GUARANTEE
Table of Contents
| | | | | | |
2 | | BLACKROCK FUNDS | | MARCH 31, 2010 | | |
Dear Shareholder
The past year has seen a remarkable turnaround from the conditions that plagued the global economy and financial markets in 2008 through early 2009. In our opinion, the “Great Recession” likely ended at some point last summer, thanks primarily to massive fiscal and monetary stimulus. From that point, the global economy has moved into recovery mode and, we believe, is getting ready to start transitioning into an expansion.
Global equity markets bottomed in early 2009 and since that time have soared dramatically higher as investors were lured back into the markets by depressed valuations, desire for higher yields and increasing confidence that all-out financial disaster had been averted. There have been several corrections along the way and volatility levels have remained elevated – reflections of mixed economic data, lingering deflation issues (especially in Europe) and concerns over the future direction of interest rates. On balance, however, strong corporate earnings and a positive macro backdrop have helped keep the equity bull market intact. From a geographic perspective, US equities have generally outpaced their international counterparts in recent months, as the domestic economic recovery has been more pronounced.
Within fixed income markets, improving economic conditions, concerns over the US deficit and a lack of demand at recent Treasury auctions have recently conspired to push Treasury yields higher (and prices correspondingly lower). In this environment, Treasuries have dramatically underperformed other areas of the bond market, particularly the high yield sector, which has been benefiting from increased investor demand. Meanwhile, municipal bonds outperformed taxable sectors over the twelve-month period thanks to continued high demand levels, but have struggled in recent months against a weak fundamental backdrop marked by ongoing state and local budget problems. As in the taxable arena, high yield municipals have been outperforming the rest of the market.
Regarding cash investments, yields on money market securities remain near all-time lows (producing returns only marginally above zero percent), with the Federal Open Market Committee reiterating that economic circumstances are likely to necessitate an accommodative interest rate stance for an “extended period.”
Against this backdrop, the major market averages posted the following returns:
| | | | | | |
Total Returns as of March 31, 2010 | | 6-month | | | 12-month | |
US equities (S&P 500 Index) | | 11.75 | % | | 49.77 | % |
Small cap US equities (Russell 2000 Index) | | 13.07 | | | 62.76 | |
International equities (MSCI Europe, Australasia, Far East Index) | | 3.06 | | | 54.44 | |
3-month Treasury bill (BofA Merrill Lynch 3-Month Treasury Bill Index) | | 0.05 | | | 0.17 | |
US Treasury securities (BofA Merrill Lynch 10-Year US Treasury Index) | | (2.62 | ) | | (6.30 | ) |
Taxable fixed income (Barclays Capital US Aggregate Bond Index) | | 1.99 | | | 7.69 | |
Tax-exempt fixed income (Barclays Capital Municipal Bond Index) | | 0.28 | | | 9.69 | |
High yield bonds (Barclays Capital US Corporate High Yield 2% Issuer Capped Index) | | 10.97 | | | 55.64 | |
Past performance is no guarantee of future results. Index performance shown for illustrative purposes only. You cannot invest directly in an index.
Global financial markets continue to show signs of improvement, but questions about the strength and sustainability of the recovery abound. Through periods of uncertainty, as ever, BlackRock’s full resources are dedicated to the management of our clients’ assets. For additional market perspective and investment insight, visit www.blackrock.com/shareholdermagazine, where you’ll find the most recent issue of our award-winning Shareholder® magazine, as well as its quarterly companion newsletter, Shareholder Perspectives. As always, we thank you for entrusting BlackRock with your investments, and we look forward to your continued partnership in the months and years ahead.
|
| Sincerely, |
|
 |
| Rob Kapito |
| President, BlackRock Advisors, LLC |
THIS PAGE NOT PART OF YOUR FUND REPORT
| | |
| Fund Summary as of March 31, 2010 | | BlackRock Mid-Cap Growth Equity Portfolio |
| |
Portfolio Management Commentary | | |
How did the Fund perform?
| | • | | The Fund generated strong returns for the six-month period, but underperformed the benchmark Russell Midcap Growth Index. |
What factors influenced performance?
| | • | | Strong stock selection in the materials and health care sectors contributed to overall performance for the period. Within the materials sector, chemical company Agrium, Inc. climbed more than 40% on incrementally higher demand for the company’s fertilizer products. Additionally, chemical company Airgas, Inc. rose more than 30%, benefiting from an unsolicited offer from a competitor to acquire the company. In health care, a number of holdings within biotechnology were the main contributors to the Fund’s outperformance in the sector. Cancer research company OSI Pharmaceuticals, Inc. jumped over 60% during the period upon receiving an acquisition bid from a larger pharmaceutical company. In addition, home oxygen provider Lincare Holdings, Inc. was up more than 40% on improving company fundamentals. |
| | • | | In contrast, weaker stock selection in the consumer discretionary and financials sectors held back relative returns for the period. Within consumer discretionary, video game retailer GameStop Corp. - Class A detracted, as the stock fell nearly 17% after posting disappointing financial results. Instant lottery ticket provider Scientific Games Corp. - Class A also dropped close to 10%, as investors remained concerned over the details of an upcoming overseas contract renewal from a major customer. In the financials sector, asset manager holding Invesco Ltd. sold off in the middle of the period on concerns of lower-than-expected revenues, finished down approximately 3% at period end. Exchange provider CME Group, Inc. also detracted for the period on concerns that possible regulatory changes could negatively affect the company’s business model. |
Describe recent portfolio activity.
| | • | | During the six months, we decreased the Fund’s weightings in both the consumer discretionary and industrial sectors, eliminating positions in lululemon athletica, inc. and Spirit AeroSystems Holdings, Inc., respectively. We also further increased the Fund’s weighting in the health care sector. |
Describe Fund positioning at period end.
| | • | | At period end, the health care sector remains the Fund’s most significant overweight relative to the Russell Midcap Growth Index (by approximately 450 basis points), while the consumer discretionary sector is the largest underweight (roughly 370 basis points). |
The views expressed reflect the opinions of BlackRock as of the date of this report and are subject to change based on changes in market, economic or other conditions. These views are not intended to be a forecast of future events and are no guarantee of future results.
Portfolio Information
| | | |
Ten Largest Holdings | | Percent of
Long-Term
Investments | |
TiVo, Inc. | | 3 | % |
Agrium, Inc. | | 2 | |
BE Aerospace, Inc. | | 2 | |
Lincare Holdings, Inc. | | 2 | |
Scientific Games Corp. - Class A | | 2 | |
Avon Products, Inc. | | 2 | |
Lam Research Corp. | | 2 | |
Genpact Ltd. | | 2 | |
Amdocs Ltd. | | 2 | |
Alliance Data Systems Corp. | | 2 | |
| |
Sector Allocation | | Percent of
Long-Term
Investments | |
Information Technology | | 26 | % |
Health Care | | 19 | |
Consumer Discretionary | | 16 | |
Industrials | | 12 | |
Energy | | 7 | |
Materials | | 7 | |
Financials | | 7 | |
Consumer Staples | | 5 | |
Telecommunication Services | | 1 | |
For Fund compliance purposes, the Fund’s sector classifications refer to any one or more of the sector sub-classifications used by one or more widely recognized market indexes or ratings group indexes, and/or as defined by Fund management. This definition may not apply for purposes of this report, which may combine sector sub-classifications for reporting ease.
| | | | | | |
4 | | BLACKROCK FUNDS | | MARCH 31, 2010 | | |
| | |
| | BlackRock Mid-Cap Growth Equity Portfolio |
| |
Total Return Based on a $10,000 Investment | | |
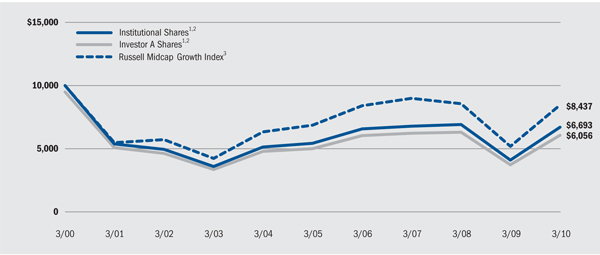
| 1 | Assuming maximum sales charge, if any, transaction costs and other operating expenses, including advisory fees. Institutional Shares do not have a sales charge. |
| 2 | The Fund normally invests at least 80% of its net assets in equity securities issued by US mid-capitalization growth companies, which the portfolio management team believes have above-average earnings growth potential. |
| 3 | An index that consists of the bottom 800 securities of the Russell 1000 Index with greater-than-average growth orientation as ranked by total market capitalization. Securities in this index generally have higher price-to-book and price-to-earnings ratios, lower dividend yields and higher forecasted growth values. |
Performance Summary for the Period Ended March 31, 2010
| | | | | | | | | | | | | | | | | | | | | |
| | | 6-Month
Total Returns | | | Average Annual Total Returns4 | |
| | | 1 Year | | | 5 Years | | | 10 Years | |
| | | w/o sales
charge | | | w/ sales
charge | | | w/o sales
charge | | | w/ sales
charge | | | w/o sales
charge | | | w/ sales
charge | |
Institutional | | 14.12 | % | | 63.46 | % | | N/A | | | 4.37 | % | | N/A | | | (3.94 | )% | | N/A | |
Service | | 13.91 | | | 62.63 | | | N/A | | | 4.03 | | | N/A | | | (4.21 | ) | | N/A | |
Investor A | | 13.94 | | | 62.75 | | | 54.14 | % | | 3.92 | | | 2.80 | % | | (4.38 | ) | | (4.89 | )% |
Investor B | | 13.42 | | | 61.59 | | | 57.09 | | | 3.14 | | | 2.78 | | | (4.93 | ) | | (4.93 | ) |
Investor C | | 13.56 | | | 61.59 | | | 60.59 | | | 3.14 | | | 3.14 | | | (5.05 | ) | | (5.05 | ) |
Class R | | 13.85 | | | 62.44 | | | N/A | | | 3.84 | | | N/A | | | (4.43 | ) | | N/A | |
Russell Midcap Growth Index | | 14.88 | | | 63.00 | | | N/A | | | 4.27 | | | N/A | | | (1.69 | ) | | N/A | |
| 4 | Assuming maximum sales charges, if any. Average annual total returns with and without sales charges reflect reductions for distribution and service fees. See “About Fund Performance” on page 10 for a detailed description of share classes, including any related sales charges and fees. |
N/A - Not applicable as share class and index do not have a sales charge.
Past performance is not indicative of future results.
Expense Example
| | | | | | | | | | | | | | | | | | |
| | | Actual | | Hypothetical6 |
| | Beginning
Account Value
October 1, 2009 | | Ending
Account Value
March 31, 2010 | | Expenses Paid
During the Period5 | | Beginning
Account Value
October 1, 2009 | | Ending
Account Value
March 31, 2010 | | Expenses Paid
During the Period5 |
Institutional | | $ | 1,000 | | $ | 1,141.20 | | $ | 6.25 | | $ | 1,000 | | $ | 1,019.10 | | $ | 5.89 |
Service | | $ | 1,000 | | $ | 1,139.10 | | $ | 8.43 | | $ | 1,000 | | $ | 1,017.05 | | $ | 7.95 |
Investor A | | $ | 1,000 | | $ | 1,139.40 | | $ | 8.43 | | $ | 1,000 | | $ | 1,017.05 | | $ | 7.95 |
Investor B | | $ | 1,000 | | $ | 1,134.20 | | $ | 12.77 | | $ | 1,000 | | $ | 1,012.96 | | $ | 12.04 |
Investor C | | $ | 1,000 | | $ | 1,135.60 | | $ | 12.41 | | $ | 1,000 | | $ | 1,013.31 | | $ | 11.70 |
Class R | | $ | 1,000 | | $ | 1,138.50 | | $ | 8.80 | | $ | 1,000 | | $ | 1,016.70 | | $ | 8.30 |
| 5 | For each class of the Fund, expenses are equal to the annualized expense ratio for the class (1.17% for Institutional, 1.58% for Service, 1.58% for Investor A, 2.40% for Investor B, 2.33% for Investor C and 1.65% for Class R), multiplied by the average account value over the period, multiplied by 182/365 (to reflect the one-half year period shown). |
| 6 | Hypothetical 5% annual return before expenses is calculated by pro rating the number of days in the most recent fiscal half-year divided by 365. |
See “Disclosure of Expenses” on page 11 for further information on how expenses were calculated.
| | | | | | |
| | | BLACKROCK FUNDS | | MARCH 31, 2010 | | 5 |
| | |
| Fund Summary as of March 31, 2010 | | BlackRock Mid-Cap Value Equity Portfolio |
| |
Portfolio Management Commentary | | |
How did the Fund perform?
| | • | | The Fund generated strong absolute returns for the six-month period, but underperformed the benchmark Russell Midcap Value Index. |
What factors influenced performance?
| | • | | A pickup in consumer spending levels and increasing optimism around the broader economic outlook helped push consumer discretionary stocks higher during the six months. Against this backdrop, an overweight and stock selection among hotels and restaurants, including P.F. Chang’s China Bistro, Inc. and Starwood Hotels & Resorts Worldwide, Inc., benefited results. Department stores Saks, Inc. and Macy’s, Inc. also added value. In industrials, positive stock selection contributed to Fund performance. Jacobs Engineering Group, Inc. and rail shipper Union Pacific Corp. were among the notable individual performers. In the consumer staples sector, cosmetics maker Estee Lauder Cos.- Class A, Inc. and supermarket chain Safeway, Inc. gained ground, boosting overall returns. |
| | • | | In contrast, weak stock selection hampered performance in the materials sector. Key detractors included glass maker Owens-Illinois, Inc., consumer products packaging maker Pactiv Corp. and United States Steel Corp. In financials, relative gains among commercial banks were overshadowed by poor performance from the Fund’s real estate investment trust (“REIT”), insurance and capital markets holdings. Health care stocks generated solid gains during the period as uncertainty surrounding health care reform diminished. Although the Fund’s health care holdings posted strong absolute results, they trailed their benchmark counterparts. Primary areas of weakness included health care equipment makers and health care providers. |
Describe recent portfolio activity.
| | • | | During the six months, we added to exposure in information technology as we believe solid corporate balance sheets, strong free cash flow generation, low inventory levels, a favorable product cycle and increased capital spending in the information technology area will continue to drive improved profit margins across much of the sector. New positions included TiVo, Inc., Dell, Inc. and communications equipment maker Ciena Corp. We also increased weightings in health care and financials. Conversely, we reduced an allocation to the more defensive consumer staples sector, trimming positions in Safeway, Inc. and Kroger Co. We also decreased a weighting in the energy sector, reducing an overweight among exploration and production companies. |
Describe Fund positioning at period end.
| | • | | At period end, the Fund continued to maintain a pro-cyclical bias, with overweights in the consumer discretionary and information technology sectors, and underweights in financials and consumer staples. While we continue to believe recovery is underway, the road ahead will likely be bumpy. We remain focused on identifying attractively-valued stocks of companies that have rationalized their cost structure, but have the opportunity to increase revenues and maximize operating leverage in a slow-growth environment. We also expect merger and acquisition activity to accelerate this year, which could provide an additional catalyst for stock prices among small- to mid-capitalization companies. |
| | • | | On February 23, 2010, the Board approved a plan of reorganization, subject to shareholder approval and certain other conditions, whereby the Fund will acquire substantially all of the assets and assume certain stated liabilities of BlackRock Aurora Portfolio of BlackRock FundsSM in exchange for newly issued shares of the Fund. |
The views expressed reflect the opinions of BlackRock as of the date of this report and are subject to change based on changes in market, economic or other conditions. These views are not intended to be a forecast of future events and are no guarantee of future results.
Portfolio Information
| | | |
Ten Largest Holdings | | Percent of
Long-Term
Investments | |
Macy’s, Inc. | | 1 | % |
Questar Corp. | | 1 | |
EQT Corp. | | 1 | |
Invesco Ltd. | | 1 | |
NYSE Euronext | | 1 | |
Owens-Illinois, Inc. | | 1 | |
Loews Corp. | | 1 | |
Simon Property Group, Inc. | | 1 | |
Forestar Group, Inc. | | 1 | |
Entergy Corp. | | 1 | |
| |
Sector Allocation | | Percent of
Long-Term
Investments | |
Financials | | 26 | % |
Consumer Discretionary | | 16 | |
Industrials | | 11 | |
Utilities | | 10 | |
Information Technology | | 10 | |
Energy | | 8 | |
Materials | | 7 | |
Health Care | | 6 | |
Consumer Staples | | 5 | |
Telecommunication Services | | 1 | |
For Fund compliance purposes, the Fund’s sector classifications refer to any one or more of the sector sub-classifications used by one or more widely recognized market indexes or ratings group indexes, and/or as defined by Fund management. This definition may not apply for purposes of this report, which may combine sector sub-classifications for reporting ease.
| | | | | | |
6 | | BLACKROCK FUNDS | | MARCH 31, 2010 | | |
| | |
| | BlackRock Mid-Cap Value Equity Portfolio |
| |
Total Return Based on a $10,000 Investment | | |
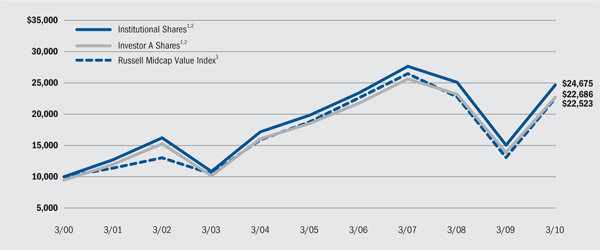
| 1 | Assuming maximum sales charge, if any, transaction costs and other operating expenses, including advisory fees. Institutional Shares do not have a sales charge. |
| 2 | The Fund normally invests at least 80% of its net assets in equity securities issued by US mid-capitalization value companies. |
| 3 | An index that consists of the bottom 800 securities of the Russell 1000 Index with less-than-average growth orientation as ranked by total market capitalization. Securities in this index generally have low price-to-book and price-to-earnings ratios, higher dividend yields and lower forecasted growth values. |
Performance Summary for the Period Ended March 31, 2010
| | | | | | | | | | | | | | | | | | | | | |
| | | 6-Month
Total Returns | | | Average Annual Total Returns4 | |
| | | 1 Year | | | 5 Years | | | 10 Years | |
| | | w/o sales
charge | | | w/ sales
charge | | | w/o sales
charge | | | w/ sales
charge | | | w/o sales
charge | | | w/ sales
charge | |
Institutional | | 14.85 | % | | 64.03 | % | | N/A | | | 4.45 | % | | N/A | | | 9.45 | % | | N/A | |
Service | | 14.63 | | | 63.48 | | | N/A | | | 4.18 | | | N/A | | | 9.13 | | | N/A | |
Investor A | | 14.66 | | | 63.33 | | | 54.81 | % | | 4.16 | | | 3.04 | % | | 9.13 | | | 8.54 | % |
Investor B | | 14.22 | | | 62.07 | | | 57.57 | | | 3.39 | | | 3.10 | | | 8.51 | | | 8.51 | |
Investor C | | 14.27 | | | 62.11 | | | 61.11 | | �� | 3.38 | | | 3.38 | | | 8.35 | | | 8.35 | |
Russell Midcap Value Index | | 15.32 | | | 72.41 | | | N/A | | | 3.71 | | | N/A | | | 8.46 | | | N/A | |
| 4 | Assuming maximum sales charges, if any. Average annual total returns with and without sales charges reflect reductions for distribution and service fees. See “About Fund Performance” on page 10 for a detailed description of share classes, including any related sales charges and fees. |
N/A - Not applicable as share class and index do not have a sales charge.
Past performance is not indicative of future results.
Expense Example
| | | | | | | | | | | | | | | | | | |
| | | Actual | | Hypothetical6 |
| | Beginning
Account Value
October 1, 2009 | | Ending
Account Value
March 31, 2010 | | Expenses Paid
During the Period5 | | Beginning
Account Value
October 1, 2009 | | Ending
Account Value
March 31, 2010 | | Expenses Paid
During the Period5 |
Institutional | | $ | 1,000 | | $ | 1,148.50 | | $ | 5.20 | | $ | 1,000 | | $ | 1,020.09 | | $ | 4.89 |
Service | | $ | 1,000 | | $ | 1,146.30 | | $ | 6.80 | | $ | 1,000 | | $ | 1,018.60 | | $ | 6.39 |
Investor A | | $ | 1,000 | | $ | 1,146.60 | | $ | 6.90 | | $ | 1,000 | | $ | 1,018.50 | | $ | 6.49 |
Investor B | | $ | 1,000 | | $ | 1,142.20 | | $ | 11.00 | | $ | 1,000 | | $ | 1,014.66 | | $ | 10.35 |
Investor C | | $ | 1,000 | | $ | 1,142.70 | | $ | 11.00 | | $ | 1,000 | | $ | 1,014.66 | | $ | 10.35 |
| 5 | For each class of the Fund, expenses are equal to the annualized expense ratio for the class (0.97% for Institutional, 1.27% for Service, 1.29% for Investor A, 2.06% for Investor B and 2.06% for Investor C), multiplied by the average account value over the period, multiplied by 182/365 (to reflect the one-half year period shown). |
| 6 | Hypothetical 5% annual return before expenses is calculated by pro rating the number of days in the most recent fiscal half-year divided by 365. |
See “Disclosure of Expenses” on page 11 for further information on how expenses were calculated.
| | | | | | |
| | | BLACKROCK FUNDS | | MARCH 31, 2010 | | 7 |
| | |
| Fund Summary as of March 31, 2010 | | BlackRock Small/Mid-Cap Growth Equity Portfolio |
| |
Portfolio Management Commentary | | |
How did the Fund perform?
| | • | | The Fund generated strong returns for the six-month period, but underperformed the benchmark Russell 2500 Growth Index. |
What factors influenced performance?
| | • | | Stock selection in the industrials and health care sectors were the most significant contributors to relative performance during the reporting period. Within industrials, the air freight transportation company Atlas Air Worldwide Holding, Inc. was up 59% given the global, cyclical recovery. In health care, a number of holdings within biotechnology were the main contributors to the Fund’s outperformance within the space. Elsewhere within the Fund, top conviction holding TiVo, Inc. spiked 65%, as a federal appeals court upheld and validated the company’s time warp technology patent. |
| | • | | Conversely, weaker stock selection in the consumer discretionary and financials sectors held back relative performance for the period. Most notable within the consumer discretionary sector was made-for-TV movie database provider RHI Entertainment, Inc., whose shares plummeted more than 80% on worries of potential bankruptcy due to slower than expected cash flow generation. Performance in the specialty retail industry also detracted from relative returns, as the Fund’s holdings were up 7% versus the benchmark’s 22% return in the sub-sector. In financials, holding PrivateBancorp, Inc. was the most significant detractor, as the stock declined by 60% after revealing greater than expected write-downs on its commercial real estate debt portfolios. In other areas, health care equipment company NuVasive, Inc. had a negative impact on results, as shares fell 30% during the period on concerns over reimbursement issues for its spine surgery products. |
Describe recent portfolio activity.
| | • | | During the six months, we decreased the Fund’s weighting in the financials sector, eliminating positions in RenaissanceRe Holdings Ltd., PrivateBancorp, Inc. and Franklin Street Properties Corp. We increased our overall position in the industrials space, adding positions in Manitowoc Co., Inc. and Atlas Air Worldwide, Inc. among others. |
Describe Fund positioning at period end.
| | • | | At period end, the Fund’s most significant overweight relative to the Russell 2500 Growth Index is in the industrials sector (by approximately 350 basis points), while its largest underweight is in the consumer discretionary sector (by 525 basis points). |
The views expressed reflect the opinions of BlackRock as of the date of this report and are subject to change based on changes in market, economic or other conditions. These views are not intended to be a forecast of future events and are no guarantee of future results.
Portfolio Information
| | | |
Ten Largest Holdings | | Percent of
Long-Term
Investments | |
TiVo, Inc. | | 4 | % |
BE Aerospace, Inc. | | 2 | |
CKX, Inc. | | 2 | |
Lincare Holdings, Inc. | | 2 | |
Dollar Financial Corp. | | 2 | |
Scientific Games Corp. - Class A | | 2 | |
ExlService Holdings, Inc. | | 2 | |
SonicWALL, Inc. | | 2 | |
Atlas Air Worldwide Holdings, Inc. | | 2 | |
SonoSite, Inc. | | 2 | |
| |
Sector Allocation | | Percent of
Long-Term
Investments | |
Information Technology | | 23 | % |
Health Care | | 21 | |
Industrials | | 19 | |
Consumer Discretionary | | 14 | |
Materials | | 7 | |
Energy | | 6 | |
Financials | | 6 | |
Consumer Staples | | 3 | |
Telecommunication Services | | 1 | |
For Fund compliance purposes, the Fund’s sector classifications refer to any one or more of the sector sub-classifications used by one or more widely recognized market indexes or ratings group indexes, and/or as defined by Fund management. This definition may not apply for purposes of this report, which may combine sector sub-classifications for reporting ease.
| | | | | | |
8 | | BLACKROCK FUNDS | | MARCH 31, 2010 | | |
| | |
| | BlackRock Small/Mid-Cap Growth Portfolio |
| |
Total Return Based on a $10,000 Investment | | |
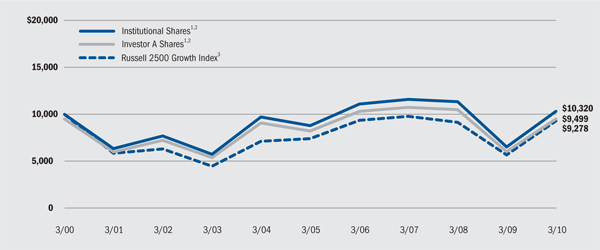
| 1 | Assuming maximum sales charge, if any, transaction costs and other operating expenses, including advisory fees. Institutional Shares do not have a sales charge. |
| 2 | Under normal market conditions, the Fund invests at least 80% of total assets in small-capitalization and mid-capitalization companies. |
| 3 | An index composed of the Russell 2500 companies with higher price-to-book ratios and higher forecasted growth values. |
Performance Summary for the Period Ended March 31, 2010
| | | | | | | | | | | | | | | | | | | | | |
| | | 6-Month
Total Returns | | | Average Annual Total Returns4 | |
| | | 1 Year | | | 5 Years | | | 10 Years | |
| | | w/o sales
charge | | | w/ sales
charge | | | w/o sales
charge | | | w/ sales
charge | | | w/o sales
charge | | | w/ sales
charge | |
Institutional | | 12.84 | % | | 58.50 | % | | N/A | | | 3.25 | % | | N/A | | | 0.32 | % | | N/A | |
Investor A | | 12.79 | | | 58.06 | | | 49.74 | % | | 2.99 | | | 1.89 | % | | 0.02 | | | (0.51 | )% |
Investor B | | 12.38 | | | 56.93 | | | 52.43 | | | 2.19 | | | 1.89 | | | (0.54 | ) | | (0.54 | ) |
Investor C | | 12.37 | | | 56.84 | | | 55.84 | | | 2.19 | | | 2.19 | | | (0.68 | ) | | (0.68 | ) |
Class R | | 12.63 | | | 57.64 | | | N/A | | | 2.70 | | | N/A | | | (0.26 | ) | | N/A | |
Russell 2500 Growth Index | | 14.87 | | | 63.92 | | | N/A | | | 4.65 | | | N/A | | | (0.75 | ) | | N/A | |
| 4 | Assuming maximum sales charges, if any. Average annual total returns with and without sales charges reflect reductions for distribution and service fees. See “About Fund Performance” on page 10 for a detailed description of share classes, including any related sales charges and fees. |
N/A - Not applicable as share class and index do not have a sales charge.
Past performance is not indicative of future results.
Expense Example
| | | | | | | | | | | | | | | | | | |
| | | Actual | | Hypothetical6 |
| | Beginning
Account Value
October 1, 2009 | | Ending
Account Value
March 31, 2010 | | Expenses Paid
During the Period5 | | Beginning
Account Value
October 1, 2009 | | Ending
Account Value
October 1, 2009 | | Expenses Paid
During the Period5 |
Institutional | | $ | 1,000 | | $ | 1,128.40 | | $ | 5.94 | | $ | 1,000 | | $ | 1,019.35 | | $ | 5.64 |
Investor A | | $ | 1,000 | | $ | 1,127.90 | | $ | 7.37 | | $ | 1,000 | | $ | 1,018.00 | | $ | 6.99 |
Investor B | | $ | 1,000 | | $ | 1,123.80 | | $ | 11.44 | | $ | 1,000 | | $ | 1,014.16 | | $ | 10.85 |
Investor C | | $ | 1,000 | | $ | 1,123.70 | | $ | 11.44 | | $ | 1,000 | | $ | 1,014.16 | | $ | 10.85 |
Class R | | $ | 1,000 | | $ | 1,126.30 | | $ | 8.91 | | $ | 1,000 | | $ | 1,016.55 | | $ | 8.45 |
| 5 | For each class of the Fund, expenses are equal to the annualized expense ratio for the class (1.12% for Institutional, 1.39% for Investor A, 2.16% Investor B, 2.16% for Investor C and 1.68% for Class R), multiplied by the average account value over the period, multiplied by 182/365 (to reflect the one-half year period shown). |
| 6 | Hypothetical 5% annual return before expenses is calculated by pro rating the number of days in the most recent fiscal half-year divided by 365. |
See “Disclosure of Expenses” on page 11 for further information on how expenses were calculated.
| | | | | | |
| | | BLACKROCK FUNDS | | MARCH 31, 2010 | | 9 |
About Fund Performance
| | • | | Institutional Shares are not subject to any sales charge. Institutional Shares bear no ongoing distribution or service fees and are available only to eligible investors. |
| | • | | Service Shares are not subject to any sales charge (front-end load) or deferred sales charge. Service Shares are subject to a service fee of 0.25% per year (but no distribution fee). |
| | • | | Investor A Shares incur a maximum initial sales charge (front-end load) of 5.25% and a service fee of 0.25% per year (but no distribution fee). |
| | • | | Investor B Shares are subject to a maximum contingent deferred sales charge of 4.50% declining to 0% after six years. In addition, Investor B Shares are subject to a distribution fee of 0.75% per year and a service fee of 0.25% per year. Investor B Shares automatically convert to Investor A Shares after approximately eight years. (There is no initial sales charge for automatic share conversions.) All returns for periods greater than eight years reflect this conversion. Investor B Shares are only available for purchase through exchanges, dividend reinvestment or for purchase by certain qualified employee benefit plans. |
| | • | | Investor C Shares are subject to a 1.00% contingent deferred sales charge if redeemed within one year of purchase. In addition, Investor C Shares are subject to a distribution fee of 0.75% per year and a service fee of 0.25% per year. |
| | • | | Class R Shares are not subject to any sales charge. Class R Shares are subject to a distribution fee of 0.25% per year and a service fee of 0.25% per year. Class R Shares are available only to certain retirement and other similar plans. Prior to October 2, 2006, BlackRock Mid-Cap Growth Equity Portfolio’s and BlackRock Small/Mid-Cap Growth Portfolio’s Class R Share performance results are those of Institutional Shares (which have no distribution or service fees) restated to reflect Class R |
Share fees.
Performance information reflects past performance and does not guarantee future results. Current performance may be lower or higher than the performance data quoted. Refer to www.blackrock.com/funds to obtain performance data current to the most recent month-end. Performance results do not reflect the deduction of taxes that a shareholder would pay on fund distributions or the redemption of fund shares. BlackRock Small/Mid-Cap Growth Portfolio may charge a 2% redemption fee for sales or exchanges of shares within 30 days of purchase or exchange. Performance data does not reflect this potential fee. Figures shown in each of the performance tables on the previous pages assume reinvestment of all dividends and distributions, if any, at net asset value on the payable date. Investment return and principal value of shares will fluctuate so that shares, when redeemed, may be worth more or less than their original cost.
Performance for BlackRock Mid-Cap Value Equity and BlackRock Small/ Mid-Cap Growth Portfolios for the periods prior to January 31, 2005 is based on performance of a certain former State Street Research mutual fund that reorganized with the Funds on that date.
The Funds’ investment advisor waived or reimbursed a portion of each Fund’s expenses. Without such waiver and reimbursement, a Fund’s performance would have been lower. BlackRock Advisors, LLC is under no obligation to waive or continue waiving its fees after February 1, 2011. Dividends paid to each class of shares will vary because of the different levels of service, distribution and transfer agency fees applicable to each class, which are deducted from the income available to be paid to shareholders.
| | | | | | |
10 | | BLACKROCK FUNDS | | MARCH 31, 2010 | | |
Disclosure of Expenses
Shareholders of these Funds may incur the following charges: (a) expenses related to transactions, including sales charges, redemption fees and exchange fees; and (b) operating expenses including advisory fees, service and distribution fees, including 12b-1 fees, and other Fund expenses. The expense examples on the previous pages (which are based on a hypothetical investment of $1,000 invested on October 1, 2009 and held through March 31, 2010) are intended to assist shareholders both in calculating expenses based on an investment in each Fund and in comparing these expenses with similar costs of investing in other mutual funds.
The tables provide information about actual account values and actual expenses. In order to estimate the expenses a shareholder paid during the period covered by this report, shareholders can divide their account value by $1,000 and then multiply the result by the number corresponding to their Fund and share class under the headings entitled “Expenses Paid During the Period.”
The tables also provide information about hypothetical account values and hypothetical expenses based on a Fund’s actual expense ratio and an assumed rate of return of 5% per year before expenses. In order to assist shareholders in comparing the ongoing expenses of investing in these Funds and other funds, compare the 5% hypothetical example with the 5% hypothetical examples that appear in other funds’ shareholder reports.
The expenses shown in the tables are intended to highlight shareholders’ ongoing costs only and do not reflect any transactional expenses, such as sales charges, redemption fees or exchange fees. Therefore, the hypothetical examples are useful in comparing ongoing expenses only, and will not help shareholders determine the relative total expenses of owning different funds. If these transactional expenses were included, shareholder expenses would have been higher.
Derivative Financial Instruments
The Funds may invest in various derivative instruments, including options, as specified in Note 2 of the Notes to Financial Statements, which constitute forms of economic leverage. Such instruments are used to obtain exposure to a market without owning or taking physical custody of securities or to hedge market and/or equity risks. Such derivative instruments involve risks, including the imperfect correlation between the value of a derivative instrument and the underlying asset, possible default of the counterparty to the transaction or illiquidity of the derivative instrument. A Fund’s ability to successfully use a derivative instrument depends on the investment advisor’s ability to accurately predict pertinent market movements, which cannot be assured. The use of derivative instruments may result in losses greater than if they had not been used, may require a Fund to sell or purchase portfolio securities at inopportune times or for distressed values, may limit the amount of appreciation a Fund can realize on an investment or may cause a Fund to hold a security that it might otherwise sell. A Fund’s investments in these instruments are discussed in detail in the Notes to Financial Statements.
| | | | | | |
| | | BLACKROCK FUNDS | | MARCH 31, 2010 | | 11 |
| | |
| Schedule of Investments March 31, 2010 (Unaudited) | | BlackRock Mid-Cap Growth Equity Portfolio |
| | (Percentages shown are based on Net Assets) |
| | | | | |
| | | Shares | | Value |
Common Stocks | | | | | |
Aerospace & Defense — 3.7% | | | | | |
BE Aerospace, Inc. (a) | | 191,400 | | $ | 5,828,130 |
Precision Castparts Corp. | | 29,000 | | | 3,674,590 |
| | | | | |
| | | | | 9,502,720 |
| | | | | |
Auto Components — 1.6% | | | | | |
Lear Corp. (a) | | 51,000 | | | 4,046,850 |
| | | | | |
Biotechnology — 2.9% | | | | | |
Dendreon Corp. (a)(b) | | 94,400 | | | 3,442,768 |
Genzyme Corp. (a) | | 36,900 | | | 1,912,527 |
InterMune, Inc. (a) | | 20,300 | | | 904,771 |
United Therapeutics Corp. (a) | | 21,400 | | | 1,184,062 |
| | | | | |
| | | | | 7,444,128 |
| | | | | |
Capital Markets — 3.4% | | | | | |
Greenhill & Co., Inc. | | 32,200 | | | 2,643,298 |
Invesco Ltd. | | 118,507 | | | 2,596,488 |
Northern Trust Corp. | | 45,200 | | | 2,497,752 |
Och-Ziff Capital Management Group LLC - Class A | | 65,200 | | | 1,043,200 |
| | | | | |
| | | | | 8,780,738 |
| | | | | |
Chemicals — 4.8% | | | | | |
Agrium, Inc. | | 82,700 | | | 5,841,101 |
Airgas, Inc. | | 47,100 | | | 2,996,502 |
Celanese Corp. - Series A | | 110,400 | | | 3,516,240 |
| | | | | |
| | | | | 12,353,843 |
| | | | | |
Communications Equipment — 1.5% | | | | | |
Harris Corp. (b) | | 52,281 | | | 2,482,825 |
Juniper Networks, Inc. (a) | | 47,600 | | | 1,460,368 |
| | | | | |
| | | | | 3,943,193 |
| | | | | |
Computers & Peripherals — 1.4% | | | | | |
Western Digital Corp. (a) | | 90,200 | | | 3,516,898 |
| | | | | |
Construction & Engineering — 1.4% | | | | | |
Quanta Services, Inc. (a) | | 187,300 | | | 3,588,668 |
| | | | | |
Containers & Packaging — 1.4% | | | | | |
Owens-Illinois, Inc. (a) | | 102,700 | | | 3,649,958 |
| | | | | |
Diversified Consumer Services — 1.0% | | | | | |
DeVry, Inc. | | 38,000 | | | 2,477,600 |
| | | | | |
Diversified Financial Services — 2.2% | | | | | |
CME Group, Inc. | | 11,400 | | | 3,603,654 |
MSCI, Inc. - Class A (a) | | 57,700 | | | 2,082,970 |
| | | | | |
| | | | | 5,686,624 |
| | | | | |
Electrical Equipment — 1.3% | | | | | |
AMETEK, Inc. | | 81,800 | | | 3,391,428 |
| | | | | |
Electronic Equipment, Instruments & Components — 1.9% | | | | | |
Amphenol Corp. - Class A | | 82,800 | | | 3,493,332 |
Cogent, Inc. (a) | | 128,100 | | | 1,306,620 |
| | | | | |
| | | | | 4,799,952 |
| | | | | |
Energy Equipment & Services — 2.6% | | | | | |
Noble Corp. (a) | | 62,200 | | | 2,601,204 |
Rowan Cos., Inc. (a) | | 47,300 | | | 1,376,903 |
Superior Energy Services, Inc. (a) | | 123,700 | | | 2,600,174 |
| | | | | |
| | | | | 6,578,281 |
| | | | | |
Food & Staples Retailing — 1.3% | | | | | |
Safeway, Inc. | | 133,400 | | | 3,316,324 |
| | | | | |
Health Care Equipment & Supplies — 4.7% | | | | | |
CareFusion Corp. (a) | | 78,000 | | | 2,061,540 |
Gen-Probe, Inc. (a) | | 55,700 | | | 2,785,000 |
Hologic, Inc. (a) | | 173,500 | | | 3,216,690 |
Inverness Medical Innovations, Inc. (a) | | 97,300 | | | 3,789,835 |
| | | | | |
| | | | | 11,853,065 |
| | | | | |
Health Care Providers & Services — 6.7% | | | | | |
Aetna, Inc. | | 101,300 | | | 3,556,643 |
Humana, Inc. (a) | | 29,300 | | | 1,370,361 |
Lincare Holdings, Inc. (a) | | 117,900 | | | 5,291,352 |
Magellan Health Services, Inc. (a) | | 29,300 | | | 1,273,964 |
Medco Health Solutions, Inc. (a) | | 55,500 | | | 3,583,080 |
MEDNAX, Inc. (a) | | 32,800 | | | 1,908,632 |
| | | | | |
| | | | | 16,984,032 |
| | | | | |
Hotels, Restaurants & Leisure — 5.0% | | | | | |
Bally Technologies, Inc. (a) | | 32,300 | | | 1,309,442 |
Burger King Holdings, Inc. | | 47,900 | | | 1,018,354 |
Darden Restaurants, Inc. | | 59,700 | | | 2,659,038 |
Penn National Gaming, Inc. (a) | | 92,800 | | | 2,579,840 |
Scientific Games Corp. - Class A (a) | | 368,000 | | | 5,181,440 |
| | | | | |
| | | | | 12,748,114 |
| | | | | |
Household Products — 1.4% | | | | | |
Church & Dwight Co., Inc. | | 51,800 | | | 3,468,010 |
| | | | | |
IT Services — 8.4% | | | | | |
Alliance Data Systems Corp. (a)(b) | | 67,800 | | | 4,338,522 |
Amdocs Ltd. (a) | | 147,300 | | | 4,435,203 |
Gartner, Inc. (a) | | 177,900 | | | 3,956,496 |
Genpact Ltd. (a) | | 264,800 | | | 4,440,696 |
Lender Processing Services, Inc. | | 114,200 | | | 4,311,050 |
| | | | | |
| | | | | 21,481,967 |
| | | | | |
Life Sciences Tools & Services — 1.0% | | | | | |
Thermo Fisher Scientific, Inc. (a) | | 50,800 | | | 2,613,152 |
| | | | | |
Machinery — 3.4% | | | | | |
Joy Global, Inc. | | 42,300 | | | 2,394,180 |
The Manitowoc Co., Inc. | | 200,000 | | | 2,600,000 |
Pentair, Inc. | | 102,900 | | | 3,665,298 |
| | | | | |
| | | | | 8,659,478 |
| | | | | |
Media — 3.2% | | | | | |
CKX, Inc. (a) | | 365,500 | | | 2,240,515 |
DISH Network Corp. - Class A | | 90,500 | | | 1,884,210 |
DreamWorks Animation SKG, Inc. - Class A (a) | | 102,400 | | | 4,033,536 |
| | | | | |
| | | | | 8,158,261 |
| | | | | |
Portfolio Abbreviation
| | | | | | | | |
| | ADR | | American Depositary Receipts | | | | |
See Notes to Financial Statements.
| | | | | | |
12 | | BLACKROCK FUNDS | | MARCH 31, 2010 | | |
| | |
| Schedule of Investments (continued) | | BlackRock Mid-Cap Growth Equity Portfolio |
| | (Percentages shown are based on Net Assets) |
| | | | | | |
| | | Shares | | Value | |
Common Stocks | | | | | | |
Metals & Mining — 0.8% | | | | | | |
Century Aluminum Co. (a) | | 147,757 | | $ | 2,033,136 | |
| | | | | | |
Oil, Gas & Consumable Fuels — 4.7% | | | | | | |
CONSOL Energy, Inc. | | 81,500 | | | 3,476,790 | |
Plains Exploration & Production Co. (a) | | 90,700 | | | 2,720,093 | |
Ultra Petroleum Corp. (a) | | 62,500 | | | 2,914,375 | |
The Williams Cos., Inc. | | 122,000 | | | 2,818,200 | |
| | | | | | |
| | | | | 11,929,458 | |
| | | | | | |
Personal Products — 2.0% | | | | | | |
Avon Products, Inc. | | 149,300 | | | 5,056,791 | |
| | | | | | |
Pharmaceuticals — 3.5% | | | | | | |
Biovail Corp. | | 114,700 | | | 1,923,519 | |
Shire Plc - ADR | | 40,856 | | | 2,694,862 | |
Warner Chilcott Plc - Class A (a) | | 167,500 | | | 4,279,625 | |
| | | | | | |
| | | | | 8,898,006 | |
| | | | | | |
Professional Services — 2.0% | | | | | | |
IHS, Inc. - Class A (a) | | 35,300 | | | 1,887,491 | |
Manpower, Inc. | | 55,700 | | | 3,181,584 | |
| | | | | | |
| | | | | 5,069,075 | |
| | | | | | |
Real Estate Investment Trusts (REITs) — 0.7% | | | | | | |
Chimera Investment Corp. | | 439,000 | | | 1,707,710 | |
| | | | | | |
Semiconductors & Semiconductor Equipment — 6.2% | | | | | | |
Broadcom Corp. - Class A (b) | | 130,200 | | | 4,320,036 | |
Lam Research Corp. (a)(b) | | 127,000 | | | 4,739,640 | |
Netlogic Microsystems, Inc. (a) | | 22,800 | | | 671,004 | |
ON Semiconductor Corp. (a) | | 253,600 | | | 2,028,800 | |
PMC-Sierra, Inc. (a) | | 448,500 | | | 4,000,620 | |
| | | | | | |
| | | | | 15,760,100 | |
| | | | | | |
Software — 6.7% | | | | | | |
Adobe Systems, Inc. (a) | | 108,100 | | | 3,823,497 | |
Intuit, Inc. (a) | | 85,500 | | | 2,936,070 | |
MICROS Systems, Inc. (a) | | 39,600 | | | 1,302,048 | |
Salesforce.com, Inc. (a) | | 33,900 | | | 2,523,855 | |
TiVo, Inc. (a) | | 372,600 | | | 6,378,912 | |
| | | | | | |
| | | | | 16,964,382 | |
| | | | | | |
Specialty Retail — 4.7% | | | | | | |
American Eagle Outfitters, Inc. | | 175,300 | | | 3,246,556 | |
Bed Bath & Beyond, Inc. (a) | | 66,000 | | | 2,888,160 | |
GameStop Corp. - Class A (a)(b) | | 154,700 | | | 3,389,477 | |
Staples, Inc. | | 107,800 | | | 2,521,442 | |
| | | | | | |
| | | | | 12,045,635 | |
| | | | | | |
Textiles, Apparel & Luxury Goods — 0.5% | | | | | | |
Coach, Inc. | | 33,300 | | | 1,316,016 | |
| | | | | | |
Wireless Telecommunication Services — 0.9% | | | | | | |
American Tower Corp. - Class A (a) | | 51,000 | | | 2,173,110 | |
| | | | | | |
Total Long-Term Investments
(Cost — $211,137,751) — 98.9% | | | | | 251,996,703 | |
| | | | | | |
| | |
| | | Shares/
Beneficial
Interest | | | |
Short-Term Securities | | | | | | |
BlackRock Liquidity Funds, TempFund, Institutional Class, 0.11% (c)(d) | | 3,327,470 | | | 3,327,470 | |
BlackRock Liquidity Series, LLC Money Market Series, 0.22% (c)(d)(e) | | 14,350,950 | | | 14,350,950 | |
| | | | | | |
Total Short-Term Securities
(Cost — $17,678,420) — 6.9% | | | | | 17,678,420 | |
| | | | | | |
Total Investments
(Cost — $228,816,171*) — 105.8% | | | | | 269,675,123 | |
Liabilities in Excess of Other Assets — (5.8)% | | | | | (14,803,316 | ) |
| | | | | | |
Net Assets — 100.0% | | | | $ | 254,871,807 | |
| | | | | | |
| * | The cost and unrealized appreciation (depreciation) of investments as of March 31, 2010, as computed for federal income tax purposes, were as follows: |
| | | | |
Aggregate cost | | $ | 235,309,990 | |
| | | | |
Gross unrealized appreciation | | $ | 48,821,110 | |
Gross unrealized depreciation | | | (14,455,977 | ) |
| | | | |
Net unrealized appreciation | | $ | 34,365,133 | |
| | | | |
| (a) | Non-income producing security. |
| (b) | Security, or a portion of security, is on loan. |
| (c) | Investments in companies considered to be an affiliate of the Fund, for purposes of Section 2(a)(3) of the Investment Company Act of 1940, were as follows: |
| | | | | | | | | | |
Affiliate | | Net
Activity | | | Realized
Gain | | Income |
BlackRock Liquidity Funds, TempFund, Institutional Class | | $ | (1,421,880 | ) | | $ | 32 | | $ | 2,232 |
BlackRock Liquidity Series, LLC Money Market Series | | $ | (247,902 | ) | | | — | | $ | 11,906 |
| (d) | Represents the current yield as of report date. |
| (e) | Security was purchased with the cash collateral from loaned securities. |
| • | | For Fund compliance purposes, the Fund’s industry classifications refer to any one or more of the industry sub-classifications used by one or more widely recognized market indexes or ratings group indexes, and/or as defined by Fund management. This definition may not apply for purposes of this report, which may combine industry sub-classifications for reporting ease. |
| • | | Fair Value Measurements – Various inputs are used in determining the fair value of investments, which are as follows: |
| | • | | Level 1 – price quotations in active markets/exchanges for identical assets and liabilities |
| | • | | Level 2 – other observable inputs (including, but not limited to: quoted prices for similar assets or liabilities in markets that are active, quoted prices for identical or similar assets or liabilities in markets that are not active, inputs other than quoted prices that are observable for the assets or liabilities (such as interest rates, yield curves, volatilities, prepayment speeds, loss severities, credit risks and default rates) or other market–corroborated inputs) |
| | • | | Level 3 – unobservable inputs based on the best information available in the circumstances, to the extent observable inputs are not available (including the Fund’s own assumptions used in determining the fair value of investments) |
See Notes to Financial Statements.
| | | | | | |
| | | BLACKROCK FUNDS | | MARCH 31, 2010 | | 13 |
| | |
| Schedule of Investments (concluded) | | BlackRock Mid-Cap Growth Equity Portfolio |
| | |
The inputs or methodologies used for valuing securities are not necessarily an indication of the risk associated with investing in those securities. For information about the Fund’s policy regarding valuation of investments and other significant accounting policies, please refer to Note 1 of the Notes to Financial Statements.
The following table summarizes the inputs used as of March 31, 2010 in determining the fair valuation of the Fund’s investments:
| | | |
Valuation Inputs | | Investments
in Securities |
| |
| | | Assets |
Level 1: | | | |
Long-Term Investments1 | | $ | 251,996,703 |
Short-Term Securities | | | 3,327,470 |
| | | |
Total Level 1 | | | 255,324,173 |
| | | |
Level 2 – Short-Term Securities | | | 14,350,950 |
Level 3 | | | — |
| | | |
Total | | $ | 269,675,123 |
| | | |
| 1 | See above Schedule of Investments for values in each industry. |
See Notes to Financial Statements.
| | | | | | |
14 | | BLACKROCK FUNDS | | MARCH 31, 2010 | | |
| | |
| Schedule of Investments March 31, 2010 (Unaudited) | | BlackRock Mid-Cap Value Equity Portfolio |
| | (Percentages shown are based on Net Assets) |
| | | | | |
| | | Shares | | Value |
Common Stocks | | | | | |
Aerospace & Defense — 0.7% | | | | | |
Orbital Sciences Corp. (a) | | 280,500 | | $ | 5,332,305 |
| | | | | |
Auto Components — 0.6% | | | | | |
Dana Holding Corp. (a) | | 363,100 | | | 4,313,628 |
| | | | | |
Beverages — 1.3% | | | | | |
Constellation Brands, Inc. - Class A (a) | | 200,500 | | | 3,296,220 |
Molson Coors Brewing Co. - Class B | | 143,800 | | | 6,048,228 |
| | | | | |
| | | | | 9,344,448 |
| | | | | |
Building Products — 1.9% | | | | | |
Masco Corp. (b) | | 511,100 | | | 7,932,272 |
Owens Corning (a) | | 231,700 | | | 5,894,448 |
| | | | | |
| | | | | 13,826,720 |
| | | | | |
Capital Markets — 1.9% | | | | | |
Freedom Pay, Inc. (a) | | 43,051 | | | 431 |
Invesco Ltd. | | 409,030 | | | 8,961,847 |
Morgan Stanley | | 167,900 | | | 4,917,791 |
| | | | | |
| | | | | 13,880,069 |
| | | | | |
Chemicals — 1.6% | | | | | |
Albemarle Corp. | | 127,700 | | | 5,443,851 |
FMC Corp. | | 102,450 | | | 6,202,323 |
| | | | | |
| | | | | 11,646,174 |
| | | | | |
Commercial Banks — 4.9% | | | | | |
Associated Banc-Corp. (b) | | 520,500 | | | 7,182,900 |
City National Corp. | | 65,700 | | | 3,545,829 |
Fifth Third Bancorp | | 421,700 | | | 5,730,903 |
KeyCorp | | 872,050 | | | 6,758,387 |
TCF Financial Corp. | | 446,700 | | | 7,120,398 |
Zions Bancorporation (b) | | 249,990 | | | 5,454,782 |
| | | | | |
| | | | | 35,793,199 |
| | | | | |
Commercial Services & Supplies — 1.4% | | | | | |
Corrections Corp. of America (a) | | 299,400 | | | 5,946,084 |
Republic Services, Inc. | | 149,060 | | | 4,325,721 |
| | | | | |
| | | | | 10,271,805 |
| | | | | |
Communications Equipment — 0.4% | | | | | |
Ciena Corp. (a)(b) | | 211,500 | | | 3,223,260 |
| | | | | |
Computers & Peripherals — 1.0% | | | | | |
Dell, Inc. (a) | | 484,800 | | | 7,276,848 |
| | | | | |
Construction & Engineering — 0.7% | | | | | |
Jacobs Engineering Group, Inc. (a)(b) | | 104,200 | | | 4,708,798 |
| | | | | |
Consumer Finance — 0.4% | | | | | |
SLM Corp. (a) | | 218,600 | | | 2,736,872 |
| | | | | |
Containers & Packaging — 2.4% | | | | | |
Owens-Illinois, Inc. (a) | | 247,240 | | | 8,786,910 |
Pactiv Corp. (a) | | 330,000 | | | 8,309,400 |
| | | | | |
| | | | | 17,096,310 |
| | | | | |
Diversified Consumer Services — 0.6% | | | | | |
H&R Block, Inc. (b) | | 240,200 | | | 4,275,560 |
| | | | | |
Diversified Financial Services — 3.0% | | | | | |
IntercontinentalExchange, Inc. (a) | | 44,600 | | | 5,003,228 |
NYSE Euronext | | 299,700 | | | 8,874,117 |
PHH Corp. (a) | | 344,150 | | | 8,111,616 |
| | | | | |
| | | | | 21,988,961 |
| | | | | |
Electric Utilities — 2.9% | | | | | |
American Electric Power Co., Inc. | | 81,070 | | | 2,770,973 |
Entergy Corp. | | 102,600 | | | 8,346,510 |
Northeast Utilities | | 255,050 | | | 7,049,582 |
Westar Energy, Inc. | | 128,800 | | | 2,872,240 |
| | | | | |
| | | | | 21,039,305 |
| | | | | |
Electronic Equipment, Instruments & Components — 1.5% | | | | | |
Anixter International, Inc. (a) | | 120,875 | | | 5,662,994 |
Tech Data Corp. (a) | | 65,336 | | | 2,737,578 |
Tyco Electronics Ltd. | | 79,200 | | | 2,176,416 |
| | | | | |
| | | | | 10,576,988 |
| | | | | |
Energy Equipment & Services — 1.1% | | | | | |
Noble Corp. (a) | | 186,600 | | | 7,803,612 |
| | | | | |
Food & Staples Retailing — 1.5% | | | | | |
The Kroger Co. | | 187,300 | | | 4,056,918 |
Safeway, Inc. (b) | | 280,680 | | | 6,977,705 |
| | | | | |
| | | | | 11,034,623 |
| | | | | |
Food Products — 1.5% | | | | | |
Del Monte Foods Co. | | 386,517 | | | 5,643,148 |
The J.M. Smucker Co. | | 89,600 | | | 5,399,296 |
| | | | | |
| | | | | 11,042,444 |
| | | | | |
Gas Utilities — 2.6% | | | | | |
EQT Corp. | | 219,700 | | | 9,007,700 |
Questar Corp. | | 220,700 | | | 9,534,240 |
| | | | | |
| | | | | 18,541,940 |
| | | | | |
Health Care Equipment & Supplies — 1.5% | | | | | |
Boston Scientific Corp. (a) | | 333,200 | | | 2,405,704 |
The Cooper Cos., Inc. | | 101,076 | | | 3,929,835 |
Zimmer Holdings, Inc. (a) | | 79,000 | | | 4,676,800 |
| | | | | |
| | | | | 11,012,339 |
| | | | | |
Health Care Providers & Services — 2.6% | | | | | |
MEDNAX, Inc. (a) | | 67,750 | | | 3,942,373 |
Universal Health Services, Inc. - Class B | | 214,300 | | | 7,519,787 |
WellPoint, Inc. (a) | | 119,700 | | | 7,706,286 |
| | | | | |
| | | | | 19,168,446 |
| | | | | |
Hotels, Restaurants & Leisure — 2.8% | | | | | |
Bally Technologies, Inc. (a) | | 149,700 | | | 6,068,838 |
Darden Restaurants, Inc. | | 107,400 | | | 4,783,596 |
P.F. Chang’s China Bistro, Inc. (a) | | 24,500 | | | 1,081,185 |
Scientific Games Corp. - Class A (a) | | 229,300 | | | 3,228,544 |
Starwood Hotels & Resorts Worldwide, Inc. (b) | | 111,800 | | | 5,214,352 |
| | | | | |
| | | | | 20,376,515 |
| | | | | |
Household Durables — 1.4% | | | | | |
MDC Holdings, Inc. | | 129,600 | | | 4,485,456 |
Stanley Black & Decker, Inc. | | 94,800 | | | 5,442,468 |
| | | | | |
| | | | | 9,927,924 |
| | | | | |
Independent Power Producers & Energy Traders — 0.8% | | | | | |
NRG Energy, Inc. (a)(b) | | 270,490 | | | 5,653,241 |
| | | | | |
Industrial Conglomerates — 0.4% | | | | | |
Textron, Inc. (b) | | 143,900 | | | 3,054,997 |
| | | | | |
Insurance — 7.8% | | | | | |
AON Corp. | | 85,000 | | | 3,630,350 |
See Notes to Financial Statements.
| | | | | | |
| | | BLACKROCK FUNDS | | MARCH 31, 2010 | | 15 |
| | |
| Schedule of Investments (continued) | | BlackRock Mid-Cap Value Equity Portfolio |
| | (Percentages shown are based on Net Assets) |
| | | | | |
| | | Shares | | Value |
Common Stocks | | | | | |
Insurance (concluded) | | | | | |
AXIS Capital Holdings Ltd. | | 240,030 | | $ | 7,503,338 |
The Hanover Insurance Group, Inc. | | 167,499 | | | 7,304,631 |
HCC Insurance Holdings, Inc. | | 230,500 | | | 6,361,800 |
Lincoln National Corp. | | 132,900 | | | 4,080,030 |
Loews Corp. | | 232,800 | | | 8,678,784 |
Primerica, Inc. (a) | | 48,000 | | | 720,000 |
RenaissanceRe Holdings Ltd. | | 38,100 | | | 2,162,556 |
The Travelers Cos., Inc. | | 117,550 | | | 6,340,647 |
W.R. Berkley Corp. | | 167,700 | | | 4,375,293 |
XL Capital Ltd. - Class A | | 291,050 | | | 5,500,845 |
| | | | | |
| | | | | 56,658,274 |
| | | | | |
Internet & Catalog Retail — 0.4% | | | | | |
Expedia, Inc. (b) | | 102,900 | | | 2,568,384 |
| | | | | |
Internet Software & Services — 1.0% | | | | | |
Yahoo!, Inc. (a) | | 422,500 | | | 6,983,925 |
| | | | | |
IT Services — 1.2% | | | | | |
Amdocs Ltd. (a) | | 127,314 | | | 3,833,425 |
Fidelity National Information Services, Inc. | | 213,650 | | | 5,007,956 |
| | | | | |
| | | | | 8,841,381 |
| | | | | |
Leisure Equipment & Products — 1.1% | | | | | |
Mattel, Inc. | | 339,600 | | | 7,722,504 |
| | | | | |
Life Sciences Tools & Services — 0.8% | | | | | |
Thermo Fisher Scientific, Inc. (a) | | 115,900 | | | 5,961,896 |
| | | | | |
Machinery — 4.4% | | | | | |
Danaher Corp. | | 85,400 | | | 6,824,314 |
Eaton Corp. | | 72,300 | | | 5,478,171 |
Navistar International Corp. (a) | | 66,100 | | | 2,956,653 |
Parker Hannifin Corp. | | 93,400 | | | 6,046,716 |
Terex Corp. (a) | | 345,200 | | | 7,839,492 |
Trinity Industries, Inc. | | 154,800 | | | 3,089,808 |
| | | | | |
| | | | | 32,235,154 |
| | | | | |
Media — 3.9% | | | | | |
Cablevision Systems Corp. - Class A | | 324,800 | | | 7,840,672 |
DIRECTV - Class A (a) | | 156,900 | | | 5,304,789 |
The Interpublic Group of Cos., Inc. (a) | | 927,400 | | | 7,715,968 |
Viacom, Inc. - Class B (a) | | 215,550 | | | 7,410,609 |
| | | | | |
| | | | | 28,272,038 |
| | | | | |
Metals & Mining — 1.4% | | | | | |
Freeport-McMoRan Copper & Gold, Inc. | | 68,700 | | | 5,739,198 |
Reliance Steel & Aluminum Co. | | 89,950 | | | 4,428,238 |
| | | | | |
| | | | | 10,167,436 |
| | | | | |
Multiline Retail — 2.1% | | | | | |
Macy’s, Inc. (b) | | 450,250 | | | 9,801,943 |
Saks, Inc. (a)(b) | | 586,700 | | | 5,045,620 |
| | | | | |
| | | | | 14,847,563 |
| | | | | |
Multi-Utilities — 2.9% | | | | | |
CMS Energy Corp. | | 486,900 | | | 7,527,474 |
PG&E Corp. (b) | | 168,700 | | | 7,156,254 |
Wisconsin Energy Corp. | | 132,300 | | | 6,536,943 |
| | | | | |
| | | | | 21,220,671 |
| | | | | |
Office Electronics — 1.1% | | | | | |
Xerox Corp. | | 848,500 | | | 8,272,875 |
| | | | | |
Oil, Gas & Consumable Fuels — 6.5% | | | | | |
Cimarex Energy Co. (b) | | 121,900 | | | 7,238,422 |
CONSOL Energy, Inc. | | 157,181 | | | 6,705,341 |
Newfield Exploration Co. (a) | | 128,500 | | | 6,688,425 |
Petrohawk Energy Corp. (a) | | 341,700 | | | 6,929,676 |
Plains Exploration & Production Co. (a) | | 275,600 | | | 8,265,244 |
SandRidge Energy, Inc. (a)(b) | | 473,100 | | | 3,642,870 |
Whiting Petroleum Corp. (a) | | 92,200 | | | 7,453,448 |
| | | | | |
| | | | | 46,923,426 |
| | | | | |
Paper & Forest Products — 1.8% | | | | | |
International Paper Co. | | 328,200 | | | 8,077,002 |
Weyerhaeuser Co. (b) | | 113,000 | | | 5,115,510 |
| | | | | |
| | | | | 13,192,512 |
| | | | | |
Personal Products — 0.9% | | | | | |
Avon Products, Inc. | | 90,000 | | | 3,048,300 |
The Estee Lauder Cos., Inc. - Class A | | 57,100 | | | 3,704,077 |
| | | | | |
| | | | | 6,752,377 |
| | | | | |
Pharmaceuticals — 0.8% | | | | | |
Watson Pharmaceuticals, Inc. (a)(b) | | 134,200 | | | 5,605,534 |
| | | | | |
Real Estate Investment Trusts (REITs) — 4.7% | | | | | |
Alexandria Real Estate Equities, Inc. (b) | | 103,500 | | | 6,996,600 |
Chimera Investment Corp. | | 1,973,710 | | | 7,677,732 |
MFA Financial, Inc. | | 1,071,800 | | | 7,888,448 |
Simon Property Group, Inc. (b) | | 102,806 | | | 8,625,423 |
U-Store-It Trust | | 426,300 | | | 3,069,360 |
| | | | | |
| | | | | 34,257,563 |
| | | | | |
Real Estate Management & Development — 1.2% | | | | | |
Forestar Group, Inc. (a) | | 443,000 | | | 8,363,840 |
| | | | | |
Road & Rail — 1.6% | | | | | |
Hertz Global Holdings, Inc. (a) | | 464,400 | | | 4,639,356 |
Union Pacific Corp. | | 95,900 | | | 7,029,470 |
| | | | | |
| | | | | 11,668,826 |
| | | | | |
Semiconductors & Semiconductor Equipment — 1.5% | | | | | |
Micron Technology, Inc. (a) | | 323,060 | | | 3,356,593 |
ON Semiconductor Corp. (a) | | 616,400 | | | 4,931,200 |
Varian Semiconductor Equipment Associates, Inc. (a) | | 86,200 | | | 2,854,944 |
| | | | | |
| | | | | 11,142,737 |
| | | | | |
Software — 2.2% | | | | | |
Novell, Inc. (a) | | 627,500 | | | 3,758,725 |
Phase Metrics, Inc. (a) | | 108,409 | | | 2,168 |
Symantec Corp. (a) | | 163,550 | | | 2,767,266 |
Take-Two Interactive Software, Inc. (a) | | 354,600 | | | 3,492,810 |
TiVo, Inc. (a) | | 362,100 | | | 6,199,152 |
| | | | | |
| | | | | 16,220,121 |
| | | | | |
Specialty Retail — 2.5% | | | | | |
The Gap, Inc. | | 324,200 | | | 7,492,262 |
Limited Brands, Inc. | | 276,300 | | | 6,802,506 |
The Sherwin-Williams Co. | | 52,500 | | | 3,553,200 |
| | | | | |
| | | | | 17,847,968 |
| | | | | |
Thrifts & Mortgage Finance — 1.8% | | | | | |
People’s United Financial, Inc. | | 509,000 | | | 7,960,760 |
See Notes to Financial Statements.
| | | | | | |
16 | | BLACKROCK FUNDS | | MARCH 31, 2010 | | |
| | |
| Schedule of Investments (continued) | | BlackRock Mid-Cap Value Equity Portfolio |
| | (Percentages shown are based on Net Assets) |
| | | | | | |
| | | Shares | | Value | |
Common Stocks | | | | | | |
Thrifts & Mortgage Finance (concluded) | | | | | | |
Washington Federal, Inc. (b) | | 253,300 | | $ | 5,147,056 | |
| | | | | | |
| | | | | 13,107,816 | |
| | | | | | |
Water Utilities — 0.9% | | | | | | |
American Water Works Co., Inc. | | 304,400 | | | 6,623,744 | |
| | | | | | |
Wireless Telecommunication Services — 0.8% | | | | | | |
Syniverse Holdings, Inc. (a) | | 298,100 | | | 5,804,007 | |
| | | | | | |
Total Long-Term Investments
(Cost — $544,729,801) — 98.7% | | | | | 716,209,903 | |
| | | | | | |
| | |
| | | Shares/
Beneficial
Interest | | | |
Short-Term Securities | | | | | | |
BlackRock Liquidity Funds, TempFund, Institutional Class, 0.11% (c)(d) | | 9,507,890 | | | 9,507,890 | |
BlackRock Liquidity Series, LLC Money Market Series, 0.22% (c)(d)(e) | | 91,313,800 | | | 91,313,800 | |
| | | | | | |
Total Short-Term Securities
(Cost — $100,821,690) — 13.9% | | | | | 100,821,690 | |
| | | | | | |
Total Investments Before Outstanding Options Written
(Cost — $645,551,491*) — 112.6% | | | | | 817,031,593 | |
| | | | | | |
| | |
| | | Contracts | | | |
Options Written | | | | | | |
Exchange-Traded Call Options Written | | | | | | |
Chimera Investment Corp., Strike Price $5, Expires 6/19/10 | | 110 | | | (550 | ) |
Darden Restaurants, Inc., Strike Price $44, Expires 4/17/10 | | 250 | | | (25,000 | ) |
Del Monte Foods Co., Strike Price $15, Expires 5/22/10 | | 1,000 | | | (40,000 | ) |
Mattel, Inc., Strike Price $25, Expires 4/17/10 | | 1,000 | | | (15,000 | ) |
Micron Technology, Inc., Strike Price $12, Expires 5/22/10 | | 1,000 | | | (28,000 | ) |
Xerox Corp., Strike Price $11, Expires 4/17/10 | | 3,000 | | | (6,000 | ) |
| | | | | | |
Total Options Written
(Premiums Received — $139,863) — (0.0)% | | | | | (114,550 | ) |
| | | | | | |
Total Investments Net of Outstanding Options Written — 112.6% | | | | | 816,917,043 | |
Liabilities in Excess of Other Assets — (12.6)% | | | | | (91,357,862 | ) |
| | | | | | |
Net Assets — 100.0% | | | | $ | 725,559,181 | |
| | | | | | |
| * | The cost and unrealized appreciation (depreciation) of investments as of March 31, 2010, as computed for federal income tax purposes, were as follows: |
| | | | |
Aggregate cost | | $ | 710,742,940 | |
| | | | |
Gross unrealized appreciation | | $ | 111,297,270 | |
Gross unrealized depreciation | | | (5,008,617 | ) |
| | | | |
Net unrealized appreciation | | $ | 106,288,653 | |
| | | | |
| (a) | Non-income producing security. |
| (b) | Security, or a portion of security, is on loan. |
| (c) | Investments in companies considered to be an affiliate of the Fund, for purposes of Section 2(a)(3) of the Investment Company Act of 1940, were as follows: |
| | | | | | | | | | |
| | | Net | | | Realized | | |
Affiliate | | Activity | | | Gain | | Income |
BlackRock Liquidity Funds, TempFund, Institutional Class | | $ | (8,080,011 | ) | | $ | 114 | | $ | 5,970 |
BlackRock Liquidity Series, LLC Money Market Series | | $ | 59,068,900 | | | | — | | $ | 47,880 |
| (d) | Represents the current yield as of report date. |
| (e) | Security was purchased with the cash collateral from loaned securities. |
| • | | For Fund compliance purposes, the Fund’s industry classifications refer to any one or more of the industry sub-classifications used by one or more widely recognized market indexes or ratings group indexes, and/or as defined by Fund management. This definition may not apply for purposes of this report, which may combine industry sub-classifications for reporting ease. |
| • | | Fair Value Measurements – Various inputs are used in determining the fair value of investments, which are as follows: |
| | • | | Level 1 – price quotations in active markets/exchanges for identical assets and liabilities |
| | • | | Level 2 – other observable inputs (including, but not limited to: quoted prices for similar assets or liabilities in markets that are active, quoted prices for identical or similar assets or liabilities in markets that are not active, inputs other than quoted prices that are observable for the assets or liabilities (such as interest rates, yield curves, volatilities, prepayment speeds, loss severities, credit risks and default rates) or other market–corroborated inputs) |
| | • | | Level 3 – unobservable inputs based on the best information available in the circumstances, to the extent observable inputs are not available (including the Fund’s own assumptions used in determining the fair value of investments) |
The inputs or methodologies used for valuing securities are not necessarily an indication of the risk associated with investing in those securities. For information about the Fund’s policy regarding valuation of investments and other significant accounting policies, please refer to Note 1 of the Notes to Financial Statements.
See Notes to Financial Statements.
| | | | | | |
| | | BLACKROCK FUNDS | | MARCH 31, 2010 | | 17 |
| | |
| Schedule of Investments (concluded) | | BlackRock Mid-Cap Value Equity Portfolio |
| | |
The following table summarizes the inputs used as of March 31, 2010 in determining the fair valuation of the Fund’s investments:
| | | | | | | |
Valuation Inputs | | Investments
in Securities | | Other Financial
Instruments1 : | |
| | |
| | | Assets | | Liabilities | |
| | |
Level 1 : | | | | | | | |
Long-Term Investments2 | | $ | 716,207,304 | | | — | |
Short-Term Securities | | | 9,507,890 | | $ | (114,550 | ) |
| | | | | | | |
Total Level 1 | | | 725,715,194 | | | (114,550 | ) |
| | | | | | | |
Level 2 – Short-Term Securities | | | 91,313,800 | | | — | |
Level 3 : | | | | | | | |
Long-Term Investments: | | | | | | | |
Capital Markets | | | 431 | | | — | |
Software | | | 2,168 | | | — | |
| | | | | | | |
Total Level 3 | | | 2,599 | | | — | |
| | | | | | | |
Total | | $ | 817,031,593 | | $ | (114,550 | ) |
| | | | | | | |
| 1 | Other financial instruments are options which are shown at value. |
| 2 | See above Schedule of Investments for values in each industry excluding the industries in Level 3 within the table. |
The following table is reconciliation of Level 3 investments for the six months ended March 31, 2010:
| | | | | | | | | |
| | | Long-Term Investments | | |
| | | Capital Markets | | Software | | Total |
Balance, as of September 30, 2009 | | $ | 431 | | $ | 2,168 | | $ | 2,599 |
Accrued discounts/premiums | | | — | | | — | | | — |
Realized gain/loss | | | — | | | — | | | — |
Change in unrealized appreciation/depreciation1 | | | — | | | — | | | — |
Net purchases/sales | | | — | | | — | | | — |
Transfers in/out of Level 3 | | | — | | | — | | | — |
| | | | | | | | | |
Balance, as of March 31, 2010 | | $ | 431 | | $ | 2,168 | | $ | 2,599 |
| | | | | | | | | |
| 1 | Included in the related net change in unrealized appreciation/depreciation in the Statements of Operations. The change in unrealized appreciation/ depreciation on securities still held at March 31, 2010 was $0. |
See Notes to Financial Statements.
| | | | | | |
18 | | BLACKROCK FUNDS | | MARCH 31, 2010 | | |
| | |
| Schedule of Investments March 31, 2010 (Unaudited) | | BlackRock Small/Mid-Cap Growth Portfolio |
| | (Percentages shown are based on Net Assets) |
| | | | | |
| | | Shares | | Value |
Common Stocks | | | | | |
Aerospace & Defense — 4.2% | | | | | |
Argon ST, Inc. (a) | | 53,311 | | $ | 1,418,606 |
BE Aerospace, Inc. (a) | | 111,800 | | | 3,404,310 |
Orbital Sciences Corp. (a) | | 78,900 | | | 1,499,889 |
| | | | | |
| | | | | 6,322,805 |
| | | | | |
Air Freight & Logistics — 3.2% | | | | | |
Atlas Air Worldwide Holdings, Inc. (a) | | 53,600 | | | 2,843,480 |
Forward Air Corp. | | 75,700 | | | 1,990,910 |
| | | | | |
| | | | | 4,834,390 |
| | | | | |
Auto Components — 1.0% | | | | | |
Lear Corp. (a) | | 19,000 | | | 1,507,650 |
| | | | | |
Beverages — 1.2% | | | | | |
Heckmann Corp. (a) | | 312,900 | | | 1,814,820 |
| | | | | |
Biotechnology — 3.2% | | | | | |
Cubist Pharmaceuticals, Inc. (a) | | 48,900 | | | 1,102,206 |
Dendreon Corp. (a)(b) | | 55,500 | | | 2,024,085 |
InterMune, Inc. (a) | | 12,000 | | | 534,840 |
Onyx Pharmaceuticals, Inc. (a) | | 36,300 | | | 1,099,164 |
| | | | | |
| | | | | 4,760,295 |
| | | | | |
Capital Markets — 2.0% | | | | | |
Financial Engines, Inc. (a) | | 15,500 | | | 261,950 |
Greenhill & Co., Inc. | | 8,000 | | | 656,720 |
Invesco Ltd. | | 82,900 | | | 1,816,339 |
SWS Group, Inc. | | 22,400 | | | 258,272 |
| | | | | |
| | | | | 2,993,281 |
| | | | | |
Chemicals — 3.9% | | | | | |
Agrium, Inc. | | 28,200 | | | 1,991,766 |
Celanese Corp. - Series A | | 61,700 | | | 1,965,145 |
Georgia Gulf Corp. (a) | | 21,900 | | | 404,931 |
Intrepid Potash, Inc. (a)(b) | | 52,600 | | | 1,595,358 |
| | | | | |
| | | | | 5,957,200 |
| | | | | |
Commercial Services & Supplies — 2.3% | | | | | |
Clean Harbors, Inc. (a) | | 21,400 | | | 1,188,984 |
SYKES Enterprises, Inc. (a) | | 103,484 | | | 2,363,575 |
| | | | | |
| | | | | 3,552,559 |
| | | | | |
Construction & Engineering — 1.9% | | | | | |
Chicago Bridge & Iron Co. NV (a) | | 62,800 | | | 1,460,728 |
Quanta Services, Inc. (a) | | 75,100 | | | 1,438,916 |
| | | | | |
| | | | | 2,899,644 |
| | | | | |
Consumer Finance — 2.0% | | | | | |
Dollar Financial Corp. (a) | | 128,599 | | | 3,094,092 |
| | | | | |
Containers & Packaging — 1.5% | | | | | |
Owens-Illinois, Inc. (a) | | 64,300 | | | 2,285,222 |
| | | | | |
Diversified Consumer Services — 1.3% | | | | | |
Grand Canyon Education, Inc. (a) | | 75,400 | | | 1,970,956 |
| | | | | |
Diversified Financial Services — 0.8% | | | | | |
MSCI, Inc. - Class A (a) | | 35,100 | | | 1,267,110 |
| | | | | |
Diversified Telecommunication Services — 0.9% | | | | | |
Cbeyond, Inc. (a) | | 95,000 | | | 1,299,600 |
| | | | | |
Electrical Equipment — 1.1% | | | | | |
A123 Systems, Inc. (a)(b) | | 6,700 | | | 92,058 |
AMETEK, Inc. | | 37,900 | | | 1,571,334 |
| | | | | |
| | | | | 1,663,392 |
| | | | | |
Electronic Equipment, Instruments & Components — 1.4% | | | | | |
Cogent, Inc. (a) | | 203,300 | | | 2,073,660 |
| | | | | |
Energy Equipment & Services — 0.9% | | | | | |
Superior Energy Services, Inc. (a) | | 64,400 | | | 1,353,688 |
| | | | | |
Food Products — 1.2% | | | | | |
Diamond Foods, Inc. | | 44,400 | | | 1,866,576 |
| | | | | |
Health Care Equipment & Supplies — 6.1% | | | | | |
Gen-Probe, Inc. (a) | | 40,900 | | | 2,045,000 |
Hologic, Inc. (a) | | 126,600 | | | 2,347,164 |
Inverness Medical Innovations, Inc. (a) | | 53,900 | | | 2,099,405 |
SonoSite, Inc. (a) | | 82,978 | | | 2,664,424 |
| | | | | |
| | | | | 9,155,993 |
| | | | | |
Health Care Providers & Services — 5.1% | | | | | |
Emergency Medical Services Corp. - Class A (a) | | 25,899 | | | 1,464,588 |
Lincare Holdings, Inc. (a) | | 69,100 | | | 3,101,208 |
Medco Health Solutions, Inc. (a) | | 30,500 | | | 1,969,080 |
MEDNAX, Inc. (a) | | 19,500 | | | 1,134,705 |
| | | | | |
| | | | | 7,669,581 |
| | | | | |
Health Care Technology — 1.0% | | | | | |
MedAssets, Inc. (a) | | 69,100 | | | 1,451,100 |
| | | | | |
Hotels, Restaurants & Leisure — 2.9% | | | | | |
The Cheesecake Factory, Inc. (a) | | 50,600 | | | 1,369,236 |
Scientific Games Corp. - Class A (a) | | 215,400 | | | 3,032,832 |
| | | | | |
| | | | | 4,402,068 |
| | | | | |
Household Products — 0.7% | | | | | |
Church & Dwight Co., Inc. | | 15,500 | | | 1,037,725 |
| | | | | |
Insurance — 0.7% | | | | | |
Aspen Insurance Holdings Ltd. | | 36,600 | | | 1,055,544 |
| | | | | |
Internet Software & Services — 0.3% | | | | | |
Constant Contact, Inc. (a) | | 19,200 | | | 445,824 |
| | | | | |
IT Services — 6.7% | | | | | |
Amdocs Ltd. (a) | | 48,075 | | | 1,447,538 |
ExlService Holdings, Inc. (a) | | 181,201 | | | 3,022,433 |
Gartner, Inc. (a) | | 106,800 | | | 2,375,232 |
Genpact Ltd. (a) | | 83,400 | | | 1,398,618 |
Global Cash Access Holdings, Inc. (a) | | 225,900 | | | 1,845,603 |
| | | | | |
| | | | | 10,089,424 |
| | | | | |
Life Sciences Tools & Services — 1.0% | | | | | |
Bruker Corp. (a) | | 53,100 | | | 777,915 |
Thermo Fisher Scientific, Inc. (a) | | 14,600 | | | 751,024 |
| | | | | |
| | | | | 1,528,939 |
| | | | | |
Machinery — 3.2% | | | | | |
Joy Global, Inc. | | 23,100 | | | 1,307,460 |
The Manitowoc Co., Inc. | | 147,900 | | | 1,922,700 |
Pentair, Inc. | | 43,300 | | | 1,542,346 |
| | | | | |
| | | | | 4,772,506 |
| | | | | |
Media — 3.5% | | | | | |
CKX, Inc. (a) | | 533,700 | | | 3,271,581 |
See Notes to Financial Statements.
| | | | | | |
| | | BLACKROCK FUNDS | | MARCH 31, 2010 | | 19 |
| | |
| Schedule of Investments (continued) | | BlackRock Small/Mid-Cap Growth Portfolio |
| | (Percentages shown are based on Net Assets) |
| | | | | | |
| | | Shares | | Value | |
Common Stocks | | | | | | |
Media (concluded) | | | | | | |
DreamWorks Animation SKG, Inc. - Class A (a) | | 49,832 | | $ | 1,962,882 | |
| | | | | | |
| | | | | 5,234,463 | |
| | | | | | |
Metals & Mining — 1.1% | | | | | | |
Century Aluminum Co. (a)(b) | | 117,800 | | | 1,620,928 | |
| | | | | | |
Oil, Gas & Consumable Fuels — 5.0% | | | | | | |
CONSOL Energy, Inc. | | 40,900 | | | 1,744,794 | |
EXCO Resources, Inc. | | 11,650 | | | 214,127 | |
Plains Exploration & Production Co. (a) | | 74,400 | | | 2,231,256 | |
Ultra Petroleum Corp. (a) | | 37,900 | | | 1,767,277 | |
The Williams Cos., Inc. | | 66,500 | | | 1,536,150 | |
| | | | | | |
| | | | | 7,493,604 | |
| | | | | | |
Pharmaceuticals — 4.5% | | | | | | |
Auxilium Pharmaceuticals, Inc. (a) | | 45,800 | | | 1,427,128 | |
Biovail Corp. | | 67,400 | | | 1,130,298 | |
Cypress Bioscience, Inc. (a) | | 137,800 | | | 675,220 | |
Shire Plc - ADR | | 33,276 | | | 2,194,885 | |
Warner Chilcott Plc - Class A (a) | | 54,100 | | | 1,382,255 | |
| | | | | | |
| | | | | 6,809,786 | |
| | | | | | |
Professional Services — 2.3% | | | | | | |
Manpower, Inc. | | 24,700 | | | 1,410,864 | |
Robert Half International, Inc. (b) | | 24,800 | | | 754,664 | |
TrueBlue, Inc. (a) | | 49,800 | | | 771,900 | |
Verisk Analytics, Inc. - Class A (a) | | 17,500 | | | 493,500 | |
| | | | | | |
| | | | | 3,430,928 | |
| | | | | | |
Semiconductors & Semiconductor Equipment — 4.3% | | | | | | |
Entegris, Inc. (a) | | 321,000 | | | 1,617,840 | |
FEI Co. (a) | | 46,500 | | | 1,065,315 | |
Microsemi Corp. (a) | | 85,200 | | | 1,477,368 | |
Netlogic Microsystems, Inc. (a) | | 13,600 | | | 400,248 | |
ON Semiconductor Corp. (a) | | 84,351 | | | 674,808 | |
Silicon Laboratories, Inc. (a) | | 27,000 | | | 1,287,090 | |
| | | | | | |
| | | | | 6,522,669 | |
| | | | | | |
Software — 9.8% | | | | | | |
Adobe Systems, Inc. (a) | | 38,400 | | | 1,358,208 | |
Blackboard, Inc. (a)(b) | | 52,500 | | | 2,187,150 | |
DemandTec, Inc. (a) | | 140,500 | | | 976,475 | |
SonicWALL, Inc. (a) | | 345,600 | | | 3,003,264 | |
Taleo Corp. - Class A (a) | | 51,200 | | | 1,326,592 | |
TiVo, Inc. (a) | | 347,200 | | | 5,944,064 | |
| | | | | | |
| | | | | 14,795,753 | |
| | | | | | |
Specialty Retail — 3.4% | | | | | | |
American Eagle Outfitters, Inc. | | 103,400 | | | 1,914,968 | |
Dick’s Sporting Goods, Inc. (a) | | 30,600 | | | 798,966 | |
GameStop Corp. - Class A (a) | | 69,766 | | | 1,528,573 | |
J. Crew Group, Inc. (a) | | 19,200 | | | 881,280 | |
| | | | | | |
| | | | | 5,123,787 | |
| | | | | | |
Textiles, Apparel & Luxury Goods — 1.0% | | | | | | |
Coach, Inc. | | 38,800 | | | 1,533,376 | |
| | | | | | |
Total Long-Term Investments
(Cost — $123,117,212) — 96.6% | | | | | 145,690,938 | |
| | | | | | |
| | |
| | | Shares/
Beneficial
Interest | | | |
Short-Term Securities | | | | | | |
BlackRock Liquidity Funds, TempFund, Institutional Class, 0.11% (c)(d) | | 4,897,837 | | | 4,897,837 | |
BlackRock Liquidity Series, LLC Money Market Series, 0.22% (c)(d)(e) | | 7,183,750 | | | 7,183,750 | |
| | | | | | |
Total Short-Term Securities
(Cost — $12,081,587) — 8.0% | | | | | 12,081,587 | |
| | | | | | |
Total Investments
(Cost — $135,198,799*) — 104.6% | | | | | 157,772,525 | |
Liabilities in Excess of Other Assets — (4.6)% | | | | | (6,935,108 | ) |
| | | | | | |
Net Assets — 100.0% | | | | $ | 150,837,417 | |
| | | | | | |
| * | The cost and unrealized appreciation (depreciation) of investments as of March 31, 2010, as computed for federal income tax purposes, were as follows: |
| | | | |
Aggregate cost | | $ | 136,682,684 | |
| | | | |
Gross unrealized appreciation | | $ | 27,119,844 | |
Gross unrealized depreciation | | | (6,030,003 | ) |
| | | | |
Net unrealized appreciation | | $ | 21,089,841 | |
| | | | |
| (a) | Non-income producing security. |
| (b) | Security, or a portion of security, is on loan. |
| (c) | Investments in companies considered to be an affiliate of the Fund, for purposes of Section 2(a)(3) of the Investment Company Act of 1940, were as follows: |
| | | | | | | | | |
| | | Net | | Realized | | |
Affiliate | | Activity | | Gain | | Income |
BlackRock Liquidity Funds, TempFund, Institutional Class | | $ | 4,897,837 | | $ | 43 | | $ | 1,946 |
BlackRock Liquidity Series, LLC Money Market Series | | $ | 4,012,250 | | | — | | $ | 5,404 |
| (d) | Represents the current yield as of report date. |
| (e) | Security was purchased with the cash collateral from loaned securities. |
| • | | For Fund compliance purposes, the Fund’s industry classifications refer to any one or more of the industry sub-classifications used by one or more widely recognized market indexes or ratings group indexes, and/or as defined by Fund management. This definition may not apply for purposes of this report, which may combine industry sub-classifications for reporting ease. |
| • | | Fair Value Measurements – Various inputs are used in determining the fair value of investments, which are as follows: |
| | • | | Level 1 – price quotations in active markets/exchanges for identical assets and liabilities |
| | • | | Level 2 – other observable inputs (including, but not limited to: quoted prices for similar assets or liabilities in markets that are active, quoted prices for identical or similar assets or liabilities in markets that are not active, inputs other than quoted prices that are observable for the assets or liabilities (such as interest rates, yield curves, volatilities, prepayment speeds, loss severities, credit risks and default rates) or other market–corroborated inputs) |
| | • | | Level 3 – unobservable inputs based on the best information available in the circumstances, to the extent observable inputs are not available (including the Fund’s own assumptions used in determining the fair value of investments) |
See Notes to Financial Statements.
| | | | | | |
20 | | BLACKROCK FUNDS | | MARCH 31, 2010 | | |
| | |
| Schedule of Investments (concluded) | | BlackRock Small/Mid-Cap Growth Portfolio |
The inputs or methodologies used for valuing securities are not necessarily an indication of the risk associated with investing in those securities. For information about the Fund’s policy regarding valuation of investments and other significant accounting policies, please refer to Note 1 of the Notes to Financial Statements.
The following table summarizes the inputs used as of March 31, 2010 in determining the fair valuation of the Fund’s investments:
| | | |
Valuation Inputs | | Investments
in Securities |
| | | Assets |
Level 1: | | | |
Long-Term Investments1 | | $ | 145,690,938 |
Short-Term Securities | | | 4,897,837 |
| | | |
Total Level 1 | | | 150,588,775 |
| | | |
Level 2 – Short-Term Securities | | | 7,183,750 |
Level 3 | | | — |
| | | |
Total | | $ | 157,772,525 |
| | | |
| 1 | See above Schedule of Investments for values in each industry. |
See Notes to Financial Statements.
| | | | | | |
| | | BLACKROCK FUNDS | | MARCH 31, 2010 | | 21 |
Statements of Assets and Liabilities
| | | | | | | | | | | | |
March 31, 2010 (Unaudited) | | BlackRock
Mid-Cap
Growth Equity
Portfolio | | | BlackRock
Mid-Cap
Value Equity
Portfolio | | | BlackRock
Small/Mid-Cap
Growth
Portfolio | |
Assets | | | | | | | | | | | | |
Investments at value - unaffiliated1,2 | | $ | 251,996,703 | | | $ | 716,209,903 | | | $ | 145,690,938 | |
Investments at value - affiliated3 | | | 17,678,420 | | | | 100,821,690 | | | | 12,081,587 | |
Investments sold receivable | | | 3,826,837 | | | | 8,271,300 | | | | 1,060,728 | |
Capital shares sold receivable | | | 221,425 | | | | 960,578 | | | | 329,400 | |
Dividends receivable | | | 149,213 | | | | 1,103,592 | | | | 26,746 | |
Securities lending income receivable - affiliated | | | 4,326 | | | | 20,732 | | | | 1,410 | |
Dividends receivable - affiliated | | | 326 | | | | 1,521 | | | | 287 | |
Receivable from advisor | | | 166 | | | | 62,660 | | | | 14,542 | |
Prepaid expenses | | | 59,690 | | | | 78,864 | | | | 49,158 | |
| | | | | | | | | | | | |
Total assets | | | 273,937,106 | | | | 827,530,840 | | | | 159,254,796 | |
| | | | | | | | | | | | |
Liabilities | | | | | | | | | | | | |
Options written at value4 | | | — | | | | 114,550 | | | | — | |
Collateral at value - securities loaned | | | 14,350,950 | | | | 91,313,800 | | | | 7,183,750 | |
Investments purchased payable | | | 3,805,396 | | | | 5,974,905 | | | | 41,830 | |
Capital shares redeemed payable | | | 405,872 | | | | 3,321,550 | | | | 831,426 | |
Other affiliates payable | | | 199,568 | | | | 451,623 | | | | 179,280 | |
Investment advisory fees payable | | | 192,527 | | | | 487,510 | | | | 99,559 | |
Service and distribution fees payable | | | 64,067 | | | | 207,970 | | | | 39,427 | |
Officer’s and Trustees’ fees payable | | | 8,111 | | | | 10,847 | | | | 7,690 | |
Other accrued expenses payable | | | 38,808 | | | | 88,904 | | | | 34,417 | |
| | | | | | | | | | | | |
Total liabilities | | | 19,065,299 | | | | 101,971,659 | | | | 8,417,379 | |
| | | | | | | | | | | | |
Net Assets | | $ | 254,871,807 | | | $ | 725,559,181 | | | $ | 150,837,417 | |
| | | | | | | | | | | | |
Net Assets Consist of | | | | | | | | | | | | |
Paid-in capital | | $ | 361,246,302 | | | $ | 814,883,457 | | | $ | 157,911,274 | |
Undistributed (accumulated) net investment income (loss) | | | (893,561 | ) | | | 20,956 | | | | (803,402 | ) |
Accumulated net realized loss | | | (146,339,886 | ) | | | (260,850,647 | ) | | | (28,844,181 | ) |
Net unrealized appreciation/depreciation | | | 40,858,952 | | | | 171,505,415 | | | | 22,573,726 | |
| | | | | | | | | | | | |
Net Assets | | $ | 254,871,807 | | | $ | 725,559,181 | | | $ | 150,837,417 | |
| | | | | | | | | | | | |
1 Investments at cost - unaffiliated | | $ | 211,137,751 | | | $ | 544,729,801 | | | $ | 123,117,212 | |
2 Securities loaned | | $ | 14,005,021 | | | $ | 88,207,261 | | | $ | 6,933,421 | |
3 Investments at cost - affiliated | | $ | 17,678,420 | | | $ | 100,821,690 | | | $ | 12,081,587 | |
4 Premiums received | | | — | | | $ | 139,863 | | | | — | |
See Notes to Financial Statements.
| | | | | | |
22 | | BLACKROCK FUNDS | | MARCH 31, 2010 | | |
| | |
| Statements of Assets and Liabilities (concluded) | | |
| | | | | | | | | |
March 31, 2010 (Unaudited) | | BlackRock
Mid-Cap
Growth Equity
Portfolio | | BlackRock
Mid-Cap
Value Equity
Portfolio | | BlackRock
Small/Mid-Cap
Growth
Portfolio |
Net Asset Value | | | | | | | | | |
Institutional | | | | | | | | | |
Net assets | | $ | 28,034,012 | | $ | 144,259,897 | | $ | 13,708,468 |
| | | | | | | | | |
Shares outstanding1 | | | 2,391,922 | | | 13,548,492 | | | 1,121,504 |
| | | | | | | | | |
Net asset value | | $ | 11.72 | | $ | 10.65 | | $ | 12.22 |
| | | | | | | | | |
Service | | | | | | | | | |
Net assets | | $ | 376,389 | | $ | 800,154 | | | — |
| | | | | | | | | |
Shares outstanding1 | | | 33,788 | | | 76,487 | | | — |
| | | | | | | | | |
Net asset value | | $ | 11.14 | | $ | 10.46 | | | — |
| | | | | | | | | |
Investor A | | | | | | | | | |
Net assets | | $ | 198,694,971 | | $ | 445,960,499 | | $ | 118,842,998 |
| | | | | | | | | |
Shares outstanding1 | | | 18,423,222 | | | 43,122,279 | | | 10,444,521 |
| | | | | | | | | |
Net asset value | | $ | 10.79 | | $ | 10.34 | | $ | 11.38 |
| | | | | | | | | |
Investor B | | | | | | | | | |
Net assets | | $ | 10,816,317 | | $ | 34,862,967 | | $ | 6,101,358 |
| | | | | | | | | |
Shares outstanding1 | | | 1,133,024 | | | 3,709,362 | | | 634,510 |
| | | | | | | | | |
Net asset value | | $ | 9.55 | | $ | 9.40 | | $ | 9.62 |
| | | | | | | | | |
Investor C | | | | | | | | | |
Net assets | | $ | 13,997,590 | | $ | 99,675,664 | | $ | 9,196,299 |
| | | | | | | | | |
Shares outstanding1 | | | 1,466,061 | | | 10,638,013 | | | 955,138 |
| | | | | | | | | |
Net asset value | | $ | 9.55 | | $ | 9.37 | | $ | 9.63 |
| | | | | | | | | |
Class R | | | | | | | | | |
Net assets | | $ | 2,952,528 | | | — | | $ | 2,988,294 |
| | | | | | | | | |
Shares outstanding1 | | | 274,072 | | | — | | | 265,943 |
| | | | | | | | | |
Net asset value | | $ | 10.77 | | | — | | $ | 11.24 |
| | | | | | | | | |
| 1 | Unlimited number of shares authorized, $0.001 par value. |
See Notes to Financial Statements.
| | | | | | |
| | | BLACKROCK FUNDS | | MARCH 31, 2010 | | 23 |
Statements of Operations
| | | | | | | | | | | | |
Six Months Ended March 31, 2010 (Unaudited) | | BlackRock
Mid-Cap
Growth
Equity
Portfolio | | | BlackRock
Mid-Cap
Value
Equity
Portfolio | | | BlackRock
Small/Mid-Cap
Growth
Portfolio | |
Investment Income | | | | | | | | | | | | |
Dividends | | $ | 1,002,920 | | | $ | 5,655,620 | | | $ | 188,697 | |
Foreign taxes withheld | | | (2,231 | ) | | | — | | | | (1,009 | ) |
Securities lending - affiliated | | | 11,906 | | | | 47,880 | | | | 5,404 | |
Dividends - affiliated | | | 2,232 | | | | 5,970 | | | | 1,946 | |
| | | | | | | | | | | | |
Total income | | | 1,014,827 | | | | 5,709,470 | | | | 195,038 | |
| | | | | | | | | | | | |
Expenses | | | | | | | | | | | | |
Investment advisory | | | 959,998 | | | | 2,811,699 | | | | 525,448 | |
Transfer agent - class specific | | | 394,093 | | | | 813,472 | | | | 269,599 | |
Service and distribution - class specific | | | 357,449 | | | | 1,163,547 | | | | 219,416 | |
Administration | | | 90,000 | | | | 253,382 | | | | 52,545 | |
Administration - class specific | | | 30,011 | | | | 87,946 | | | | 17,527 | |
Registration | | | 24,394 | | | | 22,130 | | | | 19,867 | |
Printing | | | 23,300 | | | | 81,781 | | | | 13,305 | |
Professional | | | 22,487 | | | | 25,912 | | | | 29,242 | |
Custodian | | | 9,273 | | | | 28,064 | | | | 14,462 | |
Officer and Trustees | | | 9,020 | | | | 13,997 | | | | 8,020 | |
Miscellaneous | | | 8,936 | | | | 14,906 | | | | 7,536 | |
Recoupment of past waived fees - class specific | | | 22,093 | | | | — | | | | 1,751 | |
| | | | | | | | | | | | |
Total expenses | | | 1,951,054 | | | | 5,316,836 | | | | 1,178,718 | |
Less fees waived by advisor | | | (1,244 | ) | | | (3,263 | ) | | | (1,084 | ) |
Less administration fees waived - class specific | | | (1,503 | ) | | | (87,629 | ) | | | (17,276 | ) |
Less transfer agent fees waived - class specific | | | (1,214 | ) | | | (26,453 | ) | | | (7,196 | ) |
Less transfer agent fees reimbursed - class specific | | | (9,622 | ) | | | (418,877 | ) | | | (132,862 | ) |
Less fees paid indirectly | | | (600 | ) | | | (624 | ) | | | (175 | ) |
| | | | | | | | | | | | |
Total expenses after fees waived, reimbursed and paid indirectly | | | 1,936,871 | | | | 4,779,990 | | | | 1,020,125 | |
| | | | | | | | | | | | |
Net investment income (loss) | | | (922,044 | ) | | | 929,480 | | | | (825,087 | ) |
| | | | | | | | | | | | |
Realized and Unrealized Gain (Loss) | | | | | | | | | | | | |
Net realized gain from: | | | | | | | | | | | | |
Investments | | | 15,274,801 | | | | 63,613,153 | | | | 11,550,176 | |
Redemption-in-kind transactions | | | — | | | | 3,663,107 | | | | — | |
Options written | | | — | | | | 455,324 | | | | — | |
| | | | | | | | | | | | |
| | | 15,274,801 | | | | 67,731,584 | | | | 11,550,176 | |
| | | | | | | | | | | | |
Net change in unrealized appreciation/depreciation on: | | | | | | | | | | | | |
Investments | | | 17,246,783 | | | | 26,606,701 | | | | 6,659,347 | |
Options written | | | — | | | | (34,647 | ) | | | — | |
| | | | | | | | | | | | |
| | | 17,246,783 | | | | 26,572,054 | | | | 6,659,347 | |
| | | | | | | | | | | | |
Total realized and unrealized gain | | | 32,521,584 | | | | 94,303,638 | | | | 18,209,523 | |
| | | | | | | | | | | | |
Net Increase in Net Assets Resulting from Operations | | $ | 31,599,540 | | | $ | 95,233,118 | | | $ | 17,384,436 | |
| | | | | | | | | | | | |
See Notes to Financial Statements.
| | | | | | |
24 | | BLACKROCK FUNDS | | MARCH 31, 2010 | | |
Statements of Changes in Net Assets
| | | | | | | | | | | | | | | | | | | | | | | | |
Increase (Decrease) in Net
Assets: | | BlackRock
Mid-Cap
Growth Equity
Portfolio | | | BlackRock
Mid-Cap
Value Equity
Portfolio | | | BlackRock
Small/Mid-Cap
Growth
Portfolio | |
| | Six Months
Ended
March 31, 2010
(Unaudited) | | | Year Ended
September 30, 2009 | | | Six Months
Ended
March 31, 2010
(Unaudited) | | | Year Ended
September 30, 2009 | | | Six Months
Ended
March 31, 2010
(Unaudited) | | | Year Ended
September 30, 2009 | |
Operations | | | | | | | | | | | | | | | | | | | | | | | | |
Net investment income (loss) | | $ | (922,044 | ) | | $ | (1,686,733 | ) | | $ | 929,480 | | | $ | 3,612,304 | | | $ | (825,087 | ) | | $ | (1,239,310 | ) |
Net realized gain (loss) | | | 15,274,801 | | | | (36,932,678 | ) | | | 67,731,584 | | | | (255,846,682 | ) | | | 11,550,176 | | | | (34,640,064 | ) |
Net change in unrealized appreciation/depreciation | | | 17,246,783 | | | | 30,815,471 | | | | 26,572,054 | | | | 195,004,722 | | | | 6,659,347 | | | | 17,410,574 | |
| | | | | | | | | | | | | | | | | | | | | | | | |
Net increase (decrease) in net assets resulting from operations | | | 31,599,540 | | | | (7,803,940 | ) | | | 95,233,118 | | | | (57,229,656 | ) | | | 17,384,436 | | | | (18,468,800 | ) |
| | | | | | | | | | | | | | | | | | | | | | | | |
Dividends and Distributions to Shareholders From | | | | | | | | | | | | | | | | | | | | | | | | |
Net investment income: | | | | | | | | | | | | | | | | | | | | | | | | |
Institutional | | | — | | | | — | | | | (1,272,559 | ) | | | (1,133,643 | ) | | | — | | | | — | |
Service | | | — | | | | — | | | | (12,974 | ) | | | (15,870 | ) | | | — | | | | — | |
Investor A | | | — | | | | — | | | | (1,814,401 | ) | | | (3,029,032 | ) | | | — | | | | — | |
Investor B | | | — | | | | — | | | | — | | | | (358,215 | ) | | | — | | | | — | |
Investor C | | | — | | | | — | | | | — | | | | (649,056 | ) | | | — | | | | — | |
Tax return of capital: | | | | | | | | | | | | | | | | | | | | | | | | |
Institutional | | | — | | | | — | | | | — | | | | — | | | | — | | | | (24,231 | ) |
Investor A | | | — | | | | — | | | | — | | | | — | | | | — | | | | (140,153 | ) |
Class R | | | — | | | | — | | | | — | | | | — | | | | — | | | | (1,194 | ) |
| | | | | | | | | | | | | | | | | | | | | | | | |
Decrease in net assets resulting from dividends and distributions to shareholders | | | — | | | | — | | | | (3,099,934 | ) | | | (5,185,816 | ) | | | — | | | | (165,578 | ) |
| | | | | | | | | | | | | | | | | | | | | | | | |
Capital Share Transactions | | | | | | | | | | | | | | | | | | | | | | | | |
Net decrease in net assets derived from capital share transactions | | | (10,537,077 | ) | | | (15,545,849 | ) | | | (63,944,847 | ) | | | (40,652,448 | ) | | | (9,282,000 | ) | | | (17,528,808 | ) |
| | | | | | | | | | | | | | | | | | | | | | | | |
Redemption Fees | | | | | | | | | | | | | | | | | | | | | | | | |
Redemption fees | | | — | | | | — | | | | — | | | | — | | | | 917 | | | | 6,433 | |
| | | | | | | | | | | | | | | | | | | | | | | | |
Net Assets | | | | | | | | | | | | | | | | | | | | | | | | |
Total increase (decrease) in net assets | | | 21,062,463 | | | | (23,349,789 | ) | | | 28,188,337 | | | | (103,067,920 | ) | | | 8,103,353 | | | | (36,156,753 | ) |
Beginning of period | | | 233,809,344 | | | | 257,159,133 | | | | 697,370,844 | | | | 800,438,764 | | | | 142,734,064 | | | | 178,890,817 | |
| | | | | | | | | | | | | | | | | | | | | | | | |
End of period | | $ | 254,871,807 | | | $ | 233,809,344 | | | $ | 725,559,181 | | | $ | 697,370,844 | | | $ | 150,837,417 | | | $ | 142,734,064 | |
| | | | | | | | | | | | | | | | | | | | | | | | |
Undistributed (accumulated) net investment income (loss) | | $ | (893,561 | ) | | $ | 28,483 | | | $ | 20,956 | | | $ | 2,191,410 | | | $ | (803,402 | ) | | $ | 21,685 | |
| | | | | | | | | | | | | | | | | | | | | | | | |
See Notes to Financial Statements.
| | | | | | |
| | | BLACKROCK FUNDS | | MARCH 31, 2010 | | 25 |
| | |
| Financial Highlights | | BlackRock Mid-Cap Growth Equity Portfolio |
| | | | | | | | | | | | | | | | | | | | | | | | | | | | | | | | | | | | | | | | | | | | | | | | |
| | | Institutional | | | Service | |
| | Six Months
Ended
March 31, 2010
(Unaudited) | | | Year Ended September 30, | | | Six Months
Ended
March 31, 2010
(Unaudited) | | | Year Ended September 30, | |
| | | 2009 | | | 2008 | | | 2007 | | | 2006 | | | 2005 | | | | 2009 | | | 2008 | | | 2007 | | | 2006 | | | 2005 | |
Per Share Operating Performance | |
Net asset value, beginning of period | | $ | 10.27 | | | $ | 10.33 | | | $ | 13.49 | | | $ | 10.70 | | | $ | 10.44 | | | $ | 8.76 | | | $ | 9.78 | | | $ | 9.87 | | | $ | 12.92 | | | $ | 10.27 | | | $ | 10.07 | | | $ | 8.46 | |
| | | | | | | | | | | | | | | | | | | | | | | | | | | | | | | | | | | | | | | | | | | | | | | | |
Net investment loss1 | | | (0.02 | ) | | | (0.04 | ) | | | (0.04 | ) | | | (0.07 | ) | | | (0.06 | ) | | | (0.07 | ) | | | (0.04 | ) | | | (0.06 | ) | | | (0.07 | ) | | | (0.09 | ) | | | (0.11 | ) | | | (0.07 | ) |
Net realized and unrealized gain (loss) | | | 1.47 | | | | (0.02 | ) | | | (3.12 | ) | | | 2.86 | 2 | | | 0.45 | 2 | | | 1.75 | 2 | | | 1.40 | | | | (0.03 | ) | | | (2.98 | ) | | | 2.74 | 2 | | | 0.44 | 2 | | | 1.68 | 2 |
| | | | | | | | | | | | | | | | | | | | | | | | | | | | | | | | | | | | | | | | | | | | | | | | |
Net increase (decrease) from investment operations | | | 1.45 | | | | (0.06 | ) | | | (3.16 | ) | | | 2.79 | | | | 0.39 | | | | 1.68 | | | | 1.36 | | | | (0.09 | ) | | | (3.05 | ) | | | 2.65 | | | | 0.33 | | | | 1.61 | |
| | | | | | | | | | | | | | | | | | | | | | | | | | | | | | | | | | | | | | | | | | | | | | | | |
Distributions from net realized gain | | | — | | | | — | | | | — | | | | — | | | | (0.13 | ) | | | — | | | | — | | | | — | | | | — | | | | — | | | | (0.13 | ) | | | — | |
| | | | | | | | | | | | | | | | | | | | | | | | | | | | | | | | | | | | | | | | | | | | | | | | |
Net asset value, end of period | | $ | 11.72 | | | $ | 10.27 | | | $ | 10.33 | | | $ | 13.49 | | | $ | 10.70 | | | $ | 10.44 | | | $ | 11.14 | | | $ | 9.78 | | | $ | 9.87 | | | $ | 12.92 | | | $ | 10.27 | | | $ | 10.07 | |
| | | | | | | | | | | | | | | | | | | | | | | | | | | | | | | | | | | | | | | | | | | | | | | | |
Total Investment Return3 | |
Based on net asset value | | | 14.12 | %4 | | | (0.58 | )%5 | | | (23.43 | )% | | | 26.08 | %6 | | | 3.75 | %6 | | | 19.18 | %6 | | | 13.91 | %4 | | | (0.91 | )%7 | | | (23.61 | )% | | | 25.80 | %6 | | | 3.29 | %6 | | | 19.03 | %6 |
| | | | | | | | | | | | | | | | | | | | | | | | | | | | | | | | | | | | | | | | | | | | | | | | |
Ratios to Average Net Assets | |
Total expenses | | | 1.17 | %8 | | | 1.20 | % | | | 1.07 | % | | | 1.06 | % | | | 1.15 | % | | | 1.41 | % | | | 1.63 | %8 | | | 1.65 | % | | | 1.29 | % | | | 1.32 | % | | | 2.02 | % | | | 1.60 | % |
| | | | | | | | | | | | | | | | | | | | | | | | | | | | | | | | | | | | | | | | | | | | | | | | |
Total expenses excluding recoupment of past waived fees | | | 1.14 | %8 | | | 1.20 | % | | | 1.07 | % | | | 1.06 | % | | | 1.15 | % | | | 1.41 | % | | | 1.63 | %8 | | | 1.64 | % | | | 1.29 | % | | | 1.32 | % | | | 2.02 | % | | | 1.60 | % |
| | | | | | | | | | | | | | | | | | | | | | | | | | | | | | | | | | | | | | | | | | | | | | | | |
Total expenses after fees waived, reimbursed and paid indirectly | | | 1.17 | %8 | | | 1.18 | % | | | 1.06 | % | | | 1.05 | % | | | 1.08 | % | | | 1.23 | % | | | 1.58 | %8 | | | 1.51 | % | | | 1.28 | % | | | 1.22 | % | | | 1.53 | % | | | 1.53 | % |
| | | | | | | | | | | | | | | | | | | | | | | | | | | | | | | | | | | | | | | | | | | | | | | | |
Net investment loss | | | (0.32 | %)8 | | | (0.44 | )% | | | (0.33 | )% | | | (0.59 | )% | | | (0.60 | )% | | | (0.72 | )% | | | (0.73 | %)8 | | | (0.76 | )% | | | (0.56 | )% | | | (0.76 | )% | | | (1.06 | )% | | | (0.77 | )% |
| | | | | | | | | | | | | | | | | | | | | | | | | | | | | | | | | | | | | | | | | | | | | | | | |
Supplemental Data | |
Net assets, end of period (000) | | $ | 28,034 | | | $ | 25,572 | | | $ | 26,468 | | | $ | 75,577 | | | $ | 75,111 | | | $ | 75,407 | | | $ | 376 | | | $ | 360 | | | $ | 459 | | | $ | 714 | | | $ | 757 | | | $ | 1,136 | |
| | | | | | | | | | | | | | | | | | | | | | | | | | | | | | | | | | | | | | | | | | | | | | | | |
Portfolio turnover | | | 35 | % | | | 53 | % | | | 45 | % | | | 53 | % | | | 64 | % | | | 85 | % | | | 35 | % | | | 53 | % | | | 45 | % | | | 53 | % | | | 64 | % | | | 85 | % |
| | | | | | | | | | | | | | | | | | | | | | | | | | | | | | | | | | | | | | | | | | | | | | | | |
See Notes to Financial Statements.
| | | | | | |
26 | | BLACKROCK FUNDS | | MARCH 31, 2010 | | |
| | |
Financial Highlights (continued) | | BlackRock Mid-Cap Growth Equity Portfolio |
| | | | | | | | | | | | | | | | | | | | | | | | | | | | | | | | | | | | | | | | | | | | | | | | |
| | | Investor A | | | Investor B | |
| | | Six Months
Ended
March 31, 2010
(Unaudited) | | | Year Ended September 30, | | | Six Months
Ended
March 31, 2010
(Unaudited) | | | Year Ended September 30, | |
| | | | 2009 | | | 2008 | | | 2007 | | | 2006 | | | 2005 | | | | 2009 | | | 2008 | | | 2007 | | | 2006 | | | 2005 | |
Per Share Operating Performance | |
Net asset value, beginning of period | | $ | 9.47 | | | $ | 9.56 | | | $ | 12.55 | | | $ | 10.00 | | | $ | 9.82 | | | $ | 8.26 | | | $ | 8.42 | | | $ | 8.56 $ | | | | 11.32 | | | $ | 9.09 | | | $ | 9.00 | | | $ | 7.63 | |
| | | | | | | | | | | | | | | | | | | | | | | | | | | | | | | | | | | | | | | | | | | | | | | | |
Net investment loss1 | | | (0.04 | ) | | | (0.06 | ) | | | (0.10 | ) | | | (0.12 | ) | | | (0.11 | ) | | | (0.11 | ) | | | (0.07 | ) | | | (0.10 | ) | | | (0.17 | ) | | | (0.18 | ) | | | (0.17 | ) | | | (0.15 | ) |
Net realized and unrealized gain (loss) | | | 1.36 | | | | (0.03 | ) | | | (2.89 | ) | | | 2.67 | 2 | | | 0.42 | 2 | | | 1.67 | 2 | | | 1.20 | | | | (0.04 | ) | | | (2.59 | ) | | | 2.41 | 2 | | | 0.39 | 2 | | | 1.52 | 2 |
| | | | | | | | | | | | | | | | | | | | | | | | | | | | | | | | | | | | | | | | | | | | | | | | |
Net increase (decrease) from investment operations | | | 1.32 | | | | (0.09 | ) | | | (2.99 | ) | | | 2.55 | | | | 0.31 | | | | 1.56 | | | | 1.13 | | | | (0.14 | ) | | | (2.76 | ) | | | 2.23 | | | | 0.22 | | | | 1.37 | |
| | | | | | | | | | | | | | | | | | | | | | | | | | | | | | | | | | | | | | | | | | | | | | | | |
Distributions from net realized gain | | | — | | | | — | | | | — | | | | — | | | | (0.13 | ) | | | — | | | | — | | | | — | | | | — | | | | — | | | | (0.13 | ) | | | — | |
| | | | | | | | | | | | | | | | | | | | | | | | | | | | | | | | | | | | | | | | | | | | | | | | |
Net asset value, end of period | | $ | 10.79 | | | $ | 9.47 | | | $ | 9.56 | | | $ | 12.55 | | | $ | 10.00 | | | $ | 9.82 | | | $ | 9.55 | | | $ | 8.42 $ | | | | 8.56 | | | $ | 11.32 | | | $ | 9.09 | | | $ | 9.00 | |
| | | | | | | | | | | | | | | | | | | | | | | | | | | | | | | | | | | | | | | | | | | | | | | | |
Total Investment Return3 | |
Based on net asset value | | | 13.94 | %4 | | | (0.94 | )%9 | | | (23.83 | )% | | | 25.50 | %6 | | | 3.16 | %6 | | | 18.89 | %6 | | | 13.42 | %4 | | | (1.64 | )%10 | | | (24.38 | )% | | | 24.53 | %6 | | | 2.44 | %6 | | | 17.96 | %6 |
| | | | | | | | | | | | | | | | | | | | | | | | | | | | | | | | | | | | | | | | | | | | | | | | |
Ratios to Average Net Assets | | | | | | | | | | | | | | | | | | | | | | | | | | | | | | | | | | | | | | | | | | | | | | | | |
Total expenses | | | 1.58 | %8 | | | 1.76 | % | | | 1.53 | % | | | 1.60 | % | | | 1.74 | % | | | 1.78 | % | | | 2.56 | %8 | | | 2.73 | % | | | 2.45 | % | | | 2.46 | % | | | 2.54 | % | | | 2.41 | % |
| | | | | | | | | | | | | | | | | | | | | | | | | | | | | | | | | | | | | | | | | | | | | | | | |
Total expenses excluding recoupment of past waived fees | | | 1.56 | %8 | | | 1.72 | % | | | 1.53 | % | | | 1.60 | % | | | 1.74 | % | | | 1.78 | % | | | 2.56 | %8 | | | 2.64 | % | | | 2.45 | % | | | 2.46 | % | | | 2.54 | % | | | 2.41 | % |
| | | | | | | | | | | | | | | | | | | | | | | | | | | | | | | | | | | | | | | | | | | | | | | | |
Total expenses after fees waived, reimbursed and paid indirectly | | | 1.58 | %8 | | | 1.59 | % | | | 1.53 | % | | | 1.57 | % | | | 1.58 | % | | | 1.58 | % | | | 2.40 | %8 | | | 2.34 | % | | | 2.31 | % | | | 2.25 | % | | | 2.33 | % | | | 2.33 | % |
| | | | | | | | | | | | | | | | | | | | | | | | | | | | | | | | | | | | | | | | | | | | | | | | |
Net investment loss | | | (0.74 | %)8 | | | (0.85 | )% | | | (0.81 | )% | | | (1.11 | )% | | | (1.11 | )% | | | (1.14 | )% | | | (1.56 | %)8 | | | (1.57 | )% | | | (1.58 | )% | | | (1.79 | )% | | | (1.86 | )% | | | (1.82 | )% |
| | | | | | | | | | | | | | | | | | | | | | | | | | | | | | | | | | | | | | | | | | | | | | | | |
Supplemental Data | |
Net assets, end of period (000) | | $ | 198,695 | | | $ | 181,159 | | | $ | 195,980 | | | $ | 274,333 | | | $ | 257,729 | | | $ | 290,285 | | | $ | 10,816 | | | $ | 11,978 | | | $ | 19,565 | | | $ | 43,610 | | | $ | 48,635 | | | $ | 59,100 | |
| | | | | | | | | | | | | | | | | | | | | | | | | | | | | | | | | | | | | | | | | | | | | | | | |
Portfolio turnover | | | 35 | % | | | 53 | % | | | 45 | % | | | 53 | % | | | 64 | % | | | 85 | % | | | 35 | % | | | 53 | % | | | 45 | % | | | 53 | % | | | 64 | % | | | 85 | % |
| | | | | | | | | | | | | | | | | | | | | | | | | | | | | | | | | | | | | | | | | | | | | | | | |
| 1 | Based on average shares outstanding. |
| 2 | Includes redemption fees, which are less than $0.01 per share. |
| 3 | Where applicable, total investment returns exclude the effects of any sales charges and include the reinvestment of dividends and distributions. |
| 4 | Aggregate total investment return. |
| 5 | Includes proceeds received from a settlement of litigation, which impacted the Fund’s total return. Not including these proceeds, the Fund’s total return would have been (0.87)%. |
| 6 | Redemption fee of 2.00% is reflected in total return calculations. There was no impact to the return. |
| 7 | Includes proceeds received from a settlement of litigation, which impacted the Fund’s total return. Not including these proceeds, the Fund’s total return would have been (1.22)%. |
| 9 | Includes proceeds received from a settlement of litigation, which impacted the Fund’s total return. Not including these proceeds, the Fund’s total return would have been (1.26)%. |
| 10 | Includes proceeds received from a settlement of litigation, which impacted the Fund’s total return. Not including these proceeds, the Fund’s total return would have been (1.99)%. |
See Notes to Financial Statements.
| | | | | | |
| | | BLACKROCK FUNDS | | MARCH 31, 2010 | | 27 |
| | |
Financial Highlights (continued) | | BlackRock Mid-Cap Growth Equity Portfolio |
| | | | | | | | | | | | | | | | | | | | | | | | | | | | | | | | | | | | | | | | |
| | | Investor C | | | Class R | |
| | Six Months
Ended
March 31, 2010
(Unaudited) | | | Year Ended September 30, | | | Six Months
Ended
March 31, 2010
(Unaudited) | | | Year Ended
September 30, | | | Period
October 2, 20061 to
September 30, 2007 | |
| | | 2009 | | | 2008 | | | 2007 | | | 2006 | | | 2005 | | | | 2009 | | | 2008 | | |
Per Share Operating Performance | |
Net asset value, beginning of period | | $ | 8.41 | | | $ | 8.56 | | | $ | 11.32 | | | $ | 9.09 | | | $ | 9.00 | | | $ | 7.63 | | | $ | 9.46 | | | $ | 9.56 | | | $ | 12.55 | | | $ | 9.92 | |
| | | | | | | | | | | | | | | | | | | | | | | | | | | | | | | | | | | | | | | | |
Net investment loss2 | | | (0.07 | ) | | | (0.11 | ) | | | (0.16 | ) | | | (0.19 | ) | | | (0.17 | ) | | | (0.15 | ) | | | (0.04 | ) | | | (0.07 | ) | | | (0.10 | ) | | | (0.13 | ) |
Net realized and unrealized gain (loss) | | | 1.21 | | | | (0.04 | ) | | | (2.60 | ) | | | 2.42 | 3 | | | 0.39 | 3 | | | 1.52 | 3 | | | 1.35 | | | | (0.03 | ) | | | (2.89 | ) | | | 2.76 | 3 |
| | | | | | | | | | | | | | | | | | | | | | | | | | | | | | | | | | | | | | | | |
Net increase (decrease) from investment operations | | | 1.14 | | | | (0.15 | ) | | | (2.76 | ) | | | 2.23 | | | | 0.22 | | | | 1.37 | | | | 1.31 | | | | (0.10 | ) | | | (2.99 | ) | | | 2.63 | |
| | | | | | | | | | | | | | | | | | | | | | | | | | | | | | | | | | | | | | | | |
Distributions from net realized gain | | | — | | | | — | | | | — | | | | — | | | | (0.13 | ) | | | — | | | | — | | | | — | | | | — | | | | — | |
| | | | | | | | | | | | | | | | | | | | | | | | | | | | | | | | | | | | | | | | |
Net asset value, end of period | | $ | 9.55 | | | $ | 8.41 | | | $ | 8.56 | | | $ | 11.32 | | | $ | 9.09 | | | $ | 9.00 | | | $ | 10.77 | | | $ | 9.46 | | | $ | 9.56 | | | $ | 12.55 | |
| | | | | | | | | | | | | | | | | | | | | | | | | | | | | | | | | | | | | | | | |
Total Investment Return4 | | | | | | | | | | | | | | | | | | | | | | | | | | | | | | | | | | | | | | | | |
Based on net asset value | | | 13.56 | %5 | | | (1.75 | )%6 | | | (24.38 | )% | | | 24.53 | %7 | | | 2.44 | %7 | | | 17.96 | %7 | | | 13.85 | %5 | | | (1.05 | )%8 | | | (23.83 | )% | | | 26.51 | %5,7 |
| | | | | | | | | | | | | | | | | | | | | | | | | | | | | | | | | | | | | | | | |
Ratios to Average Net Assets | |
Total expenses | | | 2.33 | %9 | | | 2.46 | % | | | 2.25 | % | | | 2.31 | % | | | 2.37 | % | | | 2.41 | % | | | 1.91 | %9 | | | 2.04 | % | | | 1.73 | % | | | 1.63 | %9 |
| | | | | | | | | | | | | | | | | | | | | | | | | | | | | | | | | | | | | | | | |
Total expenses excluding recoupment of past waived fees | | | 2.30 | %9 | | | 2.44 | % | | | 2.25 | % | | | 2.31 | % | | | 2.37 | % | | | 2.41 | % | | | 1.91 | %9 | | | 2.04 | % | | | 1.73 | % | | | 1.63 | %9 |
| | | | | | | | | | | | | | | | | | | | | | | | | | | | | | | | | | | | | | | | |
Total expenses after fees waived, reimbursed and paid indirectly | | | 2.33 | %9 | | | 2.34 | % | | | 2.25 | % | | | 2.30 | % | | | 2.33 | % | | | 2.33 | % | | | 1.65 | %9 | | | 1.63 | % | | | 1.58 | % | | | 1.59 | %9 |
| | | | | | | | | | | | | | | | | | | | | | | | | | | | | | | | | | | | | | | | |
Net investment loss | | | (1.49 | %)9 | | | (1.59 | )% | | | (1.53 | )% | | | (1.84 | )% | | | (1.86 | )% | | | (1.83 | )% | | | (0.81 | %)9 | | | (0.89 | )% | | | (0.82 | )% | | | (1.12 | )%9 |
| | | | | | | | | | | | | | | | | | | | | | | | | | | | | | | | | | | | | | | | |
Supplemental Data | |
Net assets, end of period (000) | | $ | 13,998 | | | $ | 12,418 | | | $ | 13,964 | | | $ | 20,203 | | | $ | 18,047 | | | $ | 20,748 | | | $ | 2,953 | | | $ | 2,323 | | | $ | 723 | | | $ | 25 | |
| | | | | | | | | | | | | | | | | | | | | | | | | | | | | | | | | | | | | | | | |
Portfolio turnover | | | 35 | % | | | 53 | % | | | 45 | % | | | 53 | % | | | 64 | % | | | 85 | % | | | 35 | % | | | 53 | % | | | 45 | % | | | 53 | % |
| | | | | | | | | | | | | | | | | | | | | | | | | | | | | | | | | | | | | | | | |
| 1 | Commencement of operations. |
| 2 | Based on average shares outstanding. |
| 3 | Includes redemption fees, which are less than $0.01 per share. |
| 4 | Where applicable, total investment returns exclude the effects of any sales charges and include the reinvestment of dividends and distributions. |
| 5 | Aggregate total investment return. |
| 6 | Includes proceeds received from a settlement of litigation, which impacted the Fund’s total return. Not including these proceeds, the Fund’s total return would have been (2.10)%. |
| 7 | Redemption fee of 2.00% is reflected in total return calculations. There was no impact to the return. |
| 8 | Includes proceeds received from a settlement of litigation, which impacted the Fund’s total return. Not including these proceeds, the Fund’s total return would have been (1.36)%. |
See Notes to Financial Statements.
| | | | | | |
28 | | BLACKROCK FUNDS | | MARCH 31, 2010 | | |
| | |
Financial Highlights (continued) | | BlackRock Mid-Cap Value Equity Portfolio* |
| | |
| | | | | | | | | | | | | | | | | | | | | | | | | | | | |
| | | Institutional | |
| | | Six Months
Ended
March 31, 2010 | | | Year Ended September 30, | | | Period
March 1, 2005 to | | | Period
July 1, 2004 to | |
| | | (Unaudited) | | | 2009 | | | 2008 | | | 2007 | | | 2006 | | | September 30, 2005 | | | February 28, 2005 | |
Per Share Operating Performance | | | | | | | | | | | | | | | | | | | | | | | | | | | | |
Net asset value, beginning of period | | $ | 9.34 | | | $ | 9.94 | | | $ | 14.35 | | | $ | 13.67 | | | $ | 13.74 | | | $ | 12.73 | | | $ | 12.14 | |
| | | | | | | | | | | | | | | | | | | | | | | | | | | | |
Net investment income | | | 0.03 | 1 | | | 0.08 | 1 | | | 0.10 | 1 | | | 0.11 | 1 | | | 0.12 | 1 | | | 0.04 | 1 | | | 0.11 | |
Net realized and unrealized gain (loss) | | | 1.35 | | | | (0.61 | ) | | | (2.77 | ) | | | 2.38 | 2 | | | 1.23 | 2 | | | 0.97 | 2 | | | 1.44 | |
| | | | | | | | | | | | | | | | | | | | | | | | | | | | |
Net increase (decrease) from investment operations | | | 1.38 | | | | (0.53 | ) | | | (2.67 | ) | | | 2.49 | | | | 1.35 | | | | 1.01 | | | | 1.55 | |
| | | | | | | | | | | | | | | | | | | | | | | | | | | | |
Dividends and distributions from: | | | | | | | | | | | | | | | | | | | | | | | | | | | | |
Net investment income | | | (0.07 | ) | | | (0.07 | ) | | | — | | | | (0.15 | ) | | | (0.04 | ) | | | — | | | | (0.15 | ) |
Tax return of capital | | | — | | | | — | | | | (0.02 | ) | | | — | | | | — | | | | — | | | | — | |
Net realized gain | | | — | | | | — | | | | (1.72 | ) | | | (1.66 | ) | | | (1.38 | ) | | | — | | | | (0.81 | ) |
| | | | | | | | | | | | | | | | | | | | | | | | | | | | |
Total dividends and distributions | | | (0.07 | ) | | | (0.07 | ) | | | (1.74 | ) | | | (1.81 | ) | | | (1.42 | ) | | | — | | | | (0.96 | ) |
| | | | | | | | | | | | | | | | | | | | | | | | | | | | |
Net asset value, end of period | | $ | 10.65 | | | $ | 9.34 | | | $ | 9.94 | | | $ | 14.35 | | | $ | 13.67 | | | $ | 13.74 | | | $ | 12.73 | |
| | | | | | | | | | | | | | | | | | | | | | | | | | | | |
Total Investment Return3 | | | | | | | | | | | | | | | | | | | | | | | | | | | | |
Based on net asset value | | | 14.85 | %4 | | | (5.09 | )% | | | (20.74 | )% | | | 19.35 | %5 | | | 10.77 | %5 | | | 7.94 | %4,5 | | | 13.07 | %4 |
| | | | | | | | | | | | | | | | | | | | | | | | | | | | |
Ratios to Average Net Assets | | | | | | | | | | | | | | | | | | | | | | | | | | | | |
Total expenses | | | 1.12 | %6 | | | 1.16 | % | | | 1.10 | % | | | 1.07 | % | | | 1.07 | % | | | 1.30 | %6 | | | 1.09 | %6 |
| | | | | | | | | | | | | | | | | | | | | | | | | | | | |
Total expenses after fees waived, reimbursed and paid indirectly | | | 0.97 | %6 | | | 0.95 | % | | | 0.94 | % | | | 0.95 | % | | | 0.99 | % | | | 1.00 | %6 | | | 0.99 | %6 |
| | | | | | | | | | | | | | | | | | | | | | | | | | | | |
Net investment income | | | 0.65 | %6 | | | 1.00 | % | | | 0.82 | % | | | 0.79 | % | | | 0.88 | % | | | 0.49 | %6 | | | 1.18 | %6 |
| | | | | | | | | | | | | | | | | | | | | | | | | | | | |
Supplemental Data | | | | | | | | | | | | | | | | | | | | | | | | | | | | |
Net assets, end of period (000) | | $ | 144,260 | | | $ | 165,710 | | | $ | 141,900 | | | $ | 134,665 | | | $ | 80,292 | | | $ | 53,111 | | | $ | 50,383 | |
| | | | | | | | | | | | | | | | | | | | | | | | | | | | |
Portfolio turnover | | | 50 | % | | | 181 | % | | | 117 | % | | | 202 | % | | | 153 | % | | | 60 | % | | | 53 | % |
| | | | | | | | | | | | | | | | | | | | | | | | | | | | |
| * | The performance prior to January 31, 2005 set forth in this table is the financial data of State Street Research Mid-Cap Value Fund, a series of a predecessor trust, State Street Research Equity Trust. BlackRock Funds acquired all of the assets and certain stated liabilities of State Street Research Mid-Cap Value Fund on January 28, 2005. The net asset values and other per share information listed have been restated to reflect the conversion ratio of 1.56483770 for Institutional shares. |
| 1 | Based on average shares outstanding. |
| 2 | Includes redemption fees, which are less than $0.01 per share. |
| 3 | Where applicable, total investment returns exclude the effects of any sales charges and include the reinvestment of dividends and distributions. |
| 4 | Aggregate total investment return. |
| 5 | Redemption fee of 2.00% is reflected in total return calculations. There was no impact to the return. |
See Notes to Financial Statements.
| | | | | | |
| | | BLACKROCK FUNDS | | MARCH 31, 2010 | | 29 |
| | |
Financial Highlights (continued) | | BlackRock Mid-Cap Value Equity Portfolio* |
| | | | | | | | | | | | | | | | | | | | | | | | | | | | |
| | | Service | |
| | Six Months
Ended
March 31, 2010
(Unaudited) | | | Year Ended September 30, | | | Period
March 1, 2005 to
September 30, 2005 | | | Period
January 28, 20051 to
February 28, 2005 | |
| | | 2009 | | | 2008 | | | 2007 | | | 2006 | | | |
Per Share Operating Performance | |
Net asset value, beginning of period | | $ | 9.17 | | | $ | 9.78 | | | $ | 14.14 | | | $ | 13.49 | | | $ | 13.61 | | | $ | 12.63 | | | $ | 12.04 | |
| | | | | | | | | | | | | | | | | | | | | | | | | | | | |
Net investment income (loss) | | | 0.01 | 2 | | | 0.05 | 2 | | | 0.06 | 2 | | | 0.10 | 2 | | | 0.08 | 2 | | | 0.02 | 2 | | | (0.01 | ) |
Net realized and unrealized gain (loss) | | | 1.33 | | | | (0.60 | ) | | | (2.72 | ) | | | 2.33 | 3 | | | 1.21 | 3 | | | 0.96 | 3 | | | 0.60 | |
| | | | | | | | | | | | | | | | | | | | | | | | | | | | |
Net increase (decrease) from investment operations | | | 1.34 | | | | (0.55 | ) | | | (2.66 | ) | | | 2.43 | | | | 1.29 | | | | 0.98 | | | | 0.59 | |
| | | | | | | | | | | | | | | | | | | | | | | | | | | | |
Dividends and distributions from: | | | | | | | | | | | | | | | | | | | | | | | | | | | | |
Net investment income | | | (0.05 | ) | | | (0.06 | ) | | | — | | | | (0.12 | ) | | | (0.03 | ) | | | — | | | | — | |
Tax return of capital | | | — | | | | — | | | | (0.02 | ) | | | — | | | | — | | | | — | | | | — | |
Net realized gain | | | — | | | | — | | | | (1.68 | ) | | | (1.66 | ) | | | (1.38 | ) | | | — | | | | — | |
| | | | | | | | | | | | | | | | | | | | | | | | | | | | |
Total dividends and distributions | | | (0.05 | ) | | | (0.06 | ) | | | (1.70 | ) | | | (1.78 | ) | | | (1.41 | ) | | | — | | | | — | |
| | | | | | | | | | | | | | | | | | | | | | | | | | | | |
Net asset value, end of period | | $ | 10.46 | | | $ | 9.17 | | | $ | 9.78 | | | $ | 14.14 | | | $ | 13.49 | | | $ | 13.61 | | | $ | 12.63 | |
| | | | | | | | | | | | | | | | | | | | | | | | | | | | |
Total Investment Return4 | |
Based on net asset value | | | 14.63 | %5 | | | (5.36 | )% | | | (20.95 | )% | | | 19.10 | %6 | | | 10.45 | %6 | | | 7.76 | %5,6 | | | 4.89 | %5 |
| | | | | | | | | | | | | | | | | | | | | | | | | | | | |
Ratios to Average Net Assets | |
Total expenses | | | 1.27 | %7 | | | 1.32 | % | | | 1.25 | % | | | 1.24 | % | | | 1.50 | % | | | 1.54 | %7 | | | 1.49 | %7 |
| | | | | | | | | | | | | | | | | | | | | | | | | | | | |
Total expenses excluding recoupment of past waived fees | | | 1.27 | %7 | | | 1.32 | % | | | 1.25 | % | | | 1.24 | % | | | 1.50 | % | | | 1.54 | %7 | | | 1.49 | %7 |
| | | | | | | | | | | | | | | | | | | | | | | | | | | | |
Total expenses after fees waived, reimbursed and paid indirectly | | | 1.27 | %7 | | | 1.26 | % | | | 1.23 | % | | | 1.20 | % | | | 1.25 | % | | | 1.25 | %7 | | | 1.25 | %7 |
| | | | | | | | | | | | | | | | | | | | | | | | | | | | |
Net investment income | | | 0.23 | %7 | | | 0.69 | % | | | 0.54 | % | | | 0.68 | % | | | 0.61 | % | | | 0.20 | %7 | | | 0.39 | %7 |
| | | | | | | | | | | | | | | | | | | | | | | | | | | | |
Supplemental Data | |
Net assets, end of period (000) | | $ | 800 | | | $ | 2,561 | | | $ | 2,431 | | | $ | 3,716 | | | $ | 3,130 | | | $ | 889 | | | $ | 1,374 | |
| | | | | | | | | | | | | | | | | | | | | | | | | | | | |
Portfolio turnover | | | 50 | % | | | 181 | % | | | 117 | % | | | 202 | % | | | 153 | % | | | 60 | % | | | 53 | % |
| | | | | | | | | | | | | | | | | | | | | | | | | | | | |
See Notes to Financial Statements.
| | | | | | |
30 | | BLACKROCK FUNDS | | MARCH 31, 2010 | | |
| | |
| Financial Highlights (continued) | | BlackRock Mid-Cap Value Equity Portfolio* |
| | |
| | | | | | | | | | | | | | | | | | | | | | | | | | | | |
| | | Investor A | |
| | | Six Months
Ended
March 31, 2010 | | | Year Ended September 30, | | | Period
March 1, 2005 to | | | Period
July 1, 2004 to | |
| | | (Unaudited) | | | 2009 | | | 2008 | | | 2007 | | | 2006 | | | September 30, 2005 | | | February 28, 2005 | |
Per Share Operating Performance | |
Net asset value, beginning of period | | $ | 9.06 | | | $ | 9.66 | | | $ | 14.00 | | | $ | 13.38 | | | $ | 13.49 | | | $ | 12.53 | | | $ | 11.92 | |
| | | | | | | | | | | | | | | | | | | | | | | | | | | | |
Net investment income | | | 0.02 | 2 | | | 0.05 | 2 | | | 0.06 | 2 | | | 0.08 | 2 | | | 0.08 | 2 | | | 0.02 | 2 | | | 0.07 | |
Net realized and unrealized gain (loss) | | | 1.30 | | | | (0.59 | ) | | | (2.70 | ) | | | 2.32 | 3 | | | 1.21 | 3 | | | 0.94 | 3 | | | 1.45 | |
| | | | | | | | | | | | | | | | | | | | | | | | | | | | |
Net increase (decrease) from investment operations | | | 1.32 | | | | (0.54 | ) | | | (2.64 | ) | | | 2.40 | | | | 1.29 | | | | 0.96 | | | | 1.52 | |
| | | | | | | | | | | | | | | | | | | | | | | | | | | | |
Dividends and distributions from: | | | | | | | | | | | | | | | | | | | | | | | | | | | | |
Net investment income | | | (0.04 | ) | | | (0.06 | ) | | | — | | | | (0.12 | ) | | | (0.02 | ) | | | — | | | | (0.11 | ) |
Tax return of capital | | | — | | | | — | | | | (0.02 | ) | | | — | | | | — | | | | — | | | | — | |
Net realized gain | | | — | | | | — | | | | (1.68 | ) | | | (1.66 | ) | | | (1.38 | ) | | | — | | | | (0.80 | ) |
| | | | | | | | | | | | | | | | | | | | | | | | | | | | |
Total dividends and distributions | | | (0.04 | ) | | | (0.06 | ) | | | (1.70 | ) | | | (1.78 | ) | | | (1.40 | ) | | | — | | | | (0.91 | ) |
| | | | | | | | | | | | | | | | | | | | | | | | | | | | |
Net asset value, end of period | | $ | 10.34 | | | $ | 9.06 | | | $ | 9.66 | | | $ | 14.00 | | | $ | 13.38 | | | $ | 13.49 | | | $ | 12.53 | |
| | | | | | | | | | | | | | | | | | | | | | | | | | | | |
Total Investment Return4 | | | | | | | | | | | | | | | | | | | | | | | | | | | | |
Based on net asset value | | | 14.66 | %5 | | | (5.32 | )% | | | (21.04 | )% | | | 19.02 | %6 | | | 10.56 | %6 | | | 7.66 | %5,6 | | | 12.98 | %5 |
| | | | | | | | | | | | | | | | | | | | | | | | | | | | |
Ratios to Average Net Assets | | | | | | | | | | | | | | | | | | | | | | | | | | | | |
Total expenses | | | 1.42 | %7 | | | 1.51 | % | | | 1.43 | % | | | 1.40 | % | | | 1.56 | % | | | 1.64 | %7 | | | 1.38 | %7 |
| | | | | | | | | | | | | | | | | | | | | | | | | | | | |
Total expenses after fees waived, reimbursed and paid indirectly | | | 1.29 | %7 | | | 1.26 | % | | | 1.25 | % | | | 1.25 | % | | | 1.25 | % | | | 1.25 | %7 | | | 1.24 | %7 |
| | | | | | | | | | | | | | | | | | | | | | | | | | | | |
Net investment income | | | 0.34 | %7 | | | 0.70 | % | | | 0.53 | % | | | 0.61 | % | | | 0.62 | % | | | 0.24 | %7 | | | 0.92 | %7 |
| | | | | | | | | | | | | | | | | | | | | | | | | | | | |
Supplemental Data | | | | | | | | | | | | | | | | | | | | | | | | | | | | |
Net assets, end of period (000) | | $ | 445,960 | | | $ | 395,763 | | | $ | 470,265 | | | $ | 642,264 | | | $ | 497,964 | | | $ | 500,479 | | | $ | 448,237 | |
| | | | | | | | | | | | | | | | | | | | | | | | | | | | |
Portfolio turnover | | | 50 | % | | | 181 | % | | | 117 | % | | | 202 | % | | | 153 | % | | | 60 | % | | | 53 | % |
| | | | | | | | | | | | | | | | | | | | | | | | | | | | |
| * | The performance prior to January 31, 2005 set forth in this table is the financial data of State Street Research Mid-Cap Value Fund, a series of a predecessor trust, State Street Research Equity Trust. BlackRock Funds acquired all of the assets and certain stated liabilities of State Street Research Mid-Cap Value Fund on January 28, 2005. The net asset values and other per share information listed have been restated to reflect the conversion ratio of 1.57950264 for Investor A shares. |
| 1 | Commencement of operations. |
| 2 | Based on average shares outstanding. |
| 3 | Includes redemption fees, which are less than $0.01 per share. |
| 4 | Where applicable, total investment returns exclude the effects of any sales charges and include the reinvestment of dividends and distributions. |
| 5 | Aggregate total investment return. |
| 6 | Redemption fee of 2.00% is reflected in total return calculations. There was no impact to the return. |
See Notes to Financial Statements.
| | | | | | |
| | | BLACKROCK FUNDS | | MARCH 31, 2010 | | 31 |
| | |
| Financial Highlights (continued) | | BlackRock Mid-Cap Value Equity Portfolio* |
| | |
| | | | | | | | | | | | | | | | | | | | | | | | | | | | |
| | | Investor B | |
| | | Six Months
Ended
March 31, 2010 | | | Year Ended September 30, | | | Period March 1, 2005 to | | | Period
July 1, 2004 to | |
| | | (Unaudited) | | | 2009 | | | 2008 | | | 2007 | | | 2006 | | | September 30, 2005 | | | February 28, 2005 | |
Per Share Operating Performance | |
Net asset value, beginning of period | | $ | 8.23 | | | $ | 8.84 | | | $ | 12.92 | | | $ | 12.46 | | | $ | 12.73 | | | $ | 11.87 | | | $ | 11.28 | |
| | | | | | | | | | | | | | | | | | | | | | | | | | | | |
Net investment loss | | | (0.02 | )1 | | | (0.00 | )1,2 | | | (0.02 | )1 | | | (0.01 | )1 | | | (0.02 | )1 | | | (0.04 | )1 | | | (0.03 | ) |
Net realized and unrealized gain (loss) | | | 1.19 | | | | (0.56 | ) | | | (2.47 | ) | | | 2.15 | 3 | | | 1.13 | 3 | | | 0.90 | 3 | | | 1.41 | |
| | | | | | | | | | | | | | | | | | | | | | | | | | | | |
Net increase (decrease) from investment operations | | | 1.17 | | | | (0.56 | ) | | | (2.49 | ) | | | 2.14 | | | | 1.11 | | | | 0.86 | | | | 1.38 | |
| | | | | | | | | | | | | | | | | | | | | | | | | | | | |
Dividends and distributions from: | | | | | | | | | | | | | | | | | | | | | | | | | | | | |
Net investment income | | | — | | | | (0.05 | ) | | | — | | | | (0.02 | ) | | | — | | | | — | | | | (0.01 | ) |
Net realized gain | | | — | | | | — | | | | (1.59 | ) | | | (1.66 | ) | | | (1.38 | ) | | | — | | | | (0.78 | ) |
| | | | | | | | | | | | | | | | | | | | | | | | | | | | |
Total dividends and distributions | | | — | | | | (0.05 | ) | | | (1.59 | ) | | | (1.68 | ) | | | (1.38 | ) | | | — | | | | (0.79 | ) |
| | | | | | | | | | | | | | | | | | | | | | | | | | | | |
Net asset value, end of period | | $ | 9.40 | | | $ | 8.23 | | | $ | 8.84 | | | $ | 12.92 | | | $ | 12.46 | | | $ | 12.73 | | | $ | 11.87 | |
| | | | | | | | | | | | | | | | | | | | | | | | | | | | |
Total Investment Return4 | | | | | | | | | | | | | | | | | | | | | | | | | | | | |
Based on net asset value | | | 14.22 | %5 | | | (6.12 | )% | | | (21.53 | )% | | | 18.18 | %6 | | | 9.63 | %6 | | | 7.25 | %5,6 | | | 12.39 | %5 |
| | | | | | | | | | | | | | | | | | | | | | | | | | | | |
Ratios to Average Net Assets | | | | | | | | | | | | | | | | | | | | | | | | | | | | |
Total expenses | | | 2.31 | %7 | | | 2.38 | % | | | 2.24 | % | | | 2.23 | % | | | 2.25 | % | | | 2.29 | %7 | | | 2.09 | %7 |
| | | | | | | | | | | | | | | | | | | | | | | | | | | | |
Total expenses after fees waived, reimbursed and paid indirectly | | | 2.06 | %7 | | | 2.02 | % | | | 2.00 | % | | | 2.00 | % | | | 2.00 | % | | | 2.00 | %7 | | | 1.99 | %7 |
| | | | | | | | | | | | | | | | | | | | | | | | | | | | |
Net investment income (loss) | | | (0.44 | )%7 | | | (0.04 | )% | | | (0.21 | )% | | | (0.09 | )% | | | (0.13 | )% | | | (0.52 | )%7 | | | 0.20 | %7 |
| | | | | | | | | | | | | | | | | | | | | | | | | | | | |
Supplemental Data | | | | | | | | | | | | | | | | | | | | | | | | | | | | |
Net assets, end of period (000) | | $ | 34,863 | | | $ | 41,196 | | | $ | 67,656 | | | $ | 119,768 | | | $ | 124,089 | | | $ | 131,651 | | | $ | 128,568 | |
| | | | | | | | | | | | | | | | | | | | | | | | | | | | |
Portfolio turnover | | | 50 | % | | | 181 | % | | | 117 | % | | | 202 | % | | | 153 | % | | | 60 | % | | | 53 | % |
| | | | | | | | | | | | | | | | | | | | | | | | | | | | |
See Notes to Financial Statements.
| | | | | | |
32 | | BLACKROCK FUNDS | | MARCH 31, 2010 | | |
| | |
| Financial Highlights (continued) | | BlackRock Mid-Cap Value Equity Portfolio* |
| | |
| | | | | | | | | | | | | | | | | | | | | | | | | | | | |
| | | Investor C | |
| | | Six Months
Ended
March 31, 2010 | | | Year Ended September 30, | | | Period March 1, 2005 to | | | Period July 1, 2004 to | |
| | | (Unaudited) | | | 2009 | | | 2008 | | | 2007 | | | 2006 | | | September 30, 2005 | | | February 28, 2005 | |
Per Share Operating Performance | | | | | | | | | | | | | | | | | | | | | | | | | | | | |
Net asset value, beginning of period | | $ | 8.20 | | | $ | 8.81 | | | $ | 12.90 | | | $ | 12.46 | | | $ | 12.73 | | | $ | 11.87 | | | $ | 11.28 | |
| | | | | | | | | | | | | | | | | | | | | | | | | | | | |
Net investment loss | | | (0.02 | )1 | | | (0.00 | )1,2 | | | (0.02 | )1 | | | (0.02 | )1 | | | (0.02 | )1 | | | (0.04 | )1 | | | (0.03 | ) |
Net realized and unrealized gain (loss) | | | 1.19 | | | | (0.56 | ) | | | (2.47 | ) | | | 2.15 | 3 | | | 1.13 | 3 | | | 0.90 | 3 | | | 1.40 | |
| | | | | | | | | | | | | | | | | | | | | | | | | | | | |
Net increase (decrease) from investment operations | | | 1.17 | | | | (0.56 | ) | | | (2.49 | ) | | | 2.13 | | | | 1.11 | | | | 0.86 | | | | 1.37 | |
| | | | | | | | | | | | | | | | | | | | | | | | | | | | |
Dividends and distributions from: | | | | | | | | | | | | | | | | | | | | | | | | | | | | |
Net investment income | | | — | | | | (0.05 | ) | | | — | | | | (0.03 | ) | | | — | | | | — | | | | (0.01 | ) |
Net realized gain | | | — | | | | — | | | | (1.60 | ) | | | (1.66 | ) | | | (1.38 | ) | | | — | | | | (0.77 | ) |
| | | | | | | | | | | | | | | | | | | | | | | | | | | | |
Total dividends and distributions | | | — | | | | (0.05 | ) | | | (1.60 | ) | | | (1.69 | ) | | | (1.38 | ) | | | — | | | | (0.78 | ) |
| | | | | | | | | | | | | | | | | | | | | | | | | | | | |
Net asset value, end of period | | $ | 9.37 | | | $ | 8.20 | | | $ | 8.81 | | | $ | 12.90 | | | $ | 12.46 | | | $ | 12.73 | | | $ | 11.87 | |
| | | | | | | | | | | | | | | | | | | | | | | | | | | | |
Total Investment Return4 | | | | | | | | | | | | | | | | | | | | | | | | | | | | |
Based on net asset value | | | 14.27 | %5 | | | (6.14 | )% | | | (21.56 | )% | | | 18.16 | %6 | | | 9.63 | %6 | | | 7.25 | %5,6 | | | 12.40 | %5 |
| | | | | | | | | | | | | | | | | | | | | | | | | | | | |
Ratios to Average Net Assets | | | | | | | | | | | | | | | | | | | | | | | | | | | | |
Total expenses | | | 2.27 | %7 | | | 2.39 | % | | | 2.20 | % | | | 2.21 | % | | | 2.15 | % | | | 2.29 | %7 | | | 2.09 | %7 |
| | | | | | | | | | | | | | | | | | | | | | | | | | | | |
Total expenses after fees waived, reimbursed and paid indirectly | | | 2.06 | %7 | | | 2.02 | % | | | 2.00 | % | | | 2.00 | % | | | 2.00 | % | | | 2.00 | %7 | | | 1.99 | %7 |
| | | | | | | | | | | | | | | | | | | | | | | | | | | | |
Net investment income (loss) | | | (0.43 | %)7 | | | (0.06 | )% | | | (0.22 | )% | | | (0.14 | )% | | | (0.13 | )% | | | (0.50 | )%7 | | | 0.19 | %7 |
| | | | | | | | | | | | | | | | | | | | | | | | | | | | |
Supplemental Data | | | | | | | | | | | | | | | | | | | | | | | | | | | | |
Net assets, end of period (000) | | $ | 99,676 | | | $ | 92,141 | | | $ | 118,186 | | | $ | 173,731 | | | $ | 137,382 | | | $ | 103,344 | | | $ | 91,657 | |
| | | | | | | | | | | | | | | | | | | | | | | | | | | | |
Portfolio turnover | | | 50 | % | | | 181 | % | | | 117 | % | | | 202 | % | | | 153 | % | | | 60 | % | | | 53 | % |
| | | | | | | | | | | | | | | | | | | | | | | | | | | | |
| * | The performance prior to January 31, 2005 set forth in this table is the financial data of State Street Research Mid-Cap Value Fund, a series of a predecessor trust, State Street Research Equity Trust. BlackRock Funds acquired all of the assets and certain stated liabilities of State Street Research Mid-Cap Value Fund on January 28, 2005. The net asset values and other per share information listed have been restated to reflect the conversion ratios of 1.62345461 and 1.63087248 for Investor B and Investor C shares, respectively. |
| 1 | Based on average shares outstanding. |
| 2 | Less than $0.01 per share. |
| 3 | Includes redemption fees, which are less than $0.01 per share. |
| 4 | Where applicable, total investment returns exclude the effects of any sales charges and include the reinvestment of dividends and distributions. |
| 5 | Aggregate total investment return. |
| 6 | Redemption fee of 2.00% is reflected in total return calculations. There was no impact to the return. |
See Notes to Financial Statements.
| | | | | | |
| | | BLACKROCK FUNDS | | MARCH 31, 2010 | | 33 |
| | |
| Financial Highlights (continued) | | BlackRock Small/Mid-Cap Growth Portfolio |
| | |
| | | | | | | | | | | | | | | | | | | | | | | | |
| | | Institutional | |
| | | Six Months
Ended
March 31, 2010 | | | Year Ended September 30, | |
| | | (Unaudited) | | | 2009 | | | 2008 | | | 2007 | | | 2006 | | | 2005 | |
Per Share Operating Performance | | | | | | | | | | | | | | | | | | | | | | | | |
Net asset value, beginning of period | | $ | 10.83 | | | $ | 11.80 | | | $ | 18.24 | | | $ | 15.51 | | | $ | 15.16 | | | $ | 12.49 | |
| | | | | | | | | | | | | | | | | | | | | | | | |
Net investment loss1 | | | (0.05 | ) | | | (0.06 | ) | | | (0.06 | ) | | | (0.12 | ) | | | (0.10 | ) | | | (0.17 | ) |
Net realized and unrealized gain (loss)2 | | | 1.44 | | | | (0.89 | ) | | | (3.49 | ) | | | 3.68 | | | | 1.09 | | | | 2.84 | |
| | | | | | | | | | | | | | | | | | | | | | | | |
Net increase (decrease) from investment operations | | | 1.39 | | | | (0.95 | ) | | | (3.55 | ) | | | 3.56 | | | | 0.99 | | | | 2.67 | |
| | | | | | | | | | | | | | | | | | | | | | | | |
Dividends and distributions from: | | | | | | | | | | | | | | | | | | | | | | | | |
Tax return of capital | | | — | | | | (0.02 | ) | | | — | | | | — | | | | — | | | | — | |
Net realized gain | | | — | | | | — | | | | (2.89 | ) | | | (0.83 | ) | | | (0.64 | ) | | | — | |
| | | | | | | | | | | | | | | | | | | | | | | | |
Total dividends and distributions | | | — | | | | (0.02 | ) | | | (2.89 | ) | | | (0.83 | ) | | | (0.64 | ) | | | — | |
| | | | | | | | | | | | | | | | | | | | | | | | |
Net asset value, end of period | | $ | 12.22 | | | $ | 10.83 | | | $ | 11.80 | | | $ | 18.24 | | | $ | 15.51 | | | $ | 15.16 | |
| | | | | | | | | | | | | | | | | | | | | | | | |
Total Investment Return3,4 | | | | | | | | | | | | | | | | | | | | | | | | |
Based on net asset value | | | 12.84 | %4,5 | | | (8.02 | )%6 | | | (22.78 | )% | | | 23.74 | % | | | 6.63 | % | | | 21.38 | % |
| | | | | | | | | | | | | | | | | | | | | | | | |
Ratios to Average Net Assets | | | | | | | | | | | | | | | | | | | | | | | | |
Total expenses | | | 1.87 | %7 | | | 1.97 | % | | | 1.44 | % | | | 1.38 | % | | | 1.06 | % | | | 1.28 | % |
| | | | | | | | | | | | | | | | | | | | | | | | |
Total expenses excluding recoupment of past waived fees | | | 1.84 | %7 | | | 1.97 | % | | | 1.44 | % | | | 1.38 | % | | | 1.06 | % | | | 1.28 | % |
| | | | | | | | | | | | | | | | | | | | | | | | |
Total expenses after fees waived, reimbursed and paid indirectly | | | 1.12 | % | | | 1.11 | % | | | 1.10 | % | | | 1.05 | % | | | 0.99 | % | | | 1.10 | % |
| | | | | | | | | | | | | | | | | | | | | | | | |
Net investment loss | | | (0.85 | )%7 | | | (0.67 | )% | | | (0.41 | )% | | | (0.71 | )% | | | (0.64 | )% | | | (0.72 | )% |
| | | | | | | | | | | | | | | | | | | | | | | | |
Supplemental Data | | | | | | | | | | | | | | | | | | | | | | | | |
Net assets, end of period (000) | | $ | 13,708 | | | $ | 12,178 | | | $ | 17,019 | | | $ | 26,976 | | | $ | 23,866 | | | $ | 20,133 | |
| | | | | | | | | | | | | | | | | | | | | | | | |
Portfolio turnover | | | 52 | % | | | 83 | % | | | 63 | % | | | 76 | % | | | 49 | % | | | 122 | % |
| | | | | | | | | | | | | | | | | | | | | | | | |
| | | | | | | | | | | | | | | | | | | | | | | | | | | | | | | | | | | | | | | | | | | | | | | | |
| | | Investor A | | | Investor B | |
| | | Six Months
Ended
March 31, 2010 | | | Year Ended September 30, | | | Six Months
Ended
March 31, 2010 | | | Year Ended September 30, | |
| | | (Unaudited) | | | 2009 | | | 2008 | | | 2007 | | | 2006 | | | 2005 | | | (Unaudited) | | | 2009 | | | 2008 | | | 2007 | | | 2006 | | | 2005 | |
Per Share Operating Performance | |
Net asset value, beginning of period | | $ | 10.09 | | | $ | 11.03 | | | $ | 17.24 | | | $ | 14.74 | | | $ | 14.48 | | | $ | 11.96 | | | $ | 8.56 | | | $ | 9.41 | | | $ | 15.09 | | | $ | 13.10 | | | $ | 13.03 | | | $ | 10.84 | |
| | | | | | | | | | | | | | | | | | | | | | | | | | | | | | | | | | | | | | | | | | | | | | | | |
Net investment loss1 | | | (0.06 | ) | | | (0.08 | ) | | | (0.09 | ) | | | (0.15 | ) | | | (0.15 | ) | | | (0.13 | ) | | | (0.08 | ) | | | (0.12 | ) | | | (0.17 | ) | | | (0.24 | ) | | | (0.23 | ) | | | (0.19 | ) |
Net realized and unrealized gain (loss)2 | | | 1.35 | | | | (0.85 | ) | | | (3.26 | ) | | | 3.48 | | | | 1.05 | | | | 2.65 | | | | 1.14 | | | | (0.73 | ) | | | (2.80 | ) | | | 3.06 | | | | 0.94 | | | | 2.38 | |
| | | | | | | | | | | | | | | | | | | | | | | | | | | | | | | | | | | | | | | | | | | | | | | | |
Net increase (decrease) from investment operations | | | 1.29 | | | | (0.93 | ) | | | (3.35 | ) | | | 3.33 | | | | 0.90 | | | | 2.52 | | | | 1.06 | | | | (0.85 | ) | | | (2.97 | ) | | | 2.82 | | | | 0.71 | | | | 2.19 | |
| | | | | | | | | | | | | | | | | | | | | | | | | | | | | | | | | | | | | | | | | | | | | | | | |
Dividends and Distributions from: | | | | | | | | | | | | | | | | | | | | | | | | | | | | | | | | | | | | | | | | | | | | | | | | |
Tax return of capital | | | — | | | | (0.01 | ) | | | — | | | | — | | | | — | | | | — | | | | — | | | | — | | | | — | | | | — | | | | — | | | | — | |
Net realized gain | | | — | | | | — | | | | (2.86 | ) | | | (0.83 | ) | | | (0.64 | ) | | | — | | | | — | | | | — | | | | (2.71 | ) | | | (0.83 | ) | | | (0.64 | ) | | | — | |
| | | | | | | | | | | | | | | | | | | | | | | | | | | | | | | | | | | | | | | | | | | | | | | | |
Total dividends and distributions | | | — | | | | (0.01 | ) | | | (2.86 | ) | | | (0.83 | ) | | | (0.64 | ) | | | — | | | | — | | | | — | | | | (2.71 | ) | | | (0.83 | ) | | | (0.64 | ) | | | — | |
| | | | | | | | | | | | | | | | | | | | | | | | | | | | | | | | | | | | | | | | | | | | | | | | |
Net asset value, end of period | | $ | 11.38 | | | $ | 10.09 | | | $ | 11.03 | | | $ | 17.24 | | | $ | 14.74 | | | $ | 14.48 | | | $ | 9.62 | | | $ | 8.56 | | | $ | 9.41 | | | $ | 15.09 | | | $ | 13.10 | | | $ | 13.03 | |
| | | | | | | | | | | | | | | | | | | | | | | | | | | | | | | | | | | | | | | | | | | | | | | | |
Total Investment Return3,4 | | | | | | | | | | | | | | | | | | | | | | | | | | | | | | | | | | | | | | | | | | | | | | | | |
Based on net asset value | | | 12.79 | %4,5 | | | (8.38 | )%8 | | | (22.93 | )% | | | 23.41 | % | | | 6.31 | % | | | 21.07 | % | | | 12.38 | %4,5 | | | (9.03 | )%9 | | | (23.51 | )% | | | 22.40 | % | | | 5.52 | % | | | 20.20 | % |
| | | | | | | | | | | | | | | | | | | | | | | | | | | | | | | | | | | | | | | | | | | | | | | | |
Ratios to Average Net Assets | | | | | | | | | | | | | | | | | | | | | | | | | | | | | | | | | | | | | | | | | | | | | | | | |
Total expenses | | | 1.56 | %7 | | | 1.64 | % | | | 1.45 | % | | | 1.42 | % | | | 1.66 | % | | | 1.64 | % | | | 2.48 | %7 | | | 2.61 | % | | | 2.40 | % | | | 2.40 | % | | | 2.40 | % | | | 2.30 | % |
| | | | | | | | | | | | | | | | | | | | | | | | | | | | | | | | | | | | | | | | | | | | | | | | |
Total expenses after fees waived, reimbursed and paid indirectly | | | 1.39 | %7 | | | 1.36 | % | | | 1.35 | % | | | 1.26 | % | | | 1.35 | % | | | 1.37 | %* | | | 2.16 | %7 | | | 2.11 | % | | | 2.10 | % | | | 2.09 | % | | | 2.10 | % | | | 2.10 | % |
| | | | | | | | | | | | | | | | | | | | | | | | | | | | | | | | | | | | | | | | | | | | | | | | |
Net investment loss | | | (1.11 | )%7 | | | (0.93 | )% | | | (0.66 | )% | | | (0.92 | )% | | | (1.00 | )% | | | (0.87 | )% | | | (1.88 | )%7 | | | (1.67 | )% | | | (1.40 | )% | | | (1.75 | )% | | | (1.75 | )% | | | (1.58 | )% |
| | | | | | | | | | | | | | | | | | | | | | | | | | | | | | | | | | | | | | | | | | | | | | | | |
Supplemental Data | | | | | | | | | | | | | | | | | | | | | | | | | | | | | | | | | | | | | | | | | | | | | | | | |
Net assets, end of period (000) | | $ | 118,843 | | | $ | 112,435 | | | $ | 138,073 | | | $ | 218,851 | | | $ | 209,646 | | | $ | 215,622 | | | $ | 6,101 | | | $ | 6,568 | | | $ | 10,468 | | | $ | 21,110 | | | $ | 23,085 | | | $ | 24,925 | |
| | | | | | | | | | | | | | | | | | | | | | | | | | | | | | | | | | | | | | | | | | | | | | | | |
Portfolio turnover | | | 52 | % | | | 83 | % | | | 63 | % | | | 76 | % | | | 49 | % | | | 122 | % | | | 52 | % | | | 83 | % | | | 63 | % | | | 76 | % | | | 49 | % | | | 122 | % |
| | | | | | | | | | | | | | | | | | | | | | | | | | | | | | | | | | | | | | | | | | | | | | | | |
See Notes to Financial Statements.
| | | | | | |
34 | | BLACKROCK FUNDS | | MARCH 31, 2010 | | |
| | |
| Financial Highlights (continued) | | BlackRock Small/Mid-Cap Growth Portfolio |
| | |
| | | | | | | | | | | | | | | | | | | | | | | | | | | | | | | | | | | | | | | | |
| | | Investor C | | | Class R | |
| | | Six Months
Ended
March 31, 2010 | | | Year Ended September 30, | | | Six Months
Ended
March 31, 2010 | | | Year Ended
September 30, | | | Period October 2, 200610 to | |
| | | (Unaudited) | | | 2009 | | | 2008 | | | 2007 | | | 2006 | | | 2005 | | | (Unaudited) | | | 2009 | | | 2008 | | | September 30, 2007 | |
Per Share Operating Performance | |
Net asset value, beginning of period | | $ | 8.57 | | | $ | 9.42 | | | $ | 15.12 | | | $ | 13.12 | | | $ | 13.06 | | | $ | 10.87 | | | $ | 9.98 | | | $ | 10.93 | | | $ | 17.18 | | | $ | 14.54 | |
| | | | | | | | | | | | | | | | | | | | | | | | | | | | | | | | | | | | | | | | |
Net investment loss1 | | | (0.08 | ) | | | (0.12 | ) | | | (0.17 | ) | | | (0.24 | ) | | | (0.23 | ) | | | (0.20 | ) | | | (0.07 | ) | | | (0.10 | ) | | | (0.12 | ) | | | (0.20 | ) |
Net realized and unrealized gain
(loss)2 | | | 1.14 | | | | (0.73 | ) | | | (2.80 | ) | | | 3.07 | | | | 0.93 | | | | 2.39 | | | | 1.33 | | | | (0.84 | ) | | | (3.23 | ) | | | 3.67 | |
| | | | | | | | | | | | | | | | | | | | | | | | | | | | | | | | | | | | | | | | |
Net increase (decrease) from investment operations | | | 1.06 | | | | (0.85 | ) | | | (2.97 | ) | | | 2.83 | | | | 0.70 | | | | 2.19 | | | | 1.26 | | | | (0.94 | ) | | | (3.35 | ) | | | 3.47 | |
| | | | | | | | | | | | | | | | | | | | | | | | | | | | | | | | | | | | | | | | |
Dividends and distributions from: | | | | | | | | | | | | | | | | | | | | | | | | | | | | | | | | | | | | | | | | |
Tax return of capital | | | — | | | | — | | | | — | | | | — | | | | — | | | | — | | | | — | | | | (0.01 | ) | | | — | | | | — | |
Net realized gain | | | — | | | | — | | | | (2.73 | ) | | | (0.83 | ) | | | (0.64 | ) | | | — | | | | — | | | | — | | | | (2.90 | ) | | | (0.83 | ) |
| | | | | | | | | | | | | | | | | | | | | | | | | | | | | | | | | | | | | | | | |
Total dividends and distributions | | | — | | | | — | | | | (2.73 | ) | | | (0.83 | ) | | | (0.64 | ) | | | — | | | | — | | | | (0.01 | ) | | | (2.90 | ) | | | (0.83 | ) |
| | | | | | | | | | | | | | | | | | | | | | | | | | | | | | | | | | | | | | | | |
Net asset value, end of period | | $ | 9.63 | | | $ | 8.57 | | | $ | 9.42 | | | $ | 15.12 | | | $ | 13.12 | | | $ | 13.06 | | | $ | 11.24 | | | $ | 9.98 | | | $ | 10.93 | | | $ | 17.18 | |
| | | | | | | | | | | | | | | | | | | | | | | | | | | | | | | | | | | | | | | | |
Total Investment Return3,4 | |
Based on net asset value | | | 12.37 | %4,5 | | | (9.02 | )%11 | | | (23.52 | )% | | | 22.44 | % | | | 5.43 | % | | | 20.15 | % | | | 12.63 | %4,5 | | | (8.61 | )%12 | | | (23.08 | )% | | | 24.68 | %5 |
| | | | | | | | | | | | | | | | | | | | | | | | | | | | | | | | | | | | | | | | |
Ratios to Average Net Assets | |
Total expenses | | | 2.37 | %7 | | | 2.51 | % | | | 2.25 | % | | | 2.23 | % | | | 2.30 | % | | | 2.32 | % | | | 1.95 | %7 | | | 2.34 | % | | | 2.07 | % | | | 1.81 | %7 |
| | | | | | | | | | | | | | | | | | | | | | | | | | | | | | | | | | | | | | | | |
Total expenses after fees waived, reimbursed and paid indirectly | | | 2.16 | %7 | | | 2.12 | % | | | 2.10 | % | | | 2.07 | % | | | 2.10 | % | | | 2.10 | % | | | 1.68 | %7 | | | 1.65 | % | | | 1.61 | % | | | 1.56 | %7 |
| | | | | | | | | | | | | | | | | | | | | | | | | | | | | | | | | | | | | | | | |
Net investment loss | | | (1.88 | )%7 | | | (1.68 | )% | | | (1.41 | )% | | | (1.73 | )% | | | (1.75 | )% | | | (1.60 | )% | | | (1.40 | )%7 | | | (1.22 | )% | | | (0.93 | )% | | | (1.22 | )%7 |
| | | | | | | | | | | | | | | | | | | | | | | | | | | | | | | | | | | | | | | | |
Supplemental Data | |
Net assets, end of period (000) | | $ | 9,196 | | | $ | 8,739 | | | $ | 11,427 | | | $ | 17,047 | | | $ | 17,041 | | | $ | 20,963 | | | $ | 2,988 | | | $ | 2,814 | | | $ | 1,903 | | | $ | 1,071 | |
| | | | | | | | | | | | | | | | | | | | | | | | | | | | | | | | | | | | | | | | |
Portfolio turnover | | | 52 | % | | | 83 | % | | | 63 | % | | | 76 | % | | | 49 | % | | | 122 | % | | | 52 | % | | | 83 | % | | | 63 | % | | | 76 | % |
| | | | | | | | | | | | | | | | | | | | | | | | | | | | | | | | | | | | | | | | |
| * | For the period October 1, 2004, through January 28, 2005, the expense ratio reflects the expenses of State Street Research Emerging Growth Fund prior to its reorganization with the Small/Mid-Cap Growth Portfolio on January 28, 2005. The expense ratio for the period October 1, 2004 through January 28, 2005 was 1.41%. The expense ratio of the Fund for the period January 29, 2005 through September 30, 2005 was 1.31%. |
| 1 | Based on average shares outstanding. |
| 2 | Includes redemption fees, which are less than $0.01 per share. |
| 3 | Where applicable, total investment returns exclude the effects of any sales charges and include the reinvestment of dividends and distributions. |
| 4 | Redemption fee of 2.00% is reflected in total return calculations. There was no impact to the return. |
| 5 | Aggregate total investment return. |
| 6 | Includes proceeds received from a settlement of litigation, which impacted the Fund’s total return. Not including these proceeds, the Fund’s total return would have been (8.19)%. |
| 8 | Includes proceeds received from a settlement of litigation, which impacted the Fund’s total return. Not including these proceeds, the Fund’s total return would have been (8.56)%. |
| 9 | Includes proceeds received from a settlement of litigation, which impacted the Fund’s total return. Not including these proceeds, the Fund’s total return would have been (9.25)%. |
| 10 | Commencement of operations. |
| 11 | Includes proceeds received from a settlement of litigation, which impacted the Fund’s total return. Not including these proceeds, the Fund’s total return would have been (9.24)%. |
| 12 | Includes proceeds received from a settlement of litigation, which impacted the Fund’s total return. Not including these proceeds, the Fund’s total return would have been (8.79)%. |
See Notes to Financial Statements.
| | | | | | |
| | | BLACKROCK FUNDS | | MARCH 31, 2010 | | 35 |
Notes to Financial Statements (Unaudited)
1. Organization and Significant Accounting Policies:
BlackRock FundsSM (the “Trust”), a Massachusetts business trust, is registered under the Investment Company Act of 1940, as amended (the “1940 Act”), as an open-end management investment company. As of March 31, 2010, the Trust had 25 series, of which BlackRock Mid-Cap Growth Equity Portfolio (“Mid-Cap Growth Equity”), BlackRock Mid-Cap Value Equity Portfolio (“Mid-Cap Value Equity”), and BlackRock Small/ Mid-Cap Growth Portfolio (“Small/Mid-Cap Growth”) (collectively the “Funds”) are included in these financial statements. Each of the Funds is diversified. The Funds’ financial statements are prepared in conformity with accounting principles generally accepted in the United States of America (“US GAAP”), which may require the use of management accruals and estimates. Actual results may differ from these estimates. Each Fund offers multiple classes of shares. Institutional Shares are sold without a sales charge and only to certain eligible investors. Service Shares are sold without a sales charge. Investor A Shares are generally sold with a front-end sales charge. Investor B and Investor C Shares may be subject to a contingent deferred sales charge. Class R Shares are sold without a sales charge and only to certain retirement and other similar plans. All classes of shares have identical voting, dividend, liquidation and other rights and the same terms and conditions, except that Service, Investor A, Investor B, Investor C and Class R Shares bear certain expenses related to the shareholder servicing of such shares, and Investor B, Investor C and Class R Shares also bear certain expenses related to the distribution of such shares. Investor B Shares automatically convert to Investor A Shares after approximately eight years. Investor B Shares are only available for purchase through exchanges, dividend reinvestment or for purchase by certain qualified employee benefit plans. Each class has exclusive voting rights with respect to matters relating to its shareholder servicing and distribution expenditures (except that Investor B shareholders may vote on material changes to the Investor A distribution plan).
Plan of Reorganization:
On February 23, 2010, the Board approved a plan of reorganization, subject to shareholder approval and certain other conditions, whereby Mid-Cap Value Equity will acquire substantially all of the assets and assume certain stated liabilities of BlackRock Aurora Portfolio of BlackRock FundsSM in exchange for newly issued shares of Mid-Cap Value Equity.
The following is a summary of significant accounting policies followed by the Funds:
Valuation: The Funds’ policy is to fair value their financial instruments at market value. Equity investments traded on a recognized securities exchange or the NASDAQ Global Market System are valued at the last reported sale price that day or the NASDAQ official closing price, if applicable. For equity investments traded on more than one exchange, the last reported sale price on the exchange where the stock is primarily traded is used. Equity investments traded on a recognized exchange for which there were no sales on that day are valued at the last available bid price. If no bid price is available, the prior day’s price will be used, unless it is determined that such prior day’s price no longer reflects the fair value of the security. Short-term securities with remaining maturities of 60 days or less may be valued at amortized cost, which approximates fair value. Investments in open-end investment companies are valued at net asset value each business day.
The Funds value their investments in BlackRock Liquidity Series, LLC Money Market Series (the “Money Market Series”) at fair value, which is ordinarily based upon their pro rata ownership in the net assets of the underlying fund. The Money Market Series seeks current income consistent with maintaining liquidity and preserving capital. Although the Money Market Series is not registered under the 1940 Act, its investments will follow the parameters of investments by a money market fund that is subject to Rule 2a-7 promulgated by the Securities and Exchange Commission (“SEC”) under the 1940 Act. The Funds may withdraw up to 25% of its investment daily, although the manager of the Money Market Series, in its sole discretion, may permit an investor to withdraw more than 25% on any one day.
Securities and other assets and liabilities denominated in foreign currencies are translated into US dollars using exchange rates determined as of the close of business on the New York Stock Exchange (“NYSE”). Foreign currency exchange contracts are valued at the mid between the bid and ask prices and are determined as of the close of business on the NYSE. Interpolated values are derived when the settlement date of the contract is an interim date for which quotations are not available.
Exchange-traded options are valued at the mean between the last bid and ask prices at the close of the options market in which the options trade. An exchange-traded option for which there is no mean price is valued at the last bid (long positions) or ask (short positions) price. If no bid or ask price is available, the prior day’s price will be used, unless it is determined that such prior day’s price no longer reflects the fair value of the option.
In the event that application of these methods of valuation results in a price for an investment which is deemed not to be representative of the market value of such investment or is not available, the investment will be valued by a method approved by the Board of Trustees (the “Board”) as reflecting fair value (“Fair Value Assets”). When determining the price for Fair Value Assets, the investment advisor seeks to determine the price that each Fund might reasonably expect to receive from the current sale of that asset in an arm’s-length transaction. Fair value determinations shall be based upon all available factors that the investment advisor deems relevant. The pricing of all Fair Value Assets is subsequently reported to the Board or a committee thereof.
Segregation and Collateralization: In cases in which the 1940 Act and the interpretive positions of the SEC require that a Fund either delivers collateral or segregates assets in connection with certain investments (e.g., written options) each Fund will, consistent with SEC rules and/or
| | | | | | |
36 | | BLACKROCK FUNDS | | MARCH 31, 2010 | | |
| | |
| Notes to Financial Statements (continued) | | |
certain interpretive letters issued by the SEC, segregate collateral or designate on its books and records cash or other liquid securities having a market value at least equal to the amount that would otherwise be required to be physically segregated. Furthermore, based on requirements and agreements with certain exchanges and third party broker-dealers, each party has requirements to deliver/deposit securities as collateral for certain investments.
Investment Transactions and Investment Income: For financial reporting purposes, investment transactions are recorded on the dates the transactions are entered into (the trade dates). Realized gains and losses on investment transactions are determined on the identified cost basis. Dividend income is recorded on the ex-dividend dates. Dividends from foreign securities where the ex-dividend date may have passed are subsequently recorded when the Funds have determined the ex-dividend date. Under the applicable foreign tax laws, a withholding tax at various rates may be imposed on capital gains, dividends and interest. Upon notification from issuers, some of the dividend income received from a real estate investment trust may be redesignated as a reduction of cost of the related investment and/or realized gain. Interest income, including amortization of premium and accretion of discount on debt securities, is recognized on the accrual basis. Income and realized and unrealized gains and losses are allocated daily to each class based on its relative net assets.
Redemptions-In-Kind: Mid-Cap Value Equity transferred securities and cash as a redemption-in-kind transaction. For purposes of generally accepted accounting principles, these transactions were treated as a sale of securities and the resulting gains and losses were recognized based on the market value of the securities on the date of the transfer. For tax purposes, no gains or losses were recognized. Gains and losses resulting from such redemptions-in-kind are shown as redemption-in-kind transactions in the Statements of Operations.
Dividends and Distributions: Dividends and distributions, if any, paid by the Funds are recorded on the ex-dividend dates. The amount and timing of dividends and distributions are determined in accordance with federal income tax regulations, which may differ from US GAAP. If the total dividends and distributions made in any tax year exceeds net investment income and accumulated realized capital gains, a portion of the total distribution may be treated as a tax return of capital.
Securities Lending: The Funds may lend securities to financial institutions that provide cash as collateral, which will be maintained at all times in an amount equal to at least 100% of the current market value of the loaned securities. The market value of the loaned securities is determined at the close of business of the Funds and any additional required collateral is delivered to the Funds on the next business day. Securities lending income, as disclosed in the Statements of Operations, represents the income earned from the investment of the cash collateral, net of rebates paid to, or fees paid by, borrowers and less the fees paid to the securities lending agent. Loans of securities are terminable at any time and the borrower, after notice, is required to return borrowed securities within the standard time period for settlement of securities transactions. In the event that the borrower defaults on its obligation to return borrowed securities because of insolvency or for any other reason, the Funds could experience delays and costs in gaining access to the collateral. The Funds also could suffer a loss if the value of an investment purchased with cash collateral falls below the market value of loaned securities or if the value of an investment purchased with cash collateral falls below the value of the original cash collateral received.
Income Taxes: It is the Funds’ policy to comply with the requirements of the Internal Revenue Code of 1986, as amended, applicable to regulated investment companies and to distribute substantially all of their taxable income to their shareholders. Therefore, no federal income tax provision is required.
The Funds file US federal and various state and local tax returns. No income tax returns are currently under examination. The statute of limitations on each Fund’s US federal tax returns remains open for each of the four years ended September 30, 2009. The statutes of limitations on each Fund’s state and local tax returns may remain open for an additional year depending upon the jurisdiction. There are no uncertain tax positions that require recognition of a tax liability.
Recent Accounting Standard: In January 2010, Financial Accounting Standards Board issued amended guidance to improve disclosure about fair value measurements which will require additional disclosures about transfers into and out of Levels 1 and 2 and separate disclosures about purchases, sales, issuances and settlements in the reconciliation for fair value measurements using significant unobservable inputs (Level 3). It also clarifies existing disclosure requirements relating to the levels of disaggregation for fair value measurement and inputs and valuation techniques used to measure fair value. The amended guidance is effective for financial statements for fiscal years beginning after December 15, 2009, and interim periods within those fiscal years except for disclosures about purchases, sales, issuances and settlements in the rollforward of activity in Level 3 fair value measurements, which are effective for fiscal years beginning after December 15, 2010 and for interim periods within those fiscal years. The impact of this guidance on the Funds’ financial statements and disclosures is currently being assessed.
Other: Expenses directly related to a Fund or its classes are charged to that Fund or its classes. Other operating expenses shared by several funds are pro rated among those funds on the basis of relative net assets or other appropriate methods. Other expenses of a Fund are allocated daily to each class based on its relative net assets.
2. Derivative Financial Instruments:
The Funds may engage in various portfolio investment strategies both to increase the returns of the Funds and to economically hedge, or protect, their exposure to equity risk. Losses may arise if the value of the contract decreases due to an unfavorable change in the price of the
| | | | | | |
| | | BLACKROCK FUNDS | | MARCH 31, 2010 | | 37 |
| | |
| Notes to Financial Statements (continued) | | |
underlying instrument or if the counterparty does not perform under the contract. The Funds may mitigate counterparty risk through master netting agreements included within an International Swap and Derivatives Association, Inc. (“ISDA”) Master Agreement between a Fund and each of its counterparties. The ISDA Master Agreement allows each Fund to offset with its counterparty certain derivative financial instrument’s payables and/or receivables with collateral held with each counterparty. The amount of collateral moved to/from applicable counterparties is based upon minimum transfer amounts of up to $500,000. To the extent amounts due to the Funds from their counterparties are not fully collateralized contractually or otherwise, the Funds bear the risk of loss from counterparty non-performance. See Note 1 “Segregation and Collateralization” for information with respect to collateral practices. In addition, the Funds manage counterparty risk by entering into agreements only with counterparties that they believe have the financial resources to honor their obligations and by monitoring the financial stability of those counterparties.
The Funds’ maximum risk of loss from counterparty credit risk on over-the-counter (“OTC”) derivatives is generally the aggregate unrealized gain in excess of any collateral pledged by the counterparty to the Funds. For OTC options purchased, the Funds bear the risk of loss in the amount of the premiums paid and change in market value of the options should the counterparty not perform under the contracts. Options written by the Funds do not give rise to counterparty credit risk, as options written obligate the Funds to perform and not the counterparty. Certain ISDA Master Agreements allow counterparties to OTC derivatives to terminate derivative contracts prior to maturity in the event a Fund’s net assets decline by a stated percentage or a Fund fails to meet the terms of its ISDA Master Agreements, which would cause the Funds to accelerate payment of any net liability owed to the counterparty. Counterparty risk related to exchange-traded financial futures contracts and options is minimal because of the protection against defaults provided by the exchange on which they trade.
Options: Certain Funds may purchase and write call and put options to increase or decrease their exposure to underlying instruments (equity risk) and/or, in the case of options written, to generate gains from options premiums. A call option gives the purchaser of the option the right (but not the obligation) to buy, and obligates the seller to sell (when the option is exercised), the underlying instrument at the exercise price at any time or at a specified time during the option period. A put option gives the holder the right to sell and obligates the writer to buy the underlying instrument at the exercise price at any time or at a specified time during the option period. When a Fund purchases (writes) an option, an amount equal to the premium paid (received) by a Fund is reflected as an asset (liability). The amount of the asset (liability) is subsequently marked-to-market to reflect the current market value of the option purchased (written). When an instrument is purchased or sold through an exercise of an option, the related premium paid (or received) is added to (or deducted from) the basis of the instrument acquired or deducted from (or added to) the proceeds of the instrument sold. When an option expires (or a Fund enters into a closing transaction), a Fund realizes a gain or loss on the option to the extent of the premiums received or paid (or gain or loss to the extent the cost of the closing transaction exceeds the premium received or paid). When a Fund writes a call option, such option is “covered,” meaning that a Fund holds the underlying instrument subject to being called by the option counterparty, or cash in an amount sufficient to cover the obligation. When a Fund writes a put option, such option is covered by cash in an amount sufficient to cover the obligation.
In purchasing and writing options, a Fund bears the risk of an unfavorable change in the value of the underlying instrument or the risk that the Fund may not be able to enter into a closing transaction due to an illiquid market. Exercise of an option written could result in a Fund purchasing or selling a security at a price different from the current market value. The Funds may execute transactions in both listed and OTC options.
Derivative Instruments Categorized by Risk Exposure:
Fair Values of Derivative Instruments as of March 31, 2010
Liability Derivatives
| | | | | |
| | | Statements of Assets and Liabilities Location | | Mid-Cap
Value
Equity |
Equity contracts | | Options written at value | | $ | 114,550 |
The Effect of Derivative Instruments on the Statements of Operations
Six Months Ended March 31, 2010
Net Realized Gain from
| | | |
| | | Mid-Cap
Value
Equity |
Equity contracts: | | | |
Options | | $ | 455,324 |
Net Change in Unrealized Appreciation/Depreciation on
| | | | |
| | | Mid-Cap
Value
Equity | |
Equity contracts: | | | | |
Options | | $ | (34,647 | ) |
For the six months ended March 31, 2010, the average quarterly balance of derivative financial instruments was as follows:
| | | |
| | | Mid-Cap
Value
Equity |
Options written: | | | |
Average number of contracts | | | 4,180 |
Average notional value | | $ | 6,377,500 |
3. Investment Advisory Agreement and Other Transactions with Affiliates:
The PNC Financial Services Group, Inc. (“PNC”), Bank of America Corporation (“BAC”) and Barclays Bank PLC (“Barclays”) are the largest stockholders of BlackRock, Inc. (“BlackRock”). Due to the ownership structure, PNC is an affiliate of the Funds for 1940 Act purposes, but BAC and Barclays are not.
| | | | | | |
38 | | BLACKROCK FUNDS | | MARCH 31, 2010 | | |
| | |
Notes to Financial Statements (continued) | | |
The Trust, on behalf of the Funds, entered into an Investment Advisory Agreement with BlackRock Advisors, LLC (the “Manager”), the Funds’ investment advisor, an indirect, wholly owned subsidiary of BlackRock, to provide investment advisory and administration services. The Manager is responsible for the management of each Fund’s Portfolio and provides the necessary personnel, facilities, equipment and certain other services necessary to the operations of each Fund. For such services, each Fund pays the Manager a monthly fee at the following annual rates of each Fund’s average daily net assets:
| | | | | | |
Average Daily Net Assets | | Mid-Cap Growth Equity
and
Mid-Cap Value Equity | | | Small/Mid-Cap
Growth | |
First $1 Billion | | 0.800 | % | | 0.750 | % |
$1 Billion - $2 Billion | | 0.700 | | | 0.700 | |
$2 Billion - $3 Billion | | 0.650 | | | 0.675 | |
Greater Than $3 Billion | | 0.625 | | | 0.650 | |
The Manager contractually agreed to waive or reimburse fees or expenses, excluding interest expense, dividend expense, acquired fund fees and expenses and certain other fund expenses, in order to limit expenses. The Manager has agreed not to reduce or discontinue this contractual waiver or reimbursement until February 1, 2011 unless approved by the Board, including a majority of the non-interested Trustees. The expense limitations as a percentage of net assets were as follows:
| | | | | | | | | |
Share Classes | | Mid-Cap
Growth
Equity | | | Mid-Cap
Value
Equity | | | Small/
Mid-Cap
Growth | |
Institutional | | 1.27 | % | | 0.97 | % | | 1.13 | % |
Service | | 1.58 | % | | 1.29 | % | | 1.39 | %1 |
Investor A | | 1.63 | % | | 1.29 | % | | 1.39 | % |
Investor B | | 2.40 | % | | 2.06 | % | | 2.16 | % |
Investor C | | 2.40 | % | | 2.06 | % | | 2.16 | % |
Class R | | 1.65 | % | | 2.04 | %1 | | 1.68 | % |
| 1 | There were no shares outstanding as of March 31, 2010. |
The Manager has voluntarily agreed to waive its advisory fee by the amount of investment advisory fees each Fund pays to the Manager indirectly through its investment in affiliated money market funds, however the Manager does not waive its advisory fees by the amount of investment advisory fees through its investment in other affiliated investment companies. These amounts are included in fees waived by advisor in the Statements of Operations. For the six months ended March 31, 2010, the amounts waived were as follows:
| | | |
Mid Cap Growth Equity | | $ | 1,244 |
Mid Cap Value Equity | | $ | 3,263 |
Small/Mid Cap Growth Equity | | $ | 1,084 |
If during a Fund’s fiscal year the operating expenses of a share class that at any time during the prior two fiscal years received a waiver or reimbursement from the Manager, are less than the expense limit for that share class, the Manager is entitled to be reimbursed by such share class up to the amount of fees waived or expenses reimbursed during those prior two fiscal years under the agreement provided that: (1) the Fund of which the share class is a part has more than $50 million in assets and (2) the Manager or an affiliate continues to serve as the Fund’s investment advisor or administrator. In the event the expense limit for a share class is changed subsequent to a fiscal year in which the Manager becomes entitled to reimbursement for fees waived or reimbursed, the amount available to reimburse the Manager shall be calculated by reference to the expense limit for that share class in effect at the time the Manager became entitled to receive such reimbursement, rather than the subsequently changed expense limit for that share class.
For the six months ended March 31, 2010, the Manager recouped the following waivers previously recorded by the Funds:
Recoupment of Past Waived Fees
| | | | | | |
Share Classes | | Mid-Cap
Growth
Equity | | Small/
Mid-Cap
Growth |
Institutional | | $ | 4,429 | | $ | 1,751 |
Investor A | | | 15,813 | | | — |
Investor C | | | 1,851 | | | — |
| | | | | | |
Total | | $ | 22,093 | | $ | 1,751 |
On March 31, 2010, the amounts subject to possible future recoupment under the expense limitation agreement are as follows:
| | | | | | | | | |
| | | Expiring September 30, |
| | | 2010 | | 2011 | | 2012 |
Mid-Cap Growth Equity | | $ | 47,216 | | $ | 279,792 | | $ | 12,339 |
Mid-Cap Value Equity | | $ | 1,798,676 | | $ | 1,532,746 | | $ | 532,959 |
Small/Mid-Cap Growth | | $ | 343,583 | | $ | 453,330 | | $ | 157,334 |
The Trust, on behalf of the Funds, has entered into a Distribution Agreement and Distribution Plan with BlackRock Investments, LLC (“BRIL”), an affiliate of BlackRock. Pursuant to the Distribution Plan and in accordance with Rule 12b-1 under the 1940 Act, the Funds pay BRIL ongoing service and distribution fees. The fees are accrued daily and paid monthly at annual rates based upon the average daily net assets of the shares of each Fund as follows:
| | | | | | |
| | | Service
Fee | | | Distribution
Fee | |
Service | | 0.25 | % | | — | |
Investor A | | 0.25 | % | | — | |
Investor B | | 0.25 | % | | 0.75 | % |
Investor C | | 0.25 | % | | 0.75 | % |
Class R | | 0.25 | % | | 0.25 | % |
Pursuant to sub-agreements with BRIL, broker-dealers and BRIL provide shareholder servicing and distribution services to each Fund. The ongoing service and/or distribution fee compensates BRIL and each broker-dealer for providing shareholder servicing and/or distribution related services to Service, Investor A, Investor B, Investor C and Class R shareholders.
| | | | | | |
| | | BLACKROCK FUNDS | | MARCH 31, 2010 | | 39 |
| | |
Notes to Financial Statements (continued) | | |
For the six months ended March 31, 2010, affiliates earned underwriting discounts, direct commissions and dealer concessions on sales of each Fund’s Investor A Shares as follows:
| | | |
Mid-Cap Growth Equity | | $ | 3,400 |
Mid-Cap Value Equity | | $ | 4,375 |
Small/Mid-Cap Growth | | $ | 1,651 |
For the six months ended March 31, 2010, affiliates received the following contingent deferred sales charges relating to transactions in Investor B and Investor C Shares:
| | | | | | |
| | | Investor B | | Investor C |
Mid-Cap Growth Equity | | $ | 6,276 | | $ | 284 |
Mid-Cap Value Equity | | $ | 20,144 | | $ | 2,842 |
Small/Mid-Cap Growth | | $ | 2,687 | | $ | 158 |
PFPC Trust Company, an indirect, wholly owned subsidiary of PNC, serves as custodian for each Fund. For these services, the custodian receives a fee computed daily and payable monthly, based on a percentage of the average daily gross assets of each Fund. The fee is paid at the following annual rates: 0.005% of the first $400 million, 0.004% of the next $1.6 billion and 0.003% of average daily gross assets in excess of $2 billion; plus per transaction charges and other miscellaneous fees incurred on behalf of each Fund.
The Funds have an arrangement with the custodian whereby fees may be reduced by credits earned on uninvested cash balances, which if applicable are shown as fees paid indirectly in the Statements of Operations. The custodian imposes fees on overdrawn cash balances, which can be offset by accumulated credits earned or may result in additional custody charges.
PNC Global Investment Servicing (U.S.) Inc. (“PNCGIS”), an indirect, wholly owned subsidiary of PNC and an affiliate of the Manager, serves as transfer and dividend disbursing agent. Transfer agency fees borne by the Funds are comprised of those fees charged for all shareholder communications including mailing of shareholder reports, dividend and distribution notices, and proxy materials for shareholders meetings, as well as per account and per transaction fees related to servicing and maintenance of shareholder accounts, including the issuing, redeeming and transferring of shares, check writing, anti-money laundering services, and customer identification services.
Pursuant to written agreements, certain affiliates provide the Funds with sub-accounting, recordkeeping, sub-transfer agency and other administrative services with respect to sub-accounts they service. For these services, these affiliates receive an annual fee per shareholder account which will vary depending on share class. For the six months ended March 31, 2010, the Funds paid the following in return for these services which is included in transfer agent — class specific in the Statements of Operations:
| | | |
Mid-Cap Growth Equity | | $ | 10,746 |
Mid-Cap Value Equity | | $ | 8,303 |
Small/Mid-Cap Growth | | $ | 233 |
The Manager maintains a call center, which is responsible for providing certain shareholder services to the Funds, such as responding to shareholder inquiries and processing transactions based upon instructions from shareholders with respect to the subscription and redemption of Fund shares. For the six months ended March 31, 2010, each Fund reimbursed the Manager the following amounts for costs incurred in running the call center, which are included in transfer agent — class specific in the Statements of Operations.
| | | | | | | | | |
| | | Call Center |
Share Classes | | Mid-Cap
Growth
Equity | | Mid-Cap
Value
Equity | | Small/
Mid-Cap
Growth |
Institutional | | $ | 396 | | $ | 1,108 | | $ | 157 |
Service | | | 15 | | | 42 | | | — |
Investor A | | | 23,405 | | | 16,183 | | | 6,076 |
Investor B | | | 1,383 | | | 4,276 | | | 399 |
Investor C | | | 926 | | | 4,883 | | | 561 |
Class R | | | 14 | | | — | | | 19 |
| | | | | | | | | |
Total | | $ | 26,139 | | $ | 26,492 | | $ | 7,212 |
PNCGIS and the Manager act as co-administrators for the Funds. For these services, the co-administrators receive a combined administration fee computed daily and payable monthly, based on a percentage of the average daily net assets of each Fund. The combined administration fee is paid at the following annual rates: 0.075% of the first $500 million, 0.065% of the next $500 million and 0.055% of average daily net assets in excess of $1 billion. In addition, each of the share classes is charged an administration fee based on the following percentages of average daily net assets of each respective class: 0.025% of the first $500 million, 0.015% of the next $500 million and 0.005% of average daily net assets in excess of $1 billion. In addition, PNCGIS and the Manager may have, at their discretion, voluntarily waived all or any portion of their administration fees for a Fund or a share class which are included in administration fees waived and administration fees waived — class specific in the Statements of Operations.
The Funds have received an exemptive order from the SEC permitting, among other things, to pay an affiliated securities lending agent a fee based on a share of the income derived from the securities lending activities and has retained BlackRock Investment Management, LLC (“BIM”) as the securities lending agent. BIM may, on behalf of the Funds, invest cash collateral received by a Fund for such loans, among other things, in a private investment company managed by the Manager or in registered money market funds advised by the Manager or its affiliates. The market value of securities on loan and the value of the related collateral are shown on the Statements of Assets and Liabilities as securities loaned and collateral at value – securities loaned, respectively. The cash collateral invested by BIM is disclosed in the Schedules of Investments. The share of income earned by the Funds on such investments is shown as securities lending – affiliated in the Statements of Operations. For the six months ended March 31, 2010, BIM received $16,501 in securities lending agent fees related to securities lending activities for the Funds.
| | | | | | |
40 | | BLACKROCK FUNDS | | MARCH 31, 2010 | | |
| | |
Notes to Financial Statements (continued) | | |
For the six months ended March 31, 2010, the following tables show the various types of class specific expenses borne directly by each class of each Fund and any associated waivers or reimbursements of those expenses.
| | | | | | | | | |
Administration Fees | | | | | | | | | |
| | | |
Share Classes | | Mid-Cap
Growth
Equity | | Mid-Cap
Value
Equity | | Small/
Mid-Cap
Growth |
Institutional | | $ | 3,324 | | $ | 20,342 | | $ | 1,353 |
Service | | | 46 | | | 323 | | | — |
Investor A | | | 23,350 | | | 50,821 | | | 13,974 |
Investor B | | | 1,400 | | | 4,740 | | | 771 |
Investor C | | | 1,607 | | | 11,720 | | | 1,078 |
Class R | | | 284 | | | — | | | 351 |
| | | | | | | | | |
Total | | $ | 30,011 | | $ | 87,946 | | $ | 17,527 |
| | | | | | | | | |
Administration Fees Waived | | | | | | | | | |
| | | |
Share Classes | | Mid-Cap
Growth
Equity | | Mid-Cap
Value
Equity | | Small/
Mid-Cap
Growth |
Institutional | | $ | — | | $ | 20,342 | | $ | 1,102 |
Service | | | 44 | | | 6 | | | — |
Investor A | | | — | | | 50,821 | | | 13,974 |
Investor B | | | 1,175 | | | 4,740 | | | 771 |
Investor C | | | — | | | 11,720 | | | 1,078 |
Class R | | | 284 | | | — | | | 351 |
| | | | | | | | | |
Total | | $ | 1,503 | | $ | 87,629 | | $ | 17,276 |
| | | | | | | | | |
Service and Distribution Fees | | | | | | | | | |
| | | |
Share Classes | | Mid-Cap
Growth
Equity | | Mid-Cap
Value
Equity | | Small/
Mid-Cap
Growth |
Service | | $ | 444 | | $ | 3,231 | | | — |
Investor A | | | 232,103 | | | 504,722 | | $ | 139,182 |
Investor B | | | 55,358 | | | 188,525 | | | 30,419 |
Investor C | | | 63,863 | | | 467,069 | | | 42,797 |
Class R | | | 5,681 | | | — | | | 7,018 |
| | | | | | | | | |
Total | | $ | 357,449 | | $ | 1,163,547 | | $ | 219,416 |
| | | | | | | | | |
Transfer Agent Fees | | | | | | | | | |
| | | |
Share Classes | | Mid-Cap
Growth
Equity | | Mid-Cap
Value
Equity | | Small/
Mid-Cap
Growth |
Institutional | | $ | 21,050 | | $ | 136,344 | | $ | 46,306 |
Service | | | 738 | | | 941 | | | — |
Investor A | | | 313,049 | | | 458,617 | | | 183,870 |
Investor B | | | 33,298 | | | 68,128 | | | 15,846 |
Investor C | | | 21,038 | | | 149,442 | | | 17,070 |
Class R | | | 4,920 | | | — | | | 6,507 |
| | | | | | | | | |
Total | | $ | 394,093 | | $ | 813,472 | | $ | 269,599 |
| | | | | | | | | |
Transfer Agent Fees Waived | | | | | | | | | |
| | | |
Share Classes | | Mid-Cap
Growth
Equity | | Mid-Cap
Value
Equity | | Small/
Mid-Cap
Growth |
Institutional | | $ | — | | $ | 1,108 | | $ | 140 |
Service | | | 11 | | | 3 | | | — |
Investor A | | | — | | | 16,183 | | | 6,076 |
Investor B | | | 1,189 | | | 4,276 | | | 399 |
Investor C | | | — | | | 4,883 | | | 561 |
Class R | | | 14 | | | — | | | 20 |
| | | | | | | | | |
Total | | $ | 1,214 | | $ | 26,453 | | $ | 7,196 |
| | | | | | | | | |
Transfer Agent Fees Reimbursed | | | | | | | | | |
| | | |
Share Classes | | Mid-Cap
Growth
Equity | | Mid-Cap
Value
Equity | | Small/
Mid-Cap
Growth |
Institutional | | $ | — | | $ | 98,207 | | $ | 39,282 |
Service | | | 27 | | | 27 | | | — |
Investor A | | | — | | | 203,567 | | | 74,072 |
Investor B | | | 6,901 | | | 37,388 | | | 8,771 |
Investor C | | | — | | | 79,688 | | | 7,400 |
Class R | | | 2,694 | | | — | | | 3,337 |
| | | | | | | | | |
Total | | $ | 9,622 | | $ | 418,877 | | $ | 132,862 |
The Funds may also receive earnings credits related to cash balances with PNCGIS which are shown on the Statements of Operations as fees paid indirectly.
Certain officers and/or trustees of the Trust are officers and/or directors of BlackRock or its affiliates. The Funds reimburse the Manager for compensation paid to the Trust’s Chief Compliance Officer.
4. Investments:
Purchases and sales of investments, excluding short-term securities, for the six months ended March 31, 2010 were as follows:
| | | | | | | |
| | | Purchases | | Sales | |
Mid-Cap Growth Equity | | $ | 81,108,334 | | $ | 92,316,998 | |
Mid-Cap Value Equity1 | | $ | 343,922,803 | | $ | 398,630,513 | 1 |
Small/Mid-Cap Growth | | $ | 71,348,052 | | $ | 87,506,033 | |
| 1 | Including $52,720,155 of sales representing redemptions-in-kind. |
Transactions in options written for the six months ended March 31, 2010, were as follows:
| | | | | | | | | | | | | | |
Mid-Cap Value Equity | | Calls | | | Puts | |
| | | Contracts | | | Premiums
Received | | | Contracts | | | Premiums
Received | |
Options outstanding at beginning of period | | 4,800 | | | $ | 122,060 | | | 850 | | | $ | 22,900 | |
Options written | | 18,461 | | | | 562,921 | | | 1,650 | | | | 63,070 | |
Options expired | | (9,051 | ) | | | (303,773 | ) | | (2,500 | ) | | | (85,970 | ) |
Options closed | | (7,850 | ) | | | (241,345 | ) | | — | | | | — | |
| | | | | | | | | | | | | | |
Options outstanding at end of period | | 6,360 | | | $ | 139,863 | | | — | | | $ | — | |
| | | | | | | | | | | | | | |
| | | | | | |
| | | BLACKROCK FUNDS | | MARCH 31, 2010 | | 41 |
| | |
Notes to Financial Statements (continued) | | |
5. Borrowings:
The Funds, along with certain other funds managed by the Manager and its affiliates, are a party to a $500 million credit agreement with a group of lenders, which was renewed until November 2010. The Funds may borrow under the credit agreement to fund shareholder redemptions. Prior to its renewal, the credit agreement had the following terms: 0.02% upfront fee on the aggregate commitment amount which was allocated to the Funds based on its net assets as of October 31, 2008; a commitment fee of 0.08% per annum based on the Funds’ pro rata share of the unused portion of the credit agreement, which is included in miscellaneous in the Statements of Operations, and interest at a rate equal to the higher of the (a) federal funds effective rate and (b) reserve adjusted one-month LIBOR, plus, in each case, the higher of (i) 1.50% and (ii) 50% of the CDX Index (as defined in the credit agreement) on amounts borrowed. Effective November 2009, the credit agreement was renewed with the following terms: 0.02% upfront fee on the aggregate commitment amount which was allocated to the Funds based on its net assets as of October 31, 2009, a commitment fee of 0.10% per annum based on the Funds’ pro rata share of the unused portion of the credit agreement and interest at a rate equal to the higher of (a) the one-month LIBOR plus 1.25% per annum and (b) the Fed Funds rate plus 1.25% per annum on amounts borrowed. The Funds did not borrow under the credit agreement during the six months ended March 31, 2010.
6. Capital Loss Carryforward:
As of September 30, 2009, the Funds had capital loss carryforwards available to offset future realized capital gains through the indicated expiration dates:
| | | | | | | | | |
Expiring September 30, | | Mid-Cap
Growth
Equity | | Mid-Cap
Value
Equity | | Small/
Mid-Cap
Growth |
2010 | | $ | 99,778,499 | | | — | | | — |
2011 | | | 16,297,623 | | | — | | | — |
2017 | | | 3,358,149 | | $ | 94,018,904 | | $ | 8,644,509 |
| | | | | | | | | |
Total | | $ | 119,434,271 | | $ | 94,018,904 | | $ | 8,644,509 |
| | | | | | | | | |
7. Concentration, Market and Credit Risk:
In the normal course of business, the Funds invest in securities and enter into transactions where risks exist due to fluctuations in the market (market risk) or failure of the issuer of a security to meet all its obligations (credit risk). The value of securities held by the Funds may decline in response to certain events, including those directly involving the issuers whose securities are owned by the Funds; conditions affecting the general economy; overall market changes; local, regional or global political, social or economic instability; and currency and interest rate and price fluctuations. Similar to credit risk, the Funds may be exposed to counterparty risk, or the risk that an entity with which the Funds have unsettled or open transactions may default. The Funds manage counterparty risk by entering into transactions only with counterparties that they believe have the financial resources to honor their obligations and by monitoring the financial stability of those counterparties. Financial assets, which potentially expose the Funds to credit and counterparty risks, consist principally of investments and cash due from counterparties. The extent of the Funds’ exposure to credit and counterparty risks with respect to these financial assets is generally approximated by their value recorded in the Funds’ Statements of Assets and Liabilities, less any collateral held by the Funds.
Mid-Cap Growth Equity invests a significant portion of its assets in securities in the information technology sector. Changes in economic conditions affecting the information technology sector would have a greater impact on Mid-Cap Growth Equity and could affect the value, income and/or liquidity of positions in such securities.
Mid-Cap Value Equity invests a significant portion of its assets in securities in the financials sector. Changes in economic conditions affecting the financials sector would have a greater impact on Mid-Cap Value Equity and could affect the value, income and/or liquidity of positions in such securities.
Small/Mid-Cap Growth invests a significant portion of its assets in securities in the information technology and health care sectors. Changes in economic conditions affecting the information technology and health care sectors would have a greater impact on Small/Mid-Cap Growth and could affect the value, income and/or liquidity of positions in such securities.
8. Capital Shares Transactions:
Transactions in capital shares for each class were as follows:
| | | | | | | | | | | | | | |
| | | Six Months
Ended
March 31, 2010 | | | Year Ended
September 30, 2009 | |
Mid-Cap Growth Equity | | Shares | | | Amount | | | Shares | | | Amount | |
| | | | |
Institutional | | | | | | | | | | | | | | |
Shares sold | | 374,555 | | | $ | 4,061,716 | | | 1,163,071 | | | $ | 9,242,027 | |
Shares redeemed | | (472,764 | ) | | | (5,184,579 | ) | | (1,235,018 | ) | | | (9,965,239 | ) |
| | | | | | | | | | | | | | |
Net decrease | | (98,209 | ) | | $ | (1,122,863 | ) | | (71,947 | ) | | $ | (723,212 | ) |
| | | | | | | | | | | | | | |
| | | | | | |
42 | | BLACKROCK FUNDS | | MARCH 31, 2010 | | |
| | |
Notes to Financial Statements (continued) | | |
| | | | | | | | | | | | | | |
| | | Six Months
Ended
March 31, 2010 | | | Year Ended
September 30, 2009 | |
Mid-Cap Growth Equity (concluded) | | Shares | | | Amount | | | Shares | | | Amount | |
Service | | | | | | | | | | | | | | |
Shares sold | | 689 | | | $ | 6,577 | | | 3,825 | | | $ | 27,667 | |
Shares redeemed | | (3,689 | ) | | | (38,541 | ) | | (13,568 | ) | | | (105,723 | ) |
| | | | | | | | | | | | | | |
Net decrease | | (3,000 | ) | | $ | (31,964 | ) | | (9,743 | ) | | $ | (78,056 | ) |
| | | | | | | | | | | | | | |
| | | | |
Investor A | | | | | | | | | | | | | | |
Shares sold and automatic conversion of shares | | 484,893 | | | $ | 4,879,115 | | | 1,484,196 | | | $ | 10,902,981 | |
Shares redeemed | | (1,192,584 | ) | | | (11,917,941 | ) | | (2,859,994 | ) | | | (20,691,046 | ) |
| | | | | | | | | | | | | | |
Net decrease | | (707,691 | ) | | $ | (7,038,826 | ) | | (1,375,798 | ) | | $ | (9,788,065 | ) |
| | | | | | | | | | | | | | |
| | | | |
Investor B | | | | | | | | | | | | | | |
Shares sold | | 9,379 | | | $ | 85,785 | | | 128,078 | | | $ | 822,693 | |
Shares redeemed and automatic conversion of shares | | (299,634 | ) | | | (2,670,681 | ) | | (990,583 | ) | | | (6,304,470 | ) |
| | | | | | | | | | | | | | |
Net decrease | | (290,255 | ) | | $ | (2,584,896 | ) | | (862,505 | ) | | $ | (5,481,777 | ) |
| | | | | | | | | | | | | | |
| | | | |
Investor C | | | | | | | | | | | | | | |
Shares sold | | 114,244 | | | $ | 1,028,578 | | | 229,847 | | | $ | 1,555,736 | |
Shares redeemed | | (124,005 | ) | | | (1,094,156 | ) | | (385,400 | ) | | | (2,473,072 | ) |
| | | | | | | | | | | | | | |
Net decrease | | (9,761 | ) | | $ | (65,578 | ) | | (155,553 | ) | | $ | (917,336 | ) |
| | | | | | | | | | | | | | |
| | | | |
Class R | | | | | | | | | | | | | | |
Shares sold | | 100,441 | | | $ | 1,008,244 | | | 209,373 | | | $ | 1,750,711 | |
Shares redeemed | | (71,857 | ) | | | (701,194 | ) | | (39,506 | ) | | | (308,114 | ) |
| | | | | | | | | | | | | | |
Net increase | | 28,584 | | | $ | 307,050 | | | 169,867 | | | $ | 1,442,597 | |
| | | | | | | | | | | | | | |
| | | | |
Mid-Cap Value Equity | | | | | | | | | | | | |
Institutional | | | | | | | | | | | | | | |
Shares sold | | 3,514,641 | | | $ | 34,232,521 | | | 10,048,935 | | | $ | 75,620,286 | |
Shares issued in reinvestment of dividends and distributions | | 119,221 | | | | 1,127,827 | | | 145,437 | | | | 994,774 | |
| | | | | | | | | | | | | | |
Total issued | | 3,633,862 | | | | 35,360,348 | | | 10,194,372 | | | | 76,615,060 | |
Shares redeemed | | (7,826,493 | ) | | | (76,042,743 | )1 | | (6,725,890 | ) | | | (49,417,003 | ) |
| | | | | | | | | | | | | | |
Net increase (decrease) | | (4,192,631 | ) | | $ | (40,682,395 | ) | | 3,468,482 | | | $ | 27,198,057 | |
| | | | | | | | | | | | | | |
| 1 | Includes 5,485,998 shares redeemed in exchange for cash and securities representing redemptions-in-kind with a value of $53,214,182. |
| | | | | | |
| | | BLACKROCK FUNDS | | MARCH 31, 2010 | | 43 |
| | |
Notes to Financial Statements (continued) | | |
| | | | | | | | | | | | | | |
| | | Six Months
Ended
March 31, 2010 | | | Year Ended
September 30, 2009 | |
Mid-Cap Value Equity (concluded) | | Shares | | | Amount | | | Shares | | | Amount | |
Service | | | | | | | | | | | | | | |
Shares sold | | 21,483 | | | $ | 204,620 | | | 56,513 | | | $ | 442,216 | |
Shares issued in reinvestment of dividends and distributions | | 1,366 | | | | 12,702 | | | 2,305 | | | | 15,491 | |
| | | | | | | | | | | | | | |
Total issued | | 22,849 | | | | 217,322 | | | 58,818 | | | | 457,707 | |
Shares redeemed | | (225,689 | ) | | | (2,318,343 | ) | | (28,095 | ) | | | (219,565 | ) |
| | | | | | | | | | | | | | |
Net increase (decrease) | | (202,840 | ) | | $ | (2,101,021 | ) | | 30,723 | | | $ | 238,142 | |
| | | | | | | | | | | | | | |
| | | | |
Investor A | | | | | | | | | | | | | | |
Shares sold and automatic conversion of shares | | 5,242,443 | | | $ | 50,486,827 | | | 12,079,416 | | | $ | 86,772,872 | |
Shares issued in reinvestment of dividends and distributions | | 188,069 | | | | 1,730,241 | | | 430,408 | | | | 2,857,896 | |
| | | | | | | | | | | | | | |
Total issued | | 5,430,512 | | | | 52,217,068 | | | 12,509,824 | | | | 89,630,768 | |
Shares redeemed | | (5,984,069 | ) | | | (56,946,394 | ) | | (17,497,004 | ) | | | (126,017,711 | ) |
| | | | | | | | | | | | | | |
Net decrease | | (553,557 | ) | | $ | (4,729,326 | ) | | (4,987,180 | ) | | $ | (36,386,943 | ) |
| | | | | | | | | | | | | | |
| | | | |
Investor B | | | | | | | | | | | | | | |
Shares sold | | 19,375 | | | $ | 166,785 | | | 167,209 | | | $ | 1,079,007 | |
Shares issued in reinvestment of dividends and distributions | | — | | | | — | | | 56,009 | | | | 339,972 | |
| | | | | | | | | | | | | | |
Total issued | | 19,375 | | | | 166,785 | | | 223,218 | | | | 1,418,979 | |
Shares redeemed and automatic conversion of shares | | (1,316,466 | ) | | | (11,514,163 | ) | | (2,874,133 | ) | | | (18,976,728 | ) |
| | | | | | | | | | | | | | |
Net decrease | | (1,297,091 | ) | | $ | (11,347,378 | ) | | (2,650,915 | ) | | $ | (17,557,749 | ) |
| | | | | | | | | | | | | | |
| | | | |
Investor C | | | | | | | | | | | | | | |
Shares sold | | 804,894 | | | $ | 6,984,929 | | | 1,815,483 | | | $ | 11,964,738 | |
Shares issued in reinvestment of dividends and distributions | | — | | | | — | | | 101,409 | | | | 613,484 | |
| | | | | | | | | | | | | | |
Total issued | | 804,894 | | | | 6,984,929 | | | 1,916,892 | | | | 12,578,222 | |
Shares redeemed | | (1,399,486 | ) | | | (12,069,656 | ) | | (4,098,780 | ) | | | (26,722,177 | ) |
| | | | | | | | | | | | | | |
Net decrease | | (594,592 | ) | | $ | (5,084,727 | ) | | (2,181,888 | ) | | $ | (14,143,955 | ) |
| | | | | | | | | | | | | | |
| | | | |
Small/Mid-Cap Growth | | | | | | | | | | | | |
Institutional | | | | | | | | | | | | | | |
Shares sold | | 514,159 | | | $ | 5,569,141 | | | 558,048 | | | $ | 4,712,032 | |
Shares issued in reinvestment of dividends and distributions | | — | | | | — | | | 3,062 | | | | 23,788 | |
| | | | | | | | | | | | | | |
Total issued | | 514,159 | | | | 5,569,141 | | | 561,110 | | | | 4,735,820 | |
Shares redeemed | | (517,670 | ) | | | (5,746,805 | ) | | (877,828 | ) | | | (7,967,317 | ) |
| | | | | | | | | | | | | | |
Net decrease | | (3,511 | ) | | $ | (177,664 | ) | | (316,718 | ) | | $ | (3,231,497 | ) |
| | | | | | | | | | | | | | |
| | | | | | |
44 | | BLACKROCK FUNDS | | MARCH 31, 2010 | | |
| | |
Notes to Financial Statements (concluded) | | |
| | | | | | | | | | | | | | |
| | | Six Months
Ended
March 31, 2010 | | | Year Ended
September 30, 2009 | |
Small/Mid-Cap Growth (concluded) | | Shares | | | Amount | | | Shares | | | Amount | |
Investor A | | | | | | | | | | | | | | |
Shares sold and automatic conversion of shares | | 1,198,554 | | | $ | 12,551,360 | | | 2,987,796 | | | $ | 24,340,719 | |
Shares issued in reinvestment of dividends and distributions | | — | | | | — | | | 18,736 | | | | 136,024 | |
| | | | | | | | | | | | | | |
Total issued | | 1,198,554 | | | | 12,551,360 | | | 3,006,532 | | | | 24,476,743 | |
Shares redeemed | | (1,897,242 | ) | | | (19,744,211 | ) | | (4,384,272 | ) | | | (35,972,568 | ) |
| | | | | | | | | | | | | | |
Net decrease | | (698,688 | ) | | $ | (7,192,851 | ) | | (1,377,740 | ) | | $ | (11,495,825 | ) |
| | | | | | | | | | | | | | |
| | | | |
Investor B | | | | | | | | | | | | | | |
Shares sold | | 6,196 | | | $ | 55,568 | | | 52,647 | | | $ | 357,763 | |
Shares redeemed and automatic conversion of shares | | (139,016 | ) | | | (1,228,454 | ) | | (397,913 | ) | | | (2,721,409 | ) |
| | | | | | | | | | | | | | |
Net decrease | | (132,820 | ) | | $ | (1,172,886 | ) | | (345,266 | ) | | $ | (2,363,646 | ) |
| | | | | | | | | | | | | | |
| | | | |
Investor C | | | | | | | | | | | | | | |
Shares sold | | 67,309 | | | $ | 592,790 | | | 219,231 | | | $ | 1,529,380 | |
Shares redeemed | | (131,751 | ) | | | (1,155,409 | ) | | (412,304 | ) | | | (2,856,693 | ) |
| | | | | | | | | | | | | | |
Net decrease | | (64,442 | ) | | $ | (562,619 | ) | | (193,073 | ) | | $ | (1,327,313 | ) |
| | | | | | | | | | | | | | |
| | | | |
Class R | | | | | | | | | | | | | | |
Shares sold | | 33,703 | | | $ | 342,879 | | | 189,436 | | | $ | 1,558,929 | |
Shares issued in reinvestment of dividends and distributions | | — | | | | — | | | 166 | | | | 1,195 | |
| | | | | | | | | | | | | | |
Total issued | | 33,703 | | | | 342,879 | | | 189,602 | | | | 1,560,124 | |
Shares redeemed | | (49,755 | ) | | | (518,859 | ) | | (81,806 | ) | | | (670,651 | ) |
| | | | | | | | | | | | | | |
Net increase (decrease) | | (16,052 | ) | | $ | (175,980 | ) | | 107,796 | | | $ | 889,473 | |
| | | | | | | | | | | | | | |
There is a 2% redemption fee on shares of certain Funds that are redeemed or exchanged within 30 days of purchase. The redemption fees are collected and retained by the Funds for the benefit of its remaining shareholders. The redemption fees are recorded as a credit to paid-in capital.
9. Subsequent Events:
Management has evaluated the impact of all subsequent events on the Funds through the date the financial statements were issued and has determined that there were no subsequent events requiring adjustment or additional disclosure in the financial statements.
| | | | | | |
| | | BLACKROCK FUNDS | | MARCH 31, 2010 | | 45 |
Officers and Trustees
Ronald W. Forbes, Co-Chairman of the Board and Trustee
Rodney D. Johnson, Co-Chairman of the Board and Trustee
David O. Beim, Trustee
Richard S. Davis, Trustee
Henry Gabbay, Trustee
Dr. Matina Horner, Trustee
Herbert I. London, Trustee and Member of the Audit Committee
Cynthia A. Montgomery, Trustee
Joseph P. Platt, Jr., Trustee
Robert C. Robb, Jr., Trustee
Toby Rosenblatt, Trustee
Kenneth L. Urish, Chairman of the Audit Committee and Trustee
Frederick W. Winter, Trustee and Member of the Audit Committee
Anne F. Ackerley, President and Chief Executive Officer
Richard Hoerner, CFA, Vice President
Jeffrey Holland, CFA, Vice President
Brendan Kyne, Vice President
Simon Mendelson, Vice President
Brian Schmidt, Vice President
Christopher Stavrakos, CFA, Vice President
Neal J. Andrews, Chief Financial Officer
Jay M. Fife, Treasurer
Brian P. Kindelan, Chief Compliance Officer
Howard B. Surloff, Secretary
Investment Advisor and Co-Administrator
BlackRock Advisors, LLC
Wilmington, DE 19809
Accounting Agent, Co-Administrator and Transfer Agent
PNC Global Investment Servicing (U.S.) Inc.
Wilmington, DE 19809
Custodian
PFPC Trust Company
Philadelphia, PA 19153
Distributor
BlackRock Investments, LLC
New York, NY 10022
Legal Counsel
Sidley Austin LLP
New York, NY 10019
Independent Registered Public Accounting Firm
Deloitte & Touche LLP
Philadelphia, PA 19103
Address of the Trust
100 Bellevue Parkway
Wilmington, DE 19809
| | | | | | |
46 | | BLACKROCK FUNDS | | MARCH 31, 2010 | | |
Additional Information
General Information
Electronic Delivery
Electronic copies of most financial reports and prospectuses are available on the Fund’s website or shareholders can sign up for e-mail notifications of quarterly statements, annual and semi-annual reports and prospectuses by enrolling in the Fund’s electronic delivery program.
To enroll:
Shareholders Who Hold Accounts with Investment Advisors, Banks or Brokerages:
Please contact your financial advisor to enroll. Please note that not all investment advisors, banks or brokerages may offer this service.
Shareholders Who Hold Accounts Directly With BlackRock
| 1) | Access the BlackRock website at |
http://www.blackrock.com/ edelivery
| 2) | Select “eDelivery” under the “More Information” section |
Householding
The Funds will mail only one copy of shareholder documents, including annual and semi-annual reports and proxy statements, to shareholders with multiple accounts at the same address. This practice is commonly called “householding” and it is intended to reduce expenses and eliminate duplicate mailings of shareholder documents. Mailings of your shareholder documents may be householded indefinitely unless you instruct us otherwise. If you do not want the mailing of these documents to be combined with those for other members of your household, please contact the Funds at (800) 441-7762.
Availability of Quarterly Portfolio Schedule
The Funds file their complete schedule of portfolio holdings with the Securities and Exchange Commission (the “SEC”) for the first and third quarters of each fiscal year on Form N-Q. The Funds’ Forms N-Q are available on the SEC’s website at http://www.sec.gov and may also be reviewed and copied at the SEC’s Public Reference Room in Washington, D.C. Information on the operation of the Public Reference Room may be obtained by calling (800) SEC-0330. The Funds’ Forms N-Q may also be obtained upon request and without charge by calling (800) 441-7762.
Availability of Proxy Voting Policies and Procedures
A description of the policies and procedures that the Funds use to determine how to vote proxies relating to portfolio securities is available (1) without charge, upon request, by calling (800) 441-7762; (2) at www.blackrock.com; and (3) on the SEC’s website at http:// www.sec.gov.
Availability of Proxy Voting Record
Information about how the Funds voted proxies relating to securities held in the Funds’ portfolios during the most recent 12-month period ended June 30 is available upon request and without charge (1) at www.blackrock.com or by calling (800) 441-7762 and (2) on the SEC’s website at http://www.sec.gov.
Shareholder Privileges
Account Information
Call us at (800) 441-7762 from 8:00 AM to 6:00 PM EST on any business day to get information about your account balances, recent transactions and share prices. You can also reach us on the Web at www.blackrock.com/funds.
Automatic Investment Plans
Investor Class shareholders who want to invest regularly can arrange to have $50 or more automatically deducted from their checking or savings account and invested in any of the BlackRock funds.
Systematic Withdrawal Plan
Investor Class shareholders can establish a systematic withdrawal plan and receive periodic payments of $50 or more from their BlackRock funds, as long as their account balance is at least $10,000.
Retirement Plans
Shareholders may make investments in conjunction with Traditional, Rollover, Roth, Coverdell, Simple IRAs, SEP IRAs and 403(b) Plans.
| | | | | | |
| | | BLACKROCK FUNDS | | MARCH 31, 2010 | | 47 |
Additional Information (concluded)
BlackRock Privacy Principles
BlackRock is committed to maintaining the privacy of its current and former fund investors and individual clients (collectively, “Clients”) and to safeguarding their nonpublic personal information. The following information is provided to help you understand what personal information BlackRock collects, how we protect that information and why in certain cases we share such information with select parties.
If you are located in a jurisdiction where specific laws, rules or regulations require BlackRock to provide you with additional or different privacy-related rights beyond what is set forth below, then BlackRock will comply with those specific laws, rules or regulations.
BlackRock obtains or verifies personal nonpublic information from and about you from different sources, including the following: (i) information we receive from you or, if applicable, your financial intermediary, on applications, forms or other documents; (ii) information about your transactions with us, our affiliates, or others; (iii) information we receive from a consumer reporting agency; and (iv) from visits to our websites.
BlackRock does not sell or disclose to non-affiliated third parties any nonpublic personal information about its Clients, except as permitted by law or as is necessary to respond to regulatory requests or to service Client accounts. These non-affiliated third parties are required to protect the confidentiality and security of this information and to use it only for its intended purpose.
We may share information with our affiliates to service your account or to provide you with information about other BlackRock products or services that may be of interest to you. In addition, BlackRock restricts access to nonpublic personal information about its Clients to those BlackRock employees with a legitimate business need for the information. BlackRock maintains physical, electronic and procedural safeguards that are designed to protect the nonpublic personal information of its Clients, including procedures relating to the proper storage and disposal of such information.
| | | | | | |
48 | | BLACKROCK FUNDS | | MARCH 31, 2010 | | |
A World-Class Mutual Fund Family
BlackRock offers a diverse lineup of open-end mutual funds crossing all investment styles and managed by experts in equity, fixed income and tax-exempt investing.
| | | | |
Equity Funds | | | | |
| | |
BlackRock All-Cap Energy & Resources Portfolio | | BlackRock Global Growth Fund | | BlackRock Mid-Cap Value Equity Portfolio |
BlackRock Asset Allocation Portfolio† | | BlackRock Global Opportunities Portfolio | | BlackRock Mid Cap Value Opportunities Fund |
BlackRock Aurora Portfolio | | BlackRock Global SmallCap Fund | | BlackRock Natural Resources Trust |
BlackRock Balanced Capital Fund† | | BlackRock Health Sciences Opportunities Portfolio | | BlackRock Pacific Fund |
BlackRock Basic Value Fund | | BlackRock Healthcare Fund | | BlackRock Science & Technology |
BlackRock Capital Appreciation Portfolio | | BlackRock Index Equity Portfolio* | | Opportunities Portfolio |
BlackRock Energy & Resources Portfolio | | BlackRock International Fund | | BlackRock Small Cap Core Equity Portfolio |
BlackRock Equity Dividend Fund | | BlackRock International Index Fund | | BlackRock Small Cap Growth Equity Portfolio |
BlackRock EuroFund | | BlackRock International Opportunities Portfolio | | BlackRock Small Cap Growth Fund II |
BlackRock Focus Growth Fund | | BlackRock International Value Fund | | BlackRock Small Cap Index Fund |
BlackRock Focus Value Fund | | BlackRock Large Cap Core Fund | | BlackRock Small/Mid-Cap Growth Portfolio |
BlackRock Fundamental Growth Fund | | BlackRock Large Cap Core Plus Fund | | BlackRock S&P 500 Index Fund |
BlackRock Global Allocation Fund† | | BlackRock Large Cap Growth Fund | | BlackRock U.S. Opportunities Portfolio |
BlackRock Global Dynamic Equity Fund | | BlackRock Large Cap Value Fund | | BlackRock Utilities and Telecommunications Fund |
BlackRock Global Emerging Markets Fund | | BlackRock Latin America Fund | | BlackRock Value Opportunities Fund |
BlackRock Global Financial Services Fund | | BlackRock Mid-Cap Growth Equity Portfolio | | |
| | |
Fixed Income Funds | | | | |
| | |
BlackRock Bond Portfolio | | BlackRock Income Builder Portfolio† | | BlackRock Managed Income Portfolio |
BlackRock Emerging Market Debt Portfolio | | BlackRock Inflation Protected Bond Portfolio | | BlackRock Multi-Sector Bond Portfolio |
BlackRock GNMA Portfolio | | BlackRock Intermediate Government | | BlackRock Short-Term Bond Fund |
BlackRock Government Income Portfolio | | Bond Portfolio | | BlackRock Strategic Income Opportunities Portfolio |
BlackRock High Income Fund | | BlackRock International Bond Portfolio | | BlackRock Total Return Fund |
BlackRock High Yield Bond Portfolio | | BlackRock Long Duration Bond Portfolio | | BlackRock Total Return Portfolio II |
BlackRock Income Portfolio† | | BlackRock Low Duration Bond Portfolio | | BlackRock World Income Fund |
| | |
Municipal Bond Funds | | | | |
| | |
BlackRock AMT-Free Municipal Bond Portfolio | | BlackRock Kentucky Municipal Bond Portfolio | | BlackRock New York Municipal Bond Fund |
BlackRock California Insured Municipal Bond Fund | | BlackRock Municipal Insured Fund | | BlackRock Ohio Municipal Bond Portfolio |
BlackRock High Yield Municipal Fund | | BlackRock National Municipal Fund | | BlackRock Pennsylvania Municipal Bond Fund |
BlackRock Intermediate Municipal Fund | | BlackRock New Jersey Municipal Bond Fund | | BlackRock Short-Term Municipal Fund |
| | |
Target Risk & Target Date Funds | | | | |
| | |
BlackRock Prepared Portfolios | | BlackRock Lifecycle Prepared Portfolios | | |
Conservative Prepared Portfolio | | Prepared Portfolio 2010 | | Prepared Portfolio 2030 |
Moderate Prepared Portfolio | | Prepared Portfolio 2015 | | Prepared Portfolio 2035 |
Growth Prepared Portfolio | | Prepared Portfolio 2020 | | Prepared Portfolio 2040 |
Aggressive Growth Prepared Portfolio | | Prepared Portfolio 2025 | | Prepared Portfolio 2045 |
| | | | Prepared Portfolio 2050 |
| * | See the prospectus for information on specific limitations on investments in the fund. |
BlackRock mutual funds are distributed by BlackRock Investments, LLC. You should consider the investment objectives, risks, charges and expenses of the funds under consideration carefully before investing. Each fund’s prospectus contains this and other information and is available at www.blackrock.com or by calling (800) 441-7762 or from your financial advisor. The prospectus should be read carefully before investing.
| | | | | | |
| | | BLACKROCK FUNDS | | MARCH 31, 2010 | | 49 |
[THIS PAGE INTENTIONALLY LEFT BLANK.]
[THIS PAGE INTENTIONALLY LEFT BLANK.]

This report is transmitted to shareholders only. It is not authorized for use as an offer of sale or a solicitation of an offer to buy shares of the Funds unless accompanied or preceded by the Funds’ current prospectus. Past performance results shown in this report should not be considered a representation of future performance. Investment returns and principal value of shares will fluctuate so that shares, when redeemed, may be worth more or less than their original cost. Statements and other information herein are as dated and are subject to change.

EQUITY4-3/10-SAR
| | |
| BlackRock FundsSM | |  |
| |
| SEMI-ANNUAL REPORT | MARCH 31, 2010 (UNAUDITED) | | |
BlackRock Global Opportunities Portfolio
BlackRock Health Sciences Opportunities Portfolio
BlackRock International Opportunities Portfolio
BlackRock Science & Technology Opportunities Portfolio
BlackRock U.S. Opportunities Portfolio
NOT FDIC INSURED
MAY LOSE VALUE
NO BANK GUARANTEE
Table of Contents
| | | | | | |
2 | | BLACKROCK FUNDS | | MARCH 31, 2010 | | |
Dear Shareholder
The past year has seen a remarkable turnaround from the conditions that plagued the global economy and financial markets in 2008 through early 2009. In our opinion, the “Great Recession” likely ended at some point last summer, thanks primarily to massive fiscal and monetary stimulus. From that point, the global economy has moved into recovery mode and, we believe, is getting ready to start transitioning into an expansion.
Global equity markets bottomed in early 2009 and since that time have soared dramatically higher as investors were lured back into the markets by depressed valuations, desire for higher yields and increasing confidence that all-out financial disaster had been averted. There have been several corrections along the way and volatility levels have remained elevated — reflections of mixed economic data, lingering deflation issues (especially in Europe) and concerns over the future direction of interest rates. On balance, however, strong corporate earnings and a positive macro backdrop have helped keep the equity bull market intact. From a geographic perspective, US equities have generally outpaced their international counterparts in recent months, as the domestic economic recovery has been more pronounced.
Within fixed income markets, improving economic conditions, concerns over the US deficit and a lack of demand at recent Treasury auctions have recently conspired to push Treasury yields higher (and prices correspondingly lower). In this environment, Treasuries have dramatically underperformed other areas of the bond market, particularly the high yield sector, which has been benefiting from increased investor demand. Meanwhile, municipal bonds outperformed taxable sectors over the twelve-month period thanks to continued high demand levels, but have struggled in recent months against a weak fundamental backdrop marked by ongoing state and local budget problems. As in the taxable arena, high yield municipals have been outperforming the rest of the market.
Regarding cash investments, yields on money market securities remain near all-time lows (producing returns only marginally above zero percent), with the Federal Open Market Committee reiterating that economic circumstances are likely to necessitate an accommodative interest rate stance for an “extended period.”
Against this backdrop, the major market averages posted the following returns:
| | | | | | |
Total Returns as of March 31, 2010 | | 6-month | | | 12-month | |
US equities (S&P 500 Index) | | 11.75 | % | | 49.77 | % |
Small cap US equities (Russell 2000 Index) | | 13.07 | | | 62.76 | |
International equities (MSCI Europe, Australasia, Far East Index) | | 3.06 | | | 54.44 | |
3-month Treasury bill (BofA Merrill Lynch 3-Month Treasury Bill Index) | | 0.05 | | | 0.17 | |
US Treasury securities (BofA Merrill Lynch 10-Year US Treasury Index) | | (2.62 | ) | | (6.30 | ) |
Taxable fixed income (Barclays Capital US Aggregate Bond Index) | | 1.99 | | | 7.69 | |
Tax-exempt fixed income (Barclays Capital Municipal Bond Index) | | 0.28 | | | 9.69 | |
High yield bonds (Barclays Capital US Corporate High Yield 2% Issuer Capped Index) | | 10.97 | | | 55.64 | |
Past performance is no guarantee of future results. Index performance shown for illustrative purposes only. You cannot invest directly in an index.
Global financial markets continue to show signs of improvement, but questions about the strength and sustainability of the recovery abound. Through periods of uncertainty, as ever, BlackRock’s full resources are dedicated to the management of our clients’ assets. For additional market perspective and investment insight, visit www.blackrock.com/shareholdermagazine, where you’ll find the most recent issue of our award-winning Shareholder® magazine, as well as its quarterly companion newsletter, Shareholder Perspectives. As always, we thank you for entrusting BlackRock with your investments, and we look forward to your continued partnership in the months and years ahead.
|
| Sincerely, |
|
 |
| Rob Kapito |
| President, BlackRock Advisors, LLC |
THIS PAGE NOT PART OF YOUR FUND REPORT
| | |
| Fund Summary as of March 31, 2010 | | BlackRock Global Opportunities Portfolio |
| |
Portfolio Management Commentary | | |
How did the Fund perform?
| | • | | Effective January 1, 2010, the Fund changed its benchmark from the S&P Global Broad Market Index (BMI) to the MSCI All Country World Index (ACWI). The Fund’s investment advisor believes the MSCI ACWI is more representative of the industry standard benchmark for funds with similar strategies. |
| | • | | For the six-month period, the Fund posted positive returns, but trailed both the MSCI ACWI and its former benchmark, the S&P Global BMI. |
What factors influenced performance?
| | • | | The market’s recovery since March 2009 was initially driven by macro factors, as credit markets began to heal and the global economy emerged from recession. Over the past six months, however, leadership has been much more rotational, reminding us of the bipolar nature of the markets. Focus shifted during the period between earnings and economic recoveries and the headwinds posed by the withdrawal of monetary policy, potentially higher interest rates and taxes, and sovereign debt issues. Against this backdrop, efforts to strike the right balance between defensive and cyclical exposures negatively affected performance. That said, we believe the Fund is well positioned at this point for the sideways trading we expect to continue. |
| | • | | Relative to the benchmark, positions in financials and materials detracted most during the six months, as stocks in these sectors were subject to large swings in investor sentiment. Efforts were made to position the Fund to be less susceptible to this volatility, and while trading activity to achieve that goal hindered performance in the short-term, we expect it should yield better results going forward. Also detracting from performance was an underweight in emerging markets, which outpaced most of the developed world. Cash hampered the Fund’s results as well. |
| | • | | The Fund benefited from favorable positioning in the industrials sector, where holdings in Japanese machinery and trading companies performed well. Good results among health care holdings, particularly equipment and pharmaceutical stocks, also were additive to performance, as were positions in specialty chemicals within the otherwise disappointing materials sector. We expect that a recovery in demand and a stronger pricing environment should lead to earnings recovery and margin expansion for the sub-industry going forward. |
Describe recent portfolio activity.
| | • | | Overall, changes during the period resulted in a more balanced portfolio across cyclical growth and defensive industries. We reduced the Fund’s weighting in financials, specifically non-US banks. In the energy sector, we rotated out of coal, exploration & production, drilling and services names into major integrated oil and pipeline stocks in an effort to reduce sensitivity to commodities prices. Pharmaceuticals exposure was trimmed toward the end of the period on concerns about the earnings impact of health care reform for a group that already has low growth expectations. Finally, we increased exposure to industrials, technology equipment and chemicals. |
Describe Fund positioning at period end.
| | • | | At period end, the Fund was balanced across both defensive and cyclical industries, a positioning we expect to maintain, pending evidence of a sustainable recovery. The Fund’s largest overweights relative to the MSCI ACWI were in information technology and industrials, particularly Japanese capital goods stocks. Financials accounted for the most notable underweight, which was more pronounced outside the US. Regionally, we remain somewhat underweight in emerging markets, although many of our developed market holdings have significant exposure to sources of demand in those economies. |
The views expressed reflect the opinions of BlackRock as of the date of this report and are subject to change based on changes in market, economic or other conditions. These views are not intended to be a forecast of future events and are no guarantee of future results.
Portfolio Information
| | | |
Ten Largest Holdings | | Percent of
Long-Term
Investments | |
General Electric Co. | | 2 | % |
Microsoft Corp. | | 1 | |
Exxon Mobil Corp. | | 1 | |
Royal Dutch Shell Plc - A Shares | | 1 | |
United Parcel Service, Inc. - Class B | | 1 | |
Honda Motor Co. Ltd. | | 1 | |
GlaxoSmithKline Plc | | 1 | |
Siemens AG | | 1 | |
Novartis AG | | 1 | |
Deere & Co. | | 1 | |
| | | |
Geographic Allocation | | Percent of
Long-Term
Investments | |
United States | | 50 | % |
Japan | | 8 | |
United Kingdom | | 6 | |
Canada | | 4 | |
Germany | | 4 | |
France | | 3 | |
Switzerland | | 3 | |
Brazil | | 2 | |
Netherlands | | 2 | |
South Korea | | 2 | |
Spain | | 2 | |
Other1 | | 14 | |
| 1 | Other includes a 1% holding in each of the following countries: Australia, Belgium, Bermuda, China, Finland, Hong Kong, India, Ireland, Israel, Italy, Luxembourg, Singapore, Sweden and Taiwan. |
| | | | | | |
4 | | BLACKROCK FUNDS | | MARCH 31, 2010 | | |
BlackRock Global Opportunities Portfolio
Total Return Based on a $10,000 Investment
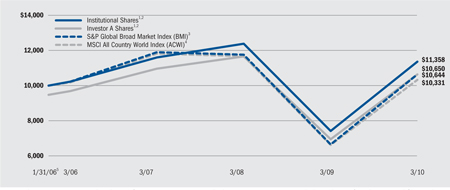
| 1 | Assuming maximum sales charge, if any, transaction costs and other operating expenses, including advisory fees. Institutional Shares do not have a sales charge. |
| 2 | The Fund will invest, under normal market conditions, at least 40% of its total assets in issuers located outside of the US. The Fund may invest up to 25% of its total assets in stocks of issuers in emerging market countries. The Fund may also invest up to 25% of its total assets in global fixed income securities, including emerging market debt. |
| 3 | The all-encompassing S&P Global index is known as the S&P Global Broad Market Index (BMI). The BMI measures the performance of the entire universe of investable securities greater than USD 100 million. The BMI is segmented into two size components: the Primary Market Index (PMI) and the Extended Market Index (EMI). The PMI defines the large-cap universe, representing the top 80% of BMI market capitalization for each listed country. The EMI defines the small-cap universe for each country, representing the remaining 20%. |
| 4 | This unmanaged market capitalization-weighted index made up of equities from 23 countries, including the United States. The Fund now uses this index as its benchmark rather than the S&P Global Broad Market Index (BMI) because Fund management believes it is more representative of the industry standard benchmark for funds with similar strategies. |
| 5 | Commencement of operations. |
Performance Summary for the Period Ended March 31, 2010
| | | | | | | | | | | | | | | |
| | | | | | Average Annual Total Returns6 | |
| | | | | | 1 Year | | | Since Inception7 | |
| | | 6-Month
Total Returns | | | w/o sales
charge | | �� | w/ sales
charge | | | w/o sales
charge | | | w/ sales
charge | |
Institutional | | 5.52 | % | | 52.70 | % | | N/A | | | 3.11 | % | | N/A | |
Investor A | | 5.32 | | | 52.75 | | | 44.63 | % | | 2.82 | | | 1.51 | % |
Investor B | | 5.00 | | | 52.66 | | | 48.16 | | | 2.13 | | | 1.68 | |
Investor C | | 5.04 | | | 52.63 | | | 51.63 | | | 2.11 | | | 2.11 | |
S&P Global Broad Market Index (BMI) | | 8.52 | | | 59.57 | | | N/A | | | 1.52 | | | N/A | |
MSCI All Country World Index (ACWI) | | 7.90 | | | 55.48 | | | N/A | | | 0.78 | | | N/A | |
| 6 | Assuming maximum sales charges, if any. Average annual total returns with and without sales charges reflect reductions for distribution and service fees. See “About Fund Performance” on page 14 for a detailed description of share classes, including any related sales charges and fees. |
| 7 | The Fund commenced operations on January 31, 2006. |
N/A - Not applicable as share class and index do not have a sales charge.
Past performance is not indicative of future results.
Expense Example
| | | | | | | | | | | | | | | | | | |
| | | Actual | | Hypothetical9 |
| | | Beginning
Account Value
October 1, 2009 | | Ending
Account Value
March 31, 2010 | | Expenses Paid
During the Period8 | | Beginning
Account Value
October 1, 2009 | | Ending
Account Value
March 31, 2010 | | Expenses Paid
During the Period8 |
Institutional | | $ | 1,000 | | $ | 1,055.20 | | $ | 6.97 | | $ | 1,000 | | $ | 1,018.15 | | $ | 6.84 |
Investor A | | $ | 1,000 | | $ | 1,053.20 | | $ | 8.45 | | $ | 1,000 | | $ | 1,016.70 | | $ | 8.30 |
Investor B | | $ | 1,000 | | $ | 1,050.00 | | $ | 12.32 | | $ | 1,000 | | $ | 1,012.91 | | $ | 12.09 |
Investor C | | $ | 1,000 | | $ | 1,050.40 | | $ | 12.32 | | $ | 1,000 | | $ | 1,012.91 | | $ | 12.09 |
| 8 | For each class of the Fund, expenses are equal to the annualized expense ratio for the class (1.36% for Institutional, 1.65% for Investor A, 2.41% for Investor B and 2.41% for Investor C), multiplied by the average account value over the period, multiplied by 182/365 (to reflect the one-half year period shown). |
| 9 | Hypothetical 5% annual return before expenses is calculated by pro rating the number of days in the most recent fiscal half-year divided by 365. See “Disclosure of Expenses” on page 15 for further information on how expenses were calculated. |
| | | | | | |
| | | BLACKROCK FUNDS | | MARCH 31, 2010 | | 5 |
| | |
| Fund Summary as of March 31, 2010 | | BlackRock Health Sciences Opportunities Portfolio |
| |
Portfolio Management Commentary | | |
How did the Fund perform?
| | • | | The Fund outperformed the Russell 3000 Health Care Index and the broad-market S&P 500 Index for the six-month period. |
What factors influenced performance?
| | • | | Our positioning in the medical devices and supplies sub-sector added most meaningfully to outperformance during the reporting period. The following discussion of relative performance pertains to the Russell 3000 Health Care Index. Life sciences tools companies were particularly strong for us, as were eye care supply and capital equipment holdings. Biotechnology was another source of strength on favorable pipeline results and acquisitions among smaller-cap holdings, as well as limited exposure to several large-cap names that delivered disappointing results over the six months. |
| | • | | In contrast, health care services results were weaker. As it became clear that the worst-case outcomes of health care reform would not be realized, many companies in this sub-sector rallied strongly, and Fund holdings were not able to keep pace. In particular, managed care stocks gained significantly during the period and we were underexposed to some of the best performers. Pharmaceuticals positioning was mixed and overall hampered results somewhat. Cash hindered Fund returns to some extent as well. |
Describe recent portfolio activity.
| | • | | During the six months, the Fund’s portfolio added to health care equipment stocks, which we believe offer attractive growth prospects, sustainable cash flows and will not be meaningfully affected by health care reform. The Fund also increased exposure to health care distributors and generic drug stocks. The Fund’s pharmaceuticals weight declined on concerns that the fee impact from health care reform will be meaningful relative to earnings expectations in the next few years, and biotechnology exposure fell as a result of company-specific trading decisions. |
Describe Fund positioning at period end.
| | • | | At period end, the Fund was relatively in line with the Russell 3000 Health Care Index in health care services, with a modest underweight in managed care and biotechnology. The Fund’s most meaningful overweights were in health care equipment and life sciences tools, while the Fund continues to be significantly underweight in pharmaceuticals, which make up more than 40% of the benchmark. |
The views expressed reflect the opinions of BlackRock as of the date of this report and are subject to change based on changes in market, economic or other conditions. These views are not intended to be a forecast of future events and are no guarantee of future results.
Portfolio Information
| | | |
Ten Largest Holdings | | Percent of
Long-Term
Investments | |
Johnson & Johnson | | 3 | % |
Stryker Corp. | | 3 | |
Novartis AG | | 3 | |
AmerisourceBergen Corp. | | 2 | |
Bristol-Myers Squibb Co. | | 2 | |
Thermo Fisher Scientific, Inc. | | 2 | |
Cephalon, Inc. | | 2 | |
Amgen, Inc. | | 2 | |
Teva Pharmaceutical Industries Ltd. - ADR | | 2 | |
Medco Health Solutions, Inc. | | 2 | |
| | | |
Industry Allocation | | Percent of
Long-Term
Investments | |
Health Care Equipment & Supplies | | 30 | % |
Pharmaceuticals | | 23 | |
Health Care Providers & Services | | 18 | |
Biotechnology | | 16 | |
Life Sciences Tools & Services | | 9 | |
Health Care Technology | | 2 | |
Industrial Conglomerates | | 1 | |
Electronic Equipment, Instruments & Components | | 1 | |
For Fund compliance purposes, the Fund’s industry classifications refer to any one or more of the industry sub-classifications used by one or more widely recognized market indexes or ratings group indexes, and/or as defined by Fund management. This definition may not apply for purposes of this report, which may combine industry sub-classifications for reporting ease.
| | | | | | |
6 | | BLACKROCK FUNDS | | MARCH 31, 2010 | | |
| | |
| | BlackRock Health Sciences Opportunities Portfolio |
| |
Total Return Based on a $10,000 Investment | | |
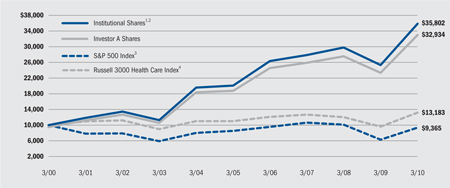
| 1 | Assuming maximum sales charge, if any, transaction costs and other operating expenses, including advisory fees. Institutional Shares do not have a sales charge. |
| 2 | Under normal market conditions, the Fund invests at least 80% of its total assets in securities of companies in health sciences and related industries. |
| 3 | This unmanaged total return index covers 500 industrial, utility, transportation and financial companies of the US markets (mostly New York Stock Exchange (“NYSE”) issues) representing about 75% of NYSE market capitalization and 30% of NYSE issues. S&P 500 is a trademark of the McGraw-Hill Companies. |
| 4 | An unmanaged index representative of companies involved in medical services or health care in the Russell 3000 Index, which is comprised of the 3,000 largest US companies as determined by total market capitalization. |
Performance Summary for the Period Ended March 31, 2010
| | | | | | | | | | | | | | | | | | | | | |
| | | | | | Average Annual Total Returns5 | |
| | | | | | 1 Year | | | 5 Years | | | 10 Years | |
| | | 6-Month
Total Returns | | | w/o sales
charge | | | w/ sales
charge | | | w/o sales
charge | | | w/ sales
charge | | | w/o sales
charge | | | w/ sales
charge | |
Institutional | | 14.42 | % | | 41.55 | % | | N/A | | | 12.29 | % | | N/A | | | 13.60 | % | | N/A | |
Service | | 14.22 | | | 41.14 | | | N/A | | | 11.97 | | | N/A | | | 13.30 | | | N/A | |
Investor A | | 14.25 | | | 41.11 | | | 33.71 | % | | 11.93 | | | 10.73 | % | | 13.27 | | | 12.66 | % |
Investor B | | 13.77 | | | 39.91 | | | 35.41 | | | 11.02 | | | 10.76 | | | 12.58 | | | 12.58 | |
Investor C | | 13.83 | | | 40.09 | | | 39.09 | | | 11.12 | | | 11.12 | | | 12.48 | | | 12.48 | |
S&P 500 Index | | 11.75 | | | 49.77 | | | N/A | | | 1.92 | | | N/A | | | (0.65 | ) | | N/A | |
Russell 3000 Health Care Index | | 13.22 | | | 37.34 | | | N/A | | | 3.69 | | | N/A | | | 2.80 | | | N/A | |
| 5 | Assuming maximum sales charges, if any. Average annual total returns with and without sales charges reflect reductions for distribution and service fees. See “About Fund Performance” on page 14 for a detailed description of share classes, including any related sales charges and fees. |
N/A - Not applicable as share class and index do not have a sales charge.
Past performance is not indicative of future results.
Expense Example
| | | | | | | | | | | | | | | | | | |
| | | Actual | | Hypothetical7 |
| | | Beginning
Account Value
October 1, 2009 | | Ending
Account Value
March 31, 2010 | | Expenses Paid
During the Period6 | | Beginning
Account Value
October 1, 2009 | | Ending
Account Value
March 31, 2010 | | Expenses Paid
During the Period6 |
Institutional | | $ | 1,000 | | $ | 1,144.20 | | $ | 5.29 | | $ | 1,000 | | $ | 1,020.00 | | $ | 4.99 |
Service | | $ | 1,000 | | $ | 1,142.20 | | $ | 6.89 | | $ | 1,000 | | $ | 1,018.50 | | $ | 6.49 |
Investor A | | $ | 1,000 | | $ | 1,142.50 | | $ | 6.89 | | $ | 1,000 | | $ | 1,018.50 | | $ | 6.49 |
Investor B | | $ | 1,000 | | $ | 1,137.70 | | $ | 11.30 | | $ | 1,000 | | $ | 1,014.36 | | $ | 10.65 |
Investor C | | $ | 1,000 | | $ | 1,138.30 | | $ | 10.82 | | $ | 1,000 | | $ | 1,014.81 | | $ | 10.20 |
| 6 | For each class of the Fund, expenses are equal to the annualized expense ratio for the class (0.99% for Institutional, 1.29% for Service, 1.29% for Investor A, 2.12% for Investor B and 2.03% for Investor C), multiplied by the average account value over the period, multiplied by 182/365 (to reflect the one-half year period shown). |
| 7 | Hypothetical 5% annual return before expenses is calculated by pro rating the number of days in the most recent fiscal half-year divided by 365. See “Disclosure of Expenses” on page 15 for further information on how expenses were calculated. |
| | | | | | |
| | | BLACKROCK FUNDS | | MARCH 31, 2010 | | 7 |
| | |
| Fund Summary as of March 31, 2010 | | BlackRock International Opportunities Portfolio |
| |
Portfolio Management Commentary | | |
How did the Fund perform?
| | • | | Effective January 1, 2010, the Fund changed its benchmark from the S&P Global Ex-US Broad Market Index (BMI) to the MSCI All Country World Index (ACWI) Ex-US. The Fund’s investment advisor believes the MSCI ACWI Ex-US is more representative of the industry standard benchmark for funds with similar strategies. |
| | • | | For the six-month period, the Fund posted positive returns, but trailed both the MSCI ACWI Ex-US and its former benchmark, the S&P Global Ex-US BMI. |
What factors influenced performance?
| | • | | The market’s recovery since March 2009 was initially driven by macro factors, as credit markets began to heal and the global economy emerged from recession. Over the past six months, however, leadership has been much more rotational, reminding us of the bipolar nature of the markets. Focus shifted during the period between earnings and economic recoveries and the headwinds posed by the withdrawal of monetary policy, potentially higher interest rates and taxes, and sovereign debt issues. Against this backdrop, efforts to strike the right balance between defensive and cyclical exposures negatively affected performance. That said, we believe the Fund is well positioned at this point for the sideways trading we expect to continue. |
| | • | | Relative to the benchmark, positions in financials and materials detracted most during the six months, as stocks in these sectors were subject to large swings in investor sentiment. Efforts were made to position the Fund to be less susceptible to this volatility, and while trading activity to achieve that goal hindered performance in the short term, we expect it should yield better results going forward. Also detracting from performance was an underweight in emerging markets, which outpaced most of the developed world. Cash hampered the Fund’s results as well. |
| | • | | The Fund benefited from favorable positioning in the industrials sector, where holdings in Japanese machinery and trading companies performed well. In addition, our constructive view on airlines, supported by improvements in freight and passenger volumes and reduced capacity, began to work in the Fund’s favor. Specialty chemicals also contributed within the otherwise disappointing materials sector. We expect that a recovery in demand and a stronger pricing environment should lead to earnings recovery and margin expansion for the sub-industry going forward. |
Describe recent portfolio activity.
| | • | | Overall, changes during the period resulted in a Fund more balanced across cyclical growth and defensive industries. We reduced the Fund’s weighting in financials, specifically banks. In the energy sector, we rotated out of exploration & production, drilling and services names into major integrated oil stocks in an effort to reduce sensitivity to commodities prices. We also increased the Fund’s exposure to industrials, technology equipment and chemicals. |
Describe Fund positioning at period end.
| | • | | At period end, the Fund was balanced across both defensive and cyclical industries, a positioning we expect to maintain, pending evidence of a sustainable recovery. The Fund’s largest overweight relative to the MSCI ACWI Ex-US was in industrials, particularly airlines and Japanese capital goods stocks. The Fund’s most notable underweight was in financials, due to our cautious positioning in banks. Regionally, we remain somewhat underweight in emerging markets, although many of our developed market holdings have significant exposure to sources of demand in those economies. |
The views expressed reflect the opinions of BlackRock as of the date of this report and are subject to change based on changes in market, economic or other conditions. These views are not intended to be a forecast of future events and are no guarantee of future results.
Portfolio Information
| | | |
Ten Largest Holdings | | Percent of
Long-Term
Investments | |
Novartis AG | | 2 | % |
Royal Dutch Shell Plc - A Shares | | 2 | |
Total SA | | 1 | |
BP Plc | | 1 | |
BG Group Plc | | 1 | |
Honda Motor Co. Ltd. | | 1 | |
Siemens AG | | 1 | |
Imperial Tobacco Group Plc | | 1 | |
Nestle SA | | 1 | |
Roche Holding AG | | 1 | |
| | | |
Geographic Allocation | | Percent of
Long-Term
Investments | |
Japan | | 16 | % |
United Kingdom | | 14 | |
Switzerland | | 9 | |
Canada | | 7 | |
Germany | | 7 | |
France | | 6 | |
Brazil | | 3 | |
Italy | | 3 | |
Netherlands | | 3 | |
South Korea | | 3 | |
Taiwan | | 3 | |
Other1 | | 26 | |
| 1 | Other includes a 2% holding in each of the following countries: Australia, China, Denmark, Hong Kong, India, Singapore, Spain and United States and a 1% holding in each of the following countries: Belgium, Bermuda, Finland, Israel, Luxembourg, Malaysia, Mexico, South Africa, Sweden and Thailand. |
| | | | | | |
8 | | BLACKROCK FUNDS | | MARCH 31, 2010 | | |
| | |
| | BlackRock International Opportunities Portfolio |
| |
Total Return Based on a $10,000 Investment | | |
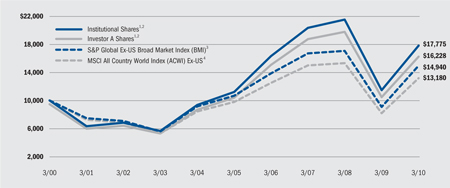
| 1 | Assuming maximum sales charge, if any, transaction costs and other operating expenses, including advisory fees. Institutional Shares do not have a sales charge. |
| 2 | The Fund, under normal market conditions, invests at least 80% of its net assets in equity securities issued by international companies of any market capitalization. |
| 3 | S&P Global Ex-US Broad Market Index (BMI) is an available market capitalization weighted equity index made up of 52 global developed and emerging markets, not including the US. The BMI is segmented into two size components: the S&P LargeMidCap Index and the S&P SmallCap Index. |
| 4 | This market capitalization weighted index is designed to provide a broad measure of stock performance throughout the world, with the exception of US-based companies. The index includes both developed and emerging markets. The Fund now uses this index as its benchmark rather than the S&P Global Ex-US Broad Market Index (BMI) because Fund management believes it is more representative of the industry standard benchmark for funds with similar strategies. |
Performance Summary for the Period Ended March 31, 2010
| | | | | | | | | | | | | | | | | | | | | |
| | | | | | Average Annual Total Returns5 | |
| | | | | | 1 Year | | | 5 Years | | | 10 Years | |
| | | 6-Month
Total Returns | | | w/o sales
charge | | | w/ sales
charge | | | w/o sales
charge | | | w/ sales
charge | | | w/o sales
charge | | | w/ sales
charge | |
Institutional | | 3.21 | % | | 55.23 | % | | N/A | | | 9.63 | % | | N/A | | | 5.92 | % | | N/A | |
Service | | 3.02 | | | 54.71 | | | N/A | | | 9.29 | | | N/A | | | 5.59 | | | N/A | |
Investor A | | 3.10 | | | 54.91 | | | 46.76 | % | | 9.29 | | | 8.12 | % | | 5.53 | | | 4.96 | % |
Investor B | | 2.65 | | | 53.68 | | | 49.18 | | | 8.43 | | | 8.14 | | | 4.89 | | | 4.89 | |
Investor C | | 2.70 | | | 53.67 | | | 52.67 | | | 8.46 | | | 8.46 | | | 4.74 | | | 4.74 | |
S&P Global Ex-US Broad Market Index (BMI) | | 5.94 | | | 64.29 | | | N/A | | | 6.92 | | | N/A | | | 4.10 | | | N/A | |
MSCI All Country World Index (ACWI) Ex-US | | 5.38 | | | 60.93 | | | N/A | | | 6.11 | | | N/A | | | 2.80 | | | N/A | |
| 5 | Assuming maximum sales charges, if any. Average annual total returns with and without sales charges reflect reductions for distribution and service fees. See “About Fund Performance” on page 14 for a detailed description of share classes, including any related sales charges and fees. |
N/A - Not applicable as share class and index do not have a sales charge.
Past performance is not indicative of future results.
Expense Example
| | | | | | | | | | | | | | | | | | |
| | | Actual | | Hypothetical7 |
| | | Beginning
Account Value
October 1, 2009 | | Ending
Account Value
March 31, 2010 | | Expenses Paid
During the Period6 | | Beginning
Account Value
October 1, 2009 | | Ending
Account Value
March 31, 2010 | | Expenses Paid
During the Period6 |
Institutional | | $ | 1,000 | | $ | 1,032.10 | | $ | 6.59 | | $ | 1,000 | | $ | 1,018.45 | | $ | 6.54 |
Service | | $ | 1,000 | | $ | 1,030.20 | | $ | 8.66 | | $ | 1,000 | | $ | 1,016.40 | | $ | 8.60 |
Investor A | | $ | 1,000 | | $ | 1,031.00 | | $ | 7.80 | | $ | 1,000 | | $ | 1,017.25 | | $ | 7.75 |
Investor B | | $ | 1,000 | | $ | 1,026.50 | | $ | 12.08 | | $ | 1,000 | | $ | 1,013.01 | | $ | 11.99 |
Investor C | | $ | 1,000 | | $ | 1,027.00 | | $ | 11.72 | | $ | 1,000 | | $ | 1,013.36 | | $ | 11.65 |
| 6 | For each class of the Fund, expenses are equal to the annualized expense ratio for the class (1.30% for Institutional, 1.71% for Service, 1.54% for Investor A, 2.39% for Investor B and 2.32% for Investor C), multiplied by the average account value over the period, multiplied by 182/365 (to reflect the one-half year period shown). |
| 7 | Hypothetical 5% annual return before expenses is calculated by pro rating the number of days in the most recent fiscal half-year divided by 365. See “Disclosure of Expenses” on page 15 for further information on how expenses were calculated. |
| | | | | | |
| | | BLACKROCK FUNDS | | MARCH 31, 2010 | | 9 |
| | |
| Fund Summary as of March 31, 2010 | | BlackRock Science & Technology Opportunities Portfolio |
| |
Portfolio Management Commentary | | |
How did the Fund perform?
| | • | | The Fund generated strong returns for the six-month period, but trailed the benchmark NYSE Arca Tech 100 Index. |
What factors influenced performance?
| | • | | On the positive side, the Fund benefited from strong stock selection across the semiconductors and semiconductor equipment sub-industries. In addition, our IT software and services group positioning was favorable, fueled by internet and application software stocks. Finally, electronic equipment and component holdings were also positive contributors to the Fund’s relative results. |
| | • | | Detractors from performance within IT came primarily from communications equipment, where the Fund’s mobile handset and component holdings suffered in comparison to network equipment stocks. Outside of IT, the Fund’s underweight in the health care sector was a hindrance throughout the past six months, in part due to the anticipation and passage of US health care reform, which removed much of the headline volatility that had plagued the sector for well over a year. Underweighting industrial stocks also negatively affected performance, as did holding cash during a period of strong gains in stock prices. |
Describe recent portfolio activity.
| | • | | While we continue to favor IT industries over the more defensive health care exposures in the benchmark, our health care weight in the Fund has grown over the time period, with additions to health care equipment and life sciences tools and services. Across IT, positioning changes were stock-specific in nature and did not materially alter the stance of the Fund from the start of the time period. |
Describe Fund positioning at period end.
| | • | | At period end, health care remains a meaningful underweight relative to the NYSE Arca Tech 100 Index, with just over a 7% weighting in the Fund. From an IT sub-industry standpoint, semiconductors remain the largest overweight, followed by systems software, internet software and services and electronic components. In contrast, we remain underweight in capital goods, as well as communications equipment and data processing and outsourced services. |
The views expressed reflect the opinions of BlackRock as of the date of this report and are subject to change based on changes in market, economic or other conditions. These views are not intended to be a forecast of future events and are no guarantee of future results.
Portfolio Information
| | | |
Ten Largest Holdings | | Percent of
Long-Term
Investments | |
Apple, Inc. | | 6 | % |
Hewlett-Packard Co. | | 4 | |
Microsoft Corp. | | 3 | |
Intel Corp. | | 3 | |
Google, Inc. - Class A | | 3 | |
Cisco Systems, Inc. | | 3 | |
International Business Machines Corp. | | 3 | |
Oracle Corp. | | 2 | |
QUALCOMM, Inc. | | 2 | |
Texas Instruments, Inc. | | 2 | |
| | | |
Industry Allocation | | Percent of
Long-Term
Investments | |
Semiconductors & Semiconductor Equipment | | 20 | % |
Software | | 20 | |
Computers & Peripherals | | 18 | |
Communications Equipment | | 11 | |
Internet Software & Services | | 8 | |
Electronic Equipment, Instruments & Components | | 5 | |
IT Services | | 5 | |
Health Care Equipment & Supplies | | 4 | |
Diversified Telecommunication Services | | 2 | |
Other1 | | 7 | |
| 1 | Other includes a 1% holding in each of the following industries: Biotechnology, Building Products, Internet & Catalog Retail, Life Sciences Tools & Services, Office Electronics, Pharmaceuticals and Wireless Telecommunication Services. |
For Fund compliance purposes, the Fund’s industry classifications refer to any one or more of the industry sub-classifications used by one or more widely recognized market indexes or ratings group indexes, and/or as defined by Fund management. This definition may not apply for purposes of this report, which may combine industry sub-classifications for reporting ease.
| | | | | | |
10 | | BLACKROCK FUNDS | | MARCH 31, 2010 | | |
| | |
| | BlackRock Science & Technology Opportunities Portfolio |
| |
Total Return Based on a $10,000 Investment | | |

| 1 | Assuming maximum sales charge, if any, transaction costs and other operating expenses, including advisory fees. Institutional Shares do not have a sales charge. |
| 2 | The Fund will invest primarily in equity securities of US and non-US companies in all capitalization ranges selected for their rapid and sustainable growth potential from the development, advancement and use of science and/or technology. |
| 3 | A price-weighted index comprised of not more than 100 individual stocks listed on the NYSE, AMEX or NASDAQ. The index is modeled to represent a broad spectrum of companies engaged principally in manufacturing products and/or providing services within technology fields. |
| 4 | Commencement of operations. |
Performance Summary for the Period Ended March 31, 2010
| | | | | | | | | | | | | | | | | | | | | |
| | | | | | Average Annual Total Returns5 | |
| | | | | | 1 Year | | | 5 Years | | | Since Inception6 | |
| | | 6-Month
Total Returns | | | w/o sales
charge | | | w/ sales
charge | | | w/o sales
charge | | | w/ sales
charge | | | w/o sales
charge | | | w/ sales
charge | |
Institutional | | 12.32 | % | | 59.09 | % | | N/A | | | 9.14 | % | | N/A | | | (1.34 | )% | | N/A | |
Service | | 12.17 | | | 58.51 | | | N/A | | | 8.73 | | | N/A | | | (1.66 | ) | | N/A | |
Investor A | | 12.17 | | | 58.60 | | | 50.36 | % | | 8.69 | | | 7.52 | % | | (1.76 | ) | | (2.29 | )% |
Investor B | | 11.67 | | | 57.20 | | | 52.70 | | | 7.77 | | | 7.48 | | | (2.38 | ) | | (2.38 | ) |
Investor C | | 11.53 | | | 57.00 | | | 56.00 | | | 7.75 | | | 7.75 | | | (2.56 | ) | | (2.56 | ) |
Class R | | 12.05 | | | 58.14 | | | N/A | | | 8.31 | | | N/A | | | (2.10 | ) | | N/A | |
NYSE Arca Tech 100 Index | | 12.61 | | | 52.55 | | | N/A | | | 5.70 | | | N/A | | | (0.53 | ) | | N/A | |
| 5 | Assuming maximum sales charges, if any. Average annual total returns with and without sales charges reflect reductions for distribution and service fees. See “About Fund Performance” on page 14 for a detailed description of share classes, including any related sales charges and fees. |
| 6 | The Fund commenced operations on May 15, 2000. |
N/A - Not applicable as share class and index do not have a sales charge.
Past performance is not indicative of future results.
Expense Example
| | | | | | | | | | | | | | | | | | |
| | | Actual | | Hypothetical8 |
| | | Beginning
Account Value
October 1, 2009 | | Ending
Account Value
March 31, 2010 | | Expenses Paid
During the Period7 | | Beginning
Account Value
October 1, 2009 | | Ending
Account Value
March 31, 2010 | | Expenses Paid
During the Period7 |
Institutional | | $ | 1,000 | | $ | 1,123.20 | | $ | 7.36 | | $ | 1,000 | | $ | 1,018.00 | | $ | 6.99 |
Service | | $ | 1,000 | | $ | 1,121.70 | | $ | 9.15 | | $ | 1,000 | | $ | 1,016.31 | | $ | 8.70 |
Investor A | | $ | 1,000 | | $ | 1,121.70 | | $ | 9.47 | | $ | 1,000 | | $ | 1,016.01 | | $ | 9.00 |
Investor B | | $ | 1,000 | | $ | 1,116.70 | | $ | 14.30 | | $ | 1,000 | | $ | 1,011.42 | | $ | 13.59 |
Investor C | | $ | 1,000 | | $ | 1,115.30 | | $ | 14.34 | | $ | 1,000 | | $ | 1,011.37 | | $ | 13.64 |
Class R | | $ | 1,000 | | $ | 1,120.50 | | $ | 11.05 | | $ | 1,000 | | $ | 1,014.51 | | $ | 10.50 |
| 7 | For each class of the Fund, expenses are equal to the annualized expense ratio for the class (1.39% for Institutional, 1.73% for Service, 1.79% for Investor A, 2.71% for Investor B, 2.72% for Investor C and 2.09% for Class R), multiplied by the average account value over the period, multiplied by 182/365 (to reflect the one-half year period shown). |
| 8 | Hypothetical 5% annual return before expenses is calculated by pro rating the number of days in the most recent fiscal half-year divided by 365. See “Disclosure of Expenses” on page 15 for further information on how expenses were calculated. |
| | | | | | |
| | | BLACKROCK FUNDS | | MARCH 31, 2010 | | 11 |
| | |
| Fund Summary as of March 31, 2010 | | BlackRock U.S. Opportunities Portfolio |
| |
Portfolio Management Commentary | | |
How did the Fund perform?
| | • | | Effective January 1, 2010, the Fund changed its benchmark from the S&P US MidSmall Cap Index to the Russell Midcap Index. The Fund’s investment advisor believes the Russell Midcap Index is more representative of the industry standard benchmark for funds with similar strategies. |
| | • | | For the six-month period, the Fund posted strong results, but underperformed both the Russell Midcap Index and its former benchmark, the S&P US MidSmall Cap Index. |
What factors influenced performance?
| | • | | The market’s recovery since March 2009 was initially driven by macro factors, as credit markets began to heal and the global economy emerged from recession. Over the past six months, however, leadership has been much more rotational, reminding us of the bipolar nature of the markets. Focus shifted during the period between earnings and economic recoveries and the headwinds posed by the withdrawal of monetary policy, potentially higher interest rates and taxes, and sovereign debt issues. Against this backdrop, efforts to strike the right balance between defensive and cyclical exposures negatively affected performance. That said, we believe the Fund is well positioned at this point for the sideways trading we expect to continue. |
| | • | | Relative to the benchmark, positions in industrials and energy detracted most during the six months, as stocks in these sectors were subject to large swings in investor sentiment. Efforts were made to position the Fund to be less susceptible to this volatility, and while trading activity to achieve that goal hindered performance in the short term, we expect it should yield better results going forward. Our view that Japanese and German industrial stocks were best positioned and cheapest globally was correct; however, US industrials continued to outperform the market as well, and our more cautious positioning in this area hurt relative performance comparisons. Within the energy sector, our exploration & production (E&P) holdings were the biggest source of weakness. Cash also detracted from the Fund’s performance. |
| | • | | The Fund’s health care exposure contributed positively to results, primarily due to holdings in biotechnology, life science tools and generic pharmaceutical companies. Positions in chemical and fertilizer stocks also yielded favorable results within the materials sector. |
Describe recent portfolio activity.
| | • | | Overall, changes made during the period resulted in a Fund more balanced across cyclical growth and defensive industries. We trimmed the Fund’s weighting in financials, specifically within insurance and real estate. In the energy sector, we reduced positions in coal miners, E&P, drilling and services names, effectively reducing beta, while also trimming positions in industrials. Meanwhile, we increased exposure to information technology and health care. Within the materials sector, we added to chemicals, packaging and forest products. |
Describe Fund positioning at period end.
| | • | | At period end, the Fund was balanced across both defensive and cyclical industries, a positioning we expect to maintain, pending evidence of a sustainable recovery. Relative to the Russell Midcap Index, the Fund’s largest sector overweights were in materials, particularly chemicals, and information technology, with an emphasis on equipment. Underweights were most notable in financials and energy. |
The views expressed reflect the opinions of BlackRock as of the date of this report and are subject to change based on changes in market, economic or other conditions. These views are not intended to be a forecast of future events and are no guarantee of future results.
Portfolio Information
| | | |
Ten Largest Holdings | | Percent of
Long-Term
Investments | |
Joy Global, Inc. | | 1 | % |
Fortune Brands, Inc. | | 1 | |
Rockwell Collins, Inc. | | 1 | |
Goodrich Corp. | | 1 | |
VF Corp. | | 1 | |
Snap-On, Inc. | | 1 | |
Comerica, Inc. | | 1 | |
The Lubrizol Corp. | | 1 | |
Owens-Illinois, Inc. | | 1 | |
NV Energy, Inc. | | 1 | |
| | | |
Sector Allocation | | Percent of
Long-Term
Investments | |
Information Technology | | 18 | % |
Consumer Discretionary | | 17 | |
Financials | | 17 | |
Industrials | | 10 | |
Materials | | 10 | |
Health Care | | 10 | |
Consumer Staples | | 6 | |
Utilities | | 6 | |
Energy | | 4 | |
Telecommunication Services | | 2 | |
For Fund compliance purposes, the Fund’s sector classifications refer to any one or more of the sector sub-classifications used by one or more widely recognized market indexes or ratings group indexes, and/or as defined by Fund management. This definition may not apply for purposes of this report, which may combine sector sub-classifications for reporting ease.
| | | | | | |
12 | | BLACKROCK FUNDS | | MARCH 31, 2010 | | |
| | |
| | BlackRock U.S. Opportunities Portfolio |
| |
Total Return Based on a $10,000 Investment | | |
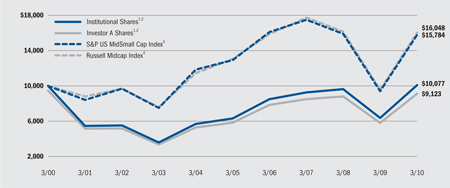
| 1 | Assuming maximum sales charge, if any, transaction costs and other operating expenses, including advisory fees. Institutional Shares do not have a sales charge. |
| 2 | The Fund normally invests at least 80% of its net assets in equity securities issued by US emerging capitalization companies with relatively attractive earnings growth potential and valuation. |
| 3 | An unmanaged index comprised of smaller-capitalization US stocks representing the bottom 30% of available market capital, with a minimum market capitalization of at least $100 million. |
| 4 | A market capitalization weighted index representing the smallest 800 companies in the Russell 1000 Index. The Fund now uses this index as its benchmark rather than the S&P US MidSmall Cap Index because Fund management believes it is more representative of the industry standard benchmark for funds with similar strategies. |
Performance Summary for the Period Ended March 31, 2010
| | | | | | | | | | | | | | | | | | | | | |
| | | | | | Average Annual Total Returns5 | |
| | | | | | 1 Year | | | 5 Years | | | 10 Years | |
| | | 6-Month
Total Returns | | | w/o sales
charge | | | w/ sales
charge | | | w/o sales
charge | | | w/ sales
charge | | | w/o sales
charge | | | w/ sales
charge | |
Institutional | | 11.47 | % | | 58.12 | % | | N/A | | | 9.86 | % | | N/A | | | 0.08 | % | | N/A | |
Service | | 11.25 | | | 57.41 | | | N/A | | | 9.41 | | | N/A | | | (0.30 | ) | | N/A | |
Investor A | | 11.24 | | | 57.35 | | | 49.08 | % | | 9.35 | | | 8.17 | % | | (0.38 | ) | | (0.91 | )% |
Investor B | | 10.79 | | | 56.16 | | | 51.66 | | | 8.54 | | | 8.25 | | | (0.97 | ) | | (0.97 | ) |
Investor C | | 10.80 | | | 56.13 | | | 55.13 | | | 8.55 | | | 8.55 | | | (1.12 | ) | | (1.12 | ) |
S&P US MidSmall Cap Index | | 14.63 | | | 67.83 | | | N/A | | | 4.09 | | | N/A | | | 4.67 | | | N/A | |
Russell Midcap Index | | 15.10 | | | 67.71 | | | N/A | | | 4.20 | | | N/A | | | 4.84 | | | N/A | |
| 5 | Assuming maximum sales charges, if any. Average annual total returns with and without sales charges reflect reductions for distribution and service fees. See “About Fund Performance” on page 14 for a detailed description of share classes, including any related sales charges and fees. |
N/A - Not applicable as share class and index do not have a sales charge.
Past performance is not indicative of future results.
Expense Example
| | | | | | | | | | | | | | | | | | |
| | | Actual | | Hypothetical7 |
| | | Beginning
Account Value
October 1, 2009 | | Ending
Account Value
March 31, 2010 | | Expenses Paid
During the Period6 | | Beginning
Account Value
October 1, 2009 | | Ending
Account Value
March 31, 2010 | | Expenses Paid
During the Period6 |
Institutional | | $ | 1,000 | | $ | 1,114.70 | | $ | 5.43 | | $ | 1,000 | | $ | 1,019.80 | | $ | 5.19 |
Service | | $ | 1,000 | | $ | 1,112.50 | | $ | 7.74 | | $ | 1,000 | | $ | 1,017.60 | | $ | 7.39 |
Investor A | | $ | 1,000 | | $ | 1,112.40 | | $ | 7.79 | | $ | 1,000 | | $ | 1,017.55 | | $ | 7.44 |
Investor B | | $ | 1,000 | | $ | 1,107.90 | | $ | 12.19 | | $ | 1,000 | | $ | 1,013.36 | | $ | 11.65 |
Investor C | | $ | 1,000 | | $ | 1,108.00 | | $ | 11.83 | | $ | 1,000 | | $ | 1,013.71 | | $ | 11.30 |
| 6 | For each class of the Fund, expenses are equal to the annualized expense ratio for the class (1.03% for Institutional, 1.47% for Service, 1.48% for Investor A, 2.32% for Investor B and 2.25% for Investor C), multiplied by the average account value over the period, multiplied by 182/365 (to reflect the one-half year period shown). |
| 7 | Hypothetical 5% annual return before expenses is calculated by pro rating the number of days in the most recent fiscal half-year divided by 365. See “Disclosure of Expenses” on page 15 for further information on how expenses were calculated. |
| | | | | | |
| | | BLACKROCK FUNDS | | MARCH 31, 2010 | | 13 |
About Fund Performance
| | • | | Institutional Shares are not subject to any sales charge. Institutional Shares bear no ongoing distribution or service fees and are available only to eligible investors. Prior to October 16, 2000, Health Sciences Opportunities Portfolio’s Institutional Share performance results are those of Investor A Shares restated to reflect Institutional Share fees. |
| | • | | Service Shares are not subject to any sales charge (front-end load) or deferred sales charge. Service Shares are subject to a service fee of 0.25% per year (but no distribution fee). Prior to January 28, 2005, Health Sciences Opportunities Portfolio’s Service Share performance results are those of Investor A Shares restated to reflect Service Share fees. |
| | • | | Investor A Shares incur a maximum initial sales charge (front-end load) of 5.25% and a service fee of 0.25% per year (but no distribution fee). |
| | • | | Investor B Shares are subject to a maximum contingent deferred sales charge of 4.50% declining to 0% after six years. In addition, Investor B Shares are subject to a distribution fee of 0.75% per year and a service fee of 0.25% per year. Investor B Shares automatically convert to Investor A Shares after approximately eight years. (There is no initial sales charge for automatic share conversions.) All returns for periods greater than eight years reflect this conversion. Investor B Shares are only available for purchase through exchanges, dividend reinvestment or for purchase by certain qualified employee benefit plans. Prior to October 16, 2000, BlackRock Health Sciences Opportunities Portfolio’s Investor B |
Share performance results are those of Investor A Shares restated to reflect Investor B Share fees.
| | • | | Investor C Shares are subject to a 1.00% contingent deferred sales charge if redeemed within one year of purchase. In addition, Investor C Shares are subject to a distribution fee of 0.75% per year and a service fee of 0.25% per year. Prior to October 16, 2000, BlackRock Health Sciences Opportunities Portfolio’s Investor C Share performance results are those of Investor A Shares restated to reflect Investor C Share fees. |
| | • | | Class R Shares are not subject to any sales charge. Class R Shares are subject to a distribution fee of 0.25% per year and a service fee of 0.25% per year. Class R Shares are available only to certain retirement and other similar plans. Prior to September 8, 2008, BlackRock Science & Technology Opportunities Portfolio’s Class R Share performance results are those of Institutional Shares (which have no distribution or service fees) restated to reflect Class R Share fees. |
Performance information reflects past performance and does not guarantee future results. Current performance may be lower or higher than the performance data quoted. Refer to www.blackrock.com/funds to obtain performance data current to the most recent month-end. Performance results do not reflect the deduction of taxes that a shareholder would pay on fund distributions or the redemption of fund shares. Each Fund may charge a 2% redemption fee for sales or exchanges of shares within 30 days of purchase or exchange. Performance data does not reflect this potential fee. Figures shown in each of the performance tables on the previous pages assume reinvestment of all dividends and distributions, if any, at net asset value on the payable date. Investment return and principal value of shares will fluctuate so that shares, when redeemed, may be worth more or less than their original cost.
Performance for BlackRock Health Sciences Opportunities Portfolio for the periods prior to January 31, 2005 is based on performance of a certain former State Street Research mutual fund that reorganized with the Fund on that date.
The Funds’ investment advisor waived or reimbursed a portion of each Fund’s expenses. Without such waiver and reimbursement, a Fund’s performance would have been lower. BlackRock Advisors, LLC is under no obligation to waive or continue waiving its fees after February 1, 2011. Dividends paid to each class of shares will vary because of the different levels of service, distribution and transfer agency fees applicable to each class, which are deducted from the income available to be paid to shareholders.
| | | | | | |
14 | | BLACKROCK FUNDS | | MARCH 31, 2010 | | |
Disclosure of Expenses
Shareholders of these Funds may incur the following charges: (a) expenses related to transactions, including sales charges, redemption fees and exchange fees; and (b) operating expenses including advisory fees, service and distribution fees, including 12b-1 fees, and other Fund expenses. The expense examples on the previous pages (which are based on a hypothetical investment of $1,000 invested on October 1, 2009 and held through March 31, 2010) are intended to assist shareholders both in calculating expenses based on an investment in each Fund and in comparing these expenses with similar costs of investing in other mutual funds.
The tables provide information about actual account values and actual expenses. In order to estimate the expenses a shareholder paid during the period covered by this report, shareholders can divide their account value by $1,000 and then multiply the result by the number corresponding to their Fund and share class under the headings entitled “Expenses Paid During the Period.”
The tables also provide information about hypothetical account values and hypothetical expenses based on a Fund’s actual expense ratio and an assumed rate of return of 5% per year before expenses. In order to assist shareholders in comparing the ongoing expenses of investing in these Funds and other funds, compare the 5% hypothetical example with the 5% hypothetical examples that appear in other funds’ shareholder reports.
The expenses shown in the tables are intended to highlight shareholders’ ongoing costs only and do not reflect any transactional expenses, such as sales charges, redemption fees or exchange fees. Therefore, the hypothetical examples are useful in comparing ongoing expenses only, and will not help shareholders determine the relative total expenses of owning different funds. If these transactional expenses were included, shareholder expenses would have been higher.
Derivative Financial Instruments
The Funds may invest in various derivative instruments, including foreign currency exchange contracts and options, as specified in Note 2 of the Notes to Financial Statements, which constitute forms of economic leverage. Such instruments are used to obtain exposure to a market without owning or taking physical custody of securities or to hedge market, equity and/or foreign currency exchange rate risks. Such derivative instruments involve risks, including the imperfect correlation between the value of a derivative instrument and the underlying asset, possible default of the counterparty to the transaction or illiquidity of the derivative instrument. A Fund’s ability to successfully use a derivative instrument depends on the investment advisor’s ability to accurately predict pertinent market movements, which cannot be assured. The use of derivative instruments may result in losses greater than if they had not been used, may require a Fund to sell or purchase portfolio securities at inopportune times or for distressed values, may limit the amount of appreciation a Fund can realize on an investment or may cause a Fund to hold a security that it might otherwise sell. The Funds’ investments in these instruments are discussed in detail in the Notes to Financial Statements.
| | | | | | |
| | | BLACKROCK FUNDS | | MARCH 31, 2010 | | 15 |
| | |
| Schedule of Investments March 31, 2010 (Unaudited) | | BlackRock Global Opportunities Portfolio |
| | (Percentages shown are based on Net Assets) |
| | | | | |
Common Stocks | | Shares | | Value |
Australia — 1.1% | | | | | |
Australia & New Zealand Banking Group Ltd. | | 12,300 | | $ | 285,882 |
BHP Billiton Ltd. - ADR | | 7,500 | | | 602,400 |
CSL Ltd. | | 4,600 | | | 153,646 |
| | | | | |
| | | | | 1,041,928 |
| | | | | |
Belgium — 0.6% | | | | | |
Anheuser-Busch InBev NV | | 10,900 | | | 548,247 |
| | | | | |
Bermuda — 0.7% | | | | | |
Arch Capital Group Ltd.(a) | | 3,700 | | | 282,125 |
Validus Holdings Ltd. | | 15,000 | | | 412,950 |
| | | | | |
| | | | | 695,075 |
| | | | | |
Brazil — 1.6% | | | | | |
Banco Santander (Brasil) SA - ADR | | 14,600 | | | 181,478 |
BM&FBOVESPA SA | | 24,142 | | | 162,092 |
Cia de Bebidas DAS Americas | | 3,700 | | | 339,142 |
Cia Siderurgica Nacional SA - ADR | | 9,100 | | | 363,363 |
Usinas Siderurgicas de Minas Gerais SA - Class A, Preference Shares | | 14,400 | | | 495,803 |
| | | | | |
| | | | | 1,541,878 |
| | | | | |
Canada — 3.7% | | | | | |
Canadian Natural Resources Ltd. | | 7,000 | | | 518,082 |
Enbridge, Inc. | | 15,800 | | | 753,559 |
Pan American Silver Corp. | | 26,400 | | | 611,160 |
Potash Corp. of Saskatchewan, Inc. | | 4,200 | | | 501,270 |
The Toronto-Dominion Bank | | 5,400 | | | 402,481 |
TransCanada Corp. | | 21,000 | | | 769,576 |
| | | | | |
| | | | | 3,556,128 |
| | | | | |
China — 0.9% | | | | | |
China Construction Bank Corp. - Class H | | 283,400 | | | 231,690 |
Focus Media Holding Ltd. - ADR(a) | | 20,800 | | | 379,808 |
Industrial & Commercial Bank of China - Class H | | 316,500 | | | 240,786 |
| | | | | |
| | | | | 852,284 |
| | | | | |
Finland — 1.0% | | | | | |
Fortum Oyj | | 15,000 | | | 367,107 |
Nokia Oyj - ADR | | 36,000 | | | 559,440 |
| | | | | |
| | | | | 926,547 |
| | | | | |
France — 2.9% | | | | | |
AXA SA | | 12,400 | | | 275,094 |
BNP Paribas | | 2,680 | | | 205,414 |
Compagnie de Saint-Gobain | | 8,400 | | | 403,401 |
Renault SA(a) | | 7,900 | | | 369,106 |
Société Generale | | 3,700 | | | 232,212 |
Total SA | | 14,900 | | | 864,770 |
Unibail-Rodamco SE | | 2,100 | | | 425,146 |
| | | | | |
| | | | | 2,775,143 |
| | | | | |
Germany — 4.2% | | | | | |
Bayerische Motoren Werke AG | | 8,400 | | | 387,521 |
Deutsche Boerse AG | | 3,600 | | | 266,358 |
Deutsche Lufthansa AG | | 47,000 | | | 779,007 |
Deutsche Telekom AG | | 38,000 | | | 513,523 |
RWE AG | | 6,000 | | | 532,276 |
Siemens AG | | 9,800 | | | 979,192 |
Volkswagen AG-Preference Shares | | 6,300 | | | 577,438 |
| | | | | |
| | | | | 4,035,315 |
| | | | | |
Hong Kong — 1.1% | | | | | |
Cheung Kong (Holdings) Ltd. | | 42,000 | | | 540,080 |
China Mobile Ltd. | | 36,000 | | | 346,192 |
Wing Hang Bank Ltd. | | 23,200 | | | 211,951 |
| | | | | |
| | | | | 1,098,223 |
| | | | | |
India — 1.2% | | | | | |
Bharti Airtel Ltd. | | 43,400 | | | 301,964 |
Punjab National Bank Ltd. | | 16,700 | | | 376,273 |
Sterlite Industries India Ltd. - ADR | | 27,800 | | | 517,358 |
| | | | | |
| | | | | 1,195,595 |
| | | | | |
Ireland — 0.8% | | | | | |
Accenture Plc - Class A | | 11,600 | | | 486,620 |
Covidien Plc | | 4,800 | | | 241,344 |
| | | | | |
| | | | | 727,964 |
| | | | | |
Israel — 0.5% | | | | | |
Teva Pharmaceutical Industries Ltd. - ADR | | 8,100 | | | 510,948 |
| | | | | |
Italy — 1.0% | | | | | |
ENI SpA | | 22,700 | | | 532,458 |
Intesa Sanpaolo SpA(a) | | 114,300 | | | 425,663 |
| | | | | |
| | | | | 958,121 |
| | | | | |
Japan — 8.5% | | | | | |
Amada Co. Ltd. | | 77,500 | | | 650,834 |
Asahi Breweries Ltd. | | 18,300 | | | 343,389 |
Canon, Inc. | | 14,500 | | | 670,701 |
Fujitsu Ltd. | | 61,400 | | | 403,076 |
Honda Motor Co. Ltd. | | 28,200 | | | 994,013 |
ITOCHU Corp. | | 76,300 | | | 669,699 |
Japan Tobacco, Inc. | | 190 | | | 707,340 |
JTEKT Corp. | | 21,100 | | | 249,165 |
Marubeni Corp. | | 119,900 | | | 746,282 |
Mitsubishi Heavy Industries Ltd. | | 134,600 | | | 558,360 |
Mitsubishi UFJ Financial Group, Inc. | | 75,400 | | | 395,221 |
Mitsui & Co. Ltd. | | 41,300 | | | 695,382 |
Nomura Holdings, Inc. | | 61,700 | | | 452,733 |
NTN Corp. | | 15,100 | | | 68,308 |
Sumitomo Mitsui Financial Group, Inc. | | 5,300 | | | 175,588 |
Tokio Marine Holdings, Inc. | | 15,600 | | | 439,782 |
| | | | | |
| | | | | 8,219,873 |
| | | | | |
Portfolio Abbreviations
| | | | | | | | |
| To simplify the listings of portfolio holdings in the Schedules of Investments, the names and descriptions of many of the securities have been abbreviated according to the following list: | | ADR | | American Depositary Receipts | | JPY | | Japanese Yen |
| | AUD | | Australian Dollar | | MXN | | Mexican Peso |
| | CAD | | Canadian Dollar | | NOK | | Norwegian Krone |
| | CDI | | CREST Depository Interest | | NZD | | New Zealand Dollar |
| | CHF | | Swiss Francs | | SEK | | Swedish Krona |
| | DKK | | Danish Krone | | SGD | | Singapore Dollar |
| | EUR | | Euro | | USD | | US Dollar |
| | GBP | | British Pound | | ZAR | | South African Rand |
| | HKD | | Hong Kong Dollar | | | | |
See Notes to Financial Statements.
| | | | | | |
16 | | BLACKROCK FUNDS | | MARCH 31, 2010 | | |
| | |
| Schedule of Investments (continued) | | BlackRock Global Opportunities Portfolio |
| | (Percentages shown are based on Net Assets) |
| | | | | |
Common Stocks | | Shares | | Value |
Luxembourg — 0.7% | | | | | |
ArcelorMittal | | 16,500 | | $ | 723,452 |
| | | | | |
Malaysia — 0.3% | | | | | |
CIMB Group Holdings Berhad | | 78,800 | | | 339,506 |
| | | | | |
Mexico — 0.5% | | | | | |
Fomento Economico Mexicano SAB de CV - ADR | | 7,100 | | | 337,463 |
Grupo Mexico SA - Series B | �� | 48,700 | | | 130,930 |
| | | | | |
| | | | | 468,393 |
| | | | | |
Netherlands — 1.8% | | | | | |
Aegon NV(a) | | 64,300 | | | 438,939 |
Corio NV | | 3,600 | | | 240,248 |
Royal Dutch Shell Plc - A Shares | | 37,300 | | | 1,078,663 |
| | | | | |
| | | | | 1,757,850 |
| | | | | |
New Zealand — 0.3% | | | | | |
Telecom Corp. of New Zealand Ltd. | | 220,700 | | | 339,393 |
| | | | | |
Russia — 0.4% | | | | | |
Vimpel-Communications - ADR | | 19,200 | | | 353,472 |
| | | | | |
Singapore — 1.5% | | | | | |
CapitaLand Ltd. | | 81,700 | | | 231,315 |
DBS Group Holdings Ltd. | | 25,000 | | | 254,894 |
Singapore Telecommunications Ltd. | | 215,300 | | | 487,018 |
Wilmar International Ltd. | | 98,700 | | | 471,726 |
| | | | | |
| | | | | 1,444,953 |
| | | | | |
South Africa — 0.4% | | | | | |
Naspers Ltd. - N Shares | | 9,200 | | | 398,900 |
| | | | | |
South Korea — 1.7% | | | | | |
Hyosung Corp. | | 6,443 | | | 463,038 |
Korea Zinc Co. Ltd. | | 2,300 | | | 410,231 |
Samsung Electronics Co. Ltd. | | 1,000 | | | 722,994 |
| | | | | |
| | | | | 1,596,263 |
| | | | | |
Spain — 1.8% | | | | | |
Banco Santander SA | | 51,700 | | | 685,753 |
Inditex SA | | 6,700 | | | 441,902 |
Telefonica SA | | 27,200 | | | 644,494 |
| | | | | |
| | | | | 1,772,149 |
| | | | | |
Sweden — 1.5% | | | | | |
Atlas Copco AB - A Shares | | 26,600 | | | 412,261 |
Nordea Bank AB | | 44,400 | | | 437,656 |
Svenska Cellulosa AB - B Shares(a) | | 41,700 | | | 587,956 |
| | | | | |
| | | | | 1,437,873 |
| | | | | |
Switzerland — 2.9% | | | | | |
ACE Ltd. | | 9,700 | | | 507,310 |
Nestle SA | | 13,000 | | | 666,146 |
Novartis AG | | 17,400 | | | 941,235 |
Roche Holding AG | | 4,100 | | | 665,883 |
| | | | | |
| | | | | 2,780,574 |
| | | | | |
Taiwan — 0.9% | | | | | |
Chunghwa Telecom Co. Ltd. - ADR | | 18,690 | | | 363,147 |
Mega Financial Holding Co. Ltd. | | 459,900 | | | 266,613 |
Siliconware Precision Industries Co. - ADR | | 38,400 | | | 230,784 |
| | | | | |
| | | | | 860,544 |
| | | | | |
Thailand — 0.2% | | | | | |
Bangkok Bank Public Co. Ltd. | | 50,600 | | | 204,766 |
| | | | | |
United Kingdom — 5.8% | | | | | |
Barclays Plc | | 119,300 | | | 649,610 |
BG Group Plc | | 40,200 | | | 696,175 |
BP Plc | | 39,500 | | | 373,873 |
GlaxoSmithKline Plc | | 51,100 | | | 980,851 |
HSBC Holdings Plc | | 47,200 | | | 478,320 |
Standard Chartered Plc | | 4,000 | | | 109,029 |
Tesco Plc | | 92,900 | | | 614,214 |
Unilever Plc | | 16,400 | | | 480,104 |
Vodafone Group Plc - ADR | | 29,100 | | | 677,739 |
WPP Plc | | 48,400 | | | 500,833 |
| | | | | |
| | | | | 5,560,748 |
| | | | | |
United States — 49.7% | | | | | |
Abbott Laboratories | | 4,700 | | | 247,595 |
Adobe Systems, Inc.(a) | | 12,900 | | | 456,273 |
Aetna, Inc. | | 7,400 | | | 259,814 |
American Electric Power Co., Inc. | | 12,900 | | | 440,922 |
Ameriprise Financial, Inc. | | 13,800 | | | 625,968 |
Amgen, Inc.(a) | | 4,300 | | | 256,968 |
Apache Corp. | | 4,800 | | | 487,200 |
Apple, Inc.(a) | | 3,900 | | | 916,227 |
Applied Materials, Inc. | | 28,600 | | | 385,528 |
Arch Coal, Inc. | | 17,500 | | | 399,875 |
AT&T, Inc. | | 19,900 | | | 514,216 |
Becton, Dickinson & Co. | | 6,400 | | | 503,872 |
Bristol-Myers Squibb Co. | | 33,600 | | | 897,120 |
Bunge Ltd. | | 6,100 | | | 375,943 |
CF Industries Holdings, Inc. | | 5,900 | | | 537,962 |
The Charles Schwab Corp. | | 18,200 | | | 340,158 |
Chevron Corp. | | 9,500 | | | 720,385 |
Cisco Systems, Inc.(a) | | 33,900 | | | 882,417 |
Citigroup, Inc.(a) | | 86,500 | | | 350,325 |
Colgate-Palmolive Co. | | 9,700 | | | 827,022 |
Comerica, Inc. | | 9,200 | | | 349,968 |
ConAgra Foods, Inc. | | 20,900 | | | 523,963 |
ConocoPhillips | | 11,600 | | | 593,572 |
Corning, Inc. | | 39,400 | | | 796,274 |
Deere & Co. | | 15,700 | | | 933,522 |
DIRECTV - Class A(a) | | 14,800 | | | 500,388 |
Dominion Resources, Inc. | | 10,700 | | | 439,877 |
The Dow Chemical Co. | | 20,100 | | | 594,357 |
E.I. du Pont de Nemours & Co. | | 9,200 | | | 342,608 |
eBay, Inc.(a) | | 27,000 | | | 727,650 |
EMC Corp.(a) | | 33,800 | | | 609,752 |
Energizer Holdings, Inc.(a) | | 5,700 | | | 357,732 |
Exxon Mobil Corp. | | 18,300 | | | 1,225,734 |
Federal Realty Investment Trust | | 3,800 | | | 276,678 |
FMC Corp. | | 10,300 | | | 623,562 |
General Electric Co. | | 86,500 | | | 1,574,300 |
General Mills, Inc. | | 6,100 | | | 431,819 |
Gilead Sciences, Inc.(a) | | 4,900 | | | 222,852 |
Goodrich Corp. | | 12,000 | | | 846,240 |
Google, Inc. - Class A(a) | | 1,200 | | | 680,412 |
Halliburton Co. | | 4,000 | | | 120,520 |
Hewlett-Packard Co. | | 16,300 | | | 866,345 |
The Home Depot, Inc. | | 15,300 | | | 494,955 |
Hudson City Bancorp, Inc. | | 16,800 | | | 237,888 |
Intel Corp. | | 24,900 | | | 554,274 |
International Business Machines Corp. | | 6,300 | | | 807,975 |
International Paper Co. | | 25,700 | | | 632,477 |
Invesco Ltd. | | 19,500 | | | 427,245 |
See Notes to Financial Statements.
| | | | | | |
| | | BLACKROCK FUNDS | | MARCH 31, 2010 | | 17 |
| | |
| Schedule of Investments (continued) | | BlackRock Global Opportunities Portfolio |
| | (Percentages shown are based on Net Assets) |
| | |
| | | | | | |
Common Stocks | | Shares | | Value | |
United States (concluded) | | | | | | |
Johnson & Johnson | | 6,100 | | $ | 397,720 | |
KeyCorp | | 77,500 | | | 600,625 | |
Kohl’s Corp.(a) | | 8,400 | | | 460,152 | |
Las Vegas Sands Corp.(a) | | 23,800 | | | 503,370 | |
Liberty Global, Inc. - Class A(a) | | 18,300 | | | 533,628 | |
Manpower, Inc. | | 7,300 | | | 416,976 | |
Medco Health Solutions, Inc.(a) | | 2,800 | | | 180,768 | |
Merck & Co., Inc. | | 9,200 | | | 343,620 | |
Microsoft Corp. | | 49,200 | | | 1,440,084 | |
Monster Worldwide, Inc.(a) | | 26,000 | | | 431,860 | |
Morgan Stanley | | 10,900 | | | 319,261 | |
The Mosaic Co. | | 8,000 | | | 486,160 | |
News Corp. - Class A | | 35,800 | | | 515,878 | |
NII Holdings, Inc.(a) | | 9,300 | | | 387,438 | |
NIKE, Inc. - Class B | | 6,900 | | | 507,150 | |
Norfolk Southern Corp. | | 9,100 | | | 508,599 | |
Occidental Petroleum Corp. | | 6,200 | | | 524,148 | |
Oracle Corp. | | 23,300 | | | 598,577 | |
Parametric Technology Corp.(a) | | 29,000 | | | 523,450 | |
People’s United Financial, Inc. | | 12,800 | | | 200,192 | |
PepsiCo, Inc. | | 13,700 | | | 906,392 | |
Pfizer, Inc. | | 18,500 | | | 317,275 | |
Piper Jaffray Cos.(a) | | 4,300 | | | 173,290 | |
Principal Financial Group, Inc. | | 1,800 | | | 52,578 | |
Progress Energy, Inc. | | 19,900 | | | 783,264 | |
QUALCOMM, Inc. | | 8,300 | | | 348,517 | |
Sempra Energy | | 10,000 | | | 499,000 | |
St. Jude Medical, Inc.(a) | | 6,100 | | | 250,405 | |
Stanley Black & Decker, Inc. | | 8,587 | | | 492,980 | |
State Street Corp. | | 4,900 | | | 221,186 | |
Stryker Corp. | | 9,500 | | | 543,590 | |
SunTrust Banks, Inc. | | 22,300 | | | 597,417 | |
T. Rowe Price Group, Inc. | | 6,700 | | | 368,031 | |
Target Corp. | | 9,600 | | | 504,960 | |
Temple-Inland, Inc. | | 23,500 | | | 480,105 | |
Texas Instruments, Inc. | | 21,400 | | | 523,658 | |
Thermo Fisher Scientific, Inc.(a) | | 10,100 | | | 519,544 | |
U.S. Bancorp | | 20,400 | | | 527,952 | |
United Parcel Service, Inc. - Class B | | 16,100 | | | 1,037,001 | |
Urban Outfitters, Inc.(a) | | 12,500 | | | 475,375 | |
Wal-Mart Stores, Inc. | | 14,000 | | | 778,400 | |
Yum! Brands, Inc. | | 13,200 | | | 505,956 | |
| | | | | | |
| | | | | 48,005,261 | |
| | | | | | |
Total Common Stocks — 100.2% | | | | | 96,727,366 | |
| | | | | | |
Rights — 0.0% | | | | | | |
Volkswagen AG, Expires 4/13/10(a) | | 5,900 | | | 3,666 | |
| | | | | | |
Total Long-Term Investments
(Cost—$86,622,278)—100.2% | | | | | 96,731,032 | |
| | | | | | |
| | |
Short-Term Securities | | | | | |
BlackRock Liquidity Funds, TempFund, Institutional Class, 0.11% (b)(c) | | 2,010,200 | | | 2,010,200 | |
| | | | | | |
Total Short-Term Securities
(Cost — $2,010,200) — 2.1% | | | | | 2,010,200 | |
| | | | | | |
Total Investments Before Options Written
(Cost — $88,632,478*) — 102.3% | | | | $ | 98,741,232 | |
| | | | | | |
| | |
Options Written | | Contracts | | | |
Exchange-Traded Call Options Written | | | | | | |
DuPont EI Nemours, Strike Price $37, Expires 4/17/10 | | 90 | | | (5,085 | ) |
| | | | | | |
Exchange-Traded Put Options Written | | | | | | |
General Electric Co., Strike Price $20, Expires 6/19/10 | | 270 | | | (7,290 | ) |
| | | | | | |
Total Options Written
(Premiums Received — $16,020) — (0.0)% | | | | | (12,375 | ) |
| | | | | | |
Total Investments Net of Outstanding Options Written — 102.3% | | | | | 98,728,857 | |
Liabilities in Excess of Other Assets — (2.3)% | | | | | (2,198,782 | ) |
| | | | | | |
Net Assets — 100.0% | | | | $ | 96,530,075 | |
| | | | | | |
| * | The cost and unrealized appreciation (depreciation) of investments as of March 31, 2010, as computed for federal income tax purposes, were as follows: |
| | | | |
Aggregate cost | | $ | 89,841,867 | |
| | | | |
Gross unrealized appreciation | | $ | 10,375,348 | |
Gross unrealized depreciation | | | (1,475,983 | ) |
| | | | |
Net unrealized appreciation | | $ | 8,899,365 | |
| | | | |
| (a) | Non-income producing security. |
| (b) | Represents the current yield as of report date. |
| (c) | Investments in companies considered to be an affiliate of the Fund, for purposes of Section 2(a)(3) of the Investment Company Act of 1940, were as follows: |
| | | | | | | |
Affiliate | | Net
Activity | | | Income |
BlackRock Liquidity Funds, TempFund, Institutional Class | | $ | (545,083 | ) | | $ | 2,104 |
| • | | Foreign currency exchange contracts as of March 31, 2010 were as follows: |
| | | | | | | | | | | |
Currency Purchased | | Currency Sold | | Counterparty | | Settlement
Date | | Unrealized
Appreciation
(Depreciation) | |
GBP 9,000 | | USD | 13,588 | | Citibank, N.A. | | 4/01/10 | | $ | 69 | |
USD 65,390 | | JPY | 6,057,000 | | Citibank, N.A. | | 4/01/10 | | | 603 | |
JPY 15,222,000 | | USD | 162,874 | | Citibank, N.A. | | 4/05/10 | | | (54 | ) |
GBP 26,000 | | USD | 39,372 | | Deutsche Bank AG | | 4/06/10 | | | 83 | |
MXN 837,000 | | USD | 67,971 | | UBS AG | | 4/06/10 | | | (273 | ) |
CAD 84,000 | | USD | 82,791 | | Citibank, N.A. | | 4/07/10 | | | (86 | ) |
CHF 74,000 | | USD | 70,309 | | Citibank, N.A. | | 4/07/10 | | | (127 | ) |
HKD 191,000 | | USD | 24,599 | | Deutsche Bank AG | | 4/07/10 | | | 1 | |
USD 84,198 | | CAD | 85,000 | | Citibank, N.A. | | 4/07/10 | | | 508 | |
USD 70,186 | | CHF | 74,000 | | Citibank, N.A. | | 4/07/10 | | | — | |
USD 24,614 | | HKD | 191,000 | | Citibank, N.A. | | 4/07/10 | | | 12 | |
AUD 2,920,000 | | USD | 2,676,793 | | Citibank, N.A. | | 4/27/10 | | | (5,084 | ) |
AUD 1,000,000 | | USD | 903,220 | | BNP Paribas | | 4/27/10 | | | 11,749 | |
See Notes to Financial Statements.
| | | | | | |
18 | | BLACKROCK FUNDS | | MARCH 31, 2010 | | |
| | |
| Schedule of Investments (continued) | | BlackRock Global Opportunities Portfolio |
| | (Percentages shown are based on Net Assets) |
| | |
| | | | | | | | | | | |
Currency Purchased | | Currency
Sold | | Counterparty | | Settlement
Date | | Unrealized
Appreciation
(Depreciation) | |
CAD 5,000 | | USD | 4,855 | | Citibank, N.A. | | 4/27/10 | | $ | 68 | |
CAD 695,000 | | USD | 682,055 | | Citibank, N.A. | | 4/27/10 | | | 2,227 | |
CAD 184,000 | | USD | 173,225 | | Deutsche Bank AG | | 4/27/10 | | | 7,937 | |
CAD 228,000 | | USD | 213,784 | | Citibank, N.A. | | 4/27/10 | | | 10,700 | |
CAD 1,848,000 | | USD | 1,759,037 | | Morgan Stanley & Co. | | 4/27/10 | | | 60,464 | |
CHF 381,000 | | USD | 369,186 | | Citibank, N.A. | | 4/27/10 | | | (7,766 | ) |
CHF 12,000 | | USD | 11,353 | | Morgan Stanley & Co. | | 4/27/10 | | | 30 | |
CHF 853,000 | | USD | 789,286 | | Citibank, N.A. | | 4/27/10 | | | 19,877 | |
DKK 1,318,000 | | USD | 249,810 | | Morgan Stanley & Co. | | 4/27/10 | | | (10,735 | ) |
EUR 3,515,000 | | USD | 4,806,875 | | Citibank, N.A. | | 4/27/10 | | | (59,196 | ) |
EUR 372,000 | | USD | 508,674 | | Deutsche Bank AG | | 4/27/10 | | | (6,216 | ) |
EUR 175,000 | | USD | 240,731 | | Citibank, N.A. | | 4/27/10 | | | (4,360 | ) |
EUR 158,000 | | USD | 217,043 | | Citibank, N.A. | | 4/27/10 | | | (3,633 | ) |
EUR 455,000 | | USD | 617,233 | | Citibank, N.A. | | 4/27/10 | | | (2,669 | ) |
EUR 379,000 | | USD | 512,015 | | Deutsche Bank AG | | 4/27/10 | | | (103 | ) |
EUR 121,000 | | USD | 163,021 | | Citibank, N.A. | | 4/27/10 | | | 412 | |
GBP 2,828,000 | | USD | 4,581,148 | | Morgan Stanley & Co. | | 4/27/10 | | | (290,370 | ) |
GBP 195,000 | | USD | 303,975 | | Citibank, N.A. | | 4/27/10 | | | (8,111 | ) |
GBP 120,000 | | USD | 185,152 | | Citibank, N.A. | | 4/27/10 | | | (3,082 | ) |
GBP 103,000 | | USD | 154,283 | | Deutsche Bank AG | | 4/27/10 | | | 1,993 | |
HKD 1,477,000 | | USD | 190,330 | | Deutsche Bank AG | | 4/27/10 | | | (60 | ) |
HKD 1,470,000 | | USD | 189,416 | | Deutsche Bank AG | | 4/27/10 | | | (47 | ) |
HKD 826,000 | | USD | 106,352 | | Citibank, N.A. | | 4/27/10 | | | 55 | |
JPY 102,870,000 | | USD | 1,138,987 | | UBS AG | | 4/27/10 | | | (38,491 | ) |
JPY 42,016,000 | | USD | 466,432 | | Citibank, N.A. | | 4/27/10 | | | (16,948 | ) |
JPY 41,985,000 | | USD | 463,468 | | Citibank, N.A. | | 4/27/10 | | | (14,316 | ) |
JPY 27,851,000 | | USD | 309,608 | | Deutsche Bank AG | | 4/27/10 | | | (11,660 | ) |
JPY 30,144,000 | | USD | 333,644 | | Deutsche Bank AG | | 4/27/10 | | | (11,165 | ) |
JPY 20,266,000 | | USD | 224,436 | | Deutsche Bank AG | | 4/27/10 | | | (7,631 | ) |
JPY 15,652,000 | | USD | 170,149 | | Deutsche Bank AG | | 4/27/10 | | | (2,705 | ) |
JPY 6,057,000 | | USD | 65,398 | | Citibank, N.A. | | 4/27/10 | | | (601 | ) |
NOK 1,800,000 | | USD | 308,078 | | Citibank, N.A. | | 4/27/10 | | | (5,585 | ) |
SEK 4,531,000 | | USD | 641,952 | | Citibank, N.A. | | 4/27/10 | | | (14,406 | ) |
SEK 2,878,000 | | USD | 408,081 | | Deutsche Bank AG | | 4/27/10 | | | (9,477 | ) |
USD 2,183,876 | | AUD | 2,484,500 | | Citibank, N.A. | | 4/27/10 | | | (89,365 | ) |
USD 245,015 | | AUD | 274,500 | | Citibank, N.A. | | 4/27/10 | | | (6,144 | ) |
USD 78,565 | | AUD | 88,000 | | Citibank, N.A. | | 4/27/10 | | | (1,952 | ) |
USD 46,493 | | AUD | 52,000 | | Citibank, N.A. | | 4/27/10 | | | (1,086 | ) |
USD 18,619 | | AUD | 21,000 | | Deutsche Bank AG | | 4/27/10 | | | (595 | ) |
USD 80,455 | | CAD | 85,000 | | Citibank, N.A. | | 4/27/10 | | | (3,234 | ) |
USD 682,098 | | CAD | 695,000 | | Citibank, N.A. | | 4/27/10 | | | (2,184 | ) |
USD 35,173 | | CAD | 36,000 | | Citibank, N.A. | | 4/27/10 | | | (272 | ) |
USD 21,505 | | CAD | 22,000 | | Citibank, N.A. | | 4/27/10 | | | (156 | ) |
USD 82,790 | | CAD | 84,000 | | Citibank, N.A. | | 4/27/10 | | | 85 | |
USD 421,595 | | CHF | 451,000 | | Citibank, N.A. | | 4/27/10 | | | (6,227 | ) |
USD 164,645 | | CHF | 174,000 | | Citibank, N.A. | | 4/27/10 | | | (413 | ) |
USD 70,321 | | CHF | 74,000 | | Citibank, N.A. | | 4/27/10 | | | 124 | |
USD 903,143 | | EUR | 675,000 | | BNP Paribas | | 4/27/10 | | | (8,573 | ) |
USD 250,772 | | EUR | 186,000 | | Citibank, N.A. | | 4/27/10 | | | (456 | ) |
USD 20,444 | | EUR | 15,000 | | Citibank, N.A. | | 4/27/10 | | | 184 | |
USD 138,994 | | EUR | 102,000 | | Citibank, N.A. | | 4/27/10 | | | 1,224 | |
USD 292,186 | | EUR | 215,000 | | Citibank, N.A. | | 4/27/10 | | | 1,788 | |
USD 262,311 | | EUR | 192,000 | | Citibank, N.A. | | 4/27/10 | | | 2,978 | |
USD 169,860 | | EUR | 122,000 | | Citibank, N.A. | | 4/27/10 | | | 5,076 | |
USD 276,585 | | EUR | 198,000 | | Citibank, N.A. | | 4/27/10 | | | 9,148 | |
USD 259,476 | | EUR | 185,000 | | Citibank, N.A. | | 4/27/10 | | | 9,598 | |
USD 1,202,847 | | EUR | 883,000 | | Morgan Stanley & Co. | | 4/27/10 | | | 10,186 | |
USD 693,129 | | EUR | 505,000 | | Citibank, N.A. | | 4/27/10 | | | 11,030 | |
USD 484,341 | | EUR | 344,000 | | Deutsche Bank AG | | 4/27/10 | | | 19,703 | |
USD 2,560,109 | | EUR | 1,814,000 | | Citibank, N.A. | | 4/27/10 | | | 109,956 | |
USD 39,367 | | GBP | 26,000 | | Deutsche Bank AG | | 4/27/10 | | | (82 | ) |
USD 13,586 | | GBP | 9,000 | | Citibank, N.A. | | 4/27/10 | | | (69 | ) |
USD 120,153 | | GBP | 79,000 | | Citibank, N.A. | | 4/27/10 | | | 290 | |
USD 154,023 | | GBP | 101,000 | | Morgan Stanley & Co. | | 4/27/10 | | | 781 | |
USD 189,014 | | GBP | 124,000 | | Deutsche Bank AG | | 4/27/10 | | | 875 | |
USD 250,334 | | GBP | 162,000 | | Citibank, N.A. | | 4/27/10 | | | 4,540 | |
USD 150,454 | | GBP | 96,000 | | Citibank, N.A. | | 4/27/10 | | | 4,798 | |
USD 469,927 | | GBP | 305,000 | | Deutsche Bank AG | | 4/27/10 | | | 7,167 | |
USD 301,755 | | GBP | 192,000 | | Citibank, N.A. | | 4/27/10 | | | 10,443 | |
USD 24,602 | | HKD | 191,000 | | Deutsche Bank AG | | 4/27/10 | | | (3 | ) |
USD 162,890 | | JPY | 15,222,000 | | Citibank, N.A. | | 4/27/10 | | | 47 | |
USD 67,522 | | JPY | 6,156,000 | | Citibank, N.A. | | 4/27/10 | | | 1,666 | |
USD 74,740 | | JPY | 6,734,000 | | Citibank, N.A. | | 4/27/10 | | | 2,700 | |
USD 89,536 | | JPY | 8,049,000 | | Citibank, N.A. | | 4/27/10 | | | 3,428 | |
USD 141,333 | | JPY | 12,776,000 | | Citibank, N.A. | | 4/27/10 | | | 4,656 | |
USD 272,714 | | JPY | 24,845,000 | | Citibank, N.A. | | 4/27/10 | | | 6,924 | |
USD 1,674,975 | | JPY | 152,621,000 | | Deutsche Bank AG | | 4/27/10 | | | 42,245 | |
USD 87,540 | | NZD | 124,000 | | Citibank, N.A. | | 4/27/10 | | | (385 | ) |
USD 104,547 | | SEK | 760,000 | | Citibank, N.A. | | 4/27/10 | | | (714 | ) |
USD 150,272 | | SEK | 1,086,000 | | Citibank, N.A. | | 4/27/10 | | | (140 | ) |
USD 128,154 | | SEK | 926,000 | | Morgan Stanley & Co. | | 4/27/10 | | | (98 | ) |
USD 231,285 | | SEK | 1,668,000 | | Royal Bank of Scotland Plc | | 4/27/10 | | | 266 | |
See Notes to Financial Statements.
| | | | | | |
| | | BLACKROCK FUNDS | | MARCH 31, 2010 | | 19 |
| | |
| Schedule of Investments (concluded) | | BlackRock Global Opportunities Portfolio |
| | |
| | | | | | | | | | | |
Currency Purchased | | Currency
Sold | | Counterparty | | Settlement
Date | | Unrealized
Appreciation
(Depreciation) | |
USD 244,783 | | SEK | 1,764,000 | | Citibank, N.A. | | 4/27/10 | | $ | 468 | |
USD 369,224 | | SGD | 514,000 | | Deutsche Bank AG | | 4/27/10 | | | 1,856 | |
| | | | | | | | | | | |
Total | | | | | | | | | $ | (266,087 | ) |
| | | | | | | | | | | |
| | • | | Fair Value Measurements - Various inputs are used in determining the fair value of investments, which are as follows: |
| | • | | Level 1 – price quotations in active markets/exchanges for identical assets and liabilities |
| | • | | Level 2 – other observable inputs (including, but not limited to: quoted prices for similar assets or liabilities in markets that are active, quoted prices for identical or similar assets or liabilities in markets that are not active, inputs other than quoted prices that are observable for the assets or liabilities (such as interest rates, yield curves, volatilities, prepayment speeds, loss severities, credit risks and default rates) or other market–corroborated inputs) |
| | • | | Level 3 – unobservable inputs based on the best information available in the circumstances, to the extent observable inputs are not available (including the Fund’s own assumptions used in determining the fair value of investments) |
The inputs or methodologies used for valuing securities are not necessarily an indication of the risk associated with investing in those securities. For information about the Fund’s policy regarding valuation of investments and other significant accounting policies, please refer to Note 1 of the Notes to Financial Statements. The following tables summarize the inputs used as of March 31, 2010 in determining the fair valuation of the Fund’s investments:
| | | | | | | | | | | | | |
| | | Investments in Securities | |
Valuation Inputs | | Level 1 | | Level 2 | | | Level 3 | | Total | |
Assets: | | | | | | | | | | | | | |
Common Stocks: | | | | | | | | | | | | | |
Australia | | $ | 602,400 | | $ | 439,528 | | | — | | $ | 1,041,928 | |
Belgium | | | — | | | 548,247 | | | — | | | 548,247 | |
Bermuda | | | 695,075 | | | — | | | — | | | 695,075 | |
Brazil | | | 1,541,878 | | | — | | | — | | | 1,541,878 | |
Canada | | | 3,556,128 | | | — | | | — | | | 3,556,128 | |
China | | | 379,808 | | | 472,476 | | | — | | | 852,284 | |
Finland | | | 559,440 | | | 367,107 | | | — | | | 926,547 | |
France | | | — | | | 2,775,143 | | | — | | | 2,775,143 | |
Germany | | | — | | | 4,035,315 | | | — | | | 4,035,315 | |
Hong Kong | | | — | | | 1,098,223 | | | — | | | 1,098,223 | |
India | | | 517,358 | | | 678,237 | | | — | | | 1,195,595 | |
Ireland | | | 727,964 | | | — | | | — | | | 727,964 | |
Israel | | | 510,948 | | | — | | | — | | | 510,948 | |
Italy | | | — | | | 958,121 | | | — | | | 958,121 | |
Japan | | | 249,165 | | | 7,970,708 | | | — | | | 8,219,873 | |
Luxembourg | | | — | | $ | 723,452 | | | — | | $ | 723,452 | |
Malaysia | | | — | | | 339,506 | | | — | | | 339,506 | |
Mexico | | $ | 468,393 | | | — | | | — | | | 468,393 | |
Netherlands | | | — | | | 1,757,850 | | | — | | | 1,757,850 | |
New Zealand | | | — | | | 339,393 | | | — | | | 339,393 | |
Russia | | | 353,472 | | | — | | | — | | | 353,472 | |
Singapore | | | — | | | 1,444,953 | | | — | | | 1,444,953 | |
South Africa | | | — | | | 398,900 | | | — | | | 398,900 | |
South Korea | | | — | | | 1,596,263 | | | — | | | 1,596,263 | |
Spain | | | — | | | 1,772,149 | | | — | | | 1,772,149 | |
Sweden | | | — | | | 1,437,873 | | | — | | | 1,437,873 | |
Switzerland | | | 507,310 | | | 2,273,264 | | | — | | | 2,780,574 | |
Taiwan | | | 593,931 | | | 266,613 | | | — | | | 860,544 | |
Thailand | | | — | | | 204,766 | | | — | | | 204,766 | |
United Kingdom | | | 677,739 | | | 4,883,009 | | | — | | | 5,560,748 | |
United States | | | 48,005,261 | | | — | | | — | | | 48,005,261 | |
Rights | | | — | | | 3,666 | | | — | | | 3,666 | |
Short-Term Securities | | | 2,010,200 | | | — | | | — | | | 2,010,200 | |
| | | | | | | | | | | | | |
Total | | $ | 61,956,470 | | $ | 36,784,762 | | | — | | $ | 98,741,232 | |
| | | | | | | | | | | | | |
| |
| | | Other Financial Instruments1 | |
Valuation Inputs | | Level 1 | | Level 2 | | | Level 3 | | Total | |
Assets | | | — | | $ | 391,018 | | | — | | $ | 391,018 | |
Liabilities | | | — | | | (669,480 | ) | | — | | | (669,480 | ) |
| | | | | | | | | | | | | |
Total | | | — | | $ | (278,462 | ) | | — | | $ | (278,462 | ) |
| | | | | | | | | | | | | |
| 1 | Other financial instruments are foreign currency exchange contracts and options. Foreign currency exchange contracts are shown at the unrealized appreciation/ depreciation on the instrument and options are shown at value. |
See Notes to Financial Statements.
| | | | | | |
20 | | BLACKROCK FUNDS | | MARCH 31, 2010 | | |
| | |
| Schedule of Investments March 31, 2010 (Unaudited) | | BlackRock Health Sciences Opportunities Portfolio |
| | (Percentages shown are based on Net Assets) |
| | |
| | | | | | |
Common Stocks | | Shares | | Value | |
Biotechnology — 14.7% | | | | | | |
3SBio, Inc. - ADR(a) | | 167,800 | | $ | 2,077,364 | |
Amgen, Inc.(a) | | 444,410 | | | 26,557,942 | |
Biogen Idec, Inc. (a) | | 285,900 | | | 16,399,224 | |
BioMarin Pharmaceutical, Inc.(a) | | 169,800 | | | 3,968,226 | |
Celgene Corp.(a) | | 203,500 | | | 12,608,860 | |
Cephalon, Inc.(a)(b) | | 406,400 | | | 27,545,792 | |
CSL Ltd. | | 354,336 | | | 11,835,285 | |
Dendreon Corp.(a)(b) | | 199,100 | | | 7,261,177 | |
Facet Biotech Corp.(a) | | 55,800 | | | 1,506,042 | |
Genzyme Corp.(a) | | 260,400 | | | 13,496,532 | |
Gilead Sciences, Inc.(a) | | 275,600 | | | 12,534,288 | |
Human Genome Sciences, Inc.(a)(b) | | 445,200 | | | 13,445,040 | |
Incyte Corp. Ltd.(a)(b) | | 621,100 | | | 8,670,556 | |
Ironwood Pharmaceuticals, Inc.(a) | | 192,700 | | | 2,605,304 | |
Momenta Pharmaceuticals, Inc.(a)(b) | | 63,800 | | | 955,086 | |
OSI Pharmaceuticals, Inc.(a) | | 184,500 | | | 10,986,975 | |
Pharmasset, Inc.(a) | | 80,300 | | | 2,152,040 | |
Sinovac Biotech Ltd.(a) | | 111,000 | | | 656,010 | |
United Therapeutics Corp.(a) | | 107,200 | | | 5,931,376 | |
Vertex Pharmaceuticals, Inc.(a) | | 150,420 | | | 6,147,666 | |
| | | | | | |
| | | | | 187,340,785 | |
| | | | | | |
Electronic Equipment, Instruments & Components — 1.3% | | | | | | |
Agilent Technologies, Inc.(a) | | 465,900 | | | 16,022,301 | |
| | | | | | |
Health Care Equipment & Supplies — 28.9% | | | | | | |
Alcon, Inc. | | 127,050 | | | 20,526,198 | |
Baxter International, Inc. | | 116,500 | | | 6,780,300 | |
Beckman Coulter, Inc. | | 148,230 | | | 9,308,844 | |
Becton, Dickinson & Co. | | 263,500 | | | 20,745,355 | |
C.R. Bard, Inc. | | 184,700 | | | 15,998,714 | |
China Medical Technologies, Inc. - ADR | | 234,700 | | | 3,196,614 | |
The Cooper Cos., Inc. | | 362,700 | | | 14,101,776 | |
Covidien Plc | | 376,470 | | | 18,928,912 | |
Edwards Lifesciences Corp.(a) | | 68,300 | | | 6,753,504 | |
Elekta AB - B Shares | | 353,400 | | | 9,870,491 | |
Gen-Probe, Inc.(a) | | 281,400 | | | 14,070,000 | |
Hill-Rom Holdings, Inc.(b) | | 629,400 | | | 17,125,974 | |
Hologic, Inc.(a) | | 468,600 | | | 8,687,844 | |
Inverness Medical Innovations, Inc.(a) | | 334,700 | | | 13,036,565 | |
Medtronic, Inc. | | 368,260 | | | 16,582,748 | |
Mindray Medical International Ltd. - ADR(b) | | 301,800 | | | 10,991,556 | |
ResMed, Inc.(a) | | 339,100 | | | 21,583,715 | |
Sirona Dental Systems, Inc.(a) | | 445,100 | | | 16,927,153 | |
Smith & Nephew Plc | | 1,387,800 | | | 13,858,545 | |
Sonova Holding AG | | 161,200 | | | 20,008,232 | |
St. Jude Medical, Inc.(a) | | 578,900 | | | 23,763,845 | |
Stryker Corp. | | 608,800 | | | 34,835,536 | |
Varian Medical Systems, Inc.(a) | | 371,100 | | | 20,532,963 | |
Zimmer Holdings, Inc.(a) | | 189,500 | | | 11,218,400 | |
| | | | | | |
| | | | | 369,433,784 | |
| | | | | | |
Health Care Providers & Services — 17.5% | | | | | | |
Aetna, Inc. | | 651,700 | | | 22,881,187 | |
AmerisourceBergen Corp. | | 1,043,200 | | | 30,169,344 | |
CIGNA Corp. | | 294,100 | | | 10,758,178 | |
Community Health Systems, Inc.(a) | | 285,300 | | | 10,536,129 | |
DaVita, Inc.(a) | | 49,130 | | | 3,114,842 | |
Express Scripts, Inc.(a) | | 190,510 | | | 19,386,298 | |
Fresenius Medical Care AG & Co. KGaA | | 370,400 | | | 20,869,521 | |
Henry Schein, Inc.(a) | | 110,100 | | | 6,484,890 | |
McKesson Corp. | | 148,700 | | | 9,772,564 | |
Medco Health Solutions, Inc.(a) | | 397,150 | | | 25,640,004 | |
MEDNAX, Inc.(a) | | 77,800 | | | 4,527,182 | |
Patterson Cos., Inc. | | 517,200 | | | 16,059,060 | |
UnitedHealth Group, Inc. | | 598,300 | | | 19,546,461 | |
VCA Antech, Inc.(a) | | 190,800 | | | 5,348,124 | |
WellPoint, Inc.(a) | | 288,900 | | | 18,599,382 | |
| | | | | | |
| | | | | 223,693,166 | |
| | | | | | |
Health Care Technology — 1.3% | | | | | | |
Allscripts-Misys Healthcare Solutions, Inc.(a)(b) | | 553,400 | | | 10,824,504 | |
Cerner Corp.(a)(b) | | 75,000 | | | 6,379,500 | |
| | | | | | |
| | | | | 17,204,004 | |
| | | | | | |
Industrial Conglomerates — 1.3% | | | | | | |
Koninklijke Philips Electronics NV | | 518,300 | | | 16,630,345 | |
| | | | | | |
Life Sciences Tools & Services — 8.6% | | | | | | |
Dionex Corp.(a) | | 92,496 | | | 6,916,851 | |
Life Technologies Corp.(a) | | 138,100 | | | 7,218,487 | |
Mettler-Toledo International, Inc.(a) | | 67,100 | | | 7,327,320 | |
Millipore Corp.(a) | | 211,200 | | | 22,302,720 | |
PerkinElmer, Inc. | | 928,100 | | | 22,181,590 | |
Tecan Group AG | | 118,392 | | | 9,091,093 | |
Thermo Fisher Scientific, Inc.(a) | | 536,300 | | | 27,587,272 | |
Waters Corp.(a) | | 100,800 | | | 6,808,032 | |
| | | | | | |
| | | | | 109,433,365 | |
| | | | | | |
Pharmaceuticals — 21.8% | | | | | | |
Abbott Laboratories | | 481,990 | | | 25,391,233 | |
Allergan, Inc. | | 114,300 | | | 7,466,076 | |
Bristol-Myers Squibb Co. | | 1,111,700 | | | 29,682,390 | |
Eli Lilly & Co. | | 90,300 | | | 3,270,666 | |
GlaxoSmithKline Plc | | 1,012,400 | | | 19,432,752 | |
Johnson & Johnson | | 569,340 | | | 37,120,968 | |
Merck & Co., Inc. | | 432,300 | | | 16,146,405 | |
Merck KGaA(a) | | 75,400 | | | 6,113,068 | |
Mylan, Inc.(a)(b) | | 786,300 | | | 17,856,873 | |
Novartis AG | | 613,400 | | | 33,181,229 | |
Novartis AG - ADR(b) | | 178,240 | | | 9,642,784 | |
Pfizer, Inc. | | 1,367,640 | | | 23,455,026 | |
Roche Holding AG | | 59,900 | | | 9,728,392 | |
Simcere Pharmaceutical Group - ADR(a) | | 133,500 | | | 1,136,085 | |
Somaxon Pharmaceuticals, Inc.(a) | | 206,700 | | | 1,787,955 | |
Teva Pharmaceutical Industries Ltd. - ADR | | 415,360 | | | 26,200,909 | |
Watson Pharmaceuticals, Inc.(a)(b) | | 266,778 | | | 11,143,317 | |
| | | | | | |
| | | | | 278,756,128 | |
| | | | | | |
Total Long-Term Investments
(Cost — $1,012,723,125) — 95.4% | | | | | 1,218,513,878 | |
| | | | | | |
| | |
Short-Term Securities | | Shares/
Beneficial
Interest | | | |
BlackRock Liquidity Funds, TempFund, Institutional Class, 0.11%(c)(d) | | 65,246,199 | | | 65,246,199 | |
BlackRock Liquidity Series, LLC Money Market Series, 0.22%(c)(d)(e) | | 96,916,350 | | | 96,916,350 | |
| | | | | | |
Total Short-Term Securities
(Cost — $162,162,549) — 12.7% | | | | | 162,162,549 | |
| | | | | | |
Total Investments (Cost — $1,174,885,674*) — 108.1% | | | | | 1,380,676,427 | |
Liabilities in Excess of Other Assets — (8.1)% | | | | | (103,640,891 | ) |
| | | | | | |
Net Assets — 100.0% | | | | $ | 1,277,035,536 | |
| | | | | | |
See Notes to Financial Statements.
| | | | | | |
| | | BLACKROCK FUNDS | | MARCH 31, 2010 | | 21 |
| | |
| Schedule of Investments (continued) | | BlackRock Health Sciences Opportunities Portfolio |
| | (Percentages shown are based on Net Assets) |
| | |
| * | The cost and unrealized appreciation (depreciation) of investments as of March 31, 2010, as computed for federal income tax purposes, were as follows: |
| | | | |
Aggregate cost | | $ | 1,187,171,619 | |
| | | | |
Gross unrealized appreciation | | $ | 196,886,067 | |
Gross unrealized depreciation | | | (3,381,259 | ) |
| | | | |
Net unrealized appreciation | | $ | 193,504,808 | |
| | | | |
| (a) | Non-income producing security. |
| (b) | Security, or a portion of security, is on loan. |
| (c) | Represents the current yield as of report date. |
| (d) | Investments in companies considered to be an affiliate of the Fund, for purposes of Section 2(a)(3) of the Investment Company Act of 1940, were as follows: |
| | | | | | | | | | |
Affiliate | | Net
Activity | | | Realized
Gain | | Income |
BlackRock Liquidity Funds, TempFund, Institutional Class | | $ | 52,975,182 | | | $ | 358 | | $ | 25,042 |
| | | |
BlackRock Liquidity Series, LLC Money Market Series | | $ | (17,008,300 | ) | | | — | | $ | 54,996 |
| | | | | | | | | | |
| (e) | Security was purchased with the cash collateral from loaned securities. |
| • | | Foreign currency exchange contracts as of March 31, 2010 were as follows: |
| | | | | | | | | | | |
Currency Purchased | | Currency Sold | | Counterparty | | Settlement
Date | | Unrealized
Appreciation
(Depreciation) | |
USD 1,402,294 | | JPY | 129,892,000 | | Citibank, N.A. | | 4/01/10 | | $ | 12,927 | |
USD 2,817,249 | | CHF | 2,966,000 | | Citibank, N.A. | | 4/06/10 | | | 4,275 | |
USD 2,590,824 | | EUR | 1,913,000 | | Citibank, N.A. | | 4/07/10 | | | 7,001 | |
USD 12,942,516 | | GBP | 8,281,000 | | Citibank, N.A. | | 4/21/10 | | | 377,725 | |
CHF 2,966,000 | | USD | 2,817,777 | | Citibank, N.A. | | 4/27/10 | | | (4,204 | ) |
CHF 37,000 | | USD | 34,489 | | Citibank, N.A. | | 4/27/10 | | | 609 | |
CHF 100,000 | | USD | 92,531 | | Citibank, N.A. | | 4/27/10 | | | 2,330 | |
CHF 9,500,000 | | USD | 8,987,999 | | Morgan Stanley & Co. | | 4/27/10 | | | 23,780 | |
CHF 3,160,000 | | USD | 2,942,014 | | Citibank, N.A. | | 4/27/10 | | | 55,588 | |
DKK 5,412,000 | | USD | 991,374 | | Citibank, N.A. | | 4/27/10 | | | (9,683 | ) |
GBP 6,760,000 | | USD | 10,971,074 | | Citibank, N.A. | | 4/27/10 | | | (714,476 | ) |
GBP 3,570,000 | | USD | 5,508,264 | | Citibank, N.A. | | 4/27/10 | | | (91,687 | ) |
JPY 451,899,000 | | USD | 4,912,485 | | Citibank, N.A. | | 4/27/10 | | | (78,100 | ) |
JPY 129,892,000 | | USD | 1,402,458 | | Citibank, N.A. | | 4/27/10 | | | (12,882 | ) |
SEK 9,938,000 | | USD | 1,392,370 | | Deutsche Bank AG | | 4/27/10 | | | (15,952 | ) |
SEK 8,725,000 | | USD | 1,174,902 | | Deutsche Bank AG | | 4/27/10 | | | 33,515 | |
USD 5,765,606 | | AUD | 6,458,000 | | Citibank, N.A. | | 4/27/10 | | | (143,264 | ) |
USD 3,494,559 | | AUD | 3,908,500 | | Citibank, N.A. | | 4/27/10 | | | (81,597 | ) |
USD 1,472,701 | | AUD | 1,661,000 | | Deutsche Bank AG | | 4/27/10 | | | (47,063 | ) |
USD 3,347,491 | | CHF | 3,609,000 | | Citibank, N.A. | | 4/27/10 | | | (76,037 | ) |
USD 2,404,658 | | CHF | 2,564,000 | | Citibank, N.A. | | 4/27/10 | | | (27,574 | ) |
USD 3,093,921 | | CHF | 3,278,000 | | Citibank, N.A. | | 4/27/10 | | | (15,617 | ) |
USD 679,497 | | CHF | 732,000 | | Citibank, N.A. | | 4/27/10 | | | (14,884 | ) |
USD 3,297,345 | | CHF | 3,482,000 | | Citibank, N.A. | | 4/27/10 | | | (5,709 | ) |
USD 1,374,231 | | CHF | 1,452,000 | | Citibank, N.A. | | 4/27/10 | | | (3,148 | ) |
USD 730,230 | | CHF | 773,000 | | Citibank, N.A. | | 4/27/10 | | | (3,044 | ) |
USD 2,558,003 | | CHF | 2,683,000 | | Citibank, N.A. | | 4/27/10 | | | 12,887 | |
USD 71,157,946 | | CHF | 73,435,000 | | Citibank, N.A. | | 4/27/10 | | | 1,496,896 | |
USD 1,021,030 | | DKK | 5,412,000 | | Royal Bank of Scotland Plc | | 4/27/10 | | | 39,339 | |
USD 1,206,388 | | EUR | 892,000 | | Citibank, N.A. | | 4/27/10 | | | 1,572 | |
USD 149,307 | | EUR | 109,000 | | Citibank, N.A. | | 4/27/10 | | | 2,082 | |
USD 1,000,808 | | EUR | 738,000 | | Citibank, N.A. | | 4/27/10 | | | 3,998 | |
USD 2,287,712 | | EUR | 1,687,000 | | Citibank, N.A. | | 4/27/10 | | | 9,096 | |
USD 1,491,709 | | EUR | 1,097,000 | | Citibank, N.A. | | 4/27/10 | | | 10,001 | |
USD 684,023 | | EUR | 499,000 | | Citibank, N.A. | | 4/27/10 | | | 10,028 | |
USD 3,901,188 | | EUR | 2,880,000 | | Citibank, N.A. | | 4/27/10 | | | 11,198 | |
USD 1,428,385 | | EUR | 1,048,000 | | Citibank, N.A. | | 4/27/10 | | | 12,861 | |
USD 735,886 | | EUR | 535,000 | | Citibank, N.A. | | 4/27/10 | | | 13,266 | |
USD 3,479,779 | | EUR | 2,554,000 | | Citibank, N.A. | | 4/27/10 | | | 30,115 | |
USD 18,387,905 | | EUR | 13,029,000 | | Citibank, N.A. | | 4/27/10 | | | 789,752 | |
USD 2,113,653 | | GBP | 1,416,000 | | Citibank, N.A. | | 4/27/10 | | | (34,770 | ) |
USD 865,331 | | GBP | 576,000 | | Citibank, N.A. | | 4/27/10 | | | (8,604 | ) |
USD 9,753,525 | | GBP | 6,214,000 | | Citibank, N.A. | | 4/27/10 | | | 325,345 | |
USD 22,401,755 | | GBP | 13,818,000 | | Deutsche Bank AG | | 4/27/10 | | | 1,436,418 | |
USD 420,901 | | JPY | 37,519,000 | | Citibank, N.A. | | 4/27/10 | | | 19,525 | |
USD 1,631,754 | | JPY | 148,767,500 | | Citibank, N.A. | | 4/27/10 | | | 40,249 | |
USD 1,887,158 | | JPY | 170,032,000 | | Citibank, N.A. | | 4/27/10 | | | 68,167 | |
USD 2,245,804 | | JPY | 201,891,000 | | Citibank, N.A. | | 4/27/10 | | | 85,987 | |
USD 306,837 | | SEK | 2,259,000 | | Deutsche Bank AG | | 4/27/10 | | | (6,036 | ) |
USD 462,049 | | SEK | 3,351,000 | | Citibank, N.A. | | 4/27/10 | | | (2,066 | ) |
USD 244,581 | | SEK | 1,760,000 | | Deutsche Bank AG | | 4/27/10 | | | 821 | |
USD 4,543,395 | | SEK | 32,068,000 | | Citibank, N.A. | | 4/27/10 | | | 101,961 | |
| | | | | | | | | | | |
Total | | | | | | | | | $ | 3,642,917 | |
| | | | | | | | | | | |
| • | | For Fund compliance purposes, the Fund’s industry classifications refer to any one or more of the industry sub-classifications used by one or more widely recognized market indexes or ratings group indexes, and/or as defined by Fund management. This definition may not apply for purposes of this report, which may combine industry sub-classifications for reporting ease. |
See Notes to Financial Statements.
| | | | | | |
22 | | BLACKROCK FUNDS | | MARCH 31, 2010 | | |
| | |
| Schedule of Investments (concluded) | | BlackRock Health Sciences Opportunities Portfolio |
| | |
| | |
| | • | | Fair Value Measurements - Various inputs are used in determining the fair value of investments, which are as follows: |
| | • | | Level 1 – price quotations in active markets/exchanges for identical assets and liabilities |
| | • | | Level 2 – other observable inputs (including, but not limited to: quoted prices for similar assets or liabilities in markets that are active, quoted prices for identical or similar assets or liabilities in markets that are not active, inputs other than quoted prices that are observable for the assets or liabilities (such as interest rates, yield curves, volatilities, prepayment speeds, loss severities, credit risks and default rates) or other market–corroborated inputs) |
| | • | | Level 3 – unobservable inputs based on the best information available in the circumstances, to the extent observable inputs are not available (including the Fund’s own assumptions used in determining the fair value of investments) |
The inputs or methodologies used for valuing securities are not necessarily an indication of the risk associated with investing in those securities. For information about the Fund’s policy regarding valuation of investments and other significant accounting policies, please refer to Note 1 of the Notes to Financial Statements.
The following tables summarize the inputs used as of March 31, 2010 in determining the fair valuation of the Fund’s investments:
| | | | | | | | | | | |
| | | Investments in Securities |
Valuation Inputs | | Level 1 | | Level 2 | | Level 3 | | Total |
Assets: | | | | | | | | | | | |
Long-Term Investments: | | | | | | | | | | | |
Biotechnology. | | $ | 175,505,500 | | $ | 11,835,285 | | — | | $ | 187,340,785 |
Electronic Equipment, Instruments & Components | | | 16,022,301 | | | — | | — | | | 16,022,301 |
Health Care Equipment & Supplies | | | 325,696,516 | | | 43,737,268 | | — | | | 369,433,784 |
Health Care Providers & Services | | | 202,823,645 | | | 20,869,521 | | — | | | 223,693,166 |
Health Care Technology | | | 17,204,004 | | | — | | — | | | 17,204,004 |
Industrial Conglomerates | | | 16,630,345 | | | — | | — | | | 16,630,345 |
Life Sciences Tools & Services | | | 100,342,272 | | | 9,091,093 | | — | | | 109,433,365 |
Pharmaceuticals | | | 210,300,687 | | | 68,455,441 | | — | | | 278,756,128 |
Short-Term Securities | | | 65,246,199 | | | 96,916,350 | | — | | | 162,162,549 |
| | | | | | | | | | | |
Total | | $ | 1,129,771,469 | | $ | 250,904,958 | | — | | $ | 1,380,676,427 |
| | | | | | | | | | | |
| | | | | | | | | | | | |
| | | Other Financial Instruments1 | |
Valuation Inputs | | Level 1 | | Level 2 | | | Level 3 | | Total | |
Assets | | — | | $ | 5,039,314 | | | — | | $ | 5,039,314 | |
Liabilities | | — | | | (1,396,367 | ) | | — | | | (1,396,367 | ) |
| | | | | | | | | | | | |
Total | | — | | $ | 3,642,947 | | | — | | $ | 3,642,947 | |
| | | | | | | | | | | | |
| 1 | Other financial instruments are foreign currency exchange contracts which are shown at the unrealized appreciation/depreciation on the instrument. |
See Notes to Financial Statements.
| | | | | | |
| | | BLACKROCK FUNDS | | MARCH 31, 2010 | | 23 |
| | |
| Schedule of Investments March 31, 2010 (Unaudited) | | BlackRock International Opportunities Portfolio |
| | (Percentages shown are based on Net Assets) |
| | |
| | | | | |
Common Stocks | | Shares | | Value |
Australia — 2.1% | | | | | |
Australia & New Zealand Banking Group Ltd. | | 398,400 | | $ | 9,259,786 |
BHP Billiton Ltd. - ADR(a) | | 141,200 | | | 11,341,184 |
Commonwealth Bank of Australia | | 173,400 | | | 8,942,760 |
CSL Ltd. | | 86,700 | | | 2,895,893 |
National Australia Bank Ltd. | | 303,200 | | | 7,650,058 |
| | | | | |
| | | | | 40,089,681 |
| | | | | |
Belgium — 0.6% | | | | | |
Anheuser-Busch InBev NV | | 206,400 | | | 10,381,493 |
| | | | | |
Bermuda — 1.0% | | | | | |
Arch Capital Group Ltd.(b) | | 71,300 | | | 5,436,625 |
Catlin Group Ltd. | | 474,400 | | | 2,594,103 |
Tyco Electronics Ltd. | | 380,400 | | | 10,453,392 |
| | | | | |
| | | | | 18,484,120 |
| | | | | |
Brazil — 2.8% | | | | | |
Banco Santander (Brasil) SA - ADR | | 282,500 | | | 3,511,475 |
BM&FBOVESPA SA | | 517,200 | | | 3,472,527 |
Cia de Bebidas DAS Americas | | 71,000 | | | 6,507,860 |
Cia Siderurgica Nacional SA - ADR | | 169,200 | | | 6,756,156 |
Companhia Energetica de Minas Gerais - CEMIG - ADR | | 459,205 | | | 7,641,171 |
Hypermarcas SA(b) | | 670,800 | | | 8,185,318 |
Usinas Siderurgicas de Minas Gerais SA - Class A, Preference Shares | | 269,400 | | | 9,275,655 |
Vale SA - ADR | | 234,000 | | | 7,532,460 |
| | | | | |
| | | | | 52,882,622 |
| | | | | |
Canada — 7.1% | | | | | |
Canadian National Railway Co. | | 153,100 | | | 9,291,669 |
Canadian Natural Resources Ltd. | | 135,200 | | | 10,006,384 |
Canadian Pacific Railway Ltd. | | 253,200 | | | 14,269,845 |
Eldorado Gold Corp.(b) | | 1,320,900 | | | 16,035,738 |
Enbridge, Inc. | | 301,900 | | | 14,398,696 |
EnCana Corp. | | 295,800 | | | 9,178,674 |
Magna International, Inc. - Class A(b) | | 143,300 | | | 8,863,105 |
Pacific Rubiales Energy Corp.(b) | | 430,400 | | | 8,360,943 |
Pan American Silver Corp. | | 503,300 | | | 11,651,395 |
Potash Corp. of Saskatchewan, Inc. | | 80,900 | | | 9,655,415 |
The Toronto-Dominion Bank | | 119,000 | | | 8,869,493 |
TransCanada Corp. | | 400,600 | | | 14,680,581 |
| | | | | |
| | | | | 135,261,938 |
| | | | | |
China — 2.0% | | | | | |
China Construction Bank Corp. - Class H | | 9,734,800 | | | 7,958,547 |
China Life Insurance Co. Ltd. - Class H | | 1,463,100 | | | 7,011,336 |
Focus Media Holding Ltd. - ADR(a)(b) | | 388,500 | | | 7,094,010 |
Hidili Industry International Development Ltd.(b) | | 7,317,300 | | | 7,942,451 |
Industrial & Commercial Bank of China - Class H | | 10,902,200 | | | 8,294,167 |
| | | | | |
| | | | | 38,300,511 |
| | | | | |
Denmark — 1.6% | | | | | |
A.P. Moller - Maersk A/S | | 945 | | | 7,202,122 |
FLSmidth & Co. A/S | | 230,000 | | | 15,929,650 |
TrygVesta A/S | | 104,800 | | | 6,914,581 |
| | | | | |
| | | | | 30,046,353 |
| | | | | |
Finland — 0.5% | | | | | |
Fortum Oyj | | 387,500 | | | 9,483,589 |
| | | | | |
France — 5.7% | | | | | |
AXA SA | | 287,600 | | | 6,380,398 |
BNP Paribas | | 50,070 | | | 3,837,715 |
Cap Gemini SA | | 156,600 | | | 7,699,498 |
Compagnie de Saint-Gobain | | 169,600 | | | 8,144,858 |
Eramet SA | | 45,000 | | | 15,438,708 |
GDF SUEZ | | 322,700 | | | 12,474,617 |
Renault SA(b) | | 149,700 | | | 6,994,335 |
Société Generale | | 80,100 | | | 5,027,077 |
Total SA | | 431,800 | | | 25,060,919 |
Unibail-Rodamco SE | | 41,100 | | | 8,320,716 |
Vivendi | | 355,800 | | | 9,514,339 |
| | | | | |
| | | | | 108,893,180 |
| | | | | |
Germany — 6.5% | | | | | |
Allianz SE | | 39,100 | | | 4,893,667 |
Bayerische Motoren Werke AG | | 159,100 | | | 7,339,826 |
Deutsche Boerse AG | | 44,400 | | | 3,285,080 |
Deutsche Lufthansa AG | | 1,023,400 | | | 16,962,474 |
Deutsche Telekom AG | | 724,600 | | | 9,792,081 |
Fresenius Medical Care AG & Co. KGaA | | 266,200 | | | 14,998,560 |
Gerry Weber International AG | | 181,332 | | | 6,294,932 |
Merck KGaA(b) | | 114,100 | | | 9,250,677 |
RWE AG | | 184,300 | | | 16,349,729 |
Siemens AG | | 187,100 | | | 18,694,572 |
Software AG | | 39,400 | | | 4,696,036 |
Volkswagen AG - Preference Shares | | 120,000 | | | 10,998,872 |
| | | | | |
| | | | | 123,556,506 |
| | | | | |
Gibraltar — 0.2% | | | | | |
PartyGaming Plc(b) | | 730,000 | | | 3,547,155 |
| | | | | |
Hong Kong — 2.2% | | | | | |
Cheung Kong (Holdings) Ltd. | | 1,005,300 | | | 12,927,196 |
China Mobile Ltd. | | 733,600 | | | 7,054,618 |
Hang Seng Bank Ltd. | | 297,900 | | | 4,144,932 |
New World Development Ltd. | | 4,156,700 | | | 8,116,926 |
REXLot Holdings Ltd. | | 38,400,700 | | | 5,484,105 |
Wing Hang Bank Ltd. | | 457,400 | | | 4,178,728 |
| | | | | |
| | | | | 41,906,505 |
| | | | | |
India — 1.7% | | | | | |
Bharti Airtel Ltd. | | 875,114 | | | 6,088,783 |
HDFC Bank Ltd. | | 197,800 | | | 8,528,216 |
State Bank of India Ltd. | | 171,100 | | | 7,911,417 |
Sterlite Industries India Ltd. - ADR | | 524,200 | | | 9,755,362 |
| | | | | |
| | | | | 32,283,778 |
| | | | | |
Indonesia — 0.3% | | | | | |
Adaro Energy PT | | 28,444,200 | | | 6,110,818 |
| | | | | |
Ireland — 0.5% | | | | | |
Covidien Plc | | 183,700 | | | 9,236,436 |
| | | | | |
Israel — 0.5% | | | | | |
Teva Pharmaceutical Industries Ltd. - ADR | | 153,300 | | | 9,670,164 |
| | | | | |
Italy — 2.5% | | | | | |
Benetton Group SpA | | 566,400 | | | 4,692,859 |
Enel SpA | | 1,510,500 | | | 8,442,136 |
ENI SpA | | 433,500 | | | 10,168,315 |
Fondiaria-Sai SpA | | 133,765 | | | 2,012,672 |
Intesa Sanpaolo SpA(b) | | 2,097,300 | | | 7,810,526 |
Parmalat SpA | | 2,612,000 | | | 7,155,009 |
UniCredit SpA(b) | | 1,260,359 | | | 3,716,251 |
Unione di Banche Italiane ScpA | | 308,300 | | | 4,158,613 |
| | | | | |
| | | | | 48,156,381 |
| | | | | |
See Notes to Financial Statements.
| | | | | | |
24 | | BLACKROCK FUNDS | | MARCH 31, 2010 | | |
| | |
| Schedule of Investments (continued) | | BlackRock International Opportunities Portfolio |
| | (Percentages shown are based on Net Assets) |
| | |
| | | | | |
Common Stocks | | Shares | | Value |
Japan — 14.8% | | | | | |
Air Water, Inc. | | 558,700 | | $ | 6,400,918 |
Amada Co. Ltd. | | 1,535,200 | | | 12,892,386 |
Asahi Breweries Ltd. | | 349,200 | | | 6,552,546 |
Bridgestone Corp. | | 420,500 | | | 7,196,405 |
Canon, Inc. | | 205,300 | | | 9,496,202 |
The Chiba Bank Ltd. | | 790,800 | | | 4,734,848 |
DA Office Investment Corp. | | 575 | | | 1,228,687 |
Fujitsu Ltd. | | 1,389,200 | | | 9,119,772 |
Hitachi High-Technologies Corp. | | 312,000 | | | 7,164,851 |
Honda Motor Co. Ltd. | | 535,600 | | | 18,879,199 |
Hoya Corp. | | 365,900 | | | 10,074,692 |
ITOCHU Corp. | | 1,434,000 | | | 12,586,473 |
Japan Prime Realty Investment Corp. | | 670 | | | 1,492,008 |
Japan Tobacco, Inc. | | 3,570 | | | 13,290,553 |
Kamigumi Co. Ltd. | | 649,200 | | | 5,226,448 |
KDDI Corp. | | 1,160 | | | 6,005,107 |
Konica Minolta Holdings, Inc. | | 818,200 | | | 9,569,963 |
Marubeni Corp. | | 2,253,700 | | | 14,027,494 |
Matsui Securities Co. Ltd. | | 436,500 | | | 3,126,077 |
Mitsubishi Heavy Industries Ltd. | | 2,580,700 | | | 10,705,495 |
Mitsubishi UFJ Financial Group, Inc. | | 1,627,900 | | | 8,532,887 |
Mitsui & Co. Ltd. | | 775,500 | | | 13,057,356 |
Mizuho Securities Co. Ltd.(b) | | 1,531,400 | | | 4,849,090 |
Nikon Corp. | | 474,700 | | | 10,378,384 |
Nomura Holdings, Inc. | | 1,188,000 | | | 8,717,126 |
NSK Ltd. | | 1,979,600 | | | 15,657,822 |
NTT Data Corp. | | 2,120 | | | 7,068,736 |
Panasonic Corp. | | 525,100 | | | 8,050,327 |
Sumitomo Mitsui Financial Group, Inc. | | 111,600 | | | 3,697,283 |
Tokio Marine Holdings, Inc. | | 300,800 | | | 8,479,905 |
West Japan Railway Co. | | 2,120 | | | 7,304,275 |
Zeon Corp. | | 2,667,200 | | | 15,596,298 |
| | | | | |
| | | | | 281,159,613 |
| | | | | |
Luxembourg — 0.8% | | | | | |
ArcelorMittal | | 323,200 | | | 14,170,884 |
| | | | | |
Malaysia — 1.0% | | | | | |
AMMB Holdings Berhad | | 4,747,600 | | | 7,271,961 |
CIMB Group Holdings Berhad | | 2,706,200 | | | 11,659,531 |
| | | | | |
| | | | | 18,931,492 |
| | | | | |
Mexico — 0.6% | | | | | |
Fomento Economico Mexicano SAB de CV - ADR | | 198,200 | | | 9,420,446 |
Grupo Mexico SA - Series B | | 917,600 | | | 2,466,972 |
| | | | | |
| | | | | 11,887,418 |
| | | | | |
Netherlands — 2.6% | | | | | |
Aegon NV(b) | | 1,425,100 | | | 9,728,341 |
Corio NV | | 28,600 | | | 1,908,632 |
Koninklijke KPN NV | | 519,600 | | | 8,245,555 |
Royal Dutch Shell Plc - A Shares | | 955,000 | | | 27,617,241 |
Wereldhave NV(b) | | 14,200 | | | 1,362,121 |
| | | | | |
| | | | | 48,861,890 |
| | | | | |
New Zealand — 0.4% | | | | | |
Telecom Corp. of New Zealand Ltd. | | 4,387,300 | | | 6,746,798 |
| | | | | |
Norway — 0.4% | | | | | |
StatoilHydro ASA | | 322,600 | | | 7,506,697 |
| | | | | |
Philippines — 0.3% | | | | | |
Philippine Long Distance Telephone Co. - ADR(a) | | 104,200 | | | 5,551,776 |
| | | | | |
Russia — 0.3% | | | | | |
Vimpel-Communications - ADR | | 302,900 | | | 5,576,389 |
| | | | | |
Singapore — 1.9% | | | | | |
CapitaLand Ltd. | | 1,629,700 | | | 4,614,124 |
DBS Group Holdings Ltd. | | 651,600 | | | 6,643,556 |
Singapore Telecommunications Ltd. | | 3,525,800 | | | 7,975,526 |
Straits Asia Resources Ltd. | | 3,666,700 | | | 5,648,102 |
Wilmar International Ltd. | | 2,207,200 | | | 10,549,072 |
| | | | | |
| | | | | 35,430,380 |
| | | | | |
South Africa — 0.7% | | | | | |
MTN Group Ltd. | | 418,200 | | | 6,419,684 |
Naspers Ltd. - N Shares | | 177,900 | | | 7,713,512 |
| | | | | |
| | | | | 14,133,196 |
| | | | | |
South Korea — 2.8% | | | | | |
Hynix Semiconductor, Inc.(b) | | 460,100 | | | 10,858,198 |
Hyosung Corp. | | 127,406 | | | 9,156,270 |
Korea Electric Power Corp.(b) | | 266,000 | | | 8,631,595 |
Korea Zinc Co. Ltd. | | 41,900 | | | 7,473,338 |
Korean Air Lines Co. Ltd.(b) | | 22,150 | | | 1,301,416 |
Samsung Electronics Co. Ltd. | | 20,800 | | | 15,038,281 |
| | | | | |
| | | | | 52,459,098 |
| | | | | |
Spain — 1.8% | | | | | |
Banco Santander SA | | 1,122,500 | | | 14,888,938 |
Inditex SA | | 114,400 | | | 7,545,309 |
Telefonica SA | | 522,500 | | | 12,380,452 |
| | | | | |
| | | | | 34,814,699 |
| | | | | |
Sweden — 1.4% | | | | | |
Atlas Copco AB - A Shares | | 506,600 | | | 7,851,559 |
Nordea Bank AB | | 819,700 | | | 8,079,868 |
Svenska Cellulosa AB - B Shares(b) | | 795,200 | | | 11,212,060 |
| | | | | |
| | | | | 27,143,487 |
| | | | | |
Switzerland — 9.1% | | | | | |
Adecco SA | | 296,400 | | | 16,827,121 |
Alcon, Inc. | | 58,000 | | | 9,370,480 |
Clariant AG(b) | | 1,277,700 | | | 16,264,297 |
Credit Suisse Group AG | | 167,800 | | | 8,637,070 |
GAM Holding Ltd. | | 151,700 | | | 1,860,304 |
Givaudan SA - Registered Shares | | 9,600 | | | 8,418,622 |
Julius Baer Group Ltd. | | 281,400 | | | 10,185,257 |
Nestle SA | | 359,000 | | | 18,395,880 |
Novartis AG | | 670,200 | | | 36,253,765 |
Roche Holding AG | | 105,100 | | | 17,069,348 |
Sonova Holding AG | | 74,500 | | | 9,246,981 |
Swiss Reinsurance Co. Ltd.(b) | | 145,400 | | | 7,134,116 |
UBS AG(b) | | 390,700 | | | 6,355,871 |
Zurich Financial Services AG | | 23,400 | | | 6,001,953 |
| | | | | |
| | | | | 172,021,065 |
| | | | | |
Taiwan — 3.2% | | | | | |
AU Optronics Corp. - ADR(a) | | 849,258 | | | 9,622,093 |
China Airlines Ltd.(b) | | 20,172,415 | | | 7,357,393 |
Chunghwa Telecom Co. Ltd. - ADR | | 378,109 | | | 7,346,658 |
Hon Hai Precision Industry Co. Ltd. | | 1,694,400 | | | 7,336,767 |
Mega Financial Holding Co. Ltd. | | 8,087,300 | | | 4,688,364 |
Polaris Securities Co. Ltd.(b) | | 8,085,704 | | | 4,203,286 |
Siliconware Precision Industries Co. - ADR(a) | | 1,131,700 | | | 6,801,517 |
Taishin Financial Holdings Co. Ltd.(b) | | 7 | | | 3 |
See Notes to Financial Statements.
| | | | | | |
| | | BLACKROCK FUNDS | | MARCH 31, 2010 | | 25 |
| | |
| Schedule of Investments (continued) | | Blackrock International Opportunities Portfolio |
| | (Percentages shown are based on Net Assets) |
| | | | | | |
Common Stocks | | Shares | | Value | |
Taiwan (concluded) | | | | | | |
Taiwan Semiconductor Manufacturing Co. Ltd. - ADR | | 967,400 | | $ | 10,148,026 | |
Yuanta Financial Holding Co. Ltd. | | 6,039,500 | | | 3,623,390 | |
| | | | | | |
| | | | | 61,127,497 | |
| | | | | | |
Thailand — 0.6% | | | | | | |
Bangkok Bank Public Co. Ltd. | | 1,097,900 | | | 4,223,029 | |
Banpu Public Co. Ltd. | | 346,000 | | | 6,517,012 | |
| | | | | | |
| | | | | 10,740,041 | |
| | | | | | |
United Kingdom — 13.5% | | | | | | |
Aegis Group Plc | | 2,185,000 | | | 4,224,951 | |
Anglo American Plc(b) | | 227,100 | | | 9,885,449 | |
Antofagasta Plc | | 641,400 | | | 10,128,016 | |
ARM Holdings Plc | | 2,403,600 | | | 8,615,458 | |
Barclays Plc | | 2,217,200 | | | 12,073,049 | |
BG Group Plc | | 1,094,700 | | | 18,957,793 | |
BP Plc | | 2,199,300 | | | 20,816,679 | |
British Airways Plc(b) | | 4,557,400 | | | 16,854,188 | |
Britvic Plc | | 1,521,900 | | | 10,698,810 | |
Domino’s Pizza UK & IRL Plc | | 1,266,000 | | | 6,491,543 | |
GlaxoSmithKline Plc | | 447,400 | | | 8,587,726 | |
HSBC Holdings Plc | | 1,649,899 | | | 16,719,901 | |
Imperial Tobacco Group Plc | | 612,200 | | | 18,679,047 | |
Inchcape Plc(b) | | 15,791,200 | | | 7,063,555 | |
InterContinental Hotels Group Plc | | 404,404 | | | 6,330,174 | |
International Power Plc | | 1,432,700 | | | 6,956,551 | |
Johnson Matthey Plc | | 384,400 | | | 10,204,391 | |
Next Plc | | 189,400 | | | 6,221,752 | |
Prudential Plc | | 754,400 | | | 6,240,881 | |
Standard Chartered Plc | | 73,700 | | | 2,008,861 | |
Tesco Plc | | 1,772,500 | | | 11,718,985 | |
Unilever Plc | | 377,900 | | | 11,062,875 | |
Vodafone Group Plc | | 3,352,500 | | | 7,754,045 | |
Vodafone Group Plc - ADR | | 342,100 | | | 7,967,509 | |
WPP Plc | | 980,500 | | | 10,146,012 | |
| | | | | | |
| | | | | 256,408,201 | |
| | | | | | |
United States — 1.4% | | | | | | |
Amkor Technology, Inc.(a)(b) | | 931,400 | | | 6,584,998 | |
The Mosaic Co. | | 130,300 | | | 7,918,331 | |
NII Holdings, Inc.(b) | | 176,200 | | | 7,340,492 | |
ResMed, Inc. - CDI(b) | | 855,800 | | | 5,497,274 | |
| | | | | | |
| | | | | 27,341,095 | |
| | | | | | |
Total Common Stocks — 95.4% | | | | | 1,810,302,946 | |
| | | | | | |
Rights — 0.0% | | | | | | |
Volkswagen AG, Expires 4/13/10(b) | | 111,300 | | | 69,151 | |
| | | | | | |
| | |
Warrant | | Shares | | | |
Italy — 0.0% | | | | | | |
Unione di Banche Italiane ScpA
(issued/exercisable 5/18/09, 1 share for 20 warrants, Expires 6/30/11, strike price 12.30 EUR)(b) | | 261,800 | | | 12,942 | |
| | | | | | |
Total Long-Term Investments
(Cost — $1,619,930,194) — 95.4% | | | | | 1,810,385,039 | |
| | | | | | |
| | |
Short-Term Securities | | Shares/
Beneficial
Interest | | Value | |
BlackRock Liquidity Funds, TempFund, Institutional Class, 0.11%(c)(d) | | 90,500,592 | | $ | 90,500,592 | |
BlackRock Liquidity Series, LLC Money Market Series, 0.22%(c)(d)(e) | | 32,364,600 | | | 32,364,600 | |
| | | | | | |
Total Short-Term Securities
(Cost — $122,865,192) — 6.5% | | | | | 122,865,192 | |
| | | | | | |
Total Investments (Cost — $1,742,795,386*) — 101.9% | | | | | 1,933,250,231 | |
Liabilities in Excess of Other Assets — (1.9)% | | | | | (35,732,013 | ) |
| | | | | | |
Net Assets — 100.0% | | | | $ | 1,897,518,218 | |
| | | | | | |
| * | The cost and unrealized appreciation (depreciation) of investments as of March 31, 2010, as computed for federal income tax purposes, were as follows: |
| | | | |
Aggregate cost | | $ | 1,758,018,231 | |
| | | | |
Gross unrealized appreciation | | $ | 204,218,276 | |
Gross unrealized depreciation | | | (28,986,276 | ) |
| | | | |
Net unrealized appreciation | | $ | 175,232,000 | |
| | | | |
| (a) | Security, or a portion of security, is on loan. |
| (b) | Non-income producing security. |
| (c) | Investments in companies considered to be an affiliate of the Fund, for purposes of Section 2(a)(3) of the Investment Company Act of 1940, were as follows: |
| | | | | | | | | |
Affiliate | | Net
Activity | | Realized
Gain | | Income |
BlackRock Liquidity Funds, TempFund, Institutional Class | | $ | 43,870,731 | | $ | 248 | | $ | 41,655 |
BlackRock Liquidity Series, LLC Money Market Series | | $ | 3,791,100 | | | — | | $ | 28,821 |
| (d) | Represents the current yield as of report date. |
| (e) | Security was purchased with the cash collateral from loaned securities. |
| • | Foreign currency exchange contracts as of March 31, 2010 were as follows: |
| | | | | | | | | | | | |
Currency
Purchased | | Currency
Sold | | Counterparty | | Settlement
Date | | Unrealized
Appreciation
(Depreciation) | |
| CHF | 915,000 | | USD | 857,947 | | Citibank, N.A. | | 4/01/10 | | $ | 9,846 | |
| CHF | 4,086,000 | | USD | 3,837,034 | | Citibank, N.A. | | 4/01/10 | | | 38,156 | |
| GBP | 223,000 | | USD | 334,052 | | Deutsche Bank AG | | 4/01/10 | | | 4,349 | |
| GBP | 1,397,000 | | USD | 2,109,191 | | Citibank, N.A. | | 4/01/10 | | | 10,753 | |
JPY
| 1,184,807,000
| | USD | 12,756,320 | | Citibank, N.A. | | 4/01/10 | | | (83,232 | ) |
| USD | 4,241,797 | | JPY | 392,910,000 | | Citibank, N.A. | | 4/01/10 | | | 39,101 | |
| CAD | 2,308,000 | | USD | 2,274,349 | | Citibank, N.A. | | 4/05/10 | | | (1,912 | ) |
| JPY | 475,854,000 | | USD | 5,091,591 | | Citibank, N.A. | | 4/05/10 | | | (1,699 | ) |
| CHF | 1,708,000 | | USD | 1,622,649 | | Citibank, N.A. | | 4/06/10 | | | (2,770 | ) |
| GBP | 1,197,000 | | USD | 1,812,617 | | Deutsche Bank AG | | 4/06/10 | | | 3,827 | |
| MXN | 15,785,000 | | USD | 1,281,864 | | UBS AG | | 4/06/10 | | | (5,148 | ) |
| CHF | 12,359,000 | | USD | 11,742,618 | | Citibank, N.A. | | 4/07/10 | | | (11,445 | ) |
| GBP | 1,064,000 | | USD | 1,617,168 | | UBS AG | | 4/07/10 | | | (2,551 | ) |
| HKD | 18,591,000 | | USD | 2,394,297 | | Deutsche Bank AG | | 4/07/10 | | | 139 | |
| NOK | 44,045,000 | | USD | 7,397,363 | | Citibank, N.A. | | 4/07/10 | | | 11,254 | |
See Notes to Financial Statements.
| | |
| Schedule of Investments (continued) | | BlackRock International Opportunities Portfolio |
| | (Percentages shown are based on Net Assets) |
| | | | | | | | | | | | |
Currency
Purchased | | Currency
Sold | | Counterparty | | Settlement
Date | | Unrealized
Appreciation
(Depreciation) | |
| USD | 6,810,160 | | CAD | 6,875,000 | | Citibank, N.A. | | 4/07/10 | | $ | 41,120 | |
| USD | 1,996,390 | | CHF | 2,128,000 | | BNP Paribas | | 4/07/10 | | | (21,931 | ) |
| USD | 756,534 | | CHF | 805,000 | | Citibank, N.A. | | 4/07/10 | | | (6,975 | ) |
| USD | 8,940,165 | | CHF | 9,426,000 | | Citibank, N.A. | | 4/07/10 | | | (9 | ) |
| USD | 1,083,099 | | DKK | 5,916,000 | | Citibank, N.A. | | 4/07/10 | | | 9,822 | |
| USD | 4,488,602 | | EUR | 3,361,000 | | Citibank, N.A. | | 4/07/10 | | | (50,984 | ) |
| USD | 4,644,056 | | EUR | 3,380,000 | | Citibank, N.A. | | 4/07/10 | | | 78,807 | |
| USD | 2,395,765 | | HKD | 18,591,000 | | Citibank, N.A. | | 4/07/10 | | | 1,201 | |
| USD | 7,419,479 | | NOK | 44,045,000 | | Deutsche Bank AG | | 4/07/10 | | | 8,489 | |
| USD | 2,385,541 | | ZAR | 17,750,000 | | Citibank, N.A. | | 4/07/10 | | | (48,350 | ) |
| CAD | 2,691,413 | | USD | 2,600,000 | | Citibank, N.A. | | 4/21/10 | | | 49,914 | |
| JPY | 114,425,000 | | USD | 1,265,881 | | Citibank, N.A. | | 4/21/10 | | | (41,811 | ) |
| USD | 11,580,742 | | CHF | 12,471,000 | | Citibank, N.A. | | 4/21/10 | | | (248,793 | ) |
| USD | 2,862,059 | | GBP | 1,833,000 | | Citibank, N.A. | | 4/21/10 | | | 80,842 | |
| USD | 15,321,275 | | GBP | 9,803,000 | | Citibank, N.A. | | 4/21/10 | | | 447,149 | |
| AUD | 69,275,000 | | USD | 63,505,085 | | Citibank, N.A. | | 4/27/10 | | | (120,615 | ) |
| AUD | 18,710,000 | | USD | 16,899,246 | | BNP Paribas | | 4/27/10 | | | 219,822 | |
| AUD | 7,945,000 | | USD | 6,846,365 | | Citibank, N.A. | | 4/27/10 | | | 423,063 | |
| CAD | 14,580,000 | | USD | 14,418,185 | | Citibank, N.A. | | 4/27/10 | | | (63,037 | ) |
| CAD | 668,000 | | USD | 654,966 | | Deutsche Bank AG | | 4/27/10 | | | 2,732 | |
| CAD | 992,000 | | USD | 930,146 | | Citibank, N.A. | | 4/27/10 | | | 46,555 | |
| CAD | 6,326,000 | | USD | 6,167,489 | | Citibank, N.A. | | 4/27/10 | | | 60,951 | |
| CAD | 19,840,000 | | USD | 19,470,451 | | Citibank, N.A. | | 4/27/10 | | | 63,578 | |
| CAD | 1,759,000 | | USD | 1,665,612 | | Morgan Stanley & Co. | | 4/27/10 | | | 66,260 | |
| CAD | 2,194,000 | | USD | 2,091,456 | | Deutsche Bank AG | | 4/27/10 | | | 68,708 | |
| CAD | 1,488,000 | | USD | 1,393,552 | | Citibank, N.A. | | 4/27/10 | | | 71,500 | |
| CAD | 2,665,000 | | USD | 2,526,821 | | Citibank, N.A. | | 4/27/10 | | | 97,080 | |
| CAD | 3,242,000 | | USD | 3,044,134 | | Deutsche Bank AG | | 4/27/10 | | | 147,868 | |
| CAD | 6,323,100 | | USD | 6,016,173 | | Citibank, N.A. | | 4/27/10 | | | 209,413 | |
| CAD | 46,571,000 | | USD | 44,329,058 | | Morgan Stanley & Co. | | 4/27/10 | | | 1,523,727 | |
| CHF | 9,576,000 | | USD | 8,860,735 | | Citibank, N.A. | | 4/27/10 | | | 223,138 | |
| DKK | 17,432,000 | | USD | 3,193,207 | | Citibank, N.A. | | 4/27/10 | | | (31,188 | ) |
| EUR | 89,655,000 | | USD | 122,606,084 | | Citibank, N.A. | | 4/27/10 | | | (1,509,885 | ) |
| EUR | 6,883,000 | | USD | 9,455,095 | | Citibank, N.A. | | 4/27/10 | | | (158,289 | ) |
| EUR | 4,657,000 | | USD | 6,367,991 | | Deutsche Bank AG | | 4/27/10 | | | (77,824 | ) |
| EUR | 3,912,000 | | USD | 5,306,851 | | Citibank, N.A. | | 4/27/10 | | | (22,948 | ) |
| EUR | 1,572,000 | | USD | 2,137,926 | | Deutsche Bank AG | | 4/27/10 | | | (14,640 | ) |
| EUR | 8,184,000 | | USD | 11,056,282 | | Deutsche Bank AG | | 4/27/10 | | | (2,227 | ) |
| EUR | 5,750,000 | | USD | 7,746,883 | | Citibank, N.A. | | 4/27/10 | | | 19,590 | |
| GBP | 35,294,000 | | USD | 57,173,633 | | Morgan Stanley & Co. | | 4/27/10 | | | (3,623,871 | ) |
| GBP | 5,285,000 | | USD | 8,577,238 | | Citibank, N.A. | | 4/27/10 | | | (558,581 | ) |
| GBP | 2,477,000 | | USD | 3,964,000 | | Deutsche Bank AG | | 4/27/10 | | | (205,776 | ) |
| GBP | 1,495,000 | | USD | 2,306,682 | | Citibank, N.A. | | 4/27/10 | | | (38,396 | ) |
| GBP | 2,490,000 | | USD | 3,729,759 | | Deutsche Bank AG | | 4/27/10 | | | 48,190 | |
| HKD | 41,815,000 | | USD | 5,388,384 | | Deutsche Bank AG | | 4/27/10 | | | (1,694 | ) |
| HKD | 41,613,000 | | USD | 5,362,010 | | Deutsche Bank AG | | 4/27/10 | | | (1,342 | ) |
| HKD | 41,574,000 | | USD | 5,355,598 | | Citibank, N.A. | | 4/27/10 | | | 46 | |
| HKD | 19,435,000 | | USD | 2,502,142 | | Deutsche Bank AG | | 4/27/10 | | | 1,512 | |
| JPY | 2,811,780,000 | | USD | 31,132,310 | | UBS AG | | 4/27/10 | | | (1,052,078 | ) |
| JPY | 910,777,000 | | USD | 10,124,739 | | Deutsche Bank AG | | 4/27/10 | | | (381,308 | ) |
| JPY | 792,267,000 | | USD | 8,795,188 | | Citibank, N.A. | | 4/27/10 | | | (319,569 | ) |
| JPY | 252,200,000 | | USD | 2,815,291 | | Deutsche Bank AG | | 4/27/10 | | | (117,273 | ) |
| JPY | 444,600,000 | | USD | 4,833,139 | | Deutsche Bank AG | | 4/27/10 | | | (76,838 | ) |
| JPY | 184,307,000 | | USD | 2,034,547 | | Citibank, N.A. | | 4/27/10 | | | (62,844 | ) |
| JPY | 392,910,000 | | USD | 4,242,291 | | Citibank, N.A. | | 4/27/10 | | | (38,967 | ) |
| NOK | 9,428,000 | | USD | 1,583,817 | | Deutsche Bank AG | | 4/27/10 | | | 575 | |
| NOK | 64,654,000 | | USD | 10,852,794 | | Deutsche Bank AG | | 4/27/10 | | | 12,423 | |
| NOK | 44,897,000 | | USD | 7,503,394 | | Deutsche Bank AG | | 4/27/10 | | | 41,625 | |
| SEK | 143,489,000 | | USD | 20,329,525 | | Citibank, N.A. | | 4/27/10 | | | (456,226 | ) |
| SEK | 53,855,000 | | USD | 7,636,278 | | Deutsche Bank AG | | 4/27/10 | | | (177,333 | ) |
| USD | 63,135,933 | | AUD | 71,827,000 | | Citibank, N.A. | | 4/27/10 | | | (2,583,538 | ) |
| USD | 2,379,156 | | AUD | 2,739,000 | | Citibank, N.A. | | 4/27/10 | | | (126,944 | ) |
| USD | 1,411,126 | | AUD | 1,574,000 | | Citibank, N.A. | | 4/27/10 | | | (29,035 | ) |
| USD | 877,104 | | AUD | 981,000 | | Citibank, N.A. | | 4/27/10 | | | (20,480 | ) |
| USD | 87,964 | | AUD | 99,000 | | Deutsche Bank AG | | 4/27/10 | | | (2,618 | ) |
| USD | 5,644,771 | | CAD | 5,918,000 | | Royal Bank of Scotland Plc | | 4/27/10 | | | (181,962 | ) |
| USD | 4,784,482 | | CAD | 4,985,000 | | Citibank, N.A. | | 4/27/10 | | | (123,639 | ) |
| USD | 4,821,539 | | CAD | 4,967,000 | | Citibank, N.A. | | 4/27/10 | | | (68,860 | ) |
| USD | 19,471,693 | | CAD | 19,840,000 | | Citibank, N.A. | | 4/27/10 | | | (62,336 | ) |
| USD | 3,691,662 | | CAD | 3,790,000 | | Citibank, N.A. | | 4/27/10 | | | (39,889 | ) |
| USD | 3,297,177 | | CAD | 3,389,000 | | Citibank, N.A. | | 4/27/10 | | | (39,558 | ) |
| USD | 5,933,456 | | CAD | 6,000,000 | | Citibank, N.A. | | 4/27/10 | | | 25,988 | |
| USD | 3,637,231 | | CHF | 3,879,500 | | Citibank, N.A. | | 4/27/10 | | | (42,895 | ) |
| USD | 3,837,867 | | CHF | 4,086,000 | | Citibank, N.A. | | 4/27/10 | | | (38,147 | ) |
| USD | 13,254,892 | | CHF | 14,005,000 | | Citibank, N.A. | | 4/27/10 | | | (30,367 | ) |
| USD | 3,400,768 | | CHF | 3,594,000 | | Citibank, N.A. | | 4/27/10 | | | (8,530 | ) |
| USD | 3,915,210 | | CHF | 4,076,000 | | Citibank, N.A. | | 4/27/10 | | | 48,683 | |
| USD | 21,073,643 | | CHF | 21,748,000 | | Citibank, N.A. | | 4/27/10 | | | 443,310 | |
| USD | 17,748,043 | | DKK | 94,074,000 | | Royal Bank of Scotland Plc | | 4/27/10 | | | 683,808 | |
| USD | 16,945,644 | | EUR | 12,665,000 | | BNP Paribas | | 4/27/10 | | | (160,857 | ) |
| USD | 3,337,386 | | EUR | 2,480,000 | | Citibank, N.A. | | 4/27/10 | | | (12,328 | ) |
| USD | 4,633,898 | | EUR | 3,437,000 | | Citibank, N.A. | | 4/27/10 | | | (8,427 | ) |
| USD | 2,130,889 | | EUR | 1,578,000 | | Citibank, N.A. | | 4/27/10 | | | (502 | ) |
| USD | 115,584 | | EUR | 85,000 | | Citibank, N.A. | | 4/27/10 | | | 775 | |
| USD | 2,116,682 | | EUR | 1,553,000 | | Citibank, N.A. | | 4/27/10 | | | 19,059 | |
| USD | 554,643 | | EUR | 393,000 | | Citibank, N.A. | | 4/27/10 | | | 23,822 | |
See Notes to Financial Statements.
| | | | | | |
| | | BLACKROCK FUNDS | | MARCH 31, 2010 | | 27 |
| | |
| Schedule of Investments (continued) | | BlackRock International Opportunities Portfolio |
| | | | | | | | | | | | |
Currency
Purchased | | Currency
Sold | | Counterparty | | Settlement
Date | | Unrealized
Appreciation
(Depreciation) | |
| USD | 3,220,039 | | EUR | 2,363,000 | | Citibank, N.A. | | 4/27/10 | | $ | 28,356 | |
| USD | 6,173,184 | | EUR | 4,518,500 | | Citibank, N.A. | | 4/27/10 | | | 70,086 | |
| USD | 6,413,850 | | EUR | 4,656,000 | | Citibank, N.A. | | 4/27/10 | | | 125,032 | |
| USD | 4,751,909 | | EUR | 3,413,000 | | Citibank, N.A. | | 4/27/10 | | | 142,001 | |
| USD | 10,299,488 | | EUR | 7,504,000 | | Citibank, N.A. | | 4/27/10 | | | 163,903 | |
| USD | 25,650,736 | | EUR | 18,830,000 | | Morgan Stanley & Co. | | 4/27/10 | | | 217,225 | |
| USD | 7,358,828 | | EUR | 5,268,000 | | Citibank, N.A. | | 4/27/10 | | | 243,388 | |
| USD | 6,958,169 | | EUR | 4,961,000 | | Citibank, N.A. | | 4/27/10 | | | 257,391 | |
| USD | 6,993,372 | | EUR | 4,967,000 | | Deutsche Bank AG | | 4/27/10 | | | 284,490 | |
| USD | 2,649,826 | | GBP | 1,774,000 | | Deutsche Bank AG | | 4/27/10 | | | (41,773 | ) |
| USD | 2,108,858 | | GBP | 1,397,000 | | Citibank, N.A. | | 4/27/10 | | | (10,738 | ) |
| USD | 657,038 | | GBP | 432,000 | | Citibank, N.A. | | 4/27/10 | | | 1,587 | |
| USD | 6,644,351 | | GBP | 4,357,000 | | Morgan Stanley & Co. | | 4/27/10 | | | 33,700 | |
| USD | 3,632,062 | | GBP | 2,311,000 | | Citibank, N.A. | | 4/27/10 | | | 125,702 | |
| USD | 8,432,497 | | GBP | 5,473,000 | | Deutsche Bank AG | | 4/27/10 | | | 128,597 | |
| USD | 4,294,667 | | GBP | 2,742,500 | | Citibank, N.A. | | 4/27/10 | | | 133,614 | |
| USD | 14,698,087 | | HKD | 114,155,000 | | Morgan Stanley & Co. | | 4/27/10 | | | (7,583 | ) |
| USD | 558,145 | | HKD | 4,335,000 | | Deutsche Bank AG | | 4/27/10 | | | (298 | ) |
| USD | 532,981 | | HKD | 4,139,000 | | Citibank, N.A. | | 4/27/10 | | | (213 | ) |
| USD | 1,729,280 | | JPY | 157,659,000 | | Citibank, N.A. | | 4/27/10 | | | 42,655 | |
| USD | 1,964,345 | | JPY | 176,986,500 | | Citibank, N.A. | | 4/27/10 | | | 70,955 | |
| USD | 2,863,362 | | JPY | 260,860,000 | | Citibank, N.A. | | 4/27/10 | | | 72,699 | |
| USD | 12,757,735 | | JPY | 1,184,807,000 | | Citibank, N.A. | | 4/27/10 | | | 82,749 | |
| USD | 2,677,507 | | JPY | 242,037,000 | | Citibank, N.A. | | 4/27/10 | | | 88,212 | |
| USD | 2,383,817 | | JPY | 214,298,000 | | Citibank, N.A. | | 4/27/10 | | | 91,272 | |
| USD | 7,096,840 | | JPY | 632,667,000 | | Citibank, N.A. | | 4/27/10 | | | 328,612 | |
| USD | 14,290,429 | | JPY | 1,302,121,000 | | Deutsche Bank AG | | 4/27/10 | | | 360,426 | |
| USD | 3,044,287 | | NOK | 18,020,000 | | Citibank, N.A. | | 4/27/10 | | | 15,995 | |
| USD | 17,112,838 | | NOK | 100,000,000 | | Deutsche Bank AG | | 4/27/10 | | | 307,665 | |
| USD | 1,595,492 | | NZD | 2,260,000 | | Citibank, N.A. | | 4/27/10 | | | (7,010 | ) |
| USD | 2,029,444 | | SEK | 14,753,000 | | Citibank, N.A. | | 4/27/10 | | | (13,854 | ) |
| USD | 2,823,475 | | SEK | 20,405,000 | | Citibank, N.A. | | 4/27/10 | | | (2,628 | ) |
| USD | 2,521,139 | | SEK | 18,217,000 | | Morgan Stanley & Co. | | 4/27/10 | | | (1,925 | ) |
| USD | 4,329,103 | | SEK | 31,221,000 | | Royal Bank of Scotland Plc | | 4/27/10 | | | 4,979 | |
| USD | 4,602,718 | | SEK | 33,169,000 | | Citibank, N.A. | | 4/27/10 | | | 8,795 | |
| USD | 16,181,911 | | SGD | 22,527,000 | | Deutsche Bank AG | | 4/27/10 | | | 81,349 | |
| | | | | | | | | | | | |
| | Total | | | | | | | | | $ | (4,367,288 | ) |
| | | | | | | | | | | | |
| • | | Fair Value Measurements - Various inputs are used in determining the fair value of investments, which are as follows: |
| | • | | Level 1 – price quotations in active markets/exchanges for identical assets and liabilities |
| | • | | Level 2 – other observable inputs (including, but not limited to: quoted prices for similar assets or liabilities in markets that are active, quoted prices for identical or similar assets or liabilities in markets that are not active, inputs other than quoted prices that are observable for the assets or liabilities (such as interest rates, yield curves, volatilities, prepayment speeds, loss severities, credit risks and default rates) or other market–corroborated inputs) |
| | • | | Level 3 – unobservable inputs based on the best information available in the circumstances, to the extent observable inputs are not available (including the Fund’s own assumptions used in determining the fair value of investments) |
The inputs or methodologies used for valuing securities are not necessarily an indication of the risk associated with investing in those securities. For information about the Fund’s policy regarding valuation of investments and other significant accounting policies, please refer to Note 1 of the Notes to Financial Statements.
The following tables summarize the inputs used as of March 31, 2010 in determining the fair valuation of the Fund’s investments:
| | | | | | | | | | | |
| | | Investments in Securities |
Valuation Inputs | | Level 1 | | Level 2 | | Level 3 | | Total |
Assets: | | | | | | | | | | | |
Common Stocks: | | | | | | | | | | | |
Australia | | $ | 11,341,184 | | $ | 28,748,497 | | — | | $ | 40,089,681 |
Belgium | | | — | | | 10,381,493 | | — | | | 10,381,493 |
Bermuda | | | 15,890,017 | | | 2,594,103 | | — | | | 18,484,120 |
Brazil | | | 52,882,622 | | | — | | — | | | 52,882,622 |
Canada | | | 135,261,938 | | | — | | — | | | 135,261,938 |
China | | | 7,094,010 | | | 31,206,501 | | — | | | 38,300,511 |
Denmark | | | — | | | 30,046,353 | | — | | | 30,046,353 |
Finland | | | — | | | 9,483,589 | | — | | | 9,483,589 |
France | | | — | | | 108,893,180 | | — | | | 108,893,180 |
Germany | | | — | | | 123,556,506 | | — | | | 123,556,506 |
Gibralter | | | — | | | 3,547,155 | | — | | | 3,547,155 |
Hong Kong | | | — | | | 41,906,505 | | — | | | 41,906,505 |
India | | | 9,755,362 | | | 22,528,416 | | — | | | 32,283,778 |
Indonesia | | | — | | | 6,110,818 | | — | | | 6,110,818 |
Ireland | | | 9,236,436 | | | — | | — | | | 9,236,436 |
Israel | | | 9,670,164 | | | — | | — | | | 9,670,164 |
Italy | | | — | | | 48,156,381 | | — | | | 48,156,381 |
See Notes to Financial Statements.
| | | | | | |
28 | | BLACKROCK FUNDS | | MARCH 31, 2010 | | |
| | |
| Schedule of Investments (concluded) | | BlackRock International Opportunities Portfolio |
| | | | | | | | | | | | | |
| | | Investments in Securities | |
Valuation Inputs | | Level 1 | | Level 2 | | | Level 3 | | Total | |
Japan | | | — | | $ | 281,159,613 | | | — | | $ | 281,159,613 | |
Luxembourg | | | — | | | 14,170,884 | | | — | | | 14,170,884 | |
Malaysia | | | — | | | 18,931,492 | | | — | | | 18,931,492 | |
Mexico | | $ | 11,887,418 | | | — | | | — | | | 11,887,418 | |
Netherlands | | | — | | | 48,861,890 | | | — | | | 48,861,890 | |
New Zealand | | | — | | | 6,746,798 | | | — | | | 6,746,798 | |
Norway | | | — | | | 7,506,697 | | | — | | | 7,506,697 | |
Philippines | | | 5,551,776 | | | — | | | — | | | 5,551,776 | |
Russia | | | 5,576,389 | | | — | | | — | | | 5,576,389 | |
Singapore | | | — | | | 35,430,380 | | | — | | | 35,430,380 | |
South Africa | | | — | | | 14,133,196 | | | — | | | 14,133,196 | |
South Korea | | | — | | | 52,459,098 | | | — | | | 52,459,098 | |
Spain | | | — | | | 34,814,699 | | | — | | | 34,814,699 | |
Sweden | | | — | | | 27,143,487 | | | — | | | 27,143,487 | |
Switzerland | | | 9,370,480 | | | 162,650,585 | | | — | | | 172,021,065 | |
Taiwan | | | 33,918,294 | | | 27,209,203 | | | — | | | 61,127,497 | |
Thailand | | | — | | | 10,740,041 | | | — | | | 10,740,041 | |
United Kingdom | | | 7,967,509 | | | 248,440,692 | | | — | | | 256,408,201 | |
United States | | | 27,341,095 | | | — | | | — | | | 27,341,095 | |
Rights | | | — | | | 69,151 | | | — | | | 69,151 | |
Warrant | | | 12,942 | | | — | | | — | | | 12,942 | |
Short-Term Securities | | | 90,500,592 | | | 32,364,600 | | | — | | | 122,865,192 | |
| | | | | | | | | | | | | |
Total | | $ | 443,258,228 | | $ | 1,489,992,003 | | | — | | $ | 1,933,250,231 | |
| | | | | | | | | | | | | |
| |
| | | Other Financial Instruments1 | |
Valuation Inputs | | Level 1 | | Level 2 | | | Level 3 | | Total | |
Assets | | | — | | $ | 8,940,005 | | | — | | $ | 8,940,005 | |
Liabilities | | | — | | | (13,307,293 | ) | | — | | | (13,307,293 | ) |
| | | | | | | | | | | | | |
Total | | | — | | $ | (4,367,288 | ) | | — | | $ | (4,367,288 | ) |
| | | | | | | | | | | | | |
| 1 | Other financial instruments are foreign currency exchange contracts which are shown at the unrealized appreciation/depreciation on the instrument. |
See Notes to Financial Statements.
| | | | | | |
| | | BLACKROCK FUNDS | | MARCH 31, 2010 | | 29 |
| | |
| Schedule of Investments March 31, 2010 (Unaudited) | | BlackRock Science & Technology Opportunities Portfolio |
| | (Percentages shown are based on Net Assets) |
| | | | | |
Common Stocks | | Shares | | Value |
Biotechnology — 0.8% | | | | | |
Biogen Idec, Inc. (a) | | 15,200 | | $ | 871,872 |
Genzyme Corp. (a) | | 10,400 | | | 539,032 |
| | | | | |
| | | | | 1,410,904 |
| | | | | |
Building Products — 0.6% | | | | | |
Asahi Glass Co. Ltd. | | 96,300 | | | 1,086,189 |
| | | | | |
Communications Equipment — 10.3% | | | | | |
Anaren, Inc.(a) | | 17,100 | | | 243,504 |
Blue Coat Systems, Inc.(a) | | 34,700 | | | 1,077,088 |
Brocade Communications Systems, Inc.(a) | | 72,800 | | | 415,688 |
Cisco Systems, Inc.(a) | | 194,700 | | | 5,068,041 |
F5 Networks, Inc.(a) | | 24,500 | | | 1,506,995 |
JDS Uniphase Corp.(a) | | 62,100 | | | 778,113 |
Juniper Networks, Inc.(a) | | 33,400 | | | 1,024,712 |
Meru Networks, Inc.(a) | | 5,700 | | | 109,269 |
Motorola, Inc.(a) | | 154,800 | | | 1,086,696 |
Nokia Oyj - ADR | | 62,800 | | | 975,912 |
Polycom, Inc.(a) | | 39,300 | | | 1,201,794 |
QUALCOMM, Inc. | | 81,800 | | | 3,434,782 |
Research In Motion Ltd.(a) | | 12,200 | | | 902,190 |
Tellabs, Inc. | | 83,000 | | | 628,310 |
| | | | | |
| | | | | 18,453,094 |
| | | | | |
Computers & Peripherals — 17.6% | | | | | |
Apple, Inc.(a) | | 47,400 | | | 11,135,682 |
Compellent Technologies, Inc.(a) | | 30,500 | | | 535,275 |
Dell, Inc.(a) | | 61,700 | | | 926,117 |
EMC Corp.(a) | | 166,700 | | | 3,007,268 |
Fujitsu Ltd. | | 55,800 | | | 366,314 |
Hewlett-Packard Co. | | 116,500 | | | 6,191,975 |
International Business Machines Corp. | | 39,100 | | | 5,014,575 |
NetApp, Inc.(a)(b) | | 54,600 | | | 1,777,776 |
QLogic Corp.(a) | | 26,800 | | | 544,040 |
Seagate Technology(a) | | 31,800 | | | 580,668 |
Teradata Corp.(a) | | 35,300 | | | 1,019,817 |
Western Digital Corp.(a) | | 13,600 | | | 530,264 |
| | | | | |
| | | | | 31,629,771 |
| | | | | |
Diversified Telecommunication Services — 2.1% | | | | | |
AT&T, Inc. | | 47,100 | | | 1,217,064 |
Verizon Communications, Inc. | | 37,800 | | | 1,172,556 |
Vimpel-Communications - ADR | | 74,000 | | | 1,362,340 |
| | | | | |
| | | | | 3,751,960 |
| | | | | |
Electronic Equipment, Instruments & Components — 4.8% | | | | | |
Agilent Technologies, Inc.(a) | | 35,800 | | | 1,231,162 |
Amphenol Corp. - Class A | | 27,800 | | | 1,172,882 |
Arrow Electronics, Inc.(a) | | 23,800 | | | 717,094 |
AU Optronics Corp. - ADR | | 90,156 | | | 1,021,468 |
Corning, Inc. | | 78,100 | | | 1,578,401 |
Hitachi Ltd.(a) | | 183,200 | | | 681,616 |
Hollysys Automation Technologies Ltd.(a) | | 37,700 | | | 433,927 |
Nidec Corp. | | 6,900 | | | 739,831 |
TTM Technologies, Inc.(a) | | 47,500 | | | 421,800 |
Vishay Intertechnology, Inc.(a) | | 56,600 | | | 579,018 |
| | | | | |
| | | | | 8,577,199 |
| | | | | |
Health Care Equipment & Supplies — 4.2% | | | | | |
Alcon, Inc. | | 8,000 | | | 1,292,480 |
Becton, Dickinson & Co. | | 11,300 | | | 889,649 |
Covidien Plc | | 17,300 | | | 869,844 |
Medtronic, Inc. | | 28,000 | | | 1,260,840 |
St. Jude Medical, Inc.(a) | | 36,800 | | | 1,510,640 |
Stryker Corp. | | 30,600 | | | 1,750,932 |
| | | | | |
| | | | | 7,574,385 |
| | | | | |
Household Durables — 0.4% | | | | | |
Panasonic Corp. | | 47,500 | | | 728,224 |
| | | | | |
Internet & Catalog Retail — 1.3% | | | | | |
Amazon.com, Inc.(a) | | 12,200 | | | 1,655,906 |
priceline.com, Inc.(a) | | 2,900 | | | 739,500 |
| | | | | |
| | | | | 2,395,406 |
| | | | | |
Internet Software & Services — 7.6% | | | | | |
Art Technology Group, Inc.(a) | | 84,800 | | | 373,968 |
Baidu, Inc. - ADR(a) | | 1,100 | | | 656,700 |
eBay, Inc.(a) | | 94,700 | | | 2,552,165 |
Google, Inc. - Class A(a) | | 10,100 | | | 5,726,801 |
Open Text Corp.(a) | | 20,200 | | | 958,894 |
VeriSign, Inc.(a) | | 43,300 | | | 1,126,233 |
Yahoo!, Inc.(a) | | 138,300 | | | 2,286,099 |
| | | | | |
| | | | | 13,680,860 |
| | | | | |
IT Services — 4.7% | | | | | |
Accenture Plc - Class A | | 30,800 | | | 1,292,060 |
Amdocs Ltd.(a) | | 29,100 | | | 876,201 |
Automatic Data Processing, Inc. | | 29,400 | | | 1,307,418 |
Cognizant Technology Solutions Corp.(a) | | 38,500 | | | 1,962,730 |
Computer Sciences Corp.(a) | | 24,500 | | | 1,335,005 |
Convergys Corp.(a) | | 68,800 | | | 843,488 |
The Western Union Co. | | 47,800 | | | 810,688 |
| | | | | |
| | | | | 8,427,590 |
| | | | | |
Life Sciences Tools & Services — 1.0% | | | | | |
Millipore Corp.(a) | | 9,200 | | | 971,520 |
Thermo Fisher Scientific, Inc.(a) | | 16,800 | | | 864,192 |
| | | | | |
| | | | | 1,835,712 |
| | | | | |
Office Electronics — 1.0% | | | | | |
Konica Minolta Holdings, Inc. | | 79,300 | | | 927,521 |
Xerox Corp. | | 93,600 | | | 912,600 |
| | | | | |
| | | | | 1,840,121 |
| | | | | |
Pharmaceuticals — 1.2% | | | | | |
Bristol-Myers Squibb Co. | | 33,900 | | | 905,130 |
Novartis AG | | 23,000 | | | 1,244,161 |
| | | | | |
| | | | | 2,149,291 |
| | | | | |
Semiconductors & Semiconductor Equipment — 19.2% | | | | | |
Advanced Semiconductor Engineering, Inc. | | 346,300 | | | 315,109 |
Altera Corp. | | 14,500 | | | 352,495 |
Applied Materials, Inc. | | 127,500 | | | 1,718,700 |
ARM Holdings Plc | | 172,400 | | | 617,950 |
ASM Pacific Technology Ltd. | | 36,600 | | | 346,097 |
Atheros Communications, Inc.(a) | | 31,900 | | | 1,234,849 |
Avago Technologies Ltd.(a) | | 23,600 | | | 485,216 |
Broadcom Corp. - Class A | | 92,400 | | | 3,065,832 |
Hynix Semiconductor, Inc. (a) | | 40,800 | | | 962,866 |
Intel Corp. | | 260,800 | | | 5,805,408 |
KLA-Tencor Corp. | | 27,500 | | | 850,300 |
Lam Research Corp.(a) | | 30,400 | | | 1,134,528 |
Marvell Technology Group Ltd.(a) | | 119,400 | | | 2,433,372 |
MaxLinear, Inc. - Class A(a) | | 24,000 | | | 426,000 |
MEMC Electronic Materials, Inc.(a) | | 73,100 | | | 1,120,623 |
Micron Technology, Inc.(a) | | 152,300 | | | 1,582,397 |
Netlogic Microsystems, Inc.(a) | | 25,400 | | | 747,522 |
See Notes to Financial Statements.
| | | | | | |
30 | | BLACKROCK FUNDS | | MARCH 31, 2010 | | |
| | |
| Schedule of Investments (continued) | | BlackRock Science & Technology Opportunities Portfolio |
| | (Percentages shown are based on Net Assets) |
| | | | | | |
Common Stocks | | Shares | | Value | |
Semiconductors & Semiconductor Equipment (concluded) | | | | | | |
Novellus Systems, Inc.(a) | | 53,900 | | $ | 1,347,500 | |
NVIDIA Corp.(a) | | 63,600 | | | 1,105,368 | |
PMC-Sierra, Inc.(a) | | 91,500 | | | 816,180 | |
Samsung Electronics Co. Ltd. | | 1,900 | | | 1,373,689 | |
Siliconware Precision Industries Co. - ADR | | 101,000 | | | 607,010 | |
Taiwan Semiconductor Manufacturing Co. Ltd. - ADR | | 90,300 | | | 947,247 | |
Teradyne, Inc.(a) | | 65,200 | | | 728,284 | |
Texas Instruments, Inc. | | 139,900 | | | 3,423,353 | |
Xilinx, Inc. | | 36,600 | | | 933,300 | |
| | | | | | |
| | | | | 34,481,195 | |
| | | | | | |
Software — 19.0% | | | | | | |
Adobe Systems, Inc.(a) | | 60,400 | | | 2,136,348 | |
ArcSight, Inc.(a)(b) | | 19,800 | | | 557,370 | |
Ariba, Inc.(a) | | 66,900 | | | 859,665 | |
AsiaInfo Holdings, Inc.(a) | | 50,700 | | | 1,342,536 | |
Autodesk, Inc.(a) | | 22,800 | | | 670,776 | |
BMC Software, Inc.(a) | | 37,700 | | | 1,432,600 | |
CA, Inc. | | 57,200 | | | 1,342,484 | |
Check Point Software Technologies(a) | | 33,800 | | | 1,185,028 | |
Citrix Systems, Inc.(a) | | 38,900 | | | 1,846,583 | |
CommVault Systems, Inc.(a) | | 37,200 | | | 794,220 | |
Compuware Corp.(a) | | 103,700 | | | 871,080 | |
Fortinet, Inc.(a) | | 14,400 | | | 253,152 | |
Intuit, Inc.(a) | | 33,500 | | | 1,150,390 | |
McAfee, Inc.(a) | | 21,200 | | | 850,756 | |
Microsoft Corp. | | 199,400 | | | 5,836,438 | |
Oracle Corp. | | 156,200 | | | 4,012,778 | |
Perfect World Co. Ltd. - ADR(a) | | 11,900 | | | 445,655 | |
Progress Software Corp.(a) | | 36,800 | | | 1,156,624 | |
Red Hat, Inc.(a) | | 41,400 | | | 1,211,778 | |
SuccessFactors, Inc.(a) | | 27,000 | | | 514,080 | |
Sybase, Inc.(a)(b) | | 42,900 | | | 1,999,998 | |
Symantec Corp.(a) | | 83,300 | | | 1,409,436 | |
Synopsys, Inc.(a) | | 27,600 | | | 617,412 | |
Taleo Corp. - Class A(a) | | 18,000 | | | 466,380 | |
VMware, Inc. - Class A(a) | | 22,500 | | | 1,199,250 | |
| | | | | | |
| | | | | 34,162,817 | |
| | | | | | |
Wireless Telecommunication Services — 0.8% | | | | | | |
American Tower Corp. - Class A(a) | | 31,000 | | | 1,320,910 | |
| | | | | | |
Total Long-Term Investments
(Cost — $139,900,921) — 96.6% | | | | | 173,505,628 | |
| | | | | | |
| | |
Short-Term Securities | | Shares/
Beneficial
Interest | | | |
BlackRock Liquidity Funds, TempFund, Institutional Class, 0.11%(c)(d) | | 6,289,597 | | | 6,289,597 | |
BlackRock Liquidity Series, LLC Money Market Series, 0.22%(c)(d)(e) | | 3,081,750 | | | 3,081,750 | |
| | | | | | |
Total Short-Term Securities
(Cost — $9,371,347) — 5.2% | | | | | 9,371,347 | |
| | | | | | |
Total Investments (Cost — $149,272,268*) — 101.8% | | | | | 182,876,975 | |
Liabilities in Excess of Other Assets — (1.8)% | | | | | (3,207,255 | ) |
| | | | | | |
Net Assets — 100.0% | | | | $ | 179,669,720 | |
| | | | | | |
| * | The cost and unrealized appreciation (depreciation) of investments as of March 31, 2010, as computed for federal income tax purposes, were as follows: |
| | | | |
Aggregate cost | | $ | 155,291,907 | |
| | | | |
Gross unrealized appreciation | | $ | 29,877,576 | |
Gross unrealized depreciation | | | (2,292,508 | ) |
| | | | |
Net unrealized appreciation | | $ | 27,585,068 | |
| | | | |
| (a) | Non-income producing security. |
| (b) | Security, or a portion of security, is on loan. |
| (c) | Investments in companies considered to be an affiliate of the Fund, for purposes of Section 2(a)(3) of the Investment Company Act of 1940, were as follows: |
| | | | | | | | | |
Affiliate | | Net
Activity | | Realized
Gain | | Income |
BlackRock Liquidity Funds, TempFund, Institutional Class | | $ | 1,577,352 | | $ | 35 | | $ | 3,396 |
BlackRock Liquidity Series, LLC Money Market Series | | $ | 2,062,150 | | | — | | $ | 2,271 |
| (d) | Represents the current yield as of report date. |
| (e) | Security was purchased with the cash collateral from loaned securities. |
| • | Foreign currency exchange contracts as of March 31, 2010 were as follows: |
| | | | | | | | | | | | |
Currency
Purchased | | Currency Sold | | Counterparty | | Settlement
Date | | Unrealized
Appreciation
(Depreciation) | |
| USD | 38,073 | | CHF | 41,000 | | Citibank, N.A. | | 4/21/10 | | $ | (818 | ) |
| EUR | 285,000 | | USD | 392,048 | | Citibank, N.A. | | 4/27/10 | | | (7,101 | ) |
| GBP | 275,000 | | USD | 440,089 | | Deutsche Bank AG | | 4/27/10 | | | (22,846 | ) |
| GBP | 90,000 | | USD | 134,811 | | Deutsche Bank AG | | 4/27/10 | | | 1,742 | |
| JPY | 56,942,000 | | USD | 635,640 | | Deutsche Bank AG | | 4/27/10 | | | (26,478 | ) |
| JPY | 43,646,000 | | USD | 484,155 | | Deutsche Bank AG | | 4/27/10 | | | (17,233 | ) |
| JPY | 21,815,000 | | USD | 241,538 | | UBS AG | | 4/27/10 | | | (8,162 | ) |
| JPY | 4,663,000 | | USD | 51,765 | | Citibank, N.A. | | 4/27/10 | | | (1,881 | ) |
| USD | 1,213,693 | | CHF | 1,273,000 | | Citibank, N.A. | | 4/27/10 | | | 6,115 | |
| USD | 399,400 | | EUR | 283,000 | | Citibank, N.A. | | 4/27/10 | | | 17,154 | |
| USD | 1,016,493 | | GBP | 627,000 | | Deutsche Bank AG | | 4/27/10 | | | 65,178 | |
| USD | 844,596 | | JPY | 76,945,000 | | Citibank, N.A. | | 4/27/10 | | | 21,444 | |
| USD | 4,616,773 | | JPY | 420,673,000 | | Deutsche Bank AG | | 4/27/10 | | | 116,442 | |
| | | | | | | | | | | | |
| | Total | | | | | | | | | $ | 143,556 | |
| | | | | | | | | | | | |
| • | | For Fund compliance purposes, the Fund’s industry classifications refer to any one or more of the industry sub-classifications used by one or more widely recognized market indexes or ratings group indexes, and/or as defined by Fund management. This definition may not apply for purposes of this report, which may combine industry sub-classifications for reporting ease. |
See Notes to Financial Statements.
| | | | | | |
| | | BLACKROCK FUNDS | | MARCH 31, 2010 | | 31 |
| | |
| Schedule of Investments (concluded) | | BlackRock Science & Technology Opportunities Portfolio |
| • | | Fair Value Measurements—Various inputs are used in determining the fair value of investments, which are as follows: |
| | • | | Level 1 – price quotations in active markets/exchanges for identical assets and liabilities |
| | • | | Level 2 – other observable inputs (including, but not limited to: quoted prices for similar assets or liabilities in markets that are active, quoted prices for identical or similar assets or liabilities in markets that are not active, inputs other than quoted prices that are observable for the assets or liabilities (such as interest rates, yield curves, volatilities, prepayment speeds, loss severities, credit risks and default rates) or other market–corroborated inputs) |
| | • | | Level 3 – unobservable inputs based on the best information available in the circumstances, to the extent observable inputs are not available (including the Fund’s own assumptions used in determining the fair value of investments) |
The inputs or methodologies used for valuing securities are not necessarily an indication of the risk associated with investing in those securities. For information about the Fund’s policy regarding valuation of investments and other significant accounting policies, please refer to Note 1 of the Notes to Financial Statements.
The following tables summarize the inputs used as of March 31, 2010 in determining the fair valuation of the Fund’s investments:
| | | | | | | | | | | | | |
| | | Investments in Securities | |
Valuation Inputs | | Level 1 | | Level 2 | | | Level 3 | | Total | |
Assets: | | | | | | | | | | | | | |
Long-Term Investments: | | | | | | | | | | | | | |
Biotechnology | | $ | 1,410,904 | | | — | | | — | | $ | 1,410,904 | |
Building Products | | | 1,086,189 | | | — | | | — | | | 1,086,189 | |
Communications Equipment | | | 18,453,094 | |
| —
|
| | —
| | | 18,453,094 | |
Computers Software & Services | | | 871,080 | | | — | | | — | | | 871,080 | |
Computers & Peripherals | | | 31,263,457 | | $ | 366,314 | | | — | | | 31,629,771 | |
Diversified Telecommunication Services | | | 3,751,960 | | | — | | | — | | | 3,751,960 | |
Electronic Equipment, Instruments & Components | | | 7,155,752 | | | 1,421,447 | | | — | | | 8,577,199 | |
Health Care Equipment & Supplies | | | 7,574,385 | | | — | | | — | | | 7,574,385 | |
Household Durables | | | — | | | 728,224 | | | — | | | 728,224 | |
Internet & Catalog Retail | | | 2,395,406 | | | — | | | — | | | 2,395,406 | |
Internet Software & Services | | | 13,680,860 | | | — | | | — | | | 13,680,860 | |
IT Services | | | 8,427,590 | | | — | | | — | | | 8,427,590 | |
Life Sciences Tools & Services | | | 1,835,712 | | | — | | | — | | | 1,835,712 | |
Office Electronics | | | 912,600 | | | 927,521 | | | — | | | 1,840,121 | |
Pharmaceuticals | | | 905,130 | | | 1,244,161 | | | — | | | 2,149,291 | |
| | | | | | | | | | | | | |
Semiconductors & Semiconductor Equipment | | | 30,865,484 | | | 3,615,711 | | | — | | | 34,481,195 | |
| | | | | | | | | | | | | |
| |
| | | Investments in Securities | |
Valuation Inputs | | Level 1 | | Level 2 | | | Level 3 | | Total | |
Software | | $ | 33,291,737 | | | — | | | — | | $ | 33,291,737 | |
Wireless Telecommunication Services | | | 1,320,910 | | | — | | | — | | | 1,320,910 | |
Short-Term Securities | | | 6,289,597 | | $ | 3,081,750 | | | — | | | 9,371,347 | |
| | | | | | | | | | | | | |
Total | | $ | 171,491,847 | | $ | 11,385,128 | | | — | | $ | 182,876,975 | |
| | | | | | | | | | | | | |
| |
| | | Other Financial Instruments1 | |
Valuation Inputs | | Level 1 | | Level 2 | | | Level 3 | | Total | |
Assets | | | — | | $ | 228,075 | | | — | | $ | 228,075 | |
Liabilities | | | — | | | (84,519 | ) | | — | | | (84,519 | ) |
| | | | | | | | | | | | | |
Total | | | — | | $ | 143,556 | | | — | | $ | 143,556 | |
| | | | | | | | | | | | | |
| 1 | Other financial instruments are foreign currency exchange contracts which are shown at the unrealized appreciation/depreciation on the instrument. |
See Notes to Financial Statements.
| | | | | | |
32 | | BLACKROCK FUNDS | | MARCH 31, 2010 | | |
| | |
| Schedule of Investments March 31, 2010 (Unaudited) | | BlackRock U.S. Opportunities Portfolio |
| | (Percentages shown are based on Net Assets) |
| | | | | |
Common Stocks | | Shares | | Value |
Aerospace & Defense — 1.7% | | | | | |
Goodrich Corp. | | 353,700 | | $ | 24,942,924 |
Rockwell Collins, Inc. | | 402,100 | | | 25,167,439 |
| | | | | |
| | | | | 50,110,363 |
| | | | | |
Air Freight & Logistics — 1.0% | | | | | |
Atlas Air Worldwide Holdings, Inc.(a) | | 313,000 | | | 16,604,650 |
UTi Worldwide, Inc. | | 880,200 | | | 13,484,664 |
| | | | | |
| | | | | 30,089,314 |
| | | | | |
Airlines — 0.4% | | | | | |
Continental Airlines, Inc. - Class B(a) | | 605,600 | | | 13,305,032 |
| | | | | |
Auto Components — 1.4% | | | | | |
ArvinMeritor, Inc.(a)(b) | | 1,030,900 | | | 13,762,515 |
Lear Corp.(a) | | 184,200 | | | 14,616,270 |
Tenneco, Inc.(a) | | 493,400 | | | 11,668,910 |
| | | | | |
| | | | | 40,047,695 |
| | | | | |
Beverages — 0.5% | | | | | |
Dr. Pepper Snapple Group, Inc. | | 397,000 | | | 13,962,490 |
| | | | | |
Biotechnology — 1.4% | | | | | |
Cephalon, Inc.(a) | | 234,600 | | | 15,901,188 |
Human Genome Sciences, Inc.(a) | | 161,000 | | | 4,862,200 |
OSI Pharmaceuticals, Inc.(a) | | 276,500 | | | 16,465,575 |
United Therapeutics Corp.(a) | | 74,100 | | | 4,099,953 |
| | | | | |
| | | | | 41,328,916 |
| | | | | |
Capital Markets — 2.7% | | | | | |
Ameriprise Financial, Inc. | | 337,300 | | | 15,299,928 |
Greenhill & Co., Inc.(b) | | 135,600 | | | 11,131,404 |
Invesco Ltd. | | 636,400 | | | 13,943,524 |
State Street Corp. | | 179,400 | | | 8,098,116 |
Stifel Financial Corp.(a) | | 270,800 | | | 14,555,500 |
TD Ameritrade Holding Corp.(a) | | 889,800 | | | 16,959,588 |
| | | | | |
| | | | | 79,988,060 |
| | | | | |
Chemicals — 4.9% | | | | | |
CF Industries Holdings, Inc. | | 236,700 | | | 21,582,306 |
Eastman Chemical Co. | | 283,600 | | | 18,059,648 |
FMC Corp. | | 310,000 | | | 18,767,400 |
The Lubrizol Corp. | | 262,700 | | | 24,094,844 |
Olin Corp. | | 1,089,900 | | | 21,383,838 |
Rockwood Holdings, Inc.(a) | | 844,300 | | | 22,475,266 |
Valspar Corp. | | 610,500 | | | 17,997,540 |
| | | | | |
| | | | | 144,360,842 |
| | | | | |
Commercial Banks — 3.1% | | | | | |
Comerica, Inc. | | 636,900 | | | 24,227,676 |
Fifth Third Bancorp | | 1,362,500 | | | 18,516,375 |
Iberiabank Corp. | | 226,700 | | | 13,604,267 |
KeyCorp | | 790,500 | | | 6,126,375 |
SunTrust Banks, Inc.(b) | | 662,200 | | | 17,740,338 |
SVB Financial Group(a)(b) | | 263,800 | | | 12,308,908 |
| | | | | |
| | | | | 92,523,939 |
| | | | | |
Commercial Services & Supplies — 0.6% | | | | | |
The GEO Group, Inc.(a) | | 926,700 | | | 18,367,194 |
| | | | | |
Communications Equipment — 2.2% | | | | | |
F5 Networks, Inc.(a) | | 367,500 | | | 22,604,925 |
Juniper Networks, Inc.(a)(b) | | 405,200 | | | 12,431,536 |
Tekelec(a) | | 977,800 | | | 17,756,848 |
Tellabs, Inc. | | 1,613,600 | | | 12,214,952 |
| | | | | |
| | | | | 65,008,261 |
| | | | | |
Computers & Peripherals — 0.8% | | | | | |
Lexmark International, Inc. - Class A(a) | | 384,600 | | | 13,876,368 |
Western Digital Corp.(a) | | 236,500 | | | 9,221,135 |
| | | | | |
| | | | | 23,097,503 |
| | | | | |
Construction & Engineering — 0.8% | | | | | |
Foster Wheeler AG(a) | | 829,700 | | | 22,518,058 |
| | | | | |
Containers & Packaging — 1.9% | | | | | |
Crown Holdings, Inc.(a) | | 617,300 | | | 16,642,408 |
Owens-Illinois, Inc.(a) | | 667,700 | | | 23,730,058 |
Rock-Tenn Co. - Class A | | 334,400 | | | 15,238,608 |
| | | | | |
| | | | | 55,611,074 |
| | | | | |
Diversified Consumer Services — 0.7% | | | | | |
H&R Block, Inc.(b) | | 608,900 | | | 10,838,420 |
ITT Educational Services, Inc.(a)(b) | | 89,600 | | | 10,078,208 |
| | | | | |
| | | | | 20,916,628 |
| | | | | |
Electric Utilities — 3.1% | | | | | |
Allegheny Energy, Inc. | | 325,200 | | | 7,479,600 |
DPL, Inc. | | 857,700 | | | 23,320,863 |
Edison International | | 674,600 | | | 23,051,082 |
Northeast Utilities | | 552,000 | | | 15,257,280 |
NV Energy, Inc. | | 1,897,700 | | | 23,398,641 |
| | | | | |
| | | | | 92,507,466 |
| | | | | |
Electrical Equipment — 0.5% | | | | | |
AMETEK, Inc. | | 391,500 | | | 16,231,590 |
| | | | | |
Electronic Equipment, Instruments & Components — 3.2% | | | | | |
Amphenol Corp. - Class A | | 507,300 | | | 21,402,987 |
Avnet, Inc.(a) | | 630,200 | | | 18,906,000 |
Ingram Micro, Inc. - Class A(a) | | 1,015,700 | | | 17,825,535 |
Jabil Circuit, Inc. | | 932,900 | | | 15,103,651 |
Plexus Corp.(a) | | 337,900 | | | 12,174,537 |
Vishay Intertechnology, Inc.(a) | | 1,055,000 | | | 10,792,650 |
| | | | | |
| | | | | 96,205,360 |
| | | | | |
Energy Equipment & Services — 0.9% | | | | | |
Helmerich & Payne, Inc.(b) | | 146,800 | | | 5,590,144 |
Key Energy Services, Inc.(a) | | 861,800 | | | 8,230,190 |
Oceaneering International, Inc.(a) | | 207,300 | | | 13,161,477 |
| | | | | |
| | | | | 26,981,811 |
| | | | | |
Food & Staples Retailing — 1.0% | | | | | |
BJ’s Wholesale Club, Inc.(a)(b) | | 453,800 | | | 16,786,062 |
SUPERVALU, Inc. | | 782,800 | | | 13,057,104 |
| | | | | |
| | | | | 29,843,166 |
| | | | | |
Food Products — 3.4% | | | | | |
Bunge Ltd.(b) | | 212,200 | | | 13,077,886 |
ConAgra Foods, Inc. | | 554,400 | | | 13,898,808 |
Flowers Foods, Inc.(b) | | 526,300 | | | 13,020,662 |
The J.M. Smucker Co. | | 197,300 | | | 11,889,298 |
McCormick & Co., Inc. | | 377,900 | | | 14,496,244 |
Mead Johnson Nutrition Co. | | 219,300 | | | 11,410,179 |
Sara Lee Corp. | | 789,500 | | | 10,997,735 |
Smithfield Foods, Inc.(a)(b) | | 618,000 | | | 12,817,320 |
| | | | | |
| | | | | 101,608,132 |
| | | | | |
See Notes to Financial Statements.
| | | | | | |
| | | BLACKROCK FUNDS | | MARCH 31, 2010 | | 33 |
| | |
| Schedule of Investments (continued) | | BlackRock U.S. Opportunities Portfolio |
| | (Percentages shown are based on Net Assets) |
| | | | | |
Common Stocks | | Shares | | Value |
Health Care Equipment & Supplies — 3.8% | | | | | |
Beckman Coulter, Inc. | | 59,400 | | $ | 3,730,320 |
C.R. Bard, Inc. | | 239,900 | | | 20,780,138 |
The Cooper Cos., Inc. | | 475,600 | | | 18,491,328 |
Edwards Lifesciences Corp.(a) | | 63,400 | | | 6,268,992 |
Gen-Probe, Inc.(a) | | 327,844 | | | 16,392,200 |
Hill-Rom Holdings, Inc. | | 141,500 | | | 3,850,215 |
Hologic, Inc.(a) | | 319,400 | | | 5,921,676 |
Inverness Medical Innovations, Inc.(a) | | 166,100 | | | 6,469,595 |
St. Jude Medical, Inc.(a) | | 183,000 | | | 7,512,150 |
Varian Medical Systems, Inc.(a) | | 290,600 | | | 16,078,898 |
Zimmer Holdings, Inc.(a) | | 109,600 | | | 6,488,320 |
| | | | | |
| | | | | 111,983,832 |
| | | | | |
Health Care Providers & Services — 1.6% | | | | | |
AmerisourceBergen Corp. | | 637,300 | | | 18,430,716 |
CIGNA Corp. | | 131,200 | | | 4,799,296 |
Community Health Systems, Inc.(a) | | 210,600 | | | 7,777,458 |
Henry Schein, Inc.(a) | | 54,800 | | | 3,227,720 |
MEDNAX, Inc.(a) | | 51,100 | | | 2,973,509 |
Patterson Cos., Inc. | | 354,600 | | | 11,010,330 |
| | | | | |
| | | | | 48,219,029 |
| | | | | |
Health Care Technology — 0.4% | | | | | |
Allscripts-Misys Healthcare Solutions, Inc.(a)(b) | | 572,100 | | | 11,190,276 |
| | | | | |
Hotels, Restaurants & Leisure — 1.0% | | | | | |
Darden Restaurants, Inc. | | 334,300 | | | 14,889,722 |
Las Vegas Sands Corp.(a)(b) | | 754,900 | | | 15,966,135 |
| | | | | |
| | | | | 30,855,857 |
| | | | | |
Household Durables — 3.1% | | | | | |
Fortune Brands, Inc. | | 538,900 | | | 26,142,039 |
Jarden Corp.(b) | | 624,000 | | | 20,772,960 |
Stanley Black & Decker, Inc. | | 258,040 | | | 14,814,077 |
Toll Brothers, Inc.(a) | | 482,900 | | | 10,044,320 |
Whirlpool Corp.(b) | | 225,800 | | | 19,701,050 |
| | | | | |
| | | | | 91,474,446 |
| | | | | |
Household Products — 0.9% | | | | | |
Church & Dwight Co., Inc. | | 243,400 | | | 16,295,630 |
Energizer Holdings, Inc.(a)(b) | | 172,300 | | | 10,813,548 |
| | | | | |
| | | | | 27,109,178 |
| | | | | |
Industrial Conglomerates — 0.7% | | | | | |
Textron, Inc.(b) | | 1,034,900 | | | 21,970,927 |
| | | | | |
Insurance — 5.3% | | | | | |
ACE Ltd. | | 275,900 | | | 14,429,569 |
The Allstate Corp. | | 604,900 | | | 19,544,319 |
AON Corp. | | 439,800 | | | 18,783,858 |
Arch Capital Group Ltd.(a) | | 124,400 | | | 9,485,500 |
Conseco, Inc.(a) | | 2,382,200 | | | 14,817,284 |
The Hanover Insurance Group, Inc. | | 261,600 | | | 11,408,376 |
Lincoln National Corp. | | 444,000 | | | 13,630,800 |
PartnerRe Ltd. | | 133,000 | | | 10,602,760 |
Primerica, Inc.(a) | | 178,900 | | | 2,683,500 |
Principal Financial Group, Inc. | | 53,000 | | | 1,548,130 |
RenaissanceRe Holdings Ltd. | | 109,219 | | | 6,199,271 |
Symetra Financial Corp.(a) | | 400,400 | | | 5,277,272 |
Transatlantic Holdings, Inc. | | 289,100 | | | 15,264,480 |
XL Capital Ltd. - Class A | | 666,200 | | | 12,591,180 |
| | | | | |
| | | | | 156,266,299 |
| | | | | |
Internet & Catalog Retail — 0.4% | | | | | |
priceline.com, Inc.(a)(b) | | 44,600 | | | 11,373,000 |
| | | | | |
Internet Software & Services — 0.6% | | | | | |
Monster Worldwide, Inc.(a)(b) | | 762,300 | | | 12,661,803 |
QuinStreet, Inc.(a) | | 256,800 | | | 4,368,168 |
| | | | | |
| | | | | 17,029,971 |
| | | | | |
IT Services — 1.6% | | | | | |
Convergys Corp.(a) | | 923,900 | | | 11,327,014 |
Fidelity National Information Services, Inc. | | 482,700 | | | 11,314,488 |
Global Payments, Inc. | | 406,300 | | | 18,506,965 |
SAIC, Inc.(a) | | 402,422 | | | 7,122,869 |
| | | | | |
| | | | | 48,271,336 |
| | | | | |
Life Sciences Tools & Services — 1.2% | | | | | |
Millipore Corp.(a) | | 108,000 | | | 11,404,800 |
PerkinElmer, Inc. | | 415,300 | | | 9,925,670 |
Thermo Fisher Scientific, Inc.(a) | | 203,500 | | | 10,468,040 |
Waters Corp.(a) | | 70,900 | | | 4,788,586 |
| | | | | |
| | | | | 36,587,096 |
| | | | | |
Machinery — 1.8% | | | | | |
Joy Global, Inc. | | 511,900 | | | 28,973,540 |
Snap-On, Inc. | | 572,000 | | | 24,790,480 |
| | | | | |
| | | | | 53,764,020 |
| | | | | |
Media — 2.0% | | | | | |
DreamWorks Animation SKG, Inc. - Class A(a) | | 348,200 | | | 13,715,598 |
The Interpublic Group of Cos., Inc.(a) | | 1,724,500 | | | 14,347,840 |
Liberty Global, Inc. - Class A(a)(b) | | 536,500 | | | 15,644,340 |
Scripps Networks Interactive Inc. - Class A | | 348,500 | | | 15,455,975 |
| | | | | |
| | | | | 59,163,753 |
| | | | | |
Metals & Mining — 1.8% | | | | | |
Reliance Steel & Aluminum Co. | | 388,500 | | | 19,125,855 |
Royal Gold, Inc.(b) | | 467,800 | | | 21,617,038 |
Titanium Metals Corp.(a) | | 694,500 | | | 11,521,755 |
| | | | | |
| | | | | 52,264,648 |
| | | | | |
Multiline Retail — 1.8% | | | | | |
Dollar Tree, Inc.(a) | | 82,900 | | | 4,909,338 |
Macy’s, Inc.(b) | | 924,700 | | | 20,130,719 |
Nordstrom, Inc.(b) | | 263,200 | | | 10,751,720 |
Saks, Inc.(a)(b) | | 2,128,900 | | | 18,308,540 |
| | | | | |
| | | | | 54,100,317 |
| | | | | |
Multi-Utilities — 2.3% | | | | | |
Alliant Energy Corp.(b) | | 553,100 | | | 18,396,106 |
CMS Energy Corp. | | 1,183,200 | | | 18,292,272 |
SCANA Corp. | | 504,700 | | | 18,971,673 |
Wisconsin Energy Corp. | | 264,300 | | | 13,059,063 |
| | | | | |
| | | | | 68,719,114 |
| | | | | |
Office Electronics — 0.5% | | | | | |
Xerox Corp. | | 1,659,700 | | | 16,182,075 |
| | | | | |
Oil & Gas — 1.0% | | | | | |
Boardwalk Pipeline Partners, L.P. | | 707,500 | | | 21,055,200 |
Plains All American Pipeline, L.P. | | 152,400 | | | 8,671,560 |
Targa Resources Partners, L.P. | | 22,000 | | | 583,220 |
| | | | | |
| | | | | 30,309,980 |
| | | | | |
Oil, Gas & Consumable Fuels — 2.2% | | | | | |
Alpha Natural Resources, Inc.(a) | | 193,900 | | | 9,673,671 |
Arch Coal, Inc. | | 535,700 | | | 12,240,745 |
Concho Resources, Inc.(a)(b) | | 259,000 | | | 13,043,240 |
Denbury Resources, Inc.(a) | | 669,700 | | | 11,297,839 |
Forest Oil Corp.(a) | | 298,600 | | | 7,709,852 |
See Notes to Financial Statements.
| | | | | | |
34 | | BLACKROCK FUNDS | | MARCH 31, 2010 | | |
| | |
| Schedule of Investments (continued) | | BlackRock U.S. Opportunities Portfolio |
| | (Percentages shown are based on Net Assets) |
| | | | | | | |
Common Stocks | | Shares | | | Value | |
Oil, Gas & Consumable Fuels (concluded) | | | | | | | |
Newfield Exploration Co.(a) | | 234,800 | | | $ | 12,221,340 | |
| | | | | | | |
| | | | | | 66,186,687 | |
| | | | | | | |
Paper & Forest Products — 1.3% | | | | | | | |
International Paper Co. | | 762,800 | | | | 18,772,508 | |
Louisiana-Pacific Corp.(a) | | 2,341,300 | | | | 21,188,765 | |
| | | | | | | |
| | | | | | 39,961,273 | |
| | | | | | | |
Pharmaceuticals — 1.1% | | | | | | | |
Mylan, Inc.(a)(b) | | 880,000 | | | | 19,984,800 | |
Watson Pharmaceuticals, Inc.(a) | | 286,752 | | | | 11,977,631 | |
| | | | | | | |
| | | | | | 31,962,431 | |
| | | | | | | |
Professional Services — 1.3% | | | | | | | |
Manpower, Inc. | | 212,800 | | | | 12,155,136 | |
Robert Half International, Inc.(b) | | 395,885 | | | | 12,046,781 | |
Towers Watson & Co. - Class A | | 290,435 | | | | 13,795,662 | |
| | | | | | | |
| | | | | | 37,997,579 | |
| | | | | | | |
Real Estate Investment Trusts (REITs) — 3.6% | | | | | | | |
Federal Realty Investment Trust(b) | | 128,600 | | | | 9,363,366 | |
Health Care REIT, Inc.(b) | | 251,000 | | | | 11,352,730 | |
Hospitality Properties Trust | | 817,700 | | | | 19,583,915 | |
Mack-Cali Realty Corp. | | 415,100 | | | | 14,632,275 | |
Rayonier, Inc. | | 422,200 | | | | 19,180,546 | |
SL Green Realty Corp.(b) | | 179,800 | | | | 10,297,146 | |
Taubman Centers, Inc.(b) | | 223,400 | | | | 8,918,128 | |
Washington Real Estate Investment Trust(b) | | 408,100 | | | | 12,467,455 | |
| | | | | | | |
| | | | | | 105,795,561 | |
| | | | | | | |
Real Estate Management & Development — 0.5% | | | | | | | |
CB Richard Ellis Group, Inc. - Class A(a) | | 853,700 | | | | 13,531,145 | |
| | | | | | | |
Road & Rail — 0.6% | | | | | | | |
Ryder System, Inc. | | 464,700 | | | | 18,011,772 | |
| | | | | | | |
Semiconductors & Semiconductor Equipment — 4.1% | | | | | | | |
Avago Technologies Ltd.(a) | | 438,800 | | | | 9,021,728 | |
International Rectifier Corp.(a) | | 745,600 | | | | 17,074,240 | |
Intersil Corp. - Class A | | 80,000 | | | | 1,179,200 | |
Lam Research Corp.(a) | | 296,500 | | | | 11,065,380 | |
Marvell Technology Group Ltd.(a) | | 688,400 | | | | 14,029,592 | |
Netlogic Microsystems, Inc.(a)(b) | | 424,400 | | | | 12,490,092 | |
Novellus Systems, Inc.(a) | | 652,800 | | | | 16,320,000 | |
NVIDIA Corp.(a) | | 895,900 | | | | 15,570,742 | |
PMC-Sierra, Inc.(a) | | 1,491,200 | | | | 13,301,504 | |
Teradyne, Inc.(a)(b) | | 1,130,400 | | | | 12,626,568 | |
| | | | | | | |
| | | | | | 122,679,046 | |
| | | | | | | |
Software — 4.8% | | | | | | | |
Advent Software, Inc.(a)(b) | | 212,200 | | | | 9,495,950 | |
Ariba, Inc.(a) | | 909,100 | | | | 11,681,935 | |
Autodesk, Inc.(a) | | 503,100 | | | | 14,801,202 | |
BMC Software, Inc.(a) | | 317,700 | | | | 12,072,600 | |
Citrix Systems, Inc.(a) | | 419,500 | | | | 19,913,665 | |
Red Hat, Inc.(a) | | 465,900 | | | | 13,636,893 | |
Rovi Corp.(a)(b) | | 358,300 | | | | 13,303,679 | |
Solera Holdings, Inc. | | 307,300 | | | | 11,877,145 | |
Sybase, Inc.(a)(b) | | 497,700 | | | | 23,202,774 | |
TIBCO Software, Inc.(a) | | 1,167,600 | | | | 12,598,404 | |
| | | | | | | |
| | | | | | 142,584,247 | |
| | | | | | | |
Specialty Retail — 4.6% | | | | | | | |
American Eagle Outfitters, Inc. | | 515,800 | | | | 9,552,616 | |
Chico’s FAS, Inc. | | 949,800 | | | | 13,696,116 | |
Dick’s Sporting Goods, Inc.(a)(b) | | 754,900 | | | | 19,710,439 | |
Guess?, Inc. | | 424,400 | | | | 19,938,312 | |
hhgregg, Inc.(a)(b) | | 459,300 | | | | 11,592,732 | |
O’Reilly Automotive, Inc.(a) | | 375,300 | | | | 15,653,763 | |
Penske Auto Group, Inc.(a) | | 632,500 | | | | 9,120,650 | |
Ross Stores, Inc. | | 311,000 | | | | 16,629,170 | |
Rue21, Inc.(a)(b) | | 145,600 | | | | 5,047,952 | |
Urban Outfitters, Inc.(a) | | 442,900 | | | | 16,843,487 | |
| | | | | | | |
| | | | | | 137,785,237 | |
| | | | | | | |
Textiles, Apparel & Luxury Goods — 1.4% | | | | | | | |
VF Corp. | | 309,700 | | | | 24,822,455 | |
The Warnaco Group, Inc.(a) | | 321,800 | | | | 15,353,078 | |
| | | | | | | |
| | | | | | 40,175,533 | |
| | | | | | | |
Thrifts & Mortgage Finance — 1.1% | | | | | | | |
First Niagara Financial Group, Inc. | | 620,500 | | | | 8,823,510 | |
Hudson City Bancorp, Inc.(b) | | 806,600 | | | | 11,421,456 | |
People’s United Financial, Inc. | | 746,200 | | | | 11,670,568 | |
| | | | | | | |
| | | | | | 31,915,534 | |
| | | | | | | |
Tobacco — 0.4% | | | | | | | |
Lorillard, Inc. | | 152,500 | | | | 11,474,100 | |
| | | | | | | |
Wireless Telecommunication Services — 2.0% | | | | | | | |
American Tower Corp. - Class A(a) | | 457,500 | | | | 19,494,075 | |
NII Holdings, Inc. (a) | | 284,500 | | | | 11,852,270 | |
NTELOS Holdings Corp. | | 438,900 | | | | 7,808,031 | |
SBA Communications Corp. - Class A(a)(b) | | 537,800 | | | | 19,398,446 | |
| | | | | | | |
| | | | | | 58,552,822 | |
| | | | | | | |
Total Long-Term Investments
(Cost — $2,407,321,939) — 97.0% | | | | | | 2,880,061,015 | |
| | | | | | | |
| | |
Short-Term Securities | | Shares/
Beneficial
Interest | | | | |
BlackRock Liquidity Funds, TempFund, Institutional Class, 0.11%(c)(d) | | 90,058,351 | | | | 90,058,351 | |
BlackRock Liquidity Series, LLC Money Market Series, 0.22%(c)(d)(e) | | 375,750,640 | | | | 375,750,640 | |
| | | | | | | |
Total Short-Term Securities
(Cost — $465,808,991) — 15.7% | | | | | | 465,808,991 | |
| | | | | | | |
Total Investments Before Options Written
(Cost — $2,873,130,930*) — 112.7% | | | | | | 3,345,870,006 | |
| | | | | | | |
| | |
Options Written | | Contracts | | | | |
Exchange-Traded Put Options Written | | | | | | | |
Continental Resources, Inc., Strike Price $37.50, Expires 4/17/10 | | (2,200 | ) | | | (16,806 | ) |
Lubrizol Corp., Strike Price $85, Expires 4/17/10 | | (1,170 | ) | | | (58,500 | ) |
| | | | | | | |
Total Options Written (Premiums received — $257,887) — (0.0)% | | | | | | (75,306 | ) |
| | | | | | | |
Total Investments Net of Outstanding Options Written — 112.7% | | | | | | 3,345,794,700 | |
Liabilities in Excess of Other Assets — (12.7)% | | | | | | (377,729,196 | ) |
| | | | | | | |
Net Assets — 100.0% | | | | | $ | 2,968,065,504 | |
| | | | | | | |
See Notes to Financial Statements.
| | | | | | |
| | | BLACKROCK FUNDS | | MARCH 31, 2010 | | 35 |
| | |
| Schedule of Investments (concluded) | | BlackRock International Opportunities Portfolio |
| | (Percentages shown are based on Net Assets) |
| * | The cost and unrealized appreciation (depreciation) of investments as of March 31, 2010, as computed for federal income tax purposes, were as follows: |
| | | | |
Aggregate cost | | $ | 2,899,495,513 | |
| | | | |
Gross unrealized appreciation | | $ | 462,950,833 | |
Gross unrealized depreciation | | | (16,576,340 | ) |
| | | | |
Net unrealized appreciation | | $ | 446,374,493 | |
| | | | |
| (a) | Non-income producing security. |
| (b) | Security, or a portion of security, is on loan. |
| (c) | Investments in companies considered to be an affiliate of the Fund, for purposes of Section 2(a)(3) of the Investment Company Act of 1940, were as follows: |
| | | | | | | | | |
Affiliate | | Net
Activity | | Realized
Gain | | Income |
BlackRock Liquidity Funds, TempFund, Institutional Class | | $ | 11,346,744 | | $ | 1,342 | | $ | 70,574 |
BlackRock Liquidity Series, LLC Money Market Series | | $ | 75,576,094 | | | — | | $ | 192,091 |
| (d) | Represents the current yield as of report date. |
| (e) | Security was purchased with the cash collateral from loaned securities. |
| • | | For Fund compliance purposes, the Fund’s industry classifications refer to any one or more of the industry sub-classifications used by one or more widely recognized market indexes or ratings group indexes, and/or as defined by Fund management. This definition may not apply for purposes of this report, which may combine industry sub-classifications for reporting ease. |
| • | | Fair Value Measurements - Various inputs are used in determining the fair value of investments, which are as follows: |
| | • | | Level 1 – price quotations in active markets/exchanges for identical assets and liabilities |
| | • | | Level 2 – other observable inputs (including, but not limited to: quoted prices for similar assets or liabilities in markets that are active, quoted prices for identical or similar assets or liabilities in markets that are not active, inputs other than quoted prices that are observable for the assets or liabilities (such as interest rates, yield curves, volatilities, prepayment speeds, loss severities, credit risks and default rates) or other market–corroborated inputs) |
| | • | | Level 3 – unobservable inputs based on the best information available in the circumstances, to the extent observable inputs are not available (including the Fund’s own assumptions used in determining the fair value of investments) |
The inputs or methodologies used for valuing securities are not necessarily an indication of the risk associated with investing in those securities. For information about the Fund’s policy regarding valuation of investments and other significant accounting policies, please refer to Note 1 of the Notes to Financial Statements.
The following tables summarize the inputs used as of March 31, 2010 in determining the fair valuation of the Fund’s investments:
| | | | | | | | | | | |
| | | Investments in Securities |
Valuation Inputs | | Level 1 | | Level 2 | | Level 3 | | Total |
Assets: | | | | | | | | | | | |
Long-Term Investments1 | | $ | 2,880,061,015 | | | — | | — | | $ | 2,880,061,015 |
Short-Term Securities | | | 90,058,351 | | $ | 375,750,640 | | — | | | 465,808,991 |
| | | | | | | | | | | |
Total | | $ | 2,970,119,366 | | $ | 375,750,640 | | — | | $ | 3,345,870,006 |
| | | | | | | | | | | |
| 1 | See above Schedule of Investments for values in each industry. |
| | | | | | | | | | | | |
| | | Other Financial Instruments2 | |
Valuation Inputs | | Level 1 | | Level 2 | | | Level 3 | | Total | |
Liabilities | | — | | $ | (75,306 | ) | | — | | $ | (75,306 | ) |
| | | | | | | | | | | | |
Total | | — | | $ | (75,306 | ) | | — | | $ | (75,306 | ) |
| | | | | | | | | | | | |
| 2 | Other financial instruments are options which are shown at value. |
See Notes to Financial Statements.
| | | | | | |
36 | | BLACKROCK FUNDS | | MARCH 31, 2010 | | |
Statements of Assets and Liabilities
| | | | | | | | | | | | | | | | | | | |
| | | | | | BlackRock | | | | | BlackRock | | | | |
| | | BlackRock | | | Health | | BlackRock | | | Science | | | BlackRock | |
| | | Global | | | Sciences | | International | | | & Technology | | | U.S. | |
| | | Opportunities | | | Opportunities | | Opportunities | | | Opportunities | | | Opportunities | |
March 31, 2010 (Unaudited) | | Portfolio | | | Portfolio | | Portfolio | | | Portfolio | | | Portfolio | |
Assets | | | | | | | | | | | | | | | | | | | |
Investments at value - unaffiliated1,2 | | $ | 96,731,032 | | | $ | 1,218,513,878 | | $ | 1,810,385,039 | | | $ | 173,505,628 | | | $ | 2,880,061,015 | |
Investments at value - affiliated3 | | | 2,010,200 | | | | 162,162,549 | | | 122,865,192 | | | | 9,371,347 | | | | 465,808,991 | |
Cash held as collateral for options written contracts | | | 349,650 | | | | — | | | — | | | | — | | | | 19,104,750 | |
Investments sold receivable | | | 1,653,279 | | | | 20,188,114 | | | 33,496,646 | | | | — | | | | 44,042,819 | |
Foreign currency at value4 | | | 939,281 | | | | 3,672,078 | | | 10,102,903 | | | | 29,543 | | | | — | |
Unrealized appreciation on foreign currency exchange contracts | | | 391,018 | | | | 5,039,314 | | | 8,940,005 | | | | 228,075 | | | | — | |
Dividends and reclaims receivable | | | 222,377 | | | | 2,695,066 | | | 5,209,178 | | | | 81,660 | | | | 1,849,819 | |
Capital shares sold receivable | | | 192,342 | | | | 7,418,844 | | | 8,548,160 | | | | 512,764 | | | | 10,823,730 | |
Dividends receivable - affiliated | | | 584 | | | | 5,541 | | | 10,736 | | | | 618 | | | | 17,105 | |
Receivable from advisor | | | — | | | | — | | | — | | | | 1,016 | | | | 107,577 | |
Securities lending income receivable - affiliated | | | — | | | | 16,455 | | | 6,704 | | | | 709 | | | | 63,005 | |
Prepaid expenses | | | 45,386 | | | | 123,090 | | | 159,910 | | | | 63,170 | | | | 177,286 | |
| | | | | | | | | | | | | | | | | | | |
Total assets | | | 102,535,149 | | | | 1,419,834,929 | | | 1,999,724,473 | | | | 183,794,530 | | | | 3,422,056,097 | |
| | | | | | | | | | | | | | | | | | | |
Liabilities | | | | | | | | | | | | | | | | | | | |
Options written at value5 | | | 12,375 | | | | — | | | — | | | | — | | | | 75,306 | |
Collateral at value - securities loaned | | | — | | | | 96,916,350 | | | 32,364,600 | | | | 3,081,750 | | | | 375,750,640 | |
Investments purchased payable | | | 1,172,924 | | | | 39,716,071 | | | 48,483,883 | | | | 85,500 | | | | 68,586,397 | |
Unrealized depreciation on foreign currency exchange contracts | | | 657,105 | | | | 1,396,397 | | | 13,307,293 | | | | 84,519 | | | | — | |
Other affiliates payable | | | 79,685 | | | | 547,468 | | | 789,837 | | | | 155,690 | | | | 922,010 | |
Capital shares redeemed payable | | | 3,935,872 | | | | 2,778,396 | | | 4,748,615 | | | | 466,302 | | | | 5,628,812 | |
Investment advisory fees payable | | | 86,492 | | | | 784,131 | | | 1,652,299 | | | | 133,714 | | | | 2,341,852 | |
Service and distribution fees payable | | | 31,994 | | | | 439,139 | | | 391,927 | | | | 52,491 | | | | 551,653 | |
Officer’s and Trustees’ fees payable | | | 7,328 | | | | 12,335 | | | 13,630 | | | | 7,561 | | | | 14,655 | |
Foreign taxes payable | | | 2,076 | | | | 116,768 | | | 313,752 | | | | — | | | | 4,096 | |
Other accrued expenses payable | | | 19,223 | | | | 92,338 | | | 140,419 | | | | 57,283 | | | | 115,172 | |
| | | | | | | | | | | | | | | | | | | |
Total liabilities | | | 6,005,074 | | | | 142,799,393 | | | 102,206,255 | | | | 4,124,810 | | | | 453,990,593 | |
| | | | | | | | | | | | | | | | | | | |
Net Assets | | $ | 96,530,075 | | | $ | 1,277,035,536 | | $ | 1,897,518,218 | | | $ | 179,669,720 | | | $ | 2,968,065,504 | |
| | | | | | | | | | | | | | | | | | | |
Net Assets Consist of | | | | | | | | | | | | | | | | | | | |
Paid-in capital | | $ | 111,311,859 | | | $ | 1,065,820,492 | | $ | 1,940,317,452 | | | $ | 234,868,931 | | | $ | 2,599,413,069 | |
Undistributed (accumulated) net investment income (loss) | | | (523,420 | ) | | | 973,874 | | | (8,493,852 | ) | | | (1,231,650 | ) | | | (4,532,266 | ) |
Accumulated net realized gain (loss) | | | (24,122,723 | ) | | | 720,029 | | | (220,350,064 | ) | | | (87,717,730 | ) | | | (99,736,956 | ) |
Net unrealized appreciation/depreciation | | | 9,864,359 | | | | 209,521,141 | | | 186,044,682 | | | | 33,750,169 | | | | 472,921,657 | |
| | | | | | | | | | | | | | | | | | | |
Net Assets | | $ | 96,530,075 | | | $ | 1,277,035,536 | | $ | 1,897,518,218 | | | $ | 179,669,720 | | | $ | 2,968,065,504 | |
| | | | | | | | | | | | | | | | | | | |
1 Investments at cost - unaffiliated | | $ | 86,622,278 | | | $ | 1,012,723,125 | | $ | 1,619,930,194 | | | $ | 139,900,921 | | | $ | 2,407,321,939 | |
2 Securities loaned | | | — | | | $ | 92,671,557 | | $ | 30,859,750 | | | $ | 2,993,724 | | | $ | 363,213,492 | |
3 Investments at cost - affiliated | | $ | 2,010,200 | | | $ | 162,162,549 | | $ | 122,865,192 | | | $ | 9,371,347 | | | $ | 465,808,991 | |
4 Foreign currency at cost | | $ | 919,694 | | | $ | 3,617,579 | | $ | 10,087,897 | | | $ | 28,534 | | | | — | |
5 Premiums received | | $ | 16,020 | | | | — | | | — | | | | — | | | $ | 257,887 | |
See Notes to Financial Statements.
| | | | | | |
| | | BLACKROCK FUNDS | | MARCH 31, 2010 | | 37 |
| | |
| Statements of Assets and Liabilities (concluded) | | |
| | |
| | | | | | | | | | | | | | | |
March 31, 2010 (Unaudited) | | BlackRock
Global
Opportunities
Portfolio | | BlackRock
Health
Sciences
Opportunities
Portfolio | | BlackRock
International
Opportunities
Portfolio | | BlackRock
Science
& Technology
Opportunities
Portfolio | | BlackRock
U.S.
Opportunities
Portfolio |
Net Asset Value | | | | | | | | | | | | | | | |
Institutional | | | | | | | | | | | | | | | |
Net assets | | $ | 19,948,246 | | $ | 235,614,859 | | $ | 773,192,742 | | $ | 33,031,181 | | $ | 1,277,321,000 |
| | | | | | | | | | | | | | | |
Shares outstanding1 | | | 1,892,600 | | | 7,832,317 | | | 24,234,512 | | | 3,772,902 | | | 35,655,820 |
| | | | | | | | | | | | | | | |
Net asset value | | $ | 10.54 | | $ | 30.08 | | $ | 31.90 | | $ | 8.75 | | $ | 35.82 |
| | | | | | | | | | | | | | | |
Service | | | | | | | | | | | | | | | |
Net assets | | | — | | $ | 12,529,385 | | $ | 85,010,643 | | $ | 490,822 | | $ | 229,694,955 |
| | | | | | | | | | | | | | | |
Shares outstanding1 | | | — | | | 426,128 | | | 2,759,915 | | | 57,857 | | | 6,675,563 |
| | | | | | | | | | | | | | | |
Net asset value | | | — | | $ | 29.40 | | $ | 30.80 | | $ | 8.48 | | $ | 34.41 |
| | | | | | | | | | | | | | | |
Investor A | | | | | | | | | | | | | | | |
Net assets | | $ | 51,969,082 | | $ | 666,699,778 | | $ | 778,225,589 | | $ | 111,113,678 | | $ | 1,128,432,020 |
| | | | | | | | | | | | | | | |
Shares outstanding1 | | | 4,953,606 | | | 22,713,877 | | | 25,475,185 | | | 13,247,193 | | | 33,142,203 |
| | | | | | | | | | | | | | | |
Net asset value | | $ | 10.49 | | $ | 29.35 | | $ | 30.55 | | $ | 8.39 | | $ | 34.05 |
| | | | | | | | | | | | | | | |
Investor B | | | | | | | | | | | | | | | |
Net assets | | $ | 4,201,685 | | $ | 57,414,530 | | $ | 30,441,474 | | $ | 5,412,586 | | $ | 22,100,293 |
| | | | | | | | | | | | | | | |
Shares outstanding1 | | | 404,001 | | | 2,080,672 | | | 1,069,063 | | | 698,489 | | | 708,451 |
| | | | | | | | | | | | | | | |
Net asset value | | $ | 10.40 | | $ | 27.59 | | $ | 28.47 | | $ | 7.75 | | $ | 31.20 |
| | | | | | | | | | | | | | | |
Investor C | | | | | | | | | | | | | | | |
Net assets | | $ | 20,411,062 | | $ | 304,776,984 | | $ | 230,647,770 | | $ | 27,218,599 | | $ | 310,517,236 |
| | | | | | | | | | | | | | | |
Shares outstanding1 | | | 1,969,315 | | | 11,053,426 | | | 8,149,257 | | | 3,515,266 | | | 9,958,120 |
| | | | | | | | | | | | | | | |
Net asset value | | $ | 10.36 | | $ | 27.57 | | $ | 28.30 | | $ | 7.74 | | $ | 31.18 |
| | | | | | | | | | | | | | | |
Class R | | | | | | | | | | | | | | | |
Net assets | | | — | | | — | | | — | | $ | 2,402,854 | | | — |
| | | | | | | | | | | | | | | |
Shares outstanding1 | | | — | | | — | | | — | | | 277,871 | | | — |
| | | | | | | | | | | | | | | |
Net asset value | | | — | | | — | | | — | | $ | 8.65 | | | — |
| | | | | | | | | | | | | | | |
| 1 | Unlimited number of shares authorized, $0.001 par value. |
See Notes to Financial Statements.
| | | | | | |
38 | | BLACKROCK FUNDS | | MARCH 31, 2010 | | |
Statements of Operations
| | | | | | | | | | | | | | | | | | | | |
Six Months Ended March 31, 2010 (Unaudited) | | BlackRock
Global
Opportunities
Portfolio | | | BlackRock
Health
Sciences
Opportunities
Portfolio | | | BlackRock
International
Opportunities
Portfolio | | | BlackRock
Science &
Technology
Opportunities
Portfolio | | | BlackRock
U.S.
Opportunities
Portfolio | |
Investment Income | | | | | | | | | | | | | | | | | | | | |
Dividends and reclaims | | $ | 759,054 | | | $ | 8,404,784 | | | $ | 14,933,631 | | | $ | 591,012 | | | $ | 12,145,188 | |
Foreign taxes withheld | | | (40,415 | ) | | | (489,762 | ) | | | (1,245,968 | ) | | | (11,241 | ) | | | (2,350 | ) |
Dividends - affiliated | | | 2,104 | | | | 25,042 | | | | 41,655 | | | | 3,396 | | | | 70,574 | |
Securities lending - affiliated | | | — | | | | 54,996 | | | | 28,821 | | | | 2,271 | | | | 192,091 | |
| | | | | | | | | | | | | | | | | | | | |
Total income | | | 720,743 | | | | 7,995,060 | | | | 13,758,139 | | | | 585,438 | | | | 12,405,503 | |
| | | | | | | | | | | | | | | | | | | | |
Expenses | | | | | | | | | | | | | | | | | | | | |
Investment advisory | | | 411,241 | | | | 4,045,465 | | | | 8,612,276 | | | | 711,461 | | | | 13,560,293 | |
Service and distribution - class specific | | | 175,677 | | | | 2,340,058 | | | | 2,159,411 | | | | 277,778 | | | | 2,908,499 | |
Transfer agent - class specific | | | 58,501 | | | | 832,047 | | | | 1,466,998 | | | | 358,539 | | | | 1,890,935 | |
Custodian | | | 34,320 | | | | 49,417 | | | | 262,549 | | | | 16,445 | | | | 67,358 | |
Administration | | | 34,270 | | | | 372,833 | | | | 558,966 | | | | 59,288 | | | | 775,664 | |
Professional | | | 31,729 | | | | 29,748 | | | | 37,484 | | | | 33,380 | | | | 37,428 | |
Registration | | | 13,730 | | | | 33,792 | | | | 48,247 | | | | 23,305 | | | | 53,748 | |
Administration - class specific | | | 11,400 | | | | 132,695 | | | | 197,762 | | | | 19,727 | | | | 259,310 | |
Printing | | | 10,633 | | | | 97,155 | | | | 167,861 | | | | 36,338 | | | | 214,532 | |
Officer and Trustees | | | 7,440 | | | | 17,145 | | | | 23,774 | | | | 8,076 | | | | 30,467 | |
Miscellaneous | | | 14,763 | | | | 25,918 | | | | 49,961 | | | | 9,844 | | | | 24,824 | |
Recoupment of past waived fees | | | 557 | | | | — | | | | — | | | | — | | | | — | |
Recoupment of past waived fees - class specific | | | 11,014 | | | | — | | | | 122,420 | | | | 426 | | | | 34,773 | |
| | | | | | | | | | | | | | | | | | | | |
Total expenses | | | 815,275 | | | | 7,976,273 | | | | 13,707,709 | | | | 1,554,607 | | | | 19,857,831 | |
Less fees waived by advisor | | | (1,211 | ) | | | (13,822 | ) | | | (22,959 | ) | | | (1,926 | ) | | | (1,638,954 | ) |
Less administration fees waived - class specific | | | (122 | ) | | | — | | | | — | | | | (13,304 | ) | | | (102,823 | ) |
Less transfer agent fees waived - class specific | | | — | | | | — | | | | — | | | | (4,832 | ) | | | (8,787 | ) |
Less transfer agent fees reimbursed - class specific | | | — | | | | — | | | | — | | | | (30,568 | ) | | | (576,950 | ) |
Less fees paid indirectly | | | (84 | ) | | | (919 | ) | | | (978 | ) | | | (205 | ) | | | (1,639 | ) |
| | | | | | | | | | | | | | | | | | | | |
Total expenses after fees waived, reimbursed and paid indirectly | | | 813,858 | | | | 7,961,532 | | | | 13,683,772 | | | | 1,503,772 | | | | 17,528,678 | |
| | | | | | | | | | | | | | | | | | | | |
Net investment income (loss) | | | (93,115 | ) | | | 33,528 | | | | 74,367 | | | | (918,334 | ) | | | (5,123,175 | ) |
| | | | | | | | | | | | | | | | | | | | |
Realized and Unrealized Gain (Loss) | | | | | | | | | | | | | | | | | | | | |
Net realized gain (loss) from: | | | | | | | | | | | | | | | | | | | | |
Investments | | | 3,915,689 | (1) | | | 75,790,644 | | | | 105,573,175 | | | | 3,340,706 | | | | 188,490,714 | |
Litigation proceeds | | | — | | | | — | | | | — | | | | 764,219 | | | | 12,770 | |
Redemption-in-kind transactions | | | — | | | | — | | | | (4,919,723 | ) | | | — | | | | — | |
Options written | | | 2,977 | | | | 1,513,127 | | | | — | | | | — | | | | — | |
Foreign currency transactions | | | 316,997 | | | | (1,630,396 | ) | | | 5,613,617 | | | | (98,088 | ) | | | — | |
| | | | | | | | | | | | | | | | | | | | |
| | | 4,235,663 | | | | 75,673,375 | | | | 106,267,069 | | | | 4,006,837 | | | | 188,503,484 | |
| | | | | | | | | | | | | | | | | | | | |
Net change in unrealized appreciation/depreciation on: | | | | | | | | | | | | | | | | | | | | |
Investments | | | 1,134,505 | | | | 61,967,816 | | | | (47,050,997 | ) | | | 14,870,355 | | | | 99,866,997 | |
Options written | | | 3,645 | | | | — | | | | — | | | | — | | | | 182,581 | |
Foreign currency transactions | | | (545,593 | ) | | | 5,334,681 | | | | (9,737,738 | ) | | | 309,802 | | | | — | |
| | | | | | | | | | | | | | | | | | | | |
| | | 592,557 | | | | 67,302,497 | | | | (56,788,735 | ) | | | 15,180,157 | | | | 100,049,578 | |
| | | | | | | | | | | | | | | | | | | | |
Total realized and unrealized gain | | | 4,828,220 | | | | 142,975,872 | | | | 49,478,334 | | | | 19,186,994 | | | | 288,553,062 | |
| | | | | | | | | | | | | | | | | | | | |
Net Increase in Net Assets Resulting from Operations | | $ | 4,735,105 | | | $ | 143,009,400 | | | $ | 49,552,701 | | | $ | 18,268,660 | | | $ | 283,429,887 | |
| | | | | | | | | | | | | | | | | | | | |
| (1) | Net of $(1,121) foreign capital gain tax. |
See Notes to Financial Statements.
| | | | | | |
| | | BLACKROCK FUNDS | | MARCH 31, 2010 | | 39 |
Statements of Changes in Net Assets
| | | | | | | | | | | | | | | |
| | | BlackRock
Global Opportunities
Portfolio | | | BlackRock
Health Sciences
Opportunities
Portfolio | |
Increase (Decrease) in Net Assets: | | Six Months
Ended
March 31, 2010
(Unaudited) | | | Year Ended
September 30,
2009 | | | Six Months
Ended
March 31, 2010
(Unaudited) | | Year Ended
September 30,
2009 | |
Operations | | | | | | | | | | | | | | | |
Net investment income (loss) | | $ | (93,115 | ) | | $ | 225,762 | | | $ | 33,528 | | $ | (1,482,653 | ) |
Net realized gain (loss) | | | 4,235,663 | | | | (26,417,928 | ) | | | 75,673,375 | | | (69,076,504 | ) |
Net change in unrealized appreciation/depreciation | | | 592,557 | | | | 20,795,046 | | | | 67,302,497 | | | 51,484,463 | |
| | | | | | | | | | | | | | | |
Net increase (decrease) in net assets resulting from operations | | | 4,735,105 | | | | (5,397,120 | ) | | | 143,009,400 | | | (19,074,694 | ) |
| | | | | | | | | | | | | | | |
Dividends and Distributions to Shareholders From | | | | | | | | | | | | | | | |
Net investment income: | | | | | | | | | | | | | | | |
Institutional | | | (257,068 | ) | | | (13,294 | ) | | | — | | | — | |
Service | | | — | | | | — | | | | — | | | — | |
Investor A | | | (594,521 | ) | | | — | | | | — | | | — | |
Investor B | | | (11,168 | ) | | | — | | | | — | | | — | |
Investor C | | | (87,254 | ) | | | — | | | | — | | | — | |
Net realized gain: | | | | | | | | | | | | | | | |
Institutional | | | — | | | | — | | | | — | | | (14,779,840 | ) |
Service | | | — | | | | — | | | | — | | | (476,833 | ) |
Investor A | | | — | | | | — | | | | — | | | (41,129,678 | ) |
Investor B | | | — | | | | — | | | | — | | | (5,993,765 | ) |
Investor C | | | — | | | | — | | | | — | | | (22,988,455 | ) |
| | | | | | | | | | | | | | | |
Decrease in net assets resulting from dividends and distributions to shareholders | | | (950,011 | ) | | | (13,294 | ) | | | — | | | (85,368,571 | ) |
| | | | | | | | | | | | | | | |
Capital Share Transactions | | | | | | | | | | | | | | | |
Net increase (decrease) in net assets derived from capital share transactions | | | 9,964,646 | | | | (9,707,472 | ) | | | 162,829,050 | | | (66,392,638 | ) |
| | | | | | | | | | | | | | | |
Redemption Fees | | | | | | | | | | | | | | | |
Redemption fees | | | 1,602 | | | | 3,529 | | | | 31,177 | | | 77,958 | |
| | | | | | | | | | | | | | | |
Net Assets | | | | | | | | | | | | | | | |
Total increase (decrease) in net assets | | | 13,751,342 | | | | (15,114,357 | ) | | | 305,869,627 | | | (170,757,945 | ) |
Beginning of period | | | 82,778,733 | | | | 97,893,090 | | | | 971,165,909 | | | 1,141,923,854 | |
| | | | | | | | | | | | | | | |
End of period | | $ | 96,530,075 | | | $ | 82,778,733 | | | $ | 1,277,035,536 | | $ | 971,165,909 | |
| | | | | | | | | | | | | | | |
Undistributed (accumulated) net investment income (loss) | | $ | (523,420 | ) | | $ | 519,706 | | | $ | 973,874 | | $ | 940,346 | |
| | | | | | | | | | | | | | | |
See Notes to Financial Statements.
| | | | | | |
40 | | BLACKROCK FUNDS | | MARCH 31, 2010 | | |
| | | | | | | | | | | | | | | | | | | | | | |
| BlackRock International Opportunities Portfolio | | | BlackRock Science & Technology Opportunities Portfolio | | | BlackRock U.S. Opportunities Portfolio | |
Six Months Ended
March 31, 2010
(Unaudited) | | | Year Ended
September 30,
2009 | | | Six Months Ended
March 31, 2010
(Unaudited) | | | Year Ended
September 30,
2009 | | | Six Months Ended
March 31, 2010
(Unaudited) | | | Year Ended
September 30,
2009 | |
| $ | 74,367 | | | $ | 11,632,867 | | | $ | (918,334 | ) | | $ | (891,402 | ) | | $ | (5,123,175 | ) | | $ | (576,660 | ) |
| | 106,267,069 | | | | (332,414,119 | ) | | | 4,006,837 | | | | (28,573,401 | ) | | | 188,503,484 | | | | (216,934,258 | ) |
| | (56,788,735 | ) | | | 422,245,971 | | | | 15,180,157 | | | | 36,881,864 | | | | 100,049,578 | | | | 446,610,193 | |
| | 49,552,701 | | | | 101,464,719 | | | | 18,268,660 | | | | 7,417,061 | | | | 283,429,887 | | | | 229,099,275 | |
| | (11,054,479 | ) | | | (1,523,480 | ) | | | — | | | | — | | | | (2,096,515 | ) | | | (60,616 | ) |
| | (1,038,975 | ) | | | — | | | | — | | | | — | | | | — | | | | — | |
| | (8,909,477 | ) | | | (153,036 | ) | | | — | | | | — | | | | — | | | | — | |
| | (112,041 | ) | | | — | | | | — | | | | — | | | | — | | | | — | |
| | (1,385,216 | ) | | | — | | | | — | | | | — | | | | — | | | | — | |
| | — | | | | — | | | | — | | | | — | | | | — | | | | — | |
| | — | | | | — | | | | — | | | | — | | | | — | | | | — | |
| | — | | | | — | | | | — | | | | — | | | | — | | | | — | |
| | — | | | | — | | | | — | | | | — | | | | — | | | | — | |
| | — | | | | — | | | | — | | | | — | | | | — | | | | — | |
| | (22,500,188 | ) | | | (1,676,516 | ) | | | — | | | | — | | | | (2,096,515 | ) | | | (60,616 | ) |
| | 289,264,096 | | | | 246,733,614 | | | | 19,438,577 | | | | (15,961,598 | ) | | | 489,263,773 | | | | 897,895,586 | |
| | 64,596 | | | | 121,554 | | | | 5,755 | | | | 11,427 | | | | 91,233 | | | | 318,611 | |
| | 316,381,205 | | | | 346,643,371 | | | | 37,712,992 | | | | (8,533,110 | ) | | | 770,688,378 | | | | 1,127,252,856 | |
| | 1,581,137,013 | | | | 1,234,493,642 | | | | 141,956,728 | | | | 150,489,838 | | | | 2,197,377,126 | | | | 1,070,124,270 | |
| $ | 1,897,518,218 | | | $ | 1,581,137,013 | | | $ | 179,669,720 | | | $ | 141,956,728 | | | $ | 2,968,065,504 | | | $ | 2,197,377,126 | |
| $ | (8,493,852 | ) | | $ | 13,931,969 | | | $ | (1,231,650 | ) | | $ | (313,316 | ) | | $ | (4,532,266 | ) | | $ | 2,687,424 | |
See Notes to Financial Statements.
| | | | | | |
| | | BLACKROCK FUNDS | | MARCH 31, 2010 | | 41 |
| | |
| Financial Highlights | | BlackRock Global Opportunities Portfolio |
| | | | | | | | | | | | | | | | | | | | |
| | | Institutional | |
| | | Six Months
Ended
March 31, 2010
(Unaudited) | | | Year Ended September 30, | | | Period
January 31, 20061
to
September 30, 2006 | |
| | | 2009 | | | 2008 | | | 2007 | | |
Per Share Operating Performance | | | | | | | | | | | | | | | | | | | | |
Net asset value, beginning of period | | | $10.13 | | | | $9.96 | | | | $13.31 | | | | $10.10 | | | | $10.00 | |
Net investment income2 | | | 0.01 | | | | 0.06 | | | | 0.09 | | | | 0.09 | | | | 0.08 | |
Net realized and unrealized gain (loss) | | | 0.55 | | | | 0.12 | | | | (2.77) | | | | 3.21 | | | | 0.01 | |
Net increase (decrease) from investment operations | | | 0.56 | | | | 0.18 | | | | (2.68) | | | | 3.30 | | | | 0.09 | |
Dividends and distributions from: | | | | | | | | | | | | | | | | | | | | |
Net investment income | | | (0.15 | ) | | | (0.01 | ) | | | (0.17 | ) | | | (0.09 | ) | | | — | |
Net realized gain | | | — | | | | — | | | | (0.50) | | | | — | | | | — | |
Total dividends and distributions | | | (0.15) | | | | (0.01) | | | | (0.67) | | | | (0.09) | | | | — | |
Redemption fees added to paid-in capital | | | 0.003 | | | | 0.003 | | | | 0.003 | | | | 0.003 | | | | 0.01 | |
Net asset value, end of period | | $ | 10.54 | | | $ | 10.13 | | | $ | 9.96 | | | $ | 13.31 | | | $ | 10.10 | |
Total Investment Return4 | | | | | | | | | | | | | | | | | | | | |
Based on net asset value | | | 5.52 | %5,6 | | | 1.78 | %5 | | | (21.16 | )%5 | | | 32.81 | %5 | | | 1.00 | %6,7 |
Ratios to Average Net Assets | | | | | | | | | | | | | | | | | | | | |
Total expenses | | | 1.36 | %8 | | | 1.50 | % | | | 1.33 | % | | | 1.32 | % | | | 2.25 | %8 |
| | | | | | | | | | | | | | | | | | | | |
Total expenses excluding recoupment of past waived fees | | | 1.36 | %8 | | | 1.49 | % | | | 1.33 | % | | | 1.32 | % | | | 2.25 | %8 |
| | | | | | | | | | | | | | | | | | | | |
Total expenses after fees waived, reimbursed and paid indirectly | | | 1.36 | %8 | | | 1.36 | % | | | 1.32 | % | | | 1.29 | % | | | 1.35 | %8 |
| | | | | | | | | | | | | | | | | | | | |
Net investment income | | | 0.21 | %8 | | | 0.70 | % | | | 0.77 | % | | | 0.78 | % | | | 1.13 | %8 |
| | | | | | | | | | | | | | | | | | | | |
Supplemental Data | | | | | | | | | | | | | | | | | | | | |
Net assets, end of period (000) | | $ | 19,948 | | | $ | 16,971 | | | $ | 36,625 | | | $ | 35,679 | | | $ | 9,099 | |
| | | | | | | | | | | | | | | | | | | | |
Portfolio turnover | | | 71 | % | | | 190 | % | | | 181 | % | | | 107 | % | | | 110 | % |
| | | | | | | | | | | | | | | | | | | | |
| | | | | | | | | | | | | | | | | | | | | | | | | | | | | | | | | | | | | | | | |
| | | Investor A | | | Investor B | |
| | | Six Months
Ended
March 31, 2010
(Unaudited) | | | Year Ended September 30, | | | Period
January 31, 20061
to
September 30, 2006 | | | Six Months
Ended
March 31, 2010
(Unaudited) | | | Year Ended September 30, | | | Period
January 31, 20061
to
September 30, 2006 | |
| | | 2009 | | | 2008 | | | 2007 | | | | | 2009 | | | 2008 | | | 2007 | | |
Per Share Operating Performance | |
Net asset value, beginning of period | | $ | 10.08 | | | $ | 9.92 | | | $ | 13.27 | | | $ | 10.08 | | | $ | 10.00 | | | $ | 9.93 | | | $ | 9.83 | | | $ | 13.16 | | | $ | 10.03 | | | $ | 10.00 | |
| | | | | | | | | | | | | | | | | | | | | | | | | | | | | | | | | | | | | | | | |
Net investment income (loss)2 | | | (0.00 | )3 | | | 0.04 | | | | 0.06 | | | | 0.04 | | | | 0.05 | | | | (0.04 | ) | | | (0.02 | ) | | | (0.04 | ) | | | (0.04 | ) | | | 0.00 | 3 |
Net realized and unrealized gain (loss) | | | 0.53 | | | | 0.12 | | | | (2.77 | ) | | | 3.22 | | | | 0.02 | | | | 0.54 | | | | 0.12 | | | | (2.76 | ) | | | 3.22 | | | | 0.02 | |
| | | | | | | | | | | | | | | | | | | | | | | | | | | | | | | | | | | | | | | | |
Net increase (decrease) from investment operations | | | 0.53 | | | | 0.16 | | | | (2.71 | ) | | | 3.26 | | | | 0.07 | | | | 0.50 | | | | 0.10 | | | | (2.80 | ) | | | 3.18 | | | | 0.02 | |
| | | | | | | | | | | | | | | | | | | | | | | | | | | | | | | | | | | | | | | | |
Dividends and distributions from: | | | | | | | | | | | | | | | | | | | | | | | | | | | | | | | | | | | | | | | | |
Net investment income | | | (0.12 | ) | | | — | | | | (0.14 | ) | | | (0.07 | ) | | | — | | | | (0.03 | ) | | | — | | | | (0.03 | ) | | | (0.05 | ) | | | — | |
Net realized gain | | | — | | | | — | | | | (0.50 | ) | | | — | | | | — | | | | — | | | | — | | | | (0.50 | ) | | | — | | | | — | |
| | | | | | | | | | | | | | | | | | | | | | | | | | | | | | | | | | | | | | | | |
Total dividends and distributions | | | (0.12 | ) | | | — | | | | (0.64 | ) | | | (0.07 | ) | | | — | | | | (0.03 | ) | | | — | | | | (0.53 | ) | | | (0.05 | ) | | | — | |
Redemption fees added to paid-in capital | | | 0.00 | 3 | | | 0.00 | 3 | | | 0.00 | 3 | | | 0.00 | 3 | | | 0.01 | | | | 0.00 | 3 | | | 0.00 | 3 | | | 0.00 | 3 | | | 0.00 | 3 | | | 0.01 | |
| | | | | | | | | | | | | | | | | | | | | | | | | | | | | | | | | | | | | | | | |
Net asset value, end of period | | $ | 10.49 | | | $ | 10.08 | | | $ | 9.92 | | | $ | 13.27 | | | $ | 10.08 | | | $ | 10.40 | | | $ | 9.93 | | | $ | 9.83 | | | $ | 13.16 | | | $ | 10.03 | |
| | | | | | | | | | | | | | | | | | | | | | | | | | | | | | | | | | | | | | | | |
Total Investment Return4 | |
Based on net asset value | | | 5.32 | %5,6 | | | 1.61 | %5 | | | (21.44 | )%5 | | | 32.51 | %5 | | | 0.80 | %6,7 | | | 5.00 | %5,6 | | | 1.02 | %5 | | | (22.13 | )%5 | | | 31.79 | %5 | | | 0.30 | %6,7 |
| | | | | | | | | | | | | | | | | | | | | | | | | | | | | | | | | | | | | | | | |
Ratios to Average Net Assets | |
Total expenses | | | 1.65 | %8 | | | 1.81 | % | | | 1.60 | % | | | 1.68 | % | | | 2.84 | %8 | | | 2.42 | %8 | | | 2.65 | % | | | 2.37 | % | | | 3.06 | % | | | 4.95 | %8 |
| | | | | | | | | | | | | | | | | | | | | | | | | | | | | | | | | | | | | | | | |
Total expenses excluding recoupment of past waived fees | | | 1.61 | %8 | | | 1.80 | % | | | 1.60 | % | | | 1.68 | % | | | 2.84 | %8 | | | 2.42 | %8 | | | 2.63 | % | | | 2.37 | % | | | 3.06 | % | | | 4.95 | %8 |
| | | | | | | | | | | | | | | | | | | | | | | | | | | | | | | | | | | | | | | | |
Total expenses after fees waived, reimbursed and paid indirectly | | | 1.65 | %8 | | | 1.66 | % | | | 1.60 | % | | | 1.56 | % | | | 1.65 | %8 | | | 2.41 | %8 | | | 2.42 | % | | | 2.36 | % | | | 2.33 | % | | | 2.40 | %8 |
| | | | | | | | | | | | | | | | | | | | | | | | | | | | | | | | | | | | | | | | |
Net investment income (loss) | | | (0.07 | )%8 | | | 0.49 | % | | | 0.49 | % | | | 0.36 | % | | | 0.70 | %8 | | | (0.85 | )%8 | | | (0.25 | )% | | | (0.30 | )% | | | (0.39 | )% | | | (0.05 | )%8 |
| | | | | | | | | | | | | | | | | | | | | | | | | | | | | | | | | | | | | | | | |
Supplemental Data | |
Net assets, end of period (000) | | $ | 51,969 | | | $ | 45,110 | | | $ | 37,529 | | | $ | 40,467 | | | $ | 23,097 | | | $ | 4,202 | | | $ | 4,351 | | | $ | 5,665 | | | $ | 7,673 | | | $ | 4,907 | |
| | | | | | | | | | | | | | | | | | | | | | | | | | | | | | | | | | | | | | | | |
Portfolio turnover | | | 71 | % | | | 190 | % | | | 181 | % | | | 107 | % | | | 110 | % | | | 71 | % | | | 190 | % | | | 181 | % | | | 107 | % | | | 110 | % |
| | | | | | | | | | | | | | | | | | | | | | | | | | | | | | | | | | | | | | | | |
See Notes to Financial Statements.
| | | | | | |
42 | | BLACKROCK FUNDS | | MARCH 31, 2010 | | |
| | |
| Financial Highlights (continued) | | BlackRock Global Opportunities Portfolio |
| | | | | | | | | | | | | | | | | | | | |
| | | Investor C | |
| | | Six Months
Ended
March 31, 2010
(Unaudited) | | | Year Ended September 30, | | | Period
January 31, 20061 to
September 30, 2006 | |
| | | | 2009 | | | 2008 | | | 2007 | | |
Per Share Operating Performance | | | | | | | | | | | | | | | | | | | | |
Net asset value, beginning of period | | $ | 9.91 | | | $ | 9.82 | | | $ | 13.16 | | | $ | 10.03 | | | $ | 10.00 | |
| | | | | | | | | | | | | | | | | | | | |
Net investment income (loss)2 | | | (0.04 | ) | | | (0.02 | ) | | | (0.03 | ) | | | (0.05 | ) | | | 0.00 | 3 |
Net realized and unrealized gain (loss) | | | 0.54 | | | | 0.11 | | | | (2.77 | ) | | | 3.23 | | | | 0.02 | |
| | | | | | | | | | | | | | | | | | | | |
Net increase (decrease) from investment operations | | | 0.50 | | | | 0.09 | | | | (2.80 | ) | | | 3.18 | | | | 0.02 | |
| | | | | | | | | | | | | | | | | | | | |
Dividends and distributions from: | | | | | | | | | | | | | | | | | | | | |
Net investment income | | | (0.05 | ) | | | — | | | | (0.04 | ) | | | (0.05 | ) | | | — | |
Net realized gain | | | — | | | | — | | | | (0.50 | ) | | | — | | | | — | |
| | | | | | | | | | | | | | | | | | | | |
Total dividends and distributions | | | (0.05 | ) | | | — | | | | (0.54 | ) | | | (0.05 | ) | | | — | |
| | | | | | | | | | | | | | | | | | | | |
Redemption fees added to paid-in capital | | | 0.00 | 3 | | | 0.00 | 3 | | | 0.00 | 3 | | | 0.00 | 3 | | | 0.01 | |
| | | | | | | | | | | | | | | | | | | | |
Net asset value, end of period | | $ | 10.36 | | | $ | 9.91 | | | $ | 9.82 | | | $ | 13.16 | | | $ | 10.03 | |
| | | | | | | | | | | | | | | | | | | | |
Total Investment Return4 | | | | | | | | | | | | | | | | | | | | |
Based on net asset value | | | 5.04 | %5,6 | | | 0.92 | %5 | | | (22.14 | )%5 | | | 31.76 | %5 | | | 0.30 | %6,7 |
| | | | | | | | | | | | | | | | | | | | |
Ratios to Average Net Assets | | | | | | | | | | | | | | | | | | | | |
Total expenses | | | 2.42 | %8 | | | 2.62 | % | | | 2.38 | % | | | 2.42 | % | | | 3.38 | %8 |
| | | | | | | | | | | | | | | | | | | | |
Total expenses excluding recoupment of past waived fees | | | 2.41 | %8 | | | 2.62 | % | | | 2.38 | % | | | 2.42 | % | | | 3.38 | %8 |
| | | | | | | | | | | | | | | | | | | | |
Total expenses after fees waived, reimbursed and paid indirectly | | | 2.41 | %8 | | | 2.42 | % | | | 2.37 | % | | | 2.35 | % | | | 2.40 | %8 |
| | | | | | | | | | | | | | | | | | | | |
Net investment loss | | | (0.82 | )%8 | | | (0.26 | )% | | | (0.26 | )% | | | (0.40 | )% | | | (0.01 | )%8 |
| | | | | | | | | | | | | | | | | | | | |
Supplemental Data | | | | | | | | | | | | | | | | | | | | |
Net assets, end of period (000) | | $ | 20,411 | | | $ | 16,348 | | | $ | 18,074 | | | $ | 18,217 | | | $ | 10,012 | |
| | | | | | | | | | | | | | | | | | | | |
Portfolio turnover | | | 71 | % | | | 190 | % | | | 181 | % | | | 107 | % | | | 110 | % |
| | | | | | | | | | | | | | | | | | | | |
| 1 | Commencement of operations. |
| 2 | Based on average shares outstanding. |
| 3 | Less than $0.01 per share. |
| 4 | Where applicable, total investment returns exclude the effects of any sales charges and include the reinvestment of dividends and distributions. |
| 5 | Redemption fee of 2.00% is reflected in total return calculations. There was no impact to the return. |
| 6 | Aggregate total investment return. |
| 7 | Redemption fee of 2.00% is reflected in total return calculations. The impact to the return from redemption fees received during the period was an increase of 0.10%. |
See Notes to Financial Statements.
| | | | | | |
| | | BLACKROCK FUNDS | | MARCH 31, 2010 | | 43 |
| | |
| Financial Highlights (continued) | | BlackRock Health Sciences Opportunities Portfolio |
| | | | | | | | | | | | | | | | | | | | | | | | | | | | |
| | | Institutional | |
| | | Six Months
Ended
March 31, 2010
(Unaudited) | | | Year Ended September 30, | | | Period
March 1, 2005 to
September 30, 2005 | | | Year Ended February 28, | |
| | | 2009 | | | 2008 | | | 2007 | | | 2006 | | | | 2005 | |
Per Share Operating Performance | | | | | | | | | | | | | | | | | | | | | | | | | | | | |
Net asset value, beginning of period | | $ | 26.29 | | | $ | 28.77 | | | $ | 30.41 | | | $ | 26.18 | | | $ | 24.45 | | | $ | 20.50 | | | $ | 21.15 | |
| | | | | | | | | | | | | | | | | | | | | | | | | | | | |
Net investment income (loss) | | | 0.07 | 1 | | | 0.08 | 1 | | | 0.08 | 1 | | | 0.06 | 1 | | | 0.04 | 1 | | | (0.06 | )1 | | | (0.15 | ) |
Net realized and unrealized gain (loss) | | | 3.72 | | | | (0.14 | ) | | | (0.49 | ) | | | 4.52 | | | | 2.30 | | | | 4.02 | | | | 0.57 | |
| | | | | | | | | | | | | | | | | | | | | | | | | | | | |
Net increase (decrease) from investment operations | | | 3.79 | | | | (0.06 | ) | | | (0.41 | ) | | | 4.58 | | | | 2.34 | | | | 3.96 | | | | 0.42 | |
| | | | | | | | | | | | | | | | | | | | | | | | | | | | |
Distributions from net realized gain | | | — | | | | (2.42 | ) | | | (1.23 | ) | | | (0.35 | ) | | | (0.62 | ) | | | (0.01 | ) | | | (1.07 | ) |
| | | | | | | | | | | | | | | | | | | | | | | | | | | | |
Redemption fees added to paid-in capital | | | 0.00 | 2 | | | 0.00 | 2 | | | 0.00 | 2 | | | 0.00 | 2 | | | 0.01 | | | | 0.00 | 2 | | | — | |
| | | | | | | | | | | | | | | | | | | | | | | | | | | | |
Net asset value, end of period | | $ | 30.08 | | | $ | 26.29 | | | $ | 28.77 | | | $ | 30.41 | | | $ | 26.18 | | | $ | 24.45 | | | $ | 20.50 | |
| | | | | | | | | | | | | | | | | | | | | | | | | | | | |
Total Investment Return3 | | | | | | | | | | | | | | | | | | | | | | | | | | | | |
Based on net asset value | | | 14.42 | %4,5 | | | 1.91 | %4 | | | (1.64 | )%4 | | | 17.68 | %4 | | | 9.77 | %6 | | | 19.32 | %4,5 | | | 1.84 | % |
| | | | | | | | | | | | | | | | | | | | | | | | | | | | |
Ratios to Average Net Assets | | | | | | | | | | | | | | | | | | | | | | | | | | | | |
Total expenses | | | 0.99 | %7 | | | 1.03 | % | | | 1.00 | % | | | 1.02 | % | | | 1.01 | % | | | 1.37 | %7 | | | 1.37 | % |
| | | | | | | | | | | | | | | | | | | | | | | | | | | | |
Total expenses after fees waived, reimbursed and paid indirectly | | | 0.99 | %7 | | | 1.03 | % | | | 1.00 | % | | | 1.02 | % | | | 1.01 | % | | | 1.25 | %7 | | | 1.25 | % |
| | | | | | | | | | | | | | | | | | | | | | | | | | | | |
Net investment income (loss) | | | 0.50 | %7 | | | 0.36 | % | | | 0.28 | % | | | 0.21 | % | | | 0.17 | % | | | (0.47 | )%7 | | | (0.59 | )% |
| | | | | | | | | | | | | | | | | | | | | | | | | | | | |
Supplemental Data | | | | | | | | | | | | | | | | | | | | | | | | | | | | |
Net assets, end of period (000) | | $ | 235,615 | | | $ | 171,607 | | | $ | 185,933 | | | $ | 172,902 | | | $ | 112,563 | | | $ | 31,229 | | | $ | 4,262 | |
| | | | | | | | | | | | | | | | | | | | | | | | | | | | |
Portfolio turnover | | | 82 | % | | | 153 | % | | | 91 | % | | | 98 | % | | | 157 | % | | | 77 | % | | | 173 | % |
| | | | | | | | | | | | | | | | | | | | | | | | | | | | |
| |
| | | Service | |
| | | Six Months
Ended
March 31, 2010
(Unaudited) | | | Year Ended September 30, | | | Period
March 1, 2005 to
September 30, 2005 | | | Period
January 28, 20058 to
February 28, 2005 | |
| | | 2009 | | | 2008 | | | 2007 | | | 2006 | | | |
Per Share Operating Performance | | | | | | | | | | | | | | | | | | | | | | | | | | | | |
Net asset value, beginning of period | | $ | 25.74 | | | $ | 28.20 | | | $ | 29.85 | | | $ | 25.78 | | | $ | 24.15 | | | $ | 20.24 | | | $ | 20.30 | |
| | | | | | | | | | | | | | | | | | | | | | | | | | | | |
Net investment income (loss) | | | 0.03 | 1 | | | 0.01 | 1 | | | (0.02 | )1 | | | (0.02 | )1 | | | (0.03 | )1 | | | (0.12 | )1 | | | (0.01 | ) |
Net realized and unrealized gain (loss) | | | 3.63 | | | | (0.14 | ) | | | (0.49 | ) | | | 4.44 | | | | 2.27 | | | | 4.04 | | | | (0.05 | ) |
| | | | | | | | | | | | | | | | | | | | | | | | | | | | |
Net increase (decrease) from investment operations | | | 3.66 | | | | (0.13 | ) | | | (0.51 | ) | | | 4.42 | | | | 2.24 | | | | 3.92 | | | | (0.06 | ) |
| | | | | | | | | | | | | | | | | | | | | | | | | | | | |
Distributions from net realized gain | | | — | | | | (2.33 | ) | | | (1.14 | ) | | | (0.35 | ) | | | (0.62 | ) | | | (0.01 | ) | | | — | |
| | | | | | | | | | | | | | | | | | | | | | | | | | | | |
Redemption fees added to paid-in capital | | | 0.00 | 2 | | | 0.00 | 2 | | | 0.00 | 2 | | | 0.00 | 2 | | | 0.01 | | | | 0.00 | 2 | | | — | |
| | | | | | | | | | | | | | | | | | | | | | | | | | | | |
Net asset value, end of period | | $ | 29.40 | | | $ | 25.74 | | | $ | 28.20 | | | $ | 29.85 | | | $ | 25.78 | | | $ | 24.15 | | | $ | 20.24 | |
| | | | | | | | | | | | | | | | | | | | | | | | | | | | |
Total Investment Return3 | | | | | | | | | | | | | | | | | | | | | | | | | | | | |
Based on net asset value | | | 14.22 | %4,5 | | | 1.59 | %4 | | | (1.98 | )%4 | | | 17.33 | %4 | | | 9.47 | %6 | | | 19.37 | %4,5 | | | (0.30 | )%5 |
| | | | | | | | | | | | | | | | | | | | | | | | | | | | |
Ratios to Average Net Assets | | | | | | | | | | | | | | | | | | | | | | | | | | | | |
Total expenses | | | 1.30 | %7 | | | 1.37 | % | | | 1.35 | % | | | 1.32 | % | | | 1.34 | % | | | 1.64 | %7 | | | 0.82 | %7 |
| | | | | | | | | | | | | | | | | | | | | | | | | | | | |
Total expenses excluding recoupment of past waived fees | | | 1.30 | %7 | | | 1.35 | % | | | 1.35 | % | | | 1.32 | % | | | 1.34 | % | | | 1.64 | %7 | | | 0.82 | %7 |
| | | | | | | | | | | | | | | | | | | | | | | | | | | | |
Total expenses after fees waived, reimbursed and paid indirectly | | | 1.29 | %7 | | | 1.36 | % | | | 1.35 | % | | | 1.30 | % | | | 1.34 | % | | | 1.55 | %7 | | | 0.82 | %7 |
| | | | | | | | | | | | | | | | | | | | | | | | | | | | |
Net investment income (loss) | | | 0.21 | %7 | | | 0.03 | % | | | (0.06 | )% | | | (0.08 | )% | | | (0.12 | )% | | | (0.90 | )%7 | | | (0.70 | )%7 |
| | | | | | | | | | | | | | | | | | | | | | | | | | | | |
Supplemental Data | | | | | | | | | | | | | | | | | | | | | | | | | | | | |
Net assets, end of period (000) | | $ | 12,529 | | | $ | 8,110 | | | $ | 5,764 | | | $ | 7,806 | | | $ | 4,347 | | | $ | 66 | | | $ | — | 9 |
| | | | | | | | | | | | | | | | | | | | | | | | | | | | |
Portfolio turnover | | | 82 | % | | | 153 | % | | | 91 | % | | | 98 | % | | | 157 | % | | | 77 | % | | | 173 | % |
| | | | | | | | | | | | | | | | | | | | | | | | | | | | |
See Notes to Financial Statements.
| | | | | | |
44 | | BLACKROCK FUNDS | | MARCH 31, 2010 | | |
| | |
| Financial Highlights (continued) | | BlackRock Health Sciences Opportunities Portfolio |
| | |
| | | | | | | | | | | | | | | | | | | | | | | | | | | | |
| | | Investor A | |
| | | Six Months
Ended
March 31, 2010
(Unaudited) | | | Year Ended September 30, | | | Period
March 1, 2005 to
September 30, 2005 | | | Year Ended February 28, | |
| | | | 2009 | | | 2008 | | | 2007 | | | 2006 | | | | 2005 | |
Per Share Operating Performance | |
Net asset value, beginning of period | | $ | 25.69 | | | $ | 28.14 | | | $ | 29.77 | | | $ | 25.72 | | | $ | 24.11 | | | $ | 20.24 | | | $ | 20.96 | |
| | | | | | | | | | | | | | | | | | | | | | | | | | | | |
Net investment income (loss) | | | 0.03 | 1 | | | 0.01 | 1 | | | (0.02 | )1 | | | (0.03 | )1 | | | (0.05 | )1 | | | (0.09 | )1 | | | (0.17 | ) |
Net realized and unrealized gain (loss) | | | 3.63 | | | | (0.15 | ) | | | (0.49 | ) | | | 4.43 | | | | 2.27 | | | | 3.97 | | | | 0.52 | |
| | | | | | | | | | | | | | | | | | | | | | | | | | | | |
Net increase (decrease) from investment operations | | | 3.66 | | | | (0.14 | ) | | | (0.51 | ) | | | 4.40 | | | | 2.22 | | | | 3.88 | | | | 0.35 | |
| | | | | | | | | | | | | | | | | | | | | | | | | | | | |
Distributions from net realized gain | | | — | | | | (2.31 | ) | | | (1.12 | ) | | | (0.35 | ) | | | (0.62 | ) | | | (0.01 | ) | | | (1.07 | ) |
| | | | | | | | | | | | | | | | | | | | | | | | | | | | |
Redemption fees added to paid-in capital | | | 0.00 | 2 | | | 0.00 | 2 | | | 0.00 | 2 | | | 0.00 | 2 | | | 0.01 | | | | 0.00 | 2 | | | — | |
| | | | | | | | | | | | | | | | | | | | | | | | | | | | |
Net asset value, end of period | | $ | 29.35 | | | $ | 25.69 | | | $ | 28.14 | | | $ | 29.77 | | | $ | 25.72 | | | $ | 24.11 | | | $ | 20.24 | |
| | | | | | | | | | | | | | | | | | | | | | | | | | | | |
Total Investment Return3 | |
Based on net asset value | | | 14.25 | %4,5 | | | 1.57 | %4 | | | (1.97 | )%4 | | | 17.29 | %4 | | | 9.40 | %6 | | | 19.17 | %4,5 | | | 1.52 | % |
| | | | | | | | | | | | | | | | | | | | | | | | | | | | |
Ratios to Average Net Assets | |
Total expenses | | | 1.30 | %7 | | | 1.37 | % | | | 1.35 | % | | | 1.35 | % | | | 1.45 | % | | | 1.69 | %7 | | | 1.73 | % |
| | | | | | | | | | | | | | | | | | | | | | | | | | | | |
Total expenses excluding recoupment of past waived fees | | | 1.30 | %7 | | | 1.37 | % | | | 1.35 | % | | | 1.35 | % | | | 1.45 | % | | | 1.69 | %7 | | | 1.73 | % |
| | | | | | | | | | | | | | | | | | | | | | | | | | | | |
Total expenses after fees waived, reimbursed and paid indirectly | | | 1.29 | %7 | | | 1.37 | % | | | 1.35 | % | | | 1.35 | % | | | 1.34 | % | | | 1.55 | %7 | | | 1.58 | % |
| | | | | | | | | | | | | | | | | | | | | | | | | | | | |
Net investment income (loss) | | | 0.19 | %7 | | | 0.02 | % | | | (0.06 | )% | | | (0.13 | )% | | | (0.19 | )% | | | (0.68 | )%7 | | | (0.90 | )% |
| | | | | | | | | | | | | | | | | | | | | | | | | | | | |
Supplemental Data | |
Net assets, end of period (000) | | $ | 666,700 | | | $ | 478,273 | | | $ | 564,943 | | | $ | 697,451 | | | $ | 434,360 | | | $ | 186,545 | | | $ | 76,550 | |
| | | | | | | | | | | | | | | | | | | | | | | | | | | | |
Portfolio turnover | | | 82 | % | | | 153 | % | | | 91 | % | | | 98 | % | | | 157 | % | | | 77 | % | | | 173 | % |
| | | | | | | | | | | | | | | | | | | | | | | | | | | | |
| 1 | Based on average shares outstanding. |
| 2 | Less than $0.01 per share. |
| 3 | Where applicable, total investment returns exclude the effects of any sales charges and include the reinvestment of dividends and distributions. |
| 4 | Redemption fee of 2.00% is reflected in total return calculations. There was no impact to the return. |
| 5 | Aggregate total investment return. |
| 6 | Redemption fee of 2.00% is reflected in total return calculations. The impact to the return from redemption fees received during the period was an increase of 0.04%. |
| 8 | Commencement of operations. |
| 9 | Net assets end of period are less than $500. |
See Notes to Financial Statements.
| | | | | | |
| | | BLACKROCK FUNDS | | MARCH 31, 2010 | | 45 |
| | |
| Financial Highlights (continued) | | BlackRock Health Sciences Opportunities Portfolio |
| | |
| | | | | | | | | | | | | | | | | | | | | | | | | | | | |
| | | Investor B | |
| | | Six Months
Ended
March 31, 2010
(Unaudited) | | | Year Ended September 30, | | | Period
March 1, 2005 to
September 30, 2005 | | | Year Ended February 28, | |
| | | | 2009 | | | 2008 | | | 2007 | | | 2006 | | | | 2005 | |
Per Share Operating Performance | |
Net asset value, beginning of period | | $ | 24.25 | | | $ | 26.73 | | | $ | 28.28 | | | $ | 24.65 | | | $ | 23.31 | | | $ | 19.65 | | | $ | 20.52 | |
| | | | | | | | | | | | | | | | | | | | | | | | | | | | |
Net investment loss | | | (0.09 | )1 | | | (0.17 | )1 | | | (0.23 | )1 | | | (0.25 | )1 | | | (0.24 | )1 | | | (0.17 | )1 | | | (0.28 | ) |
Net realized and unrealized gain (loss) | | | 3.43 | | | | (0.16 | ) | | | (0.49 | ) | | | 4.23 | | | | 2.19 | | | | 3.84 | | | | 0.48 | |
| | | | | | | | | | | | | | | | | | | | | | | | | | | | |
Net increase (decrease) from investment operations | | | 3.34 | | | | (0.33 | ) | | | (0.72 | ) | | | 3.98 | | | | 1.95 | | | | 3.67 | | | | 0.20 | |
| | | | | | | | | | | | | | | | | | | | | | | | | | | | |
Distributions from net realized gain | | | — | | | | (2.15 | ) | | | (0.83 | ) | | | (0.35 | ) | | | (0.62 | ) | | | (0.01 | ) | | | (1.07 | ) |
| | | | | | | | | | | | | | | | | | | | | | | | | | | | |
Redemption fees added to paid-in capital | | | 0.00 | 2 | | | 0.00 | 2 | | | 0.00 | 2 | | | 0.00 | 2 | | | 0.01 | | | | 0.00 | 2 | | | — | |
| | | | | | | | | | | | | | | | | | | | | | | | | | | | |
Net asset value, end of period | | $ | 27.59 | | | $ | 24.25 | | | $ | 26.73 | | | $ | 28.28 | | | $ | 24.65 | | | $ | 23.31 | | | $ | 19.65 | |
| | | | | | | | | | | | | | | | | | | | | | | | | | | | |
Total Investment Return3 | |
Based on net asset value | | | 13.77 | %4,5 | | | 0.73 | %4 | | | (2.78 | )%4 | | | 16.33 | %4 | | | 8.54 | %6 | | | 18.68 | %4,5 | | | 0.80 | % |
| | | | | | | | | | | | | | | | | | | | | | | | | | | | |
Ratios to Average Net Assets | |
Total expenses | | | 2.12 | %7 | | | 2.20 | % | | | 2.14 | % | | | 2.22 | % | | | 2.16 | % | | | 2.33 | %7 | | | 2.39 | % |
| | | | | | | | | | | | | | | | | | | | | | | | | | | | |
Total expenses excluding recoupment of past waived fees | | | 2.12 | %7 | | | 2.17 | % | | | 2.14 | % | | | 2.22 | % | | | 2.16 | % | | | 2.33 | %7 | | | 2.39 | % |
| | | | | | | | | | | | | | | | | | | | | | | | | | | | |
Total expenses after fees waived, reimbursed and paid indirectly | | | 2.12 | %7 | | | 2.20 | % | | | 2.14 | % | | | 2.19 | % | | | 2.16 | % | | | 2.25 | %7 | | | 2.25 | % |
| | | | | | | | | | | | | | | | | | | | | | | | | | | | |
Net investment loss | | | (0.70 | )%7 | | | (0.80 | )% | | | (0.85 | )% | | | (0.96 | )% | | | (1.02 | )% | | | (1.35 | )%7 | | | (1.58 | )% |
| | | | | | | | | | | | | | | | | | | | | | | | | | | | |
Supplemental Data | |
Net assets, end of period (000) | | $ | 57,414 | | | $ | 57,835 | | | $ | 80,269 | | | $ | 95,231 | | | $ | 78,902 | | | $ | 45,073 | | | $ | 29,495 | |
| | | | | | | | | | | | | | | | | | | | | | | | | | | | |
Portfolio turnover | | | 82 | % | | | 153 | % | | | 91 | % | | | 98 | % | | | 157 | % | | | 77 | % | | | 173 | % |
| | | | | | | | | | | | | | | | | | | | | | | | | | | | |
See Notes Financial Statements.
| | | | | | |
46 | | BLACKROCK FUNDS | | MARCH 31, 2010 | | |
| | |
| Financial Highlights (continued) | | BlackRock Health Sciences Opportunities Portfolio |
| | |
| | | | | | | | | | | | | | | | | | | | | | | | | | | | |
| | | Investor C | |
| | | Six Months
Ended
March 31, 2010
(Unaudited) | | | Year Ended September 30, | | | Period
March 1, 2005 to
September 30, 2005 | | | Year Ended February 28, | |
| | | | 2009 | | | 2008 | | | 2007 | | | 2006 | | | | 2005 | |
Per Share Operating Performance | |
Net asset value, beginning of period | | $ | 24.22 | | | $ | 26.70 | | | $ | 28.27 | | | $ | 24.62 | | | $ | 23.26 | | | $ | 19.61 | | | $ | 20.47 | |
| | | | | | | | | | | | | | | | | | | | | | | | | | | | |
Net investment loss | | | (0.07 | )1 | | | (0.15 | )1 | | | (0.21 | )1 | | | (0.23 | )1 | | | (0.21 | )1 | | | (0.18 | )1 | | | (0.22 | ) |
Net realized and unrealized gain (loss) | | | 3.42 | | | | (0.16 | ) | | | (0.47 | ) | | | 4.23 | | | | 2.18 | | | | 3.84 | | | | 0.43 | |
| | | | | | | | | | | | | | | | | | | | | | | | | | | | |
Net increase (decrease) from investment operations | | | 3.35 | | | | (0.31 | ) | | | (0.68 | ) | | | 4.00 | | | | 1.97 | | | | 3.66 | | | | 0.21 | |
| | | | | | | | | | | | | | | | | | | | | | | | | | | | |
Distributions from net realized gain | | | — | | | | (2.17 | ) | | | (0.89 | ) | | | (0.35 | ) | | | (0.62 | ) | | | (0.01 | ) | | | (1.07 | ) |
| | | | | | | | | | | | | | | | | | | | | | | | | | | | |
Redemption fees added to paid-in capital | | | 0.00 | 2 | | | 0.00 | 2 | | | 0.00 | 2 | | | 0.00 | 2 | | | 0.01 | | | | 0.00 | 2 | | | — | |
| | | | | | | | | | | | | | | | | | | | | | | | | | | | |
Net asset value, end of period | | $ | 27.57 | | | $ | 24.22 | | | $ | 26.70 | | | $ | 28.27 | | | $ | 24.62 | | | $ | 23.26 | | | $ | 19.61 | |
| | | | | | | | | | | | | | | | | | | | | | | | | | | | |
Total Investment Return3 | |
Based on net asset value | | | 13.83 | %4,5 | | | 0.81 | %4 | | | (2.66 | )%4 | | | 16.43 | %4 | | | 8.65 | %6 | | | 18.67 | %4,5 | | | 0.86 | % |
| | | | | | | | | | | | | | | | | | | | | | | | | | | | |
Ratios to Average Net Assets | |
Total expenses | | | 2.04 | %7 | | | 2.09 | % | | | 2.05 | % | | | 2.12 | % | | | 2.04 | % | | | 2.32 | %7 | | | 2.41 | % |
| | | | | | | | | | | | | | | | | | | | | | | | | | | | |
Total expenses excluding recoupment of past waived fees | | | 2.04 | %7 | | | 2.09 | % | | | 2.05 | % | | | 2.12 | % | | | 2.04 | % | | | 2.32 | %7 | | | 2.41 | % |
| | | | | | | | | | | | | | | | | | | | | | | | | | | | |
Total expenses after fees waived, reimbursed and paid indirectly | | | 2.03 | %7 | | | 2.09 | % | | | 2.05 | % | | | 2.11 | % | | | 2.04 | % | | | 2.25 | %7 | | | 2.25 | % |
| | | | | | | | | | | | | | | | | | | | | | | | | | | | |
Net investment loss | | | (0.58 | )%7 | | | (0.70 | )% | | | (0.76 | )% | | | (0.89 | )% | | | (0.87 | )% | | | (1.41 | )%7 | | | (1.56 | )% |
| | | | | | | | | | | | | | | | | | | | | | | | | | | | |
Supplemental Data | |
Net assets, end of period (000) | | $ | 304,777 | | | $ | 255,340 | | | $ | 305,015 | | | $ | 363,739 | | | $ | 254,724 | | | $ | 84,431 | | | $ | 25,248 | |
| | | | | | | | | | | | | | | | | | | | | | | | | | | | |
Portfolio turnover | | | 82 | % | | | 153 | % | | | 91 | % | | | 98 | % | | | 157 | % | | | 77 | % | | | 173 | % |
| | | | | | | | | | | | | | | | | | | | | | | | | | | | |
| 1 | Based on average shares outstanding. |
| 2 | Less than $0.01 per share. |
| 3 | Where applicable, total investment returns exclude the effects of any sales charges and include the reinvestment of dividends and distributions. |
| 4 | Redemption fee of 2.00% is reflected in total return calculations. There was no impact to the return. |
| 5 | Aggregate total investment return. |
| 6 | Redemption fee of 2.00% is reflected in total return calculations. The impact to the return from redemption fees received during the period was an increase of 0.04%. |
See Notes to Financial Statements.
| | | | | | |
| | | BLACKROCK FUNDS | | MARCH 31, 2010 | | 47 |
| | |
| Financial Highlights (continued) | | BlackRock International Opportunities Portfolio |
| | |
| | | | | | | | | | | | | | | | | | | | | | | | | | | | | | | | | | | | | | | | | | | | | | | | |
| | | Institutional | | | Service | |
| | | Six Months
Ended
March 31, 2010
(Unaudited) | | | Year Ended September 30, | | | Six Months
Ended
March 31, 2010
(Unaudited) | | | Year Ended September 30, | |
| | | | 2009 | | | 2008 | | | 2007 | | | 2006 | | | 2005 | | | | 2009 | | | 2008 | | | 2007 | | | 2006 | | | 2005 | |
Per Share Operating Performance | |
Net asset value, beginning of period | | $ | 31.36 | | | $ | 29.44 | | | $ | 51.08 | | | $ | 42.16 | | | $ | 34.34 | | | $ | 24.44 | | | $ | 30.26 | | | $ | 28.36 | | | $ | 49.52 | | | $ | 41.06 | | | $ | 33.55 | | | $ | 23.93 | |
| | | | | | | | | | | | | | | | | | | | | | | | | | | | | | | | | | | | | | | | | | | | | | | | |
Net investment income (loss)1 | | | 0.04 | | | | 0.34 | | | | 0.47 | | | | 0.48 | | | | 0.37 | | | | 0.53 | | | | (0.03 | ) | | | 0.27 | | | | 0.28 | | | | 0.32 | | | | 0.29 | | | | 0.44 | |
Net realized and unrealized gain (loss) | | | 0.96 | | | | 1.68 | | | | (13.66 | ) | | | 14.98 | | | | 8.57 | | | | 9.68 | | | | 0.94 | | | | 1.63 | | | | (13.14 | ) | | | 14.58 | | | | 8.32 | | | | 9.45 | |
| | | | | | | | | | | | | | | | | | | | | | | | | | | | | | | | | | | | | | | | | | | | | | | | |
Net increase (decrease) from investment operations | | | 1.00 | | | | 2.02 | | | | (13.19 | ) | | | 15.46 | | | | 8.94 | | | | 10.21 | | | | 0.91 | | | | 1.90 | | | | (12.86 | ) | | | 14.90 | | | | 8.61 | | | | 9.89 | |
| | | | | | | | | | | | | | | | | | | | | | | | | | | | | | | | | | | | | | | | | | | | | | | | |
Dividends and distributions from: | | | | | | | | | | | | | | | | | | | | | | | | | | | | | | | | | | | | | | | | | | | | | | | | |
Net investment income | | | (0.46 | ) | | | (0.10 | ) | | | (1.21 | ) | | | (0.71 | ) | | | (0.37 | ) | | | (0.32 | ) | | | (0.37 | ) | | | — | | | | (1.06 | ) | | | (0.61 | ) | | | (0.35 | ) | | | (0.28 | ) |
Net realized gain | | | — | | | | — | | | | (7.24 | ) | | | (5.83 | ) | | | (0.76 | ) | | | — | | | | — | | | | — | | | | (7.24 | ) | | | (5.83 | ) | | | (0.76 | ) | | | — | |
| | | | | | | | | | | | | | | | | | | | | | | | | | | | | | | | | | | | | | | | | | | | | | | | |
Total dividends and distributions | | | (0.46 | ) | | | (0.10 | ) | | | (8.45 | ) | | | (6.54 | ) | | | (1.13 | ) | | | (0.32 | ) | | | (0.37 | ) | | | — | | | | (8.30 | ) | | | (6.44 | ) | | | (1.11 | ) | | | (0.28 | ) |
| | | | | | | | | | | | | | | | | | | | | | | | | | | | | | | | | | | | | | | | | | | | | | | | |
Redemption fees added to paid-in capital | | | 0.00 | 2 | | | 0.00 | 2 | | | 0.00 | 2 | | | 0.00 | 2 | | | 0.01 | | | | 0.01 | | | | 0.00 | 2 | | | 0.00 | 2 | | | 0.00 | 2 | | | 0.00 | 2 | | | 0.01 | | | | 0.01 | |
| | | | | | | | | | | | | | | | | | | | | | | | | | | | | | | | | | | | | | | | | | | | | | | | |
Net asset value, end of period | | $ | 31.90 | | | $ | 31.36 | | | $ | 29.44 | | | $ | 51.08 | | | $ | 42.16 | | | $ | 34.34 | | | $ | 30.80 | | | $ | 30.26 | | | $ | 28.36 | | | $ | 49.52 | | | $ | 41.06 | | | $ | 33.55 | |
| | | | | | | | | | | | | | | | | | | | | | | | | | | | | | | | | | | | | | | | | | | | | | | | |
Total Investment Return3 | |
Based on net asset value | | | 3.21 | %4,5 | | | 6.99 | %4 | | | (30.87 | )%4,6 | | | 40.42 | %4 | | | 26.64 | %7 | | | 42.13 | %8 | | | 3.02 | %4,5 | | | 6.70 | %4 | | | (31.10 | )%4,6 | | | 40.00 | %4 | | | 26.30 | %7 | | | 41.65 | %8 |
| | | | | | | | | | | | | | | | | | | | | | | | | | | | | | | | | | | | | | | | | | | | | | | | |
Ratios to Average Net Assets | �� |
Total expenses | | | 1.31 | %9 | | | 1.45 | % | | | 1.25 | % | | | 1.25 | % | | | 1.33 | % | | | 1.51 | % | | | 1.71 | %9 | | | 1.75 | % | | | 1.58 | % | | | 1.59 | % | | | 1.58 | % | | | 1.76 | % |
| | | | | | | | | | | | | | | | | | | | | | | | | | | | | | | | | | | | | | | | | | | | | | | | |
Total expenses excluding recoupment of past waived fees | | | 1.28 | %9 | | | 1.45 | % | | | 1.25 | % | | | 1.25 | % | | | 1.33 | % | | | 1.51 | % | | | 1.64 | %9 | | | 1.73 | % | | | 1.58 | % | | | 1.59 | % | | | 1.58 | % | | | 1.76 | % |
| | | | | | | | | | | | | | | | | | | | | | | | | | | | | | | | | | | | | | | | | | | | | | | | |
Total expenses after fees waived, reimbursed and paid indirectly | | | 1.30 | %9 | | | 1.43 | % | | | 1.25 | % | | | 1.25 | % | | | 1.33 | % | | | 1.45 | % | | | 1.71 | %9 | | | 1.70 | % | | | 1.58 | % | | | 1.58 | % | | | 1.57 | % | | | 1.74 | % |
| | | | | | | | | | | | | | | | | | | | | | | | | | | | | | | | | | | | | | | | | | | | | | | | |
Net investment income (loss) | | | 0.24 | %9 | | | 1.36 | % | | | 1.18 | % | | | 1.06 | % | | | 0.91 | % | | | 1.81 | % | | | (0.17 | )%9 | | | 1.13 | % | | | 0.72 | % | | | 0.73 | % | | | 0.73 | % | | | 1.52 | % |
| | | | | | | | | | | | | | | | | | | | | | | | | | | | | | | | | | | | | | | | | | | | | | | | |
Supplemental Data | |
Net assets, end of period (000) | | $ | 773,193 | | | $ | 673,420 | | | $ | 450,605 | | | $ | 492,444 | | | $ | 336,000 | | | $ | 216,070 | | | $ | 85,011 | | | $ | 83,093 | | | $ | 64,368 | | | $ | 172,135 | | | $ | 128,879 | | | $ | 44,308 | |
| | | | | | | | | | | | | | | | | | | | | | | | | | | | | | | | | | | | | | | | | | | | | | | | |
Portfolio turnover | | | 62 | % | | | 143 | % | | | 138 | % | | | 77 | % | | | 91 | % | | | 86 | % | | | 62 | % | | | 143 | % | | | 138 | % | | | 77 | % | | | 91 | % | | | 86 | % |
| | | | | | | | | | | | | | | | | | | | | | | | | | | | | | | | | | | | | | | | | | | | | | | | |
See Notes to Financial Statements.
| | | | | | |
48 | | BLACKROCK FUNDS | | MARCH 31, 2010 | | |
| | |
| Financial Highlights (continued) | | BlackRock International Opportunities Portfolio |
| | |
| | | | | | | | | | | | | | | | | | | | | | | | |
| | | Investor A | |
| | | Six Months
Ended
March 31, 2010
(Unaudited) | | | Year Ended September 30, | |
| | | | 2009 | | | 2008 | | | 2007 | | | 2006 | | | 2005 | |
Per Share Operating Performance | |
Net asset value, beginning of period | | $ | 30.02 | | | $ | 28.14 | | | $ | 49.19 | | | $ | 40.81 | | | $ | 33.36 | | | $ | 23.78 | |
| | | | | | | | | | | | | | | | | | | | | | | | |
Net investment income1 | | | 0.01 | | | | 0.27 | | | | 0.33 | | | | 0.30 | | | | 0.23 | | | | 0.44 | |
Net realized and unrealized gain (loss) | | | 0.92 | | | | 1.62 | | | | (13.09 | ) | | | 14.49 | | | | 8.32 | | | | 9.38 | |
| | | | | | | | | | | | | | | | | | | | | | | | |
Net increase (decrease) from investment operations | | | 0.93 | | | | 1.89 | | | | (12.76 | ) | | | 14.79 | | | | 8.55 | | | | 9.82 | |
| | | | | | | | | | | | | | | | | | | | | | | | |
Dividends and distributions from: | |
Net investment income | | | (0.40 | ) | | | (0.01 | ) | | | (1.05 | ) | | | (0.58 | ) | | | (0.35 | ) | | | (0.25 | ) |
Net realized gain | | | — | | | | — | | | | (7.24 | ) | | | (5.83 | ) | | | (0.76 | ) | | | — | |
| | | | | | | | | | | | | | | | | | | | | | | | |
Total dividends and distributions | | | (0.40 | ) | | | (0.01 | ) | | | (8.29 | ) | | | (6.41 | ) | | | (1.11 | ) | | | (0.25 | ) |
| | | | | | | | | | | | | | | | | | | | | | | | |
Redemption fees added to paid-in capital | | | 0.00 | 2 | | | 0.00 | 2 | | | 0.00 | 2 | | | 0.00 | 2 | | | 0.01 | | | | 0.01 | |
| | | | | | | | | | | | | | | | | | | | | | | | |
Net asset value, end of period | | $ | 30.55 | | | $ | 30.02 | | | $ | 28.14 | | | $ | 49.19 | | | $ | 40.81 | | | $ | 33.36 | |
| | | | | | | | | | | | | | | | | | | | | | | | |
Total Investment Return3 | |
Based on net asset value | | | 3.10 | %4,5 | | | 6.73 | %4 | | | (31.09 | )%4,6 | | | 39.98 | %4 | | | 26.24 | %7 | | | 41.60 | %10 |
| | | | | | | | | | | | | | | | | | | | | | | | |
Ratios to Average Net Assets | |
Total expenses | | | 1.54 | %9 | | | 1.68 | % | | | 1.58 | % | | | 1.60 | % | | | 1.74 | % | | | 1.86 | % |
| | | | | | | | | | | | | | | | | | | | | | | | |
Total expenses after fees waived, reimbursed and paid indirectly | | | 1.54 | %9 | | | 1.68 | % | | | 1.58 | % | | | 1.60 | % | | | 1.63 | % | | | 1.75 | % |
| | | | | | | | | | | | | | | | | | | | | | | | |
Net investment income | | | 0.04 | %9 | | | 1.15 | % | | | 0.87 | % | | | 0.69 | % | | | 0.62 | % | | | 1.53 | % |
| | | | | | | | | | | | | | | | | | | | | | | | |
Supplemental Data | |
Net assets, end of period (000) | | $ | 778,226 | | | $ | 604,283 | | | $ | 482,526 | | | $ | 555,189 | | | $ | 407,282 | | | $ | 253,710 | |
| | | | | | | | | | | | | | | | | | | | | | | | |
Portfolio turnover | | | 62 | % | | | 143 | % | | | 138 | % | | | 77 | % | | | 91 | % | | | 86 | % |
| | | | | | | | | | | | | | | | | | | | | | | | |
| 1 | Based on average shares outstanding. |
| 2 | Less than $0.01 per share. |
| 3 | Where applicable, total investment returns exclude the effects of any sales charges and include the reinvestment of dividends and distributions. |
| 4 | Redemption fee of 2.00% is reflected in total return calculations. There was no impact to the return. |
| 5 | Aggregate total investment return. |
| 6 | Payment from affiliate of $112,880 received by the Fund is reflected in total return calculations. There was no impact to the return. |
| 7 | Redemption fee of 2.00% is reflected in total return calculations. The impact to the return from redemption fees received during the period was an increase of 0.03%. |
| 8 | Redemption fee of 2.00% is reflected in total return calculations. The impact to the return from redemption fees received during the period was an increase of 0.04%. |
| 10 | Redemption fee of 2.00% is reflected in total return calculations. The impact to the return from redemption fees received during the period was an increase of 0.05%. |
See Notes to Financial Statements.
| | | | | | |
| | | BLACKROCK FUNDS | | MARCH 31, 2010 | | 49 |
| | |
| Financial Highlights (continued) | | BlackRock International Opportunities Portfolio |
| | |
| | | | | | | | | | | | | | | | | | | | | | | | |
| | | Investor B | |
| | | Six Months
Ended
March 31, 2010
(Unaudited) | | | Year Ended September 30, | |
| | | | 2009 | | | 2008 | | | 2007 | | | 2006 | | | 2005 | |
Per Share Operating Performance | |
Net asset value, beginning of period | | $ | 27.83 | | | $ | 26.29 | | | $ | 46.43 | | | $ | 38.81 | | | $ | 31.97 | | | $ | 22.80 | |
| | | | | | | | | | | | | | | | | | | | | | | | |
Net investment income (loss)1 | | | (0.12 | ) | | | 0.09 | | | | (0.06 | ) | | | (0.04 | ) | | | (0.07 | ) | | | 0.18 | |
Net realized and unrealized gain (loss) | | | 0.86 | | | | 1.45 | | | | (12.16 | ) | | | 13.74 | | | | 7.95 | | | | 9.05 | |
| | | | | | | | | | | | | | | | | | | | | | | | |
Net increase (decrease) from investment operations | | | 0.74 | | | | 1.54 | | | | (12.22 | ) | | | 13.70 | | | | 7.88 | | | | 9.23 | |
| | | | | | | | | | | | | | | | | | | | | | | | |
Dividends and distributions from: | | | | | | | | | | | | | | | | | | | | | | | | |
Net investment income | | | (0.10 | ) | | | — | | | | (0.68 | ) | | | (0.25 | ) | | | (0.29 | ) | | | (0.07 | ) |
Net realized gain | | | — | | | | — | | | | (7.24 | ) | | | (5.83 | ) | | | (0.76 | ) | | | — | |
| | | | | | | | | | | | | | | | | | | | | | | | |
Total dividends and distributions | | | (0.10 | ) | | | — | | | | (7.92 | ) | | | (6.08 | ) | | | (1.05 | ) | | | (0.07 | ) |
| | | | | | | | | | | | | | | | | | | | | | | | |
Redemption fees added to paid-in capital | | | 0.00 | 2 | | | 0.00 | 2 | | | 0.00 | 2 | | | 0.00 | 2 | | | 0.01 | | | | 0.01 | |
| | | | | | | | | | | | | | | | | | | | | | | | |
Net asset value, end of period | | $ | 28.47 | | | $ | 27.83 | | | $ | 26.29 | | | $ | 46.43 | | | $ | 38.81 | | | $ | 31.97 | |
| | | | | | | | | | | | | | | | | | | | | | | | |
Total Investment Return3 | |
Based on net asset value | | | 2.65 | %4,5 | | | 5.86 | %4 | | | (31.63 | )%4,6 | | | 38.89 | %4 | | | 25.24 | %7 | | | 40.58 | %8 |
| | | | | | | | | | | | | | | | | | | | | | | | |
Ratios to Average Net Assets | |
Total expenses | | | 2.39 | %9 | | | 2.49 | % | | | 2.35 | % | | | 2.37 | % | | | 2.43 | % | | | 2.51 | % |
| | | | | | | | | | | | | | | | | | | | | | | | |
Total expenses excluding recoupment of past waived fees | | | 2.39 | %9 | | | 2.49 | % | | | 2.35 | % | | | 2.37 | % | | | 2.43 | % | | | 2.51 | % |
| | | | | | | | | | | | | | | | | | | | | | | | |
Total expenses after fees waived, reimbursed and paid indirectly | | | 2.39 | %9 | | | 2.49 | % | | | 2.35 | % | | | 2.37 | % | | | 2.43 | % | | | 2.50 | % |
| | | | | | | | | | | | | | | | | | | | | | | | |
Net investment income (loss) | | | (0.86 | )%9 | | | 0.41 | % | | | (0.15 | )% | | | (0.10 | )% | | | (0.22 | )% | | | 0.68 | % |
| | | | | | | | | | | | | | | | | | | | | | | | |
Supplemental Data | |
Net assets, end of period (000) | | $ | 30,441 | | | $ | 33,094 | | | $ | 42,927 | | | $ | 102,624 | | | $ | 91,605 | | | $ | 73,946 | |
| | | | | | | | | | | | | | | | | | | | | | | | |
Portfolio turnover | | | 62 | % | | | 143 | % | | | 138 | % | | | 77 | % | | | 91 | % | | | 86 | % |
| | | | | | | | | | | | | | | | | | | | | | | | |
See Notes to Financial Statements.
| | | | | | |
50 | | BLACKROCK FUNDS | | MARCH 31, 2010 | | |
| | |
| Financial Highlights (continued) | | BlackRock International Opportunities Portfolio |
| | |
| | | | | | | | | | | | | | | | | | | | | | | | |
| | | Investor C | |
| | | Six Months
Ended
March 31, 2010
(Unaudited) | | | Year Ended September 30, | |
| | | | 2009 | | | 2008 | | | 2007 | | | 2006 | | | 2005 | |
Per Share Operating Performance | |
Net asset value, beginning of period | | $ | 27.74 | | | $ | 26.21 | | | $ | 46.34 | | | $ | 38.78 | | | $ | 31.93 | | | $ | 22.80 | |
| | | | | | | | | | | | | | | | | | | | | | | | |
Net investment income (loss)1 | | | (0.10 | ) | | | 0.08 | | | | 0.03 | | | | (0.03 | ) | | | (0.04 | ) | | | 0.21 | |
Net realized and unrealized gain (loss) | | | 0.85 | | | | 1.45 | | | | (12.20 | ) | | | 13.71 | | | | 7.93 | | | | 9.01 | |
| | | | | | | | | | | | | | | | | | | | | | | | |
Net increase (decrease) from investment operations | | | 0.75 | | | | 1.53 | | | | (12.17 | ) | | | 13.68 | | | | 7.89 | | | | 9.22 | |
| | | | | | | | | | | | | | | | | | | | | | | | |
Dividends and distributions from: | | | | | | | | | | | | | | | | | | | | | | | | |
Net investment income | | | (0.19 | ) | | | — | | | | (0.72 | ) | | | (0.29 | ) | | | (0.29 | ) | | | (0.10 | ) |
Net realized gain | | | — | | | | — | | | | (7.24 | ) | | | (5.83 | ) | | | (0.76 | ) | | | — | |
| | | | | | | | | | | | | | | | | | | | | | | | |
Total dividends and distributions | | | (0.19 | ) | | | — | | | | (7.96 | ) | | | (6.12 | ) | | | (1.05 | ) | | | (0.10 | ) |
| | | | | | | | | | | | | | | | | | | | | | | | |
Redemption fees added to paid-in capital | | | 0.00 | 2 | | | 0.00 | 2 | | | 0.00 | 2 | | | 0.00 | 2 | | | 0.01 | | | | 0.01 | |
| | | | | | | | | | | | | | | | | | | | | | | | |
Net asset value, end of period | | $ | 28.30 | | | $ | 27.74 | | | $ | 26.21 | | | $ | 46.34 | | | $ | 38.78 | | | $ | 31.93 | |
| | | | | | | | | | | | | | | | | | | | | | | | |
Total Investment Return3 | |
Based on net asset value | | | 2.70 | %4,5 | | | 5.84 | %4 | | | (31.61 | )%4,6 | | | 38.91 | %4 | | | 25.33 | %7 | | | 40.60 | %10 |
| | | | | | | | | | | | | | | | | | | | | | | | |
Ratios to Average Net Assets | | | | | | | | | | | | | | | | | | | | | | | | |
Total expenses | | | 2.32 | %9 | | | 2.49 | % | | | 2.32 | % | | | 2.36 | % | | | 2.37 | % | | | 2.51 | % |
| | | | | | | | | | | | | | | | | | | | | | | | |
Total expenses excluding recoupment of past waived fees | | | 2.32 | %9 | | | 2.49 | % | | | 2.32 | % | | | 2.36 | % | | | 2.37 | % | | | 2.51 | % |
| | | | | | | | | | | | | | | | | | | | | | | | |
Total expenses after fees waived, reimbursed and paid indirectly | | | 2.32 | %9 | | | 2.48 | % | | | 2.32 | % | | | 2.36 | % | | | 2.37 | % | | | 2.50 | % |
| | | | | | | | | | | | | | | | | | | | | | | | |
Net investment income (loss) | | | (0.74 | )%9 | | | 0.38 | % | | | 0.08 | % | | | (0.08 | )% | | | (0.13 | )% | | | 0.75 | % |
| | | | | | | | | | | | | | | | | | | | | | | | |
Supplemental Data | |
Net assets, end of period (000) | | $ | 230,648 | | | $ | 187,246 | | | $ | 194,068 | | | $ | 255,980 | | | $ | 205,958 | | | $ | 130,138 | |
| | | | | | | | | | | | | | | | | | | | | | | | |
Portfolio turnover | | | 62 | % | | | 143 | % | | | 138 | % | | | 77 | % | | | 91 | % | | | 86 | % |
| | | | | | | | | | | | | | | | | | | | | | | | |
| 1 | Based on average shares outstanding. |
| 2 | Less than $0.01 per share. |
| 3 | Where applicable, total investment returns exclude the effects of any sales charges and include the reinvestment of dividends and distributions. |
| 4 | Redemption fee of 2.00% is reflected in total return calculations. There was no impact to the return. |
| 5 | Aggregate total investment return. |
| 6 | Payment from affiliate of $112,880 received by the Fund is reflected in total return calculations. There was no impact to the return. |
| 7 | Redemption fee of 2.00% is reflected in total return calculations. The impact to the return from redemption fees received during the period was an increase of 0.03%. |
| 8 | Redemption fee of 2.00% is reflected in total return calculations. The impact to the return from redemption fees received during the period was an increase of 0.04%. |
| 10 | Redemption fee of 2.00% is reflected in total return calculations. The impact to the return from redemption fees received during the period was an increase of 0.05%. |
See Notes to Financial Statements.
| | | | | | |
| | | BLACKROCK FUNDS | | MARCH 31, 2010 | | 51 |
| | |
| Financial Highlights (continued) | | BlackRock Science & Technology Opportunities Portfolio |
| | |
| | | | | | | | | | | | | | | | | | | | | | | | | | | | | | | | | | | | | | | | | | | | | | | | |
| | | Institutional | | | Service | |
| | | Six Months
Ended
March 31, 2010
(Unaudited) | | | Year Ended September 30, | | | Six Months
Ended
March 31, 2010
(Unaudited) | | | Year Ended September 30, | |
| | | | 2009 | | | 2008 | | | 2007 | | | 2006 | | | 2005 | | | | 2009 | | | 2008 | | | 2007 | | | 2006 | | | 2005 | |
Per Share Operating Performance | |
Net asset value, beginning of period | | $ | 7.79 | | | $ | 6.98 $ | | | | 9.03 | | | $ | 7.20 | | | $ | 6.61 | | | $ | 5.42 | | | $ | 7.56 | | | $ | 6.80 | | | $ | 8.83 | | | $ | 7.07 | | | $ | 6.51 | | | $ | 5.35 | |
| | | | | | | | | | | | | | | | | | | | | | | | | | | | | | | | | | | | | | | | | | | | | | | | |
Net investment loss1 | | | (0.03 | ) | | | (0.02 | ) | | | (0.05 | ) | | | (0.03 | ) | | | (0.03 | ) | | | (0.04 | ) | | | (0.04 | ) | | | (0.04 | ) | | | (0.06 | ) | | | (0.07 | ) | | | (0.05 | ) | | | (0.06 | ) |
Net realized and unrealized gain (loss) | | | 0.99 | | | | 0.83 | | | | (2.00 | ) | | | 1.86 | | | | 0.61 | | | | 1.23 | | | | 0.96 | | | | 0.80 | | | | (1.97 | ) | | | 1.83 | | | | 0.60 | | | | 1.22 | |
| | | | | | | | | | | | | | | | | | | | | | | | | | | | | | | | | | | | | | | | | | | | | | | | |
Net increase (decrease) from investment operations | | | 0.96 | | | | 0.81 | | | | (2.05 | ) | | | 1.83 | | | | 0.58 | | | | 1.19 | | | | 0.92 | | | | 0.76 | | | | (2.03 | ) | | | 1.76 | | | | 0.55 | | | | 1.16 | |
| | | | | | | | | | | | | | | | | | | | | | | | | | | | | | | | | | | | | | | | | | | | | | | | |
Redemption fees added to paid-in capital | | | 0.00 | 2 | | | 0.00 | 2 | | | 0.00 | 2 | | | 0.00 | 2 | | | 0.01 | | | | 0.00 | 2 | | | 0.00 | 2 | | | 0.00 | 2 | | | 0.00 | 2 | | | 0.00 | 2 | | | 0.01 | | | | 0.00 | 2 |
| | | | | | | | | | | | | | | | | | | | | | | | | | | | | | | | | | | | | | | | | | | | | | | | |
Net asset value, end of period | | $ | 8.75 | | | $ | 7.79 | | | $ | 6.98 | | | $ | 9.03 | | | $ | 7.20 | | | $ | 6.61 | | | $ | 8.48 | | | $ | 7.56 | | | $ | 6.80 | | | $ | 8.83 | | | $ | 7.07 | | | $ | 6.51 | |
| | | | | | | | | | | | | | | | | | | | | | | | | | | | | | | | | | | | | | | | | | | | | | | | |
Total Investment Return3 | |
Based on net asset value | | | 12.32 | %4,5,6 | | | 11.60 | %5,7 | | | (22.70 | )%5 | | | 25.42 | %5 | | | 8.93 | %8 | | | 21.96 | %5 | | | 12.17 | %5,6,9 | | | 11.18 | %5,10 | | | (22.99 | )%5 | | | 24.89 | %5 | | | 8.60 | %8 | | | 21.68 | %5 |
| | | | | | | | | | | | | | | | | | | | | | | | | | | | | | | | | | | | | | | | | | | | | | | | |
Ratios to Average Net Assets | |
Total expenses | | | 1.58 | %11 | | | 1.90 | % | | | 1.70 | % | | | 1.91 | % | | | 1.79 | % | | | 1.98 | % | | | 1.73 | %11 | | | 1.96 | % | | | 2.01 | % | | | 2.30 | % | | | 2.06 | % | | | 2.27 | % |
| | | | | | | | | | | | | | | | | | | | | | | | | | | | | | | | | | | | | | | | | | | | | | | | |
Total expenses excluding recoupment of past waived fees | | | 1.58 | %11 | | | 1.90 | % | | | 1.70 | % | | | 1.91 | % | | | 1.79 | % | | | 1.98 | % | | | 1.59 | %11 | | | 1.96 | % | | | 2.01 | % | | | 2.30 | % | | | 2.06 | % | | | 2.27 | % |
| | | | | | | | | | | | | | | | | | | | | | | | | | | | | | | | | | | | | | | | | | | | | | | | |
Total expenses after fees waived, reimbursed and paid indirectly | | | 1.39 | %11 | | | 1.36 | % | | | 1.35 | % | | | 1.35 | % | | | 1.38 | % | | | 1.43 | % | | | 1.73 | %11 | | | 1.75 | % | | | 1.73 | % | | | 1.73 | % | | | 1.73 | % | | | 1.73 | % |
| | | | | | | | | | | | | | | | | | | | | | | | | | | | | | | | | | | | | | | | | | | | | | | | |
Net investment loss | | | (0.65 | )%11 | | | (0.27 | )% | | | (0.55 | )% | | | (0.44 | )% | | | (0.45 | )% | | | (0.73 | )% | | | (0.99 | )%11 | | | (0.71 | )% | | | (0.75 | )% | | | (0.85 | )% | | | (0.79 | )% | | | (1.04 | )% |
| | | | | | | | | | | | | | | | | | | | | | | | | | | | | | | | | | | | | | | | | | | | | | | | |
Supplemental Data | |
Net assets, end of period (000) | | $ | 33,031 | | | $ | 27,013 | | | $ | 42,886 | | | $ | 1,449 | | | $ | 1,262 | | | $ | 847 | | | $ | 491 | | | $ | 193 | | | $ | 106 | | | $ | 123 | | | $ | 148 | | | $ | 116 | |
| | | | | | | | | | | | | | | | | | | | | | | | | | | | | | | | | | | | | | | | | | | | | | | | |
Portfolio turnover | | | 31 | % | | | 158 | % | | | 89 | % | | | 92 | % | | | 132 | % | | | 113 | % | | | 31 | % | | | 158 | % | | | 89 | % | | | 92 | % | | | 132 | % | | | 113 | % |
| | | | | | | | | | | | | | | | | | | | | | | | | | | | | | | | | | | | | | | | | | | | | | | | |
| | |
| | | Investor A | | | Investor B | |
| | | Six Months
Ended
March 31, 2010
(Unaudited) | | | Year Ended September 30, | | | Six Months
Ended
March 31, 2010
(Unaudited) | | | Year Ended September 30, | |
| | | | 2009 | | | 2008 | | | 2007 | | | 2006 | | | 2005 | | | | 2009 | | | 2008 | | | 2007 | | | 2006 | | | 2005 | |
Per Share Operating Performance | |
Net asset value, beginning of period | | $ | 7.48 | | | $ | 6.73 | | | $ | 8.74 | | | $ | 7.00 | | | $ | 6.45 | | | $ | 5.31 | | | $ | 6.94 | | | $ | 6.30 | | | $ | 8.26 | | | $ | 6.66 | | | $ | 6.19 | | | $ | 5.13 | |
| | | | | | | | | | | | | | | | | | | | | | | | | | | | | | | | | | | | | | | | | | | | | | | | |
Net investment loss1 | | | (0.04 | ) | | | (0.04 | ) | | | (0.06 | ) | | | (0.06 | ) | | | (0.06 | ) | | | (0.07 | ) | | | (0.07 | ) | | | (0.08 | ) | | | (0.13 | ) | | | (0.12 | ) | | | (0.11 | ) | | | (0.11 | ) |
Net realized and unrealized gain (loss) | | | 0.95 | | | | 0.79 | | | | (1.95 | ) | | | 1.80 | | | | 0.60 | | | | 1.21 | | | | 0.88 | | | | 0.72 | | | | (1.83 | ) | | | 1.72 | | | | 0.57 | | | | 1.17 | |
| | | | | | | | | | | | | | | | | | | | | | | | | | | | | | | | | | | | | | | | | | | | | | | | |
Net increase (decrease) from investment operations | | | 0.91 | | | | 0.75 | | | | (2.01 | ) | | | 1.74 | | | | 0.54 | | | | 1.14 | | | | 0.81 | | | | 0.64 | | | | (1.96 | ) | | | 1.60 | | | | 0.46 | | | | 1.06 | |
| | | | | | | | | | | | | | | | | | | | | | | | | | | | | | | | | | | | | | | | | | | | | | | | |
Redemption fees added to paid-in capital | | | 0.00 | 2 | | | 0.00 | 2 | | | 0.00 | 2 | | | 0.00 | 2 | | | 0.01 | | | | 0.00 | 2 | | | 0.00 | 2 | | | 0.00 | 2 | | | 0.00 | 2 | | | 0.00 | 2 | | | 0.01 | | | | 0.00 | 2 |
| | | | | | | | | | | | | | | | | | | | | | | | | | | | | | | | | | | | | | | | | | | | | | | | |
Net asset value, end of period | | $ | 8.39 | | | $ | 7.48 | | | $ | 6.73 | | | $ | 8.74 | | | $ | 7.00 | | | $ | 6.45 | | | $ | 7.75 | | | $ | 6.94 | | | $ | 6.30 | | | $ | 8.26 | | | $ | 6.66 | | | $ | 6.19 | |
| | | | | | | | | | | | | | | | | | | | | | | | | | | | | | | | | | | | | | | | | | | | | | | | |
Total Investment Return3 | |
Based on net asset value | | | 12.17 | %5,6,9 | | | 11.14 | %5,12 | | | (23.00 | )%5 | | | 24.86 | %5 | | | 8.53 | %13 | | | 21.47 | %5 | | | 11.67 | %5,6,14 | | | 10.16 | %5,15 | | | (23.73 | )%5 | | | 24.02 | %5 | | | 7.59 | %13 | | | 20.66 | %5 |
| | | | | | | | | | | | | | | | | | | | | | | | | | | | | | | | | | | | | | | | | | | | | | | | |
Ratios to Average Net Assets | |
Total expenses | | | 1.83 | %11 | | | 2.24 | % | | | 2.04 | % | | | 2.16 | % | | | 2.27 | % | | | 2.35 | % | | | 2.73 | %11 | | | 3.13 | % | | | 2.96 | % | | | 3.01 | % | | | 3.06 | % | | | 3.00 | % |
| | | | | | | | | | | | | | | | | | | | | | | | | | | | | | | | | | | | | | | | | | | | | | | | |
Total expenses excluding recoupment of past waived fees | | | 1.83 | %11 | | | 2.24 | % | | | 2.04 | % | | | 2.16 | % | | | 2.27 | % | | | 2.35 | % | | | 2.72 | %11 | | | 3.00 | % | | | 2.96 | % | | | 3.01 | % | | | 3.06 | % | | | 3.00 | % |
| | | | | | | | | | | | | | | | | | | | | | | | | | | | | | | | | | | | | | | | | | | | | | | | |
Total expenses after fees waived, reimbursed and paid indirectly | | | 1.79 | %11 | | | 1.77 | % | | | 1.75 | % | | | 1.73 | % | | | 1.77 | % | | | 1.84 | % | | | 2.71 | %11 | | | 2.65 | % | | | 2.65 | % | | | 2.50 | % | | | 2.63 | % | | | 2.59 | % |
| | | | | | | | | | | | | | | | | | | | | | | | | | | | | | | | | | | | | | | | | | | | | | | | |
Net investment loss | | | (1.05 | )%11 | | | (0.68 | )% | | | (0.77 | )% | | | (0.80 | )% | | | (0.83 | )% | | | (1.16 | )% | | | (1.96 | )%11 | | | (1.53 | )% | | | (1.70 | )% | | | (1.59 | )% | | | (1.73 | )% | | | (1.91 | )% |
| | | | | | | | | | | | | | | | | | | | | | | | | | | | | | | | | | | | | | | | | | | | | | | | |
Supplemental Data | |
Net assets, end of period (000) | | $ | 111,114 | | | $ | 83,734 | | | $ | 72,659 | | | $ | 21,632 | | | $ | 13,040 | | | $ | 9,688 | | | $ | 5,413 | | | $ | 6,538 | | | $ | 11,473 | | | $ | 9,030 | | | $ | 10,439 | | | $ | 10,998 | |
| | | | | | | | | | | | | | | | | | | | | | | | | | | | | | | | | | | | | | | | | | | | | | | | |
Portfolio turnover | | | 31 | % | | | 158 | % | | | 89 | % | | | 92 | % | | | 132 | % | | | 113 | % | | | 31 | % | | | 158 | % | | | 89 | % | | | 92 | % | | | 132 | % | | | 113 | % |
| | | | | | | | | | | | | | | | | | | | | | | | | | | | | | | | | | | | | | | | | | | | | | | | |
See Notes to Financial Statements.
| | | | | | |
52 | | BLACKROCK FUNDS | | MARCH 31, 2010 | | |
| | |
| Financial Highlights (continued) | | BlackRock Science & Technology Opportunities Portfolio |
| | |
| | | | | | | | | | | | | | | | | | | | | | | | | | | | | | | | | | | | |
| | | Investor C | | | Class R | |
| | | Six Months
Ended
March 31, 2010
(Unaudited) | | | Year Ended September 30, | | | Six Months
Ended
March 31, 2010
(Unaudited) | | | Year Ended September 30, | | | Period
September 8, 200816 to
September 30, 2008 | |
| | | | 2009 | | | 2008 | | | 2007 | | | 2006 | | | 2005 | | | | 2009 | | |
Per Share Operating Performance | |
Net asset value, beginning of period | | $ | 6.94 | | | $ | 6.29 $ | | | | 8.25 | | | $ | 6.66 | | | $ | 6.19 | | | $ | 5.14 | | | $ | 7.72 | | | $ | 6.97 | | | $ | 7.38 | |
| | | | | | | | | | | | | | | | | | | | | | | | | | | | | | | | | | | | |
Net investment loss1 | | | (0.07 | ) | | | (0.09 | ) | | | (0.13 | ) | | | (0.12 | ) | | | (0.11 | ) | | | (0.11 | ) | | | (0.05 | ) | | | (0.06 | ) | | | (0.01 | ) |
Net realized and unrealized gain (loss) | | | 0.87 | | | | 0.74 | | | | (1.83 | ) | | | 1.71 | | | | 0.57 | | | | 1.16 | | | | 0.98 | | | | 0.81 | | | | (0.40 | ) |
| | | | | | | | | | | | | | | | | | | | | | | | | | | | | | | | | | | | |
Net increase (decrease) from investment operations | | | 0.80 | | | | 0.65 | | | | (1.96 | ) | | | 1.59 | | | | 0.46 | | | | 1.05 | | | | 0.93 | | | | 0.75 | | | | (0.41 | ) |
| | | | | | | | | | | | | | | | | | | | | | | | | | | | | | | | | | | | |
Redemption fees added to paid-in capital | | | 0.00 | 2 | | | 0.00 | 2 | | | 0.00 | 2 | | | 0.00 | 2 | | | 0.01 | | | | 0.00 | 2 | | | 0.00 | 2 | | | 0.00 | 2 | | | 0.00 | 2 |
| | | | | | | | | | | | | | | | | | | | | | | | | | | | | | | | | | | | |
Net asset value, end of period | | $ | 7.74 | | | $ | 6.94 | | | $ | 6.29 | | | $ | 8.25 | | | $ | 6.66 | | | $ | 6.19 | | | $ | 8.65 | | | $ | 7.72 | | | $ | 6.97 | |
| | | | | | | | | | | | | | | | | | | | | | | | | | | | | | | | | | | | |
Total Investment Return3 | |
Based on net asset value | | | 11.53 | %5,6,17 | | | 10.33 | %5,18 | | | (23.76 | )%5 | | | 23.87 | %5 | | | 7.59 | %13 | | | 20.43 | %5 | | | 12.05 | %5,6,19 | | | 10.76 | %5,20 | | | (5.56 | )%5,6 |
| | | | | | | | | | | | | | | | | | | | | | | | | | | | | | | | | | | | |
Ratios to Average Net Assets | |
Total expenses | | | 2.75 | %11 | | | 3.23 | % | | | 2.73 | % | | | 2.88 | % | | | 2.84 | % | | | 3.00 | % | | | 2.09 | %11 | | | 2.42 | % | | | 2.36 | %11 |
| | | | | | | | | | | | | | | | | | | | | | | | | | | | | | | | | | | | |
Total expenses excluding recoupment of past waived fees | | | 2.75 | %11 | | | 3.23 | % | | | 2.73 | % | | | 2.88 | % | | | 2.84 | % | | | 3.00 | % | | | 2.08 | %11 | | | 2.42 | % | | | 2.36 | %11 |
| | | | | | | | | | | | | | | | | | | | | | | | | | | | | | | | | | | | |
Total expenses after fees waived, reimbursed and paid indirectly | | | 2.72 | %11 | | | 2.68 | % | | | 2.62 | % | | | 2.61 | % | | | 2.62 | % | | | 2.59 | % | | | 2.09 | %11 | | | 2.13 | % | | | 2.13 | %11 |
| | | | | | | | | | | | | | | | | | | | | | | | | | | | | | | | | | | | |
Net investment loss | | | (1.98 | )%11 | | | (1.59 | )% | | | (1.67 | )% | | | (1.69 | )% | | | (1.67 | )% | | | (1.91 | )% | | | (1.35 | )%11 | | | (1.04 | )% | | | (1.49 | )%11 |
| | | | | | | | | | | | | | | | | | | | | | | | | | | | | | | | | | | | |
Supplemental Data | |
Net assets, end of period (000) | | $ | 27,219 | | | $ | 22,575 | | | $ | 22,003 | | | $ | 9,755 | | | $ | 6,511 | | | $ | 2,794 | | | $ | 2,403 | | | $ | 1,904 | | | $ | 1,362 | |
| | | | | | | | | | | | | | | | | | | | | | | | | | | | | | | | | | | | |
Portfolio turnover | | | 31 | % | | | 158 | % | | | 89 | % | | | 92 | % | | | 132 | % | | | 113 | % | | | 31 | % | | | 158 | % | | | 89 | % |
| | | | | | | | | | | | | | | | | | | | | | | | | | | | | | | | | | | | |
| 1 | Based on average shares outstanding. |
| 2 | Less than $0.01 per share. |
| 3 | Where applicable, total investment returns exclude the effects of any sales charges and include the reinvestment of dividends and distributions. |
| 4 | Includes proceeds received from a settlement of litigation, which impacted the Fund’s total return. Not including these proceeds, the Fund’s total return would have been 12.11%. |
| 5 | Redemption fee of 2.00% is reflected in total return calculations. There was no impact to the return. |
| 6 | Aggregate total investment return. |
| 7 | Includes proceeds received from a settlement of litigation, which impacted the Fund’s total return. Not including these proceeds, the Fund’s total return would have been 9.03%. |
| 8 | Redemption fee of 2.00% is reflected in total return calculations. The impact to the return from redemption fees received during the period was an increase of 0.15%. |
| 9 | Includes proceeds received from a settlement of litigation, which impacted the Fund’s total return. Not including these proceeds, the Fund’s total return would have been 11.95%. |
| 10 | Includes proceeds received from a settlement of litigation, which impacted the Fund’s total return. Not including these proceeds, the Fund’s total return would have been 8.53%. |
| 12 | Includes proceeds received from a settlement of litigation, which impacted the Fund’s total return. Not including these proceeds, the Fund’s total return would have been 8.47%. |
| 13 | Redemption fee of 2.00% is reflected in total return calculations. The impact to the return from redemption fees received during the period was an increase of 0.16%. |
| 14 | Includes proceeds received from a settlement of litigation, which impacted the Fund’s total return. Not including these proceeds, the Fund’s total return would have been 11.43%. |
| 15 | Includes proceeds received from a settlement of litigation, which impacted the Fund’s total return. Not including these proceeds, the Fund’s total return would have been 7.30%. |
| 16 | Commencement of operations. |
| 17 | Includes proceeds received from a settlement of litigation, which impacted the Fund’s total return. Not including these proceeds, the Fund’s total return would have been 11.29%. |
| 18 | Includes proceeds received from a settlement of litigation, which impacted the Fund’s total return. Not including these proceeds, the Fund’s total return would have been 7.47%. |
| 19 | Includes proceeds received from a settlement of litigation, which impacted the Fund’s total return. Not including these proceeds, the Fund’s total return would have been 11.83%. |
| 20 | Includes proceeds received from a settlement of litigation, which impacted the Fund’s total return. Not including these proceeds, the Fund’s total return would have been 8.18%. |
See Notes to Financial Statements.
| | | | | | |
| | | BLACKROCK FUNDS | | MARCH 31, 2010 | | 53 |
| | |
| Financial Highlights (continued) | | BlackRock U.S. Opportunities Portfolio |
| | |
| | | | | | | | | | | | | | | | | | | | | | | | | | | | | | | | | | | | | | | | | | | | | | | | |
| | | Institutional | | | Service | |
| | | Six Months
Ended
March 31, 2010
(Unaudited) | | | Year Ended September 30, | | | Six Months
Ended
March 31, 2010
(Unaudited) | | | Year Ended September 30, | |
| | | | 2009 | | | 2008 | | | 2007 | | | 2006 | | | 2005 | | | | 2009 | | | 2008 | | | 2007 | | | 2006 | | | 2005 | |
Per Share Operating Performance | |
Net asset value, beginning of period | | $ | 32.20 | | | $ | 31.69 | | | $ | 37.05 | | | $ | 29.07 | | | $ | 25.56 | | | $ | 20.34 | | | $ | 30.93 | | | $ | 30.58 | | | $ | 35.89 | | | $ | 28.28 | | | $ | 24.96 | | | $ | 19.93 | |
| | | | | | | | | | | | | | | | | | | | | | | | | | | | | | | | | | | | | | | | | | | | | | | | |
Net investment income (loss)1 | | | (0.01 | ) | | | 0.09 | | | | 0.09 | | | | 0.03 | | | | 0.04 | | | | (0.15 | ) | | | (0.08 | ) | | | (0.01 | ) | | | (0.06 | ) | | | (0.09 | ) | | | (0.07 | ) | | | (0.21 | ) |
Net realized and unrealized gain (loss) | | | 3.70 | | | | 0.42 | | | | (5.45 | ) | | | 7.95 | | | | 3.46 | | | | 5.37 | | | | 3.56 | | | | 0.35 | | | | (5.25 | ) | | | 7.70 | | | | 3.38 | | | | 5.24 | |
| | | | | | | | | | | | | | | | | | | | | | | | | | | | | | | | | | | | | | | | | | | | | | | | |
Net increase (decrease) from investment operations | | | 3.69 | | | | 0.51 | | | | (5.36 | ) | | | 7.98 | | | | 3.50 | | | | 5.22 | | | | 3.48 | | | | 0.34 | | | | (5.31 | ) | | | 7.61 | | | | 3.31 | | | | 5.03 | |
| | | | | | | | | | | | | | | | | | | | | | | | | | | | | | | | | | | | | | | | | | | | | | | | |
Dividends from net investment income | | | (0.07 | ) | | | (0.01 | ) | | | — | | | | — | | | | — | | | | — | | | | — | | | | — | | | | — | | | | — | | | | — | | | | — | |
| | | | | | | | | | | | | | | | | | | | | | | | | | | | | | | | | | | | | | | | | | | | | | | | |
Redemption fees added to paid-in capital | | | 0.00 | 2 | | | 0.01 | | | | 0.00 | 2 | | | 0.00 | 2 | | | 0.01 | | | | 0.00 | 2 | | | 0.00 | 2 | | | 0.01 | | | | 0.00 | 2 | | | 0.00 | 2 | | | 0.01 | | | | 0.00 | 2 |
| | | | | | | | | | | | | | | | | | | | | | | | | | | | | | | | | | | | | | | | | | | | | | | | |
Net asset value, end of period | | $ | 35.82 | | | $ | 32.20 | | | $ | 31.69 | | | $ | 37.05 | | | $ | 29.07 | | | $ | 25.56 | | | $ | 34.41 | | | $ | 30.93 | | | $ | 30.58 | | | $ | 35.89 | | | $ | 28.28 | | | $ | 24.96 | |
| | | | | | | | | | | | | | | | | | | | | | | | | | | | | | | | | | | | | | | | | | | | | | | | |
Total Investment Return3 | |
Based on net asset value | | | 11.47 | %4,5 | | | 1.63 | %6 | | | (14.47 | )%4 | | | 27.45 | %4 | | | 13.73 | %7 | | | 25.66 | %4 | | | 11.25 | %4,5 | | | 1.14 | %6 | | | (14.80 | )%4 | | | 26.91 | %4 | | | 13.30 | %7 | | | 25.24 | %4 |
| | | | | | | | | | | | | | | | | | | | | | | | | | | | | | | | | | | | | | | | | | | | | | | | |
Ratios to Average Net Assets | |
Total expenses | | | 1.29 | %8 | | | 1.40 | % | | | 1.42 | % | | | 1.42 | % | | | 1.49 | % | | | 1.73 | % | | | 1.60 | %8 | | | 1.71 | % | | | 1.68 | % | | | 1.69 | % | | | 1.85 | % | | | 1.97 | % |
| | | | | | | | | | | | | | | | | | | | | | | | | | | | | | | | | | | | | | | | | | | | | | | | |
Total expenses excluding recoupment of past waived fees | | | 1.29 | %8 | | | 1.40 | % | | | 1.42 | % | | | 1.42 | % | | | 1.49 | % | | | 1.73 | % | | | 1.59 | %8 | | | 1.70 | % | | | 1.68 | % | | | 1.69 | % | | | 1.85 | % | | | 1.97 | % |
| | | | | | | | | | | | | | | | | | | | | | | | | | | | | | | | | | | | | | | | | | | | | | | | |
Total expenses after fees waived, reimbursed and paid indirectly | | | 1.03 | %8 | | | 1.01 | % | | | 1.00 | % | | | 1.01 | % | | | 1.19 | % | | | 1.60 | % | | | 1.47 | %8 | | | 1.49 | % | | | 1.43 | % | | | 1.40 | % | | | 1.57 | % | | | 1.90 | % |
| | | | | | | | | | | | | | | | | | | | | | | | | | | | | | | | | | | | | | | | | | | | | | | | |
Net investment income (loss) | | | (0.06 | )%8 | | | 0.36 | % | | | 0.26 | % | | | 0.09 | % | | | 0.15 | % | | | (0.65 | )% | | | (0.50 | )%8 | | | (0.06 | )% | | | (0.17 | )% | | | (0.28 | )% | | | (0.25 | )% | | | (0.96 | )% |
| | | | | | | | | | | | | | | | | | | | | | | | | | | | | | | | | | | | | | | | | | | | | | | | |
Supplemental Data | |
Net assets, end of period (000) | | $ | 1,277,321 | | | $ | 890,264 | | | $ | 298,166 | | | $ | 158,094 | | | $ | 20,548 | | | $ | 6,390 | | | $ | 229,695 | | | $ | 191,318 | | | $ | 109,679 | | | $ | 43,763 | | | $ | 1,527 | | | $ | 472 | |
| | | | | | | | | | | | | | | | | | | | | | | | | | | | | | | | | | | | | | | | | | | | | | | | |
Portfolio turnover | | | 75 | % | | | 166 | % | | | 164 | % | | | 106 | % | | | 120 | % | | | 94 | % | | | 75 | % | | | 166 | % | | | 164 | % | | | 106 | % | | | 120 | % | | | 94 | % |
| | | | | | | | | | | | | | | | | | | | | | | | | | | | | | | | | | | | | | | | | | | | | | | | |
| | |
| | | Investor A | | | Investor B | |
| | | Six Months
Ended
March 31, 2010
(Unaudited) | | | Year Ended September 30, | | | Six Months
Ended
March 31, 2010
(Unaudited) | | | Year Ended September 30, | |
| | | | 2009 | | | 2008 | | | 2007 | | | 2006 | | | 2005 | | | | 2009 | | | 2008 | | | 2007 | | | 2006 | | | 2005 | |
Per Share Operating Performance | | | | | | | | | | | | | | | | | |
Net asset value, beginning of period | | $ | 30.61 | | | $ | 30.29 | | | $ | 35.57 | | | $ | 28.03 | | | $ | 24.76 | | | $ | 19.78 | | | $ | 28.16 | | | $ | 28.06 | | | $ | 33.20 | | | $ | 26.37 | | | $ | 23.45 | | | $ | 18.87 | |
| | | | | | | | | | | | | | | | | | | | | | | | | | | | | | | | | | | | | | | | | | | | | | | | |
Net investment loss1 | | | (0.08 | ) | | | (0.04 | ) | | | (0.08 | ) | | | (0.10 | ) | | | (0.10 | ) | | | (0.22 | ) | | | (0.19 | ) | | | (0.17 | ) | | | (0.31 | ) | | | (0.32 | ) | | | (0.29 | ) | | | (0.37 | ) |
Net realized and unrealized gain (loss) | | | 3.52 | | | | 0.35 | | | | (5.20 | ) | | | 7.64 | | | | 3.36 | | | | 5.20 | | | | 3.23 | | | | 0.26 | | | | (4.83 | ) | | | 7.15 | | | | 3.20 | | | | 4.95 | |
| | | | | | | | | | | | | | | | | | | | | | | | | | | | | | | | | | | | | | | | | | | | | | | | |
Net increase (decrease) from investment operations | | | 3.44 | | | | 0.31 | | | | (5.28 | ) | | | 7.54 | | | | 3.26 | | | | 4.98 | | | | 3.04 | | | | 0.09 | | | | (5.14 | ) | | | 6.83 | | | | 2.91 | | | | 4.58 | |
| | | | | | | | | | | | | | | | | | | | | | | | | | | | | | | | | | | | | | | | | | | | | | | | |
Redemption fees added to paid-in capital | | | 0.00 | 2 | | | 0.01 | | | | 0.00 | 2 | | | 0.00 | 2 | | | 0.01 | | | | 0.00 | 2 | | | 0.00 | 2 | | | 0.01 | | | | 0.00 | 2 | | | 0.00 | 2 | | | 0.01 | | | | 0.00 | 2 |
| | | | | | | | | | | | | | | | | | | | | | | | | | | | | | | | | | | | | | | | | | | | | | | | |
Net asset value, end of period | | $ | 34.05 | | | $ | 30.61 | | | $ | 30.29 | | | $ | 35.57 | | | $ | 28.03 | | | $ | 24.76 | | | $ | 31.20 | | | $ | 28.16 | | | $ | 28.06 | | | $ | 33.20 | | | $ | 26.37 | | | $ | 23.45 | |
| | | | | | | | | | | | | | | | | | | | | | | | | | | | | | | | | | | | | | | | | | | | | | | | |
Total Investment Return3 | |
Based on net asset value | | | 11.24 | %4,5 | | | 1.06 | %7 | | | (14.84 | )%4 | | | 26.90 | %4 | | | 13.21 | %7 | | | 25.18 | %4 | | | 10.79 | %4,5 | | | 0.36 | %7 | | | (15.48 | )%4 | | | 25.90 | %4 | | | 12.45 | %7 | | | 24.27 | %4 |
| | | | | | | | | | | | | | | | | | | | | | | | | | | | | | | | | | | | | | | | | | | | | | | | |
Ratios to Average Net Assets | |
Total expenses | | | 1.61 | %8 | | | 1.76 | % | | | 1.73 | % | | | 1.77 | % | | | 1.95 | % | | | 2.08 | % | | | 2.47 | %8 | | | 2.59 | % | | | 2.56 | % | | | 2.56 | % | | | 2.68 | % | | | 2.73 | % |
| | | | | | | | | | | | | | | | | | | | | | | | | | | | | | | | | | | | | | | | | | | | | | | | |
Total expenses excluding recoupment of past waived fees | | | 1.61 | %8 | | | 1.75 | % | | | 1.73 | % | | | 1.77 | % | | | 1.95 | % | | | 2.08 | % | | | 2.47 | %8 | | | 2.59 | % | | | 2.56 | % | | | 2.56 | % | | | 2.68 | % | | | 2.73 | % |
| | | | | | | | | | | | | | | | | | | | | | | | | | | | | | | | | | | | | | | | | | | | | | | | |
Total expenses after fees waived, reimbursed and paid indirectly | | | 1.48 | %8 | | | 1.56 | % | | | 1.48 | % | | | 1.48 | % | | | 1.66 | % | | | 1.97 | % | | | 2.32 | %8 | | | 2.27 | % | | | 2.22 | % | | | 2.23 | % | | | 2.40 | % | | | 2.72 | % |
| | | | | | | | | | | | | | | | | | | | | | | | | | | | | | | | | | | | | | | | | | | | | | | | |
Net investment loss | | | (0.50 | )%8 | | | (0.15 | )% | | | (0.22 | )% | | | (0.32 | )% | | | (0.35 | )% | | | (1.02 | )% | | | (1.34 | )%8 | | | (0.77 | )% | | | (0.95 | )% | | | (1.06 | )% | | | (1.13 | )% | | | (1.77 | )% |
| | | | | | | | | | | | | | | | | | | | | | | | | | | | | | | | | | | | | | | | | | | | | | | | |
Supplemental Data | |
Net assets, end of period (000) | | $ | 1,128,432 | | | $ | 855,127 | | | $ | 495,656 | | | $ | 228,668 | | | $ | 96,194 | | | $ | 31,277 | | | $ | 22,100 | | | $ | 21,849 | | | $ | 20,998 | | | $ | 35,928 | | | $ | 36,093 | | | $ | 37,132 | |
| | | | | | | | | | | | | | | | | | | | | | | | | | | | | | | | | | | | | | | | | | | | | | | | |
Portfolio turnover | | | 75 | % | | | 166 | % | | | 164 | % | | | 106 | % | | | 120 | % | | | 94 | % | | | 75 | % | | | 166 | % | | | 164 | % | | | 106 | % | | | 120 | % | | | 94 | % |
| | | | | | | | | | | | | | | | | | | | | | | | | | | | | | | | | | | | | | | | | | | | | | | | |
See Notes to Financial Statements.
| | | | | | |
54 | | BLACKROCK FUNDS | | MARCH 31, 2010 | | |
| | |
| Financial Highlights (concluded) | | BlackRock U.S. Opportunities Portfolio |
| | | | | | | | | | | | | | | | | | | | | | | | |
| | | Investor C | |
| | | Six Months
Ended
March 31, 2010
(Unaudited) | | | | | | | | | | | | | | | | |
| | | | Year Ended September 30, | |
| | | | 2009 | | | 2008 | | | 2007 | | | 2006 | | | 2005 | |
Per Share Operating Performance | | | | | | | | | | | | | | | | | | | | | | | | |
Net asset value, beginning of period | | $ | 28.14 | | | $ | 28.04 | | | $ | 33.18 | | | $ | 26.34 | | | $ | 23.43 | | | $ | 18.85 | |
| | | | | | | | | | | | | | | | | | | | | | | | |
Net investment loss1 | | | (0.19 | ) | | | (0.19 | ) | | | (0.30 | ) | | | (0.32 | ) | | | (0.28 | ) | | | (0.37 | ) |
Net realized and unrealized gain (loss) | | | 3.23 | | | | 0.28 | | | | (4.84 | ) | | | 7.16 | | | | 3.18 | | | | 4.95 | |
| | | | | | | | | | | | | | | | | | | | | | | | |
Net increase (decrease) from investment operations | | | 3.04 | | | | 0.09 | | | | (5.14 | ) | | | 6.84 | | | | 2.90 | | | | 4.58 | |
| | | | | | | | | | | | | | | | | | | | | | | | |
Redemption fees added to paid-in capital | | | 0.00 | 2 | | | 0.01 | | | | 0.00 | 2 | | | 0.00 | 2 | | | 0.01 | | | | 0.00 | 2 |
| | | | | | | | | | | | | | | | | | | | | | | | |
Net asset value, end of period | | $ | 31.18 | | | $ | 28.14 | | | $ | 28.04 | | | $ | 33.18 | | | $ | 26.34 | | | $ | 23.43 | |
| | | | | | | | | | | | | | | | | | | | | | | | |
Total Investment Return3 | | | | | | | | | | | | | | | | | | | | | | | | |
Based on net asset value | | | 10.80 | %4,5 | | | 0.36 | %7 | | | (15.49 | )%4 | | | 25.97 | %4 | | | 12.42 | %7 | | | 24.30 | %4 |
| | | | | | | | | | | | | | | | | | | | | | | | |
Ratios to Average Net Assets | | | | | | | | | | | | | | | | | | | | | | | | |
Total expenses | | | 2.38 | %8 | | | 2.52 | % | | | 2.46 | % | | | 2.51 | % | | | 2.60 | % | | | 2.73 | % |
| | | | | | | | | | | | | | | | | | | | | | | | |
Total expenses excluding recoupment of past waived fees | | | 2.36 | %8 | | | 2.52 | % | | | 2.46 | % | | | 2.51 | % | | | 2.60 | % | | | 2.73 | % |
| | | | | | | | | | | | | | | | | | | | | | | | |
Total expenses after fees waived, reimbursed and paid indirectly | | | 2.25 | %8 | | | 2.28 | % | | | 2.21 | % | | | 2.20 | % | | | 2.37 | % | | | 2.72 | % |
| | | | | | | | | | | | | | | | | | | | | | | | |
Net investment loss | | | (1.28 | )%8 | | | (0.85 | )% | | | (0.95 | )% | | | (1.04 | )% | | | (1.07 | )% | | | (1.77 | )% |
| | | | | | | | | | | | | | | | | | | | | | | | |
Supplemental Data | | | | | | | | | | | | | | | | | | | | | | | | |
Net assets, end of period (000) | | $ | 310,517 | | | $ | 238,819 | | | $ | 145,626 | | | $ | 88,826 | | | $ | 39,427 | | | $ | 20,774 | |
| | | | | | | | | | | | | | | | | | | | | | | | |
Portfolio turnover | | | 75 | % | | | 166 | % | | | 164 | % | | | 106 | % | | | 120 | % | | | 94 | % |
| | | | | | | | | | | | | | | | | | | | | | | | |
| 1 | Based on average shares outstanding. |
| 2 | Less than $0.01 per share. |
| 3 | Where applicable, total investment returns exclude the effects of any sales charges and include the reinvestment of dividends and distributions. |
| 4 | Redemption fee of 2.00% is reflected in total return calculations. There was no impact to the return. |
| 5 | Aggregate total investment return. |
| 6 | Redemption fee of 2.00% is reflected in total return calculations. The impact to the return from redemption fees received during the period was an increase of 0.03%. |
| 7 | Redemption fee of 2.00% is reflected in total return calculations. The impact to the return from redemption fees received during the period was an increase of 0.04%. |
| | | | | | |
| See Notes to Financial Statements. | | | | |
| | | BLACKROCK FUNDS | | MARCH 31, 2010 | | 55 |
Notes to Financial Statements (Unaudited)
1. Organization and Significant Accounting Policies:
BlackRock FundsSM (the “Trust”), a Massachusetts business trust, is registered under the Investment Company Act of 1940, as amended (the “1940 Act”), as an open-end management investment company. As of March 31, 2010, the Trust had 25 series, of which BlackRock Global Opportunities Portfolio (“Global Opportunities”), BlackRock Health Sciences Opportunities Portfolio (“Health Sciences Opportunities”), BlackRock International Opportunities Portfolio (“International Opportunities”), BlackRock Science & Technology Opportunities Portfolio (“Science & Technology Opportunities”) and BlackRock U.S. Opportunities Portfolio (“U.S. Opportunities”) (collectively the “Funds”) are included in these financial statements. Each of the Funds, except Health Sciences Opportunities is diversified. The Funds’ financial statements are prepared in conformity with accounting principles generally accepted in the United States of America (“US GAAP”), which may require the use of management accruals and estimates. Actual results may differ from these estimates. Each Fund offers multiple classes of shares. Institutional Shares are sold without a sales charge and only to certain eligible investors. Service Shares are sold without a sales charge. Investor A Shares are generally sold with a front-end sales charge. Investor B and Investor C Shares may be subject to a contingent deferred sales charge. Class R Shares are sold without a sales charge and only to certain retirement and other similar plans. All classes of shares have identical voting, dividend, liquidation and other rights and the same terms and conditions, except that Service, Investor A, Investor B, Investor C and Class R Shares bear certain expenses related to the shareholder servicing of such shares, and Investor B, Investor C and Class R Shares also bear certain expenses related to the distribution of such shares. Investor B Shares automatically convert to Investor A Shares after approximately eight years. Investor B Shares are only available for purchase through exchanges, dividend reinvestment or for purchase by certain qualified employee benefit plans. Each class has exclusive voting rights with respect to matters relating to its shareholder servicing and distribution expenditures (except that Investor B shareholders may vote on material changes to the Investor A distribution plan).
The following is a summary of significant accounting policies followed by the Funds:
Valuation: The Funds’ policy is to fair value their financial instruments at market value. Equity investments traded on a recognized securities exchange or the NASDAQ Global Market System are valued at the last reported sale price that day or the NASDAQ official closing price, if applicable. For equity investments traded on more than one exchange, the last reported sale price on the exchange where the stock is primarily traded is used. Equity investments traded on a recognized exchange for which there were no sales on that day are valued at the last available bid price. If no bid price is available, the prior day’s price will be used, unless it is determined that such prior day’s price no longer reflects the fair value of the security. Short-term securities with remaining maturities of 60 days or less may be valued at amortized cost, which approximates fair value. Investments in open-end investment companies are valued at net asset value each business day.
The Funds value their investments in BlackRock Liquidity Series, LLC Money Market Series (the “Money Market Series”) at fair value, which is ordinarily based upon their pro rata ownership in the net assets of the underlying fund. The Money Market Series seeks current income consistent with maintaining liquidity and preserving capital. Although the Money Market Series is not registered under the 1940 Act, its investments will follow the parameters of investments by a money market fund that is subject to Rule 2a-7 promulgated by the Securities and Exchange Commission (“SEC”) under the 1940 Act. The Funds may withdraw up to 25% of its investment daily, although the manager of the Money Market Series, in its sole discretion, may permit an investor to withdraw more than 25% on any one day.
Securities and other assets and liabilities denominated in foreign currencies are translated into US dollars using exchange rates determined as of the close of business on the New York Stock Exchange (“NYSE”). Foreign currency exchange contracts are valued at the mid between the bid and ask prices and are determined as of the close of business on the NYSE. Interpolated values are derived when the settlement date of the contract is an interim date for which quotations are not available.
Exchange-traded options are valued at the mean between the last bid and ask prices at the close of the options market in which the options trade. An exchange-traded option for which there is no mean price is valued at the last bid (long positions) or ask (short positions) price. If no bid or ask price is available, the prior day’s price will be used, unless it is determined that such prior day’s price no longer reflects the fair value of the option.
In the event that application of these methods of valuation results in a price for an investment which is deemed not to be representative of the market value of such investment or is not available, the investment will be valued by a method approved by the Board of Trustees (the “Board”) as reflecting fair value (“Fair Value Assets”). When determining the price for Fair Value Assets, the investment advisor and/or the sub-advisor seeks to determine the price that each Fund might reasonably expect to receive from the current sale of that asset in an arm’s-length transaction. Fair value determinations shall be based upon all available factors that the investment advisor and/or sub-advisor deems relevant. The pricing of all Fair Value Assets is subsequently reported to the Board or a committee thereof.
Generally, trading in foreign instruments is substantially completed each day at various times prior to the close of business on the NYSE. Occasionally, events affecting the values of such instruments may occur between the foreign market close and the close of business on the NYSE that may not be reflected in the computation of each Fund’s net assets. If events (for example, a company announcement, market volatility or a natural disaster) occur during such periods that are expected to materially affect the value of such instruments, those instruments may be Fair Value Assets and be valued at their fair value, as determined in good faith by the Board or by the investment advisor using a pricing service and/or procedures approved by the Board. Each business day,
| | | | | | |
56 | | BLACKROCK FUNDS | | MARCH 31, 2010 | | |
Notes to Financial Statements (continued)
the Funds use a pricing service selected under the supervision of the Board to assist with the valuation of certain foreign exchange-traded equity securities and foreign exchange-traded and OTC options (the “Systematic Fair Value Price”). Using current market factors, the Systematic Fair Value Price is designed to value such foreign securities and foreign options at fair value as of the close of business on the NYSE, which follows the close of the local markets.
Foreign Currency Transactions: The Funds’ books and records are maintained in US dollars. Foreign currency amounts are translated into US dollars as follows: (i) market value of investment securities, assets and liabilities at the current rate of exchange; and (ii) purchases and sales of investment securities, income and expenses at the rates of exchange prevailing on the respective dates of such transactions. Generally, when the US dollar rises in value against foreign currency, the Funds’ investments denominated in that currency will lose value because its currency is worth fewer US dollars; the opposite effect occurs if the US dollar falls in relative value.
The Funds report foreign currency related transactions as components of realized gains/(loss) for financial reporting purposes, whereas such components are treated as ordinary income for federal income tax purposes.
Preferred Stock: The Funds may invest in preferred stocks. Preferred stock has a preference over common stock in liquidation (and generally in receiving dividends as well) but is subordinated to the liabilities of the issuer in all respects. As a general rule, the market value of preferred stock with a fixed dividend rate and no conversion element varies inversely with interest rates and perceived credit risk, while the market price of convertible preferred stock generally also reflects some element of conversion value. Because preferred stock is junior to debt securities and other obligations of the issuer, deterioration in the credit quality of the issuer will cause greater changes in the value of a preferred stock than in a more senior debt security with similar stated yield characteristics. Unlike interest payments on debt securities, preferred stock dividends are payable only if declared by the issuer’s board of directors. Preferred stock also may be subject to optional or mandatory redemption provisions.
Segregation and Collateralization: In cases in which the 1940 Act and the interpretive positions of the SEC require that a Fund either delivers collateral or segregates assets in connection with certain investments (e.g., foreign currency exchange contracts and written options) each Fund will, consistent with SEC rules and/or certain interpretive letters issued by the SEC, segregate collateral or designate on its books and records cash or other liquid securities having a market value at least equal to the amount that would otherwise be required to be physically segregated. Furthermore, based on requirements and agreements with certain exchanges and third party broker-dealers, each party has requirements to deliver/deposit securities as collateral for certain investments.
Redemptions-In-Kind: International Opportunities transferred securities and cash as a redemption-in-kind transaction. For purposes of generally accepted accounting principles, these transactions were treated as a sale of securities and the resulting gains and losses were recognized based on the market value of the securities on the date of the transfer. For tax purposes, no gains or losses were recognized. Gains and losses resulting from such redemptions-in-kind are shown as redemption-in-kind transactions in the Statements of Operations.
Investment Transactions and Investment Income: For financial reporting purposes, investment transactions are recorded on the dates the transactions are entered into (the trade dates). Realized gains and losses on investment transactions are determined on the identified cost basis. Dividend income is recorded on the ex-dividend dates. Dividends from foreign securities where the ex-dividend date may have passed are subsequently recorded when the Funds have determined the ex-dividend date. Under the applicable foreign tax laws, a withholding tax at various rates may be imposed on capital gains, dividends and interest. Upon notification from issuers, some of the dividend income received from a real estate investment trust may be redesignated as a reduction of cost of the related investment and/or realized gain. Interest income, including amortization of premium and accretion of discount on debt securities, is recognized on the accrual basis. Income and realized and unrealized gains and losses are allocated daily to each class based on its relative net assets.
Dividends and Distributions: Dividends and distributions, if any, paid by the Funds are recorded on the ex-dividend dates. The amount and timing of dividends and distributions are determined in accordance with federal income tax regulations, which may differ from US GAAP.
Securities Lending: The Funds may lend securities to financial institutions that provide cash as collateral, which will be maintained at all times in an amount equal to at least 100% of the current market value of the loaned securities. The market value of the loaned securities is determined at the close of business of the Funds and any additional required collateral is delivered to the Funds on the next business day. Securities lending income, as disclosed in the Statements of Operations, represents the income earned from the investment of the cash collateral, net of rebates paid to, or fees paid by, borrowers and less the fees paid to the securities lending agent. Loans of securities are terminable at any time and the borrower, after notice, is required to return borrowed securities within the standard time period for settlement of securities transactions. In the event that the borrower defaults on its obligation to return borrowed securities because of insolvency or for any other reason, the Funds could experience delays and costs in gaining access to the collateral. The Funds also could suffer a loss if the value of an investment purchased with cash collateral falls below the market value of loaned securities or if the value of an investment purchased with cash collateral falls below the value of the original cash collateral received.
Income Taxes: It is the Funds’ policy to comply with the requirements of the Internal Revenue Code of 1986, as amended, applicable to
| | | | | | |
| | | BLACKROCK FUNDS | | MARCH 31, 2010 | | 57 |
Notes to Financial Statements (continued)
regulated investment companies and to distribute substantially all of their taxable income to their shareholders. Therefore, no federal income tax provision is required.
The Funds file US federal and various state and local tax returns. No income tax returns are currently under examination. The statute of limitations on Health Sciences Opportunities, International Opportunities, Science & Technology Opportunities and U.S. Opportunities Portfolios’ US federal tax returns remains open for each of the four years ended September 30, 2009. The statute of limitations on Global Opportunities’ US federal tax returns remains open for the period ended September 30, 2006 and for each of the three years ended September 30, 2009. The statutes of limitations on each Fund’s state and local tax returns may remain open for an additional year depending upon the jurisdiction. There are no uncertain tax positions that require recognition of a tax liability.
Recent Accounting Standard: In January 2010, Financial Accounting Standards Board issued amended guidance to improve disclosure about fair value measurements which will require additional disclosures about transfers into and out of Levels 1 and 2 and separate disclosures about purchases, sales, issuances and settlements in the reconciliation for fair value measurements using significant unobservable inputs (Level 3). It also clarifies existing disclosure requirements relating to the levels of disaggregation for fair value measurement and inputs and valuation techniques used to measure fair value. The amended guidance is effective for financial statements for fiscal years after beginning December 15, 2009, and interim periods within those fiscal years, except for disclosures about purchases, sales, issuances and settlements in the rollforward of activity in Level 3 fair value measurements, which are effective for fiscal years beginning after December 15, 2010 and for interim periods within those fiscal years. The impact of this guidance on the Funds’ financial statements and disclosures is currently being assessed.
Other: Expenses directly related to a Fund or its classes are charged to that Fund or its classes. Other operating expenses shared by several funds are pro rated among those funds on the basis of relative net assets or other appropriate methods. Other expenses of a Fund are allocated daily to each class based on its relative net assets.
2. Derivative Financial Instruments:
The Funds may engage in various portfolio investment strategies both to increase the returns of the Funds and to economically hedge, or protect, their exposure to certain risks such as equity risk and foreign currency exchange rate risk. Losses may arise if the value of the contract decreases due to an unfavorable change in the price of the underlying instrument or if the counterparty does not perform under the contract. The Funds may mitigate counterparty risk through master netting agreements included within an International Swap and Derivatives Association, Inc. (“ISDA”) Master Agreement between a Fund and each of its counterparties. The ISDA Master Agreement allows each Fund to offset with its counterparty certain derivative financial instrument’s payables and/or receivables with collateral held with each counterparty.
The amount of collateral moved to/from applicable counterparties is based upon minimum transfer amounts of up to $500,000. To the extent amounts due to the Funds from their counterparties are not fully collateralized contractually or otherwise, the Funds bear the risk of loss from counterparty non-performance. See Note 1 “Segregation and Collateralization” for information with respect to collateral practices. In addition, the Funds manage counterparty risk by entering into agreements only with counterparties that they believe have the financial resources to honor their obligations and by monitoring the financial stability of those counterparties.
The Funds’ maximum risk of loss from counterparty credit risk on over-the-counter (“OTC”) derivatives is generally the aggregate unrealized gain in excess of any collateral pledged by the counterparty to the Funds. For OTC options purchased, the Funds bear the risk of loss in the amount of the premiums paid and change in market value of the options should the counterparty not perform under the contracts. Options written by the Funds do not give rise to counterparty credit risk, as options written obligate the Funds to perform and not the counterparty. Certain ISDA Master Agreements allow counterparties to OTC derivatives to terminate derivative contracts prior to maturity in the event a Fund’s net assets decline by a stated percentage or a Fund fails to meet the terms of its ISDA Master Agreements, which would cause the Funds to accelerate payment of any net liability owed to the counterparty. Counterparty risk related to exchange-traded financial futures contracts and options is minimal because of the protection against defaults provided by the exchange on which they trade.
Foreign Currency Exchange Contracts: Certain Funds may enter into foreign currency exchange contracts as an economic hedge against either specific transactions or portfolio instruments (foreign currency exchange rate risk). A foreign currency exchange contract is an agreement between two parties to buy and sell a currency at a set exchange rate on a future date. Foreign currency exchange contracts, when used by a Fund, help to manage the overall exposure to the currency backing some of the investments held by a Fund. The contract is marked-to-market daily and the change in market value is recorded by a Fund as an unrealized gain or loss. When the contract is closed, a Fund records a realized gain or loss equal to the difference between the value at the time it was opened and the value at the time it was closed. The use of foreign currency exchange contracts involves the risk that counterparties may not meet the terms of the agreement or unfavorable movements in the value of a foreign currency relative to the US dollar.
Options: The Funds may purchase and write call and put options to increase or decrease their exposure to underlying instruments (equity risk) and/or, in the case of options written, to generate gains from options premiums. A call option gives the purchaser of the option the right (but not the obligation) to buy, and obligates the seller to sell (when the option is exercised), the underlying instrument at the exercise price at any time or at a specified time during the option period. A put option gives the holder the right to sell and obligates the writer to buy the underlying instrument at the exercise price at any time or at a specified time during the option period. When a Fund purchases (writes)
| | | | | | |
58 | | BLACKROCK FUNDS | | MARCH 31, 2010 | | |
Notes to Financial Statements (continued)
an option, an amount equal to the premium paid (received) by a Fund is reflected as an asset (liability). The amount of the asset (liability) is subsequently marked-to-market to reflect the current market value of the option purchased (written). When an instrument is purchased or sold through an exercise of an option, the related premium paid (or received) is added to (or deducted from) the basis of the instrument acquired or deducted from (or added to) the proceeds of the instrument sold. When an option expires (or a Fund enters into a closing transaction), a Fund realizes a gain or loss on the option to the extent of the premiums received or paid (or gain or loss to the extent the cost of the closing transaction exceeds the premium received or paid). When a Fund writes a call option, such option is “covered,” meaning that a Fund holds the underlying instrument subject to being called by the option counterparty, or cash in an amount sufficient to cover the obligation. When a Fund writes a put option, such option is covered by cash in an amount sufficient to cover the obligation.
In purchasing and writing options, a Fund bears the risk of an unfavorable change in the value of the underlying instrument or the risk that the Fund may not be able to enter into a closing transaction due to an illiquid market. Exercise of an option written could result in a Fund purchasing or selling a security at a price different from the current market value. The Fund may execute transactions in both listed and OTC options.
Derivative Instruments Categorized by Risk Exposure:
| | | | | | | | | | | | | | |
Fair Values of Derivative Instruments as of March 31, 2010 |
Asset Derivatives |
| | | Statements of Assets
and Liabilities Location | | Global
Opportunities | | Health Sciences
Opportunities | | International
Opportunities | | Science & Technology
Opportunities |
Foreign currency exchange contracts | | Unrealized appreciation on foreign currency exchange contracts | | $ | 391,018 | | $ | 5,039,314 | | $ | 8,940,005 | | $ | 228,075 |
| | | | | | | | | | | | | | | | | |
Liability Derivatives |
| | | Statements of Assets
and Liabilities Location | | Global
Opportunities | | Health Sciences
Opportunities | | International
Opportunities | | Science & Technology
Opportunities | | U.S.
Opportunities |
Foreign currency exchange contracts | | Unrealized depreciation on foreign currency exchange contracts | | $ | 657,105 | | $ | 1,396,397 | | $ | 13,307,293 | | $ | 84,519 | | | — |
Equity contracts | | Options written at value | | | 12,375 | | | — | | | — | | | — | | $ | 75,306 |
| | | | | | | | | | | | | | | | | |
Total | | | | $ | 669,480 | | $ | 1,396,397 | | $ | 13,307,293 | | $ | 84,519 | | $ | 75,306 |
| | | | | | | | | | | | | | | | | |
| | | | | | | | | | | | | | |
The Effect of Derivative Instruments on the Statements of Operations Six Months Ended March 31, 2010 | |
Net Realized Gain (Loss) from | |
| | | Global
Opportunities | | Health Sciences
Opportunities | | | International
Opportunities | | Science &Technology
Opportunities | |
Foreign currency exchange contracts: | | | | | | | | | | | | | | |
Foreign currency transactions | | $ | 409,524 | | $ | (2,947,973 | ) | | $ | 8,404,134 | | $ | (151,664 | ) |
Equity contracts: | | | | | | | | | | | | | | |
Options | | | 2,977 | | | 1,513,127 | | | | — | | | — | |
| | | | | | | | | | | | | | |
Total | | $ | 412,501 | | $ | (1,434,846 | ) | | $ | 8,404,134 | | $ | (151,664 | ) |
| | | | | | | | | | | | | | |
| | | | | | | | | | | | | | | | | |
Net Change in Unrealized Appreciation/Depreciation on |
| | | Global
Opportunities | | | Health Sciences
Opportunities | | International
Opportunities | | | Science &
Technology
Opportunities | | U.S.
Opportunities |
Foreign currency exchange contracts: | | | | | | | | | | | | | | | | | |
Foreign currency transactions | | $ | (544,804 | ) | | $ | 5,246,746 | | $ | (9,313,313 | ) | | $ | 320,939 | | | — |
Equity contracts: | | | | | | | | | | | | | | | | | |
Options | | | 3,645 | | | | — | | | — | | | | — | | $ | 182,581 |
| | | | | | | | | | | | | | | | | |
Total | | $ | (541,159 | ) | | $ | 5,246,746 | | $ | (9,313,313 | ) | | $ | 320,939 | | $ | 182,581 |
| | | | | | | | | | | | | | | | | |
| | | | | | |
| | | BLACKROCK FUNDS | | MARCH 31, 2010 | | 59 |
Notes to Financial Statements (continued)
For the six months ended March 31, 2010, the average quarterly balance of outstanding derivative financial instruments was as follows:
| | | | | | | | | | | | | | | |
| | | Global
Opportunities | | Health Sciences
Opportunities | | International
Opportunities | | Science & Technology
Opportunities | | U.S.
Opportunities |
Foreign currency exchange contracts: | | | | | | | | | | | | | | | |
Average number of contracts - US dollars purchased | | | 41 | | | 30 | | | 66 | | | 8 | | | — |
Average number of contracts - US dollars sold | | | 39 | | | 13 | | | 56 | | | 4 | | | — |
Average US dollar amounts purchased | | $ | 17,625,358 | | $ | 175,197,635 | | $ | 543,196,662 | | $ | 7,346,139 | | | — |
Average US dollar amounts sold | | $ | 21,894,468 | | $ | 31,546,275 | | $ | 564,193,473 | | $ | 1,190,023 | | | — |
Options written: | | | | | | | | | | | | | | | |
Average number of contracts | | | 180 | | | 350 | | | — | | | — | | | 1,685 |
Average notional value | | $ | 436,500 | | $ | 2,800,000 | | | — | | | — | | $ | 9,097,500 |
3. Investment Advisory Agreements and Other Transactions with Affiliates:
The PNC Financial Services Group, Inc. (“PNC”), Bank of America Corporation (“BAC”) and Barclays Bank PLC (“Barclays”) are the largest stockholders of BlackRock, Inc. (“BlackRock”). Due to the ownership structure, PNC is an affiliate of the Funds for 1940 Act purposes, but BAC and Barclays are not.
The Trust, on behalf of the Funds, entered into an Investment Advisory Agreement with BlackRock Advisors, LLC (the “Manager”), the Funds’ investment advisor, an indirect, wholly owned subsidiary of BlackRock, to provide investment advisory and administration services. The Manager is responsible for the management of each Fund’s portfolio and provides the necessary personnel, facilities, equipment and certain other services necessary to the operations of each Fund. For such services, each Fund pays the Manager a monthly fee at the following annual rates of each Fund’s average daily net assets:
| | | | | | | | | | | | |
| | | First $1 Billion | | | $1 Billion - $2 Billion | | | $2 Billion - $3 Billion | | | Greater Than $3 Billion | |
Global Opportunities and Science & Technology Opportunities | | 0.900 | % | | 0.850 | % | | 0.800 | % | | 0.750 | % |
Health Sciences Opportunities | | 0.750 | | | 0.700 | | | 0.675 | | | 0.650 | |
International Opportunities | | 1.000 | | | 0.950 | | | 0.900 | | | 0.850 | |
U.S. Opportunities | | 1.100 | | | 1.050 | | | 1.025 | | | 1.000 | |
The Manager has agreed to contractually and/or voluntarily waive and/or reimburse fees or expenses, excluding interest expense, dividend expense, acquired fund fees and expenses and certain other fund expenses, in order to limit expenses. The expense limitations as a percentage of net assets were as follows:
| | | | | | | | | | | | | | | | | | |
| | | Global
Opportunities | | | Health Sciences
Opportunities | | | International
Opportunities | | | Science & Technology
Opportunities | | | U.S.
Opportunities | |
| | | Contractual1 | | | Contractual1 | | | Contractual1 | | | Contractual1 | | | Voluntary2 | | | Contractual1 | |
Institutional | | 1.39 | % | | 1.25 | % | | 1.49 | % | | 1.39 | % | | — | | | 1.03 | % |
Service | | 1.70 | %3 | | 1.55 | % | | 1.80 | % | | 1.78 | % | | — | | | 1.65 | % |
Investor A | | 1.70 | % | | 1.55 | % | | 1.98 | % | | 1.80 | % | | — | | | 1.65 | % |
Investor B | | 2.47 | % | | 2.25 | % | | 2.75 | % | | 2.73 | % | | — | | | 2.32 | % |
Investor C | | 2.47 | % | | 2.25 | % | | 2.75 | % | | 2.73 | % | | — | | | 2.32 | % |
Class R | | 3.70 | %3 | | 1.81 | %3 | | 2.18 | %3 | | 2.57 | % | | 2.13 | % | | 2.39 | %3 |
| 1 | The Manager has agreed not to reduce or discontinue this contractual waiver or reimbursement until February 1, 2011 unless approved by the Board, including a majority of the non-interested Trustees. |
| 2 | The voluntary waiver or reimbursement may be reduced or discontinued at any time. |
| 3 | There were no shares outstanding as of March 31, 2010. |
These amounts are included in fees waived by advisor, fees waived by administrator — class specific and transfer agent fees reimbursed, respectively, in the Statements of Operations. For the six months ended March 31, 2010, the amounts included in fees waived by advisor were as follows:
| | | |
U.S. Opportunities | | $ | 1,599,733 |
| | | | | | |
60 | | BLACKROCK FUNDS | | MARCH 31, 2010 | | |
Notes to Financial Statements (continued)
The Manager has voluntarily agreed to waive its advisory fee by the amount of investment advisory fees each Fund pays to the Manager indirectly through its investment in affiliated money market funds, however the Manager does not waive its advisory fees by the amount of investment advisory fees through its investment in other affiliated investment companies. These amounts are included in fees waived by advisor in the Statements of Operations. For the six months ended March 31, 2010, the amounts waived were as follows:
| | | |
Global Opportunities | | $ | 1,211 |
Health Sciences Opportunities | | $ | 13,822 |
International Opportunities | | $ | 22,959 |
Science & Technology Opportunities | | $ | 1,926 |
U.S. Opportunities | | $ | 39,221 |
The Manager has entered into separate sub-advisory agreements with BlackRock Financial Management, Inc. (“BFM”), an affiliate of the Manager, to serve as sub-advisor for a portion of the assets of Global Opportunities and BlackRock International, Ltd. (“BIL”), an affiliate of the Manager, to serve as sub-advisor for International Opportunities. The Manager pays BFM and BIL, for services they provide, a monthly fee that is a percentage of the investment advisory fees paid by the applicable Fund to the Manager.
If during a Fund’s fiscal year the operating expenses of a share class that at any time during the prior two fiscal years received a waiver or reimbursement from the Manager, are less than the expense limit for that share class, the Manager is entitled to be reimbursed by such share class up to the amount of fees waived or expenses reimbursed during those prior two fiscal years under the agreement provided that: (1) the Fund of which the share class is a part has more than $50 million in assets and (2) the Manager or an affiliate continues to serve as the Fund’s investment advisor or administrator. In the event the expense limit for a share class is changed subsequent to a fiscal year in which the Manager becomes entitled to reimbursement for fees waived or reimbursed, the amount available to reimburse the Manager shall be calculated by reference to the expense limit for that share class in effect at the time the Manager became entitled to receive such reimbursement, rather than the subsequently changed expense limit for that share class.
For the six months ended March 31, 2010, the Manager recouped the following waivers previously recorded by the Funds:
| | | | | | | | | | | | | | | | | | | | | |
Recoupment of Past Waived Fees | | Share Classes | | |
| | | Institutional | | Service | | Investor A | | Investor B | | Investor C | | Class R | | Total |
Global Opportunities | | $ | 380 | | | — | | $ | 10,859 | | $ | 24 | | $ | 308 | | | — | | $ | 11,571 |
International Opportunities | | $ | 92,020 | | $ | 29,226 | | | — | | $ | 642 | | $ | 532 | | | — | | $ | 122,420 |
Science & Technology Opportunities | | | — | | $ | 246 | | | — | | $ | 95 | | | — | | $ | 85 | | $ | 426 |
U.S. Opportunities | | | — | | $ | 13,818 | | $ | 2,120 | | | — | | $ | 18,835 | | | — | | $ | 34,773 |
On March 31, 2010, the amounts subject to possible future recoupment under the expense limitation agreement are as follows:
| | | | | | | | | |
| | | Expiring September 30, |
| | | 2010 | | 2011 | | 2012 |
Global Opportunities | | $ | 9,222 | | $ | 91,732 | | $ | 122 |
Science & Technology Opportunities | | $ | 128,122 | | $ | 549,128 | | $ | 48,679 |
U.S. Opportunities | | $ | 2,328,879 | | $ | 3,523,206 | | $ | 2,288,294 |
The Trust, on behalf of the Funds, has entered into a Distribution Agreement and Distribution Plan with BlackRock Investments, LLC (“BRIL”), an affiliate of BlackRock. Pursuant to the Distribution Plan and in accordance with Rule 12b-1 under the 1940 Act, the Funds pay BRIL ongoing service and distribution fees. The fees are accrued daily and paid monthly at annual rates based upon the average daily net assets of the shares of each Fund as follows:
| | | | | | |
| | | Service
Fee | | | Distribution
Fee | |
Service | | 0.25 | % | | — | |
Investor A | | 0.25 | % | | — | |
Investor B | | 0.25 | % | | 0.75 | % |
Investor C | | 0.25 | % | | 0.75 | % |
Class R | | 0.25 | % | | 0.25 | % |
Pursuant to sub-agreements with BRIL, broker-dealers and BRIL provide shareholder servicing and distribution services to each Fund. The ongoing service and/or distribution fee compensates BRIL and each broker-dealer for providing shareholder servicing and/or distribution related services to Service, Investor A, Investor B, Investor C and Class R shareholders.
For the six months ended March 31, 2010, affiliates earned underwriting discounts, direct commissions and dealer concessions on sales of each Fund’s Investor A Shares as follows:
| | | |
Global Opportunities | | $ | 6,426 |
Health Sciences Opportunities | | $ | 67,753 |
International Opportunities | | $ | 96,986 |
Science & Technology Opportunities | | $ | 10,690 |
U.S. Opportunities | | $ | 59,867 |
For the six months ended March 31, 2010, affiliates received the following contingent deferred sales charges relating to transactions in Investor A, Investor B and Investor C Shares:
| | | | | | | | | |
| | | Investor A | | Investor B | | Investor C |
Global Opportunities | | | — | | $ | 6,180 | | $ | 1,598 |
Health Sciences Opportunities | | $ | 2,190 | | $ | 76,468 | | $ | 12,694 |
International Opportunities | | $ | 6,410 | | $ | 32,249 | | $ | 15,065 |
Science & Technology Opportunities | | | — | | $ | 2,460 | | $ | 4,997 |
U.S. Opportunities | | $ | 7,472 | | $ | 22,037 | | $ | 29,049 |
PFPC Trust Company, an indirect wholly-owned subsidiary of PNC, serves as custodian for each Fund. For these services, the custodian receives a fee computed daily and payable monthly, based on a percentage of the average daily gross assets of each Fund. The fee is paid at the following
| | | | | | |
| | | BLACKROCK FUNDS | | MARCH 31, 2010 | | 61 |
Notes to Financial Statements (continued)
annual rates: 0.005% of the first $400 million, 0.004% of the next $1.6 billion and 0.003% of average daily gross assets in excess of $2 billion; plus per transaction charges and other miscellaneous fees incurred on behalf of each Fund.
The Funds have an arrangement with the custodian whereby fees may be reduced by credits earned on uninvested cash balances, which if applicable are shown as fees paid indirectly in the Statements of Operations. The custodian imposes fees on overdrawn cash balances, which can be offset by accumulated credits earned or may result in additional custody charges.
PNC Global Investment Servicing (U.S.) Inc. (“PNCGIS”), an indirect, wholly owned subsidiary of PNC and an affiliate of the Manager, serves as transfer and dividend disbursing agent. Transfer agency fees borne by the Funds are comprised of those fees charged for all shareholder communications including mailing of shareholder reports, dividend and distribution notices, and proxy materials for shareholders meetings, as well as per account and per transaction fees related to servicing and maintenance of shareholder accounts, including the issuing, redeeming and transferring of shares, check writing, anti-money laundering services, and customer identification services.
Pursuant to written agreements, certain affiliates provide the Funds with sub-accounting, recordkeeping, sub-transfer agency and other administrative services with respect to sub-accounts they service. For these services, these affiliates receive an annual fee per shareholder account which will vary depending on share class. For the six months ended March 31, 2010, the Funds paid the following in return for these services which is included in transfer agent-class specific in the Statements of Operations:
| | | |
Health Sciences Opportunities | | $ | 122 |
International Opportunities | | $ | 72,265 |
Science & Technology Opportunities | | $ | 772 |
U.S. Opportunities | | $ | 102,807 |
The Manager maintains a call center, which is responsible for providing certain shareholder services to the Funds, such as responding to shareholder inquiries and processing transactions based upon instructions from shareholders with respect to the subscription and redemption of Fund shares. For the six months ended March 31, 2010, each Fund reimbursed the Manager the following amounts for costs incurred in running the call center, which are included in transfer agent – class specific in the Statements of Operations.
| | | | | | | | | | | | | | | | | | |
| | | Share Classes | | |
Call Center | | Institutional | | Service | | Investor A | | Investor B | | Investor C | | Total |
Global Opportunities | | $ | 56 | | | — | | $ | 2,150 | | $ | 378 | | $ | 645 | | $ | 3,229 |
Health Sciences Opportunities | | $ | 2,220 | | $ | 373 | | $ | 23,502 | | $ | 4,397 | | $ | 8,869 | | $ | 39,361 |
International Opportunities | | $ | 5,365 | | $ | 1,507 | | $ | 25,165 | | $ | 2,142 | | $ | 7,072 | | $ | 41,251 |
Science & Technology Opportunities | | $ | 1,793 | | $ | 32 | | $ | 4,239 | | | — | | $ | 1,498 | | $ | 7,562 |
U.S. Opportunities | | $ | 8,780 | | $ | 2,588 | | $ | 44,226 | | $ | 235 | | $ | 9,195 | | $ | 65,024 |
PNCGIS and the Manager act as co-administrators for the Funds. For these services, the co-administrators receive a combined administration fee computed daily and payable monthly, based on a percentage of the average daily net assets of each Fund. The combined administration fee is paid at the following annual rates: 0.075% of the first $500 million, 0.065% of the next $500 million and 0.055% of average daily net assets in excess of $1 billion. In addition, each of the share classes is charged an administration fee based on the following percentages of average daily net assets of each respective class: 0.025% of the first $500 million, 0.015% of the next $500 million and 0.005% of average daily net assets in excess of $1 billion. In addition, PNCGIS and the Manager may have, at their discretion, voluntarily waived all or any portion of their administration fees for a Fund or a share class which are included in administration fees waived and administration fees waived–class specific in the Statements of Operations.
The Funds have received an exemptive order from the SEC permitting, among other things, to pay an affiliated securities lending agent a fee based on a share of the income derived from the securities lending activities and has retained BlackRock Investment Management, LLC (“BIM”) as the securities lending agent. BIM may, on behalf of the Funds, invest cash collateral received by a Fund for such loans, among other things, in a private investment company managed by the Manager or in registered money market funds advised by the Manager or its affiliates. The market value of securities on loan and the value of the related collateral are shown on the Statements of Assets and Liabilities as securities loaned and collateral at value – securities loaned, respectively. The cash collateral invested by BIM is disclosed in the Schedules of Investments. The share of income earned by the Funds on such investments is shown as securities lending–affiliated in the Statements of Operations. For the six months ended March 31, 2010, BIM received $69,106 in securities lending agent fees related to securities lending activities for the Funds.
| | | | | | |
62 | | BLACKROCK FUNDS | | MARCH 31, 2010 | | |
Notes to Financial Statements (continued)
For the six months ended March 31, 2010, the following tables show the various types of class specific expenses borne directly by each class of each Fund and any associated waivers or reimbursements of those expenses.
| | | | | | | | | | | | | | | | | | | | | |
| | | Share Classes | | |
Administration Fees | | Institutional | | Service | | Investor A | | Investor B | | Investor C | | Class R | | Total |
Global Opportunities | | $ | 2,288 | | | — | | $ | 6,276 | | $ | 531 | | $ | 2,305 | | | — | | $ | 11,400 |
Health Sciences Opportunities | | $ | 24,620 | | $ | 1,215 | | $ | 65,695 | | $ | 7,195 | | $ | 33,970 | | | — | | $ | 132,695 |
International Opportunities | | $ | 80,504 | | $ | 10,476 | | $ | 76,935 | | $ | 3,966 | | $ | 25,881 | | | — | | $ | 197,762 |
Science & Technology | | | | | | | | | | | | | | | | | | | | | |
Opportunities | | $ | 3,734 | | $ | 42 | | $ | 11,837 | | $ | 767 | | $ | 3,090 | | $ | 257 | | $ | 19,727 |
U.S. Opportunities | | $ | 100,668 | | $ | 25,839 | | $ | 96,653 | | $ | 2,688 | | $ | 33,462 | | | — | | $ | 259,310 |
| | | | | | | | | | | | | | | | | | | | | |
| | | Share Classes | | |
Administration Fees Waived | | Institutional | | Service | | Investor A | | Investor B | | Investor C | | Class R | | Total |
Global Opportunities | | $ | 120 | | | — | | | — | | | — | | $ | 2 | | | — | | $ | 122 |
Science & Technology | | | | | | | | | | | | | | | | | | | | | |
Opportunities | | $ | 3,733 | | | — | | $ | 7,543 | | $ | 333 | | $ | 1,672 | | $ | 23 | | $ | 13,304 |
U.S. Opportunities | | $ | 100,669 | | $ | 131 | | | — | | $ | 1,956 | | $ | 67 | | | — | | $ | 102,823 |
| | | | | | | | | | | | | | | | | | |
| | | Share Classes | | |
Service and Distribution Fees | | Service | | Investor A | | Investor B | | Investor C | | Class R | | Total |
Global Opportunities | | | — | | $ | 62,622 | | $ | 21,135 | | $ | 91,920 | | | — | | $ | 175,677 |
Health Sciences Opportunities | | $ | 12,147 | | $ | 683,227 | | $ | 286,656 | | $ | 1,358,028 | | | — | | $ | 2,340,058 |
International Opportunities | | $ | 104,344 | | $ | 864,380 | | $ | 157,763 | | $ | 1,032,924 | | | — | | $ | 2,159,411 |
Science & Technology Opportunities | | $ | 419 | | $ | 118,250 | | $ | 30,672 | | $ | 123,572 | | $ | 4,865 | | $ | 277,778 |
U.S. Opportunities | | $ | 258,389 | | $ | 1,204,315 | | $ | 107,388 | | $ | 1,338,407 | | | — | | $ | 2,908,499 |
| | | | | | | | | | | | | | | | | | | | | |
| | | Share Classes | | |
Transfer Agent Fees | | Institutional | | Service | | Investor A | | Investor B | | Investor C | | Class R | | Total |
Global Opportunities | | $ | 10,897 | | | — | | $ | 29,623 | | $ | 3,466 | | $ | 14,515 | | | — | | $ | 58,501 |
Health Sciences Opportunities | | $ | 100,410 | | $ | 7,839 | | $ | 447,973 | | $ | 67,833 | | $ | 207,992 | | | — | | $ | 832,047 |
International Opportunities | | $ | 556,612 | | $ | 108,030 | | $ | 563,240 | | $ | 40,830 | | $ | 198,286 | | | — | | $ | 1,466,998 |
Science & Technology | | | | | | | | | | | | | | | | | | | | | |
Opportunities | | $ | 63,244 | | $ | 298 | | $ | 200,069 | | $ | 17,185 | | $ | 73,113 | | $ | 4,630 | | $ | 358,539 |
U.S. Opportunities | | $ | 585,047 | | $ | 161,124 | | $ | 865,726 | | $ | 30,348 | | $ | 248,690 | | | — | | $ | 1,890,935 |
| | | | | | | | | | | | | | | | | |
| | | Share Classes | | |
Transfer Agent Fees Waived | | Institutional | | Service | | Investor A | | Investor B | | Investor C | | Total |
Science & Technology Opportunities | | $ | 1,794 | | | — | | $ | 2,406 | | — | | $ | 632 | | $ | 4,832 |
U.S. Opportunities | | $ | 8,780 | | $ | 7 | | | — | | — | | | — | | $ | 8,787 |
| | | | | | | | | | | | | | | | | | |
| | | Share Classes | | |
Transfer Agent Fees Reimbursed | | Institutional | | Service | | Investor A | | Investor B | | Investor C | | Total |
Science & Technology Opportunities | | $ | 23,104 | | | — | | $ | 6,317 | | $ | 222 | | $ | 925 | | $ | 30,568 |
U.S. Opportunities | | $ | 576,063 | | $ | 545 | | | — | | $ | 342 | | | — | | $ | 576,950 |
The Funds may also receive earnings credits related to cash balances with PNCGIS which are shown on the Statements of Operations as fees paid indirectly.
Certain officers and/or trustees of the Trust are officers and/or directors of BlackRock or its affiliates. The Funds reimburse the Manager for compensation paid to the Trust’s Chief Compliance Officer.
4. Investments:
Purchases and sales of investments, excluding short-term securities, for the six months ended March 31, 2010 were as follows:
| | | | | | | |
| | | Purchases | | Sales | |
Global Opportunities | | $ | 73,755,966 | | $ | 60,839,642 | |
Health Sciences Opportunities | | $ | 965,824,144 | | $ | 838,706,605 | |
International Opportunities | | $ | 1,234,110,410 | | $ | 1,017,260,489 | 1 |
Science & Technology Opportunities | | $ | 65,089,352 | | $ | 47,634,652 | |
U.S. Opportunities | | $ | 2,312,820,809 | | $ | 1,801,861,091 | |
| 1 | Including $58,039,030 of sales representing redemptions-in-kind. |
| | | | | | |
| | | BLACKROCK FUNDS | | MARCH 31, 2010 | | 63 |
Notes to Financial Statements (continued)
Transactions in options written for the six months ended March 31, 2010, were as follows:
| | | | | | | | | | | | | | |
| | | Global Opportunities | |
| | | Calls | | | Puts | |
| | | Contracts | | | Premiums
Received | | | Contracts | | | Premiums
Received | |
Options outstanding at beginning of period | | — | | | | — | | | — | | | | — | |
Options written | | 145 | | | $ | 6,847 | | | 270 | | | $ | 12,150 | |
Options expired | | (55 | ) | | | (2,977 | ) | | — | | | | — | |
| | | | | | | | | | | | | | |
Options outstanding at end of period | | 90 | | | $ | 3,870 | | | 270 | | | $ | 12,150 | |
| |
| | | Health Sciences Opportunities | |
| | | Calls | | | Puts | |
| | | Contracts | | | Premiums
Received | | | Contracts | | | Premiums
Received | |
Options outstanding at beginning of period | | — | | | | — | | | — | | | | — | |
Options written | | 12,491 | | | $ | 1,274,661 | | | 11,950 | | | $ | 1,262,729 | |
Options expired | | (8,289 | ) | | | (628,302 | ) | | (8,630 | ) | | | (959,981 | ) |
Options closed | | (2,268 | ) | | | (300,174 | ) | | (3,120 | ) | | | (288,948 | ) |
Options exercised | | (1,934 | ) | | | (346,185 | ) | | (200 | ) | | | (13,800 | ) |
| | | | | | | | | | | | | | |
Options outstanding at end of period | | — | | | | — | | | — | | | | — | |
| | | | | |
| | | U.S. Opportunities |
| | | Puts |
| | | Contracts | | Premiums
Received |
Options outstanding at beginning of period | | — | | | — |
Options written | | 3,370 | | $ | 257,887 |
Options expired | | — | | | — |
Options closed | | — | | | — |
| | | | | |
Options outstanding at end of period | | 3,370 | | $ | 257,887 |
Science & Technology Opportunities and U.S. Opportunities received proceeds from settlement of litigation where it was able to recover a portion of investment losses previously realized by such Funds. This amount is shown as litigation proceeds in the Statements of Operations.
5. Borrowings:
The Funds, along with certain other funds managed by the Manager and its affiliates, are a party to a $500 million credit agreement with a group of lenders, which was renewed until November 2010. The Funds may borrow under the credit agreement to fund shareholder redemptions. Prior to its renewal, the credit agreement had the following terms: 0.02% upfront fee on the aggregate commitment amount which was allocated to the Funds based on its net assets as of October 31, 2008; a commitment fee of 0.08% per annum based on the Funds’ pro rata share of the unused portion of the credit agreement, which is included in miscellaneous in the Statements of Operations, and interest at a rate equal to the higher of the (a) federal funds effective rate and (b) reserve adjusted one-month LIBOR, plus, in each case, the higher of (i) 1.50% and (ii) 50% of the CDX Index (as defined in the credit agreement) on amounts borrowed. Effective November 2009, the credit agreement was renewed with the following terms: 0.02% upfront fee on the aggregate commitment amount which was allocated to the Funds based on its net assets as of October 31, 2009, a commitment fee of 0.10% per annum based on the Funds’ pro rata share of the unused portion of the credit agreement and interest at a rate equal to the higher of (a) the one-month LIBOR plus 1.25% per annum and (b) the Fed Funds rate plus 1.25% per annum on amounts borrowed. The Funds did not borrow under the credit agreement during the six months ended March 31, 2010.
6. Capital Loss Carryforward:
As of September 30, 2009, the Funds had capital loss carryforwards available to offset future realized capital gains through the indicated expiration dates:
| | | | | | | | | | | | | | | |
Expiring September 30, | | Global
Opportunities | | Health
Sciences
Opportunities | | International
Opportunities | | Science &
Technology
Opportunities | | U.S.
Opportunities |
2010 | | | — | | | — | | | — | | $ | 7,544,799 | | $ | 36,277,437 |
2011 | | | — | | | — | | | — | | | — | | | 16,513,511 |
2015 | | | — | | | — | | | — | | | 54,937,681 | | | — |
2017 | | $ | 15,145,783 | | $ | 9,891,979 | | $ | 140,138,718 | | | 4,448,928 | | | 130,652,020 |
| | | | | | | | | | | | | | | |
Total | | $ | 15,145,783 | | $ | 9,891,979 | | $ | 140,138,718 | | $ | 66,931,408 | | $ | 183,442,968 |
| | | | | | | | | | | | | | | |
7. Concentration, Market and Credit Risk:
In the normal course of business, the Funds invest in securities and enter into transactions where risks exist due to fluctuations in the market (market risk) or failure of the issuer of a security to meet all its obligations (credit risk). The value of securities held by the Funds may decline in response to certain events, including those directly involving the issuers whose securities are owned by the Funds; conditions affecting the general economy; overall market changes; local, regional or global political, social or economic instability; and currency and interest rate and price fluctuations. Similar to credit risk, the Funds may be exposed to counterparty risk, or the risk that an entity with which the Funds have unsettled or open transactions may default. The Funds manage counterparty risk by entering into transactions only with counterparties that they believe have the financial resources to honor their obligations and by monitoring the financial stability of those counterparties. Financial assets, which potentially expose the Funds to credit and counterparty risks, consist principally of investments and cash due from counterparties. The extent of the Funds’ exposure to credit and counterparty risks with respect to these financial assets is generally approximated by their value recorded in the Funds’ Statements of Assets and Liabilities, less any collateral held by the Funds.
Health Sciences Opportunities invests a significant portion of its assets in securities in the health care sector. Changes in economic conditions affecting the health care sector would have a greater impact on Health Sciences Opportunities and could affect the value, income and/or liquidity of positions in such securities.
| | | | | | |
64 | | BLACKROCK FUNDS | | MARCH 31, 2010 | | |
Notes to Financial Statements (continued)
Science & Technology Opportunities invests a significant portion of its assets in securities in the information technology sector. Changes in economic conditions affecting the information technology sector would have a greater impact on Science & Technology Opportunities and could affect the value, income and/or liquidity of positions in such securities.
Global Opportunities invests from time to time a substantial amount of its assets in issuers located in a single country or a limited number of countries. When the Fund concentrates its investments in this manner, it assumes the risk that economic, political and social conditions in those countries may have a significant impact on its investment performance.
As of March 31, 2010, the Fund listed below had the following industry classifications:
| | | |
Industry | | Global
Opportunities | |
Oil, Gas & Consumable Fuels | | 10 | % |
Commercial Banks | | 9 | |
Pharmaceuticals | | 5 | |
Chemical | | — | |
Other* | | 76 | |
| * | All other industries held were each less than 5% of long-term investments. |
8. Capital Shares Transactions:
Transactions in capital shares for each class were as follows:
| | | | | | | | | | | | | | |
| | | Six Months
Ended
March 31, 2010 | | | Year Ended
September 30, 2009 | |
Global Opportunities | | Shares | | | Amount | | | Shares | | | Amount | |
| | | | |
Institutional | | | | | | | | | | | | | | |
Shares sold | | 425,580 | | | $ | 4,361,196 | | | 627,843 | | | $ | 5,231,526 | |
Shares issued in reinvestment of dividends and distributions | | 22,035 | | | | 228,067 | | | 1,598 | | | | 12,017 | |
| | | | | | | | | | | | | | |
Total issued | | 447,615 | | | | 4,589,263 | | | 629,441 | | | | 5,243,543 | |
Shares redeemed | | (229,685 | ) | | | (2,371,915 | ) | | (2,631,230 | ) | | | (19,186,438 | ) |
| | | | | | | | | | | | | | |
Net increase (decrease) | | 217,930 | | | $ | 2,217,348 | | | (2,001,789 | ) | | $ | (13,942,895 | ) |
| | | | | | | | | | | | | | |
| | | | |
Investor A | | | | | | | | | | | | | | |
Shares sold and automatic conversion of shares | | 1,259,982 | | | $ | 12,942,431 | | | 2,609,963 | | | $ | 21,237,953 | |
Shares issued in reinvestment of dividends and distributions | | 37,120 | | | | 382,705 | | | — | | | | — | |
| | | | | | | | | | | | | | |
Total issued | | 1,297,102 | | | | 13,325,136 | | | 2,609,963 | | | | 21,237,953 | |
Shares redeemed | | (820,584 | ) | | | (8,488,283 | ) | | (1,915,013 | ) | | | (14,809,927 | ) |
| | | | | | | | | | | | | | |
Net increase | | 476,518 | | | $ | 4,836,853 | | | 694,950 | | | $ | 6,428,026 | |
| | | | | | | | | | | | | | |
| | | | |
Investor B | | | | | | | | | | | | | | |
Shares sold | | 9,403 | | | $ | 97,232 | | | 37,710 | | | $ | 296,560 | |
Shares issued in reinvestment of dividends and distributions | | 1,020 | | | | 10,452 | | | — | | | | — | |
| | | | | | | | | | | | | | |
Total issued | | 10,423 | | | | 107,684 | | | 37,710 | | | | 296,560 | |
Shares redeemed and automatic conversion of shares | | (44,741 | ) | | | (455,796 | ) | | (175,892 | ) | | | (1,338,362 | ) |
| | | | | | | | | | | | | | |
Net decrease | | (34,318 | ) | | $ | (348,112 | ) | | (138,182 | ) | | $ | (1,041,802 | ) |
| | | | | | | | | | | | | | |
| | | | |
Investor C | | | | | | | | | | | | | | |
Shares sold | | 477,633 | | | $ | 4,851,558 | | | 685,206 | | | $ | 5,556,850 | |
Shares issued in reinvestment of dividends and distributions | | 7,907 | | | | 80,730 | | | — | | | | — | |
| | | | | | | | | | | | | | |
Total issued | | 485,540 | | | | 4,932,288 | | | 685,206 | | | | 5,556,850 | |
Shares redeemed | | (165,450 | ) | | | (1,673,731 | ) | | (876,684 | ) | | | (6,707,651 | ) |
| | | | | | | | | | | | | | |
Net increase (decrease) | | 320,090 | | | $ | 3,258,557 | | | (191,478 | ) | | $ | (1,150,801 | ) |
| | | | | | | | | | | | | | |
| | | | | | |
| | | BLACKROCK FUNDS | | MARCH 31, 2010 | | 65 |
Notes to Financial Statements (continued)
| | | | | | | | | | | | | | |
| | | Six Months
Ended
March 31, 2010 | | | Year Ended
September 30, 2009 | |
Health Sciences Opportunities | | Shares | | | Amount | | | Shares | | | Amount | |
| | | | |
Institutional | | | | | | | | | | | | | | |
Shares sold | | 2,435,036 | | | $ | 69,323,566 | | | 3,282,447 | | | $ | 76,446,905 | |
Shares issued in reinvestment of dividends and distributions | | — | | | | — | | | 654,857 | | | | 13,743,792 | |
| | | | | | | | | | | | | | |
Total issued | | 2,435,036 | | | | 69,323,566 | | | 3,937,304 | | | | 90,190,697 | |
Shares redeemed | | (1,129,938 | ) | | | (31,998,063 | ) | | (3,872,581 | ) | | | (88,583,362 | ) |
| | | | | | | | | | | | | | |
Net increase | | 1,305,098 | | | $ | 37,325,503 | | | 64,723 | | | $ | 1,607,335 | |
| | | | | | | | | | | | | | |
| | | | |
Service | | | | | | | | | | | | | | |
Shares sold | | 147,378 | | | $ | 4,138,804 | | | 201,025 | | | $ | 4,568,218 | |
Shares issued in reinvestment of dividends and distributions | | — | | | | — | | | 22,209 | | | | 457,497 | |
| | | | | | | | | | | | | | |
Total issued | | 147,378 | | | | 4,138,804 | | | 223,234 | | | | 5,025,715 | |
Shares redeemed | | (36,366 | ) | | | (1,004,144 | ) | | (112,484 | ) | | | (2,592,486 | ) |
| | | | | | | | | | | | | | |
Net increase | | 111,012 | | | $ | 3,134,660 | | | 110,750 | | | $ | 2,433,229 | |
| | | | | | | | | | | | | | |
| | | | |
Investor A | | | | | | | | | | | | | | |
Shares sold and automatic conversion of shares | | 6,836,372 | | | $ | 191,247,328 | | | 6,386,361 | | | $ | 143,478,445 | |
Shares issued in reinvestment of dividends and distributions | | — | | | | — | | | 1,779,579 | | | | 36,587,917 | |
| | | | | | | | | | | | | | |
Total issued | | 6,836,372 | | | | 191,247,328 | | | 8,165,940 | | | | 180,066,362 | |
Shares redeemed | | (2,737,372 | ) | | | (75,226,981 | ) | | (9,626,201 | ) | | | (215,452,894 | ) |
| | | | | | | | | | | | | | |
Net increase (decrease) | | 4,099,000 | | | $ | 116,020,347 | | | (1,460,261 | ) | | $ | (35,386,532 | ) |
| | | | | | | | | | | | | | |
| | | | |
Investor B | | | | | | | | | | | | | | |
Shares sold | | 22,035 | | | $ | 579,885 | | | 191,893 | | | $ | 3,972,396 | |
Shares issued in reinvestment of dividends and distributions | | — | | | | — | | | 288,268 | | | | 5,632,774 | |
| | | | | | | | | | | | | | |
Total issued | | 22,035 | | | | 579,885 | | | 480,161 | | | | 9,605,170 | |
Shares redeemed and automatic conversion of shares | | (326,089 | ) | | | (8,462,029 | ) | | (1,098,016 | ) | | | (23,289,909 | ) |
| | | | | | | | | | | | | | |
Net decrease | | (304,054 | ) | | $ | (7,882,144 | ) | | (617,855 | ) | | $ | (13,684,739 | ) |
| | | | | | | | | | | | | | |
| | | | |
Investor C | | | | | | | | | | | | | | |
Shares sold | | 1,668,506 | | | $ | 44,026,987 | | | 1,626,343 | | | $ | 34,422,322 | |
Shares issued in reinvestment of dividends and distributions | | — | | | | — | | | 1,084,302 | | | | 21,143,010 | |
| | | | | | | | | | | | | | |
Total issued | | 1,668,506 | | | | 44,026,987 | | | 2,710,645 | | | | 55,565,332 | |
Shares redeemed | | (1,155,904 | ) | | | (29,796,303 | ) | | (3,595,296 | ) | | | (76,927,263 | ) |
| | | | | | | | | | | | | | |
Net increase (decrease) | | 512,602 | | | $ | 14,230,684 | | | (884,651 | ) | | $ | (21,361,931 | ) |
| | | | | | | | | | | | | | |
| | | | | | |
66 | | BLACKROCK FUNDS | | MARCH 31, 2010 | | |
Notes to Financial Statements (continued)
| | | | | | | | | | | | | | |
| | | Six Months
Ended
March 31, 2010 | | | Year Ended
September 30, 2009 | |
International Opportunities | | Shares | | | Amount | | | Shares | | | Amount | |
| | | | |
Institutional | | | | | | | | | | | | | | |
Shares sold | | 8,909,897 | | | $ | 280,705,658 | | | 13,721,573 | | | $ | 350,351,562 | |
Shares issued in reinvestment of dividends and distributions | | 222,983 | | | | 7,057,465 | | | 44,657 | | | | 1,008,792 | |
| | | | | | | | | | | | | | |
Total issued | | 9,132,880 | | | | 287,763,123 | | | 13,766,230 | | | | 351,360,354 | |
Shares redeemed | | (6,373,161 | ) | | | (197,241,920 | )1 | | (7,596,872 | ) | | | (176,325,353 | ) |
| | | | | | | | | | | | | | |
Net increase | | 2,759,719 | | | $ | 90,521,203 | | | 6,169,358 | | | $ | 175,035,001 | |
| | | | | | | | | | | | | | |
| 1 | Includes 2,245,160 shares redeemed in exchange for cash and securities representing redemptions-in-kind with a value of $68,028,346. |
| | | | | | | | | | | | | | |
Service | | | | | | | | | | | | | | |
Shares sold | | 624,195 | | | $ | 18,947,646 | | | 1,706,214 | | | $ | 40,288,301 | |
Shares issued in reinvestment of dividends and distributions | | 33,306 | | | | 1,018,839 | | | — | | | | — | |
| | | | | | | | | | | | | | |
Total issued | | 657,501 | | | | 19,966,485 | | | 1,706,214 | | | | 40,288,301 | |
Shares redeemed | | (643,339 | ) | | | (19,810,348 | ) | | (1,229,774 | ) | | | (28,653,621 | ) |
| | | | | | | | | | | | | | |
Net increase | | 14,162 | | | $ | 156,137 | | | 476,440 | | | $ | 11,634,680 | |
| | | | | | | | | | | | | | |
| | | | |
Investor A | | | | | | | | | | | | | | |
Shares sold and automatic conversion of shares | | 9,219,270 | | | $ | 279,025,356 | | | 12,076,484 | | | $ | 286,846,202 | |
Shares issued in reinvestment of dividends and distributions | | 270,254 | | | | 8,194,214 | | | 6,522 | | | | 141,330 | |
| | | | | | | | | | | | | | |
Total issued | | 9,489,524 | | | | 287,219,570 | | | 12,083,006 | | | | 286,987,532 | |
Shares redeemed | | (4,146,510 | ) | | | (124,547,422 | ) | | (9,095,184 | ) | | | (208,764,465 | ) |
| | | | | | | | | | | | | | |
Net increase | | 5,343,014 | | | $ | 162,672,148 | | | 2,987,822 | | | $ | 78,223,067 | |
| | | | | | | | | | | | | | |
| | | | |
Investor B | | | | | | | | | | | | | | |
Shares sold | | 29,987 | | | $ | 846,807 | | | 137,264 | | | $ | 2,940,424 | |
Shares issued in reinvestment of dividends and distributions | | 3,502 | | | | 99,198 | | | — | | | | — | |
| | | | | | | | | | | | | | |
Total issued | | 33,489 | | | | 946,005 | | | 137,264 | | | | 2,940,424 | |
Shares redeemed and automatic conversion of shares | | (153,602 | ) | | | (4,329,580 | ) | | (580,947 | ) | | | (12,201,255 | ) |
| | | | | | | | | | | | | | |
Net decrease | | (120,113 | ) | | $ | (3,383,575 | ) | | (443,683 | ) | | $ | (9,260,831 | ) |
| | | | | | | | | | | | | | |
| | | | |
Investor C | | | | | | | | | | | | | | |
Shares sold | | 2,130,787 | | | $ | 59,649,287 | | | 2,002,956 | | | $ | 46,032,123 | |
Shares issued in reinvestment of dividends and distributions | | 45,054 | | | | 1,268,739 | | | — | | | | — | |
| | | | | | | | | | | | | | |
Total issued | | 2,175,841 | | | | 60,918,026 | | | 2,002,956 | | | | 46,032,123 | |
Shares redeemed | | (776,410 | ) | | | (21,619,843 | ) | | (2,657,870 | ) | | | (54,930,426 | ) |
| | | | | | | | | | | | | | |
Net increase (decrease) | | 1,399,431 | | | $ | 39,298,183 | | | (654,914 | ) | | $ | (8,898,303 | ) |
| | | | | | | | | | | | | | |
| | | | | | |
| | | BLACKROCK FUNDS | | MARCH 31, 2010 | | 67 |
Notes to Financial Statements (continued)
| | | | | | | | | | | | | | |
| | | Six Months
Ended
March 31, 2010 | | | Year Ended
September 30, 2009 | |
Science & Technology Opportunities | | Shares | | | Amount | | | Shares | | | Amount | |
| | | | |
Institutional | | | | | | | | | | | | | | |
Shares sold | | 589,950 | | | $ | 4,826,177 | | | 521,018 | | | $ | 3,265,366 | |
Shares redeemed | | (284,656 | ) | | | (2,335,206 | ) | | (3,200,745 | ) | | | (17,249,776 | ) |
| | | | | | | | | | | | | | |
Net increase (decrease) | | 305,294 | | | $ | 2,490,971 | | | (2,679,727 | ) | | $ | (13,984,410 | ) |
| | | | | | | | | | | | | | |
Service | | | | | | | | | | | | | | |
Shares sold | | 36,282 | | | $ | 290,891 | | | 17,786 | | | $ | 125,887 | |
Shares redeemed | | (3,949 | ) | | | (30,794 | ) | | (7,880 | ) | | | (45,584 | ) |
| | | | | | | | | | | | | | |
Net increase | | 32,333 | | | $ | 260,097 | | | 9,906 | | | $ | 80,303 | |
| | | | | | | | | | | | | | |
| | | | |
Investor A | | | | | | | | | | | | | | |
Shares sold and automatic conversion of shares | | 3,149,308 | | | $ | 24,913,465 | | | 2,913,918 | | | $ | 17,555,649 | |
Shares redeemed | | (1,099,029 | ) | | | (8,600,056 | ) | | (2,521,352 | ) | | | (14,409,211 | ) |
| | | | | | | | | | | | | | |
Net increase | | 2,050,279 | | | $ | 16,313,409 | | | 392,566 | | | $ | 3,146,438 | |
| | | | | | | | | | | | | | |
| | | | |
Investor B | | | | | | | | | | | | | | |
Shares sold | | 46,752 | | | $ | 339,374 | | | 203,386 | | | $ | 1,128,893 | |
Shares redeemed and automatic conversion of shares | | (290,549 | ) | | | (2,136,842 | ) | | (1,082,094 | ) | | | (5,711,283 | ) |
| | | | | | | | | | | | | | |
Net decrease | | (243,797 | ) | | $ | (1,797,468 | ) | | (878,708 | ) | | $ | (4,582,390 | ) |
| | | | | | | | | | | | | | |
| | | | |
Investor C | | | | | | | | | | | | | | |
Shares sold | | 690,981 | | | $ | 5,050,794 | | | 732,718 | | | $ | 4,266,648 | |
Shares redeemed | | (430,869 | ) | | | (3,146,696 | ) | | (976,877 | ) | | | (5,207,448 | ) |
| | | | | | | | | | | | | | |
Net increase (decrease) | | 260,112 | | | $ | 1,904,098 | | | (244,159 | ) | | $ | (940,800 | ) |
| | | | | | | | | | | | | | |
| | | | |
Class R | | | | | | | | | | | | | | |
Shares sold | | 78,954 | | | $ | 651,416 | | | 127,077 | | | $ | 784,567 | |
Shares redeemed | | (47,659 | ) | | | (383,946 | ) | | (75,992 | ) | | | (465,306 | ) |
| | | | | | | | | | | | | | |
Net increase | | 31,295 | | | $ | 267,470 | | | 51,085 | | | $ | 319,261 | |
| | | | | | | | | | | | | | |
| | | | | | |
68 | | BLACKROCK FUNDS | | MARCH 31, 2010 | | |
Notes to Financial Statements (continued)
| | | | | | | | | | | | | | |
| | | Six Months
Ended
March 31, 2010 | | | Year Ended
September 30, 2009 | |
U.S. Opportunities | | Shares | | | Amount | | | Shares | | | Amount | |
| | | | |
Institutional | | | | | | | | | | | | | | |
Shares sold | | 12,298,442 | | | $ | 411,593,574 | | | 24,766,679 | | | $ | 644,372,202 | |
Shares issued in reinvestment of dividends | | 42,391 | | | | 1,381,935 | | | 1,748 | | | | 37,968 | |
| | | | | | | | | | | | | | |
Total issued | | 12,340,833 | | | | 412,975,509 | | | 24,768,427 | | | | 644,410,170 | |
Shares redeemed | | (4,331,228 | ) | | | (145,318,347 | ) | | (6,530,352 | ) | | | (168,767,220 | ) |
| | | | | | | | | | | | | | |
Net increase | | 8,009,605 | | | $ | 267,657,162 | | | 18,238,075 | | | $ | 475,642,950 | |
| | | | | | | | | | | | | | |
| | | | |
Service | | | | | | | | | | | | | | |
Shares sold | | 1,208,395 | | | $ | 38,617,729 | | | 4,504,373 | | | $ | 107,437,507 | |
Shares redeemed | | (717,675 | ) | | | (22,961,034 | ) | | (1,905,741 | ) | | | (45,091,897 | ) |
| | | | | | | | | | | | | | |
Net increase | | 490,720 | | | $ | 15,656,695 | | | 2,598,632 | | | $ | 62,345,610 | |
| | | | | | | | | | | | | | |
| | | | |
Investor A | | | | | | | | | | | | | | |
Shares sold and automatic conversion of shares | | 9,186,936 | | | $ | 290,760,098 | | | 21,037,273 | | | $ | 512,086,999 | |
Shares redeemed | | (3,979,558 | ) | | | (125,613,865 | ) | | (9,468,584 | ) | | | (228,671,571 | ) |
| | | | | | | | | | | | | | |
Net increase | | 5,207,378 | | | $ | 165,146,233 | | | 11,568,689 | | | $ | 283,415,428 | |
| | | | | | | | | | | | | | |
| | | | |
Investor B | | | | | | | | | | | | | | |
Shares sold | | 27,109 | | | $ | 793,706 | | | 290,275 | | | $ | 6,365,540 | |
Shares redeemed and automatic conversion of shares | | (94,455 | ) | | | (2,758,211 | ) | | (262,791 | ) | | | (5,701,426 | ) |
| | | | | | | | | | | | | | |
Net increase (decrease) | | (67,346 | ) | | $ | (1,964,505 | ) | | 27,484 | | | $ | 664,114 | |
| | | | | | | | | | | | | | |
| | | | |
Investor C | | | | | | | | | | | | | | |
Shares sold | | 2,293,170 | | | $ | 66,658,396 | | | 5,102,977 | | | $ | 115,703,095 | |
Shares redeemed | | (821,162 | ) | | | (23,890,208 | ) | | (1,809,799 | ) | | | (39,875,611 | ) |
| | | | | | | | | | | | | | |
Net increase | | 1,472,008 | | | $ | 42,768,188 | | | 3,293,178 | | | $ | 75,827,484 | |
| | | | | | | | | | | | | | |
There is a 2% redemption fee on shares redeemed or exchanged within 30 days of purchase. The redemption fees are collected and retained by the Funds for the benefit of its remaining shareholders. The redemption fees are recorded as a credit to paid-in capital.
9. Subsequent Events:
Management has evaluated the impact of all subsequent events on the Funds through the date the financial statements were issued and has determined that there were no subsequent events requiring adjustment or additional disclosure in the financial statements.
| | | | | | |
| | | BLACKROCK FUNDS | | MARCH 31, 2010 | | 69 |
Officers and Trustees
Ronald W. Forbes, Co-Chairman of the Board and Trustee
Rodney D. Johnson, Co-Chairman of the Board and Trustee
David O. Beim, Trustee
Richard S. Davis, Trustee
Henry Gabbay, Trustee
Dr. Matina Horner, Trustee
Herbert I. London, Trustee and Member of the Audit Committee
Cynthia A. Montgomery, Trustee
Joseph P. Platt, Jr., Trustee
Robert C. Robb, Jr., Trustee
Toby Rosenblatt, Trustee
Kenneth L. Urish, Chairman of the Audit Committee and Trustee
Frederick W. Winter, Trustee and Member of the Audit Committee
Anne F. Ackerley, President and Chief Executive Officer
Richard Hoerner, CFA, Vice President
Jeffrey Holland, CFA, Vice President
Brendan Kyne, Vice President
Simon Mendelson, Vice President
Brian Schmidt, Vice President
Christopher Stavrakos, CFA, Vice President
Neal J. Andrews, Chief Financial Officer
Jay M. Fife, Treasurer
Brian P. Kindelan, Chief Compliance Officer
Howard B. Surloff, Secretary
Investment Advisor and Co-Administrator
BlackRock Advisors, LLC
Wilmington, DE 19809
Sub-Advisor—Global Opportunities Portfolio
BlackRock Financial Management, Inc.
New York, NY 10055
Sub-Advisor—International Opportunities Portfolio
BlackRock International, Ltd.
Edinburgh, Scotland EH3 8JB
Accounting Agent, Co-Administrator and Transfer Agent
PNC Global Investment Servicing (U.S.) Inc.
Wilmington, DE 19809
Custodian
PFPC Trust Company
Philadelphia, PA 19153
Distributor
BlackRock Investments, LLC
New York, NY 10022
Legal Counsel
Sidley Austin LLP
New York, NY 10019
Independent Registered Public Accounting Firm
Deloitte & ToucheLLP
Philadelphia, PA 19103
Address of the Trust
100 Bellevue Parkway
Wilmington, DE 19809
| | | | | | |
70 | | BLACKROCK FUNDS | | MARCH 31, 2010 | | |
Additional Information
General Information
Electronic Delivery
Electronic copies of most financial reports and prospectuses are available on the Fund’s website or shareholders can sign up for e-mail notifications of quarterly statements, annual and semi-annual reports and prospectuses by enrolling in the Fund’s electronic delivery program.
To enroll:
Shareholders Who Hold Accounts with Investment Advisors, Banks or Brokerages:
Please contact your financial advisor to enroll. Please note that not all investment advisors, banks or brokerages may offer this service.
Shareholders Who Hold Accounts Directly With BlackRock
| 1) | Access the BlackRock website at http://www.blackrock.com/ edelivery |
| 2) | Select “eDelivery” under the “More Information” section |
Householding
The Funds will mail only one copy of shareholder documents, including annual and semi-annual reports and proxy statements, to shareholders with multiple accounts at the same address. This practice is commonly called “householding” and it is intended to reduce expenses and eliminate duplicate mailings of shareholder documents. Mailings of your shareholder documents may be householded indefinitely unless you instruct us otherwise. If you do not want the mailing of these documents to be combined with those for other members of your household, please contact the Funds at (800) 441-7762.
Availability of Quarterly Portfolio Schedule
The Funds file their complete schedule of portfolio holdings with the Securities and Exchange Commission (the “SEC”) for the first and third quarters of each fiscal year on Form N-Q. The Funds’ Forms N-Q are available on the SEC’s website at http://www.sec.gov and may also be reviewed and copied at the SEC’s Public Reference Room in Washington, D.C. Information on the operation of the Public Reference Room may be obtained by calling (800) SEC-0330. The Funds’ Forms N-Q may also be obtained upon request and without charge by calling (800) 441-7762.
Availability of Proxy Voting Policies and Procedures
A description of the policies and procedures that the Funds use to determine how to vote proxies relating to portfolio securities is available (1) without charge, upon request by calling (800) 441-7762; (2) at www.blackrock.com; and (3) on the SEC’s website at http:// www.sec.gov.
Availability of Proxy Voting Record
Information about how the Funds voted proxies relating to securities held in the Funds’ portfolios during the most recent 12-month period ended June 30 is available upon request, and without charge (1) at www.blackrock.com or by calling (800) 441-7762 and (2) on the SEC’s website at http://www.sec.gov.
Shareholder Privileges
Account Information
Call us at (800) 441-7762 from 8:00 AM to 6:00 PM EST on any business day to get information about your account balances, recent transactions and share prices. You can also reach us on the Web at www.blackrock.com/funds.
Automatic Investment Plans
Investor Class shareholders who want to invest regularly can arrange to have $50 or more automatically deducted from their checking or savings account and invested in any of the BlackRock funds.
Systematic Withdrawal Plan
Investor Class shareholders can establish a systematic withdrawal plan and receive periodic payments of $50 or more from their BlackRock funds, as long as their account is at least $10,000.
Retirement Plans
Shareholders may make investments in conjunction with Traditional, Rollover, Roth, Coverdell, Simple IRAs, SEP IRAs and 403(b) Plans.
| | | | | | |
| | | BLACKROCK FUNDS | | MARCH 31, 2010 | | 71 |
Additional Information (concluded)
BlackRock Privacy Principles
BlackRock is committed to maintaining the privacy of its current and former fund investors and individual clients (collectively, “Clients”) and to safeguarding their nonpublic personal information. The following information is provided to help you understand what personal information BlackRock collects, how we protect that information and why in certain cases we share such information with select parties.
If you are located in a jurisdiction where specific laws, rules or regulations require BlackRock to provide you with additional or different privacy-related rights beyond what is set forth below, then BlackRock will comply with those specific laws, rules or regulations.
BlackRock obtains or verifies personal nonpublic information from and about you from different sources, including the following: (i) information we receive from you or, if applicable, your financial intermediary, on applications, forms or other documents; (ii) information about your transactions with us, our affiliates, or others; (iii) information we receive from a consumer reporting agency; and (iv) from visits to our websites.
BlackRock does not sell or disclose to non-affiliated third parties any nonpublic personal information about its Clients, except as permitted by law or as is necessary to respond to regulatory requests or to service Client accounts. These non-affiliated third parties are required to protect the confidentiality and security of this information and to use it only for its intended purpose.
We may share information with our affiliates to service your account or to provide you with information about other BlackRock products or services that may be of interest to you. In addition, BlackRock restricts access to nonpublic personal information about its Clients to those BlackRock employees with a legitimate business need for the information. BlackRock maintains physical, electronic and procedural safeguards that are designed to protect the nonpublic personal information of its Clients, including procedures relating to the proper storage and disposal of such information.
| | | | | | |
72 | | BLACKROCK FUNDS | | MARCH 31, 2010 | | |
A World-Class Mutual Fund Family
BlackRock offers a diverse lineup of open-end mutual funds crossing all investment styles and managed by experts in equity, fixed income and tax-exempt investing.
| | | | |
Equity Funds | | | | |
| | |
BlackRock All-Cap Energy & Resources Portfolio | | BlackRock Global Growth Fund | | BlackRock Mid-Cap Value Equity Portfolio |
BlackRock Asset Allocation Portfolio† | | BlackRock Global Opportunities Portfolio | | BlackRock Mid Cap Value Opportunities Fund |
BlackRock Aurora Portfolio | | BlackRock Global SmallCap Fund | | BlackRock Natural Resources Trust |
BlackRock Balanced Capital Fund† | | BlackRock Health Sciences Opportunities Portfolio | | BlackRock Pacific Fund |
BlackRock Basic Value Fund | | BlackRock Healthcare Fund | | BlackRock Science & Technology |
BlackRock Capital Appreciation Portfolio | | BlackRock Index Equity Portfolio* | | Opportunities Portfolio |
BlackRock Energy & Resources Portfolio | | BlackRock International Fund | | BlackRock Small Cap Core Equity Portfolio |
BlackRock Equity Dividend Fund | | BlackRock International Index Fund | | BlackRock Small Cap Growth Equity Portfolio |
BlackRock EuroFund | | BlackRock International Opportunities Portfolio | | BlackRock Small Cap Growth Fund II |
BlackRock Focus Growth Fund | | BlackRock International Value Fund | | BlackRock Small Cap Index Fund |
BlackRock Focus Value Fund | | BlackRock Large Cap Core Fund | | BlackRock Small/Mid-Cap Growth Portfolio |
BlackRock Fundamental Growth Fund | | BlackRock Large Cap Core Plus Fund | | BlackRock S&P 500 Index Fund |
BlackRock Global Allocation Fund† | | BlackRock Large Cap Growth Fund | | BlackRock U.S. Opportunities Portfolio |
BlackRock Global Dynamic Equity Fund | | BlackRock Large Cap Value Fund | | BlackRock Utilities and Telecommunications Fund |
BlackRock Global Emerging Markets Fund | | BlackRock Latin America Fund | | BlackRock Value Opportunities Fund |
BlackRock Global Financial Services Fund | | BlackRock Mid-Cap Growth Equity Portfolio | | |
| | |
Fixed Income Funds | | | | |
| | |
BlackRock Bond Portfolio | | BlackRock Income Builder Portfolio† | | BlackRock Managed Income Portfolio |
BlackRock Emerging Market Debt Portfolio | | BlackRock Inflation Protected Bond Portfolio | | BlackRock Multi-Sector Bond Portfolio |
BlackRock GNMA Portfolio | | BlackRock Intermediate Government | | BlackRock Short-Term Bond Fund |
BlackRock Government Income Portfolio | | Bond Portfolio | | BlackRock Strategic Income Opportunities Portfolio |
BlackRock High Income Fund | | BlackRock International Bond Portfolio | | BlackRock Total Return Fund |
BlackRock High Yield Bond Portfolio | | BlackRock Long Duration Bond Portfolio | | BlackRock Total Return Portfolio II |
BlackRock Income Portfolio† | | BlackRock Low Duration Bond Portfolio | | BlackRock World Income Fund |
| | |
Municipal Bond Funds | | | | |
| | |
BlackRock AMT-Free Municipal Bond Portfolio | | BlackRock Kentucky Municipal Bond Portfolio | | BlackRock New York Municipal Bond Fund |
BlackRock California Municipal Bond Fund | | BlackRock Municipal Insured Fund | | BlackRock Ohio Municipal Bond Portfolio |
BlackRock High Yield Municipal Fund | | BlackRock National Municipal Fund | | BlackRock Pennsylvania Municipal Bond Fund |
BlackRock Intermediate Municipal Fund | | BlackRock New Jersey Municipal Bond Fund | | BlackRock Short-Term Municipal Fund |
| | |
Target Risk & Target Date Funds | | | | |
| | |
BlackRock Prepared Portfolios | | BlackRock Lifecycle Prepared Portfolios | | |
Conservative Prepared Portfolio | | Prepared Portfolio 2010 | | Prepared Portfolio 2030 |
Moderate Prepared Portfolio | | Prepared Portfolio 2015 | | Prepared Portfolio 2035 |
Growth Prepared Portfolio | | Prepared Portfolio 2020 | | Prepared Portfolio 2040 |
Aggressive Growth Prepared Portfolio | | Prepared Portfolio 2025 | | Prepared Portfolio 2045 |
| | | | Prepared Portfolio 2050 |
| * | See the prospectus for information on specific limitations on investments in the fund. |
BlackRock mutual funds are distributed by BlackRock Investments, LLC. You should consider the investment objectives, risks, charges and expenses of the funds under consideration carefully before investing. Each fund’s prospectus contains this and other information and is available at www.blackrock.com or by calling (800) 441-7762 or from your financial advisor. The prospectus should be read carefully before investing.
| | | | | | |
| | | BLACKROCK FUNDS | | MARCH 31, 2010 | | 73 |
[THIS PAGE INTENTIONALLY LEFT BLANK.]
[THIS PAGE INTENTIONALLY LEFT BLANK.]
This report is transmitted to shareholders only. It is not authorized for use as an offer of sale or a solicitation of an offer to buy shares of the Funds unless accompanied or preceded by the Funds’ current prospectus. Past performance results shown in this report should not be considered a representation of future performance. Investment returns and principal value of shares will fluctuate so that shares, when redeemed, may be worth more or less than their original cost. Statements and other information herein are as dated and are subject to change.
Investment in foreign securities involves special risks including fluctuating foreign exchange rates, foreign government regulations, differing degrees of liquidity and the possibility of substantial volatility due to adverse political, economic or other developments.

EQUITY5-3/10-SAR
| | |
BlackRock Asset Allocation Portfolio of BlackRock FundsSM | |  |
SEMI-ANNUAL REPORT | MARCH 31, 2010 (UNAUDITED)
NOT FDIC INSURED
MAY LOSE VALUE
NO BANK GUARANTEE
Table of Contents
| | | | | | |
| 2 | | BLACKROCK ASSET ALLOCATION PORTFOLIO | | MARCH 31, 2010 | | |
Dear Shareholder
The past year has seen a remarkable turnaround from the conditions that plagued the global economy and financial markets in 2008 through early 2009. In our opinion, the “Great Recession” likely ended at some point last summer, thanks primarily to massive fiscal and monetary stimulus. From that point, the global economy has moved into recovery mode and, we believe, is getting ready to start transitioning into an expansion.
Global equity markets bottomed in early 2009 and since that time have soared dramatically higher as investors were lured back into the markets by depressed valuations, desire for higher yields and increasing confidence that all-out financial disaster had been averted. There have been several corrections along the way and volatility levels have remained elevated — reflections of mixed economic data, lingering deflation issues (especially in Europe) and concerns over the future direction of interest rates. On balance, however, strong corporate earnings and a positive macro backdrop have helped keep the equity bull market intact. From a geographic perspective, US equities have generally outpaced their international counterparts in recent months, as the domestic economic recovery has been more pronounced.
Within fixed income markets, improving economic conditions, concerns over the US deficit and a lack of demand at recent Treasury auctions have recently conspired to push Treasury yields higher (and prices correspondingly lower). In this environment, Treasuries have dramatically underperformed other areas of the bond market, particularly the high yield sector, which has been benefiting from increased investor demand. Meanwhile, municipal bonds outperformed taxable sectors over the twelve-month period thanks to continued high demand levels, but have struggled in recent months against a weak fundamental backdrop marked by ongoing state and local budget problems. As in the taxable arena, high yield municipals have been outperforming the rest of the market.
Regarding cash investments, yields on money market securities remain near all-time lows (producing returns only marginally above zero percent), with the Federal Open Market Committee reiterating that economic circumstances are likely to necessitate an accommodative interest rate stance for an “extended period”.
Against this backdrop, the major market averages posted the following returns:
| | | | | | |
Total Returns as of March 31, 2010 | | 6-month | | | 12-month | |
US equities (S&P 500 Index) | | 11.75 | % | | 49.77 | % |
Small cap US equities (Russell 2000 Index) | | 13.07 | | | 62.76 | |
International equities (MSCI Europe, Australasia, Far East Index) | | 3.06 | | | 54.44 | |
3-month Treasury bill (BofA Merrill Lynch 3-Month Treasury Bill Index) | | 0.05 | | | 0.17 | |
US Treasury securities (BofA Merrill Lynch 10-Year US Treasury Index) | | (2.62 | ) | | (6.30 | ) |
Taxable fixed income (Barclays Capital US Aggregate Bond Index) | | 1.99 | | | 7.69 | |
Tax-exempt fixed income (Barclays Capital Municipal Bond Index) | | 0.28 | | | 9.69 | |
High yield bonds (Barclays Capital US Corporate High Yield 2% Issuer Capped Index) | | 10.97 | | | 55.64 | |
Past performance is no guarantee of future results. Index performance shown for illustrative purposes only. You cannot invest directly in an index.
Global financial markets continue to show signs of improvement, but questions about the strength and sustainability of the recovery abound. Through periods of uncertainty, as ever, BlackRock’s full resources are dedicated to the management of our clients’ assets. For additional market perspective and investment insight, visit www.blackrock.com/shareholdermagazine, where you’ll find the most recent issue of our award-winning Shareholder® magazine, as well as its quarterly companion newsletter, Shareholder Perspectives. As always, we thank you for entrusting BlackRock with your investments, and we look forward to your continued partnership in the months and years ahead.
|
| Sincerely, |
|
 |
| Rob Kapito |
| President, BlackRock Advisors, LLC |
THIS PAGE NOT PART OF YOUR FUND REPORT
| | |
| Fund Summary as of March 31, 2010 |
| |
Portfolio Management Commentary | | |
How did the Fund perform?
| | • | | For the six-month period, the Fund’s Institutional shares performed in line with its benchmark, a 60%/40% composite of the S&P 500 Index and the Barclays Capital US Aggregate Bond Index, respectively; Service, Investor A, Investor B and Investor C Shares trailed the blended benchmark. All share classes outperformed the Barclays Capital US Aggregate Bond Index, but underperformed the broad-market S&P 500 Index. |
What factors influenced performance?
| | • | | Broad allocation decisions among the major asset classes (stocks, bonds and cash) were strong during the reporting period and benefited Fund performance. The Fund also benefited from positive aggregate performance by the underlying managers of its investment sleeves. |
| | • | | The strongest underlying allocation was to the fixed income component of the Fund. A majority of the excess returns in this sleeve were driven by overweight exposure to high-quality non-government spread sectors, including non-agency mortgage-backed securities, commercial mortgage-backed securities, asset-backed securities and investment-grade credit, which continued to benefit from ongoing US government support, improving economic indicators and increased investor risk appetite. |
| | • | | An allocation to US mid-cap value equities also helped performance, largely as a result of strong performance by the asset class (+15.32% six-month return, as measured by the Russell Midcap Value Index). |
| | • | | The largest detraction effects came from our allocation to international equities, particularly in the large-cap space. This was mainly the function of relatively weak performance by the asset class (+3.06% six-month return, as measured by the MSCI EAFE Index). In the smaller-cap international space, the underlying manager’s underperformance was the result of selection decisions in the financials and materials sectors. |
Describe recent portfolio activity.
| | • | | During the six-month period, there were no significant changes to the Fund’s allocations among either the major asset classes or the sub-asset classes. |
Describe Fund positioning at period end.
| | • | | The Fund ended the period with an overweight relative to the blended benchmark in equities and an underweight in fixed income. |
| | • | | Though there are many long-term headwinds facing the developed world, we think equity markets will grind higher from here. Moderate economic growth, increased merger and acquisition activity and lean corporations should propel both earnings and the equity market higher. From a fixed income perspective, credit is trading fair to the fundamentals in the US market. Interest rates will likely drift higher as the US government borrows more and foreign countries diversify their holdings away from Treasuries. |
| | • | | In sum, we have moved from a standpoint of caution to one of guarded optimism. We remain mindful of longer-term headwinds as we look for entry points to selectively add risk back to the Fund. |
The views expressed reflect the opinions of BlackRock as of the date of this report and are subject to change based on changes in market, economic or other conditions. These views are not intended to be a forecast of future events and are no guarantee of future results.
Portfolio Information
| | | |
Ten Largest Holdings | | Percent of
Long-Term
Investments | |
Fannie Mae | | 20 | % |
U.S. Treasury Notes/Strips | | 6 | |
U.S. Treasury Bonds | | 3 | |
Freddie Mac | | 2 | |
Credit Suisse Group | | 1 | |
Apple, Inc. | | 1 | |
General Electric Co. | | 1 | |
Microsoft Corp. | | 1 | |
Countrywide Financial Corp. | | 1 | |
SLM Student Loan Trust | | 1 | |
| | | |
Portfolio Composition | | Percent of
Long-Term
Investments | |
Common Stocks | | 49 | % |
U.S. Government Sponsored Agency Securities | | 25 | |
U.S. Treasury Obligations | | 9 | |
Corporate Bonds | | 7 | |
Non-Agency Mortgage-Backed Securities | | 5 | |
Asset-Backed Securities | | 2 | |
Foreign Government Obligations | | 1 | |
Foreign Agency Obligations | | 1 | |
Taxable Municipal Bonds | | 1 | |
| | | | | | |
| 4 | | BLACKROCK ASSET ALLOCATION PORTFOLIO | | MARCH 31, 2010 | | |
|
Total Return Based on a $10,000 Investment |
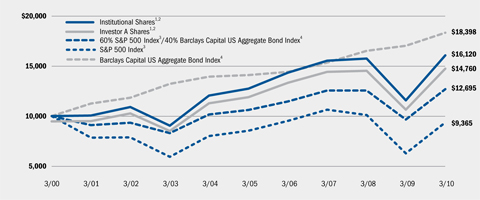
| 1 | Assuming maximum sales charge, if any, transaction costs and other operating expenses, including advisory fees. Institutional Shares do not have a sales charge. |
| 2 | The Fund uses an asset allocation strategy, investing varying percentages of its portfolio in three major categories: stocks, bonds and, to a lesser extent, money market instruments. |
| 3 | This unmanaged total return index covers 500 industrial, utility, transportation and financial companies of the US markets (mostly New York Stock Exchange (“NYSE”) issues) representing about 75% of NYSE market capitalization and 30% of NYSE issues. S&P 500 is a trademark of the McGraw-Hill Companies. |
| 4 | This unmanaged market-weighted index is comprised of investment grade corporate bonds (rated BBB or better), mortgages and US Treasury and government agency issues with at least one year to maturity. |
Performance Summary for the Period Ended March 31, 2010
| | | | | | | | | | | | | | | | | | | | | |
| | | | | | Average Annual Total Returns5 | |
| | | | | | 1 Year | | | 5 Years | | | 10 Years | |
| | | 6-Month
Total Returns | | | w/o sales
charge | | | w/ sales
charge | | | w/o sales
charge | | | w/sales
charge | | | w/o sales
charge | | | w/sales
charge | |
Institutional | | 7.83 | % | | 39.18 | % | | N/A | | | 4.81 | % | | N/A | | | 4.89 | % | | N/A | |
Service | | 7.73 | | | 38.92 | | | N/A | | | 4.52 | | | N/A | | | 4.64 | | | N/A | |
Investor A | | 7.70 | | | 38.75 | | | 31.50 | % | | 4.40 | | | 3.28 | % | | 4.53 | | | 3.97 | % |
Investor B | | 7.28 | | | 37.77 | | | 33.27 | | | 3.59 | | | 3.26 | | | 3.95 | | | 3.95 | |
Investor C | | 7.28 | | | 37.82 | | | 36.82 | | | 3.66 | | | 3.66 | | | 3.80 | | | 3.80 | |
60% S&P 500 Index/40% Barclays Capital US Aggregate Bond Index | | 7.88 | | | 31.65 | | | N/A | | | 3.64 | | | N/A | | | 2.41 | | | N/A | |
S&P 500 Index | | 11.75 | | | 49.77 | | | N/A | | | 1.92 | | | N/A | | | (0.65 | ) | | N/A | |
Barclays Capital US Aggregate Bond Index | | 1.99 | | | 7.69 | | | N/A | | | 5.44 | | | N/A | | | 6.29 | | | N/A | |
| 5 | Assuming maximum sales charge, if any. Average annual total returns with and without sales charges reflect reductions for distribution and service fees. See “About Fund Performance” on page 6 for a detailed description of share classes, including any related sales charges and fees. |
N/A - Not applicable as share class and index do not have a sales charge.
Past performance is not indicative of future results.
Expense Example
| | | | | | | | | | | | | | | | | | | | | | | | | | | | | | |
| | | Actual | | Hypothetical8 |
| | | | | Including Interest Expense | | Excluding Interest Expense | | | | Including Interest Expense | | Excluding Interest Expense |
| | | Beginning
Account Value
October 1,
2009 | | Ending
Account Value
March 31,
2010 | | Expenses
Paid During
the Period6 | | Ending
Account Value
March 31,
2010 | | Expenses
Paid During
the Period7 | | Beginning
Account Value
October 1,
2009 | | Ending
Account Value
March 31,
2010 | | Expenses
Paid During
the Period6 | | Ending
Account Value
March 31,
2010 | | Expenses
Paid During
the Period7 |
Institutional | | $ | 1,000 | | $ | 1,078.30 | | $ | 4.82 | | $ | 1,078.30 | | $ | 4.61 | | $ | 1,000 | | $ | 1,020.29 | | $ | 4.68 | | $ | 1,020.49 | | $ | 4.48 |
Service | | $ | 1,000 | | $ | 1,077.30 | | $ | 6.27 | | $ | 1,077.30 | | $ | 6.06 | | $ | 1,000 | | $ | 1,018.90 | | $ | 6.09 | | $ | 1,019.10 | | $ | 5.89 |
Investor A | | $ | 1,000 | | $ | 1,077.00 | | $ | 6.52 | | $ | 1,077.00 | | $ | 6.32 | | $ | 1,000 | | $ | 1,018.65 | | $ | 6.34 | | $ | 1,018.85 | | $ | 6.14 |
Investor B | | $ | 1,000 | | $ | 1,072.80 | | $ | 10.90 | | $ | 1,072.80 | | $ | 10.70 | | $ | 1,000 | | $ | 1,014.41 | | $ | 10.60 | | $ | 1,014.61 | | $ | 10.40 |
Investor C | | $ | 1,000 | | $ | 1,072.80 | | $ | 10.13 | | $ | 1,072.80 | | $ | 9.87 | | $ | 1,000 | | $ | 1,015.16 | | $ | 9.85 | | $ | 1,015.41 | | $ | 9.60 |
| 6 | For each class of the Fund, expenses are equal to the annualized expense ratio for the class (0.93% for Institutional, 1.21% for Service, 1.26% for Investor A, 2.11% for Investor B and 1.96% for Investor C), multiplied by the average account value over the period, multiplied by 182/365 (to reflect the one-half year period shown). |
| 7 | For each class of the Fund, expenses are equal to the annualized expense ratio for the class (0.89% for Institutional, 1.17% for Service, 1.22% for Investor A, 2.07% for Investor B and 1.91% for Investor C), multiplied by the average account value over the period, multiplied by 182/365 (to reflect the one-half year period shown). |
| 8 | Hypothetical 5% annual return before expenses is calculated by pro rating the number of days in the most recent fiscal half-year divided by 365. |
See “Disclosure of Expenses” on page 6 for further information on how expenses were calculated.
| | | | | | |
| | | BLACKROCK ASSET ALLOCATION PORTFOLIO | | MARCH 31, 2010 | | 5 |
About Fund Performance
| | • | | Institutional Shares are not subject to any sales charge. Institutional Shares bear no ongoing distribution or service fees and are available only to eligible investors. |
| | • | | Service Shares are not subject to any sales charge (front-end load) or deferred sales charge. Service Shares are subject to a service fee of 0.25% per year (but no distribution fee). Prior to January 28, 2005, Service Share performance results are those of Institutional Shares (which have no distribution or service fees) restated to reflect Service Share fees. |
| | • | | Investor A Shares incur a maximum initial sales charge (front-end load) of 5.25% and a service fee of 0.25% per year (but no distribution fee). |
| | • | | Investor B Shares are subject to a maximum contingent deferred sales charge of 4.50% declining to 0% after six years. In addition, Investor B Shares are subject to a distribution fee of 0.75% per year and a service fee of 0.25% per year. Investor B Shares automatically convert to Investor A Shares after approximately eight years. (There is no initial sales charge for automatic share conversions.) All returns for periods greater than eight years reflect this conversion. Investor B Shares are only available for purchase through exchanges, dividend reinvestment or for purchase by certain qualified employee benefit plans. |
| | • | | Investor C Shares are subject to a 1.00% contingent deferred sales charge if redeemed within one year of purchase. In addition, Investor C Shares are subject to a distribution fee of 0.75% per year and a service fee of 0.25% per year. |
Performance information reflects past performance and does not guarantee future results. Current performance may be lower or higher than the performance data quoted. Refer to www.blackrock.com/funds to obtain performance data current to the most recent month-end. Performance results do not reflect the deduction of taxes that a shareholder would pay on fund distributions or the redemption of fund shares. Performance data does not reflect this potential fee. Figures shown in the performance tables on the previous pages assume reinvestment of all dividends and distributions, if any, at net asset value on the payable date. Investment return and principal value of shares will fluctuate so that shares, when redeemed, may be worth more or less than their original cost.
Performance for the Fund for the periods prior to January 31, 2005 is based on performance of a certain former State Street Research mutual fund that reorganized with the Fund on that date.
The Fund’s investment advisor waived or reimbursed a portion of the Fund’s expenses. Without such waiver and reimbursement, the Fund’s performance would have been lower. BlackRock Advisors, LLC is under no obligation to waive or continue waiving its fees after February 1, 2011. Dividends paid to each class of shares will vary because of the different levels of service, distribution and transfer agency fees applicable to each class, which are deducted from the income available to be paid to shareholders.
Disclosure of Expenses
Shareholders of the Fund may incur the following charges: (a) expenses related to transactions, including sales charges and (b) operating expenses including advisory fees, service and distribution fees, including 12b-1 fees, and other Fund expenses. The expense example on the previous page (which is based on a hypothetical investment of $1,000 invested on October 1, 2009 and held through March 31, 2010) is intended to assist shareholders both in calculating expenses based on an investment in the Fund and in comparing these expenses with similar costs of investing in other mutual funds.
The table provides information about actual account values and actual expenses. In order to estimate the expenses a shareholder paid during the period covered by this report, shareholders can divide their account value by $1,000 and then multiply the result by the number corresponding to their share class under the heading entitled “Expenses Paid During the Period.”
The table also provides information about hypothetical account values and hypothetical expenses based on the Fund’s actual expense ratio and an assumed rate of return of 5% per year before expenses. In order to assist shareholders in comparing the ongoing expenses of investing in the Fund and other funds, compare the 5% hypothetical example with the 5% hypothetical examples that appear in other funds’ shareholder reports.
The expenses shown in the table are intended to highlight shareholders’ ongoing costs only and do not reflect any transactional expenses, such as sales charges. Therefore, the hypothetical examples are useful in comparing ongoing expenses only, and will not help shareholders determine the relative total expenses of owning different funds. If these transactional expenses were included, shareholder expenses would have been higher.
| | | | | | |
| 6 | | BLACKROCK ASSET ALLOCATION PORTFOLIO | | MARCH 31, 2010 | | |
The Benefits and Risks of Leveraging
The Fund may utilize leverage to seek to enhance its yield and net asset values (“NAVs”). However, these objectives cannot be achieved in all interest rate environments.
The Fund may utilize leverage through borrowings, including entering into reverse repurchase agreements and treasury rolls. In general, the concept of leveraging is based on the premise that the cost of assets to be obtained from leverage will be based on short-term interest rates, which normally will be lower than the income earned by the Fund on its longer-term portfolio investments. To the extent that the total assets of the Fund (including the assets obtained through leverage) are invested in higher-yielding portfolio investments, the Fund’s shareholders will benefit from the incremental net income.
Furthermore, the value of the Fund’s investments generally varies inversely with the direction of long-term interest rates, although other factors can influence the value of portfolio investments. Changes in interest rates can influence the Fund’s NAV positively or negatively in addition to the impact on the Fund’s performance from leverage.
The use of leverage may enhance opportunities for increased income to the Fund, but as described above, it also creates risks as short- or long- term interest rates fluctuate. Leverage also will generally cause greater changes in the Fund’s NAV and dividend rate than a comparable portfolio without leverage. If the income derived from securities purchased with assets received from leverage exceeds the cost of leverage, the Fund’s net income will be greater than if leverage had not been used. Conversely, if the income from the securities purchased is not sufficient to cover the cost of leverage, the Fund’s net income will be less than if leverage had not been used, and therefore the amount available for distribution to shareholders will be reduced. The Fund may be required to sell portfolio securities at inopportune times or at distressed values in order to comply with regulatory requirements applicable to the use of leverage or as required by the terms of leverage instruments which may cause the Fund to incur losses. The use of leverage may limit the Fund’s ability to invest in certain types of securities or use certain types of hedging strategies. The Fund will incur expenses in connection with the use of leverage, all of which are borne by Fund shareholders and may reduce income.
Derivative Financial Instruments
The Fund may invest in various derivative instruments, including financial futures contracts, foreign currency exchange contracts, options and swaps, as specified in Note 2 of the Notes to Financial Statements, which constitute forms of economic leverage. Such instruments are used to obtain exposure to a market without owning or taking physical custody of securities or to hedge market, equity, credit, interest rate and/or foreign currency exchange rate risks. Such derivative instruments involve risks, including the imperfect correlation between the value of a derivative instrument and the underlying asset, possible default of the counterparty to the transaction or illiquidity of the derivative instrument.
The Fund’s ability to successfully use a derivative instrument depends on the investment advisor’s ability to accurately predict pertinent market movements, which cannot be assured. The use of derivative instruments may result in losses greater than if they had not been used, may require the Fund to sell or purchase portfolio securities at inopportune times or for distressed values, may limit the amount of appreciation the Fund can realize on an investment or may cause the Fund to hold a security that it might otherwise sell. The Fund’s investments in these instruments are discussed in detail in the Notes to Financial Statements.
| | | | | | |
| | | BLACKROCK ASSET ALLOCATION PORTFOLIO | | MARCH 31, 2010 | | 7 |
| | |
| Schedule of Investments March 31, 2010 (Unaudited) |
| | (Percentages shown are based on Net Assets) |
| | | | | | |
| | | Par
(000) | | Value |
Asset-Backed Securities | | | | | | |
AmeriCredit Automobile Receivables Trust, Series 2008-2, Class A2, | | | | | | |
4.23%, 8/06/12(a) | | USD | 531 | | $ | 542,786 |
Amortizing Residential Collateral Trust, Series 2002-BC5, Class M2, | | | | | | |
2.05%, 7/25/32(a) | | | 19 | | | 7,013 |
Bank of America Auto Trust, Series 2009-2A, Class A3, | | | | | | |
2.13%, 9/15/13(b) | | | 1,430 | | | 1,451,569 |
Carrington Mortgage Loan Trust, Series 2006-NC4, Class A1, | | | | | | |
0.30%, 10/25/36(a) | | | 130 | | | 126,993 |
Centex Home Equity Loan Trust: | | | | | | |
Series 2002-A, Class MF2, 6.54%, 1/25/32 | | | 185 | | | 29,266 |
Series 2003-B, Class M3, 3.35%, 6/25/33(a) | | | 137 | | | 19,433 |
Chase Issuance Trust, Series 2009-A7, Class A7, | | | | | | |
0.68%, 9/15/10(a) | | | 1,725 | | | 1,727,573 |
Conseco Financial Corp.: | | | | | | |
Series 1996-6, Class A6, 7.95%, 9/15/27 | | | 228 | | | 231,387 |
Series 1996-7, Class A6, 7.65%, 10/15/27(a) | | | 100 | | | 99,645 |
Countrywide Asset-Backed Certificates: | | | | | | |
Series 2002-2, Class M2, 1.97%, 12/25/31(a) | | | 1 | | | 919 |
Series 2003-3, Class M6, 4.58%, 7/25/32(a) | | | 3 | | | 406 |
Series 2003-BCI, Class M2, 3.25%, 9/25/32(a) | | | 35 | | | 9,340 |
Series 2003-2, Class M2, 2.72%, 3/26/33(a) | | | 123 | | | 30,043 |
Credit-Based Asset Servicing and Securitization LLC, Series 2004-CB4, Class M1, | | | | | | |
5.77%, 5/25/35(c) | | | 121 | | | 90,413 |
Globaldrive BV, Series 2008-2, Class A, | | | | | | |
4.00%, 10/20/16 | | EUR | 378 | | | 521,162 |
Harley-Davidson Motorcycle Trust: | | | | | | |
Series 2005-2, Class A2, 4.07%, 2/15/12 | | USD | 194 | | | 193,900 |
Series 2009-3, Class A2, 0.94%, 4/16/12 | | | 1,045 | | | 1,046,560 |
Home Equity Asset Trust, Series 2007-2, Class 2A1, | | | | | | |
0.36%, 7/25/37(a) | | | 180 | | | 172,933 |
Lehman XS Trust, Series 2005-5N, Class 3A2, | | | | | | |
0.61%, 11/25/35(a) | | | 471 | | | 166,219 |
Long Beach Mortgage Loan Trust: | | | | | | |
Series 2003-4, Class M5A, 6.25%, 8/25/33(a) | | | 34 | | | 8,649 |
Series 2004-1, Class M5, 1.90%, 2/25/34(a) | | | 91 | | | 39,377 |
Massachusetts RRB Special Purpose Trust, Series 2001-1, Class A, | | | | | | |
6.53%, 6/01/15 | | | 1,132 | | | 1,234,701 |
Nissan Auto Receivables Owner Trust, Series 2009-A, Class A2, | | | | | | |
2.94%, 7/15/11 | | | 748 | | | 753,268 |
Option One Mortgage Loan Trust: | | | | | | |
Series 2002-6, Class M1, 1.37%, 11/25/32(a) | | | 16 | | | 7,336 |
Series 2002-6, Class M2, 2.80%, 11/25/32(a) | | | 35 | | | 9,522 |
Series 2003-4, Class A2, 0.89%, 7/25/33(a) | | | 71 | | | 49,915 |
Series 2003-4, Class M5A, 5.87%, 7/25/33(a) | | | 24 | | | 2,040 |
Series 2003-5, Class M4, 4.60%, 8/25/33(a) | | | 23 | | | 3,055 |
Residential Asset Mortgage Products, Inc.: | | | | | | |
Series 2003-RZ2, Class M3, 5.50%, 4/25/33(c) | | | 55 | | | 5,678 |
Series 2007-RS2, Class A1, 0.37%, 5/25/37(a) | | | 370 | | | 348,182 |
Residential Asset Securities Corp., Series 2002-KS4, Class AIIB, | | | | | | |
0.75%, 7/25/32(a) | | | 32 | | | 15,995 |
SLM Student Loan Trust: | | | | | | |
Series 2008-5, Class A2, 1.35%, 10/25/16(a) | | | 1,720 | | | 1,748,277 |
Series 2008-5, Class A3, 1.55%, 1/25/18(a) | | | 440 | | | 454,023 |
Series 2005-4, Class A2, 0.33%, 4/26/21(a) | | | 458 | | | 456,650 |
Series 2008-5, Class A4, 1.95%, 7/25/23(a) | | | 1,170 | | | 1,236,981 |
Structured Asset Investment Loan Trust, Series 2003-BC3, Class M2, | | | | | | |
3.17%, 4/25/33(a) | | | 11 | | | 2,538 |
Structured Asset Receivables Trust Certificates, Series 2003-2A, | | | | | | |
0.65%, 1/21/11(a)(b)(d) | | | — | | | 268 |
| | | | | | |
Total Asset-Backed Securities — 2.3% | | | | | | 12,844,015 |
| | | | | | |
Collateralized Debt Obligations — 0.0% | | | | | | |
Knollwood Ltd., Series 2004-1A, Class C, | | | | | | |
3.45%, 1/10/39(a)(b) | | | 115 | | | — |
| | |
| | | Shares | | |
Common Stocks | | | | | | |
Aerospace & Defense — 0.9% | | | | | | |
Argon ST, Inc.(e) | | | 4,742 | | | 126,185 |
BE Aerospace, Inc.(e) | | | 21,800 | | | 663,810 |
L-3 Communications Holdings, Inc. | | | 9,100 | | | 833,833 |
Lockheed Martin Corp. | | | 4,400 | | | 366,168 |
Meggitt Plc | | | 120,000 | | | 557,657 |
Northrop Grumman Corp. | | | 17,600 | | | 1,154,032 |
Orbital Sciences Corp.(e) | | | 18,800 | | | 357,388 |
Precision Castparts Corp. | | | 2,400 | | | 304,104 |
Raytheon Co. | | | 9,400 | | | 536,928 |
| | | | | | |
| | | | | | 4,900,105 |
| | | | | | |
Air Freight & Logistics — 0.4% | | | | | | |
Atlas Air Worldwide Holdings, Inc.(e) | | | 4,600 | | | 244,030 |
FedEx Corp. | | | 1,275 | | | 119,085 |
Forward Air Corp. | | | 6,500 | | | 170,950 |
United Parcel Service, Inc. - Class B | | | 28,450 | | | 1,832,465 |
| | | | | | |
| | | | | | 2,366,530 |
| | | | | | |
Airlines — 0.8% | | | | | | |
British Airways Plc(e) | | | 92,100 | | | 340,604 |
China Airlines Ltd.(e) | | | 626,244 | | | 228,407 |
Delta Air Lines, Inc.(e) | | | 126,650 | | | 1,847,824 |
Deutsche Lufthansa AG | | | 24,000 | | | 397,791 |
Korean Air Lines Co. Ltd.(e) | | | 5,100 | | | 299,649 |
Ryanair Holdings Plc - ADR(e) | | | 32,699 | | | 888,432 |
UAL Corp.(e) | | | 20,200 | | | 394,910 |
| | | | | | |
| | | | | | 4,397,617 |
| | | | | | |
Auto Components — 0.5% | | | | | | |
Aisin Seiki Co. Ltd. | | | 11,000 | | | 330,308 |
Bridgestone Corp. | | | 43,100 | | | 737,610 |
Cooper Tire & Rubber Co. | | | 3,300 | | | 62,766 |
Dana Holding Corp.(e) | | | 16,400 | | | 194,832 |
Hyundai Mobis | | | 2,100 | | | 278,299 |
See Notes to Financial Statements.
| | | | | | |
| 8 | | BLACKROCK ASSET ALLOCATION PORTFOLIO | | MARCH 31, 2010 | | |
| | |
| Schedule of Investments (continued) | | |
| | (Percentages shown are based on Net Assets) |
| | | | | |
| | | Shares | | Value |
Common Stocks | | | | | |
Auto Components (concluded) | | | | | |
Lear Corp.(e) | | 4,100 | | $ | 325,335 |
Magna International, Inc. - Class A(e) | | 3,900 | | | 241,215 |
Nifco, Inc. | | 10,400 | | | 239,902 |
Valeo SA(e) | | 5,000 | | | 178,230 |
Westport Innovations, Inc. (acquired 9/15/04, cost $10,162)(e)(f) | | 2,086 | | | 34,320 |
| | | | | |
| | | | | 2,622,817 |
| | | | | |
Automobiles — 0.3% | | | | | |
Astra International Tbk PT | | 134,500 | | | 617,958 |
Dongfeng Motor Group Co. Ltd. - H Shares | | 172,700 | | | 280,030 |
Toyota Motor Corp. | | 22,000 | | | 884,606 |
| | | | | |
| | | | | 1,782,594 |
| | | | | |
Beverages — 0.7% | | | | | |
Britvic Plc | | 52,400 | | | 368,367 |
The Coca-Cola Co. | | 37,323 | | | 2,052,765 |
Coca-Cola Enterprises, Inc. | | 10,050 | | | 277,983 |
Constellation Brands, Inc. - Class A(e) | | 19,460 | | | 319,922 |
Heckmann Corp.(e) | | 39,500 | | | 229,100 |
Molson Coors Brewing Co. - Class B | | 6,500 | | | 273,390 |
PepsiCo, Inc. | | 4,280 | | | 283,165 |
| | | | | |
| | | | | 3,804,692 |
| | | | | |
Biotechnology — 0.9% | | | | | |
Allos Therapeutics, Inc.(e) | | 3,000 | | | 22,290 |
Amgen, Inc.(e) | | 35,350 | | | 2,112,516 |
Amylin Pharmaceuticals, Inc.(e) | | 5,900 | | | 132,691 |
BioMarin Pharmaceutical, Inc.(e) | | 1,900 | | | 44,403 |
Cubist Pharmaceuticals, Inc.(e) | | 6,800 | | | 153,272 |
Dendreon Corp.(e) | | 11,000 | | | 401,170 |
Genzyme Corp.(e) | | 2,700 | | | 139,941 |
Gilead Sciences, Inc.(e) | | 29,050 | | | 1,321,194 |
Incyte Corp. Ltd.(e) | | 2,300 | | | 32,108 |
InterMune, Inc.(e) | | 2,700 | | | 120,339 |
Onyx Pharmaceuticals, Inc.(e) | | 5,200 | | | 157,456 |
OSI Pharmaceuticals, Inc.(e) | | 2,900 | | | 172,695 |
United Therapeutics Corp.(e) | | 1,600 | | | 88,528 |
Vanda Pharmaceuticals, Inc.(e) | | 5,800 | | | 66,932 |
| | | | | |
| | | | | 4,965,535 |
| | | | | |
Building Products — 0.3% | | | | | |
Asahi Glass Co. Ltd. | | 43,700 | | | 492,902 |
KCC Corp. | | 1,100 | | | 344,376 |
Masco Corp. | | 30,100 | | | 467,152 |
Owens Corning(e) | | 10,500 | | | 267,120 |
| | | | | |
| | | | | 1,571,550 |
| | | | | |
Capital Markets — 1.4% | | | | | |
Ameriprise Financial, Inc. | | 4,483 | | | 203,349 |
Daishin Securities Co. Ltd.(e) | | 10,600 | | | 147,372 |
F&C Asset Management Plc | | 126,600 | | | 119,411 |
Financial Engines, Inc.(e) | | 1,200 | | | 20,280 |
Franklin Resources, Inc. | | 1,850 | | | 205,165 |
The Goldman Sachs Group, Inc. | | 15,125 | | | 2,580,779 |
Greenhill & Co., Inc. | | 2,900 | | | 238,061 |
Invesco Ltd. | | 27,188 | | | 595,689 |
Matsui Securities Co. Ltd. | | 35,100 | | | 251,375 |
MF Global Holdings Ltd.(e) | | 1,400 | | | 11,298 |
Mizuho Securities Co. Ltd.(e) | | 137,400 | | | 435,069 |
Morgan Stanley | | 7,600 | | | 222,604 |
Nomura Holdings, Inc. | | 132,900 | | | 975,173 |
Northern Trust Corp. | | 3,300 | | | 182,358 |
Och-Ziff Capital Management Group LLC - Class A | | 4,800 | | | 76,800 |
Polaris Securities Co. Ltd.(e) | | 393,212 | | | 204,408 |
Schroders Plc | | 11,600 | | | 247,799 |
SWS Group, Inc. | | 10,400 | | | 119,912 |
Treasure Island Royalty Trust(e) | | 217,129 | | | 227,986 |
UBS AG(e) | | 52,124 | | | 847,948 |
Yuanta Financial Holding Co. Ltd. | | 252,800 | | | 151,667 |
| | | | | |
| | | | | 8,064,503 |
| | | | | |
Chemicals — 2.1% | | | | | |
Agrium, Inc. | | 5,750 | | | 406,122 |
Air Water, Inc. | | 96,500 | | | 1,105,582 |
Airgas, Inc. | | 3,450 | | | 219,489 |
Albemarle Corp. | | 5,700 | | | 242,991 |
Ashland, Inc. | | 13,554 | | | 715,245 |
Cabot Corp. | | 11,900 | | | 361,760 |
Celanese Corp. - Series A | | 7,900 | | | 251,615 |
Clariant AG(e) | | 34,800 | | | 442,982 |
Cytec Industries, Inc. | | 9,500 | | | 444,030 |
The Dow Chemical Co. | | 4,254 | | | 125,791 |
Eastman Chemical Co. | | 12,750 | | | 811,920 |
Ecolab, Inc. | | 12,600 | | | 553,770 |
FMC Corp. | | 4,650 | | | 281,511 |
Georgia Gulf Corp.(e) | | 1,700 | | | 31,433 |
Huntsman Corp. | | 45,200 | | | 544,660 |
Hyosung Corp. | | 3,710 | | | 266,626 |
Intrepid Potash, Inc.(e) | | 3,900 | | | 118,287 |
Lanxess AG | | 9,900 | | | 455,947 |
The Lubrizol Corp. | | 10,500 | | | 963,060 |
PPG Industries, Inc. | | 10,700 | | | 699,780 |
Rhodia SA(e) | | 11,000 | | | 227,146 |
RPM International, Inc. | | 12,900 | | | 275,286 |
Shin-Etsu Chemical Co. Ltd. | | 7,800 | | | 453,933 |
Symrise AG | | 10,200 | | | 241,718 |
Syngenta AG | | 3,011 | | | 836,091 |
Yara International ASA | | 4,800 | | | 208,686 |
Zeon Corp. | | 93,300 | | | 545,566 |
| | | | | |
| | | | | 11,831,027 |
| | | | | |
Commercial Banks — 2.0% | | | | | |
Associated Banc-Corp. | | 23,400 | | | 322,920 |
Bangkok Bank Public Co. Ltd. | | 38,000 | | | 148,799 |
Bank Central Asia Tbk PT | | 982,000 | | | 592,457 |
The Bank of Yokohama Ltd. | | 31,000 | | | 152,116 |
The Chiba Bank Ltd. | | 25,400 | | | 152,080 |
China Construction Bank Corp. - Class H | | 571,000 | | | 466,813 |
City National Corp. | | 3,000 | | | 161,910 |
Credit Agricole SA | | 43,102 | | | 752,911 |
DBS Group Holdings Ltd. | | 114,660 | | | 1,169,046 |
Fifth Third Bancorp | | 34,975 | | | 475,310 |
HSBC Holdings Plc | | 120,442 | | | 1,220,546 |
Itau UniBanco Holding SA - ADR | | 24,025 | | | 528,310 |
KeyCorp | | 39,300 | | | 304,575 |
Mega Financial Holding Co. Ltd. | | 264,400 | | | 153,278 |
National Bank of Canada | | 4,400 | | | 267,903 |
Standard Chartered Plc | | 31,829 | | | 867,572 |
TCF Financial Corp. | | 20,100 | | | 320,394 |
U.S. Bancorp | | 13,475 | | | 348,733 |
Union Bank of India | | 50,000 | | | 324,822 |
Unione di Banche Italiane ScpA | | 10,300 | | | 138,935 |
See Notes to Financial Statements.
| | | | | | |
| | | BLACKROCK ASSET ALLOCATION PORTFOLIO | | MARCH 31, 2010 | | 9 |
| | |
| Schedule of Investments (continued) |
| | (Percentages shown are based on Net Assets) |
| | | | | |
| | | Shares | | Value |
Common Stocks | | | | | |
Commercial Banks (concluded) | | | | | |
Wells Fargo & Co. | | 65,075 | | $ | 2,025,134 |
Wing Hang Bank Ltd. | | 13,600 | | | 124,247 |
Zions Bancorporation(g) | | 11,250 | | | 245,475 |
| | | | | |
| | | | | 11,264,286 |
| | | | | |
Commercial Services & Supplies — 0.6% | | | | | |
Alexco Resource Corp.(e) | | 17,322 | | | 59,765 |
Babcock International Group Plc | | 63,200 | | | 577,815 |
Clean Harbors, Inc.(e) | | 1,600 | | | 88,896 |
Corrections Corp. of America(e) | | 13,500 | | | 268,110 |
Mitie Group Plc | | 63,700 | | | 221,225 |
R.R. Donnelley & Sons Co. | | 27,900 | | | 595,665 |
Rentokil Initial Plc(e) | | 423,911 | | | 840,936 |
Republic Services, Inc. | | 6,650 | | | 192,983 |
RPS Group Plc | | 90,000 | | | 279,752 |
SYKES Enterprises, Inc.(e) | | 8,348 | | | 190,668 |
VT Group Plc | | 12,200 | | | 138,792 |
| | | | | |
| | | | | 3,454,607 |
| | | | | |
Communications Equipment — 1.1% | | | | | |
Alcatel-Lucent - ADR(e) | | 67,200 | | | 209,664 |
Calix, Inc.(e) | | 1,500 | | | 20,175 |
Ciena Corp.(e) | | 9,500 | | | 144,780 |
Cisco Systems, Inc.(e) | | 67,291 | | | 1,751,585 |
F5 Networks, Inc.(e) | | 9,300 | | | 572,043 |
Harris Corp. | | 3,771 | | | 179,085 |
Juniper Networks, Inc.(e) | | 3,300 | | | 101,244 |
Meru Networks, Inc.(e) | | 700 | | | 13,419 |
Nokia Oyj | | 55,336 | | | 862,367 |
QUALCOMM, Inc. | | 38,277 | | | 1,607,251 |
Telefonaktiebolaget LM Ericsson - B Shares | | 78,503 | | | 823,184 |
| | | | | |
| | | | | 6,284,797 |
| | | | | |
Computers & Peripherals — 2.3% | | | | | |
Apple, Inc.(e) | | 20,934 | | | 4,918,025 |
Dell, Inc.(e) | | 21,900 | | | 328,719 |
EMC Corp.(e) | | 23,500 | | | 423,940 |
Hewlett-Packard Co. | | 52,225 | | | 2,775,759 |
International Business Machines Corp. | | 7,275 | | | 933,019 |
Lexmark International, Inc. - Class A(e) | | 16,800 | | | 606,144 |
NetApp, Inc.(e) | | 37,100 | | | 1,207,976 |
Seagate Technology(e) | | 47,600 | | | 869,176 |
Western Digital Corp.(e) | | 27,146 | | | 1,058,422 |
| | | | | |
| | | | | 13,121,180 |
| | | | | |
Construction & Engineering — 0.2% | | | | | |
Chicago Bridge & Iron Co. NV(e) | | 4,600 | | | 106,996 |
FLSmidth & Co. A/S | | 6,700 | | | 464,037 |
Jacobs Engineering Group, Inc.(e) | | 4,700 | | | 212,393 |
Quanta Services, Inc.(e) | | 13,100 | | | 250,996 |
The Shaw Group, Inc.(e) | | 3,266 | | | 112,416 |
URS Corp.(e) | | 1,500 | | | 74,415 |
| | | | | |
| | | | | 1,221,253 |
| | | | | |
Construction Materials — 0.2% | | | | | |
Fletcher Building Ltd. | | 80,258 | | | 475,413 |
HeidelbergCement AG | | 6,686 | | | 372,152 |
Italcementi SpA | | 16,500 | | | 190,743 |
| | | | | |
| | | | | 1,038,308 |
| | | | | |
Consumer Finance — 0.3% | | | | | |
American Express Co. | | 5,375 | | | 221,772 |
AmeriCredit Corp.(e) | | 13,000 | | | 308,880 |
Capital One Financial Corp. | | 20,400 | | | 844,764 |
Discover Financial Services | | 12,125 | | | 180,663 |
Dollar Financial Corp.(e) | | 9,800 | | | 235,788 |
SLM Corp.(e) | | 9,900 | | | 123,948 |
| | | | | |
| | | | | 1,915,815 |
| | | | | |
Containers & Packaging — 0.3% | | | | | |
Bemis Co., Inc. | | 11,700 | | | 336,024 |
BWAY Holding Co.(e) | | 4,300 | | | 86,430 |
DS Smith Plc | | 155,200 | | | 317,390 |
Owens-Illinois, Inc.(e) | | 18,520 | | | 658,201 |
Pactiv Corp.(e) | | 14,900 | | | 375,182 |
Sealed Air Corp. | | 8,700 | | | 183,396 |
| | | | | |
| | | | | 1,956,623 |
| | | | | |
Distributors — 0.1% | | | | | |
CFAO SA(e) | | 14,417 | | | 537,244 |
Inchcape Plc(e) | | 456,800 | | | 204,331 |
| | | | | |
| | | | | 741,575 |
| | | | | |
Diversified Consumer Services — 0.1% | | | | | |
DeVry, Inc. | | 2,800 | | | 182,560 |
Grand Canyon Education, Inc.(e) | | 6,200 | | | 162,068 |
H&R Block, Inc. | | 10,600 | | | 188,680 |
| | | | | |
| | | | | 533,308 |
| | | | | |
Diversified Financial Services — 1.2% | | | | | |
Bank of America Corp. | | 56,450 | | | 1,007,633 |
Citigroup, Inc.(e) | | 22,048 | | | 89,294 |
CME Group, Inc. | | 800 | | | 252,888 |
Deutsche Boerse AG | | 2,600 | | | 192,370 |
IntercontinentalExchange, Inc.(e) | | 2,000 | | | 224,360 |
Investor AB - B Shares(e) | | 42,070 | | | 806,611 |
JPMorgan Chase & Co. | | 47,425 | | | 2,122,269 |
London Stock Exchange Group Plc | | 13,400 | | | 144,489 |
Moody’s Corp. | | 26,200 | | | 779,450 |
MSCI, Inc. - Class A(e) | | 4,150 | | | 149,815 |
NYSE Euronext | | 13,500 | | | 399,735 |
PHH Corp.(e) | | 15,500 | | | 365,335 |
Pohjola Bank Plc | | 15,100 | | | 169,461 |
| | | | | |
| | | | | 6,703,710 |
| | | | | |
Diversified Telecommunication Services — 0.8% | | | | | |
AT&T, Inc. | | 39,667 | | | 1,024,995 |
BT Group Plc | | 260,251 | | | 488,518 |
Cbeyond, Inc.(e) | | 8,300 | | | 113,544 |
CenturyTel, Inc. | | 4,932 | | | 174,889 |
Koninklijke KPN NV | | 48,708 | | | 772,949 |
Telecom Corp. of New Zealand Ltd. | | 121,600 | | | 186,997 |
Verizon Communications, Inc. | | 50,819 | | | 1,576,405 |
Vimpel-Communications - ADR | | 11,100 | | | 204,351 |
| | | | | |
| | | | | 4,542,648 |
| | | | | |
Electric Utilities — 0.5% | | | | | |
American Electric Power Co., Inc. | | 3,650 | | | 124,757 |
Companhia Energetica de Minas Gerais - CEMIG - ADR | | 19,191 | | | 319,338 |
E.ON AG | | 24,894 | | | 920,351 |
Edison International | | 16,375 | | | 559,534 |
Entergy Corp. | | 4,610 | | | 375,024 |
Northeast Utilities | | 11,550 | | | 319,242 |
See Notes to Financial Statements.
| | | | | | |
| 10 | | BLACKROCK ASSET ALLOCATION PORTFOLIO | | MARCH 31, 2010 | | |
| | |
| Schedule of Investments (continued) |
| | (Percentages shown are based on Net Assets) |
| | | | | |
| | | Shares | | Value |
Common Stocks | | | | | |
Electric Utilities (concluded) | | | | | |
Westar Energy, Inc. | | 5,800 | | $ | 129,340 |
| | | | | |
| | | | | 2,747,586 |
| | | | | |
Electrical Equipment — 0.3% | | | | | |
Alstom SA | | 8,850 | | | 551,037 |
AMETEK, Inc. | | 5,800 | | | 240,468 |
Cooper Industries Plc - Class A | | 5,700 | | | 273,258 |
GT Solar International, Inc.(e) | | 7,000 | | | 36,610 |
Hubbell, Inc. - Class B | | 1,900 | | | 95,817 |
ITM Power Plc(e) | | 12,000 | | | 3,608 |
Thomas & Betts Corp.(e) | | 9,300 | | | 364,932 |
Tognum AG | | 20,500 | | | 385,601 |
| | | | | |
| | | | | 1,951,331 |
| | | | | |
Electronic Equipment, Instruments & Components — 0.8% | | | | | |
Amphenol Corp. - Class A | | 5,900 | | | 248,921 |
Anixter International, Inc.(e) | | 5,429 | | | 254,349 |
Arrow Electronics, Inc.(e) | | 5,925 | | | 178,520 |
AU Optronics Corp. - ADR | | 27,269 | | | 308,958 |
Cogent, Inc.(e) | | 21,925 | | | 223,635 |
FUJIFILM Holdings Corp. | | 21,400 | | | 737,136 |
Hitachi Ltd.(e) | | 224,000 | | | 833,417 |
Hollysys Automation Technologies Ltd.(e) | | 12,400 | | | 142,724 |
Jabil Circuit, Inc. | | 13,225 | | | 214,113 |
Nidec Corp. | | 2,000 | | | 214,444 |
Tech Data Corp.(e) | | 15,790 | | | 661,601 |
Tyco Electronics Ltd. | | 6,125 | | | 168,315 |
Venture Corp. Ltd. | | 35,000 | | | 217,867 |
| | | | | |
| | | | | 4,404,000 |
| | | | | |
Energy Equipment & Services — 1.5% | | | | | |
AMEC Plc | | 18,000 | | | 218,242 |
Atwood Oceanics, Inc.(e) | | 15,200 | | | 526,376 |
Baker Hughes, Inc. | | 4,600 | | | 215,464 |
ENSCO International Plc - ADR | | 1,600 | | | 71,648 |
Halliburton Co. | | 19,130 | | | 576,387 |
Nabors Industries Ltd.(e) | | 10,075 | | | 197,772 |
National Oilwell Varco, Inc. | | 16,600 | | | 673,628 |
Noble Corp.(e) | | 15,418 | | | 644,781 |
Oil States International, Inc.(e) | | 13,500 | | | 612,090 |
Rowan Cos., Inc.(e) | | 25,900 | | | 753,949 |
Schlumberger Ltd. | | 29,747 | | | 1,887,745 |
SEACOR Holdings, Inc.(e) | | 4,800 | | | 387,168 |
Superior Energy Services, Inc.(e) | | 13,305 | | | 279,671 |
Technicoil Corp.(e) | | 12,900 | | | 7,621 |
Technicoil Corp. (acquired 6/15/04, cost $24,418)(e)(f) | | 33,500 | | | 19,790 |
Tidewater, Inc. | | 12,500 | | | 590,875 |
Transocean Ltd.(e) | | 5,456 | | | 471,289 |
Weatherford International Ltd.(e) | | 13,100 | | | 207,766 |
Xtreme Coil Drilling Corp.(e) | | 11,200 | | | 43,889 |
| | | | | |
| | | | | 8,386,151 |
| | | | | |
Food & Staples Retailing — 0.8% | | | | | |
Casino Guichard Perrachon SA | | 3,100 | | | 261,997 |
The Kroger Co. | | 8,400 | | | 181,944 |
Safeway, Inc. | | 22,380 | | | 556,367 |
Tesco Plc | | 112,521 | | | 743,939 |
Walgreen Co. | | 2,700 | | | 100,143 |
Wal-Mart Stores, Inc. | | 33,036 | | | 1,836,801 |
Whole Foods Market, Inc.(e) | | 17,500 | | | 632,625 |
| | | | | |
| | | | | 4,313,816 |
| | | | | |
Food Products — 1.4% | | | | | |
American Italian Pasta Co. - Class A(e) | | 4,000 | | | 155,480 |
Aryzta AG | | 6,600 | | | 289,100 |
Associated British Foods Plc | | 55,587 | | | 826,119 |
Barry Callebaut AG(e) | | 200 | | | 129,001 |
ConAgra Foods, Inc. | | 24,800 | | | 621,736 |
Corn Products International, Inc. | | 5,047 | | | 174,929 |
Dean Foods Co.(e) | | 4,500 | | | 70,605 |
Del Monte Foods Co. | | 61,696 | | | 900,762 |
Diamond Foods, Inc. | | 3,300 | | | 138,732 |
General Mills, Inc. | | 1,900 | | | 134,501 |
Greencore Group Plc | | 121,900 | | | 229,268 |
The Hershey Co. | | 600 | | | 25,686 |
The J.M. Smucker Co. | | 4,000 | | | 241,040 |
Marine Harvest ASA(e) | | 342,200 | | | 304,206 |
Nestle SA | | 37,015 | | | 1,896,723 |
Nong Shim Co. Ltd. | | 1,100 | | | 220,802 |
Nutreco Holding NV | | 4,900 | | | 308,622 |
Parmalat SpA | | 86,500 | | | 236,948 |
Sara Lee Corp. | | 54,775 | | | 763,016 |
Tyson Foods, Inc. - Class A | | 12,750 | | | 244,163 |
Viscofan SA | | 11,900 | | | 312,288 |
| | | | | |
| | | | | 8,223,727 |
| | | | | |
Gas Utilities — 0.4% | | | | | |
Atmos Energy Corp. | | 9,000 | | | 257,130 |
Energen Corp. | | 4,228 | | | 196,729 |
EQT Corp. | | 19,670 | | | 806,470 |
ONEOK, Inc. | | 5,225 | | | 238,521 |
Questar Corp. | | 9,880 | | | 426,816 |
UGI Corp. | | 16,500 | | | 437,910 |
| | | | | |
| | | | | 2,363,576 |
| | | | | |
Health Care Equipment & Supplies — 1.5% | | | | | |
Ansell Ltd. | | 36,971 | | | 411,104 |
Becton, Dickinson & Co. | | 2,900 | | | 228,317 |
Boston Scientific Corp.(e) | | 15,000 | | | 108,300 |
CareFusion Corp.(e) | | 5,700 | | | 150,651 |
China Medical Technologies, Inc. - ADR | | 6,300 | | | 85,806 |
Cie Generale d’Optique Essilor International SA | | 9,795 | | | 625,508 |
The Cooper Cos., Inc. | | 4,548 | | | 176,826 |
Elekta AB - B Shares | | 8,700 | | | 242,992 |
Gen-Probe, Inc.(e) | | 7,000 | | | 350,000 |
Getinge AB - B Shares | | 9,200 | | | 220,597 |
Haemonetics Corp.(e) | | 800 | | | 45,720 |
Hologic, Inc.(e) | | 12,400 | | | 229,896 |
Hospira, Inc.(e) | | 3,450 | | | 195,442 |
Inverness Medical Innovations, Inc.(e) | | 10,800 | | | 420,660 |
Kinetic Concepts, Inc.(e) | | 18,200 | | | 870,142 |
Merit Medical Systems, Inc.(e) | | 800 | | | 12,200 |
Mindray Medical International Ltd. - ADR | | 7,000 | | | 254,940 |
ResMed, Inc. - CDI(e) | | 49,600 | | | 318,608 |
Sirona Dental Systems, Inc.(e) | | 11,200 | | | 425,936 |
Smith & Nephew Plc | | 32,400 | | | 323,546 |
SonoSite, Inc.(e) | | 4,925 | | | 158,142 |
Sonova Holding AG | | 3,200 | | | 397,186 |
St. Jude Medical, Inc.(e) | | 24,500 | | | 1,005,725 |
See Notes to Financial Statements.
| | | | | | |
| | | BLACKROCK ASSET ALLOCATION PORTFOLIO | | MARCH 31, 2010 | | 11 |
| | |
| Schedule of Investments (continued) |
| | (Percentages shown are based on Net Assets) |
| | | | | |
| | | Shares | | Value |
Common Stocks | | | | | |
Health Care Equipment & Supplies (concluded) | | | | | |
Zimmer Holdings, Inc.(e) | | 23,000 | | $ | 1,361,600 |
| | | | | |
| | | | | 8,619,844 |
| | | | | |
Health Care Providers & Services — 2.1% | | | | | |
Aetna, Inc. | | 7,300 | | | 256,303 |
AmerisourceBergen Corp. | | 19,700 | | | 569,724 |
Cardinal Health, Inc. | | 26,125 | | | 941,284 |
Community Health Systems, Inc.(e) | | 14,900 | | | 550,257 |
Coventry Health Care, Inc.(e) | | 23,500 | | | 580,920 |
Emergency Medical Services Corp. - Class A(e) | | 2,600 | | | 147,030 |
Express Scripts, Inc.(e) | | 15,900 | | | 1,617,984 |
Fresenius Medical Care AG & Co. KGaA | | 4,900 | | | 276,082 |
HealthSouth Corp.(e) | | 10,900 | | | 203,830 |
Humana, Inc.(e) | | 13,800 | | | 645,426 |
Lincare Holdings, Inc.(e) | | 20,200 | | | 906,576 |
Magellan Health Services, Inc.(e) | | 3,500 | | | 152,180 |
McKesson Corp. | | 13,800 | | | 906,936 |
Medco Health Solutions, Inc.(e) | | 4,000 | | | 258,240 |
MEDNAX, Inc.(e) | | 7,280 | | | 423,623 |
Rhoen-Klinikum AG | | 3,200 | | | 81,895 |
UnitedHealth Group, Inc. | | 38,975 | | | 1,273,313 |
Universal Health Services, Inc. - Class B | | 18,150 | | | 636,883 |
WellPoint, Inc.(e) | | 21,090 | | | 1,357,774 |
| | | | | |
| | | | | 11,786,260 |
| | | | | |
Health Care Technology — 0.2% | | | | | |
Cerner Corp.(e)(g) | | 11,600 | | | 986,696 |
MedAssets, Inc.(e) | | 5,700 | | | 119,700 |
Phase Forward, Inc.(e) | | 6,300 | | | 82,341 |
| | | | | |
| | | | | 1,188,737 |
| | | | | |
Hotels, Restaurants & Leisure — 1.4% | | | | | |
7 Days Group Holdings Ltd. - ADR(e) | | 16,800 | | | 174,552 |
Aristocrat Leisure Ltd. | | 40,900 | | | 169,704 |
Bally Technologies, Inc.(e) | | 10,500 | | | 425,670 |
Brinker International, Inc. | | 6,950 | | | 133,996 |
Burger King Holdings, Inc. | | 3,500 | | | 74,410 |
The Cheesecake Factory, Inc.(e) | | 2,500 | | | 67,650 |
Darden Restaurants, Inc. | | 20,875 | | | 929,773 |
Domino’s Pizza UK & IRL Plc | | 34,900 | | | 178,953 |
Fu Ji Food & Catering Services Holdings Ltd.(e) | | 208,300 | | | 268 |
Home Inns & Hotels Management, Inc. - ADR(e) | | 5,400 | | | 176,796 |
InterContinental Hotels Group Plc | | 23,318 | | | 364,999 |
Jack in the Box, Inc.(e) | | 3,400 | | | 80,070 |
Las Vegas Sands Corp.(e)(g) | | 42,500 | | | 898,875 |
McDonald’s Corp. | | 2,625 | | | 175,140 |
Melco Crown Entertainment Ltd. - ADR(e) | | 58,400 | | | 281,488 |
P.F. Chang’s China Bistro, Inc.(e) | | 1,100 | | | 48,543 |
PartyGaming Plc(e) | | 66,700 | | | 324,103 |
Penn National Gaming, Inc.(e) | | 6,800 | | | 189,040 |
REXLot Holdings Ltd. | | 2,634,700 | | | 376,269 |
Scientific Games Corp. - Class A(e) | | 54,700 | | | 770,176 |
Starbucks Corp. | | 35,700 | | | 866,439 |
Starwood Hotels & Resorts Worldwide, Inc. | | 24,400 | | | 1,138,016 |
Whitbread Plc | | 10,500 | | | 235,065 |
| | | | | |
| | | | | 8,079,995 |
| | | | | |
Household Durables — 0.3% | | | | | |
Garmin Ltd. | | 5,700 | | | 219,336 |
Harman International Industries, Inc.(e) | | 4,800 | | | 224,544 |
Lennar Corp. - Class A | | 7,150 | | | 123,051 |
MDC Holdings, Inc. | | 5,800 | | | 200,738 |
Newell Rubbermaid, Inc. | | 15,575 | | | 236,740 |
Stanley Black & Decker, Inc. | | 4,300 | | | 246,863 |
Whirlpool Corp. | | 2,879 | | | 251,193 |
| | | | | |
| | | | | 1,502,465 |
| | | | | |
Household Products — 0.6% | | | | | |
Church & Dwight Co., Inc. | | 3,600 | | | 241,020 |
Kimberly-Clark Corp. | | 3,450 | | | 216,936 |
The Procter & Gamble Co. | | 44,780 | | | 2,833,231 |
| | | | | |
| | | | | 3,291,187 |
| | | | | |
Independent Power Producers & Energy Traders — 0.4% | | | | | |
Constellation Energy Group, Inc. | | 20,975 | | | 736,432 |
International Power Plc | | 67,500 | | | 327,750 |
Mirant Corp.(e) | | 35,000 | | | 380,100 |
NRG Energy, Inc.(e) | | 36,160 | | | 755,744 |
| | | | | |
| | | | | 2,200,026 |
| | | | | |
Industrial Conglomerates — 0.5% | | | | | |
3M Co. | | 2,100 | | | 175,497 |
Carlisle Cos., Inc. | | 5,800 | | | 220,980 |
General Electric Co. | | 79,175 | | | 1,440,985 |
Keppel Corp. Ltd. | | 142,000 | | | 924,894 |
Textron, Inc. | | 6,500 | | | 137,995 |
Tyco International Ltd. | | 3,725 | | | 142,481 |
| | | | | |
| | | | | 3,042,832 |
| | | | | |
Insurance — 2.3% | | | | | |
ACE Ltd. | | 2,825 | | | 147,747 |
Aegon NV(e) | | 44,000 | | | 300,363 |
AFLAC, Inc. | | 3,775 | | | 204,945 |
Allianz SE | | 9,873 | | | 1,235,682 |
Allied World Assurance Co. Holdings Ltd. | | 6,500 | | | 291,525 |
The Allstate Corp. | | 5,525 | | | 178,513 |
American Financial Group, Inc. | | 22,600 | | | 642,970 |
AON Corp. | | 3,800 | | | 162,298 |
Aspen Insurance Holdings Ltd. | | 3,200 | | | 92,288 |
Assurant, Inc. | | 18,000 | | | 618,840 |
AXIS Capital Holdings Ltd. | | 10,810 | | | 337,921 |
Berkshire Hathaway, Inc. - Class B(e) | | 2,210 | | | 179,607 |
Catlin Group Ltd. | | 18,120 | | | 99,083 |
Endurance Specialty Holdings Ltd. | | 10,700 | | | 397,505 |
Everest Re Group Ltd. | | 4,700 | | | 380,371 |
Flagstone Reinsurance Holdings Ltd. | | 16,600 | | | 190,236 |
Fondiaria-Sai SpA | | 16,900 | | | 253,920 |
The Hanover Insurance Group, Inc. | | 7,587 | | | 330,869 |
The Hartford Financial Services Group, Inc. | | 6,050 | | | 171,941 |
HCC Insurance Holdings, Inc. | | 29,510 | | | 814,476 |
Legal & General Group Plc | | 204,900 | | | 273,226 |
Lincoln National Corp. | | 7,800 | | | 239,460 |
Loews Corp. | | 23,300 | | | 868,624 |
PICC Property & Casualty Co. Ltd. - H Shares(e) | | 254,600 | | | 258,840 |
Primerica, Inc.(e) | | 2,400 | | | 36,000 |
Prudential Financial, Inc. | | 5,490 | | | 332,145 |
Prudential Plc | | 66,649 | | | 551,363 |
RenaissanceRe Holdings Ltd. | | 10,256 | | | 582,131 |
Swiss Reinsurance Co. Ltd.(e) | | 6,800 | | | 333,645 |
Topdanmark A/S(e) | | 2,900 | | | 377,588 |
The Travelers Cos., Inc. | | 24,975 | | | 1,347,151 |
Unitrin Inc | | 2,600 | | | 72,930 |
Unum Group | | 18,200 | | | 450,814 |
W.R. Berkley Corp. | | 7,590 | | | 198,023 |
See Notes to Financial Statements.
| | | | | | |
| 12 | | BLACKROCK ASSET ALLOCATION PORTFOLIO | | MARCH 31, 2010 | | |
| | |
| Schedule of Investments (continued) |
| | (Percentages shown are based on Net Assets) |
| | | | | |
| | | Shares | | Value |
Common Stocks | | | | | |
Insurance (concluded) | | | | | |
XL Capital Ltd. - Class A | | 13,150 | | $ | 248,535 |
| | | | | |
| | | | | 13,201,575 |
| | | | | |
Internet & Catalog Retail — 0.5% | | | | | |
Amazon.com, Inc.(e) | | 17,550 | | | 2,382,062 |
Expedia, Inc. | | 4,600 | | | 114,816 |
Liberty Media Corp. - Interactive(e) | | 3,500 | | | 53,585 |
priceline.com, Inc.(e) | | 1,075 | | | 274,125 |
Shutterfly, Inc.(e) | | 4,200 | | | 101,178 |
| | | | | |
| | | | | 2,925,766 |
| | | | | |
Internet Software & Services — 1.0% | | | | | |
Baidu, Inc. - ADR(e) | | 1,400 | | | 835,800 |
Constant Contact, Inc.(e) | | 3,900 | | | 90,558 |
eBay, Inc.(e) | | 2,925 | | | 78,829 |
Google, Inc. - Class A(e) | | 5,922 | | | 3,357,833 |
GSI Commerce, Inc.(e) | | 4,900 | | | 135,583 |
Open Text Corp.(e) | | 6,200 | | | 294,314 |
Tencent Holdings Ltd. | | 26,900 | | | 538,998 |
Yahoo!, Inc.(e) | | 18,800 | | | 310,764 |
| | | | | |
| | | | | 5,642,679 |
| | | | | |
IT Services — 1.0% | | | | | |
Alliance Data Systems Corp.(e)(g) | | 5,700 | | | 364,743 |
Amdocs Ltd.(e) | | 34,167 | | | 1,028,768 |
Broadridge Financial Solutions, Inc. | | 4,725 | | | 101,020 |
Cap Gemini SA | | 5,400 | | | 265,500 |
Computer Sciences Corp.(e) | | 14,400 | | | 784,656 |
Dimension Data Holdings Plc | | 151,300 | | | 209,353 |
DST Systems, Inc. | | 3,700 | | | 153,365 |
ExlService Holdings, Inc.(e) | | 13,498 | | | 225,147 |
Fidelity National Information Services, Inc. | | 9,700 | | | 227,368 |
Gartner, Inc.(e) | | 20,600 | | | 458,144 |
Genpact Ltd.(e) | | 18,700 | | | 313,599 |
Global Cash Access Holdings, Inc.(e) | | 22,800 | | | 186,276 |
Lender Processing Services, Inc. | | 13,100 | | | 494,525 |
Mastercard, Inc. - Class A | | 3,000 | | | 762,000 |
Sapient Corp. | | 16,100 | | | 147,154 |
| | | | | |
| | | | | 5,721,618 |
| | | | | |
Leisure Equipment & Products — 0.1% | | | | | |
Mattel, Inc. | | 18,800 | | | 427,512 |
| | | | | |
Life Sciences Tools & Services — 0.5% | | | | | |
Bruker Corp.(e) | | 5,300 | | | 77,645 |
Covance, Inc.(e) | | 15,000 | | | 920,850 |
ICON Plc - ADR(e) | | 5,700 | | | 150,480 |
Life Technologies Corp.(e) | | 15,100 | | | 789,277 |
PerkinElmer, Inc. | | 7,100 | | | 169,690 |
Thermo Fisher Scientific, Inc.(e) | | 9,900 | | | 509,256 |
| | | | | |
| | | | | 2,617,198 |
| | | | | |
Machinery — 2.6% | | | | | |
Amada Co. Ltd. | | 52,200 | | | 438,368 |
Caterpillar, Inc. | | 1,226 | | | 77,054 |
Cummins, Inc. | | 17,000 | | | 1,053,150 |
Danaher Corp. | | 29,000 | | | 2,317,390 |
Eaton Corp. | | 13,250 | | | 1,003,952 |
GEA Group AG | | 22,600 | | | 523,525 |
Harsco Corp. | | 2,800 | | | 89,432 |
Hino Motors Ltd.(e) | | 104,600 | | | 442,270 |
Ingersoll-Rand Plc | | 5,125 | | | 178,709 |
Joy Global, Inc. | | 30,300 | | | 1,714,980 |
The Manitowoc Co., Inc. | | 28,600 | | | 371,800 |
Metso Oyj | | 11,800 | | | 380,841 |
Nabtesco Corp. | | 36,400 | | | 486,057 |
Navistar International Corp.(e) | | 3,000 | | | 134,190 |
NSK Ltd. | | 64,000 | | | 506,214 |
NTN Corp. | | 110,700 | | | 500,772 |
PACCAR, Inc. | | 32,500 | | | 1,408,550 |
Parker Hannifin Corp. | | 14,800 | | | 958,152 |
Pentair, Inc. | | 7,000 | | | 249,340 |
Railpower Technologies Corp.(e) | | 17,600 | | | — |
SPX Corp. | | 8,100 | | | 537,192 |
Sumitomo Heavy Industries Ltd. | | 67,000 | | | 404,253 |
Terex Corp.(e) | | 15,500 | | | 352,005 |
Timken Co. | | 21,883 | | | 656,709 |
Trinity Industries, Inc. | | 7,000 | | | 139,720 |
| | | | | |
| | | | | 14,924,625 |
| | | | | |
Media — 1.5% | | | | | |
Aegis Group Plc | | 136,300 | | | 263,552 |
Cablevision Systems Corp. - Class A | | 14,400 | | | 347,616 |
CBS Corp. - Class B | | 63,300 | | | 882,402 |
CKX, Inc.(e) | | 73,750 | | | 452,088 |
Comcast Corp. - Class A | | 86,375 | | | 1,625,578 |
DIRECTV - Class A(e) | | 7,000 | | | 236,670 |
DISH Network Corp. - Class A | | 6,600 | | | 137,412 |
DreamWorks Animation SKG, Inc. - Class A(e) | | 7,450 | | | 293,456 |
Focus Media Holding Ltd. - ADR(e) | | 10,600 | | | 193,556 |
The Interpublic Group of Cos., Inc.(e) | | 41,900 | | | 348,608 |
Liberty Global, Inc. - Class A(e) | | 9,500 | | | 277,020 |
Live Nation Entertainment, Inc.(e) | | 12,200 | | | 176,900 |
The McGraw-Hill Cos., Inc. | | 3,850 | | | 137,252 |
Naspers Ltd. - N Shares | | 6,200 | | | 268,824 |
News Corp. - Class A | | 17,625 | | | 253,976 |
Reed Elsevier NV | | 15,200 | | | 184,466 |
SES SA | | 36,343 | | | 909,220 |
Time Warner Cable, Inc. | | 1,771 | | | 94,412 |
Time Warner, Inc. | | 11,208 | | | 350,474 |
Viacom, Inc. - Class B(e) | | 9,750 | | | 335,205 |
Wolters Kluwer NV | | 11,400 | | | 246,985 |
Woongjin Thinkbig Co. Ltd. | | 20,570 | | | 457,710 |
| | | | | |
| | | | | 8,473,382 |
| | | | | |
Metals & Mining — 1.8% | | | | | |
Agnico-Eagle Mines Ltd. | | 5,200 | | | 289,484 |
Archipelago Resources Plc(e) | | 78,900 | | | 43,520 |
Baja Mining Corp.(e) | | 59,300 | | | 47,293 |
BHP Billiton Plc | | 50,582 | | | 1,728,790 |
Century Aluminum Co.(e) | | 18,634 | | | 256,404 |
Crosshair Exploration & Mining Corp.(e) | | 5,600 | | | 1,048 |
Crosshair Exploration & Mining Corp. (acquired 4/01/08, cost $6,372)(e)(f) | | 5,300 | | | 991 |
Eldorado Gold Corp.(e) | | 53,262 | | | 646,601 |
Eramet SA | | 1,250 | | | 428,853 |
European Goldfields Ltd.(e) | | 12,100 | | | 83,276 |
Freeport-McMoRan Copper & Gold, Inc. | | 21,632 | | | 1,807,137 |
Gold Reserve, Inc.(e) | | 26,280 | | | 28,645 |
Grande Cache Coal Corp.(e) | | 31,200 | | | 253,741 |
Hidili Industry International Development Ltd.(e) | | 323,100 | | | 350,704 |
Kinross Gold Corp. | | 22,235 | | | 379,996 |
Lake Shore Gold Corp.(e) | | 17,719 | | | 43,964 |
| | |
See Notes to Financial Statements. | | | | | |
| | | | | | |
| | | BLACKROCK ASSET ALLOCATION PORTFOLIO | | MARCH 31, 2010 | | 13 |
| | |
| Schedule of Investments (continued) |
| | (Percentages shown are based on Net Assets) |
| | | | | |
| | | Shares | | Value |
Common Stocks | | | | | |
Metals & Mining (concluded) | | | | | |
MacArthur Coal Ltd. | | 46,100 | | $ | 593,773 |
Minefinders Corp. Ltd.(e) | | 40,000 | | | 370,400 |
Reliance Steel & Aluminum Co. | | 3,990 | | | 196,428 |
Silvercorp Metals, Inc. | | 30,900 | | | 212,054 |
Sims Metal Management Ltd. | | 12,100 | | | 238,437 |
Steel Dynamics, Inc. | | 7,175 | | | 125,347 |
Sumitomo Metal Industries Ltd. | | 141,000 | | | 427,466 |
Sunridge Gold Corp.(e) | | 146,757 | | | 65,023 |
Tambang Batubara Bukit Asam Tbk PT | | 89,200 | | | 170,197 |
Tung Ho Steel Enterprise Corp | | 172,900 | | | 196,286 |
United States Steel Corp. | | 11,900 | | | 755,888 |
Western Coal Corp.(e) | | 7,800 | | | 46,693 |
Yamana Gold, Inc. | | 23,900 | | | 236,494 |
| | | | | |
| | | | | 10,024,933 |
| | | | | |
Multiline Retail — 0.8% | | | | | |
Big Lots, Inc.(e) | | 15,900 | | | 579,078 |
Dollar Tree, Inc.(e) | | 3,575 | | | 211,712 |
Golden Eagle Retail Group Ltd. | | 91,100 | | | 181,822 |
Kohl’s Corp.(e) | | 30,302 | | | 1,659,944 |
Macy’s, Inc. | | 49,850 | | | 1,085,234 |
Mothercare Plc | | 22,200 | | | 202,247 |
Next Plc | | 5,500 | | | 180,674 |
PPR | | 1,600 | | | 212,714 |
Saks, Inc.(e) | | 26,400 | | | 227,040 |
Target Corp. | | 3,525 | | | 185,415 |
| | | | | |
| | | | | 4,725,880 |
| | | | | |
Multi-Utilities — 0.5% | | | | | |
CenterPoint Energy, Inc. | | 13,925 | | | 199,963 |
CMS Energy Corp. | | 21,800 | | | 337,028 |
DTE Energy Co. | | 19,725 | | | 879,735 |
Integrys Energy Group, Inc. | | 4,000 | | | 189,520 |
NiSource, Inc. | | 37,200 | | | 587,760 |
PG&E Corp. | | 7,600 | | | 322,392 |
Wisconsin Energy Corp. | | 5,880 | | | 290,531 |
| | | | | |
| | | | | 2,806,929 |
| | | | | |
Office Electronics — 0.2% | | | | | |
Canon, Inc. | | 23,200 | | | 1,073,122 |
Xerox Corp. | | 37,850 | | | 369,037 |
| | | | | |
| | | | | 1,442,159 |
| | | | | |
Oil, Gas & Consumable Fuels — 6.2% | | | | | |
Adaro Energy PT | | 1,032,000 | | | 221,710 |
Alpha Natural Resources, Inc.(e) | | 6,937 | | | 346,087 |
American Oil & Gas, Inc.(e) | | 10,647 | | | 72,400 |
Anadarko Petroleum Corp. | | 12,300 | | | 895,809 |
Apache Corp. | | 1,650 | | | 167,475 |
Approach Resources, Inc.(e) | | 1,700 | | | 15,436 |
Arcan Resources Ltd.(e) | | 7,500 | | | 29,685 |
Arch Coal, Inc. | | 31,700 | | | 724,345 |
Atlas Energy, Inc.(e) | | 10,000 | | | 311,200 |
ATP Oil & Gas Corp.(e) | | 4,300 | | | 80,883 |
Banpu Public Co. Ltd. | | 12,500 | | | 233,558 |
Bellatrix Exploration Ltd.(e) | | 11,382 | | | 42,361 |
BG Group Plc | | 43,149 | | | 747,246 |
Cairn Energy Plc(e) | | 113,973 | | | 721,685 |
Canadian Superior Energy, Inc.(e) | | 57,300 | | | 34,752 |
Canext Energy Ltd.(e) | | 4,020 | | | 2,058 |
Carrizo Oil & Gas, Inc.(e) | | 8,100 | | | 185,895 |
Chesapeake Energy Corp. | | 8,325 | | | 196,803 |
Chevron Corp. | | 13,400 | | | 1,016,122 |
Cimarex Energy Co. | | 5,500 | | | 326,590 |
Cinch Energy Corp. (acquired 6/07/04 through 7/07/05, cost $63,400)(e)(f) | | 40,320 | | | 53,196 |
Clayton Williams Energy, Inc.(e) | | 19,123 | | | 668,923 |
Compton Petroleum Corp.(e) | | 3,800 | | | 3,517 |
Comstock Resources, Inc.(e) | | 4,883 | | | 155,279 |
ConocoPhillips | | 32,850 | | | 1,680,934 |
CONSOL Energy, Inc. | | 34,089 | | | 1,454,237 |
Crew Energy, Inc.(e) | | 30,300 | | | 518,201 |
Crew Energy, Inc. (acquired 5/12/04, cost $36,232)(e)(f) | | 9,400 | | | 160,762 |
Daylight Resources Trust | | 51,054 | | | 528,812 |
Delphi Energy Corp.(e) | | 24,700 | | | 63,230 |
Energy XXI Bermuda Ltd.(e) | | 8,420 | | | 150,802 |
EOG Resources, Inc. | | 11,300 | | | 1,050,222 |
EXCO Resources, Inc. | | 17,500 | | | 321,650 |
Exxon Mobil Corp. | | 34,200 | | | 2,290,716 |
Fairborne Energy Ltd.(e) | | 16,182 | | | 60,703 |
Galleon Energy, Inc. - Class A(e) | | 61,017 | | | 413,929 |
Gastar Exploration Ltd.(e) | | 3,180 | | | 15,455 |
GMX Resources, Inc.(e)(g) | | 8,612 | | | 70,791 |
Goodrich Petroleum Corp.(e) | | 18,400 | | | 287,776 |
Gran Tierra Energy, Inc.(e) | | 80,800 | | | 477,330 |
Heritage Oil Plc(e) | | 40,000 | | | 340,368 |
Ithaca Energy, Inc.(e) | | 4,700 | | | 9,625 |
James River Coal Co.(e) | | 2,300 | | | 36,570 |
Longview Energy Co. (acquired 8/13/04, cost $48,000)(e)(f) | | 3,200 | | | 33,440 |
Lynden Energy Corp.(e) | | 3,500 | | | 2,585 |
Magnum Hunter Resources Corp.(e) | | 28,200 | | | 85,728 |
Marathon Oil Corp. | | 33,300 | | | 1,053,612 |
Massey Energy Co. | | 39,488 | | | 2,064,828 |
Matador Resources Co. (acquired 10/14/03 through 4/13/06, cost $62,950)(e)(f) | | 8,685 | | | 119,940 |
Midnight Oil Exploration Ltd.(e) | | 69,600 | | | 73,324 |
Midnight Oil Exploration Ltd. (acquired 12/12/05, cost $39,607)(e)(f) | | 11,600 | | | 12,221 |
Midway Energy Ltd.(e) | | 841 | | | 2,716 |
NAL Oil & Gas Trust | | 396 | | | 5,049 |
Newfield Exploration Co.(e) | | 5,785 | | | 301,109 |
Niko Resources Ltd. | | 2,000 | | | 213,322 |
Occidental Petroleum Corp. | | 3,925 | | | 331,819 |
Open Range Energy Corp.(e) | | 1,975 | | | 3,209 |
Overseas Shipholding Group, Inc. | | 4,800 | | | 188,304 |
Pacific Rodera Energy, Inc.(e) | | 37,300 | | | 11,018 |
Pacific Rubiales Energy Corp.(e) | | 11,900 | | | 231,169 |
Pan Orient Energy Corp.(e) | | 25,700 | | | 159,415 |
Paramount Resources Ltd. - Class A(e) | | 15,500 | | | 258,982 |
Patriot Coal Corp.(e) | | 2,798 | | | 57,247 |
Peabody Energy Corp. | | 26,498 | | | 1,210,959 |
Penn Virginia Corp. | | 30,000 | | | 735,000 |
Penn West Energy Trust | | 10,319 | | | 218,542 |
Petrohawk Energy Corp.(e) | | 45,600 | | | 924,768 |
Petrolifera Petroleum Ltd.(e) | | 30,150 | | | 28,498 |
Plains Exploration & Production Co.(e) | | 55,325 | | | 1,659,197 |
ProspEx Resources Ltd.(e) | | 43,140 | | | 62,863 |
Quicksilver Resources, Inc.(e) | | 10,200 | | | 143,514 |
Range Resources Corp. | | 14,000 | | | 656,180 |
Rosetta Resources, Inc.(e) | | 11,300 | | | 266,115 |
See Notes to Financial Statements.
| | | | | | |
| 14 | | BLACKROCK ASSET ALLOCATION PORTFOLIO | | MARCH 31, 2010 | | |
| | |
| Schedule of Investments (continued) |
| | (Percentages shown are based on Net Assets) |
| | | | | |
| | | Shares | | Value |
Common Stocks | | | | | |
Oil, Gas & Consumable Fuels (concluded) | | | | | |
SandRidge Energy, Inc.(e)(g) | | 21,300 | | $ | 164,010 |
Southern Union Co. | | 20,800 | | | 527,696 |
St. Mary Land & Exploration Co. | | 2,900 | | | 100,949 |
Stone Energy Corp.(e) | | 561 | | | 9,958 |
Straits Asia Resources Ltd. | | 103,900 | | | 160,045 |
Total SA | | 19,172 | | | 1,112,709 |
Tullow Oil Plc | | 34,094 | | | 646,980 |
Ultra Petroleum Corp.(e) | | 11,800 | | | 550,234 |
Ultrapar Participacoes SA - Preference Shares | | 8,740 | | | 417,599 |
Uranium One, Inc.(e) | | 25,970 | | | 68,527 |
Vero Energy, Inc.(e) | | 2,687 | | | 15,371 |
Vero Energy, Inc. (acquired 11/28/05, cost $3,345)(e)(f) | | 1,759 | | | 10,062 |
Warren Resources, Inc.(e) | | 4,034 | | | 10,166 |
West Energy Ltd.(e) | | 22,743 | | | 111,067 |
Whitehaven Coal Ltd. | | 82,100 | | | 386,899 |
Whiting Petroleum Corp.(e) | | 4,200 | | | 339,528 |
The Williams Cos., Inc. | | 39,200 | | | 905,520 |
XTO Energy, Inc. | | 22,325 | | | 1,053,294 |
| | | | | |
| | | | | 34,890,415 |
| | | | | |
Paper & Forest Products — 0.4% | | | | | |
Ainsworth Lumber Co. Ltd.(b)(e) | | 36,747 | | | 90,452 |
International Paper Co. | | 50,175 | | | 1,234,807 |
MeadWestvaco Corp. | | 24,900 | | | 636,195 |
Weyerhaeuser Co. | | 5,100 | | | 230,877 |
| | | | | |
| | | | | 2,192,331 |
| | | | | |
Personal Products — 0.4% | | | | | |
Avon Products, Inc. | | 47,200 | | | 1,598,664 |
The Estee Lauder Cos., Inc. - Class A | | 2,550 | | | 165,419 |
Herbalife Ltd. | | 2,468 | | | 113,824 |
Hypermarcas SA(e) | | 23,800 | | | 290,415 |
| | | | | |
| | | | | 2,168,322 |
| | | | | |
Pharmaceuticals — 2.2% | | | | | |
Abbott Laboratories | | 32,300 | | | 1,701,564 |
Akorn, Inc.(e) | | 33,500 | | | 51,255 |
Auxilium Pharmaceuticals, Inc.(e) | | 3,700 | | | 115,292 |
Bayer AG | | 11,200 | | | 756,786 |
Biovail Corp. | | 8,400 | | | 140,868 |
Bristol-Myers Squibb Co. | | 12,575 | | | 335,753 |
Cypress Bioscience, Inc.(e) | | 11,600 | | | 56,840 |
Depomed Inc(e) | | 12,700 | | | 45,085 |
Eli Lilly & Co. | | 5,575 | | | 201,927 |
Endo Pharmaceuticals Holdings, Inc.(e) | | 33,050 | | | 782,955 |
Forest Laboratories, Inc.(e) | | 29,250 | | | 917,280 |
GlaxoSmithKline Plc | | 61,703 | | | 1,184,373 |
Johnson & Johnson | | 6,475 | | | 422,170 |
Merck & Co., Inc. | | 4,858 | | | 181,446 |
Novartis AG | | 26,232 | | | 1,418,992 |
Pfizer, Inc. | | 104,142 | | | 1,786,035 |
Roche Holding AG | | 6,166 | | | 1,001,423 |
Shire Plc - ADR | | 2,950 | | | 194,582 |
Simcere Pharmaceutical Group - ADR(e) | | 5,500 | | | 46,805 |
Teva Pharmaceutical Industries Ltd. - ADR | | 13,700 | | | 864,196 |
Warner Chilcott Plc - Class A(e) | | 12,300 | | | 314,265 |
Watson Pharmaceuticals, Inc.(e) | | 6,000 | | | 250,620 |
| | | | | |
| | | | | 12,770,512 |
| | | | | |
Professional Services — 0.4% | | | | | |
The Corporate Executive Board Co. | | 800 | | | 21,272 |
Diamond Management & Technology Consultants, Inc. | | 16,994 | | | 133,403 |
Heidrick & Struggles International, Inc. | | 2,000 | | | 56,060 |
IHS, Inc. - Class A(e) | | 2,550 | | | 136,349 |
Kforce, Inc. - Class A(e) | | 4,400 | | | 66,924 |
Manpower, Inc. | | 14,200 | | | 811,104 |
Sthree Plc | | 71,800 | | | 370,467 |
TrueBlue, Inc.(e) | | 3,800 | | | 58,900 |
USG People NV(e) | | 19,100 | | | 360,480 |
| | | | | |
| | | | | 2,014,959 |
| | | | | |
Real Estate Investment Trusts (REITs) — 0.7% | | | | | |
Alexandria Real Estate Equities, Inc. | | 4,700 | | | 317,720 |
Annaly Capital Management, Inc. | | 6,025 | | | 103,509 |
CFS Retail Property Trust | | 39,100 | | | 67,194 |
Champion REIT | | 467,800 | | | 223,322 |
Chimera Investment Corp. | | 117,800 | | | 458,242 |
Corio NV | | 1,600 | | | 106,777 |
Eurocommercial Properties NV | | 2,500 | | | 100,530 |
Fonciere Des Regions | | 2,800 | | | 308,047 |
Hammerson Plc | | 37,500 | | | 223,777 |
Hospitality Properties Trust | | 3,500 | | | 83,825 |
MFA Financial, Inc. | | 47,500 | | | 349,600 |
Segro Plc | | 48,250 | | | 234,406 |
Simon Property Group, Inc. | | 6,825 | | | 572,617 |
Suntec Real Estate Investment Trust | | 251,100 | | | 240,299 |
Unibail-Rodamco SE | | 1,500 | | | 303,676 |
U-Store-It Trust | | 19,200 | | | 138,240 |
Wereldhave NV(e) | | 500 | | | 47,962 |
| | | | | |
| | | | | 3,879,743 |
| | | | | |
Real Estate Management & Development — 0.3% | | | | | |
Castellum AB | | 6,600 | | | 66,443 |
Forestar Group, Inc.(e) | | 19,900 | | | 375,712 |
Goldcrest Co. Ltd. | | 6,200 | | | 164,370 |
Hang Lung Properties Ltd. | | 116,000 | | | 466,747 |
New World Development Ltd. | | 132,500 | | | 258,737 |
PSP Swiss Property AG(e) | | 1,800 | | | 115,565 |
Tokyo Tatemono Co. Ltd. | | 38,000 | | | 136,948 |
| | | | | |
| | | | | 1,584,522 |
| | | | | |
Road & Rail — 0.5% | | | | | |
Canadian Pacific Railway Ltd. | | 5,900 | | | 332,512 |
CSX Corp. | | 3,450 | | | 175,605 |
East Japan Railway Co. | | 11,400 | | | 793,180 |
Hertz Global Holdings, Inc.(e) | | 20,900 | | | 208,791 |
Northgate Plc(e) | | 74,800 | | | 211,640 |
Ryder System, Inc. | | 12,375 | | | 479,655 |
Union Pacific Corp. | | 4,300 | | | 315,190 |
West Japan Railway Co. | | 60 | | | 206,725 |
| | | | | |
| | | | | 2,723,298 |
| | | | | |
Semiconductors & Semiconductor Equipment — 1.4% | | | | | |
Advanced Semiconductor Engineering, Inc. | | 112,400 | | | 102,276 |
ARM Holdings Plc | | 53,400 | | | 191,407 |
Broadcom Corp. - Class A | | 33,600 | | | 1,114,848 |
Cree, Inc.(e) | | 3,900 | | | 273,858 |
CSR Plc(e) | | 27,700 | | | 192,629 |
Entegris, Inc.(e) | | 24,700 | | | 124,488 |
Intel Corp. | | 15,125 | | | 336,682 |
Lam Research Corp.(e) | | 28,982 | | | 1,081,608 |
MaxLinear, Inc. - Class A(e) | | 800 | | | 14,200 |
See Notes to Financial Statements.
| | | | | | |
| | | BLACKROCK ASSET ALLOCATION PORTFOLIO | | MARCH 31, 2010 | | 15 |
| | |
Schedule of Investments (continued) |
| | (Percentages shown are based on Net Assets) |
| | | | | | |
| | | Shares | | Value |
Common Stocks | | | | | | |
Semiconductors & Semiconductor Equipment (concluded) | | | | | | |
Micron Technology, Inc.(e) | | | 116,430 | | $ | 1,209,708 |
Microsemi Corp.(e) | | | 7,225 | | | 125,282 |
Monolithic Power Systems, Inc.(e) | | | 3,100 | | | 69,130 |
Netlogic Microsystems, Inc.(e) | | | 4,600 | | | 135,378 |
NVIDIA Corp.(e) | | | 39,500 | | | 686,510 |
ON Semiconductor Corp.(e) | | | 46,400 | | | 371,200 |
PMC-Sierra, Inc.(e) | | | 30,650 | | | 273,398 |
Samsung Electronics Co. Ltd. | | | 863 | | | 623,944 |
Silicon Laboratories, Inc.(e) | | | 2,800 | | | 133,476 |
Siliconware Precision Industries Co. - ADR | | | 26,800 | | | 161,068 |
Texas Instruments, Inc. | | | 15,275 | | | 373,779 |
United Microelectronics Corp.(e) | | | 443,700 | | | 236,922 |
Varian Semiconductor Equipment Associates, Inc.(e) | | | 3,900 | | | 129,168 |
| | | | | | |
| | | | | | 7,960,959 |
| | | | | | |
Software — 2.3% | | | | | | |
Adobe Systems, Inc.(e) | | | 7,800 | | | 275,886 |
Autonomy Corp. Plc(e) | | | 27,936 | | | 772,107 |
Blackboard, Inc.(e) | | | 3,964 | | | 165,140 |
CA, Inc. | | | 23,100 | | | 542,157 |
Check Point Software Technologies(e) | | | 44,100 | | | 1,546,146 |
DemandTec, Inc.(e) | | | 11,200 | | | 77,840 |
Intuit, Inc.(e) | | | 5,950 | | | 204,323 |
Micro Focus International Plc | | | 55,200 | | | 420,189 |
MICROS Systems, Inc.(e) | | | 2,900 | | | 95,352 |
Microsoft Corp. | | | 157,725 | | | 4,616,611 |
Novell, Inc.(e) | | | 28,300 | | | 169,517 |
Oracle Corp. | | | 13,775 | | | 353,880 |
Perfect World Co. Ltd. - ADR(e) | | | 4,400 | | | 164,780 |
Phase Metrics, Inc.(e) | | | 50,574 | | | 1,012 |
Salesforce.com, Inc.(e) | | | 19,669 | | | 1,464,357 |
SonicWALL, Inc.(e) | | | 28,500 | | | 247,665 |
Symantec Corp.(e) | | | 7,350 | | | 124,362 |
Take-Two Interactive Software, Inc.(e) | | | 15,900 | | | 156,615 |
Taleo Corp. - Class A(e) | | | 7,400 | | | 191,734 |
TiVo, Inc.(e) | | | 69,725 | | | 1,193,692 |
| | | | | | |
| | | | | | 12,783,365 |
| | | | | | |
Specialty Retail — 1.3% | | | | | | |
Advance Auto Parts, Inc. | | | 3,150 | | | 132,048 |
American Eagle Outfitters, Inc. | | | 12,800 | | | 237,056 |
AutoNation, Inc.(e) | | | 11,800 | | | 213,344 |
Bed Bath & Beyond, Inc.(e) | | | 4,600 | | | 201,296 |
CarMax, Inc.(e) | | | 24,100 | | | 605,392 |
Esprit Holdings Ltd. | | | 103,967 | | | 819,377 |
GameStop Corp. - Class A(e) | | | 10,850 | | | 237,724 |
The Gap, Inc. | | | 28,625 | | | 661,524 |
The Home Depot, Inc. | | | 37,750 | | | 1,221,213 |
JUMBO SA | | | 18,700 | | | 189,326 |
Limited Brands, Inc. | | | 38,000 | | | 935,560 |
Lumber Liquidators Holdings, Inc.(e) | | | 5,400 | | | 144,018 |
Nitori Co. Ltd. | | | 3,200 | | | 242,970 |
Ross Stores, Inc. | | | 5,169 | | | 276,386 |
The Sherwin-Williams Co. | | | 2,340 | | | 158,371 |
Shimachu Co. Ltd. | | | 11,600 | | | 247,907 |
Signet Jewelers Ltd.(e) | | | 7,400 | | | 239,316 |
Staples, Inc. | | | 7,900 | | | 184,781 |
TJX Cos., Inc. | | | 5,050 | | | 214,726 |
The Wet Seal, Inc. - Class A(e) | | | 33,500 | | | 159,460 |
| | | | | | |
| | | | | | 7,321,795 |
| | | | | | |
Textiles, Apparel & Luxury Goods — 0.2% | | | | | | |
Anta Sports Products Ltd. | | | 125,900 | | | 207,433 |
ASICS Corp. | | | 29,100 | | | 284,894 |
Benetton Group SpA | | | 18,700 | | | 154,937 |
Coach, Inc. | | | 5,850 | | | 231,192 |
Gerry Weber International AG | | | 8,310 | | | 288,481 |
Hanesbrands, Inc.(e) | | | 2 | | | 56 |
| | | | | | |
| | | | | | 1,166,993 |
| | | | | | |
Thrifts & Mortgage Finance — 0.1% | | | | | | |
Hudson City Bancorp, Inc. | | | 10,384 | | | 147,037 |
People’s United Financial, Inc. | | | 22,900 | | | 358,156 |
Washington Federal, Inc. | | | 11,400 | | | 231,648 |
| | | | | | |
| | | | | | 736,841 |
| | | | | | |
Tobacco — 0.6% | | | | | | |
Altria Group, Inc. | | | 5,150 | | | 105,678 |
Lorillard, Inc. | | | 7,500 | | | 564,300 |
Philip Morris International, Inc. | | | 29,076 | | | 1,516,604 |
Reynolds American, Inc. | | | 11,800 | | | 636,964 |
Swedish Match AB | | | 16,800 | | | 401,475 |
| | | | | | |
| | | | | | 3,225,021 |
| | | | | | |
Trading Companies & Distributors — 0.3% | | | | | | |
ITOCHU Corp. | | | 38,900 | | | 341,432 |
Marubeni Corp. | | | 61,200 | | | 380,922 |
Mitsui & Co. Ltd. | | | 66,200 | | | 1,114,632 |
| | | | | | |
| | | | | | 1,836,986 |
| | | | | | |
Transportation Infrastructure — 0.1% | | | | | | |
COSCO Pacific Ltd. | | | 281,900 | | | 426,180 |
Kamigumi Co. Ltd. | | | 40,400 | | | 325,244 |
| | | | | | |
| | | | | | 751,424 |
| | | | | | |
Water Utilities — 0.1% | | | | | | |
American Water Works Co., Inc. | | | 13,700 | | | 298,112 |
Guangdong Investment Ltd. | | | 600,900 | | | 324,759 |
| | | | | | |
| | | | | | 622,871 |
| | | | | | |
Wireless Telecommunication Services — 0.5% | | | | | | |
American Tower Corp. - Class A(e) | | | 3,750 | | | 159,788 |
NII Holdings, Inc.(e) | | | 14,400 | | | 599,904 |
Philippine Long Distance Telephone Co. - ADR | | | 4,200 | | | 223,776 |
Syniverse Holdings, Inc.(e) | | | 13,450 | | | 261,871 |
Telephone & Data Systems, Inc. | | | 5,400 | | | 182,790 |
Vodafone Group Plc | | | 547,896 | | | 1,267,236 |
| | | | | | |
| | | | | | 2,695,365 |
| | | | | | |
Total Common Stocks — 61.0% | | | | | | 345,446,591 |
| | | | | | |
| | |
| | | Par
(000) | | |
Corporate Bonds | | | | | | |
Aerospace & Defense — 0.0% | | | | | | |
L-3 Communications Corp., Series B, | | | | | | |
6.38%, 10/15/15 | | USD | 35 | | | 35,919 |
| | | | | | |
Auto Components — 0.0% | | | | | | |
The Goodyear Tire & Rubber Co., | | | | | | |
8.63%, 12/01/11 | | | 125 | | | 130,000 |
| | | | | | |
See Notes to Financial Statements.
| | | | | | |
| 16 | | BLACKROCK ASSET ALLOCATION PORTFOLIO | | MARCH 31, 2010 | | |
| | |
Schedule of Investments (continued) |
| | (Percentages shown are based on Net Assets) |
| | | | | | |
| | | Par
(000) | | Value |
Corporate Bonds | | | | | | |
Beverages — 0.3% | | | | | | |
Anheuser-Busch InBev Worldwide, Inc.: | | | | | | |
4.13%, 1/15/15 | | USD | 1,200 | | $ | 1,234,679 |
5.38%, 1/15/20 | | | 475 | | | 490,001 |
PepsiCo, Inc., | | | | | | |
4.50%, 1/15/20 | | | 175 | | | 176,980 |
| | | | | | |
| | | | | | 1,901,660 |
| | | | | | |
Capital Markets — 0.5% | | | | | | |
The Goldman Sachs Group, Inc.: | | | | | | |
5.25%, 10/15/13 | | | 310 | | | 333,227 |
5.38%, 3/15/20 | | | 650 | | | 643,988 |
Lehman Brothers Holdings, Inc., | | | | | | |
6.75%, 12/28/17(e)(h) | | | 190 | | | 475 |
Morgan Stanley: | | | | | | |
0.50%, 1/09/12(a) | | | 335 | | | 331,211 |
4.20%, 11/20/14 | | | 1,030 | | | 1,032,272 |
5.55%, 4/27/17 | | | 115 | | | 117,615 |
5.63%, 9/23/19 | | | 465 | | | 463,360 |
| | | | | | |
| | | | | | 2,922,148 |
| | | | | | |
Chemicals — 0.1% | | | | | | |
Huntsman International LLC: | | | | | | |
7.88%, 11/15/14 | | | 335 | | | 338,350 |
7.38%, 1/01/15 | | | 85 | | | 84,362 |
NOVA Chemicals Corp.: | | | | | | |
6.50%, 1/15/12 | | | 60 | | | 61,500 |
3.65%, 11/15/13(a) | | | 200 | | | 188,500 |
| | | | | | |
| | | | | | 672,712 |
| | | | | | |
Commercial Banks — 0.1% | | | | | | |
Banco Central de la Republica Dominicana, | | | | | | |
9.04%, 1/23/18 | | | 33 | | | 36,068 |
JPMorgan Chase Bank, N.A., | | | | | | |
6.00%, 7/05/17 | | | 425 | | | 453,020 |
| | | | | | |
| | | | | | 489,088 |
| | | | | | |
Commercial Services & Supplies — 0.0% | | | | | | |
Aleris International, Inc., | | | | | | |
9.00%, 12/15/14(e)(h) | | | 230 | | | 23 |
RBS Global, Inc./Rexnord LLC, | | | | | | |
8.88%, 9/01/16 | | | 30 | | | 27,675 |
| | | | | | |
| | | | | | 27,698 |
| | | | | | |
Communications Equipment — 0.1% | | | | | | |
Cisco Systems, Inc., | | | | | | |
4.45%, 1/15/20 | | | 627 | | | 623,525 |
| | | | | | |
Computers & Peripherals — 0.1% | | | | | | |
Seagate Technology International, | | | | | | |
10.00%, 5/01/14(b) | | | 350 | | | 396,375 |
| | | | | | |
Containers & Packaging — 0.1% | | | | | | |
Ball Corp.: | | | | | | |
7.13%, 9/01/16 | | | 140 | | | 148,750 |
7.38%, 9/01/19 | | | 140 | | | 147,525 |
Rock-Tenn Co., | | | | | | |
8.20%, 8/15/11 | | | 250 | | | 261,875 |
| | | | | | |
| | | | | | 558,150 |
| | | | | | |
Diversified Financial Services — 0.8% | | | | | | |
Atlantic Marine Corp. Communities LLC, | | | | | | |
5.34%, 12/01/50(b) | | | 175 | | | 139,556 |
BP Capital Markets Plc, | | | | | | |
3.13%, 3/10/12 | | | 775 | | | 802,830 |
Crown Castle Towers LLC, | | | | | | |
6.11%, 1/15/20(b) | | | 760 | | | 794,990 |
FCE Bank Plc: | | | | | | |
7.88%, 2/15/11 | | GBP | 300 | | | 464,900 |
7.13%, 1/15/13 | | | 50 | | | 69,221 |
Ford Motor Credit Co. LLC: | | | | | | |
9.75%, 9/15/10 | | USD | 135 | | | 138,237 |
8.63%, 11/01/10 | | | 250 | | | 256,067 |
7.80%, 6/01/12 | | | 225 | | | 233,362 |
General Electric Capital Corp.: | | | | | | |
6.75%, 3/15/32 | | | 50 | | | 52,899 |
6.15%, 8/07/37 | | | 360 | | | 352,046 |
JPMorgan Chase & Co., | | | | | | |
5.60%, 6/01/11 | | | 550 | | | 579,209 |
Leucadia National Corp., | | | | | | |
7.13%, 3/15/17 | | | 200 | | | 198,000 |
New Communications Holdings, Inc., | | | | | | |
8.25%, 4/15/17(b) | | | 200 | | | 203,500 |
NSG Holdings LLC/NSG Holdings, Inc., | | | | | | |
7.75%, 12/15/25(b) | | | 140 | | | 126,000 |
Ohana Military Communities LLC, | | | | | | |
6.19%, 4/01/49(b) | | | 25 | | | 22,896 |
| | | | | | |
| | | | | | 4,433,713 |
| | | | | | |
Diversified Telecommunication Services — 0.7% | | | | | | |
AT&T Inc.: | | | | | | |
5.50%, 2/01/18 | | | 250 | | | 265,412 |
6.50%, 9/01/37 | | | 800 | | | 829,551 |
Qwest Communications International, Inc.: | | | | | | |
7.50%, 2/15/14 | | | 280 | | | 284,900 |
Series B, 7.50%, 2/15/14 | | | 30 | | | 30,525 |
Qwest Corp.: | | | | | | |
8.88%, 3/15/12 | | | 60 | | | 65,700 |
3.51%, 6/15/13(a) | | | 75 | | | 75,656 |
Telecom Italia Capital SA, | | | | | | |
4.95%, 9/30/14 | | | 475 | | | 487,270 |
Telefonica Emisiones SAU: | | | | | | |
6.42%, 6/20/16 | | | 150 | | | 166,638 |
7.05%, 6/20/36 | | | 150 | | | 169,112 |
Verizon Communications, Inc.: | | | | | | |
8.75%, 11/01/18(i) | | | 1,050 | | | 1,317,236 |
6.35%, 4/01/19 | | | 300 | | | 332,162 |
Verizon Maryland, Inc., | | | | | | |
5.13%, 6/15/33 | | | 10 | | | 8,141 |
Windstream Corp., | | | | | | |
8.63%, 8/01/16 | | | 105 | | | 107,362 |
| | | | | | |
| | | | | | 4,139,665 |
| | | | | | |
Electric Utilities — 0.3% | | | | | | |
AES Eastern Energy LP, Series 1999-A, | | | | | | |
9.00%, 1/02/17 | | | 189 | | | 194,586 |
Florida Power & Light Co.: | | | | | | |
5.63%, 4/01/34 | | | 150 | | | 147,058 |
5.95%, 2/01/38 | | | 225 | | | 230,650 |
Florida Power Corp., | | | | | | |
6.40%, 6/15/38 | | | 150 | | | 163,133 |
MidAmerican Energy Holdings Co., | | | | | | |
6.50%, 9/15/37 | | | 250 | | | 264,369 |
PacifiCorp, | | | | | | |
6.25%, 10/15/37 | | | 200 | | | 212,383 |
TXU Corp., Series P, | | | | | | |
5.55%, 11/15/14 | | | 805 | | | 587,650 |
| | | | | | |
| | | | | | 1,799,829 |
| | | | | | |
Food & Staples Retailing — 0.0% | | | | | | |
Rite Aid Corp., | | | | | | |
7.50%, 3/01/17 | | | 50 | | | 46,375 |
| | | | | | |
Food Products — 0.4% | | | | | | |
Kraft Foods, Inc.: | | | | | | |
6.50%, 8/11/17 | | | 535 | | | 599,282 |
5.38%, 2/10/20 | | | 660 | | | 670,794 |
6.50%, 2/09/40 | | | 165 | | | 170,986 |
Tyson Foods, Inc., | | | | | | |
10.50%, 3/01/14 | | | 445 | | | 528,438 |
| | | | | | |
| | | | | | 1,969,500 |
| | | | | | |
Gas Utilities — 0.0% | | | | | | |
Dominion Resources, Inc., | | | | | | |
5.00%, 3/01/14 | | | 20 | | | 21,235 |
| | | | | | |
See Notes to Financial Statements.
| | | | | | |
| | | BLACKROCK ASSET ALLOCATION PORTFOLIO | | MARCH 31, 2010 | | 17 |
| | |
| Schedule of Investments (continued) |
| | (Percentages shown are based on Net Assets) |
| | | | | | |
| | | Par
(000) | | Value |
Corporate Bonds | | | | | | |
Health Care Equipment & Supplies — 0.1% | | | | | | |
CareFusion Corp., | | | | | | |
6.38%, 8/01/19 | | USD | 300 | | $ | 328,066 |
DJO Finance LLC/DJO Finance Corp., | | | | | | |
10.88%, 11/15/14 | | | 345 | | | 374,756 |
| | | | | | |
| | | | | | 702,822 |
| | | | | | |
Health Care Providers & Services — 0.1% | | | | | | |
HCA, Inc., | | | | | | |
7.25%, 9/15/20(b) | | | 455 | | | 461,256 |
Health Management Associates, Inc., | | | | | | |
6.13%, 4/15/16 | | | 230 | | | 219,075 |
| | | | | | |
| | | | | | 680,331 |
| | | | | | |
Hotels, Restaurants & Leisure — 0.1% | | | | | | |
Wendy’s International, Inc., | | | | | | |
6.25%, 11/15/11 | | | 360 | | | 375,300 |
| | | | | | |
Household Durables — 0.4% | | | | | | |
Centex Corp., | | | | | | |
5.13%, 10/01/13 | | | 661 | | | 674,220 |
D.R. Horton, Inc.: | | | | | | |
6.88%, 5/01/13 | | | 525 | | | 549,937 |
5.63%, 9/15/14 | | | 155 | | | 153,450 |
KB Home, | | | | | | |
6.38%, 8/15/11 | | | 96 | | | 98,160 |
Lennar Corp., Series B, | | | | | | |
5.60%, 5/31/15 | | | 250 | | | 237,500 |
Pulte Group, Inc., | | | | | | |
5.20%, 2/15/15 | | | 185 | | | 177,369 |
Ryland Group, Inc., | | | | | | |
5.38%, 5/15/12 | | | 165 | | | 166,650 |
Toll Brothers Finance Corp., | | | | | | |
4.95%, 3/15/14 | | | 155 | | | 156,963 |
| | | | | | |
| | | | | | 2,214,249 |
| | | | | | |
Independent Power Producers & Energy Traders — 0.0% | | | | | | |
NRG Energy, Inc.: | | | | | | |
7.25%, 2/01/14 | | | 155 | | | 156,162 |
7.38%, 2/01/16 | | | 35 | | | 34,738 |
| | | | | | |
| | | | | | 190,900 |
| | | | | | |
Insurance — 0.9% | | | | | | |
Berkshire Hathaway Finance Corp., | | | | | | |
4.75%, 5/15/12 | | | 355 | | | 379,600 |
Hartford Life Global Funding Trusts, | | | | | | |
0.44%, 6/16/14(a) | | | 950 | | | 881,734 |
Metropolitan Life Global Funding I: | | | | | | |
2.88%, 9/17/12(b) | | | 225 | | | 228,712 |
2.50%, 1/11/13(b) | | | 1,370 | | | 1,371,080 |
5.13%, 4/10/13(b) | | | 850 | | | 912,557 |
5.13%, 6/10/14(b) | | | 300 | | | 317,756 |
Prudential Financial, Inc., | | | | | | |
4.75%, 9/17/15 | | | 620 | | | 638,146 |
Teachers Insurance & Annuity Association of America, | | | | | | |
6.85%, 12/16/39(b) | | | 265 | | | 287,454 |
| | | | | | |
| | | | | | 5,017,039 |
| | | | | | |
Internet & Catalog Retail — 0.1% | | | | | | |
Sabre Holdings Corp., | | | | | | |
8.35%, 3/15/16 | | | 690 | | | 655,500 |
| | | | | | |
Life Sciences Tools & Services — 0.1% | | | | | | |
Life Technologies Corp., | | | | | | |
6.00%, 3/01/20 | | | 230 | | | 235,491 |
| | | | | | |
Media — 0.7% | | | | | | |
Belo Corp., | | | | | | |
6.75%, 5/30/13 | | | 120 | | | 121,200 |
Cengage Learning Acquisitions, Inc., | | | | | | |
10.50%, 1/15/15(b) | | | 310 | | | 297,600 |
Clear Channel Worldwide Holdings, Inc., | | | | | | |
9.25%, 12/15/17(b) | | | 521 | | | 543,795 |
Comcast Cable Holdings LLC, | | | | | | |
7.88%, 8/01/13 | | | 2 | | | 2,279 |
Comcast Corp.: | | | | | | |
6.50%, 1/15/17 | | | 710 | | | 789,314 |
7.05%, 3/15/33 | | | 115 | | | 123,674 |
6.95%, 8/15/37 | | | 145 | | | 156,864 |
6.40%, 3/01/40 | | | 125 | | | 127,054 |
Cox Communications, Inc., | | | | | | |
8.38%, 3/01/39(b) | | | 375 | | | 469,013 |
News America Holdings, Inc., | | | | | | |
7.75%, 1/20/24 | | | 25 | | | 29,897 |
News America, Inc.: | | | | | | |
7.28%, 6/30/28 | | | 35 | | | 37,584 |
6.20%, 12/15/34 | | | 100 | | | 99,738 |
TCI Communications, Inc.: | | | | | | |
7.88%, 2/15/26 | | | 5 | | | 5,731 |
7.13%, 2/15/28 | | | 35 | | | 37,211 |
Time Warner Cable, Inc., | | | | | | |
6.20%, 7/01/13 | | | 460 | | | 507,607 |
Time Warner Cos., Inc., | | | | | | |
7.57%, 2/01/24 | | | 30 | | | 34,584 |
Time Warner Entertainment Co. LP, | | | | | | |
8.38%, 3/15/23 | | | 125 | | | 152,555 |
Time Warner, Inc., | | | | | | |
7.63%, 4/15/31 | | | 200 | | | 228,424 |
| | | | | | |
| | | | | | 3,764,124 |
| | | | | | |
Metals & Mining — 0.1% | | | | | | |
ArcelorMittal USA Partnership, | | | | | | |
9.75%, 4/01/14 | | | 10 | | | 10,325 |
Teck Resources Ltd., | | | | | | |
10.75%, 5/15/19 | | | 425 | | | 520,625 |
| | | | | | |
| | | | | | 530,950 |
| | | | | | |
Oil, Gas & Consumable Fuels — 0.8% | | | | | | |
Arch Western Finance LLC, | | | | | | |
6.75%, 7/01/13(a) | | | 315 | | | 316,181 |
Canadian Natural Resources Ltd., | | | | | | |
6.50%, 2/15/37 | | | 300 | | | 318,322 |
Cenovus Energy, Inc., | | | | | | |
6.75%, 11/15/39(b) | | | 285 | | | 309,101 |
ConocoPhillips, | | | | | | |
4.60%, 1/15/15 | | | 1,045 | | | 1,120,749 |
Enterprise Products Operating LLC, | | | | | | |
6.13%, 10/15/39 | | | 225 | | | 221,226 |
EXCO Resources, Inc., | | | | | | |
7.25%, 1/15/11 | | | 35 | | | 35,088 |
Forest Oil Corp., | | | | | | |
7.25%, 6/15/19 | | | 55 | | | 55,275 |
Nexen, Inc., | | | | | | |
6.40%, 5/15/37 | | | 400 | | | 403,210 |
Rockies Express Pipeline LLC, | | | | | | |
3.90%, 4/15/15(b) | | | 365 | | | 359,983 |
Shell International Finance BV, | | | | | | |
4.00%, 3/21/14 | | | 875 | | | 920,787 |
Valero Energy Corp., | | | | | | |
6.63%, 6/15/37 | | | 400 | | | 380,422 |
XTO Energy, Inc., | | | | | | |
6.75%, 8/01/37 | | | 250 | | | 292,700 |
| | | | | | |
| | | | | | 4,733,044 |
| | | | | | |
Paper & Forest Products — 0.1% | | | | | | |
Ainsworth Lumber Co. Ltd., | | | | | | |
11.00%, 7/29/15(b)(j) | | | 153 | | | 121,734 |
International Paper Co., | | | | | | |
7.30%, 11/15/39 | | | 325 | | | 347,312 |
NewPage Corp., | | | | | | |
10.00%, 5/01/12 | | | 40 | | | 27,750 |
| | | | | | |
| | | | | | 496,796 |
| | | | | | |
Pharmaceuticals — 0.8% | | | | | | |
Bristol-Myers Squibb Co., | | | | | | |
6.88%, 8/01/47 | | | 25 | | | 26,845 |
Eli Lilly & Co., | | | | | | |
3.55%, 3/06/12 | | | 370 | | | 386,052 |
GlaxoSmithKline Capital, Inc., | | | | | | |
4.85%, 5/15/13 | | | 400 | | | 433,560 |
Merck & Co., Inc., | | | | | | |
4.38%, 2/15/13 | | | 410 | | | 438,589 |
Novartis Capital Corp., | | | | | | |
2.90%, 4/24/15 | | | 725 | | | 719,939 |
Pfizer, Inc., | | | | | | |
5.35%, 3/15/15(i) | | | 1,190 | | | 1,311,207 |
Roche Holdings, Inc.: | | | | | | |
2.25%, 2/25/11(a)(b) | | | 180 | | | 183,267 |
5.00%, 3/01/14(b) | | | 775 | | | 837,100 |
| | | | | | |
| | | | | | 4,336,559 |
| | | | | | |
Real Estate Investment Trusts (REITs) — 0.0% | | | | | | |
iStar Financial, Inc., | | | | | | |
5.65%, 9/15/11 | | | 140 | | | 127,750 |
| | | | | | |
Software — 0.3% | | | | | | |
First Data Corp., | | | | | | |
9.88%, 9/24/15 | | | 905 | | | 778,513 |
See Notes to Financial Statements.
| | | | | | |
| 18 | | BLACKROCK ASSET ALLOCATION PORTFOLIO | | MARCH 31, 2010 | | |
| | |
| Schedule of Investments (continued) | | |
| | (Percentages shown are based on Net Assets) |
| | | | | | |
| | | Par
(000) | | Value |
Corporate Bonds | | | | | | |
Software (concluded) | | | | | | |
Oracle Corp., | | | | | | |
4.95%, 4/15/13 | | USD | 570 | | $ | 619,232 |
| | | | | | |
| | | | | | 1,397,745 |
| | | | | | |
Specialty Retail — 0.0% | | | | | | |
The Hertz Corp., | | | | | | |
8.88%, 1/01/14 | | | 80 | | | 82,200 |
| | | | | | |
Tobacco — 0.1% | | | | | | |
Philip Morris International, Inc.: | | | | | | |
6.88%, 3/17/14 | | | 275 | | | 314,907 |
4.50%, 3/26/20 | | | 440 | | | 429,289 |
| | | | | | |
| | | | | | 744,196 |
| | | | | | |
Wireless Telecommunication Services — 0.6% | | | | | | |
America Movil SAB de CV, | | | | | | |
6.38%, 3/01/35 | | | 75 | | | 75,537 |
Cellco Partnership/Verizon Wireless Capital LLC, | | | | | | |
3.75%, 5/20/11 | | | 1,620 | | | 1,670,427 |
Rogers Communications, Inc., | | | | | | |
7.50%, 3/15/15 | | | 500 | | | 583,601 |
Vodafone Group Plc, | | | | | | |
4.15%, 6/10/14 | | | 900 | | | 934,583 |
| | | | | | |
| | | | | | 3,264,148 |
| | | | | | |
Total Corporate Bonds — 8.8% | | | | | | 49,716,736 |
| | | | | | |
| | |
| | | Shares | | |
Exchange-Traded Funds — 0.0% | | | | | | |
iShares Russell 2000 Value Index Fund(k) | | | 1,463 | | | 93,398 |
| | | | | | |
| | |
| | | Par
(000) | | |
Foreign Agency Obligations | | | | | | |
Achmea Hypotheekbank NV, | | | | | | |
3.20%, 11/03/14(b) | | USD | 680 | | | 688,671 |
CDP Financial, Inc., | | | | | | |
3.00%, 11/25/14(b) | | | 1,020 | | | 1,004,332 |
Dexia Credit Local SA, | | | | | | |
2.00%, 3/05/13(b) | | | 565 | | | 561,339 |
Eksportfinans ASA: | | | | | | |
1.88%, 4/02/13 | | | 1,510 | | | 1,504,158 |
3.00%, 11/17/14 | | | 775 | | | 777,977 |
5.50%, 5/25/16 | | | 575 | | | 633,312 |
Gazprom Capital: | | | | | | |
9.63%, 3/01/13(b) | | | 200 | | | 228,250 |
9.63%, 3/01/13 | | | 680 | | | 775,268 |
Japan Finance Corp., | | | | | | |
2.00%, 6/24/11 | | | 470 | | | 474,673 |
Landwirtschaftliche Rentenbank: | | | | | | |
5.25%, 7/02/12 | | | 210 | | | 227,396 |
4.38%, 1/15/13 | | | 135 | | | 144,727 |
4.13%, 7/15/13 | | | 60 | | | 63,866 |
4.00%, 2/02/15 | | | 125 | | | 131,446 |
Petrobras International Finance Co.: | | | | | | |
5.75%, 1/20/20 | | | 300 | | | 307,347 |
6.88%, 1/20/40 | | | 420 | | | 433,518 |
The Royal Bank of Scotland Plc, | | | | | | |
2.63%, 5/11/12(b) | | | 160 | | | 163,354 |
VTB Capital SA, | | | | | | |
7.50%, 10/12/11 | | | 110 | | | 116,600 |
| | | | | | |
Total Foreign Agency Obligations — 1.4 % | | | | | | 8,236,234 |
| | | | | | |
Argentina — 0.1% | | | | | | |
Republic of Argentina: | | | | | | |
7.00%, 10/03/15 | | | 310 | | | 258,230 |
8.28%, 12/31/33 | | | 292 | | | 218,886 |
2.50%, 12/31/38(c) | | | 90 | | | 32,310 |
| | | | | | |
| | | | | | 509,426 |
| | | | | | |
Brazil — 0.1% | | | | | | |
Federal Republic of Brazil: | | | | | | |
6.00%, 1/17/17 | | | 300 | | | 325,950 |
8.25%, 1/20/34 | | | 170 | | | 216,750 |
5.63%, 1/07/41 | | | 150 | | | 141,225 |
| | | | | | |
| | | | | | 683,925 |
| | | | | | |
Canada — 0.2% | | | | | | |
Province of Ontario Canada: | | | | | | |
1.88%, 11/19/12 | | | 620 | | | 624,502 |
4.10%, 6/16/14 | | | 670 | | | 715,754 |
| | | | | | |
| | | | | | 1,340,256 |
| | | | | | |
Colombia — 0.1% | | | | | | |
Republic of Colombia: | | | | | | |
7.38%, 3/18/19 | | | 200 | | | 230,000 |
7.38%, 9/18/37 | | | 240 | | | 268,800 |
| | | | | | |
| | | | | | 498,800 |
| | | | | | |
El Salvador — 0.0% | | | | | | |
Republic of El Salvador, | | | | | | |
7.65%, 6/15/35(b) | | | 55 | | | 57,888 |
| | | | | | |
Indonesia — 0.0% | | | | | | |
Republic of Indonesia: | | | | | | |
6.63%, 2/17/37(b) | | | 100 | | | 102,250 |
7.75%, 1/17/38 | | | 110 | | | 127,600 |
| | | | | | |
| | | | | | 229,850 |
| | | | | | |
Israel — 0.0% | | | | | | |
Israel Government AID Bond: | | | | | | |
5.50%, 4/26/24 | | | 100 | | | 108,880 |
5.50%, 9/18/33 | | | 85 | | | 89,414 |
| | | | | | |
| | | | | | 198,294 |
| | | | | | |
Mexico — 0.1% | | | | | | |
United Mexican States: | | | | | | |
8.30%, 8/15/31 | | | 194 | | | 249,290 |
6.05%, 1/11/40 | | | 125 | | | 124,688 |
| | | | | | |
| | | | | | 373,978 |
| | | | | | |
Panama — 0.0% | | | | | | |
Republic of Panama, | | | | | | |
8.88%, 9/30/27 | | | 95 | | | 122,550 |
| | | | | | |
Peru — 0.1% | | | | | | |
Republic of Peru, | | | | | | |
6.55%, 3/14/37 | | | 215 | | | 230,050 |
| | | | | | |
Philippines — 0.1% | | | | | | |
Republic of Philippines, | | | | | | |
9.00%, 2/15/13 | | | 370 | | | 436,137 |
| | | | | | |
Russia — 0.1% | | | | | | |
Russia Federation, | | | | | | |
7.50%, 3/31/30(c) | | | 589 | | | 678,651 |
| | | | | | |
See Notes to Financial Statements.
| | | | | | |
| | | BLACKROCK ASSET ALLOCATION PORTFOLIO | | MARCH 31, 2010 | | 19 |
| | |
| Schedule of Investments (continued) | | |
| | (Percentages shown are based on Net Assets) |
| | | | | | |
| | | Par
(000) | | Value |
Foreign Government Obligations | | | | | | |
South Africa — 0.1% | | | | | | |
Republic of South Africa, | | | | | | |
5.50%, 3/09/20 | | USD | 500 | | $ | 506,250 |
| | | | | | |
Tunisia — 0.1% | | | | | | |
Banque Centrale de Tunisie, | | | | | | |
7.38%, 4/25/12 | | | 425 | | | 468,031 |
| | | | | | |
Turkey — 0.1% | | | | | | |
Republic of Turkey, | | | | | | |
6.75%, 4/03/18 | | | 530 | | | 578,336 |
| | | | | | |
Uruguay — 0.0% | | | | | | |
Republica Orient Uruguay, | | | | | | |
7.63%, 3/21/36 | | | 165 | | | 186,862 |
| | | | | | |
Venezuela — 0.3% | | | | | | |
Republic of Venezuela: | | | | | | |
8.50%, 10/08/14 | | | 200 | | | 174,000 |
9.25%, 9/15/27 | | | 1,000 | | | 782,500 |
9.38%, 1/13/34 | | | 600 | | | 439,500 |
| | | | | | |
| | | | | | 1,396,000 |
| | | | | | |
Total Foreign Government Obligations — 1.5% | | | | | | 8,495,284 |
| | | | | | |
Non-Agency Mortgage-Backed Securities | | | | | | |
Collateralized Mortgage Obligations — 3.1% | | | | | | |
CitiMortgage Alternative Loan Trust, Series 2007-A8, Class A1, | | | | | | |
6.00%, 10/25/37 | | | 1,081 | | | 816,526 |
Countrywide Alternative Loan Trust, Series 2005-21CB, Class A17, | | | | | | |
6.00%, 6/25/35 | | | 1,060 | | | 967,247 |
Countrywide Home Loan Mortgage Pass-Through Trust: | | | | | | |
Series 2003-27, Class M, 4.03%, 6/25/33(a) | | | 481 | | | 30,736 |
Series 2003-56, Class 4A1, 4.89%, 12/25/33(a) | | | 974 | | | 940,097 |
Series 2003-58, Class B1, 3.74%, 2/19/34(a) | | | 117 | | | 37,275 |
Series 2006-J2, Class 1A1, 6.00%, 4/25/36 | | | 849 | | | 716,868 |
Series 2006-J4, Class A9, 6.25%, 9/25/36 | | | 878 | | | 798,054 |
Series 2007-J3, Class A10, 6.00%, 7/25/37(a) | | | 875 | | | 650,022 |
Series 2006-OA5, Class 3A1, 0.45%, 4/25/46(a) | | | 381 | | | 208,079 |
Credit Suisse Mortgage Capital Certificates, Series 2006-8, Class 3A1, | | | | | | |
6.00%, 10/25/21 | | | 207 | | | 153,875 |
First Horizon Asset Securities, Inc., Series 2005-AR3, Class 3A1, | | | | | | |
5.50%, 8/25/35(a) | | | 145 | | | 128,179 |
GMAC Mortgage Corp. Loan Trust, Series 2006-AR1, Class 2A1, | | | | | | |
5.55%, 4/19/36(a) | | | 979 | | | 774,469 |
Harborview Mortgage Loan Trust, Series 2005-10, Class 2A1A, | | | | | | |
0.55%, 11/19/35(a) | | | 604 | | | 364,969 |
Homebanc Mortgage Trust, Series 2006-2, Class A1, | | | | | | |
0.43%, 12/25/36 (a) | | | 449 | | | 302,796 |
Impac Commercial Mortgage Backed Trust: | | | | | | |
Series 2004-5, Class 1A1, 0.61%, 10/25/34(a) | | | 68 | | | 54,802 |
Series 2004-7, Class 1A1, 0.99%, 11/25/34(a) | | | 169 | | | 123,715 |
Series 2004-7, Class M4, 2.05%, 11/25/34(a) | | | 56 | | | 11,756 |
JPMorgan Mortgage Trust: | | | | | | |
Series 2007-S1, Class 1A2, 5.50%, 3/25/22 | | | 106 | | | 100,767 |
Series 2006-S2, Class 2A2, 5.88%, 7/25/36 | | | 107 | | | 98,109 |
MASTR Alternative Loans Trust, Series 2004-4, Class 1A1, | | | | | | |
5.50%, 5/25/34 | | | 96 | | | 95,719 |
Residential Accredit Loans, Inc., Series 2006-QO2, Class A1, | | | | | | |
0.47%, 2/25/46(a) | | | 272 | | | 108,056 |
Residential Funding Mortgage Securities I: | | | | | | |
Series 2005-S8, Class A1, 5.50%, 11/25/35 | | | 893 | | | 792,892 |
Series 2007-S4, Class A2, 6.00%, 4/25/37 | | | 997 | | | 802,379 |
Station Place Securitization Trust, Series 2009-1, Class A, | | | | | | |
1.75%, 12/29/10(a)(b) | | | 855 | | | 852,862 |
Structured Adjustable Rate Mortgage Loan Trust, Series 2007-3, Class 2A1, | | | | | | |
5.64%, 4/25/37(a) | | | 1,170 | | | 790,241 |
Structured Asset Securities Corp.: | | | | | | |
Series 2001-21A, Class B2, 2.56%, 1/25/32(a) | | | 5 | | | 2,574 |
Series 2003-2A, Class B2II, 2.69%, 2/25/33(a) | | | 47 | | | 14,301 |
WaMu Mortgage Pass-Through Certificates: | | | | | | |
Series 2003-AR3, Class B2, 2.64%, 4/25/33(a) | | | 41 | | | 15,155 |
Series 2003-AR5, Class B2, 2.87%, 6/25/33(a) | | | 139 | | | 39,778 |
Series 2003-AR8, Class B1, 2.85%, 8/25/33(a) | | | 159 | | | 83,941 |
Series 2004-AR1, Class B1, 2.78%, 3/25/34(a) | | | 727 | | | 204,447 |
Series 2004-AR3, Class B1, 3.08%, 6/25/34(a) | | | 175 | | | 85,460 |
Series 2006-AR18, Class 1A1, 5.27%, 1/25/37(a) | | | 752 | | | 558,045 |
Series 2007-HY7, Class 4A1, 5.84%, 7/25/37(a) | | | 2,463 | | | 1,907,874 |
Series 2007-OA4, Class 1A, 1.23%, 5/25/47(a) | | | 247 | | | 146,344 |
Wells Fargo Mortgage-Backed Securities Trust: | | | | | | |
Series 2005-AR15, Class 2A1, 5.10%, 9/25/35(a) | | | 1,522 | | | 1,416,665 |
Series 2006-AR2, Class 2A5, 4.96%, 3/25/36(a) | | | 1,633 | | | 1,352,498 |
Series 2006-AR10, Class 3A1, 4.06%, 7/25/36(a) | | | 964 | | | 797,410 |
Series 2006-AR12, Class 2A1, 6.04%, 9/25/36(a) | | | 287 | | | 241,857 |
| | | | | | |
| | | | | | 17,586,839 |
| | | | | | |
Commercial Mortgage-Backed Securities — 3.5% | | | | | | |
Bank of America-First Union National Bank Commercial Mortgage, Series 2001-3, Class A2, | | | | | | |
5.46%, 4/11/37 | | | 1,361 | | | 1,412,606 |
Bear Stearns Commercial Mortgage Securities: | | | | | | |
Series 2000-WF2, Class A2, 7.32%, 10/15/32(a) | | | 300 | | | 303,556 |
Series 2002-TOP6, Class A1, 5.92%, 10/15/36 | | | 133 | | | 134,714 |
Series 2003-T12, Class A4, 4.68%, 8/13/39(a) | | | 1,025 | | | 1,066,812 |
See Notes to Financial Statements.
| | | | | | |
| 20 | | BLACKROCK ASSET ALLOCATION PORTFOLIO | | MARCH 31, 2010 | | |
| | |
| Schedule of Investments (continued) | | |
| | (Percentages shown are based on Net Assets) |
| | | | | | |
| | | Par
(000) | | Value |
Non-Agency Mortgage-Backed Securities | | | | | | |
Commercial Mortgage-Backed Securities (concluded) | | | | | | |
Commercial Mortgage Acceptance Corp., Series 1998-C2, Class. E, | | | | | | |
6.86%, 6/10/10(a) | | USD | 742 | | $ | 742,008 |
Commercial Mortgage Pass-Through Certificates, Series 2004-LB3A, Class A3, | | | | | | |
5.09%, 7/10/37(a) | | | 515 | | | 530,815 |
Credit Suisse First Boston Mortgage Securities Corp.: | | | | | | |
Series 2002-CKS4, Class A2, 5.18%, 8/15/12 | | | 1,090 | | | 1,145,784 |
Series 2002-CP5, Class A2, 4.94%, 12/15/35 | | | 1,010 | | | 1,059,071 |
Series 2001-CP4, Class D, 6.61%, 12/15/35 | | | 1,450 | | | 1,459,649 |
Series 2002-CKN2, Class A3, 6.13%, 4/15/37 | | | 1,000 | | | 1,061,907 |
Series 2003-C3, Class A5, 3.94%, 5/15/38 | | | 1,020 | | | 1,038,992 |
First Union National Bank Commercial Mortgage: | | | | | | |
Series 2001-C4, Class A2, 6.22%, 12/12/33 | | | 1,140 | | | 1,197,309 |
Series 2001-C2, Class A2, 6.66%, 1/12/43 | | | 850 | | | 876,572 |
GE Business Loan Trust: | | | | | | |
Series 2003-1, Class A, 0.66%, 4/15/31(a)(b) | | | 118 | | | 103,503 |
Series 2003-1, Class B, 1.53%, 4/15/31(a)(b) | | | 78 | | | 41,558 |
Series 2003-2A, Class B, 1.23%, 11/15/31(a)(b) | | | 525 | | | 368,460 |
Series 2004-1, Class B, 0.93%, 5/15/32(a)(b) | | | 122 | | | 74,757 |
GMAC Commercial Mortgage Securities, Inc., Series 2000-C3, Class A2, | | | | | | |
6.96%, 11/15/10 | | | 1,201 | | | 1,224,172 |
LB Commercial Conduit Mortgage Trust, Series 1999-C2, Class E, | | | | | | |
7.47%, 10/15/32 | | | 52 | | | 52,285 |
LB-UBS Commercial Mortgage Trust: | | | | | | |
Series 2001-WM, Class A1, 6.16%, 7/14/11(b) | | | 239 | | | 247,299 |
Series 2001-C7, Class A4, 5.93%, 12/15/25 | | | 260 | | | 266,800 |
Morgan Stanley Capital I: | | | | | | |
Series 2003-IQ4, Class A2, 4.07%, 5/15/40 | | | 1,025 | | | 1,051,611 |
Series 2005-HQ6, Class A4A, 4.99%, 8/13/42 | | | 2,405 | | | 2,448,832 |
Morgan Stanley Dean Witter Capital I: | | | | | | |
Series 2001-TOP1, Class A4, 6.66%, 2/15/33 | | | 780 | | | 798,887 |
Series 2002-TOP7, Class A1, 5.38%, 1/15/39 | | | 30 | | | 30,362 |
Salomon Brothers Mortgage Securities VII, Inc., Series 2000-C3, Class A2, | | | | | | |
6.59%, 11/18/10 | | | 621 | | | 626,627 |
Wachovia Bank Commercial Mortgage Trust, Series 2005-C21, Class A3, | | | | | | |
5.21%, 10/15/44(a) | | | 490 | | | 496,384 |
| | | | | | |
| | | | | | 19,861,332 |
| | | | | | |
Interest Only Collateralized Mortgage Obligations — 0.0% | | | | | | |
Salomon Brothers Mortgage Securities VI, Inc.: | | | | | | |
Series 1987-1, 11.00%, 2/17/17 | | | 17 | | | 2,305 |
Series 1987-2, 11.00%, 3/06/17 | | | 15 | | | 2,583 |
| | | | | | |
| | | | | | 4,888 |
| | | | | | |
Interest Only Commercial Mortgage-Backed Securities — 0.0% | | | | | | |
Structured Asset Securities Corp., Series 1996-CFL, Class X1, | | | | | | |
2.19%, 2/25/28(a) | | | 333 | | | — |
WaMu Commercial Mortgage Securities Trust, Series 2005-C1A, Class X, | | | | | | |
1.99%, 5/25/36(a)(b) | |
| 4,125
| | | 104,224 |
| | | | | | |
| | | | | | 104,224 |
| | | | | | |
Principal Only Collateralized Mortgage Obligations — 0.0% | | | | | | |
Salomon Brothers Mortgage Securities VI, Inc.: | | | | | | |
Series 1987-1, 0.64%, 2/17/17(l) | | | 19 | | | 18,072 |
Series 1987-2, 0.94%, 3/06/17(l) | | | 15 | | | 14,260 |
| | | | | | |
| | | | | | 32,332 |
| | | | | | |
Total Non-Agency Mortgage-Backed Securities — 6.6% | | | | | | 37,589,615 |
| | | | | | |
Preferred Securities | | | | | | |
Capital Trusts | | | | | | |
Commercial Banks — 0.1% | | | | | | |
Barclays Bank Plc, | | | | | | |
7.43%(a)(b)(m) | | | 350 | | | 344,750 |
Diversified Financial Services — 0.2% | | | | | | |
Credit Suisse/Guernsey, | | | | | | |
5.86%(a)(m) | | | 530 | | | 496,875 |
Goldman Sachs Capital II, | | | | | | |
5.79%(a)(m) | | | 300 | | | 254,250 |
JPMorgan Chase & Co., | | | | | | |
7.90%(a)(m) | | | 195 | | | 207,889 |
Lehman Brothers Holdings Capital Trust VII, | | | | | | |
5.86%(a)(e)(h)(m) | | | 110 | | | 275 |
| | | | | | |
| | | | | | 959,289 |
| | | | | | |
Insurance — 0.1% | | | | | | |
Chubb Corp., | | | | | | |
6.38%, 3/29/67(a) | | | 175 | | | 176,094 |
MetLife, Inc., | | | | | | |
6.40%, 12/15/36 | | | 390 | | | 349,050 |
The Progressive Corp., | | | | | | |
6.70%, 6/15/37(a) | | | 310 | | | 304,379 |
| | | | | | |
| | | | | | 829,523 |
| | | | | | |
Total Preferred Securities — 0.4% | | | | | | 2,133,562 |
| | | | | | |
Taxable Municipal Bonds | | | | | | |
The Board of Trustees of The Leland Stanford Junior University, | | | | | | |
4.25%, 5/01/16 | | | 275 | | | 284,058 |
Metropolitan Transportation Authority New York RB, | | | | | | |
7.34%, 11/15/39 | | | 395 | | | 457,667 |
New York State Dormitory Authority RB, Series F, | | | | | | |
5.63%, 3/15/39 | | | 275 | | | 270,124 |
Port Authority of New York & New Jersey RB, | | | | | | |
6.04%, 12/01/29 | | | 205 | | | 211,683 |
State of California GO, | | | | | | |
7.30%, 10/01/39 | | | 375 | | | 376,264 |
State of California Various Purpose GO, | | | | | | |
5.45%, 4/01/15 | | | 1,450 | | | 1,488,280 |
State of Texas GO, 5.52%, 4/01/39 | | | 675 | | | 670,842 |
| | | | | | |
Total Taxable Municipal Bonds — 0.6% | | | | | | 3,758,918 |
| | | | | | |
See Notes to Financial Statements.
| | | | | | |
| | | BLACKROCK ASSET ALLOCATION PORTFOLIO | | MARCH 31, 2010 | | 21 |
| | |
| Schedule of Investments (continued) | | |
| | (Percentages shown are based on Net Assets) |
| | | | | | |
| | | Par
(000) | | Value |
U.S. Government Sponsored Agency Securities | | | | | | |
Agency Obligations — 1.7% | | | | | | |
Fannie Mae, | | | | | | |
2.63%, 11/20/14(n) | | USD | 1,070 | | $ | 1,070,069 |
Federal Home Loan Bank: | | | | | | |
5.63%, 6/13/16(o) | | | 890 | | | 934,763 |
5.38%, 5/15/19(n) | | | 2,005 | | | 2,189,654 |
Freddie Mac: | | | | | | |
1.13%, 12/15/11(n) | | | 2,860 | | | 2,866,532 |
1.75%, 6/15/12(o) | | | 600 | | | 605,795 |
5.25%, 4/18/16(n) | | | 760 | | | 840,596 |
Resolution Funding Corp. Interest Strip: | | | | | | |
4.22%, 7/15/18(l) | | | 150 | | | 106,083 |
4.29%, 10/15/18(l) | | | 150 | | | 104,391 |
Small Business Administration Participation Certificates, Series 1997-20F, Class 1, | | | | | | |
7.20%, 6/01/17 | | | 241 | | | 265,473 |
Tennessee Valley Authority, | | | | | | |
5.25%, 9/15/39 | | | 895 | | | 885,046 |
| | | | | | |
| | | | | | 9,868,402 |
| | | | | | |
Collateralized Mortgage Obligations — 0.0% | | | | | | |
Fannie Mae, Series 2004-88, Class HA, | | | | | | |
6.50%, 7/25/34 | | | 27 | | | 28,729 |
Freddie Mac, Series 2864, Class NA, | | | | | | |
5.50%, 1/15/31 | | | 73 | | | 77,362 |
| | | | | | |
| | | | | | 106,091 |
| | | | | | |
Federal Deposit Insurance Corporation Guaranteed — 1.4% | | | | | | |
Citibank, N.A., | | | | | | |
1.75%, 12/28/12 | | | 1,190 | | | 1,193,383 |
Citigroup Funding, Inc.: | | | | | | |
2.13%, 7/12/12 | | | 755 | | | 768,539 |
1.88%, 10/22/12 | | | 1,500 | | | 1,511,967 |
General Electric Capital Corp.: | | | | | | |
2.00%, 9/28/12 | | | 950 | | | 962,932 |
2.13%, 12/21/12 | | | 2,060 | | | 2,086,951 |
2.63%, 12/28/12 | | | 1,250 | | | 1,283,635 |
| | | | | | |
| | | | | | 7,807,407 |
| | | | | | |
Interest Only Collateralized Mortgage Obligations — 0.2% | | | | | | |
Fannie Mae, Series 2003-T1, Class R, | | | | | | |
0.51%, 11/25/12(a) | | | 6,230 | | | 71,964 |
Ginnie Mae: | | | | | | |
Series 2009-16, Class SL, 7.10%, 1/20/37 | | | 1,719 | | | 208,739 |
Series 2007-9, Class BI, 6.58%, 3/20/37 | | | 1,441 | | | 150,546 |
Series 2009-26, Class SC, 6.17%, 1/16/38(a) | | | 1,435 | | | 168,636 |
Series 2009-47, Class KS, 5.82%, 6/16/39 | | | 4,031 | | | 361,305 |
| | | | | | |
| | | | | | 961,190 |
| | | | | | |
Mortgage-Backed Securities — 27.3% | | | | | | |
Fannie Mae Mortgage-Backed Securities: | | | | | | |
6.00%, 9/01/11-9/01/39 | | | 4,688 | | | 5,061,525 |
7.00%, 8/01/14-1/01/16 | | | 86 | | | 91,800 |
5.50%, 4/01/17-2/01/40(i) | | | 18,594 | | | 19,680,664 |
4.00%, 4/01/25-4/01/40(p) | | | 4,200 | | | 4,188,063 |
5.00%, 4/01/25-4/01/40(p) | | | 17,100 | | | 17,752,531 |
5.50%, 4/01/25-6/01/40(p) | | | 33,900 | | | 35,685,531 |
7.50%, 10/01/25(d) | | | — | | | 4 |
2.58%, 12/01/34(a) | | | 588 | | | 605,632 |
5.00%, 6/01/35-4/01/40 | | | 11,250 | | | 11,633,625 |
4.50%, 4/01/40-5/01/40(p) | | | 34,400 | | | 34,448,438 |
6.00%, 4/01/40-5/01/40(p) | | | 6,400 | | | 6,792,375 |
6.50%, 4/01/40(p) | | | 3,300 | | | 3,576,375 |
Freddie Mac Mortgage-Backed Securities: | | | | | | |
4.00%, 5/01/10 | | | 32 | | | 31,755 |
6.00%, 4/01/13-3/01/38 | | | 3,356 | | | 3,605,766 |
9.50%, 12/01/22 | | | 119 | | | 139,050 |
8.00%, 2/01/23-8/01/27 | | | 14 | | | 16,268 |
5.00%, 4/01/25(p) | | | 700 | | | 739,156 |
5.50%, 8/01/33-2/01/40 | | | 960 | | | 1,015,050 |
5.05%, 12/01/35(a) | | | 343 | | | 356,294 |
5.04%, 4/01/38(a) | | | 777 | | | 815,577 |
6.00%, 2/01/40-4/01/40(p) | | | 5,600 | | | 6,006,312 |
Ginnie Mae Mortgage-Backed Securities: | | | | | | |
7.50%, 12/15/10 | | | 4 | | | 4,240 |
5.50%, 4/15/33-8/15/33 | | | 364 | | | 387,632 |
5.00%, 10/20/33 | | | 801 | | | 836,676 |
2.75%, 5/20/34(a) | | | 98 | | | 99,540 |
5.00%, 4/01/40(p) | | | 800 | | | 830,500 |
| | | | | | |
| | | | | | 154,400,379 |
| | | | | | |
Total U.S. Government Sponsored Agency Securities — 30.6% | | | | | | 173,143,469 |
| | | | | | |
U.S. Treasury Obligations | | | | | | |
U.S. Treasury Bonds: | | | | | | |
8.88%, 8/15/17 | | | 4,150 | | | 5,654,375 |
8.75%, 5/15/20(n) | | | 1,200 | | | 1,691,250 |
8.75%, 8/15/20 | | | 750 | | | 1,060,078 |
8.13%, 5/15/21(n) | | | 2,900 | | | 3,971,640 |
8.13%, 8/15/21(n) | | | 345 | | | 473,405 |
8.00%, 11/15/21(n) | | | 2,500 | | | 3,406,250 |
4.25%, 5/15/39(n)(o) | | | 2,020 | | | 1,871,655 |
4.50%, 8/15/39(n) | | | 1,215 | | | 1,173,234 |
4.63%, 2/15/40 | | | 1,000 | | | 985,625 |
U.S. Treasury Notes: | | | | | | |
0.88%, 2/29/12(n) | | | 11,285 | | | 11,261,640 |
1.00%, 3/31/12(n) | | | 2,235 | | | 2,233,950 |
2.38%, 2/28/15(n) | | | 10,295 | | | 10,224,273 |
3.63%, 2/15/20(n) | | | 18,330 | | | 18,017,822 |
U.S. Treasury Strips, | | | | | | |
0.00%, 8/15/20(n)(o) | | | 3,240 | | | 2,090,581 |
| | | | | | |
Total U.S. Treasury Obligations — 11.3% | | | | | | 64,115,778 |
| | | | | | |
| | |
| | | Shares | | |
Warrants | | | | | | |
Fonciere Des Regions (issued/exercisable | | | | | | |
12/17/09, 1 share for 1 warrants, Expires | | | | | | |
12/31/10, strike price 65.00 EUR)(e) | | | 2,600 | | | 2,915 |
Unione di Banche Italiane ScpA (issued/exercisable 5/18/09, 1 share for 20 warrants, Expires 6/30/11, strike price 12.30 EUR)(e) | | | 8,600 | | | 425 |
| | | | | | |
Total Warrants — 0.0% | | | | | | 3,340 |
| | | | | | |
Total Long-Term Investments
(Cost — $632,990,234) — 124.5% | | | | | | 705,576,940 |
| | | | | | |
See Notes to Financial Statements.
| | | | | | |
| 22 | | BLACKROCK ASSET ALLOCATION PORTFOLIO | | MARCH 31, 2010 | | |
| | |
| Schedule of Investments (continued) | | |
| | (Percentages shown are based on Net Assets) |
| | | | | | | |
| | | Shares/
Beneficial
Interest | | | Value | |
Short-Term Securities | | | | | | | |
Money Market Funds — 6.0% | | | | | | | |
BlackRock Liquidity Funds, TempFund, Institutional Class, | | | | | | | |
0.11%(k)(q) | | 31,897,347 | | | $ | 31,897,347 | |
BlackRock Liquidity Series, LLC Money Market Series, | | | | | | | |
0.22%(k)(q)(r) | | 1,893,500 | | | | 1,893,500 | |
| | | | | | | |
| | | | | | 33,790,847 | |
| | | | | | | |
| | |
| | | Par
(000) | | | | |
Borrowed Bond Agreements — 1.0% | | | | | | | |
Barclays Bank Plc, | | | | | | | |
0.14%, 6/30/10 | | USD 5,675 | | | | 5,675,125 | |
| | | | | | | |
Total Short-Term Securities
(Cost — $39,465,972) — 7.0% | | | | | | 39,465,972 | |
| | | | | | | |
| | |
| | | Contracts | | | | |
Options Purchased | | | | | | | |
Exchange-Traded Put Options Purchased | | | | | | | |
3-month Euro-Dollar Futures, Strike Price USD 98.75, Expires 9/13/10 | | 121 | | | | 5,294 | |
| | | | | | | |
Over-the-Counter Call Swaptions Purchased Receive a fixed rate of 1.120% and pay a floating rate based on 3-month LIBOR, Expires 4/26/10, Broker, Morgan Stanley Capital Services, Inc. | | 1,200 | (s) | | | 6,122 | |
Receive a fixed rate of 1.150% and pay a floating rate based on 3-month LIBOR, Expires 9/03/10, Broker, Deutsche Bank AG | | 1,350 | (s) | | | 40,684 | |
Receive a fixed rate of 1.200% and pay a floating rate based on 3-month LIBOR, Expires 9/02/10, Broker, Citibank, N.A. | | 1,350 | (s) | | | 45,619 | |
Receive a fixed rate of 2.905% and pay a floating rate based on 3-month LIBOR, Expires 1/31/11, Broker, JPMorgan Chase Bank, N.A. | | 870 | (s) | | | 126,304 | |
Receive a fixed rate of 4.185% and pay a floating rate based on 3-month LIBOR, Expires 3/04/11, Broker, Deutsche Bank AG | | 260 | (s) | | | 75,602 | |
Receive a fixed rate of 4.250% and pay a floating rate based on 3-month LIBOR, Expires 5/14/10, Broker, Royal Bank of Scotland Plc | | 290 | (s) | | | 13,503 | |
| | | | | | | |
| | | | | | 307,834 | |
| | | | | | | |
Over-the-Counter Put Swaptions Purchased | | | | | | | |
Pay a fixed rate of 1.915% and receive a floating rate based on 3-month LIBOR, Expires 9/02/10, Broker, Morgan Stanley Capital Services, Inc. | | 1,350 | (s) | | | 5,697 | |
Pay a fixed rate of 1.945% and receive a floating rate based on 3-month LIBOR, Expires 9/03/10, Broker, Citibank, N.A. | | 1,350 | (s) | | | 5,564 | |
Pay a fixed rate of 2.905% and receive a floating rate based on 3-month LIBOR, Expires 1/31/11, Broker, JPMorgan Chase Bank, N.A. | | 870 | (s) | | | 82,886 | |
Pay a fixed rate of 4.185% and receive a floating rate based on 3-month LIBOR, Expires 3/04/11, Broker, Deutsche Bank AG | | 260 | (s) | | | 101,175 | |
Pay a fixed rate of 5.035% and receive a floating rate based on 3-month LIBOR, Expires 10/15/12, Broker, JPMorgan Chase Bank, N.A. | | 1,450 | (s) | | | 712,519 | |
Pay a fixed rate of 5.090% and receive a floating rate based on 3-month LIBOR, Expires 10/29/12, Broker, Credit Suisse International | | 230 | (s) | | | 109,939 | |
Pay a fixed rate of 5.250% and receive a floating rate based on 3-month LIBOR, Expires 5/07/10, Broker, JPMorgan Chase Bank, N.A. | | 2,130 | (s) | | | 39 | |
| | | | | | | |
| | | | | | 1,017,819 | |
| | | | | | | |
Total Options Purchased
(Cost — $1,759,904) — 0.2% | | | | | | 1,330,947 | |
| | | | | | | |
Total Investments Before Borrowed Bonds, TBA Sale Commitments and Options Written
(Cost — $674,216,110*) — 131.7% | | | | | | 746,373,859 | |
| | | | | | | |
| | |
| | | Par
(000) | | | | |
Borrowed Bonds | | | | | | | |
U.S. Treasury Bonds, | | | | | | | |
8.88%, 8/15/17 | | USD 4,150 | | | | (5,654,375 | ) |
| | | | | | | |
Total Borrowed Bonds
(Proceeds — $5,670,909) — (1.0)% | | | | | | (5,654,375 | ) |
| | | | | | | |
TBA Sale Commitments (p) | | | | | | | |
Fannie Mae Mortgage-Backed Securities: | | | | | | | |
5.00%, 4/01/25-4/01/40 | | 18,700 | | | | (19,360,000 | ) |
4.50%, 4/01/40 | | 12,000 | | | | (12,026,250 | ) |
5.50%, 4/01/40-6/01/40(i) | | 37,202 | | | | (39,165,543 | ) |
6.00%, 4/01/40 | | 1,900 | | | | (2,012,219 | ) |
6.00%, 4/01/40 | | 1,400 | | | | (1,487,062 | ) |
Freddie Mac Mortgage-Backed Securities: | | | | | | | |
5.00%, 4/01/25 | | 700 | | | | (739,156 | ) |
5.50%, 4/01/40 | | 400 | | | | (421,000 | ) |
6.00%, 4/01/40-5/01/40 | | 8,800 | | | | (9,430,070 | ) |
| | | | | | | |
Total TBA Sale Commitments
(Proceeds — $84,756,947) — (14.9)% | | | | | | (84,641,300 | ) |
| | | | | | | |
| | |
| | | Contracts | | | | |
Options Written | | | | | | | |
Exchange-Traded Put Options Written | | | | | | | |
3-month Euro-Dollar Futures, Strike Price USD 98.25, Expires 9/13/10 | | 121 | | | | (2,269 | ) |
| | | | | | | |
Over-the-Counter Call Swaptions Written | | | | | | | |
Pay a fixed rate of 3.140% and receive a floating rate based on 3-month LIBOR, Expires 4/02/10, Broker, Barclays Bank Plc | | 150 | (s) | | | — | |
Pay a fixed rate of 3.600% and receive a floating rate based on 3-month LIBOR, Expires 4/19/10, Broker, Goldman Sachs Bank USA | | 190 | (s) | | | (2,306 | ) |
Pay a fixed rate of 3.600% and receive a floating rate based on 3-month LIBOR, Expires 5/07/10, Broker, JPMorgan Chase Bank, N.A. | | 160 | (s) | | | (3,973 | ) |
Pay a fixed rate of 3.600% and receive a floating rate based on 3-month LIBOR, Expires 5/24/10, Broker, Morgan Stanley Capital Services, Inc. | | 190 | (s) | | | (6,784 | ) |
See Notes to Financial Statements.
| | | | | | |
| | | BLACKROCK ASSET ALLOCATION PORTFOLIO | | MARCH 31, 2010 | | 23 |
| | |
| Schedule of Investments (continued) | | |
| | (Percentages shown are based on Net Assets) |
| | | | | | | |
| | | Contracts | | | Value | |
Options Written | | | | | | | |
Over-the-Counter Call Swaptions Written (concluded) | | | | | | | |
Pay a fixed rate of 3.600% and receive a floating rate based on 3-month LIBOR, Expires 5/24/10, Broker, Morgan Stanley Capital Services, Inc. | | 310 | (s) | | $ | (11,069 | ) |
Pay a fixed rate of 3.800% and receive a floating rate based on 3-month LIBOR, Expires 5/28/10, Broker, Morgan Stanley Capital Services, Inc. | | 300 | (s) | | | (27,356 | ) |
Pay a fixed rate of 4.123% and receive a floating rate based on 3-month LIBOR, Expires 8/27/10, Broker, Morgan Stanley Capital Services, Inc. | | 160 | (s) | | | (41,717 | ) |
Pay a fixed rate of 4.490% and receive a floating rate based on 3-month LIBOR, Expires 12/05/11, Broker, Deutsche Bank AG | | 210 | (s) | | | (82,654 | ) |
Pay a fixed rate of 4.800% and receive a floating rate based on 3-month LIBOR, Expires 6/11/10, Broker, Citibank, N.A. | | 280 | (s) | | | (210,834 | ) |
Pay a fixed rate of 4.840% and receive a floating rate based on 3-month LIBOR, Expires 12/03/14, Broker, JPMorgan Chase Bank, N.A. | | 130 | (s) | | | (60,719 | ) |
Pay a fixed rate of 4.890% and receive a floating rate based on 3-month LIBOR, Expires 12/03/14, Broker, Deutsche Bank AG | | 150 | (s) | | | (72,275 | ) |
Pay a fixed rate of 4.895% and receive a floating rate based on 3-month LIBOR, Expires 3/04/13, Broker, Deutsche Bank AG | | 260 | (s) | | | (132,416 | ) |
Pay a fixed rate of 4.920% and receive a floating rate based on 3-month LIBOR, Expires 3/05/13, Broker, Deutsche Bank AG | | 200 | (s) | | | (103,705 | ) |
Pay a fixed rate of 5.400% and receive a floating rate based on 3-month LIBOR, Expires 12/15/10, Broker, UBS AG | | 260 | (s) | | | (273,520 | ) |
| | | | | | | |
| | | | | | (1,029,328 | ) |
| | | | | | | |
Over-the-Counter Put Swaptions Written | | | | | | | |
Pay a fixed rate of 4.840% and receive a floating rate based on 3-month LIBOR, Expires 12/03/14, Broker, JPMorgan Chase Bank, N.A. | | 130 | (s) | | | (101,455 | ) |
Receive a fixed rate of 3.140% and pay a floating rate based on 3-month LIBOR, Expires 4/02/10, Broker, Barclays Bank Plc | | 150 | (s) | | | (86,604 | ) |
Receive a fixed rate of 3.900% and pay a floating rate based on 3-month LIBOR, Expires 4/19/10, Broker, Goldman Sachs Bank USA | | 190 | (s) | | | (9,516 | ) |
Receive a fixed rate of 4.100% and pay a floating rate based on 3-month LIBOR, Expires 5/07/10, Broker, JPMorgan Chase Bank, N.A. | | 160 | (s) | | | (5,914 | ) |
Receive a fixed rate of 4.100% and pay a floating rate based on 3-month LIBOR, Expires 5/24/10, Broker, Morgan Stanley Capital Services, Inc. | | 190 | (s) | | | (11,566 | ) |
Receive a fixed rate of 4.100% and pay a floating rate based on 3-month LIBOR, Expires 5/24/10, Broker, Morgan Stanley Capital Services, Inc. | | 310 | (s) | | | (18,871 | ) |
Receive a fixed rate of 4.123% and pay a floating rate based on 3-month LIBOR, Expires 8/27/10, Broker, Morgan Stanley Capital Services, Inc. | | 160 | (s) | | | (29,964 | ) |
Receive a fixed rate of 4.490% and pay a floating rate based on 3-month LIBOR, Expires 12/05/11, Broker, Deutsche Bank AG | | 210 | (s) | | | (106,818 | ) |
Receive a fixed rate of 4.500% and pay a floating rate based on 3-month LIBOR, Expires 5/28/10, Broker, Morgan Stanley Capital Services, Inc. | | 300 | (s) | | | (4,006 | ) |
Receive a fixed rate of 4.800% and pay a floating rate based on 3-month LIBOR, Expires 6/11/10, Broker, Citibank, N.A. | | 280 | (s) | | | (1,937 | ) |
Receive a fixed rate of 4.890% and pay a floating rate based on 3-month LIBOR, Expires 12/03/14, Broker, Deutsche Bank AG | | 150 | (s) | | | (114,174 | ) |
Receive a fixed rate of 4.895% and pay a floating rate based on 3-month LIBOR, Expires 3/04/13, Broker, Deutsche Bank AG | | 260 | (s) | | | (155,926 | ) |
Receive a fixed rate of 4.920% and pay a floating rate based on 3-month LIBOR, Expires 3/05/13, Broker, Deutsche Bank AG | | 200 | (s) | | | (118,145 | ) |
Receive a fixed rate of 5.400% and pay a floating rate based on 3-month LIBOR, Expires 12/15/10, Broker, UBS AG | | 260 | (s) | | | (12,544 | ) |
Receive a fixed rate of 6.035% and pay a floating rate based on 3-month LIBOR, Expires 10/15/12, Broker, JPMorgan Chase Bank, N.A. | | 1,450 | (s) | | | (354,321 | ) |
Receive a fixed rate of 6.090% and pay a floating rate based on 3-month LIBOR, Expires 10/29/12, Broker, Credit Suisse International | | 230 | (s) | | | (54,866 | ) |
| | | | | | | |
| | | | | | (1,186,627 | ) |
| | | | | | | |
Total Options Written
(Premiums Received — $3,031,817) — (0.4)% | | | | | | (2,218,224 | ) |
| | | | | | | |
Total Investments Net of Borrowed Bonds, TBA Sale Commitments and Options Written — 115.4% | | | | | | 653,859,960 | |
Liabilities in Excess of Other Assets — (15.4)% | | | | | | (87,367,711 | ) |
| | | | | | | |
Net Assets — 100.0% | | | | | $ | 566,492,249 | |
| | | | | | | |
| * | The cost and unrealized appreciation (depreciation) of investments as of March 31, 2010, as computed for federal income tax purposes, were as follows: |
| | | | |
Aggregate cost | | $ | 684,587,461 | |
| | | | |
Gross unrealized appreciation | | $ | 77,113,259 | |
Gross unrealized depreciation | | | (15,326,861 | ) |
| | | | |
Net unrealized appreciation | | $ | 61,786,398 | |
| | | | |
| (a) | Variable rate security. Rate shown is as of report date. |
| (b) | Security exempt from registration under Rule 144A of the Securities Act of 1933. These securities may be resold in transactions exempt from registration to qualified institutional investors. |
| (c) | Represents a step-up bond that pays an initial coupon rate for the first period and then a higher coupon rate for the following periods. Rate shown is as of report date. |
| (d) | Par is less than $500. |
| (e) | Non-income producing security. |
| (f) | Restricted security as to resale. As of report date the Fund held 0.1% of its net assets, with a current value of $444,722 and an original cost of $294,486 in these securities. |
| (g) | Security, or a portion of security, is on loan. |
| (h) | Issuer filed for bankruptcy and/or is in default of interest payments. |
| (i) | Security, or a portion thereof, has been pledged as collateral for swap contracts. |
See Notes to Financial Statements.
| | | | | | |
| 24 | | BLACKROCK ASSET ALLOCATION PORTFOLIO | | MARCH 31, 2010 | | |
| | |
| Schedule of Investments (continued) | | |
| | |
| (j) | Represents a payment-in-kind security which may pay interest/dividends in additional face/shares. |
| (k) | Investments in companies considered to be an affiliate of the Fund, for purposes of Section 2(a)(3) of the Investment Company Act of 1940, were as follows: |
| | | | | | | | | | |
Affiliate | | Net
Activity | | | Realized
Gain | | Income |
BlackRock Liquidity Funds, TempFund, Institutional Class | | $ | (733,552 | ) | | $ | 133 | | $ | 22,685 |
BlackRock Liquidity Series, LLC Money Market Series | | $ | 645,000 | | | | — | | $ | 4,295 |
iShares Russell 2000 Value Index Fund | | | — | | | | — | | $ | 796 |
| (l) | Represents a zero-coupon bond. Rate shown reflects the current yield as of report date. |
| (m) | Security is perpetual in nature and has no stated maturity date. |
| (n) | All or a portion of security pledged as collateral for reverse repurchase agreements. |
| (o) | All or a portion of security pledged as collateral in connection with open financial futures contracts. |
| (p) | Represents or includes a to-be-announced (“TBA”) transaction. Unsettled TBA transactions as of report date were as follows: |
| | | | | | | | |
Counterparty | | Value | | | Unrealized
Appreciation
(Depreciation) | |
Bank of America, N.A. | | $ | (9,070,219 | ) | | $ | (19,661 | ) |
Barclays Bank Plc | | $ | 14,003,813 | | | $ | (45,875 | ) |
BNP Paribas | | $ | 1,924,125 | | | $ | (34,562 | ) |
Citibank, N.A. | | $ | 1,921,250 | | | $ | 1,918 | |
Credit Suisse International | | $ | 4,116,031 | | | $ | (41,712 | ) |
Deutsche Bank AG | | $ | (7,274,254 | ) | | $ | (2,968 | ) |
Goldman Sachs Bank USA | | $ | 16,350,055 | | | $ | 21,342 | |
JPMorgan Chase Bank, N.A. | | $ | 8,511,180 | | | $ | 13,637 | |
Morgan Stanley Capital Services, Inc. | | $ | (3,217,781 | ) | | $ | (42,434 | ) |
Royal Bank of Scotland Plc | | $ | (3,679,188 | ) | | $ | 10,906 | |
Wells Fargo, N.A. | | $ | 1,792,969 | | | $ | (3,719 | ) |
| (q) | Represents the current yield as of report date. |
| (r) | Security was purchased with the cash collateral from loaned securities. |
| (s) | One contract represents a notional amount of $10,000. |
| • | | Reverse repurchase agreements outstanding as of March 31, 2010 were as follows: |
| | | | | | | | | | | | | |
Counterparty | | Interest
Rate | | | Settlement
Date | | Maturity
Date | | Net Closing
Amount | | Par |
Credit Suisse International | | 0.19 | % | | 1/26/10 | | 6/30/10 | | $ | 5,736,439 | | $ | 5,731,750 |
Bank of America, N.A. | | 0.05 | % | | 3/04/10 | | Open | | $ | 1,026,320 | | | 1,026,281 |
Barclays Bank Plc | | 0.12 | % | | 3/05/10 | | Open | | $ | 6,303,415 | | | 6,302,869 |
Bank of America, N.A. | | 0.16 | % | | 3/05/10 | | Open | | $ | 1,514,875 | | | 1,514,700 |
JPMorgan Chase Bank, N.A. | | 0.15 | % | | 3/08/10 | | Open | | $ | 4,005,384 | | | 4,005,000 |
Bank of America, N.A. | | 0.17 | % | | 3/11/10 | | Open | | $ | 2,233,280 | | | 2,233,069 |
Bank of America, N.A. | | 0.17 | % | | 3/11/10 | | Open | | $ | 2,881,722 | | | 2,881,450 |
Bank of America, N.A. | | 0.17 | % | | 3/11/10 | | Open | | $ | 1,080,802 | | | 1,080,700 |
Bank of America, N.A. | | 0.17 | % | | 3/11/10 | | Open | | $ | 862,681 | | | 862,600 |
Bank of America, N.A. | | 0.05 | % | | 3/24/10 | | Open | | $ | 7,990,078 | | | 7,990,000 |
Credit Suisse International | | 0.20 | % | | 3/25/10 | | Open | | $ | 11,790,393 | | | 11,790,000 |
Barclays Bank Plc | | (0.12 | )% | | 3/31/10 | | 4/01/10 | | $ | 2,270,417 | | | 2,270,425 |
Royal Bank of Scotland Plc | | 0.00 | % | | 3/31/10 | | 4/01/10 | | $ | 2,232,206 | | | 2,232,206 |
JPMorgan Chase Bank, N.A. | | 0.00 | % | | 3/31/10 | | 4/01/10 | | $ | 3,276,788 | | | 3,276,788 |
Credit Suisse International | | 0.20 | % | | 3/31/10 | | 4/01/10 | | $ | 5,865,483 | | | 5,865,450 |
Barclays Bank Plc | | (0.02 | )% | | 4/01/10 | | 4/06/10 | | $ | 2,276,181 | | | 2,276,187 |
Barclays Bank Plc | | 0.19 | % | | 4/01/10 | | 4/06/10 | | $ | 5,791,153 | | | 5,791,000 |
Barclays Bank Plc | | 0.10 | % | | 4/01/10 | | Open | | $ | 2,235,000 | | | 2,235,000 |
JPMorgan Chase Bank, N.A. | | 0.12 | % | | 4/01/10 | | Open | | $ | 3,280,894 | | | 3,280,894 |
| | | | | | | | | | | | | |
Total | | | | | | | | | | | | $ | 72,646,369 |
| | | | | | | | | | | | | |
| • | | Foreign currency exchange contracts as of March 31, 2010 were as follows: |
| | | | | | | | | | | | |
Currency
Purchased | | Currency
Sold | | Counterparty | | Settlement
Date | | Unrealized
Appreciation
(Depreciation) | |
| CAD | 23,000 | | USD | 22,620 | | Citibank, N.A. | | 4/01/10 | | $ | 26 | |
| USD | 23,729 | | JPY | 2,198,000 | | Citibank, N.A. | | 4/01/10 | | | 219 | |
| BRL | 670,035 | | USD | 365,500 | | Royal Bank of Scotland Plc | | 4/05/10 | | | 10,883 | |
| BRL | 665,210 | | USD | 373,504 | | UBS AG | | 4/05/10 | | | 557 | |
| CAD | 55,000 | | USD | 54,198 | | Citibank, N.A. | | 4/05/10 | | | (46 | ) |
| USD | 376,213 | | BRL | 670,035 | | Royal Bank of Scotland Plc | | 4/05/10 | | | (561 | ) |
| USD | 365,500 | | BRL | 665,210 | | UBS AG | | 4/05/10 | | | (8,560 | ) |
| AUD | 114,000 | | USD | 104,584 | | Citibank, N.A. | | 4/06/10 | | | 29 | |
| EUR | 190,000 | | USD | 257,165 | | Citibank, N.A. | | 4/06/10 | | | (540 | ) |
| CAD | 153,000 | | USD | 149,123 | | Citibank, N.A. | | 4/07/10 | | | 1,519 | |
| CHF | 99,000 | | USD | 94,063 | | Citibank, N.A. | | 4/07/10 | | | (170 | ) |
| EUR | 35,000 | | USD | 47,537 | | Citibank, N.A. | | 4/07/10 | | | (263 | ) |
| HKD | 590,000 | | USD | 75,985 | | Deutsche Bank AG | | 4/07/10 | | | 4 | |
| USD | 40,411 | | CHF | 43,000 | | Citibank, N.A. | | 4/07/10 | | | (373 | ) |
| USD | 53,114 | | CHF | 56,000 | | Citibank, N.A. | | 4/07/10 | | | — | |
| USD | 78,724 | | DKK | 430,000 | | Citibank, N.A. | | 4/07/10 | | | 714 | |
| USD | 76,031 | | HKD | 590,000 | | Citibank, N.A. | | 4/07/10 | | | 38 | |
| CAD | 2,109,800 | | USD | 1,993,829 | | Citibank, N.A. | | 4/21/10 | | | 83,440 | |
| JPY | 3,779,000 | | USD | 41,807 | | Citibank, N.A. | | 4/21/10 | | | (1,381 | ) |
See Notes to Financial Statements.
| | | | | | |
| | | BLACKROCK ASSET ALLOCATION PORTFOLIO | | MARCH 31, 2010 | | 25 |
| | |
| Schedule of Investments (continued) | | |
| | |
| | | | | | | | | | | | |
Currency
Purchased | | Currency
Sold | | Counterparty | | Settlement
Date | | Unrealized
Appreciation
(Depreciation) | |
| USD | 26,272 | | CAD | 27,800 | | Citibank, N.A. | | 4/21/10 | | $ | (1,099 | ) |
| USD | 1,990,312 | | CAD | 2,082,000 | | Goldman Sachs Bank USA | | 4/21/10 | | | (59,585 | ) |
| USD | 509,987 | | GBP | 315,000 | | Morgan Stanley Capital Services, Inc. | | 4/21/10 | | | 32,036 | |
| AUD | 400,000 | | USD | 361,288 | | BNP Paribas | | 4/27/10 | | | 4,700 | |
| AUD | 2,319,000 | | USD | 2,125,850 | | Citibank, N.A. | | 4/27/10 | | | (4,038 | ) |
| CAD | 321,000 | | USD | 317,758 | | Citibank, N.A. | | 4/27/10 | | | (1,708 | ) |
| CAD | 355,000 | | USD | 348,388 | | Citibank, N.A. | | 4/27/10 | | | 1,138 | |
| CAD | 29,000 | | USD | 27,192 | | Citibank, N.A. | | 4/27/10 | | | 1,361 | |
| CAD | 71,000 | | USD | 67,319 | | Citibank, N.A. | | 4/27/10 | | | 2,586 | |
| CAD | 424,000 | | USD | 413,376 | | Citibank, N.A. | | 4/27/10 | | | 4,085 | |
| CAD | 288,000 | | USD | 282,381 | | Deutsche Bank AG | | 4/27/10 | | | 1,178 | |
| CAD | 392,000 | | USD | 373,679 | | Deutsche Bank AG | | 4/27/10 | | | 12,276 | |
| CAD | 480,000 | | USD | 450,705 | | Deutsche Bank AG | | 4/27/10 | | | 21,893 | |
| CAD | 83,000 | | USD | 78,593 | | Morgan Stanley Capital Services, Inc. | | 4/27/10 | | | 3,127 | |
| CHF | 1,152,000 | | USD | 1,116,279 | | Citibank, N.A. | | 4/27/10 | | | (23,482 | ) |
| CHF | 106,000 | | USD | 98,082 | | Citibank, N.A. | | 4/27/10 | | | 2,470 | |
| CHF | 169,000 | | USD | 157,533 | | Citibank, N.A. | | 4/27/10 | | | 2,782 | |
| DKK | 600,000 | | USD | 113,722 | | Morgan Stanley Capital Services, Inc. | | 4/27/10 | | | (4,887 | ) |
| EUR | 2,095,000 | | USD | 2,864,980 | | Citibank, N.A. | | 4/27/10 | | | (35,282 | ) |
| EUR | 99,000 | | USD | 135,995 | | Citibank, N.A. | | 4/27/10 | | | (2,277 | ) |
| EUR | 217,000 | | USD | 294,373 | | Citibank, N.A. | | 4/27/10 | | | (1,273 | ) |
| EUR | 15,000 | | USD | 20,634 | | Citibank, N.A. | | 4/27/10 | | | (374 | ) |
| EUR | 107,000 | | USD | 144,159 | | Citibank, N.A. | | 4/27/10 | | | 365 | |
| EUR | 41,000 | | USD | 56,063 | | Deutsche Bank AG | | 4/27/10 | | | (685 | ) |
| EUR | 66,000 | | USD | 89,760 | | Deutsche Bank AG | | 4/27/10 | | | (615 | ) |
| EUR | 56,000 | | USD | 75,654 | | Deutsche Bank AG | | 4/27/10 | | | (15 | ) |
| EUR | 23,000 | | USD | 32,470 | | Royal Bank of Scotland Plc | | 4/27/10 | | | (1,404 | ) |
| GBP | 153,000 | | USD | 236,068 | | Citibank, N.A. | | 4/27/10 | | | (3,929 | ) |
| GBP | 224,000 | | USD | 335,528 | | Deutsche Bank AG | | 4/27/10 | | | 4,335 | |
| HKD | 2,107,000 | | USD | 271,473 | | Deutsche Bank AG | | 4/27/10 | | | (45 | ) |
| JPY | 38,826,000 | | USD | 431,019 | | Citibank, N.A. | | 4/27/10 | | | (15,661 | ) |
| JPY | 8,467,000 | | USD | 93,466 | | Citibank, N.A. | | 4/27/10 | | | (2,887 | ) |
| JPY | 2,198,000 | | USD | 23,732 | | Citibank, N.A. | | 4/27/10 | | | (218 | ) |
| JPY | 30,803,000 | | USD | 343,852 | | Deutsche Bank AG | | 4/27/10 | | | (14,323 | ) |
| JPY | 16,859,000 | | USD | 187,415 | | Deutsche Bank AG | | 4/27/10 | | | (7,058 | ) |
| JPY | 15,712,000 | | USD | 174,289 | | Deutsche Bank AG | | 4/27/10 | | | (6,204 | ) |
| JPY | 40,895,000 | | USD | 452,794 | | UBS AG | | 4/27/10 | | | (15,302 | ) |
| NOK | 1,031,000 | | USD | 173,198 | | Deutsche Bank AG | | 4/27/10 | | | 63 | |
| SEK | 3,966,000 | | USD | 561,903 | | Citibank, N.A. | | 4/27/10 | | | (12,610 | ) |
| SEK | 278,000 | | USD | 38,949 | | Deutsche Bank AG | | 4/27/10 | | | (446 | ) |
| SEK | 296,000 | | USD | 39,859 | | Deutsche Bank AG | | 4/27/10 | | | 1,137 | |
| USD | 1,728,554 | | AUD | 1,966,500 | | Citibank, N.A. | | 4/27/10 | | | (70,733 | ) |
| USD | 151,460 | | AUD | 169,500 | | Citibank, N.A. | | 4/27/10 | | | (3,627 | ) |
| USD | 43,514 | | AUD | 50,000 | | Citibank, N.A. | | 4/27/10 | | | (2,234 | ) |
| USD | 118,173 | | AUD | 133,000 | | Deutsche Bank AG | | 4/27/10 | | | (3,518 | ) |
| USD | 206,599 | | CAD | 219,000 | | Citibank, N.A. | | 4/27/10 | | | (9,024 | ) |
| USD | 132,531 | | CAD | 138,500 | | Citibank, N.A. | | 4/27/10 | | | (3,833 | ) |
| USD | 348,410 | | CAD | 355,000 | | Citibank, N.A. | | 4/27/10 | | | (1,115 | ) |
| USD | 103,835 | | CAD | 105,000 | | Citibank, N.A. | | 4/27/10 | | | 455 | |
| USD | 190,263 | | CAD | 200,000 | | Deutsche Bank AG | | 4/27/10 | | | (6,653 | ) |
| USD | 55,316 | | CHF | 59,000 | | Citibank, N.A. | | 4/27/10 | | | (652 | ) |
| USD | 133,419 | | CHF | 141,000 | | Citibank, N.A. | | 4/27/10 | | | (335 | ) |
| USD | 94,078 | | CHF | 99,000 | | Citibank, N.A. | | 4/27/10 | | | 186 | |
| USD | 77,871 | | DKK | 422,000 | | Citibank, N.A. | | 4/27/10 | | | 1,323 | |
| USD | 129,631 | | DKK | 705,000 | | Citibank, N.A. | | 4/27/10 | | | 1,749 | |
| USD | 361,257 | | EUR | 270,000 | | BNP Paribas | | 4/27/10 | | | (3,429 | ) |
| USD | 239,548 | | EUR | 177,000 | | Citibank, N.A. | | 4/27/10 | | | 476 | |
| USD | 257,169 | | EUR | 190,000 | | Citibank, N.A. | | 4/27/10 | | | 544 | |
| USD | 230,586 | | EUR | 168,000 | | Citibank, N.A. | | 4/27/10 | | | 3,669 | |
| USD | 450,897 | | EUR | 331,000 | | Morgan Stanley & Co. | | 4/27/10 | | | 3,818 | |
| USD | 80,609 | | GBP | 53,000 | | Citibank, N.A. | | 4/27/10 | | | 195 | |
| USD | 52,480 | | GBP | 33,000 | | Citibank, N.A. | | 4/27/10 | | | 2,411 | |
| USD | 212,172 | | GBP | 135,000 | | Citibank, N.A. | | 4/27/10 | | | 7,343 | |
| USD | 397,098 | | GBP | 255,000 | | Citibank, N.A. | | 4/27/10 | | | 10,200 | |
| USD | 333,819 | | GBP | 213,000 | | Citibank, N.A. | | 4/27/10 | | | 10,645 | |
| USD | 236,092 | | GBP | 148,000 | | Citibank, N.A. | | 4/27/10 | | | 11,539 | |
| USD | 273,983 | | GBP | 169,000 | | Deutsche Bank AG | | 4/27/10 | | | 17,568 | |
| USD | 527,644 | | GBP | 346,000 | | Morgan Stanley & Co. | | 4/27/10 | | | 2,676 | |
| USD | 23,307 | | HKD | 181,000 | | Citibank, N.A. | | 4/27/10 | | | (9 | ) |
| USD | 24,463 | | HKD | 190,000 | | Deutsche Bank AG | | 4/27/10 | | | (13 | ) |
| USD | 75,996 | | HKD | 590,000 | | Deutsche Bank AG | | 4/27/10 | | | 7 | |
| USD | 320,730 | | HKD | 2,491,000 | | Morgan Stanley Capital Services, Inc. | | 4/27/10 | | | (165 | ) |
| USD | 259,116 | | JPY | 23,398,000 | | Citibank, N.A. | | 4/27/10 | | | 8,805 | |
| USD | 647,840 | | JPY | 59,020,000 | | Citibank, N.A. | | 4/27/10 | | | 16,448 | |
| USD | 31,214 | | JPY | 2,848,000 | | Deutsche Bank AG | | 4/27/10 | | | 746 | |
| USD | 1,486,275 | | JPY | 135,427,000 | | Deutsche Bank AG | | 4/27/10 | | | 37,486 | |
| USD | 234,959 | | NOK | 1,373,000 | | Deutsche Bank AG | | 4/27/10 | | | 4,224 | |
| USD | 194,142 | | NZD | 275,000 | | Citibank, N.A. | | 4/27/10 | | | (853 | ) |
See Notes to Financial Statements.
| | | | | | |
| 26 | | BLACKROCK ASSET ALLOCATION PORTFOLIO | | MARCH 31, 2010 | | |
| | |
| Schedule of Investments (continued) | | |
| | |
| | | | | | | | | | | |
Currency
Purchased | | Currency
Sold | | Counterparty | | Settlement
Date | | Unrealized
Appreciation
(Depreciation) |
| USD | 390,055 | | SGD | 543,000 | | Deutsche Bank AG | | 4/27/10 | | $ | 1,961 |
| BRL | 669,029 | | USD | 365,500 | | UBS AG | | 5/04/10 | | | 8,044 |
| USD | 548,439 | | EUR | 405,500 | | Citibank, N.A. | | 5/26/10 | | | 726 |
| | | | | | | | | | | |
| Total | | | | | | | | | | $ | 12,711 |
| | | | | | | | | | | |
| • | | Financial futures contracts purchased as of March 31, 2010 were as follows: |
| | | | | | | | | | | |
| Contracts | | Issue | | Expiration
Date | | Notional
Value | | Unrealized
Appreciation
(Depreciation) | |
| 80 | | S&P 500 Index | | June 2010 | | $ | 23,304,000 | | $ | 483,298 | |
| 3 | | U.S. Treasury Bonds (30 Year) | | June 2010 | | $ | 348,375 | | | (714 | ) |
| | | | | | | | | | | |
| Total | | | | | | | | | $ | 482,584 | |
| | | | | | | | | | | |
| • | | Financial futures contracts sold as of March 31, 2010 were as follows: |
| | | | | | | | | | | |
| Contracts | | Issue | | Expiration Date | | Notional
Value | | Unrealized
Appreciation
(Depreciation) | |
| 5 | | Euro Dollar Futures | | June 2010 | | $ | 1,245,375 | | $ | (198 | ) |
| 201 | | U.S. Treasury Notes (2 Year) | | June 2010 | | $ | 43,607,578 | | | 28,198 | |
| 36 | | U.S. Treasury Notes (5 Year) | | June 2010 | | $ | 4,134,375 | | | 7,868 | |
| 115 | | U.S. Treasury Notes (10 Year) | | June 2010 | | $ | 13,368,750 | | | (11,953 | ) |
| 24 | | U.S. Ultra Long-term Treasury Bonds | | June 2010 | | $ | 2,879,250 | | | 13,993 | |
| 5 | | Euro Dollar Futures | | September 2010 | | $ | 1,243,313 | | | (123 | ) |
| 5 | | Euro Dollar Futures | | December 2010 | | $ | 1,239,625 | | | 115 | |
| 2 | | Euro Dollar Futures | | March 2011 | | $ | 494,100 | | | (219 | ) |
| 4 | | Euro Dollar Futures | | June 2011 | | $ | 984,450 | | | 87 | |
| 4 | | Euro Dollar Futures | | September 2011 | | $ | 980,800 | | | 37 | |
| 4 | | Euro Dollar Futures | | December 2011 | | $ | 977,250 | | | 137 | |
| 4 | | Euro Dollar Futures | | March 2012 | | $ | 974,150 | | | 262 | |
| | | | | | | | | | | |
| Total | | | | | | | | | $ | 38,204 | |
| | | | | | | | | | | |
| • | | Interest rate swaps outstanding as of March 31, 2010 were as follows: |
| | | | | | | | | | | | | |
Fixed Rate | | Floating Rate | | Counterparty | | Expiration | | Notional
Amount
(000) | | Unrealized
Appreciation
(Depreciation) | |
1.12%(a) | | 3-month LIBOR | | BNP Paribas | | January 2012 | | USD | 13,700 | | $ | (39,974 | ) |
1.14%(b) | | 3-month LIBOR | | BNP Paribas | | February 2012 | | USD | 7,100 | | | 18,185 | |
1.10%(b) | | 3-month LIBOR | | Deutsche Bank AG | | February 2012 | | USD | 6,800 | | | 11,358 | |
1.81%(a) | | 3-month LIBOR | | Citibank, N.A. | | March 2012 | | USD | 4,000 | | | (51,729 | ) |
2.25%(a) | | 3-month LIBOR | | Deutsche Bank AG | | December 2012 | | USD | 2,220 | | | (51,074 | ) |
2.79%(a) | | 3-month LIBOR | | JPMorgan Chase Bank, N.A. | | November 2014 | | USD | 1,090 | | | (21,085 | ) |
2.56%(a) | | 3-month LIBOR | | Bank of America, N.A. | | March 2015 | | USD | 5,200 | | | 24,262 | |
2.62%(a) | | 3-month LIBOR | | Barclays Bank Plc | | March 2015 | | USD | 3,900 | | | 6,675 | |
2.75%(a) | | 3-month LIBOR | | Morgan Stanley Capital Services, Inc. | | March 2015 | | USD | 2,000 | | | (4,143 | ) |
2.73%(a) | | 3-month LIBOR | | Morgan Stanley Capital Services, Inc. | | April 2015 | | USD | 3,400 | | | (2,170 | ) |
2.72%(a) | | 3-month LIBOR | | JPMorgan Chase Bank, N.A. | | April 2015 | | USD | 3,500 | | | — | |
3.41%(b) | | 3-month LIBOR | | Deutsche Bank AG | | May 2019 | | USD | 6,900 | | | (59,817 | ) |
3.68%(b) | | 3-month LIBOR | | Deutsche Bank AG | | August 2019 | | USD | 4,200 | | | (660 | ) |
3.50%(b) | | 3-month LIBOR | | Citibank, N.A. | | September 2019 | | USD | 1,200 | | | (19,749 | ) |
3.50%(b) | | 3-month LIBOR | | Bank of America, N.A. | | September 2019 | | USD | 2,800 | | | (49,390 | ) |
3.47%(b) | | 3-month LIBOR | | Royal Bank of Scotland Plc | | September 2019 | | USD | 3,600 | | | (73,290 | ) |
3.43%(a) | | 3-month LIBOR | | Deutsche Bank AG | | October 2019 | | USD | 1,000 | | | 8,831 | |
3.36%(b) | | 3-month LIBOR | | Goldman Sachs Bank USA | | October 2019 | | USD | 1,400 | | | (22,835 | ) |
3.12%(a) | | 3-month LIBOR | | Barclays Bank Plc | | October 2019 | | USD | 5,600 | | | 43,794 | |
See Notes to Financial Statements.
| | | | | | |
| | | BLACKROCK ASSET ALLOCATION PORTFOLIO | | MARCH 31, 2010 | | 27 |
| | |
| Schedule of Investments (continued) | | |
| | |
| | | | | | | | | | | | | |
Fixed Rate | | Floating Rate | | Counterparty | | Expiration | | Notional
Amount
(000) | | Unrealized
Appreciation
(Depreciation) | |
3.73%(a) | | 3-month LIBOR | | Citibank, N.A. | | October 2019 | | USD | 1,100 | | $ | (14,993 | ) |
5.49%(a) | | 3-month LIBOR | | JPMorgan Chase Bank, N.A. | | October 2019 | | USD | 1,400 | | | (180,180 | ) |
3.50%(a) | | 3-month LIBOR | | Morgan Stanley Capital Services, Inc. | | November 2019 | | USD | 600 | | | 5,245 | |
3.46%(a) | | 3-month LIBOR | | Bank of America, N.A. | | November 2019 | | USD | 985 | | | 12,146 | |
3.31%(b) | | 3-month LIBOR | | Barclays Bank Plc | | December 2019 | | USD | 5,600 | | | (149,509 | ) |
3.31%(b) | | 3-month LIBOR | | Royal Bank of Scotland Plc | | December 2019 | | USD | 800 | | | (21,192 | ) |
3.40%(a) | | 3-month LIBOR | | Deutsche Bank AG | | December 2019 | | USD | 5,600 | | | 108,565 | |
3.62%(b) | | 3-month LIBOR | | Deutsche Bank AG | | December 2019 | | USD | 1,600 | | | (1,401 | ) |
3.50%(b) | | 3-month LIBOR | | Deutsche Bank AG | | December 2019 | | USD | 700 | | | (8,207 | ) |
3.66%(b) | | 3-month LIBOR | | Credit Suisse International | | December 2019 | | USD | 4,700 | | | 12,821 | |
5.67%(a) | | 3-month LIBOR | | Citibank, N.A. | | January 2020 | | USD | 500 | | | (59,999 | ) |
3.89%(b) | | 3-month LIBOR | | BNP Paribas | | January 2020 | | USD | 1,700 | | | 29,802 | |
3.93%(b) | | 3-month LIBOR | | BNP Paribas | | January 2020 | | USD | 2,100 | | | 43,640 | |
3.89%(b) | | 3-month LIBOR | | Credit Suisse International | | January 2020 | | USD | 2,500 | | | 42,692 | |
4.87%(a) | | 3-month LIBOR | | Deutsche Bank AG | | February 2020 | | USD | 5,700 | | | (303,495 | ) |
3.71%(a) | | 3-month LIBOR | | Deutsche Bank AG | | February 2020 | | USD | 3,100 | | | 7,863 | |
3.78%(a) | | 3-month LIBOR | | Morgan Stanley Capital Services, Inc. | | February 2020 | | USD | 1,700 | | | (5,898 | ) |
3.87%(b) | | 3-month LIBOR | | Morgan Stanley Capital Services, Inc. | | February 2020 | | USD | 1,000 | | | 9,593 | |
3.75%(b) | | 3-month LIBOR | | Royal Bank of Scotland Plc | | February 2020 | | USD | 3,500 | | | (2,289 | ) |
3.68%(b) | | 3-month LIBOR | | BNP Paribas | | March 2020 | | USD | 2,800 | | | (19,434 | ) |
3.70%(a) | | 3-month LIBOR | | Morgan Stanley Capital Services, Inc. | | March 2020 | | USD | 2,300 | | | 13,896 | |
3.65%(b) | | 3-month LIBOR | | JPMorgan Chase Bank, N.A. | | March 2020 | | USD | 2,000 | | | (19,967 | ) |
3.64%(a) | | 3-month LIBOR | | Royal Bank of Scotland Plc | | March 2020 | | USD | 3,700 | | | 41,979 | |
3.73%(a) | | 3-month LIBOR | | Barclays Bank Plc | | March 2020 | | USD | 1,000 | | | 3,775 | |
3.33%(b) | | 3-month LIBOR | | Citibank, N.A. | | March 2020 | | USD | 2,100 | | | 22,237 | |
3.77%(b) | | 3-month LIBOR | | Citibank, N.A. | | March 2020 | | USD | 2,400 | | | (2,129 | ) |
3.68%(a) | | 3-month LIBOR | | Deutsche Bank AG | | March 2020 | | USD | 1,100 | | | 10,581 | |
3.64%(b) | | 3-month LIBOR | | Deutsche Bank AG | | March 2020 | | USD | 1,300 | | | (17,120 | ) |
3.71%(a) | | 3-month LIBOR | | Morgan Stanley Capital Services, Inc. | | March 2020 | | USD | 2,500 | | | 18,326 | |
3.75%(a) | | 3-month LIBOR | | Deutsche Bank AG | | March 2020 | | USD | 1,200 | | | 5,811 | |
3.83%(a) | | 3-month LIBOR | | JPMorgan Chase Bank, N.A. | | March 2020 | | USD | 1,000 | | | (1,927 | ) |
4.42%(c) | | 3-month LIBOR | | JPMorgan Chase Bank, N.A. | | August 2020 | | USD | 2,325 | | | (97,882 | ) |
4.24%(c) | | 3-month LIBOR | | JPMorgan Chase Bank, N.A. | | August 2020 | | USD | 705 | | | (21,467 | ) |
5.41%(b) | | 3-month LIBOR | | JPMorgan Chase Bank, N.A. | | August 2022 | | USD | 1,130 | | | 160,082 | |
4.35%(a) | | 3-month LIBOR | | JPMorgan Chase Bank, N.A. | | July 2039 | | USD | 1,300 | | | 23,053 | |
4.44%(b) | | 3-month LIBOR | | Royal Bank of Scotland Plc | | January 2040 | | USD | 1,000 | | | 3,811 | |
See Notes to Financial Statements.
| | | | | | |
| 28 | | BLACKROCK ASSET ALLOCATION PORTFOLIO | | MARCH 31, 2010 | | |
| | |
| Schedule of Investments (continued) | | |
| | |
| | | | | | | | | | | | | |
Fixed Rate | | Floating Rate | | Counterparty | | Expiration | | Notional
Amount
(000) | | Unrealized
Appreciation
(Depreciation) | |
4.52%(b) | | 3-month LIBOR | | Morgan Stanley Capital Services, Inc. | | February 2040 | | USD | 900 | | $ | 6,085 | |
3.50%(c) | | 3-month LIBOR | | Barclays Bank Plc | | March 2040 | | USD | 500 | | | 83,641 | |
| | | | | | | | | | | | | |
Total | | | | | | | | | | | $ | (544,256 | ) |
| | | | | | | | | | | | | |
| (a) | Fund pays fixed interest rate and receives floating rate. |
| (b) | Fund pays floating interest rate and receives fixed rate. |
| (c) | Fund pays fixed interest rate and receives floating rate at expiration date. |
| • | | Credit default swaps on single-name issues - buy protection outstanding as of March 31, 2010 were as follows: |
| | | | | | | | | | | | | | |
Issuer | | Pay Fixed
Rate | | | Counterparty | | Expiration | | Notional
Amount
(000) | | Unrealized
Appreciation
(Depreciation) | |
Centex Corp. | | 6.92 | % | | JPMorgan Chase Bank, N.A. | | December 2010 | | USD | 265 | | $ | (13,070 | ) |
iStar Financial, Inc. | | 5.00 | % | | Morgan Stanley Capital Services, Inc. | | September 2011 | | USD | 140 | | | (29,192 | ) |
Wendy’s/Arby’s Group, Inc. | | 2.90 | % | | JPMorgan Chase Bank, N.A. | | December 2011 | | USD | 360 | | | (10,944 | ) |
NOVA Chemicals Corp. | | 5.00 | % | | Citibank, N.A. | | March 2012 | | USD | 25 | | | (698 | ) |
NOVA Chemicals Corp. | | 5.00 | % | | JPMorgan Chase Bank, N.A. | | June 2012 | | USD | 35 | | | (588 | ) |
Ryland Group, Inc. | | 4.51 | % | | JPMorgan Chase Bank, N.A. | | June 2012 | | USD | 165 | | | (12,273 | ) |
Macy’s, Inc. | | 7.50 | % | | Morgan Stanley Capital Services, Inc. | | June 2012 | | USD | 335 | | | (48,140 | ) |
Belo Corp. | | 5.00 | % | | Barclays Bank Plc | | June 2013 | | USD | 120 | | | (24,186 | ) |
D.R. Horton, Inc. | | 5.04 | % | | JPMorgan Chase Bank, N.A. | | June 2013 | | USD | 525 | | | (58,582 | ) |
Centex Corp. | | 4.37 | % | | Deutsche Bank AG | | December 2013 | | USD | 575 | | | (71,855 | ) |
NOVA Chemicals Corp. | | 5.00 | % | | Goldman Sachs Bank USA | | December 2013 | | USD | 200 | | | (9,449 | ) |
Centex Corp. | | 4.40 | % | | JPMorgan Chase Bank, N.A. | | December 2013 | | USD | 330 | | | (41,757 | ) |
Tyson Foods, Inc. | | 4.10 | % | | Barclays Bank Plc | | March 2014 | | USD | 445 | | | (51,485 | ) |
Hertz Global Holdings, Inc. | | 5.00 | % | | Goldman Sachs Bank USA | | March 2014 | | USD | 80 | | | (29,845 | ) |
Toll Brothers, Inc. | | 2.00 | % | | JPMorgan Chase Bank, N.A. | | March 2014 | | USD | 155 | | | (3,652 | ) |
Seagate Technology Holdings, Inc. | | 1.00 | % | | Credit Suisse International | | June 2014 | | USD | 275 | | | (4,213 | ) |
D.R. Horton, Inc. | | 5.07 | % | | JPMorgan Chase Bank, N.A. | | September 2014 | | USD | 155 | | | (20,977 | ) |
Macy’s, Inc. | | 1.00 | % | | Morgan Stanley Capital Services, Inc. | | September 2014 | | USD | 90 | | | (2,363 | ) |
Huntsman Corp. | | 5.00 | % | | Goldman Sachs Bank USA | | December 2014 | | USD | 335 | | | (149,729 | ) |
TXU Corp. | | 5.00 | % | | JPMorgan Chase Bank, N.A. | | December 2014 | | USD | 125 | | | (16,709 | ) |
TXU Corp. | | 5.00 | % | | Morgan Stanley Capital Services, Inc. | | December 2014 | | USD | 680 | | | (78,146 | ) |
Huntsman Corp. | | 5.00 | % | | Goldman Sachs Bank USA | | March 2015 | | USD | 85 | | | (31,407 | ) |
Pulte Group, Inc. | | 3.00 | % | | JPMorgan Chase Bank, N.A. | | March 2015 | | USD | 185 | | | (9,375 | ) |
Lennar Corp. | | 5.86 | % | | JPMorgan Chase Bank, N.A. | | June 2015 | | USD | 250 | | | (35,986 | ) |
First Data Corp. | | 5.00 | % | | Barclays Bank Plc | | December 2015 | | USD | 320 | | | (43,301 | ) |
First Data Corp. | | 5.00 | % | | Credit Suisse International | | December 2015 | | USD | 130 | | | (17,591 | ) |
First Data Corp. | | 5.00 | % | | Deutsche Bank AG | | December 2015 | | USD | 240 | | | 13,279 | |
First Data Corp. | | 5.00 | % | | Goldman Sachs Bank USA | | December 2015 | | USD | 85 | | | (11,077 | ) |
First Data Corp. | | 5.00 | % | | JPMorgan Chase Bank, N.A. | | December 2015 | | USD | 165 | | | (22,327 | ) |
See Notes to Financial Statements.
| | | | | | |
| | | BLACKROCK ASSET ALLOCATION PORTFOLIO | | MARCH 31, 2010 | | 29 |
| | |
| Schedule of Investments (continued) | | |
| | |
| | | | | | | | | | | | | |
Issuer | | Pay Fixed
Rate | | Counterparty | | Expiration | | Notional
Amount
(000) | | Unrealized
Appreciation
(Depreciation) | |
Sabre Holdings Corp. | | 5.00% | | JPMorgan Chase Bank, N.A. | | March 2016 | | USD | 690 | | $ | (370,251 | ) |
| | | | | | | | | | | | | |
Total | | | | | | | | | | | $ | (1,205,889 | ) |
| | | | | | | | | | | | | |
| • | | Credit default swaps on traded indexes - buy protection outstanding as of March 31, 2010 were as follows: |
| | | | | | | | | | | | | |
Index | | Pay Fixed
Rate | | Counterparty | | Expiration | | Notional
Amount
(000) | | Unrealized
Depreciation | |
Dow Jones North America High Yield Index Series 13 Volume 1 | | 5.00% | | Credit Suisse International | | December 2014 | | USD | 7,524 | | $ | (165,274 | ) |
| • | | For Fund compliance purposes, the Fund’s industry classifications refer to any one or more of the industry sub-classifications used by one or more widely recognized market indexes or ratings group indexes and/or as defined by Fund management. This definition may not apply for purposes of this report, which may combine industry sub-classifications for reporting ease. |
| • | | Portfolio abbreviations: |
| | | | | | |
| ADR | | American Depositary Receipts | | JPY | | Japanese Yen |
| AUD | | Australian Dollar | | LIBOR | | London InterBank Offered Rate |
| BRL | | Brazilian Real | | NOK | | Norwegian Krone |
| CAD | | Canadian Dollar | | NZD | | New Zealand Dollar |
| CHF | | Swiss Francs | | RB | | Revenue Bonds |
| DKK | | Danish Krone | | SEK | | Swedish Krona |
| EUR | | Euro | | SGD | | Singapore Dollar |
| GBP | | British Pound | | TBA | | To-Be-Announced |
| GO | | General Obligation | | USD | | US Dollar |
| HKD | | Hong Kong Dollar | | | | |
| • | | Fair Value Measurements – Various inputs are used in determining the fair value of investments, which are as follows: |
| | • | | Level 1 – price quotations in active markets/exchanges for identical assets and liabilities |
| | • | | Level 2 – other observable inputs (including, but not limited to: quoted prices for similar assets or liabilities in markets that are active, quoted prices for identical or similar assets or liabilities in markets that are not active, inputs other than quoted prices that are observable for the assets or liabilities (such as interest rates, yield curves, volatilities, prepayment speeds, loss severities, credit risks and default rates) or other market–corroborated inputs) |
| | • | | Level 3 – unobservable inputs based on the best information available in the circumstances, to the extent observable inputs are not available (including the Fund’s own assumptions used in determining the fair value of investments) |
The inputs or methodologies used for valuing securities are not necessarily an indication of the risk associated with investing in those securities. For information about the Fund’s policy regarding valuation of investments and other significant accounting policies, please refer to Note 1 of the Notes to Financial Statements.
The following tables summarize the inputs used as of March 31, 2010 in determining the fair valuation of the Fund’s investments:
| | | | | | | | | | | | | | |
| | | Investments in Securities | |
Valuation Inputs | | Level 1 | | Level 2 | | | Level 3 | | Total | |
Assets: | | | | | | | | | | | | | | |
Asset-Backed Securities | | | — | | $ | 12,843,747 | | | $ | 268 $ | | | 12,844,015 | |
Collateralized Debt Obligations | | | — | | | — | | | | — | | | — | |
Common Stocks | | $ | 260,429,518 | | | 84,862,413 | | | | 154,660 | | | 345,446,591 | |
Corporate Bonds | | | — | | | 49,716,736 | | | | — | | | 49,716,736 | |
Exchange-Traded Funds | | | 93,398 | | | — | | | | — | | | 93,398 | |
Foreign Agency Obligations | | | — | | | 8,236,234 | | | | — | | | 8,236,234 | |
Foreign Government Obligations | | | — | | | 8,495,284 | | | | — | | | 8,495,284 | |
Non-Agency Mortgage-Backed Securities | | | — | | | 36,706,017 | | | | 883,598 | | | 37,589,615 | |
Preferred Securities | | | — | | | 2,133,562 | | | | — | | | 2,133,562 | |
Taxable Municipal Bonds | | | — | | | 3,758,918 | | | | — | | | 3,758,918 | |
U.S. Government Sponsored Agency Securities | | | — | | | 173,143,469 | | | | — | | | 173,143,469 | |
U.S. Treasury Obligations | | | — | | | 64,115,778 | | | | — | | | 64,115,778 | |
Warrants | | | 3,340 | | | — | | | | — | | | 3,340 | |
Short-Term Securities: | | | | | | | | | | | | | | |
Money Market Funds | | | 31,897,347 | | | 1,893,500 | | | | — | | | 33,790,847 | |
Borrowed Bond Agreements | | | — | | | 5,675,125 | | | | — | | | 5,675,125 | |
Liabilities: | | | | | | | | | | | | | | |
Borrowed Bonds | | | — | | | (5,654,375 | ) | | | — | | | (5,654,375 | ) |
TBA Sale Commitments | | | — | | | (84,641,300 | ) | | | — | | | (84,641,300 | ) |
| | | | | | | | | | | | | | |
Total | | $ | 292,423,603 | | $ | 361,285,108 | | | $ | 1,038,526 | | $ | 654,747,237 | |
| | | | | | | | | | | | | | |
| | | | | | | | | | | | | | | | |
| | | Other Financial Instruments1 | |
Valuation Inputs | | Level 1 | | | Level 2 | | | Level 3 | | | Total | |
Assets | | $ | 540,124 | | | $ | 2,463,051 | | | | — | | | $ | 3,003,175 | |
Liabilities | | | (28,353 | ) | | | (5,124,670 | ) | | $ | (119,349 | ) | | | (5,272,372 | ) |
| | | | | | | | | | | | | | | | |
Total | | $ | 511,771 | | | $ | (2,661,619 | ) | | $ | (119,349 | ) | | $ | (2,269,197 | ) |
| | | | | | | | | | | | | | | | |
| 1 | Other financial instruments are options purchased, options written, borrowed bonds, foreign currency exchange contracts, financial futures contracts and |
See Notes to Financial Statements.
| | | | | | |
| 30 | | BLACKROCK ASSET ALLOCATION PORTFOLIO | | MARCH 31, 2010 | | |
| | |
| Schedule of Investments (concluded) | | |
| | |
| | swaps. Foreign currency exchange contracts, financial futures contracts and swaps are shown at the unrealized appreciation/depreciation on the instrument and options purchased, options written and borrowed bonds are shown at value. |
The following tables are a reconciliation of Level 3 investments for which significant unobservable inputs were used to determine fair value:
| | | | | | | | | | | | | | | |
| | | Investments in Securities | |
| | | Asset-Backed
Securities | | Common
Stocks | | | Non-Agency
Mortgage-Backed
Securities | | | Total | |
Balance, as of September 30, 2009 | | $ | 268 | | $ | 200,988 | | | $ | 84,386 | | | $ | 285,642 | |
Accrued discounts/premiums | | | — | | | — | | | | (37 | ) | | | (37 | ) |
Realized gain/loss | | | — | | | — | | | | (167 | ) | | | (167 | ) |
Change in unrealized appreciation/depreciation3 | | | — | | | (46,328 | ) | | | 50,776 | | | | 4,448 | |
Net purchases/sales | | | — | | | — | | | | 832,581 | | | | 832,581 | |
Transfers in/out of Level 3 | | | — | | | — | | | | (83,941 | ) | | | — | |
| | | | | | | | | | | | | | | |
Balance, as of March 31, 2010 | | $ | 268 | | $ | 154,660 | | | $ | 883,598 | | | $ | 1,038,526 | |
| | | | | | | | | | | | | | | |
| | | | |
| | | Other Financial
Instruments2 | |
| | | Liabilities | |
Balance, as of September 30, 2009 | | $ | (162,360 | ) |
Accrued discounts/premiums | | | — | |
Realized gain/loss | | | — | |
Change in unrealized appreciation/depreciation3 | | | 43,011 | |
Net purchases/sales | | | — | |
Transfers in/out of Level 3 | | | — | |
| | | | |
Balance, as of March 31, 2010 | | $ | (119,349 | ) |
| | | | |
| 2 | Other financial instruments are swaps. |
| 3 | The change in unrealized appreciation/depreciation on securities still held at March 31, 2010 was $(11,202), which is included in the related net change in unrealized appreciation/depreciation on the Statements of Operations. |
See Notes to Financial Statements.
| | | | | | |
| | | BLACKROCK ASSET ALLOCATION PORTFOLIO | | MARCH 31, 2010 | | 31 |
| | |
| Statement of Assets and Liabilities | | |
| | |
| | | | |
March 31, 2010 (Unaudited) | | | |
Assets | | | | |
Investments at value — unaffiliated (including securities loaned of $1,840,700) (cost — $640,324,092) | | $ | 712,489,614 | |
Investments at value — affiliated (cost — $33,892,018) | | | 33,884,245 | |
Foreign currency at value (cost — $386,716) | | | 389,160 | |
Cash pledged as collateral in connection with financial futures contracts | | | 2,199,000 | |
Swap premium paid | | | 1,062,343 | |
TBA sale commitments receivable | | | 84,756,947 | |
Investments sold receivable | | | 65,625,611 | |
Interest receivable | | | 2,167,193 | |
Capital shares sold receivable | | | 809,800 | |
Unrealized appreciation on swaps | | | 792,028 | |
Dividends and reclaims receivable | | | 615,447 | |
Unrealized appreciation on foreign currency exchange contracts | | | 346,205 | |
Principal paydown receivable | | | 122,425 | |
Dividends receivable — affiliated | | | 3,279 | |
Margin variation receivable | | | 2,475 | |
Securities lending income receivable — affiliated | | | 2,790 | |
Receivable from advisor | | | 86 | |
Prepaid expenses | | | 74,424 | |
| | | | |
Total assets | | | 905,343,072 | |
| | | | |
Liabilities | | | | |
Bank overdraft | | | 133,171 | |
Investments purchased payable | | | 163,738,809 | |
TBA sale commitments at value (proceeds $84,756,947) | | | 84,641,300 | |
Reverse repurchase agreements | | | 72,646,369 | |
Borrowed bonds (proceeds $5,670,909) | | | 5,654,375 | |
Payable for treasury rolls | | | 2,991,277 | |
Options written at value (premiums received $3,031,817) | | | 2,218,224 | |
Unrealized depreciation on swaps | | | 2,707,447 | |
Collateral at value — securities loaned | | | 1,893,500 | |
Capital shares redeemed payable | | | 542,725 | |
Other affiliates payable | | | 341,906 | |
Investment advisory fees payable | | | 295,023 | |
Service and distribution fees payable | | | 203,506 | |
Margin variation payable | | | 188,161 | |
Unrealized depreciation on foreign currency exchange contracts | | | 333,494 | |
Interest expense payable | | | 213,723 | |
Officer’s and Trustees’ fees payable | | | 10,137 | |
Foreign taxes payable | | | 3,349 | |
Other accrued expenses payable | | | 94,327 | |
| | | | |
Total liabilities | | | 338,850,823 | |
| | | | |
Net Assets | | $ | 566,492,249 | |
| | | | |
Net Assets Consist of | | | | |
Paid-in capital | | $ | 552,044,362 | |
Undistributed net investment income | | | 2,136,368 | |
Accumulated net realized loss | | | (59,413,742 | ) |
Net unrealized appreciation/depreciation | | | 71,725,261 | |
| | | | |
Net Assets | | $ | 566,492,249 | |
| | | | |
Net Asset Value | | | | |
Institutional — Based on net assets of $35,747,255 and 2,518,489 shares outstanding, unlimited number of shares authorized, $0.001 par value | | $ | 14.19 | |
| | | | |
Service — Based on net assets of $1,510,887 and 106,747 shares outstanding, unlimited number of shares authorized, $0.001 par value | | $ | 14.15 | |
| | | | |
Investor A — Based on net assets of $385,492,648 and 27,254,664 shares outstanding, unlimited number of shares authorized, $0.001 par value | | $ | 14.14 | |
| | | | |
Investor B — Based on net assets of $62,225,511 and 4,452,544 shares outstanding, unlimited number of shares authorized, $0.001 par value | | $ | 13.98 | |
| | | | |
Investor C — Based on net assets of $81,515,948 and 5,850,092 shares outstanding, unlimited number of shares authorized, $0.001 par value | | $ | 13.93 | |
| | | | |
See Notes to Financial Statements.
| | | | | | |
| 32 | | BLACKROCK ASSET ALLOCATION PORTFOLIO | | MARCH 31, 2010 | | |
| | | | |
Six Months Ended March 31, 2010 (Unaudited) | | | |
Investment Income | | | | |
Interest | | $ | 5,446,246 | |
Dividends and reclaims | | | 2,375,333 | |
Foreign taxes withheld | | | (57,130 | ) |
Securities lending — affiliated | | | 4,295 | |
Dividends — affiliated | | | 23,481 | |
| | | | |
Total income | | | 7,792,225 | |
| | | | |
Expenses | | | | |
Investment advisory | | | 1,499,999 | |
Service and distribution — class specific | | | 1,169,037 | |
Transfer agent — class specific | | | 464,721 | |
Administration | | | 202,204 | |
Custodian | | | 145,439 | |
Professional | | | 64,400 | |
Administration — class specific | | | 68,184 | |
Printing | | | 54,744 | |
Registration | | | 24,991 | |
Officer and Trustees | | | 12,342 | |
Miscellaneous | | | 88,048 | |
Recoupment of past waived fees — class specific | | | 34,491 | |
| | | | |
Total expenses excluding interest expense | | | 3,828,600 | |
Interest expense | | | 119,323 | |
| | | | |
Total expenses | | | 3,947,923 | |
Less fees waived by advisor | | | (12,094 | ) |
Less administration fees waived — class specific | | | (3,094 | ) |
Less transfer agent fees waived — class specific | | | (162 | ) |
Less transfer agent fees reimbursed — class specific | | | (544 | ) |
Less fees paid indirectly | | | (659 | ) |
| | | | |
Total expenses after fees waived, reimbursed and paid indirectly | | | 3,931,370 | |
| | | | |
Net investment income | | | 3,860,855 | |
| | | | |
Realized and Unrealized Gain (Loss) | | | | |
Net realized gain (loss) from: | | | | |
Investments | | | 12,487,746 | |
Options written | | | 1,847,083 | |
Financial futures contracts | | | 2,957,758 | |
Swaps | | | 5,903 | |
Foreign currency transactions | | | 365,980 | |
| | | | |
| | | 17,664,470 | |
| | | | |
Net change in unrealized appreciation/depreciation on: | | | | |
Investments | | | 18,526,777 | |
Options written | | | 900,487 | |
Financial futures contracts | | | (169,683 | ) |
Swaps | | | (810,843 | ) |
Foreign currency transactions | | | 375,919 | |
Borrowed bonds | | | 16,534 | |
| | | | |
| | | 18,839,191 | |
| | | | |
Total realized and unrealized gain | | | 36,503,661 | |
| | | | |
Net Increase in Net Assets Resulting from Operations | | $ | 40,364,516 | |
| | | | |
See Notes to Financial Statements.
| | | | | | |
| | | BLACKROCK ASSET ALLOCATION PORTFOLIO | | MARCH 31, 2010 | | 33 |
| | |
| Statements of Changes in Net Assets | | |
| | |
| | | | | | | | |
Increase (Decrease) in Net Assets: | | Six Months
Ended
March 31, 2010
(Unaudited) | | | Year Ended
September 30,
2009 | |
Operations | | | | | | | | |
Net investment income | | $ | 3,860,855 | | | $ | 8,965,099 | |
Net realized gain (loss) | | | 17,664,470 | | | | (68,309,365 | ) |
Net change in unrealized appreciation/depreciation | | | 18,839,191 | | | | 76,219,961 | |
| | | | | | | | |
Net increase in net assets resulting from operations | | | 40,364,516 | | | | 16,875,695 | |
| | | | | | | | |
Dividends and Distributions to Shareholders From | | | | | | | | |
Net investment income: | | | | | | | | |
Institutional | | | (274,199 | ) | | | (440,877 | ) |
Service | | | (12,119 | ) | | | (21,097 | ) |
Investor A | | | (2,825,979 | ) | | | (4,525,741 | ) |
Investor B | | | (258,407 | ) | | | (371,592 | ) |
Investor C | | | (314,393 | ) | | | (430,792 | ) |
Net realized gain: | | | | | | | | |
Institutional | | | — | | | | (406,332 | ) |
Service | | | — | | | | (21,686 | ) |
Investor A | | | — | | | | (5,466,565 | ) |
Investor B | | | — | | | | (1,298,809 | ) |
Investor C | | | — | | | | (1,188,380 | ) |
| | | | | | | | |
Decrease in net assets resulting from dividends and distributions to shareholders | | | (3,685,097 | ) | | | (14,171,871 | ) |
| | | | | | | | |
Capital Share Transactions | | | | | | | | |
Net decrease in net assets derived from capital share transactions | | | (4,535,019 | ) | | | (50,336,591 | ) |
| | | | | | | | |
Net Assets | | | | | | | | |
Total decrease in net assets | | | 32,144,400 | | | | (47,632,767 | ) |
Beginning of period | | | 534,347,849 | | | | 581,980,616 | |
| | | | | | | | |
End of period | | $ | 566,492,249 | | | $ | 534,347,849 | |
| | | | | | | | |
Undistributed net investment income | | $ | 2,136,368 | | | $ | 1,960,610 | |
| | | | | | | | |
See Notes to Financial Statements.
| | | | | | |
| 34 | | BLACKROCK ASSET ALLOCATION PORTFOLIO | | MARCH 31, 2010 | | |
| | | | | | | | | | | | | | | | | | | | | | | | | | | | |
| | | Institutional* | |
| | | Six Months Ended March 31, 2010 | | | Year Ended September 30, | | | Period March 1, 2005 to | | | Period April 1, 2004 to | |
| | | (Unaudited) | | | 2009 | | | 2008 | | | 2007 | | | 2006 | | | September 30, 2005 | | | February 28, 2005 | |
Per Share Operating Performance | | | | | | | | | | | | | | | | | | | | | | | | | | | | |
Net asset value, beginning of period | | $ | 13.28 | | | $ | 12.96 | | | $ | 17.07 | | | $ | 15.53 | | | $ | 15.51 | | | $ | 14.99 | | | $ | 14.91 | |
| | | | | | | | | | | | | | | | | | | | | | | | | | | | |
Net investment income | | | 0.13 | 1 | | | 0.27 | 1 | | | 0.33 | 1 | | | 0.33 | 1 | | | 0.31 | 1 | | | 0.17 | 1 | | | 0.20 | |
Net realized and unrealized gain (loss) | | | 0.90 | | | | 0.45 | | | | (2.76 | ) | | | 2.08 | 2 | | | 0.66 | 2 | | | 0.52 | 2 | | | 0.82 | |
| | | | | | | | | | | | | | | | | | | | | | | | | | | | |
Net increase (decrease) from investment operations | | | 1.03 | | | | 0.72 | | | | (2.43 | ) | | | 2.41 | | | | 0.97 | | | | 0.69 | | | | 1.02 | |
| | | | | | | | | | | | | | | | | | | | | | | | | | | | |
Dividends and distributions from: | | | | | | | | | | | | | | | | | | | | | | | | | | | | |
Net investment income | | | (0.12 | ) | | | (0.21 | ) | | | (0.38 | ) | | | (0.24 | ) | | | (0.30 | ) | | | (0.17 | ) | | | (0.40 | ) |
Net realized gain | | | — | | | | (0.19 | ) | | | (1.30 | ) | | | (0.63 | ) | | | (0.65 | ) | | | — | | | | (0.54 | ) |
| | | | | | | | | | | | | | | | | | | | | | | | | | | | |
Total dividends and distributions | | | (0.12 | ) | | | (0.40 | ) | | | (1.68 | ) | | | (0.87 | ) | | | (0.95 | ) | | | (0.17 | ) | | | (0.94 | ) |
| | | | | | | | | | | | | | | | | | | | | | | | | | | | |
Net asset value, end of period | | $ | 14.19 | | | $ | 13.28 | | | $ | 12.96 | | | $ | 17.07 | | | $ | 15.53 | | | $ | 15.51 | | | $ | 14.99 | |
| | | | | | | | | | | | | | | | | | | | | | | | | | | | |
Total Investment Return3 | | | | | | | | | | | | | | | | | | | | | | | | | | | | |
Based on net asset value | | | 7.83 | %4 | | | 6.15 | %5 | | | (15.81 | )% | | | 16.04 | %6 | | | 6.53 | %6 | | | 4.66 | %4,6 | | | 7.17 | %4 |
| | | | | | | | | | | | | | | | | | | | | | | | | | | | |
Ratios to Average Net Assets | | | | | | | | | | | | | | | | | | | | | | | | | | | | |
Total expenses | | | 0.96 | %7 | | | 0.95 | % | | | 0.94 | % | | | 0.93 | % | | | 0.91 | % | | | 1.11 | %7 | | | 1.05 | %7 |
| | | | | | | | | | | | | | | | | | | | | | | | | | | | |
Total expenses excluding recoupment of past waived fees | | | 0.96 | %7 | �� | | 0.95 | % | | | 0.94 | % | | | 0.93 | % | | | 0.91 | % | | | 1.11 | %7 | | | 1.05 | %7 |
| | | | | | | | | | | | | | | | | | | | | | | | | | | | |
Total expenses after fees waived, reimbursed and paid indirectly | | | 0.93 | %7 | | | 0.88 | % | | | 0.89 | % | | | 0.86 | % | | | 0.83 | % | | | 0.86 | %7 | | | 1.03 | %7 |
| | | | | | | | | | | | | | | | | | | | | | | | | | | | |
Total expenses after fees waived, reimbursed and paid indirectly and excluding interest expense | | | 0.89 | %7 | | | 0.88 | % | | | 0.85 | % | | | 0.86 | % | | | 0.83 | % | | | 0.86 | %7 | | | 1.03 | %7 |
| | | | | | | | | | | | | | | | | | | | | | | | | | | | |
Net investment income | | | 1.94 | %7 | | | 2.43 | % | | | 2.20 | % | | | 2.03 | % | | | 2.04 | % | | | 1.90 | %7 | | | 1.71 | %7 |
| | | | | | | | | | | | | | | | | | | | | | | | | | | | |
Supplemental Data | | | | | | | | | | | | | | | | | | | | | | | | | | | | |
Net assets, end of period (000) | | $ | 35,747 | | | $ | 29,127 | | | $ | 23,083 | | | $ | 34,720 | | | $ | 32,545 | | | $ | 29,752 | | | $ | 31,328 | |
| | | | | | | | | | | | | | | | | | | | | | | | | | | | |
Portfolio turnover | | | 179 | %8 | | | 354 | %9 | | | 391 | %10 | | | 93 | % | | | 136 | % | | | 90 | % | | | 101 | % |
| | | | | | | | | | | | | | | | | | | | | | | | | | | | |
| * | The performance prior to January 31, 2005 set forth in this table is the financial data of the State Street Research Asset Allocation Fund, a series of a predecessor trust, the State Street Research Income Trust. BlackRock Funds acquired all of the assets and certain stated liabilities of State Street Research Asset Allocation Fund on January 28, 2005. The net asset values and other per share information listed have been restated to reflect the conversion ratio of 0.71889936 for Institutional shares. |
| 1 | Based on average shares outstanding. |
| 2 | Includes redemption fees, which are less than $0.01 per share. |
| 3 | Where applicable, total investment returns exclude the effects of any sales charges and include the reinvestment of dividends and distributions. |
| 4 | Aggregate total investment return. |
| 5 | Includes proceeds received from a settlement of litigation, which impacted the Fund’s total return. Not including these proceeds, the Fund’s total return would have been 5.92%. |
| 6 | Redemption fee of 2.00% is reflected in total return calculations. There was no impact to the return. |
| 8 | Includes mortgage dollar roll transactions; excluding these transactions the portfolio turnover would have been 122%. |
| 9 | Includes mortgage dollar roll transactions; excluding these transactions the portfolio turnover would have been 227%. |
| 10 | Includes TBA transactions, excluding these transactions, the portfolio turnover would have been 121%. |
See Notes to Financial Statements.
| | | | | | |
| | | BLACKROCK ASSET ALLOCATION PORTFOLIO | | MARCH 31, 2010 | | 35 |
| | |
| Financial Highlights (continued) | | |
| | |
| | | | | | | | | | | | | | | | | | | | | | | | | | | | |
| | | Service | |
| | | Six Months Ended March 31, 2010 | | | Year Ended September 30, | | | Period March 1, 2005 to | | | Period January 28, 20051 to | |
| | | (Unaudited) | | | 2009 | | | 2008 | | | 2007 | | | 2006 | | | September 30, 2005 | | | February 28, 2005 | |
Per Share Operating Performance | | | | | | | | | | | | | | | | | | | | | | | | | | | | |
Net asset value, beginning of period | | $ | 13.24 | | | $ | 12.93 | | | $ | 17.03 | | | $ | 15.51 | | | $ | 15.49 | | | $ | 14.97 | | | $ | 14.63 | |
| | | | | | | | | | | | | | | | | | | | | | | | | | | | |
Net investment income | | | 0.11 | 2 | | | 0.24 | 2 | | | 0.30 | 2 | | | 0.29 | 2 | | | 0.27 | 2 | | | 0.14 | 2 | | | 0.01 | |
Net realized and unrealized gain (loss) | | | 0.91 | | | | 0.44 | | | | (2.76 | ) | | | 2.08 | 3 | | | 0.65 | 3 | | | 0.52 | 3 | | | 0.33 | |
| | | | | | | | | | | | | | | | | | | | | | | | | | | | |
Net increase (decrease) from investment operations | | | 1.02 | | | | 0.68 | | | | (2.46 | ) | | | 2.37 | | | | 0.92 | | | | 0.66 | | | | 0.34 | |
| | | | | | | | | | | | | | | | | | | | | | | | | | | | |
Dividends and distributions from: | | | | | | | | | | | | | | | | | | | | | | | | | | | | |
Net investment income | | | (0.11 | ) | | | (0.18 | ) | | | (0.34 | ) | | | (0.22 | ) | | | (0.25 | ) | | | (0.14 | ) | | | — | |
Net realized gain | | | — | | | | (0.19 | ) | | | (1.30 | ) | | | (0.63 | ) | | | (0.65 | ) | | | — | | | | — | |
| | | | | | | | | | | | | | | | | | | | | | | | | | | | |
Total dividends and distributions | | | (0.11 | ) | | | (0.37 | ) | | | (1.64 | ) | | | (0.85 | ) | | | (0.90 | ) | | | (0.14 | ) | | | — | |
| | | | | | | | | | | | | | | | | | | | | | | | | | | | |
Net asset value, end of period | | $ | 14.15 | | | $ | 13.24 | | | $ | 12.93 | | | $ | 17.03 | | | $ | 15.51 | | | $ | 15.49 | | | $ | 14.97 | |
| | | | | | | | | | | | | | | | | | | | | | | | | | | | |
Total Investment Return4 | |
Based on net asset value | | | 7.73 | %5 | | | 5.83 | %6 | | | (16.00 | )% | | | 15.74 | %7 | | | 6.24 | %7 | | | 4.44 | %5,7 | | | 2.32 | %5 |
| | | | | | | | | | | | | | | | | | | | | | | | | | | | |
Ratios to Average Net Assets | |
Total expenses | | | 1.29 | %8 | | | 1.18 | % | | | 1.11 | % | | | 1.31 | % | | | 1.17 | % | | | 1.36 | %8 | | | 1.26 | %8 |
| | | | | | | | | | | | | | | | | | | | | | | | | | | | |
Total expenses excluding recoupment of past waived fees | | | 1.29 | %8 | | | 1.15 | % | | | 1.11 | % | | | 1.31 | % | | | 1.17 | % | | | 1.36 | %8 | | | 1.26 | %8 |
| | | | | | | | | | | | | | | | | | | | | | | | | | | | |
Total expenses after fees waived, reimbursed and paid indirectly | | | 1.21 | %8 | | | 1.14 | % | | | 1.11 | % | | | 1.10 | % | | | 1.11 | % | | | 1.16 | %8 | | | 1.16 | %8 |
| | | | | | | | | | | | | | | | | | | | | | | | | | | | |
Total expenses after fees waived, reimbursed and paid indirectly and excluding interest expense | | | 1.17 | %8 | | | 1.14 | % | | | 1.07 | % | | | 1.10 | % | | | 1.11 | % | | | 1.16 | %8 | | | 1.16 | %8 |
| | | | | | | | | | | | | | | | | | | | | | | | | | | | |
Net investment income (loss) | | | 1.64 | %8 | | | 2.17 | % | | | 1.96 | % | | | 1.80 | % | | | 1.76 | % | | | 1.60 | %8 | | | (0.17 | )%8 |
| | | | | | | | | | | | | | | | | | | | | | | | | | | | |
Supplemental Data | |
Net assets, end of period (000) | | $ | 1,511 | | | $ | 1,472 | | | $ | 1,552 | | | $ | 2,325 | | | $ | 2,201 | | | $ | 2,171 | | | $ | 2,171 | |
| | | | | | | | | | | | | | | | | | | | | | | | | | | | |
Portfolio turnover | | | 179 | %9 | | | 354 | %10 | | | 391 | %11 | | | 93 | % | | | 136 | % | | | 90 | % | | | 101 | % |
| | | | | | | | | | | | | | | | | | | | | | | | | | | | |
| | | | | | | | | | | | | | | | | | | | | | | | | | | | |
| | | Investor A* | |
| | | Six Months Ended March 31, 2010 | | | Year Ended September 30, | | | Period March 1, 2005 to | | | Period April 1, 2004 to | |
| | | (Unaudited) | | | 2009 | | | 2008 | | | 2007 | | | 2006 | | | September 30, 2005 | | | February 28, 2005 | |
Per Share Operating Performance | |
Net asset value, beginning of period | | $ | 13.23 | | | $ | 12.92 | | | $ | 17.01 | | | $ | 15.50 | | | $ | 15.48 | | | $ | 14.95 | | | $ | 14.89 | |
| | | | | | | | | | | | | | | | | | | | | | | | | | | | |
Net investment income | | | 0.11 | 2 | | | 0.23 | 2 | | | 0.28 | 2 | | | 0.27 | 2 | | | 0.25 | 2 | | | 0.13 | 2 | | | 0.18 | |
Net realized and unrealized gain (loss) | | | 0.90 | | | | 0.43 | | | | (2.75 | ) | | | 2.07 | 3 | | | 0.66 | 3 | | | 0.53 | 3 | | | 0.80 | |
| | | | | | | | | | | | | | | | | | | | | | | | | | | | |
Net increase (decrease) from investment operations | | | 1.01 | | | | 0.66 | | | | (2.47 | ) | | | 2.34 | | | | 0.91 | | | | 0.66 | | | | 0.98 | |
| | | | | | | | | | | | | | | | | | | | | | | | | | | | |
Dividends and distributions from: | | | | | | | | | | | | | | | | | | | | | | | | | | | | |
Net investment income | | | (0.10 | ) | | | (0.16 | ) | | | (0.32 | ) | | | (0.20 | ) | | | (0.24 | ) | | | (0.13 | ) | | | (0.38 | ) |
Net realized gain | | | — | | | | (0.19 | ) | | | (1.30 | ) | | | (0.63 | ) | | | (0.65 | ) | | | — | | | | (0.54 | ) |
| | | | | | | | | | | | | | | | | | | | | | | | | | | | |
Total dividends and distributions | | | (0.10 | ) | | | (0.35 | ) | | | (1.62 | ) | | | (0.83 | ) | | | (0.89 | ) | | | (0.13 | ) | | | (0.92 | ) |
| | | | | | | | | | | | | | | | | | | | | | | | | | | | |
Net asset value, end of period | | $ | 14.14 | | | $ | 13.23 | | | $ | 12.92 | | | $ | 17.01 | | | $ | 15.50 | | | $ | 15.48 | | | $ | 14.95 | |
| | | | | | | | | | | | | | | | | | | | | | | | | | | | |
Total Investment Return4 | |
Based on net asset value | | | 7.70 | %5 | | | 5.66 | %12 | | | (16.05 | )% | | | 15.58 | %7 | | | 6.12 | %7 | | | 4.44 | %5,7 | | | 6.78 | %5 |
| | | | | | | | | | | | | | | | | | | | | | | | | | | | |
Ratios to Average Net Assets | |
Total expenses | | | 1.26 | %8 | | | 1.27 | % | | | 1.24 | % | | | 1.21 | % | | | 1.36 | % | | | 1.46 | %8 | | | 1.32 | %8 |
| | | | | | | | | | | | | | | | | | | | | | | | | | | | |
Total expenses excluding recoupment of past waived fees | | | 1.25 | %8 | | | 1.27 | % | | | 1.24 | % | | | 1.21 | % | | | 1.36 | % | | | 1.46 | %8 | | | 1.32 | %8 |
| | | | | | | | | | | | | | | | | | | | | | | | | | | | |
Total expenses after fees waived, reimbursed and paid indirectly | | | 1.26 | %8 | | | 1.26 | % | | | 1.24 | % | | | 1.21 | % | | | 1.23 | % | | | 1.25 | %8 | | | 1.24 | %8 |
| | | | | | | | | | | | | | | | | | | | | | | | | | | | |
Total expenses after fees waived, reimbursed and paid indirectly and excluding interest expense | | | 1.22 | %8 | | | 1.26 | % | | | 1.20 | % | | | 1.21 | % | | | 1.23 | % | | | 1.25 | %8 | | | 1.24 | %8 |
| | | | | | | | | | | | | | | | | | | | | | | | | | | | |
Net investment income | | | 1.60 | %8 | | | 2.04 | % | | | 1.84 | % | | | 1.68 | % | | | 1.63 | % | | | 1.51 | %8 | | | 1.55 | %8 |
| | | | | | | | | | | | | | | | | | | | | | | | | | | | |
Supplemental Data | |
Net assets, end of period (000) | | $ | 385,493 | | | $ | 361,751 | | | $ | 390,051 | | | $ | 506,537 | | | $ | 482,284 | | | $ | 491,557 | | | $ | 526,929 | |
| | | | | | | | | | | | | | | | | | | | | | | | | | | | |
Portfolio turnover | | | 179 | %9 | | | 354 | %10 | | | 391 | %11 | | | 93 | % | | | 136 | % | | | 90 | % | | | 101 | % |
| | | | | | | | | | | | | | | | | | | | | | | | | | | | |
See Notes to Financial Statements.
| | | | | | |
| 36 | | BLACKROCK ASSET ALLOCATION PORTFOLIO | | MARCH 31, 2010 | | |
| | |
| Financial Highlights (continued) | | |
| | |
| | | | | | | | | | | | | | | | | | | | | | | | | | | | |
| | | Investor B* | |
| | | Six Months Ended March 31, 2010 | | | Year Ended September 30, | | | Period March 1, 2005 to | | | Period April 1, 2004 to | |
| | | (Unaudited) | | | 2009 | | | 2008 | | | 2007 | | | 2006 | | | September 30, 2005 | | | February 28, 2005 | |
Per Share Operating Performance | |
Net asset value, beginning of period | | $ | 13.08 | | | $ | 12.75 | | | $ | 16.83 | | | $ | 15.35 | | | $ | 15.34 | | | $ | 14.81 | | | $ | 14.74 | |
| | | | | | | | | | | | | | | | | | | | | | | | | | | | |
Net investment income | | | 0.05 | 2 | | | 0.14 | 2 | | | 0.16 | 2 | | | 0.14 | 2 | | | 0.13 | 2 | | | 0.07 | 2 | | | 0.08 | |
Net realized and unrealized gain (loss) | | | 0.90 | | | | 0.43 | | | | (2.75 | ) | | | 2.07 | 3 | | | 0.65 | 3 | | | 0.51 | 3 | | | 0.81 | |
| | | | | | | | | | | | | | | | | | | | | | | | | | | | |
Net increase (decrease) from investment operations | | | 0.95 | | | | 0.57 | | | | (2.59 | ) | | | 2.21 | | | | 0.78 | | | | 0.58 | | | | 0.89 | |
| | | | | | | | | | | | | | | | | | | | | | | | | | | | |
Dividends and distributions from: | | | | | | | | | | | | | | | | | | | | | | | | | | | | |
Net investment income | | | (0.05 | ) | | | (0.05 | ) | | | (0.19 | ) | | | (0.10 | ) | | | (0.12 | ) | | | (0.05 | ) | | | (0.28 | ) |
| | | | | | | | | | | | | | | | | | | | | | | | | | | | |
Net realized gain | | | — | | | | (0.19 | ) | | | (1.30 | ) | | | (0.63 | ) | | | (0.65 | ) | | | — | | | | (0.54 | ) |
| | | | | | | | | | | | | | | | | | | | | | | | | | | | |
Total dividends and distributions | | | (0.05 | ) | | | (0.24 | ) | | | (1.49 | ) | | | (0.73 | ) | | | (0.77 | ) | | | (0.05 | ) | | | (0.82 | ) |
| | | | | | | | | | | | | | | | | | | | | | | | | | | | |
Net asset value, end of period | | $ | 13.98 | | | $ | 13.08 | | | $ | 12.75 | | | $ | 16.83 | | | $ | 15.35 | | | $ | 15.34 | | | $ | 14.81 | |
| | | | | | | | | | | | | | | | | | | | | | | | | | | | |
Total Investment Return4 | |
Based on net asset value | | | 7.28 | %5 | | | 4.93 | %13 | | | (16.89 | )% | | | 14.81 | %7 | | | 5.30 | %7 | | | 3.94 | %5,7 | | | 6.20 | %5 |
| | | | | | | | | | | | | | | | | | | | | | | | | | | | |
Ratios to Average Net Assets | |
Total expenses | | | 2.12 | %8 | | | 2.07 | % | | | 2.02 | % | | | 2.01 | % | | | 2.03 | % | | | 2.11 | %8 | | | 2.04 | %8 |
| | | | | | | | | | | | | | | | | | | | | | | | | | | | |
Total expenses excluding recoupment of past waived fees | | | 2.07 | %8 | | | 2.06 | % | | | 2.02 | % | | | 2.01 | % | | | 2.03 | % | | | 2.11 | %8 | | | 2.04 | %8 |
| | | | | | | | | | | | | | | | | | | | | | | | | | | | |
Total expenses after fees waived, reimbursed and paid indirectly | | | 2.11 | %8 | | | 2.04 | % | | | 2.02 | % | | | 2.01 | % | | | 2.00 | % | | | 2.01 | %8 | | | 2.04 | %8 |
| | | | | | | | | | | | | | | | | | | | | | | | | | | | |
Total expenses after fees waived, reimbursed and paid indirectly and excluding interest expense | | | 2.07 | %8 | | | 2.04 | % | | | 1.97 | % | | | 2.01 | % | | | 2.00 | % | | | 2.01 | %8 | | | 2.04 | %8 |
| | | | | | | | | | | | | | | | | | | | | | | | | | | | |
Net investment income | | | 0.73 | %8 | | | 1.27 | % | | | 1.06 | % | | | 0.89 | % | | | 0.86 | % | | | 0.75 | %8 | | | 0.73 | %8 |
| | | | | | | | | | | | | | | | | | | | | | | | | | | | |
Supplemental Data | | | | | | | | | | | | | | | | | | | | | | | | | | | | |
Net assets, end of period (000) | | $ | 62,226 | | | $ | 69,934 | | | $ | 97,710 | | | $ | 152,820 | | | $ | 175,826 | | | $ | 181,583 | | | $ | 187,689 | |
| | | | | | | | | | | | | | | | | | | | | | | | | | | | |
Portfolio turnover | | | 179 | %9 | | | 354 | %10 | | | 391 | %11 | | | 93 | % | | | 136 | % | | | 90 | % | | | 101 | % |
| | | | | | | | | | | | | | | | | | | | | | | | | | | | |
| * | The performance prior to January 31, 2005 set forth in this table is the financial data of the State Street Research Asset Allocation Fund, a series of a predecessor trust, the State Street Research Income Trust. BlackRock Funds acquired all of the assets and certain stated liabilities of State Street Research Asset Allocation Fund on January 28, 2005. The net asset values and other per share information listed have been restated to reflect the conversion ratios of 0.71991517 and 0.72321182 for Investor A and Investor B shares, respectively. |
| 1 | Commencement of operations. |
| 2 | Based on average shares outstanding. |
| 3 | Includes redemption fees, which are less than $0.01 per share. |
| 4 | Where applicable, total investment returns exclude the effects of any sales charges and include the reinvestment of dividends and distributions. |
| 5 | Aggregate total investment return. |
| 6 | Includes proceeds received from a settlement of litigation, which impacted the Fund’s total return. Not including these proceeds, the Fund’s total return would have been 5.60%. |
| 7 | Redemption fee of 2.00% is reflected in total return calculations. There was no impact to the return. |
| 9 | Includes mortgage dollar roll transactions; excluding these transactions the portfolio turnover would have been 122%. |
| 10 | Includes mortgage dollar roll transactions; excluding these transactions the portfolio turnover would have been 227%. |
| 11 | Includes TBA transactions, excluding these transactions, the portfolio turnover would have been 121%. |
| 12 | Includes proceeds received from a settlement of litigation, which impacted the Fund’s total return. Not including these proceeds, the Fund’s total return would have been 5.42%. |
| 13 | Includes proceeds received from a settlement of litigation, which impacted the Fund’s total return. Not including these proceeds, the Fund’s total return would have been 4.69%. |
See Notes to Financial Statements.
| | | | | | |
| | | BLACKROCK ASSET ALLOCATION PORTFOLIO | | MARCH 31, 2010 | | 37 |
Financial Highlights (concluded)
| | | | | | | | | | | | | | | | | | | | | | | | | | | | |
| | | Investor C* | |
| | | Six Months
Ended
March 31, 2010
(Unaudited) | | | Year Ended September 30, | | | Period
March 1, 2005 to
September 30, 2005 | | | Period
April 1, 2004 to
February 28, 2005 | |
| | | | 2009 | | | 2008 | | | 2007 | | | 2006 | | | |
Per Share Operating Performance | | | | | | | | | | | | | | | | | | | | | | | | | | | | |
Net asset value, beginning of period | | $ | 13.04 | | | $ | 12.73 | | | $ | 16.78 | | | $ | 15.34 | | | $ | 15.33 | | | $ | 14.81 | | | $ | 14.74 | |
| | | | | | | | | | | | | | | | | | | | | | | | | | | | |
Net investment income | | | 0.06 | 1 | | | 0.15 | 1 | | | 0.17 | 1 | | | 0.15 | 1 | | | 0.15 | 1 | | | 0.06 | 1 | | | 0.08 | |
Net realized and unrealized gain (loss) | | | 0.89 | | | | 0.43 | | | | (2.71 | ) | | | 2.04 | 2 | | | 0.65 | 2 | | | 0.52 | 2 | | | 0.81 | |
| | | | | | | | | | | | | | | | | | | | | | | | | | | | |
Net increase (decrease) from investment operations. | | | 0.95 | | | | 0.58 | | | | (2.54 | ) | | | 2.19 | | | | 0.80 | | | | 0.58 | | | | 0.89 | |
| | | | | | | | | | | | | | | | | | | | | | | | | | | | |
Dividends and distributions from: | | | | | | | | | | | | | | | | | | | | | | | | | | | | |
Net investment income | | | (0.06 | ) | | | (0.08 | ) | | | (0.21 | ) | | | (0.12 | ) | | | (0.14 | ) | | | (0.06 | ) | | | (0.28 | ) |
Net realized gain | | | — | | | | (0.19 | ) | | | (1.30 | ) | | | (0.63 | ) | | | (0.65 | ) | | | — | | | | (0.54 | ) |
| | | | | | | | | | | | | | | | | | | | | | | | | | | | |
Total dividends and distributions | | | (0.06 | ) | | | (0.27 | ) | | | (1.51 | ) | | | (0.75 | ) | | | (0.79 | ) | | | (0.06 | ) | | | (0.82 | ) |
| | | | | | | | | | | | | | | | | | | | | | | | | | | | |
Net asset value, end of period | | $ | 13.93 | | | $ | 13.04 | | | $ | 12.73 | | | $ | 16.78 | | | $ | 15.34 | | | $ | 15.33 | | | $ | 14.81 | |
| | | | | | | | | | | | | | | | | | | | | | | | | | | | |
Total Investment Return3 | | | | | | | | | | | | | | | | | | | | | | | | | | | | |
Based on net asset value | | | 7.28 | %4 | | | 4.99 | %5 | | | (16.66 | )% | | | 14.68 | %6 | | | 5.42 | %6 | | | 3.90 | %4,6 | | | 6.20 | %4 |
| | | | | | | | | | | | | | | | | | | | | | | | | | | | |
Ratios to Average Net Assets | | | | | | | | | | | | | | | | | | | | | | | | | | | | |
Total expenses | | | 1.96 | %7 | | | 1.98 | % | | | 1.94 | % | | | 1.95 | % | | �� | 1.94 | % | | | 2.11 | %7 | | | 2.04 | %7 |
| | | | | | | | | | | | | | | | | | | | | | | | | | | | |
Total expenses excluding recoupment of past waived fees | | | 1.96 | %7 | | | 1.97 | % | | | 1.94 | % | | | 1.95 | % | | | 1.94 | % | | | 2.11 | %7 | | | 2.04 | %7 |
| | | | | | | | | | | | | | | | | | | | | | | | | | | | |
Total expenses after fees waived, reimbursed and paid indirectly | | | 1.96 | %7 | | | 1.98 | % | | | 1.94 | % | | | 1.94 | % | | | 1.91 | % | | | 2.00 | %7 | | | 2.04 | %7 |
| | | | | | | | | | | | | | | | | | | | | | | | | | | | |
Total expenses after fees waived, reimbursed and paid indirectly and excluding interest expense | | | 1.91 | %7 | | | 1.98 | % | | | 1.90 | % | | | 1.94 | % | | | 1.91 | % | | | 2.00 | %7 | | | 2.04 | %7 |
| | | | | | | | | | | | | | | | | | | | | | | | | | | | |
Net investment income | | | 0.90 | %7 | | | 1.32 | % | | | 1.14 | % | | | 0.96 | % | | | 0.97 | % | | | 0.75 | %7 | | | 0.76 | %7 |
| | | | | | | | | | | | | | | | | | | | | | | | | | | | |
Supplemental Data | | | | | | | | | | | | | | | | | | | | | | | | | | | | |
Net assets, end of period (000) | | $ | 81,516 | | | $ | 72,063 | | | $ | 69,584 | | | $ | 84,596 | | | $ | 80,286 | | | $ | 67,371 | | | $ | 65,357 | |
| | | | | | | | | | | | | | | | | | | | | | | | | | | | |
Portfolio turnover | | | 179 | %8 | | | 354 | %9 | | | 391 | %10 | | | 93 | % | | | 136 | % | | | 90 | % | | | 101 | % |
| | | | | | | | | | | | | | | | | | | | | | | | | | | | |
| * | The performance prior to January 31, 2005 set forth in this table is the financial data of the State Street Research Asset Allocation Fund, a series of a predecessor trust, the State Street Research Income Trust. BlackRock Funds acquired all of the assets and certain stated liabilities of State Street Research Asset Allocation Fund on January 28, 2005. The net asset values and other per share information listed have been restated to reflect the conversion ratio of 0.72727901 for Investor C shares. |
| 1 | Based on average shares outstanding. |
| 2 | Includes redemption fees, which are less than $0.01 per share. |
| 3 | Where applicable, total investment returns exclude the effects of any sales charges and include the reinvestment of dividends and distributions. |
| 4 | Aggregate total investment return. |
| 5 | Includes proceeds received from a settlement of litigation, which impacted the Fund’s total return. Not including these proceeds, the Fund’s total return would have been 4.75%. |
| 6 | Redemption fee of 2.00% is reflected in total return calculations. There was no impact to the return. |
| 8 | Includes mortgage dollar roll transactions; excluding these transactions the portfolio turnover would have been 122%. |
| 9 | Includes mortgage dollar roll transactions; excluding these transactions the portfolio turnover would have been 227%. |
| 10 | Includes TBA transactions, excluding these transactions, the portfolio turnover would have been 121%. |
See Notes to Financial Statements.
| | | | | | |
| 38 | | BLACKROCK ASSET ALLOCATION PORTFOLIO | | MARCH 31, 2010 | | |
Notes to Financial Statements (Unaudited)
1. Organization and Significant Accounting Policies:
BlackRock FundsSM (the “Trust”), a Massachusetts business trust, is registered under the Investment Company Act of 1940, as amended (the “1940 Act”), as an open-end management investment company. As of March 31, 2010, the Trust had 25 series. These financial statements relate to the Trust’s BlackRock Asset Allocation Portfolio (the “Fund”). The Fund is diversified. The Fund’s financial statements are prepared in conformity with accounting principles generally accepted in the United States of America (“US GAAP”), which may require the use of management accruals and estimates. Actual results may differ from these estimates. The Fund offers multiple classes of shares. Institutional Shares are sold without a sales charge and only to certain eligible investors. Service Shares are sold without a sales charge. Investor A Shares are generally sold with a front-end sales charge. Investor B and Investor C Shares may be subject to a contingent deferred sales charge. All classes of shares have identical voting, dividend, liquidation and other rights and the same terms and conditions, except that Service, Investor A, Investor B and Investor C Shares bear certain expenses related to the shareholder servicing of such shares, and Investor B and Investor C Shares also bear certain expenses related to the distribution of such shares. Investor B Shares automatically convert to Investor A Shares after approximately eight years. Investor B Shares are only available for purchase through exchanges, dividend reinvestment or for purchase by certain qualified employee benefit plans. Each class has exclusive voting rights with respect to matters relating to its shareholder servicing and distribution expenditures (except that Investor B shareholders may vote on material changes to the Investor A distribution plan).
The following is a summary of significant accounting policies followed by the Fund:
Valuation: The Fund’s policy is to fair value its financial instruments at market value. Equity investments traded on a recognized securities exchange or the NASDAQ Global Market System are valued at the last reported sale price that day or the NASDAQ official closing price, if applicable. For equity investments traded on more than one exchange, the last reported sale price on the exchange where the stock is primarily traded is used. Equity investments traded on a recognized exchange for which there were no sales on that day are valued at the last available bid price. If no bid price is available, the prior day’s price will be used, unless it is determined that such prior day’s price no longer reflects the fair value of the security. The Fund values its bond investments on the basis of last available bid prices or current market quotations provided by dealers or pricing services selected under the supervision of the Fund’s Board of Trustees (the “Board”). In determining the value of a particular investment, pricing services may use certain information with respect to transactions in such investments, quotations from dealers, pricing matrixes, market transactions in comparable investments, various relationships observed in the market between investments and calculated yield measures based on valuation technology commonly employed in the market for such investments. Asset-backed and mortgage-backed securities are valued by independent pricing services using models that consider estimated cash flows of each tranche of the security, establish a benchmark yield and develop an estimated tranche specific spread to the benchmark yield based on the unique attributes of the tranche. Financial futures contracts traded on exchanges are valued at their last sale price. Swap agreements are valued by utilizing quotes received daily by the Fund’s pricing service or through brokers, which are derived using daily swap curves and trades of underlying securities. To-be-announced (“TBA”) commitments are valued at the current market value of the underlying securities. Short-term securities with remaining maturities of 60 days or less may be valued at amortized cost, which approximates fair value. Investments in open-end investment companies are valued at net asset value each business day.
The Fund values its investment in BlackRock Liquidity Series, LLC Money Market Series (the “Money Market Series”) at fair value, which is ordinarily based upon their pro rata ownership in the net assets of the underlying fund. The Money Market Series seeks current income consistent with maintaining liquidity and preserving capital. Although the Money Market Series is not registered under the 1940 Act, its investments will follow the parameters of investments by a money market fund that is subject to Rule 2a-7 promulgated by the Securities and Exchange Commission (“SEC”) under the 1940 Act. The Fund may withdraw up to 25% of its investment daily, although the manager of the Money Market Series, in its sole discretion, may permit an investor to withdraw more than 25% on any one day.
Securities and other assets and liabilities denominated in foreign currencies are translated into US dollars using exchange rates determined as of the close of business on the New York Stock Exchange (“NYSE”). Foreign currency exchange contracts are valued at the mid between the bid and ask prices and are determined as of the close of business on the NYSE. Interpolated values are derived when the settlement date of the contract is an interim date for which quotations are not available.
Exchange-traded options are valued at the mean between the last bid and ask prices at the close of the options market in which the options trade. An exchange-traded option for which there is no mean price is valued at the last bid (long positions) or ask (short positions) price. If no bid or ask price is available, the prior day’s price will be used, unless it is determined that such prior day’s price no longer reflects the fair value of the option. Over-the-counter (“OTC”) options and swaptions are valued by an independent pricing service using a mathematical model which incorporates a number of market data factors, such as the trades and prices of the underlying instruments.
In the event that application of these methods of valuation results in a price for an investment which is deemed not to be representative of the market value of such investment or is not available, the investment will be valued by a method approved by the Board as reflecting fair value (“Fair Value Assets”). When determining the price for Fair Value Assets, the investment advisor and/or sub-advisor seek to determine the price
| | | | | | |
| | | BLACKROCK ASSET ALLOCATION PORTFOLIO | | MARCH 31, 2010 | | 39 |
|
| Notes to Financial Statements (continued) |
that the Fund might reasonably expect to receive from the current sale of that asset in an arm’s-length transaction. Fair value determinations shall be based upon all available factors that the investment advisor and/or sub-advisor deem relevant. The pricing of all Fair Value Assets is subsequently reported to the Board or a committee thereof.
Generally, trading in foreign instruments is substantially completed each day at various times prior to the close of business on the NYSE. Occasionally, events affecting the values of such instruments may occur between the foreign market close and the close of business on the NYSE that may not be reflected in the computation of the Fund’s net assets. If events (for example, a company announcement, market volatility or a natural disaster) occur during such periods that are expected to materially affect the value of such instruments, those instruments may be Fair Value Assets and be valued at their fair value, as determined in good faith by the Board or by the investment advisor using a pricing service and/or procedures approved by the Board. Each business day, the Fund uses a pricing service selected under the supervision of the Board to assist with the valuation of certain foreign exchange-traded equity securities and foreign exchange-traded and OTC options (the “Systematic Fair Value Price”). Using current market factors, the Systematic Fair Value Price is designed to value such foreign securities and foreign options at fair value as of the close of business on the NYSE, which follows the close of the local markets.
The Fund is not obligated for costs associated with the registration of restricted securities.
Foreign Currency Transactions: The Fund’s books and records are maintained in US dollars. Foreign currency amounts are translated into US dollars as follows: (i) market value of investment securities, assets and liabilities at the current rate of exchange; and (ii) purchases and sales of investment securities, income and expenses at the rates of exchange prevailing on the respective dates of such transactions. Generally, when the US dollar rises in value against foreign currency, the Fund’s investments denominated in that currency will lose value because its currency is worth fewer US dollars; the opposite effect occurs if the US dollar falls in relative value.
The Fund reports foreign currency related transactions as components of realized gain (loss) for financial reporting purposes, whereas such components are treated as ordinary income for federal income tax purposes.
Asset-Backed and Mortgage-Backed Securities: The Fund may invest in asset-backed securities. Asset-backed securities are generally issued as pass-through certificates, which represent undivided fractional ownership interests in an underlying pool of assets, or as debt instruments, which are also known as collateralized obligations, and are generally issued as the debt of a special purpose entity organized solely for the purpose of owning such assets and issuing such debt. Asset-backed securities are often backed by a pool of assets representing the obligations of a number of different parties. The yield characteristics of certain asset-backed securities may differ from traditional debt securities. One such major difference is that all or a principal part of the obligations may be prepaid at any time because the underlying assets (i.e., loans) may be prepaid at any time. As a result, a decrease in interest rates in the market may result in increases in the level of prepayments as borrowers, particularly mortgagors, refinance and repay their loans. An increased prepayment rate with respect to an asset-backed security subject to such a prepayment rate feature will have the effect of shortening the maturity of the security. If the Fund has purchased such an asset-backed security at a premium, a faster than anticipated prepayment rate could result in a loss of principal to the extent of the premium paid.
The Fund may purchase certain mortgage pass-through securities. There are a number of important differences among the agencies and instrumentalities of the US Government that issue mortgage-related securities and among the securities that they issue. For example, mortgage-related securities guaranteed by the Government National Mortgage Association (“GNMA”) are guaranteed as to the timely payment of principal and interest by GNMA, and such guarantee is backed by the full faith and credit of the United States. However, mortgage-related securities issued by the Federal Home Loan Mortgage Corporation (“FHLMC”) and Federal National Mortgage Association (“FNMA”) including FNMA guaranteed Mortgage Pass-Through Certificates are solely the obligations of the FHLMC and FNMA, are not backed by or entitled to the full faith and credit of the United States but are supported by the right of the issuer to borrow from the Treasury.
The Fund invests a significant portion of its assets in securities backed by commercial or residential mortgage loans or in issuers that hold mortgage and other asset-backed securities. Please see the Schedule of Investments for these securities. Changes in economic conditions, including delinquencies and/or defaults on assets underlying these securities, can affect the value, income and/or liquidity of such positions.
Multiple Class Pass-Through Securities: The Fund may invest in multiple class pass-through securities, including collateralized mortgage obligations (“CMOs”) and commercial mortgage backed securities. These multiple class securities may be issued by GNMA, US Government agencies or instrumentalities or by trusts formed by private originators of, or investors in, mortgage loans. In general, CMOs are debt obligations of a legal entity that are collateralized by, and multiple class pass-through securities represent direct ownership interests in, a pool of residential or commercial mortgage loans or mortgage pass-through securities, the payments on which are used to make payments on the CMOs or multiple class pass-through securities. Classes of CMOs include interest only (“IOs”), principal only (“POs”), planned amortization classes and targeted amortization classes. IOs and POs are stripped mortgage-backed securities representing interests in a pool of mortgages, the cash flow from which has been separated into interest and principal components. IOs receive the interest portion of the cash flow while POs receive the principal portion. IOs and POs can be extremely volatile in response to changes in interest rates. As interest rates rise and fall, the value of IOs tends to move in the same direction as interest rates. POs perform best when prepayments on the underlying mortgages rise since this increases
| | | | | | |
| 40 | | BLACKROCK ASSET ALLOCATION PORTFOLIO | | MARCH 31, 2010 | | |
|
| Notes to Financial Statements (continued) |
the rate at which the investment is returned and the yield to maturity on the PO. When payments on mortgages underlying a PO are slower than anticipated, the life of the PO is lengthened and the yield to maturity is reduced. If the underlying mortgage assets experience greater than anticipated pre-payments of principal, the Fund may not fully recoup its initial investments in IOs.
Capital Trusts: These securities are typically issued by corporations, generally in the form of interest-bearing notes with preferred securities characteristics, or by an affiliated business trust of a corporation, generally in the form of beneficial interests in subordinated debentures or similarly structured securities. The securities can be structured as either fixed or adjustable coupon securities that can have either a perpetual or stated maturity date. Interest can be deferred without creating an event of default or acceleration, although maturity cannot take place unless all cumulative payment obligations have been met. The deferral of payments does not affect the purchase or sale of these securities in the open market. Payments on these securities are treated as interest rather than dividends for federal income tax purposes. These securities can have a rating that is slightly below that of the issuing company’s senior debt securities.
Preferred Stock: The Fund may invest in preferred stocks. Preferred stock has a preference over common stock in liquidation (and generally in receiving dividends as well) but is subordinated to the liabilities of the issuer in all respects. As a general rule, the market value of preferred stock with a fixed dividend rate and no conversion element varies inversely with interest rates and perceived credit risk, while the market price of convertible preferred stock generally also reflects some element of conversion value. Because preferred stock is junior to debt securities and other obligations of the issuer, deterioration in the credit quality of the issuer will cause greater changes in the value of a preferred stock than in a more senior debt security with similar stated yield characteristics. Unlike interest payments on debt securities, preferred stock dividends are payable only if declared by the issuer’s board of directors. Preferred stock also may be subject to optional or mandatory redemption provisions.
Collateralized Debt Obligations: The Fund may invest in collateralized debt obligations (“CDOs”), which include collateralized bond obligations (“CBOs”) and collateralized loan obligations (“CLOs”). CBOs and CLOs are types of asset-backed securities. A CDO is a bankruptcy remote entity which is backed by a diversified pool of debt securities (CBOs) or syndicated bank loans (CLOs). The cash flows of the CDO can be split into multiple segments, called “tranches”, which will vary in risk profile and yield. The riskiest segment is the subordinated or “equity” tranche. This tranche bears the greatest risk of defaults from the underlying assets in the CDO and serves to protect the other, more senior, tranches from default in all but the most severe circumstances. Since it is shielded from defaults by the more junior tranches, a “senior” tranche will typically have higher credit ratings and lower yields than their underlying securities, and often receive investment grade ratings from one or more of the nationally recognized rating agencies. Despite the protection from the more junior tranches, senior tranches can experience substantial losses due to actual defaults, increased sensitivity to future defaults and the disappearance of one or more protecting tranches as a result of changes in the credit profile of the underlying pool of assets.
Borrowed Bond Agreements: In a borrowed bond agreement, the Fund borrows securities from a third party, with the commitment that they will be returned to the lender on an agreed-upon date. Borrowed bond agreements are primarily entered into to settle short positions. In a borrowed bond agreement, the Fund’s prime broker or third party broker takes possession of the underlying collateral securities or cash to settle such short positions. The value of the underlying collateral securities or cash approximates the principal amount of the borrowed bond transaction, including accrued interest. To the extent that borrowed bond transactions exceed one business day, the value of the collateral with any counterparty is marked to market on a daily basis to ensure the adequacy of the collateral. If the lender defaults and the value of the collateral declines or if bankruptcy proceedings are commenced with respect to the lender of the security, realization of the collateral by the Fund may be delayed or limited.
Forward Commitments and When-Issued Delayed Delivery Securities: The Fund may purchase securities on a when-issued basis and may purchase or sell securities on a forward commitment basis. Settlement of such transactions normally occurs within a month or more after the purchase or sale commitment is made. The Fund may purchase securities under such conditions with the intention of actually acquiring them, but may enter into a separate agreement to sell the securities before the settlement date. Since the value of securities purchased may fluctuate prior to settlement, the Fund may be required to pay more at settlement than the security is worth. In addition, the purchaser is not entitled to any of the interest earned prior to settlement. When purchasing a security on a delayed-delivery basis, the Fund assumes the rights and risks of ownership of the security, including the risk of price and yield fluctuations. In the event of default by the counterparty, the Fund’s maximum amount of loss is the unrealized gain of the commitment, which is shown on the Schedule of Investments, if any.
Inflation-Indexed Bonds: Inflation-indexed bonds are fixed income securities whose principal value is periodically adjusted according to the rate of inflation. If the index measuring inflation falls, the principal value of inflation-indexed bonds will be adjusted downward, and consequently the interest payable on these securities (calculated with respect to a smaller principal amount) will be reduced. Repayment of the original bond principal upon maturity (as adjusted for inflation) is guaranteed in the case of US Treasury inflation-indexed bonds. For bonds that do not provide a similar guarantee, the adjusted principal value of the bond repaid at maturity may be less than the original principal.
Mortgage Dollar Roll Transactions: The Fund may sell TBA mortgage-backed securities and simultaneously contract to repurchase substantially similar (same type, coupon and maturity) securities on a specific future date at an agreed upon price. During the period between the sale
| | | | | | |
| | | BLACKROCK ASSET ALLOCATION PORTFOLIO | | MARCH 31, 2010 | | 41 |
|
| Notes to Financial Statements (continued) |
and repurchase, the Fund will not be entitled to receive interest and principal payments on the securities sold. The Fund accounts for dollar roll transactions as purchases and sales and realizes gains and losses on these transactions. These transactions may increase the Fund’s portfolio turnover rate. Mortgage dollar rolls involve the risk that the market value of the securities that the Fund is required to purchase may decline below the agreed upon repurchase price of those securities.
Treasury Roll Transactions: A treasury roll transaction involves the sale of a Treasury security, with an agreement to repurchase the same security at an agreed upon price and date. Treasury rolls constitute a borrowing and the difference between the sale and repurchase price represents interest expense at an agreed upon rate. Whether such a transaction produces a positive impact on performance depends upon whether the income and gains on the securities purchased with the proceeds received from the sale of the security exceeds the interest expense incurred by the Fund. Treasury rolls are not considered purchases and sales and any gains or losses incurred on the treasury rolls will be deferred until the treasury securities are disposed.
Treasury roll transactions involve the risk that the market value of the securities that the Fund is required to purchase may decline below the agreed upon purchase price of those securities. If investment performance of securities purchased with proceeds from these transactions does not exceed the income, capital appreciation and gain or loss that would have been realized on the securities sold as part of the treasury roll, the use of this technique will adversely impact the investment performance of the Fund.
Reverse Repurchase Agreements: The Fund may enter into reverse repurchase agreements with qualified third party broker-dealers. In a reverse repurchase agreement, the Fund sells securities to a bank or broker-dealer and agrees to repurchase the securities at a mutually agreed upon date and price. Certain agreements have no stated maturity and can be terminated by either party at any time. Interest on the value of the reverse repurchase agreements issued and outstanding is based upon competitive market rates determined at the time of issuance. The Fund may utilize reverse repurchase agreements when it is anticipated that the interest income to be earned from the investment of the proceeds of the transaction is greater than the interest expense of the transaction. Reverse repurchase agreements involve leverage risk and also the risk that the market value of the securities that the Fund is obligated to repurchase under the agreement may decline below the repurchase price. In the event the buyer of securities under a reverse repurchase agreement files for bankruptcy or becomes insolvent, the Fund’s use of the proceeds from the agreement may be restricted while the other party, or its trustee or receiver, determines whether or not to enforce the Fund’s obligation to repurchase the securities.
TBA Commitments: The Fund may enter into TBA commitments pursuant to which it agrees to purchase mortgage-backed securities for a fixed price, with payment and delivery at a scheduled future date beyond the customary settlement period for that security. The specific securities to be delivered are not identified at the trade date; however, delivered securities must meet specified terms, including issuer, rate and mortgage terms. The Fund generally enters into TBA transactions with the intent to take possession of the underlying mortgage-backed securities but can extend the settlement or roll the transaction. TBA commitments involve a risk of loss if the value of the security to be purchased or sold declines or increases prior to settlement date, which is in addition to the risk of decline in the value of the Fund’s other assets.
Zero-Coupon Bonds: The Fund may invest in zero-coupon bonds, which are normally issued at a significant discount from face value and do not provide for periodic interest payments. Zero-coupon bonds may experience greater volatility in market value than similar maturity debt obligations which provide for regular interest payments.
Segregation and Collateralization: In cases in which the 1940 Act and the interpretive positions of the SEC require that the Fund either delivers collateral or segregates assets in connection with certain investments (e.g., dollar rolls, TBAs beyond normal settlement, borrowed bonds, financial futures contracts, foreign currency exchange contracts, swaps and written options), or certain borrowings (e.g., reverse repurchase agreements) the Fund will, consistent with SEC rules and/or certain interpretive letters issued by the SEC, segregate collateral or designate on its books and records cash or other liquid securities having a market value at least equal to the amount that would otherwise be required to be physically segregated. Furthermore, based on requirements and agreements with certain exchanges and third party broker-dealers, each party has requirements to deliver/deposit securities as collateral for certain investments.
Investment Transactions and Investment Income: For financial reporting purposes, investment transactions are recorded on the dates the transactions are entered into (the trade dates). Realized gains and losses on investment transactions are determined on the identified cost basis. Dividend income is recorded on the ex-dividend dates. Dividends from foreign securities where the ex-dividend date may have passed are subsequently recorded when the Fund has determined the ex-dividend date. Under the applicable foreign tax laws, a withholding tax at various rates may be imposed on capital gains, dividends and interest. Upon notification from issuers, some of the dividend income received from a real estate investment trust may be redesignated as a reduction of cost of the related investment and/or realized gain. Interest income, including amortization of premium and accretion of discount on debt securities, is recognized on the accrual basis. Income and realized and unrealized gains and losses are allocated daily to each class based on its relative net assets. Consent fees are compensation for agreeing to changes in the terms of debt instruments and are included in interest income in the Statement of Operations.
Dividends and Distributions: Dividends and distributions, if any, paid by the Fund are recorded on the ex-dividend dates. The amount and timing of dividends and distributions are determined in accordance with federal income tax regulations, which may differ from US GAAP.
| | | | | | |
| 42 | | BLACKROCK ASSET ALLOCATION PORTFOLIO | | MARCH 31, 2010 | | |
|
| Notes to Financial Statements (continued) |
Securities Lending: The Fund may lend securities to financial institutions that provide cash as collateral, which will be maintained at all times in an amount equal to at least 100% of the current market value of the loaned securities. The market value of the loaned securities is determined at the close of business of the Fund and any additional required collateral is delivered to the Fund on the next business day. Securities lending income, as disclosed in the Statement of Operations, represents the income earned from the investment of the cash collateral, net of rebates paid to, or fees paid by, borrowers and less the fees paid to the securities lending agent. Loans of securities are terminable at any time and the borrower, after notice, is required to return borrowed securities within the standard time period for settlement of securities transactions. In the event that the borrower defaults on its obligation to return borrowed securities because of insolvency or for any other reason, the Fund could experience delays and costs in gaining access to the collateral. The Fund also could suffer a loss if the value of an investment purchased with cash collateral falls below the market value of loaned securities or if the value of an investment purchased with cash collateral falls below the value of the original cash collateral received.
Income Taxes: It is the Fund’s policy to comply with the requirements of the Internal Revenue Code of 1986, as amended, applicable to regulated investment companies and to distribute substantially all of its taxable income to its shareholders. Therefore, no federal income tax provision is required.
The Fund files US federal and various state and local tax returns. No income tax returns are currently under examination. The statute of limitations on the Fund’s US federal tax returns remains open for each of the four years ended September 30, 2009. The statutes of limitations on the Fund’s state and local tax returns may remain open for an additional year depending upon the jurisdiction. There are no uncertain tax positions that require recognition of a tax liability.
Recent Accounting Standard: In January 2010, Financial Accounting Standards Board issued amended guidance to improve disclosure about fair value measurements which will require additional disclosures about transfers into and out of Levels 1 and 2 and separate disclosures about purchases, sales, issuances and settlements in the reconciliation for fair value measurements using significant unobservable inputs (Level 3). It also clarifies existing disclosure requirements relating to the levels of disaggregation for fair value measurement and inputs and valuation techniques used to measure fair value. The amended guidance is effective for financial statements for fiscal years beginning after December 15, 2009, and interim periods within those fiscal years, except for disclosures about purchases, sales, issuances and settlements in the rollforward of activity in Level 3 fair value measurements, which are effective for fiscal years beginning after December 15, 2010 and for interim periods within those fiscal years. The impact of this guidance on the Fund’s financial statements and disclosures is currently being assessed.
Other: Expenses directly related to the Fund or its classes are charged to the Fund or its classes. Other operating expenses shared by several funds are pro rated among those funds on the basis of relative net assets or other appropriate methods. Other expenses of the Fund are allocated daily to each class based on its relative net assets.
2. Derivative Financial Instruments:
The Fund may engage in various portfolio investment strategies both to increase the returns of the Fund and to economically hedge, or protect, its exposure to certain risks such as credit risk, equity risk, interest rate risk and foreign currency exchange rate risk. Losses may arise if the value of the contract decreases due to an unfavorable change in the price of the underlying instrument or if the counterparty does not perform under the contract. The Fund may mitigate counterparty risk through master netting agreements included within an International Swap and Derivatives Association, Inc. (“ISDA”) Master Agreement between the Fund and each of its counterparties. The ISDA Master Agreement allows the Fund to offset with its counterparty certain derivative financial instrument’s payables and/or receivables with collateral held with each counterparty. The amount of collateral moved to/from applicable counterparties is based upon minimum transfer amounts of up to $500,000. To the extent amounts due to the Fund from its counterparties are not fully collateralized contractually or otherwise, the Fund bears the risk of loss from counterparty non-performance. See Note 1 “Segregation and Collateralization” for information with respect to collateral practices. In addition, the Fund manages counterparty risk by entering into agreements only with counterparties that they believe have the financial resources to honor their obligations and by monitoring the financial stability of those counterparties.
The Fund’s maximum risk of loss from counterparty credit risk on OTC derivatives is generally the aggregate unrealized gain in excess of any collateral pledged by the counterparty to the Fund. For OTC options purchased, the Fund bears the risk of loss in the amount of the premiums paid and change in market value of the options should the counterparty not perform under the contracts. Options written by the Fund do not give rise to counterparty credit risk, as options written obligate the Fund to perform and not the counterparty. Certain ISDA Master Agreements allow counterparties to OTC derivatives to terminate derivative contracts prior to maturity in the event the Fund’s net assets decline by a stated percentage or the Fund fails to meet the terms of its ISDA Master Agreements, which would cause the Fund to accelerate payment of any net liability owed to the counterparty. Counterparty risk related to exchange-traded financial futures contracts and options is minimal because of the protection against defaults provided by the exchange on which they trade.
Financial Futures Contracts: The Fund may purchase or sell financial futures contracts and options on financial futures contracts to gain exposure to, or economically hedge against, changes in the value of equity securities (equity risk), interest rates (interest rate risk) or foreign
| | | | | | |
| | | BLACKROCK ASSET ALLOCATION PORTFOLIO | | MARCH 31, 2010 | | 43 |
|
| Notes to Financial Statements (continued) |
currencies (foreign currency exchange rate risk). Financial futures contracts are contracts for delayed delivery of securities or currencies at a specific future date and at a specific price or yield. Pursuant to the contract, the Fund agrees to receive from or pay to the broker an amount of cash equal to the daily fluctuation in value of the contract. Such receipts or payments are known as margin variation and are recognized by the Fund as unrealized gains or losses. When the contract is closed, the Fund records a realized gain or loss equal to the difference between the value of the contract at the time it was opened and the value at the time it was closed. The use of financial futures transactions involves the risk of an imperfect correlation in the movements in the price of financial futures contracts, interest or foreign currency exchange rates and the underlying assets.
Foreign Currency Exchange Contracts: The Fund may enter into foreign currency exchange contracts as an economic hedge against either specific transactions or portfolio instruments (foreign currency exchange rate risk). A foreign currency exchange contract is an agreement between two parties to buy and sell a currency at a set exchange rate on a future date. Foreign currency exchange contracts, when used by the Fund, help to manage the overall exposure to the currency backing some of the investments held by the Fund. The contract is marked-to-market daily and the change in market value is recorded by the Fund as an unrealized gain or loss. When the contract is closed, the Fund records a realized gain or loss equal to the difference between the value at the time it was opened and the value at the time it was closed. The use of foreign currency exchange contracts involves the risk that counterparties may not meet the terms of the agreement or unfavorable movements in the value of a currency relative to the US dollar.
Options: The Fund may purchase and write call and put options to increase or decrease its exposure to underlying instruments (interest rate risk) and/or, in the case of options written, to generate gains from options premiums. A call option gives the purchaser of the option the right (but not the obligation) to buy, and obligates the seller to sell (when the option is exercised), the underlying instrument at the exercise price at any time or at a specified time during the option period. A put option gives the holder the right to sell and obligates the writer to buy the underlying instrument at the exercise price at any time or at a specified time during the option period. When the Fund purchases (writes) an option, an amount equal to the premium paid (received) by the Fund is reflected as an asset (liability). The amount of the asset (liability) is subsequently marked-to-market to reflect the current market value of the option purchased (written). When an instrument is purchased or sold through an exercise of an option, the related premium paid (or received) is added to (or deducted from) the basis of the instrument acquired or deducted from (or added to) the proceeds of the instrument sold. When an option expires (or the Fund enters into a closing transaction), the Fund realizes a gain or loss on the option to the extent of the premiums received or paid (or gain or loss to the extent the cost of the closing transaction exceeds the premium received or paid). When the Fund writes a call option, such option is “covered,” meaning that the Fund holds the underlying instrument subject to being called by the option counterparty, or cash in an amount sufficient to cover the obligation. When the Fund writes a put option, such option is covered by cash in an amount sufficient to cover the obligation.
Options on swaps (swaptions) are similar to options on securities except that instead of selling or purchasing the right to buy or sell a security, the writer or purchaser of the swap option is granting or buying the right to enter into a previously agreed upon interest rate swap agreement at any time before the expiration of the option.
The Fund may also purchase or sell listed or OTC foreign currency options, foreign currency futures and related options on foreign currency futures as a short or long hedge against possible variations in foreign exchange rates. When foreign currency is purchased or sold through an exercise of a foreign currency option, the related premium paid (or received) is added to (or deducted from) the basis of the foreign currency acquired or deducted from (or added to) the proceeds of the foreign currency sold. Such transactions may be effected with respect to hedges on non-US dollar denominated instruments owned by the Fund but not yet delivered, or committed or anticipated to be purchased by the Fund.
In purchasing and writing options, the Fund bears the risk of an unfavorable change in the value of the underlying instrument or the risk that the Fund may not be able to enter into a closing transaction due to an illiquid market. Exercise of an option written could result in the Fund purchasing or selling a security at a price different from the current market value. The Fund may execute transactions in both listed and OTC options.
Swaps: The Fund may enter into swap agreements, in which the Fund and a counterparty agree to make periodic net payments on a specified notional amount. These periodic payments received or made by the Fund are recorded in the Statement of Operations as realized gains or losses, respectively. Any upfront fees paid are recorded as assets and any upfront fees received are recorded as liabilities and amortized over the term of the swap. Swaps are marked-to-market daily and changes in value are recorded as unrealized appreciation (depreciation). When the swap is terminated, the Fund will record a realized gain or loss equal to the difference between the proceeds from (or cost of) the closing transaction and the Fund’s basis in the contract, if any. Generally, the basis of the contracts is the premium received or paid. Swap transactions involve, to varying degrees, elements of interest rate, credit and market risk in excess of the amounts recognized in the Statement of Assets and Liabilities. Such risks involve the possibility that there will be no liquid market for these agreements, that the counterparty to the agreements may default on its obligation to perform or disagree as to the meaning of the contractual terms in the agreements, and that there may be unfavorable changes in interest rates and/or market values associated with these transactions.
| • | | Credit default swaps – The Fund may enter into credit default swaps to manage its exposure to the market or certain sectors of the market, to reduce its risk exposure to defaults of corporate and/or |
| | | | | | |
| 44 | | BLACKROCK ASSET ALLOCATION PORTFOLIO | | MARCH 31, 2010 | | |
|
| Notes to Financial Statements (continued) |
| | sovereign issuers or to create exposure to corporate and/or sovereign issuers to which it is not otherwise exposed (credit risk). The Fund enters into credit default agreements to provide a measure of protection against the default of an issuer (as buyer of protection) and/or gain credit exposure to an issuer to which it is not otherwise exposed (as seller of protection). The Fund may either buy or sell (write) credit default swaps on single-name issuers (corporate or sovereign) or traded indexes. Credit default swaps on single-name issuers are agreements in which the buyer pays fixed periodic payments to the seller in consideration for a guarantee from the seller to make a specific payment should a negative credit event take place (e.g., bankruptcy, failure to pay, obligation accelerators, repudiation, moratorium or restructuring). Credit default swaps on traded indexes are agreements in which the buyer pays fixed periodic payments to the seller in consideration for a guarantee from the seller to make a specific payment should a write-down, principal or interest shortfall or default of all or individual underlying securities included in the index occurs. As a buyer, if an underlying credit event occurs, the Fund will either receive from the seller an amount equal to the notional amount of the swap and deliver the referenced security or underlying securities comprising of an index or receive a net settlement of cash equal to the notional amount of the swap less the recovery value of the security or underlying securities comprising of an index. As a seller (writer), if an underlying credit event occurs, the Fund will either pay the buyer an amount equal to the notional amount of the swap and take delivery of the referenced security or underlying securities comprising of an index or pay a net settlement of cash equal to the notional amount of the swap less the recovery value of the security or underlying securities comprising of an index. |
| • | | Interest rate swaps – The Fund may enter into interest rate swaps to manage duration, the yield curve or interest rate risk by economically hedging the value of the fixed rate bonds which may decrease when interest rates rise (interest rate risk). Interest rate swaps are agreements in which one party pays a floating rate of interest on a notional principal amount and receives a fixed rate of interest on the same notional principal amount for a specified period of time. In more complex swaps, the notional principal amount may decline (or amortize) over time. |
Derivative Instruments Categorized by Risk Exposure:
| | | | | |
| | | Fair Values of Derivative Instruments as of March 31, 2010 |
| | | Asset Derivatives |
| | | Statement of Assets and Liabilities Location |
Interest rate contracts | | Net unrealized appreciation/depreciation*; Unrealized appreciation on swaps; Investment at value - unaffiliated** | | $ | 2,160,393 |
Foreign currency exchange contracts | | Unrealized appreciation on foreign currency exchange contracts | | | 346,205 |
Credit contracts | | Unrealized appreciation on swaps | | | 13,279 |
Equity contracts | | Net unrealized appreciation/depreciation* | | | 483,298 |
| | | | | |
Total | | | | $ | 3,003,175 |
| | | | | |
| | | | | |
| | | Liability Derivatives |
| | | Statement of Assets and Liabilities Location |
Interest rate contracts | | Net unrealized appreciation/ depreciation*; Unrealized depreciation on swaps; Options written at value | | $ | 3,554,436 |
Foreign currency exchange contracts | | Unrealized depreciation on foreign currency exchange contracts | | | 333,494 |
Credit contracts | | Unrealized depreciation on swaps | | | 1,384,442 |
| | | | | |
Total | | | | $ | 5,272,372 |
| | | | | |
| * | Includes cumulative appreciation/depreciation of financial futures contracts as reported in the Schedule of Investments. Only current day’s margin variation is reported within the Statement of Assets and Liabilities. |
| ** | Includes options purchased at value as reported in the Schedule of Investments. |
| | | | |
| | | The Effect of Derivative
Instruments on the
Statement of Operations
Six Months Ended
March 31, 2010 | |
| | | Net Realized Gain
(Loss) from | |
Credit contracts: | | | | |
Swaps | | $ | (305,611 | ) |
Equity contracts: | | | | |
Financial futures contracts | | | 3,264,959 | |
Foreign currency exchange contracts: | | | | |
Foreign currency transactions | | | 675,718 | |
Interest rate contracts: | | | | |
Financial futures contracts | | | (307,201 | ) |
Options*** | | | 952,881 | |
Swaps | | | 311,514 | |
| | | | |
Total | | $ | 4,592,260 | |
| | | | |
| | | | |
| | | Net Change in
Unrealized
Appreciation/
Depreciation on | |
Credit contracts: | | | | |
Swaps | | $ | (87,944 | ) |
Equity contracts: | | | | |
Financial futures contracts | | | (154,874 | ) |
Foreign currency exchange contracts: | | | | |
Foreign currency transactions | | | 386,733 | |
Interest rate contracts: | | | | |
Financial futures contracts | | | (14,809 | ) |
Options*** | | | 904,650 | |
Swaps | | | (722,899 | ) |
| | | | |
Total | | $ | 310,857 | |
| | | | |
| *** | Options purchased are included in the net realized gain (loss) from investments and net change in unrealized appreciation/depreciation on investments. |
| | | | | | |
| | | BLACKROCK ASSET ALLOCATION PORTFOLIO | | MARCH 31, 2010 | | 45 |
|
| Notes to Financial Statements (continued) |
For the six months ended March 31, 2010, the average quarterly balance of outstanding derivative financial instruments was as follows:
| | | |
Financial futures contracts: | | | |
Average number of contracts purchased | | | 82 |
Average number of contracts sold | | | 371 |
Average notional value of contracts purchased | | $ | 22,933,188 |
Average notional value of contracts sold | | $ | 56,531,278 |
Foreign currency exchange contracts: | | | |
Average number of contracts — US dollars purchased | | | 52 |
Average number of contracts — US dollars sold | | | 48 |
Average US dollar amounts purchased | | $ | 17,828,646 |
Average US dollar amounts sold | | $ | 15,325,088 |
Options: | | | |
Average number of contracts purchased | | | 12,682 |
Average number of contracts written | | | 9,007 |
Average notional value of contracts purchased | | $ | 158,263,875 |
Average notional value of contracts written | | $ | 121,336,625 |
Credit default swaps: | | | |
Average number of contracts — buy protection | | | 32 |
Average notional value — buy protection | | $ | 11,587,000 |
Interest rate swaps: | | | |
Average number of contracts — pays fixed rate | | | 23 |
Average number of contracts — receives fixed rate | | | 21 |
Average notional value — pays fixed rate | | $ | 56,925,000 |
Average notional value — receives fixed rate | | $ | 60,080,000 |
3. Investment Advisory Agreements and Other Transactions with Affiliates:
The PNC Financial Services Group, Inc. (“PNC”), Bank of America Corporation (“BAC”) and Barclays Bank PLC (“Barclays”) are the largest stockholders of BlackRock, Inc. (“BlackRock”). Due to the ownership structure, PNC is an affiliate of the Fund for 1940 Act purposes, but BAC and Barclays are not.
The Trust, on behalf of the Fund, entered into an Investment Advisory Agreement with BlackRock Advisors, LLC (the “Manager”), the Fund’s investment advisor, an indirect, wholly owned subsidiary of BlackRock, to provide investment advisory and administration services. The Manager is responsible for the management of the Fund’s portfolio and provides the necessary personnel, facilities, equipment and certain other services necessary to the operations of the Fund. For such services, the Fund pays the Manager a monthly fee at the following annual rates of the Fund’s average daily net assets:
| | | |
Average Daily Net Assets | | | |
First $1 Billion | | 0.550 | % |
$1 Billion - $2 Billion | | 0.500 | |
$2 Billion - $3 Billion | | 0.475 | |
Greater Than $3 Billion | | 0.450 | |
The Manager contractually agreed to waive or reimburse fees or expenses, excluding interest expense, dividend expense, acquired fund fees and expenses and certain other fund expenses, in order to limit expenses. The Manager has agreed not to reduce or discontinue this contractual waiver or reimbursement until February 1, 2011 unless approved by the Board, including a majority of the non-interested
Trustees. The expense limitations as a percentage of net assets were as follows:
| | | | | | | | |
| Share Classes |
Institutional | | Service | | Investor A | | Investor B | | Investor C |
| 0.89% | | 1.17% | | 1.37% | | 2.14% | | 2.14% |
The Manager has voluntarily agreed to waive its advisory fee by the amount of investment advisory fees the Fund pays to the Manager indirectly through its investment in affiliated money market funds, however the Manager does not waive its advisory fees by the amount of investment advisory fees through its investment in other affiliated investment companies. This amount is included in fees waived by advisor in the Statement of Operations. For the six months ended March 31, 2010, the Manager waived $12,094, which were included in fees waived by advisor in the Statement of Operations.
The Manager has entered into a sub-advisory agreement with BlackRock Financial Management, Inc. (“BFM”), an affiliate of the Manager, under which the Manager pays BFM, for services it provides, a monthly fee that is a percentage of the investment advisory fees paid by the Fund to the Manager.
If during the Fund’s fiscal year the operating expenses of a share class that at any time during the prior two fiscal years received a waiver or reimbursement from the Manager, are less than the expense limit for that share class, the Manager is entitled to be reimbursed by such share class up to the amount of fees waived or expenses reimbursed during the prior two fiscal years under the agreement provided that: (1) the Fund has more than $50 million in assets and (2) the Manager or an affiliate continues to serve as the Fund’s investment advisor or administrator. In the event the expense limit for a share class is changed subsequent to a fiscal year in which the Manager becomes entitled to reimbursement for fees waived or reimbursed, the amount available to reimburse the Manager shall be calculated by reference to the expense limit for that share class in effect at the time the Manager became entitled to receive such reimbursement, rather than the subsequently changed expense limit for that share class.
For the six months ended March 31, 2010, the Manager recouped the following waivers previously recorded by the Fund:
| | | | |
| Share Classes |
| Investor A | | Investor B | | Total |
| $18,827 | | $15,664 | | $34,491 |
On March 31, 2010, the amounts subject to possible future recoupment under the expense limitation agreement are as follows:
| | | | |
| Expiring September 30, |
| 2010 | | 2011 | | 2012 |
| $14,285 | | $17,733 | | $3,800 |
The Trust, on behalf of the Fund, has entered into a Distribution Agreement and Distribution Plan with BlackRock Investments, LLC (“BRIL”), an affiliate of BlackRock. Pursuant to the Distribution Plan and in accordance with Rule 12b-1 under the 1940 Act, the Fund pays BRIL
| | | | | | |
| 46 | | BLACKROCK ASSET ALLOCATION PORTFOLIO | | MARCH 31, 2010 | | |
|
| Notes to Financial Statements (continued) |
ongoing service and distribution fees. The fees are accrued daily and paid monthly at annual rates based upon the average daily net assets of the shares of the Fund as follows:
| | | | | | |
| | | Service
Fee | | | Distribution
Fee | |
Service | | 0.25 | % | | — | |
Investor A | | 0.25 | % | | — | |
Investor B | | 0.25 | % | | 0.75 | % |
Investor C | | 0.25 | % | | 0.75 | % |
Pursuant to sub-agreements with BRIL, broker-dealers and BRIL provide shareholder servicing and distribution services to the Fund. The ongoing service and/or distribution fee compensates BRIL and each broker-dealer for providing shareholder servicing and/or distribution related services to Service, Investor A, Investor B and Investor C shareholders.
For the six months ended March 31, 2010, affiliates earned underwriting discounts, direct commissions and dealer concessions on sales of the Fund’s Investor A Shares of $34,232.
For the six months ended March 31, 2010, affiliates received contingent deferred sales charges relating to transactions in Investor A, Investor B, and Investor C Shares of $135, $38,068 and $2,625 respectively.
PFPC Trust Company, an indirect, wholly owned subsidiary of PNC, serves as custodian for the Fund. For these services, the custodian receives a fee computed daily and payable monthly, based on a percentage of the average daily gross assets of the Fund. The fee is paid at the following annual rates: 0.005% of the first $400 million, 0.004% of the next $1.6 billion and 0.003% of average daily gross assets in excess of $2 billion; plus per transaction charges and other miscellaneous fees incurred on behalf of the Fund.
The Fund has an arrangement with the custodian whereby fees may be reduced by credits earned on uninvested cash balances, which if applicable are shown as fees paid indirectly in the Statement of Operations. The custodian imposes fees on overdrawn cash balances, which can be offset by accumulated credits earned or may result in additional custody charges.
PNC Global Investment Servicing (U.S.) Inc. (“PNCGIS”), an indirect, wholly owned subsidiary of PNC and an affiliate of the Manager, serves as transfer and dividend disbursing agent. Transfer agency fees borne by the Fund are comprised of those fees charged for all shareholder communications, including mailing of shareholder reports, dividend and distribution notices, and proxy materials for shareholders meetings, as well as per account and per transaction fees related to servicing and maintenance of shareholder accounts, including the issuing, redeeming and transferring of shares, check writing, anti-money laundering services, and customer identification services.
Pursuant to written agreements, certain affiliates provide the Fund with sub-accounting, recordkeeping, sub-transfer agency and other administrative services with respect to sub-accounts they service. For these services, these affiliates receive an annual fee per shareholder account which will vary depending on share class. For the six months ended March 31, 2010, the Fund paid $10,830 in return for these services, which are included in transfer agent — class specific in the Statement of Operations.
The Manager maintains a call center, which is responsible for providing certain shareholder services to the Fund, such as responding to shareholder inquiries and processing transactions based upon instructions from shareholders with respect to the subscription and redemption of Fund shares. For the six months ended March 31, 2010, the Fund reimbursed the Manager the following amounts for costs incurred in running the call center, which are included in transfer agent — class specific in the Statement of Operations.
| | | | | | | | | | |
| Share Classes |
Institutional | | Service | | Investor A | | Investor B | | Investor C | | Total |
| $324 | | $36 | | $21,687 | | $5,651 | | $2,565 | | $30,263 |
PNCGIS and the Manager act as co-administrators for the Fund. For these services, the co-administrators receive a combined administration fee computed daily and payable monthly, based on a percentage of the average daily net assets of the Fund. The combined administration fee is paid at the following annual rates: 0.075% of the first $500 million, 0.065% of the next $500 million and 0.055% of average daily net assets in excess of $1 billion. In addition, each of the share classes is charged an administration fee based on the following percentages of average daily net assets of each respective class 0.025% of the first $500 million, 0.015% of the next $500 million and 0.005% of average daily net assets in excess of $1 billion. In addition, PNCGIS and the Manager may have, at their discretion, voluntarily waived all or any portion of their administration fees for the Fund or a share class which are included in administration fees waived and administration fees waived — class specific in the Statement of Operations.
The Fund has received an exemptive order from the SEC permitting, among other things, to pay an affiliated securities lending agent a fee based on a share of the income derived from the securities lending activities and has retained BlackRock Investment Management, LLC (“BIM”) as the securities lending agent. BIM may, on behalf of the Fund, invest cash collateral received by the Fund for such loans, among other things, in a private investment company managed by the Manager or in registered money market funds advised by the Manager or its affiliates. The market value of securities on loan and the value of the related collateral are shown on the Statement of Assets and Liabilities as securities loaned and collateral at value – securities loaned, respectively. The cash collateral invested by BIM is disclosed in the Schedule of Investments. The share of income earned by the Fund on such investments is shown as securities lending — affiliated in the Statement of Operations. For the six months ended March 31, 2010, BIM received $1,081 in securities lending agent fees related to securities lending activities for the Fund.
| | | | | | |
| | | BLACKROCK ASSET ALLOCATION PORTFOLIO | | MARCH 31, 2010 | | 47 |
|
| Notes to Financial Statements (continued) |
For the six months ended March 31, 2010, the following table shows the various types of class specific expenses borne directly by each class of the Fund and any associated waivers or reimbursements of those expenses.
| | | | | | | | | | | | | | | | | | | | | |
| | | Share Classes | |
| | | Institutional | | | Service | | | Investor A | | Investor B | | Investor C | | Total | |
Administration Fees | | $ | 3,902 | | | $ | 189 | | | $ | 46,352 | | $ | 8,268 | | $ | 9,473 | | $ | 68,184 | |
Administration Fees Waived | | $ | (2,905 | ) | | $ | (189 | ) | | | — | | | — | | | — | | $ | (3,094 | ) |
Service and Distribution Fees | | | — | | | $ | 1,888 | | | $ | 460,594 | | $ | 328,646 | | $ | 377,909 | | $ | 1,169,037 | |
Transfer Agent Fees | | $ | 19,007 | | | $ | 1,549 | | | $ | 315,111 | | $ | 79,635 | | $ | 49,419 | | $ | 464,721 | |
Transfer Agent Fees Waived | | $ | (126 | ) | | $ | (36 | ) | | | — | | | — | | | — | | $ | (162 | ) |
Transfer Agent Fees Reimbursed | | $ | (221 | ) | | $ | (323 | ) | | | — | | | — | | | — | | $ | (544 | ) |
The Fund may also receive earnings credits related to cash balances with PNCGIS which are shown on the Statement of Operations as fees paid indirectly.
Certain officers and/or trustees of the Trust are officers and/or directors of BlackRock or its affiliates. The Fund reimburses the Manager for compensation paid to the Trust’s Chief Compliance Officer.
4. Investments:
Purchases and sales of investments including paydowns, mortgage dollar roll and TBA transactions and excluding short-term securities and US government securities for the six months ended March 31, 2010, were $765,136,006 and $674,733,354, respectively.
Purchases and sales of US government securities for the six months ended March 31, 2010, were $353,686,346 and $329,974,198, respectively.
Purchases and sales of mortgage dollar rolls for the six months ended March 31, 2010, were $316,601,223 and $317,023,953, respectively.
Transactions in options written for the six months ended March 31, 2010, were as follows:
| | | | | | | | | | | | | | |
| | | Calls | | | Puts | |
| | | Contracts | | | Premiums
Received | | | Contracts | | | Premiums
Received | |
Options outstanding at beginning of period | | 5,920 | | | $ | 2,321,957 | | | 6,940 | | | $ | 2,426,168 | |
Options written | | 3,450 | | | | 1,483,596 | | | 5,303 | | | | 2,162,287 | |
Options expired | | (1,350 | ) | | | (432,140 | ) | | (2,972 | ) | | | (795,901 | ) |
Options closed | | (5,070 | ) | | | (2,182,238 | ) | | (4,520 | ) | | | (1,951,913 | ) |
| | | | | | | | | | | | | | |
Options outstanding end of period | | 2,950 | | | $ | 1,191,175 | | | 4,751 | | | $ | 1,840,641 | |
5. Borrowings:
For the six months ended March 31, 2010, the average amount of borrowings and the daily weighted average interest rate in treasury rolls and reverse repurchase agreements were $45,104,013 and 1.02%, respectively.
The Fund, along with certain other funds managed by the Manager and its affiliates, is a party to a $500 million credit agreement with a group of lenders, which was renewed until November 2010. The Fund may borrow under the credit agreement to fund shareholder redemptions.
Prior to its renewal, the credit agreement had the following terms: 0.02% upfront fee on the aggregate commitment amount which was allocated to the Fund based on its net assets as of October 31, 2008; a commitment fee of 0.08% per annum based on the Fund’s pro rata share of the unused portion of the credit agreement, which is included in miscellaneous in the Statement of Operations, and interest at a rate equal to the higher of the (a) federal funds effective rate and (b) reserve adjusted one-month LIBOR, plus, in each case, the higher of (i) 1.50% and (ii) 50% of the CDX Index (as defined in the credit agreement) on amounts borrowed. Effective November 2009, the credit agreement was renewed with the following terms: 0.02% upfront fee on the aggregate commitment amount which was allocated to the Fund based on its net assets as of October 31, 2009, a commitment fee of 0.10% per annum based on the Fund’s pro rata share of the unused portion of the credit agreement and interest at a rate equal to the higher of (a) the one-month LIBOR plus 1.25% per annum and (b) the Fed Funds rate plus 1.25% per annum on amounts borrowed. The Fund did not borrow under the credit agreement during the six months ended March 31, 2010.
6. Capital Loss Carryforward:
As of September 30, 2009, the Fund had capital loss carryforwards available to offset future realized capital gains through the indicated expiration dates:
| | | |
Expires September 30, | | |
2010 | | $ | 2,685,812 |
2017 | | | 12,397,822 |
| | | |
Total | | $ | 15,083,634 |
| | | |
7. Market and Credit Risk:
In the normal course of business, the Fund invests in securities and enters into transactions where risks exist due to fluctuations in the market (market risk) or failure of the issuer of a security to meet all its obligations (credit risk). The value of securities held by the Fund may decline in response to certain events, including those directly involving the issuers whose securities are owned by the Fund; conditions affecting the general economy; overall market changes; local, regional or global political, social or economic instability; and currency and interest rate and price fluctuations. Similar to credit risk, the Fund may be exposed to counterparty risk, or the risk that an entity with which the Fund has unsettled or open transactions may default. The Fund manages
| | | | | | |
| 48 | | BLACKROCK ASSET ALLOCATION PORTFOLIO | | MARCH 31, 2010 | | |
|
| Notes to Financial Statements (continued) |
counterparty risk by entering into transactions only with counterparties that they believe have the financial resources to honor their obligations and by monitoring the financial stability of those counterparties. Financial assets, which potentially expose the Fund to credit and counterparty risks, consist principally of investments and cash due from counterparties. The extent of the Fund’s exposure to credit and counterparty risks with respect to these financial assets is generally approximated by their value recorded in the Fund’s Statement of Assets and Liabilities, less any collateral held by the Fund.
8. Capital Shares Transactions:
Transactions in capital shares for each class were as follows:
| | | | | | | | | | | | | | |
| | | Six Months Ended
March 31, 2010 | | | Year Ended
September 30, 2009 | |
| | | Shares | | | Amount | | | Shares | | | Amount | |
Institutional | | | | | | | | | | | | | | |
Shares sold | | 534,400 | | | $ | 7,255,186 | | | 1,568,005 | | | $ | 17,415,761 | |
Shares issued in reinvestment of dividends and distributions | | 18,294 | | | | 248,783 | | | 60,683 | | | | 676,921 | |
| | | | | | | | | | | | | | |
Total issued | | 552,694 | | | | 7,503,969 | | | 1,628,688 | | | | 18,092,682 | |
Shares redeemed | | (227,742 | ) | | | (3,109,405 | ) | | (1,216,027 | ) | | | (13,381,936 | ) |
| | | | | | | | | | | | | | |
Net increase | | 324,952 | | | $ | 4,394,564 | | | 412,661 | | | $ | 4,710,746 | |
| | | | | | | | | | | | | | |
| | | | |
Service | | | | | | | | | | | | | | |
Shares sold | | 4,372 | | | $ | 58,598 | | | 7,630 | | | $ | 87,467 | |
Shares issued in reinvestment of dividends and distributions | | 884 | | | | 11,999 | | | 1,463 | | | | 16,925 | |
| | | | | | | | | | | | | | |
Total issued | | 5,256 | | | | 70,597 | | | 9,093 | | | | 104,392 | |
Shares redeemed | | (9,678 | ) | | | (134,449 | ) | | (17,967 | ) | | | (204,021 | ) |
| | | | | | | | | | | | | | |
Net decrease | | (4,422 | ) | | $ | (63,852 | ) | | (8,874 | ) | | $ | (99,629 | ) |
| | | | | | | | | | | | | | |
| | | | |
Investor A | | | | | | | | | | | | | | |
Shares sold and automatic conversion of shares | | 1,848,248 | | | $ | 25,176,431 | | | 5,331,563 | | | $ | 58,978,737 | |
Shares issued in reinvestment of dividends and distributions | | 198,493 | | | | 2,691,468 | | | 875,104 | | | | 9,562,047 | |
| | | | | | | | | | | | | | |
Total issued | | 2,046,741 | | | | 27,867,899 | | | 6,206,667 | | | | 68,540,784 | |
Shares redeemed | | (2,128,911 | ) | | | (28,982,435 | ) | | (9,068,937 | ) | | | (99,318,802 | ) |
| | | | | | | | | | | | | | |
Net decrease | | (82,170 | ) | | $ | (1,114,536 | ) | | (2,862,270 | ) | | $ | (30,778,018 | ) |
| | | | | | | | | | | | | | |
| | | | |
Investor B | | | | | | | | | | | | | | |
Shares sold | | 37,730 | | | $ | 510,568 | | | 382,013 | | | $ | 4,151,296 | |
Shares issued in reinvestment of dividends and distributions | | 17,718 | | | | 237,815 | | | 148,206 | | | | 1,551,025 | |
| | | | | | | | | | | | | | |
Total issued | | 55,448 | | | | 748,383 | | | 530,219 | | | | 5,702,321 | |
Shares redeemed and automatic conversion of shares | | (949,337 | ) | | | (12,846,186 | ) | | (2,844,557 | ) | | | (30,909,977 | ) |
| | | | | | | | | | | | | | |
Net decrease | | (893,889 | ) | | $ | (12,097,803 | ) | | (2,314,338 | ) | | $ | (25,207,656 | ) |
| | | | | | | | | | | | | | |
| | | | |
Investor C | | | | | | | | | | | | | | |
Shares sold | | 880,760 | | | $ | 11,830,176 | | | 3,873,289 | | | $ | 41,842,695 | |
Shares issued in reinvestment of dividends and distributions | | 21,346 | | | | 285,593 | | | 143,186 | | | | 1,507,320 | |
| | | | | | | | | | | | | | |
Total issued | | 902,106 | | | | 12,115,769 | | | 4,016,475 | | | | 43,350,015 | |
Shares redeemed | | (579,117 | ) | | | (7,769,161 | ) | | (3,955,079 | ) | | | (42,312,049 | ) |
| | | | | | | | | | | | | | |
Net increase | | 322,989 | | | $ | 4,346,608 | | | 61,396 | | | $ | 1,037,966 | |
| | | | | | | | | | | | | | |
| | | | | | |
| | | BLACKROCK ASSET ALLOCATION PORTFOLIO | | MARCH 31, 2010 | | 49 |
Notes to Financial Statements (concluded)
9. Subsequent Events:
Management has evaluated the impact of all subsequent events on the Fund through the date the financial statements were issued and has determined that there were no subsequent events requiring adjustment or additional disclosure in the financial statements.
| | | | | | |
| 50 | | BLACKROCK ASSET ALLOCATION PORTFOLIO | | MARCH 31, 2010 | | |
Officers and Trustees
Ronald W. Forbes, Co-Chairman of the Board and Trustee
Rodney D. Johnson, Co-Chairman of the Board and Trustee
David O. Beim, Trustee
Richard S. Davis, Trustee
Henry Gabbay, Trustee
Dr. Matina Horner, Trustee
Herbert I. London, Trustee and Member of the Audit Committee
Cynthia A. Montgomery, Trustee
Joseph P. Platt, Jr., Trustee
Robert C. Robb, Jr., Trustee
Toby Rosenblatt, Trustee
Kenneth L. Urish, Chairman of the Audit Committee and Trustee
Frederick W. Winter, Trustee and Member of the Audit Committee
Anne F. Ackerley, President and Chief Executive Officer
Richard Hoerner, CFA, Vice President
Jeffery Holland, CFA, Vice President
Brendan Kyne, Vice President
Simon Mendelson, Vice President
Brian Schmidt, Vice President
Christopher Stavrakos, CFA, Vice President
Neal J. Andrews, Chief Financial Officer
Jay M. Fife, Treasurer
Brian P. Kindelan, Chief Compliance Officer
Howard Surloff, Secretary
Investment Advisor and Co-Administrator
BlackRock Advisors, LLC
Wilmington, DE 19809
Sub-Advisor
BlackRock Financial Management, Inc.
New York, NY 10055
Accounting Agent, Co-Administrator and Transfer Agent
PNC Global Investment Servicing (U.S.) Inc.
Wilmington, DE 19809
Custodian
PFPC Trust Company
Philadelphia, PA 19153
Distributor
BlackRock Investments, LLC
New York, NY 10022
Legal Counsel
Sidley Austin LLP
New York, NY 10019
Independent Registered Public Accounting Firm
Deloitte & Touche LLP
Philadelphia, PA 19103
Address of the Trust
100 Bellevue Parkway
Wilmington, DE 19809
| | | | | | |
| | | BLACKROCK ASSET ALLOCATION PORTFOLIO | | MARCH 31, 2010 | | 51 |
Additional Information
General Information
Electronic Delivery
Electronic copies of most financial reports and prospectuses are available on the Fund’s website or shareholders can sign up for e-mail notifications of quarterly statements, annual and semi-annual reports and prospectuses by enrolling in the Fund’s electronic delivery program.
To enroll:
Shareholders Who Hold Accounts with Investment Advisors, Banks or Brokerages:
Please contact your financial advisor to enroll. Please note that not all investment advisors, banks or brokerages may offer this service.
Shareholders Who Hold Accounts Directly With BlackRock
| 1) | Access the BlackRock website at |
http://www.blackrock.com/ edelivery
| 2) | Select “eDelivery” under the “More Information” section |
Householding
The Fund will mail only one copy of shareholder documents, including annual and semi-annual reports and proxy statements, to shareholders with multiple accounts at the same address. This practice is commonly called “householding” and it is intended to reduce expenses and eliminate duplicate mailings of shareholder documents. Mailings of your shareholder documents may be householded indefinitely unless you instruct us otherwise. If you do not want the mailing of these documents to be combined with those for other members of your household, please contact the Fund at (800) 441-7762.
Availability of Quarterly Portfolio Schedule
The Fund files its complete schedule of portfolio holdings with the Securities and Exchange Commission (the “SEC”) for the first and third quarters of each fiscal year on Form N-Q. The Fund’s Forms N-Q are available on the SEC’s website at http://www.sec.gov and may also be reviewed and copied at the SEC’s Public Reference Room in Washington, D.C. Information on the operation of the Public Reference Room may be obtained by calling (800) SEC-0330. The Fund’s Forms N-Q may also be obtained upon request and without charge by calling (800) 441-7762.
Availability of Proxy Voting Policies and Procedures
A description of the policies and procedures that the Fund uses to determine how to vote proxies relating to portfolio securities is available (1) without charge, upon request, by calling (800) 441-7762; (2) at www.blackrock.com; and (3) on the SEC’s website at http:// www.sec.gov.
Availability of Proxy Voting Record
Information about how the Fund voted proxies relating to securities held in the Fund’s portfolios during the most recent 12-month period ended June 30 is available upon request and without charge (1) at www.blackrock.com or by calling (800) 441-7762 and (2) on the SEC’s website at http://www.sec.gov.
Shareholder Privileges
Account Information
Call us at (800) 441-7762 from 8:00 AM to 6:00 PM EST on any business day to get information about your account balances, recent transactions and share prices. You can also reach us on the Web at www.blackrock.com/funds.
Automatic Investment Plans
Investor Class shareholders who want to invest regularly can arrange to have $50 or more automatically deducted from their checking or savings account and invested in any of the BlackRock funds.
Systematic Withdrawal Plan
Investor Class shareholders can establish a systematic withdrawal plan and receive periodic payments of $50 or more from their BlackRock funds, as long as their account balance is at least $10,000.
Retirement Plans
Shareholders may make investments in conjunction with Traditional, Rollover, Roth, Coverdell, Simple IRAs, SEP IRAs and 403(b) Plans.
| | | | | | |
| 52 | | BLACKROCK ASSET ALLOCATION PORTFOLIO | | MARCH 31, 2010 | | |
|
| Additional Information (concluded) |
BlackRock Privacy Principles
BlackRock is committed to maintaining the privacy of its current and former fund investors and individual clients (collectively, “Clients”) and to safeguarding their nonpublic personal information. The following information is provided to help you understand what personal information BlackRock collects, how we protect that information and why in certain cases we share such information with select parties.
If you are located in a jurisdiction where specific laws, rules or regulations require BlackRock to provide you with additional or different privacy-related rights beyond what is set forth below, then BlackRock will comply with those specific laws, rules or regulations.
BlackRock obtains or verifies personal nonpublic information from and about you from different sources, including the following: (i) information we receive from you or, if applicable, your financial intermediary, on applications, forms or other documents; (ii) information about your transactions with us, our affiliates, or others; (iii) information we receive from a consumer reporting agency; and (iv) from visits to our websites.
BlackRock does not sell or disclose to non-affiliated third parties any nonpublic personal information about its Clients, except as permitted by law or as is necessary to respond to regulatory requests or to service Client accounts. These non-affiliated third parties are required to protect the confidentiality and security of this information and to use it only for its intended purpose.
We may share information with our affiliates to service your account or to provide you with information about other BlackRock products or services that may be of interest to you. In addition, BlackRock restricts access to nonpublic personal information about its Clients to those BlackRock employees with a legitimate business need for the information. BlackRock maintains physical, electronic and procedural safeguards that are designed to protect the nonpublic personal information of its Clients, including procedures relating to the proper storage and disposal of such information.
| | | | | | |
| | | BLACKROCK ASSET ALLOCATION PORTFOLIO | | MARCH 31, 2010 | | 53 |
A World-Class Mutual Fund Family
BlackRock offers a diverse lineup of open-end mutual funds crossing all investment styles and managed by experts in equity, fixed income and tax-exempt investing.
| | | | |
Equity Funds | | | | |
| | |
BlackRock All-Cap Energy & Resources Portfolio | | BlackRock Global Growth Fund | | BlackRock Mid-Cap Value Equity Portfolio |
BlackRock Asset Allocation Portfolio† | | BlackRock Global Opportunities Portfolio | | BlackRock Mid Cap Value Opportunities Fund |
BlackRock Aurora Portfolio | | BlackRock Global SmallCap Fund | | BlackRock Natural Resources Trust |
BlackRock Balanced Capital Fund† | | BlackRock Health Sciences Opportunities Portfolio | | BlackRock Pacific Fund |
BlackRock Basic Value Fund | | BlackRock Healthcare Fund | | BlackRock Science & Technology Opportunities Portfolio |
BlackRock Capital Appreciation Portfolio | | BlackRock Index Equity Portfolio* | | BlackRock Small Cap Core Equity Portfolio |
BlackRock Energy & Resources Portfolio | | BlackRock International Fund | | BlackRock Small Cap Growth Equity Portfolio |
BlackRock Equity Dividend Fund | | BlackRock International Index Fund | | BlackRock Small Cap Growth Fund II |
BlackRock EuroFund | | BlackRock International Opportunities Portfolio | | BlackRock Small Cap Index Fund |
BlackRock Focus Growth Fund | | BlackRock International Value Fund | | BlackRock Small/Mid-Cap Growth Portfolio |
BlackRock Focus Value Fund | | BlackRock Large Cap Core Fund | | BlackRock S&P 500 Index Fund |
BlackRock Fundamental Growth Fund | | BlackRock Large Cap Core Plus Fund | | BlackRock U.S. Opportunities Portfolio |
BlackRock Global Allocation Fund† | | BlackRock Large Cap Growth Fund | | BlackRock Utilities and Telecommunications Fund |
BlackRock Global Dynamic Equity Fund | | BlackRock Large Cap Value Fund | | BlackRock Value Opportunities Fund |
BlackRock Global Emerging Markets Fund | | BlackRock Latin America Fund | | |
BlackRock Global Financial Services Fund | | BlackRock Mid-Cap Growth Equity Portfolio | | |
| | |
| Fixed Income Funds | | | | |
| | |
BlackRock Bond Portfolio | | BlackRock Income Builder Portfolio† | | BlackRock Managed Income Portfolio |
BlackRock Emerging Market Debt Portfolio | | BlackRock Inflation Protected Bond Portfolio | | BlackRock Multi-Sector Bond Portfolio |
BlackRock GNMA Portfolio | | BlackRock Intermediate Government Bond Portfolio | | BlackRock Short-Term Bond Fund |
BlackRock Government Income Portfolio | | BlackRock International Bond Portfolio | | BlackRock Strategic Income Opportunities Portfolio |
BlackRock High Income Fund | | BlackRock Long Duration Bond Portfolio | | BlackRock Total Return Fund |
BlackRock High Yield Bond Portfolio | | BlackRock Low Duration Bond Portfolio | | BlackRock Total Return Portfolio II |
BlackRock Income Portfolio† | | | | BlackRock World Income Fund |
| | |
Municipal Bond Funds | | | | |
| | |
BlackRock AMT-Free Municipal Bond Portfolio | | BlackRock Kentucky Municipal Bond Portfolio | | BlackRock New York Municipal Bond Fund |
BlackRock California Municipal Bond Fund | | BlackRock Municipal Insured Fund | | BlackRock Ohio Municipal Bond Portfolio |
BlackRock High Yield Municipal Fund | | BlackRock National Municipal Fund | | BlackRock Pennsylvania Municipal Bond Fund |
BlackRock Intermediate Municipal Fund | | BlackRock New Jersey Municipal Bond Fund | | BlackRock Short-Term Municipal Fund |
| | |
Target Risk & Target Date Funds | | | | |
| | |
BlackRock Prepared Portfolios | | BlackRock Lifecycle Prepared Portfolios | | |
Conservative Prepared Portfolio | | Prepared Portfolio 2010 | | Prepared Portfolio 2030 |
Moderate Prepared Portfolio | | Prepared Portfolio 2015 | | Prepared Portfolio 2035 |
Growth Prepared Portfolio | | Prepared Portfolio 2020 | | Prepared Portfolio 2040 |
Aggressive Growth Prepared Portfolio | | Prepared Portfolio 2025 | | Prepared Portfolio 2045 |
| | | | Prepared Portfolio 2050 |
| * | See the prospectus for information on specific limitations on investments in the fund. |
BlackRock mutual funds are distributed by BlackRock Investments, LLC. You should consider the investment objectives, risks, charges and expenses of the funds under consideration carefully before investing. Each fund’s prospectus contains this and other information and is available at www.blackrock.com or by calling (800) 441-7762 or from your financial advisor. The prospectus should be read carefully before investing.
| | | | | | |
| 54 | | BLACKROCK ASSET ALLOCATION PORTFOLIO | | MARCH 31, 2010 | | |
[THIS PAGE INTENTIONALLY LEFT BLANK.]

This report is transmitted to shareholders only. It is not authorized for use as an offer of sale or a solicitation of an offer to buy shares of the Fund unless accompanied or preceded by the Fund’s current prospectus. Past performance results shown in this report should not be considered a representation of future performance. Investment returns and principal value of shares will fluctuate so that shares, when redeemed, may be worth more or less than their original cost. Statements and other information herein are as dated and are subject to change.
Investment in foreign securities involves special risks including fluctuating foreign exchange rates, foreign government regulations, differing degrees of liquidity and the possibility of substantial volatility due to adverse political, economic or other developments.

AA-3/10-SAR
| | | | |
| Item 2 | | – | | Code of Ethics – Not Applicable to this semi-annual report |
| | |
| Item 3 | | – | | Audit Committee Financial Expert – Not Applicable to this semi-annual report |
| | |
| Item 4 | | – | | Principal Accountant Fees and Services – Not Applicable to this semi-annual report |
| | |
| Item 5 | | – | | Audit Committee of Listed Registrants – Not Applicable |
| | |
| Item 6 | | – | | Investments |
| | |
| | | | (a) The registrant’s Schedule of Investments is included as part of the Report to Stockholders filed under Item 1 of this form. |
| | |
| | | | (b) Not Applicable due to no such divestments during the semi-annual period covered since the previous Form N-CSR filing. |
| | | | |
| Item 7 | | – | | Disclosure of Proxy Voting Policies and Procedures for Closed-End Management Investment Companies – Not Applicable |
| | |
| Item 8 | | – | | Portfolio Managers of Closed-End Management Investment Companies – Not Applicable |
| | |
| Item 9 | | – | | Purchases of Equity Securities by Closed-End Management Investment Company and Affiliated Purchasers – Not Applicable |
| | |
| Item 10 | | – | | Submission of Matters to a Vote of Security Holders – The registrant’s Nominating and Governance Committee will consider nominees to the board of directors recommended by shareholders when a vacancy becomes available. Shareholders who wish to recommend a nominee should send nominations that include biographical information and set forth the qualifications of the proposed nominee to the registrant’s Secretary. There have been no material changes to these procedures. |
| | |
| Item 11 | | – | | Controls and Procedures |
| | |
| 11(a) | | – | | The registrant’s principal executive and principal financial officers or persons performing similar functions have concluded that the registrant’s disclosure controls and procedures (as defined in Rule 30a-3(c) under the Investment Company Act of 1940, as amended (the “1940 Act”)) are effective as of a date within 90 days of the filing of this report based on the evaluation of these controls and procedures required by Rule 30a-3(b) under the 1940 Act and Rule 15(d)-15(b) under the Securities Exchange Act of 1934, as amended. |
| | |
| 11(b) | | – | | There were no changes in the registrant’s internal control over financial reporting (as defined in Rule 30a-3(d) under the 1940 Act) that occurred during the second fiscal quarter of the period covered by this report that have materially affected, or are reasonably likely to materially affect, the registrant’s internal control over financial reporting. |
| | |
| Item 12 | | – | | Exhibits attached hereto |
| | |
| 12(a)(1) | | – | | Code of Ethics – Not Applicable to this semi-annual report |
| | |
| 12(a)(2) | | – | | Certifications – Attached hereto |
| | |
| 12(a)(3) | | – | | Not Applicable |
| | |
| 12(b) | | – | | Certifications – Attached hereto |
Pursuant to the requirements of the Securities Exchange Act of 1934 and the Investment Company Act of 1940, the registrant has duly caused this report to be signed on its behalf by the undersigned, thereunto duly authorized.
| | | | | | |
BlackRock Funds | | | | |
| | | |
| BY: | | /s/ Anne F. Ackerley | | | | |
| | Anne F. Ackerley | | | | |
| | Chief Executive Officer of BlackRock Funds |
Date: May 27, 2010
Pursuant to the requirements of the Securities Exchange Act of 1934 and the Investment Company Act of 1940, this report has been signed below by the following persons on behalf of the registrant and in the capacities and on the dates indicated.
| | | | | | |
| By: | | /s/ Anne F. Ackerley | | | | |
| | Anne F. Ackerley | | | | |
| | Chief Executive Officer (principal executive officer) of BlackRock Funds |
Date: May 27, 2010
| | | | | | |
| By: | | /s/ Neal J. Andrews | | | | |
| | Neal J. Andrews | | | | |
| | Chief Financial Officer (principal financial officer) of BlackRock Funds |
Date: May 27, 2010