UNITED STATES
SECURITIES AND EXCHANGE COMMISSION
Washington, D.C. 20549
FORM N-CSRS
CERTIFIED SHAREHOLDER REPORT OF REGISTERED
MANAGEMENT INVESTMENT COMPANIES
Investment Company Act file number 811-05742
Name of Fund: BlackRock Funds
Exchange Portfolio
Fund Address: 100 Bellevue Parkway, Wilmington, DE 19809
Name and address of agent for service: Anne F. Ackerley, Chief Executive Officer, BlackRock Funds, 55 East 52nd Street, New York, NY 10055
Registrant’s telephone number, including area code: (800) 441-7762
Date of fiscal year end: 12/31/2010
Date of reporting period: 06/30/2010
| | | | |
| Item 1 | | – | | Report to Stockholders |
| | |
BlackRock Exchange Portfolio | |  |
of BlackRock FundsSM | |
| |
SEMI-ANNUAL REPORT | JUNE 30, 2010 (UNAUDITED) | | |
NOT FDIC INSURED
MAY LOSE VALUE
NO BANK GUARANTEE
Table of Contents
| | | | | | |
| 2 | | BLACKROCK EXCHANGE PORTFOLIO | | JUNE 30, 2010 | | |
Dear Shareholder
Although overall global economic and financial conditions have generally improved over the past year, the past several months have seen high levels of market volatility and diminishing investor confidence sparked by the sovereign debt crisis in Europe and mixed economic data that have raised concerns over the possibility that some economies could slide back into recession. Despite the uneven nature of recent market conditions, we continue to believe that the “Great Recession” likely ended at some point last summer, thanks primarily to massive fiscal and monetary stimulus, and that the global economy remains in recovery mode for most regions of the world. Regarding the US economy, we believe it is unlikely that the United States will experience a “double dip” recession, although we acknowledge that subpar growth is likely to persist for some time.
Global equity markets bottomed in early 2009 and since that time have moved unevenly higher as investors were lured back into the markets by depressed valuations, desire for higher yields and improvements in corporate earnings prospects. Volatility levels, however, have remained elevated – primarily as a result of uneven economic data and lingering deflation issues (especially in Europe). As the period drew to a close, equity markets had endured a significant correction that drove stock prices into negative territory on a year-to-date basis in almost every market. Over a 12-month basis, however, global equities posted positive returns thanks to improving corporate revenues and profits and a reasonably strong macro backdrop. From a geographic perspective, US equities have significantly outpaced their international counterparts over the past six and twelve months, as the domestic economic recovery has been more pronounced and as credit-related issues have held European markets down. Within the United States, smaller cap stocks have noticeably outperformed large caps.
In fixed income markets, yields have been moving unevenly over the past six and twelve months as improving economic conditions have been acting to push Treasury yields higher (and prices correspondingly lower), while concerns over ongoing deflation threats have acted as a counterweight. As the period drew to a close, however, Treasury yields fell sharply as investors flocked to the “safe haven” asset class in the face of escalating uncertainty. As a result, US Treasuries became one of the world’s best-performing asset classes on a six-month basis. High yield bonds have also continued to perform well, thanks in large part to ongoing high levels of investor demand. Meanwhile, municipal bonds performed in-line with their taxable counterparts on a 12-month basis, but slightly underperformed over the last six months as investors rotated to the relative safety of Treasuries.
Regarding cash investments, yields on money market securities remain near all-time lows (producing returns only marginally above zero percent), with the Federal Open Market Committee reiterating that economic circumstances are likely to necessitate an accommodative interest rate stance for an “extended period.”
Against this backdrop, the major market averages posted the following returns:
| | | | | | |
Total Returns as of June 30, 2010 | | 6-month | | | 12-month | |
US equities (S&P 500 Index) | | (6.65 | )% | | 14.43 | % |
Small cap US equities (Russell 2000 Index) | | (1.95 | ) | | 21.48 | |
International equities (MSCI Europe, Australasia, Far East Index) | | (13.23 | ) | | 5.92 | |
3-month Treasury bill (BofA Merrill Lynch 3-Month Treasury Bill Index) | | 0.05 | | | 0.16 | |
US Treasury securities (BofA Merrill Lynch 10-Year US Treasury Index) | | 9.36 | | | 8.20 | |
Taxable fixed income (Barclays Capital US Aggregate Bond Index) | | 5.33 | | | 9.50 | |
Tax-exempt fixed income (Barclays Capital Municipal Bond Index) | | 3.31 | | | 9.61 | |
High yield bonds (Barclays Capital US Corporate High Yield 2% Issuer Capped Index) | | 4.45 | | | 26.66 | |
Past performance is no guarantee of future results. Index performance shown for illustrative purposes only. You cannot invest directly in an index.
Although conditions are certainly better than they were a couple of years ago, global financial markets continue to face high volatility and questions about the strength and sustainability of the recovery abound. Through periods of uncertainty, as ever, BlackRock’s full resources are dedicated to the management of our clients’ assets. For additional market perspective and investment insight, visit www.blackrock.com/shareholdermagazine, where you’ll find the most recent issue of our award-winning Shareholder® magazine, as well as its quarterly companion newsletter, Shareholder Perspectives. As always, we thank you for entrusting BlackRock with your investments, and we look forward to your continued partnership in the months and years ahead.
|
| Sincerely, |
|
 |
| Rob Kapito |
| President, BlackRock Advisors, LLC |
THIS PAGE NOT PART OF YOUR FUND REPORT
|
| Fund Summary as of June 30, 2010 |
|
Portfolio Management Commentary |
How did the Fund perform?
| | • | | For the six-month period ended June 30, 2010, the Fund outperformed its benchmark, the S&P 500 Index. |
What factors influenced performance?
| | • | | Stock selection in the financials sector generated significant outperformance during the period. The Fund’s top investment in the sector, Berkshire Hathaway, Inc., rose more than 20% despite the negative market environment. In addition, the Fund’s large investment in American Express Co. also positively impacted performance. |
| | • | | The Fund’s investment in Millipore Corp. led to outperformance in the health care sector, as the company was acquired at a substantial premium and the stock produced a return of 47% for the period. Portfolio holdings in the industrials sector also contributed positively, with shares of The Boeing Co. and Caterpillar, Inc. appreciating as customer orders rose with the global economic recovery. |
| | • | | Conversely, investments in the energy sector negatively impacted Fund performance, as positions in both BP Plc and Transocean Ltd. declined sharply due to the oil rig explosion and massive oil spill in the Gulf of Mexico. After evaluating the oil spill and the companies’ potential governmental and legal liabilities, we sold Transocean and dramatically reduced our position in BP. The information technology (IT) sector also produced underperformance, with double-digit declines in Hewlett-Packard Co. and Microsoft Corp. |
Describe recent portfolio activity.
| | • | | As a result of market appreciation and trading activity, the Fund’s weightings in the financials and industrials sectors increased during the period, while exposure to energy and IT decreased. |
Describe Fund positioning at period end.
| | • | | As of June 30, 2010, the Fund holds notable overweights in consumer staples, health care and industrials. The Fund holds an underweight in consumer discretionary and has no holdings in the materials and utilities sectors. |
The views expressed reflect the opinions of BlackRock as of the date of this report and are subject to change based on changes in market, economic or other conditions. These views are not intended to be a forecast of future events and are no guarantee of future results.
Portfolio Information
| | | |
Ten Largest Holdings | | Percent of
Long-Term
Investments | |
Berkshire Hathaway, Inc. - Class B | | 8 | % |
Target Corp. | | 7 | |
The Procter & Gamble Co. | | 6 | |
International Business Machines Corp. | | 6 | |
Hewlett-Packard Co. | | 6 | |
American Express Co. | | 6 | |
Schlumberger Ltd. | | 5 | |
Microsoft Corp. | | 5 | |
Exxon Mobil Corp. | | 5 | |
The Boeing Co. | | 4 | |
| |
Sector Allocation | | Percent of
Long-Term
Investments | |
Information Technology | | 20 | % |
Financials | | 17 | |
Consumer Staples | | 16 | |
Health Care | | 16 | |
Industrials | | 14 | |
Energy | | 10 | |
Consumer Discretionary | | 6 | |
Telecommunication Services | | 1 | |
For Fund compliance purposes, the Fund’s sector classifications refer to any one or more of the sector sub-classifications used by one or more widely recognized market indexes or ratings group indexes, and/or as defined by Fund management. This definition may not apply for purposes of this report, which may combine sector sub-classifications for reporting ease.
| | | | | | |
| 4 | | BLACKROCK EXCHANGE PORTFOLIO | | JUNE 30, 2010 | | |
|
Total Return Based on a $10,000 Investment |
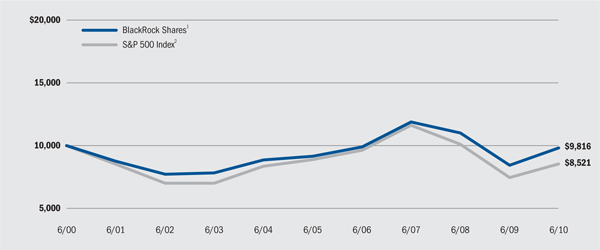
| 1 | The Fund normally invests largely in a diversified and supervised portfolio of common stocks, or securities convertible into common stocks. |
| 2 | This unmanaged index covers 500 industrial, utility, transportation and financial companies of the US markets (mostly New York Stock Exchange (“NYSE”) issues) representing about 75% of NYSE market capitalization and 30% of NYSE issues. S&P 500 is a trademark of the McGraw-Hill Companies. |
Shares of the Fund are not currently offered to the public.
Performance Summary for the Period Ended June 30, 2010
| | | | | | | | | | | | |
| | | | | | Average Annual Total Returns3 | |
| | 6-Month
Total Returns | | | 1 Year | | | 5 Years | | | 10 Years | |
BlackRock Shares | | (5.77 | )% | | 16.61 | % | | 1.42 | % | | (0.18 | )% |
S&P 500 Index | | (6.65 | ) | | 14.43 | | | (0.79 | ) | | (1.59 | ) |
| 3 | See “About Fund Performance” on page 6 for a detailed description of performance related information. Past performance is not indicative of future results. |
Expense Example
| | | | | | | | | | | | | | | | | | |
| | | Actual | | Hypothetical5 |
| | | Beginning
Account Value
January 1, 2010 | | Ending
Account Value
June 30, 2010 | | Expenses Paid
During the Period4 | | Beginning
Account Value
January 1, 2010 | | Ending
Account Value
June 30, 2010 | | Expenses Paid
During the Period4 |
BlackRock Shares | | $ | 1,000 | | $ | 942.30 | | $ | 2.99 | | $ | 1,000 | | $ | 1,021.72 | | $ | 3.11 |
| 4 | For the BlackRock Shares of the Fund, expenses are equal to the annualized expense ratio of 0.62%, multiplied by the average account value over the period, multiplied by 181/365 (to reflect the one-half year period shown). |
| 5 | Hypothetical 5% annual return before expenses is calculated by pro rating the number of days in the most recent fiscal half year divided by 365. |
See “Disclosure of Expenses” on page 6 for further information on how expenses were calculated.
| | | | | | |
| | | BLACKROCK EXCHANGE PORTFOLIO | | JUNE 30, 2010 | | 5 |
About Fund Performance
| | • | | BlackRock Shares are not subject to any sales charge. These shares bear no ongoing distribution or service fees and are available only to eligible investors. |
Performance information reflects past performance and does not guarantee future results. Current performance may be lower or higher than the performance data quoted. Refer to www.blackrock.com/funds to obtain performance data current to the most recent month-end. Performance results do not reflect the deduction of taxes that a shareholder would pay on fund distributions or the redemption of fund shares. Figures shown in the performance table on the previous page assume reinvestment of all dividends and distributions, if any, at net asset value on the payable date. Investment return and principal value of shares will fluctuate so that shares, when redeemed, may be worth more or less than their original cost.
The Fund’s investment advisor waived or reimbursed a portion of the Fund’s expenses. Without such waiver and reimbursement, the Fund’s performance would have been lower. BlackRock Advisors, LLC is under no obligation to waive or continue waiving its fees after May 1, 2011.
Disclosure of Expenses
Shareholders of the Fund may incur the following charges: (a) expenses related to transactions; and (b) operating expenses including advisory fees and other Fund expenses. The expense example on the previous page (which is based on a hypothetical investment of $1,000 invested on January 1, 2010 and held through June 30, 2010) is intended to assist shareholders both in calculating expenses based on an investment in the Fund and in comparing these expenses with similar costs of investing in other mutual funds.
The table provides information about actual account values and actual expenses. In order to estimate the expenses a shareholder paid during the period covered by this report, shareholders can divide their account value by $1,000 and then multiply the result by the number under the heading entitled “Expenses Paid During the Period.”
The table also provides information about hypothetical account values and hypothetical expenses based on the Fund’s actual expense ratio and an assumed rate of return of 5% per year before expenses. In order to assist shareholders in comparing the ongoing expenses of investing in the Fund and other funds, compare the 5% hypothetical example with the 5% hypothetical examples that appear in other funds’ shareholder reports.
The expenses shown in the table are intended to highlight shareholders’ ongoing costs only and do not reflect any transactional expenses, such as sales charges, redemption fees or exchange fees. Therefore, the hypothetical example is useful in comparing ongoing expenses only, and will not help shareholders determine the relative total expenses of owning different funds. If these transactional expenses were included, shareholder expenses would have been higher.
| | | | | | |
| 6 | | BLACKROCK EXCHANGE PORTFOLIO | | JUNE 30, 2010 | | |
| | |
| Schedule of Investments June 30, 2010 (Unaudited) |
| | (Percentages shown are based on Net Assets) |
| | | | | | |
| | | Shares | | Value | |
Common Stocks | | | | | | |
Aerospace & Defense — 7.1% | | | | | | |
The Boeing Co. | | 126,232 | | $ | 7,921,058 | |
General Dynamics Corp. | | 93,000 | | | 5,446,080 | |
| | | | | | |
| | | | | 13,367,138 | |
| | | | | | |
Beverages — 2.3% | | | | | | |
The Coca-Cola Co. | | 87,735 | | | 4,397,278 | |
| | | | | | |
Capital Markets — 1.2% | | | | | | |
Ameriprise Financial, Inc. | | 61,125 | | | 2,208,446 | |
| | | | | | |
Computers & Peripherals — 5.7% | | | | | | |
Hewlett-Packard Co. | | 249,188 | | | 10,784,857 | |
| | | | | | |
Consumer Finance — 5.7% | | | | | | |
American Express Co. | | 271,045 | | | 10,760,487 | |
| | | | | | |
Diversified Financial Services — 2.4% | | | | | | |
JPMorgan Chase & Co. | | 124,728 | | | 4,566,292 | |
| | | | | | |
Electronic Equipment, Instruments & Components — 0.5% | | | | | | |
Agilent Technologies, Inc.(a) | | 29,749 | | | 845,764 | |
| | | | | | |
Energy Equipment & Services — 4.9% | | | | | | |
Schlumberger Ltd.(b) | | 168,194 | | | 9,307,856 | |
| | | | | | |
Food & Staples Retailing — 3.1% | | | | | | |
Wal-Mart Stores, Inc. | | 119,846 | | | 5,760,997 | |
| | | | | | |
Food Products — 1.1% | | | | | | |
General Mills, Inc. | | 16,994 | | | 603,627 | |
Kraft Foods, Inc. - Class A | | 53,285 | | | 1,491,980 | |
| | | | | | |
| | | | | 2,095,607 | |
| | | | | | |
Health Care Equipment & Supplies — 0.4% | | | | | | |
Medtronic, Inc. | | 22,800 | | | 826,956 | |
| | | | | | |
Household Products — 6.1% | | | �� | | | |
The Procter & Gamble Co. | | 191,038 | | | 11,458,459 | |
| | | | | | |
Industrial Conglomerates — 2.4% | | | | | | |
General Electric Co. | | 317,848 | | | 4,583,368 | |
| | | | | | |
Insurance — 7.6% | | | | | | |
Berkshire Hathaway, Inc. - Class B(a)(b) | | 180,100 | | | 14,352,169 | |
| | | | | | |
IT Services — 8.0% | | | | | | |
International Business Machines Corp. | | 90,052 | | | 11,119,621 | |
The Western Union Co. | | 266,480 | | | 3,973,217 | |
| | | | | | |
| | | | | 15,092,838 | |
| | | | | | |
Life Sciences Tools & Services — 2.3% | | | | | | |
Millipore Corp.(a) | | 41,268 | | | 4,401,232 | |
| | | | | | |
Machinery — 3.8% | | | | | | |
Caterpillar, Inc. | | 119,415 | | | 7,173,259 | |
| | | | | | |
Multiline Retail — 6.3% | | | | | | |
Target Corp. | | 242,683 | | | 11,932,723 | |
| | | | | | |
Oil, Gas & Consumable Fuels — 4.9% | | | | | | |
BP Plc - ADR | | 31,546 | | | 911,049 | |
Exxon Mobil Corp. | | 144,677 | | | 8,256,716 | |
| | | | | | |
| | | | | 9,167,765 | |
| | | | | | |
Pharmaceuticals — 12.3% | | | | | | |
AstraZeneca Plc - ADR(b) | | 64,000 | | | 3,016,320 | |
Johnson & Johnson | | 115,747 | | | 6,836,018 | |
Merck & Co., Inc. | | 83,999 | | | 2,937,445 | |
Novartis AG - ADR(b) | | 155,916 | | | 7,533,861 | |
Pfizer, Inc. | | 204,166 | | | 2,911,407 | |
| | | | | | |
| | | | | 23,235,051 | |
| | | | | | |
Semiconductors & Semiconductor Equipment — 0.4% | | | | | | |
Intel Corp. | | 40,915 | | | 795,797 | |
| | | | | | |
Software — 4.5% | | | | | | |
Microsoft Corp. | | 367,277 | | | 8,451,044 | |
| | | | | | |
Tobacco — 2.7% | | | | | | |
Altria Group, Inc. | | 77,000 | | | 1,543,080 | |
Philip Morris International, Inc. | | 77,000 | | | 3,529,680 | |
| | | | | | |
| | | | | 5,072,760 | |
| | | | | | |
Wireless Telecommunication Services — 0.7% | | | | | | |
Vodafone Group Plc - ADR | | 64,452 | | | 1,332,223 | |
| | | | | | |
Total Long-Term Investments
(Cost — $42,047,134) — 96.4% | | | | | 181,970,366 | |
| | | | | | |
| | |
| | | Shares/
Beneficial
Interest | | | |
Short-Term Securities | | | | | | |
BlackRock Liquidity Funds, TempFund, Institutional Class, | | | | | | |
0.16%(c)(d) | | 6,667,732 | | | 6,667,732 | |
BlackRock Liquidity Series, LLC Money Market Series, | | | | | | |
0.27%(c)(d)(e) | | 26,728,200 | | | 26,728,200 | |
| | | | | | |
Total Short-Term Securities
(Cost — $33,395,932) — 17.7% | | | | | 33,395,932 | |
| | | | | | |
Total Investments (Cost — $75,443,066*) — 114.1% | | | | | 215,366,298 | |
Liabilities in Excess of Other Assets — (14.1)% | | | | | (26,680,754 | ) |
| | | | | | |
Net Assets — 100.0% | | | | $ | 188,685,544 | |
| | | | | | |
| * | The cost and unrealized appreciation (depreciation) of investments as of June 30, 2010, as computed for federal income tax purposes, were as follows: |
| | | | |
Aggregate cost | | $ | 72,826,270 | |
| | | | |
Gross unrealized appreciation | | $ | 143,069,157 | |
Gross unrealized depreciation | | | (529,129 | ) |
| | | | |
Net unrealized appreciation | | $ | 142,540,028 | |
| | | | |
| (a) | Non-income producing security. |
| (b) | Security, or a portion of security, is on loan. |
Portfolio Abbreviation
ADR American Depositary Receipts
See Notes to Financial Statements.
| | | | | | |
| | | BLACKROCK EXCHANGE PORTFOLIO | | JUNE 30, 2010 | | 7 |
| | |
| Schedule of Investments (concluded) | | |
| | |
| (c) | Investments in companies considered to be an affiliate of the Fund during the period, for purposes of Section 2(a)(3) of the Investment Company Act of 1940, as amended, were as follows: |
| | | | | | | | | | | | | |
Affiliate | | Shares/Beneficial
Interest
held at
December 31,
2009 | | Net Activity | | | Shares/Beneficial
Interest
held at
June 30, 2010 | | Realized
Gain | | Income |
BlackRock Liquidity Funds, TempFund, Institutional Class | | 2,451,630 | | 4,216,102 | | | 6,667,732 | | $ | 10 | | $ | 1,965 |
BlackRock Liquidity Series LLC, Money Market Series | | 27,202,500 | | (474,300 | ) | | 26,728,200 | | | — | | $ | 7,880 |
| (d) | Represents the current yield as of report date. |
| (e) | Security was purchased with the cash collateral from loaned securities. |
| • | | For Fund compliance purposes, the Fund’s industry classifications refer to any one or more of the industry sub-classifications used by one or more widely recognized market indexes or ratings group indexes, and/or as defined by Fund management. This definition may not apply for purposes of this report, which may combine industry sub-classifications for reporting ease. |
| • | | Fair Value Measurements – Various inputs are used in determining the fair value of investments, which are as follows: |
| | • | | Level 1 – price quotations in active markets/exchanges for identical assets and liabilities |
| | • | | Level 2 – other observable inputs (including, but not limited to: quoted prices for similar assets or liabilities in markets that are active, quoted prices for identical or similar assets or liabilities in markets that are not active, inputs other than quoted prices that are observable for the assets or liabilities (such as interest rates, yield curves, volatilities, prepayment speeds, loss severities, credit risks and default rates) or other market–corroborated inputs) |
| | • | | Level 3 – unobservable inputs based on the best information available in the circumstances, to the extent observable inputs are not available (including the Fund’s own assumptions used in determining the fair value of investments) |
The inputs or methodologies used for valuing securities are not necessarily an indication of the risk associated with investing in those securities. For information about the Fund’s policy regarding valuation of investments and other significant accounting policies, please refer to Note 1 of the Notes to Financial Statements.
The following table summarizes the inputs used as of June 30, 2010 in determining the fair valuation of the Fund’s investments:
| | | | | | | | | | | |
Valuation Inputs | | Level 1 | | Level 2 | | Level 3 | | Total |
Assets: | | | | | | | | | | | |
Investments in Securities: | | | | | | | | | | | |
Long-Term Investments1 | | $ | 181,970,366 | | | — | | — | | $ | 181,970,366 |
Short-Term Securities | | | 6,667,732 | | $ | 26,728,200 | | — | | | 33,395,932 |
| | | | | | | | | | | |
Total | | $ | 188,638,098 | | $ | 26,728,200 | | — | | $ | 215,366,298 |
| | | | | | | | | | | |
| 1 | See above Schedule of Investments for values in each industry. |
See Notes to Financial Statements.
| | | | | | |
| 8 | | BLACKROCK EXCHANGE PORTFOLIO | | JUNE 30, 2010 | | |
Statement of Assets and Liabilities
| | | | |
June 30, 2010 (Unaudited) | | | |
Assets | | | | |
Investments at value - unaffiliated (including securities loaned of $25,988,609) (cost — $42,047,134) | | $ | 181,970,366 | |
Investments at value - affiliated (cost — $33,395,932) | | | 33,395,932 | |
Dividends receivable | | | 385,794 | |
Securities lending income receivable - affiliated | | | 1,403 | |
Dividends receivable - affiliated | | | 894 | |
Receivable from advisor | | | 452 | |
Prepaid expenses | | | 8,345 | |
| | | | |
Total assets | | | 215,763,186 | |
| | | | |
Liabilities | | | | |
Collateral on securities loaned at value | | | 26,728,200 | |
Investment advisory fees payable | | | 161,897 | |
Capital shares redeemed payable | | | 108,323 | |
Professional fees payable | | | 28,048 | |
Other affiliates payable | | | 29,247 | |
Printing fees payable | | | 13,438 | |
Officer’s and Trustees’ fees payable | | | 5,955 | |
Other accrued expenses payable | | | 2,534 | |
| | | | |
Total liabilities | | | 27,077,642 | |
| | | | |
Net Assets | | $ | 188,685,544 | |
| | | | |
Net Assets Consist of | | | | |
Paid-in capital | | $ | 51,553,144 | |
Undistributed net investment income | | | 1,341,216 | |
Accumulated net realized loss | | | (4,132,048 | ) |
Net unrealized appreciation/depreciation | | | 139,923,232 | |
| | | | |
Net Assets | | $ | 188,685,544 | |
| | | | |
Net Asset Value | | | | |
BlackRock Shares outstanding, unlimited number of shares authorized, $0.001 per value | | | 365,843 | |
| | | | |
Net asset value | | $ | 515.76 | |
| | | | |
See Notes to Financial Statements.
| | | | | | |
| | | BLACKROCK EXCHANGE PORTFOLIO | | JUNE 30, 2010 | | 9 |
Statement of Operations
| | | | |
Six Months Ended June 30, 2010 (Unaudited) | | | |
Investment Income | | | | |
Dividends | | $ | 2,529,631 | |
Foreign taxes withheld | | | (108,060 | ) |
Dividends - affiliated | | | 1,965 | |
Securities lending - affiliated | | | 7,880 | |
| | | | |
Total income | | | 2,431,416 | |
| | | | |
Expenses | | | | |
Investment advisory | | | 509,842 | |
Administration | | | 101,968 | |
Professional | | | 32,021 | |
Printing | | | 11,748 | |
Custodian | | | 6,698 | |
Officer and Trustees | | | 6,124 | |
Transfer agent | | | 3,664 | |
Miscellaneous | | | 6,741 | |
| | | | |
Total expenses | | | 678,806 | |
Less fees waived by advisor | | | (17,985 | ) |
Less administration fees waived | | | (25,492 | ) |
Less transfer agent fees waived | | | (576 | ) |
Less transfer agent fees reimbursed | | | (2,548 | ) |
| | | | |
Total expenses after fees waived and reimbursed | | | 632,205 | |
| | | | |
Net investment income | | | 1,799,211 | |
| | | | |
Realized and Unrealized Gain (Loss) | | | | |
Net realized gain from: | | | | |
Investments | | | 3,757,964 | |
Redemption-in-kind transactions | | | 148,761 | |
| | | | |
| | | 3,906,725 | |
| | | | |
Net change in unrealized appreciation/depreciation on investments | | | (17,158,862 | ) |
| | | | |
Total realized and unrealized loss | | | (13,252,137 | ) |
| | | | |
Net Decrease in Net Assets Resulting from Operations | | $ | (11,452,926 | ) |
| | | | |
See Notes to Financial Statements.
| | | | | | |
| 10 | | BLACKROCK EXCHANGE PORTFOLIO | | JUNE 30, 2010 | | |
Statements of Changes in Net Assets
| | | | | | | | |
Increase (Decrease) in Net Assets: | | Six Months
Ended
June 30, 2010
(Unaudited) | | | Year Ended
December 31,
2009 | |
Operations | | | | | | | | |
Net investment income | | $ | 1,799,211 | | | $ | 3,501,442 | |
Net realized gain from investment transactions | | | 3,757,964 | | | | 6,756,703 | |
Net realized gain from redemption-in-kind transactions | | | 148,761 | | | | 7,265,291 | |
Net change in unrealized appreciation/depreciation | | | (17,158,862 | ) | | | 25,837,784 | |
| | | | | | | | |
Net increase (decrease) in net assets resulting from operations | | | (11,452,926 | ) | | | 43,361,220 | |
| | | | | | | | |
Dividends to Shareholders From | | | | | | | | |
Net investment income from BlackRock Shares | | | (457,995 | ) | | | (3,542,974 | ) |
| | | | | | | | |
Capital Share Transactions | | | | | | | | |
Shares issued in reinvestment of dividends | | | 64,547 | | | | 501,567 | |
Shares redeemed | | | (1,997,595 | ) | | | (13,336,165 | ) |
| | | | | | | | |
Net decrease in net assets derived from capital share transactions | | | (1,933,048 | ) | | | (12,834,598 | ) |
| | | | | | | | |
Net Assets | | | | | | | | |
Total increase (decrease) in net assets | | | (13,843,969 | ) | | | 26,983,648 | |
Beginning of period | | | 202,529,513 | | | | 175,545,865 | |
| | | | | | | | |
End of period | | $ | 188,685,544 | | | $ | 202,529,513 | |
| | | | | | | | |
Undistributed net investment income | | $ | 1,341,216 | | | $ | — | |
| | | | | | | | |
See Notes to Financial Statements.
| | | | | | |
| | | BLACKROCK EXCHANGE PORTFOLIO | | JUNE 30, 2010 | | 11 |
Financial Highlights
| | | | | | | | | | | | | | | | | | | | | | | | | | | | |
| | | BlackRock Shares | |
| | | Six Months
Ended
June 30, 2010
(Unaudited) | | | Year Ended
December 31,
2009 | | | Period
October 1,
2008 to
December 31,
2008 | | | Year Ended September 30, | | | Period
January 1,
2005 to
September 30,
2005 | |
| | | | | 2008 | | | 2007 | | | 2006 | | |
Per Share Operating Performance | |
Net asset value, beginning of period | | $ | 548.49 | | | $ | 443.11 | | | $ | 572.26 | | | $ | 676.66 | | | $ | 575.50 | | | $ | 533.63 | | | $ | 520.73 | |
| | | | | | | | | | | | | | | | | | | | | | | | | | | | |
Net investment income1 | | | 4.90 | | | | 9.12 | | | | 2.24 | | | | 8.07 | | | | 6.21 | | | | 6.63 | | | | 4.10 | |
Net realized and unrealized gain (loss) | | | (36.38 | ) | | | 105.72 | | | | (124.70 | ) | | | (105.98 | ) | | | 100.52 | | | | 41.58 | | | | 11.80 | |
| | | | | | | | | | | | | | | | | | | | | | | | | | | | |
Net increase (decrease) from investment operations | | | (31.48 | ) | | | 114.84 | | | | (122.46 | ) | | | (97.91 | ) | | | 106.73 | | | | 48.21 | | | | 15.90 | |
| | | | | | | | | | | | | | | | | | | | | | | | | | | | |
Dividends from net investment income | | | (1.25 | ) | | | (9.46 | ) | | | (6.69 | ) | | | (6.49 | ) | | | (5.57 | ) | | | (6.34 | ) | | | (3.00 | ) |
| | | | | | | | | | | | | | | | | | | | | | | | | | | | |
Net asset value, end of period | | $ | 515.76 | | | $ | 548.49 | | | $ | 443.11 | | | $ | 572.26 | | | $ | 676.66 | | | $ | 575.50 | | | $ | 533.63 | |
| | | | | | | | | | | | | | | | | | | | | | | | | | | | |
Total Investment Return2 | |
Based on net asset value | | | (5.77 | )%3 | | | 26.10 | % | | | (21.35 | )%3 | | | (14.56 | )% | | | 18.62 | % | | | 9.06 | % | | | 3.10 | %3 |
| | | | | | | | | | | | | | | | | | | | | | | | | | | | |
Ratios to Average Net Assets | |
Total expenses | | | 0.67 | %4 | | | 0.68 | % | | | 0.71 | %4 | | | 0.65 | % | | | 0.65 | % | | | 0.67 | % | | | 0.71 | %4 |
| | | | | | | | | | | | | | | | | | | | | | | | | | | | |
Total expenses after fees waived, reimbursed and paid indirectly | | | 0.62 | %4 | | | 0.61 | % | | | 0.60 | %4 | | | 0.60 | % | | | 0.60 | % | | | 0.60 | % | | | 0.60 | %4 |
| | | | | | | | | | | | | | | | | | | | | | | | | | | | |
Net investment income | | | 1.76 | %4 | | | 1.96 | % | | | 1.94 | %4 | | | 1.28 | % | | | 0.99 | % | | | 1.20 | % | | | 1.06 | %4 |
| | | | | | | | | | | | | | | | | | | | | | | | | | | | |
Supplemental Data | |
Net assets, end of period (000) | | $ | 188,686 | | | $ | 202,530 | | | $ | 175,546 | | | $ | 238,201 | | | $ | 313,012 | | | $ | 293,551 | | | $ | 292,516 | |
| | | | | | | | | | | | | | | | | | | | | | | | | | | | |
Portfolio turnover | | | — | | | | — | | | | — | | | | — | | | | 1 | % | | | — | | | | — | |
| | | | | | | | | | | | | | | | | | | | | | | | | | | | |
| 1 | Based on average shares outstanding. |
| 2 | Where applicable, total investment returns include the reinvestment of dividends and distributions. |
| 3 | Aggregate total investment return. |
See Notes to Financial Statements.
| | | | | | |
| 12 | | BLACKROCK EXCHANGE PORTFOLIO | | JUNE 30, 2010 | | |
Notes to Financial Statements (Unaudited)
1. Organization and Significant Accounting Policies:
BlackRock FundsSM (the “Trust”), a Massachusetts business trust, is registered under the Investment Company Act of 1940, as amended (the “1940 Act”), as an open-end management investment company. As of June 30, 2010, the Trust had 25 series. These financial statements relate to the Trust’s BlackRock Exchange Portfolio (the “Fund”). The Fund is diversified. The Fund’s financial statements are prepared in conformity with accounting principles generally accepted in the United States of America (“US GAAP”), which may require management estimates and assumptions that affect the reported amounts and disclosures in the financial statements. Actual results could differ from those estimates.
The following is a summary of significant accounting policies followed by the Fund:
Valuation: The Fund’s policy is to fair value its financial instruments at market value using independent dealers or pricing services selected under the supervision of the Board of Trustees (the “Board”). Equity investments traded on a recognized securities exchange or the NASDAQ Global Market System are valued at the last reported sale price that day or the NASDAQ official closing price, if applicable. For equity investments traded on more than one exchange, the last reported sale price on the exchange where the stock is primarily traded is used. Equity investments traded on a recognized exchange for which there were no sales on that day are valued at the last available bid price. If no bid price is available, the prior day’s price will be used, unless it is determined that such prior day’s price no longer reflects the fair value of the security. Short-term securities with remaining maturities of 60 days or less may be valued at amortized cost, which approximates fair value. Investments in open-end investment companies are valued at net asset value each business day.
The Fund values its investment in BlackRock Liquidity Series, LLC Money Market Series (the “Money Market Series”) at fair value, which is ordinarily based upon its pro rata ownership in the net assets of the underlying fund. The Money Market Series seeks current income consistent with maintaining liquidity and preserving capital. Although the Money Market Series is not registered under the 1940 Act, its investments will follow the parameters of investments by a money market fund that is subject to Rule 2a-7 promulgated by the Securities and Exchange Commission (“SEC”) under the 1940 Act. The Fund may withdraw up to 25% of its investment daily, although the manager of the Money Market Series, in its sole discretion, may permit an investor to withdraw more than 25% on any one day.
In the event that application of these methods of valuation results in a price for an investment which is deemed not to be representative of the market value of such investment or is not available, the investment will be valued in accordance with a policy approved by the Board as reflecting fair value (“Fair Value Assets”). When determining the price for Fair Value Assets, the investment advisor seeks to determine the price that the Fund might reasonably expect to receive from the current sale of that asset in an arm’s-length transaction. Fair value determinations shall be based upon all available factors that the investment advisor deems relevant. The pricing of all Fair Value Assets is subsequently reported to the Board or a committee thereof.
Redemptions-In-Kind: During the six months ended June 30, 2010, the Fund transferred securities and cash to investors in connection with redemptions-in-kind. For purposes US GAAP, these transactions were treated as a sale of securities and the resulting gains and losses were recognized based on the market value of the securities on the date of the transfer. For tax purposes, no gains or losses were recognized. Gains and losses resulting from such redemptions-in-kind are shown as redemption-in-kind transactions in the Statement of Operations.
Investment Transactions and Investment Income: For financial reporting purposes, investment transactions are recorded on the dates the transactions are entered into (the trade dates). Realized gains and losses on investment transactions are determined on the identified cost basis. Dividend income is recorded on the ex-dividend dates. Dividends from foreign securities where the ex-dividend date may have passed are subsequently recorded when the Fund has determined the ex-dividend date. Under the applicable foreign tax laws, a withholding tax at various rates may be imposed on capital gains, dividends and interest.
Dividends and Distributions: Dividends and distributions, if any, paid by the Fund are recorded on the ex-dividend dates. The amount and timing of dividends and distributions are determined in accordance with federal income tax regulations, which may differ from US GAAP.
Securities Lending: The Fund may lend securities to financial institutions that provide cash as collateral, which will be maintained at all times in an amount equal to at least 100% of the current market value of the loaned securities. The market value of the loaned securities is determined at the close of business of the Fund and any additional required collateral is delivered to the Fund on the next business day. Securities lending income, as disclosed in the Statement of Operations, represents the income earned from the investment of the cash collateral, net of rebates paid to, or fees paid by, borrowers and less the fees paid to the securities lending agent. Loans of securities are terminable at any time and the borrower, after notice, is required to return borrowed securities within the standard time period for settlement of securities transactions. In the event that the borrower defaults on its obligation to return borrowed securities because of insolvency or for any other reason, the Fund could experience delays and costs in gaining access to the collateral. The Fund also could suffer a loss if the value of an investment purchased with cash collateral falls below the market value of loaned securities or if the value of an investment purchased with cash collateral falls below the value of the original cash collateral received.
Income Taxes: It is the Fund’s policy to comply with the requirements of the Internal Revenue Code of 1986, as amended, applicable to regulated investment companies and to distribute substantially all of its
| | | | | | |
| | | BLACKROCK EXCHANGE PORTFOLIO | | JUNE 30, 2010 | | 13 |
Notes to Financial Statements (continued)
taxable income to its shareholders. Therefore, no federal income tax provision is required.
The Fund files US federal and various state and local tax returns. No income tax returns are currently under examination. The statute of limitations on the Fund’s US federal tax returns remains open for each of the four periods ended December 31, 2009. The statutes of limitations on the Fund’s state and local tax returns may remain open for an additional year depending upon the jurisdiction. There are no uncertain tax positions that require recognition of a tax liability.
Other: Expenses directly related to the Fund are charged to the Fund. Other operating expenses shared by several funds are pro rated among those funds on the basis of relative net assets or other appropriate methods.
2. Investment Advisory Agreement and Other Transactions with Affiliates:
The PNC Financial Services Group, Inc. (“PNC”), Bank of America Corporation (“BAC”) and Barclays Bank PLC (“Barclays”) are the largest stockholders of BlackRock, Inc. (“BlackRock”). Due to the ownership structure, PNC is an affiliate of the Fund for 1940 Act purposes, but BAC and Barclays are not.
The Trust, on behalf of the Fund, entered into an Investment Advisory Agreement with BlackRock Advisors, LLC (the “Manager”), the Fund’s investment advisor, an indirect, wholly owned subsidiary of BlackRock to provide investment advisory and administration services. The Manager is responsible for the management of the Fund’s portfolio and provides the necessary personnel, facilities, equipment and certain other services necessary to the operations of the Fund. For such services, the Fund pays the Manager a monthly fee based on the average daily value of the Fund’s net assets, at the annual rate of 0.50%.
The Manager contractually agreed to waive and/or reimburse fees or expenses, excluding interest expense, dividend expense, acquired fund fees and expenses and certain other fund expenses, in order to limit expenses to 0.62% of the Fund’s average daily net assets. The Manager has agreed not to reduce or discontinue this contractual waiver or reimbursement before May 1, 2011 unless approved by the Board, including a majority of the non-interested Trustees. This expense limit applies to the aggregate expenses incurred on the BlackRock Share class.
These amounts are included in fees waived by advisor, administration fees waived and transfer agent fees reimbursed, respectively, in the Statement of Operations. For the six months ended June 30, 2010, $16,885 is included in fees waived by advisor.
The Manager voluntarily agreed to waive its advisory fees by the amount of investment advisory fees the Fund pays to the Manager indirectly through its investment in affiliated money market funds, however the Manager does not waive its advisory fees by the amount of investment advisory fees through its investment in other affiliated investment companies. This amount is included in fees waived by advisor in the Statement of Operations. For the six months ended June 30, 2010, the Manager waived $1,100.
If during the Fund’s fiscal year the operating expenses of the BlackRock Share class, that at any time during the prior two fiscal years received a waiver or reimbursement from the Manager, are less than the expense limit for the BlackRock Share class, the Manager is entitled to be reimbursed by the BlackRock Share class up to the amount of fees waived or expenses reimbursed during the prior two fiscal years under the agreement provided that: (1) the Fund has more than $50 million in assets for the fiscal year and (2) the Manager or an affiliate continues to serve as the Fund’s investment advisor or administrator. In the event the expense limit for the BlackRock Share class is changed subsequent to a fiscal year in which the Manager becomes entitled to reimbursement for fees waived or reimbursed, the amount available to reimburse the Manager shall be calculated by reference to the expense limit for the BlackRock Share class in effect at the time the Manager became entitled to receive such reimbursement, rather than the subsequently changed expense limit for the BlackRock Share class.
On June 30, 2010, the amounts subject to possible future recoupment under the expense limitation agreement are as follows:
| | | | | | | |
| Expiring December 31, |
| 2010 | | 2011 | | 2012 |
| $ | 51,110 | | $ | 127,694 | | $ | 45,501 |
PFPC Trust Company, an indirect, wholly owned subsidiary of PNC, serves as custodian for the Fund. For these services, the custodian receives a fee computed daily and payable monthly, based on a percentage of the average daily gross assets of the Fund. The fee is paid at the following annual rates: 0.005% of the first $400 million, 0.004% of the next $1.6 billion and 0.003% of average daily gross assets in excess of $2 billion; plus per transaction charges and other miscellaneous fees incurred on behalf of the Fund.
PNC Global Investment Servicing (U.S.) Inc. (“PNCGIS”), an indirect, wholly owned subsidiary of PNC and an affiliate of the Manager, serves as transfer and dividend disbursing agent. Transfer agency fees borne by the Fund are comprised of those fees charged for all shareholder communications including mailing of shareholder reports, dividend and distribution notices, and proxy materials for shareholder meetings, as well as per account and per transaction fees related to servicing and maintenance of shareholder accounts, including the issuing, redeeming and transferring of shares, check writing, anti-money laundering services, and customer identification services.
PNCGIS and the Manager act as co-administrators for the Fund. For these services, the co-administrators receive a combined administration fee computed daily and payable monthly, based on a percentage of the average daily net assets of the Fund. The combined administration fee is paid at the following annual rates: 0.075% of the first $500 million,
| | | | | | |
| 14 | | BLACKROCK EXCHANGE PORTFOLIO | | JUNE 30, 2010 | | |
Notes to Financial Statements (continued)
0.065% of the next $500 million and 0.055% of average daily net assets in excess of $1 billion. In addition, the Fund is charged an administration fee based on the following percentages of average daily net assets of the BlackRock Share class: 0.025% of the first $500 million, 0.015% of the next $500 million and 0.005% of average daily net assets in excess of $1 billion. In addition, PNCGIS and the Manager may have, at their discretion, voluntarily waived all or any portion of their administration fees for the Fund which are included in administration fees waived in the Statement of Operations.
Effective July 1, 2010, PNCGIS and PFPC Trust Company were sold to The Bank of New York Mellon Corporation and are no longer considered affiliates of the Manager. At the close of the sale, PNCGIS changed its name to BNY Mellon Investment Servicing (US) Inc. PFPC Trust Company will not change its name until a later date to be announced.
The Fund received an exemptive order from the SEC permitting, among other things, to pay an affiliated securities lending agent a fee based on a share of the income derived from the securities lending activities and has retained BlackRock Investment Management, LLC (“BIM”) as the securities lending agent. BIM may, on behalf of the Fund, invest cash collateral received by the Fund for such loans, among other things, in a private investment company managed by the Manager or in registered money market funds advised by the Manager or its affiliates. The market value of securities on loan and the value of the related collateral are shown in the Statement of Assets and Liabilities as securities loaned and collateral on securities loaned, at value, respectively. The cash collateral invested by BIM is disclosed in the Schedule of Investments. The share of income earned by the Fund on such investments is shown as securities lending – affiliated in the Statement of Operations. For the six months ended June 30, 2010, BIM received $1,954 in securities lending agent fees related to securities lending activities for the Fund.
Certain officers and/or trustees of the Trust are officers and/or directors of BlackRock or its affiliates. The Fund reimburses the Manager for compensation paid to the Trust’s Chief Compliance Officer.
3. Investments:
Purchases and sales of investments, excluding short-term securities, for the six months ended June 30, 2010, were $0 and $4,346,302, including $173,675 of sales representing redemptions-in-kind, respectively.
4. Borrowings:
The Fund, along with certain other funds managed by the Manager and its affiliates, is a party to a $500 million credit agreement with a group of lenders, which expires in November 2010. The Fund may borrow under the credit agreement to fund shareholder redemptions. The Fund paid its pro rata share of a 0.02% upfront fee on the aggregate commitment amount which was allocated to the Fund based on its net assets as of October 31, 2009, a commitment fee of 0.10% per annum based on the Fund’s pro rata share of the unused portion of the credit agreement and interest at a rate equal to the higher of (a) the one- month LIBOR plus 1.25% per annum and (b) the Fed Funds rate plus 1.25% per annum on amounts borrowed. The Fund did not borrow under the credit agreement during the six months ended June 30, 2010.
5. Capital Loss Carryforwards:
As of December 31, 2009, the Fund had capital loss carryforwards available to offset future realized capital gains through the indicated expiration dates:
| | | |
Expires December 31, | | |
2010 | | $ | 141,029 |
2013 | | | 1,281,140 |
2014 | | | 233,900 |
2016 | | | 6,382,704 |
| | | |
Total | | $ | 8,038,773 |
| | | |
6. Concentration, Market and Credit Risk:
In the normal course of business, the Fund invests in securities and enters into transactions where risks exist due to fluctuations in the market (market risk) or failure of the issuer of a security to meet all its obligations (issuer credit risk). The value of securities held by the Fund may decline in response to certain events, including those directly involving the issuers whose securities are owned by the Fund; conditions affecting the general economy; overall market changes; local, regional or global political, social or economic instability; and currency and interest rate and price fluctuations. Similar to issuer credit risk, the Fund may be exposed to counterparty credit risk, or the risk that an entity with which the Fund has unsettled or open transactions may fail to or be unable to perform on its commitments. The Fund manages counterparty risk by entering into transactions only with counterparties that it believes have the financial resources to honor their obligations and by monitoring the financial stability of those counterparties. Financial assets, which potentially expose the Fund to market issuer and counterparty risks, consist principally of financial instruments and receivables due from counterparties. The extent of the Fund’s exposure to market issuer and counterparty credit risks with respect to these financial assets is generally approximated by their value recorded in the Fund’s Statement of Assets and Liabilities, less any collateral held by the Fund.
The Fund invests a significant portion of its assets in securities in the information technology sector. Changes in economic conditions affecting the information technology sector would have a greater impact on the Fund and could affect the value, income and/or liquidity of positions in such securities.
| | | | | | |
| | | BLACKROCK EXCHANGE PORTFOLIO | | JUNE 30, 2010 | | 15 |
Notes to Financial Statements (concluded)
7. Capital Shares Transactions:
Transactions in BlackRock Shares were as follows:
| | | | | | |
| | | Six Months
Ended
June 30, 2010 | | | Year Ended
December 31,
2009 | |
Shares issued in reinvestment of dividends | | 107 | | | 976 | |
Shares redeemed | | (3,510 | )1 | | (27,895 | )2 |
| | | | | | |
Net decrease | | (3,403 | ) | | (26,919 | ) |
| | | | | | |
| 1 | Including (733) representing redemptions-in-kind. |
| 2 | Including (18,383) representing redemptions-in-kind. |
8. Subsequent Events:
Management has evaluated the impact of all subsequent events on the Fund through the date the financial statements were issued and has determined that there were no subsequent events requiring adjustment or additional disclosure in the financial statements.
| | | | | | |
| 16 | | BLACKROCK EXCHANGE PORTFOLIO | | JUNE 30, 2010 | | |
Disclosure of Investment Advisory Agreement
The Board of Trustees (the “Board,” and the members of which are referred to as “Board Members”) of BlackRock FundsSM (the “Trust”) met on April 20, 2010 and May 18-19, 2010 to consider the approval of the Trust’s investment advisory agreement (the “Advisory Agreement”) with BlackRock Advisors, LLC (the “Manager”), the Trust’s investment advisor, on behalf of BlackRock Exchange Portfolio (the “Fund”), a series of the Trust.
Activities and Composition of the Board
The Board consists of thirteen individuals, eleven of whom are not “interested persons” of the Trust as defined in the Investment Company Act of 1940, as amended (the “1940 Act”) (the “Independent Board Members”). The Board Members are responsible for the oversight of the operations of the Fund and perform the various duties imposed on the directors of investment companies by the 1940 Act. The Independent Board Members have retained independent legal counsel to assist them in connection with their duties. The Co-Chairs of the Board are each Independent Board Members. The Board has established five standing committees: an Audit Committee, a Governance and Nominating Committee, a Compliance Committee, a Performance Oversight and Contract Committee and an Executive Committee, each of which is composed of Independent Board Members (except for the Executive Committee, which also has one interested Board Member) and is chaired by Independent Board Members. The Board also has one ad hoc committee, the Joint Product Pricing Committee, which consists of Independent Board Members and directors/trustees of the boards of certain other BlackRock-managed funds, who are not “interested persons” of their respective funds.
The Agreement
Pursuant to the 1940 Act, the Board is required to consider the continuation of the Agreement on an annual basis. In connection with this process, the Board assessed, among other things, the nature, scope and quality of the services provided to the Fund by the personnel of BlackRock and its affiliates, including investment management, administrative and shareholder services, oversight of fund accounting and custody, marketing services and assistance in meeting applicable legal and regulatory requirements.
From time to time throughout the year, the Board, acting directly and through its committees, considers at each of its meetings factors that are relevant to its annual consideration of the renewal of the Agreement, including the services and support provided by BlackRock to the Fund and its shareholders. Among the matters the Board considered were: (a) investment performance for one-, three- and five-year periods, as applicable, against peer funds, and applicable benchmarks, if any, as well as senior management’s and portfolio managers’ analysis of the reasons for any over performance or underperformance against its peers and/or benchmark, as applicable; (b) fees, including advisory, administration, if applicable, and other amounts paid to BlackRock and its affiliates by the Fund for services, such as transfer agency, marketing and distribution, call center and fund accounting; (c) Fund operating expenses; (d) the resources devoted to and compliance reports relating to the Fund’s investment objective, policies and restrictions, (e) the Fund’s compliance with its Code of Ethics and compliance policies and procedures; (f) the nature, cost and character of non-investment management services provided by BlackRock and its affiliates; (g) BlackRock’s and other service providers’ internal controls; (h) BlackRock’s implementation of the proxy voting policies approved by the Board; (i) the use of brokerage commissions and execution quality of portfolio transactions; (j) BlackRock’s implementation of the Fund’s valuation and liquidity procedures; (k) an analysis of contractual and actual management fees for products with similar investment objectives across the open-end fund, closed-end fund and institutional account product channels; and (l) periodic updates on BlackRock’s business.
Board Considerations in Approving the Agreement
The Approval Process: Prior to the April 20, 2010 meeting, the Board requested and received materials specifically relating to the Agreement. The Board is engaged in a process with BlackRock to periodically review the nature and scope of the information provided to better assist its deliberations. The materials provided in connection with the April meeting included (a) information independently compiled and prepared by Lipper, Inc. (“Lipper”) on Fund fees and expenses, and the investment performance of the Fund as compared with a peer group of funds as determined by Lipper (collectively, “Peers”); (b) information on the profitability of the Agreement to BlackRock and a discussion of fall-out benefits to BlackRock and its affiliates and significant shareholders; (c) a general analysis provided by BlackRock concerning investment advisory fees charged to other clients, such as institutional clients and closed-end funds, under similar investment mandates, as well as the performance of such other clients, as applicable; (d) the impact of economies of scale; (e) a summary of aggregate amounts paid by the Fund to BlackRock; (f) sales and redemption data regarding the Fund’s shares; and (g) if applicable, a comparison of management fees to similar BlackRock open-end funds, as classified by Lipper.
At an in-person meeting held on April 20, 2010, the Board reviewed materials relating to its consideration of the Agreement. As a result of the discussions that occurred during the April 20, 2010 meeting, the Board presented BlackRock with questions and requests for additional information and BlackRock responded to these requests with additional written information in advance of the May 18-19, 2010 Board meeting.
At an in-person meeting held on May 18-19, 2010, the Board, including the Independent Board Members, unanimously approved the continuation of the Agreement between the Manager and the Trust with respect to the Fund for a one-year term ending June 30, 2011. In approving the continuation of the Agreement, the Board considered: (a) the nature, extent and quality of the services provided by BlackRock; (b) the investment performance of the Fund and BlackRock; (c) the advisory fee and the cost of the services and profits to be realized by BlackRock and its affiliates from their relationship with the Fund; (d) economies of scale; and (e) other factors deemed relevant by the Board Members.
| | | | | | |
| | | BLACKROCK EXCHANGE PORTFOLIO | | JUNE 30, 2010 | | 17 |
Disclosure of Investment Advisory Agreement
The Board also considered other matters it deemed important to the approval process, such as payments made to BlackRock or its affiliates relating to the distribution of Fund shares, services related to the valuation and pricing of portfolio holdings of the Fund, direct and indirect benefits to BlackRock and its affiliates and significant shareholders from their relationship with the Fund and advice from independent legal counsel with respect to the review process and materials submitted for the Board’s review. The Board noted the willingness of BlackRock personnel to engage in open, candid discussions with the Board. The Board did not identify any particular information as controlling, and each Board Member may have attributed different weights to the various items considered.
A. Nature, Extent and Quality of the Services Provided by BlackRock: The Board, including the Independent Board Members, reviewed the nature, extent and quality of services provided by BlackRock, including the investment advisory services and the resulting performance of the Fund. Throughout the year, the Board compared Fund performance to the performance of a comparable group of mutual funds, and the performance of a relevant benchmark, if any. The Board met with BlackRock’s senior management personnel responsible for investment operations, including the senior investment officers. The Board also reviewed the materials provided by the Fund’s portfolio management team discussing Fund performance and the Fund’s investment objective, strategies and outlook.
The Board considered, among other factors, the number, education and experience of BlackRock’s investment personnel generally and the Fund’s portfolio management team, investments by portfolio managers in the funds they manage, BlackRock’s portfolio trading capabilities, BlackRock’s use of technology, BlackRock’s commitment to compliance and BlackRock’s approach to training and retaining portfolio managers and other research, advisory and management personnel. The Board also reviewed a general description of BlackRock’s compensation structure with respect to the Fund’s portfolio management team and BlackRock’s ability to attract and retain high-quality talent.
In addition to advisory services, the Board considered the quality of the administrative and non-investment advisory services provided to the Fund. BlackRock and its affiliates and significant shareholders provide the Fund with certain administrative, transfer agency, shareholder and other services (in addition to any such services provided to the Fund by third parties) and officers and other personnel as are necessary for the operations of the Fund. In addition to investment advisory services, BlackRock and its affiliates provide the Fund with other services, including (i) preparing disclosure documents, such as the prospectus, the statement of additional information and periodic shareholder reports; (ii) assisting with daily accounting and pricing; (iii) overseeing and coordinating the activities of other service providers; (iv) organizing Board meetings and preparing the materials for such Board meetings; (v) providing legal and compliance support; and (vi) performing other administrative functions necessary for the operation of the Fund, such as tax reporting, fulfilling regulatory filing requirements, and call center services. The Board reviewed the structure and duties of BlackRock’s fund administration, accounting, legal and compliance departments and considered BlackRock’s policies and procedures for assuring compliance with applicable laws and regulations.
B. The Investment Performance of the Fund and BlackRock: The Board, including the Independent Board Members, also reviewed and considered the performance history of the Fund. In preparation for the April 20, 2010 meeting, the Board was provided with reports, independently prepared by Lipper, which included a comprehensive analysis of the Fund’s performance. The Board also reviewed a narrative and statistical analysis of the Lipper data that was prepared by BlackRock, which analyzed various factors that affect Lipper’s rankings. In connection with its review, the Board received and reviewed information regarding the investment performance of the Fund as compared to a representative group of similar funds as determined by Lipper and to all funds in the Fund’s applicable Lipper category. The Board was provided with a description of the methodology used by Lipper to select peer funds. The Board regularly reviews the performance of the Fund throughout the year. The Board attaches more importance to performance over relatively long periods of time, typically three to five years.
The Board noted that, in general, the Fund performed better than its Peers in that the Fund’s performance was at or above the median of its Lipper Performance Universe in two of the one-, three- and five-year periods reported.
C. Consideration of the Advisory Fees and the Cost of the Services and Profits to be Realized by BlackRock and its Affiliates from their Relationship with the Fund: The Board, including the Independent Board Members, reviewed the Fund’s contractual advisory fee rate compared with the other funds in its Lipper category. It also compared the Fund’s total expenses, as well as actual management fees, to those of other funds in its Lipper category. The Board considered the services provided and the fees charged by BlackRock to other types of clients with similar investment mandates, including separately managed institutional accounts.
The Board received and reviewed statements relating to BlackRock’s financial condition and profitability with respect to the services it provided the Fund. The Board was also provided with a profitability analysis that detailed the revenues earned and the expenses incurred by BlackRock for services provided to the Fund. The Board reviewed BlackRock’s profitability with respect to the Fund and other funds the Board currently oversees for the year ended December 31, 2009 compared to available aggregate profitability data provided for the year ended December 31, 2008. The Board reviewed BlackRock’s profitability with respect to other fund complexes managed by the Manager and/or its affiliates. The Board reviewed BlackRock’s assumptions and methodology of allocating expenses in the profitability analysis, noting the inherent limitations in allocating costs among various advisory products. The Board recognized that profitability may
| | | | | | |
| 18 | | BLACKROCK EXCHANGE PORTFOLIO | | JUNE 30, 2010 | | |
Disclosure of Investment Advisory Agreement (concluded)
be affected by numerous factors including, among other things, fee waivers and expense reimbursements by the Manager, the types of funds managed, expense allocations and business mix, and the difficulty of comparing profitability as a result of those factors.
The Board noted that, in general, individual fund or product line profitability of other advisors is not publicly available. Nevertheless, to the extent such information was available, the Board considered BlackRock’s operating margin, in general, compared to the operating margin for leading investment management firms whose operations include advising open-end funds, among other product types. That data indicates that operating margins for BlackRock with respect to its registered funds are generally consistent with margins earned by similarly situated publicly traded competitors. In addition, the Board considered, among other things, certain third party data comparing BlackRock’s operating margin with that of other publicly-traded asset management firms. That third party data indicates that larger asset bases do not, in themselves, translate to higher profit margins.
In addition, the Board considered the cost of the services provided to the Fund by BlackRock, and BlackRock’s and its affiliates’ profits relating to the management and distribution of the Fund and the other funds advised by BlackRock and its affiliates. As part of its analysis, the Board reviewed BlackRock’s methodology in allocating its costs to the management of the Fund. The Board also considered whether BlackRock has the financial resources necessary to attract and retain high quality investment management personnel to perform its obligations under the Agreement and to continue to provide the high quality of services that is expected by the Board.
The Board noted that the Fund’s contractual advisory fee rate was lower than or equal to the median contractual advisory fee rate paid by the Fund’s Peers, in each case before taking into account any expense reimbursements or fee waivers. The Board also noted that BlackRock has contractually agreed to waive fees and/or reimburse expenses in order to limit, to a specified amount, the Fund’s total operating expenses as a percentage of the Fund’s average daily net assets.
D. Economies of Scale: The Board, including the Independent Board Members, considered the extent to which economies of scale might be realized as the assets of the Fund increase. The Board also considered the extent to which the Fund benefits from such economies and whether there should be changes in the advisory fee rate or structure in order to enable the Fund to participate in these economies of scale, for example through the use of breakpoints in the advisory fee based upon the asset level of the Fund.
E. Other Factors Deemed Relevant by the Board Members: The Board, including the Independent Board Members, also took into account other ancillary or “fall-out” benefits that BlackRock or its affiliates and significant shareholders may derive from their respective relationships with the Fund, both tangible and intangible, such as BlackRock’s ability to leverage its investment professionals who manage other portfolios, an increase in BlackRock’s profile in the investment advisory community, and the engagement of BlackRock’s affiliates and significant shareholders as service providers to the Fund, including for administrative, transfer agency and distribution services. The Board also considered BlackRock’s overall operations and its efforts to expand the scale of, and improve the quality of, its operations. The Board also noted that BlackRock may use and benefit from third party research obtained by soft dollars generated by certain mutual fund transactions to assist in managing all or a number of its other client accounts. The Board further noted that BlackRock completed the acquisition of a complex of exchange-traded funds (“ETFs”) on December 1, 2009, and that BlackRock’s funds may invest in such ETFs without any offset against the management fees payable by the funds to BlackRock.
In connection with its consideration of the Agreement, the Board also received information regarding BlackRock’s brokerage and soft dollar practices. The Board received reports from BlackRock which included information on brokerage commissions and trade execution practices throughout the year.
The Board noted the competitive nature of the open-end fund marketplace, and that shareholders are able to redeem their Fund shares if they believe that the Fund’s fees and expenses are too high or if they are dissatisfied with the performance of the Fund.
Conclusion
The Board, including the Independent Board Members, unanimously approved the continuation of the Agreement between the Manager and the Trust with respect to the Fund for a one-year term ending June 30, 2011. As part of its approval, the Board considered the detailed review of BlackRock’s fee structure, as it applies to the Fund, being conducted by the ad hoc Joint Product Pricing Committee. Based upon its evaluation of all of the aforementioned factors in their totality, the Board, including the Independent Board Members, was satisfied that the terms of the Agreement were fair and reasonable and in the best interest of the Fund and its shareholders. In arriving at a decision to approve the Agreement, the Board did not identify any single factor or group of factors as all-important or controlling, but considered all factors together, and different Board Members may have attributed different weights to the various factors considered. The Independent Board Members were also assisted by the advice of independent legal counsel in making this determination. The contractual fee arrangements for the Fund reflect the results of several years of review by the Board Members and predecessor Board Members, and discussions between such Board Members (and predecessor Board Members) and BlackRock. Certain aspects of the arrangements may be the subject of more attention in some years than in others, and the Board Members’ conclusions may be based in part on their consideration of these arrangements in prior years.
| | | | | | |
| | | BLACKROCK EXCHANGE PORTFOLIO | | JUNE 30, 2010 | | 19 |
Officers and Trustees
Ronald W. Forbes, Co-Chairman of the Board and Trustee
Rodney D. Johnson, Co-Chairman of the Board and Trustee
David O. Beim, Trustee
Richard S. Davis, Trustee
Henry Gabbay, Trustee
Dr. Matina Horner, Trustee
Herbert I. London, Trustee and Member of the Audit Committee
Cynthia A. Montgomery, Trustee
Joseph P. Platt, Jr., Trustee
Robert C. Robb, Jr., Trustee
Toby Rosenblatt, Trustee
Kenneth L. Urish, Chairman of the Audit Committee and Trustee
Frederick W. Winter, Trustee and Member of the Audit Committee
Anne F. Ackerley, President and Chief Executive Officer
Richard Hoerner, CFA, Vice President
Jeffrey Holland, CFA, Vice President
Brendan Kyne, Vice President
Simon Mendelson, Vice President
Brian Schmidt, Vice President
Christopher Stavrakos, CFA, Vice President
Neal J. Andrews, Chief Financial Officer
Jay M. Fife, Treasurer
Brian P. Kindelan, Chief Compliance Officer
Howard B. Surloff, Secretary
Investment Advisor and Co-Administrator
BlackRock Advisors, LLC
Wilmington, DE 19809
Accounting Agent, Co-Administrator and Transfer Agent
BNY Mellon Investment Servicing (US) Inc.
Wilmington, DE 19809
Custodian
PFPC Trust Company
Wilmington, DE 19809
Distributor
BlackRock Investments, LLC
New York, NY 10022
Legal Counsel
Sidley Austin LLP
New York, NY 10019
Independent Registered Public Accounting Firm
Deloitte & Touche LLP
Philadelphia, PA 19103
Address of the Trust
100 Bellevue Parkway
Wilmington, DE 19809
| | | | | | |
| 20 | | BLACKROCK EXCHANGE PORTFOLIO | | JUNE 30, 2010 | | |
Additional Information
General Information
Electronic Delivery
Electronic copies of most financial reports and prospectuses are available on the Fund’s website or shareholders can sign up for e-mail notifications of quarterly statements, annual and semi-annual reports and prospectuses by enrolling in the Fund’s electronic delivery program.
To enroll:
Shareholders Who Hold Accounts with Investment Advisors, Banks or Brokerages
Please contact your financial advisor. Please note that not all investment advisors, banks or brokerages may offer this service.
Shareholders Who Hold Accounts Directly With BlackRock
| 1) | Access the BlackRock website at |
http://www.blackrock.com/edelivery
| 2) | Select “eDelivery” under the “More Information” section |
Householding
The Fund will mail only one copy of shareholder documents, including annual and semi-annual reports and proxy statements, to shareholders with multiple accounts at the same address. This practice is commonly called “householding” and it is intended to reduce expenses and eliminate duplicate mailings of shareholder documents. Mailings of your shareholder documents may be householded indefinitely unless you instruct us otherwise. If you do not want the mailing of these documents to be combined with those for other members of your household, please contact the Fund at (800) 441-7762.
Availability of Quarterly Portfolio Schedule
The Fund files its complete schedule of portfolio holdings with the Securities and Exchange Commission (the “SEC”) for the first and third quarters of each fiscal year on Form N-Q. The Fund’s Forms N-Q are available on the SEC’s website at http://www.sec.gov and may also be reviewed and copied at the SEC’s Public Reference Room in Washington, D.C. Information on the operation of the Public Reference Room may be obtained by calling (800) SEC-0330. The Fund’s Forms N-Q may also be obtained upon request and without charge by calling (800) 441-7762.
Availability of Proxy Voting Policies and Procedures
A description of the policies and procedures that the Fund uses to determine how to vote proxies relating to portfolio securities is available (1) without charge, upon request, by calling (800) 441-7762; (2) at http://www.blackrock.com; and (3) on the SEC’s website at http:// www.sec.gov.
Availability of Proxy Voting Record
Information about how the Fund voted proxies relating to securities held in the Fund’s portfolios during the most recent 12-month period ended June 30 is available upon request and without charge (1) at http:// www.blackrock.com or by calling (800) 441-7762 and (2) on the SEC’s website at http://www.sec.gov.
BlackRock Privacy Principles
BlackRock is committed to maintaining the privacy of its current and former fund investors and individual clients (collectively, “Clients”) and to safeguarding their non-public personal information. The following information is provided to help you understand what personal information BlackRock collects, how we protect that information and why in certain cases we share such information with select parties.
If you are located in a jurisdiction where specific laws, rules or regulations require BlackRock to provide you with additional or different privacy-related rights beyond what is set forth below, then BlackRock will comply with those specific laws, rules or regulations.
BlackRock obtains or verifies personal non-public information from and about you from different sources, including the following: (i) information we receive from you or, if applicable, your financial intermediary, on applications, forms or other documents; (ii) information about your transactions with us, our affiliates, or others; (iii) information we receive from a consumer reporting agency; and (iv) from visits to our websites.
BlackRock does not sell or disclose to non-affiliated third parties any non-public personal information about its Clients, except as permitted by law or as is necessary to respond to regulatory requests or to service Client accounts. These non-affiliated third parties are required to protect the confidentiality and security of this information and to use it only for its intended purpose.
We may share information with our affiliates to service your account or to provide you with information about other BlackRock products or services that may be of interest to you. In addition, BlackRock restricts access to non-public personal information about its Clients to those BlackRock employees with a legitimate business need for the information. BlackRock maintains physical, electronic and procedural safeguards that are designed to protect the non-public personal information of its Clients, including procedures relating to the proper storage and disposal of such information.
| | | | | | |
| | | BLACKROCK EXCHANGE PORTFOLIO | | JUNE 30, 2010 | | 21 |
A World-Class Mutual Fund Family
BlackRock offers a diverse lineup of open-end mutual funds crossing all investment styles and managed by experts in equity, fixed income and tax-exempt investing.
| | | | | | | | |
Equity Funds | | | | |
| | |
BlackRock All-Cap Energy & Resources Portfolio | | BlackRock Global Opportunities Portfolio | | BlackRock Mid-Cap Value Equity Portfolio |
BlackRock Asset Allocation Portfolio† | | BlackRock Global SmallCap Fund | | BlackRock Mid Cap Value Opportunities Fund |
BlackRock Balanced Capital Fund† | | BlackRock Health Sciences Opportunities Portfolio | | BlackRock Natural Resources Trust |
BlackRock Basic Value Fund | | BlackRock Healthcare Fund | | BlackRock Pacific Fund |
BlackRock Capital Appreciation Fund | | BlackRock Index Equity Portfolio* | | BlackRock Science & Technology |
BlackRock Energy & Resources Portfolio | | BlackRock International Fund | | Opportunities Portfolio |
BlackRock Equity Dividend Fund | | BlackRock International Index Fund | | BlackRock Small Cap Core Equity Portfolio |
BlackRock EuroFund | | BlackRock International Opportunities Portfolio | | BlackRock Small Cap Growth Equity Portfolio |
BlackRock Focus Growth Fund | | BlackRock International Value Fund | | BlackRock Small Cap Growth Fund II |
BlackRock Focus Value Fund | | BlackRock Large Cap Core Fund | | BlackRock Small Cap Index Fund |
BlackRock Global Allocation Fund† | | BlackRock Large Cap Core Plus Fund | | BlackRock Small/Mid-Cap Growth Portfolio |
BlackRock Global Dynamic Equity Fund | | BlackRock Large Cap Growth Fund | | BlackRock S&P 500 Index Fund |
BlackRock Global Emerging Markets Fund | | BlackRock Large Cap Value Fund | | BlackRock U.S. Opportunities Portfolio |
BlackRock Global Financial Services Fund | | BlackRock Latin America Fund | | BlackRock Utilities and Telecommunications Fund |
BlackRock Global Growth Fund | | BlackRock Mid-Cap Growth Equity Portfolio | | BlackRock Value Opportunities Fund |
| | | | BlackRock World Gold Fund |
| | |
Fixed Income Funds | | | | |
| | |
BlackRock Bond Portfolio | | BlackRock Income Builder Portfolio† | | BlackRock Managed Income Portfolio |
BlackRock Emerging Market Debt Portfolio | | BlackRock Inflation Protected Bond Portfolio | | BlackRock Multi-Sector Bond Portfolio |
BlackRock Floating Rate Income Portfolio | | BlackRock Intermediate Government | | BlackRock Short-Term Bond Fund |
BlackRock GNMA Portfolio | | Bond Portfolio | | BlackRock Strategic Income Opportunities Portfolio |
BlackRock Government Income Portfolio | | BlackRock International Bond Portfolio | | BlackRock Total Return Fund |
BlackRock High Income Fund | | BlackRock Long Duration Bond Portfolio | | BlackRock Total Return Portfolio II |
BlackRock High Yield Bond Portfolio | | BlackRock Low Duration Bond Portfolio | | BlackRock World Income Fund |
BlackRock Income Portfolio† | | | | |
| | |
Municipal Bond Funds | | | | |
| | |
BlackRock AMT-Free Municipal Bond Portfolio | | BlackRock Kentucky Municipal Bond Portfolio | | BlackRock New York Municipal Bond Fund |
BlackRock California Municipal Bond Fund | | BlackRock Municipal Insured Fund | | BlackRock Ohio Municipal Bond Portfolio |
BlackRock High Yield Municipal Fund | | BlackRock National Municipal Fund | | BlackRock Pennsylvania Municipal Bond Fund |
BlackRock Intermediate Municipal Fund | | BlackRock New Jersey Municipal Bond Fund | | BlackRock Short-Term Municipal Fund |
| | |
Target Risk & Target Date Funds† | | | | |
| | |
BlackRock Prepared Portfolios | | BlackRock Lifecycle Prepared Portfolios | | BlackRock LifePath Portfolios |
Conservative Prepared Portfolio | | 2010 | | 2035 | | Retirement | | 2040 |
Moderate Prepared Portfolio | | 2015 | | 2040 | | 2020 | | 2045 |
Growth Prepared Portfolio | | 2020 | | 2045 | | 2025 | | 2050 |
Aggressive Growth Prepared Portfolio | | 2025 | | 2050 | | 2030 | | 2055 |
| | 2030 | | | | 2035 | | |
| * | See the prospectus for information on specific limitations on investments in the fund. |
BlackRock mutual funds are distributed by BlackRock Investments, LLC. You should consider the investment objectives, risks, charges and expenses of the funds under consideration carefully before investing. Each fund’s prospectus contains this and other information and is available at www.blackrock.com or by calling (800) 441-7762 or from your financial advisor. The prospectus should be read carefully before investing.
| | | | | | |
| 22 | | BLACKROCK EXCHANGE PORTFOLIO | | JUNE 30, 2010 | | |
[THIS PAGE INTENTIONALLY LEFT BLANK.]

This report is transmitted to shareholders only. It is not authorized for use as an offer of sale or a solicitation of an offer to buy shares of the Fund unless accompanied or preceded by that Fund’s current prospectus. Past performance results shown in this report should not be considered a representation of future performance. Investment returns and principal value of shares will fluctuate so that shares, when redeemed, may be worth more or less than their original cost. Statements and other information herein are as dated and are subject to change.

EXCH-6/10-SAR
| | | | |
| Item 2 | | – | | Code of Ethics – Not Applicable to this semi-annual report |
| | |
| Item 3 | | – | | Audit Committee Financial Expert – Not Applicable to this semi-annual report |
| | |
| Item 4 | | – | | Principal Accountant Fees and Services – Not Applicable to this semi-annual report |
| | |
| Item 5 | | – | | Audit Committee of Listed Registrants – Not Applicable |
| | |
| Item 6 | | – | | Investments |
| | |
| | | | (a) The registrant’s Schedule of Investments is included as part of the Report to Stockholders filed under Item 1 of this form. |
| | |
| | | | (b) Not Applicable due to no such divestments during the semi-annual period covered since the previous Form N-CSR filing. |
| | |
| Item 7 | | – | | Disclosure of Proxy Voting Policies and Procedures for Closed-End Management Investment Companies – Not Applicable |
| | |
| Item 8 | | – | | Portfolio Managers of Closed-End Management Investment Companies – Not Applicable |
| | |
| Item 9 | | – | | Purchases of Equity Securities by Closed-End Management Investment Company and Affiliated Purchasers – Not Applicable |
| | |
| Item 10 | | – | | Submission of Matters to a Vote of Security Holders – The registrant’s Nominating and Governance Committee will consider nominees to the board of directors recommended by shareholders when a vacancy becomes available. Shareholders who wish to recommend a nominee should send nominations that include biographical information and set forth the qualifications of the proposed nominee to the registrant’s Secretary. There have been no material changes to these procedures. |
| | |
| Item 11 | | – | | Controls and Procedures |
| | |
| 11(a) | | – | | The registrant’s principal executive and principal financial officers or persons performing similar functions have concluded that the registrant’s disclosure controls and procedures (as defined in Rule 30a-3(c) under the Investment Company Act of 1940, as amended (the “1940 Act”)) are effective as of a date within 90 days of the filing of this report based on the evaluation of these controls and procedures required by Rule 30a-3(b) under the 1940 Act and Rule 15(d)-15(b) under the Securities Exchange Act of 1934, as amended. |
| | |
| 11(b) | | – | | There were no changes in the registrant’s internal control over financial reporting (as defined in Rule 30a-3(d) under the 1940 Act) that occurred during the second fiscal quarter of the period covered by this report that have materially affected, or are reasonably likely to materially affect, the registrant’s internal control over financial reporting. |
| | | | |
| Item 12 | | – | | Exhibits attached hereto |
| | |
| 12(a)(1) | | – | | Code of Ethics – Not Applicable to this semi-annual report |
| | |
| 12(a)(2) | | – | | Certifications – Attached hereto |
| | |
| 12(a)(3) | | – | | Not Applicable |
| | |
| 12(b) | | – | | Certifications – Attached hereto |
Pursuant to the requirements of the Securities Exchange Act of 1934 and the Investment Company Act of 1940, the registrant has duly caused this report to be signed on its behalf by the undersigned, thereunto duly authorized.
| | | | | | |
| BlackRock Funds | | | | |
| | | |
| By: | | /s/ Anne F. Ackerley | | | | |
| | Anne F. Ackerley | | | | |
| | Chief Executive Officer of BlackRock Funds | | |
| | |
| Date: September 2, 2010 | | | | |
Pursuant to the requirements of the Securities Exchange Act of 1934 and the Investment Company Act of 1940, this report has been signed below by the following persons on behalf of the registrant and in the capacities and on the dates indicated.
| | | | | | |
| By: | | /s/ Anne F. Ackerley | | | | |
| | Anne F. Ackerley | | | | |
| | Chief Executive Officer (principal executive officer) of BlackRock Funds | | |
| | |
| Date: September 2, 2010 | | | | |
| | | |
| By: | | /s/ Neal J. Andrews | | | | |
| | Neal J. Andrews | | | | |
| | Chief Financial Officer (principal financial officer) of BlackRock Funds | | |
| | |
| Date: September 2, 2010 | | | | |