UNITED STATES
SECURITIES AND EXCHANGE COMMISSION
Washington, D.C. 20549
FORM N-CSR
CERTIFIED SHAREHOLDER REPORT OF REGISTERED MANAGEMENT INVESTMENT COMPANIES
Investment Company Act file number 811-05742
Name of Fund: BlackRock Funds
BlackRock All-Cap Energy & Resources Portfolio
BlackRock China Fund
BlackRock Energy & Resources Portfolio
BlackRock Global Opportunities Portfolio
BlackRock Health Sciences Opportunities Portfolio
BlackRock International Opportunities Portfolio
BlackRock Managed Volatility Portfolio (Formerly, BlackRock Asset Allocation Portfolio)
BlackRock Mid-Cap Growth Equity Portfolio
BlackRock Mid-Cap Value Equity Portfolio
BlackRock Science & Technology Opportunities Portfolio
BlackRock Small Cap Growth Equity Portfolio
BlackRock U.S. Opportunities Portfolio
BlackRock World Gold Fund
Fund Address: 100 Bellevue Parkway, Wilmington, DE 19809
Name and address of agent for service: John M. Perlowski, Chief Executive Officer, BlackRock Funds, 55 East 52nd
Street, New York, NY 10055
Registrant’s telephone number, including area code: (800) 441-7762
Date of fiscal year end: 09/30/2012
Date of reporting period: 03/31/2012
Item 1 – Report to Stockholders
| | | | |
 | | | March 31, 2012 | |
|
Semi-Annual Report (Unaudited) |
BlackRock FundsSM
| | u | BlackRock All-Cap Energy & Resources Portfolio |
| | u | BlackRock Energy & Resources Portfolio |
| | u | BlackRock World Gold Fund |
| | |
| Not FDIC Insured • No Bank Guarantee • May Lose Value | | |
| | | | | | |
| | | | | | | |
| 2 | | BLACKROCK FUNDS | | MARCH 31, 2012 | | |
Dear Shareholder
Twelve months ago, risk assets were charging forward, only to be met with a sharp reversal in May 2011 when escalating political strife in Greece rekindled fears about sovereign debt problems spreading across Europe. Concurrently, global economic indicators signaled that the recovery had slowed. Confidence was further shaken by the prolonged debt ceiling debate in Washington, DC. On August 5, 2011, Standard & Poor’s made history by downgrading the US government’s credit rating, and turmoil erupted in financial markets around the world. Extraordinary levels of volatility persisted in the months that followed as the European debt crisis intensified. Macro news flow became a greater influence on trading decisions than the fundamentals of the securities traded, resulting in high correlations between asset prices. By the end of the third quarter, equity markets had fallen nearly 20% from their April peak while safe-haven assets such as US Treasuries and gold had rallied to historic highs.
October brought enough positive economic data to assuage fears of a global double-dip recession. Additionally, European leaders began to show progress toward stemming the region’s debt crisis. Investors began to reenter the markets, putting risk assets on the road to recovery. Improving investor sentiment carried over into the first several months of 2012. Debt problems in Europe stabilized as policymakers secured a bailout plan for Greece and completed the nation’s debt restructuring without significant market disruptions. While concerns about slowing growth in China and a European recession weighed on the outlook for the global economy, an acceleration of the US recovery lifted sentiment. Several consecutive months of stronger jobs data signaled solid improvement in the US labor market, a pivotal factor for economic growth. Meanwhile, the European Central Bank revived financial markets with additional liquidity through its long-term refinancing operations. The improving market conditions and generally better-than-expected economic news lured investors still holding cash on the sidelines back to risk assets. Stocks, commodities and high yield bonds rallied through the first two months of the year while rising Treasury yields pressured higher-quality fixed income assets. The rally softened in late March, however, as concerns about slowing growth in China were refueled by negative signals from the world’s second-largest economy. Additionally, concerns over the European debt crisis resurfaced given uncertainty around policies for sovereign debt financing in peripheral countries and rising yields in Portugal and Spain.
Thanks in large part to an exceptionally strong first quarter of 2012, risk assets, including equities and high yield bonds, posted solid returns for the 6-month period ended March 31, 2012. On a 12-month basis, US large-cap stocks and high yield bonds delivered positive results, while small-cap stocks finished in slightly negative territory. International and emerging markets, which experienced significant downturns in 2011, lagged the broader rebound. Fixed income securities experienced mixed results, given recent volatility in yields. US Treasury bonds performed particularly well for the 12-month period; however, an early-2012 sell-off resulted in a negative return for the 6–month period. Municipal bonds staged a solid advance over the past year. Continued low short-term interest rates kept yields on money market securities near their all-time lows.
While markets have improved in recent months, considerable headwinds remain. Europe faces a prolonged recession and the financial situations in Italy, Portugal and Spain remain worrisome. Higher oil and gasoline prices along with slowing growth in China and other emerging-market countries weigh heavily on the future of the global economy. But, we believe that with these challenges come opportunities. We remain committed to working with you and your financial professional to identify actionable ideas for your portfolio. We encourage you to visit www.blackrock.com/newworld for more information.
Sincerely,

Rob Kapito
President, BlackRock Advisors, LLC

“While markets have improved in recent months, considerable headwinds remain.”
Rob Kapito
President, BlackRock Advisors, LLC
| | | | | | | | |
Total Returns as of March 31, 2012 | |
| | | 6-month | | | 12-month | |
US large cap equities (S&P 500® Index) | | | 25.89 | % | | | 8.54 | % |
US small cap equities (Russell 2000® Index) | | | 29.83 | | | | (0.18 | ) |
International equities (MSCI Europe, Australasia, Far East Index) | | | 14.56 | | | | (5.77 | ) |
Emerging market equities (MSCI Emerging Markets Index) | | | 19.12 | | | | (8.81 | ) |
3-month Treasury bill (BofA Merrill Lynch 3-Month Treasury Bill Index) | | | 0.01 | | | | 0.06 | |
US Treasury securities (BofA Merrill Lynch 10- Year US Treasury Index) | | | (1.05 | ) | | | 14.92 | |
US investment grade bonds (Barclays US Aggregate Bond Index) | | | 1.43 | | | | 7.71 | |
Tax-exempt municipal bonds (S&P Municipal Bond Index) | | | 4.16 | | | | 12.56 | |
US high yield bonds (Barclays US Corporate High Yield 2% Issuer Capped Index) | | | 12.17 | | | | 6.43 | |
Past performance is no guarantee of future results. Index performance is shown for illustrative purposes only. You cannot invest directly in an index.
| | | | | | |
| | | | | | | |
| | THIS PAGE NOT PART OF YOUR FUND REPORT | | | | 3 |
| | |
| | |
Fund Summary as of March 31, 2012 | | BlackRock All-Cap Energy & Resources Portfolio |
|
| Investment Objective |
BlackRock All-Cap Energy & Resources Portfolio’s (the “Fund”) investment objective is to provide long-term growth of capital. |
| Portfolio Management Commentary |
| | How did the Fund perform? |
| — | | For the six-month period ended March 31, 2012, the Fund posted a positive double-digit return, but underperformed its custom benchmark, which is a blend of 70% Wilshire 5000 Modified Energy Cap Weighted Index and 30% MSCI All-Country World Energy Index. The Fund also underperformed the broad-market S&P 500® Index. The following discussion of relative performance pertains to the Fund’s custom blended benchmark. |
| | What factors influenced performance? |
| — | | The Fund benefited from its sizable exposure to oil-focused names within the oil & gas exploration & production sub-industry. Oil producers such as Whiting Petroleum Corp., Plains Exploration & Production Co. and Energy XXI Bermuda Ltd. posted solid double-digit gains on stronger global pricing and increased recognition of their respective production profiles. Natural gas producers in this group suffered the impact of extremely low natural gas prices and thus muted the otherwise strong performance from oil-oriented stocks. |
| — | | The largest detractor from returns relative to the custom blended benchmark was the Fund’s overweight allocation to gold names. Gold stocks dropped off sharply in tandem with spot market prices in the beginning of the fourth quarter of 2011, but did not keep pace with the recovery in gold spot prices during January and February of 2012. |
| — | | The Fund’s overweight in oil, gas & consumable fuels also detracted substantially. Coal names struggled throughout the period from the effects of the warm winter in the United States. Negative performance was exacerbated by the impact of power producers switching to natural gas, as natural gas prices traded at historically low levels. Alpha Natural Resources, Inc., Peabody Energy Corp. and CONSOL Energy, Inc. had the largest impact on relative returns within the group. |
| — | | The Fund’s lack of exposure to refiners, one of the best-performing segments in the first quarter of 2012, hampered returns as a widening spread between global and US crude oil prices enabled these companies to realize higher margins. |
| | Describe recent portfolio activity. |
| — | | During the six-month period, positioning in the portfolio remained relatively unchanged. |
| | Describe portfolio positioning at period end. |
| — | | At period end, the Fund continued to favor oil-focused names across the capitalization spectrum. The Fund maintained exposure to coal and low-cost natural gas producers that have experienced selling pressure in recent months. |
| — | | With energy stocks implying prices of $80 per barrel for crude oil and $2 per ton for coal margins as of period end, Fund management believes the sector is poised to rally from its oversold/under-owned conditions. While the timing of such a rebound remains uncertain given macroeconomic headwinds, Fund management believes the energy sector offers compelling value. |
The views expressed reflect the opinions of BlackRock as of the date of this report and are subject to change based on changes in market, economic or other conditions. These views are not intended to be a forecast of future events and are no guarantee of future results.
| | | | | |
| Ten Largest Holdings | | Percent of Long-Term Investments |
Whiting Petroleum Corp. | | | | 5 | % |
Silver Wheaton Corp. | | | | 4 | |
EOG Resources, Inc. | | | | 4 | |
Occidental Petroleum Corp. | | | | 4 | |
Core Laboratories NV | | | | 4 | |
Apache Corp. | | | | 3 | |
CONSOL Energy, Inc. | | | | 3 | |
Goldcorp, Inc. | | | | 3 | |
Chevron Corp. | | | | 3 | |
Plains Exploration & Production Co. | | | | 3 | |
| | | | | |
| Industry Allocation | | Percent of
Long-Term
Investments |
Oil, Gas & Consumable Fuels | | | | 74 | % |
Energy Equipment & Services | | | | 15 | |
Metals & Mining | | | | 9 | |
Chemicals | | | | 2 | |
For Fund compliance purposes, the Fund’s industry classifications refer to any one or more of the industry sub-classifications used by one or more widely recognized market indexes or ratings group indexes, and/or as defined by Fund management. These definitions may not apply for purposes of this report, which may combine industry sub-classifications for reporting ease.
| | | | | | |
| | | | | | | |
| 4 | | BLACKROCK FUNDS | | MARCH 31, 2012 | | |
| | |
| | |
| | BlackRock All-Cap Energy & Resources Portfolio |
|
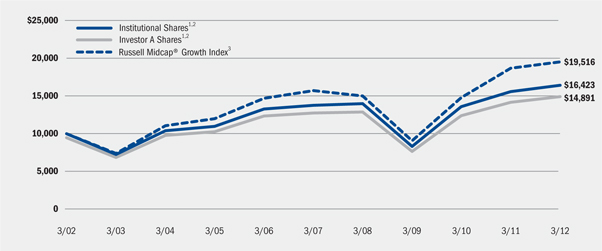
| Total Return Based on a $10,000 Investment |
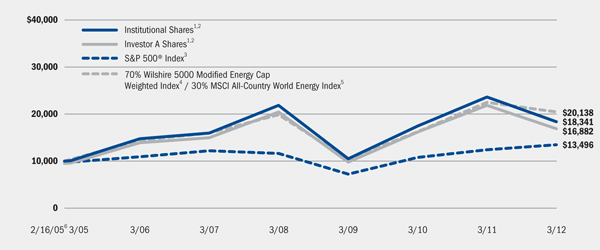
| | 1 | Assuming maximum sales charges, if any, transaction costs and other operating expenses, including investment advisory fees. Institutional Shares do not have a sales charge. |
| | 2 | Under normal market conditions, the Fund invests at least 80% of its total assets in equity securities of global energy and natural resources companies and companies in associated businesses, as well as utilities (such as gas, water, cable, electrical and telecommunications utilities). |
| | 3 | This unmanaged index covers 500 industrial, utility, transportation and financial companies of the US markets (mostly New York Stock Exchange (“NYSE”) issues) representing about 75% of NYSE market capitalization and 30% of NYSE issues. |
| | 4 | The Wilshire 5000 Modified Energy Cap Weighted Index is a customized index comprised of the energy sector constituents of the Wilshire 5000 (Full Cap) Index which have been market capitalization weighted and the six largest securities and all securities that have a percentage market value below 0.01% have been removed. |
| | 5 | The MSCI All-Country World Energy Index is comprised of the energy sector constituents of the MSCI All-Country World Index, a free float-adjusted market capitalization weighted index designed to measure the equity market performance of developed and emerging markets. |
| | 6 | Commencement of operations. |
|
| Performance Summary for the Period Ended March 31, 2012 |
| | | | | | | | | | | | | | | | | | | | | | | | | | | | | | | | | | | |
| | | | | Average Annual Total Returns7 |
| | | | | 1 Year | | 5 Years | | Since Inception8 |
| | | 6-Month
Total Returns | | w/o sales charge | | w/sales charge | | w/o sales charge | | w/sales charge | | w/o sales charge | | w/sales charge |
Institutional | | | | 17.46 | % | | | | (22.37 | )% | | | | N/A | | | | | 2.81 | % | | | | N/A | | | | | 8.89 | % | | | | N/A | |
Service | | | | 17.23 | | | | | (22.63 | ) | | | | N/A | | | | | 2.42 | | | | | N/A | | | | | 8.47 | | | | | N/A | |
Investor A | | | | 17.14 | | | | | (22.73 | ) | | | | (26.79 | )% | | | | 2.40 | | | | | 1.31 | % | | | | 8.45 | | | | | 7.63 | % |
Investor B | | | | 16.68 | | | | | (23.31 | ) | | | | (26.76 | ) | | | | 1.63 | | | | | 1.30 | | | | | 7.64 | | | | | 7.64 | |
Investor C | | | | 16.65 | | | | | (23.28 | ) | | | | (24.05 | ) | | | | 1.65 | | | | | 1.65 | | | | | 7.68 | | | | | 7.68 | |
S&P 500® Index | | | | 25.89 | | | | | 8.54 | | | | | N/A | | | | | 2.01 | | | | | N/A | | | | | 4.30 | | | | | N/A | |
| 70% Wilshire 5000 Modified Energy Cap Weighted Index / 30% MSCI All-Country World Energy Index | | | | 23.55 | | | | | (10.61 | ) | | | | N/A | | | | | 4.78 | | | | | N/A | | | | | 10.32 | | | | | N/A | |
| | 7 | Assuming maximum sales charges, if any. Average annual total returns with and without sales charges reflect reductions for distribution and service fees. See “About Fund Performance” on page 12 for a detailed description of share classes, including any related sales charges and fees. |
| | 8 | The Fund commenced operations on February 16, 2005. |
| | | N/A - Not applicable as share class and index do not have a sales charge. |
| | | Past performance is not indicative of future results. |
| | | | | | | | | | | | | | | | | | | | | | | | | | | | | | | | | | | |
| | | Actual | | Hypothetical10 | | |
| | | Beginning Account Value October 1, 2011 | | Ending Account Value March 31, 2012 | | Expenses Paid
During the Period9 | | Beginning Account Value October 1, 2011 | | Ending Account Value March 31, 2012 | | Expenses Paid
During the Period9 | | Annualized Expense Ratio |
Institutional | | | $ | 1,000.00 | | | | $ | 1,174.60 | | | | $ | 5.06 | | | | $ | 1,000.00 | | | | $ | 1,020.35 | | | | $ | 4.70 | | | | | 0.93 | % |
Service | | | $ | 1,000.00 | | | | $ | 1,172.30 | | | | $ | 6.90 | | | | $ | 1,000.00 | | | | $ | 1,018.65 | | | | $ | 6.41 | | | | | 1.27 | % |
Investor A | | | $ | 1,000.00 | | | | $ | 1,171.40 | | | | $ | 7.27 | | | | $ | 1,000.00 | | | | $ | 1,018.30 | | | | $ | 6.76 | | | | | 1.34 | % |
Investor B | | | $ | 1,000.00 | | | | $ | 1,166.80 | | | | $ | 11.38 | | | | $ | 1,000.00 | | | | $ | 1,014.50 | | | | $ | 10.58 | | | | | 2.10 | % |
Investor C | | | $ | 1,000.00 | | | | $ | 1,166.50 | | | | $ | 11.21 | | | | $ | 1,000.00 | | | | $ | 1,014.65 | | | | $ | 10.43 | | | | | 2.07 | % |
| | 9 | For each class of the Fund, expenses are equal to the annualized expense ratio for the class, multiplied by the average account value over the period, multiplied by 183/366 (to reflect the one-half year period shown). |
| | 10 | Hypothetical 5% annual return before expenses is calculated by pro rating the number of days in the most recent fiscal half year divided by 366. |
| | See “Disclosure of Expenses” on page 13 for further information on how expenses were calculated. |
| | | | | | |
| | | | | | | |
| | BLACKROCK FUNDS | | MARCH 31, 2012 | | 5 |
| | |
| | |
Fund Summary as of March 31, 2012 | | BlackRock China Fund |
|
| Investment Objective |
BlackRock China Fund’s (the “Fund”) investment objective is to seek to maximize total return. Total return means the combination of capital appreciation and investment income. |
| Portfolio Management Commentary |
| | How did the Fund perform? |
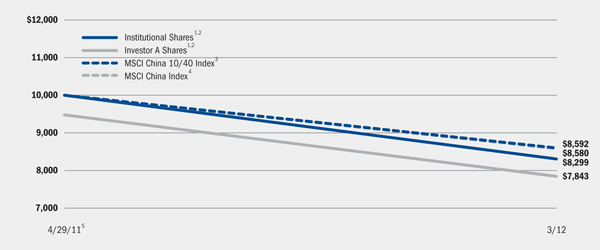
| — | | For the six-month period ended March 31, 2012, the Fund outperformed its benchmark, the MSCI China 10/40 Index, and the MSCI China Index. The following discussion of relative performance pertains to the MSCI China 10/40 Index. |
| | What factors influenced performance? |
| — | | The Fund outperformed its benchmark as a result of strong stock selection, particularly within the energy and financials sectors. In energy, the Fund’s underweight positions relative to the benchmark in China Shenhua Energy Co., PetroChina Co. Ltd. and Yanzhou Coal Mining Co. Ltd. had a positive impact on performance, as did an overweight holding in China Coal Energy Co. Ltd. Within financials, the Fund’s overweight positions in China CITIC Bank Corp. Ltd. and China Minsheng Banking Corp. Ltd. were the largest contributors to performance. From an individual security perspective, the Fund’s top contributor to performance for the period was diversified electronics manufacturer ZhuZhou CSR Times Electric Co. Ltd. The Fund maintained an overweight position in this core holding as it continued to benefit from the loosening of specific government policy that supports the development of the company’s rail network. |
| — | | Detracting from performance was the Fund’s overweight holding in materials company Huabao International Holdings Ltd., which saw its stock price decline due to allegations of fraud in the final quarter of 2011. An overweight position in wireless communications provider China Unicom Hong Kong Ltd. also had a negative impact on Fund performance during the period. |
| | Describe recent portfolio activity. |
| — | | During the six-month period, the Fund purchased health care stock Sinopharm Group Co. as a long-term structural growth holding. The Fund also added Kingdee International Software Group Co. Ltd. to its portfolio holdings, which reduced the Fund’s underweight in the information technology (“IT”) sector. In the industrials sector, the Fund initiated a small position in AviChina Industry & Technology Co. Ltd., a developer and manufacturer of aviation products, for its attractive long-term growth potential. |
| — | | The Fund reduced exposure to the consumer staples sector during the period by exiting its position and taking profits on Want Want China Holdings Ltd. The Fund also exited its position in China Taiping Insurance Holdings Co. Ltd. and invested some of those proceeds in New China Life Insurance Co. Ltd., but remained underweight in Chinese life insurers overall. |
| | Describe portfolio positioning at period end. |
| — | | As of period end, the Fund maintained sector overweights relative to the MSCI China 10/40 Index in consumer discretionary, health care, industrials and materials, and a marginal overweight in utilities. The Fund was underweight in consumer staples, energy, IT and telecommunications services, and slightly underweight in financials. The Fund ended the period positioned to purchase securities on price weakness amid a trend of downward revisions of corporate earnings reports while continuing to add to its long-term secular growth stocks, particularly in the IT, health care and consumer discretionary sectors. |
The views expressed reflect the opinions of BlackRock as of the date of this report and are subject to change based on changes in market, economic or other conditions. These views are not intended to be a forecast of future events and are no guarantee of future results.
| | | | | |
| Ten Largest Holdings | | Percent of
Long-Term
Investments |
CNOOC Ltd. | | | | 7 | % |
Industrial & Commercial Bank of China, H Shares | | | | 7 | |
China Mobile Ltd. | | | | 7 | |
China Construction Bank Corp., H Shares | | | | 6 | |
Bank of China Ltd., H Shares | | | | 6 | |
China Petroleum & Chemical Corp., H Shares | | | | 4 | |
China Unicom Hong Kong Ltd. | | | | 3 | |
China Pacific Insurance Group Co. Ltd., H Shares | | | | 3 | |
Zhuzhou CSR Times Electric Co. Ltd., H Shares | | | | 3 | |
China CITIC Bank Corp. Ltd., H Shares | | | | 3 | |
| | | | | |
| Sector Allocation | | Percent of Long-Term Investments |
Financials | | | | 36 | % |
Energy | | | | 17 | |
Industrials | | | | 11 | |
Telecommunication Services | | | | 10 | |
Materials | | | | 7 | |
Consumer Discretionary | | | | 7 | |
Health Care | | | | 5 | |
Information Technology | | | | 3 | |
Utilities | | | | 3 | |
Consumer Staples | | | | 1 | |
For Fund compliance purposes, the Fund’s sector classifications refer to any one or more of the sector sub-classifications used by one or more widely recognized market indexes or ratings group indexes, and/or as defined by Fund management. These definitions may not apply for purposes of this report, which may combine sector sub-classifications for reporting ease.
| | | | | | |
| | | | | | | |
| 6 | | BLACKROCK FUNDS | | MARCH 31, 2012 | | |
|
| Total Return Based on a $10,000 Investment |
| | 1 | Assuming maximum sales charges, if any, transaction costs and other operating expenses, including investment advisory fees. Institutional Shares do not have a sales charge. |
| | 2 | The Fund seeks to achieve its objective by investing at least 80% of its total assets in equity securities of companies domiciled, or exercising the predominant part of their economic activity, in China, including its special administrative regions such as Hong Kong, or in instruments with similar economic characteristics. |
| | 3 | A free float-adjusted market capitalization index that is designed to measure equity market performance in China, taking into consideration the concentration constraints of the European Union’s UCITS III regulations. |
| | 4 | An unmanaged free float-adjusted market capitalization index designed to measure equity market performance of China. |
| | 5 | Commencement of operations. |
|
| Performance Summary for the Period Ended March 31, 2012 |
| | | | | | | | | | | | | | | | | | | | |
| | | | | | | Total Returns6 |
| | | | | | | Since Inception7 |
| | | 6-Month Total Returns | | | | w/o sales charge | | w/sales
charge |
Institutional | | | | 20.27 | % | | | | | | (17.01 | )% | | | | N/A | |
Investor A | | | | 20.10 | | | | | | | (17.25 | ) | | | | (21.57 | )% |
Investor C | | | | 19.71 | | | | | | | (17.76 | ) | | | | (18.57 | ) |
MSCI China 10/40 Index | | | | 19.20 | | | | | | | (14.08 | ) | | | | N/A | |
MSCI China Index | | | | 18.82 | | | | | | | (14.20 | ) | | | | N/A | |
| | 6 | Assuming maximum sales charges, if any. Total returns with and without sales charges reflect reductions for distribution and service fees. See “About Fund Performance” on page 12 for a detailed description of share classes, including any related sales charges and fees. |
| | 7 | The Fund commenced operations on April 29, 2011. |
| | | N/A - Not applicable as share class and index do not have a sales charge. |
| | | Past performance is not indicative of future results. |
| | | | | | | | | | | | | | | | | | | | | | | | | | | | | | | | | | | |
| | | Actual | | Hypothetical9 | | |
| | | Beginning Account Value October 1, 2011 | | Ending
Account Value March 31, 2012 | | Expenses Paid During the Period8 | | Beginning Account Value
October 1, 2011 | | Ending Account Value March 31, 2012 | | Expenses Paid During the Period8 | | Annualized Expense Ratio |
Institutional | | | $ | 1,000.00 | | | | $ | 1,202.70 | | | | $ | 9.09 | | | | $ | 1,000.00 | | | | $ | 1,016.75 | | | | $ | 8.32 | | | | | 1.65 | % |
Investor A | | | $ | 1,000.00 | | | | $ | 1,201.00 | | | | $ | 10.45 | | | | $ | 1,000.00 | | | | $ | 1,015.50 | | | | $ | 9.57 | | | | | 1.90 | % |
Investor C | | | $ | 1,000.00 | | | | $ | 1,197.10 | | | | $ | 14.56 | | | | $ | 1,000.00 | | | | $ | 1,011.75 | | | | $ | 13.33 | | | | | 2.65 | % |
| | 8 | For each class of the Fund, expenses are equal to the annualized expense ratio for the class, multiplied by the average account value over the period, multiplied by 183/366 (to reflect the one-half year period shown). |
| | 9 | Hypothetical 5% annual return before expenses is calculated by pro rating the number of days in the most recent fiscal period divided by 366. |
| | | See “Disclosure of Expenses” on page 13 for further information on how expenses were calculated. |
| | | | | | |
| | | | | | | |
| | BLACKROCK FUNDS | | MARCH 31, 2012 | | 7 |
| | |
| | |
Fund Summary as of March 31, 2012 | | BlackRock Energy & Resources Portfolio |
|
| Investment Objective |
BlackRock Energy & Resources Portfolio’s (the “Fund”) investment objective is to provide long-term growth of capital. |
| Portfolio Management Commentary |
| | How did the Fund perform? |
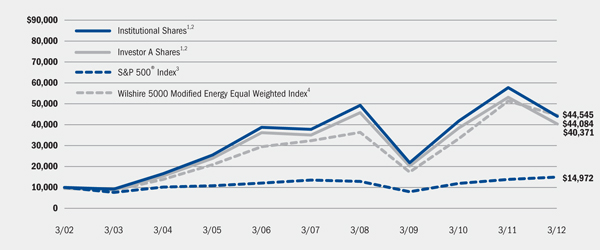
| — | | For the six-month period ended March 31, 2012, the Fund posted a positive double-digit return, but underperformed its benchmark, the Wilshire 5000 Modified Energy Equal Weighted Index, and the broad-market S&P 500® Index. The following discussion of relative performance pertains to the Fund’s benchmark. |
| | What factors influenced performance? |
| — | | The Fund benefited from its sizable exposure to oil-focused names in the oil & gas exploration & production sub-industry. Oil producers such as Plains Exploration & Production Co., Energy XXI Bermuda Ltd. and Clayton Williams Energy, Inc. posted solid double-digit gains on stronger global pricing and increased recognition of their respective production profiles. Cobalt International Energy, Inc. stock price more than doubled on the announcement of the company’s exploration success off the coast of Africa. Natural gas producers in this group suffered the impact of extremely low natural gas prices and thus muted the otherwise strong performance from oil-oriented stocks. |
| — | | The Fund also benefited from stock selection in oil & gas storage & transportation, as Cheniere Energy, Inc. shares soared on the company’s significant progress toward becoming the first viable candidate to export liquefied natural gas. |
| — | | The largest detractor from returns relative to the benchmark was the Fund’s overweight allocation to the oil, gas & consumable fuels segment. Coal names struggled throughout the period from the effects of the warm winter in the United States. Negative performance was exacerbated by the impact of power producers switching to natural gas, as natural gas prices traded at historically low levels. Alpha Natural Resources, Inc., Peabody Energy Corp. and CONSOL Energy, Inc. had the |
| | | largest impact on relative returns within the group. Stock selection in the oil & gas equipment & services group also detracted from returns, primarily due to the Fund’s lack of exposure to several strong-performing stocks within the customized benchmark including OYO Geospace Corp., which returned close to 90% during the period after announcing its contract to monitor deep-water reservoirs off the coast of Brazil. |
| — | | The Fund’s modest overweight position in gold and precious metals also detracted from returns, as equity names did not keep up with spot prices which recovered from large drops in the fourth quarter of 2011. The Fund’s lack of weighting in refiners, one of the best-performing segments in the first quarter, hampered returns as these names benefited from a widening spread between global and US crude oil prices, enabling them to realize higher margins. |
| | Describe recent portfolio activity. |
| — | | During the six-month period, positioning in the portfolio remained relatively unchanged. |
| | Describe portfolio positioning at period end. |
| — | | At period end, the Fund’s holdings reflected an emphasis on small- and mid-sized oil producers with the ability to grow their volumes in the coming years. The Fund also exhibited a preference for low-cost natural gas producers and coal producers, a segment which could be among the last to move up on firming market conditions, but could also have the largest upward move. |
| — | | With energy stocks implying prices of $80 per barrel for crude oil and $2 per ton for coal margins as of period end, Fund management believes the sector is poised to rally from its oversold/under-owned conditions. While the timing of such a rebound remains uncertain given macroeconomic headwinds, Fund management believes the energy sector offers compelling value. |
The views expressed reflect the opinions of BlackRock as of the date of this report and are subject to change based on changes in market, economic or other conditions. These views are not intended to be a forecast of future events and are no guarantee of future results.
| | | | | |
| Ten Largest Holdings | | Percent of
Long-Term
Investments |
Plains Exploration & Production Co. | | | | 6 | % |
CONSOL Energy, Inc. | | | | 5 | |
Alpha Natural Resources, Inc. | | | | 5 | |
Energy XXI Bermuda Ltd. | | | | 4 | |
Range Resources Corp. | | | | 4 | |
Clayton Williams Energy, Inc. | | | | 4 | |
Pioneer Natural Resources Co. | | | | 4 | |
EQT Corp. | | | | 4 | |
Weatherford International Ltd. | | | | 3 | |
Peabody Energy Corp. | | | | 3 | |
| | | | | |
| Industry Allocation | | Percent of
Long-Term
Investments |
Oil, Gas & Consumable Fuels | | | | 80 | % |
Energy Equipment & Services | | | | 13 | |
Metals & Mining | | | | 7 | |
For Fund compliance purposes, the Fund’s industry classifications refer to any one or more of the industry sub-classifications used by one or more widely recognized market indexes or ratings group indexes, and/or as defined by Fund management. These definitions may not apply for purposes of this report, which may combine industry sub-classifications for reporting ease.
| | | | | | |
| | | | | | | |
| 8 | | BLACKROCK FUNDS | | MARCH 31, 2012 | | |
| | |
| | |
| | BlackRock Energy & Resources Portfolio |
|
| Total Return Based on a $10,000 Investment |
| | 1 | Assuming maximum sales charges, if any, transaction costs and other operating expenses, including investment advisory fees. Institutional Shares do not have a sales charge. |
| | 2 | Under normal market conditions, the Fund invests at least 80% of its total assets in equity securities of global energy and natural resources companies and companies in associated businesses, as well as utilities (such as gas, water, cable, electrical and telecommunications utilities). |
| | 3 | This unmanaged index covers 500 industrial, utility, transportation and financial companies of the US markets (mostly NYSE issues) representing about 75% of NYSE market capitalization and 30% of NYSE issues. |
| | 4 | The Wilshire 5000 Modified Energy Equal Weighted Index is a customized index comprised of the energy sector constituents of the Wilshire 5000 (Full Cap) Index which have been equally weighted and the six largest securities and all securities that have a percentage market value below 0.01% have been removed. |
|
| Performance Summary for the Period Ended March 31, 2012 |
| | | | | | | | | | | | | | | | | | | | | | | | | | | | | | | | | | | |
| | | | | Average Annual Total Returns5 |
| | | | | 1 Year | | 5 Years | | 10 Years |
| | | 6-Month
Total Returns | | w/o sales charge | | w/sales charge | | w/o sales charge | | w/sales charge | | w/o sales charge | | w/sales charge |
Institutional | | | | 21.99 | % | | | | (23.81 | )% | | | | N/A | | | | | 3.14 | % | | | | N/A | | | | | 15.99 | % | | | | N/A | |
Investor A | | | | 21.79 | | | | | (24.06 | ) | | | | (28.04 | )% | | | | 2.80 | | | | | 1.69 | % | | | | 15.60 | | | | | 14.98 | % |
Investor B | | | | 21.36 | | | | | (24.63 | ) | | | | (27.88 | ) | | | | 2.02 | | | | | 1.82 | | | | | 14.93 | | | | | 14.93 | |
Investor C | | | | 21.32 | | | | | (24.61 | ) | | | | (25.33 | ) | | | | 2.06 | | | | | 2.06 | | | | | 14.78 | | | | | 14.78 | |
S&P 500® Index | | | | 25.89 | | | | | 8.54 | | | | | N/A | | | | | 2.01 | | | | | N/A | | | | | 4.12 | | | | | N/A | |
Wilshire 5000 Modified Energy Equal Weighted Index | | | | 24.83 | | | | | (13.29 | ) | | | | N/A | | | | | 6.63 | | | | | N/A | | | | | 16.11 | | | | | N/A | |
| | 5 | Assuming maximum sales charges, if any. Average annual total returns with and without sales charges reflect reductions for distribution and service fees. See “About Fund Performance” on page 12 for a detailed description of share classes, including any related sales charges and fees. |
| | | N/A - Not applicable as share class and index do not have a sales charge. |
| | Past performance is not indicative of future results. |
| | | | | | | | | | | | | | | | | | | | | | | | | | | | | | | | | | | |
| | | Actual | | Hypothetical7 | | |
| | | Beginning
Account Value
October 1, 2011 | | Ending
Account Value
March 31, 2012 | | Expenses Paid During the Period6 | | Beginning Account Value
October 1, 2011 | | Ending Account Value
March 31, 2012 | | Expenses Paid
During the Period6 | | Annualized Expense Ratio |
Institutional | | | $ | 1,000.00 | | | | $ | 1,219.90 | | | | $ | 5.49 | | | | $ | 1,000.00 | | | | $ | 1,020.05 | | | | $ | 5.00 | | | | | 0.99 | % |
Investor A | | | $ | 1,000.00 | | | | $ | 1,217.90 | | | | $ | 7.49 | | | | $ | 1,000.00 | | | | $ | 1,018.25 | | | | $ | 6.81 | | | | | 1.35 | % |
Investor B | | | $ | 1,000.00 | | | | $ | 1,213.60 | | | | $ | 11.62 | | | | $ | 1,000.00 | | | | $ | 1,014.50 | | | | $ | 10.58 | | | | | 2.10 | % |
Investor C | | | $ | 1,000.00 | | | | $ | 1,213.20 | | | | $ | 11.40 | | | | $ | 1,000.00 | | | | $ | 1,014.70 | | | | $ | 10.38 | | | | | 2.06 | % |
| | 6 | For each class of the Fund, expenses are equal to the annualized expense ratio for the class, multiplied by the average account value over the period, multiplied by 183/366 (to reflect the one-half year period shown). |
| | 7 | Hypothetical 5% annual return before expenses is calculated by pro rating the number of days in the most recent fiscal half year divided by 366. |
| | | See “Disclosure of Expenses” on page 13 for further information on how expenses were calculated. |
| | | | | | |
| | | | | | | |
| | BLACKROCK FUNDS | | MARCH 31, 2012 | | 9 |
| | |
| | |
Fund Summary as of March 31, 2012 | | BlackRock World Gold Fund |
|
| Investment Objective |
BlackRock World Gold Fund’s (the “Fund”) investment objective is to seek to maximize total return. Total return means the combination of capital appreciation and investment income. |
| Portfolio Management Commentary |
| | How did the Fund perform? |
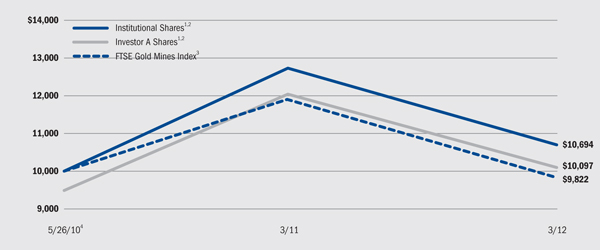
| — | | For the six-month period ended March 31, 2012, the Fund outperformed its benchmark, the FTSE Gold Mines Index. |
| | What factors influenced performance? |
| — | | The Fund’s exposure to several small-to-mid-cap gold companies with a focus on development projects contributed to performance during the six-month period, with investments in European Goldfields Ltd., Banro Corp. and B2Gold Corp. performing particularly well. Shares of European Goldfields Ltd. moved higher following the company’s acquisition by Eldorado Gold Corp. in the fourth quarter 2011. Banro Corp., a developer operating in the Democratic Republic of the Congo, announced a positive operations update for its Twangiza open-pit gold mine, reassuring investors that its production increase is on schedule. B2Gold Corp. continued to deliver on production guidance while keeping its operating costs low. The Fund’s allocation to non-gold holdings also aided performance. Silver producers were among the strongest of these, as they benefited from a 75% rise in the average silver price in 2011 relative to the average price in 2010. |
| — | | Detracting from relative performance was the Fund’s holding of Kinross Gold Corp., a North American-listed gold producer. During the period, Kinross Gold Corp. reported that the development of its Tasiast mine in Mauritania was facing some delays and wrote down $2.9 billion in goodwill against this asset. |
| — | | The Fund’s broad underweight to the major large-cap gold producers was a source of negative performance in the fourth quarter of 2011, as these stocks broadly held up better than their mid-tier counterparts in the risk-averse environment. |
| | Describe recent portfolio activity. |
| — | | The Fund added to its position in Eldorado Gold Corp. in early 2012, after the stock sold off due to its acquisition of European Goldfields Ltd. Eldorado Gold Corp. stock has been trading on a lower valuation, presenting an attractive buying opportunity. The Fund initiated a new position in Canadian-listed stock Osisko Mining Corp., which recently worked to resolve issues at its flagship Malartic mine. The outlook for Osisko Mining Corp. is positive given increased production and lower operational risk at the Malartic mine. The Fund sold its entire position in small-cap gold producer Guyana Goldfields, Inc. due to uncertainty about its feasibility study. |
| | Describe portfolio positioning at period end. |
| — | | At period end, the Fund had 84% of its portfolio invested in gold companies, 12% in silver companies and 3% in platinum names, with the remaining assets allocated to other metals and minerals and cash. |
The views expressed reflect the opinions of BlackRock as of the date of this report and are subject to change based on changes in market, economic or other conditions. These views are not intended to be a forecast of future events and are no guarantee of future results.
| | | | | |
| Ten Largest Holdings | | Percent of
Long-Term
Investments |
Newcrest Mining Ltd. | | | | 9 | % |
Goldcorp, Inc. | | | | 9 | |
Eldorado Gold Corp. | | | | 6 | |
Fresnillo Plc. | | | | 6 | |
Kinross Gold Corp. | | | | 5 | |
Yamana Gold, Inc. | | | | 5 | |
Randgold Resources Ltd. - ADR | | | | 5 | |
Industrias Penoles SAB de CV | | | | 4 | |
Barrick Gold Corp. | | | | 3 | |
Alamos Gold, Inc. | | | | 3 | |
| | | | | |
| Geographic Allocation | | Percent of
Long-Term
Investments |
Canada | | | | 49 | % |
Australia | | | | 15 | |
Mexico | | | | 9 | |
South Africa | | | | 7 | |
Jersey, Channel Islands | | | | 6 | |
United States | | | | 5 | |
Peru | | | | 5 | |
United Kingdom | | | | 4 | |
| | | | | | |
| | | | | | | |
| 10 | | BLACKROCK FUNDS | | MARCH 31, 2012 | | |
| | |
| | |
| | BlackRock World Gold Fund |
|
| Total Return Based on a $10,000 Investment |
| | 1 | Assuming maximum sales charges, if any, transaction costs and other operating expenses, including investment advisory fees. Institutional Shares do not have a sales charge. |
| | 2 | Under normal circumstances, the Fund will invest at least 80% of its net assets, plus any borrowings for investment purposes, in equity securities of gold-related companies. |
| | 3 | An index designed to reflect the performance of the worldwide market in the shares of companies whose principal activity is the mining of gold. |
| | 4 | Commencement of operations. |
|
| Performance Summary for the Period Ended March 31, 2012 |
| | | | | | | | | | | | | | | | | | | | | | | | | | | | | | | | |
| | | | | | | Average Annual Total Returns5 |
| | | | | | | 1 Year | | | | Since Inception6 |
| | | 6-Month
Total Returns | | | | w/o sales charge | | w/sales charge | | | | w/o sales charge | | w/sales charge |
Institutional | | | | (6.06 | )% | | | | | | (16.02 | )% | | | | N/A | | | | | | | 3.70 | % | | | | N/A | |
Investor A | | | | (6.13 | ) | | | | | | (16.17 | ) | | | | (20.58 | )% | | | | | | 3.48 | | | | | 0.52 | % |
Investor C | | | | (6.55 | ) | | | | | | (16.90 | ) | | | | (17.73 | ) | | | | | | 2.65 | | | | | 2.65 | |
FTSE Gold Mines Index | | | | (11.65 | ) | | | | | | (17.46 | ) | | | | N/A | | | | | | | (0.97 | ) | | | | N/A | |
| | 5 | Assuming maximum sales charges, if any. Average annual total returns with and without sales charges reflect reductions for distribution and service fees. See “About Fund Performance” on page 12 for a detailed description of share classes, including any related sales charges and fees. |
| | 6 | The Fund commenced operations on May 26, 2010. |
| | | N/A - Not applicable as share class and index do not have a sales charge. |
| | | Past performance is not indicative of future results. |
| | | | | | | | | | | | | | | | | | | | | | | | | | | | | | | | | | | |
| | | Actual | | Hypothetical8 | | |
| | | Beginning
Account Value
October 1, 2011 | | Ending
Account Value March 31, 2012 | | Expenses Paid
During the Period7 | | Beginning
Account Value
October 1, 2011 | | Ending
Account Value
March 31, 2012 | | Expenses Paid
During the Period7 | | Annualized Expense Ratio |
Institutional | | | $ | 1,000.00 | | | | $ | 939.40 | | | | $ | 6.01 | | | | $ | 1,000.00 | | | | $ | 1,018.80 | | | | $ | 6.26 | | | | | 1.24 | % |
Investor A | | | $ | 1,000.00 | | | | $ | 938.70 | | | | $ | 7.22 | | | | $ | 1,000.00 | | | | $ | 1,017.55 | | | | $ | 7.52 | | | | | 1.49 | % |
Investor C | | | $ | 1,000.00 | | | | $ | 934.50 | | | | $ | 10.98 | | | | $ | 1,000.00 | | | | $ | 1,013.65 | | | | $ | 11.43 | | | | | 2.27 | % |
| | 7 | For each class of the Fund, expenses are equal to the annualized expense ratio for the class, multiplied by the average account value over the period, multiplied by 183/366 (to reflect the one-half year period shown). |
| | 8 | Hypothetical 5% annual return before expenses is calculated by pro rating the number of days in the most recent fiscal period divided by 366. |
| | | See “Disclosure of Expenses” on page 13 for further information on how expenses were calculated. |
| | | | | | |
| | | | | | | |
| | BLACKROCK FUNDS | | MARCH 31, 2012 | | 11 |
| — | | Institutional Shares are not subject to any sales charge. Institutional Shares bear no ongoing distribution or service fees and are available only to eligible investors. |
| — | | Service Shares are not subject to any sales charge (front-end load) or deferred sales charge. Service Shares are subject to a service fee of 0.25% per year (but no distribution fee). |
| — | | Investor A Shares incur a maximum initial sales charge (front-end load) of 5.25% and a service fee of 0.25% per year (but no distribution fee). |
| — | | Investor B Shares are subject to a maximum contingent deferred sales charge (“CDSC”) of 4.50% declining to 0% after six years. In addition, Investor B Shares are subject to a distribution fee of 0.75% per year and a service fee of 0.25% per year. Investor B Shares automatically convert to Investor A Shares after approximately eight years. (There is no initial sales charge for automatic share conversions.) All returns for periods greater than eight years reflect this conversion. Investor B Shares are only available through exchanges, dividend reinvestment by existing shareholders or for purchase by certain qualified employee benefit plans. |
| — | | Investor C Shares are subject to a 1.00% CDSC if redeemed within one year of purchase. In addition, Investor C Shares are subject to a distribution fee of 0.75% per year and a service fee of 0.25% per year. |
| | Performance information reflects past performance and does not guarantee future results. Current performance may be lower or higher than the |
| | performance data quoted. Refer to www.blackrock.com/funds to obtain performance data current to the most recent month-end. Performance results do not reflect the deduction of taxes that a shareholder would pay on Fund distributions or the redemption of Fund shares. Figures shown in each of the performance tables on the previous pages assume reinvestment of all dividends and distributions, if any, at net asset value (“NAV”) on the ex-dividend date. Investment return and principal value of shares will fluctuate so that shares, when redeemed, may be worth more or less than their original cost. | |
| | Performance for the BlackRock Energy & Resources Portfolio for the periods prior to January 31, 2005 is based on performance of a certain former State Street Research mutual fund that reorganized with BlackRock Energy & Resources Portfolio on that date. |
| | The Funds’ investment advisor, BlackRock Advisors, LLC (the “Manager”), waived and/or reimbursed a portion of each Fund’s expenses. Without such waiver and/or reimbursement, a Fund’s performance would have been lower. The Manager is under no obligation to waive or reimburse or to continue waiving or reimbursing its fees after the applicable termination date. See Note 3 of the Notes to Financial Statements for additional information on waivers and reimbursements. Dividends paid to each class of shares will vary because of the different levels of service, distribution and transfer agency fees applicable to each class, which are deducted from the income available to be paid to shareholders. |
| | | | | | |
| | | | | | | |
| 12 | | BLACKROCK FUNDS | | MARCH 31, 2012 | | |
Shareholders of the Funds may incur the following charges: (a) expenses related to transactions, including sales charges and exchange fees; and (b) operating expenses, including investment advisory fees, service and distribution fees, including 12b-1 fees, acquired fund fees and expenses and other Fund expenses. The expense examples on the previous pages (which are based on a hypothetical investment of $1,000 invested on October 1, 2011 and held through March 31, 2012) are intended to assist shareholders both in calculating expenses based on an investment in the Funds and in comparing these expenses with similar costs of investing in other mutual funds.
The tables provide information about actual account values and actual expenses. In order to estimate the expenses a shareholder paid during the period covered by this report, shareholders can divide their account value by $1,000 and then multiply the result by the number corresponding to their Fund and share class under the headings entitled “Expenses Paid During the Period.”
The tables also provide information about hypothetical account values and hypothetical expenses based on a Fund’s actual expense ratio and an assumed rate of return of 5% per year before expenses. In order to assist shareholders in comparing the ongoing expenses of investing in these Funds and other funds, compare the 5% hypothetical example with the 5% hypothetical examples that appear in other funds’ shareholder reports.
The expenses shown in the tables are intended to highlight shareholders’ ongoing costs only and do not reflect any transactional expenses, such as sales charges or exchange fees, if any. Therefore, the hypothetical examples are useful in comparing ongoing expenses only, and will not help shareholders determine the relative total expenses of owning different funds. If these transactional expenses were included, shareholder expenses would have been higher.
Derivative Financial Instruments
The Funds may invest in various derivative financial instruments, including foreign currency exchange contracts as specified in Note 2 of the Notes to Financial Statements, which may constitute forms of economic leverage. Such derivative financial instruments are used to obtain exposure to a market without owning or taking physical custody of securities or to hedge market and/or foreign currency exchange rate risks. Derivative financial instruments involve risks, including the imperfect correlation between the value of a derivative financial instrument and the underlying asset, possible default of the counterparty to the transaction or illiquidity of the derivative financial instrument. The Funds’
ability to use a derivative financial instrument successfully depends on the investment advisor’s ability to predict pertinent market movements accurately, which cannot be assured. The use of derivative financial instruments may result in losses greater than if they had not been used, may require a Fund to sell or purchase portfolio investments at inopportune times or for distressed values, may limit the amount of appreciation a Fund can realize on an investment, may result in lower dividends paid to shareholders or may cause a Fund to hold an investment that it might otherwise sell. The Funds’ investments in these instruments are discussed in detail in the Notes to Financial Statements.
| | | | | | |
| | | | | | | |
| | BLACKROCK FUNDS | | MARCH 31, 2012 | | 13 |
| | |
| | |
Schedule of Investments March 31, 2012 (Unaudited) | | BlackRock All-Cap Energy & Resources Portfolio (Percentages shown are based on Net Assets) |
| | | | | | | | |
| Common Stocks | | Shares | | | Value | |
Chemicals – 1.6% | | | | | |
Potash Corp. of Saskatchewan, Inc. | | | 259,000 | | | $ | 11,833,710 | |
| |
Energy Equipment & Services – 15.1% | | | | | |
Atwood Oceanics, Inc. (a) | | | 93,100 | | | | 4,179,259 | |
Basic Energy Services, Inc. (a) | | | 182,300 | | | | 3,162,905 | |
Calfrac Well Services Ltd. | | | 53,400 | | | | 1,493,669 | |
Core Laboratories NV | | | 208,600 | | | | 27,445,502 | |
Halliburton Co. | | | 221,100 | | | | 7,338,309 | |
Key Energy Services, Inc. (a)(b) | | | 898,600 | | | | 13,883,370 | |
National Oilwell Varco, Inc. | | | 145,000 | | | | 11,523,150 | |
Patterson-UTI Energy, Inc. | | | 482,133 | | | | 8,336,080 | |
Schlumberger Ltd. | | | 148,641 | | | | 10,394,465 | |
Seadrill Ltd. | | | 322,200 | | | | 12,098,602 | |
Technip SA | | | 80,900 | | | | 9,553,110 | |
Trican Well Service Ltd. | | | 435,600 | | | | 6,397,854 | |
| | | | | | | | |
| | | | | | | 115,806,275 | |
| |
Metals & Mining – 8.8% | | | | | |
Eldorado Gold Corp. | | | 692,020 | | | | 9,504,911 | |
Goldcorp, Inc. | | | 524,652 | | | | 23,640,819 | |
Silver Wheaton Corp. | | | 1,022,124 | | | | 33,934,517 | |
| | | | | | | | |
| | | | | | | 67,080,247 | |
| |
Oil, Gas & Consumable Fuels – 72.7% | | | | | |
Alpha Natural Resources, Inc. (a) | | | 1,178,219 | | | | 17,920,711 | |
Anadarko Petroleum Corp. | | | 143,900 | | | | 11,273,126 | |
Angle Energy, Inc. (a) | | | 575,400 | | | | 3,253,552 | |
Apache Corp. | | | 255,630 | | | | 25,675,477 | |
Bill Barrett Corp. (a) | | | 325,800 | | | | 8,474,058 | |
Bonanza Creek Energy, Inc. (a)(b) | | | 367,900 | | | | 8,038,615 | |
Cenovus Energy, Inc. | | | 368,260 | | | | 13,235,264 | |
Cheniere Energy, Inc. (a) | | | 554,600 | | | | 8,307,908 | |
Chesapeake Energy Corp. | | | 644,400 | | | | 14,930,748 | |
Chevron Corp. | | | 215,000 | | | | 23,056,600 | |
Concho Resources, Inc. (a) | | | 70,200 | | | | 7,166,016 | |
CONSOL Energy, Inc. | | | 699,830 | | | | 23,864,203 | |
Continental Resources, Inc. (a)(b) | | | 156,400 | | | | 13,422,248 | |
Crescent Point Energy Corp. | | | 449,370 | | | | 19,345,278 | |
Crew Energy, Inc. (a) | | | 436,300 | | | | 4,164,195 | |
Denbury Resources, Inc. (a) | | | 1,034,690 | | | | 18,862,399 | |
Energy XXI Bermuda Ltd. (a) | | | 413,800 | | | | 14,942,318 | |
EOG Resources, Inc. | | | 276,370 | | | | 30,704,707 | |
EQT Corp. | | | 155,110 | | | | 7,477,853 | |
Exxon Mobil Corp. | | | 133,400 | | | | 11,569,782 | |
Gasco Energy, Inc. (a) | | | 1,528,300 | | | | 408,362 | |
Guide Exploration Ltd., Class A (a) | | | 781,394 | | | | 1,723,462 | |
Hess Corp. | | | 154,270 | | | | 9,094,217 | |
Hugoton Royalty Trust | | | 1 | | | | 15 | |
James River Coal Co. (a)(b) | | | 493,800 | | | | 2,528,256 | |
| | | | | | | | |
| Common Stocks | | Shares | | | Value | |
Oil, Gas & Consumable Fuels (concluded) | | | | | |
Kodiak Oil & Gas Corp. (a)(b) | | | 853,600 | | | $ | 8,501,856 | |
Kosmos Energy Ltd. (a) | | | 312,000 | | | | 4,130,880 | |
Noble Energy, Inc. | | | 210,700 | | | | 20,602,246 | |
Occidental Petroleum Corp. | | | 312,050 | | | | 29,716,521 | |
OGX Petroleo e Gas Participacoes SA (a) | | | 1,190,900 | | | | 9,864,093 | |
Patriot Coal Corp. (a)(b) | | | 447,816 | | | | 2,794,372 | |
Peabody Energy Corp. | | | 496,390 | | | | 14,375,454 | |
PetroBakken Energy Ltd., Class A | | | 108,842 | | | | 1,812,487 | |
PetroChina Co. Ltd. - ADR | | | 37,790 | | | | 5,310,629 | |
Pioneer Natural Resources Co. | | | 110,800 | | | | 12,364,172 | |
Plains Exploration & Production Co. (a) | | | 494,010 | | | | 21,069,527 | |
Range Resources Corp. | | | 254,700 | | | | 14,808,258 | |
Rex Energy Corp. (a)(b) | | | 425,400 | | | | 4,543,272 | |
Rosetta Resources, Inc. (a)(b) | | | 231,200 | | | | 11,273,312 | |
Royal Dutch Shell Plc - ADR | | | 187,800 | | | | 13,170,414 | |
Southwestern Energy Co. (a) | | | 168,400 | | | | 5,153,040 | |
Statoil ASA | | | 427,022 | | | | 11,590,282 | |
StatoilHydro ASA - ADR | | | 180,240 | | | | 4,886,306 | |
Suncor Energy, Inc. | | | 416,180 | | | | 13,609,086 | |
Total SA - ADR | | | 217,300 | | | | 11,108,376 | |
Whiting Petroleum Corp. (a) | | | 672,160 | | | | 36,498,288 | |
| | | | | | | | |
| | | | | | | 556,622,241 | |
| |
Total Long-Term Investments (Cost – $641,082,030) – 98.2% | | | | 751,342,473 | |
| |
| | | | | |
| |
| | | | | |
| Short-Term Securities | | | | | | |
BlackRock Liquidity Funds, TempFund, Institutional Class, 0.14% (c)(d) | | | 8,924,473 | | | | 8,924,473 | |
| |
| | | Beneficial Interest (000) | | | | |
BlackRock Liquidity Series, LLC Money Market Series, 0.24% (c)(d)(e) | | $ | 27,397 | | | | 27,396,922 | |
| |
Total Short-Term Securities (Cost – $36,321,395) – 4.7% | | | | 36,321,395 | |
| |
Total Investments (Cost – $677,403,425) – 102.9% | | | | 787,663,868 | |
Liabilities in Excess of Other Assets – (2.9)% | | | | (22,345,875 | ) |
| | | | | | | | |
Net Assets – 100.0% | | | $ | 765,317,993 | |
| | | | | | | | |
| | | | | |
| |
| (a) | Non-income producing security. |
| (b) | Security, or a portion of security, is on loan. |
To simplify the listings of portfolio holdings in the Schedules of Investments, the names and descriptions of many of the securities have been abbreviated according to the following list:
| | |
| ADR | | American Depositary Receipts |
| CAD | | Canadian Dollar |
| MXN | | Mexican Peso |
| USD | | US Dollar |
See Notes to Financial Statements.
| | | | | | |
| | | | | | | |
| 14 | | BLACKROCK FUNDS | | MARCH 31, 2012 | | |
| | |
| | |
Schedule of Investments (concluded) | | BlackRock All-Cap Energy & Resources Portfolio |
| (c) | Investments in companies considered to be an affiliate of the Fund during the period, for purposes of Section 2(a)(3) of the Investment Company Act of 1940, as amended, were as follows: |
| | | | | | | | | | | | | | | | |
| Affiliate | | Shares/ Beneficial Interest Held at September 30,
2011 | | | Net Activity | | | Shares/ Beneficial Interest Held at March 31, 2012 | | | Income | |
BlackRock Liquidity Funds, TempFund, Institutional Class | | | 35,736,782 | | | | (26,812,309 | ) | | | 8,924,473 | | | $ | 8,572 | |
BlackRock Liquidity Series, LLC Money Market Series | | $ | 7,413,123 | | | $ | 19,983,799 | | | $ | 27,396,922 | | | $ | 41,208 | |
| (d) | Represents the current yield as of report date. |
| (e) | Security was purchased with the cash collateral from loaned securities. |
| — | | For Fund compliance purposes, the Fund’s industry classifications refer to any one or more of the industry sub-classifications used by one or more widely recognized market indexes or ratings group indexes, and/or as defined by Fund management. These definitions may not apply for purposes of this report, which may combine industry sub-classifications for reporting ease. |
| — | | Fair Value Measurements — Various inputs are used in determining the fair value of investments. These inputs are categorized into a disclosure hierarchy consisting of three broad levels for financial statement purposes as follows: |
| | — | | Level 1 – unadjusted price quotations in active markets/exchanges for identical assets and liabilities |
| | — | | Level 2 – other observable inputs (including, but not limited to: quoted prices for similar assets or liabilities in markets that are active, quoted prices for identical or similar assets or liabilities in markets that are not active, inputs other than quoted prices that are observable for the assets or liabilities (such as interest rates, yield curves, volatilities, prepayment speeds, loss severities, credit risks and default rates) or other market–corroborated inputs) |
| | — | | Level 3 – unobservable inputs based on the best information available in the circumstances, to the extent observable inputs are not available (including the Fund’s own assumptions used in determining the fair value of investments) |
Changes in valuation techniques may result in transfers into or out of an assigned level within the disclosure hierarchy. The categorization of a value determined for investments is based on the pricing transparency of the investment and is not necessarily an indication of the risks associated with investing in those securities. For information about the Fund’s policy regarding valuation of investments and other significant accounting policies, please refer to Note 1 of the Notes to Financial Statements.
The following table summarizes the inputs used as of March 31, 2012 in determining the fair valuation of the Fund’s investments:
| | | | | | | | | | | | | | |
| Valuation Inputs | | Level 1 | | | Level 2 | | | Level 3 | | Total | |
Assets: | | | | | | | | | | | | | | |
Investments: | | | | | | | | | | | | | | |
Long-Term Investments: | | | | | | | | | | | | | | |
Common Stocks: | | | | | | | | | | | | | | |
Chemicals | | $ | 11,833,710 | | | | – | | | – | | $ | 11,833,710 | |
Energy Equipment & Services | | | 94,154,563 | | | $ | 21,651,712 | | | – | | | 115,806,275 | |
Metals & Mining. | | | 67,080,247 | | | | – | | | – | | | 67,080,247 | |
Oil, Gas & Consumable Fuels | | | 545,031,959 | | | | 11,590,282 | | | – | | | 556,622,241 | |
Short-Term Securities | | | 8,924,473 | | | | 27,396,922 | | | – | | | 36,321,395 | |
| | | | | | | | | | | | | | |
Total | | $ | 727,024,952 | | | $ | 60,638,916 | | | – | | $ | 787,663,868 | |
See Notes to Financial Statements.
| | | | | | |
| | | | | | | |
| | BLACKROCK FUNDS | | MARCH 31, 2012 | | 15 |
| | |
| | |
Schedule of Investments March 31, 2012 (Unaudited) | | BlackRock China Fund (Percentages shown are based on Net Assets) |
| | | | | | | | |
| Common Stocks | | Shares | | | Value | |
Aerospace & Defense – 0.6% | | | | | | | | |
AviChina Industry & Technology Co. Ltd., H Shares | | | 36,000 | | | $ | 16,504 | |
Automobiles – 1.6% | | | | | | | | |
Dongfeng Motor Group Co. Ltd., H Shares | | | 24,000 | | | | 43,330 | |
Chemicals – 2.4% | | | | | | | | |
Huabao International Holdings Ltd. | | | 99,000 | | | | 64,381 | |
Commercial Banks – 21.3% | | | | | | | | |
Bank of China Ltd., H Shares | | | 399,000 | | | | 160,822 | |
China CITIC Bank Corp. Ltd., H Shares | | | 111,200 | | | | 66,873 | |
China Construction Bank Corp., H Shares | | | 210,000 | | | | 162,255 | |
Industrial & Commercial Bank of China, H Shares | | | 276,000 | | | | 178,063 | |
| | | | | | | | |
| | | | | | | | 568,013 | |
Construction & Engineering – 2.4% | | | | | | | | |
China Communications Construction Co. Ltd., H Shares | | | 63,000 | | | | 63,198 | |
Construction Materials – 0.7% | | | | | | | | |
China Shanshui Cement Group Ltd. | | | 11,000 | | | | 8,683 | |
TCC International Holdings Ltd. | | | 28,000 | | | | 10,673 | |
| | | | | | | | |
| | | | | | | | 19,356 | |
Diversified Financial Services – 0.6% | | | | | | | | |
China Everbright Ltd. | | | 10,000 | | | | 15,169 | |
Diversified Telecommunication Services – 3.1% | | | | | |
China Unicom Hong Kong Ltd. | | | 48,000 | | | | 81,344 | |
Electrical Equipment – 3.1% | | | | | | | | |
Xinjiang Goldwind Science & Technology Co. Ltd., H Shares (a) | | | 22,410 | | | | 12,149 | |
Zhuzhou CSR Times Electric Co. Ltd., H Shares | | | 27,000 | | | | 68,982 | |
| | | | | | | | |
| | | | | | | | 81,131 | |
Electronic Equipment, Instruments & Components – 0.1% | |
China High Precision Automation Group Ltd. | | | 20,000 | | | | 3,065 | |
Food Products – 0.9% | | | | | | | | |
Uni-President China Holdings Ltd. | | | 34,000 | | | | 23,862 | |
Health Care Equipment & Supplies – 0.8% | | | | | | | | |
Mindray Medical International Ltd. - ADR | | | 674 | | | | 22,222 | |
Health Care Providers & Services – 1.6% | | | | | | | | |
Sinopharm Group Co., H Shares | | | 15,200 | | | | 42,475 | |
Hotels, Restaurants & Leisure – 1.0% | | | | | | | | |
REXLot Holdings Ltd. | | | 300,000 | | | | 26,656 | |
Independent Power Producers & Energy Traders – 2.7% | |
China Resources Power Holdings Co. Ltd. | | | 26,000 | | | | 48,146 | |
Datang International Power Generation Co. Ltd., H Shares | | | 66,000 | | | | 23,287 | |
| | | | | | | | |
| | | | | | | | 71,433 | |
Insurance – 6.0% | | | | | | | | |
AIA Group Ltd. | | | 7,600 | | | | 27,843 | |
China Life Insurance Co. Ltd., H Shares | | | 16,000 | | | | 41,517 | |
China Pacific Insurance Group Co. Ltd., H Shares | | | 24,800 | | | | 76,806 | |
New China Life Insurance Co. Ltd., H Shares | | | 3,312 | | | | 13,499 | |
| | | | | | | | |
| | | | | | | | 159,665 | |
Life Sciences Tools & Services – 2.0% | | | | | | | | |
WuXi PharmaTech Cayman, Inc. - ADR (a) | | | 3,737 | | | | 53,813 | |
| | | | | | | | |
| Common Stocks | | Shares | | | Value | |
Machinery – 1.3% | | | | | | | | |
China Rongsheng Heavy Industry Group Co. Ltd. | | | 67,000 | | | $ | 17,687 | |
CSR Corp. Ltd., H Shares | | | 21,000 | | | | 14,332 | |
Zoomlion Heavy Industry Science and Technology Co. Ltd., H Shares | | | 2,600 | | | | 3,462 | |
| | | | | | | | |
| | | | | | | | 35,481 | |
Marine – 0.8% | | | | | | | | |
China Shipping Development Co. Ltd., H Shares | | | 32,000 | | | | 22,170 | |
Metals & Mining – 2.5% | | | | | | | | |
Angang Steel Co. Ltd., H Shares | | | 26,000 | | | | 16,707 | |
Shougang Fushan Resources Group Ltd. | | | 76,000 | | | | 25,739 | |
Zijin Mining Group Co. Ltd., H Shares | | | 60,000 | | | | 23,797 | |
| | | | | | | | |
| | | | | | | | 66,243 | |
Multiline Retail – 0.3% | | | | | | | | |
PCD Stores Group Ltd. | | | 60,000 | | | | 8,499 | |
Oil, Gas & Consumable Fuels – 15.3% | | | | | | | | |
China Coal Energy Co., Ltd., H Shares | | | 52,000 | | | | 58,324 | |
China Petroleum & Chemical Corp., H Shares | | | 102,000 | | | | 111,122 | |
CNOOC Ltd. | | | 91,000 | | | | 187,026 | |
PetroChina Co. Ltd., H Shares | | | 36,000 | | | | 50,902 | |
| | | | | | | | |
| | | | | | | | 407,374 | |
Paper & Forest Products – 1.0% | | | | | | | | |
Lee & Man Paper Manufacturing Ltd. | | | 38,000 | | | | 17,714 | |
Shandong Chenming Paper Holdings Ltd., H Shares | | | 18,000 | | | | 8,484 | |
| | | | | | | | |
| | | | | | | | 26,198 | |
Real Estate Management & Development – 5.8% | |
China Vanke Co. Ltd., B Shares | | | 20,100 | | | | 23,839 | |
Franshion Properties China Ltd. | | | 104,000 | | | | 26,785 | |
Poly Hong Kong Investments Ltd. | | | 62,000 | | | | 28,822 | |
Shenzhen Investment Ltd. | | | 106,000 | | | | 23,069 | |
Shimao Property Holdings Ltd. | | | 27,500 | | | | 29,357 | |
Shui On Land Ltd. | | | 55,500 | | | | 22,441 | |
| | | | | | | | |
| | | | | | | | 154,313 | |
Semiconductors & Semiconductor Equipment – 0.7% | |
Trina Solar Ltd. - ADR (a) | | | 2,550 | | | | 18,181 | |
Software – 1.9% | | | | | | | | |
Kingdee International Software Group Co. Ltd. | | | 58,000 | | | | 13,967 | |
Kingsoft Corp. Ltd. | | | 26,000 | | | | 11,551 | |
Shanda Games Ltd. - ADR (a) | | | 4,900 | | | | 25,480 | |
| | | | | | | | |
| | | | | | | | 50,998 | |
Specialty Retail – 1.6% | | | | | | | | |
Esprit Holdings Ltd. | | | 3,100 | | | | 6,227 | |
GOME Electrical Appliances Holding Ltd. | | | 159,000 | | | | 32,965 | |
Pou Sheng International Holdings Ltd. (a) | | | 18,000 | | | | 2,272 | |
| | | | | | | | |
| | | | | | | | 41,464 | |
Textiles, Apparel & Luxury Goods – 1.8% | | | | | | | | |
Peak Sport Products Co. Ltd. | | | 58,000 | | | | 14,041 | |
Ports Design Ltd. | | | 22,500 | | | | 33,031 | |
| | | | | | | | |
| | | | | | | | 47,072 | |
Transportation Infrastructure – 1.9% | | | | | | | | |
Beijing Capital International Airport Co. Ltd., H Shares | | | 86,000 | | | | 49,725 | |
| | | | | | |
| See Notes to Financial Statements. | | | | |
| | | | | | | |
| 16 | | BLACKROCK FUNDS | | MARCH 31, 2012 | | |
| | |
| | |
Schedule of Investments (continued) | | BlackRock China Fund (Percentages shown are based on Net Assets) |
| | | | | | | | |
| Common Stocks | | Shares | | | Value | |
Wireless Telecommunication Services – 6.6% | | | | | | | | |
China Mobile Ltd. | | | 16,000 | | | $ | 176,060 | |
| |
Total Common Stocks – 92.4% | | | | 2,459,395 | |
| |
| | | | | | | | |
| |
Participation Notes | | | | | | | | |
Automobiles – 0.4% | | | | | | | | |
Deutsche Bank AG (BYD Co. Ltd.),
due 11/10/16 (a) | | | 3,500 | | | | 9,780 | |
| |
Commercial Banks – 0.8% | | | | | | | | |
Citibank, N.A. (Agricultural Bank of China Ltd.),
due 1/20/15 (a) | | | 52,700 | | | | 22,365 | |
Diversified Financial Services – 2.1% | | | | | | | | |
Morgan Stanley Capital Services, Inc. (China Minsheng Banking Corp. Ltd.), due 5/02/12 (a) | | | 48,500 | | | | 43,906 | |
Morgan Stanley Capital Services, Inc. (Evergrande Real Estate Group Ltd.), due 5/11/12 (a) | | | 22,000 | | | | 11,785 | |
| | | | | | | | |
| | | | | | | 55,691 | |
| |
Insurance – 0.3% | | | | | | | | |
Citibank, N.A. (China Life Insurance Co. Ltd.),
due 1/20/15 (a) | | | 3,400 | | | | 8,803 | |
Machinery – 0.6% | | | | | | | | |
Morgan Stanley Capital Services, Inc. (Zoomlion Heavy Industry Science and Technology Co. Ltd.), due 5/28/12 (a) | | | 11,000 | | | | 14,647 | |
Metals & Mining – 1.2% | | | | | | | | |
Citibank, N.A. (Baoshan Iron & Steel Co. Ltd.),
due 1/20/15 (a) | | | 28,700 | | | | 21,678 | |
Deutsche Bank AG (Baoshan Iron & Steel Co. Ltd.),
due 11/11/19 (a) | | | 6,600 | | | | 5,076 | |
UBS AG (Baoshan Iron & Steel Co. Ltd.),
due 6/18/13 (a) | | | 6,487 | | | | 4,900 | |
| | | | | | | | |
| | | | | | | 31,654 | |
| |
Total Participation Notes – 5.4% | | | | 142,940 | |
| |
Total Long-Term Investments
(Cost – $3,065,364) – 97.8% | | | | 2,602,335 | |
| | | | | |
| |
Short-Term Securities | | | | | | | | |
BlackRock Liquidity Funds, TempFund, Institutional Class, 0.14% (b)(c) | | | 10,559 | | | | 10,559 | |
| |
Total Short-Term Securities (Cost – $10,559) – 0.4% | | | | 10,559 | |
| |
Total Investments (Cost – $3,075,923) – 98.2% | | | | 2,612,894 | |
Other Assets Less Liabilities – 1.8% | | | | 47,747 | |
| | | | | | | | |
Net Assets – 100.0% | | | $ | 2,660,641 | |
| | | | | | | | |
| | | | | | | | |
| |
| (a) | Non-income producing security. |
| (b) | Investments in companies considered to be an affiliate of the Fund during the period, for purposes of Section 2(a)(3) of the Investment Company Act of 1940, as amended, were as follows: |
| | | | | | | | | | | | | | | | |
| Affiliate | | Shares Held at September 30, 2011 | | | Net Activity | | | Shares
Held at March 31, 2012 | | | Income | |
BlackRock Liquidity Funds, TempFund, Institutional Class | | | 77,730 | | | | (67,171 | ) | | | 10,559 | | | $ | 18 | |
| (c) | Represents the current yield as of report date. |
| — | | For Fund compliance purposes, the Fund’s industry classifications refer to any one or more of the industry sub classifications used by one or more widely recognized market indexes or ratings group indexes, and/or as defined by Fund management. These definitions may not apply for purposes of this report, which may combine industry sub-classifications for reporting ease. |
| — | | Fair Value Measurements – Various inputs are used in determining the fair value of investments. These inputs are categorized into a disclosure hierarchy consisting of three broad levels for financial statement purposes as follows: |
| | — | | Level 1 – unadjusted price quotations in active markets/exchanges for identical assets and liabilities |
| | — | | Level 2 – other observable inputs (including, but not limited to: quoted prices for similar assets or liabilities in markets that are active, quoted prices for identical or similar assets or liabilities in markets that are not active, inputs other than quoted prices that are observable for the assets or liabilities (such as interest rates, yield curves, volatilities, prepayment speeds, loss severities, credit risks and default rates) or other market–corroborated inputs) |
| | — | | Level 3 – unobservable inputs based on the best information available in the circumstances, to the extent observable inputs are not available (including the Fund’s own assumptions used in determining the fair value of investments) |
Changes in valuation techniques may result in transfers into or out of an assigned level within the disclosure hierarchy. The categorization of a value determined for investments is based on the pricing transparency of the investment and is not necessarily an indication of the risks associated with investing in those securities. For information about the Fund’s policy regarding valuation of investments and other significant accounting policies, please refer to Note 1 of the Notes to Financial Statements.
| | | | | | |
| See Notes to Financial Statements. | | | | |
| | | | | | | |
| | BLACKROCK FUNDS | | MARCH 31, 2012 | | 17 |
| | |
| | |
Schedule of Investments (concluded) | | BlackRock China Fund |
The following table summarizes the inputs used as of March 31, 2012 in determining the fair valuation of the Fund’s investments:
| | | | | | | | | | | | | | |
| Valuation Inputs | | Level 1 | | | Level 2 | | | Level 3 | | Total | |
Assets: | | | | | | | | | | | | | | |
Investments: | | | | | | | | | | | | | | |
Long-Term Investments: | | | | | | | | | | | | | | |
Common Stocks: | | | | | | | | | | | | | | |
Aerospace & Defense | | | – | | | $ | 16,504 | | | – | | $ | 16,504 | |
Automobiles | | | – | | | | 43,330 | | | – | | | 43,330 | |
Chemicals | | | – | | | | 64,381 | | | – | | | 64,381 | |
Commercial Banks | | | – | | | | 568,013 | | | – | | | 568,013 | |
Construction & Engineering | | | – | | | | 63,198 | | | – | | | 63,198 | |
Construction Materials | | | – | | | | 19,356 | | | – | | | 19,356 | |
Diversified Financial Services | | | – | | | | 15,169 | | | – | | | 15,169 | |
Diversified Telecommunication Services | | | – | | | | 81,344 | | | – | | | 81,344 | |
Electrical Equipment | | | – | | | | 81,131 | | | – | | | 81,131 | |
Electronic Equipment, Instruments & Components | | $ | 3,065 | | | | – | | | – | | | 3,065 | |
Food Products | | | – | | | | 23,862 | | | – | | | 23,862 | |
Health Care Equipment & Supplies | | | 22,222 | | | | – | | | – | | | 22,222 | |
Health Care Providers & Services | | | – | | | | 42,475 | | | – | | | 42,475 | |
Hotels, Restaurants & Leisure | | | – | | | | 26,656 | | | – | | | 26,656 | |
Independent Power Producers & Energy Traders | | | – | | | | 71,433 | | | – | | | 71,433 | |
Insurance | | | 13,499 | | | | 146,166 | | | – | | | 159,665 | |
Life Sciences Tools & Services | | | 53,813 | | | | – | | | – | | | 53,813 | |
Machinery | | | – | | | | 35,481 | | | – | | | 35,481 | |
Marine | | | – | | | | 22,170 | | | – | | | 22,170 | |
Metals & Mining | | | – | | | | 66,243 | | | – | | | 66,243 | |
Multiline Retail | | | – | | | | 8,499 | | | – | | | 8,499 | |
Oil, Gas & Consumable Fuels | | | – | | | | 407,374 | | | – | | | 407,374 | |
Paper & Forest Products | | | – | | | | 26,198 | | | – | | | 26,198 | |
Real Estate Management & Development | | | – | | | | 154,313 | | | – | | | 154,313 | |
Semiconductors & Semiconductor Equipment | | | 18,181 | | | | – | | | – | | | 18,181 | |
Software | | | 25,480 | | | | 25,518 | | | – | | | 50,998 | |
Specialty Retail | | | – | | | | 41,464 | | | – | | | 41,464 | |
| | | | | | | | | | | | | | |
| Valuation Inputs | | Level 1 | | | Level 2 | | | Level 3 | | Total | |
Textiles, Apparel & Luxury Goods | | $ | 33,031 | | | $ | 14,041 | | | – | | $ | 47,072 | |
Transportation Infrastructure | | | – | | | | 49,725 | | | – | | | 49,725 | |
Wireless Telecom- munication Services | | | – | | | | 176,060 | | | – | | | 176,060 | |
Participation Notes: | | | | | | | | | | | | | | |
Automobiles | | | 9,780 | | | | – | | | – | | | 9,780 | |
Commercial Banks | | | 22,365 | | | | – | | | – | | | 22,365 | |
Diversified Financial Services | | | 55,691 | | | | – | | | – | | | 55,691 | |
Insurance | | | 8,803 | | | | – | | | – | | | 8,803 | |
Machinery | | | 14,647 | | | | – | | | – | | | 14,647 | |
Metals & Mining | | | 31,654 | | | | – | | | – | | | 31,654 | |
Short-Term Securities | | | 10,559 | | | | – | | | – | | | 10,559 | |
| |
Total | | $ | 322,790 | | | $ | 2,290,104 | | | – | | $ | 2,612,894 | |
| | | | |
| | | | | | |
| See Notes to Financial Statements. | | | | |
| | | | | | | |
| 18 | | BLACKROCK FUNDS | | MARCH 31, 2012 | | |
| | |
| | |
Schedule of Investments March 31, 2012 (Unaudited) | | BlackRock Energy & Resources Portfolio (Percentages shown are based on Net Assets) |
| | | | | | | | |
| Common Stocks | | Shares | | | Value | |
Capital Markets – 0.1% | |
Treasure Island Royalty Trust (a) | | | 643,822 | | | $ | 824,092 | |
| |
Commercial Services & Supplies – 0.0% | |
Republic Resources, Inc. (a) | | | 28,750 | | | | – | |
| |
Diversified Financial Services – 0.0% | |
Sprott Resource Lending Corp. | | | 61,000 | | | | 99,684 | |
| |
Electrical Equipment – 0.0% | |
ITM Power Plc (a) | | | 525,200 | | | | 565,984 | |
| |
Electronic Equipment, Instruments & Components – 0.0% | |
Opsens, Inc. (a) | | | 2,175,000 | | | | 512,432 | |
| |
Energy Equipment & Services – 12.7% | | | | | |
Diamond Offshore Drilling, Inc. | | | 147,100 | | | | 9,818,925 | |
Essential Energy Services Ltd. (a) | | | 925,069 | | | | 2,170,195 | |
Gasfrac Energy Services, Inc. (a) | | | 211,900 | | | | 1,595,437 | |
Geokinetics, Inc. (a)(b) | | | 1,039,033 | | | | 1,828,698 | |
Halliburton Co. | | | 800,326 | | | | 26,562,820 | |
Lufkin Industries, Inc. | | | 112,368 | | | | 9,062,479 | |
McDermott International, Inc. (a) | | | 700,000 | | | | 8,967,000 | |
Parker Drilling Co. (a) | | | 884,700 | | | | 5,281,659 | |
Pioneer Drilling Co. (a) | | | 1,000,000 | | | | 8,800,000 | |
Poseidon Concepts Corp. | | | 42,481 | | | | 597,108 | |
Schlumberger Ltd. | | | 199,600 | | | | 13,958,028 | |
Strad Energy Services Ltd. | | | 242,100 | | | | 1,288,838 | |
Transocean Ltd. | | | 132,500 | | | | 7,247,750 | |
Wavefront Technology
Solutions, Inc. (a) | | | 710,000 | | | | 562,334 | |
Weatherford International Ltd. (a) | | | 2,686,496 | | | | 40,539,225 | |
Western Energy Services Corp. (a) | | | 591,860 | | | | 4,830,057 | |
Western Energy Services Corp. (Acquired 2/25/10, cost $3,752,521) (a)(c) | | | 1,000,000 | | | | 8,160,810 | |
Xtreme Coil Drilling Corp. (a) | | | 527,700 | | | | 1,655,924 | |
| | | | | | | | |
| | | | | | | 152,927,287 | |
| |
Machinery – 0.0% | | | | | | | | |
Railpower Technologies Corp. (a) | | | 360,600 | | | | – | |
| |
Metals & Mining – 6.9% | | | | | | | | |
Alexco Resource Corp. (a) | | | 967,683 | | | | 6,776,925 | |
Archipelago Resources Plc (a) | | | 2,247,400 | | | | 2,336,548 | |
Baja Mining Corp. (a) | | | 3,654,800 | | | | 3,517,578 | |
Balmoral Resources Ltd. (a) | | | 1,500,000 | | | | 1,188,030 | |
Banro Corp. (a) | | | 1,000,000 | | | | 4,631,811 | |
Brigus Gold Corp. (a) | | | 1,368,600 | | | | 1,042,795 | |
Crosshair Energy Corp. (a) | | | 139,900 | | | | 70,129 | |
Dalradian Resources, Inc. (a) | | | 1,000,900 | | | | 1,485,119 | |
Eastmain Resources, Inc. (a) | | | 3,700,000 | | | | 4,636,824 | |
Eldorado Gold Corp. | | | 168,965 | | | | 2,320,738 | |
Eurasian Minerals, Inc. (a) | | | 400,000 | | | | 922,352 | |
Explor Resources, Inc. (a) | | | 1,000,000 | | | | 215,550 | |
Freeport-McMoRan Copper & Gold, Inc. | | | 600,000 | | | | 22,824,000 | |
Goldcorp, Inc. | | | 4,600 | | | | 207,345 | |
Golden Predator Corp. (a) | | | 2,000,000 | | | | 1,223,119 | |
Helio Resource Corp. (a) | | | 3,000,000 | | | | 691,764 | |
Imperial Metals Corp. (a) | | | 120,924 | | | | 2,022,169 | |
Kilo Goldmines Ltd. (a) | | | 4,805,300 | | | | 963,517 | |
Kinross Gold Corp. | | | 111,175 | | | | 1,088,403 | |
Lake Shore Gold Corp. (a) | | | 1,294,602 | | | | 1,336,849 | |
MAG Silver Corp. (a) | | | 964,000 | | | | 9,761,291 | |
Minaurum Gold, Inc. (a) | | | 2,000,000 | | | | 521,329 | |
Nevsun Resources Ltd. | | | 554,800 | | | | 2,046,884 | |
Oromin Explorations Ltd. (a) | | | 1,850,000 | | | | 1,613,615 | |
Paramount Gold and Silver Corp. (a) | | | 219,437 | | | | 497,195 | |
| | | | |
| Common Stocks | | Shares | | Value |
| | | | | | | | |
Metals & Mining (concluded) | | | | | | | | |
Pilot Gold, Inc. (a) | | | 1,000,000 | | | $ | 1,814,627 | |
Probe Mines Ltd. (a) | | | 130,800 | | | | 177,031 | |
Renaissance Gold, Inc. (a) | | | 750,000 | | | | 654,168 | |
Romarco Minerals, Inc. (a) | | | 223,000 | | | | 221,334 | |
Sunridge Gold Corp. (a)(b) | | | 6,325,559 | | | | 2,917,196 | |
Virginia Mines, Inc. (a) | | | 216,350 | | | | 2,114,805 | |
West Kirkland Mining, Inc. (a) | | | 500,000 | | | | 416,061 | |
| | | | | | | | |
| | | | | | | 82,257,101 | |
| |
Oil, Gas & Consumable Fuels – 80.9% | | | | | | | | |
Alpha Natural Resources, Inc. (a) | | | 3,516,189 | | | | 53,481,235 | |
Americas Petrogas, Inc. (a) | | | 2,655,000 | | | | 9,475,964 | |
Angle Energy, Inc. (a) | | | 1,505,800 | | | | 8,514,424 | |
Antares Energy Ltd. (Acquired 6/14/10, cost $5,189,100) (a)(c) | | | 10,000,000 | | | | 5,179,255 | |
Arch Coal, Inc. | | | 1,828,800 | | | | 19,586,448 | |
Arsenal Energy, Inc. (a) | | | 2,572,000 | | | | 1,701,860 | |
Atlas Energy LP | | | 2 | | | | 66 | |
ATP Oil & Gas Corp. (a) | | | 268,800 | | | | 1,975,680 | |
Aurora Oil & Gas Ltd. (a) | | | 1,148,400 | | | | 4,547,777 | |
Baytex Energy Corp. | | | 169,948 | | | | 8,824,108 | |
Bellatrix Exploration Ltd. (a) | | | 1,040,732 | | | | 5,488,245 | |
Bonanza Creek Energy, Inc. (a) | | | 202,300 | | | | 4,420,255 | |
BPZ Resources, Inc. (a) | | | 1,499,600 | | | | 6,043,388 | |
Cabot Oil & Gas Corp. | | | 234,400 | | | | 7,306,248 | |
Carrizo Oil & Gas, Inc. (a) | | | 400,400 | | | | 11,315,304 | |
Cequence Energy Ltd. (a) | | | 57,000 | | | | 75,432 | |
Cheniere Energy, Inc. (a) | | | 1,534,800 | | | | 22,991,304 | |
Chesapeake Energy Corp. | | | 550,000 | | | | 12,743,500 | |
Clayton Williams Energy, Inc. (a) | | | 599,421 | | | | 47,618,004 | |
Coastal Energy Co. (a) | | | 1,303,500 | | | | 20,399,654 | |
Cobalt International Energy, Inc. (a) | | | 738,187 | | | | 22,167,756 | |
Compton Petroleum Corp. (Acquired 9/24/04, cost $727,951) (a)(c) | | | 521 | | | | 2,074 | |
Comstock Resources, Inc. (a) | | | 203,300 | | | | 3,218,239 | |
CONSOL Energy, Inc. | | | 1,725,000 | | | | 58,822,500 | |
Crew Energy, Inc. (a) | | | 1,380,537 | | | | 13,176,313 | |
Crew Energy, Inc. (Acquired 6/24/98 through 10/09/98,
cost $183,115) (a)(c) | | | 191,300 | | | | 1,825,831 | |
Crocotta Energy, Inc. (a) | | | 2,182,400 | | | | 6,038,823 | |
DeeThree Exploration Ltd. (a) | | | 979,300 | | | | 4,359,208 | |
Delphi Energy Corp. (a) | | | 955,200 | | | | 1,369,428 | |
Denbury Resources, Inc. (a) | | | 395,200 | | | | 7,204,496 | |
Endeavour International Corp. (a) | | | 335,132 | | | | 3,971,314 | |
Energy XXI Bermuda Ltd. (a) | | | 1,420,780 | | | | 51,304,366 | |
EOG Resources, Inc. | | | 107,200 | | | | 11,909,920 | |
EQT Corp. | | | 922,400 | | | | 44,468,904 | |
Fairborne Energy Ltd. (a) | | | 712,958 | | | | 1,572,518 | |
Far East Energy Corp. (a)(b) | | | 18,000,000 | | | | 4,678,200 | |
Forest Oil Corp. (a) | | | 100,000 | | | | 1,212,000 | |
FX Energy, Inc. (a) | | | 398,500 | | | | 2,167,840 | |
Gastar Exploration Ltd. (a) | | | 677,960 | | | | 2,027,100 | |
Goodrich Petroleum Corp. (a) | | | 1,009,700 | | | | 19,204,494 | |
Gran Tierra Energy, Inc. (a) | | | 1,202,849 | | | | 7,585,263 | |
Greenfields Petroleum Corp. (Acquired
11/03/10, cost $926,522) (a)(c) | | | 110,000 | | | | 634,117 | |
Guide Exploration Ltd., Class A (a) | | | 1,001,598 | | | | 2,209,149 | |
Guide Exploration Ltd., Class A
(Acquired 2/09/04,
cost $346,401) (a)(c) | | | 173,600 | | | | 382,896 | |
Gulfport Energy Corp. (a) | | | 88,300 | | | | 2,571,296 | |
Ithaca Energy, Inc. (a) | | | 268,300 | | | | 855,375 | |
| | | | | | |
| See Notes to Financial Statements. | | | | |
| | | | | | | |
| | BLACKROCK FUNDS | | MARCH 31, 2012 | | 19 |
| | |
| | |
Schedule of Investments (continued) | | BlackRock Energy & Resources Portfolio (Percentages shown are based on Net Assets) |
| | | | | | | | |
| Common Stocks | | Shares | | | Value | |
Oil, Gas & Consumable Fuels (concluded) | | | | | |
James River Coal Co. (a) | | | 297,600 | | | $ | 1,523,712 | |
Kodiak Oil & Gas Corp. (a) | | | 1,296,600 | | | | 12,914,136 | |
Lone Pine Resources, Inc. (a) | | | 61,248 | | | | 398,112 | |
Longview Energy Co. (Acquired 8/13/04, cost $1,281,000) (a)(c) | | | 85,400 | | | | 1,043,511 | |
Lynden Energy Corp. (a) | | | 200,400 | | | | 94,429 | |
Magnum Hunter Resources Corp. (a) | | | 1,200,500 | | | | 7,695,205 | |
Manitok Energy, Inc. (a) | | | 1,996,900 | | | | 3,443,449 | |
Matador Resources Co. (Acquired 10/14/03 through 4/13/06, cost $2,957,155) (a)(c) | | | 513,393 | | | | 5,621,653 | |
Max Petroleum Plc (a) | | | 5,000,000 | | | | 1,016,579 | |
McMoRan Exploration Co. (a) | | | 508,500 | | | | 5,440,950 | |
Niko Resources Ltd. | | | 302,800 | | | | 10,652,416 | |
Novus Energy, Inc. (a) | | | 3,422,100 | | | | 3,568,083 | |
NuVista Energy Ltd. (a) | | | 817,600 | | | | 3,024,657 | |
Open Range Energy Corp. (a) | | | 48,061 | | | | 57,821 | |
Pace Oil and Gas Ltd. (a)(b) | | | 2,660,330 | | | | 13,255,642 | |
Pace Oil and Gas Ltd. (Acquired 9/29/05, cost $1,971,490) (a)(c) | | | 57,740 | | | | 287,701 | |
Painted Pony Petroleum Ltd., Class A (a) | | | 1,169,900 | | | | 9,828,826 | |
Palliser Oil & Gas Corp. (a) | | | 1,974,200 | | | | 1,484,435 | |
Pan Orient Energy Corp. (a) | | | 959,100 | | | | 3,913,516 | |
Patriot Coal Corp. (a) | | | 477,346 | | | | 2,978,639 | |
Peabody Energy Corp. | | | 1,045,436 | | | | 30,275,827 | |
Penn Virginia Corp. | | | 1,608,300 | | | | 7,317,765 | |
Penn West Petroleum Ltd. | | | 153,333 | | | | 2,996,100 | |
Petroleum Development Corp. (a) | | | 387,200 | | | | 14,361,248 | |
Pinecrest Energy, Inc. (a) | | | 662,500 | | | | 1,952,729 | |
Pioneer Natural Resources Co. | | | 408,100 | | | | 45,539,879 | |
Plains Exploration & Production Co. (a) | | | 1,656,625 | | | | 70,655,056 | |
PRD Energy, Inc. (a) | | | 990,200 | | | | 416,947 | |
Range Resources Corp. | | | 829,200 | | | | 48,209,688 | |
Rex Energy Corp. (a) | | | 556,300 | | | | 5,941,284 | |
Rosetta Resources, Inc. (a) | | | 579,000 | | | | 28,232,040 | |
Scorpio Tankers, Inc. (a) | | | 277,710 | | | | 1,960,633 | |
Ship Finance International Ltd. | | | 27 | | | | 413 | |
Sonde Resources Corp. (a) | | | 1,246,060 | | | | 3,052,847 | |
Sonde Resources Corp. (Acquired 1/15/10, cost $3,034,134) (a)(c) | | | 1,200,000 | | | | 2,935,486 | |
Southwestern Energy Co. (a) | | | 825,600 | | | | 25,263,360 | |
Stone Energy Corp. (a) | | | 27,274 | | | | 779,764 | |
Swift Energy Co. (a) | | | 448,900 | | | | 13,031,567 | |
Touchstone Exploration, Inc. (a) | | | 2,154,300 | | | | 842,325 | |
Tourmaline Oil Corp. (a) | | | 57,420 | | | | 1,269,349 | |
Trilogy Energy Corp. | | | 956,222 | | | | 25,270,452 | |
Trioil Resources Ltd., Class A (a) | | | 810,183 | | | | 2,745,419 | |
Uranium One, Inc. (a) | | | 1,005,765 | | | | 2,793,091 | |
Valero Energy Corp. | | | 357,600 | | | | 9,215,352 | |
Vero Energy, Inc. (a) | | | 91,642 | | | | 253,579 | |
Yangarra Resources Ltd. (a) | | | 2,302,800 | | | | 1,085,083 | |
Yoho Resources, Inc. (a)(b) | | | 2,146,300 | | | | 5,594,646 | |
ZaZa Energy Corp. (a) | | | 726,557 | | | | 3,393,021 | |
| | | | | | | | |
| | | | | | | 970,255,993 | |
| |
Total Common Stocks – 100.6% | | | | | | | 1,207,442,573 | |
| |
| | | | | | | | |
| |
| | | | | | | | |
| Warrants (d) | | Shares | | | Value | |
Oil, Gas & Consumable Fuels – 0.0% | | | | | | | | |
Compton Petroleum Corp. (Issued/Exercisable 8/18/11, 1 Share for 1 Warrant, Expires 8/23/14, Strike Price CAD 11.92) | | | 1,043 | | | $ | 2,300 | |
Magnum Hunter Resources Corp.
(Issued/Exercisable 8/29/11, 1 Share for 1 Warrant, Expires 10/14/13, Strike Price USD 10.50) | | | 60,050 | | | | – | |
| |
Total Warrants – 0.0% | | | | | | | 2,300 | |
| |
Total Long-Term Investments (Cost – $1,177,469,134) – 100.6% | | | | | | | 1,207,444,873 | |
| |
| | | | | | | | |
| |
| | |
Short-Term Securities | | | | | | | | |
| |
BlackRock Liquidity Funds, TempFund, Institutional Class, 0.14% (e)(f) | | | 95,805 | | | | 95,805 | |
| |
Total Short-Term Securities
(Cost – $95,805) – 0.0% | | | | | | | 95,805 | |
Total Investments
(Cost – $1,177,564,939) – 100.6% | | | | | | | 1,207,540,678 | |
Liabilities in Excess of Other Assets – (0.6)% | | | | (7,769,832 | ) |
| | | | | | | | |
Net Assets – 100.0% | | | | | | $ | 1,199,770,846 | |
| | | | | | | | |
| | | | | | | | |
| |
| (a) | Non-income producing security. |
| (b) | Investments in companies (whereby the Fund held 5% or more of the companies’ outstanding securities) that were considered to be an affiliate during the period, for purposes of Section 2(a)(3) of the Investment Company Act of 1940, as amended, were as follows: |
| | | | | | | | | | | | | | | | |
| Affiliate | | Shares Held at September 30,
2011 | | | Shares Purchased | | | Shares Held at March 31,
2012 | | | Value at
March 31,
2012 | |
Far East Energy Corp. | | | 18,000,000 | | | | – | | | | 18,000,000 | | | $ | 4,678,200 | |
Geokinetics, Inc. | | | 739,033 | | | | 300,000 | | | | 1,039,033 | | | $ | 1,828,698 | |
Pace Oil and Gas Ltd. | | | 2,660,330 | | | | – | | | | 2,660,330 | | | $ | 13,255,642 | |
Sunridge Gold Corp. | | | 4,325,559 | | | | 2,000,000 | | | | 6,325,559 | | | $ | 2,917,196 | |
Yoho Resources, Inc.1 | | | 2,146,300 | | | | – | | | | 2,146,300 | | | $ | 5,594,646 | |
| |
| 1 | No longer an affiliated company or held by the Fund as of report date. |
| (c) | Restricted security as to resale. As of report date, the Fund held 2.2% of its net assets, with a current value of $26,073,334 and an original cost of $20,369,389, in these securities. |
| (d) | Warrants entitle the Fund to purchase a predetermined number of shares of common stock and are non-income producing. The purchase price and number of shares are subject to adjustment under certain conditions until the expiration date, if any. |
| | | | | | |
See Notes to Financial Statements. | | | | |
| | | | | | |
| 20 | | BLACKROCK FUNDS | | MARCH 31, 2012 | | |
| | |
| | |
Schedule of Investments (concluded) | | BlackRock Energy & Resources Portfolio |
| (e) | Investments in companies considered to be an affiliate of the Fund during the period, for purposes of Section 2(a)(3) of the Investment Company Act of 1940, as amended, were as follows: |
| | | | | | | | | | | | | | | | |
| Affiliate | | Shares Held at September 30, 2011 | | | Net Activity | | | Shares Held at March 31, 2012 | | | Income | |
| BlackRock Liquidity Funds, TempFund, Institutional Class | | | 232,783 | | | | (136,978 | ) | | | 95,805 | | | $ | 3,475 | |
| (f) | Represents the current yield as of report date. |
| — | | For Fund compliance purposes, the Fund’s industry classifications refer to any one or more of the industry sub-classifications used by one or more widely recognized market indexes or ratings group indexes, and/or as defined by Fund management. These definitions may not apply for purposes of this report, which may combine industry sub-classifications for reporting ease. |
| — | | Fair Value Measurements – Various inputs are used in determining the fair value of investments. These inputs are categorized into a disclosure hierarchy consisting of three broad levels for financial statement purposes as follows: |
| | — | | Level 1 – unadjusted price quotations in active markets/exchanges for identical assets and liabilities |
| | — | | Level 2 – other observable inputs (including, but not limited to: quoted prices for similar assets or liabilities in markets that are active, quoted prices for identical or similar assets or liabilities in markets that are not active, inputs other than quoted prices that are observable for the assets or liabilities (such as interest rates, yield curves, volatilities, prepayment speeds, loss severities, credit risks and default rates) or other market–corroborated inputs) |
| | — | | Level 3 – unobservable inputs based on the best information available in the circumstances, to the extent observable inputs are not available (including the Fund’s own assumptions used in determining the fair value of investments) |
Changes in valuation techniques may result in transfers into or out of an assigned level within the disclosure hierarchy. The categorization of a value determined for investments is based on the pricing transparency of the investment and is not necessarily an indication of the risks associated with of investing in those securities. For information about the Fund’s policy regarding valuation of investments and other significant accounting policies, please refer to Note 1 of the Notes to Financial Statements.
The following table summarizes the inputs used as of March 31, 2012 in determining the fair valuation of the Fund’s investments:
| | | | | | | | | | | | | | | | |
| Valuation Inputs | | Level 1 | | | Level 2 | | | Level 3 | | | Total | |
Assets: | | | | | | | | | | | | | | | | |
Investments: | | | | | | | | | | | | | | | | |
Long-Term Investments: | | | | | | | | | | | | | | | | |
Common Stocks: | | | | | | | | | | | | | | | | |
Capital Markets | | $ | 824,092 | | | | – | | | | – | | | $ | 824,092 | |
Commercial Services & Supplies | | | – | | | | – | | | | – | | | | – | |
Diversified Financial Services | | | 99,684 | | | | – | | | | – | | | | 99,684 | |
Electrical Equipment | | | 565,984 | | | | – | | | | – | | | | 565,984 | |
Electronic Equipment, Instruments & Components | | | 512,432 | | | | – | | | | – | | | | 512,432 | |
Energy Equipment & Services | | | 152,927,287 | | | | – | | | | – | | | | 152,927,287 | |
Machinery | | | – | | | | – | | | | – | | | | – | |
Metals & Mining | | | 82,257,101 | | | | – | | | | – | | | | 82,257,101 | |
Oil, Gas & Consumable Fuels | | | 959,447,045 | | | $ | 9,765,437 | | | $ | 1,043,511 | | | | 970,255,993 | |
Warrants | | | 2,300 | | | | – | | | | – | | | | 2,300 | |
Short-Term Securities | | | 95,805 | | | | – | | | | – | | | | 95,805 | |
Total | | $ | 1,196,731,730 | | | $ | 9,765,437 | | | $ | 1,043,511 | | | $ | 1,207,540,678 | |
| | | | | | |
| See Notes to Financial Statements. | | | | |
| | | | | | | |
| | BLACKROCK FUNDS | | MARCH 31, 2012 | | 21 |
| | |
| | |
Consolidated Schedule of Investments March 31, 2012 (Unaudited) | | BlackRock World Gold Fund |
| | |
| | (Percentages shown are based on Net Assets) |
| | | | | | | | |
| Common Stocks | | Shares | | | Value | |
Australia – 14.8% | | | | | | | | |
Ampella Mining Ltd. (a) | | | 39,560 | | | $ | 41,145 | |
Aquarius Platinum Ltd. | | | 17,370 | | | | 39,542 | |
Centamin Plc (a) | | | 19,560 | | | | 21,560 | |
Dampier Gold Ltd. (a) | | | 21,520 | | | | 5,240 | |
Evolution Mining Ltd. (a) | | | 33,770 | | | | 60,922 | |
Indochine Mining Ltd. (a) | | | 151,560 | | | | 28,813 | |
Integra Mining Ltd. (a) | | | 192,990 | | | | 103,154 | |
Kingsgate Consolidated Ltd. | | | 2,810 | | | | 18,658 | |
Medusa Mining Ltd. | | | 7,820 | | | | 40,747 | |
Newcrest Mining Ltd. | | | 29,000 | | | | 891,945 | |
Northern Star Resources Ltd. (a) | | | 56,000 | | | | 49,733 | |
Papillon Resources Ltd. (a) | | | 60,000 | | | | 67,753 | |
Silver Lake Resources Ltd. (a) | | | 18,648 | | | | 65,736 | |
| | | | | | | | |
| | | | | | | | 1,434,948 | |
Canada – 48.6% | | | | | | | | |
Agnico-Eagle Mines Ltd. | | | 4,580 | | | | 152,628 | |
Alamos Gold, Inc. | | | 17,300 | | | | 317,573 | |
B2Gold Corp. (a) | | | 22,000 | | | | 94,401 | |
Banro Corp. (a) | | | 30,000 | | | | 138,954 | |
Barrick Gold Corp. | | | 7,405 | | | | 321,969 | |
Belo Sun Mining Corp. (a) | | | 58,000 | | | | 54,078 | |
Centerra Gold, Inc. | | | 10,520 | | | | 163,582 | |
Detour Gold Corp. (a) | | | 5,600 | | | | 139,628 | |
Eldorado Gold Corp. | | | 42,000 | | | | 576,871 | |
Goldcorp, Inc. | | | 19,000 | | | | 856,424 | |
IAMGOLD Corp. | | | 23,640 | | | | 314,742 | |
Kinross Gold Corp. | | | 49,500 | | | | 483,859 | |
Lake Shore Gold Corp. (a) | | | 13,000 | | | | 13,424 | |
Minefinders Corp. (a) | | | 7,240 | | | | 101,401 | |
New Gold, Inc. (a) | | | 26,540 | | | | 262,087 | |
Osisko Mining Corp. (a) | | | 4,340 | | | | 50,386 | |
Romarco Minerals, Inc. (a) | | | 106,000 | | | | 105,208 | |
SEMAFO, Inc. | | | 15,900 | | | | 84,804 | |
Yamana Gold, Inc. | | | 30,400 | | | | 474,233 | |
| | | | | | | | |
| | | | | | | | 4,706,252 | |
China – 0.1% | | | | | | | | |
Real Gold Mining Ltd. | | | 13,000 | | | | 7,416 | |
Hong Kong – 0.2% | | | | | | | | |
G-Resources Group Ltd. (a) | | | 228,000 | | | | 13,958 | |
Jersey, Channel Islands – 5.6% | | | | | | | | |
Minera IRL Ltd. (a) | | | 95,860 | | | | 102,765 | |
Randgold Resources Ltd. - ADR | | | 5,025 | | | | 442,100 | |
| | | | | | | | |
| | | | | | | | 544,865 | |
Mexico – 9.3% | | | | | | | | |
Fresnillo Plc | | | 22,000 | | | | 564,112 | |
Industrias Penoles SAB de CV | | | 7,000 | | | | 339,692 | |
| | | | | | | | |
| | | | | | | | 903,804 | |
Peru – 4.4% | | | | | | | | |
Cia de Minas Buenaventura SA - ADR | | | 7,300 | | | | 294,263 | |
Volcan Cia Minera SAA, Class B (a) | | | 96,500 | | | | 132,409 | |
| | | | | | | | |
| | | | | | | | 426,672 | |
Russia – 0.2% | | | | | | | | |
Polymetal International Plc (a) | | | 1,240 | | | | 18,316 | |
South Africa – 7.4% | | | | | | | | |
AngloGold Ashanti Ltd. | | | 4,395 | | | | 162,192 | |
| | | | | | | | |
| Common Stocks | | Shares | | | Value | |
South Africa (concluded) | | | | | | | | |
Gold Fields Ltd. | | | 8,580 | | | $ | 118,537 | |
Harmony Gold Mining Co. Ltd. | | | 21,610 | | | | 236,435 | |
Impala Platinum Holdings Ltd. | | | 9,990 | | | | 197,295 | |
| | | | | | | | |
| | | | | | | | 714,459 | |
United Kingdom – 3.5% | | | | | | | | |
Archipelago Resources Plc (a) | | | 27,980 | | | | 29,090 | |
Hochschild Mining Plc | | | 8,810 | | | | 65,515 | |
Hummingbird Resources Plc (a) | | | 25,000 | | | | 52,983 | |
Patagonia Gold Plc (a) | | | 68,930 | | | | 42,723 | |
Petropavlovsk Plc | | | 9,955 | | | | 88,860 | |
Rio Tinto Plc | | | 1,120 | | | | 62,078 | |
| | | | | | | | |
| | | | | | | | 341,249 | |
United States – 3.3% | | | | | | | | |
Freeport-McMoRan Copper & Gold, Inc. | | | 2,300 | | | | 87,492 | |
Gold Resource Corp. | | | 1,280 | | | | 31,117 | |
Newmont Mining Corp. | | | 4,000 | | | | 205,080 | |
| | | | | | | | |
| | | | | | | | 323,689 | |
Total Common Stocks – 97.4% | | | | | | | 9,435,628 | |
| | | | | | | | |
Investment Companies | | | | | | | | |
Jersey, Channel Islands – 0.6% | | | | | | | | |
ETFS Physical Platinum (a) | | | 400 | | | | 63,562 | |
United States – 1.8% | | | | | | | | |
SPDR Gold Trust (a) | | | 1,050 | | | | 170,247 | |
Total Investment Companies – 2.4% | | | | 233,809 | |
| | | | | | | | |
Warrants (b) | | | | | | | | |
Canada – 0.0% | | | | | | | | |
Kinross Gold Corp. (Issued/Exercisable 10/28/10, 1 Share for 1 Warrant, Expires 9/17/14, Strike Price USD 21.30) (a) | | | 757 | | | | 486 | |
Total Investments (Cost – $10,229,408) – 99.8% | | | | 9,669,923 | |
Other Assets Less Liabilities – 0.2% | | | | | | | 22,983 | |
| | | | | | | | |
Net Assets – 100.0% | | | | | | $ | 9,692,906 | |
| | | | | | | | |
| | | | | | | | |
| (a) | Non-income producing security. |
| (b) | Warrants entitle the Fund to purchase a predetermined number of shares of common stock and are non-income producing. The purchase price and number of shares are subject to adjustment under certain conditions until the expiration date, if any. |
| — | | Investments in companies considered to be an affiliate of the Fund during the period, for purposes of Section 2(a)(3) of the Investment Company Act of 1940, as amended, was as follows: |
| | | | | | | | | | | | | | |
| Affiliate | | Shares Held at September 30, 2011 | | | Net Activity | | | Shares Held at March 31, 2012 | | Income | |
BlackRock Liquidity Funds, TempFund, Institutional Class | | | 156,211 | | | | (156,211 | ) | | – | | $ | 27 | |
| | | | | | |
| See Notes to Financial Statements. | | | | |
| | | | | | | |
| 22 | | BLACKROCK FUNDS | | MARCH 31, 2012 | | |
| | |
| | |
| Consolidated Schedule of Investments (concluded) | | BlackRock World Gold Fund |
| — | | Foreign currency exchange contracts as of March 31, 2012 were as follows: |
| | | | | | | | | | | | | | | | | | | | | | |
Currency Purchased | | | Currency Sold | | | Counterparty | | Settlement Date | | | Unrealized
Depreciation | |
| USD | | | 38,554 | | | | CAD | | | | 38,569 | | | Bank of New York Mellon | | | 4/02/12 | | | | $ (113) | |
| USD | | | 9,608 | | | | MXN | | | | 122,975 | | | Bank of New York Mellon | | | 4/02/12 | | | | (4) | |
| USD | | | 27,186 | | | | CAD | | | | 27,259 | | | Bank of New York Mellon | | | 4/12/12 | | | | (143) | |
| | | | |
Total | | | | | | | | | | | | | | $ (260) | |
| — | | Fair Value Measurements – Various inputs are used in determining the fair value of investments and derivative financial instruments. These inputs are categorized into a disclosure hierarchy consisting of three broad levels for financial statement purposes as follows: |
| | — | | Level 1 – unadjusted price quotations in active markets/exchanges for identical assets and liabilities |
| | — | | Level 2 – other observable inputs (including, but not limited to: quoted prices for similar assets or liabilities in markets that are active, quoted prices for identical or similar assets or liabilities in markets that are not active, inputs other than quoted prices that are observable for the assets or liabilities (such as interest rates, yield curves, volatilities, prepayment speeds, loss severities, credit risks and default rates) or other market–corroborated inputs) |
| | — | | Level 3 – unobservable inputs based on the best information available in the circumstances, to the extent observable inputs are not available (including the Fund’s own assumptions used in determining the fair value of investments and derivative financial instruments) |
Changes in valuation techniques may result in transfers into or out of an assigned level within the disclosure hierarchy. The categorization of a value determined for investments and derivative financial instruments is based on the pricing transparency of the investment and derivative financial instrument and is not necessarily an indication of the risks associated with investing in those securities. For information about the Fund’s policy regarding valuation of investments and derivative financial instruments and other significant accounting policies, please refer to Note 1 of the Notes to Financial Statements.
The following tables summarize the inputs used as of March 31, 2012 in determining the fair valuation of the Fund’s investments and derivative financial instruments:
| | | | | | | | | | | | | | |
| Valuation Inputs | | Level 1 | | | Level 2 | | | Level 3 | | Total | |
Assets: | | | | | | | | | | | | | | |
Investments: | | | | | | | | | | | | | | |
Long-Term Investments: | | | | | | | | | | | | | | |
Common Stocks: | | | | | | | | | | | | | | |
Australia | | $ | 5,240 | | | $ | 1,429,708 | | | – | | $ | 1,434,948 | |
Canada | | | 4,706,252 | | | | – | | | – | | | 4,706,252 | |
China | | | 7,416 | | | | – | | | – | | | 7,416 | |
Hong Kong | | | – | | | | 13,958 | | | – | | | 13,958 | |
Jersey, Channel Islands | | | 544,865 | | | | – | | | – | | | 544,865 | |
Mexico | | | 339,692 | | | | 564,112 | | | – | | | 903,804 | |
Peru | | | 426,672 | | | | – | | | – | | | 426,672 | |
Russia | | | 18,316 | | | | – | | | – | | | 18,316 | |
South Africa | | | – | | | | 714,459 | | | – | | | 714,459 | |
United Kingdom | | | 124,796 | | | | 216,453 | | | – | | | 341,249 | |
United States | | | 323,689 | | | | – | | | – | | | 323,689 | |
Investment Companies | | | 233,809 | | | | – | | | – | | | 233,809 | |
Warrants | | | 486 | | | | – | | | – | | | 486 | |
Total | | $ | 6,731,233 | | | $ | 2,938,690 | | | – | | $ | 9,669,923 | |
| | | | | | | | | | | | |
| Valuation Inputs | | Level 1 | | | Level 2 | | Level 3 | | Total | |
Derivative Financial Instruments1 | | | | | | | | | | | | |
Liabilities: | | | | | | | | | | | | |
Foreign currency exchange contracts | | $ | (260 | ) | | – | | – | | $ | (260 | ) |
Total | | $ | (260 | ) | | – | | – | | $ | (260 | ) |
| 1 | Derivative financial instruments are foreign currency exchange contracts which are valued at the unrealized appreciation/depreciation on the instrument. |
| | | | | | |
See Notes to Financial Statements. | | | | |
| | | | | | |
| | BLACKROCK FUNDS | | MARCH 31, 2012 | | 23 |
| | |
| | |
Statements of Assets and Liabilities | | |
| | | | | | | | | | | | | | | | |
| March 31, 2012 (Unaudited) | | BlackRock
All-Cap Energy &
Resources
Portfolio | | | BlackRock
China Fund | | | BlackRock
Energy &
Resources
Portfolio | | | BlackRock
World Gold Fund1 | |
Assets | | | | | | | | | | | | | | | | |
Investments at value – unaffiliated2,3 | | $ | 751,342,473 | | | $ | 2,602,335 | | | $ | 1,178,170,491 | | | $ | 9,669,923 | |
Investments at value – affiliated4 | | | 36,321,395 | | | | 10,559 | | | | 29,370,187 | | | | – | |
Investments sold receivable | | | 6,123,754 | | | | – | | | | 18,224,483 | | | | 88,971 | |
Cash | | | – | | | | 3,601 | | | | 1,502 | | | | – | |
Foreign currency at value5 | | | 667 | | | | 2,302 | | | | 27,802 | | | | – | |
Capital shares sold receivable | | | 764,840 | | | | – | | | | 1,845,059 | | | | 35,306 | |
Dividends and reclaims receivable – unaffiliated | | | 404,516 | | | | 467 | | | | 282,884 | | | | 9,749 | |
Securities lending income receivable – affiliated | | | 2,718 | | | | – | | | | – | | | | – | |
Receivable from advisor | | | – | | | | 41,183 | | | | – | | | | – | |
Dividends receivable – affiliated | | | 1,944 | | | | 5 | | | | 149 | | | | 12 | |
Prepaid expenses | | | 71,244 | | | | 49,033 | | | | 73,874 | | | | 35,433 | |
| | | | |
Total assets | | | 795,033,551 | | | | 2,709,485 | | | | 1,227,996,431 | | | | 9,839,394 | |
| | | | |
| | | | | | | | | | | | | | | | |
Liabilities | | | | | | | | | | | | | | | | |
Collateral on securities loaned at value | | | 27,396,922 | | | | – | | | | – | | | | – | |
Bank overdraft | | | – | | | | – | | | | – | | | | 47,428 | |
Investments purchased payable | | | – | | | | – | | | | 18,743,745 | | | | – | |
Unrealized depreciation on foreign currency exchange contracts | | | – | | | | – | | | | – | | | | 260 | |
Capital shares redeemed payable | | | 1,250,353 | | | | 29,362 | | | | 7,404,134 | | | | 29,927 | |
Investment advisory fees payable. | | | 509,380 | | | | – | | | | 900,786 | | | | 21,336 | |
Service and distribution fees payable | | | 161,160 | | | | 65 | | | | 323,813 | | | | 3,023 | |
Other affiliates payable | | | 80,078 | | | | – | | | | 125,175 | | | | – | |
Custodian fees payable | | | 61,741 | | | | 7,595 | | | | 109,800 | | | | 3,779 | |
Professional fees payable | | | 31,702 | | | | 5,913 | | | | 40,697 | | | | 33,991 | |
Officer’s and Trustees’ fees payable | | | 7,424 | | | | 1,024 | | | | 11,728 | | | | 1,042 | |
Printing fees payable | | | 5,860 | | | | – | | | | 5,213 | | | | – | |
Other accrued expenses payable | | | 210,938 | | | | 4,885 | | | | 560,494 | | | | 5,702 | |
| | | | |
Total liabilities | | | 29,715,558 | | | | 48,844 | | | | 28,225,585 | | | | 146,488 | |
| | | | |
Net Assets | | $ | 765,317,993 | | | $ | 2,660,641 | | | $ | 1,199,770,846 | | | $ | 9,692,906 | |
| | | | |
| | | | | | | | | | | | | | | | |
Net Assets Consist of | | | | | | | | | | | | | | | | |
Paid-in capital | | $ | 764,239,702 | | | $ | 3,214,349 | | | $ | 1,164,875,216 | | | $ | 10,680,747 | |
Accumulated net investment loss | | | (1,021,738 | ) | | | (10,640 | ) | | | (43,606,504 | ) | | | (105,782 | ) |
Accumulated net realized gain (loss) | | | (108,160,429 | ) | | | (80,070 | ) | | | 48,526,390 | | | | (322,058 | ) |
Net unrealized appreciation/depreciation | | | 110,260,458 | | | | (462,998 | ) | | | 29,975,744 | | | | (560,001 | ) |
| | | | |
Net Assets | | $ | 765,317,993 | | | $ | 2,660,641 | | | $ | 1,199,770,846 | | | $ | 9,692,906 | |
| | | | |
| | | | |
1 Consolidated Statement of Assets and Liabilities | | | | | | | | | | | | | | | | |
2 Investments at cost – unaffiliated | | $ | 641,082,030 | | | $ | 3,065,364 | | | $ | 1,177,469,134 | | | $ | 10,229,408 | |
3 Securities loaned at value | | $ | 26,679,973 | | | | – | | | | – | | | | – | |
4 Investments at cost – affiliated | | $ | 36,321,395 | | | $ | 10,559 | | | $ | 46,657,999 | | | | – | |
5 Foreign currency at cost | | $ | 566 | | | $ | 2,271 | | | $ | 27,749 | | | | – | |
See Notes to Financial Statements.
| | | | | | |
| | | | | | | |
| 24 | | BLACKROCK FUNDS | | MARCH 31, 2012 | | |
| | |
| | |
Statements of Assets and Liabilities (concluded) | | |
| | | | | | | | | | | | | | | | |
| March 31, 2012 (Unaudited) | | BlackRock
All-Cap Energy &
Resources
Portfolio | | | BlackRock
China Fund | | | BlackRock
Energy &
Resources
Portfolio | | | BlackRock
World Gold Fund1 | |
Net Asset Value | | | | | | | | | | | | | | | | |
Institutional | | | | | | | | | | | | | | | | |
Net assets | | $ | 439,070,513 | | | $ | 2,457,908 | | | $ | 336,534,269 | | | $ | 4,009,832 | |
| | | | |
| | | | |
Shares outstanding2 | | | 30,798,404 | | | | 301,188 | | | | 9,043,505 | | | | 384,060 | |
| | | | |
| | | | |
Net asset value | | $ | 14.26 | | | $ | 8.16 | | | $ | 37.21 | | | $ | 10.44 | |
| | | | |
| | | | |
Service | | | | | | | | | | | | | | | | |
Net assets | | $ | 4,943,565 | | | | – | | | | – | | | | – | |
| | | | |
| | | | |
Shares outstanding2 | | | 354,491 | | | | – | | | | – | | | | – | |
| | | | |
| | | | |
Net asset value | | $ | 13.95 | | | | – | | | | – | | | | – | |
| | | | |
| | | | |
Investor A | | | | | | | | | | | | | | | | |
Net assets | | $ | 195,786,012 | | | $ | 170,434 | | | $ | 683,674,679 | | | $ | 3,032,683 | |
| | | | |
| | | | |
Shares outstanding2 | | | 14,045,223 | | | | 20,929 | | | | 21,070,893 | | | | 291,062 | |
| | | | |
| | | | |
Net asset value | | $ | 13.94 | | | $ | 8.14 | | | $ | 32.45 | | | $ | 10.42 | |
| | | | |
| | | | |
Investor B | | | | | | | | | | | | | | | | |
Net assets | | $ | 18,704,575 | | | | – | | | $ | 13,138,646 | | | | – | |
| | | | |
| | | | |
Shares outstanding2 | | | 1,399,944 | | | | – | | | | 547,942 | | | | – | |
| | | | |
| | | | |
Net asset value | | $ | 13.36 | | | | – | | | $ | 23.98 | | | | – | |
| | | | |
| | | | |
Investor C | | | | | | | | | | | | | | | | |
Net assets | | $ | 106,813,328 | | | $ | 32,299 | | | $ | 166,423,252 | | | $ | 2,650,391 | |
| | | | |
| | | | |
Shares outstanding2 | | | 7,980,981 | | | | 3,982 | | | | 7,001,808 | | | | 257,707 | |
| | | | |
| | | | |
Net asset value | | $ | 13.38 | | | $ | 8.11 | | | $ | 23.77 | | | $ | 10.28 | |
| | | | |
| | 1 | Consolidated Statement of Assets and Liabilities. |
| | 2 | Unlimited number of shares authorized, $0.001 par value. |
See Notes to Financial Statements.
| | | | | | |
| | | | | | | |
| | BLACKROCK FUNDS | | MARCH 31, 2012 | | 25 |
| | | | | | | | | | | | | | | | |
| Six Months Ended March 31, 2012 (Unaudited) | | BlackRock
All-Cap Energy &
Resources
Portfolio | | | BlackRock
China Fund | | | BlackRock
Energy &
Resources
Portfolio | | | BlackRock
World Gold Fund1 | |
Investment Income | | | | | | | | | | | | | | | | |
Dividends and reclaims – unaffiliated | | $ | 4,104,897 | | | $ | 10,614 | | | $ | 2,565,541 | | | $ | 58,892 | |
Foreign taxes withheld | | | (274,184 | ) | | | (235 | ) | | | (96,418 | ) | | | (3,762 | ) |
Dividends – affiliated | | | 8,572 | | | | 18 | | | | 3,475 | | | | 27 | |
Securities lending – affiliated | | | 41,208 | | | | – | | | | – | | | | – | |
| | | | |
Total income | | | 3,880,493 | | | | 10,397 | | | | 2,472,598 | | | | 55,157 | |
| | | | |
| | | | | | | | | | | | | | | | |
Expenses | | | | | | | | | | | | | | | | |
Investment advisory | | | 2,944,818 | | | | 12,578 | | | | 4,709,466 | | | | 42,303 | |
Service and distribution – class specific | | | 932,736 | | | | 276 | | | | 1,880,744 | | | | 19,815 | |
Transfer agent – class specific | | | 441,367 | | | | 270 | | | | 1,145,554 | | | | 8,547 | |
Administration | | | 289,118 | | | | 10,963 | | | | 444,117 | | | | 9,120 | |
Administration – class specific | | | 98,225 | | | | 314 | | | | 147,871 | | | | 1,411 | |
Registration | | | 44,204 | | | | 3,297 | | | | 67,152 | | | | 18,013 | |
Professional | | | 30,991 | | | | 29,115 | | | | 37,225 | | | | 29,994 | |
Custodian | | | 30,173 | | | | 4,050 | | | | 47,285 | | | | 6,830 | |
Printing | | | 29,810 | | | | 10,099 | | | | 41,688 | | | | 1,171 | |
Officer and Trustees | | | 11,765 | | | | 1,418 | | | | 18,300 | | | | 1,517 | |
Offering | | | – | | | | 75,460 | | | | – | | | | – | |
Miscellaneous | | | 14,862 | | | | 7,411 | | | | 14,956 | | | | 4,731 | |
Recoupment of past waived fees – class specific | | | 6,525 | | | | – | | | | 105,854 | | | | – | |
| | | | |
Total expenses | | | 4,874,594 | | | | 155,251 | | | | 8,660,212 | | | | 143,452 | |
Less fees waived by advisor | | | (6,905 | ) | | | (12,578 | ) | | | (2,871 | ) | | | (40,476 | ) |
Less administration fees waived | | | – | | | | (943 | ) | | | – | | | | (1,447 | ) |
Less administration fees waived – class specific | | | (3,099 | ) | | | (299 | ) | | | (5,255 | ) | | | (1,406 | ) |
Less transfer agent fees waived – class specific | | | (1,758 | ) | | | (7 | ) | | | (2,041 | ) | | | (452 | ) |
Less transfer agent fees reimbursed – class specific | | | (5,881 | ) | | | (224 | ) | | | (17,794 | ) | | | (7,483 | ) |
Less expenses reimbursed by advisor | | | – | | | | (120,163 | ) | | | – | | | | (1,680 | ) |
Less fees paid indirectly | | | (122 | ) | | | – | | | | (304 | ) | | | (6 | ) |
| | | | |
Total expenses after fees waived, reimbursed and paid indirectly | | | 4,856,829 | | | | 21,037 | | | | 8,631,947 | | | | 90,502 | |
| | | | |
Net investment loss | | | (976,336 | ) | | | (10,640 | ) | | | (6,159,349 | ) | | | (35,345 | ) |
| | | | |
| | | | | | | | | | | | | | | | |
Realized and Unrealized Gain (Loss) | | | | | | | | | | | | | | | | |
Net realized gain (loss) from:
Investments – unaffiliated | | | (3,248,015 | ) | | | (58,948 | ) | | | 62,482,359 | | | | (161,921 | ) |
Foreign currency transactions | | | (7,429 | ) | | | 48 | | | | (12,439 | ) | | | (1,555 | ) |
| | | | |
| | | (3,255,444 | ) | | | (58,900 | ) | | | 62,469,920 | | | | (163,476 | ) |
| | | | |
Net change in unrealized appreciation/depreciation on: | | | | | | | | | | | | | | | | |
Investments – unaffiliated | | | 126,335,020 | | | | 497,295 | | | | 181,501,191 | | | | (459,437 | ) |
Investments – affiliated | | | – | | | | – | | | | (2,669,765 | ) | | | – | |
Foreign currency transactions | | | 2,456 | | | | (76 | ) | | | 6,732 | | | | (190 | ) |
| | | | |
| | | 126,337,476 | | | | 497,219 | | | | 178,838,158 | | | | (459,627 | ) |
| | | | |
Total realized and unrealized gain (loss) | | | 123,082,032 | | | | 438,319 | | | | 241,308,078 | | | | (623,103 | ) |
| | | | |
Net Increase (Decrease) in Net Assets Resulting from Operations | | $ | 122,105,696 | | | $ | 427,679 | | | $ | 235,148,729 | | | $ | (658,448 | ) |
| | | | |
| | 1 | Consolidated Statement of Operations. |
See Notes to Financial Statements.
| | | | | | |
| | | | | | | |
| 26 | | BLACKROCK FUNDS | | MARCH 31, 2012 | | |
| | |
| | |
Statements of Changes in Net Assets | | |
| | | | | | | | | | | | | | | | |
| | | BlackRock
All-Cap Energy &
Resources
Portfolio | | | BlackRock
China
Fund | |
| Increase (Decrease) in Net Assets: | | Six Months
Ended
March 31,
2012
(Unaudited) | | | Year Ended
September 30,
2011 | | | Six Months
Ended
March 31,
2012
(Unaudited) | | | Period
April 29,
20111 to
September 30,
2011 | |
Operations | | | | | | | | | | | | | | | | |
Net investment income (loss) | | $ | (976,336 | ) | | $ | (2,702,610 | ) | | $ | (10,640 | ) | | $ | 38,392 | |
Net realized gain (loss) | | | (3,255,444 | ) | | | 47,587,036 | | | | (58,900 | ) | | | (21,267 | ) |
Net change in unrealized appreciation/depreciation | | | 126,337,476 | | | | (148,099,558 | ) | | | 497,219 | | | | (960,217 | ) |
| | | | | | | | |
Net increase (decrease) in net assets resulting from operations | | | 122,105,696 | | | | (103,215,132 | ) | | | 427,679 | | | | (943,092 | ) |
| | | | | | | | |
| | | | | | | | | | | | | | | | |
Dividends to Shareholders From | | | | | | | | | | | | | | | | |
Net investment income: | | | | | | | | | | | | | | | | |
Institutional | | | – | | | | (3,839,400 | ) | | | (36,656 | ) | | | – | |
Service | | | – | | | | (26,046 | ) | | | – | | | | – | |
Investor A | | | – | | | | (1,129,552 | ) | | | (1,275 | ) | | | – | |
Investor C | | | – | | | | – | | | | (364 | ) | | | – | |
| | | | | | | | |
Decrease in net assets resulting from dividends to shareholders | | | – | | | | (4,994,998 | ) | | | (38,295 | ) | | | – | |
| | | | | | | | |
| | | | | | | | | | | | | | | | |
Capital Share Transactions | | | | | | | | | | | | | | | | |
Net increase (decrease) in net assets derived from capital share transactions | | | (67,194,693 | ) | | | 43,265,442 | | | | 153,198 | | | | 3,061,151 | |
| | | | | | | | |
| | | | | | | | | | | | | | | | |
Redemption Fees | | | | | | | | | | | | | | | | |
Redemption fees | | | – | | | | 11,916 | | | | – | | | | – | |
| | | | | | | | |
| | | | | | | | | | | | | | | | |
Net Assets | | | | | | | | | | | | | | | | |
Total increase (decrease) in net assets | | | 54,911,003 | | | | (64,932,772 | ) | | | 542,582 | | | | 2,118,059 | |
Beginning of period | | | 710,406,990 | | | | 775,339,762 | | | | 2,118,059 | | | | – | |
| | | | | | | | |
End of period | | $ | 765,317,993 | | | $ | 710,406,990 | | | $ | 2,660,641 | | | $ | 2,118,059 | |
| | | | | | | | |
Undistributed (accumulated) net investment income (loss) | | $ | (1,021,738 | ) | | $ | (45,402 | ) | | $ | (10,640 | ) | | $ | 38,295 | |
| | | | | | | | |
| | 1 | Commencement of operations. |
See Notes to Financial Statements.
| | | | | | |
| | | | | | | |
| | BLACKROCK FUNDS | | MARCH 31, 2012 | | 27 |
| | |
| | |
Statements of Changes in Net Assets (concluded) | | |
| | | | | | | | | | | | | | | | |
| | | BlackRock
Energy &
Resources
Portfolio | | | BlackRock
World
Gold
Fund1 | |
| Increase (Decrease) in Net Assets: | | Six Months Ended March 31, 2012
(Unaudited) | | | Year Ended September 30, 2011 | | | Six Months Ended March 31, 2012 (Unaudited) | | | Year Ended September 30, 2011 | |
Operations | | | | | | | | | | | | | | | | |
Net investment loss | | $ | (6,159,349 | ) | | $ | (8,481,928 | ) | | $ | (35,345 | ) | | $ | (30,854 | ) |
Net realized gain (loss) | | | 62,469,920 | | | | 183,610,918 | | | | (163,476 | ) | | | (119,194 | ) |
Net change in unrealized appreciation/depreciation | | | 178,838,158 | | | | (346,757,344 | ) | | | (459,627 | ) | | | (740,821 | ) |
| | | | | | | | |
Net increase (decrease) in net assets resulting from operations | | | 235,148,729 | | | | (171,628,354 | ) | | | (658,448 | ) | | | (890,869 | ) |
| | | | | | | | |
| | | | | | | | | | | | | | | | |
Dividends and Distributions to Shareholders From | | | | | | | | | | | | | | | | |
Net investment income: | | | | | | | | | | | | | | | | |
Institutional | | | (6,472,682 | ) | | | (4,255,273 | ) | | | (6,994 | ) | | | (54,178 | ) |
Investor A | | | (12,596,485 | ) | | | (7,643,972 | ) | | | – | | | | (17,212 | ) |
Investor B | | | (256,431 | ) | | | (108,168 | ) | | | – | | | | – | |
Investor C | | | (2,987,927 | ) | | | (1,292,699 | ) | | | – | | | | (5,391 | ) |
Tax return of capital: | | | | | | | | | | | | | | | | |
Institutional | | | – | | | | – | | | | – | | | | (14,591 | ) |
Investor A | | | – | | | | – | | | | – | | | | (4,882 | ) |
Investor C | | | – | | | | – | | | | – | | | | (1,788 | ) |
Net realized gain: | | | | | | | | | | | | | | | | |
Institutional | | | (6,605,013 | ) | | | – | | | | – | | | | (48,469 | ) |
Investor A | | | (15,831,908 | ) | | | – | | | | – | | | | (16,216 | ) |
Investor B | | | (545,981 | ) | | | – | | | | – | | | | – | |
Investor C | | | (5,160,872 | ) | | | – | | | | – | | | | (5,939 | ) |
| | | | | | | | |
Decrease in net assets resulting from dividends and distributions to shareholders | | | (50,457,299 | ) | | | (13,300,112 | ) | | | (6,994 | ) | | | (168,666 | ) |
| | | | | | | | |
| | | | | | | | | | | | | | | | |
Capital Share Transactions | | | | | | | | | | | | | | | | |
Net increase (decrease) in net assets derived from capital share transactions | | | (85,989,561 | ) | | | 198,994,525 | | | | (42,202 | ) | | | 6,780,995 | |
| | | | | | | | |
| | | | | | | | | | | | | | | | |
Redemption Fees | | | | | | | | | | | | | | | | |
Redemption fees | | | – | | | | 85,902 | | | | – | | | | 218 | |
| | | | | | | | |
| | | | | | | | | | | | | | | | |
Net Assets | | | | | | | | | | | | | | | | |
Total increase (decrease) in net assets | | | 98,701,869 | | | | 14,151,961 | | | | (707,644 | ) | | | 5,721,678 | |
Beginning of period | | | 1,101,068,977 | | | | 1,086,917,016 | | | | 10,400,550 | | | | 4,678,872 | |
| | | | | | | | |
End of period | | $ | 1,199,770,846 | | | $ | 1,101,068,977 | | | $ | 9,692,906 | | | $ | 10,400,550 | |
| | | | | | | | |
Accumulated net investment loss | | $ | (43,606,504 | ) | | $ | (15,133,630 | ) | | $ | (105,782 | ) | | $ | (63,443 | ) |
| | | | | | | | |
| | 1 | Consolidated Statements of Changes in Net Assets. |
See Notes to Financial Statements.
| | | | | | |
| | | | | | | |
| 28 | | BLACKROCK FUNDS | | MARCH 31, 2012 | | |
| | |
| | |
Financial Highlights | | BlackRock All-Cap Energy & Resources Portfolio |
| | | | | | | | | | | | | | | | | | | | | | | | | | | | | | | | | | | | | | | | | | | | | | | | | | |
| | | Institutional | | | | | Service | |
| | | | | |
| | | Six Months
Ended
March 31,
2012
(Unaudited) | | | Year Ended September 30, | | | | | Six Months
Ended
March 31,
2012
(Unaudited) | | | Year Ended September 30, | |
| | | | 2011 | | | 2010 | | | 2009 | | | 2008 | | | 2007 | | | | | 2011 | | | 2010 | | | 2009 | | | 2008 | | | 2007 | |
Per Share Operating Performance | | | | | | | | | | | | | | | | | | | | | | | | | | | | | | | | | | | | | | | | | | | |
Net asset value, beginning of period | | $ | 12.14 | | | $ | 13.76 | | | $ | 12.46 | | | $ | 16.20 | | | $ | 19.40 | | | $ | 13.85 | | | | | $ | 11.90 | | | $ | 13.49 | | | $ | 12.24 | | | $ | 16.01 | | | $ | 19.19 | | | $ | 13.75 | |
Net investment income (loss)1 | | | 0.00 | 2 | | | 0.01 | | | | 0.02 | | | | 0.02 | | | | 0.24 | | | | 0.05 | | | | | | (0.02 | ) | | | (0.05 | ) | | | (0.03 | ) | | | (0.03 | ) | | | 0.12 | | | | (0.02 | ) |
Net realized and unrealized gain (loss) | | | 2.12 | | | | (1.51 | )3 | | | 1.38 | 3 | | | (2.14 | )3 | | | (2.90 | )3 | | | 5.90 | 3 | | | | | 2.07 | | | | (1.47 | )3 | | | 1.35 | 3 | | | (2.12 | )3 | | | (2.83 | )3 | | | 5.86 | 3 |
Net increase (decrease) from investment operations | | | 2.12 | | | | (1.50 | ) | | | 1.40 | | | | (2.12 | ) | | | (2.66 | ) | | | 5.95 | | | | | | 2.05 | | | | (1.52 | ) | | | 1.32 | | | | (2.15 | ) | | | (2.71 | ) | | | 5.84 | |
Dividends and distributions from: | | | | | | | | | | | | | | | | | | | | | | | | | | | | | | | | | | | | | | | | | | | | | | | | | | |
Net investment income | | | – | | | | (0.12 | ) | | | (0.10 | ) | | | – | | | | (0.23 | ) | | | – | | | | | | – | | | | (0.07 | ) | | | (0.07 | ) | | | – | | | | (0.16 | ) | | | – | |
Net realized gain | | | – | | | | – | | | | – | | | | (1.62 | ) | | | (0.31 | ) | | | (0.40 | ) | | | | | – | | | | – | | | | – | | | | (1.62 | ) | | | (0.31 | ) | | | (0.40 | ) |
Total dividends and distributions | | | – | | | | (0.12 | ) | | | (0.10 | ) | | | (1.62 | ) | | | (0.54 | ) | | | (0.40 | ) | | | | | – | | | | (0.07 | ) | | | (0.07 | ) | | | (1.62 | ) | | | (0.47 | ) | | | (0.40 | ) |
Net asset value, end of period | | $ | 14.26 | | | $ | 12.14 | | | $ | 13.76 | | | $ | 12.46 | | | $ | 16.20 | | | $ | 19.40 | | | | | $ | 13.95 | | | $ | 11.90 | | | $ | 13.49 | | | $ | 12.24 | | | $ | 16.01 | | | $ | 19.19 | |
| | | | | | | | | | | | | | | | | | | | | | | | | | | | | | | | | | | | | | | | | | | | | | | | | | |
Total Investment Return4 | | | | | | | | | | | | | | | | | | | | | | | | | | | |
Based on net asset value | | | 17.46% | 5 | | | (11.10)% | 6 | | | 11.32% | 6 | | | (7.53)% | 6 | | | (14.25)% | 6 | | | 43.66% | 6 | | | | | 17.23% | 5 | | | (11.36)% | 6 | | | 10.79% | 6 | | | (7.85)% | 6 | | | (14.59)% | 6 | | | 43.16% | 6 |
| | | | | | | | | | | | | | | | | | | | | | | | | | | | | | | | | | | | | | | | | | | | | | | | | | |
Ratios to Average Net Assets | | | | | | | | | | | | | | | | | | | | | | | | | | | |
Total expenses | | | 0.94% | 7 | | | 0.93% | | | | 0.94% | | | | 0.98% | | | | 0.89% | | | | 0.93% | | | | | | 1.27% | 7 | | | 1.27% | | | | 1.34% | | | | 1.54% | | | | 1.25% | | | | 1.42% | |
Total expenses excluding recoupment of past waived fees | | | 0.94% | 7 | | | 0.91% | | | | 0.93% | | | | 0.97% | | | | 0.89% | | | | 0.93% | | | | | | 1.27% | 7 | | | 1.24% | | | | 1.27% | | | | 1.47% | | | | 1.25% | | | | 1.42% | |
Total expenses after fees waived, reimbursed and paid indirectly | | | 0.93% | 7 | | | 0.93% | | | | 0.93% | | | | 0.93% | | | | 0.89% | | | | 0.93% | | | | | | 1.27% | 7 | | | 1.26% | | | | 1.34% | | | | 1.35% | | | | 1.25% | | | | 1.33% | |
Net investment income (loss) | | | 0.05% | 7 | | | 0.03% | | | | 0.16% | | | | 0.17% | | | | 1.14% | | | | 0.31% | | | | | | (0.28)% | 7 | | | (0.30)% | | | | (0.25)% | | | | (0.26)% | | | | 0.56% | | | | (0.11)% | |
| | | | | | | | | | | | | | | | | | | | | | | | | | | | | | | | | | | | | | | | | | | | | | | | | | |
Supplemental Data | | | | | | | | | | | | | | | | | | | | | | | | | | | |
Net assets, end of period (000) | | $ | 439,071 | | | $ | 400,269 | | | $ | 420,071 | | | $ | 328,434 | | | $ | 510,804 | | | $ | 598,747 | | | | | $ | 4,944 | | | $ | 4,816 | | | $ | 4,231 | | | $ | 3,426 | | | $ | 4,836 | | | $ | 3,435 | |
Portfolio turnover | | | 13% | | | | 22% | | | | 38% | | | | 22% | | | | 38% | | | | 31% | | | | | | 13% | | | | 22% | | | | 38% | | | | 22% | | | | 38% | | | | 31% | |
| | 1 | Based on average shares outstanding. |
| | 2 | Less than $0.01 per share. |
| | 3 | Includes redemption fees, which are less than $0.01 per share. |
| | 4 | Where applicable, total investment returns exclude the effects of any sales charges and include the reinvestment of dividends and distributions. |
| | 5 | Aggregate total investment return. |
| | 6 | Redemption fee of 2.00% is reflected in total return calculations. There was no impact to the return. |
| | | | | | |
See Notes to Financial Statements. | | | | |
| | | | | | | |
| | BLACKROCK FUNDS | | MARCH 31, 2012 | | 29 |
| | |
| | |
Financial Highlights (continued) | | BlackRock All-Cap Energy & Resources Portfolio |
| | | | | | | | | | | | | | | | | | | | | | | | | | | | | | | | | | | | | | | | | | | | | | | | | | |
| | | Investor A | | | | | Investor B | |
| | | | | |
| | | Six Months
Ended
March 31,
2012
(Unaudited) | | | Year Ended September 30, | | | | | Six Months
Ended
March 31,
2012
(Unaudited) | | | Year Ended September 30, | |
| | | | 2011 | | | 2010 | | | 2009 | | | 2008 | | | 2007 | | | | | 2011 | | | 2010 | | | 2009 | | | 2008 | | | 2007 | |
Per Share Operating Performance | | | | | | | | | | | | | | | | | | | | | | | | | | | |
Net asset value, beginning of period | | $ | 11.90 | | | $ | 13.50 | | | $ | 12.24 | | | $ | 16.01 | | | $ | 19.18 | | | $ | 13.75 | | | | | $ | 11.45 | | | $ | 13.03 | | | $ | 11.84 | | | $ | 15.68 | | | $ | 18.82 | | | $ | 13.59 | |
Net investment income (loss)1 | | | (0.02 | ) | | | (0.06 | ) | | | (0.03 | ) | | | (0.02 | ) | | | 0.17 | | | | (0.02 | ) | | | | | (0.07 | ) | | | (0.18 | ) | | | (0.13 | ) | | | (0.09 | ) | | | 0.01 | | | | (0.13 | ) |
Net realized and unrealized gain (loss) | | | 2.06 | | | | (1.47 | )2 | | | 1.35 | 2 | | | (2.13 | )2 | | | (2.87 | )2 | | | 5.85 | 2 | | | | | 1.98 | | | | (1.40 | )2 | | | 1.32 | 2 | | | (2.13 | )2 | | | (2.81 | )2 | | | 5.76 | 2 |
Net increase (decrease) from investment operations | | | 2.04 | | | | (1.53 | ) | | | 1.32 | | | | (2.15 | ) | | | (2.70 | ) | | | 5.83 | | | | | | 1.91 | | | | (1.58 | ) | | | 1.19 | | | | (2.22 | ) | | | (2.80 | ) | | | 5.63 | |
Dividends and distributions from: | | | | | | | | | | | | | | | | | | | | | | | | | | | | | | | | | | | | | | | | | | | | | | | | | | |
Net investment income | | | – | | | | (0.07 | ) | | | (0.06 | ) | | | – | | | | (0.16 | ) | | | – | | | | | | – | | | | – | | | | – | | | | – | | | | (0.03 | ) | | | – | |
Net realized gain | | | – | | | | – | | | | – | | | | (1.62 | ) | | | (0.31 | ) | | | (0.40 | ) | | | | | – | | | | – | | | | – | | | | (1.62 | ) | | | (0.31 | ) | | | (0.40 | ) |
Total dividends and distributions | | | – | | | | (0.07 | ) | | | (0.06 | ) | | | (1.62 | ) | | | (0.47 | ) | | | (0.40 | ) | | | | | – | | | | – | | | | – | | | | (1.62 | ) | | | (0.34 | ) | | | (0.40 | ) |
Net asset value, end of period | | $ | 13.94 | | | $ | 11.90 | | | $ | 13.50 | | | $ | 12.24 | | | $ | 16.01 | | | $ | 19.18 | | | | | $ | 13.36 | | | $ | 11.45 | | | $ | 13.03 | | | $ | 11.84 | | | $ | 15.68 | | | $ | 18.82 | |
| | | | | | | | | | | | | | | | | | | | | | | | | | | | | | | | | | | | | | | | | | | | | | | | | | |
Total Investment Return3 | | | | | | | | | | | | | | | | | | | | | | | | | | | |
Based on net asset value | | | 17.14% | 4 | | | (11.46)% | 5 | | | 10.84% | 5 | | | (7.85)% | 5 | | | (14.55)% | 5 | | | 43.09% | 5 | | | | | 16.68% | 4 | | | (12.13)% | 5 | | | 10.05% | 5 | | | (8.56)% | 5 | | | (15.23)% | 5 | | | 42.11% | 5 |
| | | | | | | | | | | | | | | | | | | | | | | | | | | | | | | | | | | | | | | | | | | | | | | | | | |
Ratios to Average Net Assets | | | | | | | | | | | | | | | | | | | | | | | | | | | |
Total expenses | | | 1.34% | 6 | | | 1.35% | | | | 1.34% | | | | 1.48% | | | | 1.27% | | | | 1.34% | | | | | | 2.19% | 6 | | | 2.11% | | | | 2.17% | | | | 2.35% | | | | 2.09% | | | | 2.23% | |
Total expenses excluding recoupment of past waived fees | | | 1.34% | 6 | | | 1.28% | | | | 1.32% | | | | 1.45% | | | | 1.27% | | | | 1.34% | | | | | | 2.19% | 6 | | | 2.09% | | | | 2.16% | | | | 2.33% | | | | 2.09% | | | | 2.23% | |
Total expenses after fees waived, reimbursed and paid indirectly | | | 1.34% | 6 | | | 1.34% | | | | 1.34% | | | | 1.34% | | | | 1.26% | | | | 1.31% | | | | | | 2.10% | 6 | | | 2.10% | | | | 2.10% | | | | 2.06% | | | | 2.04% | | | | 2.04% | |
Net investment income (loss) | | | (0.35)% | 6 | | | (0.38)% | | | | (0.25)% | | | | (0.25)% | | | | 0.81% | | | | (0.10)% | | | | | | (1.11)% | 6 | | | (1.15)% | | | | (1.03)% | | | | (0.95)% | | | | 0.06% | | | | (0.82)% | |
| | | | | | | | | | | | | | | | | | | | | | | | | | | | | | | | | | | | | | | | | | | | | | | | | | |
Supplemental Data | | | | | | | | | | | | | | | | | | | | | | | | | | | |
Net assets, end of period (000) | | $ | 195,786 | | | $ | 187,017 | | | $ | 207,523 | | | $ | 178,364 | | | $ | 267,422 | | | $ | 347,598 | | | | | $ | 18,705 | | | $ | 18,872 | | | $ | 27,113 | | | $ | 30,873 | | | $ | 42,399 | | | $ | 55,538 | |
Portfolio turnover | | | 13% | | | | 22% | | | | 38% | | | | 22% | | | | 38% | | | | 31% | | | | | | 13% | | | | 22% | | | | 38% | | | | 22% | | | | 38% | | | | 31% | |
| | 1 | Based on average shares outstanding. |
| | 2 | Includes redemption fees, which are less than $0.01 per share. |
| | 3 | Where applicable, total investment returns exclude the effects of any sales charges and include the reinvestment of dividends and distributions. |
| | 4 | Aggregate total investment return. |
| | 5 | Redemption fee of 2.00% is reflected in total return calculations. There was no impact to the return. |
| | | | | | |
See Notes to Financial Statements. | | | | |
| | | | | | | |
| 30 | | BLACKROCK FUNDS | | MARCH 31, 2012 | | |
| | |
| | |
Financial Highlights (concluded) | | BlackRock All-Cap Energy & Resources Portfolio |
| | | | | | | | | | | | | | | | | | | | | | | | |
| | | Investor C | |
| | |
| | | Six Months
Ended
March 31,
2012
(Unaudited) | | | Year Ended September 30, | |
| | | | 2011 | | | 2010 | | | 2009 | | | 2008 | | | 2007 | |
Per Share Operating Performance | | | | | | | | | | | | | | | | | | | | | | | | |
Net asset value, beginning of period | | $ | 11.47 | | | $ | 13.04 | | | $ | 11.85 | | | $ | 15.69 | | | $ | 18.84 | | | $ | 13.60 | |
Net investment income (loss)1 | | | (0.07 | ) | | | (0.17 | ) | | | (0.13 | ) | | | (0.09 | ) | | | 0.02 | | | | (0.13 | ) |
Net realized and unrealized gain (loss) | | | 1.98 | | | | (1.40 | )2 | | | 1.32 | 2 | | | (2.13 | )2 | | | (2.82 | )2 | | | 5.77 | 2 |
Net increase (decrease) from investment operations | | | 1.91 | | | | (1.57 | ) | | | 1.19 | | | | (2.22 | ) | | | (2.80 | ) | | | 5.64 | |
Dividends and distributions from: | | | | | | | | | | | | | | | | | | | | | | | | |
Net investment income | | | – | | | | – | | | | – | | | | – | | | | (0.04 | ) | | | – | |
Net realized gain | | | – | | | | – | | | | – | | | | (1.62 | ) | | | (0.31 | ) | | | (0.40 | ) |
Total dividends and distributions | | | – | | | | – | | | | – | | | | (1.62 | ) | | | (0.35 | ) | | | (0.40 | ) |
Net asset value, end of period | | $ | 13.38 | | | $ | 11.47 | | | $ | 13.04 | | | $ | 11.85 | | | $ | 15.69 | | | $ | 18.84 | |
| | | | | | | | | | | | | | | | | | | | | | | | |
Total Investment Return3 | | | | | | | | | | | | | | | | | | | | | | | | |
Based on net asset value | | | 16.65% | 4 | | | (12.04)% | 5 | | | 10.04% | 5 | | | (8.54 | )%5 | | | (15.21)% | 5 | | | 42.15% | 5 |
| | | | | | | | | | | | | | | | | | | | | | | | |
Ratios to Average Net Assets | | | | | | | | | | | | | | | | | | | | | | | | |
Total expenses | | | 2.07% | 6 | | | 2.05% | | | | 2.08% | | | | 2.23% | | | | 2.02% | | | | 2.12% | |
Total expenses excluding recoupment of past waived fees | | | 2.07% | 6 | | | 2.03% | | | | 2.08% | | | | 2.21% | | | | 2.02% | | | | 2.12% | |
Total expenses after fees waived, reimbursed and paid indirectly | | | 2.07% | 6 | | | 2.04% | | | | 2.08% | | | | 2.05% | | | | 2.01% | | | | 2.04% | |
Net investment income (loss) | | | (1.08)% | 6 | | | (1.08)% | | | | (1.00)% | | | | (0.95)% | | | | 0.08% | | | | (0.83)% | |
| | | | | | | | | | | | | | | | | | | | | | | | |
Supplemental Data | | | | | | | | | | | | | | | | | | | | | | | | |
Net assets, end of period (000) | | $ | 106,813 | | | $ | 99,433 | | | $ | 116,401 | | | $ | 113,347 | | | $ | 153,512 | | | $ | 207,194 | |
Portfolio turnover | | | 13% | | | | 22% | | | | 38% | | | | 22% | | | | 38% | | | | 31% | |
| | 1 | Based on average shares outstanding. |
| | 2 | Includes redemption fees, which are less than $0.01 per share. |
| | 3 | Where applicable, total investment returns exclude the effects of any sales charges and include the reinvestment of dividends and distributions. |
| | 4 | Aggregate total investment return. |
| | 5 | Redemption fee of 2.00% is reflected in total return calculations. There was no impact to the return. |
| | | | | | |
See Notes to Financial Statements. | | | | |
| | | | | | | |
| | BLACKROCK FUNDS | | MARCH 31, 2012 | | 31 |
| | |
| | |
Financial Highlights | | BlackRock China Fund |
| | | | | | | | | | | | | | | | | | | | | | | | | | | | |
| | | Institutional | | | | | Investor A | | | | | Investor C | |
| | | Six Months Ended
March 31,
2012
(Unaudited) | | | Period April 29,
20111 to
September 30,
2011 | | | | | Six Months
Ended
March 31,
2012
(Unaudited) | | | Period April 29, 20111 to
September 30,
2011 | | | | | Six Months
Ended
March 31,
2012
(Unaudited) | | | Period April 29,
20111 to
September 30,
2011 | |
Per Share Operating Performance | |
Net asset value, beginning of period | | $ | 6.90 | | | $ | 10.00 | | | | | $ | 6.89 | | | $ | 10.00 | | | | | $ | 6.87 | | | $ | 10.00 | |
Net investment income (loss)2 | | | (0.03 | ) | | | 0.13 | | | | | | (0.05 | ) | | | 0.09 | | | | | | (0.07 | ) | | | 0.09 | |
Net realized and unrealized gain (loss) | | | 1.41 | | | | (3.23 | ) | | | | | 1.42 | | | | (3.20 | ) | | | | | 1.41 | | | | (3.22 | ) |
Net increase (decrease) from investment operations | | | 1.38 | | | | (3.10 | ) | | | | | 1.37 | | | | (3.11 | ) | | | | | 1.34 | | | | (3.13 | ) |
Dividends from net investment income | | | (0.12 | ) | | | – | | | | | | (0.12 | ) | | | – | | | | | | (0.10 | ) | | | – | |
Net asset value, end of period | | $ | 8.16 | | | $ | 6.90 | | | | | $ | 8.14 | | | $ | 6.89 | | | | | $ | 8.11 | | | $ | 6.87 | |
| | | | | | | | | | | | | | | | | | | | | | | | | | | | |
Total Investment Return3 | |
Based on net asset value | | | 20.27% | | | | (31.00)% | | | | | | 20.10% | | | | (31.10)% | | | | | | 19.71% | | | | (31.30)% | |
| | | | | | | | | | | | | | | | | | | | | | | | | | | | |
Ratios to Average Net Assets4 | |
Total expenses | | | 12.26% | | | | 9.67% | 5 | | | | | 13.81% | | | | 12.18% | 5 | | | | | 13.83% | | | | 11.73% | 5 |
Total expenses after fees waived and reimbursed | | | 1.65% | | | | 1.65% | | | | | | 1.90% | | | | 1.90% | | | | | | 2.65% | | | | 2.65% | |
Net investment income (loss) | | | (0.82)% | | | | 3.39% | | | | | | (1.14)% | | | | 2.47% | | | | | | (1.80)% | | | | 2.30% | |
| | | | | | | | | | | | | | | | | | | | | | | | | | | | |
Supplemental Data | |
Net assets, end of period (000) | | $ | 2,458 | | | $ | 2,049 | | | | | $ | 170 | | | $ | 51 | | | | | $ | 32 | | | $ | 19 | |
Portfolio turnover | | | 20% | | | | 14% | | | | | | 20% | | | | 14% | | | | | | 20% | | | | 14% | |
| | 1 | Commencement of operations. |
| | 2 | Based on average shares outstanding. |
| | 3 | Aggregate total investment return. |
| | 5 | Organization costs were not annualized in the calculation of the expense ratios. If these expenses were annualized, the total expenses for Institutional, Investor A and Investor C would have been 13.81%, 18.86% and 16.54%, respectively. |
| | | | | | |
See Notes to Financial Statements. | | | | |
| | | | | | | |
| 32 | | BLACKROCK FUNDS | | MARCH 31, 2012 | | |
| | |
| | |
Financial Highlights | | BlackRock Energy & Resources Portfolio |
| | | | | | | | | | | | | | | | | | | | | | | | | | | | | | | | | | | | | | | | | | | | | | | | | | |
| | | Institutional | | | | | Investor A | |
| | | | | |
| | | Six Months
Ended
March 31, | | | Year Ended September 30, | | | | | Six Months
Ended
March 31, | | | Year Ended September 30, | |
| | | 2012 (Unaudited) | | | 2011 | | | 2010 | | | 2009 | | | 2008 | | | 2007 | | | | | 2012 (Unaudited) | | | 2011 | | | 2010 | | | 2009 | | | 2008 | | | 2007 | |
Per Share Operating Performance | | | | | | | | | | | | | | | | | | | | | | | | | | | |
Net asset value, beginning of period | | $ | 31.70 | | | $ | 34.98 | | | $ | 32.61 | | | $ | 51.31 | | | $ | 63.42 | | | $ | 68.57 | | | | | $ | 27.73 | | | $ | 30.63 | | | $ | 28.67 | | | $ | 47.29 | | | $ | 59.02 | | | $ | 64.90 | |
Net investment income (loss)1 | | | (0.11) | | | | (0.08) | | | | 0.05 | | | | (0.07) | | | | (0.13) | | | | (0.02) | | | | | | (0.16) | | | | (0.20) | | | | (0.12) | | | | (0.13) | | | | (0.32) | | | | (0.16) | |
Net realized and unrealized gain (loss) | | | 7.08 | | | | (2.68) | | | | 2.31 | | | | (9.60) | | | | (2.78) | | | | 14.26 | | | | | | 6.21 | | | | (2.34) | | | | 2.08 | | | | (9.46) | | | | (2.29) | | | | 13.41 | |
Net increase (decrease) from investment operations | | | 6.97 | | | | (2.76) | | | | 2.36 | | | | (9.67) | | | | (2.91) | | | | 14.24 | | | | | | 6.05 | | | | (2.54) | | | | 1.96 | | | | (9.59) | | | | (2.61) | | | | 13.25 | |
Dividends and distributions from: | | | | | | | | | | | | | | | | | | | | | | | | | | | | | | | | | | | | | | | | | | | | | | | | | | |
Net investment income | | | (0.72) | | | | (0.52) | | | | – | | | | – | | | | (2.01) | | | | (0.81) | | | | | | (0.59) | | | | (0.36) | | | | – | | | | – | | | | (1.92) | | | | (0.55) | |
Net realized gain | | | (0.74) | | | | – | | | | – | | | | (9.04) | | | | (7.22) | | | | (18.58) | | | | | | (0.74) | | | | – | | | | – | | | | (9.04) | | | | (7.22) | | | | (18.58) | |
Total dividends and distributions | | | (1.46) | | | | (0.52) | | | | – | | | | (9.04) | | | | (9.23) | | | | (19.39) | | | | | | (1.33) | | | | (0.36) | | | | – | | | | (9.04) | | | | (9.14) | | | | (19.13) | |
Redemption fees added to paid-in capital | | | – | | | | 0.00 | 2 | | | 0.01 | | | | 0.01 | | | | 0.03 | | | | 0.00 | 2 | | | | | – | | | | 0.00 | 2 | | | 0.00 | 2 | | | 0.01 | | | | 0.02 | | | | 0.00 | 2 |
Net asset value, end of period | | $ | 37.21 | | | $ | 31.70 | | | $ | 34.98 | | | $ | 32.61 | | | $ | 51.31 | | | $ | 63.42 | | | | | $ | 32.45 | | | $ | 27.73 | | | $ | 30.63 | | | $ | 28.67 | | | $ | 47.29 | | | $ | 59.02 | |
| | | | | | | | | | | | | | | | | | | | | | | | | | | | | | | | | | | | | | | | | | | | | | | | | | |
Total Investment Return3 | | | | | | | | | | | | | | | | | | | | | | | | | | | |
Based on net asset value | | | 21.99% | 4 | | | (8.28)% | | | | 7.27% | 5,6 | | | (7.64)% | 7,8 | | | (6.77)% | 6 | | | 23.55% | 9 | | | | | 21.79% | 4 | | | (8.61)% | | | | 6.84% | 9,10 | | | (8.20)% | 6,11 | | | (6.78)% | 8 | | | 23.25% | 9 |
| | | | | | | | | | | | | | | | | | | | | | | | | | | | | | | | | | | | | | | | | | | | | | | | | | |
Ratios to Average Net Assets | | | | | | | | | | | | | | | | | | | | | | | | | | | |
Total expenses | | | 0.99% | 12 | | | 0.93% | | | | 0.97% | | | | 1.00% | | | | 0.92% | | | | 1.07% | | | | | | 1.35% | 12 | | | 1.28% | | | | 1.35% | | | | 1.40% | | | | 1.25% | | | | 1.30% | |
Total expenses excluding recoupment of past waived fees | | | 0.98% | 12 | | | 0.93% | | | | 0.97% | | | | 0.98% | | | | 0.92% | | | | 1.07% | | | | | | 1.33% | 12 | | | 1.26% | | | | 1.31% | | | | 1.38% | | | | 1.25% | | | | 1.30% | |
Total expenses after fees waived, reimbursed and paid indirectly | | | 0.99% | 12 | | | 0.92% | | | | 0.97% | | | | 0.99% | | | | 0.92% | | | | 1.03% | | | | | | 1.35% | 12 | | | 1.27% | | | | 1.35% | | | | 1.31% | | | | 1.25% | | | | 1.29% | |
Net investment income (loss) | | | (0.60)% | 12 | | | (0.18)% | | | | 0.13% | | | | (0.25)% | | | | (0.18)% | | | | (0.03)% | | | | | | (0.96)% | 12 | | | (0.52)% | | | | (0.39)% | | | | (0.55)% | | | | (0.49)% | | | | (0.28)% | |
| | | | | | | | | | | | | | | | | | | | | | | | | | | | | | | | | | | | | | | | | | | | | | | | | | |
Supplemental Data | | | | | | | | | | | | | | | | | | | | | | | | | | | | | | | | | | | | | | | | | | | | | | | | | | |
Net assets, end of period (000) | | $ | 336,534 | | | $ | 306,403 | | | $ | 274,009 | | | $ | 134,187 | | | $ | 82,147 | | | $ | 37,498 | | | | | $ | 683,675 | | | $ | 632,030 | | | $ | 644,786 | | | $ | 636,437 | | | $ | 689,646 | | | $ | 685,590 | |
Portfolio turnover | | | 9% | | | | 40% | | | | 16% | | | | 25% | | | | 32% | | | | 15% | | | | | | 9% | | | | 40% | | | | 16% | �� | | | 25% | | | | 32% | | | | 15% | |
| | 1 | Based on average shares outstanding. |
| | 2 | Less than $0.01 per share. |
| | 3 | Where applicable, total investment returns exclude the effects of any sales charges and include the reinvestment of dividends and distributions. |
| | 4 | Aggregate total investment return. |
| | 5 | Includes proceeds received from a settlement of litigation, which impacted the Fund’s total return. Excluding these proceeds, the Fund’s total return would have been 7.20%. |
| | 6 | Redemption fee of 2.00% is reflected in total return calculations. The impact to the return from redemption fees received during the period was an increase of 0.03%. |
| | 7 | Includes proceeds received from a settlement of litigation, which impacted the Fund’s total return. Excluding these proceeds, the Fund’s total return would have been (7.66)%. |
| | 8 | Redemption fee of 2.00% is reflected in total return calculations. The impact to the return from redemption fees received during the period was an increase of 0.02%. |
| | 9 | Redemption fee of 2.00% is reflected in total return calculations. There was no impact to the return. |
| | 10 | Includes proceeds received from a settlement of litigation, which impacted the Fund’s total return. Excluding these proceeds, the Fund’s total return would have been 6.77%. |
| | 11 | Includes proceeds received from a settlement of litigation, which impacted the Fund’s total return. Excluding these proceeds, the Fund’s total return would have been (8.23)%. |
See Notes to Financial Statements.
| | | | | | |
| | | | | | | |
| | BLACKROCK FUNDS | | MARCH 31, 2012 | | 33 |
| | |
| | |
Financial Highlights (concluded) | | BlackRock Energy & Resources Portfolio |
| | | | | | | | | | | | | | | | | | | | | | | | | | | | | | | | | | | | | | | | | | | | | | | | | | |
| | | Investor B | | | | | Investor C | |
| | | | | |
| | | Six Months
Ended | | | Year Ended September 30, | | | | | Six Months
Ended | | | Year Ended September 30, | |
| | | March 31, 2012 (Unaudited) | | | 2011 | | | 2010 | | | 2009 | | | 2008 | | | 2007 | | | | | March 31, 2012 (Unaudited) | | | 2011 | | | 2010 | | | 2009 | | | 2008 | | | 2007 | |
Per Share Operating Performance | | | | | | | | | | | | | | | | | | | | | | | | | | | |
Net asset value, beginning of period | | $ | 20.65 | | | $ | 22.86 | | | $ | 21.56 | | | $ | 39.68 | | | $ | 50.87 | | | $ | 58.19 | | | | | $ | 20.55 | | | $ | 22.81 | | | $ | 21.51 | | | $ | 39.61 | | | $ | 50.84 | | | $ | 58.19 | |
Net investment loss1 | | | (0.21) | | | | (0.38) | | | | (0.27) | | | | (0.22) | | | | (0.67) | | | | (0.50) | | | | | | (0.21) | | | | (0.37) | | | | (0.24) | | | | (0.22) | | | | (0.66) | | | | (0.50) | |
Net realized and unrealized gain (loss) | | | 4.63 | | | | (1.73) | | | | 1.57 | | | | (8.87) | | | | (1.81) | | | | 11.82 | | | | | | 4.60 | | | | (1.69) | | | | 1.54 | | | | (8.85) | | | | (1.79) | | | | 11.83 | |
Net increase (decrease) from investment operations | | | 4.42 | | | | (2.11) | | | | 1.30 | | | | (9.09) | | | | (2.48) | | | | 11.32 | | | | | | 4.39 | | | | (2.06) | | | | 1.30 | | | | (9.07) | | | | (2.45) | | | | 11.33 | |
Dividends and distributions from: | | | | | | | | | | | | | | | | | | | | | | | | | | | | | | | | | | | | | | | | | | | | | | | | | | |
Net investment income | | | (0.35) | | | | (0.10) | | | | – | | | | – | | | | (1.51) | | | | (0.06) | | | | | | (0.43) | | | | (0.20) | | | | – | | | | – | | | | (1.58) | | | | (0.04) | |
Net realized gain | | | (0.74) | | | | – | | | | – | | | | (9.04) | | | | (7.22) | | | | (18.58) | | | | | | (0.74) | | | | – | | | | – | | | | (9.04) | | | | (7.22) | | | | (18.58) | |
Total dividends and distributions | | | (1.09) | | | | (0.10) | | | | – | | | | (9.04) | | | | (8.73) | | | | (18.64) | | | | | | (1.17) | | | | (0.20) | | | | – | | | | (9.04) | | | | (8.80) | | | | (18.62) | |
Redemption fees added to paid-in capital | | | – | | | | 0.00 | 2 | | | 0.00 | 2 | | | 0.01 | | | | 0.02 | | | | 0.00 | 2 | | | | | – | | | | 0.00 | 2 | | | 0.00 | 2 | | | 0.01 | | | | 0.02 | | | | 0.00 | 2 |
Net asset value, end of period | | $ | 23.98 | | | $ | 20.65 | | | $ | 22.86 | | | $ | 21.56 | | | $ | 39.68 | | | $ | 50.87 | | | | | $ | 23.77 | | | $ | 20.55 | | | $ | 22.81 | | | $ | 21.51 | | | $ | 39.61 | | | $ | 50.84 | |
| | | | | | | | | | | | | | | | | | | | | | | | | | | | | | | | | | | | | | | | | | | | | | | | | | |
Total Investment Return3 | | | | | | | | | | | | | | | | | | | | | | | | | | | | | | | | | | | | | | | | | | | | | | | | | | |
Based on net asset value | | | 21.36% | 4 | | | (9.33)% | | | | 6.03% | 5,6 | | | (8.74)% | 7,8 | | | (7.63)% | 9 | | | 22.35% | 6 | | | | | 21.32% | 4 | | | (9.25)% | | | | 6.04% | 6,10 | | | (8.68)% | 8,11 | | | (7.57)% | 9 | | | 22.36% | 6 |
| | | | | | | | | | | | | | | | | | | | | | | | | | | | | | | | | | | | | | | | | | | | | | | | | | |
Ratios to Average Net Assets | | | | | | | | | | | | | | | | | | | | | | | | | | | | | | | | | | | | | | | | | | | | | | | | | | |
Total expenses | | | 2.15% | 12 | | | 2.07% | | | | 2.10% | | | | 2.25% | | | | 2.01% | | | | 2.08% | | | | | | 2.06% | 12 | | | 2.04% | | | | 2.06% | | | | 2.16% | | | | 1.96% | | | | 2.02% | |
Total expenses excluding recoupment of past waived fees | | | 2.15% | 12 | | | 2.03% | | | | 2.10% | | | | 2.23% | | | | 2.01% | | | | 2.08% | | | | | | 2.05% | 12 | | | 1.99% | | | | 2.05% | | | | 2.16% | | | | 1.96% | | | | 2.02% | |
Total expenses after fees waived, reimbursed and paid indirectly | | | 2.10% | 12 | | | 2.07% | | | | 2.09% | | | | 2.05% | | | | 2.00% | | | | 2.03% | | | | | | 2.06% | 12 | | | 2.03% | | | | 2.05% | | | | 2.05% | | | | 1.96% | | | | 2.01% | |
Net investment loss | | | (1.70)% | 12 | | | (1.31)% | | | | (1.17)% | | | | (1.28)% | | | | (1.24)% | | | | (1.01)% | | | | | | (1.67)% | 12 | | | (1.29)% | | | | (1.07)% | | | | (1.29)% | | | | (1.21)% | | | | (1.00)% | |
| | | | | | | | | | | | | | | | | | | | | | | | | | | | | | | | | | | | | | | | | | | | | | | | | | |
Supplemental Data | | | | | | | | | | | | | | | | | | | | | | | | | | | | | | | | | | | | | | | | | | | | | | | | | | |
Net assets, end of period (000) | | $ | 13,139 | | | $ | 16,450 | | | $ | 25,633 | | | $ | 34,218 | | | $ | 57,174 | | | $ | 80,178 | | | | | $ | 166,423 | | | $ | 146,186 | | | $ | 142,490 | | | $ | 129,556 | | | $ | 151,409 | | | $ | 144,300 | |
Portfolio turnover | | | 9% | | | | 40% | | | | 16% | | | | 25% | | | | 32% | | | | 15% | | | | | | 9% | | | | 40% | | | | 16% | | | | 25% | | | | 32% | | | | 15% | |
| | 1 | Based on average shares outstanding. |
| | 2 | Less than $0.01 per share. |
| | 3 | Where applicable, total investment returns exclude the effects of any sales charges and include the reinvestment of dividends and distributions. |
| | 4 | Aggregate total investment return. |
| | 5 | Includes proceeds received from a settlement of litigation, which impacted the Fund’s total return. Excluding these proceeds, the Fund’s total return would have been 5.94%. |
| | 6 | Redemption fee of 2.00% is reflected in total return calculations. There was no impact to the return. |
| | 7 | Includes proceeds received from a settlement of litigation, which impacted the Fund’s total return. Excluding these proceeds, the Fund’s total return would have been (8.77)%. |
| | 8 | Redemption fee of 2.00% is reflected in total return calculations. The impact to the return from redemption fees received during the period was an increase of 0.04%. |
| | 9 | Redemption fee of 2.00% is reflected in total return calculations. The impact to the return from redemption fees received during the period was an increase of 0.02%. |
| | 10 | Includes proceeds received from a settlement of litigation, which impacted the Fund’s total return. Excluding these proceeds, the Fund’s total return would have been 5.95%. |
| | 11 | Includes proceeds received from a settlement of litigation, which impacted the Fund’s total return. Excluding these proceeds, the Fund’s total return would have been (8.71)%. |
See Notes to Financial Statements.
| | | | | | |
| | | | | | | |
| 34 | | BLACKROCK FUNDS | | MARCH 31, 2012 | | |
| | |
| | |
Financial Highlights | | BlackRock World Gold Fund |
| | | | | | | | | | | | | | | | | | | | | | | | | | | | | | | | | | | | | | | | |
| | | Institutional | | | | | Investor A | | | | | Investor C | |
| | | | | | | | | | | |
| | | Six Months
Ended March 31,
2012 (Unaudited)1 | | | Year Ended
September 30,
20111 | | | Period May 26, 20102 to
September 30, 2010 | | | | | Six Months
Ended March 31,
2012 (Unaudited)1 | | | Year Ended
September 30,
20111 | | | Period May 26,
20102 to September 30, 2010 | | | | | Six Months
Ended March 31,
2012 (Unaudited)1 | | | Year Ended
September 30,
20111 | | | Period May 26,
20102 to
September 30,
2010 | |
Per Share Operating Performance | |
Net asset value, beginning of period | | $ | 11.13 | | | $ | 12.07 | | | $ | 10.00 | | | | | $ | 11.10 | | | $ | 12.05 | | | $ | 10.00 | | | | | $ | 11.00 | | | $ | 12.02 | | | $ | 10.00 | |
Net investment income (loss)3 | | | (0.02 | ) | | | (0.02 | ) | | | (0.01 | ) | | | | | (0.03 | ) | | | (0.04 | ) | | | 0.00 | 4 | | | | | (0.07 | ) | | | (0.13 | ) | | | (0.04 | ) |
Net realized and unrealized gain (loss)5 | | | (0.65 | ) | | | (0.63 | ) | | | 2.08 | | | | | | (0.65 | ) | | | (0.62 | ) | | | 2.05 | | | | | | (0.65 | ) | | | (0.62 | ) | | | 2.06 | |
Net increase (decrease) from investment operations | | | (0.67 | ) | | | (0.65 | ) | | | 2.07 | | | | | | (0.68 | ) | | | (0.66 | ) | | | 2.05 | | | | | | (0.72 | ) | | | (0.75 | ) | | | 2.02 | |
Dividends and distributions from: | | | | | | | | | | | | | | | | | | | | | | | | | | | | | | | | | | | | | | | | |
Net investment income | | | (0.02 | ) | | | (0.13 | ) | | | — | | | | | | — | | | | (0.13 | ) | | | — | | | | | | — | | | | (0.11 | ) | | | — | |
Tax return of capital | | | — | | | | (0.04 | ) | | | — | | | | | | — | | | | (0.04 | ) | | | — | | | | | | — | | | | (0.04 | ) | | | — | |
Net realized gain | | | — | | | | (0.12 | ) | | | — | | | | | | — | | | | (0.12 | ) | | | — | | | | | | — | | | | (0.12 | ) | | | — | |
Total dividends and distributions | | | (0.02 | ) | | | (0.29 | ) | | | — | | | | | | — | | | | (0.29 | ) | | | — | | | | | | — | | | | (0.27 | ) | | | — | |
Net asset value, end of period | | $ | 10.44 | | | $ | 11.13 | | | $ | 12.07 | | | | | $ | 10.42 | | | $ | 11.10 | | | $ | 12.05 | | | | | $ | 10.28 | | | $ | 11.00 | | | $ | 12.02 | |
| | | | | | | | | | | | | | | | | | | | | | | | | | | | | | | | | | | | | | | | |
Total Investment Return6 | |
Based on net asset value | | | (6.06)% | 7 | | | (5.69)% | | | | 20.70% | 7 | | | | | (6.13)% | 7 | | | (5.83)% | | | | 20.50% | 7 | | | | | (6.55)% | 7 | | | (6.57)% | | | | 20.20% | 7 |
| | | | | | | | | | | | | | | | | | | | | | | | | | | | | | | | | | | | | | | | |
Ratios to Average Net Assets | |
Total expenses | | | 2.11% | 8 | | | 4.05% | | | | 5.79% | 8,9 | | | | | 2.51% | 8 | | | 4.45% | | | | 7.16% | 8,9 | | | | | 3.22% | 8 | | | 5.14% | | | | 7.37% | 8,9 |
Total expenses after fees waived and reimbursed | | | 1.24% | 8 | | | 1.24% | | | | 1.24% | 8 | | | | | 1.49% | 8 | | | 1.49% | | | | 1.49% | 8 | | | | | 2.27% | 8 | | | 2.27% | | | | 2.27% | 8 |
Net investment income (loss) | | | (0.27)% | 8 | | | (0.15)% | | | | (0.39)% | 8 | | | | | (0.51)% | 8 | | | (0.36)% | | | | 0.07% | 8 | | | | | (1.30)% | 8 | | | (1.05)% | | | | (1.15)% | 8 |
| | | | | | | | | | | | | | | | | | | | | | | | | | | | | | | | | | | | | | | | |
Supplemental Data | |
Net assets, end of period (000) | | $ | 4,010 | | | $ | 4,432 | | | $ | 3,974 | | | | | $ | 3,033 | | | $ | 3,242 | | | $ | 572 | | | | | $ | 2,650 | | | $ | 2,726 | | | $ | 132 | |
Portfolio turnover | | | 12% | | | | 29% | | | | 1% | | | | | | 12% | | | | 29% | | | | 1% | | | | | | 12% | | | | 29% | | | | 1% | |
| | 1 | Consolidated Financial Highlights. |
| | 2 | Commencement of operations. |
| | 3 | Based on average shares outstanding. |
| | 4 | Less than $0.01 per share. |
| | 5 | Includes redemption fees, which are less than $0.01 per share. |
| | 6 | Redemption fee of 2.00% is reflected in total return calculations. There was no impact to the return. |
| | 7 | Aggregate total investment return. |
| | 9 | Organization costs were not annualized in the calculation of the expense ratios. If these expenses were annualized, the total expenses for Institutional, Investor A and Investor C would have been 6.17%, 8.00% and 7.94%, respectively. |
| | | | | | |
See Notes to Financial Statements. | | | | |
| | | | | | | |
| | BLACKROCK FUNDS | | MARCH 31, 2012 | | 35 |
| | |
| | |
Notes to Financial Statements (Unaudited) | | |
1. Organization and Significant Accounting Policies:
BlackRock FundsSM (the “Trust”) is registered under the Investment Company Act of 1940, as amended (the “1940 Act”), as an open-end management investment company. The Trust is organized as a Massachusetts business trust. BlackRock All-Cap Energy & Resources Portfolio (“All-Cap Energy & Resources”), BlackRock China Fund (“China Fund”), BlackRock Energy & Resources Portfolio (“Energy & Resources”) and BlackRock World Gold Fund (“World Gold”) (collectively, the “Funds” or individually, a “Fund”) are each a series of the Trust. The Funds are classified as non-diversified. The Funds’ financial statements are prepared in conformity with accounting principles generally accepted in the United States of America (“US GAAP”), which may require management to make estimates and assumptions that affect the reported amounts and disclosures in the financial statements. Actual results could differ from those estimates. Each Fund offers multiple classes of shares. Institutional Shares are sold without a sales charge and only to certain eligible investors. Service Shares are sold without a sales charge. Investor A Shares are generally sold with a front-end sales charge. Investor B and Investor C Shares may be subject to a CDSC. All classes of shares have identical voting, dividend, liquidation and other rights and the same terms and conditions, except that Service, Investor A, Investor B and Investor C Shares bear certain expenses related to the shareholder servicing of such shares, and Investor B and Investor C Shares also bear certain expenses related to the distribution of such shares. Investor B Shares automatically convert to Investor A Shares after approximately eight years. Investor B Shares are only available through exchanges, dividend reinvestment by existing shareholders or for purchase by certain qualified employee benefit plans. Each class has exclusive voting rights with respect to matters relating to its shareholder servicing and distribution expenditures (except that Investor B shareholders may vote on material changes to the Investor A distribution and service plan).
The following is a summary of significant accounting policies followed by the Funds:
Basis of Consolidation: The accompanying consolidated financial statements of World Gold include the accounts of BlackRock Cayman World Gold Fund 1, Ltd. (the “Subsidiary”), a wholly owned subsidiary of World Gold, which primarily invests in commodity-related instruments. The Subsidiary enables World Gold to hold these commodity-related instruments and still satisfy Regulated Investment Company (“RIC”) tax requirements. World Gold may invest up to 25% of its total assets in the Subsidiary. Intercompany accounts and transactions have been eliminated. The Subsidiary is subject to the same investment policies and restrictions that apply to World Gold.
Valuation: US GAAP defines fair value as the price the Funds would receive to sell an asset or pay to transfer a liability in an orderly transaction between market participants at the measurement date. The Funds fair value their financial instruments at market value using independent dealers or pricing services under policies approved by the Board of Trustees of the Trust (the “Board”). Equity investments traded on a recognized
securities exchange or the NASDAQ Global Market System (“NASDAQ”) are valued at the last reported sale price that day or the NASDAQ official closing price, if applicable. For equity investments traded on more than one exchange, the last reported sale price on the exchange where the stock is primarily traded is used. Equity investments traded on a recognized exchange for which there were no sales on that day are valued at the last available bid price. If no bid price is available, the prior day’s price will be used, unless it is determined that such prior day’s price no longer reflects the fair value of the security. Investments in open-end registered investment companies are valued at NAV each business day. Short-term securities with remaining maturities of 60 days or less may be valued at amortized cost, which approximates fair value.
The Funds value their investments in BlackRock Liquidity Series, LLC Money Market Series (the “Money Market Series”) at fair value, which is ordinarily based upon their pro rata ownership in the underlying fund’s net assets. The Money Market Series seeks current income consistent with maintaining liquidity and preserving capital. Although the Money Market Series is not registered under the 1940 Act, its investments will follow the parameters of investments by a money market fund that is subject to Rule 2a-7 under the 1940 Act. Each Fund may withdraw up to 25% of its investment daily, although the manager of the Money Market Series, in its sole discretion, may permit an investor to withdraw more than 25% on any one day.
Securities and other assets and liabilities denominated in foreign currencies are translated into US dollars using exchange rates determined as of the close of business on the New York Stock Exchange (“NYSE”). Foreign currency exchange contracts are valued at the mean between the bid and ask prices and are determined as of the close of business on the NYSE. Interpolated values are derived when the settlement date of the contract is an interim date for which quotations are not available.
In the event that application of these methods of valuation results in a price for an investment which is deemed not to be representative of the market value of such investment or if a price is not available, the investment will be valued in accordance with a policy approved by the Board as reflecting fair value (“Fair Value Assets”). When determining the price for Fair Value Assets, the investment advisor and/or the sub-advisor seek to determine the price that each Fund might reasonably expect to receive from the current sale of that asset in an arm’s-length transaction. Fair value determinations shall be based upon all available factors that the investment advisor and/or sub-advisor deem relevant. The pricing of all Fair Value Assets is subsequently reported to the Board or a committee thereof.
Generally, trading in foreign instruments is substantially completed each day at various times prior to the close of business on the NYSE. Occasionally, events affecting the values of such instruments may occur between the foreign market close and the close of business on the NYSE that may not be reflected in the computation of each Fund’s net assets. If events (for example, a company announcement, market volatility or a natural disaster) occur during such periods that are expected to materially affect the value of such instruments, those instruments may be Fair Value
| | | | | | |
| | | | | | | |
| 36 | | BLACKROCK FUNDS | | MARCH 31, 2012 | | |
| | |
| | |
Notes to Financial Statements (continued) | | |
Assets and be valued at their fair value, as determined in good faith by the investment advisor using a pricing service and/or policies approved by the Board. Each business day, the Funds use a pricing service to assist with the valuation of certain foreign exchange-traded equity securities and foreign exchange-traded and over-the-counter (“OTC”) options (the “Systematic Fair Value Price”). Using current market factors, the Systematic Fair Value Price is designed to value such foreign securities and foreign options at fair value as of the close of business on the NYSE, which follows the close of the local markets.
Foreign Currency Transactions: The Funds’ books and records are maintained in US dollars. Purchases and sales of investment securities are recorded at the rates of exchange prevailing on the respective date of such transactions. Generally, when the US dollar rises in value against a foreign currency, the Funds’ investments denominated in that currency will lose value because its currency is worth fewer US dollars; the opposite effect occurs if the US dollar falls in relative value.
The Funds do not isolate the portion of the results of operations arising as a result of changes in the foreign exchange rates from the changes in the market prices of investments held or sold for financial reporting purposes. Accordingly, the effects of changes in foreign currency exchange rates on investments are not segregated on the Statements of Operations from the effects of changes in market prices of those investments but are included as a component of net realized and unrealized gain (loss) from investments. The Funds report realized currency gains (losses) on foreign currency related transactions as components of net realized gain (loss) for financial reporting purposes, whereas such components are treated as ordinary income for federal income tax purposes.
Participation Notes: China Fund may invest in participation notes (“P-Notes”). P-Notes are promissory notes issued by banks or broker-dealers that are designed to offer the Fund a return measured by the change in the value of the underlying security or basket of securities (the “underlying security”) while not holding the actual shares of the underlying security. P-Notes are typically used to allow the Fund to gain exposure to securities traded in foreign markets that may be restricted due to country-specific regulations. When the P-Note matures, the issuer will pay to, or receive from, the Fund the difference between the value of the underlying security at the time of the purchase and the underlying security’s value at maturity of the P-Notes. Income received on P-Notes is recorded by the Fund as dividend income in the Statements of Operations. An investment in a P-Note involves additional risks beyond the risks normally associated with a direct investment in the underlying security. While the holder of a P-Note is entitled to receive from the bank or broker-dealer any dividends paid by the underlying security, the holder is not entitled to the same rights (e.g., voting rights) as a direct owner of the underlying security. P-Notes are considered general unsecured contractual obligations of the bank or broker-dealer. The Fund must rely on the creditworthiness of the issuer for its investment returns on the P-Notes and has no rights against the issuer of the underlying security. A P-Note may be more volatile and less liquid than other investments held by the Fund since the P-Note generally is dependent on the liquidity in the local trading market for the underlying security.
Segregation and Collateralization: In cases in which the 1940 Act and the interpretive positions of the Securities and Exchange Commission (“SEC”) require that a Fund either deliver collateral or segregate assets in connection with certain investments (e.g., foreign currency exchange contracts), the Fund will, consistent with SEC rules and/or certain interpretive letters issued by the SEC, segregate collateral or designate on its books and records cash or liquid securities having a market value at least equal to the amount that would otherwise be required to be physically segregated. Furthermore, based on requirements and agreements with certain exchanges and third party broker-dealers, each party to such transactions has requirements to deliver/deposit securities as collateral for certain investments.
Investment Transactions and Investment Income: For financial reporting purposes, investment transactions are recorded on the dates the transactions are entered into (the trade dates). Realized gains and losses on investment transactions are determined on the identified cost basis. Dividend income is recorded on the ex-dividend dates. Dividends from foreign securities where the ex-dividend date may have passed are subsequently recorded when the Funds are informed of the ex-dividend date. Under the applicable foreign tax laws, a withholding tax at various rates may be imposed on capital gains, dividends and interest. Income and realized and unrealized gains and losses are allocated daily to each class based on its relative net assets.
Dividends and Distributions: Dividends and distributions paid by the Funds are recorded on the ex-dividend dates. If the total dividends and distributions made in any tax year exceeds net investment income and accumulated realized capital gains, a portion of the total distribution may be treated as a tax return of capital. The amount and timing of dividends and distributions are determined in accordance with federal income tax regulations, which may differ from US GAAP.
Securities Lending: The Funds may lend securities to approved borrowers, such as banks, brokers and other financial institutions. The borrower pledges cash, securities issued or guaranteed by the US government or irrevocable letters of credit issued by a bank as collateral, which will be maintained at all times in an amount equal to at least 100% of the current market value of the loaned securities. The market value of the loaned securities is determined at the close of business of the Funds and any additional required collateral is delivered to the Funds on the next business day. Securities lending income, as disclosed in the Statements of Operations, represents the income earned from the investment of the cash collateral, net of rebates paid to, or fees paid by, borrowers and less the fees paid to the securities lending agent. During the term of the loan, the Funds earn dividend or interest income on the securities loaned but do not receive dividend or interest income on the securities received as collateral. Loans of securities are terminable at any time and the borrower, after notice, is required to return borrowed securities within the standard time period for settlement of securities transactions. In the event that the borrower defaults on its obligation to return borrowed securities because of insolvency or for any other reason, the Funds could experience delays and costs in gaining access to the collateral. The
| | | | | | |
| | | | | | | |
| | BLACKROCK FUNDS | | MARCH 31, 2012 | | 37 |
| | |
| | |
Notes to Financial Statements (continued) | | |
Funds also could suffer a loss if the value of an investment purchased with cash collateral falls below the market value of loaned securities or if the value of an investment purchased with cash collateral falls below the value of the original cash collateral received. During the six months ended March 31, 2012, any securities on loan were collaterized by cash.
Income Taxes: It is each Fund’s policy to comply with the requirements of the Internal Revenue Code of 1986, as amended, applicable to RICs and to distribute substantially all of its taxable income to its shareholders. Therefore, no federal income tax provision is required.
The Funds file US federal and various state and local tax returns. No income tax returns are currently under examination. The statute of limitations on All-Cap Energy & Resources and Energy & Resources Funds’ US federal tax returns remains open for each of the four years ended September 30, 2011. The statute of limitations on World Gold’s US federal tax returns remains open for each of the two periods ended September 30, 2011. The statute of limitations on China’s US federal tax return remains open for the period ended September 30, 2011. The statutes of limitations on each Fund’s state and local tax returns may remain open for an additional year depending upon the jurisdiction. Management does not believe there are any uncertain tax positions that require recognition of a tax liability.
China Fund has adopted certain revisions to its tax laws and regulations that may result in holdings of the China Fund located in China being subject to withholding taxes on dividends and other income which may include taxes on capital gains. During the six months ended March 31, 2012, the China Fund invested in certain Chinese securities “A-shares” available only to local Chinese investors and Qualified Foreign Institutional Investors (“QFIIs”) through P-Notes. The China Fund gained access to the A-share market through various unaffiliated QFIIs. There is uncertainty in the current Chinese tax law whether capital gains realized on the China Fund’s investments in A-shares will be subject to tax. If such tax is imposed, the China Fund’s NAV or return could be adversely impacted.
Recent Accounting Standards: In May 2011, the Financial Accounting Standards Board (the “FASB”) issued amended guidance to improve disclosure about fair value measurements which will require the following disclosures for fair value measurements categorized as Level 3: quantitative information about the unobservable inputs and assumptions used in the fair value measurement, a description of the valuation policies and procedures and a narrative description of the sensitivity of the fair value measurement to changes in unobservable inputs and the interrelationships between those unobservable inputs. In addition, the amounts and reasons for all transfers in and out of Level 1 and Level 2 will be required to be disclosed as well as disclosure of the level in the fair value hierarchy of assets and liabilities not recorded at fair value but where fair value is disclosed. The amended guidance is effective for financial statements for fiscal years beginning after December 15, 2011, and interim periods within those fiscal years. Management is evaluating the impact of this guidance on the Funds’ financial statement disclosures.
In December 2011, the FASB issued guidance that will expand current disclosure requirements on the offsetting of certain assets and liabilities. The new disclosures will be required for investments and derivative financial instruments subject to master netting or similar agreements which are eligible for offset in the Statements of Assets and Liabilities and will require an entity to disclose both gross and net information about such investments and transactions in the financial statements. The guidance is effective for financial statements with fiscal years beginning on or after January 1, 2013, and interim periods within those fiscal years. Management is evaluating the impact of this guidance on the Funds’ financial statement disclosures.
Organization and Offering Costs: Upon commencement of operations, organization costs associated with the establishment of China Fund were expensed by China Fund and reimbursed by the Manager. Offering costs are amortized over a 12-month period beginning with the commencement of operations.
Other: Expenses directly related to a Fund or its classes are charged to that Fund or class. Other operating expenses shared by several funds are pro rated among those funds on the basis of relative net assets or other appropriate methods. Expenses directly related to the Funds and other shared expenses pro rated to the Funds are allocated daily to each class based on its relative net assets or other appropriate methods.
The Funds have an arrangement with the custodian whereby fees may be reduced by credits earned on uninvested cash balances, which, if applicable, are shown as fees paid indirectly in the Statements of Operations. The custodian imposes fees on overdrawn cash balances, which can be offset by accumulated credits earned or may result in additional custody charges.
2. Derivative Financial Instruments:
The Funds engage in various portfolio investment strategies using derivative contracts both to increase the returns of the Funds and to economically hedge, or protect, their exposure to foreign currency exchange rate risk. These contracts may be transacted on an exchange or OTC.
Losses may arise if the value of the contract decreases due to an unfavorable change in the market rates or values of the underlying instrument or if the counterparty does not perform under the contract. The Funds’ maximum risk of loss from counterparty credit risk on OTC derivatives is generally the aggregate unrealized gain netted against any collateral pledged by/posted to the counterparty.
The Funds may mitigate counterparty risk by procuring collateral and through netting provisions included within an International Swaps and Derivatives Association, Inc. master agreement (“ISDA Master Agreement”) implemented between a Fund and each of its respective counterparties. An ISDA Master Agreement allows each Fund to offset with each separate counterparty certain derivative financial instrument’s payables and/or receivables with collateral held. The amount of collateral moved to/from applicable counterparties is generally based upon
| | | | | | |
| | | | | | | |
| 38 | | BLACKROCK FUNDS | | MARCH 31, 2012 | | |
| | |
| | |
Notes to Financial Statements (continued) | | |
minimum transfer amounts of up to $500,000. To the extent amounts due to the Funds from their counterparties are not fully collateralized contractually or otherwise, the Funds bear the risk of loss from counterparty non-performance. See Note 1 “Segregation and Collateralization” for information with respect to collateral practices. In addition, the Funds manage counterparty risk by entering into agreements only with counterparties that they believe have the financial resources to honor their obligations and by monitoring the financial stability of those counterparties.
Certain ISDA Master Agreements allow counterparties to OTC derivatives to terminate derivative contracts prior to maturity in the event the Funds’ net assets decline by a stated percentage or the Funds fail to meet the terms of its ISDA Master Agreements, which would cause the Funds to accelerate payment of any net liability owed to the counterparty.
Foreign Currency Exchange Contracts: The Funds enter into foreign currency exchange contracts as an economic hedge against either specific transactions or portfolio instruments or to obtain exposure to foreign currencies (foreign currency exchange rate risk). A foreign currency exchange contract is an agreement between two parties to buy and sell a currency at a set exchange rate on a future date. Foreign currency exchange contracts, when used by the Funds, help to manage the overall exposure to the currencies in which some of the investments held by the Funds are denominated. The contract is marked-to-market daily and the change in market value is recorded by the Funds as an unrealized gain or loss. When the contract is closed, the Funds record a realized gain or loss equal to the difference between the value at the time it was opened and the value at the time it was closed. The use of foreign currency exchange contracts involves the risk that the value of a foreign currency exchange contract changes unfavorably due to movements in the value of the referenced foreign currencies and the risk that a counterparty to the contract does not perform its obligations under the agreement.
Derivative Financial Instruments Categorized by Risk Exposure:
| | | | | | |
| Fair Values of Derivative Financial Instruments as of March 31, 2012 | |
| Liability Derivatives | |
| | | Statements of Assets and Liabilities Location | | World
Gold | |
Foreign currency exchange contracts | | Unrealized depreciation on foreign currency exchange contracts | | $ | 260 | |
| | | | | | | | | | | | | | | | |
The Effect of Derivative Financial Instruments in the Statements of
Operations Six Months Ended March 31, 2012 | |
| Net Realized Gain (Loss) From | |
| | | All-Cap
Energy &
Resources | | | China
Fund | | | Energy &
Resources | | | World
Gold | |
Foreign currency exchange contracts | | | $(11,437) | | | | $(13) | | | | $57,685 | | | | $ (1,275) | |
| | | | | | |
| Net Change in Unrealized Appreciation/Depreciation on | |
| | | Energy &
Resources | | World
Gold | |
Foreign currency exchange contracts | | $(187) | | | $2,245 | |
For the six months ended March 31, 2012, the average quarterly balances of outstanding derivative financial instruments were as follows:
| | | | | | | | | | | | | | | | |
| | | All-Cap
Energy &
Resources | | | China
Fund | | | Energy &
Resources | | | World
Gold | |
Foreign currency exchange contracts: | | | | | | | | | | | | | | | | |
Average number of contracts - US dollars purchased | | | 2 | | | | 1 | | | | 1 | | | | 2 | |
Average number of contracts - US dollars sold | | | 1 | | | | 1 | | | | 1 | | | | 1 | |
Average US dollar amounts purchased | | | $1,668,421 | | | | $94 | | | | $642,931 | 1 | | | $37,674 | |
Average US dollar amounts sold | | | $1,507,465 | 1 | | | $19 | | | | $ 14,211 | | | | $13,718 | 1 |
| 1 | Average contract amount shown due to limited activity. |
3. Investment Advisory Agreements and Other Transactions with Affiliates:
The PNC Financial Services Group, Inc. (“PNC”) and Barclays Bank PLC (“Barclays”) are the largest stockholders of BlackRock, Inc.
(“BlackRock”). Due to the ownership structure, PNC is an affiliate for 1940 Act purposes, but Barclays is not.
The Trust, on behalf of the Funds, entered into an Investment Advisory Agreement with the Manager, the Funds’ investment advisor, an indirect, wholly owned subsidiary of BlackRock, to provide investment advisory and administration services. The Manager is responsible for the management of each Fund’s portfolio and provides the necessary personnel, facilities, equipment and certain other services necessary to the operations of each Fund. For such services, each Fund except China Fund pays the Manager a monthly fee based on a percentage of each Fund’s average daily net assets at the following annual rates:
| | |
| Average Daily Net Assets | | Investment
Advisory Fee |
First $1 Billion | | 0.750% |
$1 Billion - $2 Billion | | 0.700% |
$2 Billion - $3 Billion | | 0.675% |
Greater than $3 Billion | | 0.650% |
For such services, China Fund pays the Manager a monthly fee at an annual rate of 1.00% of its average daily net assets.
| | | | | | |
| | | | | | | |
| | BLACKROCK FUNDS | | MARCH 31, 2012 | | 39 |
| | |
| | |
Notes to Financial Statements (continued) | | |
The Manager contractually agreed to waive and/or reimburse fees or expenses, excluding interest expense, dividend expense, acquired fund fees and expenses and certain other fund expenses, in order to limit expenses. The expense limitations as a percentage of average daily net assets are as follows:
| | | | | | | | | | | | | | | | |
| Share Classes | | All-Cap Energy & Resources | | | China Fund | | | Energy & Resources | | | World Gold | |
BlackRock | | | 0.92 | %1 | | | N/A | | | | N/A | | | | N/A | |
Institutional | | | 0.96 | % | | | 1.65 | % | | | 1.07 | % | | | 1.24 | % |
Service. | | | 1.38 | % | | | N/A | | | | 1.38 | %1 | | | N/A | |
Investor A | | | 1.38 | % | | | 1.90 | % | | | 1.38 | % | | | 1.49 | % |
Investor B | | | 2.10 | % | | | N/A | | | | 2.10 | % | | | N/A | |
Investor C | | | 2.10 | % | | | 2.65 | % | | | 2.10 | % | | | 2.27 | % |
Class R | | | 1.83 | %1 | | | N/A | | | | 1.94 | %1 | | | N/A | |
| 1 | There were no shares outstanding as of March 31, 2012. |
The Manager has agreed not to reduce or discontinue this contractual waiver or reimbursement prior to February 1, 2013 unless approved by the Board, including a majority of the Independent Trustees. These amounts are included in fees waived by advisor and shown as administration fees waived – class specific, transfer agent fees waived – class specific, transfer agent fees reimbursed – class specific and expenses reimbursed by advisor, respectively, in the Statements of Operations. For the six months ended March 31, 2012, the Manager waived $12,558 and $40,435 of investment advisory fees for China Fund and World Gold, respectively, which are included in fees waived by advisor. Class specific expense waivers or reimbursements are as follows:
| | | | | | | | | | | | | | | | |
| Administration Fees Waived | |
| Share Classes | | All-Cap
Energy &
Resources | | | China
Fund | | | Energy &
Resources | | | World
Gold | |
Institutional | | | – | | | $ | 282 | | | $ | 628 | | | $ | 570 | |
Service | | $ | 10 | | | | – | | | | | | | | – | |
Investor A | | | 407 | | | | 13 | | | | 2,183 | | | | 454 | |
Investor B | | | 2,581 | | | | – | | | | 2,058 | | | | – | |
Investor C | | | 101 | | | | 4 | | | | 386 | | | | 382 | |
Total | | $ | 3,099 | | | $ | 299 | | | $ | 5,255 | | | $ | 1,406 | |
| | | | | | | | | | | | | | | | |
| | | | | | | | | | | | | | | | | |
| | | | | | | | | | | | | | | | |
| Transfer Agent Fees Waived | |
| Share Classes | | All-Cap
Energy &
Resources | | | China
Fund | | | Energy &
Resources | | | World
Gold | |
Institutional | | | – | | | $ | 1 | | | $ | 116 | | | $ | 118 | |
Service | | $ | 5 | | | | – | | | | – | | | | – | |
Investor A | | | 169 | | | | 4 | | | | 875 | | | | 212 | |
Investor B | | | 1,584 | | | | – | | | | 921 | | | | – | |
Investor C | | | – | | | | 2 | | | | 129 | | | | 122 | |
Total | | $ | 1,758 | | | $ | 7 | | | $ | 2,041 | | | $ | 452 | |
| | | | | | | | | | | | | | | | |
| | | | | | | | | | | | | | | | | |
| | | | | | | | | | | | | | | | |
| Transfer Agent Fees Reimbursed | |
| Share Classes | | All-Cap
Energy &
Resources | | | China
Fund | | | Energy &
Resources | | | World
Gold | |
Institutional | | | – | | | $ | 49 | | | $ | 2,522 | | | $ | 1,436 | |
Investor A | | $ | 1,042 | | | | 120 | | | | 12,038 | | | | 3,818 | |
Investor B | | | 4,839 | | | | – | | | | 1,347 | | | | – | |
Investor C | | | – | | | | 55 | | | | 1,887 | | | | 2,229 | |
Total | | $ | 5,881 | | | $ | 224 | | | $ | 17,794 | | | $ | 7,483 | |
| | | | | | | | | | | | | | | | |
| | | | | | | | | | | | | | | | | |
The Manager voluntarily agreed to waive its investment advisory fees by the amount of investment advisory fees each Fund pays to the Manager indirectly through its investment in affiliated money market funds. However, the Manager does not waive its investment advisory fees by the amount of investment advisory fees paid in connection with each Fund’s investment in other affiliated investment companies, if any. These amounts are included in fees waived by advisor in the Statements of Operations. For the six months ended March 31, 2012, the amounts waived were as follows:
| | | | |
All-Cap Energy & Resources | | $ | 6,905 | |
China Fund | | $ | 20 | |
Energy & Resources | | $ | 2,871 | |
World Gold | | $ | 41 | |
The Manager provides investment management and other services to the Subsidiary. The Manager does not receive separate compensation from the Subsidiary for providing investment management or administrative services. However, World Gold pays the Manager based on World Gold’s net assets, which include the assets of the Subsidiary.
The Manager entered into a sub-advisory agreement with BlackRock International Limited (“BIL”), an affiliate of the Manager, to serve as sub-advisor for World Gold. The Manager pays BIL, for services it provides, a monthly fee that is a percentage of the investment advisory fees paid by World Gold to the Manager.
If during a Fund’s fiscal year the operating expenses of a share class, that at any time during the prior two fiscal years received a waiver or reimbursement from the Manager, are less than the expense limit for that share class, the Manager is entitled to be reimbursed by such share class up to the lesser of (a) the amount of fees waived or expenses reimbursed during those prior two fiscal years under the agreement and (b) the amount by which the expense limit for that share class exceeds the operating expenses of the share class for the current fiscal year, provided that: (1) the Fund of which the share class is a part has more than $50 million in assets for the fiscal year and (2) the Manager or an affiliate continues to serve as the Fund’s investment advisor or administrator.
| | | | | | |
| | | | | | | |
| 40 | | BLACKROCK FUNDS | | MARCH 31, 2012 | | |
| | |
| | |
Notes to Financial Statements (continued) | | |
In the event the expense limit for a share class is changed subsequent to a fiscal year in which the Manager becomes entitled to reimbursement for fees waived or reimbursed, the amount available to reimburse the Manager shall be calculated by reference to the expense limit for that share class in effect at the time the Manager became entitled to receive such reimbursement, rather than the subsequently changed expense limit for that share class.
For the six months ended March 31, 2012, the Manager recouped the following waivers previously recorded by the Funds:
| | | | | | | | |
| Recoupment of Past Waived Fees | |
| Share Classes | | All-Cap
Energy &
Resources | | | Energy &
Resources | |
Institutional | | | – | | | $ | 11,869 | |
Service | | $ | 25 | | | | – | |
Investor A | | | 6,500 | | | | 81,875 | |
Investor B | | | – | | | | – | |
Investor C | | | – | | | | 12,110 | |
Total | | $ | 6,525 | | | $ | 105,854 | |
On March 31, 2012, the amounts subject to possible future recoupment under the expense limitation agreement are as follows:
| | | | | | | | | | | | |
| | | Expiring September 30, | |
| | | 2012 | | | 2013 | | | 2014 | |
All-Cap Energy & Resources | | $ | 14,359 | | | $ | 1,561 | | | $ | 10,737 | |
China Fund | | | – | | | $ | 139,204 | | | $ | 134,196 | |
Energy & Resources | | | – | | | $ | 357 | | | $ | 25,087 | |
World Gold | | $ | 61,160 | | | $ | 253,276 | | | $ | 52,904 | |
The Trust, on behalf of the Funds, entered into a Distribution Agreement and Distribution and Service Plan with BlackRock Investments, LLC (“BRIL”), an affiliate of the Manager. Pursuant to the Distribution and Service Plan and in accordance with Rule 12b-1 under the 1940 Act, the Funds pay BRIL ongoing service and distribution fees. The fees are accrued daily and paid monthly at annual rates based upon the average daily net assets of the shares of each Fund as follows:
| | | | | | | | |
| | | Service
Fee | | | Distribution
Fee | |
Service | | | 0.25 | % | | | – | |
Investor A | | | 0.25 | % | | | – | |
Investor B | | | 0.25 | % | | | 0.75 | % |
Investor C | | | 0.25 | % | | | 0.75 | % |
Pursuant to sub-agreements with BRIL, broker-dealers and BRIL provide shareholder servicing and distribution services to each Fund. The ongoing service and/or distribution fee compensate BRIL and each broker-dealer for providing shareholder servicing and/or distribution related services to Service, Investor A, Investor B and Investor C shareholders.
For the six months ended March 31, 2012, the following table shows the class specific service and distribution fees borne directly by each class of each Fund:
| | | | | | | | | | | | | | | | |
| Service and Distribution Fees | |
| Share Classes | | All-Cap
Energy &
Resources | | | China
Fund | | | Energy &
Resources | | | World
Gold | |
Service | | $ | 6,819 | | | | – | | | | – | | | | – | |
Investor A | | | 259,903 | | | $ | 133 | | | $ | 913,843 | | | $ | 4,542 | |
Investor B | | | 103,235 | | | | – | | | | 87,690 | | | | – | |
Investor C | | | 562,779 | | | | 143 | | | | 879,211 | | | | 15,273 | |
Total. | | $ | 932,736 | | | $ | 276 | | | $ | 1,880,744 | | | $ | 19,815 | |
| | | | | | | | | | | | | | | | |
| | | | | | | | | | | | | | | | | |
For the six months ended March 31, 2012, affiliates earned underwriting discounts, direct commissions and dealer concessions on sales of each Fund’s Investor A Shares as follows:
| | | | |
All-Cap Energy & Resources | | $ | 10,781 | |
China Fund | | $ | 184 | |
Energy & Resources | | $ | 41,755 | |
World Gold | | $ | 4,501 | |
For the six months ended March 31, 2012, affiliates received the following CDSCs relating to transactions in Investor A, Investor B and Investor C Shares as follows:
| | | | | | | | | | | | |
| | | Investor A | | | Investor B | | | Investor C | |
All-Cap Energy & Resources | | $ | 46 | | | $ | 10,320 | | | $ | 8,565 | |
Energy & Resources | | $ | 6,224 | | | $ | 10,236 | | | $ | 21,109 | |
World Gold | | $ | 485 | | | | – | | | $ | 1,529 | |
Pursuant to written agreements, certain financial intermediaries, some of which may be affiliates, provide the Funds with sub-accounting, recordkeeping, sub-transfer agency and other administrative services with respect to sub-accounts they service. For these services, these entities receive an annual fee per shareholder account, which will vary depending on share class and/or net assets. For the six months ended March 31, 2012, the Funds paid the following to affiliates in return for these services, which are included in transfer agent – class specific in the Statements of Operations.
| | | | |
All-Cap Energy & Resources | | $ | 402 | |
Energy & Resources | | $ | 4,072 | |
The Manager maintains a call center, which is responsible for providing certain shareholder services to the Funds, such as responding to shareholder inquiries and processing transactions based upon instructions from shareholders with respect to the subscription and redemption of Fund shares. For the six months ended March 31, 2012, each Fund reimbursed the Manager the following amounts for costs incurred in running
| | | | | | |
| | | | | | | |
| | BLACKROCK FUNDS | | MARCH 31, 2012 | | 41 |
| | |
| | |
Notes to Financial Statements (continued) | | |
the call center, which are included in transfer agent – class specific in the Statements of Operations:
| | | | | | | | | | | | | | | | |
| Share Classes | | All-Cap
Energy &
Resources | | | China
Fund | | | Energy &
Resources | | | World
Gold | |
Institutional | | $ | 2,139 | | | $ | 2 | | | $ | 2,973 | | | $ | 121 | |
Service | | | 230 | | | | – | | | | – | | | | – | |
Investor A | | | 8,038 | | | | 4 | | | | 23,153 | | | | 212 | |
Investor B | | | 1,600 | | | | – | | | | 1,390 | | | | – | |
Investor C | | | 4,005 | | | | 2 | | | | 5,077 | | | | 122 | |
Total | | $ | 16,012 | | | $ | 8 | | | $ | 32,593 | | | $ | 455 | |
| | | | | | | | | | | | | | | | |
| | | | | | | | | | | | | | | | | |
For the six months ended March 31, 2012, the following table shows the class specific transfer agent fees borne directly by each class of each Fund:
| | | | | | | | | | | | | | | | |
| Transfer Agent Fees | |
| Share Classes | | All-Cap
Energy &
Resources | | | China
Fund | | | Energy &
Resources | | | World
Gold | |
Institutional | | $ | 102,845 | | | $ | 80 | | | $ | 195,067 | | | $ | 1,631 | |
Service | | | 3,599 | | | | – | | | | – | | | | – | |
Investor A | | | 203,259 | | | | 131 | | | | 772,499 | | | | 4,094 | |
Investor B | | | 30,564 | | | | – | | | | 24,423 | | | | – | |
Investor C | | | 101,100 | | | | 59 | | | | 153,565 | | | | 2,822 | |
Total | | $ | 441,367 | | | $ | 270 | | | $ | 1,145,554 | | | $ | 8,547 | |
| | | | | | | | | | | | | | | | |
| | | | | | | | | | | | | | | | | |
BNY Mellon Investment Servicing (US) Inc. (“BNYMIS”) and the Manager act as co-administrators for the Funds. For these services, the co-administrators receive a combined administration fee computed daily and payable monthly, based on a percentage of the average daily net assets of each Fund. The combined administration fee is paid at the following annual rates: 0.075% of the first $500 million, 0.065% of the next $500 million and 0.055% of the average daily net assets in excess of $1 billion. In addition, each of the share classes is charged an administration fee based on the following percentages of average daily net assets of each respective class: 0.025% of the first $500 million, 0.015% of the next $500 million and 0.005% of the average daily net assets in excess of $1 billion. In addition, BNYMIS and the Manager may have, at their discretion, voluntarily waived all or any portion of their administration fees for a Fund or a share class which are included in administration fees waived and administration fees waived – class specific in the Statements of Operations. For the six months ended March 31, 2012, the Funds paid the following to the Manager in return for these services, which are included in administration, administration – class specific, administration fees waived and administration fees waived – class specific in the Statements of Operations:
| | | | |
| Administration Fees | | | |
All-Cap Energy & Resources | | $ | 271,511 | |
Energy & Resources | | $ | 407,601 | |
For the six months ended March 31, 2012, the following table shows the administration fees – class specific borne directly by each class of each Fund:
| | | | | | | | | | | | | | | | |
| Administration Fees – Class Specific | |
| Share Classes | | All-Cap
Energy &
Resources | | | China
Fund | | | Energy &
Resources | | | World
Gold | |
Institutional | | $ | 54,902 | | | $ | 297 | | | $ | 43,868 | | | $ | 575 | |
Service | | | 682 | | | | – | | | | – | | | | – | |
Investor A | | | 25,990 | | | | 13 | | | | 79,831 | | | | 454 | |
Investor B | | | 2,581 | | | | – | | | | 2,192 | | | | – | |
Investor C | | | 14,070 | | | | 4 | | | | 21,980 | | | | 382 | |
Total | | $ | 98,225 | | | $ | 314 | | | $ | 147,871 | | | $ | 1,411 | |
| | | | | | | | | | | | | | | | |
| | | | | | | | | | | | | | | | | |
The Funds received an exemptive order from the SEC permitting them, among other things, to pay an affiliated securities lending agent a fee based on a share of the income derived from the securities lending activities and have retained BlackRock Investment Management, LLC (“BIM”) as the securities lending agent. BIM may, on behalf of the Funds, invest cash collateral received by a Fund for such loans, among other things, in a private investment company managed by the Manager or in registered money market funds advised by the Manager or its affiliates. As securities lending agent, BIM is responsible for all transaction fees and all other operational costs relating to securities lending activities, other than extraordinary expenses. BIM does not receive any fees for managing the cash collateral. The market value of securities on loan and the value of the related collateral, if applicable, are shown in the Statements of Assets and Liabilities as securities loaned at value and collateral on securities loaned at value, respectively. The cash collateral invested by BIM is disclosed in the Schedules of Investments, if any. Securities lending income is equal to the total of income earned from the reinvestment of cash collateral, net of rebates paid to, or fees paid by, borrowers of securities. The Funds retain 65% of securities lending income and pay a fee to BIM equal to 35% of such income. The share of income earned by the Funds on the reinvestment of cash collateral is shown as securities lending – affiliated in the Statements of Operations. For the six months ended March 31, 2012, BIM received $24,715 in securities lending agent fees related to securities lending activities for the Funds.
During the six months ended March 31, 2012, Energy & Resources received reimbursements of $7,869 from an affiliate, which is included in capital share transactions on the Statements of Changes in Net Assets, relating to processing errors.
Certain officers and/or trustees of the Trust are officers and/or directors of BlackRock or its affiliates. The Funds reimburse the Manager for compensation paid to the Trust’s Chief Compliance Officer.
| | | | | | |
| | | | | | | |
| 42 | | BLACKROCK FUNDS | | MARCH 31, 2012 | | |
| | |
| | |
Notes to Financial Statements (continued) | | |
4. Investments:
Purchases and sales of investments, excluding short-term securities, for the six months ended March 31, 2012, were as follows:
| | | | | | | | |
| | | Purchases | | | Sales | |
All-Cap Energy & Resources | | $ | 100,583,698 | | | $ | 142,392,090 | |
China Fund | | $ | 637,909 | | | $ | 481,663 | |
Energy & Resources | | $ | 117,863,558 | | | $ | 231,303,436 | |
World Gold | | $ | 1,299,626 | | | $ | 1,415,792 | |
5. Income Tax Information:
As of September 30, 2011, All-Cap Energy & Resources had a capital loss carryforward of $101,763,569 available to offset future realized capital gains, which expires in 2018.
As of September 30, 2011, China Fund had a short-term capital loss carryforward available to offset future realized capital gains in the amount of $18,788. The capital loss carryforward is not subject to expiration and must first be utilized to offset future realized gains of the same character.
Under the RIC Modernization Act of 2010, capital losses incurred by the Funds after September 30, 2011 will not be subject to expiration. In addition, any such losses must be utilized prior to the losses incurred in pre-enactment taxable years.
As of March 31, 2012, gross unrealized appreciation and gross unrealized depreciation based on cost for federal income tax purposes were as follows:
| | | | | | | | | | | | | | | | |
| | | All-Cap
Energy &
Resources | | | China
Fund | | | Energy &
Resources | | | World Gold | |
Tax cost | | $ | 680,544,840 | | | $ | 3,078,305 | | | $ | 1,192,634,326 | | | $ | 10,439,926 | |
Gross
unrealized
appreciation | | $ | 199,060,948 | | | $ | 80,867 $ | | | | 266,435,183 | | | $ | 830,275 | |
Gross
unrealized
depreciation | | | (91,941,920 | ) | | | (546,278 | ) | | | (251,528,831 | ) | | | (1,600,278 | ) |
Net
unrealized
appreciation
(depreciation) | | $ | 107,119,028 | | | $ | (465,411 | ) | | $ | 14,906,352 | | | $ | (770,003 | ) |
6. Borrowings:
The Trust, on behalf of the Funds, along with certain other funds managed by the Manager and its affiliates, is a party to a $500 million credit agreement with a group of lenders. The Funds may borrow under the credit agreement to fund shareholder redemptions. Effective November 2010 to November 2011, the credit agreement had the following terms: a commitment fee of 0.08% per annum based on the Funds’ pro rata share of the unused portion of the credit agreement and interest at a rate equal to the higher of (a) the one-month LIBOR plus 1.00% per annum or (b) the Fed Funds rate plus 1.00% per annum on amounts borrowed. In addition, the Funds paid administration and arrangement fees which were allocated to the Funds based on their net assets as of October 31, 2010. The credit agreement, which expired in November 2011, was renewed until November 2012. Effective November 2011 to
November 2012, the credit agreement has the following terms: a commitment fee of 0.065% per annum based on the Funds’ pro rata share of the unused portion of the credit agreement and interest at a rate equal to the higher of (a) the one-month LIBOR plus 0.80% per annum or (b) the Fed Funds rate plus 0.80% per annum on amounts borrowed. In addition, the Funds paid administration and arrangement fees which were allocated to the Funds based on their net assets as of October 31, 2011. The Funds did not borrow under the credit agreement during the six months ended March 31, 2012.
7. Concentration, Market and Credit Risk:
In the normal course of business, the Funds invest in securities and enter into transactions where risks exist due to fluctuations in the market (market risk) or failure of the issuer of a security to meet all its obligations (issuer credit risk). The value of securities held by the Funds may decline in response to certain events, including those directly involving the issuers whose securities are owned by the Funds; conditions affecting the general economy; overall market changes; local, regional or global political, social or economic instability; and currency and interest rate and price fluctuations. Similar to issuer credit risk, the Funds may be exposed to counterparty credit risk, or the risk that an entity with which the Funds have unsettled or open transactions may fail to or be unable to perform on its commitments. The Funds manage counterparty credit risk by entering into transactions only with counterparties that they believe have the financial resources to honor their obligations and by monitoring the financial stability of those counterparties. Financial assets, which potentially expose the Funds to market issuer and counterparty credit risks, consist principally of financial instruments and receivables due from counterparties. The extent of the Funds’ exposure to market, issuer and counterparty credit risks with respect to these financial assets is generally approximated by their value recorded in the Funds’ Statements of Assets and Liabilities, less any collateral held by the Funds.
As of March 31, 2012, All-Cap Energy & Resources and Energy & Resources invested a significant portion of their assets in securities in the energy sector. Changes in economic conditions affecting the energy sector would have a greater impact on All-Cap Energy & Resources and Energy & Resources and could affect the value, income and/or liquidity of positions in such securities.
As of March 31, 2012, China Fund invested a significant portion of its assets in securities in the financial sector. Changes in economic conditions affecting the financial sector would have a greater impact on China Fund and could affect the value, income and/or liquidity of positions in such securities.
As of March 31, 2012, World Gold invested a significant portion of its assets in securities in the materials sector. Changes in economic conditions affecting the materials sector would have a greater impact on World Gold and could affect the value, income and/or liquidity of positions in such securities.
| | | | | | |
| | | | | | | |
| | BLACKROCK FUNDS | | MARCH 31, 2012 | | 43 |
| | |
| | |
Notes to Financial Statements (continued) | | |
China Fund invests a substantial amount of its assets in issuers located in a single country or a limited number of countries. When the Fund concentrates its investments in this manner, it assumes the risk that economic, political and social conditions in those countries may have a significant impact on its investment performance. Foreign issuers may not be subject to the same uniform accounting, auditing and financial reporting standards and practices as used in the U.S. Foreign securities markets may also be less liquid, more volatile, and less subject to governmental supervision not typically associated with investing in U.S. securities.
As of March 31, 2012, the Funds listed below had the following geographic allocations:
| | | | | | | | | | |
| Geographic Allocations | | All-Cap
Energy &
Resources | | Energy &
Resources |
United States | | | | 68 | % | | | | 68 | % |
Canada | | | | 16 | | | | | 21 | |
Netherlands | | | | 5 | | | | | – | |
Bermuda | | | | 4 | | | | | 4 | |
France | | | | 3 | | | | | – | |
Norway | | | | 2 | | | | | – | |
Brazil | | | | 1 | | | | | – | |
China | | | | 1 | | | | | – | |
Switzerland | | | | – | | | | | 4 | |
United Kingdom | | | | – | | | | | 2 | |
Australia | | | | – | | | | | 1 | |
8. Capital Shares Transactions:
Transactions in capital shares for each class were as follows:
| | | | | | | | | | | | | | | | | | |
| | | Six Months Ended
March 31, 2012 | | | | | Year Ended
September 30, 2011 | |
| All-Cap Energy & Resources | | Shares | | | Amount | | | | | Shares | | | Amount | |
Institutional | | | | | | | | | | | | | | | | | | |
Shares sold | | | 3,812,195 | | | $ | 54,883,895 | | | | | | 11,764,153 | | | $ | 196,149,612 | |
Shares issued in reinvestment of dividends | | | – | | | | – | | | | | | 236,670 | | | | 3,753,576 | |
Shares redeemed | | | (5,978,883 | ) | | | (85,619,126 | ) | | | | | (9,569,807 | ) | | | (155,160,649 | ) |
Net increase (decrease) | | | (2,166,688 | ) | | $ | (30,735,231 | ) | | | | | 2,431,016 | | | $ | 44,742,539 | |
| | | | | |
| | | | | | | | | | | | | | | | | | |
Service | | | | | | | | | | | | | | | | | | |
Shares sold | | | 16,353 | | | $ | 233,099 | | | | | | 233,545 | | | $ | 3,751,758 | |
Shares issued in reinvestment of dividends | | | – | | | | – | | | | | | 1,559 | | | | 24,303 | |
Shares redeemed | | | (66,511 | ) | | | (946,970 | ) | | | | | (144,086 | ) | | | (2,329,320 | ) |
Net increase (decrease) | | | (50,158 | ) | | $ | (713,871 | ) | | | | | 91,018 | | | $ | 1,446,741 | |
| | | | | |
| | | | | | | | | | | | | | | | | | |
Investor A | | | | | | | | | | | | | | | | | | |
Shares sold and automatic conversion of shares | | | 1,231,404 | | | $ | 17,099,787 | | | | | | 7,235,798 | | | $ | 116,893,102 | |
Shares issued in reinvestment of dividends | | | – | | | | – | | | | | | 68,620 | | | | 1,070,479 | |
Shares redeemed | | | (2,899,203 | ) | | | (40,229,586 | ) | | | | | (6,968,976 | ) | | | (111,272,616 | ) |
Net increase (decrease) | | | (1,667,799 | ) | | $ | (23,129,799 | ) | | | | | 335,442 | | | $ | 6,690,965 | |
| | | | | |
| | | | | | | | | | | | | | | | | | |
Investor B | | | | | | | | | | | | | | | | | | |
Shares sold | | | 7,773 | | | $ | 110,471 | | | | | | 51,499 | | | $ | 813,829 | |
Shares redeemed and automatic conversion of shares | | | (256,213 | ) | | | (3,475,567 | ) | | | | | (484,707 | ) | | | (7,428,635 | ) |
Net decrease | | | (248,440 | ) | | $ | (3,365,096 | ) | | | | | (433,208 | ) | | $ | (6,614,806 | ) |
| | | | | | |
| | | | | | | |
| 44 | | BLACKROCK FUNDS | | MARCH 31, 2012 | | |
| | |
| | |
Notes to Financial Statements (continued) | | |
| | | | | | | | | | | | | | | | | | |
| | | Six Months Ended
March 31, 2012 | | | | | Year Ended
September 30, 2011 | |
| All-Cap Energy & Resources (concluded) | | Shares | | | Amount | | | | | Shares | | | Amount | |
Investor C | | | | | | | | | | | | | | | | | | |
Shares sold | | | 270,192 | | | $ | 3,657,294 | | | | | | 1,743,965 | | | $ | 27,386,669 | |
Shares redeemed | | | (960,230 | ) | | | (12,907,990 | ) | | | | | (2,001,029 | ) | | | (30,386,666 | ) |
Net decrease | | | (690,038 | ) | | $ | (9,250,696 | ) | | | | | (257,064 | ) | | $ | (2,999,997 | ) |
| | | | | | | | | | | | | | | | | | |
Total net increase (decrease) | | | (4,823,123 | ) | | $ | (67,194,693 | ) | | | | | 2,167,204 | | | $ | 43,265,442 | |
| | | | |
| | | | | | | | | | | Period
April 29, 20111 to
September 30, 2011 | |
| China Fund | | | | | | | | | | Shares | | | Amount | |
Institutional | | | | | | | | | | | | | | | | | | |
Shares sold | | | 5,083 | | | $ | 40,597 | | | | | | 297,943 | | | $ | 2,978,100 | |
Shares issued in reinvestment of dividends | | | 59 | | | | 425 | | | | | | – | | | | – | |
Shares redeemed | | | (1,097 | ) | | | (8,249 | ) | | | | | (800 | ) | | | (7,351 | ) |
Net increase | | | 4,045 | | | $ | 32,773 | | | | | | 297,143 | | | $ | 2,970,749 | |
| | | | | |
| | | | | | | | | | | | | | | | | | |
Investor A | | | | | | | | | | | | | | | | | | |
Shares sold | | | 18,659 | | | $ | 152,952 | | | | | | 7,911 | | | $ | 69,004 | |
Shares issued in reinvestment of dividends | | | 89 | | | | 642 | | | | | | – | | | | – | |
Shares redeemed | | | (5,155 | ) | | | (42,821 | ) | | | | | (575 | ) | | | (3,963 | ) |
Net increase | | | 13,593 | | | $ | 110,773 | | | | | | 7,336 | | | $ | 65,041 | |
| | | | | |
| | | | | | | | | | | | | | | | | | |
Investor C | | | | | | | | | | | | | | | | | | |
Shares sold | | | 1,232 | | | $ | 9,489 | | | | | | 2,727 | | | $ | 25,361 | |
Shares issued in reinvestment of dividends | | | 23 | | | | 163 | | | | | | – | | | | – | |
Net increase | | | 1,255 | | | $ | 9,652 | | | | | | 2,727 | | | $ | 25,361 | |
| | | | | | | | | | | | | | | | | | |
Total net increase | | | 18,893 | | | $ | 153,198 | | | | | | 307,206 | | | $ | 3,061,151 | |
1 Commencement of operations.
| | | | | | | | | | | | | | | | | | |
| | | | | | | | | | | Year Ended
September 30, 2011 | |
| Energy & Resources | | | | | | | | | | Shares | | | Amount | |
Institutional | | | | | | | | | | | | | | | | | | |
Shares sold | | | 1,448,483 | | | $ | 56,014,262 | | | | | | 7,170,242 | | | $ | 330,432,080 | |
Shares issued in reinvestment of dividends and distributions | | | 310,297 | | | | 11,564,803 | | | | | | 84,123 | | | | 3,587,025 | |
Shares redeemed | | | (2,380,228 | ) | | | (89,585,113 | ) | | | | | (5,422,553 | ) | | | (234,438,204 | ) |
Net increase (decrease) | | | (621,448 | ) | | $ | (22,006,048 | ) | | | | | 1,831,812 | | | $ | 99,580,901 | |
| | | | | |
| | | | | | | | | | | | | | | | | | |
Investor A | | | | | | | | | | | | | | | | | | |
Shares sold and automatic conversion of shares | | | 2,822,715 | | | $ | 94,634,906 | | | | | | 12,876,717 | | | $ | 509,593,830 | |
Shares issued in reinvestment of dividends and distributions | | | 850,675 | | | | 27,672,619 | | | | | | 197,658 | | | | 7,392,389 | |
Shares redeemed | | | (5,392,845 | ) | | | (177,511,357 | ) | | | | | (11,335,505 | ) | | | (436,454,466 | ) |
Net increase (decrease) | | | (1,719,455 | ) | | $ | (55,203,832 | ) | | | | | 1,738,870 | | | $ | 80,531,753 | |
| | | | | | |
| | | | | | | |
| | BLACKROCK FUNDS | | MARCH 31, 2012 | | 45 |
| | |
| | |
Notes to Financial Statements (concluded) | | |
| | | | | | | | | | | | | | | | | | |
| | | Six Months Ended March 31, 2012 | | | | | Year Ended September 30, 2011 | |
| Energy & Resources (concluded) | | Shares | | | Amount | | | | | Shares | | | Amount | |
| | | | | |
Investor B | | | | | | | | | | | | | | | | | | |
Shares sold | | | 4,722 | | | $ | 122,632 | | | | | | 26,094 | | | $ | 771,312 | |
Shares issued in reinvestment of dividends and distributions | | | 32,306 | | | | 778,303 | | | | | | 3,677 | | | | 103,069 | |
Shares redeemed and automatic conversion of shares | | | (285,651 | ) | | | (7,050,740 | ) | | | | | (354,576 | ) | | | (10,074,825 | ) |
Net decrease | | | (248,623 | ) | | $ | (6,149,805 | ) | | | | | (324,805 | ) | | $ | (9,200,444 | ) |
| | | | | |
| | | | | | | | | | | | | | | | | | |
Investor C | | | | | | | | | | | | | | | | | | |
Shares sold | | | 538,096 | | | $ | 13,398,694 | | | | | | 2,552,890 | | | $ | 75,921,530 | |
Shares issued in reinvestment of dividends and distributions | | | 325,305 | | | | 7,768,854 | | | | | | 43,559 | | | | 1,214,416 | |
Shares redeemed | | | (976,744 | ) | | | (23,797,424 | ) | | | | | (1,727,294 | ) | | | (49,053,631 | ) |
Net increase (decrease) | | | (113,343 | ) | | $ | (2,629,876 | ) | | | | | 869,155 | | | $ | 28,082,315 | |
| | | | | | | | | | | | | | | | | | |
Total net increase (decrease) | | | (2,702,869 | ) | | $ | (85,989,561 | ) | | | | | 4,115,032 | | | $ | 198,994,525 | |
| | | | | |
World Gold | | | | | | | | | | | | | | | | | | |
| | | | | |
Institutional | | | | | | | | | | | | | | | | | | |
Shares sold | | | 32,694 | | | $ | 377,246 | | | | | | 181,768 | | | $ | 2,270,406 | |
Shares issued in reinvestment of dividends and distributions | | | 159 | | | | 1,794 | | | | | | 1,892 | | | | 24,354 | |
Shares redeemed | | | (47,094 | ) | | | (534,474 | ) | | | | | (114,738 | ) | | | (1,416,911 | ) |
Net increase (decrease) | | | (14,241 | ) | | $ | (155,434 | ) | | | | | 68,922 | | | $ | 877,849 | |
| | | | | |
| | | | | | | | | | | | | | | | | | |
Investor A | | | | | | | | | | | | | | | | | | |
Shares sold | | | 120,306 | | | $ | 1,389,149 | | | | | | 470,161 | | | $ | 5,767,358 | |
Shares issued in reinvestment of dividends and distributions | | | – | | | | – | | | | | | 2,868 | | | | 36,880 | |
Shares redeemed | | | (121,380 | ) | | | (1,372,053 | ) | | | | | (228,392 | ) | | | (2,864,351 | ) |
Net increase (decrease) | | | (1,074 | ) | | $ | 17,096 | | | | | | 244,637 | | | $ | 2,939,887 | |
| | | | | |
| | | | | | | | | | | | | | | | | | |
Investor C | | | | | | | | | | | | | | | | | | |
Shares sold | | | 89,630 | | | $ | 1,018,577 | | | | | | 274,614 | | | $ | 3,410,785 | |
Shares issued in reinvestment of dividends and distributions | | | – | | | | – | | | | | | 964 | | | | 12,364 | |
Shares redeemed | | | (79,727 | ) | | | (922,441 | ) | | | | | (38,767 | ) | | | (459,890 | ) |
Net increase | | | 9,903 | | | $ | 96,136 | | | | | | 236,811 | | | $ | 2,963,259 | |
| | | | | | | | | | | | | | | | | | |
| | | | | |
Total net increase (decrease) | | | (5,412 | ) | | $ | (42,202 | ) | | | | | 550,370 | | | $ | 6,780,995 | |
Prior to April 1, 2011, there was a 2% redemption fee on shares redeemed or exchanged that have been held 30 days or less. The redemption fees were collected and retained by the Funds for the benefit of the remaining shareholders. The redemption fees were recorded as a credit to paid-in capital. Effective April 1, 2011, the redemption fee was terminated and is no longer charged by the Funds.
At March 31, 2012, 296,000 Institutional Shares, 2,000 Investor A Shares and 2,000 Investor C Shares of China Fund were owned by affiliates.
At March 31, 2012, 296,000 Institutional Shares, 2,000 Investor A Shares and 2,000 Investor C Shares of World Gold were owned by affiliates.
9. Subsequent Events:
Management has evaluated the impact of all subsequent events on the Funds through the date the financial statements were issued and has determined that there were no subsequent events requiring adjustment or additional disclosure in the financial statements.
| | | | | | |
| | | | | | | |
| 46 | | BLACKROCK FUNDS | | MARCH 31, 2012 | | |
Ronald W. Forbes, Co-Chairman of the Board and Trustee
Rodney D. Johnson, Co-Chairman of the Board and Trustee
Paul L. Audet, Trustee
David O. Beim, Trustee
Henry Gabbay, Trustee
Dr. Matina S. Horner, Trustee
Herbert I. London, Trustee
Cynthia A. Montgomery, Trustee
Joseph P. Platt, Trustee
Robert C. Robb, Jr., Trustee
Toby Rosenblatt, Trustee
Kenneth L. Urish, Trustee
Frederick W. Winter, Trustee
John M. Perlowski, President and Chief Executive Officer
Richard Hoerner, CFA, Vice President
Brendan Kyne, Vice President
Simon Mendelson, Vice President
Christopher Stavrakos, CFA, Vice President
Neal Andrews, Chief Financial Officer
Jay Fife, Treasurer
Brian Kindelan, Chief Compliance Officer and Anti-Money Laundering Officer
Ira P. Shapiro, Secretary
Investment Advisor and Co-Administrator
BlackRock Advisors, LLC
Wilmington, DE 19809
Sub-Advisor - World Gold
BlackRock International Limited
Edinburgh, Scotland EH3 8JB
Accounting Agent, Co-Administrator and Transfer Agent
BNY Mellon Investment Servicing (US) Inc.
Wilmington, DE 19809
Custodian
The Bank of New York Mellon
New York, NY 10286
Distributor
BlackRock Investments, LLC
New York, NY 10022
Legal Counsel
Sidley Austin LLP
New York, NY 10019
Independent Registered Public Accounting Firm
Deloitte & Touche LLP
Philadelphia, PA 19103
Address of the Trust
100 Bellevue Parkway
Wilmington, DE 19809
| | | | | | |
| | | | | | | |
| | BLACKROCK FUNDS | | MARCH 31, 2012 | | 47 |
Electronic Delivery
Electronic copies of most financial reports and prospectuses are available on the Funds’ website or shareholders can sign up for e-mail notifications of quarterly statements, annual and semi-annual reports and prospectuses by enrolling in the Funds’ electronic delivery program.
To enroll:
Shareholders Who Hold Accounts with Investment Advisors, Banks or Brokerages:
Please contact your financial advisor. Please note that not all investment advisors, banks or brokerages may offer this service.
Shareholders Who Hold Accounts Directly With BlackRock:
| 1) | Access the BlackRock website at http://www.blackrock.com/edelivery |
| 2) | Select “eDelivery” under the “More Information” section |
Householding
The Funds will mail only one copy of shareholder documents, including prospectuses, annual and semi-annual reports and proxy statements, to shareholders with multiple accounts at the same address. This practice is commonly called “householding” and is intended to reduce expenses and eliminate duplicate mailings of shareholder documents. Mailings of your shareholder documents may be householded indefinitely unless you instruct us otherwise. If you do not want the mailing of these documents to be combined with those for other members of your household, please contact the Funds at (800) 441-7762.
Availability of Quarterly Schedule of Investments
The Funds file their complete schedule of portfolio holdings with the SEC for the first and third quarters of each fiscal year on Form N-Q. The Funds’ Forms N-Q are available on the SEC’s website at http:// www.sec.gov and may also be reviewed and copied at the SEC’s Public Reference Room in Washington, D.C. Information on how to access documents on the SEC’s website without charge may be obtained by calling (800) SEC-0330. The Funds’ Forms N-Q may also be obtained upon request and without charge by calling (800) 441-7762.
Availability of Proxy Voting Policies and Procedures
A description of the policies and procedures that the Funds use to determine how to vote proxies relating to portfolio securities is available (1) without charge, upon request, by calling (800) 441-7762; (2) at http://www.blackrock.com; and (3) on the SEC’s website at http:// www.sec.gov.
Availability of Proxy Voting Record
Information about how the Funds voted proxies relating to securities held in the Funds’ portfolios during the most recent 12-month period ended June 30 is available upon request and without charge (1) at http://www.blackrock.com or by calling (800) 441-7762 and (2) on the SEC’s website at http://www.sec.gov.
Account Information
Call us at (800) 441-7762 from 8:00 AM to 6:00 PM EST on any business day to get information about your account balances, recent transactions and share prices. You can also reach us on the Web at http:// www.blackrock.com/funds.
Automatic Investment Plans
Investor Class shareholders who want to invest regularly can arrange to have $50 or more automatically deducted from their checking or savings account and invested in any of the BlackRock funds.
Systematic Withdrawal Plan
Investor Class shareholders can establish a systematic withdrawal plan and receive periodic payments of $50 or more from their BlackRock funds, as long as their account balance is at least $10,000.
Retirement Plans
Shareholders may make investments in conjunction with Traditional, Rollover, Roth, Coverdell, Simple IRAs, SEP IRAs and 403(b) Plans.
| | | | | | |
| | | | | | | |
| 48 | | BLACKROCK FUNDS | | MARCH 31, 2012 | | |
| | |
| | |
Additional Information (concluded) | | |
|
BlackRock Privacy Principles |
BlackRock is committed to maintaining the privacy of its current and former fund investors and individual clients (collectively, “Clients”) and to safeguarding their non-public personal information. The following information is provided to help you understand what personal information BlackRock collects, how we protect that information and why in certain cases we share such information with select parties.
If you are located in a jurisdiction where specific laws, rules or regulations require BlackRock to provide you with additional or different privacy-related rights beyond what is set forth below, then BlackRock will comply with those specific laws, rules or regulations.
BlackRock obtains or verifies personal non-public information from and about you from different sources, including the following: (i) information we receive from you or, if applicable, your financial intermediary, on applications, forms or other documents; (ii) information about your transactions with us, our affiliates, or others; (iii) information we receive from a consumer reporting agency; and (iv) from visits to our websites.
BlackRock does not sell or disclose to non-affiliated third parties any non-public personal information about its Clients, except as permitted by law or as is necessary to respond to regulatory requests or to service Client accounts. These non-affiliated third parties are required to protect the confidentiality and security of this information and to use it only for its intended purpose.
We may share information with our affiliates to service your account or to provide you with information about other BlackRock products or services that may be of interest to you. In addition, BlackRock restricts access to non-public personal information about its Clients to those BlackRock employees with a legitimate business need for the information. BlackRock maintains physical, electronic and procedural safeguards that are designed to protect the non-public personal information of its Clients, including procedures relating to the proper storage and disposal of such information.
| | | | | | |
| | | | | | | |
| | BLACKROCK FUNDS | | MARCH 31, 2012 | | 49 |
| | |
| | |
A World-Class Mutual Fund Family | | |
BlackRock offers a diverse lineup of open-end mutual funds crossing all investment styles and managed by experts in equity, fixed income and tax-exempt investing.
| | | | |
Equity Funds |
BlackRock ACWI ex-US Index Fund BlackRock All-Cap Energy & Resources Portfolio BlackRock Balanced Capital Fund† BlackRock Basic Value Fund BlackRock Capital Appreciation Fund BlackRock China Fund BlackRock Commodity Strategies Fund BlackRock Emerging Markets Fund BlackRock Emerging Markets Long/Short Equity Fund BlackRock Energy & Resources Portfolio BlackRock Equity Dividend Fund BlackRock EuroFund BlackRock Focus Growth Fund BlackRock Global Allocation Fund BlackRock Global Dividend Income Portfolio† | | BlackRock Global Dynamic Equity Fund BlackRock Global Opportunities Portfolio BlackRock Global SmallCap Fund BlackRock Health Sciences Opportunities Portfolio BlackRock Index Equity Portfolio BlackRock India Fund BlackRock International Fund BlackRock International Index Fund BlackRock International Opportunities Portfolio BlackRock Large Cap Core Fund BlackRock Large Cap Core Plus Fund BlackRock Large Cap Growth Fund BlackRock Large Cap Value Fund BlackRock Latin America Fund BlackRock Managed Volatility Portfolio† BlackRock Mid-Cap Growth Equity Portfolio | | BlackRock Mid-Cap Value Equity Portfolio BlackRock Mid Cap Value Opportunities Fund BlackRock Natural Resources Trust BlackRock Pacific Fund BlackRock Russell 1000 Index Fund BlackRock Science & Technology
Opportunities Portfolio BlackRock Small Cap Growth Equity Portfolio BlackRock Small Cap Growth Fund II BlackRock Small Cap Index Fund BlackRock S&P 500 Index Fund BlackRock S&P 500 Stock Fund BlackRock U.S. Opportunities Portfolio BlackRock Value Opportunities Fund BlackRock World Gold Fund |
| | |
| | |
| | |
| | |
| | |
| | |
| | |
| | |
| | |
| | |
| | |
| | |
| | |
| | |
| | |
| | | | |
Fixed Income Funds | | | | |
BlackRock Bond Index Fund BlackRock Core Bond Portfolio BlackRock CoreAlpha Bond Fund BlackRock Emerging Market Debt Portfolio BlackRock Floating Rate Income Portfolio BlackRock Global Long/Short Credit Fund BlackRock GNMA Portfolio | | BlackRock High Yield Bond Portfolio BlackRock Inflation Protected Bond Portfolio BlackRock International Bond Portfolio BlackRock Long Duration Bond Portfolio BlackRock Low Duration Bond Portfolio BlackRock Multi-Asset Income Portfolio† BlackRock Multi-Sector Bond Portfolio | | BlackRock Strategic Income Opportunities Portfolio BlackRock Total Return Fund BlackRock US Government Bond Portfolio BlackRock US Mortgage Portfolio BlackRock World Income Fund |
| | |
| | |
| | |
| | |
| | |
| | |
| | | | |
Municipal Bond Funds | | | | |
BlackRock California Municipal Bond Fund BlackRock High Yield Municipal Fund BlackRock Intermediate Municipal Fund | | BlackRock National Municipal Fund BlackRock New Jersey Municipal Bond Fund BlackRock New York Municipal Bond Fund | | BlackRock Pennsylvania Municipal Bond Fund BlackRock Short-Term Municipal Fund |
| | |
| | |
| | | | | | | | | | | | | | |
Target Risk & Target Date Funds† | |
BlackRock Prepared Portfolios | | BlackRock Lifecycle Prepared Portfolios | | LifePath Portfolios | | LifePath Index Portfolios | |
Conservative Prepared Portfolio | | 2015 | | 2035 | | Retirement | | 2040 | | Retirement | | | 2040 | |
Moderate Prepared Portfolio | | 2020 | | 2040 | | 2020 | | 2045 | | 2020 | | | 2045 | |
Growth Prepared Portfolio | | 2025 | | 2045 | | 2025 | | 2050 | | 2025 | | | 2050 | |
Aggressive Growth Prepared Portfolio | | 2030 | | 2050 | | 2030 | | 2055 | | 2030 | | | 2055 | |
| | | | | | 2035 | | | | 2035 | | | | |
BlackRock mutual funds are currently distributed by BlackRock Investments, LLC. You should consider the investment objectives, risks, charges and expenses of the funds under consideration carefully before investing. Each fund’s prospectus contains this and other information and is available at www.blackrock.com or by calling (800) 441-7762 or from your financial advisor. The prospectus should be read carefully before investing.
| | | | | | |
| | | | | | | |
| 50 | | BLACKROCK FUNDS | | MARCH 31, 2012 | | |
[THIS PAGE INTENTIONALLY LEFT BLANK.]
| | |
This report is transmitted to shareholders only. It is not authorized for use as an offer of sale or a solicitation of an offer to buy shares of the Funds unless accompanied or preceded by that Fund’s current prospectus. Past performance results shown in this report should not be considered a representation of future performance. Investment returns and principal value of shares will fluctuate so that shares, when redeemed, may be worth more or less than their original cost. Statements and other information herein are as dated and are subject to change. | | 
|
| Investment in foreign securities involves special risks including fluctuating foreign exchange rates, foreign government regulations, differing degrees of liquidity and the possibility of substantial volatility due to adverse political, economic or other developments. | |
| | |
| EQUITY1-3/12-SAR | |  |
| | |

| | March 31, 2012 |
|
|
Semi-Annual Report (Unaudited) |
BlackRock FundsSM
| | u | | BlackRock Mid-Cap Growth Equity Portfolio |
| | u | | BlackRock Mid-Cap Value Equity Portfolio |
| | u | | BlackRock Small Cap Growth Equity Portfolio |
|
Not FDIC Insured n No Bank Guarantee n May Lose Value |
| | | | | | |
| | | | | | | |
| 2 | | BLACKROCK FUNDS | | MARCH 31, 2012 | | |
Dear Shareholder
Twelve months ago, risk assets were charging forward, only to be met with a sharp reversal in May 2011 when escalating political strife in Greece rekindled fears about sovereign debt problems spreading across Europe. Concurrently, global economic indicators signaled that the recovery had slowed. Confidence was further shaken by the prolonged debt ceiling debate in Washington, DC. On August 5, 2011, Standard & Poor’s made history by downgrading the US government’s credit rating, and turmoil erupted in financial markets around the world. Extraordinary levels of volatility persisted in the months that followed as the European debt crisis intensified. Macro news flow became a greater influence on trading decisions than the fundamentals of the securities traded, resulting in high correlations between asset prices. By the end of the third quarter, equity markets had fallen nearly 20% from their April peak while safe-haven assets such as US Treasuries and gold had rallied to historic highs.
October brought enough positive economic data to assuage fears of a global double-dip recession. Additionally, European leaders began to show progress toward stemming the region’s debt crisis. Investors began to reenter the markets, putting risk assets on the road to recovery. Improving investor sentiment carried over into the first several months of 2012. Debt problems in Europe stabilized as policymakers secured a bailout plan for Greece and completed the nation’s debt restructuring without significant market disruptions. While concerns about slowing growth in China and a European recession weighed on the outlook for the global economy, an acceleration of the US recovery lifted sentiment. Several consecutive months of stronger jobs data signaled solid improvement in the US labor market, a pivotal factor for economic growth. Meanwhile, the European Central Bank revived financial markets with additional liquidity through its long-term refinancing operations. The improving market conditions and generally better-than-expected economic news lured investors still holding cash on the sidelines back to risk assets. Stocks, commodities and high yield bonds rallied through the first two months of the year while rising Treasury yields pressured higher-quality fixed income assets. The rally softened in late March, however, as concerns about slowing growth in China were refueled by negative signals from the world’s second-largest economy. Additionally, concerns over the European debt crisis resurfaced given uncertainty around policies for sovereign debt financing in peripheral countries and rising yields in Portugal and Spain.
Thanks in large part to an exceptionally strong first quarter of 2012, risk assets, including equities and high yield bonds, posted solid returns for the 6-month period ended March 31, 2012. On a 12-month basis, US large-cap stocks and high yield bonds delivered positive results, while small-cap stocks finished in slightly negative territory. International and emerging markets, which experienced significant downturns in 2011, lagged the broader rebound. Fixed income securities experienced mixed results, given recent volatility in yields. US Treasury bonds performed particularly well for the 12-month period; however, an early-2012 sell-off resulted in a negative return for the 6–month period. Municipal bonds staged a solid advance over the past year. Continued low short-term interest rates kept yields on money market securities near their all-time lows.
While markets have improved in recent months, considerable headwinds remain. Europe faces a prolonged recession and the financial situations in Italy, Portugal and Spain remain worrisome. Higher oil and gasoline prices along with slowing growth in China and other emerging-market countries weigh heavily on the future of the global economy. But, we believe that with these challenges come opportunities. We remain committed to working with you and your financial professional to identify actionable ideas for your portfolio. We encourage you to visit www.blackrock.com/newworld for more information.
Sincerely,

Rob Kapito
President, BlackRock Advisors, LLC

“While markets have improved in recent months, considerable headwinds remain.”
Rob Kapito
President, BlackRock Advisors, LLC
| | | | | | | | | | | | | | |
| Total Returns as of March 31, 2012 | | | |
| | | | | 6-month | | | | | | | 12-month | | | |
| US large cap equities (S&P 500® Index) | | | | 25.89 | % | | | | | | 8.54 | % | | |
| US small cap equities (Russell 2000® Index) | | | | 29.83 | | | | | | | (0.18 | ) | | |
| International equities (MSCI Europe, Australasia, Far East Index) | | | | 14.56 | | | | | | | (5.77 | ) | | |
| Emerging market equities (MSCI Emerging Markets Index) | | | | 19.12 | | | | | | | (8.81 | ) | | |
| 3-month Treasury bill (BofA Merrill Lynch 3-Month Treasury Bill Index) | | | | 0.01 | | | | | | | 0.06 | | | |
| US Treasury securities (BofA Merrill Lynch 10- Year US Treasury Index) | | | | (1.05 | ) | | | | | | 14.92 | | | |
| US investment grade bonds (Barclays US Aggregate Bond Index) | | | | 1.43 | | | | | | | 7.71 | | | |
| Tax-exempt municipal bonds (S&P Municipal Bond Index) | | | | 4.16 | | | | | | | 12.56 | | | |
| US high yield bonds (Barclays US Corporate High Yield 2% Issuer Capped Index) | | | | 12.17 | | | | | | | 6.43 | | | |
Past performance is no guarantee of future results. Index performance is shown for illustrative purposes only. You cannot invest directly in an index.
| | | | | | |
| | | | | | | |
| | THIS PAGE NOT PART OF YOUR FUND REPORT | | | | 3 |
| | |
| | |
Fund Summary as of March 31, 2012 | | BlackRock Mid-Cap Growth Equity Portfolio |
BlackRock Mid-Cap Growth Equity Portfolio’s (the “Fund”) investment objective is long-term capital appreciation.
|
Portfolio Management Commentary |
How did the Fund perform?
| — | | The Fund’s Investor A, Institutional and Service Shares outperformed its benchmark, the Russell Midcap Growth® Index, while its Investor B, Investor C and Class R Shares slightly underperformed for the six-month period ended March 31, 2012. All Share Classes posted positive double-digit returns. |
What factors influenced performance?
| — | | Stock selection across a variety of sectors, including health care, industrials and materials all positively impacted performance for the six-month period. Stock selection in health care was the most significant contributor to overall performance. Holdings in pharmaceuticals performed notably well as the industry returned more than 40% within the portfolio. ViroPharma, Inc. was the biggest contributor in the space, as the stock jumped after announcing a distribution agreement for its legacy antibiotic treatment, removing near-term uncertainty over the possibility that the drug would become a generic offering. Also within the pharmaceutical space, Elan Corp. Plc finished higher on strong sales of the company’s treatment for multiple sclerosis symptoms. Positive stock selection in industrials and materials also boosted returns. Within industrials, global equipment manufacturer Terex Corp. significantly contributed given the improving fundamentals for this late-cycle construction business. Chemicals company Rockwood Holdings, Inc. also finished higher during the period due to strong financial results. |
| — | | Weak stock selection within the consumer staples and energy sectors held back the Fund’s performance. Retail coffee holding Green Mountain Coffee Roasters, Inc. sunk close to 50% after missing revenue estimates, leading to a sharp increase in short interest in the stock. Stock selection within energy also notable detracted. Holdings in Superior Energy Services, Inc., Cabot Oil & Gas Corp. and Range Resources Corp. all finished flat to down during the period, after having strong runs to finish 2011. Coal producer Alpha Natural Resources, Inc. also negatively impacted returns, as the significantly lower natural gas prices kept a lid on thermal coal prices within the United States. |
Describe recent portfolio activity.
| — | | The Fund reduced its overall weightings in the health care and energy sectors during the six-month period. |
Describe portfolio positioning at period end.
| — | | At period end, the Fund’s largest overweight relative to the Russell Midcap Growth® Index was in the health care sector, while its most significant underweight was in consumer discretionary. In general, sector allocations are a function of our bottom-up stock selection process, and therefore a result of where we are finding individual opportunities in the mid-cap growth universe. |
The views expressed reflect the opinions of BlackRock as of the date of this report and are subject to change based on changes in market, economic or other conditions. These views are not intended to be a forecast of future events and are no guarantee of future results.
| | | | | |
| Ten Largest Holdings | | Percent of
Long-Term
Investments |
Teva Pharmaceutical Industries Ltd. - ADR | | | | 3 | % |
Cubist Pharmaceuticals, Inc. | | | | 3 | |
Elan Corp. Plc - ADR | | | | 2 | |
TiVo, Inc. | | | | 2 | |
Broadcom Corp., Class A | | | | 2 | |
Boston Scientific Corp. | | | | 2 | |
Teradata Corp. | | | | 2 | |
Jazz Pharmaceuticals, Inc. | | | | 2 | |
Whole Foods Market, Inc. | | | | 2 | |
BE Aerospace, Inc. | | | | 2 | |
| | | | | |
| Sector Allocation | | Percent of
Long-Term
Investments |
Information Technology | | | | 23 | % |
Health Care | | | | 19 | |
Consumer Discretionary | | | | 18 | |
Industrials | | | | 14 | |
Energy | | | | 8 | |
Materials | | | | 8 | |
Financials | | | | 5 | |
Consumer Staples | | | | 5 | |
For Fund compliance purposes, the Fund’s sector classifications refer to any one or more of the sector sub-classifications used by one or more widely recognized market indexes or ratings group indexes, and/or as defined by Fund management. These definitions may not apply for purposes of this report, which may combine sector sub-classifications for reporting ease.
| | | | | | |
| | | | | | | |
| 4 | | BLACKROCK FUNDS | | MARCH 31, 2012 | | |
| | |
| | |
| | BlackRock Mid-Cap Growth Equity Portfolio |
|
Total Return Based on a $10,000 Investment |
| | 1 | Assuming maximum sales charges, if any, transaction costs and other operating expenses, including investment advisory fees. Institutional Shares do not have a sales charge. |
| | 2 | The Fund normally invests at least 80% of its net assets in equity securities issued by US mid-capitalization growth companies, which the portfolio management team believes have above-average earnings growth potential. |
| | 3 | An index that consists of the bottom 800 securities of the Russell 1000® Index with greater-than-average growth orientation as ranked by total market capitalization. Securities in this index generally have higher price-to-book and price-to-earnings ratios, lower dividend yields and higher forecasted growth values. |
|
Performance Summary for the Period Ended March 31, 2012 |
| | | | | | | | | | | | | | | | | | | | | | | | | | | | | | | | | | | |
| | | | | Average Annual Total Returns4 |
| | | | | 1 Year | | 5 Years | | 10 Years |
| | | 6-Month Total Returns | | w/o sales
charge | | w/sales
charge | | w/o sales
charge | | w/sales
charge | | w/o sales
charge | | w/sales
charge |
Institutional | | | | 27.75 | % | | | | 5.35 | % | | | | N/A | | | | | 3.60 | % | | | | N/A | | | | | 5.09 | % | | | | N/A | |
Service | | | | 27.46 | | | | | 4.95 | | | | | N/A | | | | | 3.29 | | | | | N/A | | | | | 4.75 | | | | | N/A | |
Investor A | | | | 27.59 | | | | | 5.03 | | | | | (0.46 | )% | | | | 3.17 | | | | | 2.07 | % | | | | 4.62 | | | | | 4.06 | % |
Investor B | | | | 27.03 | | | | | 4.16 | | | | | (0.35 | ) | | | | 2.38 | | | | | 2.01 | | | | | 4.00 | | | | | 4.00 | |
Investor C | | | | 27.00 | | | | | 4.15 | | | | | 3.15 | | | | | 2.39 | | | | | 2.39 | | | | | 3.85 | | | | | 3.85 | |
Class R | | | | 27.35 | | | | | 4.79 | | | | | N/A | | | | | 3.09 | | | | | N/A | | | | | 4.55 | | | | | N/A | |
Russell Midcap® Growth Index | | | | 27.39 | | | | | 4.43 | | | | | N/A | | | | | 4.44 | | | | | N/A | | | | | 6.92 | | | | | N/A | |
| | 4 | Assuming maximum sales charges, if any. Average annual total returns with and without sales charges reflect reductions for distribution and service fees. See “About Fund Performance” on page 10 for a detailed description of share classes, including any related sales charges and fees. |
| | | N/A - Not applicable as share class and index do not have a sales charge. |
| | | Past performance is not indicative of future results. |
| | | | | | | | | | | | | | | | | | | | | | | | | | | | | | | | | | | |
| | | Actual | | Hypothetical6 | | |
| | | Beginning
Account Value
October 1, 2011 | | Ending
Account Value
March 31, 2012 | | Expenses Paid
During the Period5 | | Beginning
Account Value
October 1, 2011 | | Ending
Account Value
March 31, 2012 | | Expenses Paid
During the Period5 | | Annualized
Expense
Ratio |
Institutional | | | $ | 1,000.00 | | | | $ | 1,277.50 | | | | $ | 6.26 | | | | $ | 1,000.00 | | | | $ | 1,019.50 | | | | $ | 5.55 | | | | | 1.10 | % |
Service | | | $ | 1,000.00 | | | | $ | 1,274.60 | | | | $ | 8.98 | | | | $ | 1,000.00 | | | | $ | 1,017.10 | | | | $ | 7.97 | | | | | 1.58 | % |
Investor A | | | $ | 1,000.00 | | | | $ | 1,275.90 | | | | $ | 7.91 | | | | $ | 1,000.00 | | | | $ | 1,018.05 | | | | $ | 7.01 | | | | | 1.39 | % |
Investor B | | | $ | 1,000.00 | | | | $ | 1,270.30 | | | | $ | 12.26 | | | | $ | 1,000.00 | | | | $ | 1,014.20 | | | | $ | 10.88 | | | | | 2.16 | % |
Investor C | | | $ | 1,000.00 | | | | $ | 1,270.00 | | | | $ | 12.26 | | | | $ | 1,000.00 | | | | $ | 1,014.20 | | | | $ | 10.88 | | | | | 2.16 | % |
Class R | | | $ | 1,000.00 | | | | $ | 1,273.50 | | | | $ | 9.38 | | | | $ | 1,000.00 | | | | $ | 1,016.75 | | | | $ | 8.32 | | | | | 1.65 | % |
| | 5 | For each class of the Fund, expenses are equal to the annualized expense ratio for the class, multiplied by the average account value over the period, multiplied by 183/366 (to reflect the one-half year period shown). |
| | 6 | Hypothetical 5% annual return before expenses is calculated by pro rating the number of days in the most recent fiscal half year divided by 366. |
| | | See “Disclosure of Expenses” on page 10 for further information on how expenses were calculated. |
| | | | | | |
| | | | | | | |
| | BLACKROCK FUNDS | | MARCH 31, 2012 | | 5 |
| | |
| | |
Fund Summary as of March 31, 2012 | | BlackRock Mid-Cap Value Equity Portfolio |
BlackRock Mid-Cap Value Equity Portfolio’s (the “Fund”) investment objective is long-term capital appreciation.
|
Portfolio Management Commentary |
How did the Fund perform?
| — | | For the six-month period ended March 31, 2012, the Fund outperformed its benchmark, the Russell Midcap® Value Index. |
What factors influenced performance?
| — | | Stock selection was the greatest contributor to the Fund’s outperformance, most notably in the information technology (“IT”), consumer discretionary and energy sectors. In IT, Seagate Technology Plc. was the strongest performer. The disk drive maker raised its revenue expectations during the period as flooding in Thailand hampered production at many of its competitors. Other notable contributors in the IT sector included network communications equipment maker ADTRAN, Inc. and electronic components producer TE Connectivity Ltd. In consumer discretionary, improving consumer spending trends drove strong gains in holdings of specialty retailers Abercrombie & Fitch Co. and Ascena Retail Group, Inc. Auto parts manufacturer Dana Holding Corp. and hotel and resort operator Gaylord Entertainment Co. also made notable contributions to the Fund’s return. Energy stocks generally performed well during the period due to an improving outlook for global economic growth. Among the Fund’s energy holdings, drilling equipment maker National Oilwell Varco, Inc. and oil & gas exploration & production companies Denbury Resources, Inc. and Whiting Petroleum Corp. boosted returns. |
| — | | Detracting from performance was stock selection within the utilities, materials and health care sectors. The relatively defensive utilities sector underperformed the broader market during the period as investors favored higher risk assets. Accordingly, the Fund’s sector underweight |
| | | relative to the benchmark index was beneficial; however, the benefit was overshadowed by the negative impact of stock selection within the sector. Key areas of weakness were the Fund’s holdings in independent power producers and electric utilities. In materials, stock selection within the metals & mining and chemicals industries detracted from performance. In the health care sector, weaker performers included drug distributor AmerisourceBergen Corp., health care benefits provider WellPoint, Inc. and high-tech health care equipment provider Thermo Fisher Scientific, Inc. |
Describe recent portfolio activity.
| — | | During the six-month period, the Fund modestly increased exposure to the utilities sector with new positions in Edison International Co. and NV Energy, Inc. The Fund also increased its weighting in health care with the purchase of Boston Scientific Corp. and Covidien Plc. Conversely, the Fund reduced exposure to financials, primarily within real estate investment trusts (“REITs”), and trimmed its allocation to the materials sector with the sale of agricultural chemicals producer Agrium, Inc. and coal producer Walter Energy, Inc. |
Describe portfolio positioning at period end.
| — | | At period end, the Fund’s positioning remained biased toward continued gradual improvement in the global economy and a generally positive environment for the US equity market. The Fund’s most notable sector weightings relative to the Russell Midcap® Value Index included overweights in IT and health care, and underweights in utilities, consumer staples and financials. |
The views expressed reflect the opinions of BlackRock as of the date of this report and are subject to change based on changes in market, economic or other conditions. These views are not intended to be a forecast of future events and are no guarantee of future results.
| | | | | |
| Ten Largest Holdings | | Percent of
Long-Term
Investments |
The J.M. Smucker Co. | | | | 2 | % |
Loews Corp. | | | | 2 | |
AXIS Capital Holdings Ltd. | | | | 2 | |
XL Group Plc | | | | 2 | |
RenaissanceRe Holdings Ltd. | | | | 2 | |
TE Connectivity Ltd. | | | | 2 | |
Ashland, Inc. | | | | 2 | |
Take-Two Interactive Software, Inc. | | | | 2 | |
BioMed Realty Trust, Inc. | | | | 2 | |
PPL Corp. | | | | 2 | |
| | | | | |
| Sector Allocation | | Percent of
Long-Term
Investments |
Financials | | | | 29 | % |
Information Technology | | | | 15 | |
Consumer Discretionary | | | | 11 | |
Utilities | | | | 11 | |
Industrials | | | | 10 | |
Health Care | | | | 9 | |
Energy | | | | 6 | |
Consumer Staples | | | | 5 | |
Materials | | | | 4 | |
For Fund compliance purposes, the Fund’s sector classifications refer to any one or more of the sector sub-classifications used by one or more widely recognized market indexes or ratings group indexes, and/or as defined by Fund management. These definitions may not apply for purposes of this report, which may combine sector sub-classifications for reporting ease.
| | | | | | |
| | | | | | | |
| 6 | | BLACKROCK FUNDS | | MARCH 31, 2012 | | |
| | |
| | |
| | BlackRock Mid-Cap Value Equity Portfolio |
|
Total Return Based on a $10,000 Investment |
| | 1 | Assuming maximum sales charges, if any, transaction costs and other operating expenses, including investment advisory fees. Institutional Shares do not have a sales charge. |
| | 2 | The Fund normally invests at least 80% of its net assets in equity securities issued by US mid-capitalization value companies. |
| | 3 | An index that consists of the bottom 800 securities of the Russell 1000® Index with less-than-average growth orientation as ranked by total market capitalization. Securities in this index generally have low price-to-book and price-to-earnings ratios, higher dividend yields and lower forecasted growth values. |
|
Performance Summary for the Period Ended March 31, 2012 |
| | | | | | | | | | | | | | | | | | | | | | | | | | | | | | | | | | | |
| | | | | Average Annual Total Returns4 |
| | | | | 1 Year | | 5 Years | | 10 Years |
| | | 6-Month
Total Returns | | w/o sales
charge | | w/sales
charge | | w/o sales
charge | | w/sales
charge | | w/o sales
charge | | w/sales
charge |
Institutional | | | | 27.36 | % | | | | (1.00 | )% | | | | N/A | | | | | 1.11 | % | | | | N/A | | | | | 6.07 | % | | | | N/A | |
Service | | | | 27.22 | | | | | (1.28 | ) | | | | N/A | | | | | 0.83 | | | | | N/A | | | | | 5.76 | | | | | N/A | |
Investor A | | | | 27.27 | | | | | (1.22 | ) | | | | (6.42 | )% | | | | 0.82 | | | | | (0.26 | )% | | | | 5.76 | | | | | 5.19 | % |
Investor B | | | | 26.81 | | | | | (2.07 | ) | | | | (6.48 | ) | | | | 0.05 | | | | | (0.30 | ) | | | | 5.15 | | | | | 5.15 | |
Investor C | | | | 26.78 | | | | | (1.99 | ) | | | | (2.97 | ) | | | | 0.04 | | | | | 0.04 | | | | | 4.98 | | | | | 4.98 | |
Class R | | | | 26.99 | | | | | (1.65 | ) | | | | N/A | | | | | 0.79 | | | | | N/A | | | | | 5.83 | | | | | N/A | |
Russell Midcap® Value Index. | | | | 26.30 | | | | | 2.28 | | | | | N/A | | | | | 1.26 | | | | | N/A | | | | | 8.02 | | | | | N/A | |
| | 4 | Assuming maximum sales charges, if any. Average annual total returns with and without sales charges reflect reductions for distribution and service fees. See “About Fund Performance” on page 10 for a detailed description of share classes, including any related sales charges and fees. |
N/A - Not applicable as share class and index do not have a sales charge.
Past performance is not indicative of future results.
| | | | | | | | | | | | | | | | | | | | | | | | | | | | | | | | | | | |
| | | Actual | | Hypothetical6 | | |
| | | Beginning
Account Value
October 1, 2011 | | Ending Account Value
March 31, 2012 | | Expenses Paid
During the Period5 | | Beginning Account Value
October 1, 2011 | | Ending
Account Value
March 31, 2012 | | Expenses Paid
During the Period5 | | Annualized
Expense
Ratio |
Institutional | | | $ | 1,000.00 | | | | $ | 1,273.60 | | | | $ | 5.51 | | | | $ | 1,000.00 | | | | $ | 1,020.15 | | | | $ | 4.90 | | | | | 0.97 | % |
Service | | | $ | 1,000.00 | | | | $ | 1,272.20 | | | | $ | 7.33 | | | | $ | 1,000.00 | | | | $ | 1,018.55 | | | | $ | 6.51 | | | | | 1.29 | % |
Investor A | | | $ | 1,000.00 | | | | $ | 1,272.70 | | | | $ | 7.33 | | | | $ | 1,000.00 | | | | $ | 1,018.55 | | | | $ | 6.51 | | | | | 1.29 | % |
Investor B | | | $ | 1,000.00 | | | | $ | 1,268.10 | | | | $ | 11.68 | | | | $ | 1,000.00 | | | | $ | 1,014.70 | | | | $ | 10.38 | | | | | 2.06 | % |
Investor C | | | $ | 1,000.00 | | | | $ | 1,267.80 | | | | $ | 11.68 | | | | $ | 1,000.00 | | | | $ | 1,014.70 | | | | $ | 10.38 | | | | | 2.06 | % |
Class R | | | $ | 1,000.00 | | | | $ | 1,269.90 | | | | $ | 9.36 | | | | $ | 1,000.00 | | | | $ | 1,016.75 | | | | $ | 8.32 | | | | | 1.65 | % |
| | 5 | For each class of the Fund, expenses are equal to the annualized expense ratio for the class, multiplied by the average account value over the period, multiplied by 183/366 (to reflect the one-half year period shown). |
| | 6 | Hypothetical 5% annual return before expenses is calculated by pro rating the number of days in the most recent fiscal half year divided by 366. |
| | See | “Disclosure of Expenses” on page 10 for further information on how expenses were calculated. |
| | | | | | |
| | | | | | | |
| | BLACKROCK FUNDS | | MARCH 31, 2012 | | 7 |
| | |
| | |
Fund Summary as of March 31, 2012 | | BlackRock Small Cap Growth Equity Portfolio |
BlackRock Small Cap Growth Equity Portfolio’s (the “Fund”) investment objective is long-term capital appreciation.
|
Portfolio Management Commentary |
How did the Fund perform?
| — | | The Fund outperformed its benchmark, the Russell 2000® Growth Index, for the six-month period ended March 31, 2012. |
What factors influenced performance?
| — | | Stock selection across a variety of sectors contributed to the Fund’s performance relative to the benchmark index, including health care and industrials. Stock selection within the health care sector was the most significant contributor to relative returns. Holdings in Inhibitex, Inc., ViroPharma, Inc. and SonoSite, Inc. each experienced substantial stock price movements, adding more than 1% each to relative returns due to strong drug profiles and medical device products that each respective company possesses. Stock selection within industrials also lifted returns. Capital-intensive companies such as Wabash National Corp. and Altra Holdings, Inc. all experienced a strong bounce from their August 2011 pullback, as these stocks benefited from secular growth within the highly cyclical machinery industry. The Fund’s overall underweight exposure to consumer staples slightly benefited relative returns, as the sector underperformed the overall market. |
| — | | Stock selection within the consumer discretionary and financials sectors slightly held back relative returns during the six-month period. Within |
| | | specialty retail, the Fund’s position in The Children’s Place Retail Stores, Inc. hampered overall returns and lagged the return of the overall return of the benchmark despite being up more than 10% during the period. The largest overall detractor within the consumer discretionary space was Shutterfly, Inc., as worries of increasing competition sent the online photo provider down more than 30%. Within financials, higher-conviction holding DFC Global Corp. fell more than 10% after having a strong run during the prior reporting period. |
Describe recent portfolio activity.
| — | | The Fund reduced its overall weightings in the health care and energy sectors during the six-month period, while it increased its overall exposure to industrials. |
Describe portfolio positioning at period end.
| — | | At period end, the Fund’s largest overweight relative to the Russell 2000® Growth Index was in the energy sector, while its most significant underweight was in financials. In general, sector allocations are a function of our bottom-up stock selection process, and therefore a result of where we are finding individual opportunities in the small-cap growth universe. |
| | | | | |
| Ten Largest Holdings | | Percent of
Long-Term
Investments |
TiVo, Inc. | | | | 4 | % |
Cubist Pharmaceuticals, Inc. | | | | 4 | |
ExlService Holdings, Inc. | | | | 3 | |
Acorda Therapeutics, Inc. | | | | 3 | |
Jazz Pharmaceuticals, Inc. | | | | 3 | |
Elan Corp. Plc - ADR | | | | 2 | |
DFC Global Corp. | | | | 2 | |
ViroPharma, Inc. | | | | 2 | |
ACCO Brands Corp | | | | 2 | |
Caribou Coffee Co., Inc. | | | | 2 | |
| | | | | |
| Sector Allocation | | Percent of
Long-Term
Investments |
Information Technology | | | | 26 | % |
Health Care | | | | 21 | |
Industrials | | | | 19 | |
Consumer Discretionary | | | | 13 | |
Energy | | | | 11 | |
Materials | | | | 4 | |
Financials | | | | 2 | |
Consumer Staples | | | | 2 | |
Telecommunication Services | | | | 2 | |
For Fund compliance purposes, the Fund’s sector classifications refer to any one or more of the sector sub-classifications used by one or more widely recognized market indexes or ratings group indexes, and/or as defined by Fund management. These definitions may not apply for purposes of this report, which may combine sector sub-classifications for reporting ease.
| | | | | | |
| | | | | | | |
| 8 | | BLACKROCK FUNDS | | MARCH 31, 2012 | | |
| | |
| | |
| | BlackRock Small Cap Growth Equity Portfolio |
|
Total Return Based on a $10,000 Investment |
| | 1 | Assuming maximum sales charges, if any, transaction costs and other operating expenses, including investment advisory fees. Institutional Shares do not have a sales charge. |
| | 2 | The Fund normally invests at least 80% of its net assets in the equity securities issued by US small capitalization companies (market capitalizations between approximately $76.4 million and $3.1 billion as of June 30, 2011), which the portfolio management team believes offer superior prospects for growth. |
| | 3 | An index that contains those securities with greater-than-average growth orientations, generally having higher price-to-book and price-to-earnings ratios. |
|
Performance Summary for the Period Ended March 31, 2012 |
| | | | | | | | | | | | | | | | | | | | | | | | | | | | | | | | | | | |
| | | | | Average Annual Total Returns4 |
| | | | | 1 Year | | 5 Years | | 10 Years |
| | | 6-Month
Total Returns | | w/o sales
charge | | w/sales
charge | | w/o sales
charge | | w/sales
charge | | w/o sales
charge | | w/sales
charge |
Institutional | | | | 38.51 | % | | | | 6.82 | % | | | | N/A | | | | | 5.08 | % | | | | N/A | | | | | 8.37 | % | | | | N/A | |
Service | | | | 38.22 | | | | | 6.45 | | | | | N/A | | | | | 4.80 | | | | | N/A | | | | | 8.09 | | | | | N/A | |
Investor A | | | | 38.26 | | | | | 6.37 | | | | | 0.78 | % | | | | 4.67 | | | | | 3.54 | % | | | | 7.97 | | | | | 7.39 | % |
Investor B | | | | 37.67 | | | | | 5.56 | | | | | 1.06 | | | | | 3.80 | | | | | 3.46 | | | | | 7.26 | | | | | 7.26 | |
Investor C | | | | 37.72 | | | | | 5.57 | | | | | 4.57 | | | | | 3.73 | | | | | 3.73 | | | | | 7.06 | | | | | 7.06 | |
Russell 2000® Growth Index | | | | 30.26 | | | | | 0.68 | | | | | N/A | | | | | 4.15 | | | | | N/A | | | | | 6.00 | | | | | N/A | |
| | 4 | Assuming maximum sales charges, if any. Average annual total returns with and without sales charges reflect reductions for distribution and service fees. See “About Fund Performance” on page 10 for a detailed description of share classes, including any related sales charges and fees. |
| | | N/A - Not applicable as share class and index do not have a sales charge. |
| | | Past performance is not indicative of future results. |
| | | | | | | | | | | | | | | | | | | | | | | | | | | | | | | | | | | |
| | | Actual | | Hypothetical6 | | |
| | | Beginning
Account Value
October 1, 2011 | | Ending
Account Value
March 31, 2012 | | Expenses Paid
During the Period5 | | Beginning
Account Value
October 1, 2011 | | Ending
Account Value
March 31, 2012 | | Expenses Paid
During the Period5 | | Annualized
Expense
Ratio |
Institutional | | | $ | 1,000.00 | | | | $ | 1,385.10 | | | | $ | 4.89 | | | | $ | 1,000.00 | | | | $ | 1,020.90 | | | | $ | 4.14 | | | | | 0.82 | % |
Service | | | $ | 1,000.00 | | | | $ | 1,382.20 | | | | $ | 7.03 | | | | $ | 1,000.00 | | | | $ | 1,019.10 | | | | $ | 5.96 | | | | | 1.18 | % |
Investor A | | | $ | 1,000.00 | | | | $ | 1,382.60 | | | | $ | 6.91 | | | | $ | 1,000.00 | | | | $ | 1,019.20 | | | | $ | 5.86 | | | | | 1.16 | % |
Investor B | | | $ | 1,000.00 | | | | $ | 1,376.70 | | | | $ | 11.88 | | | | $ | 1,000.00 | | | | $ | 1,015.00 | | | | $ | 10.08 | | | | | 2.00 | % |
Investor C | | | $ | 1,000.00 | | | | $ | 1,377.20 | | | | $ | 11.65 | | | | $ | 1,000.00 | | | | $ | 1,015.20 | | | | $ | 9.87 | | | | | 1.96 | % |
| | 5 | For each class of the Fund, expenses are equal to the annualized expense ratio for the class, multiplied by the average account value over the period, multiplied by 183/366 (to reflect the one-half year period shown). |
| | 6 | Hypothetical 5% annual return before expenses is calculated by pro rating the number of days in the most recent fiscal half year divided by 366. |
| | | See “Disclosure of Expenses” on page 10 for further information on how expenses were calculated. |
| | | | | | |
| | | | | | | |
| | BLACKROCK FUNDS | | MARCH 31, 2012 | | 9 |
| — | | Institutional Shares are not subject to any sales charge. Institutional Shares bear no ongoing distribution or service fees and are available only to eligible investors. |
| — | | Service Shares are not subject to any sales charge (front-end load) or deferred sales charge. Service Shares are subject to a service fee of 0.25% per year (but no distribution fee). |
| — | | Investor A Shares incur a maximum initial sales charge (front-end load) of 5.25% and a service fee of 0.25% per year (but no distribution fee). |
| — | | Investor B Shares are subject to a maximum contingent deferred sales charge (“CDSC”) of 4.50% declining to 0% after six years. In addition, Investor B Shares are subject to a distribution fee of 0.75% per year and a service fee of 0.25% per year. Investor B Shares automatically convert to Investor A Shares after approximately eight years. (There is no initial sales charge for automatic share conversions.) All returns for periods greater than eight years reflect this conversion. Investor B Shares are only available through exchanges, dividend reinvestment by existing shareholders or for purchase by certain qualified employee benefit plans. |
| — | | Investor C Shares are subject to a 1.00% CDSC if redeemed within one year of purchase. In addition, Investor C Shares are subject to a distribution fee of 0.75% per year and a service fee of 0.25% per year. |
| — | | Class R Shares are not subject to any sales charge. Class R Shares are subject to a distribution fee of 0.25% per year and a service fee of 0.25% per year. Class R Shares are available only to certain retirement and other similar plans. Prior to October 2, 2006, the performance results of Class R Shares of BlackRock Mid-Cap Growth Equity Portfolio are those of Institutional Shares (which have no distribution or service fees) restated to reflect Class R Shares fees. Prior to July 30, 2010, the |
performance results of BlackRock Mid-Cap Value Equity Portfolio’s Class R Shares are those of Institutional Shares (which have no distribution or service fees) restated to reflect Class R Shares fees.
Performance information reflects past performance and does not guarantee future results. Current performance may be lower or higher than the performance data quoted. Refer to www.blackrock.com/funds to obtain performance data current to the most recent month-end. Performance results do not reflect the deduction of taxes that a shareholder would pay on Fund distributions or the redemption of Fund shares. Figures shown in each of the performance tables on the previous pages assume reinvestment of all dividends and distributions, if any, at net asset value (“NAV”) on the ex-dividend date. Investment return and principal value of shares will fluctuate so that shares, when redeemed, may be worth more or less than their original cost.
Performance for BlackRock Mid-Cap Value Equity Portfolio for the periods prior to January 31, 2005 is based on performance of a certain former State Street Research mutual fund that reorganized with BlackRock Mid-Cap Value Equity Portfolio on that date.
The Funds’ investment advisor, BlackRock Advisors, LLC (the “Manager”), waived and/or reimbursed a portion of each Fund’s expenses. Without such waiver and/or reimbursement, a Fund’s performance would have been lower. The Manager is under no obligation to waive or reimburse or to continue waiving or reimbursing its fees after the applicable termination date. See Note 3 of the Notes to Financial Statements for additional information on waivers and reimbursements. Dividends paid to each class of shares will vary because of the different levels of service, distribution and transfer agency fees applicable to each class, which are deducted from the income available to be paid to shareholders.
Disclosure of Expenses
Shareholders of the Funds may incur the following charges: (a) expenses related to transactions, including sales charges and exchange fees; and (b) operating expenses, including investment advisory fees, service and distribution fees, including 12b-1 fees, acquired fund fees and expenses and other Fund expenses. The expense examples on the previous pages (which are based on a hypothetical investment of $1,000 invested on October 1, 2011 and held through March 31, 2012) are intended to assist shareholders both in calculating expenses based on an investment in the Funds and in comparing these expenses with similar costs of investing in other mutual funds.
The tables provide information about actual account values and actual expenses. In order to estimate the expenses a shareholder paid during the period covered by this report, shareholders can divide their account value by $1,000 and then multiply the result by the number corresponding to their Fund and share class under the headings entitled “Expenses Paid During the Period.”
The tables also provide information about hypothetical account values and hypothetical expenses based on a Fund’s actual expense ratio and an assumed rate of return of 5% per year before expenses. In order to assist shareholders in comparing the ongoing expenses of investing in these Funds and other funds, compare the 5% hypothetical example with the 5% hypothetical examples that appear in other funds’ shareholder reports.
The expenses shown in the tables are intended to highlight shareholders’ ongoing costs only and do not reflect any transactional expenses, such as sales charges or exchange fees, if any. Therefore, the hypothetical examples are useful in comparing ongoing expenses only, and will not help shareholders determine the relative total expenses of owning different funds. If these transactional expenses were included, shareholder expenses would have been higher.
| | | | | | |
| | | | | | | |
| 10 | | BLACKROCK FUNDS | | MARCH 31, 2012 | | |
| | |
| | |
Derivative Financial Instruments | | |
The Funds may invest in various derivative financial instruments, including options as specified in Note 2 of the Notes to Financial Statements, which may constitute forms of economic leverage. Such derivative financial instruments are used to obtain exposure to a market without owning or taking physical custody of securities or to hedge market and/or equity risks. Derivative financial instruments involve risks, including the imperfect correlation between the value of a derivative financial instrument and the underlying asset, possible default of the counterparty to the transaction or illiquidity of the derivative financial instrument. The Funds’ ability to use a derivative financial instrument successfully depends on
the investment advisor’s ability to predict pertinent market movements accurately, which cannot be assured. The use of derivative financial instruments may result in losses greater than if they had not been used, may require a Fund to sell or purchase portfolio investments at inopportune times or for distressed values, may limit the amount of appreciation a Fund can realize on an investment, may result in lower dividends paid to shareholders or may cause a Fund to hold an investment that it might otherwise sell. The Funds’ investments in these instruments are discussed in detail in the Notes to Financial Statements.
| | | | | | |
| | | | | | | |
| | BLACKROCK FUNDS | | MARCH 31, 2012 | | 11 |
| | |
| | |
Schedule of Investments March 31, 2012 (Unaudited) | | BlackRock Mid-Cap Growth Equity Portfolio (Percentages shown are based on Net Assets) |
| | | | | | | | |
| Common Stocks | | Shares | | | Value | |
Aerospace & Defense – 3.1% | | | | | | | | |
BE Aerospace, Inc. (a)(b) | | | 127,000 | | | $ | 5,901,690 | |
Precision Castparts Corp. | | | 19,200 | | | | 3,319,680 | |
TransDigm Group, Inc. (a) | | | 11,300 | | | | 1,308,088 | |
| | | | | | | | |
| | | | | | | 10,529,458 | |
| |
Air Freight & Logistics – 0.7% | | | | | | | | |
Expeditors International of Washington, Inc. | | | 53,900 | | | | 2,506,889 | |
| |
Auto Components – 2.3% | | | | | | | | |
Dana Holding Corp. (a) | | | 213,900 | | | | 3,315,450 | |
Lear Corp. | | | 94,400 | | | | 4,388,656 | |
| | | | | | | | |
| | | | | | | 7,704,106 | |
| |
Automobiles – 1.1% | | | | | | | | |
Harley-Davidson, Inc. | | | 76,200 | | | | 3,739,896 | |
| |
Biotechnology – 5.3% | | | | | | | | |
Acorda Therapeutics, Inc. (a) | | | 57,572 | | | | 1,528,537 | |
Alkermes Plc (a) | | | 46,600 | | | | 864,430 | |
Amarin Corp. Plc - ADR (a)(b) | | | 271,964 | | | | 3,078,632 | |
Cubist Pharmaceuticals, Inc. (a)(b)(c) | | | 209,945 | | | | 9,080,121 | |
Vertex Pharmaceuticals, Inc. (a) | | | 81,900 | | | | 3,358,719 | |
| | | | | | | | |
| | | | | | | 17,910,439 | |
| |
Capital Markets – 1.0% | | | | | | | | |
Lazard Ltd., Class A | | | 117,700 | | | | 3,361,512 | |
| |
Chemicals – 5.6% | | | | | | | | |
Airgas, Inc. | | | 48,000 | | | | 4,270,560 | |
Ashland, Inc. | | | 74,200 | | | | 4,530,652 | |
Celanese Corp. | | | 73,400 | | | | 3,389,612 | |
Ecolab, Inc. | | | 53,200 | | | | 3,283,504 | |
Rockwood Holdings, Inc. (a) | | | 61,100 | | | | 3,186,365 | |
| | | | | | | | |
| | | | | | | 18,660,693 | |
| |
Commercial Banks – 1.3% | | | | | | | | |
First Republic Bank (a) | | | 68,100 | | | | 2,243,214 | |
SVB Financial Group (a)(b) | | | 30,900 | | | | 1,988,106 | |
| | | | | | | | |
| | | | | | | 4,231,320 | |
| |
Communications Equipment – 2.5% | | | | | | | | |
Ciena Corp. (a)(b) | | | 213,100 | | | | 3,450,089 | |
Riverbed Technology, Inc. (a)(b) | | | 177,300 | | | | 4,978,584 | |
| | | | | | | | |
| | | | | | | 8,428,673 | |
| |
Computers & Peripherals – 1.6% | | | | | | | | |
NetApp, Inc. (a) | | | 117,100 | | | | 5,242,567 | |
| |
Diversified Financial Services – 1.3% | | | | | | | | |
IntercontinentalExchange, Inc. (a) | | | 32,700 | | | | 4,493,634 | |
| |
Electrical Equipment – 1.2% | | | | | | | | |
AMETEK, Inc. | | | 79,650 | | | | 3,863,822 | |
| |
Energy Equipment & Services – 0.8% | | | | | | | | |
Superior Energy Services, Inc. (a) | | | 102,400 | | | | 2,699,264 | |
| |
Food & Staples Retailing – 1.8% | | | | | | | | |
Whole Foods Market, Inc. | | | 73,600 | | | | 6,123,520 | |
| |
Food Products – 3.4% | | | | | | | | |
Flowers Foods, Inc. | | | 189,900 | | | | 3,868,263 | |
| | | | | | | | |
| Common Stocks | | Shares | | | Value | |
Food Products (concluded) | | | | | | | | |
Green Mountain Coffee Roasters, Inc. (a)(b) | | | 88,700 | | | $ | 4,154,708 | |
The Hershey Co. | | | 57,000 | | | | 3,495,810 | |
| | | | | | | | |
| | | | | | | 11,518,781 | |
| |
Health Care Equipment & Supplies – 2.6% | | | | | | | | |
Boston Scientific Corp. (a) | | | 1,069,900 | | | | 6,398,002 | |
DENTSPLY International, Inc. | | | 41,700 | | | | 1,673,421 | |
Hologic, Inc. (a) | | | 38,200 | | | | 823,210 | |
| | | | | | | | |
| | | | | | | 8,894,633 | |
| |
Health Care Providers & Services – 0.3% | | | | | | | | |
HealthSouth Corp. (a) | | | 43,200 | | | | 884,736 | |
| |
Hotels, Restaurants & Leisure – 1.0% | | | | | | | | |
Darden Restaurants, Inc. | | | 35,400 | | | | 1,811,064 | |
Starwood Hotels & Resorts Worldwide, Inc. | | | 29,600 | | | | 1,669,736 | |
| | | | | | | | |
| | | | | | | 3,480,800 | |
| |
Insurance – 1.0% | | | | | | | | |
RenaissanceRe Holdings Ltd. | | | 46,100 | | | | 3,491,153 | |
| |
Internet & Catalog Retail – 1.3% | | | | | | | | |
priceline.com, Inc. (a) | | | 5,900 | | | | 4,233,250 | |
| |
IT Services – 5.3% | | | | | | | | |
Alliance Data Systems Corp. (a)(b) | | | 39,100 | | | | 4,925,036 | |
Gartner, Inc. (a)(b) | | | 87,200 | | | | 3,718,208 | |
Genpact Ltd. (a) | | | 173,400 | | | | 2,826,420 | |
Teradata Corp. (a) | | | 93,700 | | | | 6,385,655 | |
| | | | | | | | |
| | | | | | | 17,855,319 | |
| |
Life Sciences Tools & Services – 0.5% | | | | | | | | |
Illumina, Inc. (a) | | | 32,600 | | | | 1,715,086 | |
| |
Machinery – 5.5% | | | | | | | | |
CNH Global NV | | | 110,300 | | | | 4,378,910 | |
Flowserve Corp. | | | 7,200 | | | | 831,672 | |
Navistar International Corp. (a) | | | 81,000 | | | | 3,276,450 | |
Stanley Black & Decker, Inc. | | | 21,400 | | | | 1,646,944 | |
Terex Corp. (a) | | | 137,200 | | | | 3,087,000 | |
Timken Co. | | | 32,200 | | | | 1,633,828 | |
Trinity Industries, Inc. | | | 112,600 | | | | 3,710,170 | |
| | | | | | | | |
| | | | | | | 18,564,974 | |
| |
Media – 2.1% | | | | | | | | |
AMC Networks, Inc., Class A (a) | | | 30,700 | | | | 1,370,141 | |
CBS Corp., Class B | | | 165,000 | | | | 5,595,150 | |
| | | | | | | | |
| | | | | | | 6,965,291 | |
| |
Metals & Mining – 0.8% | | | | | | | | |
Globe Specialty Metals, Inc. | | | 176,400 | | | | 2,623,068 | |
| |
Multiline Retail – 1.5% | | | | | | | | |
Dollar Tree, Inc. (a) | | | 24,300 | | | | 2,296,107 | |
Nordstrom, Inc. | | | 46,500 | | | | 2,590,980 | |
| | | | | | | | |
| | | | | | | 4,887,087 | |
| |
Oil, Gas & Consumable Fuels – 7.2% | | | | | | | | |
Alpha Natural Resources, Inc. (a) | | | 50,500 | | | | 768,105 | |
Cabot Oil & Gas Corp. | | | 99,800 | | | | 3,110,766 | |
CONSOL Energy, Inc. | | | 102,200 | | | | 3,485,020 | |
| | | | | | |
| To simplify the listings of portfolio holdings in the Schedules of Investments, the names and descriptions of many of the securities have been abbreviated according to the following list: | | | | ADR USD | | American Depositary Receipts US Dollar |
See Notes to Financial Statements.
| | | | | | |
| | | | | | | |
| 12 | | BLACKROCK FUNDS | | MARCH 31, 2012 | | |
| | |
| | |
Schedule of Investments (continued) | | BlackRock Mid-Cap Growth Equity Portfolio (Percentages shown are based on Net Assets) |
| | | | | | | | |
| Common Stocks | | Shares | | | Value | |
Oil, Gas & Consumable Fuels (concluded) | |
Energy XXI Bermuda Ltd. (a)(b) | | | 26,375 | | | $ | 952,401 | |
Plains Exploration & Production Co. (a) | | | 129,000 | | | | 5,501,850 | |
Range Resources Corp. | | | 52,000 | | | | 3,023,280 | |
SandRidge Energy, Inc. (a)(b) | | | 624,800 | | | | 4,892,184 | |
SM Energy Co. | | | 36,400 | | | | 2,576,028 | |
| | | | | | | | |
| | | | | | | 24,309,634 | |
| |
Paper & Forest Products – 1.1% | |
International Paper Co. | | | 104,100 | | | | 3,653,910 | |
| |
Pharmaceuticals – 9.5% | | | | | | | | |
Elan Corp. Plc - ADR (a) | | | 482,700 | | | | 7,245,327 | |
Endo Pharmaceuticals Holdings, Inc. (a) | | | 90,700 | | | | 3,512,811 | |
Jazz Pharmaceuticals, Inc. (a)(b) | | | 128,461 | | | | 6,226,505 | |
Teva Pharmaceutical Industries Ltd.- ADR | | | 224,000 | | | | 10,093,440 | |
ViroPharma, Inc. (a)(b) | | | 159,671 | | | | 4,801,307 | |
| | | | | | | | |
| | | | | | | 31,879,390 | |
| |
Professional Services – 2.9% | |
IHS, Inc., Class A (a) | | | 58,300 | | | | 5,459,795 | |
Robert Half International, Inc. | | | 146,900 | | | | 4,451,070 | |
| | | | | | | | |
| | | | | | | 9,910,865 | |
| |
Real Estate Investment Trusts (REITs) – 0.8% | |
DuPont Fabros Technology, Inc. (b) | | | 105,900 | | | | 2,589,255 | |
| |
Semiconductors & Semiconductor Equipment – 7.5% | |
Analog Devices, Inc. | | | 137,900 | | | | 5,571,160 | |
Avago Technologies Ltd. | | | 125,500 | | | | 4,890,735 | |
Broadcom Corp., Class A (a) | | | 164,000 | | | | 6,445,200 | |
ON Semiconductor Corp. (a) | | | 589,400 | | | | 5,310,494 | |
Xilinx, Inc. | | | 81,300 | | | | 2,961,759 | |
| | | | | | | | |
| | | | | | | 25,179,348 | |
| |
Software – 5.4% | | | | | | | | |
Check Point Software Technologies Ltd. (a) | | | 83,100 | | | | 5,305,104 | |
Citrix Systems, Inc. (a) | | | 11,300 | | | | 891,683 | |
Intuit, Inc. | | | 86,500 | | | | 5,201,245 | |
TiVo, Inc. (a) | | | 563,700 | | | | 6,758,763 | |
| | | | | | | | |
| | | | | | | 18,156,795 | |
| |
Specialty Retail – 6.9% | |
The Children’s Place Retail Stores, Inc. (a)(b) | | | 30,400 | | | | 1,570,768 | |
Dick’s Sporting Goods, Inc. | | | 38,400 | | | | 1,846,272 | |
Express, Inc. (a) | | | 217,700 | | | | 5,438,146 | |
GameStop Corp., Class A (b) | | | 161,966 | | | | 3,537,337 | |
The Gap, Inc. | | | 74,300 | | | | 1,942,202 | |
Limited Brands, Inc. | | | 101,100 | | | | 4,852,800 | |
TJX Cos., Inc. | | | 97,800 | | | | 3,883,638 | |
| | | | | | | | |
| | | | | | | 23,071,163 | |
| |
Textiles, Apparel & Luxury Goods – 1.4% | |
Fossil, Inc. (a)(b) | | | 35,500 | | | | 4,685,290 | |
| |
Total Common Stocks – 97.6% | | | | | | | 328,045,621 | |
| | | | | | | | |
| Warrants (d) | | Shares | | | Value | |
Pharmaceuticals – 0.0% | |
Alexza Pharmaceuticals, Inc. (Issued/Exercisable 5/06/11, 1 Share for 1 Warrant, Expires 5/06/16, Strike Price USD 1.77) | | | 81,252 | | | | – | |
| |
Total Long-Term Investments (Cost – $263,693,026) – 97.6% | | | | | | $ | 328,045,621 | |
| | | | | | | | |
| | |
| Short-Term Securities | | | | | | |
| |
BlackRock Liquidity Funds, TempFund, Institutional Class, 0.14% (e)(f) | | | 3,078,608 | | | | 3,078,608 | |
| |
| | | Beneficial
Interest (000) | | | | |
BlackRock Liquidity Series, LLC Money Market Series, 0.24% (e)(f)(g) | | $ | 55,216 | | | | 55,216,453 | |
| |
Total Short-Term Securities (Cost – $58,295,061) – 17.3% | | | | 58,295,061 | |
Total Investments Before Options Written (Cost – $321,988,087) – 114.9% | | | | 386,340,682 | |
| | | | | | | | |
| | |
| Options Written | | Contracts | | | | |
| |
Exchange-Traded Call Options Written | |
Cubist Pharmaceuticals, Inc., Strike Price USD 43, Expires 4/21/12 | | | | | | | | |
(Premiums Received – $21,334) – (0.0)% | | | 220 | | | | (29,150 | ) |
| |
Total Investments Net of Options Written –114.9% | | | | 386,311,532 | |
Liabilities in Excess of Other Assets – (14.9)% | | | | (50,197,093 | ) |
| | | | | | | | |
Net Assets – 100.0% | | | $ | 336,114,439 | |
| | | | | | | | |
| (a) | Non-income producing security. |
| (b) | Security, or a portion of security, is on loan. |
| (c) | All or a portion of security has been pledged/segregated as collateral in connection with outstanding options written. |
| (d) | Warrants entitle the Fund to purchase a predetermined number of shares of common stock and are non-income producing. The purchase price and number of shares are subject to adjustment under certain conditions until the expiration date, if any. |
See Notes to Financial Statements.
| | | | | | |
| | | | | | | |
| | BLACKROCK FUNDS | | MARCH 31, 2012 | | 13 |
| | |
| | |
Schedule of Investments (concluded) | | BlackRock Mid-Cap Growth Equity Portfolio |
| (e) | Investments in companies considered to be an affiliate of the Fund during the period, for purposes of Section 2(a)(3) of the Investment Company Act of 1940, as amended, were as follows: |
| | | | | | | | |
| Affiliate | | Shares/ Beneficial Interest Held at
September 30, 2011 | | Net Activity | | Shares/ Beneficial Interest Held at March 31, 2012 | | Income |
BlackRock Liquidity Funds, TempFund,
Institutional Class | | 9,900,843 | | (6,822,235) | | 3,078,608 | | $ 2,493 |
BlackRock Liquidity Series, LLC
Money Market Series | | $24,618,918�� | | $30,597,535 | | $55,216,453 | | $ 44,184 |
|
| (f) | Represents the current yield as of report date. |
| (g) | Security was purchased with the cash collateral from loaned securities. |
| — | | For Fund compliance purposes, the Fund’s industry classifications refer to any one or more of the industry sub-classifications used by one or more widely recognized market indexes or ratings group indexes, and/or as defined by Fund management. These definitions may not apply for purposes of this report, which may combine industry sub-classifications for reporting ease. |
| — | | Fair Value Measurements – Various inputs are used in determining the fair value of investments and derivative financial instruments. These inputs are categorized into a disclosure hierarchy consisting of three broad levels for financial statement purposes as follows: |
| | — | | Level 1 - unadjusted price quotations in active markets/exchanges for identical assets and liabilities |
| | — | | Level 2 - other observable inputs (including, but not limited to: quoted prices for similar assets or liabilities in markets that are active, quoted prices for identical or similar assets or liabilities in markets that are not active, inputs other than quoted prices that are observable for the assets or liabilities (such as interest rates, yield curves, volatilities, prepayment speeds, loss severities, credit risks and default rates) or other market-corroborated inputs) |
| | — | | Level 3 - unobservable inputs based on the best information available in the circumstances, to the extent observable inputs are not available (including the Fund’s own assumptions used in determining the fair value of investments and derivative financial instruments) |
Changes in valuation techniques may result in transfers into or out of an assigned level within the disclosure hierarchy. The categorization of a value determined for investments and derivative financial instruments is based on the pricing transparency of the investment and derivative financial instrument and is not necessarily an indication of the risks associated with investing in those securities. For information about the Fund’s policy regarding valuation of investments and derivative financial instruments and other significant accounting policies, please refer to Note 1 of the Notes to Financial Statements.
| | | | | | | | |
The following tables summarize the inputs used as of March 31, 2012 in
determining the fair valuation of the Fund’s investment and derivative
financial instruments: |
| | | | | | | | | | | | | | |
| Valuation Inputs | | Level 1 | | | Level 2 | | | Level 3 | | Total | |
Assets: | | | | | | | | | | | | | | |
Investments: | | | | | | | | | | | | | | |
Long-Term Investments1 | | $ | 328,045,621 | | | | – | | | – | | $ | 328,045,621 | |
Short-Term Securities | | | 3,078,608 | | | $ | 55,216,453 | | | – | | | 58,295,061 | |
Total | | $ | 331,124,229 | | | $ | 55,216,453 | | | – | | $ | 386,340,682 | |
1 See above Schedule of Investments for values in each industry.
| | | | | | | | | | | | |
| Valuation Inputs | | Level 1 | | | Level 2 | | Level 3 | | Total | |
Derivative Financial Instruments2 | | | | | | | | | | | | |
Liabilities: | | | | | | | | | | | | |
Equity contracts | | $ | (29,150 | ) | | – | | – | | $ | (29,150 | ) |
2 Derivative financial instruments are options written which are shown at value.
| | | | | | |
See Notes to Financial Statements. |
| | | | | | | |
| 14 | | BLACKROCK FUNDS | | MARCH 31, 2012 | | |
| | |
| | |
Schedule of Investments March 31, 2012 (Unaudited) | | BlackRock Mid-Cap Value Equity Portfolio (Percentages shown are based on Net Assets) |
| | | | | | | | |
| Common Stocks | | Shares | | | Value | |
Aerospace & Defense – 0.9% | | | | | | | | |
Spirit AeroSystems Holdings, Inc., Class A (a)(b) | | | 363,710 | | | $ | 8,896,347 | |
| |
Auto Components – 3.3% | | | | | | | | |
Dana Holding Corp. (a) | | | 959,092 | | | | 14,865,926 | |
The Goodyear Tire & Rubber Co. (a) | | | 801,560 | | | | 8,993,503 | |
Lear Corp. | | | 222,400 | | | | 10,339,376 | |
| | | | | | | | |
| | | | | | | 34,198,805 | |
| |
Beverages – 1.2% | | | | | | | | |
Coca-Cola Enterprises, Inc. | | | 445,600 | | | | 12,744,160 | |
| |
Building Products – 0.8% | | | | | | | | |
Fortune Brands Home & Security, Inc. (a) | | | 375,960 | | | | 8,297,437 | |
| |
Capital Markets – 2.6% | | | | | | | | |
Ameriprise Financial, Inc. | | | 214,770 | | | | 12,269,810 | |
Freedom Pay, Inc. (a) | | | 43,051 | | | | – | |
Invesco Ltd. (b) | | | 531,700 | | | | 14,180,439 | |
| | | | | | | | |
| | | | | | | 26,450,249 | |
| |
Chemicals – 2.1% | | | | | | | | |
Ashland, Inc. | | | 288,690 | | | | 17,627,411 | |
Cytec Industries, Inc. | | | 60,280 | | | | 3,664,421 | |
| | | | | | | | |
| | | | | | | 21,291,832 | |
| |
Commercial Banks – 3.8% | | | | | | | | |
Comerica, Inc. | | | 486,610 | | | | 15,746,700 | |
M&T Bank Corp. | | | 168,500 | | | | 14,639,280 | |
SunTrust Banks, Inc. | | | 379,960 | | | | 9,183,633 | |
| | | | | | | | |
| | | | | | | 39,569,613 | |
| |
Commercial Services & Supplies – 1.6% | |
Corrections Corp. of America | | | 599,720 | | | | 16,378,353 | |
| |
Communications Equipment – 0.6% | |
Comverse Technology, Inc. (a) | | | 894,990 | | | | 6,148,581 | |
| |
Computers & Peripherals – 1.9% | | | | | | | | |
Seagate Technology Plc | | | 301,400 | | | | 8,122,730 | |
Western Digital Corp. (a) | | | 270,780 | | | | 11,207,584 | |
| | | | | | | | |
| | | | | | | 19,330,314 | |
| |
Construction & Engineering – 1.0% | |
Jacobs Engineering Group, Inc. (a) | | | 240,840 | | | | 10,686,071 | |
| |
Consumer Finance – 0.9% | | | | | | | | |
Discover Financial Services | | | 293,620 | | | | 9,789,291 | |
| |
Containers & Packaging – 1.8% | |
Crown Holdings, Inc. (a) | | | 389,600 | | | | 14,348,968 | |
Rock-Tenn Co., Class A | | | 61,050 | | | | 4,124,538 | |
| | | | | | | | |
| | | | | | | 18,473,506 | |
| |
Diversified Financial Services – 1.3% | |
NYSE Euronext, Inc. | | | 432,760 | | | | 12,987,128 | |
| |
Diversified Telecommunication Services – 1.5% | |
CenturyLink, Inc. | | | 408,370 | | | | 15,783,501 | |
| |
Electric Utilities – 8.3% | | | | | | | | |
American Electric Power Co., Inc. | | | 380,630 | | | | 14,684,705 | |
Edison International Co. | | | 388,520 | | | | 16,515,985 | |
Northeast Utilities | | | 399,950 | | | | 14,846,144 | |
NV Energy, Inc. | | | 428,570 | | | | 6,908,548 | |
PPL Corp. | | | 593,803 | | | | 16,780,873 | |
Westar Energy, Inc. | | | 567,350 | | | | 15,846,085 | |
| | | | | | | | |
| | | | | | | 85,582,340 | |
| |
| | | | | | | | |
| Common Stocks | | Shares | | | Value | |
Electronic Equipment, Instruments & Components – 2.5% | |
Ingram Micro, Inc., Class A (a) | | | 424,690 | | | $ | 7,882,246 | |
TE Connectivity Ltd. | | | 489,400 | | | | 17,985,450 | |
| | | | | | | | |
| | | | | | | 25,867,696 | |
| |
Energy Equipment & Services – 1.5% | |
Nabors Industries Ltd. (a) | | | 484,730 | | | | 8,477,928 | |
National Oilwell Varco, Inc. | | | 86,790 | | | | 6,897,201 | |
| | | | | | | | |
| | | | | | | 15,375,129 | |
| |
Food Products – 3.6% | |
H.J. Heinz Co. | | | 124,890 | | | | 6,687,860 | |
The J.M. Smucker Co. | | | 257,120 | | | | 20,919,283 | |
TreeHouse Foods, Inc. (a) | | | 166,010 | | | | 9,877,595 | |
| | | | | | | | |
| | | | | | | 37,484,738 | |
| |
Health Care Equipment & Supplies – 1.6% | |
Boston Scientific Corp. (a) | | | 1,574,520 | | | | 9,415,630 | |
Covidien Plc | | | 134,500 | | | | 7,354,460 | |
| | | | | | | | |
| | | | | | | 16,770,090 | |
| |
Health Care Providers & Services – 5.7% | |
AmerisourceBergen Corp. | | | 387,250 | | | | 15,366,080 | |
CIGNA Corp. | | | 291,150 | | | | 14,339,138 | |
Tenet Healthcare Corp. (a) | | | 937,560 | | | | 4,978,444 | |
Universal Health Services, Inc., Class B | | | 258,710 | | | | 10,842,536 | |
WellPoint, Inc. | | | 180,280 | | | | 13,304,664 | |
| | | | | | | | |
| | | | | | | 58,830,862 | |
| |
Hotels, Restaurants & Leisure – 2.7% | |
Gaylord Entertainment Co. (a)(b) | | | 454,216 | | | | 13,989,853 | |
Vail Resorts, Inc. | | | 203,400 | | | | 8,797,050 | |
Wynn Resorts Ltd. | | | 40,010 | | | | 4,996,449 | |
| | | | | | | | |
| | | | | | | 27,783,352 | |
| |
Household Durables – 0.8% | |
MDC Holdings, Inc. | | | 301,040 | | | | 7,763,822 | |
| |
Independent Power Producers & Energy Traders – 1.2% | |
NRG Energy, Inc. (a) | | | 783,180 | | | | 12,272,431 | |
| |
Insurance – 9.8% | |
AON Plc | | | 258,770 | | | | 12,695,256 | |
AXIS Capital Holdings Ltd. | | | 596,830 | | | | 19,796,851 | |
Lincoln National Corp. | | | 436,681 | | | | 11,510,911 | |
Loews Corp. | | | 509,450 | | | | 20,311,771 | |
RenaissanceRe Holdings Ltd. | | | 243,440 | | | | 18,435,711 | |
XL Group Plc | | | 861,050 | | | | 18,676,175 | |
| | | | | | | | |
| | | | | | | 101,426,675 | |
| |
Internet Software & Services – 0.8% | |
Yahoo!, Inc. (a) | | | 550,480 | | | | 8,378,306 | |
| |
IT Services – 1.6% | |
Broadridge Financial Solutions, Inc. | | | 682,082 | | | | 16,308,581 | |
| |
Life Sciences Tools & Services – 0.2% | |
Thermo Fisher Scientific, Inc. | | | 45,520 | | | | 2,566,418 | |
| |
Machinery – 3.4% | |
Parker Hannifin Corp. | | | 133,970 | | | | 11,327,164 | |
Stanley Black & Decker, Inc. | | | 144,960 | | | | 11,156,122 | |
Timken Co. | | | 238,500 | | | | 12,101,490 | |
| | | | | | | | |
| | | | | | | 34,584,776 | |
| |
See Notes to Financial Statements.
| | | | | | |
| | | | | | | |
| | BLACKROCK FUNDS | | MARCH 31, 2012 | | 15 |
| | |
| | |
Schedule of Investments (continued) | | BlackRock Mid-Cap Value Equity Portfolio (Percentages shown are based on Net Assets) |
| | | | | | | | |
| Common Stocks | | Shares | | | Value | |
Media – 0.3% | | | | | | | | |
The Interpublic Group of Cos., Inc. | | | 311,660 | | | $ | 3,556,041 | |
| |
Metals & Mining – 0.6% | | | | | | | | |
Coeur d’Alene Mines Corp. (a) | | | 125,040 | | | | 2,968,450 | |
Freeport-McMoRan Copper & Gold, Inc. | | | 76,900 | | | | 2,925,276 | |
| | | | | | | | |
| | | | | | | 5,893,726 | |
| |
Multiline Retail – 0.6% | | | | | | | | |
Macy’s, Inc. | | | 154,930 | | | | 6,155,369 | |
| |
Multi-Utilities – 1.5% | | | | | | | | |
Wisconsin Energy Corp. | | | 428,000 | | | | 15,057,040 | |
| |
Office Electronics – 1.1% | | | | | | | | |
Xerox Corp. | | | 1,351,740 | | | | 10,922,059 | |
| |
Oil, Gas & Consumable Fuels – 4.3% | | | | | | | | |
Alpha Natural Resources, Inc. (a) | | | 201,290 | | | | 3,061,621 | |
Denbury Resources, Inc. (a) | | | 483,490 | | | | 8,814,023 | |
EQT Corp. | | | 139,460 | | | | 6,723,367 | |
Noble Energy, Inc. | | | 101,190 | | | | 9,894,358 | |
Valero Energy Corp. | | | 322,760 | | | | 8,317,525 | |
Whiting Petroleum Corp. (a) | | | 130,240 | | | | 7,072,032 | |
| | | | | | | | |
| | | | | | | 43,882,926 | |
| |
Personal Products – 0.4% | | | | | | | | |
Avon Products, Inc. | | | 224,690 | | | | 4,349,998 | |
| |
Pharmaceuticals – 1.3% | | | | | | | | |
Forest Laboratories, Inc. (a)(b) | | | 390,760 | | | | 13,555,464 | |
| |
Professional Services – 1.0% | | | | | | | | |
Towers Watson & Co., Class A | | | 154,387 | | | | 10,200,349 | |
| |
Real Estate Investment Trusts (REITs) – 6.6% | |
BioMed Realty Trust, Inc. (b) | | | 906,600 | | | | 17,207,268 | |
CubeSmart (b) | | | 863,706 | | | | 10,278,101 | |
Duke Realty Corp. | | | 603,260 | | | | 8,650,748 | |
DuPont Fabros Technology, Inc. (b) | | | 304,400 | | | | 7,442,580 | |
Kilroy Realty Corp. (REIT) (b) | | | 206,660 | | | | 9,632,423 | |
Vornado Realty Trust (b) | | | 182,300 | | | | 15,349,660 | |
| | | | | | | | |
| | | | | | | 68,560,780 | |
| |
Real Estate Management & Development – 0.9% | |
Forestar Group, Inc. (a)(b) | | | 619,437 | | | | 9,533,135 | |
| |
Road & Rail – 1.3% | | | | | | | | |
Hertz Global Holdings, Inc. (a) | | | 866,730 | | | | 13,035,619 | |
| |
| | | | | | | | |
| Common Stocks | | Shares | | | Value | |
Semiconductors & Semiconductor Equipment – 3.1% | |
Analog Devices, Inc. | | | 181,200 | | | $ | 7,320,480 | |
ON Semiconductor Corp. (a) | | | 1,816,691 | | | | 16,368,386 | |
Teradyne, Inc. (a)(b) | | | 483,160 | | | | 8,160,572 | |
| | | | | | | | |
| | | | | | | 31,849,438 | |
| |
Software – 1.7% | |
Take-Two Interactive Software, Inc. (a)(b) | | | 1,134,110 | | | | 17,448,282 | |
| |
Specialty Retail – 2.9% | |
Abercrombie & Fitch Co., Class A | | | 241,640 | | | | 11,987,760 | |
Ascena Retail Group, Inc. (a) | | | 46,800 | | | | 2,074,176 | |
Staples, Inc. | | | 559,250 | | | | 9,048,665 | |
Williams-Sonoma, Inc. | | | 173,240 | | | | 6,493,035 | |
| | | | | | | | |
| | | | | | | 29,603,636 | |
| |
Textiles, Apparel & Luxury Goods – 0.4% | |
PVH Corp. | | | 50,770 | | | | 4,535,284 | |
| |
Thrifts & Mortgage Finance – 2.4% | |
Capitol Federal Financial, Inc. | | | 1,234,854 | | | | 14,645,368 | |
People’s United Financial, Inc. | | | 769,320 | | | | 10,185,797 | |
| | | | | | | | |
| | | | | | | 24,831,165 | |
| |
Total Long-Term Investments (Cost – $875,861,828) – 99.4% | | | | | | | 1,024,990,715 | |
| |
| | | | | | | | |
Short-Term Securities | | | | | | | | |
BlackRock Liquidity Funds, TempFund, Institutional Class, 0.14% (c)(d) | | | 2,785,039 | | | | 2,785,039 | |
| | | Beneficial
Interest (000) | | | | |
BlackRock Liquidity Series, LLC Money Market Series, 0.24% (c)(d)(e) | | $ | 61,450 | | | | 61,450,013 | |
Total Short-Term Securities (Cost – $64,235,052) – 6.2% | | | | 64,235,052 | |
Total Investments (Cost – $940,096,880) – 105.6% | | | | 1,089,225,767 | |
Liabilities in Excess of Other Assets – (5.6)% | | | | (57,955,916 | ) |
| | | | | | | | |
Net Assets – 100.0% | | | | | | $ | 1,031,269,851 | |
| | | | | | | | |
| | | | | | | | |
| (a) | Non-income producing security. |
| (b) | Security, or a portion of security, is on loan. |
| (c) | Investments in companies considered to be an affiliate of the Fund during the period, for purposes of Section 2(a)(3) of the Investment Company Act of 1940, as amended, were as follows: |
| | | | | | | | | | | | | | | | | | | | |
| Affiliate | | Shares/
Beneficial
Interest Held at
September 30,
2011 | | | Net Activity | | | Shares/
Beneficial
Interest Held at
March 31,
2012 | | | Realized
Gain | | | Income | |
| |
BlackRock Liquidity Funds, TempFund, Institutional Class | | | 13,687,713 | | | | (10,902,674) | | | | 2,785,039 | | | | $180 | | | | $ 7,085 | |
BlackRock Liquidity Series, LLC Money Market Series | | | $73,910,690 | | | | $(12,460,677) | | | | $61,450,013 | | | | – | | | | $65,701 | |
| |
| (d) | Represents the current yield as of report date. |
| (e) | Security was purchased with the cash collateral from loaned securities. |
See Notes to Financial Statements.
| | | | | | |
| | | | | | | |
| 16 | | BLACKROCK FUNDS | | MARCH 31, 2012 | | |
| | |
| | |
Schedule of Investments (concluded) | | BlackRock Mid-Cap Value Equity Portfolio |
| — | | For Fund compliance purposes, the Fund’s industry classifications refer to any one or more of the industry sub-classifications used by one or more widely recognized market indexes or ratings group indexes and/or as defined by Fund management. These definitions may not apply for purposes of this report, which may combine industry sub-classifications for reporting ease. |
| — | | Fair Value Measurements – Various inputs are used in determining the fair value of investments. These inputs are categorized into a disclosure hierarchy consisting of three broad levels for financial statement purposes as follows: |
| | — | | Level 1 - unadjusted price quotations in active markets/exchanges for identical assets and liabilities |
| | — | | Level 2 - other observable inputs (including, but not limited to: quoted prices for similar assets or liabilities in markets that are active, quoted prices for identical or similar assets or liabilities in markets that are not active, inputs other than quoted prices that are observable for the assets or liabilities (such as interest rates, yield curves, volatilities, prepayment speeds, loss severities, credit risks and default rates) or other market-corroborated inputs) |
| | — | | Level 3 - unobservable inputs based on the best information available in the circumstances, to the extent observable inputs are not available (including the Fund’s own assumptions used in determining the fair value of investments) |
Changes in valuation techniques may result in transfers into or out of an assigned level within the disclosure hierarchy. The categorization of a value determined for investments is based on the pricing transparency of the investment and is not necessarily an indication of the risks associated with investing in those securities. For information about the Fund’s policy regarding valuation of investments and other significant accounting policies, please refer to Note 1 of the Notes to Financial Statements.
The following table summarizes the inputs used as of March 31, 2012 in determining the fair valuation of the Fund’s investments:
| | | | | | | | | | | | |
| Valuation Inputs | | Level 1 | | | Level 2 | | Level 3 | | Total | |
Assets: | | | | | | | | | | | | |
Investments: | | | | | | | | | | | | |
Long-
Term Investments1 | | $ | 1,024,990,715 | | | – | | – | | $ | 1,024,990,715 | |
Short-
Term Securities | | | 2,785,039 | | | $61,450,013 | | – | | | 64,235,052 | |
| |
Total | | $ | 1,027,775,754 | | | $61,450,013 | | – | | $ | 1,089,225,767 | |
| | | | |
1 See above Schedule of Investments for values in each industry.
See Notes to Financial Statements.
| | | | | | |
| | | | | | | |
| | BLACKROCK FUNDS | | MARCH 31, 2012 | | 17 |
| | |
| | |
Schedule of Investments March 31, 2012 (Unaudited) | | BlackRock Small Cap Growth Equity Portfolio (Percentages shown are based on Net Assets) |
| | | | | | | | |
| Common Stocks | | Shares | | | Value | |
Aerospace & Defense – 2.4% | |
BE Aerospace, Inc. (a)(b) | | | 430,236 | | | $ | 19,993,067 | |
Orbital Sciences Corp. (a) | | | 1,274,885 | | | | 16,764,738 | |
| | | | | | | | |
| | | | | | | 36,757,805 | |
| |
Air Freight & Logistics – 1.4% | |
Atlas Air Worldwide Holdings, Inc. (a)(b) | | | 424,514 | | | | 20,890,334 | |
| |
Airlines – 1.0% | | | | | | | | |
Alaska Air Group, Inc. (a) | | | 420,138 | | | | 15,049,343 | |
| |
Auto Components – 1.4% | | | | | | | | |
Dana Holding Corp. (a) | | | 1,350,352 | | | | 20,930,456 | |
| |
Biotechnology – 10.8% | |
Acorda Therapeutics, Inc. (a)(b) | | | 1,505,139 | | | | 39,961,441 | |
Alkermes Plc (a) | | | 346,100 | | | | 6,420,155 | |
Amarin Corp. Plc - ADR (a)(b) | | | 1,834,851 | | | | 20,770,513 | |
BioSpecifics Technologies Corp. (a)(c) | | | 763,967 | | | | 12,085,958 | |
Cubist Pharmaceuticals, Inc. (a)(b)(d) | | | 1,387,573 | | | | 60,012,532 | |
Gentium SpA - ADR (a)(c) | | | 2,929,088 | | | | 25,541,647 | |
| | | | | | | | |
| | | | | | | 164,792,246 | |
| |
Building Products – 1.2% | |
Trex Co., Inc. (a)(b) | | | 590,853 | | | | 18,954,564 | |
| |
Chemicals – 1.0% | |
Ferro Corp. (a)(b) | | | 2,583,567 | | | | 15,346,388 | |
| |
Commercial Services & Supplies – 2.0% | |
ACCO Brands Corp. (a)(b) | | | 2,452,922 | | | | 30,440,762 | |
| |
Communications Equipment – 2.5% | |
Ciena Corp. (a)(b) | | | 723,831 | | | | 11,718,824 | |
Riverbed Technology, Inc. (a) | | | 949,159 | | | | 26,652,385 | |
| | | | | | | | |
| | | | | | | 38,371,209 | |
| |
Construction & Engineering – 0.9% | |
Chicago Bridge & Iron Co. NV | | | 313,456 | | | | 13,538,165 | |
| |
Consumer Finance – 2.2% | |
DFC Global Corp. (a) | | | 1,787,264 | | | | 33,725,672 | |
| |
Diversified Telecommunication Services – 1.5% | |
Cbeyond, Inc. (a)(c) | | | 2,908,177 | | | | 23,265,416 | |
| |
Energy Equipment & Services – 4.1% | |
Heckmann Corp. (a)(b) | | | 3,948,501 | | | | 17,018,039 | |
Hornbeck Offshore Services, Inc. (a)(b) | | | 453,208 | | | | 19,048,332 | |
Newpark Resources, Inc. (a)(b) | | | 1,639,475 | | | | 13,427,300 | |
Superior Energy Services, Inc. (a)(b) | | | 484,022 | | | | 12,758,820 | |
| | | | | | | | |
| | | | | | | 62,252,491 | |
| |
Food Products – 1.7% | |
Annie’s, Inc. (a) | | | 15,500 | | | | 540,020 | |
Darling International, Inc. (a) | | | 179,600 | | | | 3,128,632 | |
Hain Celestial Group, Inc. (a)(b) | | | 180,000 | | | | 7,885,800 | |
Sanderson Farms, Inc. | | | 263,843 | | | | 13,991,594 | |
| | | | | | | | |
| | | | | | | 25,546,046 | |
| |
Health Care Equipment & Supplies – 1.2% | |
ArthroCare Corp. (a) | | | 587,443 | | | | 15,772,845 | |
GenMark Diagnostics, Inc. (a) | | | 559,769 | | | | 2,267,065 | |
| | | | | | | | |
| | | | | | | 18,039,910 | |
| |
Health Care Providers & Services – 0.3% | |
HealthSouth Corp. (a) | | | 212,600 | | | | 4,354,048 | |
| |
Health Care Technology – 1.1% | |
Epocrates, Inc. (a)(c) | | | 1,969,031 | | | | 16,894,286 | |
| |
| | | | | | | | |
| Common Stocks | | Shares | | | Value | |
Hotels, Restaurants & Leisure – 1.9% | |
Caribou Coffee Co., Inc. (a)(b)(c) | | | 1,579,901 | | | $ | 29,449,355 | |
| |
Household Durables – 1.4% | |
Skullcandy, Inc. (a)(b) | | | 1,325,336 | | | | 20,980,069 | |
| |
Internet Software & Services – 2.8% | |
DealerTrack Holdings, Inc. (a)(b) | | | 534,900 | | | | 16,186,074 | |
NIC, Inc. (a) | | | 2,138,750 | | | | 25,943,038 | |
| | | | | | | | |
| | | | | | | 42,129,112 | |
| |
IT Services – 5.5% | | | | | | | | |
ExlService Holdings, Inc. (a)(c) | | | 1,724,520 | | | | 47,320,829 | |
Global Cash Access Holdings, Inc. (a) | | | 2,697,372 | | | | 21,039,502 | |
MoneyGram International, Inc. (a) | | | 187,400 | | | | 3,373,200 | |
WNS Holdings Ltd. - ADR (a) | | | 935,924 | | | | 11,277,884 | |
| | | | | | | | |
| | | | | | | 83,011,415 | |
| |
Leisure Equipment & Products – 1.0% | |
Brunswick Corp. | | | 572,000 | | | | 14,729,000 | |
| |
Machinery – 5.3% | | | | | | | | |
Altra Holdings, Inc. (a) | | | 750,815 | | | | 14,415,648 | |
Chart Industries, Inc. (a)(b) | | | 49,800 | | | | 3,651,834 | |
Navistar International Corp. (a) | | | 295,000 | | | | 11,932,750 | |
Terex Corp. (a) | | | 640,490 | | | | 14,411,025 | |
Titan International, Inc. (b) | | | 459,300 | | | | 10,862,445 | |
Wabash National Corp. (a)(b) | | | 2,531,815 | | | | 26,204,285 | |
| | | | | | | | |
| | | | | | | 81,477,987 | |
| |
Media – 1.9% | | | | | | | | |
National CineMedia, Inc. | | | 1,850,470 | | | | 28,312,191 | |
| |
Metals & Mining – 1.1% | |
Globe Specialty Metals, Inc. | | | 1,150,927 | | | | 17,114,285 | |
| |
Oil, Gas & Consumable Fuels – 6.5% | |
Cheniere Energy, Inc. (a) | | | 726,000 | | | | 10,875,480 | |
Energy XXI Bermuda Ltd. (a)(b) | | | 704,048 | | | | 25,423,173 | |
James River Coal Co. (a)(b) | | | 606,150 | | | | 3,103,488 | |
Kodiak Oil & Gas Corp. (a)(b) | | | 1,621,399 | | | | 16,149,134 | |
Magnum Hunter Resources Corp. (a)(b) | | | 1,715,620 | | | | 10,997,124 | |
McMoRan Exploration Co. (a)(b) | | | 560,742 | | | | 5,999,939 | |
SandRidge Energy, Inc. (a)(b) | | | 1,510,641 | | | | 11,828,319 | |
Swift Energy Co. (a) | | | 502,295 | | | | 14,581,624 | |
| | | | | | | | |
| | | | | | | 98,958,281 | |
| |
Paper & Forest Products – 2.2% | |
KapStone Paper and Packaging Corp. (a) | | | 570,363 | | | | 11,236,151 | |
Schweitzer-Mauduit International, Inc. | | | 333,384 | | | | 23,023,499 | |
| | | | | | | | |
| | | | | | | 34,259,650 | |
| |
Pharmaceuticals – 6.9% | |
Elan Corp. Plc - ADR (a) | | | 2,250,424 | | | | 33,778,864 | |
Jazz Pharmaceuticals, Inc. (a)(b) | | | 808,530 | | | | 39,189,449 | |
ViroPharma, Inc. (a)(b) | | | 1,076,407 | | | | 32,367,559 | |
| | | | | | | | |
| | | | | | | 105,335,872 | |
| |
Professional Services – 4.1% | |
The Corporate Executive Board Co. | | | 432,143 | | | | 18,586,470 | |
CoStar Group, Inc. (a)(b) | | | 345,836 | | | | 23,879,976 | |
Kforce, Inc., Class A (a) | | | 354,270 | | | | 5,278,623 | |
On Assignment, Inc. (a)(b) | | | 817,771 | | | | 14,286,459 | |
| | | | | | | | |
| | | | | | | 62,031,528 | |
| |
Semiconductors & Semiconductor Equipment – 7.3% | |
Cavium, Inc. (a)(b) | | | 305,700 | | | | 9,458,358 | |
See Notes to Financial Statements.
| | | | | | |
| | | | | | | |
| 18 | | BLACKROCK FUNDS | | MARCH 31, 2012 | | |
| | |
| | |
Schedule of Investments (continued) | | BlackRock Small Cap Growth Equity Portfolio (Percentages shown are based on Net Assets) |
| | | | | | | | |
| Common Stocks | | Shares | | | Value | |
Semiconductors & Semiconductor Equipment (concluded) | |
Lattice Semiconductor Corp. (a) | | | 3,782,088 | | | $ | 24,318,826 | |
Microsemi Corp. (a)(b) | | | 1,114,560 | | | | 23,896,166 | |
OmniVision Technologies, Inc. (a) | | | 41,600 | | | | 832,000 | |
ON Semiconductor Corp. (a) | | | 2,792,191 | | | | 25,157,641 | |
Semtech Corp. (a)(b) | | | 955,081 | | | | 27,181,605 | |
| | | | | | | | |
| | | | | | | 110,844,596 | |
| |
Software – 7.6% | | | | | | | | |
Fortinet, Inc. (a) | | | 624,611 | | | | 17,270,494 | |
Gateway Industries, Inc. (Acquired 2/11/11 through 12/27/11,
cost $590,861) (a)(e) | | | 2,635,275 | | | | 7,642,298 | |
PROS Holdings, Inc. (a) | | | 368,052 | | | | 6,882,572 | |
QLIK Technologies, Inc. (a) | | | 271,600 | | | | 8,691,200 | |
TiVo, Inc. (a) | | | 5,207,671 | | | | 62,439,975 | |
Tyler Technologies, Inc. (a) | | | 180,125 | | | | 6,918,601 | |
Ultimate Software Group, Inc. (a)(b) | | | 76,800 | | | | 5,627,904 | |
| | | | | | | | |
| | | | | | | 115,473,044 | |
| |
Specialty Retail – 4.2% | |
The Children’s Place Retail Stores,
Inc. (a)(b) | | | 382,586 | | | | 19,768,219 | |
Express, Inc. (a) | | | 1,013,908 | | | | 25,327,422 | |
Lumber Liquidators Holdings, Inc. (a) | | | 774,214 | | | | 19,440,514 | |
| | | | | | | | |
| | | | | | | 64,536,155 | |
| |
Textiles, Apparel & Luxury Goods – 1.3% | |
G-III Apparel Group Ltd. (a) | | | 704,782 | | | | 20,029,904 | |
| |
Trading Companies & Distributors – 0.5% | |
Rush Enterprises, Inc., Class A (a)(b) | | | 361,600 | | | | 7,673,152 | |
| |
Total Common Stocks – 98.2% | | | | | | | 1,495,494,737 | |
| |
| | | | | | | | |
| | | | | | | | |
| | |
| Warrants (f) | | | | | | |
Pharmaceuticals – 0.0% | | | | | | | | |
Alexza Pharmaceuticals, Inc. (Issued/Exercisable 5/06/11, 1 Share for 1 Warrant, Expires 5/06/16, Strike Price USD 1.77) | | | 1,000,249 | | | | – | |
| |
| | | | | | |
| | | | | Value | |
Total Long-Term Investments (Cost – $1,235,118,028) – 98.2% | | $ | 1,495,494,737 | |
| | | | | | | | |
| | |
| Short-Term Securities | | Shares | | | | |
BlackRock Liquidity Funds, TempFund, Institutional Class, 0.14% (g)(h) | | | 42,112,900 | | | | 42,112,900 | |
| | | Beneficial
Interest (000) | | | | |
BlackRock Liquidity Series, LLC Money Market Series, 0.24% (g)(h)(i) | | $ | 398,889 | | | | 398,889,234 | |
Total Short-Term Securities (Cost – $441,002,134) – 29.0% | | | | 441,002,134 | |
Total Investments Before Options Written (Cost – $1,676,120,162) – 127.2% | | | | 1,936,496,871 | |
| | | | | | | | |
| | |
| Options Written | | Contracts | | | | |
Exchange-Traded Call Options Written | |
Cubist Pharmaceuticals, Inc., Strike Price USD 43, Expires 4/21/12 | | | | | | | | |
(Premiums Received – $90,767) – (0.0)% | | | 936 | | | | (124,020 | ) |
| |
Total Investments Net of Options Written – 127.2% | | | | 1,936,372,851 | |
Liabilities in Excess of Other Assets – (27.2)% | | | | (413,755,007 | ) |
Net Assets – 100.0% | | | $ | 1,522,617,844 | |
| | | | |
|
(a) Non-income producing security. |
(b) Security, or a portion of security, is on loan. |
| (c) | Investments in companies (whereby the Fund held 5% or more of the companies’ outstanding securities) that were considered to be an affiliate during the period, for purposes of Section 2(a)(3) of the Investment Company Act of 1940, as amended, were as follows: |
| | | | | | | | | | | | | | | | | | | | | | | | | | | | |
| Affiliate | | Shares Held at
September 30,
2011 | | | Shares
Purchased | | | Shares
Sold | | | Shares Held at March 31,
2012 | | | Value at
March 31,
2012 | | | Realized
Gain (Loss) | | | Income | |
BioSpecifics Technologies Corp. | | | 666,887 | | | | 97,080 | | | | – | | | | 763,967 | | | $ | 12,085,958 | | | | – | | | | – | |
Caribou Coffee Co., Inc. | | | 1,249,470 | | | | 453,851 | | | | 123,420 | | | | 1,579,901 | | | $ | 29,449,355 | | | $ | 376,961 | | | | – | |
Cbeyond, Inc. | | | 1,923,850 | | | | 984,327 | | | | – | | | | 2,908,177 | | | $ | 23,265,416 | | | | – | | | | – | |
Epocrates, Inc. | | | – | | | | 1,969,031 | | | | – | | | | 1,969,031 | | | $ | 16,894,286 | | | | – | | | | – | |
ExlService Holdings, Inc. | | | 1,463,120 | | | | 361,960 | | | | 100,560 | | | | 1,724,520 | | | $ | 47,320,829 | | | $ | 284,356 | | | | – | |
Gentium SpA - ADR | | | 1,930,876 | | | | 998,212 | | | | – | | | | 2,929,088 | | | $ | 25,541,647 | | | | – | | | | – | |
SonoSite, Inc.1 | | | 782,395 | | | | 161,400 | | | | 943,795 | | | | – | | | | – | | | $ | 23,589,702 | | | | – | |
Summit Hotel Properties, Inc.1 | | | 1,532,482 | | | | 127,199 | | | | 1,659,681 | | | | – | | | | – | | | $ | (3,480,677 | ) | | $ | 310,903 | |
1 No longer an affiliated company or held by the Fund as of report date.
See Notes to Financial Statements.
| | | | | | |
| | | | | | | |
| | BLACKROCK FUNDS | | MARCH 31, 2012 | | 19 |
| | |
| | |
Schedule of Investments (concluded) | | BlackRock Small Cap Growth Equity Portfolio |
| (d) | All or a portion of security has been pledged/segregated as collateral in connection with outstanding options written. | |
| (e) | Restricted security as to resale. As of report date the Fund held 0.5% of its net assets, with a current value of $7,642,298 and original cost of $590,861, in this security. | |
| (f) | Warrants entitle the Fund to purchase a predetermined number of shares of common stock and are non-income producing. The purchase price and number of shares are subject to adjustment under certain conditions until the expiration date, if any. | |
| (g) | Investments in companies considered to be an affiliate of the Fund during the period, for purposes of Section 2(a)(3) of the Investment Company Act of 1940, as amended, were as follows: |
| | | | | | | | | | | | | | | | | | | | | | | | | | | | |
| Affiliate | | Shares/
Beneficial
Interest Held at
September 30,
2011 | | | Shares/
Beneficial
Interest
Purchased | | | Shares
Sold | | | Shares/
Beneficial
Interest Held at
March 31,
2012 | | | Value at
March 31,
2012 | | | Realized
Gain | | | Income | |
BlackRock Liquidity Funds, TempFund, Institutional Class | | | 20,809,320 | | | | 21,303,580 | 1 | | | – | | | | 42,112,900 | | | $ | 42,112,900 | | | | – | | | $ | 10,456 | |
BlackRock Liquidity Series LLC, Money Market Series | | $ | 226,303,648 | | | $ | 172,585,586 | 1 | | | – | | | $ | 398,889,234 | | | $ | 398,889,234 | | | | – | | | $ | 803,540 | |
iShares Russell 2000 Growth Index Fund | | | 125,100 | | | | 1,752,400 | | | | 1,877,500 | | | | – | | | | – | | | $ | 2,425,606 | | | $ | 192,221 | |
1 Represents net shares/beneficial interest purchased.
| (h) | Represents the current yield as of report date. |
| (i) | Security was purchased with the cash collateral from loaned securities. |
| — | | For Fund compliance purposes, the Fund’s industry classifications refer to any one or more of the industry sub-classifications used by one or more widely recognized market indexes or ratings group indexes, and/or as defined by Fund management. These definitions may not apply for purposes of this report, which may combine industry sub-classifications for reporting ease. |
| — | | Fair Value Measurements – Various inputs are used in determining the fair value of investments and derivative financial instruments. These inputs are categorized into a disclosure hierarchy consisting of three broad levels for financial statement purposes as follows: |
| | — | | Level 1 - unadjusted price quotations in active markets/exchanges for identical assets and liabilities |
| | — | | Level 2 - other observable inputs (including, but not limited to: quoted prices for similar assets or liabilities in markets that are active, quoted prices for identical or similar assets or liabilities in markets that are not active, inputs other than quoted prices that are observable for the assets or liabilities (such as interest rates, yield curves, volatilities, prepayment speeds, loss severities, credit risks and default rates) or other market–corroborated inputs) |
| | — | | Level 3 - unobservable inputs based on the best information available in the circumstances, to the extent observable inputs are not available (including the Fund’s own assumptions used in determining the fair value of investments and derivative financial instruments) |
Changes in valuation techniques may result in transfers into or out of an assigned level within the disclosure hierarchy. The categorization of a value determined for investments and derivative financial instruments is based on the pricing transparency of the investment and derivative financial instrument and is not necessarily an indication of the risks associated with investing in those securities. For information about the Fund’s policy regarding valuation of investments and derivative financial instruments and other significant accounting policies, please refer to Note 1 of the Notes to Financial Statements.
The following tables summarize the inputs used as of March 31, 2012 in determining the fair valuation of the Fund’s investments and derivative financial instruments:
| | | | | | | | | | | | | | | | |
| Valuation Inputs | | Level 1 | | | Level 2 | | | Level 3 | | | Total | |
Assets: | | | | | | | | | | | | | | | | |
Investments: | | | | | | | | | | | | | | | | |
Long-
Term Investments:1 | | | | | | | | | | | | | | | | |
Common Stocks | | $ | 1,487,852,439 | | | $ | 7,642,298 | | | | – | | | $ | 1,495,494,737 | |
Short-Term Securities | | | 42,112,900 | | | | 398,889,234 | | | | – | | | | 441,002,134 | |
Total | | $ | 1,529,965,339 | | | $ | 406,531,532 | | | | – | | | $ | 1,936,496,871 | |
| | | | |
1 See above Schedule of Investments for values in each industry excluding Level 2, Software, within the table.
| | | | | | | | | | | | |
| Valuation Inputs | | Level 1 | | | Level 2 | | Level 3 | | Total | |
Derivative Financial Instruments2 | | | | | | | | | | | | |
Liabilities: | | | | | | | | | | | | |
Equity contracts | | $ | (124,020 | ) | | – | | – | | $ | (124,020 | ) |
| | | | |
2 Derivative financial instruments are options written which are shown at value.
See Notes to Financial Statements.
| | | | | | |
| | | | | | | |
| 20 | | BLACKROCK FUNDS | | MARCH 31, 2012 | | |
| | |
| | |
Statements of Assets and Liabilities | | |
| | | | | | | | | | | | |
| March 31, 2012 (Unaudited) | | BlackRock
Mid-Cap
Growth Equity
Portfolio | | | BlackRock
Mid-Cap Value Equity
Portfolio | | | BlackRock Small Cap Growth Equity Portfolio | |
Assets | | | | | | | | | | | | |
| Investments at value – unaffiliated1,2 | | $ | 328,045,621 | | | $ | 1,024,990,715 | | | $ | 1,340,937,246 | |
| Investments at value – affiliated3 | | | 58,295,061 | | | | 64,235,052 | | | | 595,559,625 | |
| Investments sold receivable | | | 10,597,387 | | | | 7,029,881 | | | | 90,682,919 | |
| Capital shares sold receivable | | | 3,226,492 | | | | 535,625 | | | | 2,404,620 | |
| Dividends receivable – unaffiliated | | | 50,487 | | | | 1,499,197 | | | | 2,291 | |
| Receivable from advisor | | | 8,626 | | | | 64,674 | | | | – | |
| Securities lending income receivable – affiliated | | | 3,650 | | | | 1,271 | | | | 108,341 | |
| Dividends receivable – affiliated | | | 892 | | | | 704 | | | | 4,846 | |
| Prepaid expenses | | | 47,952 | | | | 63,731 | | | | 63,737 | |
| | | | |
| Total assets | | | 400,276,168 | | | | 1,098,420,850 | | | | 2,029,763,625 | |
| | | | |
| | | | | | | | | | | | |
Liabilities | | | | | | | | | | | | |
Options written at value4 | | | 29,150 | | | | – | | | | 124,020 | |
Collateral on securities loaned at value | | | 55,216,453 | | | | 61,450,013 | | | | 398,889,234 | |
Investments purchased payable | | | 7,567,982 | | | | 2,240,330 | | | | 36,475,291 | |
Capital shares redeemed payable | | | 750,088 | | | | 1,689,864 | | | | 69,920,300 | |
Investment advisory fees payable | | | 207,687 | | | | 696,173 | | | | 702,782 | |
Service and distribution fees payable | | | 88,299 | | | | 287,378 | | | | 117,572 | |
Other affiliates payable | | | 8,041 | | | | 48,953 | | | | 154,292 | |
Officer’s and Trustees’ fees payable | | | 2,918 | | | | 9,609 | | | | 10,523 | |
Other accrued expenses payable | | | 291,111 | | | | 728,679 | | | | 751,767 | |
| | | | |
Total liabilities | | | 64,161,729 | | | | 67,150,999 | | | | 507,145,781 | |
| | | | |
Net Assets | | $ | 336,114,439 | | | $ | 1,031,269,851 | | | $ | 1,522,617,844 | |
| | | | |
| | | | | | | | | | | | | |
Net Assets Consist of | | | | | | | | | | | | |
Paid-in capital | | $ | 285,435,574 | | | $ | 1,054,881,023 | | | $ | 1,166,975,808 | |
Undistributed (accumulated) net investment income (loss) | | | (672,707 | ) | | | 669,210 | | | | (2,500,281 | ) |
Accumulated net realized gain (loss) | | | (12,993,207 | ) | | | (173,409,269 | ) | | | 97,798,861 | |
Net unrealized appreciation/depreciation | | | 64,344,779 | | | | 149,128,887 | | | | 260,343,456 | |
| | | | |
Net Assets | | $ | 336,114,439 | | | $ | 1,031,269,851 | | | $ | 1,522,617,844 | |
| | | | |
| | | |
1 Investments at cost – unaffiliated | | $ | 263,693,026 | | | $ | 875,861,828 | | | $ | 1,106,438,280 | |
2 Securities loaned at value | | $ | 53,555,517 | | | $ | 60,145,450 | | | $ | 387,767,797 | |
3 Investments at cost – affiliated | | $ | 58,295,061 | | | $ | 64,235,052 | | | $ | 569,681,882 | |
4 Premiums received | | $ | 21,334 | | | | – | | | $ | 90,767 | |
See Notes to Financial Statements.
| | | | | | |
| | | | | | | |
| | BLACKROCK FUNDS | | MARCH 31, 2012 | | 21 |
| | |
| | |
Statements of Assets and Liabilities (concluded) | | |
| | | | | | | | | | | | |
| March 31, 2012 (Unaudited) | | BlackRock Mid-Cap Growth Equity Portfolio | | | BlackRock Mid-Cap Value Equity Portfolio | | | BlackRock Small Cap Growth Equity Portfolio | |
Net Asset Value | | | | | | | | | | | | |
Institutional | | | | | | | | | | | | |
Net assets | | $ | 23,085,038 | | | $ | 192,206,355 | | | $ | 1,075,224,701 | |
| | | | |
Shares outstanding1 | | | 1,628,238 | | | | 15,520,485 | | | | 39,637,621 | |
| | | | |
Net asset value | | $ | 14.18 | | | $ | 12.38 | | | $ | 27.13 | |
| | | | |
| | | |
Service | | | | | | | | | | | | |
Net assets | | $ | 1,182,468 | | | $ | 1,391,099 | | | $ | 30,125,190 | |
| | | | |
Shares outstanding1 | | | 88,466 | | | | 114,298 | | | | 1,182,652 | |
| | | | |
Net asset value | | $ | 13.37 | | | $ | 12.17 | | | $ | 25.47 | |
| | | | |
| | | |
Investor A | | | | | | | | | | | | |
Net assets | | $ | 278,421,798 | | | $ | 683,007,407 | | | $ | 384,437,351 | |
| | | | |
Shares outstanding1 | | | 21,506,061 | | | | 56,839,729 | | | | 15,614,148 | |
| | | | |
Net asset value | | $ | 12.95 | | | $ | 12.02 | | | $ | 24.62 | |
| | | | |
| | | |
Investor B | | | | | | | | | | | | |
Net assets | | $ | 6,972,580 | | | $ | 24,144,266 | | | $ | 1,981,538 | |
| | | | |
Shares outstanding1 | | | 618,104 | | | | 2,219,250 | | | | 94,394 | |
| | | | |
Net asset value | | $ | 11.28 | | | $ | 10.88 | | | $ | 20.99 | |
| | | | |
| | | |
Investor C | | | | | | | | | | | | |
Net assets | | $ | 20,483,907 | | | $ | 129,340,135 | | | $ | 30,849,064 | |
| | | | |
Shares outstanding1 | | | 1,814,619 | | | | 11,937,186 | | | | 1,471,116 | |
| | | | |
Net asset value | | $ | 11.29 | | | $ | 10.84 | | | $ | 20.97 | |
| | | | |
| | | |
Class R | | | | | | | | | | | | |
Net assets | | $ | 5,968,648 | | | $ | 1,180,589 | | | | – | |
| | | | |
Shares outstanding1 | | | 462,724 | | | | 95,588 | | | | – | |
| | | | |
Net asset value | | $ | 12.90 | | | $ | 12.35 | | | | – | |
| | | | |
1 Unlimited number of shares authorized, $0.001 par value.
See Notes to Financial Statements.
| | | | | | |
| | | | | | | |
| 22 | | BLACKROCK FUNDS | | MARCH 31, 2012 | | |
| | | | | | | | | | | | |
| Six Months Ended March 31, 2012 (Unaudited) | | BlackRock
Mid-Cap
Growth Equity
Portfolio | | | BlackRock
Mid-Cap Value
Equity
Portfolio | | | BlackRock
Small Cap
Growth Equity
Portfolio | |
Investment Income | | | | | | | | | | | | |
Dividends – unaffiliated | | $ | 1,572,806 | | | $ | 9,678,052 | | | $ | 2,760,568 | |
Foreign taxes withheld | | | (28,892 | ) | | | – | | | | (5,042 | ) |
Securities lending – affiliated | | | 44,184 | | | | 65,701 | | | | 803,540 | |
Dividends – affiliated | | | 2,493 | | | | 7,085 | | | | 513,580 | |
| | | | |
Total income | | | 1,590,591 | | | | 9,750,838 | | | | 4,072,646 | |
| | | | |
| | | | | | | | | | | | |
Expenses | | | | | | | | | | | | |
Investment advisory | | | 1,256,507 | | | | 4,008,077 | | | | 3,807,048 | |
Transfer agent – class specific | | | 505,125 | | | | 1,219,237 | | | | 1,367,552 | |
Service and distribution – class specific | | | 473,381 | | | | 1,581,678 | | | | 586,342 | |
Administration | | | 117,798 | | | | 350,490 | | | | 466,275 | |
Administration – class specific | | | 39,284 | | | | 117,885 | | | | 148,154 | |
Registration | | | 33,896 | | | | 39,966 | | | | 42,337 | |
Professional | | | 29,263 | | | | 29,748 | | | | 29,862 | |
Custodian | | | 14,688 | | | | 34,042 | | | | 52,786 | |
Printing | | | 11,309 | | | | 29,783 | | | | 43,681 | |
Officer and Trustees | | | 5,717 | | | | 14,552 | | | | 19,741 | |
Miscellaneous | | | 12,971 | | | | 20,080 | | | | 20,472 | |
Recoupment of past waived fees – class specific | | | 656 | | | | 790 | | | | – | |
| | | | |
Total expenses | | | 2,500,595 | | | | 7,446,328 | | | | 6,584,250 | |
Less fees waived by advisor | | | (1,597 | ) | | | (4,579 | ) | | | (5,801 | ) |
Less administration fees waived – class specific | | | (38,258 | ) | | | (117,601 | ) | | | (2,761 | ) |
Less transfer agent fees waived – class specific | | | (39,620 | ) | | | (38,815 | ) | | | (212 | ) |
Less transfer agent fees reimbursed – class specific | | | (157,498 | ) | | | (533,451 | ) | | | (2,437 | ) |
Less fees paid indirectly | | | (324 | ) | | | (328 | ) | | | (112 | ) |
| | | | |
Total expenses after fees waived, reimbursed and paid indirectly | | | 2,263,298 | | | | 6,751,554 | | | | 6,572,927 | |
| | | | |
Net investment income (loss) | | | (672,707 | ) | | | 2,999,284 | | | | (2,500,281 | ) |
| | | | |
| | | | | | | | | | | | |
Realized and Unrealized Gain (Loss) | | | | | | | | | | | | |
Net realized gain (loss) from: | | | | | | | | | | | | |
Investments – unaffiliated | | | 11,662,402 | | | | (17,008,222 | ) | | | 89,189,640 | |
Investments – affiliated | | | – | | | | 180 | | | | 23,195,948 | |
Options written. | | | (122,470 | ) | | | 251,245 | | | | (488,801 | ) |
| | | | |
| | | 11,539,932 | | | | (16,756,797 | ) | | | 111,896,787 | |
| | | | |
Net change in unrealized appreciation/depreciation on: | | | | | | | | | | | | |
Investments – unaffiliated | | | 64,136,922 | | | | 252,272,536 | | | | 295,652,801 | |
Investments – affiliated | | | – | | | | – | | | | 45,761,988 | |
Options written. | | | (7,816 | ) | | | 40,926 | | | | (33,253 | ) |
| | | | |
| | | 64,129,106 | | | | 252,313,462 | | | | 341,381,536 | |
| | | | |
Total realized and unrealized gain. | | | 75,669,038 | | | | 235,556,665 | | | | 453,278,323 | |
| | | | |
Net Increase in Net Assets Resulting from Operations | | $ | 74,996,331 | | | $ | 238,555,949 | | | $ | 450,778,042 | |
| | | | |
See Notes to Financial Statements.
| | | | | | |
| | | | | | | |
| | BLACKROCK FUNDS | | MARCH 31, 2012 | | 23 |
| | |
| | |
Statements of Changes in Net Assets | | |
| | | | | | | | | | | | | | | | | | | | | | | | |
| | | BlackRock
Mid-Cap
Growth Equity
Portfolio | | | BlackRock
Mid-Cap
Value Equity
Portfolio | | | BlackRock
Small Cap
Growth Equity
Portfolio | |
Increase (Decrease) in Net Assets: | | Six Months
Ended March 31, 2012
(Unaudited) | | | Year Ended
September 30,
2011 | | | Six Months Ended March 31, 2012 (Unaudited) | | | Year Ended
September 30,
2011 | | | Six Months Ended March 31, 2012 (Unaudited) | | | Year Ended
September 30,
2011 | |
| | | | | | |
Operations | | | | | | | | | | | | | | | | | | | | | | | | |
Net investment income (loss) | | $ | (672,707 | ) $ | | | (2,024,414 | ) | | $ | 2,999,284 | | | $ | 7,157,810 | | | $ | (2,500,281 | ) | | $ | (9,856,705 | ) |
Net realized gain (loss) | | | 11,539,932 | | | | 25,183,896 | | | | (16,756,797 | ) | | | 193,447,017 | | | | 111,896,787 | | | | 163,582,740 | |
Net change in unrealized appreciation/depreciation | | | 64,129,106 | | | | (23,853,188 | ) | | | 252,313,462 | | | | (247,371,603 | ) | | | 341,381,536 | | | | (188,023,895 | ) |
| | | | | | | | | | | | |
Net increase (decrease) in net assets resulting from operations | | | 74,996,331 | | | | (693,706 | ) | | | 238,555,949 | | | | (46,766,776 | ) | | | 450,778,042 | | | | (34,297,860 | ) |
| | | | | | | | | | | | |
| | | | | | | | | | | | | | | | | | | | | | | | |
Dividends and Distributions to Shareholders From | |
Net investment income: | | | | | | | | | | | | | | | | | | | | | | | | |
Institutional | | | – | | | | – | | | | (1,662,860 | ) | | | (1,930,361 | ) | | | – | | | | – | |
Service | | | – | | | | – | | | | (8,174 | ) | | | (3,730 | ) | | | – | | | | – | |
Investor A | | | – | | | | – | | | | (3,726,374 | ) | | | (5,160,440 | ) | | | – | | | | – | |
Investor B | | | – | | | | – | | | | – | | | | (34,422 | ) | | | – | | | | – | |
Investor C | | | – | | | | – | | | | – | | | | (265,420 | ) | | | – | | | | – | |
Class R | | | – | | | | – | | | | (2,690 | ) | | | (5,689 | ) | | | – | | | | – | |
Net realized gain: | | | | | | | | | | | | | | | | | | | | | | | | |
Institutional | | | – | | | | – | | | | – | | | | – | | | | (25,878,958 | ) | | | – | |
Service | | | – | | | | – | | | | – | | | | – | | | | (735,003 | ) | | | – | |
Investor A | | | – | | | | – | | | | – | | | | – | | | | (7,371,034 | ) | | | – | |
Investor B | | | – | | | | – | | | | – | | | | – | | | | (60,195 | ) | | | – | |
Investor C | | | – | | | | – | | | | – | | | | – | | | | (874,865 | ) | | | – | |
| | | | | | | | | | | | |
Decrease in net assets resulting from dividends and distributions to shareholders | | | – | | | | – | | | | (5,400,098 | ) | | | (7,400,062 | ) | | | (34,920,055 | ) | | | – | |
| | | | | | | | | | | | |
| | | | | | | | | | | | | | | | | | | | | | | | |
Capital Share Transactions | | | | | | | | | | | | | | | | | | | | | | | | |
Net increase (decrease) in net assets derived from capital share transactions | | | (21,304,824 | ) | | | (52,938,926 | ) | | | (126,325,668 | ) | | | (145,080,585 | ) | | | (109,815,277 | ) | | | 91,798,500 | |
| | | | | | | | | | | | |
| | | | | | | | | | | | | | | | | | | | | | | | |
Redemption Fees | | | | | | | | | | | | | | | | | | | | | | | | |
Redemption fees | | | – | | | | – | | | | – | | | | – | | | | – | | | | 29,171 | |
| | | | | | | | | | | | |
| | | | | | | | | | | | | | | | | | | | | | | | |
Net Assets | | | | | | | | | | | | | | | | | | | | | | | | |
Total increase (decrease) in net assets | | | 53,691,507 | | | | 52,245,220 | | | | 106,830,183 | | | | (199,247,423 | ) | | | 306,042,710 | | | | 57,529,811 | |
Beginning of period | | | 282,422,932 | | | | 230,177,712 | | | | 924,439,668 | | | | 1,123,687,091 | | | | 1,216,575,134 | | | | 1,159,045,323 | |
| | | | | | | | | | | | |
End of period | | $ | 336,114,439 | | | $ | 282,422,932 | | | $ | 1,031,269,851 | | | $ | 924,439,668 | | | $ | 1,522,617,844 | | | $ | 1,216,575,134 | |
| | | | | | | | | | | | |
Undistributed (accumulated) net investment income (loss) | | $ | (672,707 | ) | | | – | | | $ | 669,210 | | | $ | 3,070,024 | | | $ | (2,500,281 | ) | | | – | |
| | | | | | | | | | | | |
See Notes to Financial Statements.
| | | | | | |
| | | | | | | |
| 24 | | BLACKROCK FUNDS | | MARCH 31, 2012 | | |
| | |
| | |
Financial Highlights | | BlackRock Mid-Cap Growth Equity Portfolio |
| | | | | | | | | | | | | | | | | | | | | | | | | | | | | | | | | | | | | | | | | | | | | | | | | | |
| | | Institutional | | | | | Service | |
| | | Six Months
Ended
March 31,
2012 | | | Year Ended September 30, | | | | | Six Months
Ended
March 31,
2012 | | | Year Ended September 30, | |
| | | (Unaudited) | | | 2011 | | | 2010 | | | 2009 | | | 2008 | | | 2007 | | | | | (Unaudited) | | | 2011 | | | 2010 | | | 2009 | | | 2008 | | | 2007 | |
Per Share Operating Performance | |
Net asset value, beginning of period | | $ | 11.10 | | | $ | 11.18 | | | $ | 10.27 | | | $ | 10.33 | | | $ | 13.49 | | | $ | 10.70 | | | | | $ | 10.49 | | | $ | 10.60 | | | $ | 9.78 | | | $ | 9.87 | | | $ | 12.92 | | | $ | 10.27 | |
Net investment loss1 | | | (0.01) | | | | (0.05) | | | | (0.01) | | | | (0.04) | | | | (0.04) | | | | (0.07) | | | | | | (0.04) | | | | (0.10) | | | | (0.05) | | | | (0.06) | | | | (0.07) | | | | (0.09) | |
Net realized and unrealized gain (loss) | | | 3.09 | | | | (0.03) | | | | 0.92 | | | | (0.02) | | | | (3.12) | | | | 2.86 | 2 | | | | | 2.92 | | | | (0.01) | | | | 0.87 | | | | (0.03) | | | | (2.98) | | | | 2.74 | 2 |
Net increase (decrease) from investment operations | | | 3.08 | | | | (0.08) | | | | 0.91 | | | | (0.06) | | | | (3.16) | | | | 2.79 | | | | | | 2.88 | | | | (0.11) | | | | 0.82 | | | | (0.09) | | | | (3.05) | | | | 2.65 | |
Net asset value, end of period | | $ | 14.18 | | | $ | 11.10 | | | $ | 11.18 | | | $ | 10.27 | | | $ | 10.33 | | | $ | 13.49 | | | | | $ | 13.37 | | | $ | 10.49 | | | $ | 10.60 | | | $ | 9.78 | | | $ | 9.87 | | | $ | 12.92 | |
| | | | | | | | | | | | | | | | | | | | | | | | | | | | | | | | | | | | | | | | | | | | | | | | | | |
Total Investment Return3 | | | | | | | | | | | | | | | | | | | | | | | | | | | |
Based on net asset value | | | 27.75% | 4 | | | (0.72)% | 5 | | | 8.86% | 6 | | | (0.58)% | 7 | | | (23.43)% | | | | 26.08% | 8 | | | | | 27.46% | 4 | | | (1.04)% | 9 | | | 8.38% | 10 | | | (0.91)% | 11 | | | (23.61)% | | | | 25.80% | 8 |
| | | | | | | | | | | | | | | | | | | | | | | | | | | | | | | | | | | | | | | | | | | | | | | | | | |
Ratios to Average Net Assets | | | | | | | | | | | | | | | | | | | | | | | | | | | |
Total expenses | | | 1.18% | 12 | | | 1.17% | | | | 1.15% | | | | 1.20% | | | | 1.07% | | | | 1.06% | | | | | | 2.03% | 12 | | | 1.87% | | | | 1.63% | | | | 1.65% | | | | 1.29% | | | | 1.32% | |
Total expenses excluding recoupment of past waived fees | | | 1.18% | 12 | | | 1.17% | | | | 1.14% | | | | 1.20% | | | | 1.07% | | | | 1.06% | | | | | | 2.03% | 12 | | | 1.87% | | | | 1.62% | | | | 1.64% | | | | 1.29% | | | | 1.32% | |
Total expenses after fees waived, reimbursed and paid indirectly | | | 1.10% | 12 | | | 1.17% | | | | 1.15% | | | | 1.18% | | | | 1.06% | | | | 1.05% | | | | | | 1.58% | 12 | | | 1.58% | | | | 1.58% | | | | 1.51% | | | | 1.28% | | | | 1.22% | |
Net investment loss | | | (0.08)% | 12 | | | (0.38)% | | | | (0.09)% | | | | (0.44)% | | | | (0.33)% | | | | (0.59)% | | | | | | (0.58)% | 12 | | | (0.83)% | | | | (0.52)% | | | | (0.76)% | | | | (0.56)% | | | | (0.76)% | |
| | | | | | | | | | | | | | | | | | | | | | | | | | | | | | | | | | | | | | | | | | | | | | | | | | |
Supplemental Data | |
Net assets, end of period (000) | | $ | 23,085 | | | $ | 19,348 | | | $ | 24,421 | | | $ | 25,572 | | | $ | 26,468 | | | $ | 75,577 | | | | | $ | 1,182 | | | $ | 714 | | | $ | 330 | | | $ | 360 | | | $ | 459 | | | $ | 714 | |
Portfolio turnover | | | 44% | | | | 131% | | | | 76% | | | | 53% | | | | 45% | | | | 53% | | | | | | 44% | | | | 131% | | | | 76% | | | | 53% | | | | 45% | | | | 53% | |
| | 1 | Based on average shares outstanding. |
| | 2 | Includes redemption fees, which are less than $0.01 per share. |
| | 3 | Where applicable, total investment returns exclude the effects of any sales charges and include the reinvestment of dividends and distributions. |
| | 4 | Aggregate total investment return. |
| | 5 | Includes proceeds received from a settlement of litigation, which impacted the Fund’s total return. Excluding these proceeds, the Fund’s total return would have been (0.90)%. |
| | 6 | Includes proceeds received from a settlement of litigation, which impacted the Fund’s total return. Excluding these proceeds, the Fund’s total return would have been 8.47%. |
| | 7 | Includes proceeds received from a settlement of litigation, which impacted the Fund’s total return. Excluding these proceeds, the Fund’s total return would have been (0.87)%. |
| | 8 | Redemption fee of 2.00% is reflected in total return calculations. There was no impact to the return. |
| | 9 | Includes proceeds received from a settlement of litigation, which impacted the Fund’s total return. Excluding these proceeds, the Fund’s total return would have been (1.23)%. |
| | 10 | Includes proceeds received from a settlement of litigation, which impacted the Fund’s total return. Excluding these proceeds, the Fund’s total return would have been 7.98%. |
| | 11 | Includes proceeds received from a settlement of litigation, which impacted the Fund’s total return. Excluding these proceeds, the Fund’s total return would have been (1.22)%. |
See Notes to Financial Statements.
| | | | | | |
| | | | | | | |
| | BLACKROCK FUNDS | | MARCH 31, 2012 | | 25 |
| | |
| | |
Financial Highlights (continued) | | BlackRock Mid-Cap Growth Equity Portfolio |
| | | | | | | | | | | | | | | | | | | | | | | | | | | | | | | | | | | | | | | | | | | | | | | | | | |
| | | Investor A | | | | | Investor B | |
| | | Six Months
Ended
March 31,
2012 | | | Year Ended September 30, | | | | | Six Months
Ended
March 31,
2012 | | | Year Ended September 30, | |
| | | (Unaudited) | | | 2011 | | | 2010 | | | 2009 | | | 2008 | | | 2007 | | | | | (Unaudited) | | | 2011 | | | 2010 | | | 2009 | | | 2008 | | | 2007 | |
Per Share Operating Performance | |
Net asset value, beginning of period | | $ | 10.15 | | | $ | 10.27 | | | $ | 9.47 | | | $ | 9.56 | | | $ | 12.55 | | | $ | 10.00 | | | | | $ | 8.88 | | | $ | 9.05 | | | $ | 8.42 | | | $ | 8.56 | | | $ | 11.32 | | | $ | 9.09 | |
Net investment loss1 | | | (0.02 | ) | | | (0.09 | ) | | | (0.05 | ) | | | (0.06 | ) | | | (0.10 | ) | | | (0.12 | ) | | | | | (0.06 | ) | | | (0.16 | ) | | | (0.12 | ) | | | (0.10 | ) | | | (0.17 | ) | | | (0.18 | ) |
Net realized and unrealized gain (loss) | | | 2.82 | | | | (0.03 | ) | | | 0.85 | | | | (0.03 | ) | | | (2.89 | ) | | | 2.67 | 2 | | | | | 2.46 | | | | (0.01 | ) | | | 0.75 | | | | (0.04 | ) | | | (2.59 | ) | | | 2.41 | 2 |
Net increase (decrease) from investment operations | | | 2.80 | | | | (0.12 | ) | | | 0.80 | | | | (0.09 | ) | | | (2.99 | ) | | | 2.55 | | | | | | 2.40 | | | | (0.17 | ) | | | 0.63 | | | | (0.14 | ) | | | (2.76 | ) | | | 2.23 | |
Net asset value, end of period | | $ | 12.95 | | | $ | 10.15 | | | $ | 10.27 | | | $ | 9.47 | | | $ | 9.56 | | | $ | 12.55 | | | | | $ | 11.28 | | | $ | 8.88 | | | $ | 9.05 | | | $ | 8.42 | | | $ | 8.56 | | | $ | 11.32 | |
| | | | | | | | | | | | | | | | | | | | | | | | | | | | | | | | | | | | | | | | | | | | | | | | | | |
Total Investment Return3 | |
Based on net asset value | | | 27.59% | 4 | | | (1.17 | )%5 | | | 8.45% | 6 | | | (0.94 | )%7 | | | (23.83 | )% | | | 25.50% | 8 | | | | | 27.03% | 4 | | | (1.88 | )%9 | | | 7.48% | 10 | | | (1.64 | )%11 | | | (24.38 | )% | | | 24.53% | 8 |
| | | | | | | | | | | | | | | | | | | | | | | | | | | | | | | | | | | | | | | | | | | | | | | | | | |
Ratios to Average Net Assets | |
Total expenses | | | 1.53%12 | | | | 1.59% | | | | 1.58% | | | | 1.76% | | | | 1.53% | | | | 1.60% | | | | | | 2.61%12 | | | | 2.43% | | | | 2.48% | | | | 2.73% | | | | 2.45% | | | | 2.46% | |
Total expenses excluding recoupment of past waived fees | | | 1.53%12 | | | | 1.56% | | | | 1.55% | | | | 1.72% | | | | 1.53% | | | | 1.60% | | | | | | 2.61%12 | | | | 2.42% | | | | 2.47% | | | | 2.64% | | | | 2.45% | | | | 2.46% | |
Total expenses after fees waived, reimbursed and paid indirectly | | | 1.39%12 | | | | 1.58% | | | | 1.58% | | | | 1.59% | | | | 1.53% | | | | 1.57% | | | | | | 2.16%12 | | | | 2.39% | | | | 2.38% | | | | 2.34% | | | | 2.31% | | | | 2.25% | |
Net investment loss | | | (0.38)%12 | | | | (0.79)% | | | | (0.51)% | | | | (0.85)% | | | | (0.81)% | | | | (1.11)% | | | | | | (1.13%)12 | | | | (1.58)% | | | | (1.36)% | | | | (1.57)% | | | | (1.58)% | | | | (1.79)% | |
| | | | | | | | | | | | | | | | | | | | | | | | | | | | | | | | | | | | | | | | | | | | | | | | | | |
Supplemental Data | |
Net assets, end of period (000) | | $ | 278,422 | | | $ | 232,924 | | | $ | 180,501 | | | $ | 181,159 | | | $ | 195,980 | | | $ | 274,333 | | | | | $ | 6,973 | | | $ | 7,596 | | | $ | 8,209 | | | $ | 11,978 | | | $ | 19,565 | | | $ | 43,610 | |
Portfolio turnover | | | 44% | | | | 131% | | | | 76% | | | | 53% | | | | 45% | | | | 53% | | | | | | 44% | | | | 131% | | | | 76% | | | | 53% | | | | 45% | | | | 53% | |
| | 1 | Based on average shares outstanding. |
| | 2 | Includes redemption fees, which are less than $0.01 per share. |
| | 3 | Where applicable, total investment returns exclude the effects of any sales charges and include the reinvestment of dividends and distributions. |
| | 4 | Aggregate total investment return. |
| | 5 | Includes proceeds received from a settlement of litigation, which impacted the Fund’s total return. Excluding these proceeds, the Fund’s total return would have been (1.36)%. |
| | 6 | Includes proceeds received from a settlement of litigation, which impacted the Fund’s total return. Excluding these proceeds, the Fund’s total return would have been 8.03%. |
| | 7 | Includes proceeds received from a settlement of litigation, which impacted the Fund’s total return. Excluding these proceeds, the Fund’s total return would have been (1.26)%. |
| | 8 | Redemption fee of 2.00% is reflected in total return calculations. There was no impact to the return. |
| | 9 | Includes proceeds received from a settlement of litigation, which impacted the Fund’s total return. Excluding these proceeds, the Fund’s total return would have been (2.10)%. |
| | 10 | Includes proceeds received from a settlement of litigation, which impacted the Fund’s total return. Excluding these proceeds, the Fund’s total return would have been 7.01%. |
| | 11 | Includes proceeds received from a settlement of litigation, which impacted the Fund’s total return. Excluding these proceeds, the Fund’s total return would have been (1.99)%. |
See Notes to Financial Statements.
| | | | | | |
| | | | | | | |
| 26 | | BLACKROCK FUNDS | | MARCH 31, 2012 | | |
| | |
| | |
Financial Highlights (concluded) | | BlackRock Mid-Cap Growth Equity Portfolio |
| | | | | | | | | | | | | | | | | | | | | | | | | | | | | | | | | | | | | | | | | | | | | | | | | | |
| | | Investor C | | Class R | |
| | | Six Months
Ended
March 31,
2012 | | | Year Ended September 30, | | | | | Six Months
Ended
March 31,
2012 | | | Year Ended September 30, | | | Period October 2,
20061 to
September | |
| | | (Unaudited) | | | 2011 | | | 2010 | | | 2009 | | | 2008 | | | 2007 | | | | | (Unaudited) | | | 2011 | | | 2010 | | | 2009 | | | 2008 | | | 30, 2007 | |
Per Share Operating Performance | |
Net asset value, beginning of period | | $ | 8.89 | | | $ | 9.05 | | | $ | 8.41 | | | $ | 8.56 | | | $ | 11.32 | | | $ | 9.09 | | | | | $ | 10.13 | | | $ | 10.25 | | | $ | 9.46 | | | $ | 9.56 | | | $ | 12.55 | | | $ | 9.92 | |
Net investment loss2 | | | (0.06 | ) | | | (0.16 | ) | | | (0.11 | ) | | | (0.11 | ) | | | (0.16 | ) | | | (0.19 | ) | | | | | (0.04 | ) | | | (0.10 | ) | | | (0.04 | ) | | | (0.07 | ) | | | (0.10 | ) | | | (0.13 | ) |
Net realized and unrealized gain (loss) | | | (2.46 | ) | | | (0.00 | )3 | | | 0.75 | | | | (0.04 | ) | | | (2.60 | ) | | | 2.42 | 4 | | | | | 2.81 | | | | (0.02 | ) | | | 0.83 | | | | (0.03 | ) | | | (2.89 | ) | | | 2.76 | 4 |
Net increase (decrease) from investment operations | | | 2.40 | | | | (0.16 | ) | | | 0.64 | | | | (0.15 | ) | | | (2.76 | ) | | | 2.23 | | | | | | 2.77 | | | | (0.12 | ) | | | 0.79 | | | | (0.10 | ) | | | (2.99 | ) | | | 2.63 | |
Net asset value, end of period | | $ | 11.29 | | | $ | 8.89 | | | $ | 9.05 | | | $ | 8.41 | | | $ | 8.56 | | | $ | 11.32 | | | | | $ | 12.90 | | | $ | 10.13 | | | $ | 10.25 | | | $ | 9.46 | | | $ | 9.56 | | | $ | 12.55 | |
| | | | | | | | | | | | | | | | | | | | | | | | | | | | | | | | | | | | | | | | | | | | | | | | | | |
Total Investment Return5 | |
Based on net asset value | | | 27.00%6 | | | | (1.77)% | 7 | | | 7.61%8 | | | | (1.75)% | 9 | | | (24.38)% | | | | 24.53% | 10 | | | | | 27.35%6 | | | | (1.17)% | 11 | | | 8.35% | 12 | | | (1.05)% | 13 | | | (23.83)% | | | | 26.51% | 6,10 |
| | | | | | | | | | | | | | | | | | | | | | | | | | | | | | | | | | | | | | | | | | | | | | | | | | |
Ratios to Average Net Assets | |
Total expenses | | | 2.34%14 | | | | 2.34% | | | | 2.33% | | | | 2.46% | | | | 2.25% | | | | 2.31% | | | | | | 1.85%14 | | | | 1.91% | | | | 1.97% | | | | 2.04% | | | | 1.73% | | | | 1.63%14 | |
Total expenses excluding recoupment of past waived fees | | | 2.34%14 | | | | 2.31% | | | | 2.30% | | | | 2.44% | | | | 2.25% | | | | 2.31% | | | | | | 1.85%14 | | | | 1.91% | | | | 1.97% | | | | 2.04% | | | | 1.73% | | | | 1.63%14 | |
Total expenses after fees waived, reimbursed and paid indirectly | | | 2.16%14 | | | | 2.33% | | | | 2.33% | | | | 2.34% | | | | 2.25% | | | | 2.30% | | | | | | 1.65%14 | | | | 1.65% | | | | 1.65% | | | | 1.63% | | | | 1.58% | | | | 1.59%14 | |
Net investment loss | | | (1.15)%14 | | | | (1.54)% | | | | (1.26)% | | | | (1.59)% | | | | (1.53)% | | | | (1.84)% | | | | | | (0.63)%14 | | | | (0.84)% | | | | (0.44)% | | | | (0.89)% | | | | (0.82)% | | | | (1.12)%14 | |
| | | | | | | | | | | | | | | | | | | | | | | | | | | | | | | | | | | | | | | | | | | | | | | | | | |
Supplemental Data | |
Net assets, end of period (000) | | $ | 20,484 | | | $ | 16,615 | | | $ | 12,578 | | | $ | 12,418 | | | $ | 13,964 | | | $ | 20,203 | | | | | $ | 5,969 | | | $ | 5,227 | | | $ | 4,138 | | | $ | 2,323 | | | $ | 723 | | | $ | 25 | |
Portfolio turnover | | | 44% | | | | 131% | | | | 76% | | | | 53% | | | | 45% | | | | 53% | | | | | | 44% | | | | 131% | | | | 76% | | | | 53% | | | | 45% | | | | 53% | |
| | 1 | Commencement of operations. |
| | 2 | Based on average shares outstanding. |
| | 3 | Less than $(0.01) per share. |
| | 4 | Includes redemption fees, which are less than $0.01 per share. |
| | 5 | Where applicable, total investment returns exclude the effects of any sales charges and include the reinvestment of dividends and distributions. |
| | 6 | Aggregate total investment return. |
| | 7 | Includes proceeds received from a settlement of litigation, which impacted the Fund’s total return. Excluding these proceeds, the Fund’s total return would have been (1.99)%. |
| | 8 | Includes proceeds received from a settlement of litigation, which impacted the Fund’s total return. Excluding these proceeds, the Fund’s total return would have been 7.13%. |
| | 9 | Includes proceeds received from a settlement of litigation, which impacted the Fund’s total return. Excluding these proceeds, the Fund’s total return would have been (2.10)%. |
| | 10 | Redemption fee of 2.00% is reflected in total return calculations. There was no impact to the return. |
| | 11 | Includes proceeds received from a settlement of litigation, which impacted the Fund’s total return. Excluding these proceeds, the Fund’s total return would have been (1.37)%. |
| | 12 | Includes proceeds received from a settlement of litigation, which impacted the Fund’s total return. Excluding these proceeds, the Fund’s total return would have been 7.93%. |
| | 13 | Includes proceeds received from a settlement of litigation, which impacted the Fund’s total return. Excluding these proceeds, the Fund’s total return would have been (1.36)%. |
See Notes to Financial Statements.
| | | | | | |
| | | | | | | |
| | BLACKROCK FUNDS | | MARCH 31, 2012 | | 27 |
| | |
| | |
Financial Highlights | | BlackRock Mid-Cap Value Equity Portfolio |
| | | | | | | | | | | | | | | | | | | | | | | | | | | | | | | | | | | | | | | | | | | | | | | | | | |
| | | Institutional | | | | | Service | |
| | | Six Months
Ended
March 31,
2012 | | | Year Ended September 30, | | | | | Six Months Ended
March 31, 2012 | | | Year Ended September 30, | |
| | | (Unaudited) | | | 2011 | | | 2010 | | | 2009 | | | 2008 | | | 2007 | | | | | (Unaudited) | | | 2011 | | | 2010 | | | 2009 | | | 2008 | | | 2007 | |
Per Share Operating Performance | |
Net asset value, beginning of period | | $ | 9.81 | | | $ | 10.53 | | | $ | 9.34 | | | $ | 9.94 | | | $ | 14.35 | | | $ | 13.67 | | | | | $ | 9.63 | | | $ | 10.33 | | | $ | 9.17 | | | $ | 9.78 | | | $ | 14.14 | | | $ | 13.49 | |
Net investment income1 | | | 0.05 | | | | 0.12 | | | | 0.10 | | | | 0.08 | | | | 0.10 | | | | 0.11 | | | | | | 0.04 | | | | 0.08 | | | | 0.04 | | | | 0.05 | | | | 0.06 | | | | 0.10 | |
Net realized and unrealized gain (loss) | | | 2.62 | | | | (0.74 | ) | | | 1.16 | | | | (0.61 | ) | | | (2.77 | ) | | | 2.38 | 2 | | | | | 2.57 | | | | (0.73 | ) | | | 1.17 | | | | (0.60 | ) | | | (2.72 | ) | | | 2.33 | 2 |
Net increase (decrease) from investment operations | | | 2.67 | | | | (0.62 | ) | | | 1.26 | | | | (0.53 | ) | | | (2.67 | ) | | | 2.49 | | | | | | 2.61 | | | | (0.65 | ) | | | 1.21 | | | | (0.55 | ) | | | (2.66 | ) | | | 2.43 | |
Dividends and distributions from: | | | | | | | | | | | | | | | | | | | | | | | | | | | | | | | | | | | | | | | | | | | | | | | | | | |
Net investment income | | | (0.10 | ) | | | (0.10 | ) | | | (0.07 | ) | | | (0.07 | ) | | | – | | | | (0.15 | ) | | | | | (0.07 | ) | | | (0.05 | ) | | | (0.05 | ) | | | (0.06 | ) | | | – | | | | (0.12 | ) |
Tax return of capital | | | – | | | | – | | | | – | | | | – | | | | (0.02 | ) | | | – | | | | | | – | | | | – | | | | – | | | | – | | | | (0.02 | ) | | | – | |
Net realized gain | | | – | | | | – | | | | – | | | | – | | | | (1.72 | ) | | | (1.66 | ) | | | | | – | | | | – | | | | – | | | | – | | | | (1.68 | ) | | | (1.66 | ) |
Total dividends and distributions | | | (0.10 | ) | | | (0.10 | ) | | | (0.07 | ) | | | (0.07 | ) | | | (1.74 | ) | | | (1.81 | ) | | | | | (0.07 | ) | | | (0.05 | ) | | | (0.05 | ) | | | (0.06 | ) | | | (1.70 | ) | | | (1.78 | ) |
Net asset value, end of period | | $ | 12.38 | | | $ | 9.81 | | | $ | 10.53 | | | $ | 9.34 | | | $ | 9.94 | | | $ | 14.35 | | | | | $ | 12.17 | | | $ | 9.63 | | | $ | 10.33 | | | $ | 9.17 | | | $ | 9.78 | | | $ | 14.14 | |
| | | | | | | | | | | | | | | | | | | | | | | | | | | | | | | | | | | | | | | | | | | | | | | | | | |
Total Investment Return3 | |
Based on net asset value | | | 27.36%4 | | | | (6.03)% | 5 | | | 13.56% | | | | (5.09)% | | | | (20.74)% | | | | 19.35% | 6 | | | | | 27.22%4 | | | | (6.38)% | 5 | | | 13.20% | | | | (5.36)% | | | | (20.95)% | | | | 19.10% | 6 |
| | | | | | | | | | | | | | | | | | | | | | | | | | | | | | | | | | | | | | | | | | | | | | | | | | |
Ratios to Average Net Assets | |
Total expenses | | | 1.15%7 | | | | 1.08% | | | | 1.13% | | | | 1.16% | | | | 1.10% | | | | 1.07% | | | | | | 1.69%7 | | | | 1.49% | | | | 1.31% | | | | 1.32% | | | | 1.25% | | | | 1.24% | |
Total expenses excluding recoupment of past waived fees | | | 1.15%7 | | | | 1.08% | | | | 1.13% | | | | 1.16% | | | | 1.10% | | | | 1.07% | | | | | | 1.69%7 | | | | 1.49% | | | | 1.31% | | | | 1.32% | | | | 1.25% | | | | 1.24% | |
Total expenses after fees waived, reimbursed and paid indirectly | | | 0.97%7 | | | | 0.97% | | | | 0.97% | | | | 0.95% | | | | 0.94% | | | | 0.95% | | | | | | 1.29%7 | | | | 1.29% | | | | 1.27% | | | | 1.26% | | | | 1.23% | | | | 1.20% | |
Net investment income | | | 0.96%7 | | | | 0.98% | | | | 0.99% | | | | 1.00% | | | | 0.82% | | | | 0.79% | | | | | | 0.67%7 | | | | 0.65% | | | | 0.37% | | | | 0.69% | | | | 0.54% | | | | 0.68% | |
| | | | | | | | | | | | | | | | | | | | | | | | | | | | | | | | | | | | | | | | | | | | | | | | | | |
Supplemental Data | |
Net assets, end of period (000) | | $ | 192,206 | | | $ | 195,753 | | | $ | 204,286 | | | $ | 165,710 | | | $ | 141,900 | | | $ | 134,665 | | | | | $ | 1,391 | | | $ | 1,025 | | | $ | 737 | | | $ | 2,561 | | | $ | 2,431 | | | $ | 3,716 | |
Portfolio turnover | | | 51% | | | | 137% | | | | 123% | | | | 181% | | | | 117% | | | | 202% | | | | | | 51% | | | | 137% | | | | 123% | | | | 181% | | | | 117% | | | | 202% | |
| | 1 | Based on average shares outstanding. |
| | 2 | Includes redemption fees, which are less than $0.01 per share. |
| | 3 | Where applicable, total investment returns exclude the effects of any sales charges and include the reinvestment of dividends and distributions. |
| | 4 | Aggregate total investment return. |
| | 5 | Includes proceeds received from a settlement of litigation, which had no impact on the Fund’s total return. |
| | 6 | Redemption fee of 2.00% is reflected in total return calculations. There was no impact to the return. |
See Notes to Financial Statements.
| | | | | | |
| | | | | | | |
| 28 | | BLACKROCK FUNDS | | MARCH 31, 2012 | | |
| | |
| | |
Financial Highlights (continued) | | BlackRock Mid-Cap Value Equity Portfolio |
| | | | | | | | | | | | | | | | | | | | | | | | | | | | | | | | | | | | | | | | | | | | | | | | | | |
| | | Investor A | | | | | Investor B | |
| | | Six Months
Ended
March 31,
2012 | | | Year Ended September 30, | | | | | Six Months
Ended
March 31,
2012 | | | Year Ended September 30, | |
| | | (Unaudited) | | | 2011 | | | 2010 | | | 2009 | | | 2008 | | | 2007 | | | | | (Unaudited) | | | 2011 | | | 2010 | | | 2009 | | | 2008 | | | 2007 | |
Per Share Operating Performance | |
Net asset value, beginning of period | | $ | 9.50 | | | $ | 10.21 | | | $ | 9.06 | | | $ | 9.66 | | | $ | 14.00 | | | $ | 13.38 | | | | | $ | 8.58 | | | $ | 9.25 | | | $ | 8.23 | | | $ | 8.84 | | | $ | 12.92 | | | $ | 12.46 | |
Net investment income (loss)1 | | | 0.04 | | | | 0.08 | | | | 0.06 | | | | 0.05 | | | | 0.06 | | | | 0.08 | | | | | | (0.01 | ) | | | (0.01 | ) | | | (0.02 | ) | | | (0.00 | )2 | | | (0.02 | ) | | | (0.01 | ) |
Net realized and unrealized gain (loss) | | | 2.54 | | | | (0.72 | ) | | | 1.13 | | | | (0.59 | ) | | | (2.70 | ) | | | 2.32 | 3 | | | | | 2.31 | | | | (0.65 | ) | | | 1.04 | | | | (0.56 | ) | | | (2.47 | ) | | | 2.15 | 4 |
Net increase (decrease) from investment operations | | | 2.58 | | | | (0.64 | ) | | | 1.19 | | | | (0.54 | ) | | | (2.64 | ) | | | 2.40 | | | | | | 2.30 | | | | (0.66 | ) | | | 1.02 | | | | (0.56 | ) | | | (2.49 | ) | | | 2.14 | |
Dividends and distributions from: | | | | | | | | | | | | | | | | | | | | | | | | | | | | | | | | | | | | | | | | | | | | | | | | | | |
Net investment income | | | (0.06 | ) | | | (0.07 | ) | | | (0.04 | ) | | | (0.06 | ) | | | – | | | | (0.12 | ) | | | | | – | | | | (0.01 | ) | | | – | | | | (0.05 | ) | | | – | | | | (0.02 | ) |
Tax return of capital | | | – | | | | – | | | | – | | | | – | | | | (0.02 | ) | | | – | | | | | | – | | | | – | | | | – | | | | – | | | | (1.59 | ) | | | (1.66 | ) |
Net realized gain | | | – | | | | – | | | | – | | | | – | | | | (1.68 | ) | | | (1.66 | ) | | | | | – | | | | – | | | | – | | | | – | | | | – | | | | – | |
Total dividends and distributions | | | (0.06 | ) | | | (0.07 | ) | | | (0.04 | ) | | | (0.06 | ) | | | (1.70 | ) | | | (1.78 | ) | | | | | – | | | | (0.01 | ) | | | – | | | | (0.05 | ) | | | (1.59 | ) | | | (1.68 | ) |
Net asset value, end of period | | $ | 12.02 | | | $ | 9.50 | | | $ | 10.21 | | | $ | 9.06 | | | $ | 9.66 | | | $ | 14.00 | | | | | $ | 10.88 | | | $ | 8.58 | | | $ | 9.25 | | | $ | 8.23 | | | $ | 8.84 | | | $ | 12.92 | |
| | | | | | | | | | | | | | | | | | | | | | | | | | | | | | | | | | | | | | | | | | | | | | | | | | |
Total Investment Return5 | |
Based on net asset value | | | 27.27%6 | | | | (6.33)%7 | | | | 13.21% | | | | (5.32)% | | | | (21.04)% | | | | 19.02%4 | | | | | | 26.81%6 | | | | (7.17)%7 | | | | 12.39% | | | | (6.12%) | | | | (21.53%) | | | | 18.18% | |
| | | | | | | | | | | | | | | | | | | | | | | | | | | | | | | | | | | | | | | | | | | | | | | | | | |
Ratios to Average Net Assets | |
Total expenses. | | | 1.41%8 | | | | 1.37% | | | | 1.40% | | | | 1.51% | | | | 1.43% | | | | 1.40% | | | | | | 2.35%8 | | | | 2.13% | | | | 2.22% | | | | 2.38% | | | | 2.24% | | | | 2.23% | |
Total expenses excluding recoupment of past waived fees | | | 1.41%8 | | | | 1.37% | | | | 1.40% | | | | 1.51% | | | | 1.43% | | | | 1.40% | | | | | | 2.35%8 | | | | 2.12% | | | | 2.20% | | | | 2.38% | | | | 2.24% | | | | 2.23% | |
Total expenses after fees waived, reimbursed and paid indirectly | | | 1.29%8 | | | | 1.29% | | | | 1.29% | | | | 1.26% | | | | 1.25% | | | | 1.25% | | | | | | 2.06%8 | | | | 2.06% | | | | 2.04% | | | | 2.02% | | | | 2.00% | | | | 2.00% | |
Net investment income (loss) | | | 0.66%8 | | | | 0.66% | | | | 0.61% | | | | 0.70% | | | | 0.53% | | | | 0.61% | | | | | | (0.12%)8 | | | | (0.10%) | | | | (0.24)% | | | | (0.04%) | | | | (0.21%) | | | | (0.09%) | |
| | | | | | | | | | | | | | | | | | | | | | | | | | | | | | | | | | | | | | | | | | | | | | | | | | |
Supplemental Data | |
Net assets, end of period (000) | | $ | 683,007 | | | $ | 587,989 | | | $ | 726,666 | | | $ | 395,763 | | | $ | 470,265 | | | $ | 642,264 | | | | | $ | 24,144 | | | $ | 26,233 | | | $ | 42,239 | | | $ | 41,196 | | | $ | 67,656 | | | $ | 119,768 | |
Portfolio turnover | | | 51% | | | | 137% | | | | 123% | | | | 181% | | | | 117% | | | | 202% | | | | | | 51% | | | | 137% | | | | 123% | | | | 181% | | | | 117% | | | | 202% | |
| | 1 | Based on average shares outstanding. |
| | 2 | Less than $(0.01) per share. |
| | 3 | Includes redemption fees, which are less than $0.01 per share. |
| | 4 | Redemption fee of 2.00% is reflected in total return calculations. There was no impact to the return. |
| | 5 | Where applicable, total investment returns exclude the effects of any sales charges and include the reinvestment of dividends and distributions. |
| | 6 | Aggregate total investment return. |
| | 7 | Includes proceeds received from a settlement of litigation, which had no impact on the Fund’s total return. |
See Notes to Financial Statements.
| | | | | | |
| | | | | | | |
| | BLACKROCK FUNDS | | MARCH 31, 2012 | | 29 |
| | |
| | |
Financial Highlights (concluded) | | BlackRock Mid-Cap Value Equity Portfolio |
| | | | | | | | | | | | | | | | | | | | | | | | | | | | | | | | | | |
| | | Investor C | | | | | Class R |
| | | Six Months
Ended
March 31,
2012 | | | Year Ended September 30, | | | | | Six Months
Ended
March 31,
2012 | | | Year Ended September 30, | | Period July 30, 20101 to |
| | | (Unaudited) | | | 2011 | | | 2010 | | | 2009 | | | 2008 | | | 2007 | | | | | (Unaudited) | | | 2011 | | September 30, 2010 |
Per Share Operating Performance |
Net asset value, beginning of period | | $ | 8.55 | | | $ | 9.22 | | | $ | 8.20 | | | $ | 8.81 | | | $ | 12.90 | | | $ | 12.46 | | | | | $ | 9.75 | | | $ 10.51 | | $ 10.24 |
Net investment income (loss)2 | | | (0.01) | | | | (0.01) | | | | (0.01) | | | | (0.00) | 3 | | | (0.02) | | | | (0.02) | | | | | | 0.02 | | | 0.04 | | 0.004 |
Net realized and unrealized gain (loss) | | | 2.30 | | | | (0.64) | | | | 1.03 | | | | (0.56) | | | | (2.47) | | | | 2.15 | 5 | | | | | 2.61 | | | (0.73) | | 0.27 |
Net increase (decrease) from investment operations | | | 2.29 | | | | (0.65) | | | | 1.02 | | | | (0.56) | | | | (2.49) | | | | 2.13 | | | | | | 2.63 | | | (0.69) | | 0.27 |
Dividends and distributions from: | | | | | | | | | | | | | | | | | | | | | | | | | | | | | | | | | | |
Net investment income | | | – | | | | (0.02) | | | | – | | | | (0.05) | | | | – | | | | (0.03) | | | | | | (0.03) | | | (0.07) | | – |
Net realized gain | | | – | | | | – | | | | – | | | | – | | | | (1.60) | | | | (1.66) | | | | | | – | | | – | | – |
Total dividends and distributions | | | – | | | | (0.02) | | | | – | | | | (0.05) | | | | (1.60) | | | | (1.69) | | | | | | (0.03) | | | (0.07) | | – |
Net asset value, end of period | | $ | 10.84 | | | $ | 8.55 | | | $ | 9.22 | | | $ | 8.20 | | | $ | 8.81 | | | $ | 12.90 | | | | | $ | 12.35 | | | $ 9.75 | | $ 10.51 |
| | | | | | | | | | | | | | | | | | | | | | | | | | | | | | | | | | |
Total Investment Return6 | | | | | | | | | | | |
Based on net asset value | | | 26.78% | 7 | | | (7.11)% | 8 | | | 12.44% | | | | (6.14)% | | | | (21.56)% | | | | 18.16% | 9 | | | | | 26.99% | 7 | | (6.66)%8 | | 13.17%7 |
| | | | | | | | | | | | | | | | | | | | | | | | | | | | | | | | | | |
Ratios to Average Net Assets | | | | | | | | | | | |
Total expenses | | | 2.19% | 10 | | | 2.16% | | | | 2.22% | | | | 2.39% | | | | 2.20% | | | | 2.21% | | | | | | 1.73% | 10 | | 1.72% | | 2.21%10 |
Total expenses excluding recoupment of past waived fees | | | 2.19% | 10 | | | 2.16% | | | | 2.22% | | | | 2.39% | | | | 2.20% | | | | 2.21% | | | | | | 1.73% | 10 | | 1.70% | | 2.21%10 |
Total expenses after fees waived, reimbursed and paid indirectly | | | 2.06% | 10 | | | 2.06% | | | | 2.06% | | | | 2.02% | | | | 2.00% | | | | 2.00% | | | | | | 1.65% | 10 | | 1.65% | | 1.65%10 |
Net investment income (loss) | | | (0.12)% | 10 | | | (0.11)% | | | | (0.17)% | | | | (0.06)% | | | | (0.22)% | | | | (0.14)% | | | | | | 0.30% | 10 | | 0.31% | | 0.08%10 |
| | | | | | | | | | | | | | | | | | | | | | | | | | | | | | | | | | |
Supplemental Data |
Net assets, end of period (000) | | $ | 129,340 | | | $ | 112,520 | | | $ | 148,923 | | | $ | 92,141 | | | $ | 118,186 | | | $ | 173,731 | | | | | $ | 1,181 | | | $ 920 | | $ 838 |
Portfolio turnover | | | 51% | | | | 137% | | | | 123% | | | | 181% | | | | 117% | | | | 202% | | | | | | 51% | | | 137% | | 123% |
| | 1 | Commencement of operations. |
| | 2 | Based on average shares outstanding. |
| | 3 | Less than $(0.01) per share. |
| | 4 | Less than $0.01 per share. |
| | 5 | Includes redemption fees, which are less than $0.01 per share. |
| | 6 | Where applicable, total investment returns exclude the effects of any sales charges and include the reinvestment of dividends and distributions. |
| | 7 | Aggregate total investment return. |
| | 8 | Includes proceeds received from a settlement of litigation, which had no impact on the Fund’s total return. |
| | 9 | Redemption fee of 2.00% is reflected in total return calculations. There was no impact to the return. |
See Notes to Financial Statements.
| | | | | | |
| | | | | | | |
| 30 | | BLACKROCK FUNDS | | MARCH 31, 2012 | | |
| | |
| | |
Financial Highlights | | BlackRock Small Cap Growth Equity Portfolio |
| | | | | | | | | | | | | | | | | | | | | | | | | | | | | | | | | | | | | | | | | | | | | | | | | | |
| | | Institutional | | | | | Service | |
| | | Six Months
Ended
March 31,
2012 | | | Year Ended September 30, | | | | | Six Months
Ended
March 31,
2012 | | | Year Ended September 30, | |
| | | (Unaudited) | | | 2011 | | | 2010 | | | 2009 | | | 2008 | | | 2007 | | | | | (Unaudited) | | | 2011 | | | 2010 | | | 2009 | | | 2008 | | | 2007 | |
Per Share Operating Performance | |
Net asset value, beginning of period | | $ | 20.09 | | | $ | 20.42 | | | $ | 18.66 | | | $ | 20.33 | | | $ | 23.71 | | | $ | 19.26 | | | | | $ | 18.93 | | | $ | 19.29 | | | $ | 17.67 | | | $ | 19.30 | | | $ | 22.58 | | | $ | 18.38 | |
Net investment income (loss)1 | | | (0.03 | ) | | | (0.13 | ) | | | (0.12 | ) | | | (0.07 | ) | | | 0.03 | | | | (0.07 | ) | | | | | (0.07 | ) | | | (0.18 | ) | | | (0.16 | ) | | | (0.10 | ) | | | (0.03 | ) | | | (0.11) | |
Net realized and unrealized gain (loss) | | | 7.67 | | | | (0.20 | )2 | | | 1.88 | 2 | | | (1.60 | )2 | | | (3.41 | )2 | | | 4.52 | 2 | | | | | 7.21 | | | | (0.18 | )2 | | | 1.78 | 2 | | | (1.53 | )2 | | | (3.25 | )2 | | | 4.312 | |
Net increase (decrease) from investment operations | | | 7.64 | | | | (0.33 | ) | | | 1.76 | | | | (1.67 | ) | | | (3.38 | ) | | | 4.45 | | | | | | 7.14 | | | | (0.36 | ) | | | 1.62 | | | | (1.63 | ) | | | (3.28 | ) | | | 4.20 | |
Distributions from net realized gain | | | (0.60 | ) | | | – | | | | – | | | | – | | | | – | | | | – | | | | | | (0.60 | ) | | | – | | | | – | | | | – | | | | – | | | | – | |
Net asset value, end of period | | $ | 27.13 | | | $ | 20.09 | | | $ | 20.42 | | | $ | 18.66 | | | $ | 20.33 | | | $ | 23.71 | | | | | $ | 25.47 | | | $ | 18.93 | | | $ | 19.29 | | | $ | 17.67 | | | $ | 19.30 | | | $ | 22.58 | |
| | | | | | | | | | | | | | | | | | | | | | | | | | | | | | | | | | | | | | | | | | | | | | | | | | |
Total Investment Return3 | | | | | | | | | | | | | | | | | | | | | | | | | | | |
Based on net asset value | | | 38.51% | 4 | | | (1.62 | )%5,6 | | | 9.43% | 6 | | | (8.22 | )%6,7 | | | (14.26 | )%6 | | | 23.11% | 6 | | | | | 38.22% | 4 | | | (1.87 | )%5,6 | | | 9.17% | 6 | | | (8.45 | )%6,8 | | | (14.53 | )%6 | | | 22.85%6 | |
| | | | | | | | | | | | | | | | | | | | | | | | | | | | | | | | | | | | | | | | | | | | | | | | | | |
Ratios to Average Net Assets | | | | | | | | | | | | | | | | | | | | | | | | | | | |
Total expenses | | | 0.82% | 9 | | | 0.80% | | | | 0.83% | | | | 0.88% | | | | 0.77% | | | | 0.82% | | | | | | 1.22% | 9 | | | 1.07% | | | | 1.10% | | | | 1.15% | | | | 1.07% | | | | 1.02% | |
Total expenses excluding recoupment of past waived fees | | | 0.82% | 9 | | | 0.80% | | | | 0.83% | | | | 0.88% | | | | 0.77% | | | | 0.82% | | | | | | 1.22% | 9 | | | 1.07% | | | | 1.10% | | | | 1.14% | | | | 1.07% | | | | 1.02% | |
Total expenses after fees waived, reimbursed and paid indirectly | | | 0.82% | 9 | | | 0.80% | | | | 0.83% | | | | 0.88% | | | | 0.77% | | | | 0.82% | | | | | | 1.18% | 9 | | | 1.07% | | | | 1.10% | | | | 1.11% | | | | 1.07% | | | | 1.02% | |
Net investment income (loss) | | | (0.24% | )9 | | | (0.55 | )% | | | (0.59 | )% | | | (0.48 | )% | | | 0.15% | | | | (0.34 | )% | | | | | (0.60% | )9 | | | (0.81 | )% | | | (0.86 | )% | | | (0.70 | )% | | | (0.14 | )% | | | (0.54)% | |
| | | | | | | | | | | | | | | | | | | | | | | | | | | | | | | | | | | | | | | | | | | | | | | | | | |
Supplemental Data | |
Net assets, end of period (000) | | $ | 1,075,225 | | | $ | 931,857 | | | $ | 806,461 | | | $ | 855,375 | | | $ | 699,761 | | | $ | 587,586 | | | | | $ | 30,125 | | | $ | 23,683 | | | $ | 47,917 | | | $ | 43,932 | | | $ | 40,514 | | | $ | 35,945 | |
Portfolio turnover | | | 81% | | | | 141% | | | | 128% | | | | 82% | | | | 81% | | | | 81% | | | | | | 81% | | | | 141% | | | | 128% | | | | 82% | | | | 81% | | | | 81% | |
| | 1 | Based on average shares outstanding. |
| | 2 | Includes redemption fees, which are less than $0.01 per share. |
| | 3 | Where applicable, total investment returns exclude the effects of any sales charges and include the reinvestment of dividends and distributions. |
| | 4 | Aggregate total investment return. |
| | 5 | Includes proceeds received from a settlement of litigation, which had no impact on the Fund’s total return. |
| | 6 | Redemption fee of 2.00% is reflected in total return calculations. There was no impact to the return. |
| | 7 | Includes proceeds received from a settlement of litigation, which impacted the Fund’s total return. Excluding these proceeds, the Fund’s total return would have been (8.26)%. |
| | 8 | Includes proceeds received from a settlement of litigation, which impacted the Fund’s total return. Excluding these proceeds, the Fund’s total return would have been (8.50)%. |
See Notes to Financial Statements.
| | | | | | |
| | | | | | | |
| | BLACKROCK FUNDS | | MARCH 31, 2012 | | 31 |
| | |
| | |
Financial Highlights (continued) | | BlackRock Small Cap Growth Equity Portfolio |
| | | | | | | | | | | | | | | | | | | | | | | | | | | | | | | | | | | | | | | | | | | | | | | | | | |
| | | Investor A | | | | | Investor B | |
| | | Six Months Ended March 31, 2012 | | | Year Ended September 30, | | | | | Six Months
Ended
March 31,
2012 | | | Year Ended September 30, | |
| | | (Unaudited) | | | 2011 | | | 2010 | | | 2009 | | | 2008 | | | 2007 | | | | | (Unaudited) | | | 2011 | | | 2010 | | | 2009 | | | 2008 | | | 2007 | |
Per Share Operating Performance | |
Net asset value, beginning of period | | $ | 18.31 | | | $ | 18.69 | | | $ | 17.14 | | | $ | 18.76 | | | $ | 21.97 | | | $ | 17.90 | | | | | $ | 15.75 | | | $ | 16.20 | | | $ | 15.00 | | | $ | 16.56 | | | $ | 19.57 | | | $ | 16.07 | |
Net investment loss1 | | | (0.07) | | | | (0.21) | | | | (0.18) | | | | (0.13) | | | | (0.05) | | | | (0.13) | | | | | | (0.13) | | | | (0.32) | | | | (0.30) | | | | (0.21) | | | | (0.21) | | | | (0.26) | |
Net realized and unrealized gain (loss) | | | 6.98 | | | | (0.17) | 2 | | | 1.73 | 2 | | | (1.49) | 2 | | | (3.16) | 2 | | | 4.20 | 2 | | | | | 5.97 | | | | (0.13) | 2 | | | 1.50 | 2 | | | (1.35) | 2 | | | (2.80) | 2 | | | 3.76 | 2 |
Net increase (decrease) from investment operations | | | 6.91 | | | | (0.38) | | | | 1.55 | | | | (1.62) | | | | (3.21) | | | | 4.07 | | | | | | 5.84 | | | | (0.45) | | | | 1.20 | | | | (1.56) | | | | (3.01) | | | | 3.50 | |
Distributions from net realized gain | | | (0.60) | | | | – | | | | – | | | | | | | | – | | | | – | | | | | | (0.60) | | | | – | | | | – | | | | – | | | | – | | | | – | |
Net asset value, end of period | | $ | 24.62 | | | $ | 18.31 | | | $ | 18.69 | | | $ | 17.14 | | | $ | 18.76 | | | $ | 21.97 | | | | | $ | 20.99 | | | $ | 15.75 | | | $ | 16.20 | | | $ | 15.00 | | | $ | 16.56 | | | $ | 19.57 | |
| | | | | | | | | | | | | | | | | | | | | | | | | | | | | | | | | | | | | | | | | | | | | | | | | | |
Total Investment Return3 | | | | | | | | | | | | | | | | | | | | | | | | | | | |
Based on net asset value | | | 38.26% | 4 | | | (2.03)% | 5,6 | | | 9.04% | 6 | | | (8.64)% | 6,7 | | | (14.61)% | 6 | | | 22.74% | 6 | | | | | 37.67% | 4 | | | (2.78)% | 5,6 | | | 8.00% | 6 | | | (15.38)% | 6 | | | (9.42)% | 6,8 | | | 21.78% | 6 |
| | | | | | | | | | | | | | | | | | | | | | | | | | | | | | | | | | | | | | | | | | | | | | | | | | |
Ratios to Average Net Assets | | | | | | | | | | | | | | | | | | | | | | | | | | | |
Total expenses | | | 1.16% | 9 | | | 1.18% | | | | 1.22% | | | | 1.33% | | | | 1.16% | | | | 1.12% | | | | | | 2.00% | 9 | | | 1.96% | | | | 2.19% | | | | 2.30% | | | | 2.08% | | | | 2.02% | |
Total expenses excluding recoupment of past waived fees | | | 1.16% | 9 | | | 1.18% | | | | 1.22% | | | | 1.33% | | | | 1.16% | | | | 1.12% | | | | | | 2.00% | 9 | | | 1.96% | | | | 2.07% | | | | 2.20% | | | | 2.08% | | | | 2.02% | |
Total expenses after fees waived, reimbursed and paid indirectly | | | 1.16% | 9 | | | 1.18% | | | | 1.22% | | | | 1.33% | | | | 1.16% | | | | 1.12% | | | | | | 2.00% | 9 | | | 1.96% | | | | 2.19% | | | | 2.20% | | | | 2.08% | | | | 1.92% | |
Net investment loss | | | (0.61)% | 9 | | | (0.94)% | | | | (0.98)% | | | | (0.92)% | | | | (0.22)% | | | | (0.64)% | | | | | | (1.42%) | 9 | | | (1.72)% | | | | (1.94)% | | | | (1.72)% | | | | (1.11)% | | | | (1.44)% | |
| | | | | | | | | | | | | | | | | | | | | | | | | | | | | | | | | | | | | | | | | | | | | | | | | | |
Supplemental Data | | | | | | | | | | | | | | | | | | | | | | | | | | | |
Net assets, end of period (000) | | $ | 384,437 | | | $ | 235,400 | | | $ | 269,080 | | | $ | 240,361 | | | $ | 211,065 | | | $ | 189,575 | | | | | $ | 1,982 | | | $ | 1,687 | | | $ | 2,369 | | | $ | 3,327 | | | $ | 5,721 | | | $ | 10,222 | |
Portfolio turnover | | | 81% | | | | 141% | | | | 128% | | | | 82% | | | | 81% | | | | 81% | | | | | | 81% | | | | 141% | | | | 128% | | | | 82% | | | | 81% | | | | 81% | |
| | 1 | Based on average shares outstanding. |
| | 2 | Includes redemption fees, which are less than $0.01 per share. |
| | 3 | Where applicable, total investment returns exclude the effects of any sales charges and include the reinvestment of dividends and distributions. |
| | 4 | Aggregate total investment return. |
| | 5 | Includes proceeds received from a settlement of litigation, which had no impact on the Fund’s total return. |
| | 6 | Redemption fee of 2.00% is reflected in total return calculations. There was no impact to the return. |
| | 7 | Includes proceeds received from a settlement of litigation, which impacted the Fund’s total return. Excluding these proceeds, the Fund’s total return would have been (8.69)%. |
| | 8 | Includes proceeds received from a settlement of litigation, which impacted the Fund’s total return. Excluding these proceeds, the Fund’s total return would have been (9.48)%. |
See Notes to Financial Statements.
| | | | | | |
| | | | | | | |
| 32 | | BLACKROCK FUNDS | | MARCH 31, 2012 | | |
| | |
| | |
Financial Highlights (concluded) | | BlackRock Small Cap Growth Equity Portfolio |
| | | | | | | | | | | | | | | | | | | | | | | | |
| | | Investor C | |
| | | Six Months
Ended March 31,
2012 | | | Year Ended September 30, | |
| | | (Unaudited) | | | 2011 | | | 2010 | | | 2009 | | | 2008 | | | 2007 | |
Per Share Operating Performance | |
Net asset value, beginning of period | | $ | 15.73 | | | $ | 16.19 | | | $ | 14.99 | | | $ | 16.56 | | | $ | 19.57 | | | $ | 16.09 | |
Net investment loss1 | | | (0.13) | | | | (0.35) | | | | (0.30) | | | | (0.22) | | | | (0.21) | | | | (0.29) | |
Net realized and unrealized gain (loss) | | | 5.97 | | | | (0.11) | 2 | | | 1.50 | 2 | | | (1.35) | 2 | | | (2.80) | 2 | | | 3.772 | |
Net increase (decrease) from investment operations | | | 5.84 | | | | (0.46) | | | | 1.20 | | | | (1.57) | | | | (3.01) | | | | 3.48 | |
Distributions from net realized gain | | | (0.60) | | | | – | | | | – | | | | – | | | | – | | | | – | |
Net asset value, end of period | | $ | 20.97 | | | $ | 15.73 | | | $ | 16.19 | | | $ | 14.99 | | | $ | 16.56 | | | $ | 19.57 | |
| | | | | | | | | | | | | | | | | | | | | | | | |
Total Investment Return3 | |
Based on net asset value | | | 37.72% | 4 | | | (2.84)% | 5,6 | | | 8.01% | 6 | | | (9.48)% | 6,7 | | | (15.38)% | 6 | | | 21.63%6 | |
| | | | | | | | | | | | | | | | | | | | | | | | |
Ratios to Average Net Assets | |
Total expenses | | | 1.96% | 8 | | | 2.08% | | | | 2.19% | | | | 2.31% | | | | 2.08% | | | | 2.09% | |
Total expenses excluding recoupment of past waived fees | | | 1.96% | 8 | | | 2.05% | | | | 2.13% | | | | 2.29% | | | | 2.08% | | | | 2.09% | |
Total expenses after fees waived, reimbursed and paid indirectly | | | 1.96% | 8 | | | 2.07% | | | | 2.16% | | | | 2.22% | | | | 2.08% | | | | 2.04% | |
Net investment loss | | | (1.38%) | 8 | | | (1.83)% | | | | (1.92)% | | | | (1.81)% | | | | (1.14)% | | | | (1.56)% | |
| | | | | | | | | | | | | | | | | | | | | | | | |
Supplemental Data | |
Net assets, end of period (000) | | $ | 30,849 | | | $ | 23,947 | | | $ | 33,219 | | | $ | 25,915 | | | $ | 24,405 | | | $ | 21,847 | |
Portfolio turnover | | | 81% | | | | 141% | | | | 128% | | | | 82% | | | | 81% | | | | 81% | |
| | 1 | Based on average shares outstanding. |
| | 2 | Includes redemption fees, which are less than $0.01 per share. |
| | 3 | Where applicable, total investment returns exclude the effects of any sales charges and include the reinvestment of dividends and distributions. |
| | 4 | Aggregate total investment return. |
| | 5 | Includes proceeds received from a settlement of litigation, which had no impact on the Fund’s total return. |
| | 6 | Redemption fee of 2.00% is reflected in total return calculations. There was no impact to the return. |
| | 7 | Includes proceeds received from a settlement of litigation, which impacted the Fund’s total return. Excluding these proceeds, the Fund’s total return would have been (9.54)%. |
See Notes to Financial Statements.
| | | | | | |
| | | | | | | |
| | BLACKROCK FUNDS | | MARCH 31, 2012 | | 33 |
| | |
| | |
Notes to Financial Statements (Unaudited) | | |
1. Organization and Significant Accounting Policies:
BlackRock FundsSM (the “Trust”) is registered under the Investment Company Act of 1940, as amended (the “1940 Act”), as an open-end management investment company. The Trust is organized as a Massa-chusetts business trust. BlackRock Mid-Cap Growth Equity Portfolio (“Mid-Cap Growth Equity”), BlackRock Mid-Cap Value Equity Portfolio (“Mid-Cap Value Equity”) and BlackRock Small Cap Growth Equity Portfolio (“Small Cap Growth Equity”) (collectively, the “Funds” or individually, a “Fund”) are each a series of the Trust. The Funds are classified as diversified. The Funds’ financial statements are prepared in conformity with accounting principles generally accepted in the United States of America (“US GAAP”), which may require management to make estimates and assumptions that affect the reported amounts and disclosures in the financial statements. Actual results could differ from those estimates. Each Fund offers multiple classes of shares. Institutional Shares are sold without a sales charge and only to certain eligible investors. Service Shares are sold without a sales charge. Investor A Shares are generally sold with a front-end sales charge. Investor B and Investor C Shares may be subject to a CDSC. Class R Shares are sold without a sales charge and only to certain retirement and other similar plans. All classes of shares have identical voting, dividend, liquidation and other rights and the same terms and conditions, except that Service, Investor A, Investor B, Investor C and Class R Shares bear certain expenses related to the shareholder servicing of such shares, and Investor B, Investor C and Class R Shares also bear certain expenses related to the distribution of such shares. Investor B Shares automatically convert to Investor A Shares after approximately eight years. Investor B Shares are only available through exchanges, dividend reinvestment by existing shareholders or for purchase by certain qualified employee benefit plans. Each class has exclusive voting rights with respect to matters relating to its shareholder servicing and distribution expenditures (except that Investor B shareholders may vote on material changes to the Investor A distribution and service plan).
Reorganizations: The Board of Trustees of the Trust (the “Board”) and of Mid-Cap Growth Equity and the Board and shareholders of BlackRock Small/Mid-Cap Growth Portfolio (“Small/Mid-Cap Growth”), a series of the Trust, approved the reorganization of Small/Mid-Cap Growth into Mid-Cap Growth Equity pursuant to which Mid-Cap Growth Equity acquired substantially all of the assets and assumed certain stated liabilities of Small/Mid-Cap Growth in exchange for an equal aggregate value of Mid-Cap Growth Equity shares.
Each shareholder of Small/Mid-Cap Growth received shares of Mid-Cap Growth Equity with the same class designation and an aggregate NAV of such shareholder’s Small/Mid-Cap Growth shares, as determined at the close of business on September 9, 2011.
The reorganization was accomplished by a tax-free exchange of shares of Mid-Cap Growth Equity in the following amounts and at the following conversion ratios:
| | | | | | | | | | | | |
| | | Small/Mid-Cap Growth Shares Prior to Reorganization | | | Conversion
Ratio | | | Shares of
Mid-Cap Growth
Equity | |
Institutional | | | 325,605 | | | | 1.02754184 | | | | 334,572 | |
Investor A | | | 6,985,641 | | | | 1.04197646 | | | | 7,278,873 | |
Investor B | | | 302,749 | | | | 0.99544086 | | | | 301,369 | |
Investor C | | | 784,243 | | | | 0.99592366 | | | | 781,046 | |
Class R | | | 216,432 | | | | 1.02709786 | | | | 222,297 | |
Small/Mid-Cap Growth’s net assets and composition of net assets on September 9, 2011, the date of the reorganization, were as follows:
| | | | | | | | | | | | |
Net Assets | | Paid-in Capital | | | Accumulated
Net Realized
Loss | | | Net
Unrealized
Appreciation | |
$92,348,707 | | $ | 99,897,827 | | | $ | (8,980,281 | ) | | $ | 1,431,161 | |
For financial reporting purposes, assets received and shares issued by Mid-Cap Growth Equity were recorded at fair value; however, the cost basis of the investments received from Small/Mid-Cap Growth was carried forward to align ongoing reporting of Mid-Cap Growth Equity’s realized and unrealized gains and losses with amounts distributable to shareholders for tax purposes.
The aggregate net assets of Mid-Cap Growth Equity immediately after the acquisition amounted to $294,911,916. Small/Mid-Cap Growth’s fair value and cost of investments prior to the reorganization were $93,085,931 and $91,654,770, respectively.
The purpose of the transaction was to combine two funds managed by the Manager, the investment advisor to both Small/Mid-Cap Growth and Mid-Cap Growth Equity with the same or substantially similar (but not identical) investment objectives, investment policies, strategies, risks and restrictions. The reorganization was a tax-free event and was effective on September 12, 2011.
Assuming the acquisition had been completed on October 1, 2010, the beginning of the annual reporting period of Mid-Cap Growth Equity, the pro forma results of operations for the year ended September 30, 2011, were as follows:
| — | | Net investment loss: $(3,404,549) |
| — | | Net realized and change in unrealized gain/loss on investments: $12,060,317 |
| — | | Net increase in the net assets resulting from operations: $8,655,768 |
Because the combined investment portfolios have been managed as a single integrated portfolio since the acquisition was completed, it is not practicable to separate the amounts of revenue and earnings of Small/ Mid-Cap Growth that have been included in the Mid-Cap Growth Equity’s Statement of Changes since September 12, 2011.
| | | | | | |
| | | | | | | |
| 34 | | BLACKROCK FUNDS | | MARCH 31, 2012 | | |
| | |
| | |
Notes to Financial Statements (continued) | | |
Reorganization costs incurred by Mid-Cap Growth Equity in connection with the reorganization were expensed by Mid-Cap Growth Equity.
The following is a summary of significant accounting policies followed by the Funds:
Valuation: US GAAP defines fair value as the price the Funds would receive to sell an asset or pay to transfer a liability in an orderly transaction between market participants at the measurement date. The Funds fair value their financial instruments at market value using independent dealers or pricing services under policies approved by the Board. Equity investments traded on a recognized securities exchange or the NASDAQ Global Market System (“NASDAQ”) are valued at the last reported sale price that day or the NASDAQ official closing price, if applicable. For equity investments traded on more than one exchange, the last reported sale price on the exchange where the stock is primarily traded is used. Equity investments traded on a recognized exchange for which there were no sales on that day are valued at the last available bid price. If no bid price is available, the prior day’s price will be used, unless it is determined that such prior day’s price no longer reflects the fair value of the security. Investments in open-end registered investment companies are valued at NAV each business day. Short-term securities with remaining maturities of 60 days or less may be valued at amortized cost, which approximates fair value.
The Funds value their investments in BlackRock Liquidity Series, LLC Money Market Series (the “Money Market Series”) at fair value, which is ordinarily based upon their pro rata ownership in the underlying fund’s net assets. The Money Market Series seeks current income consistent with maintaining liquidity and preserving capital. Although the Money Market Series is not registered under the 1940 Act, its investments will follow the parameters of investments by a money market fund that is subject to Rule 2a-7 under the 1940 Act. Each Fund may withdraw up to 25% of its investment daily, although the manager of the Money Market Series, in its sole discretion, may permit an investor to withdraw more than 25% on any one day.
Exchange-traded options are valued at the mean between the last bid and ask prices at the close of the options market in which the options trade. An exchange-traded option for which there is no mean price is valued at the last bid (long positions) or ask (short positions) price. If no bid or ask price is available, the prior day’s price will be used, unless it is determined that the prior day’s price no longer reflects the fair value of the option. Over-the-counter (“OTC”) options are valued by an independent pricing service using a mathematical model which incorporates a number of market data factors, such as the trades and prices of the underlying instruments.
In the event that application of these methods of valuation results in a price for an investment which is deemed not to be representative of the market value of such investment or if a price is not available, the investment will be valued in accordance with a policy approved by the Board as reflecting fair value (“Fair Value Assets”). When determining the price
for Fair Value Assets, the investment advisor seeks to determine the price that each Fund might reasonably expect to receive from the current sale of that asset in an arm’s-length transaction. Fair value determinations shall be based upon all available factors that the investment advisor deems relevant. The pricing of all Fair Value Assets is subsequently reported to the Board or a committee thereof.
Segregation and Collateralization: In cases in which the 1940 Act and the interpretive positions of the Securities and Exchange Commission (“SEC”) require that a Fund either deliver collateral or segregate assets in connection with certain investments (e.g., options written), the Fund will, consistent with SEC rules and/or certain interpretive letters issued by the SEC, segregate collateral or designate on its books and records cash or liquid securities having a market value at least equal to the amount that would otherwise be required to be physically segregated. Furthermore, based on requirements and agreements with certain exchanges and third party broker-dealers, each party to such transactions has requirements to deliver/deposit securities as collateral for certain investments.
Investment Transactions and Investment Income: For financial reporting purposes, investment transactions are recorded on the dates the transactions are entered into (the trade dates). Realized gains and losses on investment transactions are determined on the identified cost basis. Dividend income is recorded on the ex-dividend dates. Dividends from foreign securities where the ex-dividend date may have passed are subsequently recorded when the Funds are informed of the ex-dividend date. Under the applicable foreign tax laws, a withholding tax at various rates may be imposed on capital gains, dividends and interest. Upon notification from issuers, some of the dividend income received from a real estate investment trust may be redesignated as a reduction of cost of the related investment and/or realized gain. Income and realized and unrealized gains and losses are allocated daily to each class based on its relative net assets.
Dividends and Distributions: Dividends and distributions paid by the Funds are recorded on the ex-dividend dates. The amount and timing of dividends and distributions are determined in accordance with federal income tax regulations, which may differ from US GAAP.
Securities Lending: The Funds may lend securities to approved borrowers, such as banks, brokers and other financial institutions. The borrower pledges cash, securities issued or guaranteed by the US government or irrevocable letters of credit issued by a bank as collateral, which will be maintained at all times in an amount equal to at least 100% of the current market value of the loaned securities. The market value of the loaned securities is determined at the close of business of the Funds and any additional required collateral is delivered to the Funds on the next business day. Securities lending income, as disclosed in the Statements of Operations, represents the income earned from the investment of the cash collateral, net of rebates paid to, or fees paid by, borrowers and less the fees paid to the securities lending agent. During the term of the loan, the Funds earn dividend or interest income on the securities
| | | | | | |
| | | | | | | |
| | BLACKROCK FUNDS | | MARCH 31, 2012 | | 35 |
| | |
| | |
Notes to Financial Statements (continued) | | |
loaned but do not receive dividend or interest income on the securities received as collateral. Loans of securities are terminable at any time and the borrower, after notice, is required to return borrowed securities within the standard time period for settlement of securities transactions. In the event that the borrower defaults on its obligation to return borrowed securities because of insolvency or for any other reason, the Funds could experience delays and costs in gaining access to the collateral. The Funds also could suffer a loss if the value of an investment purchased with cash collateral falls below the market value of loaned securities or if the value of an investment purchased with cash collateral falls below the value of the original cash collateral received. During the six months ended March 31, 2012, any securities on loan were collaterized by cash.
Income Taxes: It is each Fund’s policy to comply with the requirements of the Internal Revenue Code of 1986, as amended, applicable to regulated investment companies and to distribute substantially all of its taxable income to its shareholders. Therefore, no federal income tax provision is required.
Each Fund files US federal and various state and local tax returns. No income tax returns are currently under examination. The statute of limitations on the Funds’ US federal tax returns remains open for each of the four years ended September 30, 2011. The statutes of limitations on each Fund’s state and local tax returns may remain open for an additional year depending upon the jurisdiction. Management does not believe there are any uncertain tax positions that require recognition of a tax liability.
Recent Accounting Standards: In May 2011, the Financial Accounting Standards Board (the “FASB”) issued amended guidance to improve disclosure about fair value measurements which will require the following disclosures for fair value measurements categorized as Level 3: quantitative information about the unobservable inputs and assumptions used in the fair value measurement, a description of the valuation policies and procedures and a narrative description of the sensitivity of the fair value measurement to changes in unobservable inputs and the interrelationships between those unobservable inputs. In addition, the amounts and reasons for all transfers in and out of Level 1 and Level 2 will be required to be disclosed as well as disclosure of the level in the fair value hierarchy of assets and liabilities not recorded at fair value but where fair value is disclosed. The amended guidance is effective for financial statements for fiscal years beginning after December 15, 2011, and interim periods within those fiscal years. Management is evaluating the impact of this guidance on the Funds’ financial statement disclosures.
In December 2011, the FASB issued guidance that will expand current disclosure requirements on the offsetting of certain assets and liabilities. The new disclosures will be required for investments and derivative financial instruments subject to master netting or similar agreements which are eligible for offset in the Statements of Assets and Liabilities and will require an entity to disclose both gross and net information about such investments and transactions in the financial statements. The guidance is effective for financial statements with fiscal years beginning on or after
January 1, 2013, and interim periods within those fiscal years. Management is evaluating the impact of this guidance on the Funds’ financial statement disclosures.
Other: Expenses directly related to a Fund or its classes are charged to that Fund or class. Other operating expenses shared by several funds are pro rated among those funds on the basis of relative net assets or other appropriate methods. Expenses directly related to the Funds and other shared expenses pro rated to the Funds are allocated daily to each class based on its relative net assets or other appropriate methods.
The Funds have an arrangement with the custodian whereby fees may be reduced by credits earned on uninvested cash balances, which, if applicable, are shown as fees paid indirectly in the Statements of Operations. The custodian imposes fees on overdrawn cash balances, which can be offset by accumulated credits earned or may result in additional custody charges.
2. Derivative Financial Instruments:
The Funds engage in various portfolio investment strategies using derivative contracts both to increase the returns of the Funds and to economically hedge, or protect, their exposure to equity risk. These contracts may be transacted on an exchange or OTC.
Losses may arise if the value of the contract decreases due to an unfavorable change in the market rates or values of the underlying instrument or if the counterparty does not perform under the contract. The Funds’ maximum risk of loss from counterparty credit risk on OTC derivatives is generally the aggregate unrealized gain netted against any collateral pledged by/posted to the counterparty. For OTC options purchased, the Funds bear the risk of loss in the amount of the premiums paid plus the positive change in market values net of any collateral received on the options should the counterparty fail to perform under the contracts. Options written by the Funds do not give rise to counterparty credit risk, as options written obligate the Funds to perform and not the counterparty. Counterparty risk related to exchange-traded options is deemed to be minimal due to the protection against defaults provided by the exchange on which these contracts trade.
The Funds may mitigate counterparty risk by procuring collateral and through netting provisions included within an International Swaps and Derivatives Association, Inc. master agreement (“ISDA Master Agreement”) implemented between a Fund and each of its respective counterparties. An ISDA Master Agreement allows each Fund to offset with each separate counterparty certain derivative financial instrument’s payables and/or receivables with collateral held. The amount of collateral moved to/from applicable counterparties is generally based upon minimum transfer amounts of up to $500,000. To the extent amounts due to the Funds from their counterparties are not fully collateralized contractually or otherwise, the Funds bear the risk of loss from counterparty non-performance. See Note 1 “Segregation and Collateralization” for information with respect to collateral practices. In
| | | | | | |
| | | | | | | |
| 36 | | BLACKROCK FUNDS | | MARCH 31, 2012 | | |
| | |
| | |
Notes to Financial Statements (continued) | | |
addition, the Funds manage counterparty risk by entering into agreements only with counterparties that they believe have the financial resources to honor their obligations and by monitoring the financial stability of those counterparties.
Certain ISDA Master Agreements allow counterparties to OTC derivatives to terminate derivative contracts prior to maturity in the event the Funds’ net assets decline by a stated percentage or the Funds fail to meet the terms of its ISDA Master Agreements, which would cause the Funds to accelerate payment of any net liability owed to the counterparty.
Options: The Funds purchase and write call and put options to increase or decrease their exposure to underlying instruments (including equity risk) and/or, in the case of options written, to generate gains from options premiums. A call option gives the purchaser (holder) of the option the right (but not the obligation) to buy, and obligates the seller (written) to sell (when the option is exercised), the underlying instrument at the exercise or strike price at any time or at a specified time during the option period. A put option gives the holder the right to sell and obligates the writer to buy the underlying instrument at the exercise or strike price at any time or at a specified time during the option period. When a Fund purchases (writes) an option, an amount equal to the premium paid (received) by a Fund is reflected as an asset (liability). The amount of the asset (liability) is subsequently marked-to-market to reflect the current market value of the option purchased (written). When an instrument is purchased or sold through an exercise of an option, the related premium paid (or received) is added to (or deducted from) the basis of the instrument acquired or deducted from (or added to) the proceeds of the instrument sold. When an option expires (or a Fund enters into a closing transaction), a Fund realizes a gain or loss on the option to the extent of the premiums received or paid (or gain or loss to the extent the cost of the closing transaction exceeds the premiums received or paid). When a Fund writes a call option, such option is “covered,” meaning that a Fund holds the underlying instrument subject to being called by the option counterparty. When a Fund writes a put option, such option is covered by cash in an amount sufficient to cover the obligation.
In purchasing and writing options, a Fund bears the risk of an unfavorable change in the value of the underlying instrument or the risk that a Fund may not be able to enter into a closing transaction due to an illiquid market. Exercise of a written option could result in a Fund purchasing or selling a security at a price different from the current market value.
Derivative Financial Instruments Categorized by Risk Exposure:
| | | | | | | | | | | | |
| Fair Values of Derivative Financial Instruments as of March 31, 2012 | |
| Liability Derivatives | |
| | | Statements of Assets
and Liabilities Location | | | Mid-Cap
Growth
Equity | | | Small Cap
Growth
Equity | |
Equity contracts | | | Options written at value | | | $ | 29,150 | | | $ | 124,020 | |
| | | | | | | | | | | | |
| The Effect of Derivative Financial Instruments in the Statements of Operations Six Months Ended March 31, 2012 | |
| Net Realized Gain (Loss) From | |
| | | Mid-Cap Growth Equity | | | Mid-Cap
Value
Equity | | | Small Cap Growth
Equity | |
Equity contracts: | | | | | | | | | | | | |
Options | | $ | (122,470 | ) | | $ | 251,245 | | | $ | (488,801 | ) |
| Net Change in Unrealized Appreciation/Depreciation on | |
| | | Mid-Cap Growth Equity | | | Mid-Cap Value
Equity | | | Small Cap Growth
Equity | |
Equity contracts: | | | | | | | | | | | | |
Options | | $ | (7,816 | ) | | $ | 40,926 | | | $ | (33,253 | ) |
| |
For the six months ended March 31, 2012, the average quarterly bal-ances of outstanding derivative financial instruments were as follows: | |
| | | Mid-Cap Growth Equity | | | Mid-Cap
Value
Equity | | | Small Cap
Growth
Equity | |
Options: | | | | | | | | | | | | |
Average number of option contracts purchased | | | – | | | | 1 | 1 | | | – | |
Average number of option contracts written | | | 1 | | | | 1 | 1 | | | 1 | |
Average notional value of option contracts purchased | | | — | | | $ | 2,625,000 | 1 | | | – | |
Average notional value of option contracts written | | $ | 473,000 | | | $ | 1,726,2881 | | | $ | 2,012,400 | |
| 1 | Average contract amount shown due to limited activity. |
3. Investment Advisory Agreement and Other Transactions with Affiliates:
The PNC Financial Services Group, Inc. (“PNC”) and Barclays Bank PLC (“Barclays”) are the largest stockholders of BlackRock. Due to the ownership structure, PNC is an affiliate for 1940 Act purposes, but Barclays is not.
The Trust, on behalf of the Funds, entered into an Investment Advisory Agreement with the Manager, the Funds’ investment advisor, an indirect, wholly owned subsidiary of BlackRock, to provide investment advisory and administration services. The Manager is responsible for the management of each Fund’s portfolio and provides the necessary personnel, facilities, equipment and certain other services necessary to the operations of each Fund. For such services, each Fund pays the Manager a
| | | | | | |
| | | | | | | |
| | BLACKROCK FUNDS | | MARCH 31, 2012 | | 37 |
| | |
| | |
Notes to Financial Statements (continued) | | |
monthly fee based on a percentage of each Fund’s average daily net assets at the following annual rates:
| | | | |
| | | Mid-Cap Growth Equity
and
Mid-Cap Value Equity | | Small Cap
Growth
Equity |
| Average Daily Net Assets | | Investment
Advisory Fee | | Investment
Advisory Fee |
First $1 Billion. | | 0.800% | | 0.550% |
$1 Billion - $2 Billion | | 0.700% | | 0.500% |
$2 Billion - $3 Billion | | 0.650% | | 0.475% |
Greater than $3 Billion | | 0.625% | | 0.450% |
The Manager contractually or voluntarily agreed to waive and/or reimburse fees or expenses, excluding interest expense, dividend expense, acquired fund fees and expenses and certain other fund expenses, in order to limit expenses. The expense limitations as a percentage of average daily net assets are as follows:
| | | | | | | | | | |
| Share Classes | | Mid-Cap
Growth
Equity | | Mid-Cap
Value
Equity | | Small Cap Growth Equity | |
| | | Contractual | | Contractual2 | | Contractual2 | | Voluntary3 | |
Institutional | | 1.11%1 | | 0.97% | | 1.02% | | | – | |
Service | | 1.58%2 | | 1.29% | | 1.29% | | | 1.18% | |
Investor A | | 1.39%1 | | 1.29% | | 1.50% | | | – | |
Investor B | | 2.16%1 | | 2.06% | | 2.28% | | | – | |
Investor C | | 2.16%1 | | 2.06% | | 2.28% | | | – | |
Class R | | 1.65%2 | | 1.65%4 | | 1.72%5 | | | – | |
| 1 | The Manager has agreed not to reduce or discontinue this contractual waiver or reimbursement prior to February 1, 2014 unless approved by the Board, including a majority of the Independent Trustees. |
| 2 | The Manager has agreed not to reduce or discontinue this contractual waiver or reimbursement prior to February 1, 2013, except for Mid-Cap Value Equity’s Class R Shares which is prior to February 1, 2022, unless approved by the Board, including a majority of the Independent Trustees. |
| 3 | The voluntary waiver or reimbursement may be reduced or discontinued at any time. |
| 4 | On February 1 of each year, the waiver agreement will renew automatically for an additional one year so that the agreement will have a perpetual ten year term. |
| 5 | There were no shares outstanding as of March 31, 2012. |
These amounts are shown as administration fees waived – class specific, transfer agent fees waived – class specific and transfer agent fees reimbursed – class specific, respectively, in the Statements of Operations. Class specific expense waivers or reimbursements are as follows:
| | | | | | | | | | | | |
| Administration Fees Waived | |
| Share Classes | | Mid-Cap
Growth
Equity | | | Mid-Cap
Value
Equity | | | Small Cap
Growth
Equity | |
Institutional | | $ | 1,639 | | | $ | 24,331 | | | | – | |
Service | | | 119 | | | | 158 | | | $ | 2,761 | |
Investor A | | | 32,462 | | | | 74,325 | | | | – | |
Investor B | | | 947 | | | | 3,242 | | | | – | |
Investor C | | | 2,384 | | | | 15,407 | | | | – | |
Class R | | | 707 | | | | 138 | | | | – | |
Total | | $ | 38,258 | | | $ | 117,601 | | | $ | 2,761 | |
| | | | | | | | | | | | |
| Transfer Agent Fees Waived | |
| Share Classes | | Mid-Cap
Growth
Equity | | | Mid-Cap
Value
Equity | | | Small Cap
Growth
Equity | |
Institutional | | $ | 781 | | | $ | 1,228 | | | | – | |
Service | | | 184 | | | | 145 | | | $ | 212 | |
Investor A | | | 29,317 | | | | 28,030 | | | | – | |
Investor B | | | 3,421 | | | | 3,559 | | | | – | |
Investor C | | | 5,890 | | | | 5,832 | | | | – | |
Class R | | | 27 | | | | 21 | | | | – | |
Total | | $ | 39,620 | | | $ | 38,815 | | | $ | 212 | |
| | | | | | | | | | | | |
| Transfer Agent Fees Reimbursed | |
| Share Classes | | Mid-Cap
Growth
Equity | | | Mid-Cap
Value
Equity | | | Small Cap
Growth
Equity | |
Institutional | | $ | 6,359 | | | $ | 147,675 | | | | – | |
Service | | | 1,846 | | | | 2,250 | | | $ | 2,437 | |
Investor A | | | 123,317 | | | | 289,671 | | | | – | |
Investor B | | | 12,573 | | | | 31,663 | | | | – | |
Investor C | | | 8,325 | | | | 61,903 | | | | – | |
Class R | | | 5,078 | | | | 289 | | | | – | |
Total | | $ | 157,498 | | | $ | 533,451 | | | $ | 2,437 | |
The Manager voluntarily agreed to waive its investment advisory fees by the amount of investment advisory fees each Fund pays to the Manager indirectly through its investment in affiliated money market funds. However the Manager does not waive its investment advisory fees by the amount of investment advisory fees paid in connection with each Fund’s investment in other affiliated investment companies, if any. These amounts are included in fees waived by advisor in the Statements of Operations. For the six months ended March 31, 2012, the amounts waived were as follows:
| | | | |
| Mid-Cap Growth Equity | | $1,597 | |
Mid-Cap Value Equity | | $ | 4,579 | |
Small Cap Growth Equity | | $ | 5,801 | |
If during a Fund’s fiscal year the operating expenses of a share class, that at any time during the prior two fiscal years received a waiver or reimbursement from the Manager, are less than the expense limit for that share class, the Manager is entitled to be reimbursed by such share class up to the lesser of (a) the amount of fees waived or expenses reimbursed during those prior two fiscal years under the agreement and (b) the amount by which the expense limit for that share class exceeds the operating expenses of the share class for the current fiscal year, provided that: (1) the Fund of which the share class is a part has more than $50 million in assets for the fiscal year and (2) the Manager or an affiliate continues to serve as the Fund’s investment advisor or administrator. In the event the expense limit for a share class is changed subsequent to a fiscal year in which the Manager becomes entitled to reimbursement for fees waived or reimbursed, the amount available to reimburse the Manager shall be calculated by reference to the expense limit for that share class in effect at the time the Manager became entitled to receive such reimbursement, rather than the subsequently changed expense limit for that share class.
| | | | | | |
| | | | | | | |
| 38 | | BLACKROCK FUNDS | | MARCH 31, 2012 | | |
| | |
| | |
Notes to Financial Statements (continued) | | |
For the six months ended March 31, 2012, the Manager recouped the following waivers previously recorded by the Funds:
| | | | | | | | |
| Recoupment of Past Waived Fees | |
| Share Classes | | Mid-Cap Growth
Equity | | | Mid-Cap
Value
Equity | |
Institutional | | $ | 656 | | | | – | |
Investor B | | | – | | | $ | 287 | |
Investor C | | | – | | | | 503 | |
Total | | $ | 656 | | | $ | 790 | |
On March 31, 2012, the amounts subject to possible future recoupment under the expense limitation agreement are as follows:
| | | | | | | | | | | | |
| | | Expiring September 30, | |
| | | | 2012 | | | | 2013 | | | | 2014 | |
Mid-Cap Growth Equity | | $ | 18,353 | | | $ | 46,944 | | | $ | 235,374 | |
Mid-Cap Value Equity | | $ | 990,928 | | | $ | 1,061,191 | | | $ | 689,854 | |
The Trust, on behalf of the Funds, entered into a Distribution Agreement and Distribution and Service Plan with BlackRock Investments, LLC (“BRIL”), an affiliate of the Manager. Pursuant to the Distribution and Service Plan and in accordance with Rule 12b-1 under the 1940 Act, the Funds pay BRIL ongoing service and distribution fees. The fees are accrued daily and paid monthly at annual rates based upon the average daily net assets of the shares of each Fund as follows:
| | | | | | |
| | | Service
Fee | | Distribution
Fee | |
Service | | 0.25% | | | – | |
Investor A | | 0.25% | | | – | |
Investor B | | 0.25% | | | 0.75 | % |
Investor C | | 0.25% | | | 0.75 | % |
Class R | | 0.25% | | | 0.25 | % |
Pursuant to sub-agreements with BRIL, broker-dealers and BRIL provide shareholder servicing and distribution services to each Fund. The ongoing service and/or distribution fee compensate BRIL and each broker-dealer for providing shareholder servicing and/or distribution related services to Service, Investor A, Investor B, Investor C and Class R shareholders.
For the six months ended March 31, 2012, the following table shows the class specific service and distribution fees borne directly by each class of each Fund:
| | | | | | | | | | | | |
| Service and Distribution Fees | |
| Share Classes | | Mid-Cap
Growth
Equity | | | Mid-Cap
Value
Equity | | | Small Cap
Growth
Equity | |
Service | | $ | 1,188 | | | $ | 1,579 | | | $ | 34,434 | |
Investor A | | | 324,621 | | | | 822,083 | | | | 402,874 | |
Investor B | | | 37,889 | | | | 129,725 | | | | 9,461 | |
Investor C | | | 95,361 | | | | 625,539 | | | | 139,573 | |
Class R | | | 14,322 | | | | 2,752 | | | | – | |
Total | | $ | 473,381 | | | $ | 1,581,678 | | | $ | 586,342 | |
For the six months ended March 31, 2012, affiliates earned underwriting discounts, direct commissions and dealer concessions on sales of each Fund’s Investor A Shares as follows:
| | | | |
Mid-Cap Growth Equity | | $ | 2,986 | |
Mid-Cap Value Equity | | $ | 4,754 | |
Small Cap Growth Equity | | $ | 7,400 | |
For the six months ended March 31, 2012, affiliates received the following CDSCs relating to transactions in Investor A, Investor B and Investor C Shares as follows:
| | | | | | | | | | | | |
| | | | Investor A | | | | Investor B | | | | Investor C | |
Mid-Cap Growth Equity | | | – | | | $ | 1,852 | | | $ | 1,029 | |
Mid-Cap Value Equity | | $ | 109 | | | $ | 9,079 | | | $ | 2,579 | |
Small Cap Growth Equity | | $ | 1,090 | | | $ | 1,109 | | | $ | 808 | |
Pursuant to written agreements, certain financial intermediaries, some of which may be affiliates, provide the Funds with sub-accounting, recordkeeping, sub-transfer agency and other administrative services with respect to sub-accounts they service. For these services, these entities receive an annual fee per shareholder account, which will vary depending on share class and/or net assets. For the six months ended March 31, 2012, the Funds paid the following to affiliates in return for these services, which are included in transfer agent – class specific in the Statements of Operations:
| | | | |
Mid-Cap Growth Equity | | $ | 5,138 | |
Mid-Cap Value Equity | | $ | 6,587 | |
Small Cap Growth Equity | | $ | 113,580 | |
| | | | | | |
| | | | | | | |
| | BLACKROCK FUNDS | | MARCH 31, 2012 | | 39 |
| | |
| | |
Notes to Financial Statements (continued) | | |
The Manager maintains a call center, which is responsible for providing certain shareholder services to the Funds, such as responding to shareholder inquiries and processing transactions based upon instructions from shareholders with respect to the subscription and redemption of Fund shares. For the six months ended March 31, 2012, each Fund reimbursed the Manager the following amounts for costs incurred in running the call center, which are included in transfer agent – class specific in the Statements of Operations:
| | | | | | | | | | | | |
| Share Classes | | Mid-Cap
Growth
Equity | | | Mid-Cap
Value
Equity | | | Small Cap
Growth
Equity | |
Institutional | | $ | 1,096 | | | $ | 1,228 | | | $ | 3,318 | |
Service | | | 184 | | | | 145 | | | | 690 | |
Investor A | | | 29,317 | | | | 28,030 | | | | 6,143 | |
Investor B | | | 3,421 | | | | 3,567 | | | | 128 | |
Investor C | | | 5,890 | | | | 5,843 | | | | 756 | |
Class R | | | 30 | | | | 21 | | | | – | |
Total | | $ | 39,938 | | | $ | 38,834 | | | $ | 11,035 | |
For the six months ended March 31, 2012, the following table shows the class specific transfer agent fees borne directly by each class of each Fund:
| | | | | | | | | | | | |
| Transfer Agent Fees | |
| Share Classes | | Mid-Cap
Growth
Equity | | | Mid-Cap
Value
Equity | | | Small Cap
Growth
Equity | |
Institutional | | $ | 22,184 | | | $ | 216,115 | | | $ | 869,332 | |
Service | | | 3,886 | | | | 3,282 | | | | 43,379 | |
Investor A | | | 408,930 | | | | 775,034 | | | | 408,763 | |
Investor B | | | 24,208 | | | | 57,791 | | | | 3,237 | |
Investor C | | | 34,879 | | | | 165,331 | | | | 42,841 | |
Class R | | | 11,038 | | | | 1,684 | | | | – | |
Total | | $ | 505,125 | | | $ | 1,219,237 | | | $ | 1,367,552 | |
BNY Mellon Investment Servicing (US) Inc. (“BNYMIS”) and the Manager act as co-administrators for the Funds. For these services, the co-administrators receive a combined administration fee computed daily and payable monthly, based on a percentage of the average daily net assets of each Fund. The combined administration fee is paid at the following annual rates: 0.075% of the first $500 million, 0.065% of the next $500 million and 0.055% of the average daily net assets in excess of $1 billion. In addition, each of the share classes is charged an administration fee based on the following percentages of average daily net assets of each respective class: 0.025% of the first $500 million, 0.015% of the next $500 million and 0.005% of the average daily net assets in excess of $1 billion. In addition, BNYMIS and the Manager may have, at their discretion, voluntarily waived all or any portion of their administration fees for a Fund or a share class which are included in administration fees waived – class specific in the Statements of Operations. For the six months ended March 31, 2012, the Funds paid the following to the Manager in return for these services, which are included in administration, administration – class specific and administration fees
waived – class specific in the Statements of Operations:
| | | | |
| Administration Fees | |
Mid-Cap Growth Equity | | $ | 80,661 | |
Mid-Cap Value Equity | | $ | 249,694 | |
Small Cap Growth Equity | | $ | 479,843 | |
For the six months ended March 31, 2012, the following table shows the administration fees – class specific borne directly by each class of each Fund:
| | | | | | | | | | | | |
| Administration Fees – Class Specific | |
| Share Classes | | Mid-Cap
Growth
Equity | | | Mid-Cap
Value
Equity | | | Small Cap
Growth
Equity | |
Institutional | | $ | 2,656 | | | $ | 24,330 | | | $ | 100,698 | |
Service | | | 119 | | | | 158 | | | | 3,443 | |
Investor A | | | 32,462 | | | | 74,325 | | | | 40,287 | |
Investor B | | | 947 | | | | 3,296 | | | | 237 | |
Investor C | | | 2,384 | | | | 15,638 | | | | 3,489 | |
Class R | | | 716 | | | | 138 | | | | – | |
Total | | $ | 39,284 | | | $ | 117,885 | | | $ | 148,154 | |
The Funds received an exemptive order from the SEC permitting them, among other things, to pay an affiliated securities lending agent a fee based on a share of the income derived from the securities lending activities and has retained BlackRock Investment Management, LLC (“BIM”) as the securities lending agent. BIM may, on behalf of the Funds, invest cash collateral received by the Funds for such loans, among other things, in a private investment company managed by the Manager or in registered money market funds advised by the Manager or its affiliates. As securities lending agent, BIM is responsible for all transaction fees and all other operational costs relating to securities lending activities, other than extraordinary expenses. BIM does not receive any fees for managing the cash collateral. The market value of securities on loan and the value of the related collateral, if applicable, are shown in the Statements of Assets and Liabilities as securities loaned at value and collateral on securities loaned at value, respectively. The cash collateral invested by BIM is disclosed in the Schedules of Investments, if any. Securities lending income is equal to the total of income earned from the reinvestment of cash collateral, net of rebates paid to, or fees paid by, borrowers of securities. The Funds retain 65% of securities lending income and pay a fee to BIM equal to 35% of such income. The share of income earned by the Funds on the reinvestment of cash collateral is shown as securities lending – affiliated in the Statements of Operations. For the six months ended March 31, 2012, BIM received $483,279 in securities lending agent fees related to securities lending activities for the Funds.
Certain officers and/or trustees of the Trust are officers and/or directors of BlackRock or its affiliates. The Funds reimburse the Manager for compensation paid to the Trust’s Chief Compliance Officer.
| | | | | | |
| | | | | | | |
| 40 | | BLACKROCK FUNDS | | MARCH 31, 2012 | | |
| | |
| | |
Notes to Financial Statements (continued) | | |
4. Investments:
Purchases and sales of investments, excluding short-term securities, for the six months ended March 31, 2012, were as follows:
| | | | | | | | |
| | Purchases | | | Sales | |
Mid-Cap Growth Equity | | $ | 136,351,636 | | | $ | 161,464,461 | |
Mid-Cap Value Equity | | $ | 504,062,471 | | | $ | 631,148,969 | |
Small Cap Growth Equity | | $ | 1,146,895,804 | | | $ | 1,333,064,194 | |
Transactions in options written for the six months ended March 31, 2012, were as follows:
| | | | | | | | | | | | | | | | |
| | | Mid-Cap Growth Equity | |
| | | Calls | | | Puts | |
| | | Contracts | | | Premiums
Received | | | Contracts | | | Premiums
Received | |
Outstanding options,beginning of period | | | – | | | | – | | | | – | | | | – | |
Options written | | | 3,080 | | | $ | 373,154 | | | | 555 | | | $ | 43,832 | |
Options expired | | | (885 | ) | | | (52,480 | ) | | | (555 | ) | | | (43,832 | ) |
Options closed | | | (1,975 | ) | | | (299,340 | ) | | | – | | | | – | |
Outstanding options,at end of period | | | 220 | | | $ | 21,334 | | | | – | | | | – | |
| |
| | | Mid-Cap Value Equity | |
| | | Calls | | | Puts | |
| | | Contracts | | | Premiums
Received | | | Contracts | | | Premiums
Received | |
Outstanding options,beginning of period | | | – | | | | – | | | | 1,750 | | | $ | 55,574 | |
Options written | | | 15,155 | | | $ | 363,752 | | | | 1,000 | | | | 62,976 | |
Options expired | | | (8,905 | ) | | | (220,838 | ) | | | (2,250 | ) | | | (65,063 | ) |
Options closed | | | (6,250 | ) | | | (142,914 | ) | | | (500 | ) | | | (53,487 | ) |
Outstanding options,at end of period. | | | – | | | | – | | | | – | | | | – | |
| |
| | | Small Cap Growth Equity | |
| | | Calls | | | Puts | |
| | | Contracts | | | Premiums
Received | | | Contracts | | | Premiums
Received | |
Outstanding options,beginning of period | | | – | | | | – | | | | – | | | | – | |
Options written | | | 14,897 | | | $ | 1,641,740 | | | | 2,360 | | | $ | 186,383 | |
Options expired | | | (5,453 | ) | | | (265,526 | ) | | | (2,360 | ) | | | (186,383 | ) |
Options closed | | | (8,508 | ) | | | (1,285,447 | ) | | | – | | | | – | |
Outstanding options,at end of period | | | 936 | | | $ | 90,767 | | | | – | | | | – | |
5. Income Tax Information:
As of September 30, 2011, the Funds had capital loss carryforwards available to offset future realized capital gains through the indicated expiration dates as follows:
| | | | | | | | |
Expires September 30,
| | Mid-Cap
Growth Equity | | | Mid-Cap Value Equity | |
2017 | | $ | 7,635,980 | | | $ | 35,789,825 | |
2018 | | | 14,650,983 | | | | 90,011,532 | |
| | | | |
Total | | $ | 22,286,963 | | | $ | 125,801,357 | |
| | | | | | | | |
Under the Regulated Investment Company Modernization Act of 2010, capital losses incurred by the Funds after September 30, 2011 will not be subject to expiration. In addition any such losses must be utilized prior to the losses incurred in pre-enactment taxable years.
As of March 31, 2012, gross unrealized appreciation and gross unrealized depreciation based on cost for federal income tax purposes were as follows:
| | | | | | | | | | | | |
| | | Mid-Cap
Growth Equity | | | Mid-Cap Value Equity | | | Small Cap Growth Equity | |
Tax cost | | $ | 324,234,263 | | | $ | 970,884,546 | | | $ | 1,687,784,749 | |
Gross unrealized appreciation | | $ | 70,235,381 | | | $ | 128,715,684 | | | $ | 297,245,067 | |
Gross unrealized depreciation | | | (8,128,962 | ) | | | (10,374,463 | ) | | | (48,532,945 | ) |
Net unrealized appreciation | | $ | 62,106,419 | | | $ | 118,341,221 | | | $ | 248,712,122 | |
6. Borrowings:
The Trust, on behalf of the Funds, along with certain other funds managed by the Manager and its affiliates, is a party to a $500 million credit agreement with a group of lenders. The Funds may borrow under the credit agreement to fund shareholder redemptions. Effective November 2010 to November 2011, the credit agreement had the following terms: a commitment fee of 0.08% per annum based on the Funds’ pro rata share of the unused portion of the credit agreement and interest at a rate equal to the higher of (a) the one-month LIBOR plus 1.00% per annum or (b) the Fed Funds rate plus 1.00% per annum on amounts borrowed. In addition, the Funds paid administration and arrangement fees which were allocated to the Funds based on their net assets as of October 31, 2010. The credit agreement, which expired in November 2011, was renewed until November 2012. Effective November 2011 to November 2012, the credit agreement has the following terms: a commitment fee of 0.065% per annum based on the Funds’ pro rata share of the unused portion of the credit agreement and interest at a rate equal to the higher of (a) the one-month LIBOR plus 0.80% per annum or (b) the Fed Funds rate plus 0.80% per annum on amounts borrowed. In addition, the Funds paid administration and arrangement fees which were allocated to the Funds based on their net assets as of October 31, 2011. The Funds did not borrow under the credit agreement during the six months ended March 31, 2012.
7. Concentration, Market and Credit Risk:
In the normal course of business, the Funds invest in securities and enter into transactions where risks exist due to fluctuations in the market (market risk) or failure of the issuer of a security to meet all its obligations (issuer credit risk). The value of securities held by the Funds may decline in response to certain events, including those directly involving the issuers whose securities are owned by the Funds; conditions affecting the general economy; overall market changes; local, regional or global political, social or economic instability; and currency and interest rate and price fluctuations. Similar to issuer credit risk, the Funds may be exposed to counterparty credit risk, or the risk that an entity with which the Funds have unsettled or open transactions may fail to or be
| | | | | | |
| | | | | | | |
| | BLACKROCK FUNDS | | MARCH 31, 2012 | | 41 |
| | |
| | |
Notes to Financial Statements (continued) | | |
unable to perform on its commitments. The Funds manage counterparty credit risk by entering into transactions only with counterparties that they believe have the financial resources to honor their obligations and by monitoring the financial stability of those counterparties. Financial assets, which potentially expose the Funds to market, issuer and counterparty credit risks, consist principally of financial instruments and receivables due from counterparties. The extent of the Funds’ exposure to market, issuer and counterparty credit risks with respect to these financial assets is generally approximated by their value recorded in the Funds’ Statements of Assets and Liabilities, less any collateral held by the Funds.
As of March 31, 2012, Mid-Cap Growth Equity invested a significant portion of its assets in securities in the information technology sector. Changes in economic conditions affecting the information technology
sector would have a greater impact on Mid-Cap Growth Equity and could affect the value, income and/or liquidity of positions in such securities.
As of March 31, 2012, Mid-Cap Value Equity invested a significant portion of its assets in securities in the financials sector. Changes in economic conditions affecting the financials sector would have a greater impact on Mid-Cap Value Equity and could affect the value, income and/or liquidity of positions in such securities.
As of March 31, 2012, Small Cap Growth Equity invested a significant portion of its assets in securities in the information technology and health care sectors. Changes in economic conditions affecting the information technology and health care sectors would have a greater impact on Small Cap Growth Equity and could affect the value, income and/or liquidity of positions in such securities.
8. Capital Shares Transactions:
| | | | | | | | | | | | | | | | | | |
| Transactions in capital shares for each class were as follows: | | Six Months Ended March 31, 2012 | | | | | Year Ended September 30, 2011 | |
| Mid-Cap Growth Equity | | Shares | | | Amount | | | | | Shares | | | Amount | |
Institutional | | | | | | | | | | | | | | | | | | |
| | | | | |
Shares issued in the reorganization1 | | | – | | | | – | | | | | | 334,572 | | | $ | 3,832,627 | |
Shares sold | | | 235,098 | | | $ | 3,103,853 | | | | | | 168,193 | | | | 2,166,903 | |
Shares redeemed | | | (349,829 | ) | | | (4,439,974 | ) | | | | | (943,989 | ) | | | (11,724,048 | ) |
Net decrease | | | (114,731 | ) | | $ | (1,336,121 | ) | | | | | (441,224 | ) | | $ | (5,724,518 | ) |
| | | | | | | | | | | | | | | | | | |
Service | | | | | | | | | | | | | | | | | | |
| | | | | |
Shares sold | | | 29,221 | | | $ | 360,475 | | | | | | 53,858 | | | $ | 659,568 | |
Shares redeemed | | | (8,836 | ) | | | (112,200 | ) | | | | | (16,917 | ) | | | (201,967 | ) |
Net increase | | | 20,385 | | | $ | 248,275 | | | | | | 36,941 | | | $ | 457,601 | |
| | | | | | | | | | | | | | | | | | |
Investor A | | | | | | | | | | | | | | | | | | |
| | | | | |
Shares issued in the reorganization1 | | | – | | | | – | | | | | | 7,278,873 | | | $ | 76,262,939 | |
Shares sold and automatic conversion of shares | | | 1,030,470 | | | $ | 12,481,642 | | | | | | 821,451 | | | | 9,555,528 | |
Shares redeemed | | | (2,469,157 | ) | | | (29,057,610 | ) | | | | | (2,738,897 | ) | | | (31,713,217 | ) |
Net increase (decrease) | | | (1,438,687 | ) | | $ | (16,575,968 | ) | | | | | 5,361,427 | | | $ | 54,105,250 | |
| | | | | | | | | | | | | | | | | | |
Investor B | | | | | | | | | | | | | | | | | | |
| | | | | |
Shares issued in the reorganization1 | | | – | | | | – | | | | | | 301,369 | | | $ | 2,763,072 | |
Shares sold | | | 3,381 | | | $ | 35,309 | | | | | | 4,104 | | | | 42,022 | |
Shares redeemed and automatic conversion of shares | | | (240,797 | ) | | | (2,485,158 | ) | | | | | (356,866 | ) | | | (3,666,901 | ) |
Net decrease | | | (237,416 | ) | | $ | (2,449,849 | ) | | | | | (51,393 | ) | | $ | (861,807 | ) |
| | | | | | | | | | | | | | | | | | |
Investor C | | | | | | | | | | | | | | | | | | |
| | | | | |
Shares issued in the reorganization1 | | | – | | | | – | | | | | | 781,046 | | | $ | 7,166,019 | |
Shares sold | | | 121,850 | | | $ | 1,250,736 | | | | | | 143,308 | | | | 1,461,945 | |
Shares redeemed | | | (177,035 | ) | | | (1,839,072 | ) | | | | | (443,743 | ) | | | (4,626,917 | ) |
Net increase (decrease) | | | (55,185 | ) | | $ | (588,336 | ) | | | | | 480,611 | | | $ | 4,001,047 | |
| 1See Note 1 regarding the reorganization. | | | | | | | | | | | | | | | | | | |
| | | | | | |
| | | | | | | |
| 42 | | BLACKROCK FUNDS | | MARCH 31, 2012 | | |
| | |
| | |
Notes to Financial Statements (continued) | | |
| | | | | | | | | | | | | | | | | | |
| | | Six Months Ended March 31, 2012 | | | | | Year Ended September 30, 2011 | |
| Mid-Cap Growth Equity (concluded) | | Shares | | | Amount | | | | | Shares | | | Amount | |
Class R | | | | | | | | | | | | | | | | | | |
Shares issued in the reorganization1 | | | – | | | | – | | | | | | 222,297 | | | $ | 2,324,050 | |
Shares sold | | | 54,552 | | | $ | 647,989 | | | | | | 197,272 | | | | 2,255,026 | |
Shares redeemed | | | (107,860 | ) | | | (1,250,814 | ) | | | | | (307,256 | ) | | | (3,617,723 | ) |
Net increase (decrease) | | | (53,308 | ) | | $ | (602,825 | ) | | | | | 112,313 | | | $ | 961,353 | |
| | | | | |
| | | | | | | | | | | | | | | | | | | |
Total net increase (decrease) | | | (1,878,942 | ) | | $ | (21,304,824 | ) | | | | | 5,498,675 | | | $ | 52,938,926 | |
| | | | | |
Mid-Cap Value Equity | | | | | | | | | | | | | | | | | | |
Institutional | | | | | | | | | | | | | | | | | | |
Shares sold | | | 2,589,413 | | | $ | 29,411,551 | | | | | | 6,509,862 | | | $ | 77,245,215 | |
Shares issued in reinvestment of dividends | | | 137,628 | | | | 1,496,015 | | | | | | 128,801 | | | | 1,469,614 | |
Shares redeemed | | | (7,168,059 | ) | | | (80,607,872 | ) | | | | | (6,077,324 | ) | | | (72,257,371 | ) |
Net increase (decrease) | | | (4,441,018 | ) | | $ | (49,700,306 | ) | | | | | 561,339 | | | $ | 6,457,458 | |
| | | | | |
| | | | | | | | | | | | | | | | | | |
Service | | | | | | | | | | | | | | | | | | |
Shares sold | | | 19,050 | | | $ | 212,619 | | | | | $ | 52,134 | | | $ | 599,387 | |
Shares issued in reinvestment of dividends | | | 671 | | | | 7,167 | | | | | | 312 | | | | 3,505 | |
Shares redeemed | | | (11,819 | ) | | | (131,537 | ) | | | | | (17,365 | ) | | | (202,577 | ) |
Net increase | | | 7,902 | | | $ | 88,249 | | | | | | 35,081 | | | $ | 400,315 | |
| | | | | |
| | | | | | | | | | | | | | | | | | |
Investor A | | | | | | | | | | | | | | | | | | |
Shares sold and automatic conversion of shares | | | 3,054,030 | | | $ | 33,875,661 | | | | | | 8,354,777 | | | $ | 95,689,822 | |
Shares issued in reinvestment of dividends | | | 341,640 | | | | 3,604,318 | | | | | | 448,160 | | | | 4,965,604 | |
Shares redeemed | | | (8,448,699 | ) | | | (93,614,556 | ) | | | | | (18,072,495 | ) | | | (206,259,093 | ) |
Net decrease | | | (5,053,029 | ) | | $ | (56,134,577 | ) | | | | | (9,269,558 | ) | | $ | (105,603,667 | ) |
| | | | | |
| | | | | | | | | | | | | | | | | | | |
Investor B | | | | | | | | | | | | | | | | | | |
Shares sold | | | 8,019 | | | $ | 80,976 | | | | | | 26,595 | | | $ | 270,530 | |
Shares issued in reinvestment of dividends and distributions | | | – | | | | – | | | | | | 3,305 | | | | 33,308 | |
Shares redeemed and automatic conversion of shares | | | (844,759 | ) | | | (8,465,429 | ) | | | | | (1,542,686 | ) | | | (15,892,141 | ) |
Net decrease | | | (836,740 | ) | | $ | (8,384,453 | ) | | | | | (1,512,786 | ) | | $ | (15,588,303 | ) |
| | | | | |
| | | | | | | | | | | | | | | | | | |
Investor C | | | | | | | | | | | | | | | | | | |
Shares sold | | | 363,737 | | | $ | 3,654,168 | | | | | | 1,304,791 | | | $ | 13,523,538 | |
Shares issued in reinvestment of dividends and distributions | | | – | | | | – | | | | | | 25,130 | | | | 252,303 | |
Shares redeemed | | | (1,588,399 | ) | | | (15,858,266 | ) | | | | | (4,328,420 | ) | | | (44,713,990 | ) |
Net decrease | | | (1,224,662 | ) | | $ | (12,204,098 | ) | | | | | (2,998,499 | ) | | $ | (30,938,149 | ) |
| 1 | See Note 1 regarding the reorganization. |
| | | | | | |
| | | | | | | |
| | BLACKROCK FUNDS | | MARCH 31, 2012 | | 43 |
| | |
| | |
Notes to Financial Statements (concluded) | | |
| | | | | | | | | | | | | | | | | | |
| | | Six Months Ended March 31, 2012 | | | | | Year Ended September 30, 2011 | |
| Mid-Cap Value Equity (concluded) | | Shares | | | Amount | | | | | Shares | | | Amount | |
Class R | | | | | | | | | | | | | | | | | | |
Shares sold | | | 11,593 | | | $ | 133,615 | | | | | | 41,377 | | | $ | 503,720 | |
Shares issued in reinvestment of dividends | | | 248 | | | | 2,690 | | | | | | 499 | | | | 5,689 | |
Shares redeemed | | | (10,609 | ) | | | (126,788 | ) | | | | | (27,177 | ) | | | (317,648 | ) |
Net increase | | | 1,232 | | | $ | 9,517 | | | | | | 14,699 | | | $ | 191,761 | |
| | | | | |
| | | | | | | | | | | | | | | | | | | |
Total net decrease | | | (11,546,315 | ) | | $ | (126,325,668 | ) | | | | | (13,169,724 | ) | | $ | (145,080,585 | ) |
Small Cap Growth Equity | | | | | | | | | | | | | | | | | | |
Institutional | | | | | | | | | | | | | | | | | | |
Shares sold | | | 6,925,459 | | | $ | 170,836,933 | | | | | | 18,551,956 | | | $ | 439,584,953 | |
Shares issued in reinvestment of distributions | | | 1,043,022 | | | | 24,469,310 | | | | | | – | | | | – | |
Shares redeemed | | | (14,716,127 | ) | | | (360,698,589 | ) | | | | | (11,662,254 | ) | | | (278,499,643 | ) |
Net increase (decrease) | | | (6,747,646 | ) | | $ | (165,392,346 | ) | | | | | 6,889,702 | | | $ | 161,085,310 | |
| | | | | |
| | | | | | | | | | | | | | | | | | |
Service | | | | | | | | | | | | | | | | | | |
Shares sold | | | 268,737 | | | $ | 6,185,778 | | | | | | 471,352 | | | $ | 10,611,161 | |
Shares issued in reinvestment of distributions | | | 28,033 | | | | 618,413 | | | | | | – | | | | – | |
Shares redeemed | | | (365,263 | ) | | | (8,320,227 | ) | | | | | (1,704,268 | ) | | | (35,739,318 | ) |
Net decrease | | | (68,493 | ) | | $ | (1,516,036 | ) | | | | | (1,232,916 | ) | | $ | (25,128,157 | ) |
| | | | | |
| | | | | | | | | | | | | | | | | | |
Investor A | | | | | | | | | | | | | | | | | | |
Shares sold and automatic conversion of shares | | | 6,306,514 | | | $ | 137,479,548 | | | | | | 3,960,009 | | | $ | 86,832,105 | |
Shares issued in reinvestment of distributions | | | 338,833 | | | | 7,223,935 | | | | | | – | | | | – | |
Shares redeemed | | | (3,885,237 | ) | | | (86,479,180 | ) | | | | | (5,506,578 | ) | | | (120,110,671 | ) |
Net increase (decrease) | | | 2,760,110 | | | $ | 58,224,303 | | | | | | (1,546,569 | ) | | $ | (33,278,566 | ) |
| | | | | |
| | | | | | | | | | | | | | | | | | |
Investor B | | | | | | | | | | | | | | | | | | |
Shares sold | | | 3,607 | | | $ | 66,726 | | | | | | 16,430 | | | $ | 317,768 | |
Shares issued in reinvestment of distributions | | | 3,114 | | | | 56,765 | | | | | | – | | | | – | |
Shares redeemed and automatic conversion of shares | | | (19,427 | ) | | | (362,309 | ) | | | | | (55,590 | ) | | | (1,050,685 | ) |
Net decrease | | | (12,706 | ) | | $ | (238,818 | ) | | | | | (39,160 | ) | | $ | (732,917 | ) |
| | | | | |
| | | | | | | | | | | | | | | | | | |
Investor C | | | | | | | | | | | | | | | | | | |
Shares sold | | | 138,958 | | | $ | 2,716,636 | | | | | | 367,663 | | | $ | 6,971,644 | |
Shares issued in reinvestment of distributions | | | 45,987 | | | | 837,427 | | | | | | – | | | | – | |
Shares redeemed | | | (236,026 | ) | | | (4,446,443 | ) | | | | | (896,784 | ) | | | (17,118,814 | ) |
Net decrease | | | (51,081 | ) | | $ | (892,380 | ) | | | | | (529,121 | ) | | $ | (10,147,170 | ) |
| | | | | | | | | | | | | | | | | | |
Total net increase (decrease) | | | (4,119,816 | ) | | $ | (109,815,277 | ) | | | | | 3,541,936 | | | $ | 91,798,500 | |
Prior to April 1, 2011, there was a 2% redemption fee on shares of Small Cap Growth Equity redeemed or exchanged that have been held 30 days or less. The redemption fees were collected and retained by the Fund for the benefit of the remaining shareholders. The redemption fees were recorded as a credit to paid-in capital. Effective April 1, 2011, the redemption fee was terminated and is no longer charged by the Fund.
9. Subsequent Events:
Management has evaluated the impact of all subsequent events on the Funds through the date the financial statements were issued and has determined that there were no subsequent events requiring adjustment or additional disclosure in the financial statements.
| | | | | | |
| | | | | | | |
| 44 | | BLACKROCK FUNDS | | MARCH 31, 2012 | | |
Ronald W. Forbes, Co-Chairman of the Board and Trustee
Rodney D. Johnson, Co-Chairman of the Board and Trustee
Paul L. Audet, Trustee
David O. Beim, Trustee
Henry Gabbay, Trustee
Dr. Matina S. Horner, Trustee
Herbert I. London, Trustee
Cynthia A. Montgomery, Trustee
Joseph P. Platt, Trustee
Robert C. Robb, Jr., Trustee
Toby Rosenblatt, Trustee
Kenneth L. Urish, Trustee
Frederick W. Winter, Trustee
John M. Perlowski, President and Chief Executive Officer
Richard Hoerner, CFA, Vice President
Brendan Kyne, Vice President
Simon Mendelson, Vice President
Christopher Stavrakos, CFA, Vice President
Neal Andrews, Chief Financial Officer
Jay Fife, Treasurer
Brian Kindelan, Chief Compliance Officer and Anti-Money Laundering Officer
Ira P. Shapiro, Secretary
Investment Advisor and Co-Administrator
BlackRock Advisors, LLC
Wilmington, DE 19809
Accounting Agent, Co-Administrator and Transfer Agent
BNY Mellon Investment Servicing (US) Inc.
Wilmington, DE 19809
Custodian
The Bank of New York Mellon
New York, NY 10286
Distributor
BlackRock Investments, LLC
New York, NY 10022
Legal Counsel
Sidley Austin LLP
New York, NY 10019
Independent Registered Public Accounting Firm
Deloitte & Touche LLP
Philadelphia, PA 19103
Address of the Trust
100 Bellevue Parkway
Wilmington, DE 19809
| | | | | | |
| | | | | | | |
| | BLACKROCK FUNDS | | MARCH 31, 2012 | | 45 |
Electronic Delivery
Electronic copies of most financial reports and prospectuses are available on the Funds’ website or shareholders can sign up for e-mail notifications of quarterly statements, annual and semi-annual reports and prospectuses by enrolling in the Funds’ electronic delivery program.
To enroll:
Shareholders Who Hold Accounts with Investment Advisors, Banks or Brokerages:
Please contact your financial advisor. Please note that not all investment advisors, banks or brokerages may offer this service.
Shareholders Who Hold Accounts Directly With BlackRock:
| 1) | Access the BlackRock website at http://www.blackrock.com/ edelivery |
| 2) | Select “eDelivery” under the “More Information” section |
Householding
The Funds will mail only one copy of shareholder documents, including prospectuses, annual and semi-annual reports and proxy statements, to shareholders with multiple accounts at the same address. This practice is commonly called “householding” and is intended to reduce expenses and eliminate duplicate mailings of shareholder documents. Mailings of your shareholder documents may be householded indefinitely unless you instruct us otherwise. If you do not want the mailing of these documents to be combined with those for other members of your household, please contact the Funds at (800) 441-7762.
Availability of Quarterly Schedule of Investments
The Funds file their complete schedule of portfolio holdings with the SEC for the first and third quarters of each fiscal year on Form N-Q. The Funds’ Forms N-Q are available on the SEC’s website at
http:// www.sec.gov and may also be reviewed and copied at the SEC’s Public Reference Room in Washington, D.C. Information on how to access documents on the SEC’s website without charge may be obtained by calling (800) SEC-0330. The Funds’ Forms N-Q may also be obtained upon request and without charge by calling (800) 441-7762.
Availability of Proxy Voting Policies and Procedures
A description of the policies and procedures that the Funds use to determine how to vote proxies relating to portfolio securities is available (1) without charge, upon request, by calling (800) 441-7762; (2) at http://www.blackrock.com; and (3) on the SEC’s website at http:// www.sec.gov.
Availability of Proxy Voting Record
Information about how the Funds voted proxies relating to securities held in the Funds’ portfolios during the most recent 12-month period ended June 30 is available upon request and without charge (1) at http://www.blackrock.com or by calling (800) 441-7762 and (2) on the SEC’s website at http://www.sec.gov.
Account Information
Call us at (800) 441-7762 from 8:00 AM to 6:00 PM EST on any business day to get information about your account balances, recent transactions and share prices. You can also reach us on the Web at
http:// www.blackrock.com/funds.
Automatic Investment Plans
Investor Class shareholders who want to invest regularly can arrange to have $50 or more automatically deducted from their checking or savings account and invested in any of the BlackRock funds.
Systematic Withdrawal Plan
Investor Class shareholders can establish a systematic withdrawal plan and receive periodic payments of $50 or more from their BlackRock funds, as long as their account balance is at least $10,000.
Retirement Plans
Shareholders may make investments in conjunction with Traditional, Rollover, Roth, Coverdell, Simple IRAs, SEP IRAs and 403(b) Plans.
| | | | | | |
| | | | | | | |
| 46 | | BLACKROCK FUNDS | | MARCH 31, 2012 | | |
| | |
| | |
Additional Information (concluded) | | |
|
BlackRock Privacy Principles |
BlackRock is committed to maintaining the privacy of its current and former fund investors and individual clients (collectively, “Clients”) and to safeguarding their non-public personal information. The following information is provided to help you understand what personal information BlackRock collects, how we protect that information and why in certain cases we share such information with select parties.
If you are located in a jurisdiction where specific laws, rules or regulations require BlackRock to provide you with additional or different privacy-related rights beyond what is set forth below, then BlackRock will comply with those specific laws, rules or regulations.
BlackRock obtains or verifies personal non-public information from and about you from different sources, including the following: (i) information we receive from you or, if applicable, your financial intermediary, on applications, forms or other documents; (ii) information about your transactions with us, our affiliates, or others; (iii) information we receive from a consumer reporting agency; and (iv) from visits to our websites.
BlackRock does not sell or disclose to non-affiliated third parties any non-public personal information about its Clients, except as permitted by law or as is necessary to respond to regulatory requests or to service Client accounts. These non-affiliated third parties are required to protect the confidentiality and security of this information and to use it only for its intended purpose.
We may share information with our affiliates to service your account or to provide you with information about other BlackRock products or services that may be of interest to you. In addition, BlackRock restricts access to non-public personal information about its Clients to those BlackRock employees with a legitimate business need for the information. BlackRock maintains physical, electronic and procedural safeguards that are designed to protect the non-public personal information of its Clients, including procedures relating to the proper storage and disposal of such information.
| | | | | | |
| | | | | | | |
| | BLACKROCK FUNDS | | MARCH 31, 2012 | | 47 |
| | |
| | |
A World-Class Mutual Fund Family | | |
BlackRock offers a diverse lineup of open-end mutual funds crossing all investment styles and managed by experts in equity, fixed income and tax-exempt investing.
| | | | |
Equity Funds | | | | |
| | |
BlackRock ACWI ex-US Index Fund | | BlackRock Global Dynamic Equity Fund | | BlackRock Mid-Cap Value Equity Portfolio |
BlackRock All-Cap Energy & Resources Portfolio | | BlackRock Global Opportunities Portfolio | | BlackRock Mid Cap Value Opportunities Fund |
BlackRock Balanced Capital Fund† | | BlackRock Global SmallCap Fund | | BlackRock Natural Resources Trust |
BlackRock Basic Value Fund | | BlackRock Health Sciences Opportunities Portfolio | | BlackRock Pacific Fund |
BlackRock Capital Appreciation Fund | | BlackRock Index Equity Portfolio | | BlackRock Russell 1000 Index Fund |
BlackRock China Fund | | BlackRock India Fund | | BlackRock Science & Technology |
BlackRock Commodity Strategies Fund | | BlackRock International Fund | | Opportunities Portfolio |
BlackRock Emerging Markets Fund | | BlackRock International Index Fund | | BlackRock Small Cap Growth Equity Portfolio |
BlackRock Emerging Markets Long/Short | | BlackRock International Opportunities Portfolio | | BlackRock Small Cap Growth Fund II |
Equity Fund | | BlackRock Large Cap Core Fund | | BlackRock Small Cap Index Fund |
BlackRock Energy & Resources Portfolio | | BlackRock Large Cap Core Plus Fund | | BlackRock S&P 500 Index Fund |
BlackRock Equity Dividend Fund | | BlackRock Large Cap Growth Fund | | BlackRock S&P 500 Stock Fund |
BlackRock EuroFund | | BlackRock Large Cap Value Fund | | BlackRock U.S. Opportunities Portfolio |
BlackRock Focus Growth Fund | | BlackRock Latin America Fund | | BlackRock Value Opportunities Fund |
BlackRock Global Allocation Fund | | BlackRock Managed Volatility Portfolio† | | BlackRock World Gold Fund |
BlackRock Global Dividend Income Portfolio† | | BlackRock Mid-Cap Growth Equity Portfolio | | |
| | |
| | | | |
Fixed Income Funds | | | | |
| | |
BlackRock Bond Index Fund | | BlackRock High Yield Bond Portfolio | | BlackRock Strategic Income |
BlackRock Core Bond Portfolio | | BlackRock Inflation Protected Bond Portfolio | | Opportunities Portfolio |
BlackRock CoreAlpha Bond Fund | | BlackRock International Bond Portfolio | | BlackRock Total Return Fund |
BlackRock Emerging Market Debt Portfolio | | BlackRock Long Duration Bond Portfolio | | BlackRock US Government Bond Portfolio |
BlackRock Floating Rate Income Portfolio | | BlackRock Low Duration Bond Portfolio | | BlackRock US Mortgage Portfolio |
BlackRock Global Long/Short Credit Fund | | BlackRock Multi-Asset Income Portfolio† | | BlackRock World Income Fund |
BlackRock GNMA Portfolio | | BlackRock Multi-Sector Bond Portfolio | | |
| | |
| | | | |
Municipal Bond Funds | | | | |
| | |
BlackRock California Municipal Bond Fund | | BlackRock National Municipal Fund | | BlackRock Pennsylvania Municipal Bond Fund |
BlackRock High Yield Municipal Fund | | BlackRock New Jersey Municipal Bond Fund | | BlackRock Short-Term Municipal Fund |
BlackRock Intermediate Municipal Fund | | BlackRock New York Municipal Bond Fund | | |
| | | | | | | | | | | | | | | | | | | | |
Target Risk & Target Date Funds† | | | | | | | | | | | | | | | | | | | | |
| | | | | | |
BlackRock Prepared Portfolios | | | BlackRock Lifecycle | | | | Prepared Portfolios | | | | LifePath Portfolios | | | | | | LifePath Index Portfolios | | | |
Conservative Prepared Portfolio | | | 2015 | | | | 2035 | | | | Retirement | | | 2040 | | | Retirement | | | 2040 |
Moderate Prepared Portfolio | | | 2020 | | | | 2040 | | | | 2020 | | | 2045 | | | 2020 | | | 2045 |
Growth Prepared Portfolio | | | 2025 | | | | 2045 | | | | 2025 | | | 2050 | | | 2025 | | | 2050 |
Aggressive Growth Prepared Portfolio | | | 2030 | | | | 2050 | | | | 2030 | | | 2055 | | | 2030 | | | 2055 |
| | | | | | | | | | | 2035 | | | | | | 2035 | | | |
† Mixed asset fund.
BlackRock mutual funds are currently distributed by BlackRock Investments, LLC. You should consider the investment objectives, risks, charges and expenses of the funds under consideration carefully before investing. Each fund’s prospectus contains this and other information and is available at www.blackrock.com or by calling (800) 441-7762 or from your financial advisor. The prospectus should be read carefully before investing.
| | | | | | |
| | | | | | | |
| 48 | | BLACKROCK FUNDS | | MARCH 31, 2012 | | |
[THIS PAGE INTENTIONALLY LEFT BLANK.]
[THIS PAGE INTENTIONALLY LEFT BLANK.]
[THIS PAGE INTENTIONALLY LEFT BLANK.]
This report is transmitted to shareholders only. It is not authorized for use as an offer of sale or a solicitation of an offer to buy shares of the Funds unless accompanied or preceded by that Fund’s current prospectus. Past performance results shown in this report should not be considered a representation of future performance. Investment returns and principal value of shares will fluctuate so that shares, when redeemed, may be worth more or less than their original cost. Statements and other information herein are as dated and are subject to change.
EUITY3-3/12-SAR 
| | |

| | March 31, 2012 |
|
Semi-Annual Report (Unaudited) |
BlackRock FundsSM
| | u | BlackRock Global Opportunities Portfolio |
| | u | BlackRock Health Sciences Opportunities Portfolio |
| | u | BlackRock International Opportunities Portfolio |
| | u | BlackRock Science & Technology Opportunities Portfolio |
| | u | BlackRock U.S. Opportunities Portfolio |
| | |
Not FDIC Insured ¡ No Bank Guarantee ¡ May Lose Value | | |
| | | | |
| | | | |
2 | | BLACKROCK FUNDS | | MARCH 31, 2012 |
Dear Shareholder
Twelve months ago, risk assets were charging forward, only to be met with a sharp reversal in May 2011 when escalating political strife in Greece rekindled fears about sovereign debt problems spreading across Europe. Concurrently, global economic indicators signaled that the recovery had slowed. Confidence was further shaken by the prolonged debt ceiling debate in Washington, DC. On August 5, 2011, Standard & Poor’s made history by downgrading the US government’s credit rating, and turmoil erupted in financial markets around the world. Extraordinary levels of volatility persisted in the months that followed as the European debt crisis intensified. Macro news flow became a greater influence on trading decisions than the fundamentals of the securities traded, resulting in high correlations between asset prices. By the end of the third quarter, equity markets had fallen nearly 20% from their April peak while safe-haven assets such as US Treasuries and gold had rallied to historic highs.
October brought enough positive economic data to assuage fears of a global double-dip recession. Additionally, European leaders began to show progress toward stemming the region’s debt crisis. Investors began to reenter the markets, putting risk assets on the road to recovery. Improving investor sentiment carried over into the first several months of 2012. Debt problems in Europe stabilized as policymakers secured a bailout plan for Greece and completed the nation’s debt restructuring without significant market disruptions. While concerns about slowing growth in China and a European recession weighed on the outlook for the global economy, an acceleration of the US recovery lifted sentiment. Several consecutive months of stronger jobs data signaled solid improvement in the US labor market, a pivotal factor for economic growth. Meanwhile, the European Central Bank revived financial markets with additional liquidity through its long-term refinancing operations. The improving market conditions and generally better-than-expected economic news lured investors still holding cash on the sidelines back to risk assets. Stocks, commodities and high yield bonds rallied through the first two months of the year while rising Treasury yields pressured higher-quality fixed income assets. The rally softened in late March, however, as concerns about slowing growth in China were refueled by negative signals from the world’s second-largest economy. Additionally, concerns over the European debt crisis resurfaced given uncertainty around policies for sovereign debt financing in peripheral countries and rising yields in Portugal and Spain.
Thanks in large part to an exceptionally strong first quarter of 2012, risk assets, including equities and high yield bonds, posted solid returns for the 6-month period ended March 31, 2012. On a 12-month basis, US large-cap stocks and high yield bonds delivered positive results, while small-cap stocks finished in slightly negative territory. International and emerging markets, which experienced significant downturns in 2011, lagged the broader rebound. Fixed income securities experienced mixed results, given recent volatility in yields. US Treasury bonds performed particularly well for the 12-month period; however, an early-2012 sell-off resulted in a negative return for the 6-month period. Municipal bonds staged a solid advance over the past year. Continued low short-term interest rates kept yields on money market securities near their all-time lows.
While markets have improved in recent months, considerable headwinds remain. Europe faces a prolonged recession and the financial situations in Italy, Portugal and Spain remain worrisome. Higher oil and gasoline prices along with slowing growth in China and other emerging-market countries weigh heavily on the future of the global economy. But, we believe that with these challenges come opportunities. We remain committed to working with you and your financial professional to identify actionable ideas for your portfolio. We encourage you to visit www.blackrock.com/newworld for more information.
Sincerely,

Rob Kapito
President, BlackRock Advisors, LLC

“While markets have improved in recent months, considerable headwinds remain.”
Rob Kapito
President, BlackRock Advisors, LLC
Total Returns as of March 31, 2012
| | | | | | | | | | |
| | | 6-month | | 12-month |
US large cap equities (S&P 500® Index) | | | | 25.89 | % | | | | 8.54 | % |
US small cap equities (Russell 2000® Index) | | | | 29.83 | | | | | (0.18 | ) |
International equities (MSCI Europe, Australasia, Far East Index) | | | | 14.56 | | | | | (5.77 | ) |
Emerging market equities (MSCI Emerging Markets Index) | | | | 19.12 | | | | | (8.81 | ) |
3-month Treasury bill (BofA Merrill Lynch 3-Month Treasury Bill Index) | | | | 0.01 | | | | | 0.06 | |
US Treasury securities (BofA Merrill Lynch 10- Year US Treasury Index) | | | | (1.05 | ) | | | | 14.92 | |
US investment grade bonds (Barclays US Aggregate Bond Index) | | | | 1.43 | | | | | 7.71 | |
Tax-exempt municipal bonds (S&P Municipal Bond Index) | | | | 4.16 | | | | | 12.56 | |
US high yield bonds (Barclays US Corporate High Yield 2% Issuer Capped Index) | | | | 12.17 | | | | | 6.43 | |
Past performance is no guarantee of future results. Index performance is shown for illustrative purposes only. You cannot invest directly in an index.
| | | | | | |
| | | | | | |
| | THIS PAGE NOT PART OF YOUR FUND REPORT | | | | 3 |
| | | | |
Fund Summary as of March 31, 2012 | | | BlackRock Global Opportunities Portfolio | |
Investment Objective | | | | |
|
BlackRock Global Opportunities Portfolio’s (the “Fund”) investment objective is to provide long-term capital appreciation. |
Portfolio Management Commentary |
How did the Fund perform?
| — | | For the six-month period ended March 31, 2012, the Fund posted a positive double-digit return, but underperformed its benchmark, the MSCI All Country World Index (ACWI). |
What factors influenced performance?
| — | | Relative to the benchmark index, the Fund benefited most from stock selection in the industrials sector. The Fund’s holdings in industrial machinery delivered strong returns, more than doubling the returns on the segment as represented in the benchmark index, due to the Fund’s bias toward US companies. Stock selection within information technology (“IT”) was another significant source of positive performance, particularly within technology hardware & equipment, where F5 Networks, Inc. was a notable contributor. Positioning within financials, predominately in regional banks, also had a positive impact. |
| | Global central banks provided financial markets with liquidity during the six-month period and investors increased their appetite for risk. In this environment, the more economically sensitive sectors, including IT, consumer discretionary and industrials, outperformed the traditionally defensive consumer staples, telecommunication services, health care and utilities segments. Relative to the benchmark index, the Fund’s underweight in industrials and overweight in consumer staples detracted |
| | | from returns. Other overweight positions that did not perform well during the period include US-based electric utilities, wireless telecom providers and select companies within the integrated oil & gas industry. However, the Fund continues to maintain these positions as longer-term investments. |
Describe recent portfolio activity.
| — | | During the six-month period, the Fund added to its exposure in the industrials sector by closing its underweight position in capital goods, and increased its weighting in consumer discretionary, particularly in the retail space. These additions were offset by reductions in consumer staples and integrated telecommunication services. |
Describe portfolio positioning at period end.
| — | | At period end, the Fund’s positioning reflected several key characteristics. For one, given the number of headwinds faced by equity markets and the potential severity of the risks they impose, the Fund’s holdings were diversified in a manner that reduces the Fund’s vulnerability to any particular development or macro event. Additionally, the Fund’s holdings did not reflect an intentional bias toward any particular sector or security characteristic. The Fund’s overall portfolio risk was derived more from the individual security risks associated with its holdings than from systematic risks (i.e., risks that impact an entire market or market segment). |
The views expressed reflect the opinions of BlackRock as of the date of this report and are subject to change based on changes in market, economic or other conditions. These views are not intended to be a forecast of future events and are no guarantee of future results.
| | | | | |
| Ten Largest Holdings | | Percent of
Long-Term
Investments |
Exxon Mobil Corp. | | | | 2 | % |
Apple, Inc. | | | | 2 | |
JPMorgan Chase & Co. | | | | 1 | |
British American Tobacco Plc | | | | 1 | |
PepsiCo, Inc. | | | | 1 | |
Reynolds American, Inc. | | | | 1 | |
Royal Dutch Shell Plc, A Shares | | | | 1 | |
Google, Inc., Class A | | | | 1 | |
Stanley Black & Decker, Inc. | | | | 1 | |
Raytheon Co. | | | | 1 | |
| | | | | |
| Geographic Allocation | | Percent of Long-Term
Investments |
United States | | | | 56 | % |
United Kingdom | | | | 7 | |
Japan | | | | 5 | |
Germany | | | | 4 | |
France | | | | 3 | |
Canada | | | | 3 | |
Switzerland | | | | 2 | |
Netherlands | | | | 2 | |
South Korea | | | | 2 | |
Hong Kong | | | | 2 | |
Other1 | | | | 14 | |
| | 1 | Other includes a 1% or less investment in each of the following countries: China, Ireland, Brazil, Australia, Mexico, Italy, Belgium, Singapore, Norway, Taiwan, South Africa, Argentina, India, Indonesia, Israel, Sweden, Spain and Luxembourg. |
| | | | |
| | | | |
4 | | BLACKROCK FUNDS | | MARCH 31, 2012 |
BlackRock Global Opportunities Portfolio
|
Total Return Based on a $10,000 Investment |
| | |
| | 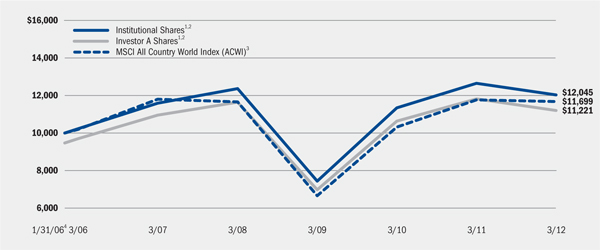 |
| |
| | 1 Assuming maximum sales charges, if any, transaction costs and other operating expenses, including investment advisory fees. Institutional Shares do not have a sales charge. 2 The Fund will invest, under normal market conditions, at least 75% of its total assets in global equity securities of any market capitalization, selected for their with above-average return potential. The Fund may invest up to 25% of its total assets in stocks of issuers in emerging market countries. The Fund may also invest up to 25% of its total assets in global fixed income securities, including emerging market debt. 3 This unmanaged market capitalization-weighted index is made up of equities from 45 countries, including the United States. 4 Commencement of operations. |
|
Performance Summary for the Period Ended March 31, 2012 |
| | | | | | | | | | | | | | | | | | | | | | | | | | | | | | | | | | | |
| | | | | Average Annual Total Returns5 |
| | | | | 1 Year | | 5 Years | | Since Inception6 |
| | | 6-Month
Total Returns | | w/o sales
charge | | w/sales
charge | | w/o sales
charge | | w/sales
charge | | w/o sales
charge | | w/sales
charge |
Institutional | | | | 19.12 | % | | | | (4.95 | )% | | | | N/A | | | | | 0.74 | % | | | | N/A | | | | | 3.06 | % | | | | N/A | |
Investor A | | | | 19.06 | | | | | (5.21 | ) | | | | (10.15 | )% | | | | 0.45 | | | | | (0.63 | )% | | | | 2.78 | | | | | 1.89 | % |
Investor B | | | | 18.46 | | | | | (6.02 | ) | | | | (10.25 | ) | | | | (0.29 | ) | | | | (0.67 | ) | | | | 2.03 | | | | | 2.03 | |
Investor C | | | | 18.54 | | | | | (5.95 | ) | | | | (6.90 | ) | | | | (0.32 | ) | | | | (0.32 | ) | | | | 2.01 | | | | | 2.01 | |
Class R | | | | 18.83 | | | | | (5.49 | ) | | | | N/A | | | | | 0.09 | | | | | N/A | | | | | 2.40 | | | | | N/A | |
MSCI All Country World Index (ACWI) | | | | 19.91 | | | | | (0.73 | ) | | | | N/A | | | | | (0.19 | ) | | | | N/A | | | | | 2.58 | | | | | N/A | |
| | 5 | Assuming maximum sales charges, if any. Average annual total returns with and without sales charges reflect reductions for distribution and service fees. See “About Fund Performance” on page 14 for a detailed description of share classes, including any related sales charges and fees. |
| | 6 | The Fund commenced operations on January 31, 2006. |
N/A - Not applicable as share class and index do not have a sales charge.
Past performance is not indicative of future results.
| | | | | | | | | | | | | | | | | | | | | | | | | | | | | | | | | | | |
| | | Actual | | Hypothetical8 | | |
| | | Beginning
Account Value
October 1, 2011 | | Ending
Account Value
March 31, 2012 | | Expenses Paid
During the Period7 | | Beginning
Account Value
October 1, 2011 | | Ending
Account Value
March 31, 2012 | | Expenses Paid During the Period7 | | Annualized Expense
Ratio |
Institutional | | | $ | 1,000.00 | | | | $ | 1,191.20 | | | | $ | 5.81 | | | | $ | 1,000.00 | | | | $ | 1,019.70 | | | | | $ 5.35 | | | | | 1.06 | % |
Investor A | | | $ | 1,000.00 | | | | $ | 1,190.60 | | | | $ | 7.28 | | | | $ | 1,000.00 | | | | $ | 1,018.35 | | | | | $ 6.71 | | | | | 1.33 | % |
Investor B | | | $ | 1,000.00 | | | | $ | 1,184.60 | | | | $ | 11.91 | | | | $ | 1,000.00 | | | | $ | 1,014.10 | | | | | $10.98 | | | | | 2.18 | % |
Investor C | | | $ | 1,000.00 | | | | $ | 1,185.40 | | | | $ | 11.69 | | | | $ | 1,000.00 | | | | $ | 1,014.30 | | | | | $10.78 | | | | | 2.14 | % |
Class R | | | $ | 1,000.00 | | | | $ | 1,188.30 | | | | $ | 9.25 | | | | $ | 1,000.00 | | | | $ | 1,016.55 | | | | | $ 8.52 | | | | | 1.69 | % |
| | 7 | For each class of the Fund, expenses are equal to the annualized expense ratio for the class, multiplied by the average account value over the period, multiplied by 183/366 (to reflect the one-half year period shown). |
| | 8 | Hypothetical 5% annual return before expenses is calculated by pro rating the number of days in the most recent fiscal half year divided by 366. |
See “Disclosure of Expenses” on page 15 for further information on how expenses were calculated.
| | | | | | |
| | | | | | |
| | BLACKROCK FUNDS | | MARCH 31, 2012 | | 5 |
| | |
| Fund Summary as of March 31, 2012 | | BlackRock Health Sciences Opportunities Portfolio |
| | |
Investment Objective | | |
BlackRock Health Sciences Opportunities Portfolio’s (the “Fund”) investment objective is to provide long-term growth of capital. | | |
Portfolio Management Commentary | | |
How did the Fund perform?
| — | | For the six-month period ended March 31, 2012, the Fund posted a positive double-digit return, but underperformed its benchmark, the Russell 3000® Health Care Index, and the broad-market S&P 500® Index. The following discussion of relative performance pertains to the Russell 3000® Health Care Index. |
What factors influenced performance?
| — | | On an industry basis, the key contributors to performance relative to the Russell 3000® Health Care Index were the Fund’s underweight allocation to pharmaceuticals and overweight in biotechnology. Stock selection in life sciences & tools and health care technology also had a positive impact. |
| — | | The primary detractor from the Fund’s performance relative to the benchmark index was the Fund’s overweight allocation and stock selection in the health care providers & services industry. More specifically, an underweight allocation and stock selection in both the health care services and managed health care segments hampered returns, as did an overweight and stock selection in health care distributors. Also having a negative impact was stock selection in the health care equipment & supplies and pharmaceuticals industries. |
Describe recent portfolio activity.
| — | | Early in the six-month period, the Fund continued to reduce its overweight position in health care equipment & supplies. The Fund reduced |
| | | its weighting in the health care providers & services industry, and slightly added to its biotechnology allocation. The Fund added exposure to pharmaceuticals while remaining materially underweight in the industry relative to the large allocation in the benchmark index. However, in the middle of the period, the Fund reduced its pharmaceuticals weighting given recent price appreciation in the space and a less favorable risk reward profile. The proceeds of these sales were invested in the health care equipment & supplies, health care providers & services and biotechnology industries. |
Describe portfolio positioning at period end.
| — | | Fund management views health care valuations as attractive, while noting that political uncertainty stemming from the Supreme Court’s review of the Health Care Reform legislation and the pending US presidential election continues to weigh on the sector. As of period end, the Fund continued to maintain a focus on innovative companies with products or services that address an unmet medical need or significantly reduce the costs associated with a current product or procedure. The Fund held limited exposure to companies that are reliant on government reimbursement or vulnerable to broad trends in health care utilization improvement. |
The views expressed reflect the opinions of BlackRock as of the date of this report and are subject to change based on changes in market, economic or other conditions. These views are not intended to be a forecast of future events and are no guarantee of future results.
| | | | | |
| Ten Largest Holdings | | Percent of Long-Term Investments |
UnitedHealth Group, Inc. | | | | 4 | % |
Johnson & Johnson | | | | 3 | |
Alexion Pharmaceuticals, Inc. | | | | 3 | |
Amgen, Inc. | | | | 3 | |
Pfizer, Inc. | | | | 3 | |
Biogen Idec, Inc. | | | | 3 | |
WellPoint, Inc. | | | | 3 | |
Allergan, Inc. | | | | 3 | |
Gilead Sciences, Inc. | | | | 3 | |
Merck & Co., Inc. | | | | 3 | |
| | | | | |
| Industry Allocation | | Percent of Long-Term Investments |
Pharmaceuticals | | | | 28 | % |
Biotechnology | | | | 24 | |
Health Care Providers & Services | | | | 21 | |
Health Care Equipment & Supplies | | | | 18 | |
Life Sciences Tools & Services | | | | 5 | |
Industrial Conglomerates | | | | 2 | |
Health Care Technology | | | | 1 | |
Food & Staples Retailing | | | | 1 | |
For Fund compliance purposes, the Fund’s industry classifications refer to any one or more of the industry sub-classifications used by one or more widely recognized market indexes or ratings group indexes, and/or as defined by Fund management. These definitions may not apply for purposes of this report, which may combine industry sub-classifications for reporting ease.
| | | | |
| | | | |
6 | | BLACKROCK FUNDS | | MARCH 31, 2012 |
BlackRock Health Sciences Opportunities Portfolio
|
Total Return Based on a $10,000 Investment |
| | |
| | 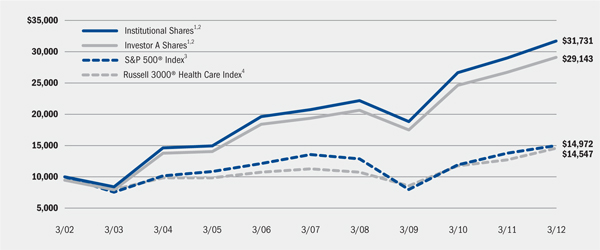 |
| |
| | 1 Assuming maximum sales charges, if any, transaction costs and other operating expenses, including investment advisory fees. Institutional Shares do not have a sales charge. 2 Under normal market conditions, the Fund invests at least 80% of its total assets in equity securities of companies in health sciences and related industries. 3 This unmanaged index covers 500 industrial, utility, transportation and financial companies of the US markets (mostly New York Stock Exchange (“NYSE”) issues) representing about 75% of NYSE market capitalization and 30% of NYSE issues. 4 An unmanaged index representative of companies involved in medical services or health care in the Russell 3000® Index, which is comprised of the 3,000 largest US companies as determined by total market capitalization. |
|
Performance Summary for the Period Ended March 31, 2012 |
| | | | | | | | | | | | | | | | | | | | | | | | | | | | | | | | | | | |
| | | | | Average Annual Total Returns5 |
| | | | | 1 Year | | 5 Years | | 10 Years |
| | | 6-Month
Total Returns | | w/o sales
charge | | w/sales
charge | | w/o sales
charge | | w/sales
charge | | w/o sales
charge | | w/sales
charge |
Institutional | | | | 18.40 | % | | | | 9.39 | % | | | | N/A | | | | | 8.85 | % | | | | N/A | | | | | 12.24 | % | | | | N/A | |
Service | | | | 18.28 | | | | | 9.10 | | | | | N/A | | | | | 8.51 | | | | | N/A | | | | | 11.92 | | | | | N/A | |
Investor A | | | | 18.25 | | | | | 9.06 | | | | | 3.34 | % | | | | 8.51 | | | | | 7.35 | % | | | | 11.89 | | | | | 11.29 | % |
Investor B | | | | 17.74 | | | | | 8.19 | | | | | 3.69 | | | | | 7.64 | | | | | 7.34 | | | | | 11.21 | | | | | 11.21 | |
Investor C | | | | 17.81 | | | | | 8.30 | | | | | 7.30 | | | | | 7.73 | | | | | 7.73 | | | | | 11.10 | | | | | 11.10 | |
Class R | | | | 17.99 | | | | | 8.60 | | | | | N/A | | | | | 8.00 | | | | | N/A | | | | | 11.36 | | | | | N/A | |
S&P 500® Index | | | | 25.89 | | | | | 8.54 | | | | | N/A | | | | | 2.01 | | | | | N/A | | | | | 4.12 | | | | | N/A | |
Russell 3000® Health Care Index | | | | 21.21 | | | | | 14.72 | | | | | N/A | | | | | 5.23 | | | | | N/A | | | | | 3.82 | | | | | N/A | |
| | 5 | Assuming maximum sales charges, if any. Average annual total returns with and without sales charges reflect reductions for distribution and service fees. See “About Fund Performance” on page 14 for a detailed description of share classes, including any related sales charges and fees. |
N/A - Not applicable as share class and index do not have a sales charge.
Past performance is not indicative of future results.
| | | | | | | | | | | | | | | | | | | | | | | | | | | | | | | | | | | |
| | | Actual | | Hypothetical7 | | |
| | | Beginning
Account Value
October 1, 2011 | | Ending
Account Value
March 31, 2012 | | Expenses Paid
During the Period6 | | Beginning
Account Value
October 1, 2011 | | Ending
Account Value
March 31, 2012 | | Expenses Paid
During the Period6 | | Annualized
Expense
Ratio |
Institutional | | | $ | 1,000.00 | | | | $ | 1,184.00 | | | | $ | 5.35 | | | | $ | 1,000.00 | | | | $ | 1,020.10 | | | | $ | 4.95 | | | | | 0.98 | % |
Service | | | $ | 1,000.00 | | | | $ | 1,182.80 | | | | $ | 6.93 | | | | $ | 1,000.00 | | | | $ | 1,018.65 | | | | $ | 6.41 | | | | | 1.27 | % |
Investor A | | | $ | 1,000.00 | | | | $ | 1,182.50 | | | | $ | 6.98 | | | | $ | 1,000.00 | | | | $ | 1,018.60 | | | | $ | 6.46 | | | | | 1.28 | % |
Investor B | | | $ | 1,000.00 | | | | $ | 1,177.40 | | | | $ | 11.38 | | | | $ | 1,000.00 | | | | $ | 1,014.55 | | | | $ | 10.53 | | | | | 2.09 | % |
Investor C | | | $ | 1,000.00 | | | | $ | 1,178.10 | | | | $ | 10.94 | | | | $ | 1,000.00 | | | | $ | 1,014.95 | | | | $ | 10.13 | | | | | 2.01 | % |
Class R | | | $ | 1,000.00 | | | | $ | 1,179.90 | | | | $ | 9.10 | | | | $ | 1,000.00 | | | | $ | 1,016.65 | | | | $ | 8.42 | | | | | 1.67 | % |
| | 6 | For each class of the Fund, expenses are equal to the annualized expense ratio for the class, multiplied by the average account value over the period, multiplied by 183/366 (to reflect the one-half year period shown). |
| | 7 | Hypothetical 5% annual return before expenses is calculated by pro rating the number of days in the most recent fiscal half year divided by 366. |
See “Disclosure of Expenses” on page 15 for further information on how expenses were calculated.
| | | | | | |
| | | | | | |
| | BLACKROCK FUNDS | | MARCH 31, 2012 | | 7 |
| | |
| Fund Summary as of March 31, 2012 | | BlackRock International Opportunities Portfolio |
| | |
Investment Objective | | |
BlackRock International Opportunities Portfolio’s (the “Fund”) investment objective is to seek long-term capital appreciation. | | |
Portfolio Management Commentary | | |
How did the Fund perform?
| — | | For the six-month period ended March 31, 2012, the Fund outperformed its benchmark, the MSCI All Country World Index (ACWI) Ex-US. |
What factors influenced performance?
| — | | Relative to the benchmark, the Fund’s performance benefited from strong stock selection in eight out of ten sectors during the period. The largest contribution to the Fund’s performance relative to the benchmark came from IT, where holdings in software & services delivered strong returns. The Fund’s preference for emerging market-based internet software companies had a positive impact. Additionally, an overweight in semiconductors proved beneficial as the industry posted strong returns due to an inventory correction and growing demand. Stock selection was also beneficial in consumer discretionary, utilities, financials, health care, materials, consumer staples and energy. |
| — | | Global central banks provided financial markets with liquidity during the six-month period and investors increased their appetite for risk. In this environment, the more economically sensitive sectors, including IT, consumer discretionary and industrials, outperformed the traditionally defensive consumer staples, telecommunication services and utilities segments. Relative to the benchmark index, the Fund’s underweights to industrials and financials and overweight in consumer staples detracted from performance. The Fund held an allocation to cash as a means to |
| | | reduce the impact on market volatility on the portfolio. As equity markets advanced during the period, the cash position hindered Fund returns. Stock selection in telecommunication services and industrials also had a negative impact on performance. |
Describe recent portfolio activity.
| — | | During the six-month period, the Fund added to its exposure in the industrials sector by closing its underweight in capital goods. The Fund increased its materials allocation via investments in fertilizers, gold and paper products, and increased its weighting in consumer discretionary, particularly in the retail space. These additions were offset by reductions in consumer staples and telecommunication services. |
Describe portfolio positioning at period end.
| — | | At period end, the Fund’s positioning reflected several key characteristics. For one, given the number of headwinds faced by equity markets and the potential severity of the risks they impose, the Fund’s holdings were diversified in a manner that reduces the Fund’s vulnerability to any particular development or macro event. Additionally, the Fund’s holdings did not reflect an intentional bias toward any particular sector or security characteristic. The Fund’s overall portfolio risk was derived more from the individual security risks associated with its holdings than from systematic risks (i.e., risks that impact an entire market or market segment). |
The views expressed reflect the opinions of BlackRock as of the date of this report and are subject to change based on changes in market, economic or other conditions. These views are not intended to be a forecast of future events and are no guarantee of future results.
| | | | | |
| Ten Largest Holdings | | Percent of
Long-Term
Investments |
Nestle SA | | | | 2 | % |
Royal Dutch Shell Plc, A Shares | | | | 2 | |
British American Tobacco Plc | | | | 2 | |
Australia & New Zealand Banking Group Ltd | | | | 1 | |
Banco Bradesco SA, Preference Shares | | | | 1 | |
HSBC Holdings Plc | | | | 1 | |
National Grid Plc | | | | 1 | |
BP Plc | | | | 1 | |
Sanofi SA | | | | 1 | |
IHI Corp. | | | | 1 | |
| | | | | |
| Geographic Allocation | | Percent of
Long-Term
Investments |
United Kingdom | | | | 17 | % |
Japan | | | | 13 | |
Germany | | | | 8 | |
Switzerland | | | | 7 | |
Canada | | | | 5 | |
Netherlands | | | | 4 | |
France | | | | 4 | |
Brazil | | | | 4 | |
Australia | | | | 4 | |
Hong Kong | | | | 4 | |
Singapore | | | | 3 | |
China | | | | 3 | |
Ireland | | | | 3 | |
South Korea | | | | 2 | |
Taiwan | | | | 2 | |
Sweden. | | | | 2 | |
Italy | | | | 2 | |
Spain | | | | 2 | |
Other1 | | | | 11 | |
| | 1 | Other includes a 1% or less investment in each of the following countries: Mexico, Norway, Argentina, Indonesia, South Africa, Israel, Belgium, Luxembourg, Bermuda, India, Malaysia, United States and Gibraltar. |
| | | | |
| | | | |
8 | | BLACKROCK FUNDS | | MARCH 31, 2012 |
BlackRock International Opportunities Portfolio
|
Total Return Based on a $10,000 Investment |
| | |
| | 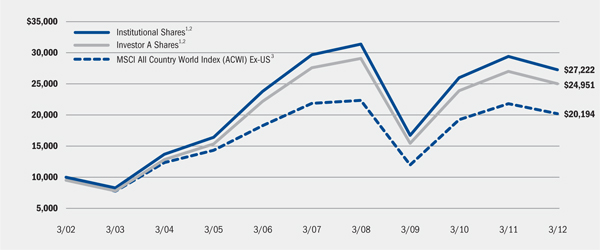 |
| |
| | 1 Assuming maximum sales charges, if any, transaction costs and other operating expenses, including investment advisory fees. Institutional Shares do not have a sales charge. 2 The Fund, under normal market conditions, invests at least 80% of its net assets in equity securities issued by foreign companies of any market capitalization. The Fund may invest up to 40% of its net assets in stocks of issuers in emerging market countries. 3 This market capitalization weighted index is designed to provide a broad measure of stock performance throughout the world, with the exception of US-based companies. The index includes both developed and emerging markets. |
|
Performance Summary for the Period Ended March 31, 2012 |
| | | | | | | | | | | | | | | | | | | | | | | | | | | | | | | | | | | |
| | | | | Average Annual Total Returns4 |
| | | | | 1 Year | | 5 Years | | 10 Years |
| | | 6-Month
Total Returns | | w/o sales
charge | | w/sales
charge | | w/o sales
charge | | w/sales
charge | | w/o sales
charge | | w/sales
charge |
Institutional | | | | 16.96 | % | | | | (7.16 | )% | | | | N/A | | | | | (1.65 | )% | | | | N/A | | | | | 10.53 | % | | | | N/A | |
Service | | | | 16.69 | | | | | (7.58 | ) | | | | N/A | | | | | (2.01 | ) | | | | N/A | | | | | 10.18 | | | | | N/A | |
Investor A | | | | 16.84 | | | | | (7.41 | ) | | | | (12.26 | )% | | | | (1.93 | ) | | | | (2.98 | )% | | | | 10.17 | | | | | 9.57 | % |
Investor B | | | | 16.36 | | | | | (8.12 | ) | | | | (12.22 | ) | | | | (2.70 | ) | | | | (3.02 | ) | | | | 9.49 | | | | | 9.49 | |
Investor C | | | | 16.35 | | | | | (8.14 | ) | | | | (9.05 | ) | | | | (2.69 | ) | | | | (2.69 | ) | | | | 9.33 | | | | | 9.33 | |
MSCI All Country World Index (ACWI) Ex-US | | | | 15.37 | | | | | (7.18 | ) | | | | N/A | | | | | (1.56 | ) | | | | N/A | | | | | 7.28 | | | | | N/A | |
| | 4 | Assuming maximum sales charges, if any. Average annual total returns with and without sales charges reflect reductions for distribution and service fees. See “About Fund Performance” on page 14 for a detailed description of share classes, including any related sales charges and fees. |
N/A - Not applicable as share class and index do not have a sales charge.
Past performance is not indicative of future results.
| | | | | | | | | | | | | | | | | | | | | | | | | | | | | | | | | | | |
| | | Actual | | Hypothetical6 | | |
| | | Beginning
Account Value
October 1, 2011 | | Ending
Account Value
March 31, 2012 | | Expenses Paid
During the Period5 | | Beginning
Account Value
October 1, 2011 | | Ending
Account Value
March 31, 2012 | | Expenses Paid
During the Period5 | | Annualized
Expense
Ratio |
Institutional | | | $ | 1,000.00 | | | | $ | 1,169.60 | | | | $ | 7.05 | | | | $ | 1,000.00 | | | | $ | 1,018.50 | | | | $ | 6.56 | | | | | 1.30 | % |
Service | | | $ | 1,000.00 | | | | $ | 1,166.90 | | | | $ | 9.70 | | | | $ | 1,000.00 | | | | $ | 1,016.05 | | | | $ | 9.02 | | | | | 1.79 | % |
Investor A | | | $ | 1,000.00 | | | | $ | 1,168.40 | | | | $ | 8.40 | | | | $ | 1,000.00 | | | | $ | 1,017.25 | | | | $ | 7.82 | | | | | 1.55 | % |
Investor B | | | $ | 1,000.00 | | | | $ | 1,163.60 | | | | $ | 12.82 | | | | $ | 1,000.00 | | | | $ | 1,013.15 | | | | $ | 11.93 | | | | | 2.37 | % |
Investor C | | | $ | 1,000.00 | | | | $ | 1,163.50 | | | | $ | 12.71 | | | | $ | 1,000.00 | | | | $ | 1,013.25 | | | | $ | 11.83 | | | | | 2.35 | % |
| | 5 | For each class of the Fund, expenses are equal to the annualized expense ratio for the class, multiplied by the average account value over the period, multiplied by 183/366 (to reflect the one-half year period shown). |
| | 6 | Hypothetical 5% annual return before expenses is calculated by pro rating the number of days in the most recent fiscal half year divided by 366. |
See “Disclosure of Expenses” on page 15 for further information on how expenses were calculated.
| | | | | | |
| | | | | | |
| | BLACKROCK FUNDS | | MARCH 31, 2012 | | 9 |
| | |
| Fund Summary as of March 31, 2012 | | BlackRock Science & Technology Opportunities Portfolio |
| | |
Investment Objective | | |
BlackRock Science & Technology Opportunities Portfolio’s (the “Fund”) investment objective is to provide long-term capital appreciation. |
Portfolio Management Commentary | | |
How did the Fund perform?
| — | | For the six-month period, the Fund posted a positive double-digit return, but underperformed its benchmark, the NYSE Arca Tech 100 IndexSM. |
What factors influenced performance?
| — | | The Fund benefited from stock selection in IT where network security solutions providers Fortinet, Inc. and Imperva, Inc. and software provider Temenos Group AG were strong performers. The Fund continued to favor the strategically important areas of network security and business analytics given their strong growth-rate projections relative to personal computers, notebooks and handsets. The Fund’s preference for growth in smartphones over feature phones also had a positive impact. In particular, an investment in Avago Technologies Ltd., which supplies chips for smartphones, was a meaningful contributor in the first quarter of 2012. Outside of IT, the Fund’s underweight in health care versus the benchmark index proved beneficial. |
| — | | Conversely, the Fund’s underperformance was largely attributable to its industry allocations relative to the benchmark index. The Fund’s underweight to computer hardware-related names and overweights to software and semiconductor stocks detracted from relative returns for the period. Hardware stocks staged a sharp rebound, with many of the consumer-centric names like Apple, Inc. performing particularly well, and materially outperformed the software and semiconductor segments. Stock selection in each of these segments also had a negative impact on Fund performance. |
Describe recent portfolio activity.
| — | | During the six-month period, the Fund increased exposure to software with additions in internet providers, application software and systems software. The Fund reduced its underweight in communications equipment, but remained cautious on hardware stocks overall. The Fund reduced the size of its position in Apple, Inc. in order to mitigate the negative-event risk associated with such a large, high-profile holding. Also during the period, the Fund reduced its allocation to the health care sector, which represented less than 2% of the Fund’s net assets as of period end. |
Describe portfolio positioning at period end.
| — | | At period end, the Fund remained overweight in the IT sector relative to the NYSE Arca Tech 100 IndexSM, and underweight in health care. Within IT, the Fund’s positioning was biased toward particular themes. The Fund’s software holdings reflected a preference for the mission-critical nature of security and business analytics. In semiconductors, the Fund held companies with exposure to smartphones, with a particular focus on names that sell to the supply chain of industry leaders like Apple, Inc. and Samsung Electronics Co. Ltd. In computer hardware, the Fund held exposure to data storage given attractive long-term growth prospects. |
The views expressed reflect the opinions of BlackRock as of the date of this report and are subject to change based on changes in market, economic or other conditions. These views are not intended to be a forecast of future events and are no guarantee of future results.
| | | | | |
| Ten Largest Holdings | | Percent of
Long-Term
Investments |
Apple, Inc. | | | | 9 | % |
QUALCOMM, Inc. | | | | 4 | |
International Business Machines Corp. | | | | 3 | |
Google, Inc., Class A | | | | 3 | |
eBay, Inc. | | | | 3 | |
Red Hat, Inc. | | | | 3 | |
Cisco Systems, Inc. | | | | 3 | |
MICROS Systems, Inc. | | | | 2 | |
Intel Corp. | | | | 2 | |
Accenture Plc, Class A | | | | 2 | |
| | | | | |
| Industry Allocation | | Percent of
Long-Term
Investments |
Software | | | | 26 | % |
Semiconductors & Semiconductor Equipment | | | | 17 | |
Internet Software & Services | | | | 14 | |
Computers & Peripherals | | | | 14 | |
IT Services | | | | 12 | |
Communications Equipment | | | | 10 | |
Diversified Consumer Services | | | | 2 | |
Other1 | | | | 5 | |
| | 1 | Other includes a 1% or less investment in each of the following industries: Electronic Equipment, Instruments & Components, Internet & Catalog Retail, HealthCare Equipment & Supplies, Biotechnology, Pharmaceuticals and Machinery. |
For Fund compliance purposes, the Fund’s industry classifications refer to any one or more of the industry sub-classifications used by one or more widely recognized market indexes or ratings group indexes, and/or as defined by Fund management. These definitions may not apply for purposes of this report, which may combine industry sub-classifications for reporting ease.
| | | | |
| | | | |
10 | | BLACKROCK FUNDS | | MARCH 31, 2012 |
BlackRock Science & Technology Opportunities Portfolio
|
Total Return Based on a $10,000 Investment |
| | |
| | 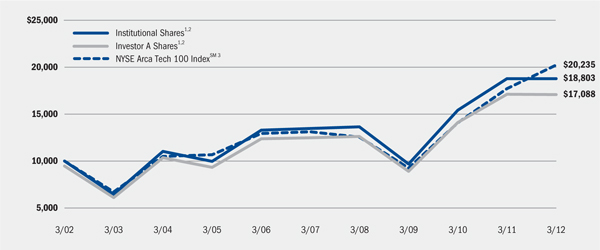 |
| |
| | 1 Assuming maximum sales charges, if any, transaction costs and other operating expenses, including investment advisory fees. Institutional Shares do not have a sales charge. 2 The Fund, under normal circumstances, invests at least 80% of its net assets in equity securities issued by US and non-US science and technology companies in all market capitalization ranges selected for their rapid and sustainable growth potential from the development, advancement and use of science and/or technology. The Fund may invest up to 25% of its net assets in emerging market countries. 3 A price-weighted index comprised of not more than 100 individual stocks listed on the NYSE, AMEX or NASDAQ. The index is modeled to represent a broad spectrum of companies engaged principally in manufacturing products and/or providing services within technology fields. |
|
Performance Summary for the Period Ended March 31, 2012 |
| | | | | | | | | | | | | | | | | | | | | | | | | | | | | | | | | | | |
| | | | | Average Annual Total Returns4 |
| | | | | 1 Year | | 5 Years | | 10 Years |
| | | 6-Month
Total Returns | | w/o sales
charge | | w/sales
charge | | w/o sales
charge | | w/sales
charge | | w/o sales
charge | | w/sales
charge |
Institutional | | | | 24.04 | % | | | | 0.09 | % | | | | N/A | | | | | 6.90 | % | | | | N/A | | | | | 6.52 | % | | | | N/A | |
Service | | | | 23.92 | | | | | 0.00 | | | | | N/A | | | | | 6.57 | | | | | N/A | | | | | 6.20 | | | | | N/A | |
Investor A | | | | 23.63 | | | | | (0.30 | ) | | | | (5.49 | )% | | | | 6.47 | | | | | 5.33 | % | | | | 6.07 | | | | | 5.50 | % |
Investor B | | | | 23.26 | | | | | (1.18 | ) | | | | (5.63 | ) | | | | 5.54 | | | | | 5.22 | | | | | 5.38 | | | | | 5.38 | |
Investor C | | | | 23.29 | | | | | (1.18 | ) | | | | (2.17 | ) | | | | 5.52 | | | | | 5.52 | | | | | 5.20 | | | | | 5.20 | |
Class R | | | | 23.61 | | | | | (0.48 | ) | | | | N/A | | | | | 6.14 | | | | | N/A | | | | | 5.72 | | | | | N/A | |
NYSE Arca Tech 100 IndexSM | | | | 31.13 | | | | | 14.26 | | | | | N/A | | | | | 9.07 | | | | | N/A | | | | | 7.30 | | | | | N/A | |
| | 4 | Assuming maximum sales charges, if any. Average annual total returns with and without sales charges reflect reductions for distribution and service fees. See “About Fund Performance” on page 14 for a detailed description of share classes, including any related sales charges and fees. |
N/A - Not applicable as share class and index do not have a sales charge.
Past performance is not indicative of future results.
| | | | | | | | | | | | | | | | | | | | | | | | | | | | | | | | | | | |
| | | Actual | | Hypothetical6 | | |
| | | Beginning
Account Value
October 1, 2011 | | Ending
Account Value
March 31, 2012 | | Expenses Paid
During the Period5 | | Beginning
Account Value
October 1, 2011 | | Ending
Account Value
March 31, 2012 | | Expenses Paid
During the Period5 | | Annualized
Expense
Ratio |
Institutional | | | $ | 1,000.00 | | | | $ | 1,240.40 | | | | $ | 7.79 | | | | $ | 1,000.00 | | | | $ | 1,018.05 | | | | $ | 7.01 | | | | | 1.39 | % |
Service | | | $ | 1,000.00 | | | | $ | 1,239.20 | | | | $ | 8.73 | | | | $ | 1,000.00 | | | | $ | 1,017.20 | | | | $ | 7.87 | | | | | 1.56 | % |
Investor A | | | $ | 1,000.00 | | | | $ | 1,236.30 | | | | $ | 9.73 | | | | $ | 1,000.00 | | | | $ | 1,016.30 | | | | $ | 8.77 | | | | | 1.74 | % |
Investor B | | | $ | 1,000.00 | | | | $ | 1,232.60 | | | | $ | 14.29 | | | | $ | 1,000.00 | | | | $ | 1,012.20 | | | | $ | 12.88 | | | | | 2.56 | % |
Investor C | | | $ | 1,000.00 | | | | $ | 1,232.90 | | | | $ | 14.63 | | | | $ | 1,000.00 | | | | $ | 1,011.90 | | | | $ | 13.18 | | | | | 2.62 | % |
Class R | | | $ | 1,000.00 | | | | $ | 1,236.10 | | | | $ | 10.90 | | | | $ | 1,000.00 | | | | $ | 1,015.25 | | | | $ | 9.82 | | | | | 1.95 | % |
| | 5 | For each class of the Fund, expenses are equal to the annualized expense ratio for the class, multiplied by the average account value over the period, multiplied by 183/366 (to reflect the one-half year period shown). |
| | 6 | Hypothetical 5% annual return before expenses is calculated by pro rating the number of days in the most recent fiscal half year divided by 366. |
See “Disclosure of Expenses” on page 15 for further information on how expenses were calculated.
| | | | | | |
| | | | | | |
| | BLACKROCK FUNDS | | MARCH 31, 2012 | | 11 |
| | |
| Fund Summary as of March 31, 2012 | | BlackRock U.S. Opportunities Portfolio |
| | |
Investment Objective | | |
BlackRock U.S. Opportunities Portfolio’s (the “Fund”) investment objective is to provide long-term capital appreciation. |
Portfolio Management Commentary | | |
How did the Fund perform?
| — | | For the six-month period ended March 31, 2012, the Fund posted a positive double-digit return, but underperformed its benchmark, the Russell Midcap® Index. |
What factors influenced performance?
| — | | The Fund benefited from its positioning in the materials sector, where its specialty chemicals holdings delivered strong returns. Specifically, overweight positions in Cytec Industries, Inc., Celanese Corp. and Valspar Corp. had a positive impact on returns as each of these stocks posted gains above 35% during the period, driven by upside surprises to their earnings. The Fund’s investments in the consumer staples sector also contributed positively, most notably in packaged foods & meats. The Fund maintained a preference for private label food names, which have passed through higher soft commodity prices better than branded competitors while capitalizing on financially strapped consumers. Stock selection across the media industry also aided returns, with notable contributions from holdings of Liberty Global, Inc., Scripps Networks Interactive, Inc. and The Interpublic Group of Cos., Inc. |
| — | | The Fund’s underperformance relative to the benchmark was largely attributable to stock selection in IT, energy and health care. The Fund’s IT holdings were the largest drag on a relative basis. After a double-digit start to the fourth quarter in 2011, the Fund’s semiconductor holdings gave back their gains over the following consecutive months as several large competitors in the space issued weakening earnings guidance, dragging the entire segment down. In a similar manner, a number of enterprise software and IT services-related holdings favored in the Fund |
| | declined in the wake of cautionary comments from Oracle Corp. In energy, the Fund’s holdings in the oil & gas exploration & production and the oil & gas drilling segments weakened on concerns about slowing global growth. In the health care sector, manufacturing issues and production concerns hampered returns of select holdings in health care equipment & supplies. |
Describe recent portfolio activity.
| — | | During the six-month period, the Fund reduced exposure to consumer staples, telecommunication services and utilities, bringing those allocations closer to a neutral position relative to the benchmark index. The proceeds were used to reduce the Fund’s underweight in industrials and to increase positions in materials stocks with favorable risk-reward profiles. The Fund maintained its underweight in financials, but added to capital market names with potential for a pick-up in activity as well as healthier small- to medium-sized US banks that may be poised to return capital to their shareholders. |
Describe portfolio positioning at period end.
| — | | At period end, the Fund’s positioning reflected several key characteristics. For one, given the number of headwinds faced by equity markets and the potential severity of the risks they impose, the Fund’s holdings were diversified in a manner that reduces the Fund’s vulnerability to any particular development or macro event. Additionally, the Fund’s holdings did not reflect an intentional bias toward any particular sector or security characteristic. The Fund’s overall portfolio risk was derived more from the individual security risks associated with its holdings than from systematic risks (i.e., risks that impact an entire market or market segment). |
The views expressed reflect the opinions of BlackRock as of the date of this report and are subject to change based on changes in market, economic or other conditions. These views are not intended to be a forecast of future events and are no guarantee of future results.
| | | | | |
| Ten Largest Holdings | | Percent of
Long-Term
Investments |
CBRE Group, Inc. | | | | 1 | % |
Federal Realty Investment Trust | | | | 1 | |
Hospitality Properties Trust | | | | 1 | |
Essex Property Trust, Inc. | | | | 1 | |
International Paper Co. | | | | 1 | |
Rayonier, Inc. | | | | 1 | |
Ross Stores, Inc. | | | | 1 | |
O’Reilly Automotive, Inc. | | | | 1 | |
Affiliated Managers Group, Inc. | | | | 1 | |
Ryder System, Inc. | | | | 1 | |
| | | | | |
| Sector Allocation | | Percent of
Long-Term
Investments |
Financials | | | | 19 | % |
Consumer Discretionary | | | | 17 | |
Information Technology | | | | 14 | |
Industrials | | | | 12 | |
Health Care | | | | 10 | |
Energy | | | | 8 | |
Utilities | | | | 7 | |
Materials | | | | 6 | |
Consumer Staples | | | | 6 | |
Telecommunication Services | | | | 1 | |
For Fund compliance purposes, the Fund’s sector classifications refer to any one or more of the sector sub-classifications used by one or more widely recognized market indexes or ratings group indexes, and/or as defined by Fund management. These definitions may not apply for purposes of this report, which may combine sector sub-classifications for reporting ease.
| | | | |
| | | | |
12 | | BLACKROCK FUNDS | | MARCH 31, 2012 |
BlackRock U.S. Opportunities Portfolio
|
Total Return Based on a $10,000 Investment |
| | |
| | 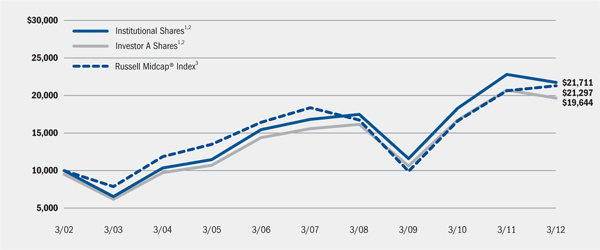 |
| |
| | 1 Assuming maximum sales charges, if any, transaction costs and other operating expenses, including investment advisory fees. Institutional Shares do not have a sales charge. 2 The Fund normally invests at least 80% of its net assets in equity securities issued by US emerging capitalization companies with relatively attractive earnings growth potential and valuation. 3 A market index that measures the performance of the mid-cap segment of the US equities universe. It is a subset of the Russell 1000® Index including approximately 800 of the smallest securities based on a combination of their market cap and current index membership. The Russell Midcap® Index represents approximately 31% of the total market capitalization of the Russell 1000® companies. |
|
Performance Summary for the Period Ended March 31, 2012 |
| | | | | | | | | | | | | | | | | | | | | | | | | | | | | | | | | | | |
| | | | | Average Annual Total Returns4 |
| | | | | 1 Year | | 5 Years | | 10 Years |
| | | 6-Month
Total Returns | | w/o sales
charge | | w/sales
charge | | w/o sales
charge | | w/sales
charge | | w/o sales
charge | | w/sales
charge |
Institutional | | | | 23.51 | % | | | | (4.72 | )% | | | | N/A | | | | | 5.27 | % | | | | N/A | | | | | 8.06 | % | | | | N/A | |
Service | | | | 23.22 | | | | | (5.17 | ) | | | | N/A | | | | | 4.81 | | | | | N/A | | | | | 7.64 | | | | | N/A | |
Investor A | | | | 23.17 | | | | | (5.22 | ) | | | | (10.20 | )% | | | | 4.75 | | | | | 3.63 | % | | | | 7.56 | | | | | 6.99 | % |
Investor B | | | | 22.70 | | | | | (5.93 | ) | | | | (9.69 | ) | | | | 3.96 | | | | | 3.62 | | | | | 6.92 | | | | | 6.92 | |
Investor C | | | | 22.73 | | | | | (5.91 | ) | | | | (6.74 | ) | | | | 3.99 | | | | | 3.99 | | | | | 6.77 | | | | | 6.77 | |
Russell Midcap® Index | | | | 26.84 | | | | | 3.31 | | | | | N/A | | | | | 3.03 | | | | | N/A | | | | | 7.85 | | | | | N/A | |
| | 4 | Assuming maximum sales charges, if any. Average annual total returns with and without sales charges reflect reductions for distribution and service fees. See “About Fund Performance” on page 14 for a detailed description of share classes, including any related sales charges and fees. |
N/A - Not applicable as share class and index do not have a sales charge.
Past performance is not indicative of future results.
| | | | | | | | | | | | | | | | | | | | | | | | | | | | | | | | | | | |
| | | Actual | | Hypothetical6 | | |
| | | Beginning
Account Value
October 1, 2011 | | Ending
Account Value
March 31, 2012 | | Expenses Paid
During the Period5 | | Beginning
Account Value
October 1, 2011 | | Ending
Account Value
March 31, 2012 | | Expenses Paid
During the Period5 | | Annualized
Expense
Ratio |
Institutional | | | $ | 1,000.00 | | | | $ | 1,235.10 | | | | $ | 5.76 | | | | $ | 1,000.00 | | | | $ | 1,019.85 | | | | $ | 5.20 | | | | | 1.03 | % |
Service | | | $ | 1,000.00 | | | | $ | 1,232.20 | | | | $ | 8.43 | | | | $ | 1,000.00 | | | | $ | 1,017.45 | | | | $ | 7.62 | | | | | 1.51 | % |
Investor A | | | $ | 1,000.00 | | | | $ | 1,231.70 | | | | $ | 8.65 | | | | $ | 1,000.00 | | | | $ | 1,017.25 | | | | $ | 7.82 | | | | | 1.55 | % |
Investor B | | | $ | 1,000.00 | | | | $ | 1,227.00 | | | | $ | 12.86 | | | | $ | 1,000.00 | | | | $ | 1,013.45 | | | | $ | 11.63 | | | | | 2.31 | % |
Investor C | | | $ | 1,000.00 | | | | $ | 1,227.30 | | | | $ | 12.64 | | | | $ | 1,000.00 | | | | $ | 1,013.65 | | | | $ | 11.43 | | | | | 2.27 | % |
| | 5 | For each class of the Fund, expenses are equal to the annualized expense ratio for the class, multiplied by the average account value over the period, multiplied by 183/366 (to reflect the one-half year period shown). |
| | 6 | Hypothetical 5% annual return before expenses is calculated by pro rating the number of days in the most recent fiscal half year divided by 366. |
See “Disclosure of Expenses” on page 15 for further information on how expenses were calculated.
| | | | | | |
| | | | | | |
| | BLACKROCK FUNDS | | MARCH 31, 2012 | | 13 |
| — | | Institutional Shares are not subject to any sales charge. Institutional Shares bear no ongoing distribution or service fees and are available only to eligible investors. |
| — | | Service Shares are not subject to any sales charge (front-end load) or deferred sales charge. Service Shares are subject to a service fee of 0.25% per year (but no distribution fee). Prior to January 28, 2005, the performance results of Service Shares of the BlackRock Health Sciences Opportunities Portfolio (“Health Sciences Opportunities”) are those of Investor A Shares restated to reflect Service Shares’ fees. |
| — | | Investor A Shares incur a maximum initial sales charge (front-end load) of 5.25% and a service fee of 0.25% per year (but no distribution fee). |
| — | | Investor B Shares are subject to a maximum contingent deferred sales charge (“CDSC”) of 4.50% declining to 0% after six years. In addition, Investor B Shares are subject to a distribution fee of 0.75% per year and a service fee of 0.25% per year. Investor B Shares automatically convert to Investor A Shares after approximately eight years. (There is no initial sales charge for automatic share conversions.) All returns for periods greater than eight years reflect this conversion. Investor B Shares are only available through exchanges, dividend reinvestments by existing shareholders or for purchase by certain qualified employee benefit plans. |
| — | | Investor C Shares are subject to a 1.00% CDSC if redeemed within one year of purchase. In addition, Investor C Shares are subject to a distribution fee of 0.75% per year and a service fee of 0.25% per year. |
| — | | Class R Shares are not subject to any sales charge. Class R Shares are subject to a distribution fee of 0.25% per year and a service fee of 0.25% per year. Class R Shares are available only to certain retirement and other similar plans. Prior to September 8, 2008, the performance results of Class R Shares of BlackRock Science & Technology Opportunities Portfolio are those of Institutional Shares (which have no distribution or service fees) restated to reflect Class R Shares’ fees. Prior to |
September 12, 2011, the performance results of Class R Shares of BlackRock Global Opportunities’ Portfolio and Health Sciences Opportunities’ are those of Institutional Shares (which have no distribution or service fees) restated to reflect Class R Shares’ fees.
Performance information reflects past performance and does not guarantee future results. Current performance may be lower or higher than the performance data quoted. Refer to www.blackrock.com/funds to obtain performance data current to the most recent month-end. Performance results do not reflect the deduction of taxes that a shareholder would pay on Fund distributions or the redemption of Fund shares. Figures shown in each of the performance tables on the previous pages assume reinvestment of all dividends and distributions, if any, at net asset value (“NAV”) on the ex-dividend date. Investment return and principal value of shares will fluctuate so that shares, when redeemed, may be worth more or less than their original cost.
Performance for Health Sciences Opportunities for the periods prior to January 31, 2005 is based on performance of a certain former State Street Research mutual fund that reorganized with Health Sciences Opportunities on that date.
The Funds’ investment advisor, BlackRock Advisors, LLC (the “Manager”), waived and/or reimbursed a portion of each Fund’s expenses. Without such waiver and/or reimbursement, a Fund’s performance would have been lower. The Manager is under no obligation to waive or reimburse or to continue waiving or reimbursing its fees after the applicable termination date. See Note 3 of the Notes to Financial Statements for additional information on waivers and reimbursements. Dividends paid to each class of shares will vary because of the different levels of service, distribution and transfer agency fees applicable to each class, which are deducted from the income available to be paid to shareholders.
| | | | |
| | | | |
14 | | BLACKROCK FUNDS | | MARCH 31, 2012 |
Shareholders of the Funds may incur the following charges: (a) expenses related to transactions, including sales charges and exchange fees; and (b) operating expenses, including investment advisory fees, service and distribution fees, including 12b-1 fees, acquired fund fees and expenses and other Fund expenses. The expense examples on the previous pages (which are based on a hypothetical investment of $1,000 invested on October 1, 2011 and held through March 31, 2012) are intended to assist shareholders both in calculating expenses based on an investment in the Funds and in comparing these expenses with similar costs of investing in other mutual funds.
The tables provide information about actual account values and actual expenses. In order to estimate the expenses a shareholder paid during the period covered by this report, shareholders can divide their account value by $1,000 and then multiply the result by the number corresponding to their Fund and share class under the headings entitled “Expenses Paid During the Period.”
The tables also provide information about hypothetical account values and hypothetical expenses based on a Fund’s actual expense ratio and an assumed rate of return of 5% per year before expenses. In order to assist shareholders in comparing the ongoing expenses of investing in these Funds and other funds, compare the 5% hypothetical example with the 5% hypothetical examples that appear in other funds’ shareholder reports.
The expenses shown in the tables are intended to highlight shareholders’ ongoing costs only and do not reflect any transactional expenses, such as sales charges or exchange fees, if any. Therefore, the hypothetical examples are useful in comparing ongoing expenses only, and will not help shareholders determine the relative total expenses of owning different funds. If these transactional expenses were included, shareholder expenses would have been higher.
Derivative Financial Instruments
The Funds may invest in various derivative financial instruments, including financial futures contracts, foreign currency exchange contracts and options as specified in Note 2 of the Notes to Financial Statements, which may constitute forms of economic leverage. Such derivative financial instruments are used to obtain exposure to a market without owning or taking physical custody of securities or to hedge market, equity and/ or foreign currency exchange rate risks. Derivative financial instruments involve risks, including the imperfect correlation between the value of a derivative financial instrument and the underlying asset, possible default of the counterparty to the transaction or illiquidity of the derivative financial instrument. The Funds’ ability to use a derivative financial
instrument successfully depends on the investment advisor’s ability to predict pertinent market movements accurately, which cannot be assured. The use of derivative financial instruments may result in losses greater than if they had not been used, may require a Fund to sell or purchase portfolio investments at inopportune times or for distressed values, may limit the amount of appreciation a Fund can realize on an investment, may result in lower dividends paid to shareholders or may cause a Fund to hold an investment that it might otherwise sell. The Funds’ investments in these instruments are discussed in detail in the Notes to Financial Statements.
| | | | | | |
| | | | | | |
| | BLACKROCK FUNDS | | MARCH 31, 2012 | | 15 |
| | |
| Schedule of Investments March 31, 2012 (Unaudited) | | BlackRock Global Opportunities Portfolio |
| | (Percentages shown are based on Net Assets) |
| | | | | | | | |
| Common Stocks | | Shares | | | Value | |
| |
Argentina – 0.5% | | | | | | | | |
Arcos Dorados Holdings, Inc., Class A | | | 110,100 | | | $ | 1,991,709 | |
| |
Australia – 1.1% | | | | | | | | |
Australia & New Zealand Banking Group Ltd. | | | 53,700 | | | | 1,295,473 | |
Newcrest Mining Ltd. | | | 60,200 | | | | 1,851,555 | |
PanAust Ltd. (a) | | | 285,700 | | | | 900,408 | |
| | | | | | | | |
| | | | | | | 4,047,436 | |
| |
Belgium – 0.8% | | | | | | | | |
Anheuser-Busch InBev NV | | | 41,000 | | | | 2,985,997 | |
| |
Brazil – 1.3% | | | | | | | | |
Banco Bradesco SA, Preference Shares | | | 191,000 | | | | 3,327,289 | |
BM&FBovespa SA | | | 200,042 | | | | 1,226,256 | |
| | | | | | | | |
| | | | | | | 4,553,545 | |
| |
Canada – 2.7% | | | | | | | | |
First Quantum Minerals Ltd. | | | 56,800 | | | | 1,083,098 | |
Manulife Financial Corp. | | | 126,900 | | | | 1,718,802 | |
Saputo, Inc. | | | 46,300 | | | | 2,005,738 | |
Suncor Energy, Inc. | | | 48,600 | | | | 1,587,923 | |
The Toronto-Dominion Bank | | | 21,200 | | | | 1,799,380 | |
TransCanada Corp. | | | 33,200 | | | | 1,425,591 | |
| | | | | | | | |
| | | | | | | 9,620,532 | |
| |
China – 1.5% | | | | | | | | |
Air China Ltd., H Shares | | | 1,062,000 | | | | 735,596 | |
China Construction Bank Corp., H Shares | | | 3,052,400 | | | | 2,355,901 | |
China Eastern Airlines Corp. Ltd.,
H Shares (a) | | | 1,354,000 | | | | 444,556 | |
China Southern Airlines Co. Ltd.,
H Shares (a) | | | 1,266,000 | | | | 604,703 | |
Lentuo International, Inc. - ADR (a) | | | 53,000 | | | | 200,340 | |
Zoomlion Heavy Industry Science and | | | | | | | | |
Technology Co. Ltd., H Shares | | | 753,200 | | | | 1,001,510 | |
| | | | | | | | |
| | | | | | | 5,342,606 | |
| |
France – 3.1% | | | | | | | | |
Arkema SA | | | 19,400 | | | | 1,809,238 | |
AXA SA | | | 46,200 | | | | 766,688 | |
BNP Paribas SA | | | 24,880 | | | | 1,183,553 | |
Danone SA | | | 26,700 | | | | 1,862,485 | |
LVMH Moet Hennessy Louis Vuitton SA | | | 13,200 | | | | 2,271,526 | |
Sanofi SA | | | 41,400 | | | | 3,212,306 | |
| | | | | | | | |
| | | | | | | 11,105,796 | |
| |
Germany – 3.7% | | | | | | | | |
Allianz SE | | | 20,200 | | | | 2,410,914 | |
Continental AG | | | 20,300 | | | | 1,916,403 | |
Daimler AG | | | 26,000 | | | | 1,567,815 | |
Deutsche Bank AG | | | 41,000 | | | | 2,041,364 | |
Deutsche Lufthansa AG | | | 145,300 | | | | 2,031,821 | |
Merck KGaA | | | 20,500 | | | | 2,268,541 | |
Volkswagen AG, Preference Shares | | | 5,660 | | | | 995,390 | |
| | | | | | | | |
| | | | | | | 13,232,248 | |
| |
| | | | | | | | |
| Common Stocks | | Shares | | | Value | |
| |
Hong Kong – 1.6% | | | | | | | | |
AIA Group Ltd. | | | 837,000 | | | $ | 3,072,726 | |
Hong Kong Exchanges and Clearing Ltd. | | | 89,600 | | | | 1,508,000 | |
Wharf Holdings Ltd. | | | 193,900 | | | | 1,057,318 | |
| | | | | | | | |
| | | | | | | 5,638,044 | |
| |
India – 0.5% | | | | | | | | |
ICICI Bank Ltd. | | | 42,700 | | | | 740,596 | |
Jubilant Foodworks Ltd. (a) | | | 53,440 | | | | 1,234,022 | |
| | | | | | | | |
| | | | | | | 1,974,618 | |
| |
Indonesia – 0.5% | | | | | | | | |
Adaro Energy Tbk PT | | | 5,748,200 | | | | 1,214,454 | |
Tower Bersama Infrastructure Tbk PT (a) | | | 2,260,500 | | | | 730,671 | |
| | | | | | | | |
| | | | | | | 1,945,125 | |
| |
Ireland – 1.3% | | | | | | | | |
Accenture Plc, Class A | | | 39,000 | | | | 2,515,500 | |
Covidien Plc | | | 42,500 | | | | 2,323,900 | |
| | | | | | | | |
| | | | | | | 4,839,400 | |
| |
Israel – 0.5% | | | | | | | | |
Check Point Software
Technologies Ltd. (a) | | | 27,871 | | | | 1,779,285 | |
| |
Italy – 0.9% | | | | | | | | |
ENI SpA | | | 65,700 | | | | 1,539,698 | |
Intesa Sanpaolo SpA | | | 922,800 | | | | 1,654,031 | |
| | | | | | | | |
| | | | | | | 3,193,729 | |
| |
Japan – 4.4% | | | | | | | | |
Bridgestone Corp. | | | 56,600 | | | | 1,384,187 | |
Hino Motors Ltd. | | | 240,000 | | | | 1,750,754 | |
Honda Motor Co. Ltd. | | | 44,700 | | | | 1,721,585 | |
IHI Corp. | | | 1,389,100 | | | | 3,530,974 | |
ORIX Corp. | | | 18,900 | | | | 1,815,833 | |
Softbank Corp. | | | 69,000 | | | | 2,054,211 | |
Sumitomo Mitsui Financial Group, Inc. | | | 53,600 | | | | 1,774,039 | |
Toyota Motor Corp. | | | 43,400 | | | | 1,888,425 | |
| | | | | | | | |
| | | | | | | 15,920,008 | |
| |
Luxembourg – 0.3% | | | | | | | | |
ArcelorMittal | | | 58,100 | | | | 1,112,237 | |
| |
Mexico – 0.9% | | | | | | | | |
Fomento Economico Mexicano SAB de CV - ADR | | | 22,300 | | | | 1,834,621 | |
Grupo Modelo SAB de CV, Series C | | | 201,600 | | | | 1,413,460 | |
| | | | | | | | |
| | | | | | | 3,248,081 | |
| |
Netherlands – 2.1% | | | | | | | | |
Akzo Nobel NV | | | 38,300 | | | | 2,262,403 | |
Corio NV | | | 15,400 | | | | 812,497 | |
Royal Dutch Shell Plc, A Shares | | | 113,800 | | | | 3,987,096 | |
To simplify the listings of portfolio holdings in the Schedules of Investments, the names and descriptions of many of the securities have been abbreviated according to the following list:
| | | | | | |
| ADR | | American Depositary Receipts | | HKD | | Hong Kong Dollar |
| AUD | | Australian Dollar | | JPY | | Japanese Yen |
| CAD | | Canadian Dollar | | MXN | | Mexican Peso |
| CHF | | Swiss Franc | | NOK | | Norwegian Krone |
| DKK | | Danish Krone | | SEK | | Swedish Krona |
| EUR | | Euro | | SGD | | Singapore Dollar |
| GBP | | British Pound | | USD | | US Dollar |
See Notes to Financial Statements.
| | | | |
| | | | |
16 | | BLACKROCK FUNDS | | MARCH 31, 2012 |
| | |
| Schedule of Investments (continued) | | BlackRock Global Opportunities Portfolio |
| | (Percentages shown are based on Net Assets) |
| | | | | | | | |
| Common Stocks | | Shares | | | Value | |
| |
Netherlands (concluded) | | | | | | | | |
Ziggo NV (a) | | | 14,700 | | | $ | 458,572 | |
| | | | | | | | |
| | | | | | | 7,520,568 | |
| |
Norway – 0.7% | | | | | | | | |
Statoil ASA | | | 90,300 | | | | 2,450,933 | |
| |
Singapore – 0.8% | | | | | | | | |
Avago Technologies Ltd. | | | 49,600 | | | | 1,932,912 | |
Sakari Resources Ltd. | | | 538,900 | | | | 1,000,715 | |
| | | | | | | | |
| | | | | | | 2,933,627 | |
| |
South Africa – 0.6% | | | | | | | | |
Naspers Ltd., N Shares | | | 38,500 | | | | 2,166,065 | |
| |
South Korea – 1.8% | | | | | | | | |
Dongbu Insurance Co. Ltd. | | | 59,400 | | | | 2,569,870 | |
Samsung Electronics Co. Ltd. | | | 1,725 | | | | 1,945,894 | |
Samsung Life Insurance Co. Ltd. | | | 21,400 | | | | 1,870,766 | |
| | | | | | | | |
| | | | | | | 6,386,530 | |
| |
Spain – 0.4% | | | | | | | | |
Repsol YPF SA | | | 54,591 | | | | 1,372,334 | |
| |
Sweden – 0.5% | | | | | | | | |
Volvo AB, B Shares | | | 115,300 | | | | 1,679,611 | |
| |
Switzerland – 2.3% | | | | | | | | |
Julius Baer Group Ltd. | | | 48,000 | | | | 1,938,150 | |
Novartis AG | | | 15,400 | | | | 852,508 | |
Roche Holding AG | | | 14,700 | | | | 2,558,246 | |
Weatherford International Ltd. (a) | | | 83,800 | | | | 1,264,542 | |
Xstrata Plc | | | 105,600 | | | | 1,809,110 | |
| | | | | | | | |
| | | | | | | 8,422,556 | |
| |
Taiwan – 0.7% | | | | | | | | |
First Financial Holding Co. Ltd. | | | 2,332,400 | | | | 1,406,400 | |
Taiwan Semiconductor Manufacturing Co. Ltd. | | | 341,000 | | | | 980,367 | |
| | | | | | | | |
| | | | | | | 2,386,767 | |
| |
United Kingdom – 7.3% | | | | | | | | |
Afren Plc (a) | | | 471,800 | | | | 1,008,721 | |
Barclays Plc | | | 574,400 | | | | 2,164,586 | |
BG Group Plc | | | 82,400 | | | | 1,910,567 | |
BP Plc | | | 323,800 | | | | 2,411,413 | |
British American Tobacco Plc | | | 90,100 | | | | 4,538,717 | |
Compass Group Plc | | | 133,300 | | | | 1,397,444 | |
GlaxoSmithKline Plc | | | 97,800 | | | | 2,186,383 | |
HSBC Holdings Plc | | | 239,983 | | | | 2,131,565 | |
Inmarsat Plc | | | 167,300 | | | | 1,233,284 | |
National Grid Plc | | | 214,600 | | | | 2,162,907 | |
Subsea 7 SA | | | 73,600 | | | | 1,949,348 | |
Vodafone Group Plc - ADR | | | 114,300 | | | | 3,162,681 | |
| | | | | | | | |
| | | | | | | 26,257,616 | |
| |
United States – 54.0% | | | | | | | | |
Allergan, Inc. | | | 22,600 | | | | 2,156,718 | |
Amazon.com, Inc. (a) | | | 8,100 | | | | 1,640,331 | |
American Electric Power Co., Inc. | | | 75,000 | | | | 2,893,500 | |
Ameriprise Financial, Inc. | | | 49,700 | | | | 2,839,361 | |
Apple, Inc. | | | 9,300 | | | | 5,575,071 | |
AT&T Inc. | | | 91,900 | | | | 2,870,037 | |
Baxter International, Inc. | | | 39,300 | | | | 2,349,354 | |
Biogen Idec, Inc. (a) | | | 10,838 | | | | 1,365,263 | |
Caterpillar, Inc. | | | 14,600 | | | | 1,555,192 | |
Cisco Systems, Inc. | | | 71,600 | | | | 1,514,340 | |
Citigroup, Inc. | | | 36,760 | | | | 1,343,578 | |
Comcast Corp., Class A | | | 67,400 | | | | 2,022,674 | |
ConAgra Foods, Inc. | | | 80,300 | | | | 2,108,678 | |
Costco Wholesale Corp. | | | 30,200 | | | | 2,742,160 | |
Crown Holdings, Inc. (a) | | | 49,800 | | | | 1,834,134 | |
| | | | | | | | |
| Common Stocks | | Shares | | | Value | |
| |
United States (concluded) | | | | | | | | |
CSX Corp. | | | 86,000 | | | $ | 1,850,720 | |
Dominion Resources, Inc. | | | 44,000 | | | | 2,253,240 | |
Dover Corp. | | | 41,600 | | | | 2,618,304 | |
eBay, Inc. (a) | | | 67,100 | | | | 2,475,319 | |
Eli Lilly & Co. | | | 63,400 | | | | 2,553,118 | |
EMC Corp. (a) | | | 72,600 | | | | 2,169,288 | |
EQT Corp. | | | 25,000 | | | | 1,205,250 | |
Exelon Corp. | | | 55,200 | | | | 2,164,392 | |
Exxon Mobil Corp. | | | 81,200 | | | | 7,042,476 | |
F5 Networks, Inc. (a) | | | 12,000 | | | | 1,619,520 | |
Federal Realty Investment Trust | | | 23,600 | | | | 2,284,244 | |
FedEx Corp. | | | 17,200 | | | | 1,581,712 | |
Fortinet, Inc. (a) | | | 67,669 | | | | 1,871,048 | |
Freeport-McMoRan Copper & Gold, Inc. | | | 50,900 | | | | 1,936,236 | |
General Mills, Inc. | | | 71,900 | | | | 2,836,455 | |
Gilead Sciences, Inc. (a) | | | 32,526 | | | | 1,588,895 | |
The Goldman Sachs Group, Inc. | | | 23,800 | | | | 2,960,006 | |
Google, Inc., Class A (a) | | | 5,900 | | | | 3,783,316 | |
Huntsman Corp. | | | 156,300 | | | | 2,189,763 | |
Informatica Corp. (a) | | | 27,400 | | | | 1,449,460 | |
Intel Corp. | | | 66,400 | | | | 1,866,504 | |
International Business Machines Corp. | | | 14,600 | | | | 3,046,290 | |
International Paper Co. | | | 98,700 | | | | 3,464,370 | |
Johnson & Johnson | | | 25,400 | | | | 1,675,384 | |
JPMorgan Chase & Co. | | | 105,800 | | | | 4,864,684 | |
KeyCorp | | | 205,000 | | | | 1,742,500 | |
Kraft Foods, Inc., Class A | | | 65,800 | | | | 2,501,058 | |
Las Vegas Sands Corp. | | | 35,800 | | | | 2,061,006 | |
Liberty Global, Inc., Class A (a) | | | 46,900 | | | | 2,348,752 | |
Lowe’s Cos., Inc. | | | 80,700 | | | | 2,532,366 | |
Manpower, Inc. | | | 19,582 | | | | 927,599 | |
Medtronic, Inc. | | | 31,700 | | | | 1,242,323 | |
MetLife, Inc. | | | 56,600 | | | | 2,114,010 | |
Microsoft Corp. | | | 57,400 | | | | 1,851,150 | |
Monsanto Co. | | | 27,400 | | | | 2,185,424 | |
The NASDAQ OMX Group, Inc. (a) | | | 69,300 | | | | 1,794,870 | |
Newmont Mining Corp. | | | 43,900 | | | | 2,250,753 | |
NII Holdings, Inc. (a) | | | 34,900 | | | | 639,019 | |
NIKE, Inc., Class B | | | 17,600 | | | | 1,908,544 | |
Occidental Petroleum Corp. | | | 32,000 | | | | 3,047,360 | |
Oracle Corp. | | | 60,500 | | | | 1,764,180 | |
Owens Corning (a) | | | 59,500 | | | | 2,143,785 | |
PepsiCo, Inc. | | | 62,000 | | | | 4,113,700 | |
Pfizer, Inc. | | | 126,300 | | | | 2,861,958 | |
Polycom, Inc. (a) | | | 83,400 | | | | 1,590,438 | |
PPL Corp. | | | 108,500 | | | | 3,066,210 | |
The Procter & Gamble Co. | | | 27,900 | | | | 1,875,159 | |
QLIK Technologies, Inc. (a) | | | 64,567 | | | | 2,066,144 | |
QUALCOMM, Inc. | | | 33,300 | | | | 2,265,066 | |
Raytheon Co. | | | 68,500 | | | | 3,615,430 | |
Reynolds American, Inc. | | | 98,900 | | | | 4,098,416 | |
Rockwell Automation, Inc. | | | 26,900 | | | | 2,143,930 | |
Rowan Cos., Inc. (a) | | | 40,800 | | | | 1,343,544 | |
Schlumberger Ltd. | | | 43,600 | | | | 3,048,948 | |
SPX Corp. | | | 37,700 | | | | 2,922,881 | |
Stanley Black & Decker, Inc. | | | 47,942 | | | | 3,689,616 | |
Stryker Corp. | | | 27,000 | | | | 1,497,960 | |
Symantec Corp. (a) | | | 63,100 | | | | 1,179,970 | |
Teradata Corp. (a) | | | 30,664 | | | | 2,089,752 | |
TIBCO Software, Inc. (a) | | | 46,764 | | | | 1,426,302 | |
Time Warner, Inc. | | | 72,700 | | | | 2,744,425 | |
United States Steel Corp. | | | 74,600 | | | | 2,191,002 | |
UnitedHealth Group, Inc. | | | 40,600 | | | | 2,392,964 | |
Verizon Communications, Inc. | | | 57,000 | | | | 2,179,110 | |
Viacom, Inc., Class B | | | 38,100 | | | | 1,808,226 | |
WellPoint, Inc. | | | 12,200 | | | | 900,360 | |
See Notes to Financial Statements.
| | | | | | |
| | | | | | |
| | BLACKROCK FUNDS | | MARCH 31, 2012 | | 17 |
| | |
| Schedule of Investments (continued) | | BlackRock Global Opportunities Portfolio |
| | (Percentages shown are based on Net Assets) |
| | | | | | | | |
| Common Stocks | | Shares | | | Value | |
| |
United States (concluded) | | | | | | | | |
Wells Fargo & Co. | | | 104,600 | | | $ | 3,571,044 | |
Whirlpool Corp. | | | 14,200 | | | | 1,091,412 | |
Whole Foods Market, Inc. | | | 23,100 | | | | 1,921,920 | |
| | | | | | | | |
| | | | | | | 194,910,971 | |
| |
Total Long-Term Investments | | | | | | | | |
(Cost – $316,335,420) – 96.8% | | | | | | | 349,017,974 | |
| |
|
| |
| | | | | | | | |
| Short-Term Securities | | Shares | | | Value | |
| |
BlackRock Liquidity Funds, TempFund,
Institutional Class, 0.14% (b)(c) | | | 9,341,977 | | | $ | 9,341,977 | |
| |
Total Short-Term Securities (Cost – $9,341,977) – 2.6% | | | | 9,341,977 | |
| |
Total Investments (Cost – $325,677,397) – 99.4% | | | | 358,359,951 | |
Other Assets Less Liabilities – 0.6% | | | | 2,253,566 | |
| | | | | | | | |
Net Assets – 100.0% | | | | | | $ | 360,613,517 | |
| | | | | | | | |
| | |
(a) Non-income producing security. | | | | | | | | |
(b) Represents the current yield as of report date. | | | | | |
| | (c) | Investments in companies considered to be an affiliate of the Fund during the period, for purposes of Section 2(a)(3) of the Investment Company Act of 1940, as amended, were as follows: |
| | | | | | | | | | | | | | | | | | |
| |
| Affiliate | | Shares Held at
September 30,
2011 | | | Net Activity | | | Shares
Held at
March 31,
2012 | | | Realized
Gain | | Income | |
| |
BlackRock Liquidity Funds, TempFund, Institutional Class | | | 4,695,511 | | | | 4,646,466 | | | | 9,341,977 | | | $199 | | | $3,355 | |
| |
| • | | Foreign currency exchange contracts as of March 31, 2012 were as follows: |
| | | | | | | | | | | | | | |
| |
| | | Currency
Purchased | | | | Currency
Sold | | Counterparty | | Settle- ment
Date | | Unrealized Appreciation (Depreciation) | |
| |
AUD | | 1,380,000 | | USD | | 1,439,976 | | Citibank, N.A. | | 4/11/12 | | | $ (12,438 | ) |
AUD | | 253,000 | | USD | | 268,791 | | Citibank, N.A. | | 4/11/12 | | | (7,076 | ) |
AUD | | 190,000 | | USD | | 202,187 | | Citibank, N.A. | | 4/11/12 | | | (5,642 | ) |
AUD | | 6,530,000 | | USD | | 6,682,149 | | Citibank, N.A. | | 4/11/12 | | | 72,796 | |
CAD | | 396,000 | | USD | | 395,625 | | Citibank, N.A. | | 4/11/12 | | | 1,294 | |
CAD | | 448,000 | | USD | | 447,459 | | Citibank, N.A. | | 4/11/12 | | | 1,581 | |
CAD | | 8,788,000 | | USD | | 8,595,714 | | Citibank, N.A. | | 4/11/12 | | | 212,671 | |
CHF | | 156,000 | | USD | | 172,353 | | Citibank, N.A. | | 4/11/12 | | | 487 | |
CHF | | 265,000 | | USD | | 288,648 | | Citibank, N.A. | | 4/11/12 | | | 4,958 | |
CHF | | 652,000 | | USD | | 716,208 | | Citibank, N.A. | | 4/11/12 | | | 6,173 | |
CHF | | 817,000 | | USD | | 895,290 | | Citibank, N.A. | | 4/11/12 | | | 9,902 | |
CHF | | 1,669,000 | | USD | | 1,820,856 | | UBS AG | | 4/11/12 | | | 28,308 | |
CHF | | 3,968,000 | | USD | | 4,205,978 | | UBS AG | | 4/11/12 | | | 190,355 | |
DKK | | 8,120,000 | | USD | | 1,463,740 | | Citibank, N.A. | | 4/11/12 | | | (8,293 | ) |
EUR | | 352,000 | | USD | | 462,010 | | Citibank, N.A. | | 4/11/12 | | | 7,478 | |
EUR | | 1,673,000 | | USD | | 2,199,222 | | Citibank, N.A. | | 4/11/12 | | | 32,182 | |
EUR | | 2,237,000 | | USD | | 2,951,100 | | Citibank, N.A. | | 4/11/12 | | | 32,552 | |
EUR | | 1,833,000 | | USD | | 2,410,619 | | Citibank, N.A. | | 4/11/12 | | | 34,189 | |
EUR | | 3,188,000 | | USD | | 4,182,296 | | Citibank, N.A. | | 4/11/12 | | | 69,775 | |
EUR | | 2,832,000 | | USD | | 3,754,184 | | UBS AG | | 4/11/12 | | | 23,063 | |
GBP | | 1,700,000 | | USD | | 2,689,271 | | Bank of New York Mellon | | 4/11/12 | | | 29,668 | |
GBP | | 891,000 | | USD | | 1,405,573 | | Citibank, N.A. | | 4/11/12 | | | 19,471 | |
GBP | | 4,608,000 | | USD | | 7,034,425 | | Citibank, N.A. | | 4/11/12 | | | 335,499 | |
GBP | | 2,594,000 | | USD | | 4,104,735 | | Credit Suisse | | 4/11/12 | | | 44,046 | |
| | | | | | | | International | | | | | | |
GBP | | 587,000 | | USD | | 919,770 | | UBS AG | | 4/11/12 | | | 19,063 | |
HKD | | 6,190,000 | | USD | | 798,444 | | Citibank, N.A. | | 4/11/12 | | | (1,295 | ) |
HKD | | 10,961,000 | | USD | | 1,411,115 | | Citibank, N.A. | | 4/11/12 | | | 444 | |
| | | | | | | | | | | | | | |
| |
| | | Currency
Purchased | | | | Currency
Sold | | Counterparty | | Settle- ment
Date | | Unrealized
Appreciation
(Depreciation) | |
| |
JPY | | 112,311,000 | | USD | | 1,465,472 | | Citibank, N.A. | | 4/11/12 | | | $ (108,416 | ) |
JPY | | 106,565,000 | | USD | | 1,360,101 | | Citibank, N.A. | | 4/11/12 | | | (72,474 | ) |
JPY | | 453,056,000 | | USD | | 5,424,872 | | Citibank, N.A. | | 4/11/12 | | | 49,415 | |
JPY | | 701,897,500 | | USD | | 9,146,305 | | Royal Bank of Scotland Plc | | 4/11/12 | | | (665,261 | ) |
JPY | | 104,727,000 | | USD | | 1,303,940 | | UBS AG | | 4/11/12 | | | (38,521 | ) |
MXN | | 14,313,000 | | USD | | 1,045,483 | | Citibank, N.A. | | 4/11/12 | | | 71,961 | |
NOK | | 9,066,000 | | USD | | 1,583,580 | | Citibank, N.A. | | 4/11/12 | | | 7,681 | |
SEK | | 29,055,000 | | USD | | 4,205,879 | | Royal Bank of Scotland Plc | | 4/11/12 | | | 183,716 | |
SGD | | 1,670,000 | | USD | | 1,295,915 | | Royal Bank of Scotland Plc | | 4/11/12 | | | 32,605 | |
USD | | 1,246,845 | | AUD | | 1,202,000 | | Deutsche Bank AG | | 4/11/12 | | | 3,439 | |
USD | | 1,104,332 | | CAD | | 1,105,000 | | Royal Bank of Canada | | 4/11/12 | | | (3,231 | ) |
USD | | 1,914,164 | | CAD | | 1,915,000 | | UBS AG | | 4/11/12 | | | (5,279 | ) |
USD | | 20,077 | | CAD | | 20,000 | | UBS AG | | 4/11/12 | | | 31 | |
USD | | 937,593 | | CHF | | 859,000 | | Citibank, N.A. | | 4/11/12 | | | (14,133 | ) |
USD | | 451,495 | | CHF | | 411,000 | | Citibank, N.A. | | 4/11/12 | | | (3,871 | ) |
USD | | 1,097,004 | | EUR | | 850,000 | | Citibank, N.A. | | 4/11/12 | | | (36,704 | ) |
USD | | 1,536,342 | | EUR | | 1,175,000 | | Citibank, N.A. | | 4/11/12 | | | (30,842 | ) |
USD | | 13,909,080 | | EUR | | 10,865,000 | | Goldman Sachs Bank USA | | 4/11/12 | | | (582,373 | ) |
USD | | 17,998,500 | | EUR | | 14,200,000 | | Northern Trust Co. | | 4/11/12 | | | (941,088 | ) |
USD | | 874,172 | | EUR | | 670,000 | | UBS AG | | 4/11/12 | | | (19,457 | ) |
USD | | 1,002,858 | | EUR | | 760,000 | | UBS AG | | 4/11/12 | | | (10,810 | ) |
USD | | 466,451 | | EUR | | 353,000 | | UBS AG | | 4/11/12 | | | (4,371 | ) |
USD | | 1,325,990 | | GBP | | 840,000 | | Citibank, N.A. | | 4/11/12 | | | (17,485 | ) |
USD | | 1,285,962 | | GBP | | 815,000 | | UBS AG | | 4/11/12 | | | (17,529 | ) |
See Notes to Financial Statements.
| | | | |
| | | | |
18 | | BLACKROCK FUNDS | | MARCH 31, 2012 |
| | |
| Schedule of Investments (concluded) | | BlackRock Global Opportunities Portfolio |
| | |
| | | | | | | | | | | | | | |
| | | Currency
Purchased | | | | Currency Sold | | Counterparty | | Settle- ment Date | | Unrealized
Appreciation
(Depreciation) | |
USD | | 23,215 | | HKD | | 180,000 | | Citibank, N.A. | | 4/11/12 | | $ | 34 | |
USD | | 830,782 | | HKD | | 6,443,000 | | Citibank, N.A. | | 4/11/12 | | | 1,051 | |
USD | | 2,124,479 | | HKD | | 16,479,000 | | Citibank, N.A. | | 4/11/12 | | | 2,311 | |
USD | | 691,608 | | HKD | | 5,363,000 | | Credit Suisse | | 4/11/12 | | | 959 | |
| | | | | | | | International | | | | | | |
USD | | 1,273,104 | | JPY | | 96,907,000 | | Citibank, N.A. | | 4/11/12 | | | 102,174 | |
USD | | 2,221,358 | | JPY | | 172,450,000 | | Citibank, N.A. | | 4/11/12 | | | 137,640 | |
USD | | 1,236,307 | | JPY | | 94,180,000 | | Deutsche Bank AG | | 4/11/12 | | | 98,328 | |
USD | | 405,699 | | JPY | | 31,168,000 | | UBS AG | | 4/11/12 | | | 29,096 | |
USD | | 363,061 | | NOK | | 2,062,000 | | Citibank, N.A. | | 4/11/12 | | | 1,139 | |
USD | | 1,819,107 | | NOK | | 10,943,000 | | UBS AG | | 4/11/12 | | | (101,604 | ) |
USD | | 574,317 | | NOK | | 3,232,000 | | UBS AG | | 4/11/12 | | | 7,038 | |
USD | | 1,252,375 | | NOK | | 7,046,000 | | UBS AG | | 4/11/12 | | | 15,664 | |
USD | | 536,009 | | SEK | | 3,566,000 | | Citibank, N.A. | | 4/11/12 | | | (2,738 | ) |
USD | | 242,890 | | SEK | | 1,624,000 | | Citibank, N.A. | | 4/11/12 | | | (2,462 | ) |
USD | | 548,627 | | SEK | | 3,685,000 | | Deutsche Bank AG | | 4/11/12 | | | (8,098 | ) |
Total | | | | | | | | | | $ | (801,254 | ) |
| | | | | | | | | | | | | | |
| — | | Fair Value Measurements – Various inputs are used in determining the fair value of investments and derivative financial instruments. These inputs are categorized into a disclosure hierarchy consisting of three broad levels for financial statement purposes as follows: |
| | — | | Level 1 - unadjusted price quotations in active markets/exchanges for identical assets and liabilities |
| | — | | Level 2 - other observable inputs (including, but not limited to: quoted prices for similar assets or liabilities in markets that are active, quoted prices for identical or similar assets or liabilities in markets that are not active, inputs other than quoted prices that are observable for the assets or liabilities (such as interest rates, yield curves, volatilities, prepayment speeds, loss severities, credit risks and default rates) or other market–corroborated inputs) |
| | — | | Level 3 - unobservable inputs based on the best information available in the circumstances, to the extent observable inputs are not available (including the Fund’s own assumptions used in determining the fair value of investments and derivative financial instruments) |
Changes in valuation techniques may result in transfers into or out of an assigned level within the disclosure hierarchy. The categorization of a value determined for investments and derivative financial instruments is based on the pricing transparency of the investment and derivative financial instrument and is not necessarily an indication of the risks associated with investing in those securities. For information about the Fund’s policy regarding valuation of investments and derivative financial instruments and other significant accounting policies, please refer to Note 1 of the Notes to Financial Statements.
The following tables summarize the inputs used as of March 31, 2012 in determining the fair valuation of the Fund’s investments and derivative financial instruments:
| | | | | | | | |
| Valuation Inputs | | Level 1 | | Level 2 | | Level 3 | | Total |
Assets: | | | | | | | | |
Investments: | | | | | | | | |
Long-Term Investments: | | | | | | | | |
Common Stocks: | | | | | | | | |
Argentina | | $ 1,991,709 | | – | | – | | $ 1,991,709 |
Australia | | – | | $ 4,047,436 | | – | | 4,047,436 |
Belgium | | – | | 2,985,997 | | – | | 2,985,997 |
Brazil | | 4,553,545 | | – | | – | | 4,553,545 |
Canada | | 9,620,532 | | – | | – | | 9,620,532 |
China | | 200,340 | | 5,142,266 | | – | | 5,342,606 |
France | | – | | 11,105,796 | | – | | 11,105,796 |
Germany | | – | | 13,232,248 | | – | | 13,232,248 |
Hong Kong | | – | | 5,638,044 | | – | | 5,638,044 |
India | | – | | 1,974,618 | | – | | 1,974,618 |
Indonesia | | – | | 1,945,125 | | – | | 1,945,125 |
Ireland | | 4,839,400 | | – | | – | | 4,839,400 |
Israel | | 1,779,285 | | – | | – | | 1,779,285 |
Italy | | – | | 3,193,729 | | – | | 3,193,729 |
Japan | | – | | 15,920,008 | | – | | 15,920,008 |
Luxembourg | | – | | 1,112,237 | | – | | 1,112,237 |
Mexico | | 3,248,081 | | – | | – | | 3,248,081 |
Netherlands | | 458,572 | | 7,061,996 | | – | | 7,520,568 |
Norway | | – | | 2,450,933 | | – | | 2,450,933 |
Singapore | | 1,932,912 | | 1,000,715 | | – | | 2,933,627 |
South Africa | | – | | 2,166,065 | | – | | 2,166,065 |
South Korea | | – | | 6,386,530 | | – | | 6,386,530 |
Spain | | – | | 1,372,334 | | – | | 1,372,334 |
Sweden | | – | | 1,679,611 | | – | | 1,679,611 |
Switzerland | | 1,264,542 | | 7,158,014 | | – | | 8,422,556 |
Taiwan | | – | | 2,386,767 | | – | | 2,386,767 |
United Kingdom | | 3,162,681 | | 23,094,935 | | – | | 26,257,616 |
United States | | 194,910,971 | | – | | – | | 194,910,971 |
Short-Term Securities | | 9,341,977 | | – | | – | | 9,341,977 |
Total | | $237,304,547 | | $121,055,404 | | – | | $358,359,951 |
| | | | |
| | | | | | | | | |
| Valuation Inputs | | Level 1 | | Level 2 | | Level 3 | | Total |
Derivative Financial Instruments1 |
Assets: | | | | | | | | |
Foreign currency exchange contracts | | – | | $1,920,237 | | – | | $1,920,237 |
Liabilities: | | | | | | | | |
Foreign currency exchange contracts | | – | | (2,721,491) | | – | | (2,721,491) |
| Total | | – | | $(801,254) | | – | | $(801,254) |
| 1 | Derivative financial instruments are foreign currency exchange contracts which are valued at the unrealized appreciation/depreciation on the instrument. |
See Notes to Financial Statements.
| | | | | | |
| | | | | | |
| | BLACKROCK FUNDS | | MARCH 31, 2012 | | 19 |
| | |
| Schedule of Investments March 31, 2012 (Unaudited) | | BlackRock Health Sciences Opportunities Portfolio |
| | (Percentages shown are based on Net Assets) |
| | | | | | | | |
| Common Stocks | | Shares | | | Value | |
| |
Biotechnology – 23.7% | | | | | | | | |
3SBio, Inc. - ADR (a) | | | 467,000 | | | $ | 6,911,600 | |
Achillion Pharmaceuticals, Inc. (a)(b) | | | 225,400 | | | | 2,159,332 | |
Acorda Therapeutics, Inc. (a) | | | 633,100 | | | | 16,808,805 | |
Affymax, Inc. (a) | | | 180,700 | | | | 2,121,418 | |
Alexion Pharmaceuticals, Inc. (a) | | | 601,324 | | | | 55,838,947 | |
Algeta ASA (a) | | | 49,000 | | | | 1,236,652 | |
Amgen, Inc. | | | 760,610 | | | | 51,713,874 | |
Amylin Pharmaceuticals, Inc. (a)(b) | | | 566,700 | | | | 14,144,832 | |
Ardea Biosciences, Inc. (a)(b) | | | 27,600 | | | | 600,576 | |
ARIAD Pharmaceuticals, Inc. (a)(b) | | | 1,228,707 | | | | 19,597,877 | |
ArQule, Inc. (a) | | | 333,200 | | | | 2,335,732 | |
Biogen Idec, Inc. (a) | | | 373,659 | | | | 47,069,824 | |
BioMarin Pharmaceutical, Inc. (a)(b) | | | 259,800 | | | | 8,898,150 | |
Celgene Corp. (a) | | | 432,900 | | | | 33,558,408 | |
Cepheid, Inc. (a) | | | 43,300 | | | | 1,811,239 | |
ChemoCentryx, Inc. (a) | | | 153,000 | | | | 1,630,980 | |
CSL Ltd. | | | 135,100 | | | | 5,030,903 | |
Cubist Pharmaceuticals, Inc. (a)(b) | | | 329,000 | | | | 14,229,250 | |
Dendreon Corp. (a)(b) | | | 738,200 | | | | 7,865,521 | |
Exelixis, Inc. (a) | | | 1,293,300 | | | | 6,699,294 | |
Genomic Health, Inc. (a)(b) | | | 90,100 | | | | 2,757,961 | |
Gilead Sciences, Inc. (a) | | | 923,467 | | | | 45,111,363 | |
Human Genome Sciences, Inc. (a)(b) | | | 494,200 | | | | 4,072,208 | |
Incyte Corp. Ltd. (a)(b) | | | 447,900 | | | | 8,644,470 | |
Medivation, Inc. (a) | | | 299,000 | | | | 22,341,280 | |
Momenta Pharmaceuticals, Inc. (a)(b) | | | 227,000 | | | | 3,477,640 | |
Onyx Pharmaceuticals, Inc. (a)(b) | | | 183,500 | | | | 6,914,280 | |
Pharmacyclics, Inc. (a) | | | 556,552 | | | | 15,449,883 | |
Regeneron Pharmaceuticals,
Inc. (a)(b) | | | 60,500 | | | | 7,055,510 | |
Rigel Pharmaceuticals, Inc. (a)(b) | | | 149,800 | | | | 1,205,890 | |
Synta Pharmaceuticals Corp. (a) | | | 852,600 | | | | 3,708,810 | |
Theravance, Inc. (a)(b) | | | 217,400 | | | | 4,239,300 | |
Verastem, Inc. (a) | | | 139,500 | | | | 1,524,735 | |
Vertex Pharmaceuticals, Inc. (a) | | | 229,270 | | | | 9,402,363 | |
| | | | | | | | |
| | | | | | | 436,168,907 | |
| |
Diversified Consumer Services – 0.2% | | | | | |
Stewart Enterprises, Inc., Class A | | | 681,400 | | | | 4,136,098 | |
| |
Food & Staples Retailing – 0.7% | | | | | | | | |
CVS Caremark Corp. (c) | | | 301,200 | | | | 13,493,760 | |
| |
Health Care Equipment & Supplies – 17.4% | | | | | |
Alere, Inc. (a)(b) | | | 191,800 | | | | 4,988,718 | |
Align Technology, Inc. (a)(b) | | | 500,933 | | | | 13,800,704 | |
Baxter International, Inc. | | | 629,700 | | | | 37,643,466 | |
Becton, Dickinson & Co. | | | 56,800 | | | | 4,410,520 | |
Covidien Plc | | | 744,100 | | | | 40,687,388 | |
DENTSPLY International, Inc. | | | 522,100 | | | | 20,951,873 | |
Elekta AB, B Shares | | | 96,300 | | | | 4,874,703 | |
Given Imaging Ltd. (a) | | | 184,300 | | | | 3,451,939 | |
Hologic, Inc. (a) | | | 1,775,200 | | | | 38,255,560 | |
Intuitive Surgical, Inc. (a) | | | 57,000 | | | | 30,879,750 | |
Medtronic, Inc. | | | 1,140,200 | | | | 44,684,438 | |
Natus Medical, Inc. (a) | | | 204,900 | | | | 2,444,457 | |
Sirona Dental Systems, Inc. (a) | | | 111,200 | | | | 5,731,248 | |
St. Jude Medical, Inc. | | | 469,400 | | | | 20,799,114 | |
Stryker Corp. | | | 444,700 | | | | 24,671,956 | |
Varian Medical Systems, Inc. (a) | | | 67,100 | | | | 4,627,216 | |
Zimmer Holdings, Inc. | | | 282,400 | | | | 18,152,672 | |
| | | | | | | | |
| | | | | | | 321,055,722 | |
| |
Health Care Providers & Services – 20.6% | | | | | |
Acadia Healthcare Co., Inc. (a) | | | 141,200 | | | | 2,301,560 | |
| | | | | | | | |
| Common Stocks | | Shares | | | Value | |
| |
Health Care Providers & Services (concluded) | | | | | |
Aetna, Inc. | | | 785,318 | | | $ | 39,391,551 | |
AMERIGROUP Corp. (a) | | | 55,300 | | | | 3,720,584 | |
AmerisourceBergen Corp. | | | 238,300 | | | | 9,455,744 | |
Brookdale Senior Living, Inc. (a) | | | 240,100 | | | | 4,494,672 | |
Cardinal Health, Inc. | | | 469,700 | | | | 20,248,767 | |
Centene Corp. (a) | | | 77,800 | | | | 3,809,866 | |
CIGNA Corp. | | | 329,100 | | | | 16,208,175 | |
Coventry Health Care, Inc. | | | 263,000 | | | | 9,354,910 | |
Express Scripts, Inc. (a)(b) | | | 255,400 | | | | 13,837,572 | |
HCA Holdings, Inc. (a) | | | 286,500 | | | | 7,088,010 | |
Henry Schein, Inc. (a) | | | 124,214 | | | | 9,400,516 | |
Humana, Inc. | | | 288,225 | | | | 26,655,048 | |
Laboratory Corp. of America
Holdings (a) | | | 40,400 | | | | 3,698,216 | |
McKesson Corp. | | | 330,700 | | | | 29,025,539 | |
Medco Health Solutions, Inc. (a) | | | 124,750 | | | | 8,769,925 | |
MEDNAX, Inc. (a)(b) | | | 57,300 | | | | 4,261,401 | |
Quest Diagnostics, Inc. | | | 519,000 | | | | 31,736,850 | |
UnitedHealth Group, Inc. | | | 1,180,400 | | | | 69,572,776 | |
Universal Health Services, Inc.,
Class B | | | 160,400 | | | | 6,722,364 | |
VCA Antech, Inc. (a) | | | 579,500 | | | | 13,450,195 | |
WellPoint, Inc. | | | 633,733 | | | | 46,769,495 | |
| | | | | | | | |
| | | | | | | 379,973,736 | |
| |
Health Care Technology – 1.4% | | | | | | | | |
Cerner Corp. (a) | | | 191,900 | | | | 14,615,104 | |
SXC Health Solutions Corp. (a) | | | 124,600 | | | | 9,340,016 | |
Vocera Communications, Inc. (a) | | | 37,800 | | | | 884,520 | |
| | | | | | | | |
| | | | | | | 24,839,640 | |
| |
Industrial Conglomerates – 1.9% | | | | | | | | |
Danaher Corp. | | | 453,400 | | | | 25,390,400 | |
Koninklijke Philips Electronics NV | | | 465,500 | | | | 9,447,825 | |
| | | | | | | | |
| | | | | | | 34,838,225 | |
| |
Life Sciences Tools & Services – 4.6% | | | | | |
Agilent Technologies, Inc. | | | 446,014 | | | | 19,852,083 | |
Life Technologies Corp. (a) | | | 381,800 | | | | 18,639,476 | |
Luminex Corp. (a)(b) | | | 245,100 | | | | 5,723,085 | |
Mettler-Toledo International, Inc. (a)(b) | | | 49,004 | | | | 9,053,489 | |
Thermo Fisher Scientific, Inc. | | | 233,200 | | | | 13,147,816 | |
Waters Corp. (a) | | | 185,175 | | | | 17,158,315 | |
| | | | | | | | |
| | | | | | | 83,574,264 | |
| |
Pharmaceuticals – 27.8% | | | | | | | | |
Abbott Laboratories | | | 651,500 | | | | 39,930,435 | |
Allergan, Inc. | | | 480,300 | | | | 45,835,029 | |
Auxilium Pharmaceuticals, Inc. (a) | | | 94,445 | | | | 1,753,844 | |
Bristol-Myers Squibb Co. | | | 536,700 | | | | 18,113,625 | |
Elan Corp. Plc - ADR (a) | | | 1,840,200 | | | | 27,621,402 | |
Eli Lilly & Co. | | | 1,007,400 | | | | 40,567,998 | |
Endo Pharmaceuticals Holdings,
Inc. (a) | | | 273,600 | | | | 10,596,528 | |
GlaxoSmithKline Plc | | | 775,800 | | | | 17,343,516 | |
Johnson & Johnson | | | 904,700 | | | | 59,674,012 | |
Merck & Co., Inc. | | | 1,170,100 | | | | 44,931,840 | |
Merck KGaA | | | 151,900 | | | | 16,809,333 | |
Mylan, Inc. (a) | | | 389,800 | | | | 9,140,810 | |
Novartis AG | | | 160,300 | | | | 8,873,835 | |
Pfizer, Inc. | | | 2,084,140 | | | | 47,226,612 | |
Roche Holding AG | | | 149,600 | | | | 26,034,942 | |
Sanofi SA | | | 570,500 | | | | 44,266,194 | |
Shire Plc - ADR | | | 51,100 | | | | 4,841,725 | |
Teva Pharmaceutical Industries Ltd. - ADR | | | 396,100 | | | | 17,848,266 | |
UCB SA | | | 152,700 | | | | 6,590,877 | |
See Notes to Financial Statements.
| | | | |
| | | | |
20 | | BLACKROCK FUNDS | | MARCH 31, 2012 |
| | |
| Schedule of Investments (continued) | | BlackRock Health Science Opportunities Portfolio |
| | (Percentages shown are based on Net Assets) |
| | | | | | | | |
| Common Stocks | | Shares | | | Value | |
| |
Pharmaceuticals (concluded) | |
Valeant Pharmaceuticals International, Inc. (a) | | | 182,600 | | | $ | 9,803,794 | |
ViroPharma, Inc. (a) | | | 255,700 | | | | 7,688,899 | |
Watson Pharmaceuticals,
Inc. (a) | | | 96,900 | | | | 6,498,114 | |
| | | | | | | | |
| | | | | | | 511,991,630 | |
| |
Total Long-Term Investments | | | | | |
(Cost – $1,500,626,133) – 98.3% | | | | 1,810,071,982 | |
| |
| | | | | | | | |
| | | | | | | | |
Short-Term Securities | | | | | | | | |
| | | | | | | | |
BlackRock Liquidity Funds, TempFund, Institutional Class, 0.14% (d)(e) | | | 88,935,556 | | | | 88,935,556 | |
| |
| | |
| | | Beneficial
Interest (000) | | | | |
| |
BlackRock Liquidity Series, LLC Money Market Series, 0.24% (d)(e)(f) | | $ | 103,423 | | | | 103,422,838 | |
| |
Total Short-Term Securities (Cost – $192,358,394) – 10.4% | | | | 192,358,394 | |
| |
Total Investments Before Options Written | | | | | |
(Cost – $1,692,984,527) – 108.7% | | | | 2,002,430,376 | |
| |
| | | | | | | | |
| | | | | | | | |
| | | | | | | | |
| Options Written | | Contracts | | | Value | |
| |
Exchange-Traded Call Options Written | | | | | |
CVS Caremark Corp., Strike Price $45, Expires 4/21/12 | | | 600 | | | $ | (34,200 | ) |
| |
Exchange-Traded Put Options Written | | | | | |
Dendreon Corp., Strike Price $9, Expires 4/21/12 | | | 3,780 | | | | (54,810 | ) |
Medivation, Inc., Strike Price $70, Expires 4/21/12 | | | 870 | | | | (108,750 | ) |
| |
Total Options Written | | | | | | | | |
(Premiums Received – $664,296) – (0.0)% | | | | (197,760 | ) |
| |
Total Investments Net of Options Written – 108.7% | | | | 2,002,232,616 | |
Liabilities in Excess of Other Assets – (8.7)% | | | | (160,681,281 | ) |
| | | | | | | | |
Net Assets – 100.0% | | | | | | $ | 1,841,551,335 | |
| | | | | | | | |
| (a) | Non-income producing security. |
| (b) | Security, or a portion of security, is on loan. |
| (c) | All or a portion of security has been pledged/segregated as collateral in connection with outstanding options written. |
| (d) | Represents the current yield as of report date. |
| (e) | Investments in companies considered to be an affiliate of the Fund during the period, for purposes of Section 2(a)(3) of the Investment Company Act of 1940, as amended, were as follows: |
| | | | | | | | | | | | | | | | | | | | |
| |
| Affiliate | | Shares/
Beneficial
Interest Held at
September 30,
2011 | | | Net Activity | | | Shares/
Beneficial
Interest Held at March 31, 2012 | | | Realized
Gain | | | Income | |
| |
BlackRock Liquidity Funds, TempFund, Institutional Class | | | 114,422,161 | | | | (25,486,605 | ) | | | 88,935,556 | | | $ | 321 | | | $ | 50,791 | |
BlackRock Liquidity Series, LLC Money Market Series | | $ | 27,098,498 | | | $ | 76,324,340 | | | $ | 103,422,838 | | | | – | | | $ | 112,779 | |
| |
(f) Security was purchased with the cash collateral from loaned securities.
| — | | Foreign currency exchange contracts as of March 31, 2012 were as follows: |
| | | | | | | | | | | | | | |
| |
| | | Currency Purchased | | | | Currency Sold | | Counterparty | | Settlement
Date | | Unrealized Appreciation
(Depreciation) | |
| |
EUR | | 4,139,000 | | USD | | 5,492,879 | | Citibank, N.A. | | 4/03/12 | | $ | 27,333 | |
EUR | | 1,531,000 | | USD | | 2,042,054 | | Citibank, N.A. | | 4/04/12 | | | (149 | ) |
AUD | | 3,949,000 | | USD | | 4,195,481 | | Citibank, N.A. | | 4/11/12 | | | (110,446 | ) |
CHF | | 22,866,000 | | USD | | 25,057,175 | | Citibank, N.A. | | 4/11/12 | | | 277,137 | |
CHF | | 15,875,000 | | USD | | 17,319,404 | | UBS AG | | 4/11/12 | | | 269,252 | |
EUR | | 5,864,000 | | USD | | 7,696,670 | | Citibank, N.A. | | 4/11/12 | | | 124,580 | |
GBP | | 1,354,000 | | USD | | 2,135,966 | | Citibank, N.A. | | 4/11/12 | | | 29,589 | |
GBP | | 8,771,000 | | USD | | 13,879,195 | | Credit Suisse International | | 4/11/12 | | | 148,932 | |
USD | | 1,013,435 | | AUD | | 975,000 | | Citibank, N.A. | | 4/11/12 | | | 4,848 | |
USD | | 4,164,878 | | AUD | | 4,006,000 | | Citibank, N.A. | | 4/11/12 | | | 20,880 | |
USD | | 3,501,053 | | AUD | | 3,352,000 | | Citibank, N.A. | | 4/11/12 | | | 33,584 | |
| | | | | | | | | | | | | | |
| |
| | | Currency Purchased | | | | Currency Sold | | Counterparty | | Settlement
Date | | Unrealized Appreciation
(Depreciation) | |
| |
USD | | 8,910,757 | | CHF | | 8,146,000 | | Citibank, N.A. | | 4/11/12 | | $ | (114,578 | ) |
USD | | 1,217,681 | | CHF | | 1,157,000 | | Citibank, N.A. | | 4/11/12 | | | (64,214 | ) |
USD | | 63,507,307 | | CHF | | 59,914,000 | | UBS AG | | 4/11/12 | | | (2,874,219 | ) |
USD | | 2,769,759 | | EUR | | 2,105,000 | | Citibank, N.A. | | 4/11/12 | | | (37,835 | ) |
USD | | 607,276 | | EUR | | 477,000 | | Citibank, N.A. | | 4/11/12 | | | (28,934 | ) |
USD | | 5,493,024 | | EUR | | 4,139,000 | | Citibank, N.A. | | 4/11/12 | | | (27,466 | ) |
USD | | 1,030,030 | | EUR | | 788,000 | | Citibank, N.A. | | 4/11/12 | | | (21,031 | ) |
USD | | 401,775 | | EUR | | 317,000 | | Citibank, N.A. | | 4/11/12 | | | (21,031 | ) |
USD | | 652,879 | | EUR | | 500,000 | | Citibank, N.A. | | 4/11/12 | | | (14,008 | ) |
USD | | 2,042,109 | | EUR | | 1,531,000 | | Citibank, N.A. | | 4/11/12 | | | 101 | |
USD | | 65,802,172 | | EUR | | 51,401,000 | | Goldman Sachs Bank | | 4/11/12 | | | (2,755,136 | ) |
| | | | | | | | USA | | | | | | |
USD | | 594,913 | | GBP | | 388,000 | | Citibank, N.A. | | 4/11/12 | | | (25,645 | ) |
USD | | 32,305,680 | | GBP | | 21,098,000 | | Goldman Sachs Bank | | 4/11/12 | | | (1,437,955 | ) |
| | | | | | | | USA | | | | | | |
See Notes to Financial Statements.
| | | | | | |
| | | | | | |
| | BLACKROCK FUNDS | | MARCH 31, 2012 | | 21 |
| | |
| Schedule of Investments (concluded) | | BlackRock Health Sciences Opportunities Portfolio |
| | |
| | | | | | | | | | | | | | |
| | | Currency
Purchased | | | | Currency
Sold | | Counterparty | | Settle- ment Date | | Unrealized
Appreciation
(Depreciation) | |
USD | | 2,363,923 | | SEK | | 16,508,000 | | Citibank, N.A. | | 4/11/12 | | $ | (130,086 | ) |
USD | | 74,029 | | SEK | | 515,000 | | Citibank, N.A. | | 4/11/12 | | | (3,777 | ) |
USD | | 1,839,232 | | SEK | | 12,733,000 | | UBS AG | | 4/11/12 | | | (84,455 | ) |
| | | | | | |
Total | | | | | | | | | | | | $ | (6,814,729 | ) |
| | | | | | | | | | | | | | |
| — | | For Fund compliance purposes, the Fund’s industry classifications refer to any one or more of the industry sub-classifications used by one or more widely recognized market indexes or ratings group indexes and/or as defined by Fund management. These definitions may not apply for purposes of this report, which may combine industry sub-classifications for reporting ease. |
| — | | Fair Value Measurements – Various inputs are used in determining the fair value of investments and derivative financial instruments. These inputs are categorized into a disclosure hierarchy consisting of three broad levels for financial statement purposes as follows: |
| | — | | Level 1 - unadjusted price quotations in active markets/exchanges for identical assets and liabilities |
| | — | | Level 2 - other observable inputs (including, but not limited to: quoted prices for similar assets or liabilities in markets that are active, quoted prices for identical or similar assets or liabilities in markets that are not active, inputs other than quoted prices that are observable for the assets or liabilities (such as interest rates, yield curves, volatilities, prepayment speeds, loss severities, credit risks and default rates) or other market–corroborated inputs) |
| | — | | Level 3 - unobservable inputs based on the best information available in the circumstances, to the extent observable inputs are not available (including the Fund’s own assumptions used in determining the fair value of investments and derivative financial instruments) |
Changes in valuation techniques may result in transfers into or out of an assigned level within the disclosure hierarchy. The categorization of a value determined for investments and derivative financial instruments is based on the pricing transparency of the investment and derivative financial instrument and is not necessarily an indication of the risks associated with investing in those securities. For information about the Fund’s policy regarding valuation of investments and derivative financial instruments and other significant accounting policies, please refer to Note 1 of the Notes to Financial Statements.
The following tables summarize the inputs used as of March 31, 2012 in determining the fair valuation of the Fund’s investments and derivative financial instruments:
| | | | | | | | |
Valuation Inputs | | Level 1 | | Level 2 | | Level 3 | | Total |
Assets: | | | | | | | | |
Investments: | | | | | | | | |
Long-Term Investments: | | | | | | | | |
Common Stocks: | | | | | | | | |
Biotechnology | | $ 429,901,352 | | $6,267,555 | | – | | $436,168,907 |
Diversified Consumer Services | | 4,136,098 | | – | | – | | 4,136,098 |
Food & Staples Retailing | | 13,493,760 | | – | | – | | 13,493,760 |
Health Care Equipment & Supplies | | 316,181,019 | | 4,874,703 | | – | | 321,055,722 |
Health Care Providers & Services | | 379,973,736 | | – | | – | | 379,973,736 |
Health Care Technology | | 24,839,640 | | – | | – | | 24,839,640 |
Industrial Conglomerates | | 25,390,400 | | 9,447,825 | | – | | 34,838,225 |
Life Sciences Tools & Services | | 83,574,264 | | – | | – | | 83,574,264 |
Pharmaceuticals | | 392,072,933 | | 119,918,697 | | – | | 511,991,630 |
Short-Term Securities | | 88,935,556 | | 103,422,838 | | – | | 192,358,394 |
Total | | $1,758,498,758 | | $243,931,618 | | – | | $2,002,430,376 |
| | |
| | | | | | | | | | | | | | |
Valuation Inputs | | Level 1 | | | Level 2 | | | Level 3 | | Total | |
Derivative Financial Instruments1 | |
Assets: | | | | | | | | | | | | | | |
Foreign currency exchange contracts | | $ | 27,333 $ | | | | 908,903 | | | – | | $ | 936,236 | |
Liabilities: | | | | | | | | | | | | | | |
Equity contracts | | | (197,760 | ) | | | – | | | – | | | (197,760 | ) |
Foreign currency exchange contracts | | | (149 | ) | | | (7,750,816 | ) | | – | | | (7,750,965 | ) |
| Total | | $ | (170,576 | ) | | $ | 6,841,913 | ) | | – | | $ | 7,012,489 | ) |
| 1 | Derivative financial instruments are foreign currency exchange contracts and options. Foreign currency exchange contracts are valued at the unrealized appreciation/depreciation on the instrument and options are shown at value. |
See Notes to Financial Statements.
| | | | |
| | | | |
22 | | BLACKROCK FUNDS | | MARCH 31, 2012 |
| | |
| Schedule of Investments March 31, 2012 (Unaudited) | | BlackRock International Opportunities Portfolio |
| | (Percentages shown are based on Net Assets) |
| | | | | | | | |
| Common Stocks | | Shares | | | Value | |
| |
Argentina – 1.1% | | | | | | | | |
Arcos Dorados Holdings, Inc., Class A | | | 608,300 | | | $ | 11,004,147 | |
MercadoLibre, Inc. (a) | | | 109,567 | | | | 10,714,557 | |
| | | | | | | | |
| | | | | | | 21,718,704 | |
| |
Australia – 3.5% | | | | | | | | |
Australia & New Zealand Banking Group Ltd. | | | 1,127,600 | | | | 27,202,526 | |
BHP Billiton Ltd. | | | 437,600 | | | | 15,775,346 | |
CSL Ltd. | | | 140,500 | | | | 5,231,990 | |
Newcrest Mining Ltd. | | | 579,100 | | | | 17,811,224 | |
| | | | | | | | |
| | | | | | | 66,021,086 | |
| |
Belgium – 0.9% | | | | | | | | |
Anheuser-Busch InBev NV | | | 244,500 | | | | 17,806,736 | |
| |
Bermuda – 0.7% | | | | | | | | |
Seadrill Ltd. | | | 333,700 | | | | 12,530,427 | |
| |
Brazil – 3.9% | | | | | | | | |
Banco Bradesco SA, Preference Shares | | | 1,485,400 | | | | 25,876,206 | |
BM&FBovespa SA | | | 1,988,400 | | | | 12,188,883 | |
BRF - Brasil Foods SA | | | 480,600 | | | | 9,491,156 | |
Cia Energetica de Minas Gerais - ADR | | | 505,225 | | | | 12,014,252 | |
PDG Realty SA Empreendimentos e Participacoes | | | 1,560,700 | | | | 5,377,744 | |
Tractebel Energia SA | | | 560,200 | | | | 9,973,705 | |
| | | | | | | | |
| | | | | | | 74,921,946 | |
| |
Canada – 4.7% | | | | | | | | |
First Quantum Minerals Ltd. | | | 507,400 | | | | 9,675,420 | |
Gildan Activewear, Inc. | | | 225,300 | | | | 6,200,296 | |
Manulife Financial Corp. | | | 721,600 | | | | 9,773,739 | |
Royal Bank of Canada | | | 262,900 | | | | 15,237,104 | |
Suncor Energy, Inc. | | | 422,300 | | | | 13,797,942 | |
The Toronto-Dominion Bank | | | 135,500 | | | | 11,500,757 | |
TransCanada Corp. | | | 185,000 | | | | 7,943,807 | |
Yamana Gold, Inc. | | | 1,009,200 | | | | 15,743,297 | |
| | | | | | | | |
| | | | | | | 89,872,362 | |
| |
China – 2.7% | | | | | | | | |
Baidu, Inc. - ADR (b) | | | 73,300 | | | | 10,684,941 | |
China Construction Bank Corp., H Shares | | | 26,177,800 | | | | 20,204,530 | |
Lentuo International, Inc. - ADR (b) | | | 301,000 | | | | 1,137,780 | |
Tencent Holdings Ltd. | | | 419,400 | | | | 11,707,332 | |
Zoomlion Heavy Industry Science and | | | | | | | | |
Technology Co. Ltd., H Shares | | | 6,556,400 | | | | 8,717,871 | |
| | | | | | | | |
| | | | | | | 52,452,454 | |
| |
France – 4.1% | | | | | | | | |
AXA SA | | | 861,027 | | | | 14,288,730 | |
BNP Paribas SA | | | 151,170 | | | | 7,191,223 | |
Danone SA | | | 167,900 | | | | 11,712,034 | |
GDF SUEZ | | | 367,600 | | | | 9,501,954 | |
LVMH Moet Hennessy Louis Vuitton SA | | | 62,800 | | | | 10,806,955 | |
Sanofi SA | | | 280,600 | | | | 21,772,295 | |
Société Generale SA | | | 90,300 | | | | 2,649,672 | |
| | | | | | | | |
| | | | | | | 77,922,863 | |
| |
Germany – 7.6% | | | | | | | | |
Adidas AG | | | 162,305 | | | | 12,682,696 | |
Allianz SE | | | 155,400 | | | | 18,547,326 | |
Continental AG | | | 96,400 | | | | 9,100,553 | |
Daimler AG | | | 184,500 | | | | 11,125,454 | |
Deutsche Bank AG | | | 347,800 | | | | 17,316,742 | |
Deutsche Lufthansa AG | | | 728,200 | | | | 10,182,876 | |
Gerry Weber International AG | | | 358,688 | | | | 13,762,916 | |
Infineon Technologies AG | | | 1,144,671 | | | | 11,699,042 | |
K+S AG | | | 260,000 | | | | 13,597,267 | |
| | | | | | | | |
| Common Stocks | | Shares | | | Value | |
| |
Germany (concluded) | | | | | | | | |
Merck KGaA | | | 136,300 | | | $ | 15,083,029 | |
Volkswagen AG, Preference Shares | | | 72,648 | | | | 12,776,167 | |
| | | | | | | | |
| | | | | | | 145,874,068 | |
| |
Gibraltar – 0.1% | | | | | | | | |
Bwin.Party Digital Entertainment Plc | | | 788,075 | | | | 1,955,839 | |
| |
Hong Kong – 3.4% | | | | | | | | |
AIA Group Ltd. | | | 4,648,000 | | | | 17,063,357 | |
China Merchants Holdings International Co. Ltd. | | | 3,013,900 | | | | 10,094,117 | |
China Mobile Ltd. | | | 829,100 | | | | 9,129,699 | |
Hong Kong Exchanges and Clearing Ltd. | | | 499,100 | | | | 8,400,031 | |
Melco Crown Entertainment Ltd. - ADR (b) | | | 653,300 | | | | 8,891,413 | |
REXLot Holdings Ltd. | | | 40,096,100 | | | | 3,564,428 | |
Wharf Holdings Ltd. | | | 1,540,000 | | | | 8,397,470 | |
| | | | | | | | |
| | | | | | | 65,540,515 | |
| |
India – 0.6% | | | | | | | | |
ICICI Bank Ltd. | | | 283,800 | | | | 4,922,275 | |
Jubilant Foodworks Ltd. (b) | | | 284,601 | | | | 6,571,931 | |
| | | | | | | | |
| | | | | | | 11,494,206 | |
| |
Indonesia – 1.1% | | | | | | | | |
Adaro Energy Tbk PT | | | 35,183,200 | | | | 7,433,348 | |
Indofood Sukses Makmur Tbk PT | | | 17,589,500 | | | | 9,345,932 | |
Tower Bersama Infrastructure Tbk PT (b) | | | 11,940,500 | | | | 3,859,581 | |
| | | | | | | | |
| | | | | | | 20,638,861 | |
| |
Ireland – 2.5% | | | | | | | | |
Accenture Plc, Class A | | | 186,300 | | | | 12,016,350 | |
Covidien Plc | | | 204,400 | | | | 11,176,592 | |
Experian Plc | | | 1,287,361 | | | | 20,080,972 | |
Shire Plc - ADR | | | 55,600 | | | | 5,268,100 | |
| | | | | | | | |
| | | | | | | 48,542,014 | |
| |
Israel – 0.9% | | | | | | | | |
Check Point Software Technologies Ltd. (b) | | | 168,800 | | | | 10,776,192 | |
Teva Pharmaceutical Industries
Ltd. - ADR | | | 161,000 | | | | 7,254,660 | |
| | | | | | | | |
| | | | | | | 18,030,852 | |
| |
Italy – 1.4% | | | | | | | | |
ENI SpA | | | 652,000 | | | | 15,279,802 | |
Intesa Sanpaolo SpA | | | 6,878,000 | | | | 12,328,158 | |
| | | | | | | | |
| | | | | | | 27,607,960 | |
| |
Japan – 12.1% | | | | | | | | |
Bridgestone Corp. | | | 720,000 | | | | 17,608,030 | |
The Chiba Bank Ltd. | | | 1,892,000 | | | | 12,121,806 | |
Daiwa Office Investment Corp. | | | 1,369 | | | | 3,670,391 | |
Honda Motor Co. Ltd. | | | 320,100 | | | | 12,328,395 | |
IHI Corp. | | | 8,449,000 | | | | 21,476,642 | |
Japan Prime Realty Investment Corp. | | | 1,770 | | | | 5,106,616 | |
JGC Corp. | | | 477,000 | | | | 14,886,155 | |
Kubota Corp. | | | 1,711,100 | | | | 16,562,903 | |
Mitsui Fudosan Co. Ltd. | | | 586,300 | | | | 11,321,997 | |
ORIX Corp. | | | 118,000 | | | | 11,336,944 | |
SMC Corp. | | | 84,200 | | | | 13,474,583 | |
Softbank Corp. | | | 435,200 | | | | 12,956,412 | |
Sumitomo Mitsui Financial Group, Inc. | | | 570,500 | | | | 18,882,259 | |
Tokyo Electron Ltd. | | | 36,100 | | | | 2,081,684 | |
Toray Industries, Inc. | | | 2,339,500 | | | | 17,450,112 | |
Toyota Motor Corp. | | | 354,300 | | | | 15,416,339 | |
Yamato Holdings Co. Ltd. | | | 476,800 | | | | 7,406,213 | |
Zeon Corp. | | | 1,780,600 | | | | 16,647,032 | |
| | | | | | | | |
| | | | | | | 230,734,513 | |
| |
See Notes to Financial Statements.
| | | | | | |
| | | | | | |
| | BLACKROCK FUNDS | | MARCH 31, 2012 | | 23 |
| | |
| Schedule of Investments (continued) | | BlackRock International Opportunities Portfolio |
| | (Percentages shown are based on Net Assets) |
| | | | | | | | |
| Common Stocks | | Shares | | | Value | |
| |
Luxembourg – 0.8% | | | | | | | | |
ArcelorMittal | | | 830,500 | | | $ | 15,898,679 | |
| |
Malaysia – 0.5% | | | | | | | | |
Genting Malaysia BHD | | | 6,800,400 | | | | 8,710,752 | |
| |
Mexico – 1.3% | | | | | | | | |
Fomento Economico Mexicano SAB de CV - ADR | | | 199,200 | | | | 16,388,184 | |
Grupo Modelo SAB de CV, Series C | | | 1,209,500 | | | | 8,480,057 | |
| | | | | | | | |
| | | | | | | 24,868,241 | |
| |
Netherlands – 4.1% | | | | | | | | |
Akzo Nobel NV | | | 223,800 | | | | 13,219,996 | |
ASML Holding NV | | | 41,900 | | | | 2,099,257 | |
Corio NV | | | 34,539 | | | | 1,822,262 | |
Koninklijke DSM NV | | | 252,800 | | | | 14,634,816 | |
Royal Dutch Shell Plc, A Shares | | | 999,000 | | | | 35,000,954 | |
Unilever NV | | | 271,900 | | | | 9,251,284 | |
Ziggo NV (b) | | | 77,800 | | | | 2,427,002 | |
| | | | | | | | |
| | | | | | | 78,455,571 | |
| |
Norway – 1.3% | | | | | | | | |
Statoil ASA | | | 675,300 | | | | 18,329,073 | |
Storebrand ASA | | | 1,267,000 | | | | 6,412,708 | |
| | | | | | | | |
| | | | | | | 24,741,781 | |
| |
Singapore – 3.0% | | | | | | | | |
Avago Technologies Ltd. | | | 303,100 | | | | 11,811,807 | |
DBS Group Holdings Ltd. | | | 1,165,000 | | | | 13,163,870 | |
Sakari Resources Ltd. | | | 6,385,600 | | | | 11,857,791 | |
Singapore Telecommunications Ltd. | | | 8,177,100 | | | | 20,528,219 | |
| | | | | | | | |
| | | | | | | 57,361,687 | |
| |
South Africa – 1.0% | | | | | | | | |
MTN Group Ltd. | | | 529,900 | | | | 9,343,890 | |
Naspers Ltd., N Shares | | | 165,600 | | | | 9,316,894 | |
| | | | | | | | |
| | | | | | | 18,660,784 | |
| |
South Korea – 2.3% | | | | | | | | |
Hyundai Marine & Fire Insurance Co. Ltd. | | | 441,200 | | | | 12,706,061 | |
Samsung Electronics Co. Ltd. | | | 15,000 | | | | 16,920,822 | |
Samsung Life Insurance Co. Ltd. | | | 125,600 | | | | 10,979,820 | |
SK Hynix, Inc. | | | 146,100 | | | | 3,778,147 | |
| | | | | | | | |
| | | | | | | 44,384,850 | |
| |
Spain – 1.4% | | | | | | | | |
Banco Santander SA | | | 1,350,400 | | | | 10,384,702 | |
Repsol YPF SA | | | 290,195 | | | | 7,295,055 | |
Telefonica SA | | | 574,600 | | | | 9,427,223 | |
| | | | | | | | |
| | | | | | | 27,106,980 | |
| |
Sweden – 1.5% | | | | | | | | |
Svenska Cellulosa AB, B Shares | | | 533,900 | | | | 9,252,064 | |
Volvo AB, B Shares | | | 1,338,500 | | | | 19,498,342 | |
| | | | | | | | |
| | | | | | | 28,750,406 | |
| |
Switzerland – 6.8% | | | | | | | | |
Julius Baer Group Ltd. | | | 320,500 | | | | 12,941,191 | |
Nestle SA | | | 654,800 | | | | 41,197,772 | |
Novartis AG | | | 86,300 | | | | 4,777,367 | |
Roche Holding AG | | | 81,100 | | | | 14,113,862 | |
Swiss Re AG | | | 284,300 | | | | 18,155,316 | |
Syngenta AG | | | 35,500 | | | | 12,232,666 | |
TE Connectivity Ltd. | | | 263,000 | | | | 9,665,250 | |
Xstrata Plc | | | 930,909 | | | | 15,948,075 | |
| | | | | | | | |
| | | | | | | 129,031,499 | |
| |
Taiwan – 2.1% | | | | | | | | |
Chunghwa Telecom Co. Ltd. - ADR | | | 239,767 | | | | 7,375,233 | |
| | | | | | | | |
| Common Stocks | | Shares | | | Value | |
| |
Taiwan (concluded) | | | | | | | | |
Mega Financial Holding Co. Ltd. | | | 16,132,946 | | | $ | 11,413,221 | |
Taiwan Semiconductor Manufacturing Co. Ltd. | | | 3,586,000 | | | | 10,309,664 | |
United Microelectronics Corp. | | | 21,590,000 | | | | 10,516,245 | |
| | | | | | | | |
| | | | | | | 39,614,363 | |
| |
United Kingdom – 16.3% | | | | | | | | |
Barclays Plc | | | 4,041,200 | | | | 15,228,981 | |
Barratt Developments Plc (b) | | | 467,962 | | | | 1,055,649 | |
Bellway Plc | | | 196,942 | | | | 2,580,028 | |
BG Group Plc | | | 843,800 | | | | 19,564,766 | |
BP Plc | | | 3,075,900 | | | | 22,906,931 | |
British American Tobacco Plc | | | 591,000 | | | | 29,771,165 | |
Britvic Plc | | | 1,891,800 | | | | 11,643,719 | |
Compass Group Plc | | | 732,600 | | | | 7,680,175 | |
Diageo Plc | | | 393,000 | | | | 9,461,725 | |
GlaxoSmithKline Plc | | | 629,200 | | | | 14,066,177 | |
HSBC Holdings Plc | | | 2,874,099 | | | | 25,528,175 | |
Imperial Tobacco Group Plc | | | 528,600 | | | | 21,442,903 | |
Inchcape Plc | | | 1,114,820 | | | | 6,706,931 | |
Invensys Plc | | | 3,411,000 | | | | 10,864,219 | |
Kazakhmys Plc | | | 452,184 | | | | 6,583,142 | |
Meggitt Plc | | | 1,527,300 | | | | 9,875,623 | |
National Grid Plc | | | 2,335,200 | | | | 23,535,979 | |
Persimmon Plc | | | 224,270 | | | | 2,298,809 | |
Rexam Plc | | | 2,033,100 | | | | 13,924,025 | |
SSE Plc | | | 719,000 | | | | 15,289,590 | |
Subsea 7 SA | | | 660,200 | | | | 17,485,867 | |
Taylor Wimpey Plc | | | 3,365,206 | | | | 2,775,428 | |
Vodafone Group Plc - ADR | | | 738,600 | | | | 20,437,062 | |
| | | | | | | | |
| | | | | | | 310,707,069 | |
| |
United States – 0.3% | | | | | | | | |
NII Holdings, Inc. (b) | | | 255,200 | | | | 4,672,712 | |
| |
Total Long-Term Investments (Cost – $1,675,847,474) – 94.0% | | | | 1,796,630,780 | |
| |
| | | | | | | | |
| |
Short-Term Securities | | | | | | | | |
BlackRock Liquidity Funds, TempFund, Institutional Class, 0.14% (c)(d) | | | 73,310,419 | | | | 73,310,419 | |
| |
| | | Beneficial Interest (000) | | | | |
| |
BlackRock Liquidity Series, LLC Money Market Series,
0.24% (c)(d)(e) | | | $ 475 | | | | 474,700 | |
| |
Total Short-Term Securities (Cost – $73,785,119) – 3.8% | | | | | | | 73,785,119 | |
| |
Total Investments (Cost – $1,749,632,593) – 97.8% | | | | 1,870,415,899 | |
Other Assets Less Liabilities – 2.2% | | | | 41,141,169 | |
| | | | | | | | |
Net Assets – 100.0% | | | | | | $ | 1,911,557,068 | |
| | | | | | | | |
| (a) | Security, or a portion of security, is on loan. |
| (b) | Non-income producing security. |
See Notes to Financial Statements.
| | | | |
| | | | |
24 | | BLACKROCK FUNDS | | MARCH 31, 2012 |
| | |
| Schedule of Investments (continued) | | BlackRock International Opportunities Portfolio |
| (c) | Investments in companies considered to be an affiliate of the Fund during the period, for purposes of Section 2(a)(3) of the Investment Company Act of 1940, as amended, were as follows: |
| | | | | | | | | | | | | | | | | | | | |
| |
| Affiliate | | Shares/
Beneficial
Interest Held at
September 30,
2011 | | | Net
Activity | | | Shares/
Beneficial
Interest Held at
March 31,
2012 | | | Realized
Gain | | | Income | |
| |
BlackRock Liquidity Funds, TempFund, Institutional Class | | | 71,355,791 | | | | 1,954,628 | | | | 73,310,419 | | | $ | 1,306 | | | $ | 50,135 | |
BlackRock Liquidity Series, LLC
Money Market Series | | $ | 7,202,388 | | | $ | (6,727,688 | ) | | $ | 474,700 | | | | – | | | $ | 4,390 | |
| |
| (d) | Represents the current yield as of report date. |
| (e) | Security was purchased with the cash collateral from loaned securities. |
| — | Foreign currency exchange contracts as of March 31, 2012 were as follows: |
| | | | | | | | | | | | | | |
| | | Currency
Purchased | | | | Currency
Sold | | Counterparty | | Settle- ment Date | | Unrealized
Appreciation
(Depreciation) | |
AUD | | 22,676,000 | | USD | | 23,100,087 | | Citibank, N.A. | | 4/11/12 | | $ | 357,054 | |
AUD | | 32,305,000 | | USD | | 33,057,707 | | Citibank, N.A. | | 4/11/12 | | | 360,133 | |
CAD | | 14,060,000 | | USD | | 14,043,008 | | Citibank, N.A. | | 4/11/12 | | | 49,607 | |
CAD | | 66,129,000 | | USD | | 64,682,062 | | Citibank, N.A. | | 4/11/12 | | | 1,600,335 | |
CHF | | 580,000 | | USD | | 640,798 | | Citibank, N.A. | | 4/11/12 | | | 1,811 | |
CHF | | 2,671,000 | | USD | | 2,934,036 | | Citibank, N.A. | | 4/11/12 | | | 25,290 | |
CHF | | 7,819,000 | | USD | | 8,568,269 | | Citibank, N.A. | | 4/11/12 | | | 94,767 | |
CHF | | 4,189,000 | | USD | | 4,570,141 | | UBS AG | | 4/11/12 | | | 71,049 | |
CHF | | 19,314,000 | | USD | | 20,472,346 | | UBS AG | | 4/11/12 | | | 926,539 | |
DKK | | 50,987,000 | | USD | | 9,191,095 | | Citibank, N.A. | | 4/11/12 | | | (52,071 | ) |
EUR | | 14,692,000 | | USD | | 19,382,010 | | Citibank, N.A. | | 4/11/12 | | | 213,796 | |
EUR | | 13,593,000 | | USD | | 17,876,453 | | Citibank, N.A. | | 4/11/12 | | | 253,534 | |
EUR | | 19,308,000 | | USD | | 25,381,100 | | Citibank, N.A. | | 4/11/12 | | | 371,405 | |
EUR | | 21,732,000 | | USD | | 28,523,880 | | Citibank, N.A. | | 4/11/12 | | | 461,693 | |
EUR | | 5,554,000 | | USD | | 7,362,549 | | UBS AG | | 4/11/12 | | | 45,231 | |
GBP | | 1,241,000 | | USD | | 1,957,706 | | Citibank, N.A. | | 4/11/12 | | | 27,120 | |
GBP | | 14,753,000 | | USD | | 22,521,458 | | Citibank, N.A. | | 4/11/12 | | | 1,074,136 | |
GBP | | 28,936,000 | | USD | | 45,788,211 | | Credit Suisse | | 4/11/12 | | | 491,333 | |
| | | | | | | | International | | | | | | |
GBP | | 2,044,000 | | USD | | 3,202,744 | | UBS AG | | 4/11/12 | | | 66,381 | |
HKD | | 132,411,000 | | USD | | 17,046,545 | | Citibank, N.A. | | 4/11/12 | | | 5,367 | |
JPY | | 1,130,915,000 | | USD | | 14,756,564 | | Citibank, N.A. | | 4/11/12 | | | (1,091,691 | ) |
JPY | | 615,674,000 | | USD | | 8,006,018 | | Citibank, N.A. | | 4/11/12 | | | (566,815 | ) |
JPY | | 502,722,000 | | USD | | 6,416,297 | | Citibank, N.A. | | 4/11/12 | | | (341,895 | ) |
JPY | | 803,890,000 | | USD | | 9,625,742 | | Citibank, N.A. | | 4/11/12 | | | 87,680 | |
JPY | | 3,341,599,500 | | USD | | 43,543,805 | | Royal Bank of Scotland Plc | | 4/11/12 | | | (3,167,179 | ) |
MXN | | 171,945,000 | | USD | | 12,559,597 | | Citibank, N.A. | | 4/11/12 | | | 864,482 | |
NOK | | 69,893,000 | | USD | | 12,208,378 | | Citibank, N.A. | | 4/11/12 | | | 59,213 | |
NOK | | 44,378,000 | | USD | | 7,971,432 | | UBS AG | | 4/11/12 | | | (182,224 | ) |
SEK | | 223,645,000 | | USD | | 32,373,902 | | Royal Bank of Scotland Plc | | 4/11/12 | | | 1,414,120 | |
USD | | 535,301 | | AUD | | 515,000 | | Citibank, N.A. | | 4/11/12 | | | 2,561 | |
USD | | 2,202,000 | | AUD | | 2,118,000 | | Citibank, N.A. | | 4/11/12 | | | 11,039 | |
| | | | | | | | | | | | | | |
| | | | | | | | | | | | | | |
| | | Currency
Purchased | | | | Currency
Sold | | Counterparty | | Settle- ment Date | | Unrealized
Appreciation
(Depreciation) | |
USD | | 1,850,796 | | AUD | | 1,772,000 | | Citibank, N.A. | | 4/11/12 | | $ | 17,754 | |
USD | | 9,182,195 | | AUD | | 8,769,000 | | Citibank, N.A. | | 4/11/12 | | | 111,122 | |
USD | | 9,596,520 | | CAD | | 9,690,000 | | Citibank, N.A. | | 4/11/12 | | | (115,957 | ) |
USD | | 2,821,905 | | CAD | | 2,826,000 | | Citibank, N.A. | | 4/11/12 | | | (10,650 | ) |
USD | | 12,604,442 | | CHF | | 11,555,500 | | Citibank, N.A. | | 4/11/12 | | | (198,438 | ) |
USD | | 5,348,106 | | CHF | | 4,972,000 | | Citibank, N.A. | | 4/11/12 | | | (160,606 | ) |
USD | | 3,351,447 | | CHF | | 3,101,000 | | Citibank, N.A. | | 4/11/12 | | | (84,296 | ) |
USD | | 4,797,763 | | CHF | | 4,386,000 | | Citibank, N.A. | | 4/11/12 | | | (61,692 | ) |
USD | | 4,325,051 | | CHF | | 3,940,000 | | Citibank, N.A. | | 4/11/12 | | | (40,260 | ) |
USD | | 1,245,205 | | EUR | | 935,000 | | Bank of New York Mellon | | 4/11/12 | | | (1,811 | ) |
USD | | 7,647,324 | | EUR | | 5,826,000 | | Citibank, N.A. | | 4/11/12 | | | (123,242 | ) |
USD | | 10,011,406 | | EUR | | 7,550,000 | | Citibank, N.A. | | 4/11/12 | | | (58,587 | ) |
USD | | 3,753,136 | | EUR | | 2,823,000 | | Citibank, N.A. | | 4/11/12 | | | (12,107 | ) |
USD | | 84,208,500 | | EUR | | 65,779,000 | | Goldman Sachs Bank USA | | 4/11/12 | | | (3,525,809 | ) |
USD | | 89,739,000 | | EUR | | 70,800,000 | | Northern Trust Co. | | 4/11/12 | | | (4,692,188 | ) |
USD | | 9,320,877 | | EUR | | 7,175,000 | | UBS AG | | 4/11/12 | | | (248,950 | ) |
USD | | 5,995,146 | | EUR | | 4,537,000 | | UBS AG | | 4/11/12 | | | (56,185 | ) |
USD | | 11,570,845 | | GBP | | 7,330,000 | | Citibank, N.A. | | 4/11/12 | | | (152,581 | ) |
USD | | 7,631,428 | | GBP | | 4,815,000 | | Citibank, N.A. | | 4/11/12 | | | (69,567 | ) |
USD | | 5,814,281 | | GBP | | 3,665,000 | | Citibank, N.A. | | 4/11/12 | | | (47,432 | ) |
USD | | 1,648,064 | | GBP | | 1,052,000 | | Citibank, N.A. | | 4/11/12 | | | (34,479 | ) |
USD | | 2,053,375 | | GBP | | 1,296,000 | | Citibank, N.A. | | 4/11/12 | | | (19,417 | ) |
USD | | 1,318,719 | | GBP | | 832,000 | | Citibank, N.A. | | 4/11/12 | | | (11,962 | ) |
USD | | 1,559,700 | | GBP | | 994,000 | | Deutsche Bank AG | | 4/11/12 | | | (30,079 | ) |
USD | | 1,895,742 | | HKD | | 14,716,000 | | Citibank, N.A. | | 4/11/12 | | | 613 | |
USD | | 1,062,950 | | HKD | | 8,242,000 | | Citibank, N.A. | | 4/11/12 | | | 1,544 | |
USD | | 2,830,752 | | HKD | | 21,949,000 | | Citibank, N.A. | | 4/11/12 | | | 4,156 | |
USD | | 5,551,054 | | HKD | | 43,058,000 | | Citibank, N.A. | | 4/11/12 | | | 6,037 | |
USD | | 1,541,275 | | HKD | | 11,950,000 | | UBS AG | | 4/11/12 | | | 2,352 | |
USD | | 9,133,844 | | JPY | | 709,085,000 | | Citibank, N.A. | | 4/11/12 | | | 565,953 | |
USD | | 8,378,979 | | JPY | | 637,797,000 | | Citibank, N.A. | | 4/11/12 | | | 672,463 | |
USD | | 8,143,715 | | JPY | | 620,376,000 | | Deutsche Bank AG | | 4/11/12 | | | 647,697 | |
USD | | 8,746,300 | | JPY | | 671,938,000 | | UBS AG | | 4/11/12 | | | 627,257 | |
USD | | 1,944,998 | | NOK | | 11,070,000 | | Citibank, N.A. | | 4/11/12 | | | 1,996 | |
USD | | 1,918,834 | | NOK | | 10,898,000 | | Citibank, N.A. | | 4/11/12 | | | 6,021 | |
See Notes to Financial Statements.
| | | | | | |
| | | | | | |
| | BLACKROCK FUNDS | | MARCH 31, 2012 | | 25 |
| | |
| Schedule of Investments (concluded) | | BlackRock International Opportunities Portfolio |
| | | | | | | | | | | | | | | | |
| | | Currency
Purchased | | | | | Currency
Sold | | Counterparty | | Settle- ment
Date | | Unrealized
Appreciation
(Depreciation) | |
USD | | 3,541,123 | | | NOK | | | 19,815,000 | | Citibank, N.A. | | 4/11/12 | | $ | 63,203 | |
USD | | 38,429,813 | | | NOK | | | 231,178,000 | | UBS AG | | 4/11/12 | | | (2,146,456 | ) |
USD | | 3,053,016 | | | NOK | | | 17,181,000 | | UBS AG | | 4/11/12 | | | 37,414 | |
USD | | 6,656,286 | | | NOK | | | 37,449,000 | | UBS AG | | 4/11/12 | | | 83,253 | |
USD | | 1,972,418 | | | SEK | | | 13,774,000 | | Citibank, N.A. | | 4/11/12 | | | (108,542 | ) |
USD | | 6,223,930 | | | SEK | | | 41,407,000 | | Citibank, N.A. | | 4/11/12 | | | (31,790 | ) |
USD | | 2,819,255 | | | SEK | | | 18,850,000 | | Citibank, N.A. | | 4/11/12 | | | (28,581 | ) |
USD | | 6,398,319 | | | SEK | | | 42,976,000 | | Deutsche Bank AG | | 4/11/12 | | | (94,444 | ) |
USD | | 1,990,178 | | | SEK | | | 13,778,000 | | UBS AG | | 4/11/12 | | | (91,386 | ) |
USD | | 5,037,458 | | | SGD | | | 6,324,000 | | Citibank, N.A. | | 4/11/12 | | | 6,584 | |
USD | | 3,174,563 | | | SGD | | | 3,990,000 | | Deutsche Bank AG | | 4/11/12 | | | 434 | |
USD | | 10,863,180 | | | SGD | | | 13,999,000 | | Royal Bank of Scotland Plc | | 4/11/12 | | | (273,317 | ) |
USD | | 3,806,537 | | | SGD | | | 4,782,000 | | Royal Bank of Scotland Plc | | 4/11/12 | | | 2,356 | |
| | | | | | |
Total | | | | | | | | | | | | | | $ | (6,138,801 | ) |
| — | | Fair Value Measurements – Various inputs are used in determining the fair value of investments and derivative financial instruments. These inputs are categorized into a disclosure hierarchy consisting of three broad levels for financial statement purposes as follows: |
| | — | | Level 1 - unadjusted price quotations in active markets/exchanges for identical assets and liabilities |
| | — | | Level 2 - other observable inputs (including, but not limited to: quoted prices for similar assets or liabilities in markets that are active, quoted prices for identical or similar assets or liabilities in markets that are not active, inputs other than quoted prices that are observable for the assets or liabilities (such as interest rates, yield curves, volatilities, prepayment speeds, loss severities, credit risks and default rates) or other market–corroborated inputs) |
| | — | | Level 3 - unobservable inputs based on the best information available in the circumstances, to the extent observable inputs are not available (including the Fund’s own assumptions used in determining the fair value of investments and derivative financial instruments) |
Changes in valuation techniques may result in transfers into or out of an assigned level within the disclosure hierarchy. The categorization of a value determined for investments and derivative financial instruments is based on the pricing transparency of the investment and derivative financial instrument and is not necessarily an indication of the risks associated with investing in those securities. For information about the Fund’s policy regarding valuation of investments and derivative financial instruments and other significant accounting policies, please refer to Note 1 of the Notes to Financial Statements.
The following tables summarize the inputs used as of March 31, 2012 in determining the fair valuation of the Fund’s investments and derivative financial instruments:
| | | | | | | | | | | | | | |
| Valuation Inputs | | Level 1 | | | Level 2 | | | Level 3 | | Total | |
Assets: | | | | | | | | | | | | | | |
Investments: | | | | | | | | | | | | | | |
Long-Term Investments: | | | | | | | | | | | | | | |
Common Stocks: | | | | | | | | | | | | | | |
Argentina | | $ | 21,718,704 | | | | – | | | – | | $ | 21,718,704 | |
Australia | | | – | | | $ | 66,021,086 | | | – | | | 66,021,086 | |
Belgium | | | – | | | | 17,806,736 | | | – | | | 17,806,736 | |
Bermuda | | | – | | | | 12,530,427 | | | – | | | 12,530,427 | |
Brazil | | | 74,921,946 | | | | – | | | – | | | 74,921,946 | |
Canada | | | 89,872,362 | | | | – | | | – | | | 89,872,362 | |
China | | | 11,822,721 | | | | 40,629,733 | | | – | | | 52,452,454 | |
France | | | – | | | | 77,922,863 | | | – | | | 77,922,863 | |
Germany | | | – | | | | 145,874,068 | | | – | | | 145,874,068 | |
Gibraltar | | | – | | | | 1,955,839 | | | – | | | 1,955,839 | |
Hong Kong | | | 8,891,413 | | | | 56,649,102 | | | – | | | 65,540,515 | |
India | | | – | | | | 11,494,206 | | | – | | | 11,494,206 | |
Indonesia | | | – | | | | 20,638,861 | | | – | | | 20,638,861 | |
Ireland | | | 28,461,042 | | | | 20,080,972 | | | – | | | 48,542,014 | |
Israel | | | 18,030,852 | | | | – | | | – | | | 18,030,852 | |
Italy | | | – | | | | 27,607,960 | | | – | | | 27,607,960 | |
Japan | | | – | | | | 230,734,513 | | | – | | | 230,734,513 | |
Luxembourg | | | – | | | | 15,898,679 | | | – | | | 15,898,679 | |
Malaysia | | | – | | | | 8,710,752 | | | – | | | 8,710,752 | |
Mexico | | | 24,868,241 | | | | – | | | – | | | 24,868,241 | |
Netherlands | | | 2,427,002 | | | | 76,028,569 | | | – | | | 78,455,571 | |
Norway | | | – | | | | 24,741,781 | | �� | – | | | 24,741,781 | |
Singapore | | | 11,811,807 | | | | 45,549,880 | | | – | | | 57,361,687 | |
South Africa | | | – | | | | 18,660,784 | | | – | | | 18,660,784 | |
South Korea | | | – | | | | 44,384,850 | | | – | | | 44,384,850 | |
Spain | | | – | | | | 27,106,980 | | | – | | | 27,106,980 | |
Sweden | | | – | | | | 28,750,406 | | | – | | | 28,750,406 | |
Switzerland | | | 9,665,250 | | | | 119,366,249 | | | – | | | 129,031,499 | |
Taiwan | | | 7,375,233 | | | | 32,239,130 | | | – | | | 39,614,363 | |
United Kingdom | | | 20,437,062 | | | | 290,270,007 | | | – | | | 310,707,069 | |
United States | | | 4,672,712 | | | | – | | | – | | | 4,672,712 | |
Short-Term Securities | | | 73,310,419 | | | | 474,700 | | | – | | | 73,785,119 | |
Total | | $ | 408,286,766 | | | $ | 1,462,129,133 | | | – | | $ | 1,870,415,899 | |
| | | | | | | | | | | | |
| Valuation Inputs | | Level 1 | | Level 2 | | | Level 3 | | Total | |
Derivative Financial Instruments1 | | | | | | | | | | | | |
Assets: | | | | | | | | | | | | |
Foreign currency exchange contracts | | – | | $ | 11,793,885 | | | – | | $ | 11,793,885 | |
Liabilities: | | | | | | | | | | | | |
Foreign currency exchange contracts | | – | | | (17,932,686 | ) | | – | | | (17,932,686 | ) |
| |
Total | | – | | $ | (6,138,801 | ) | | – | | $ | (6,138,801 | ) |
| | | |
| 1 | Derivative financial instruments are foreign currency exchange contracts which are valued at the unrealized appreciation/depreciation on the instrument. |
See Notes to Financial Statements.
| | | | |
| | | | |
26 | | BLACKROCK FUNDS | | MARCH 31, 2012 |
| | |
| Schedule of Investments March 31, 2012 | | BlackRock Science & Technology Opportunities Portfolio |
(Unaudited) | | (Percentages shown are based on Net Assets) |
| | | | | | | | |
| Common Stocks | | Shares | | | Value | |
| |
Biotechnology – 0.7% | | | | | | | | |
Biogen Idec, Inc. (a) | | | 6,137 | | | $ | 773,078 | |
Gilead Sciences, Inc. (a) | | | 12,700 | | | | 620,395 | |
| | | | | | | | |
| | | | | | | 1,393,473 | |
| |
Communications Equipment – 9.7% | |
Acme Packet, Inc. (a) | | | 6,125 | | | | 168,560 | |
Cisco Systems, Inc. | | | 242,473 | | | | 5,128,304 | |
F5 Networks, Inc. (a) | | | 25,900 | | | | 3,495,464 | |
Finisar Corp. (a) | | | 8,989 | | | | 181,128 | |
Juniper Networks, Inc. (a) | | | 8,250 | | | | 188,760 | |
Polycom, Inc. (a) | | | 21,392 | | | | 407,945 | |
QUALCOMM, Inc. | | | 109,846 | | | | 7,471,725 | |
Riverbed Technology, Inc. (a) | | | 96,950 | | | | 2,722,356 | |
| | | | | | | | |
| | | | | | | 19,764,242 | |
| |
Computers & Peripherals – 13.5% | |
Apple, Inc. | | | 30,797 | | | | 18,461,878 | |
EMC Corp. (a) | | | 124,199 | | | | 3,711,066 | |
NetApp, Inc. (a) | | | 44,700 | | | | 2,001,219 | |
SanDisk Corp. (a) | | | 53,182 | | | | 2,637,295 | |
Synaptics, Inc. (a) | | | 17,270 | | | | 630,528 | |
| | | | | | | | |
| | | | | | | 27,441,986 | |
| |
Diversified Consumer Services – 1.5% | |
New Oriental Education & Technology Group,
Inc. - ADR (a) | | | 113,900 | | | | 3,127,694 | |
| |
Electronic Equipment, Instruments & Components – 1.4% | |
Jabil Circuit, Inc. | | | 113,600 | | | | 2,853,632 | |
| |
Health Care Equipment & Supplies – 0.7% | | | | | | | | |
Baxter International, Inc. | | | 12,300 | | | | 735,294 | |
Medtronic, Inc. | | | 17,500 | | | | 685,825 | |
| | | | | | | | |
| | | | | | | 1,421,119 | |
| |
Internet & Catalog Retail – 1.2% | |
Amazon.com, Inc. (a) | | | 12,300 | | | | 2,490,873 | |
| |
Internet Software & Services – 14.3% | |
Baidu, Inc. - ADR (a) | | | 14,550 | | | | 2,120,953 | |
Bazaarvoice, Inc. (a) | | | 30,900 | | | | 613,983 | |
Brightcove, Inc. (a) | | | 86,100 | | | | 2,135,280 | |
Constant Contact, Inc. (a) | | | 69,500 | | | | 2,070,405 | |
Demandware, Inc. (a) | | | 9,000 | | | | 268,200 | |
eBay, Inc. (a) | | | 145,600 | | | | 5,371,184 | |
ExactTarget, Inc. (a) | | | 33,100 | | | | 860,600 | |
Google, Inc., Class A (a) | | | 10,175 | | | | 6,524,617 | |
LogMeIn, Inc. (a) | | | 11,416 | | | | 402,186 | |
MercadoLibre, Inc. | | | 20,858 | | | | 2,039,704 | |
Millennial Media, Inc. (a) | | | 58,400 | | | | 1,372,400 | |
Responsys, Inc. (a) | | | 108,086 | | | | 1,293,789 | |
Sina Corp. (a) | | | 3,075 | | | | 199,875 | |
Sohu.com, Inc. (a)(b) | | | 39,034 | | | | 2,153,506 | |
Tencent Holdings Ltd. | | | 39,600 | | | | 1,105,413 | |
Yelp, Inc. (a) | | | 22,200 | | | | 596,958 | |
| | | | | | | | |
| | | | | | | 29,129,053 | |
| |
IT Services – 11.9% | |
Accenture Plc, Class A | | | 67,300 | | | | 4,340,850 | |
Automatic Data Processing, Inc. | | | 34,701 | | | | 1,915,148 | |
Cognizant Technology Solutions Corp.,
Class A (a) | | | 51,850 | | | | 3,989,857 | |
International Business Machines Corp. | | | 31,600 | | | | 6,593,340 | |
Mastercard, Inc., Class A | | | 4,700 | | | | 1,976,538 | |
Teradata Corp. (a) | | | 36,098 | | | | 2,460,079 | |
Vantiv, Inc., Class A (a) | | | 52,300 | | | | 1,026,649 | |
| | | | | | | | |
| Common Stocks | | Shares | | | Value | |
| |
IT Services (concluded) | |
Visa, Inc., A Shares | | | 16,700 | | | $ | 1,970,600 | |
| | | | | | | | |
| | | | | | | 24,273,061 | |
| |
Machinery – 0.2% | |
Proto Labs, Inc. (a) | | | 12,300 | | | | 419,307 | |
| |
Pharmaceuticals – 0.4% | |
Pfizer, Inc. | | | 32,500 | | | | 736,450 | |
| |
Semiconductors & Semiconductor Equipment – 17.2% | |
Advanced Micro Devices, Inc. (a) | | | 243,130 | | | | 1,949,903 | |
Altera Corp. | | | 50,375 | | | | 2,005,933 | |
ASML Holding NV | | | 23,500 | | | | 1,177,388 | |
Avago Technologies Ltd. | | | 108,100 | | | | 4,212,657 | |
Broadcom Corp., Class A (a) | | | 77,400 | | | | 3,041,820 | |
Cavium, Inc. (a) | | | 30,807 | | | | 953,169 | |
Fairchild Semiconductor International, Inc. (a) | | | 141,724 | | �� | | 2,083,343 | |
Infineon Technologies AG | | | 95,100 | | | | 971,964 | |
Intel Corp. | | | 164,200 | | | | 4,615,662 | |
Intersil Corp., Class A | | | 87,500 | | | | 980,000 | |
Lam Research Corp. (a) | | | 23,625 | | | | 1,054,147 | |
Linear Technology Corp. | | | 20,341 | | | | 685,492 | |
Micron Technology, Inc. (a) | | | 234,000 | | | | 1,895,400 | |
ON Semiconductor Corp. (a) | | | 94,150 | | | | 848,291 | |
RF Micro Devices, Inc. (a) | | | 77,449 | | | | 385,696 | |
Samsung Electronics Co. Ltd. | | | 975 | | | | 1,099,853 | |
Skyworks Solutions, Inc. (a) | | | 85,292 | | | | 2,358,324 | |
Tokyo Electron Ltd. | | | 6,400 | | | | 369,052 | |
TriQuint Semiconductor, Inc. (a) | | | 30,925 | | | | 213,228 | |
Xilinx, Inc. | | | 109,000 | | | | 3,970,870 | |
| | | | | | | | |
| | | | | | | 34,872,192 | |
| |
Software – 26.1% | |
ACI Worldwide, Inc. (a)(b) | | | 83,400 | | | | 3,358,518 | |
Ariba, Inc. (a) | | | 79,700 | | | | 2,606,987 | |
Check Point Software Technologies Ltd. (a) | | | 31,975 | | | | 2,041,284 | |
Citrix Systems, Inc. (a) | | | 36,691 | | | | 2,895,287 | |
CommVault Systems, Inc. (a) | | | 10,485 | | | | 520,475 | |
Fortinet, Inc. (a) | | | 97,700 | | | | 2,701,405 | |
Guidewire Software, Inc. (a) | | | 58,100 | | | | 1,788,318 | |
Imperva, Inc. (a)(b) | | | 70,924 | | | | 2,776,675 | |
Informatica Corp. (a) | | | 11,875 | | | | 628,187 | |
Intuit, Inc. | | | 3,300 | | | | 198,429 | |
MICROS Systems, Inc. (a) | | | 88,844 | | | | 4,912,185 | |
Microsoft Corp. | | | 77,650 | | | | 2,504,213 | |
MicroStrategy, Inc., Class A (a) | | | 13,400 | | | | 1,876,000 | |
Oracle Corp. | | | 99,300 | | | | 2,895,588 | |
QLIK Technologies, Inc. (a) | | | 96,300 | | | | 3,081,600 | |
Red Hat, Inc. (a) | | | 87,700 | | | | 5,252,353 | |
Rovi Corp. (a) | | | 54,600 | | | | 1,777,230 | |
Salesforce.com, Inc. (a) | | | 6,427 | | | | 993,036 | |
SAP AG - ADR | | | 28,500 | | | | 1,989,870 | |
Symantec Corp. (a) | | | 111,000 | | | | 2,075,700 | |
TIBCO Software, Inc. (a) | | | 116,540 | | | | 3,554,470 | |
Totvs SA | | | 33,181 | | | | 609,653 | |
VMware, Inc., Class A (a) | | | 18,400 | | | | 2,067,608 | |
| | | | | | | | |
| | | | | | | 53,105,071 | |
| |
Total Long-Term Investments | | | | | | | | |
(Cost – $161,749,712) – 98.8% | | | | | | | 201,028,153 | |
| |
| | | | | | | | |
| | | | | | | | |
See Notes to Financial Statements.
| | | | | | |
| | | | | | |
| | BLACKROCK FUNDS | | MARCH 31, 2012 | | 27 |
| | |
| Schedule of Investments (continued) | | BlackRock Science & Technology Opportunities Portfolio |
| | (Percentages shown are based on Net Assets) |
| | | | | | | | |
| Short-Term Securities | | Shares | | | Value | |
| |
BlackRock Liquidity Funds, TempFund, Institutional Class, 0.14% (c)(d) | | | 5,656,112 | | | $ | 5,656,112 | |
| |
| | | Beneficial
Interest (000) | | | | |
| |
BlackRock Liquidity Series, LLC Money Market Series, 0.24% (c)(d)(e) | | $ | 2,816 | | | | 2,815,500 | |
| |
Total Short-Term Securities (Cost – $8,471,612) – 4.2% | | | | 8,471,612 | |
| |
| | | | |
| | | Value | |
| |
Total Investments (Cost – $170,221,324) | | | 209,499,765 | |
Liabilities in Excess of Other Assets – (3.0)% | | | (6,010,657 | ) |
| | | | |
Net Assets – 100.0% | | $ | 203,489,108 | |
| | | | |
| (a) | Non-income producing security. |
| (b) | Security, or a portion of security, is on loan. |
| (c) | Investments in companies considered to be an affiliate of the Fund during the period, for purposes of Section 2(a)(3) of the Investment Company Act of 1940, as amended, were as follows: |
| | | | | | | | | | | | | | | | | | | | |
| |
| Affiliate | | Shares/ Beneficial Interest Held at September 30, 2011 | | | Net Activity | | | Shares/ Beneficial Interest Held at March 31, 2012 | | | Realized Gain | | | Income | |
| |
BlackRock Liquidity Funds, TempFund, Institutional Class | | | 6,191,478 | | | | (535,366 | ) | | | 5,656,112 | | | | $222 | | | $ | 2,893 | |
BlackRock Liquidity Series, LLC
Money Market Series | | | $8,808,582 | | | $ | (5,993,082 | ) | | $ | 2,815,500 | | | | – | | | $ | 53,465 | |
| |
| (d) | Represents the current yield as of report date. |
| (e) | Security was purchased with the cash collateral from loaned securities. |
| — | | Foreign currency exchange contracts as of March 31, 2012 were as follows: |
| | | | | | | | | | | | |
|
| | | Currency
Purchased | | | | Currency
Sold | | Counterparty | | Settle- ment
Date | | Unrealized
Appreciation
(Depreciation) |
|
CHF | | 114,000 | | USD | | 125,950 | | Citibank, N.A. | | 4/11/12 | | $ 356 |
CHF | | 371,000 | | USD | | 407,536 | | Citibank, N.A. | | 4/11/12 | | 3,513 |
CHF | | 204,000 | | USD | | 221,779 | | Citibank, N.A. | | 4/11/12 | | 4,242 |
CHF | | 697,000 | | USD | | 759,199 | | Citibank, N.A. | | 4/11/12 | | 13,040 |
CHF | | 3,015,000 | | USD | | 3,303,918 | | Citibank, N.A. | | 4/11/12 | | 36,542 |
GBP | | 265,000 | | USD | | 419,032 | | Royal Bank of Scotland Plc | | 4/11/12 | | 4,803 |
HKD | | 7,851,000 | | USD | | 1,012,734 | | Citibank, N.A. | | 4/11/12 | | (1,681) |
JPY | | 356,000 | | USD | | 4,433 | | UBS AG | | 4/11/12 | | (131) |
USD | | 4,854,683 | | CHF | | 4,580,000 | | UBS AG | | 4/11/12 | | (219,714) |
USD | | 1,473,479 | | EUR | | 1,151,000 | | Goldman Sachs Bank | | 4/11/12 | | (61,695) |
| | | | | | | | USA | | | | |
USD | | 402,714 | | EUR | | 310,000 | | UBS AG | | 4/11/12 | | (10,756) |
USD | | 405,773 | | GBP | | 265,000 | | Goldman Sachs Bank USA | | 4/11/12 | | (18,061) |
USD | | 2,132,843 | | HKD | | 16,564,000 | | Goldman Sachs Bank USA | | 4/11/12 | | (272) |
USD | | 518,275 | | JPY | | 39,773,000 | | Royal Bank of Scotland Plc | | 4/11/12 | | 37,697 |
|
Total | | | | | | | | | | | | $(212,117) |
| | | | | | | | | | | | |
| — | | For Fund compliance purposes, the Fund’s industry classifications refer to any one or more of the industry sub-classifications used by one or more widely recognized market indexes or ratings group indexes and/or as defined by Fund management. These definitions may not apply for purposes of this report, which may combine industry sub-classifications for reporting ease. |
| — | | Fair Value Measurements – Various inputs are used in determining the fair value of investments and derivative financial instruments. These inputs are categorized into a disclosure hierarchy consisting of three broad levels for financial statement purposes as follows: |
| | — | | Level 1 - unadjusted price quotations in active markets/exchanges for identical assets and liabilities |
| | — | | Level 2 - other observable inputs (including, but not limited to: quoted prices for similar assets or liabilities in markets that are active, quoted prices for identical or similar assets or liabilities in markets that are not active, inputs other than quoted prices that are observable for the assets or liabilities (such as interest rates, yield curves, volatilities, prepayment speeds, loss severities, credit risks and default rates) or other market–corroborated inputs) |
| | — | | Level 3 - unobservable inputs based on the best information available in the circumstances, to the extent observable inputs are not available (including the Fund’s own assumptions used in determining the fair value of investments and derivative financial instruments) |
Changes in valuation techniques may result in transfers into or out of an assigned level within the disclosure hierarchy. The categorization of a value determined for investments and derivative financial instruments is based on the pricing transparency of the investment and derivative financial instrument and is not necessarily an indication of the risks associated with investing in those securities. For information about the Fund’s policy regarding valuation of investments and derivative financial instruments and other significant accounting policies, please refer to Note 1 of the Notes to Financial Statements.
See Notes to Financial Statements.
| | | | |
| | | | |
28 | | BLACKROCK FUNDS | | MARCH 31, 2012 |
| | |
| Schedule of Investments (concluded) | | BlackRock Science & Technology Opportunities Portfolio |
| | |
The following tables summarize the inputs used as of March 31, 2012 in determining the fair valuation of the Fund’s investments and derivative financial instruments:
| | | | | | | | | | | | | | |
| |
| Valuation Inputs | | Level 1 | | | Level 2 | | | Level 3 | | Total | |
| |
Assets: | | | | | | | | | | | | | | |
Investments: | | | | | | | | | | | | | | |
Long-Term Investments: | | | | | | | | | | | | | | |
Common Stocks: | | | | | | | | | | | | | | |
Biotechnology | | $ | 1,393,473 | | | | – | | | – | | $ | 1,393,473 | |
Communications Equipment | | | 19,764,242 | | | | – | | | – | | | 19,764,242 | |
Computers & Peripherals | | | 27,441,986 | | | | – | | | – | | | 27,441,986 | |
Diversified Consumer Services | | | 3,127,694 | | | | – | | | – | | | 3,127,694 | |
Electronic
Equipment,
Instruments &
Components | | | 2,853,632 | | | | – | | | – | | | 2,853,632 | |
Health Care Equipment & Supplies | | | 1,421,119 | | | | – | | | – | | | 1,421,119 | |
Internet & Catalog Retail | | | 2,490,873 | | | | – | | | – | | | 2,490,873 | |
Internet Software & Services | | | 28,023,640 | | | $ | 1,105,413 | | | – | | | 29,129,053 | |
IT Services | | | 24,273,061 | | | | – | | | – | | | 24,273,061 | |
Machinery | | | 419,307 | | | | – | | | – | | | 419,307 | |
Pharmaceuticals | | | 736,450 | | | | – | | | – | | | 736,450 | |
Semiconductors & Semiconductor Equipment | | | 31,253,935 | | | | 3,618,257 | | | – | | | 34,872,192 | |
Software | | | 53,105,071 | | | | – | | | – | | | 53,105,071 | |
Short-Term Securities | | | 5,656,112 | | | | 2,815,500 | | | – | | | 8,471,612 | |
| |
Total | | $ | 201,960,595 | | | $ | 7,539,170 | | | – | | $ | 209,499,765 | |
| | | | |
| | | | | | | | | | | | |
| | | | | | | | | | | | |
| |
| Valuation Inputs | | Level 1 | | Level 2 | | | Level 3 | | Total | |
| |
Derivative Financial Instruments1 | | | | | | | | | | | | |
Assets: | | | | | | | | | | | | |
Foreign currency exchange contracts | | – | | $ | 100,193 | | | – | | $ | 100,193 | |
Liabilities: | | | | | | | | | | | | |
Foreign currency exchange contracts | | – | | | (312,310) | | | – | | | (312,310 | ) |
| |
Total | | – | | $ | (212,117) | | | – | | | $(212,117 | ) |
| | | |
| 1 | Derivative financial instruments are foreign currency exchange contracts which are valued at the unrealized appreciation/depreciation on the instrument. |
See Notes to Financial Statements.
| | | | | | |
| | | | | | |
| | BLACKROCK FUNDS | | MARCH 31, 2012 | | 29 |
| | |
| Schedule of Investments March 31, 2012 (Unaudited) | | BlackRock U.S. Opportunities Portfolio |
| | (Percentages shown are based on Net Assets) |
| | | | | | | | |
| Common Stocks | | Shares | | | Value | |
| |
Aerospace & Defense – 1.0% | |
Raytheon Co. | | | 290,000 | | | $ | 15,306,200 | |
Triumph Group, Inc. | | | 263,200 | | | | 16,492,112 | |
| | | | | | | | |
| | | | | | | 31,798,312 | |
| |
Air Freight & Logistics – 0.4% | |
Expeditors International of Washington, Inc. | | | 273,800 | | | | 12,734,438 | |
| |
Airlines – 0.5% | |
Southwest Airlines Co. | | | 2,031,300 | | | | 16,737,912 | |
| |
Auto Components – 1.2% | |
The Goodyear Tire & Rubber Co. (a) | | | 1,762,800 | | | | 19,778,616 | |
Lear Corp. | | | 384,000 | | | | 17,852,160 | |
| | | | | | | | |
| | | | | | | 37,630,776 | |
| |
Automobiles – 0.5% | |
Tesla Motors, Inc. (a)(b) | | | 392,100 | | | | 14,601,804 | |
| |
Beverages – 0.7% | |
Coca-Cola Enterprises, Inc. | | | 774,600 | | | | 22,153,560 | |
| |
Biotechnology – 1.6% | |
Alexion Pharmaceuticals, Inc. (a) | | | 302,700 | | | | 28,108,722 | |
ARIAD Pharmaceuticals, Inc. (a)(b) | | | 442,163 | | | | 7,052,500 | |
Dendreon Corp. (a)(b) | | | 116,800 | | | | 1,244,504 | |
Medivation, Inc. (a) | | | 66,000 | | | | 4,931,520 | |
Vertex Pharmaceuticals, Inc. (a) | | | 174,000 | | | | 7,135,740 | |
| | | | | | | | |
| | | | | | | 48,472,986 | |
| |
Building Products – 0.6% | |
Owens Corning (a)(b) | | | 539,300 | | | | 19,430,979 | |
| |
Capital Markets – 3.9% | |
Affiliated Managers Group, Inc. (a) | | | 297,600 | | | | 33,274,656 | |
Ameriprise Financial, Inc. | | | 472,700 | | | | 27,005,351 | |
Jefferies Group, Inc. | | | 273,635 | | | | 5,155,283 | |
Lazard Ltd., Class A (b) | | | 933,800 | | | | 26,669,328 | |
TD Ameritrade Holding Corp. | | | 1,408,200 | | | | 27,797,868 | |
| | | | | | | | |
| | | | | | | 119,902,486 | |
| |
Chemicals – 3.2% | |
Celanese Corp. | | | 416,300 | | | | 19,224,734 | |
Cytec Industries, Inc. | | | 375,300 | | | | 22,814,487 | |
Huntsman Corp. | | | 946,400 | | | | 13,259,064 | |
PPG Industries, Inc. | | | 233,900 | | | | 22,407,620 | |
Valspar Corp. | | | 443,700 | | | | 21,426,273 | |
| | | | | | | | |
| | | | | | | 99,132,178 | |
| |
Commercial Banks – 3.0% | |
Associated Banc-Corp | | | 941,162 | | | | 13,138,621 | |
Comerica, Inc. | | | 701,400 | | | | 22,697,304 | |
Commerce Bancshares, Inc. | | | 291,865 | | | | 11,826,370 | |
Iberiabank Corp. | | | 293,100 | | | | 15,672,057 | |
KeyCorp | | | 3,378,300 | | | | 28,715,550 | |
| | | | | | | | |
| | | | | | | 92,049,902 | |
| |
Communications Equipment – 1.2% | |
F5 Networks, Inc. (a) | | | 204,100 | | | | 27,545,336 | |
Juniper Networks, Inc. (a) | | | 429,300 | | | | 9,822,384 | |
| | | | | | | | |
| | | | | | | 37,367,720 | |
| |
Computers & Peripherals – 1.0% | |
NetApp, Inc. (a) | | | 389,200 | | | | 17,424,484 | |
SanDisk Corp. (a) | | | 254,508 | | | | 12,621,052 | |
| | | | | | | | |
| | | | | | | 30,045,536 | |
| |
Construction & Engineering – 0.6% | |
Chicago Bridge & Iron Co. NV | | | 217,800 | | | | 9,406,782 | |
KBR, Inc. | | | 288,700 | | | | 10,263,285 | |
| | | | | | | | |
| | | | | | | 19,670,067 | |
| |
| | | | | | | | |
| Common Stocks | | Shares | | | Value | |
| |
Containers & Packaging – 1.2% | |
Crown Holdings, Inc. (a) | | | 661,800 | | | $ | 24,374,094 | |
Rock-Tenn Co., Class A | | | 192,400 | | | | 12,998,544 | |
| | | | | | | | |
| | | | | | | 37,372,638 | |
| |
Diversified Financial Services – 1.0% | |
CBOE Holdings, Inc. | | | 403,500 | | | | 11,467,470 | |
The NASDAQ OMX Group, Inc. (a) | | | 725,500 | | | | 18,790,450 | |
| | | | | | | | |
| | | | | | | 30,257,920 | |
| |
Electric Utilities – 1.4% | |
FirstEnergy Corp. | | | 373,000 | | | | 17,005,070 | |
PPL Corp. | | | 908,800 | | | | 25,682,688 | |
| | | | | | | | |
| | | | | | | 42,687,758 | |
| |
Electrical Equipment – 1.1% | |
The Babcock & Wilcox Co. (a) | | | 568,000 | | | | 14,626,000 | |
Rockwell Automation, Inc. | | | 245,200 | | | | 19,542,440 | |
| | | | | | | | |
| | | | | | | 34,168,440 | |
| |
Electronic Equipment, Instruments & Components – 0.7% | |
Jabil Circuit, Inc. | | | 828,100 | | | | 20,801,872 | |
| |
Energy Equipment & Services – 2.7% | |
Cameron International Corp. (a) | | | 270,600 | | | | 14,295,798 | |
Dresser-Rand Group, Inc. (a)(b) | | | 341,705 | | | | 15,851,695 | |
Oceaneering International, Inc. | | | 233,400 | | | | 12,577,926 | |
Rowan Cos., Inc. (a)(b) | | | 891,700 | | | | 29,363,681 | |
Weatherford International Ltd. (a) | | | 669,900 | | | | 10,108,791 | |
| | | | | | | | |
| | | | | | | 82,197,891 | |
| |
Food & Staples Retailing – 0.6% | |
Whole Foods Market, Inc. | | | 211,600 | | | | 17,605,120 | |
| |
Food Products – 4.2% | |
ConAgra Foods, Inc. | | | 772,700 | | | | 20,291,102 | |
Green Mountain Coffee Roasters, Inc. (a)(b) | | | 152,970 | | | | 7,165,115 | |
Post Holdings, Inc. (a) | | | 165,168 | | | | 5,438,982 | |
Ralcorp Holdings, Inc. (a) | | | 330,336 | | | | 24,474,594 | |
Sara Lee Corp. | | | 1,444,500 | | | | 31,100,085 | |
Smithfield Foods, Inc. (a) | | | 912,400 | | | | 20,100,172 | |
Snyders-Lance, Inc. | | | 148,900 | | | | 3,849,065 | |
TreeHouse Foods, Inc. (a) | | | 296,400 | | | | 17,635,800 | |
| | | | | | | | |
| | | | | | | 130,054,915 | |
| |
Health Care Equipment & Supplies – 2.3% | |
Align Technology, Inc. (a)(b) | | | 91,541 | | | | 2,521,955 | |
DENTSPLY International, Inc. | | | 369,200 | | | | 14,815,996 | |
Hologic, Inc. (a) | | | 1,108,700 | | | | 23,892,485 | |
Intuitive Surgical, Inc. (a)(b) | | | 31,232 | | | | 16,919,936 | |
Varian Medical Systems, Inc. (a)(b) | | | 50,000 | | | | 3,448,000 | |
Zimmer Holdings, Inc. | | | 131,500 | | | | 8,452,820 | |
| | | | | | | | |
| | | | | | | 70,051,192 | |
| |
Health Care Providers & Services – 3.0% | |
Aetna, Inc. | | | 265,694 | | | | 13,327,211 | |
AMERIGROUP Corp. (a) | | | 46,700 | | | | 3,141,976 | |
AmerisourceBergen Corp. | | | 177,300 | | | | 7,035,264 | |
Centene Corp. (a) | | | 65,800 | | | | 3,222,226 | |
Coventry Health Care, Inc. | | | 133,000 | | | | 4,730,810 | |
HCA Holdings, Inc. (a) | | | 241,900 | | | | 5,984,606 | |
Henry Schein, Inc. (a)(b) | | | 116,800 | | | | 8,839,424 | |
Humana, Inc. | | | 148,736 | | | | 13,755,105 | |
Laboratory Corp. of America Holdings (a) | | | 37,000 | | | | 3,386,980 | |
Quest Diagnostics, Inc. | | | 220,200 | | | | 13,465,230 | |
Universal Health Services, Inc., Class B | | | 113,100 | | | | 4,740,021 | |
VCA Antech, Inc. (a)(b) | | | 435,600 | | | | 10,110,276 | |
| | | | | | | | |
| | | | | | | 91,739,129 | |
| |
See Notes to Financial Statements.
| | | | |
| | | | |
30 | | BLACKROCK FUNDS | | MARCH 31, 2012 |
| | |
| Schedule of Investments (continued) | | BlackRock U.S. Opportunities Portfolio |
| | (Percentages shown are based on Net Assets) |
| | | | | | | | |
| Common Stocks | | Shares | | | Value | |
| |
Health Care Technology – 0.7% | |
Cerner Corp. (a) | | | 213,500 | | | $ | 16,260,160 | |
SXC Health Solutions Corp. (a)(b) | | | 76,400 | | | | 5,726,944 | |
| | | | | | | | |
| | | | | | | 21,987,104 | |
| |
Hotels, Restaurants & Leisure – 1.8% | |
Penn National Gaming, Inc. (a)(b) | | | 337,900 | | | | 14,522,942 | |
Starwood Hotels & Resorts Worldwide, Inc. | | | 524,500 | | | | 29,587,045 | |
Wynn Resorts Ltd. | | | 100,800 | | | | 12,587,904 | |
| | | | | | | | |
| | | | | | | 56,697,891 | |
| |
Household Durables – 2.8% | |
Jarden Corp. | | | 501,000 | | | | 20,155,230 | |
PulteGroup, Inc. (a)(b) | | | 1,658,500 | | | | 14,677,725 | |
Toll Brothers, Inc. (a) | | | 637,600 | | | | 15,296,024 | |
Tupperware Brands Corp. | | | 410,900 | | | | 26,092,150 | |
Whirlpool Corp. | | | 121,200 | | | | 9,315,432 | |
| | | | | | | | |
| | | | | | | 85,536,561 | |
| |
Independent Power Producers & Energy Traders – 0.8% | |
Calpine Corp. (a) | | | 1,528,000 | | | | 26,296,880 | |
| |
Insurance – 2.9% | |
AON Plc | | | 473,300 | | | | 23,220,098 | |
Hartford Financial Services Group, Inc. | | | 1,053,000 | | | | 22,197,240 | |
The Progressive Corp. | | | 229,176 | | | | 5,312,300 | |
Reinsurance Group of America, Inc. | | | 241,800 | | | | 14,379,846 | |
RenaissanceRe Holdings Ltd. | | | 321,300 | | | | 24,332,049 | |
| | | | | | | | |
| | | | | | | 89,441,533 | |
| |
IT Services – 1.8% | |
Fiserv, Inc. (a)(b) | | | 375,900 | | | | 26,083,701 | |
Teradata Corp. (a) | | | 315,438 | | | | 21,497,100 | |
The Western Union Co. | | | 518,100 | | | | 9,118,560 | |
| | | | | | | | |
| | | | | | | 56,699,361 | |
| |
Life Sciences Tools & Services – 1.0% | |
Agilent Technologies, Inc. | | | 251,533 | | | | 11,195,734 | |
Life Technologies Corp. (a) | | | 245,400 | | | | 11,980,428 | |
Waters Corp. (a) | | | 100,054 | | | | 9,271,004 | |
| | | | | | | | |
| | | | | | | 32,447,166 | |
| |
Machinery – 3.7% | |
Dover Corp. | | | 310,800 | | | | 19,561,752 | |
Ingersoll-Rand Plc (b) | | | 422,600 | | | | 17,474,510 | |
Joy Global, Inc. | | | 285,200 | | | | 20,962,200 | |
Parker Hannifin Corp. | | | 189,300 | | | | 16,005,315 | |
Snap-On, Inc. | | | 273,400 | | | | 16,669,198 | |
Stanley Black & Decker, Inc. | | | 301,640 | | | | 23,214,214 | |
| | | | | | | | |
| | | | | | | 113,887,189 | |
| |
Media – 2.5% | |
Liberty Global, Inc., Class A (a) | | | 620,600 | | | | 31,079,648 | |
Liberty Media Corp., Class A (a) | | | 332,500 | | | | 29,309,875 | |
Scripps Networks Interactive, Inc., Class A | | | 368,300 | | | | 17,932,527 | |
| | | | | | | | |
| | | | | | | 78,322,050 | |
| |
Metals & Mining – 0.4% | |
Nucor Corp. | | | 172,600 | | | | 7,413,170 | |
United States Steel Corp. (b) | | | 212,800 | | | | 6,249,936 | |
| | | | | | | | |
| | | | | | | 13,663,106 | |
| |
Multiline Retail – 2.9% | |
Dollar Tree, Inc. (a)(b) | | | 286,650 | | | | 27,085,559 | |
Macy’s, Inc. | | | 705,600 | | | | 28,033,488 | |
Nordstrom, Inc. | | | 410,000 | | | | 22,845,200 | |
Saks, Inc. (a)(b) | | | 1,000,000 | | | | 11,610,000 | |
| | | | | | | | |
| | | | | | | 89,574,247 | |
| |
| | | | | | | | |
| Common Stocks | | Shares | | | Value | |
| |
Multi-Utilities – 4.5% | |
Alliant Energy Corp. | | | 420,400 | | | $ | 18,211,728 | |
CenterPoint Energy, Inc. | | | 977,300 | | | | 19,272,356 | |
CMS Energy Corp. | | | 820,900 | | | | 18,059,800 | |
Public Service Enterprise Group, Inc. | | | 570,200 | | | | 17,453,822 | |
Sempra Energy | | | 528,100 | | | | 31,664,876 | |
Wisconsin Energy Corp. | | | 440,800 | | | | 15,507,344 | |
Xcel Energy, Inc. | | | 687,700 | | | | 18,203,419 | |
| | | | | | | | |
| | | | | | | 138,373,345 | |
| |
Oil, Gas & Consumable Fuels – 4.7% | |
Cabot Oil & Gas Corp. | | | 346,600 | | | | 10,803,522 | |
Concho Resources, Inc. (a) | | | 176,500 | | | | 18,017,120 | |
EQT Corp. | | | 369,300 | | | | 17,803,953 | |
Kosmos Energy Ltd. (a)(b) | | | 1,433,700 | | | | 18,982,188 | |
Peabody Energy Corp. | | | 267,000 | | | | 7,732,320 | |
Pioneer Natural Resources Co. | | | 170,000 | | | | 18,970,300 | |
Range Resources Corp. | | | 319,900 | | | | 18,598,986 | |
Southwestern Energy Co. (a)(b) | | | 343,100 | | | | 10,498,860 | |
Whiting Petroleum Corp. (a) | | | 462,400 | | | | 25,108,320 | |
| | | | | | | | |
| | | | | | | 146,515,569 | |
| |
Paper & Forest Products – 1.1% | |
International Paper Co. | | | 993,100 | | | | 34,857,810 | |
| |
Pharmaceuticals – 1.5% | |
Elan Corp. Plc - ADR (a)(b) | | | 1,455,700 | | | | 21,850,057 | |
Endo Pharmaceuticals Holdings, Inc. (a) | | | 260,100 | | | | 10,073,673 | |
Mylan, Inc. (a) | | | 471,200 | | | | 11,049,640 | |
ViroPharma, Inc. (a)(b) | | | 159,600 | | | | 4,799,172 | |
| | | | | | | | |
| | | | | | | 47,772,542 | |
| |
Professional Services – 1.5% | |
Equifax, Inc. | | | 523,300 | | | | 23,161,258 | |
Manpower, Inc. | | | 167,742 | | | | 7,945,939 | |
Robert Half International, Inc. | | | 496,624 | | | | 15,047,707 | |
| | | | | | | | |
| | | | | | | 46,154,904 | |
| |
Real Estate Investment Trusts (REITs) – 6.3% | |
Essex Property Trust, Inc. (b) | | | 234,500 | | | | 35,529,095 | |
Federal Realty Investment Trust (b) | | | 423,500 | | | | 40,990,565 | |
Health Care REIT, Inc. (b) | | | 316,600 | | | | 17,400,336 | |
Hospitality Properties Trust | | | 1,519,500 | | | | 40,221,165 | |
Rayonier, Inc. | | | 787,350 | | | | 34,714,261 | |
SL Green Realty Corp. (b) | | | 239,800 | | | | 18,596,490 | |
Washington REIT (b) | | | 291,006 | | | | 8,642,878 | |
| | | | | | | | |
| | | | | | | 196,094,790 | |
| |
Real Estate Management & Development – 1.3% | |
CBRE Group, Inc. (a) | | | 2,075,800 | | | | 41,432,968 | |
| |
Road & Rail – 1.2% | |
Ryder System, Inc. | | | 600,200 | | | | 31,690,560 | |
Swift Transportation Co. (a) | | | 372,301 | | | | 4,296,354 | |
| | | | | | | | |
| | | | | | | 35,986,914 | |
| |
Semiconductors & Semiconductor Equipment – 4.0% | |
Advanced Micro Devices, Inc. (a) | | | 2,026,045 | | | | 16,248,881 | |
Altera Corp. | | | 399,100 | | | | 15,892,162 | |
Avago Technologies Ltd. | | | 665,000 | | | | 25,915,050 | |
International Rectifier Corp. (a)(b) | | | 149,461 | | | | 3,448,065 | |
Intersil Corp., Class A | | | 283,300 | | | | 3,172,960 | |
Linear Technology Corp. | | | 498,000 | | | | 16,782,600 | |
Micron Technology, Inc. (a) | | | 838,400 | | | | 6,791,040 | |
ON Semiconductor Corp. (a) | | | 1,624,578 | | | | 14,637,448 | |
RF Micro Devices, Inc. (a) | | | 677,977 | | | | 3,376,325 | |
Skyworks Solutions, Inc. (a) | | | 582,319 | | | | 16,101,120 | |
| | | | | | | | |
| | | | | | | 122,365,651 | |
| |
See Notes to Financial Statements.
| | | | | | |
| | | | | | |
| | BLACKROCK FUNDS | | MARCH 31, 2012 | | 31 |
| | |
| Schedule of Investments (concluded) | | BlackRock U.S. Opportunities Portfolio |
| | (Percentages shown are based on Net Assets) |
| | | | | | | | |
| Common Stocks | | Shares | | | Value | |
| |
Software – 5.0% | |
Advent Software, Inc. (a) | | | 87,639 | | | $ | 2,243,558 | |
Autodesk, Inc. (a) | | | 137,200 | | | | 5,806,304 | |
Check Point Software Technologies Ltd. (a) | | | 291,300 | | | | 18,596,592 | |
Citrix Systems, Inc. (a) | | | 190,200 | | | | 15,008,682 | |
Fortinet, Inc. (a) | | | 555,917 | | | | 15,371,105 | |
Intuit, Inc. | | | 107,100 | | | | 6,439,923 | |
Nuance Communications, Inc. (a)(b) | | | 254,800 | | | | 6,517,784 | |
QLIK Technologies, Inc. (a) | | | 755,770 | | | | 24,184,640 | |
Red Hat, Inc. (a) | | | 260,100 | | | | 15,577,389 | |
Rovi Corp. (a) | | | 430,000 | | | | 13,996,500 | |
Symantec Corp. (a)(b) | | | 513,100 | | | | 9,594,970 | |
TIBCO Software, Inc. (a)(b) | | | 687,766 | | | | 20,976,863 | |
| | | | | | | | |
| | | | | | | 154,314,310 | |
| |
Specialty Retail – 3.5% | |
Abercrombie & Fitch Co., Class A | | | 232,800 | | | | 11,549,208 | |
Guess?, Inc. | | | 681,200 | | | | 21,287,500 | |
O’Reilly Automotive, Inc. (a)(b) | | | 365,500 | | | | 33,388,425 | |
Ross Stores, Inc. | | | 589,200 | | | | 34,232,520 | |
rue21, Inc. (a)(b) | | | 261,500 | | | | 7,672,410 | |
| | | | | | | | |
| | | | | | | 108,130,063 | |
| |
Textiles, Apparel & Luxury Goods – 1.6% | |
Coach, Inc. | | | 183,100 | | | | 14,149,968 | |
Deckers Outdoor Corp. (a)(b) | | | 175,100 | | | | 11,040,055 | |
PVH Corp. | | | 266,000 | | | | 23,761,780 | |
| | | | | | | | |
| | | | | | | 48,951,803 | |
| |
| | | | | | | | |
| Common Stocks | | Shares | | | Value | |
| |
Trading Companies & Distributors – 0.7% | |
United Rentals, Inc. (a)(b) | | | 474,500 | | | $ | 20,351,305 | |
| |
Wireless Telecommunication Services — 1.3% | |
NII Holdings, Inc. (a) | | | 553,100 | | | | 10,127,261 | |
SBA Communications Corp.,
Class A (a)(b) | | | 611,600 | | | | 31,075,396 | |
| | | | | | | | |
| | | | | | | 41,202,657 | |
| |
Total Long-Term Investments | |
(Cost – $2,536,316,657) – 97.1% | | | | 3,005,723,250 | |
| |
| |
| |
|
| Short-Term Securities | |
| |
BlackRock Liquidity Funds, TempFund,
Institutional Class, 0.14% (c)(d) | | | 89,365,810 | | | | 89,365,810 | |
| |
| | | Beneficial Interest (000) | | | | |
| |
BlackRock Liquidity Series, LLC Money Market Series, 0.24% (c)(d)(e) | | $ | 331,247 | | | | 331,246,609 | |
| |
Total Short-Term Securities
(Cost – $420,612,419) – 13.6% | | | | 420,612,419 | |
| |
Total Investments
(Cost – $2,956,929,076) – 110.7% | | | | 3,426,335,669 | |
Liabilities in Excess of Other Assets – (10.7)% | | | | (331,960,583 | ) |
| | | | | | | | |
Net Assets – 100.0% | | | $ | 3,094,375,086 | |
| | | | | | | | |
| (a) | Non-income producing security. |
| (b) Security, | or a portion of security, is on loan. |
| (c) | Investments in companies considered to be an affiliate of the Fund during the period, for purposes of Section 2(a)(3) of the Investment Company Act of 1940, as amended, were as follows: |
| | | | | | | | | | | | | | | | | | | | |
| |
| Affiliate | | Shares/
Beneficial
Interest Held at
September 30,
2011 | | | Net Activity | | | Shares/
Beneficial
Interest Held at
March 31, 2012 | | | Realized
Gain | | | Income | |
| |
BlackRock Liquidity Funds, TempFund, Institutional Class | | | 187,421,477 | | | | (98,055,667 | ) | | | 89,365,810 | | | | $1,359 | | | $ | 71,331 | |
BlackRock Liquidity Series, LLC
Money Market Series | | | $274,382,587 | | | $ | 56,864,022 | | | | $331,246,609 | | | | – | | | $ | 667,278 | |
| |
| (d) | Represents the current yield as of report date. |
| (e) | Security was purchased with the cash collateral from loaned securities. |
| — | | For Fund compliance purposes, the Fund’s industry classifications refer to any one or more of the industry sub-classifications used by one or more widely recognized market indexes or ratings group indexes and/or as defined by Fund management. These definitions may not apply for purposes of this report, which may combine industry sub-classifications for reporting ease. |
| — | | Fair Value Measurements – Various inputs are used in determining the fair value of investments. These inputs are categorized into a disclosure hierarchy consisting of three broad levels for financial statement purposes as follows: |
| | — | | Level 1 - unadjusted price quotations in active markets/exchanges for identical assets and liabilities |
| | — | | Level 2 - other observable inputs (including, but not limited to: quoted prices for similar assets or liabilities in markets that are active, quoted prices for identical or similar assets or liabilities in markets that are not active, inputs other than quoted prices that are observable for the assets or liabilities (such as interest rates, yield curves, volatilities, prepayment speeds, loss severities, credit risks and default rates) or other market–corroborated inputs) |
| | — | | Level 3 - unobservable inputs based on the best information available in the circumstances, to the extent observable inputs are not available (including the Fund’s own assumptions used in determining the fair value of investments) |
Changes in valuation techniques may result in transfers into or out of an assigned level within the disclosure hierarchy. The categorization of a value determined for investments is based on the pricing transparency of the investment and is not necessarily an indication of the risks associated with investing in those securities. For information about the Fund’s policy regarding valuation of investments and other significant accounting policies, please refer to Note 1 of the Notes to Financial Statements.
The following table summarizes the inputs used as of March 31, 2012 in determining the fair valuation of the Fund’s investments:
| | | | | | | | |
| Valuation Inputs | | Level 1 | | Level 2 | | Level 3 | | Total |
Assets: | | | | | | | | |
Investments: | | | | | | | | |
Long-Term Investments1 | | $3,005,723,250 | | – | | – | | $3,005,723,250 |
Short-Term Securities | | 89,365,810 | | $331,246,609 | | – | | 420,612,419 |
Total | | $3,095,089,060 | | $331,246,609 | | – | | $3,426,335,669 |
| | |
| 1 | See above Schedule of Investments for values in each industry. |
See Notes to Financial Statements.
| | | | |
| | | | |
32 | | BLACKROCK FUNDS | | MARCH 31, 2012 |
| | |
| Statements of Assets and Liabilities | | |
| | |
| | | | | | | | | | | | | | | | | | | | |
| March 31, 2012 (Unaudited) | | BlackRock
Global
Opportunities
Portfolio | | | BlackRock
Health
Sciences
Opportunities
Portfolio | | | BlackRock
International
Opportunities
Portfolio | | | BlackRock
Science & Technology
Opportunities
Portfolio | | | BlackRock
U.S.
Opportunities
Portfolio | |
Assets | | | | | | | | | | | | | | | | | | | | |
Investments at value – unaffiliated1,2 | | $ | 349,017,974 | | | $ | 1,810,071,982 | | | $ | 1,796,630,780 | | | $ | 201,028,153 | | | $ | 3,005,723,250 | |
Investments at value – affiliated3 | | | 9,341,977 | | | | 192,358,394 | | | | 73,785,119 | | | | 8,471,612 | | | | 420,612,419 | |
Cash | | | 312 | | | | – | | | | 1,311,619 | | | | 12,652 | | | | – | |
Cash pledged as collateral for options written | | | – | | | | 9,966,600 | | | | – | | | | – | | | | – | |
Foreign currency at value4 | | | 5,322,110 | | | | 1,233,903 | | | | 42,594,099 | | | | 541,005 | | | | – | |
Investments sold receivable | | | 450,745 | | | | 20,123,181 | | | | 3,160,648 | | | | – | | | | 20,369,412 | |
Unrealized appreciation on foreign currency exchange contracts | | | 1,920,237 | | | | 936,236 | | | | 11,793,885 | | | | 100,193 | | | | – | |
Dividends and reclaims receivable – unaffiliated | | | 717,372 | | | | 2,878,609 | | | | 6,336,137 | | | | 53,876 | | | | 3,095,321 | |
Capital shares sold receivable | | | 156,766 | | | | 3,338,259 | | | | 2,573,182 | | | | 643,330 | | | | 5,041,140 | |
Receivable from advisor | | | 38,324 | | | | – | | | | – | | | | – | | | | 222,871 | |
Dividends receivable – affiliated | | | 861 | | | | 8,782 | | | | 9,852 | | | | 517 | | | | 9,552 | |
Securities lending income receivable – affiliated | | | – | | | | 13,875 | | | | 645 | | | | 3,119 | | | | 81,286 | |
Prepaid expenses | | | 42,254 | | | | 86,462 | | | | 81,746 | | | | 56,961 | | | | 117,919 | |
Total assets | | | 367,008,932 | | | | 2,041,016,283 | | | | 1,938,277,712 | | | | 210,911,418 | | | | 3,455,273,170 | |
| | | | | | | | | | | | | | | | | | | | |
Liabilities | | | | | | | | | | | | | | | | | | | | |
Options written at value5 | | | – | | | | 197,760 | | | | – | | | | – | | | | – | |
Bank overdraft | | | – | | | | – | | | | – | | | | – | | | | 263 | |
Collateral on securities loaned at value | | | – | | | | 103,422,838 | | | | 474,700 | | | | 2,815,500 | | | | 331,246,609 | |
Investments purchased payable | | | 2,000,198 | | | | 81,734,108 | | | | – | | | | 3,579,702 | | | | 15,764,395 | |
Unrealized depreciation on foreign currency exchange contracts | | | 2,721,491 | | | | 7,750,965 | | | | 17,932,686 | | | | 312,310 | | | | – | |
Capital shares redeemed payable | | | 968,960 | | | | 3,671,148 | | | | 4,914,638 | | | | 255,626 | | | | 7,552,165 | |
Investment advisory fees payable | | | 277,410 | | | | 1,100,373 | | | | 1,586,562 | | | | 169,390 | | | | 2,559,140 | |
Service and distribution fees payable | | | 118,248 | | | | 566,439 | | | | 342,822 | | | | 56,884 | | | | 484,939 | |
Other affiliates payable | | | 13,521 | | | | 166,507 | | | | 227,702 | | | | 19,682 | | | | 296,127 | |
Officer’s and Trustees’ fees payable | | | 1,649 | | | | 9,328 | | | | 13,575 | | | | 2,225 | | | | 28,827 | |
Other accrued expenses payable | | | 293,938 | | | | 845,482 | | | | 1,227,959 | | | | 210,991 | | | | 2,965,619 | |
Total liabilities | | | 6,395,415 | | | | 199,464,948 | | | | 26,720,644 | | | | 7,422,310 | | | | 360,898,084 | |
Net Assets | | $ | 360,613,517 | | | $ | 1,841,551,335 | | | $ | 1,911,557,068 | | | $ | 203,489,108 | | | $ | 3,094,375,086 | |
| | | | | |
| | | | | | | | | | | | | | | | | | | | |
Net Assets Consist of | | | | | | | | | | | | | | | | | | | | |
Paid-in capital | | $ | 493,211,561 | | | $ | 1,507,078,006 | | | $ | 1,915,498,173 | | | $ | 221,331,820 | | | $ | 2,588,129,004 | |
Undistributed (distributions in excess of) net investment income (loss) | | | 1,062,385 | | | | (3,303,124 | ) | | | (8,562,793 | ) | | | (1,984,678 | ) | | | 3,650,388 | |
Accumulated net realized gain (loss) | | | (165,555,896 | ) | | | 34,589,874 | | | | (110,473,889 | ) | | | (54,931,681 | ) | | | 33,189,101 | |
Net unrealized appreciation/depreciation | | | 31,895,467 | | | | 303,186,579 | | | | 115,095,577 | | | | 39,073,647 | | | | 469,406,593 | |
Net Assets | | $ | 360,613,517 | | | $ | 1,841,551,335 | | | $ | 1,911,557,068 | | | $ | 203,489,108 | | | $ | 3,094,375,086 | |
| | | | | | | | | | | | | | | | | | | | |
1 Investments at cost – unaffiliated | | $ | 316,335,420 | | | $ | 1,500,626,133 | | | $ | 1,675,847,474 | | | $ | 161,749,712 | | | $ | 2,536,316,657 | |
2 Securities loaned at value | | | – | | | $ | 101,088,423 | | | $ | 459,613 | | | $ | 2,762,296 | | | $ | 323,942,234 | |
3 Investments at cost – affiliated | | $ | 9,341,977 | | | $ | 192,358,394 | | | $ | 73,785,119 | | | $ | 8,471,612 | | | $ | 420,612,419 | |
4 Foreign currency at cost | | $ | 5,312,497 | | | $ | 1,208,157 | | | $ | 42,300,818 | | | $ | 534,272 | | | | – | |
5 Premiums received | | | – | | | $ | 664,296 | | | | – | | | | – | | | | – | |
See Notes to Financial Statements.
| | | | | | |
| | | | | | |
| | BLACKROCK FUNDS | | MARCH 31, 2012 | | 33 |
| | |
| Statements of Assets and Liabilities (concluded) | | |
| | | | | | | | | | | | | | | | | | | | |
| March 31, 2012 (Unaudited) | | BlackRock
Global
Opportunities
Portfolio | | | BlackRock
Health
Sciences
Opportunities
Portfolio | | | BlackRock
International
Opportunities
Portfolio | | | BlackRock
Science & Technology
Opportunities
Portfolio | | | BlackRock
U.S.
Opportunities
Portfolio | |
Net Asset Value | | | | | | | | | | | | | | | | | | | | |
Institutional | | | | | | | | | | | | | | | | | | | | |
Net assets | | $ | 62,752,267 | | | $ | 428,522,089 | | | $ | 908,188,023 | | | $ | 41,786,824 | | | $ | 1,812,851,118 | |
Shares outstanding1 | | | 5,661,049 | | | | 13,283,161 | | | | 27,933,829 | | | | 3,913,688 | | | | 48,529,542 | |
Net asset value | | $ | 11.08 | | | $ | 32.26 | | | $ | 32.51 | | | $ | 10.68 | | | $ | 37.36 | |
Service | | | | | | | | | | | | | | | | | | | | |
Net assets | | | – | | | $ | 15,720,858 | | | $ | 52,022,009 | | | $ | 1,169,351 | | | $ | 189,524,789 | |
Shares outstanding1 | | | – | | | | 499,543 | | | | 1,656,361 | | | | 113,467 | | | | 5,310,917 | |
Net asset value | | | – | | | $ | 31.47 | | | $ | 31.41 | | | $ | 10.31 | | | $ | 35.69 | |
Investor A | | | | | | | | | | | | | | | | | | | | |
Net assets | | $ | 214,140,558 | | | $ | 968,879,959 | | | $ | 766,074,737 | | | $ | 121,050,061 | | | $ | 791,614,641 | |
Shares outstanding1 | | | 19,451,949 | | | | 30,854,145 | | | | 24,641,453 | | | | 11,922,337 | | | | 22,450,535 | |
Net asset value | | $ | 11.01 | | | $ | 31.40 | | | $ | 31.09 | | | $ | 10.15 | | | $ | 35.26 | |
Investor B | | | | | | | | | | | | | | | | | | | | |
Net assets | | $ | 6,411,746 | | | $ | 45,626,289 | | | $ | 13,581,934 | | | $ | 3,269,968 | | | $ | 15,504,064 | |
Shares outstanding1 | | | 594,799 | | | | 1,547,966 | | | | 467,438 | | | | 354,790 | | | | 488,955 | |
Net asset value | | $ | 10.78 | | | $ | 29.47 | | | $ | 29.06 | | | $ | 9.22 | | | $ | 31.71 | |
Investor C | | | | | | | | | | | | | | | | | | | | |
Net assets | | $ | 61,186,939 | | | $ | 370,240,870 | | | $ | 171,690,365 | | | $ | 31,588,318 | | | $ | 284,880,474 | |
Shares outstanding1 | | | 5,697,695 | | | | 12,614,734 | | | | 5,962,955 | | | | 3,431,310 | | | | 8,978,318 | |
Net asset value | | $ | 10.74 | | | $ | 29.35 | | | $ | 28.79 | | | $ | 9.21 | | | $ | 31.73 | |
Class R | | | | | | | | | | | | | | | | | | | | |
Net assets | | $ | 16,122,007 | | | $ | 12,561,270 | | | | – | | | $ | 4,624,586 | | | | – | |
Shares outstanding1 | | | 1,466,058 | | | | 401,439 | | | | – | | | | 443,953 | | | | – | |
Net asset value | | $ | 11.00 | | | $ | 31.29 | | | | – | | | $ | 10.42 | | | | – | |
1 Unlimited number of shares authorized, $0.001 par value. | | | | | | | | | | | | | | | | | |
See Notes to Financial Statements.
| | | | |
| | | | |
34 | | BLACKROCK FUNDS | | MARCH 31, 2012 |
| | | | | | | | | | | | | | | | | | |
| Six Months Ended March 31, 2012 (Unaudited) | | BlackRock
Global
Opportunities
Portfolio | | | BlackRock
Health
Sciences
Opportunities
Portfolio | | | BlackRock
International
Opportunities
Portfolio | | | BlackRock
Science &
Technology
Opportunities
Portfolio | | | BlackRock U.S.
Opportunities
Portfolio |
Investment Income | | | | | | | | | | | | | | | | | | |
Dividends and reclaims – unaffiliated | | $ | 3,613,624 | | | $ | 13,770,521 | | | $ | 20,104,762 | | | $ | 495,166 | | | $ 24,372,499 |
Foreign taxes withheld | | | (142,254 | ) | | | (286,005 | ) | | | (1,186,370 | ) | | | (5,191 | ) | | (1,633) |
Dividends – affiliated | | | 3,355 | | | | 50,791 | | | | 50,135 | | | | 2,893 | | | 71,331 |
Interest | | | – | | | | 430 | | | | 5,967 | | | | 305 | | | – |
Securities lending – affiliated | | | – | | | | 112,779 | | | | 4,390 | | | | 53,465 | | | 667,278 |
| | | |
Total income | | | 3,474,725 | | | | 13,648,516 | | | | 18,978,884 | | | | 546,638 | | | 25,109,475 |
| | | |
| | | | | | | | | | | | | | | | | | |
Expenses | | | | | | | | | | | | | | | | | | |
Investment advisory | | | 1,638,624 | | | | 6,171,638 | | | | 9,081,086 | | | | 842,930 | | | 17,415,658 |
Service and distribution – class specific | | | 654,761 | | | | 3,115,692 | | | | 1,940,839 | | | | 314,541 | | | 2,862,586 |
Transfer agent – class specific | | | 343,515 | | | | 1,474,606 | | | | 1,989,048 | | | | 349,313 | | | 3,803,281 |
Administration | | | 136,552 | | | | 540,271 | | | | 586,286 | | | | 70,244 | | | 984,736 |
Administration – class specific | | | 45,637 | | | | 191,890 | | | | 201,537 | | | | 23,448 | | | 276,289 |
Professional | | | 40,096 | | | | 30,525 | | | | 37,811 | | | | 33,262 | | | 35,499 |
Custodian | | | 31,713 | | | | 68,220 | | | | 135,282 | | | | 14,196 | | | 87,521 |
Registration | | | 24,334 | | | | 51,761 | | | | 60,408 | | | | 35,884 | | | 93,378 |
Printing | | | 12,002 | | | | 50,063 | | | | 59,536 | | | | 7,468 | | | 115,679 |
Officer and Trustees | | | 5,873 | | | | 23,057 | | | | 24,692 | | | | 3,762 | | | 47,280 |
Miscellaneous | | | 19,078 | | | | 30,514 | | | | 50,043 | | | | 13,393 | | | 35,697 |
Recoupment of past waived fees – class specific | | | 2,061 | | | | – | | | | 1,304 | | | | 19,302 | | | 550 |
| | | |
Total expenses | | | 2,954,246 | | | | 11,748,237 | | | | 14,167,872 | | | | 1,727,743 | | | 25,758,154 |
Less fees waived by advisor | | | (4,567 | ) | | | (27,966 | ) | | | (30,756 | ) | | | (2,381 | ) | | (1,778,585) |
Less administration fees waived – class specific | | | (44,202 | ) | | | (651 | ) | | | (1,720 | ) | | | (4,714 | ) | | (125,827) |
Less transfer agent fees waived – class specific | | | (7,116 | ) | | | (85 | ) | | | (2,306 | ) | | | (1,861 | ) | | (86,698) |
Less transfer agent fees reimbursed – class specific | | | (254,671 | ) | | | (531 | ) | | | (245 | ) | | | (9,112 | ) | | (2,111,718) |
Less fees paid indirectly | | | (49 | ) | | | (447 | ) | | | (280 | ) | | | (81 | ) | | (431) |
| | | |
Total expenses after fees waived, reimbursed and paid indirectly | | | 2,643,641 | | | | 11,718,557 | | | | 14,132,565 | | | | 1,709,594 | | | 21,654,895 |
| | | |
Net investment income (loss) | | | 831,084 | | | | 1,929,959 | | | | 4,846,319 | | | | (1,162,956 | ) | | 3,454,580 |
| | | |
| | | | | | | | | | | | | | | | | | |
Realized and Unrealized Gain (Loss) | | | | | | | | | | | | | | | | | | |
Net realized gain (loss) from: | | | | | | | | | | | | | | | | | | |
Investments – unaffiliated | | | (8,953,037 | )1 | | | 32,912,669 | | | | (48,514,399 | ) | | | 7,633,985 | | | 38,197,170 |
Investments – affiliated | | | 199 | | | | 321 | | | | 1,306 | | | | 222 | | | 1,359 |
Options written | | | 311,864 | | | | 1,206,001 | | | | – | | | | – | | | – |
Financial futures contracts | | | – | | | | – | | | | 4,387,622 | | | | (307,584 | ) | | 3,640,472 |
Foreign currency transactions | | | (824,798 | ) | | | 13,481,431 | | | | 9,216,104 | | | | 1,242,612 | | | – |
| | | |
| | | (9,465,772 | ) | | | 47,600,422 | | | | (34,909,367 | ) | | | 8,569,235 | | | 41,839,001 |
| | | |
Net change in unrealized appreciation/depreciation on: | | | | | | | | | | | | | | | | | | |
Investments | | | 71,409,698 | | | | 244,316,134 | | | | 317,419,412 | | | | 33,515,100 | | | 637,800,116 |
Options written | | | – | | | | 466,536 | | | | – | | | | – | | | – |
Financial futures contracts | | | – | | | | – | | | | 1,617,815 | | | | – | | | 10,765,517 |
Foreign currency transactions | | | 617,444 | | | | (12,180,700 | ) | | | (6,311,286 | ) | | | (1,010,956 | ) | | – |
| | | |
| | | 72,027,142 | | | | 232,601,970 | | | | 312,725,941 | | | | 32,504,144 | | | 648,565,633 |
| | | |
Total realized and unrealized gain | | | 62,561,370 | | | | 280,202,392 | | | | 277,816,574 | | | | 41,073,379 | | | 690,404,634 |
| | | |
Net Increase in Net Assets Resulting from Operations | | $ | 63,392,454 | | | $ | 282,132,351 | | | $ | 282,662,893 | | | $ | 39,910,423 | | | $ 693,859,214 |
| | | |
1 Net of $(2,110) foreign capital gain tax. | | | | | | | | | | | | | | | | | | |
See Notes to Financial Statements.
| | | | | | |
| | | | | | |
| | BLACKROCK FUNDS | | MARCH 31, 2012 | | 35 |
| | |
| Statements of Changes in Net Assets | | |
| | |
| | | | | | | | | | | | | | | | | | |
| | | BlackRock
Global Opportunities
Portfolio | | | | | BlackRock
Health Sciences
Opportunities
Portfolio | |
| Increase in Net Assets: | | Six Months Ended March 31, 2012 (Unaudited) | | | Year Ended September 30, 2011 | | | | | Six Months Ended March 31, 2012 (Unaudited) | | | Year Ended September 30, 2011 | |
Operations | | | | | | | | | | | | | | | | | | |
Net investment income (loss) | | $ | 831,084 | | | $ | 275,112 | | | | | $ | 1,929,959 | | | $ | (5,001,828) | |
Net realized gain (loss) | | | (9,465,772 | ) | | | 3,378,527 | | | | | | 47,600,422 | | | | 91,796,358 | |
Net change in unrealized appreciation/depreciation | | | 72,027,142 | | | | (26,740,125 | ) | | | | | 232,601,970 | | | | (53,887,779) | |
Net increase (decrease) in net assets resulting from operations | | | 63,392,454 | | | | (23,086,486 | ) | | | | | 282,132,351 | | | | 32,906,751 | |
| | | | | | | | | | | | | | | | | | |
Dividends and Distributions to Shareholders From | | | | | | | | | | | | | | | | | | |
Net investment income: | | | | | | | | | | | | | | | | | | |
Institutional | | | (118,127 | ) | | | (151,636 | ) | | | | | – | | | | (356,523) | |
Investor A | | | (283,735 | ) | | | (128,372 | ) | | | | | – | | | | – | |
Class R | | | (4,925 | ) | | | – | | | | | | – | | | | – | |
Net realized gain: | | | | | | | | | | | | | | | | | | |
Institutional | | | – | | | | – | | | | | | (18,534,663 | ) | | | (10,061,316) | |
Service | | | – | | | | – | | | | | | (758,372 | ) | | | (519,043) | |
Investor A | | | – | | | | – | | | | | | (44,254,685 | ) | | | (30,115,936) | |
Investor B | | | – | | | | – | | | | | | (2,120,280 | ) | | | (1,712,754) | |
Investor C | | | – | | | | – | | | | | | (15,906,640 | ) | | | (11,157,356) | |
Class R | | | – | | | | – | | | | | | (527,704 | ) | | | – | |
Decrease in net assets resulting from dividends and distributions to shareholders | | | (406,787 | ) | | | (280,008 | ) | | | | | (82,102,344 | ) | | | (53,922,928) | |
| | | | | | | | | | | | | | | | | | |
Capital Share Transactions | | | | | | | | | | | | | | | | | | |
Net increase (decrease) in net assets derived from capital share transactions | | | (51,792,404 | ) | | | 288,633,793 | | | | | | 57,090,390 | | | | 344,887,812 | |
| | | | | | | | | | | | | | | | | | |
Redemption Fees | | | | | | | | | | | | | | | | | | |
Redemption fees | | | – | | | | 2,143 | | | | | | – | | | | 17,727 | |
| | | | | | | | | | | | | | | | | | |
Net Assets | | | | | | | | | | | | | | | | | | |
Total increase in net assets | | | 11,193,263 | | | | 265,269,442 | | | | | | 257,120,397 | | | | 323,889,362 | |
Beginning of period | | | 349,420,254 | | | | 84,150,812 | | | | | | 1,584,430,938 | | | | 1,260,541,576 | |
End of period | | $ | 360,613,517 | | | $ | 349,420,254 | | | | | $ | 1,841,551,335 | | | $ | 1,584,430,938 | |
Undistributed (distributions in excess of) net investment income (loss) | | $ | 1,062,385 | | | $ | 638,088 | | | | | $ | (3,303,124 | ) | | $ | (5,233,083) | |
See Notes to Financial Statements.
| | | | |
| | | | |
36 | | BLACKROCK FUNDS | | MARCH 31, 2012 |
| | |
| Statements of Changes in Net Assets (concluded) |
| | |
| | | | | | | | | | | | | | | | | | | | | | | | | | | | |
| | | BlackRock
International
Opportunities
Portfolio | | | | | BlackRock
Science &
Technology
Opportunities
Portfolio | | | | | BlackRock
U.S. Opportunities
Portfolio | |
| Increase (Decrease) in Net Assets: | | Six Months Ended March 31, 2012 (Unaudited) | | | Year Ended September 30, 2011 | | | | | Six Months Ended March 31, 2012 (Unaudited) | | | Year Ended September 30, 2011 | | | | | Six Months Ended March 31, 2012 (Unaudited) | | | Year Ended September 30, 2011 | |
Operations | | | | | | | | | | | |
Net investment income (loss) | | $ | 4,846,319 | | | $ | 26,393,452 | | | | | $ | (1,162,956 | ) | | $ | (2,170,676 | ) | | | | $ | 3,454,580 | | | $ | (6,590,565) | |
Net realized gain (loss) | | | (34,909,367 | ) | | | 149,988,562 | | | | | | 8,569,235 | | | | (1,510,360 | ) | | | | | 41,839,001 | | | | 396,998,889 | |
Net change in unrealized appreciation/depreciation | | | 312,725,941 | | | | (417,009,868 | ) | | | | | 32,504,144 | | | | (7,020,373 | ) | | | | | 648,565,633 | | | | (659,559,092) | |
Net increase (decrease) in net assets resulting from operations | | | 282,662,893 | | | | (240,627,854 | ) | | | | | 39,910,423 | | | | (10,701,409 | ) | | | | | 693,859,214 | | | | (269,150,768) | |
| | | | | | | | | | | | | | | | | | | | | | | | | | | | |
Dividends and Distributions to Shareholders From | | | | | | | | | | | |
Net investment income: | | | | | | | | | | | | | | | | | | | | | | | | | | | | |
Institutional | | | (16,930,123 | ) | | | (10,989,330 | ) | | | | | – | | | | – | | | | | | – | | | | – | |
Service | | | (747,975 | ) | | | (459,323 | ) | | | | | – | | | | – | | | | | | – | | | | – | |
Investor A | | | (13,129,458 | ) | | | (7,220,618 | ) | | | | | – | | | | – | | | | | | – | | | | – | |
Investor B | | | (122,493 | ) | | | (6,972 | ) | | | | | – | | | | – | | | | | | – | | | | – | |
Investor C | | | (1,570,033 | ) | | | (523,946 | ) | | | | | – | | | | – | | | | | | – | | | | – | |
Net realized gain: | | | | | | | | | | | | | | | | | | | | | | | | | | | | |
Institutional | | | – | | | | – | | | | | | – | | | | – | | | | | | (200,665,343 | ) | | | (33,361,497) | |
Service | | | – | | | | – | | | | | | – | | | | – | | | | | | (20,074,027 | ) | | | (3,268,451) | |
Investor A | | | – | | | | – | | | | | | – | | | | – | | | | | | (94,447,429 | ) | | | (16,649,136) | |
Investor B | | | – | | | | – | | | | | | – | | | | – | | | | | | (1,740,672 | ) | | | (237,927) | |
Investor C | | | – | | | | – | | | | | | – | | | | – | | | | | | (31,519,270 | ) | | | (4,147,409) | |
Decrease in net assets resulting from dividends and distributions to shareholders | | | (32,500,082 | ) | | | (19,200,189 | ) | | | | | – | | | | – | | | | | | (348,446,741 | ) | | | (57,664,420) | |
| | | | | | | | | | | | | | | | | | | | | | | | | | | | |
Capital Share Transactions | | | | | | | | | | | |
Net increase (decrease) in net assets derived from capital share transactions | | | (67,397,031 | ) | | | 71,985,983 | | | | | | (12,184,581 | ) | | | 12,679,272 | | | | | | (525,822,006 | ) | | | 263,237,665 | |
| | | | | | | | | | | | | | | | | | | | | | | | | | | | |
Redemption Fees | | | | | | | | | | | |
Redemption fees | | | – | | | | 28,640 | | | | | | – | | | | 10,894 | | | | | | – | | | | 87,311 | |
| | | | | | | | | | | | | | | | | | | | | | | | | | | | |
Net Assets | | | | | | | | | | | |
Total increase (decrease) in net assets | | | 182,765,780 | | | | (187,813,420 | ) | | | | | 27,725,842 | | | | 1,988,757 | | | | | | (180,409,533 | ) | | | (63,490,212) | |
Beginning of period | | | 1,728,791,288 | | | | 1,916,604,708 | | | | | | 175,763,266 | | | | 173,774,509 | | | | | | 3,274,784,619 | | | | 3,338,274,831 | |
End of period | | $ | 1,911,557,068 | | | $ | 1,728,791,288 | | | | | $ | 203,489,108 | | | $ | 175,763,266 | | | | | $ | 3,094,375,086 | | | $ | 3,274,784,619 | |
Undistributed (distributions in excess of) net investment income (loss) | | $ | (8,562,793 | ) | | $ | 19,090,970 | | | | | $ | (1,984,678 | ) | | $ | (821,722 | ) | | | | $ | 3,650,388 | | | $ | 195,808 | |
See Notes to Financial Statements.
| | | | | | |
| | | | | | |
| | BLACKROCK FUNDS | | MARCH 31, 2012 | | 37 |
| | |
| Financial Highlights | | BlackRock Global Opportunities Portfolio |
| | |
| | | | | | | | | | | | | | | | | | | | | | | | |
| | | Institutional | |
| | | Six Months
Ended
March 31, | | | Year Ended September 30, | |
| | | 2012 | | | | | | | | | | | | | | | | |
| | | (Unaudited) | | | 2011 | | | 2010 | | | 2009 | | | 2008 | | | 2007 | |
Per Share Operating Performance | | | | | | | | | | | | | | | | | | | | | | | | |
Net asset value, beginning of period | | $ | 9.32 | | | $ | 10.52 | | | $ | 10.13 | | | $ | 9.96 | | | $ | 13.31 | | | $ | 10.10 | |
Net investment income1 | | | 0.04 | | | | 0.08 | | | | 0.06 | | | | 0.06 | | | | 0.09 | | | | 0.09 | |
Net realized and unrealized gain (loss) | | | 1.74 | | | | (1.20) | 2 | | | 0.482 | | | | 0.122 | | | | (2.77) | 2 | | | 3.212 | |
Net increase (decrease) from investment operations | | | 1.78 | | | | (1.12) | | | | 0.54 | | | | 0.18 | | | | (2.68) | | | | 3.30 | |
Dividends and distributions from: | | | | | | | | | | | | | | | | | | | | | | | | |
Net investment income | | | (0.02) | | | | (0.08) | | | | (0.15) | | | | (0.01) | | | | (0.17) | | | | (0.09) | |
Net realized gain | | | – | | | | – | | | | – | | | | – | | | | (0.50) | | | | – | |
Total dividends and distributions | | | (0.02) | | | | (0.08) | | | | (0.15) | | | | (0.01) | | | | (0.67) | | | | (0.09) | |
Net asset value, end of period | | $ | 11.08 | | | $ | 9.32 | | | $ | 10.52 | | | $ | 10.13 | | | $ | 9.96 | | | $ | 13.31 | |
| | | | | | | | | | | | | | | | | | | | | | | | |
Total Investment Return3 | | | | | | | | | | | | | | | | | | | | | | | | |
Based on net asset value | | | 19.12% | 4 | | | (10.81)% | 5 | | | 5.32% | 5 | | | 1.78% | 5 | | | (21.16)% | 5 | | | 32.81% | 5 |
| | | | | | | | | | | | | | | | | | | | | | | | |
Ratios to Average Net Assets | | | | | | | | | | | | | | | | | | | | | | | | |
Total expenses | | | 1.24% | 6 | | | 1.53% | | | | 1.43% | | | | 1.50% | | | | 1.33% | | | | 1.32% | |
Total expenses excluding recoupment of past waived fees | | | 1.24% | 6 | | | 1.52% | | | | 1.42% | | | | 1.49% | | | | 1.33% | | | | 1.32% | |
Total expenses after fees waived, reimbursed and paid indirectly | | | 1.06% | 6 | | | 1.34% | | | | 1.37% | | | | 1.36% | | | | 1.32% | | | | 1.29% | |
Net investment income | | | 0.85% | 6 | | | 0.68% | | | | 0.64% | | | | 0.70% | | | | 0.77% | | | | 0.78% | |
| | | | | | | | | | | | | | | | | | | | | | | | |
Supplemental Data | | | | | | | | | | | | | | | | | | | | | | | | |
Net assets, end of period (000) | | $ | 62,752 | | | $ | 58,793 | | | $ | 21,699 | | | $ | 16,971 | | | $ | 36,625 | | | $ | 35,679 | |
Portfolio turnover | | | 54% | | | | 137% | | | | 146% | | | | 190% | | | | 181% | | | | 107% | |
| | 1 | Based on average shares outstanding. |
| | 2 | Includes redemption fees, which are less than $0.01 per share. |
| | 3 | Where applicable, total investment returns exclude the effects of any sales charges and include the reinvestment of dividends and distributions. |
| | 4 | Aggregate total investment return. |
| | 5 | Redemption fee of 2.00% is reflected in total return calculations. There was no impact to the return. |
See Notes to Financial Statements.
| | | | |
| | | | |
38 | | BLACKROCK FUNDS | | MARCH 31, 2012 |
| | |
| Financial Highlights (continued) | | BlackRock Global Opportunities Portfolio |
| | |
| | | | | | | | | | | | | | | | | | | | | | | | | | | | | | | | | | | | | | | | | | | | | | |
| | | Investor A | | | Investor B |
| | | Six Months
Ended March 31, 2012 (Unaudited) | | | | | | Six Months
Ended March 31, 2012 (Unaudited) | | | |
| | | | Year Ended September 30, | | | | Year Ended September 30, |
| | | | | | | | | | | | | | | | | | | | | | | | | | | | | | | | |
| | | | 2011 | | | 2010 | | | 2009 | | | 2008 | | | 2007 | | | | 2011 | | | 2010 | | | 2009 | | | 2008 | | | 2007 |
Per Share Operating Performance | | | | | | | | | | | | | | | | | | | | | | | | | | | | | | | | | | | | | | | |
Net asset value, beginning of period | | $ | 9.26 | | | $ | 10.45 | | | $ | 10.08 | | | $ | 9.92 | | | $ | 13.27 | | | | $10.08 | | | $ | 9.10 | | | $ | 10.31 | | | $ | 9.93 | | | $ | 9.83 | | | $ | 13.16 | | | $ 10.03 |
| | | | | | | |
Net investment income (loss)1 | | | 0.03 | | | | 0.05 | | | | 0.03 | | | | 0.04 | | | | 0.06 | | | | 0.04 | | | | (0.01 | ) | | | (0.04 | ) | | | (0.04 | ) | | | (0.02 | ) | | | (0.04 | ) | | (0.04) |
Net realized and unrealized gain (loss) | | | 1.73 | | | | (1.20 | )2 | | | 0.46 | 2 | | | 0.12 | 2 | | | (2.77 | )2 | | | 3.222 | | | | 1.69 | | | | (1.17 | )2 | | | 0.45 | 2 | | | 0.12 | 2 | | | (2.76 | )2 | | 3.222 |
| | | | | | | |
Net increase (decrease) from investment operations | | | 1.76 | | | | (1.15 | ) | | | 0.49 | | | | 0.16 | | | | (2.71 | ) | | | 3.26 | | | | 1.68 | | | | (1.21 | ) | | | 0.41 | | | | 0.10 | | | | (2.80 | ) | | 3.18 |
| | | | | | | |
Dividends and distributions from: | | | | | | | | | | | | | | | | | | | | | | | | | | | | | | | | | | | | | | | | | | | | | | |
Net investment income | | | (0.01 | ) | | | (0.04 | ) | | | (0.12 | ) | | | – | | | | (0.14 | ) | | | (0.07) | | | | – | | | | – | | | | (0.03 | ) | | | – | | | | (0.03 | ) | | (0.05) |
Net realized gain | | | – | | | | – | | | | – | | | | – | | | | (0.50 | ) | | | – | | | | – | | | | – | | | | – | | | | – | | | | (0.50 | ) | | – |
| | | | | | | |
Total dividends and distributions | | | (0.01 | ) | | | (0.04 | ) | | | (0.12 | ) | | | – | | | | (0.64 | ) | | | (0.07) | | | | – | | | | – | | | | (0.03 | ) | | | – | | | | (0.53 | ) | | (0.05) |
| | | | | | | |
Net asset value, end of period | | $ | 11.01 | | | $ | 9.26 | | | $ | 10.45 | | | $ | 10.08 | | | $ | 9.92 | | | | $13.27 | | | $ | 10.78 | | | $ | 9.10 | | | $ | 10.31 | | | $ | 9.93 | | | $ | 9.83 | | | $ 13.16 |
| | | | | | | |
| | | | | | | | | | | | | | | | | | | | | | | | | | | | | | | | | | | | | | | | | | | | | | |
Total Investment Return3 | | | | | | | | | | | | | | | | | | | | | | | | | | | | | | | | | | | | | | | |
Based on net asset value | | | 19.06% | 4 | | | (11.11)% | 5 | | | 4.92% | 5 | | | 1.61% | 5 | | | (21.44)% | 5 | | | 32.51%5 | | | | 18.46% | 4 | | | (11.74)% | 5 | | | 4.09% | 5 | | | 1.02% | 5 | | | (22.13)% | 5 | | 31.79%5 |
| | | | | | | |
| | | | | | | | | | | | | | | | | | | | | | | | | | | | | | | | | | | | | | | | | | | | | | |
Ratios to Average Net Assets | | | | | | | | | | | | | | | | | | | | | | | | | | | | | | | | | | | | | | | |
Total expenses | | | 1.50% | 6 | | | 1.76% | | | | 1.72% | | | | 1.81% | | | | 1.60% | | | | 1.68% | | | | 2.19% | 6 | | | 2.56% | | | | 2.45% | | | | 2.65% | | | | 2.37% | | | 3.06% |
| | | | | | | |
Total expenses excluding recoupment of past waived fees | | | 1.50% | 6 | | | 1.74% | | | | 1.70% | | | | 1.80% | | | | 1.60% | | | | 1.68% | | | | 2.19% | 6 | | | 2.53% | | | | 2.45% | | | | 2.63% | | | | 2.37% | | | 3.06% |
| | | | | | | |
Total expenses after fees waived, reimbursed and paid indirectly | | | 1.33% | 6 | | | 1.61% | | | | 1.67% | | | | 1.66% | | | | 1.60% | | | | 1.56% | | | | 2.18% | 6 | | | 2.42% | | | | 2.43% | | | | 2.42% | | | | 2.36% | | | 2.33% |
| | | | | | | |
Net investment income (loss) | | | 0.58% | 6 | | | 0.42% | | | | 0.32% | | | | 0.49% | | | | 0.49% | | | | 0.36% | | | | (0.27)% | 6 | | | (0.39)% | | | | (0.44)% | | | | (0.25)% | | | | (0.30)% | | | (0.39)% |
| | | | | | | |
| | | | | | | | | | | | | | | | | | | | | | | | | | | | | | | | | | | | | | | | | | | | | | |
Supplemental Data | | | | | | | | | | | | | | | | | | | | | | | | | | | | | | | | | | | | | | | |
Net assets, end of period (000) | | $ | 214,141 | | | $ | 210,299 | | | $ | 39,280 | | | $ | 45,110 | | | $ | 37,529 | | | | $40,467 | | | $ | 6,412 | | | $ | 6,750 | | | $ | 3,617 | | | $ | 4,351 | | | $ | 5,665 | | | $ 7,673 |
| | | | | | | |
Portfolio turnover | | | 54% | | | | 137% | | | | 146% | | | | 190% | | | | 181% | | | | 107% | | | | 54% | | | | 137% | | | | 146% | | | | 190% | | | | 181% | | | 107% |
| | | | | | | |
| | 1 | Based on average shares outstanding. |
| | 2 | Includes redemption fees, which are less than $0.01 per share. |
| | 3 | Where applicable, total investment returns exclude the effects of any sales charges and include the reinvestment of dividends and distributions. |
| | 4 | Aggregate total investment return. |
| | 5 | Redemption fee of 2.00% is reflected in total return calculations. There was no impact to the return. |
See Notes to Financial Statements.
| | | | | | |
| | | | | | |
| | BLACKROCK FUNDS | | MARCH 31, 2012 | | 39 |
| | |
| Financial Highlights (concluded) | | BlackRock Global Opportunities Portfolio |
| | | | | | | | | | | | | | | | | | | | | | | | | | | | | | |
| | | Investor C | | Class R |
| | | Six Months
Ended March 31,
2012
(Unaudited) | | | Year Ended September 30, | | Six Months
Ended March 31,
2012
(Unaudited) | | | | | |
| | | | 2011 | | | 2010 | | | 2009 | | | 2008 | | | 2007 | | | Period
September 12, 20111 to
September 30, 2011 |
Per Share Operating Performance | | | |
Net asset value, beginning of period | | $ | 9.06 | | | $ | 10.27 | | | $ | 9.91 | | | $ | 9.82 | | | $ | 13.16 | | | $10.03 | | $ 9.26 | | | $ 9.76 | | | |
| | | | | |
Net investment income (loss)2 | | | (0.01 | ) | | | (0.04 | ) | | | (0.04 | ) | | | (0.02 | ) | | | (0.03 | ) | | (0.05) | | 0.01 | | | 0.00 | 3 | | |
Net realized and unrealized gain (loss) | | | 1.69 | | | | (1.17 | )4 | | | 0.45 | 4 | | | 0.11 | 4 | | | (2.77 | )4 | | 3.234 | | 1.73 | | | (0.50)4 | | | |
| | | | | |
Net increase (decrease) from investment operations | | | 1.68 | | | | (1.21 | ) | | | 0.41 | | | | 0.09 | | | | (2.80 | ) | | 3.18 | | 1.74 | | | (0.50) | | | |
| | | | | |
Dividends and distributions from: | | | | | | | | | | | | | | | | | | | | | | | | | | | | | | |
Net investment income | | | – | | | | – | | | | (0.05 | ) | | | – | | | | (0.04 | ) | | (0.05) | | (0.00)5 | | | – | | | |
Net realized gain | | | – | | | | – | | | | – | | | | – | | | | (0.50 | ) | | – | | – | | | – | | | |
| | | | | |
Total dividends and distributions | | | – | | | | – | | | | (0.05 | ) | | | – | | | | (0.54 | ) | | (0.05) | | – | | | – | | | |
| | | | | |
Net asset value, end of period | | $ | 10.74 | | | $ | 9.06 | | | $ | 10.27 | | | $ | 9.91 | | | $ | 9.82 | | | $13.16 | | $ 11.00 | | | $ 9.26 | | | |
| | | | | |
| | | | | | |
Total Investment Return6 | | | |
Based on net asset value | | | 18.54% | 7 | | | (11.78)% | 8 | | | 4.13% | 8 | | | 0.92% | 8 | | | (22.14)% | 8 | | 31.76%8 | | 18.83%7 | | | (4.83)% | 7,8 | | |
| | | | | |
| | | | | | |
Ratios to Average Net Assets | | | |
Total expenses | | | 2.31% | 9 | | | 2.59% | | | | 2.49% | | | | 2.62% | | | | 2.38% | | | 2.42% | | 1.95%9 | | | 1.98% | 9 | | |
| | | | | |
Total expenses excluding recoupment of past waived fees | | | 2.31% | 9 | | | 2.57% | | | | 2.49% | | | | 2.62% | | | | 2.38% | | | 2.42% | | 1.92%9 | | | 1.98% | 9 | | |
| | | | | |
Total expenses after fees waived, reimbursed and paid indirectly | | | 2.14% | 9 | | | 2.42% | | | | 2.44% | | | | 2.42% | | | | 2.37% | | | 2.35% | | 1.69%9 | | | 1.72% | 9 | | |
| | | | | |
Net investment income (loss) | | | (0.23)% | 9 | | | (0.38)% | | | | (0.40)% | | | | (0.26)% | | | | (0.26)% | | | (0.40)% | | 0.22%9 | | | 0.23% | 9 | | |
| | | | | |
| | | | | | |
Supplemental Data | | | | | | | | | | | | | | | | | | | | | | | | | | | | | | |
Net assets, end of period (000) | | $ | 61,187 | | | $ | 58,687 | | | $ | 19,554 | | | $ | 16,348 | | | $ | 18,074 | | | $18,217 | | $ 16,122 | | | $ 14,891 | | | |
| | | | | |
Portfolio turnover | | | 54% | | | | 137% | | | | 146% | | | | 190% | | | | 181% | | | 107% | | 54% | | | 137% | | | |
| | | | | |
1 Commencement of operations. | | | |
2 Based on average shares outstanding. | | | |
3 Less than $0.01 per share. | | | |
4 Includes redemption fees, which are less than $0.01 per share. | | | |
5 Less than $(0.01) per share. | | | |
6 Where applicable, total investment returns exclude the effects of any sales charges and include the reinvestment of dividends and distributions. | | | |
7 Aggregate total investment return. | | | |
8 Redemption fee of 2.00% is reflected in total return calculations. There was no impact to the return. | | | |
9 Annualized. | | | |
See Notes to Financial Statements.
| | | | |
| | | | |
40 | | BLACKROCK FUNDS | | MARCH 31, 2012 |
| | |
| Financial Highlights | | BlackRock Health Sciences Opportunities Portfolio |
| | | | | | | | | | | | | | | | | | | | | | | | | | | | | | | | | | | | | | | | | | | | | | | | |
| | | Institutional | | | Service |
| | | Six Months
Ended March 31,
2012
(Unaudited) | | | Year Ended September 30, | | | Six Months
Ended March 31,
2012
(Unaudited) | | | Year Ended September 30, |
| | | | 2011 | | | | 2010 | | | | 2009 | | | | 2008 | | | | 2007 | | | | | 2011 | | | | 2010 | | | | 2009 | | | | 2008 | | | 2007 | | |
Per Share Operating Performance | | |
Net asset value, beginning of period | | | $ 28.77 | | | $ | 28.92 | | | $ | 26.29 | | | $ | 28.77 | | | $ | 30.41 | | | $ | 26.18 | | | $ | 28.05 | | | $ | 28.22 | | | $ | 25.74 | | | $ | 28.20 | | | $ | 29.85 | | | $ 25.78 | | |
| | | | | | | |
Net investment income (loss)1 | | | 0.10 | | | | 0.02 | | | | 0.06 | | | | 0.08 | | | | 0.08 | | | | 0.06 | | | | 0.05 | | | | (0.07 | ) | | | (0.03 | ) | | | 0.01 | | | | (0.02 | ) | | (0.02) | | |
Net realized and unrealized gain (loss) | | | 4.95 | | | | 1.23 | 2 | | | 2.57 | 2 | | | (0.14 | )2 | | | (0.49) | 2 | | | 4.522 | | | | 4.85 | | | | 1.19 | 2 | | | 2.51 | 2 | | | (0.14 | )2 | | | (0.49 | )2 | | 4.442 | | |
| | | | | | | |
Net increase (decrease) from investment operations | | | 5.05 | | | | 1.25 | | | | 2.63 | | | | (0.06 | ) | | | (0.41) | | | | 4.58 | | | | 4.90 | | | | 1.12 | | | | 2.48 | | | | (0.13 | ) | | | (0.51 | ) | | 4.42 | | |
| | | | | | | |
Dividends and distributions from: | | | | | | | | | | | | | | | | | | | | | | | | | | | | | | | | | | | | | | | | | | | | | | | | |
Net investment income | | | – | | | | (0.05 | ) | | | – | | | | – | | | | – | | | | – | | | | – | | | | – | | | | – | | | | – | | | | – | | | – | | |
Net realized gain | | | (1.56 | ) | | | (1.35 | ) | | | – | | | | (2.42 | ) | | | (1.23) | | | | (0.35) | | | | (1.48 | ) | | | (1.29 | ) | | | – | | | | (2.33 | ) | | | (1.14 | ) | | (0.35) | | |
| | | | | | | |
Total dividends and distributions | | | (1.56 | ) | | | (1.40 | ) | | | – | | | | (2.42 | ) | | | (1.23) | | | | (0.35) | | | | (1.48 | ) | | | (1.29 | ) | | | – | | | | (2.33 | ) | | | (1.14 | ) | | (0.35) | | |
| | | | | | | |
Net asset value, end of period | | | $ 32.26 | | | $ | 28.77 | | | $ | 28.92 | | | $ | 26.29 | | | $ | 28.77 | | | $ | 30.41 | | | $ | 31.47 | | | $ | 28.05 | | | $ | 28.22 | | | $ | 25.74 | | | $ | 28.20 | | | $ 29.85 | | |
| | | | | | | |
| | | | | | | | | |
Total Investment Return3 | | |
Based on net asset value | | | 18.40% | 4 | | | 4.41% | 5 | | | 10.00% | 5,6 | | | 1.91% | 5 | | | (1.64)%5 | | | | 17.68%5 | | | | 18.28% | 4 | | | 4.04% | 5 | | | 9.64% | 5,6 | | | 1.59% | 5 | | | (1.98 | )%5 | | 17.33%5 | | |
| | | | | | | |
| | | | | | | | | |
Ratios to Average Net Assets | | |
Total expenses | | | 0.98% | 7 | | | 1.00% | | | | 1.00% | | | | 1.03% | | | | 1.00% | | | | 1.02% | | | | 1.27% | 7 | | | 1.32% | | | | 1.33% | | | | 1.37% | | | | 1.35% | | | 1.32% | | |
| | | | | | | |
Total expenses excluding recoupment of past waived fees | | | 0.98% | 7 | | | 1.00% | | | | 1.00% | | | | 1.03% | | | | 1.00% | | | | 1.02% | | | | 1.27% | 7 | | | 1.31% | | | | 1.33% | | | | 1.35% | | | | 1.35% | | | 1.32% | | |
| | | | | | | |
Total expenses after fees waived, reimbursed and paid indirectly | | | 0.98% | 7 | | | 1.00% | | | | 1.00% | | | | 1.03% | | | | 1.00% | | | | 1.02% | | | | 1.27% | 7 | | | 1.31% | | | | 1.32% | | | | 1.36% | | | | 1.35% | | | 1.30% | | |
| | | | | | | |
Net investment income (loss) | | | 0.64% | 7 | | | 0.07% | | | | 0.21% | | | | 0.36% | | | | 0.28% | | | | 0.21% | | | | 0.34% | 7 | | | (0.24)% | | | | (0.12)% | | | | 0.03% | | | | (0.06)% | | | (0.08)% | | |
| | | | | | | |
| | | | | | | | | |
Supplemental Data | | |
Net assets, end of period (000) | | | $428,522 | | | $ | 362,292 | | | $ | 232,697 | | | $ | 171,607 | | | $ | 185,933 | | | $ | 172,902 | | | $ | 15,721 | | | $ | 13,478 | | | $ | 11,704 | | | $ | 8,110 | | | $ | 5,764 | | | $ 7,806 | | |
| | | | | | | |
Portfolio turnover | | | 72% | | | | 135% | | | | 184% | | | | 153% | | | | 91% | | | | 98% | | | | 72% | | | | 135% | | | | 184% | | | | 153% | | | | 91% | | | 98% | | |
| | | | | | | |
1 Based on average shares outstanding. | | |
2 Includes redemption fees, which are less than $0.01 per share. | | |
3 Where applicable, total investment returns exclude the effects of any sales charges and include the reinvestment of dividends and distributions. | | |
4 Aggregate total investment return. | | |
5 Redemption fee of 2.00% is reflected in total return calculations. There was no impact to the return. | | |
6 Includes proceeds received from a settlement of litigation, which had no impact on the Fund’s total return. | | |
7 Annualized. | | |
See Notes to Financial Statements.
| | | | | | |
| | | | | | |
| | BLACKROCK FUNDS | | MARCH 31, 2012 | | 41 |
| | |
| Financial Highlights (continued) | | BlackRock Health Sciences Opportunities Portfolio |
| | | | | | | | | | | | | | | | | | | | | | | | | | | | | | | | | | | | | | | | | | | | | | |
| | | Investor A | | | Investor B |
| | | Six Months
Ended March 31,
2012
(Unaudited) | | | Year Ended September 30, | | | Six Months
Ended March 31,
2012
(Unaudited) | | | Year Ended September 30, |
| | | | 2011 | | | | 2010 | | | | 2009 | | | | 2008 | | | | 2007 | | | | | 2011 | | | | 2010 | | | | 2009 | | | | 2008 | | | 2007 |
Per Share Operating Performance |
Net asset value, beginning of period | | $ | 28.00 | | | $ | 28.18 | | | $ | 25.69 | | | $ | 28.14 | | | $ | 29.77 | | | | $25.72 | | | $ | 26.26 | | | $ | 26.39 | | | $ | 24.25 | | | $ | 26.73 | | | $ | 28.28 | | | $ 24.65 |
| | | | | | | |
Net investment income (loss)1 | | | 0.05 | | | | (0.07 | ) | | | (0.03 | ) | | | 0.01 | | | | (0.02 | ) | | | (0.03) | | | | (0.07 | ) | | | (0.28 | ) | | | (0.23 | ) | | | (0.17 | ) | | | (0.23 | ) | | (0.25) |
Net realized and unrealized gain (loss) | | | 4.83 | | | | 1.19 | 2 | | | 2.52 | 2 | | | (0.15 | )2 | | | (0.49 | )2 | | | 4.432 | | | | 4.54 | | | | 1.14 | 2 | | | 2.37 | 2 | | | (0.16 | )2 | | | (0.49 | )2 | | 4.232 |
| | | | | | | |
Net increase (decrease) from investment operations | | | 4.88 | | | | 1.12 | | | | 2.49 | | | | (0.14 | ) | | | (0.51 | ) | | | 4.40 | | | | 4.47 | | | | 0.86 | | | | 2.14 | | | | (0.33 | ) | | | (0.72 | ) | | 3.98 |
| | | | | | | |
Distributions from net realized gain | | | (1.48 | ) | | | (1.30 | ) | | | – | | | | (2.31 | ) | | | (1.12 | ) | | | (0.35) | | | | (1.26 | ) | | | (0.99 | ) | | | – | | | | (2.15 | ) | | | (0.83 | ) | | (0.35) |
| | | | | | | |
Net asset value, end of period | | $ | 31.40 | | | $ | 28.00 | | | $ | 28.18 | | | $ | 25.69 | | | $ | 28.14 | | | | $29.77 | | | $ | 29.47 | | | $ | 26.26 | | | $ | 26.39 | | | $ | 24.25 | | | $ | 26.73 | | | $ 28.28 |
| | | | | | | |
| | | | | | | |
Total Investment Return3 |
Based on net asset value | | | 18.25% | 4 | | | 4.03% | 5 | | | 9.69% | 5,6 | | | 1.57% | 5 | | | (1.97 | )%5 | | | 17.29%5 | | | | 17.74% | 4 | | | 3.27% | 5 | | | 8.82% | 5,6 | | | 0.73% | 5 | | | (2.78 | )%5 | | 16.33%5 |
| | | | | | | |
| | | | | | | |
Ratios to Average Net Assets |
Total expenses | | | 1.28% | 7 | | | 1.31% | | | | 1.31% | | | | 1.37% | | | | 1.35% | | | | 1.35% | | | | 2.10% | 7 | | | 2.06% | | | | 2.10% | | | | 2.20% | | | | 2.14% | | | 2.22% |
| | | | | | | |
Total expenses excluding recoupment of past waived fees | | | 1.28% | 7 | | | 1.31% | | | | 1.31% | | | | 1.37% | | | | 1.35% | | | | 1.35% | | | | 2.10% | 7 | | | 2.06% | | | | 2.10% | | | | 2.17% | | | | 2.14% | | | 2.22% |
| | | | | | | |
Total expenses after fees waived, reimbursed and paid indirectly | | | 1.28% | 7 | | | 1.31% | | | | 1.31% | | | | 1.37% | | | | 1.35% | | | | 1.35% | | | | 2.09% | 7 | | | 2.06% | | | | 2.09% | | | | 2.20% | | | | 2.14% | | | 2.19% |
| | | | | | | |
Net investment income (loss) | | | 0.33% | 7 | | | (0.24)% | | | | (0.11)% | | | | 0.02% | | | | (0.06)% | | | | (0.13)% | | | | (0.48)% | 7 | | | (0.99)% | | | | (0.88)% | | | | (0.80)% | | | | (0.85)% | | | (0.96)% |
| | | | | | | |
| | | | | | | |
Supplemental Data |
Net assets, end of period (000) | | $ | 968,880 | | | $ | 825,046 | | | $ | 682,857 | | | $ | 478,273 | | | $ | 564,943 | | | | $697,451 | | | $ | 45,626 | | | $ | 46,180 | | | $ | 47,855 | | | $ | 57,835 | | | $ | 80,269 | | | $ 95,231 |
| | | | | | | |
Portfolio turnover | | | 72% | | | | 135% | | | | 184% | | | | 153% | | | | 91% | | | | 98% | | | | 72% | | | | 135% | | | | 184% | | | | 153% | | | | 91% | | | 98% |
| | | | | | | |
1 Based on average shares outstanding. |
2 Includes redemption fees, which are less than $0.01 per share. |
3 Where applicable, total investment returns exclude the effects of any sales charges and include the reinvestment of dividends and distributions. |
4 Aggregate total investment return. |
5 Redemption fee of 2.00% is reflected in total return calculations. There was no impact to the return. |
6 Includes proceeds received from a settlement of litigation, which had no impact on the Fund’s total return. |
7 Annualized. |
See Notes to Financial Statements.
| | | | |
| | | | |
42 | | BLACKROCK FUNDS | | MARCH 31, 2012 |
| | |
| Financial Highlights (concluded) | | BlackRock Health Sciences Opportunities Portfolio |
| | | | | | | | | | | | | | | | | | | | | | | | | | | | | | | | |
| | | Investor C | | | | | Class R |
| | | Six Months
Ended March 31,
2012
(Unaudited) | | | Year Ended September 30, | | | | | Six Months
Ended March 31,
2012
(Unaudited) | | | Period
September 12, 20111 to
September 30, 2011 |
| | | | 2011 | | | | 2010 | | | | 2009 | | | | 2008 | | | | 2007 | | | | | |
Per Share Operating Performance |
Net asset value, beginning of period | | $ | 26.18 | | | $ | 26.37 | | | $ | 24.22 | | | $ | 26.70 | | | $ | 28.27 | | | $ | 24.62 | | | | | $ | 28.00 | | | $ 28.19 |
Net investment loss2 | | | (0.05 | ) | | | (0.27 | ) | | | (0.21 | ) | | | (0.15 | ) | | | (0.21 | ) | | | (0.23 | ) | | | | | (0.01 | ) | | (0.01) |
Net realized and unrealized gain (loss) | | | 4.52 | | | | 1.14 | 3 | | | 2.36 | 3 | | | (0.16 | )3 | | | (0.47 | )3 | | | 4.23 | 3 | | | | | 4.82 | | | (0.18)3 |
Net increase (decrease) from investment operations | | | 4.47 | | | | 0.87 | | | | 2.15 | | | | (0.31 | ) | | | (0.68 | ) | | | 4.00 | | | | | | 4.81 | | | (0.19) |
Distributions from net realized gain | | | (1.30 | ) | | | (1.06 | ) | | | – | | | | (2.17 | ) | | | (0.89 | ) | | | (0.35 | ) | | | | | (1.52 | ) | | – |
Net asset value, end of period | | $ | 29.35 | | | $ | 26.18 | | | $ | 26.37 | | | $ | 24.22 | | | $ | 26.70 | | | $ | 28.27 | | | | | $ | 31.29 | | | $ 28.00 |
| | | | | | | | | |
Total Investment Return4 |
Based on net asset value | | | 17.81% | 5 | | | 3.32% | 6 | | | 8.88% | 6,7 | | | 0.81% | 6 | | | (2.66 | )%6 | | | 16.43% | 6 | | | | | 17.99% | 5 | | (0.64)%5,6 |
| | | | | | | | | |
Ratios to Average Net Assets |
Total expenses | | | 2.02% | 8 | | | 2.02% | | | | 2.04% | | | | 2.09% | | | | 2.05% | | | | 2.12% | | | | | | 1.69% | 8 | | 1.75%8 |
Total expenses excluding recoupment of past waived fees | | | 2.02% | 8 | | | 2.02% | | | | 2.04% | | | | 2.09% | | | | 2.05% | | | | 2.12% | | | | | | 1.69% | 8 | | 1.75%8 |
Total expenses after fees waived, reimbursed and paid indirectly | | | 2.01% | 8 | | | 2.02% | | | | 2.04% | | | | 2.09% | | | | 2.05% | | | | 2.11% | | | | | | 1.67% | 8 | | 1.75%8 |
Net investment loss | | | (0.40)% | 8 | | | (0.95)% | | | | (0.83)% | | | | (0.70)% | | | | (0.76)% | | | | (0.89)% | | | | | | (0.04)% | 8 | | (0.82)%8 |
| | | | | | | | | |
Supplemental Data |
Net assets, end of period (000) | | $ | 370,241 | | | $ | 327,855 | | | $ | 285,428 | | | $ | 255,340 | | | $ | 305,015 | | | $ | 363,739 | | | | | $ | 12,561 | | | $ 9,580 |
Portfolio turnover | | | 72% | | | | 135% | | | | 184% | | | | 153% | | | | 91% | | | | 98% | | | | | | 72% | | | 135% |
1 Commencement of operations. |
2 Based on average shares outstanding. |
3 Includes redemption fees, which are less than $0.01 per share. |
4 Where applicable, total investment returns exclude the effects of any sales charges and include the reinvestment of dividends and distributions. |
5 Aggregate total investment return. |
6 Redemption fee of 2.00% is reflected in total return calculations. There was no impact to the return. |
7 Includes proceeds received from a settlement of litigation, which had no impact on the Fund’s total return. |
8 Annualized. |
See Notes to Financial Statements.
| | | | | | |
| | | | | | |
| | BLACKROCK FUNDS | | MARCH 31, 2012 | | 43 |
| | |
| Financial Highlights | | BlackRock International Opportunities Portfolio |
| | |
| | | | | | | | | | | | | | | | | | | | | | | | | | | | | | | | | | | | | | | | | | | | | | | | | | |
| | | Institutional | | | | | Service | |
| | | Six Months
Ended March 31,
2012
(Unaudited) | | | Year Ended September 30, | | | | | Six Months
Ended March 31,
2012
(Unaudited) | | | Year Ended September 30, | |
| | | | 2011 | | | | 2010 | | | | 2009 | | | | 2008 | | | | 2007 | | | | | | | 2011 | | | | 2010 | | | | 2009 | | | | 2008 | | | | 2007 | |
Per Share Operating Performance | | | | | | | | | | | | | | | | | | | | | | | | | | | | | | | | | | | | | | | | | | | |
Net asset value, beginning of period | | $ | 28.37 | | | $ | 32.76 | | | $ | 31.36 | | | $ | 29.44 | | | $ | 51.08 | | | $ | 42.16 | | | | | $ | 27.34 | | | $ | 31.58 | | | $ | 30.26 | | | $ | 28.36 | | | $ | 49.52 | | | $ | 41.06 | |
Net investment income1 | | | 0.12 | | | | 0.49 | | | | 0.28 | | | | 0.34 | | | | 0.47 | | | | 0.48 | | | | | | 0.04 | | | | 0.34 | | | | 0.16 | | | | 0.27 | | | | 0.28 | | | | 0.32 | |
Net realized and unrealized gain (loss) | | | 4.62 | | | | (4.52 | )2 | | | 1.58 | 2 | | | 1.68 | 2 | | | (13.66 | )2 | | | 14.98 | 2 | | | | | 4.47 | | | | (4.37 | )2 | | | 1.53 | 2 | | | 1.63 | 2 | | | (13.14 | )2 | | | 14.58 | 2 |
Net increase (decrease) from investment operations | | | 4.74 | | | | (4.03 | ) | | | 1.86 | | | | 2.02 | | | | (13.19 | ) | | | 15.46 | | | | | | 4.51 | | | | (4.03 | ) | | | 1.69 | | | | 1.90 | | | | (12.86 | ) | | | 14.90 | |
Dividends and distributions from: | | | | | | | | | | | | | | | | | | | | | | | | | | | | | | | | | | | | | | | | | | | | | | | | | | |
Net investment income | | | (0.60 | ) | | | (0.36 | ) | | | (0.46 | ) | | | (0.10 | ) | | | (1.21 | ) | | | (0.71 | ) | | | | | (0.44 | ) | | | (0.21 | ) | | | (0.37 | ) | | | – | | | | (1.06 | ) | | | (0.61 | ) |
Net realized gain | | | – | | | | – | | | | – | | | | – | | | | (7.24 | ) | | | (5.83 | ) | | | | | – | | | | – | | | | – | | | | – | | | | (7.24 | ) | | | (5.83 | ) |
Total dividends and distributions | | | (0.60 | ) | | | (0.36 | ) | | | (0.46 | ) | | | (0.10 | ) | | | (8.45 | ) | | | (6.54 | ) | | | | | (0.44 | ) | | | (0.21 | ) | | | (0.37 | ) | | | – | | | | (8.30 | ) | | | (6.44 | ) |
Net asset value, end of period | | $ | 32.51 | | | $ | 28.37 | | | $ | 32.76 | | | $ | 31.36 | | | $ | 29.44 | | | $ | 51.08 | | | | | $ | 31.41 | | | $ | 27.34 | | | $ | 31.58 | | | $ | 30.26 | | | $ | 28.36 | | | $ | 49.52 | |
| | | | | | | | | | |
Total Investment Return3 | | | | | | | | | | | | | | | | | | | | | | | | | | | | | | | | | | | | | | | | | | | |
Based on net asset value | | | 16.96% | 4 | | | (12.50)% | 5 | | | 5.99% | 5 | | | 6.99% | 5 | | | (30.87)% | 5,6 | | | 40.42% | 5 | | | | | 16.69% | 4 | | | (12.88)% | 5 | | | 5.63% | 5 | | | 6.70% | 5 | | | (31.10)% | 5,6 | | | 40.00% | 5 |
| | | | | | | | | | |
Ratios to Average Net Assets | | | | | | | | | | | | | | | | | | | | | | | | | | | | | | | | | | | | | | | | | | | |
Total expenses | | | 1.30% | 7 | | | 1.26% | | | | 1.35% | | | | 1.45% | | | | 1.25% | | | | 1.25% | | | | | | 1.81% | 7 | | | 1.66% | | | | 1.72% | | | | 1.75% | | | | 1.58% | | | | 1.59% | |
Total expenses excluding recoupment of past waived fees | | | 1.30% | 7 | | | 1.26% | | | | 1.34% | | | | 1.45% | | | | 1.25% | | | | 1.25% | | | | | | 1.81% | 7 | | | 1.66% | | | | 1.69% | | | | 1.73% | | | | 1.58% | | | | 1.59% | |
Total expenses after fees waived, reimbursed and paid indirectly | | | 1.30% | 7 | | | 1.26% | | | | 1.35% | | | | 1.43% | | | | 1.25% | | | | 1.25% | | | | | | 1.79% | 7 | | | 1.65% | | | | 1.72% | | | | 1.70% | | | | 1.58% | | | | 1.58% | |
Net investment income | | | 0.75% | 7 | | | 1.41% | | | | 0.91% | | | | 1.36% | | | | 1.18% | | | | 1.06% | | | | | | 0.24% | 7 | | | 1.02% | | | | 0.53% | | | | 1.13% | | | | 0.72% | | | | 0.73% | |
| | | | | | | | | | |
Supplemental Data | | | | | | | | | | | | | | | | | | | | | | | | | | | | | | | | | | | | | | | | | | | |
Net assets, end of period (000) | | $ | 908,188 | | | $ | 792,695 | | | $ | 802,167 | | | $ | 673,420 | | | $ | 450,605 | | | $ | 492,444 | | | | | $ | 52,022 | | | $ | 47,846 | | | $ | 70,365 | | | $ | 83,093 | | | $ | 64,368 | | | $ | 172,135 | |
Portfolio turnover | | | 41% | | | | 116% | | | | 116% | | | | 143% | | | | 138% | | | | 77% | | | | | | 41% | | | | 116% | | | | 116% | | | | 143% | | | | 138% | | | | 77% | |
| | 1 | Based on average shares outstanding. |
| | 2 | Includes redemption fees, which are less than $0.01 per share. |
| | 3 | Where applicable, total investment returns exclude the effects of any sales charges and include the reinvestment of dividends and distributions. |
| | 4 | Aggregate total investment return. |
| | 5 | Redemption fee of 2.00% is reflected in total return calculations. There was no impact to the return. |
| | 6 | Payment from affiliate of $112,880 received by the Fund is reflected in total return calculations. There was no impact to the return. |
See Notes to Financial Statements.
| | | | |
| | | | |
44 | | BLACKROCK FUNDS | | MARCH 31, 2012 |
| | |
| Financial Highlights (continued) | | BlackRock International Opportunities Portfolio |
| | | | | | | | | | | | | | | | | | | | | | | | | | | | | | | | | | | | | | | | | | | | | | | | | | |
| | | Investor A | | | Investor B |
| | | Six Months | | | | | | | | | | | | | | | | | | Six Months | | | | | | | | | | | | | | | | | | |
| | | Ended | | | | | | | | | | | | | | | | | | Ended | | | | | | | | | | | | | | | | | | |
| | | March 31, | | | Year Ended September 30, | | | March 31, | | | Year Ended September 30, |
| | | 2012 | | | | | | | | | | | | | | | | | | 2012 | | | | | | | | | | | | | | | | | | |
| | | (Unaudited) | | | 2011 | | | 2010 | | | 2009 | | | 2008 | | | 2007 | | | (Unaudited) | | | 2011 | | | 2010 | | | 2009 | | | 2008 | | | 2007 | | | |
Per Share Operating Performance | | | | | | | | | | | | | | | | | | | | | | | | | | | | | | | |
Net asset value, beginning of period | | | $ 27.10 | | | $ | 31.33 | | | $ | 30.02 | | | $ | 28.14 | | | $ | 49.19 | | | $ | 40.81 | | | $ | 25.18 | | | $ | 29.10 | | | $ | 27.83 | | | $ | 26.29 | | | $ | 46.43 | | | $ | 38.81 | | | |
| | | | | | | |
Net investment income1 | | | 0.07 | | | | 0.39 | | | | 0.21 | | | | 0.27 | | | | 0.33 | | | | 0.30 | | | | (0.05 | ) | | | 0.10 | | | | (0.05 | ) | | | 0.09 | | | | (0.06 | ) | | | (0.04) | | | |
Net realized and unrealized gain (loss) | | | 4.44 | | | | (4.34 | )2 | | | 1.50 | 2 | | | 1.62 | 2 | | | (13.09 | )2 | | | 14.492 | | | | 4.15 | | | | (4.01 | )2 | | | 1.42 | 2 | | | 1.45 | 2 | | | (12.16 | )2 | | | 13.742 | | | |
| | | | | | | |
Net increase (decrease) from investment operations | | | 4.51 | | | | (3.95 | ) | | | 1.71 | | | | 1.89 | | | | (12.76 | ) | | | 14.79 | | | | 4.10 | | | | (3.91 | ) | | | 1.37 | | | | 1.54 | | | | (12.22 | ) | | | 13.70 | | | |
| | | | | | | |
Dividends and distributions from: | | | | | | | | | | | | | | | | | | | | | | | | | | | | | | | | | | | |
Net investment income | | | (0.52 | ) | | | (0.28 | ) | | | (0.40 | ) | | | (0.01 | ) | | | (1.05 | ) | | | (0.58) | | | | (0.22 | ) | | | (0.01 | ) | | | (0.10 | ) | | | – | | | | (0.68 | ) | | | (0.25) | | | |
Net realized gain | | | – | | | | – | | | | – | | | | – | | | | (7.24 | ) | | | (5.83) | | | | – | | | | – | | | | – | | | | – | | | | (7.24 | ) | | | (5.83) | | | |
| | | | | | | |
Total dividends and distributions | | | (0.52 | ) | | | (0.28 | ) | | | (0.40 | ) | | | (0.01 | ) | | | (8.29 | ) | | | (6.41) | | | | (0.22 | ) | | | (0.01 | ) | | | (0.10 | ) | | | – | | | | (7.92 | ) | | | (6.08) | | | |
| | | | | | | |
Net asset value, end of period | | | $ 31.09 | | | $ | 27.10 | | | $ | 31.33 | | | $ | 30.02 | | | $ | 28.14 | | | $ | 49.19 | | | $ | 29.06 | | | $ | 25.18 | | | $ | 29.10 | | | $ | 27.83 | | | $ | 26.29 | | | $ | 46.43 | | | |
| | | | | | | |
| | | | | | | | | | | | | | | | | | | | | | | | | | | | | | | | | | | | | | | | | | | | | | | | | | |
Total Investment Return3 | | | | | | | | | | | | | | | | | | | | | | | | | | | | | | | |
Based on net asset value | | | 16.84% | 4 | | | (12.77)% | 5 | | | 5.73% | 5 | | | 6.73% | 5 | | | (31.09)% | 5,6 | | | 39.98%5 | | | | 16.36% | 4 | | | (13.45)% | 5 | | | 4.92% | 5 | | | 5.86% | 5 | | | (31.63)% | 5,6 | | | 38.89%5 | | | |
| | | | | | | |
| | | | | | | | | | | | | | | | | | | | | | | | | | | | | | | | | | | | | | | | | | | | | | | | | | |
Ratios to Average Net Assets | | | | | | | | | | | | | | | | | | | | | | | | | | | | | | | |
Total expenses | | | 1.56% | 7 | | | 1.54% | | | | 1.59% | | | | 1.68% | | | | 1.58% | | | | 1.60% | | | | 2.38% | 7 | | | 2.32% | | | | 2.38% | | | | 2.49% | | | | 2.35% | | | | 2.37% | | | |
| | | | | | | |
Total expenses excluding recoupment of past waived fees | | | 1.56% | 7 | | | 1.54% | | | | 1.59% | | | | 1.68% | | | | 1.58% | | | | 1.60% | | | | 2.38% | 7 | | | 2.32% | | | | 2.38% | | | | 2.49% | | | | 2.35% | | | | 2.37% | | | |
| | | | | | | |
Total expenses after fees waived, reimbursed and paid indirectly | | | 1.55% | 7 | | | 1.53% | | | | 1.59% | | | | 1.68% | | | | 1.58% | | | | 1.60% | | | | 2.37% | 7 | | | 2.32% | | | | 2.38% | | | | 2.49% | | | | 2.35% | | | | 2.37% | | | |
| | | | | | | |
Net investment income | | | 0.48% | 7 | | | 1.16% | | | | 0.72% | | | | 1.15% | | | | 0.87% | | | | 0.69% | | | | (0.35)% | 7 | | | 0.34% | | | | (0.18)% | | | | 0.41% | | | | (0.15)% | | | | (0.10)% | | | |
| | | | | | | |
| | | | | | | | | | | | | | | | | | | | | | | | | | | | | | | | | | | | | | | | | | | | | | | | | | |
Supplemental Data | | | | | | | | | | | | | | | | | | | | | | | | | | | | | | | |
Net assets, end of period (000) | | | $766,075 | | | $ | 703,201 | | | $ | 794,034 | | | $ | 604,283 | | | $ | 482,526 | | | $ | 555,189 | | | $ | 13,582 | | | $ | 15,568 | | | $ | 25,080 | | | $ | 33,094 | | | $ | 42,927 | | | $ | 102,624 | | | |
| | | | | | | |
Portfolio turnover | | | 41% | | | | 116% | | | | 116% | | | | 143% | | | | 138% | | | | 77% | | | | 41% | | | | 116% | | | | 116% | | | | 143% | | | | 138% | | | | 77% | | | |
| | | | | | | |
| | 1 | Based on average shares outstanding. |
| | 2 | Includes redemption fees, which are less than $0.01 per share. |
| | 3 | Where applicable, total investment returns exclude the effects of any sales charges and include the reinvestment of dividends and distributions. |
| | 4 | Aggregate total investment return. |
| | 5 | Redemption fee of 2.00% is reflected in total return calculations. There was no impact to the return. |
| | 6 | Payment from affiliate of $112,880 received by the Fund is reflected in total return calculations. There was no impact to the return. |
See Notes to Financial Statements.
| | | | | | |
| | | | | | |
| | BLACKROCK FUNDS | | MARCH 31, 2012 | | 45 |
| | |
| Financial Highlights (concluded) | | BlackRock International Opportunities Portfolio |
| | |
| | | | | | | | | | | | | | | | | | | | | | | | | | |
| | | Investor C |
| | | Six Months | | | | | | | | | | | | | | | | | | |
| | | Ended | | | Year Ended September 30, |
| | | March 31, | | | | | | | | | | | | | | | | | | |
| | | 2012 | | | | | | | | | | | | | | | | | | |
| | | (Unaudited) | | | 2011 | | | 2010 | | | 2009 | | | 2008 | | | 2007 | | | |
|
Per Share Operating Performance | | | | | | | | | | | | | | | | | | | | | | | | | | |
|
Net asset value, beginning of period | | $ | 24.98 | | | $ | 28.92 | | | $ | 27.74 | | | $ | 26.21 | | | $ | 46.34 | | | $ | 38.78 | | | |
| | | |
Net investment income (loss)1 | | | (0.04 | ) | | | 0.11 | | | | (0.02 | ) | | | 0.08 | | | | 0.03 | | | | (0.03 | ) | | |
Net realized and unrealized gain (loss) | | | 4.10 | | | | (3.98 | )2 | | | 1.39 | 2 | | | 1.45 | 2 | | | (12.20 | )2 | | | 13.71 | 2 | | |
| | | |
Net increase (decrease) from investment operations | | | 4.06 | | | | (3.87 | ) | | | 1.37 | | | | 1.53 | | | | (12.17 | ) | | | 13.68 | | | |
| | | |
Dividends and distributions from: | | | | | | | | | | | | | | | | | | | | | | | | | | |
Net investment income | | | (0.25 | ) | | | (0.07 | ) | | | (0.19 | ) | | | – | | | | (0.72 | ) | | | (0.29 | ) | | |
Net realized gain | | | – | | | | – | | | | – | | | | – | | | | (7.24 | ) | | | (5.83 | ) | | |
| | | |
Total dividends and distributions | | | (0.25 | ) | | | (0.07 | ) | | | (0.19 | ) | | | – | | | | (7.96 | ) | | | (6.12 | ) | | |
| | | |
Net asset value, end of period | | $ | 28.79 | | | $ | 24.98 | | | $ | 28.92 | | | $ | 27.74 | | | $ | 26.21 | | | $ | 46.34 | | | |
| | | |
|
Total Investment Return3 | | | | | | | | | | | | | | | | | | | | | | | | | | |
|
Based on net asset value | | | 16.35% | 4 | | | (13.44)% | 5 | | | 4.95% | 5 | | | 5.84% | 5 | | | (31.61)% | 5,6 | | | 38.91% | 5 | | |
| | | |
|
Ratios to Average Net Assets | | | | | | | | | | | | | | | | | | | | | | | | | | |
|
Total expenses | | | 2.35% | 7 | | | 2.31% | | | | 2.36% | | | | 2.49% | | | | 2.32% | | | | 2.36% | | | |
| | | |
Total expenses excluding recoupment of past waived fees | | | 2.35% | 7 | | | 2.31% | | | | 2.36% | | | | 2.49% | | | | 2.32% | | | | 2.36% | | | |
| | | |
Total expenses after fees waived, reimbursed and paid indirectly | | | 2.35% | 7 | | | 2.31% | | | | 2.36% | | | | 2.48% | | | | 2.32% | | | | 2.36% | | | |
| | | |
Net investment income (loss) | | | (0.31)% | 7 | | | 0.37% | | | | (0.06)% | | | | 0.38% | | | | 0.08% | | | | (0.08)% | | | |
| | | |
| | | | | | | | | | | | | | | | | | | | | | | | | | |
|
Supplemental Data | | | | | | | | | | | | | | | | | | | | | | | | | | |
|
Net assets, end of period (000) | | $ | 171,690 | | | $ | 169,481 | | | $ | 224,958 | | | $ | 187,246 | | | $ | 194,068 | | | $ | 255,980 | | | |
| | | |
Portfolio turnover | | | 41% | | | | 116% | | | | 116% | | | | 143% | | | | 138% | | | | 77% | | | |
| | | |
| | 1 | Based on average shares outstanding. |
| | 2 | Includes redemption fees, which are less than $0.01 per share. |
| | 3 | Where applicable, total investment returns exclude the effects of any sales charges and include the reinvestment of dividends and distributions. |
| | 4 | Aggregate total investment return. |
| | 5 | Redemption fee of 2.00% is reflected in total return calculations. There was no impact to the return. |
| | 6 | Payment from affiliate of $112,880 received by the Fund is reflected in total return calculations. There was no impact to the return. |
See Notes to Financial Statements.
| | | | |
| | | | |
46 | | BLACKROCK FUNDS | | MARCH 31, 2012 |
| | |
| Financial Highlights | | BlackRock Science & Technology Opportunities Portfolio |
| | | | | | | | | | | | | | | | | | | | | | | | | | | | | | | | | | | | | | | | | | | | | | |
| | | Institutional | | | Service |
| | | Six Months
Ended March 31,
2012
(Unaudited) | | | Year Ended September 30, | | | Six Months
Ended March 31,
2012
(Unaudited) | | | Year Ended September 30, |
| | | | 2011 | | | | 2010 | | | | 2009 | | | | 2008 | | | | 2007 | | | | | 2011 | | | | 2010 | | | | 2009 | | | | 2008 | | | 2007 |
Per Share Operating Performance |
Net asset value, beginning of period | | $ | 8.61 | | | $ | 9.02 | | | $ | 7.79 | | | $ | 6.98 | | | $ | 9.03 | | | $ | 7.20 | | | $ | 8.32 | | | $ | 8.72 | | | $ | 7.56 | | | $ | 6.80 | | | $ | 8.83 | | | $ 7.07 |
| | | | | | | |
Net investment loss1 | | | (0.04 | ) | | | (0.06 | ) | | | (0.05 | ) | | | (0.02 | ) | | | (0.05 | ) | | | (0.03) | | | | (0.05 | ) | | | (0.07 | ) | | | (0.08 | ) | | | (0.04 | ) | | | (0.06 | ) | | (0.07) |
Net realized and unrealized gain (loss) | | | 2.11 | | | | (0.35 | )2 | | | 1.28 | 2 | | | 0.83 | 2 | | | (2.00 | )2 | | | 1.862 | | | | 2.04 | | | | (0.33 | )2 | | | 1.24 | 2 | | | 0.80 | 2 | | | (1.97 | )2 | | 1.832 |
| | | | | | | |
Net increase (decrease) from investment operations | | | 2.07 | | | | (0.41 | ) | | | 1.23 | | | | 0.81 | | | | (2.05 | ) | | | 1.83 | | | | 1.99 | | | | (0.40 | ) | | | 1.16 | | | | 0.76 | | | | (2.03 | ) | | 1.76 |
| | | | | | | |
Net asset value, end of period | | $ | 10.68 | | | $ | 8.61 | | | $ | 9.02 | | | $ | 7.79 | | | $ | 6.98 | | | $ | 9.03 | | | $ | 10.31 | | | $ | 8.32 | | | $ | 8.72 | | | $ | 7.56 | | | $ | 6.80 | | | $ 8.83 |
| | | | | | | |
| | | | | | | |
Total Investment Return3 |
Based on net asset value | | | 24.04% | 4 | | | (4.55)% | 5 | | | 15.79% | 5,6 | | | 11.60% | 5,7 | | | (22.70)% | 5 | | | 25.42%5 | | | | 23.92% | 4 | | | (4.59)% | 5 | | | 15.34% | 5,8 | | | 11.18% | 5,9 | | | (22.99)% | 5 | | 24.89%5 |
| | | | | | | |
| | | | | | | |
Ratios to Average Net Assets |
Total expenses | | | 1.46% | 10 | | | 1.46% | | | | 1.55% | | | | 1.90% | | | | 1.70% | | | | 1.91% | | | | 1.57% | 10 | | | 1.55% | | | | 1.76% | | | | 1.96% | | | | 2.01% | | | 2.30% |
| | | | | | | |
Total expenses excluding recoupment of past waived fees | | | 1.46% | 10 | | | 1.46% | | | | 1.55% | | | | 1.90% | | | | 1.70% | | | | 1.91% | | | | 1.54% | 10 | | | 1.54% | | | | 1.67% | | | | 1.96% | | | | 2.01% | | | 2.30% |
| | | | | | | |
Total expenses after fees waived, reimbursed and paid indirectly | | | 1.39% | 10 | | | 1.39% | | | | 1.39% | | | | 1.36% | | | | 1.35% | | | | 1.35% | | | | 1.56% | 10 | | | 1.53% | | | | 1.74% | | | | 1.75% | | | | 1.73% | | | 1.73% |
| | | | | | | |
Net investment loss | | | (0.81)% | 10 | | | (0.60)% | | | | (0.59)% | | | | (0.27)% | | | | (0.55)% | | | | (0.44)% | | | | (1.00)% | 10 | | | (0.74)% | | | | (0.94)% | | | | (0.71)% | | | | (0.75)% | | | (0.85)% |
| | | | | | | |
| | | | | | | |
Supplemental Data |
Net assets, end of period (000) | | $ | 41,787 | | | $ | 33,982 | | | $ | 33,135 | | | $ | 27,013 | | | $ | 42,886 | | | $ | 1,449 | | | $ | 1,169 | | | $ | 851 | | | $ | 659 | | | $ | 193 | | | $ | 106 | | | $ 123 |
| | | | | | | |
Portfolio turnover | | | 164% | | | | 103% | | | | 97% | | | | 158% | | | | 89% | | | | 92% | | | | 164% | | | | 103% | | | | 97% | | | | 158% | | | | 89% | | | 92% |
| | | | | | | |
1 Based on average shares outstanding. |
2 Includes redemption fees, which are less than $0.01 per share. |
3 Where applicable, total investment returns exclude the effects of any sales charges and include the reinvestment of dividends and distributions. |
4 Aggregate total investment return. |
5 Redemption fee of 2.00% is reflected in total return calculations. There was no impact to the return. |
6 Includes proceeds received from a settlement of litigation, which impacted the Fund’s total return. Excluding these proceeds, the Fund’s total return would have been 15.53%. |
7 Includes proceeds received from a settlement of litigation, which impacted the Fund’s total return. Excluding these proceeds, the Fund’s total return would have been 9.03%. |
8 Includes proceeds received from a settlement of litigation, which impacted the Fund’s total return. Excluding these proceeds, the Fund’s total return would have been 15.08%. |
9 Includes proceeds received from a settlement of litigation, which impacted the Fund’s total return. Excluding these proceeds, the Fund’s total return would have been 8.53%. |
10 Annualized. |
See Notes to Financial Statements.
| | | | | | |
| | | | | | |
| | BLACKROCK FUNDS | | MARCH 31, 2012 | | 47 |
| | |
| Financial Highlights (continued) | | BlackRock Science & Technology Opportunities Portfolio |
| | | | | | | | | | | | | | | | | | | | | | | | | | | | | | | | | | | | | | | | | | | | | | | | |
| | | Investor A | | | | | Investor B |
| | | Six Months
Ended March 31,
2012
(Unaudited) | | | Year Ended September 30, | | | | | Six Months
Ended March 31,
2012
(Unaudited) | | | Year Ended September 30, |
| | | | 2011 | | | 2010 | | | 2009 | | | 2008 | | | 2007 | | | | | | 2011 | | | 2010 | | | 2009 | | | 2008 | | | 2007 |
Per Share Operating Performance |
Net asset value, beginning of period | | $ | 8.21 | | | $ | 8.62 | | | $ | 7.48 | | | $ | 6.73 | | | $ | 8.74 | | | $ | 7.00 | | | | | $ | 7.48 | | | $ | 7.93 | | | $ | 6.94 | | | $ | 6.30 | | | $ | 8.26 | | | $ 6.66 |
Net investment loss1 | | | (0.05 | ) | | | (0.09 | ) | | | (0.08 | ) | | | (0.04 | ) | | | (0.06 | ) | | | (0.06 | ) | | | | | (0.08 | ) | | | (0.16 | ) | | | (0.14 | ) | | | (0.08 | ) | | | (0.13 | ) | | (0.12) |
Net realized and unrealized gain (loss) | | | 1.99 | | | | (0.32 | )2 | | | 1.22 | 2 | | | 0.79 | 2 | | | (1.95 | )2 | | | 1.80 | 2 | | | | | 1.82 | | | | (0.29 | )2 | | | 1.13 | 2 | | | 0.72 | 2 | | | (1.83 | )2 | | 1.722 |
Net increase (decrease) from investment operations | | | 1.94 | | | | (0.41 | ) | | | 1.14 | | | | 0.75 | | | | (2.01 | ) | | | 1.74 | | | | | | 1.74 | | | | (0.45 | ) | | | 0.99 | | | | 0.64 | | | | (1.96 | ) | | 1.60 |
Net asset value, end of period | | $ | 10.15 | | | $ | 8.21 | | | $ | 8.62 | | | $ | 7.48 | | | $ | 6.73 | | | $ | 8.74 | | | | | $ | 9.22 | | | $ | 7.48 | | | $ | 7.93 | | | $ | 6.94 | | | $ | 6.30 | | | $ 8.26 |
| | | | | | | | | |
Total Investment Return3 |
Based on net asset value | | | 23.63% | 4 | | | (4.76 | )%5 | | | 15.24% | 5,6 | | | 11.14% | 5,7 | | | (23.00 | )%5 | | | 24.86% | 5 | | | | | 23.26% | 4 | | | (5.68 | )%5 | | | 14.27% | 5,8 | | | 10.16% | 5,9 | | | (23.73 | )%5 | | 24.02%5 |
| | | | | | | | | |
Ratios to Average Net Assets |
Total expenses | | | 1.75% | 10 | | | 1.79% | | | | 1.82% | | | | 2.24% | | | | 2.04% | | | | 2.16% | | | | | | 2.56% | 10 | | | 2.67% | | | | 2.70% | | | | 3.13% | | | | 2.96% | | | 3.01% |
Total expenses excluding recoupment of past waived fees | | | 1.72% | 10 | | | 1.71% | | | | 1.81% | | | | 2.24% | | | | 2.04% | | | | 2.16% | | | | | | 2.56% | 10 | | | 2.44% | | | | 2.65% | | | | 3.00% | | | | 2.96% | | | 3.01% |
Total expenses after fees waived, reimbursed and paid indirectly | | | 1.74% | 10 | | | 1.78% | | | | 1.79% | | | | 1.77% | | | | 1.75% | | | | 1.73% | | | | | | 2.56% | 10 | | | 2.66% | | | | 2.69% | | | | 2.65% | | | | 2.65% | | | 2.50% |
Net investment loss | | | (1.15)% | 10 | | | (0.98)% | | | | (0.99)% | | | | (0.68)% | | | | (0.77)% | | | | (0.80)% | | | | | | (1.96)% | 10 | | | (1.87)% | | | | (1.90)% | | | | (1.53)% | | | | (1.70)% | | | (1.59)% |
| | | | | | | | | |
Supplemental Data |
Net assets, end of period (000) | | $ | 121,050 | | | $ | 106,632 | | | $ | 105,577 | | | $ | 83,734 | | | $ | 72,659 | | | $ | 21,632 | | | | | $ | 3,270 | | | $ | 3,130 | | | $ | 4,390 | | | $ | 6,538 | | | $ | 11,473 | | | $ 9,030 |
Portfolio turnover | | | 164% | | | | 103% | | | | 97% | | | | 158% | | | | 89% | | | | 92% | | | | | | 164% | | | | 103% | | | | 97% | | | | 158% | | | | 89% | | | 92% |
1 Based on average shares outstanding. |
2 Includes redemption fees, which are less than $0.01 per share. |
3 Where applicable, total investment returns exclude the effects of any sales charges and include the reinvestment of dividends and distributions. |
4 Aggregate total investment return. |
5 Redemption fee of 2.00% is reflected in total return calculations. There was no impact to the return. |
6 Includes proceeds received from a settlement of litigation, which impacted the Fund’s total return. Excluding these proceeds, the Fund’s total return would have been 14.97%. |
7 Includes proceeds received from a settlement of litigation, which impacted the Fund’s total return. Excluding these proceeds, the Fund’s total return would have been 8.47%. |
8 Includes proceeds received from a settlement of litigation, which impacted the Fund’s total return. Excluding these proceeds, the Fund’s total return would have been 13.98%. |
9 Includes proceeds received from a settlement of litigation, which impacted the Fund’s total return. Excluding these proceeds, the Fund’s total return would have been 7.30%. |
10 Annualized. |
See Notes to Financial Statements.
| | | | |
| | | | |
48 | | BLACKROCK FUNDS | | MARCH 31, 2012 |
| | |
| Financial Highlights (concluded) | | BlackRock Science & Technology Opportunities Portfolio |
| | |
| | | | | | | | | | | | | | | | | | | | | | | | | | | | | | | | | | | | | | | | | | | | | | | | | | | | | | | | | | | |
| | | Investor C | | Class R |
| | | Six Months
Ended | | Year Ended September 30, | | Six Months
Ended | | Year Ended September 30, | | Period September 8, 20081 to September 30, 2008 |
| | | March 31, | | | | | | | | | | | | March 31, | | | | | | | |
| | | 2012 | | | | | | | | | | | | 2012 | | | | | | | |
| | | (Unaudited) | | 2011 | | 2010 | | 2009 | | 2008 | | 2007 | | (Unaudited) | | 2011 | | 2010 | | 2009 | |
Per Share Operating Performance |
Net asset value, beginning of period | | | $ | 7.47 | | | | $ | 7.92 | | | | $ | 6.94 | | | | $ | 6.29 | | | | $ | 8.25 | | | | $ | 6.66 | | | | $ | 8.43 | | | | $ | 8.88 | | | | $ | 7.72 | | | | $ | 6.97 | | | | | | $ | 7.38 | | | |
| | | | | | | | | | |
Net investment loss2 | | | | (0.08 | ) | | | | (0.16 | ) | | | | (0.14 | ) | | | | (0.09 | ) | | | | (0.13 | ) | | | | (0.12) | | | | | (0.06 | ) | | | | (0.12 | ) | | | | (0.11 | ) | | | | (0.06 | ) | | | | | | (0.01 | ) | | |
Net realized and unrealized gain (loss) | | | | 1.82 | | | | | (0.29 | )3 | | | | 1.12 | 3 | | | | 0.74 | 3 | | | | (1.83 | )3 | | | | 1.713 | | | | | 2.05 | | | | | (0.33 | )3 | | | | 1.27 | 3 | | | | 0.81 | 3 | | | | | | (0.40 | )3 | | |
| | | | | | | | | | |
Net increase (decrease) from investment operations | | | | 1.74 | | | | | (0.45 | ) | | | | 0.98 | | | | | 0.65 | | | | | (1.96 | ) | | | | 1.59 | | | | | 1.99 | | | | | (0.45 | ) | | | | 1.16 | | | | | 0.75 | | | | | | | (0.41 | ) | | |
| | | | | | | | | | |
Net asset value, end of period | | | $ | 9.21 | | | | $ | 7.47 | | | | $ | 7.92 | | | | $ | 6.94 | | | | $ | 6.29 | | | | $ | 8.25 | | | | $ | 10.42 | | | | $ | 8.43 | | | | $ | 8.88 | | | | $ | 7.72 | | | | | | $ | 6.97 | | | |
| | | | | | | | | | |
| | | | | | | | | | | | | | | | | | | | | | | | | | | | | | | | | | | | | | | | | | | | | | | | | | | | | | | | | | | |
Total Investment Return4 |
Based on net asset value | | | | 23.29% | 5 | | | | (5.68 | )%6 | | | | 14.12% | 6,7 | | | | 10.33% | 6,8 | | | | (23.76 | )%6 | | | | 23.87% | 6 | | | | 23.61% | 5 | | | | (5.07 | )%6 | | | | 15.03% | 6,9 | | | | 10.76% | 6,10 | | | | | | (5.56 | )%5,6 | | |
| | | | | | | | | | |
| | | | | | | | | | | | | | | | | | | | | | | | | | | | | | | | | | | | | | | | | | | | | | | | | | | | | | | | | | | |
Ratios to Average Net Assets |
Total expenses | | | | 2.63% | 11 | | | | 2.68% | | | | | 2.73% | | | | | 3.23% | | | | | 2.73% | | | | | 2.88% | | | | | 1.96% | 11 | | | | 2.00% | | | | | 2.10% | | | | | 2.42% | | | | | | | 2.36% | 11 | | |
| | | | | | | | | | |
Total expenses excluding recoupment of past waived fees | | | | 2.61% | 11 | | | | 2.59% | | | | | 2.73% | | | | | 3.23% | | | | | 2.73% | | | | | 2.88% | | | | | 1.95% | 11 | | | | 2.00% | | | | | 2.10% | | | | | 2.42% | | | | | | | 2.36% | 11 | | |
| | | | | | | | | | |
Total expenses after fees waived, reimbursed and paid indirectly | | | | 2.62% | 11 | | | | 2.67% | | | | | 2.71% | | | | | 2.68% | | | | | 2.62% | | | | | 2.61% | | | | | 1.95% | 11 | | | | 2.00% | | | | | 2.09% | | | | | 2.13% | | | | | | | 2.13% | 11 | | |
| | | | | | | | | | |
Net investment loss | | | | (2.04)% | 11 | | | | (1.88)% | | | | | (1.92)% | | | | | (1.59)% | | | | | (1.67)% | | | | | (1.69)% | | | | | (1.38)% | 11 | | | | (1.21)% | | | | | (1.29)% | | | | | (1.04)% | | | | | | | (1.49)% | 11 | | |
| | | | | | | | | | |
| | | | | | | | | | | | | | | | | | | | | | | | | | | | | | | | | | | | | | | | | | | | | | | | | | | | | | | | | | | |
Supplemental Data |
Net assets, end of period (000) | | | $ | 31,588 | | | | $ | 27,651 | | | | $ | 27,053 | | | | $ | 22,575 | | | | $ | 22,003 | | | | $ | 9,755 | | | | $ | 4,625 | | | | $ | 3,518 | | | | $ | 2,961 | | | | $ | 1,904 | | | | | | $ | 1,362 | | | |
| | | | | | | | | | |
Portfolio turnover | | | | 164% | | | | | 103% | | | | | 97% | | | | | 158% | | | | | 89% | | | | | 92% | | | | | 164% | | | | | 103% | | | | | 97% | | | | | 158% | | | | | | | 89% | | | |
| | | | | | | | | | |
| | 1 | Commencement of operations. |
| | 2 | Based on average shares outstanding. |
| | 3 | Includes redemption fees, which are less than $0.01 per share. |
| | 4 | Where applicable, total investment returns exclude the effects of any sales charges and include the reinvestment of dividends and distributions. |
| | 5 | Aggregate total investment return. |
| | 6 | Redemption fee of 2.00% is reflected in total return calculations. There was no impact to the return. |
| | 7 | Includes proceeds received from a settlement of litigation, which impacted the Fund’s total return. Excluding these proceeds, the Fund’s total return would have been 13.83%. |
| | 8 | Includes proceeds received from a settlement of litigation, which impacted the Fund’s total return. Excluding these proceeds, the Fund’s total return would have been 7.47%. |
| | 9 | Includes proceeds received from a settlement of litigation, which impacted the Fund’s total return. Excluding these proceeds, the Fund’s total return would have been 14.77%. |
| | 10 | Includes proceeds received from a settlement of litigation, which impacted the Fund’s total return. Excluding these proceeds, the Fund’s total return would have been 8.18%. |
See Notes to Financial Statements.
| | | | | | |
| | | | | | |
| | BLACKROCK FUNDS | | MARCH 31, 2012 | | 49 |
| | |
| Financial Highlights | | BlackRock U.S. Opportunities Portfolio |
| | |
| | | | | | | | | | | | | | | | | | | | | | | | | | | | | | | | | | | | | | | | | | | | | | | | | | | | | | | | | | | | | | | | | |
| | | Institutional | | Service |
| | | Six Months
Ended | | Year Ended September 30, | | Six Months
Ended | | Year Ended September 30, |
| | | March 31, | | | | | | | | | | | | March 31, | | | | | | | | | | | | |
| | | 2012 | | | | | | | | | | | | 2012 | | | | | | | | | | | | |
| | | (Unaudited) | | 2011 | | 2010 | | 2009 | | 2008 | | 2007 | | (Unaudited) | | 2011 | | 2010 | | 2009 | | 2008 | | 2007 |
Per Share Operating Performance | | | |
Net asset value, beginning of period | | | | $33.86 | | | | | $36.94 | | | | | $32.20 | | | | | $31.69 | | | | | $37.05 | | | | | $29.07 | | | | | $32.44 | | | | | $35.40 | | | | | $30.93 | | | | | $30.58 | | | | | $35.89 | | | | | $28.28 | | | |
| | | | | | | | | | |
Net investment income (loss)1 | | | | 0.09 | | | | | 0.05 | | | | | 0.04 | | | | | 0.09 | | | | | 0.09 | | | | | 0.03 | | | | | 0.00 | 2 | | | | (0.12 | ) | | | | (0.11 | ) | | | | (0.01 | ) | | | | (0.06 | ) | | | | (0.09 | ) | | |
Net realized and unrealized gain (loss) | | | | 7.35 | | | | | (2.44 | ) | | | | 4.77 | | | | | 0.42 | | | | | (5.45 | ) | | | | 7.95 | | | | | 7.03 | | | | | (2.34 | ) | | | | 4.58 | | | | | 0.35 | | | | | (5.25 | ) | | | | 7.70 | | | |
| | | | | | | | | | |
Net increase (decrease) from investment operations | | | | 7.44 | | | | | (2.39 | ) | | | | 4.81 | | | | | 0.51 | | | | | (5.36 | ) | | | | 7.98 | | | | | 7.03 | | | | | (2.46 | ) | | | | 4.47 | | | | | 0.34 | | | | | (5.31 | ) | | | | 7.61 | | | |
| | | | | | | | | | |
Dividends and distributions from: | | | | | | | | | | | | | | | | | | | | | | | | | | | | | | | | | | | | | | | | | | | | | | | | | | | | | | | | | | | | | | |
Net investment income | | | | – | | | | | – | | | | | (0.07 | ) | | | | (0.01 | ) | | | | – | | | | | – | | | | | – | | | | | – | | | | | – | | | | | – | | | | | – | | | | | – | | | |
| | | | | | | | | | |
Net realized gains | | | | (3.94 | ) | | | | (0.69 | ) | | | | – | | | | | – | | | | | – | | | | | – | | | | | (3.78 | ) | | | | (0.50 | ) | | | | – | | | | | – | | | | | – | | | | | – | | | |
| | | | | | | | | | |
Total dividends and distributions | | | | (3.94 | ) | | | | (0.69 | ) | | | | (0.07 | ) | | | | (0.01 | ) | | | | – | | | | | – | | | | | (3.78 | ) | | | | (0.50 | ) | | | | – | | | | | – | | | | | – | | | | | – | | | |
Redemption fees added to paid-in capital | | | | – | | | | | 0.00 | 2 | | | | 0.00 | 2 | | | | 0.01 | | | | | 0.00 | 2 | | | | 0.002 | | | | | – | | | | | 0.00 | 2 | | | | 0.00 | 2 | | | | 0.01 | | | | | 0.00 | 2 | | | | 0.00 | 2 | | |
| | | | | | | | | | |
Net asset value, end of period | | | | $37.36 | | | | | $33.86 | | | | | $36.94 | | | | | $32.20 | | | | | $31.69 | | | | | $37.05 | | | | | $35.69 | | | | | $32.44 | | | | | $35.40 | | | | | $30.93 | | | | | $30.58 | | | | | $35.89 | | | |
| | | | | | | | | | |
| | | | | | | | | | | | | | | | | | | | | | | | | | | | | | | | | | | | | | | | | | | | | | | | | | | | | | | | | | | | | | | |
Total Investment Return3 | | | |
Based on net asset value | | | | 23.51% | 4 | | | | (6.75)% | 5 | | | | 14.96% | 5,6 | | | | 1.63% | 7 | | | | (14.47)% | 5 | | | | 27.45%5 | | | | | 23.22% | 4 | | | | (7.16)% | 5 | | | | 14.45% | 5,6 | | | | 1.14% | 7 | | | | (14.80)% | 5 | | | | 26.91% | 5 | | |
| | | | | | | | | | |
| | | | | | | | | | | | | | | | | | | | | | | | | | | | | | | | | | | | | | | | | | | | | | | | | | | | | | | | | | | | | | | |
Ratios to Average Net Assets | | | |
Total expenses | | | | 1.38% | 8 | | | | 1.36% | | | | | 1.30% | | | | | 1.40% | | | | | 1.42% | | | | | 1.42% | | | | | 1.62% | 8 | | | | 1.57% | | | | | 1.60% | | | | | 1.71% | | | | | 1.68% | | | | | 1.69% | | | |
| | | | | | | | | | |
Total expenses excluding recoupment of past waived fees | | | | 1.38% | 8 | | | | 1.36% | | | | | 1.30% | | | | | 1.40% | | | | | 1.42% | | | | | 1.42% | | | | | 1.62% | 8 | | | | 1.57% | | | | | 1.60% | | | | | 1.70% | | | | | 1.68% | | | | | 1.69% | | | |
| | | | | | | | | | |
Total expenses after fees waived, reimbursed and paid indirectly | | | | 1.03% | 8 | | | | 1.03% | | | | | 1.03% | | | | | 1.01% | | | | | 1.00% | | | | | 1.01% | | | | | 1.51% | 8 | | | | 1.46% | | | | | 1.48% | | | | | 1.49% | | | | | 1.43% | | | | | 1.40% | | | |
| | | | | | | | | | |
Net investment income (loss) | | | | 0.49% | 8 | | | | 0.12% | | | | | 0.13% | | | | | 0.36% | | | | | 0.26% | | | | | 0.09% | | | | | 0.01% | 8 | | | | (0.30)% | | | | | (0.34)% | | | | | (0.06)% | | | | | (0.17)% | | | | | (0.28)% | | | |
| | | | | | | | | | |
| | | | | | | | | | | | | | | | | | | | | | | | | | | | | | | | | | | | | | | | | | | | | | | | | | | | | | | | | | | | | | | |
Supplemental Data | | | |
Net assets, end of period (000) | | | | $1,812,851 | | | | | $1,905,254 | | | | | $1,588,509 | | | | | $890,264 | | | | | $298,166 | | | | | $158,094 | | | | | $189,525 | | | | | $183,604 | | | | | $235,926 | | | | | $191,318 | | | | | $109,679 | | | | | $43,763 | | | |
| | | | | | | | | | |
Portfolio turnover | | | | 47% | | | | | 120% | | | | | 123% | | | | | 166% | | | | | 164% | | | | | 106% | | | | | 47% | | | | | 120% | | | | | 123% | | | | | 166% | | | | | 164% | | | | | 106% | | | |
| | | | | | | | | | |
| | 1 | Based on average shares outstanding. |
| | 2 | Less than $0.01 per share. |
| | 3 | Where applicable, total investment returns exclude the effects of any sales charges and include the reinvestment of dividends and distributions. |
| | 4 | Aggregate total investment return. |
| | 5 | Redemption fee of 2.00% is reflected in total return calculations. There was no impact to the return. |
| | 6 | Includes proceeds received from a settlement of litigation, which had no impact on the Fund’s total return. |
| | 7 | Redemption fee of 2.00% is reflected in total return calculations. The impact to the return from redemption fees received during the period was an increase of 0.03%. |
See Notes to Financial Statements.
| | | | |
| | | | |
50 | | BLACKROCK FUNDS | | MARCH 31, 2012 |
| | |
| Financial Highlights (continued) | | BlackRock U.S. Opportunities Portfolio |
| | |
| | | | | | | | | | | | | | | | | | | | | | | | | | | | | | | | | | | | | | | | | | | | | | | | | | | | | | | | | | | | | | |
| | | Investor A | | Investor B |
| | | Six Months
Ended | | Year Ended September 30, | | Six Months
Ended | | Year Ended September 30, |
| | | March 31, | | | | | | | | | | | | March 31, | | | | | | | | | | | | |
| | | 2012 | | | | | | | | | | | | 2012 | | | | | | | | | | | | |
| | | (Unaudited) | | 2011 | | 2010 | | 2009 | | 2008 | | 2007 | | (Unaudited) | | 2011 | | 2010 | | 2009 | | 2008 | | 2007 | | |
Per Share Operating Performance |
Net asset value, beginning of period | | | $ | 32.08 | | | | $ | 35.02 | | | | $ | 30.61 | | | | $ | 30.29 | | | | $ | 35.57 | | | | | $28.03 | | | | $ | 29.11 | | | | $ | 31.96 | | | | $ | 28.16 | | | | $ | 28.06 | | | | $ | 33.20 | | | | $ | 26.37 | | | |
| | | | | | | | | | |
Net investment loss1 | | | | (0.01 | ) | | | | (0.13 | ) | | | | (0.12 | ) | | | | (0.04 | ) | | | | (0.08 | ) | | | | (0.10) | | | | | (0.12 | ) | | | | (0.40 | ) | | | | (0.35 | ) | | | | (0.17 | ) | | | | (0.31 | ) | | | | (0.32 | ) | | |
Net realized and unrealized gain (loss) | | | | 6.95 | | | | | (2.31 | ) | | | | 4.53 | | | | | 0.35 | | | | | (5.20 | ) | | | | 7.64 | | | | | 6.27 | | | | | (2.06 | ) | | | | 4.15 | | | | | 0.26 | | | | | (4.83 | ) | | | | 7.15 | | | |
| | | | | | | | | | |
Net increase (decrease) from investment operations | | | | 6.94 | | | | | (2.44 | ) | | | | 4.41 | | | | | 0.31 | | | | | (5.28 | ) | | | | 7.54 | | | | | 6.15 | | | | | (2.46 | ) | | | | 3.80 | | | | | 0.09 | | | | | (5.14 | ) | | | | 6.83 | | | |
| | | | | | | | | | |
Distributions from net realized gains | | | | (3.76 | ) | | | | (0.50 | ) | | | | – | | | | | – | | | | | – | | | | | – | | | | | (3.55 | ) | | | | (0.39 | ) | | | | – | | | | | – | | | | | – | | | | | – | | | |
| | | | | | | | | | |
Redemption fees added to paid-in capital | | | | – | | | | | 0.00 | 2 | | | | 0.00 | 2 | | | | 0.01 | | | | | 0.00 | 2 | | | | 0.002 | | | | | – | | | | | 0.00 | 2 | | | | 0.00 | 2 | | | | 0.01 | | | | | 0.00 | 2 | | | | 0.00 | 2 | | |
| | | | | | | | | | |
Net asset value, end of period | | | $ | 35.26 | | | | $ | 32.08 | | | | $ | 35.02 | | | | $ | 30.61 | | | | $ | 30.29 | | | | | $35.57 | | | | $ | 31.71 | | | | $ | 29.11 | | | | $ | 31.96 | | | | $ | 28.16 | | | | $ | 28.06 | | | | $ | 33.20 | | | |
| | | | | | | | | | |
| | | | | | | | | | | | | | | | | | | | | | | | | | | | | | | | | | | | | | | | | | | | | | | | | | | | | | | | | | | | | | |
Total Investment Return3 |
Based on net asset value | | | | 23.17% | 4 | | | | (7.19)% | 5 | | | | 14.41% | 5,6 | | | | 1.06% | 7 | | | | (14.84)% | 5 | | | | 26.90%5 | | | | | 22.70% | 4 | | | | (7.90)% | 5 | | | | 13.49% | 5,6 | | | | 0.36% | 7 | | | | (15.48)% | 5 | | | | 25.90% | 5 | | |
| | | | | | | | | | |
| | | | | | | | | | | | | | | | | | | | | | | | | | | | | | | | | | | | | | | | | | | | | | | | | | | | | | | | | | | | | | |
Ratios to Average Net Assets |
Total expenses | | | | 1.66% | 8 | | | | 1.59% | | | | | 1.64% | | | | | 1.76% | | | | | 1.73% | | | | | 1.77% | | | | | 2.44% | 8 | | | | 2.39% | | | | | 2.44% | | | | | 2.59% | | | | | 2.56% | | | | | 2.56% | | | |
| | | | | | | | | | |
Total expenses excluding recoupment of past waived fees | | | | 1.66% | 8 | | | | 1.59% | | | | | 1.64% | | | | | 1.75% | | | | | 1.73% | | | | | 1.77% | | | | | 2.44% | 8 | | | | 2.37% | | | | | 2.44% | | | | | 2.59% | | | | | 2.56% | | | | | 2.56% | | | |
| | | | | | | | | | |
Total expenses after fees waived, reimbursed and paid indirectly | | | | 1.55% | 8 | | | | 1.49% | | | | | 1.51% | | | | | 1.56% | | | | | 1.48% | | | | | 1.48% | | | | | 2.31% | 8 | | | | 2.28% | | | | | 2.30% | | | | | 2.27% | | | | | 2.22% | | | | | 2.23% | | | |
| | | | | | | | | | |
Net investment loss | | | | (0.04)% | 8 | | | | (0.34)% | | | | | (0.37)% | | | | | (0.15)% | | | | | (0.22)% | | | | | (0.32)% | | | | | (0.79)% | 8 | | | | (1.12)% | | | | | (1.18)% | | | | | (0.77)% | | | | | (0.95)% | | | | | (1.06)% | | | |
| | | | | | | | | | |
| | | | | | | | | | | | | | | | | | | | | | | | | | | | | | | | | | | | | | | | | | | | | | | | | | | | | | | | | | | | | | |
Supplemental Data |
Net assets, end of period (000) | | | $ | 791,615 | | | | $ | 888,293 | | | | $ | 1,158,626 | | | | $ | 855,127 | | | | $ | 495,656 | | | | | $228,668 | | | | $ | 15,504 | | | | $ | 15,047 | | | | $ | 20,255 | | | | $ | 21,849 | | | | $ | 20,998 | | | | $ | 35,928 | | | |
| | | | | | | | | | |
Portfolio turnover | | | | 47% | | | | | 120% | | | | | 123% | | | | | 166% | | | | | 164% | | | | | 106% | | | | | 47% | | | | | 120% | | | | | 123% | | | | | 166% | | | | | 164% | | | | | 106% | | | |
| | | | | | | | | | |
| | 1 | Based on average shares outstanding. |
| | 2 | Less than $0.01 per share. |
| | 3 | Where applicable, total investment returns exclude the effects of any sales charges and include the reinvestment of dividends and distributions. |
| | 4 | Aggregate total investment return. |
| | 5 | Redemption fee of 2.00% is reflected in total return calculations. There was no impact to the return. |
| | 6 | Includes proceeds received from a settlement of litigation, which had no impact on the Fund’s total return. |
| | 7 | Redemption fee of 2.00% is reflected in total return calculations. The impact to the return from redemption fees received during the period was an increase of 0.04%. |
See Notes to Financial Statements.
| | | | | | |
| | | | | | |
| | BLACKROCK FUNDS | | MARCH 31, 2012 | | 51 |
| | |
| Financial Highlights (concluded) | | BlackRock U.S. Opportunities Portfolio |
| | | | | | | | | | | | | | | | | | | | | | | | |
| | | Investor C | |
| | | Six Months
Ended | | | Year Ended September 30, | |
| | | March 31,
2012 | | | | | | | | | | | | | | | | |
| | | (Unaudited) | | | 2011 | | | 2010 | | | 2009 | | | 2008 | | | 2007 | |
Per Share Operating Performance | |
Net asset value, beginning of period | | $ | 29.11 | | | $ | 31.95 | | | $ | 28.14 | | | $ | 28.04 | | | $ | 33.18 | | | $ | 26.34 | |
Net investment loss1 | | | (0.12 | ) | | | (0.38 | ) | | | (0.33 | ) | | | (0.19 | ) | | | (0.30 | ) | | | (0.32 | ) |
Net realized and unrealized gain (loss) | | | 6.28 | | | | (2.07 | ) | | | 4.14 | | | | 0.28 | | | | (4.84 | ) | | | 7.16 | |
Net increase (decrease) from investment operations | | | 6.16 | | | | (2.45 | ) | | | 3.81 | | | | 0.09 | | | | (5.14 | ) | | | 6.84 | |
Distributions from net realized gains | | | (3.54 | ) | | | (0.39 | ) | | | – | | | | – | | | | – | | | | – | |
Redemption fees added to paid-in capital | | | – | | | | 0.00 | 2 | | | 0.00 | 2 | | | 0.01 | | | | 0.00 | 2 | | | 0.00 | 2 |
Net asset value, end of period | | $ | 31.73 | | | $ | 29.11 | | | $ | 31.95 | | | $ | 28.14 | | | $ | 28.04 | | | $ | 33.18 | |
| | | | | | | | | | | | | | | | | | | | | | | | |
Total Investment Return3 | | | | | | | | | | | | | | | | | | | | | | | | |
Based on net asset value | | | 22.73% | 4 | | | (7.87)% | 5 | | | 13.54% | 5,6 | | | 0.36% | 7 | | | (15.49)% | 5 | | | 25.97% | 5 |
| | | | | | | | | | | | | | | | | | | | | | | | |
Ratios to Average Net Assets | | | | | | | | | | | | | | | | | | | | | | | | |
Total expenses | | | 2.37% | 8 | | | 2.34% | | | | 2.39% | | | | 2.52% | | | | 2.46% | | | | 2.51% | |
Total expenses excluding recoupment of past waived fees | | | 2.37% | 8 | | | 2.33% | | | �� | 2.38% | | | | 2.52% | | | | 2.46% | | | | 2.51% | |
Total expenses after fees waived, reimbursed and paid indirectly | | | 2.27% | 8 | | | 2.24% | | | | 2.27% | | | | 2.28% | | | | 2.21% | | | | 2.20% | |
Net investment loss | | | (0.75)% | 8 | | | (1.08)% | | | | (1.12)% | | | | (0.85)% | | | | (0.95)% | | | | (1.04)% | |
| | | | | | | | | | | | | | | | | | | | | | | | |
Supplemental Data | | | | | | | | | | | | | | | | | | | | | | | | |
Net assets, end of period (000) | | $ | 284,880 | | | $ | 282,586 | | | $ | 334,958 | | | $ | 238,819 | | | $ | 145,626 | | | $ | 88,826 | |
Portfolio turnover | | | 47% | | | | 120% | | | | 123% | | | | 166% | | | | 164% | | | | 106% | |
| | 1 | Based on average shares outstanding. |
| | 2 | Less than $0.01 per share. |
| | 3 | Where applicable, total investment returns exclude the effects of any sales charges and include the reinvestment of dividends and distributions. |
| | 4 | Aggregate total investment return. |
| | 5 | Redemption fee of 2.00% is reflected in total return calculations. There was no impact to the return. |
| | 6 | Includes proceeds received from a settlement of litigation, which had no impact on the Fund’s total return. |
| | 7 | Redemption fee of 2.00% is reflected in total return calculations. The impact to the return from redemption fees received during the period was an increase of 0.04%. |
See Notes to Financial Statements.
| | | | |
| | | | |
52 | | BLACKROCK FUNDS | | MARCH 31, 2012 |
Notes to Financial Statements (Unaudited)
1. Organization and Significant Accounting Policies:
BlackRock FundsSM (the “Trust”) is registered under the Investment Company Act of 1940, as amended (the “1940 Act”), as an open-end management investment company. The Trust is organized as a Massachusetts business trust. BlackRock Global Opportunities Portfolio (“Global Opportunities”), BlackRock Health Sciences Opportunities Portfolio (“Health Sciences Opportunities”), BlackRock International Opportunities Portfolio (“International Opportunities”), BlackRock Science & Technology Opportunities Portfolio (“Science & Technology Opportunities”) and BlackRock U.S. Opportunities Portfolio (“U.S. Opportunities”) (collectively, the “Funds” or individually, a “Fund”) are each a series of the Trust. Each of the Funds, except Health Sciences Opportunities, is diversified. The Funds’ financial statements are prepared in conformity with accounting principles generally accepted in the United States of America (“US GAAP”), which may require management to make estimates and assumptions that affect the reported amounts and disclosures in the financial statements. Actual results could differ from those estimates. Each Fund offers multiple classes of shares. Institutional Shares are sold without a sales charge and only to certain eligible investors. Service Shares are sold without a sales charge. Investor A Shares are generally sold with a front-end sales charge. Investor B and Investor C Shares may be subject to a CDSC. Class R Shares are sold without a sales charge and only to certain retirement and other similar plans. All classes of shares have identical voting, dividend, liquidation and other rights and the same terms and conditions, except that Service, Investor A, Investor B, Investor C and Class R Shares bear certain expenses related to the shareholder servicing of such shares, and Investor B, Investor C and Class R Shares also bear certain expenses related to the distribution of such shares. Investor B Shares automatically convert to Investor A Shares after approximately eight years. Investor B Shares are only available through exchanges, dividend reinvestment by existing shareholders or for purchase by certain qualified employee benefit plans. Each class has exclusive voting rights with respect to matters relating to its shareholder servicing and distribution expenditures (except that Investor B shareholders may vote on material changes to the Investor A distribution and service plan).
Reorganizations: The Board of Trustees of the Trust (the “Board”) and of Global Opportunities and the Board of Directors and shareholders of BlackRock Global Growth Fund, Inc. (“Global Growth”) approved the reorganization of Global Growth into Global Opportunities pursuant to which Global Opportunities acquired substantially all of the assets and assumed certain stated liabilities of Global Growth in exchange for an equal aggregate value of Global Opportunities shares.
Each shareholder of Global Growth received shares of Global Opportunities with the same class designation and an aggregate NAV of such shareholder’s Global Growth shares, as determined at the close of business on September 9, 2011. In connection with the reorganization, Global Opportunities issued newly created Class R Shares.
The reorganization was accomplished by a tax-free exchange of shares of Global Opportunities in the following amounts and at the following conversion ratios:
| | | | | | | | | | | | | | |
| | | | | Global Growth Shares Prior to Reorganization | | | Conversion Ratio | | | Shares of Global Opportunities | |
Institutional | | | 3,509,188 | | | | 1.33658929 | | | | 4,690,343 | |
Investor A | | | 14,755,527 | | | | 1.32869118 | | | | 19,605,539 | |
Investor B | | | 367,181 | | | | 1.29848147 | | | | 476,778 | |
Investor C | | | 3,757,078 | | | | 1.29501571 | | | | 4,865,475 | |
Class R | | | 1,252,737 | | | | 1.28821323 | | | | 1,613,792 | |
| | | | | | | | | | |
Global Growth’s net assets and composition of net assets on September 9, 2011, the date of the reorganization, were as follows: |
| Net Assets | | Paid-in Capital | | Accumulated Net
Investment
Income | | Accumulated
Net Realized
Loss | | | Net
Unrealized
Depreciation |
$304,152,785 | | $462,591,696 | | $180,888 | | $ | (135,908,279 | ) | | $(22,711,520) |
For financial reporting purposes, assets received and shares issued by Global Opportunities were recorded at fair value; however, the cost basis of the investments received from Global Growth was carried forward to align ongoing reporting of Global Opportunities’ realized and unrealized gains and losses with amounts distributable to shareholders for tax purposes.
The aggregate net assets of Global Opportunities immediately after the acquisition amounted to $373,249,936. Global Growth’s fair value and cost of investments prior to the reorganization were $320,739,432 and $298,207,845, respectively.
The purpose of the transaction was to combine two funds managed by the Manager, the investment advisor to both Global Growth and Global Opportunities with the same or substantially similar (but not identical) investment objectives, investment policies, strategies, risks and restrictions. The reorganization was a tax-free event and was effective on September 12, 2011.
Assuming the acquisition had been completed on October 1, 2010, the beginning of the annual reporting period of Global Opportunities, the pro forma results of operations for the year ended September 30, 2011, were as follows:
| • | | Net investment income: $2,320,634 |
| • | | Net realized and change in unrealized gain/loss on investments: $(41,230,418) |
| • | | Net decrease in the net assets resulting from operations: $(38,909,784) |
Because the combined investment portfolios have been managed as a single integrated portfolio since the acquisition was completed, it is not practicable to separate the amounts of revenue and earnings of Global Growth that have been included in the Global Opportunities’ Statement of Operations since September 12, 2011.
Reorganization costs incurred by Global Opportunities in connection with the reorganization were expensed by Global Opportunities.
The Board of Health Sciences Opportunities and the Board of Directors and shareholders of BlackRock Healthcare Fund, Inc. (“Healthcare”)
| | | | | | |
| | | | | | |
| | BLACKROCK FUNDS | | MARCH 31, 2012 | | 53 |
| | |
| Notes to Financial Statements (continued) | | |
approved the reorganization of Healthcare into Health Sciences Opportunities pursuant to which Health Sciences Opportunities acquired substantially all of the assets and assumed certain stated liabilities of Healthcare in exchange for an equal aggregate value of Health Sciences Opportunities shares.
Each shareholder of Healthcare received shares of Health Sciences Opportunities with the same class designation and an aggregate NAV of such shareholder’s Healthcare shares, as determined at the close of business on September 9, 2011. In connection with the reorganization, Health Sciences Opportunities issued newly created Class R Shares.
The reorganization was accomplished by a tax-free exchange of shares of Health Sciences Opportunities in the following amounts and at the following conversion ratios:
| | | | | | | | | | | | |
| | | Healthcare Shares Prior to Reorganization | | | Conversion Ratio | | | Shares of Health Sciences Opportunities | |
Institutional | | | 13,244,297 | | | | 0.19034241 | | | | 2,520,951 | |
Investor A | | | 27,277,774 | | | | 0.16917605 | | | | 4,614,746 | |
Investor B | | | 2,622,885 | | | | 0.10066507 | | | | 264,033 | |
Investor C | | | 17,312,942 | | | | 0.10007561 | | | | 1,732,603 | |
Class R | | | 3,541,881 | | | | 0.09820156 | | | | 347,818 | |
| | | | | | | | |
Healthcare’s net assets and composition of net assets on September 9, 2011, the date of the reorganization, were as follows: |
| Net Assets | | Paid-in Capital | | Accumulated Net Investment
Loss | | Accumulated Net Realized
Loss | | Net
Unrealized
Appreciation |
$265,090,492 | | $262,990,491 | | $(202,292) | | $(913,655) | | $3,215,948 |
For financial reporting purposes, assets received and shares issued by Health Sciences Opportunities were recorded at fair value; however, the cost basis of the investments received from Healthcare was carried forward to align ongoing reporting of Health Sciences Opportunities’ realized and unrealized gains and losses with amounts distributable to shareholders for tax purposes.
The aggregate net assets of Health Sciences Opportunities immediately after the acquisition amounted to $1,597,073,853. Healthcare’s fair value and cost of investments prior to the reorganization were $263,048,253 and $265,906,507, respectively.
The purpose of the transaction was to combine two funds managed by the Manager, the investment advisor to Healthcare and Health Sciences Opportunities with the same or substantially similar (but not identical) investment objectives, investment policies, strategies, risks and restrictions. The reorganization was a tax-free event and was effective on September 12, 2011.
Assuming the acquisition had been completed on October 1, 2010; the beginning of the annual reporting period of Health Sciences Opportunities, the pro forma results of operations for the year ended September 30, 2011, were as follows:
| • | | Net investment loss: $(7,044,861) |
| • | | Net realized and change in unrealized gain/loss on investments: $(518,793) |
| • | | Net decrease in the net assets resulting from operations: $(7,563,654) |
Because the combined investment portfolios have been managed as a single integrated portfolio since the acquisition was completed, it is not practicable to separate the amounts of revenue and earnings of Healthcare that have been included in the Health Sciences Opportunities’ Statement of Operations since September 12, 2011.
Reorganization costs incurred by Health Sciences Opportunities in connection with the reorganization were paid by the Manager.
The following is a summary of significant accounting policies followed by the Funds:
Valuation: US GAAP defines fair value as the price the Funds would receive to sell an asset or pay to transfer a liability in an orderly transaction between market participants at the measurement date. The Funds fair value their financial instruments at market value using independent dealers or pricing services under policies approved by the Board. Equity investments traded on a recognized securities exchange or the NASDAQ Global Market System (“NASDAQ”) are valued at the last reported sale price that day or the NASDAQ official closing price, if applicable. For equity investments traded on more than one exchange, the last reported sale price on the exchange where the stock is primarily traded is used. Equity investments traded on a recognized exchange for which there were no sales on that day are valued at the last available bid price. If no bid price is available, the prior day’s price will be used, unless it is determined that such prior day’s price no longer reflects the fair value of the security. Financial futures contracts traded on exchanges are valued at their last sale price. Investments in open-end registered investment companies are valued at NAV each business day. Short-term securities with remaining maturities of 60 days or less may be valued at amortized cost, which approximates fair value.
The Funds value their investments in BlackRock Liquidity Series, LLC Money Market Series (the “Money Market Series”) at fair value, which is ordinarily based upon their pro rata ownership in the underlying fund’s net assets. The Money Market Series seeks current income consistent with maintaining liquidity and preserving capital. Although the Money Market Series is not registered under the 1940 Act, its investments will follow the parameters of investments by a money market fund that is subject to Rule 2a-7 under the 1940 Act. Each Fund may withdraw up to 25% of its investment daily, although the manager of the Money Market Series, in its sole discretion, may permit an investor to withdraw more than 25% on any one day.
Securities and other assets and liabilities denominated in foreign currencies are translated into US dollars using exchange rates determined as of the close of business on the New York Stock Exchange (“NYSE”). Foreign currency exchange contracts are valued at the mean between the bid and ask prices and are determined as of the close of business on the NYSE. Interpolated values are derived when the settlement date of the contract is an interim date for which quotations are not available.
| | | | |
| | | | |
54 | | BLACKROCK FUNDS | | MARCH 31, 2012 |
Notes to Financial Statements (continued)
Exchange-traded options are valued at the mean between the last bid and ask prices at the close of the options market in which the options trade. An exchange-traded option for which there is no mean price is valued at the last bid (long positions) or ask (short positions) price. If no bid or ask price is available, the prior day’s price will be used, unless it is determined that the prior day’s price no longer reflects the fair value of the option. Over-the-counter (“OTC”) options are valued by an independent pricing service using a mathematical model which incorporates a number of market data factors, such as the trades and prices of the underlying instruments.
In the event that application of these methods of valuation results in a price for an investment which is deemed not to be representative of the market value of such investment or if a price is not available, the investment will be valued in accordance with a policy approved by the Board as reflecting fair value (“Fair Value Assets”). When determining the price for Fair Value Assets, the investment advisor and/or the sub-advisor seek to determine the price that each Fund might reasonably expect to receive from the current sale of that asset in an arm’s-length transaction. Fair value determinations shall be based upon all available factors that the investment advisor and/or sub-advisor deem relevant. The pricing of all Fair Value Assets is subsequently reported to the Board or a committee thereof.
Generally, trading in foreign instruments is substantially completed each day at various times prior to the close of business on the NYSE. Occasionally, events affecting the values of such instruments may occur between the foreign market close and the close of business on the NYSE that may not be reflected in the computation of each Fund’s net assets. If events (for example, a company announcement, market volatility or a natural disaster) occur during such periods that are expected to materially affect the value of such instruments, those instruments may be Fair Value Assets and be valued at their fair value, as determined in good faith by the investment advisor using a pricing service and/or policies approved by the Board. Each business day, the Funds use a pricing service to assist with the valuation of certain foreign exchange-traded equity securities and foreign exchange-traded and OTC options (the “Systematic Fair Value Price”). Using current market factors, the Systematic Fair Value Price is designed to value such foreign securities and foreign options at fair value as of the close of business on the NYSE, which follows the close of the local markets.
Foreign Currency Transactions: The Funds’ books and records are maintained in US dollars. Purchases and sales of investment securities are recorded at the rates of exchange prevailing on the respective date of such transactions. Generally, when the US dollar rises in value against a foreign currency, the Funds’ investments denominated in that currency will lose value because its currency is worth fewer US dollars; the opposite effect occurs if the US dollar falls in relative value.
The Funds do not isolate the portion of the results of operations arising as a result of changes in the foreign exchange rates from the changes in the market prices of investments held or sold for financial reporting purposes. Accordingly, the effects of changes in foreign currency exchange rates on investments are not segregated on the Statements of Operations from the effects of changes in market prices of those investments
but are included as a component of net realized and unrealized gain (loss) from investments. The Funds report realized currency gains (losses) on foreign currency related transactions as components of net realized gain (loss) for financial reporting purposes, whereas such components are treated as ordinary income for federal income tax purposes.
Segregation and Collateralization: In cases in which the 1940 Act and the interpretive positions of the Securities and Exchange Commission (“SEC”) require that a Fund either deliver collateral or segregate assets in connection with certain investments (e.g., financial futures contracts, foreign currency exchange contracts and options written), the Fund will, consistent with SEC rules and/or certain interpretive letters issued by the SEC, segregate collateral or designate on its books and records cash or liquid securities having a market value at least equal to the amount that would otherwise be required to be physically segregated. Furthermore, based on requirements and agreements with certain exchanges and third party broker-dealers, each party to such transactions has requirements to deliver/deposit securities as collateral for certain investments.
Investment Transactions and Investment Income: For financial reporting purposes, investment transactions are recorded on the dates the transactions are entered into (the trade dates). Realized gains and losses on investment transactions are determined on the identified cost basis. Dividend income is recorded on the ex-dividend dates. Dividends from foreign securities where the ex-dividend date may have passed are subsequently recorded when the Funds are informed of the ex-dividend date. Under the applicable foreign tax laws, a withholding tax at various rates may be imposed on capital gains, dividends and interest. Upon notification from issuers, some of the dividend income received from a real estate investment trust may be redesignated as a reduction of cost of the related investment and/or realized gain. Income and realized and unrealized gains and losses are allocated daily to each class based on its relative net assets.
Dividends and Distributions: Dividends and distributions paid by the Funds are recorded on the ex-dividend dates. The amount and timing of dividends and distributions are determined in accordance with federal income tax regulations, which may differ from US GAAP.
Securities Lending: The Funds may lend securities to approved borrowers, such as banks, brokers and other financial institutions. The borrower pledges cash, securities issued or guaranteed by the US government or irrevocable letters of credit issued by a bank as collateral, which will be maintained at all times in an amount equal to at least 100% of the current market value of the loaned securities. The market value of the loaned securities is determined at the close of business of the Funds and any additional required collateral is delivered to the Funds on the next business day. Securities lending income, as disclosed in the Statements of Operations, represents the income earned from the investment of the cash collateral, net of rebates paid to, or fees paid by, borrowers and less the fees paid to the securities lending agent. During the term of the loan, the Funds earn dividend or interest income on the securities loaned but do not receive dividend or interest income on the securities received as collateral. Loans of securities are terminable at any time and the borrower, after notice, is required to return borrowed securities within the standard time period for settlement of securities transactions. In the
| | | | | | |
| | | | | | |
| | BLACKROCK FUNDS | | MARCH 31, 2012 | | 55 |
| | |
| Notes to Financial Statements (continued) | | |
event that the borrower defaults on its obligation to return borrowed securities because of insolvency or for any other reason, the Funds could experience delays and costs in gaining access to the collateral. The Funds also could suffer a loss if the value of an investment purchased with cash collateral falls below the market value of loaned securities or if the value of an investment purchased with cash collateral falls below the value of the original cash collateral received. During the six months ended March 31, 2012, any securities on loan were collateralized by cash.
Income Taxes: It is each Fund’s policy to comply with the requirements of the Internal Revenue Code of 1986, as amended, applicable to regulated investment companies and to distribute substantially all of its taxable income to its shareholders. Therefore, no federal income tax provision is required.
Each Fund files US federal and various state and local tax returns. No income tax returns are currently under examination. The statute of limitations on the Funds’ US federal tax returns remains open for each of the four years ended September 30, 2012. The statutes of limitations on each Fund’s state and local tax returns may remain open for an additional year depending upon the jurisdiction. Management does not believe there are any uncertain tax positions that require recognition of a tax liability.
Recent Accounting Standards: In May 2011, the Financial Accounting Standards Board (the “FASB”) issued amended guidance to improve disclosure about fair value measurements which will require the following disclosures for fair value measurements categorized as Level 3: quantitative information about the unobservable inputs and assumptions used in the fair value measurement, a description of the valuation policies and procedures and a narrative description of the sensitivity of the fair value measurement to changes in unobservable inputs and the interrelationships between those unobservable inputs. In addition, the amounts and reasons for all transfers in and out of Level 1 and Level 2 will be required to be disclosed as well as disclosure of the level in the fair value hierarchy of assets and liabilities not recorded at fair value but where fair value is disclosed. The amended guidance is effective for financial statements for fiscal years beginning after December 15, 2011, and interim periods within those fiscal years. Management is evaluating the impact of this guidance on the Funds’ financial statement disclosures.
In December 2011, the FASB issued guidance that will expand current disclosure requirements on the offsetting of certain assets and liabilities. The new disclosures will be required for investments and derivative financial instruments subject to master netting or similar agreements which are eligible for offset in the Statements of Assets and Liabilities and will require an entity to disclose both gross and net information about such investments and transactions in the financial statements. The guidance is effective for financial statements with fiscal years beginning on or after January 1, 2013, and interim periods within those fiscal years. Management is evaluating the impact of this guidance on the Funds’ financial statement disclosures.
Other: Expenses directly related to a Fund or its classes are charged to that Fund or class. Other operating expenses shared by several funds are
pro rated among those funds on the basis of relative net assets or other appropriate methods. Expenses directly related to the Funds and other shared expenses pro rated to the Funds are allocated daily to each class based on its relative net assets or other appropriate methods.
The Funds have an arrangement with the custodian whereby fees may be reduced by credits earned on uninvested cash balances, which, if applicable, are shown as fees paid indirectly in the Statements of Operations. The custodian imposes fees on overdrawn cash balances, which can be offset by accumulated credits earned or may result in additional custody charges.
2. Derivative Financial Instruments:
The Funds engage in various portfolio investment strategies using derivative contracts both to increase the returns of the Funds and to economically hedge, or protect, their exposure to equity risk or foreign currency exchange rate risk. These contracts may be transacted on an exchange or OTC.
Losses may arise if the value of the contract decreases due to an unfavorable change in the market rates or values of the underlying instrument or if the counterparty does not perform under the contract. The Funds’ maximum risk of loss from counterparty credit risk on OTC derivatives is generally the aggregate unrealized gain netted against any collateral pledged by/posted to the counterparty. For OTC options purchased, the Funds bear the risk of loss in the amount of the premiums paid plus the positive change in market values net of any collateral received on the options should the counterparty fail to perform under the contracts. Options written by the Funds do not give rise to counterparty credit risk, as options written obligate the Funds to perform and not the counterparty. Counterparty risk related to exchange-traded options is deemed to be minimal due to the protection against defaults provided by the exchange on which these contracts trade.
The Funds may mitigate counterparty risk by procuring collateral and through netting provisions included within an International Swaps and Derivatives Association, Inc. master agreement (“ISDA Master Agreement”) implemented between a Fund and each of its respective counterparties. The ISDA Master Agreement allows each Fund to offset with each separate counterparty certain derivative financial instrument’s payables and/or receivables with collateral held. The amount of collateral moved to/from applicable counterparties is generally based upon minimum transfer amounts of up to $500,000. To the extent amounts due to the Funds from their counterparties are not fully collateralized contractually or otherwise, the Funds bear the risk of loss from counterparty non-performance. See Note 1 “Segregation and Collateralization” for information with respect to collateral practices. In addition, the Funds manage counterparty risk by entering into agreements only with counterparties that they believe have the financial resources to honor their obligations and by monitoring the financial stability of those counterparties.
Certain ISDA Master Agreements allow counterparties to OTC derivatives to terminate derivative contracts prior to maturity in the event the Funds’ net assets decline by a stated percentage or the Funds fail to meet the terms of its ISDA Master Agreements, which would cause the Funds to accelerate payment of any net liability owed to the counterparty.
| | | | |
| | | | |
56 | | BLACKROCK FUNDS | | MARCH 31, 2012 |
Notes to Financial Statements (continued)
Financial Futures Contracts: The Funds, except for Global Opportunities and Health Sciences Opportunities purchase or sell financial futures contracts and options on financial futures contracts to gain exposure to, or economically hedge against, changes in the value of equity securities (including equity risk). Financial futures contracts are agreements between the Fund and counterparty to buy or sell a specific quantity of an underlying instrument at a specified price and at a specified date. Depending on the terms of the particular contract, financial futures contracts are settled either through physical delivery of the underlying instrument on the settlement date or by payment of a cash settlement amount on the settlement date. Pursuant to the contract, the Funds agree to receive from or pay to the broker an amount of cash equal to the daily fluctuation in value of the contract. Such receipts or payments are known as variation margin and are recorded by the Funds as unrealized appreciation or depreciation. When the contract is closed, the Funds record a realized gain or loss equal to the difference between the value of the contract at the time it was opened and the value at the time it was closed. The use of financial futures contracts involves the risk of an imperfect correlation in the movements in the price of financial futures contracts and the underlying assets.
Foreign Currency Exchange Contracts: The Funds, except for U.S. Opportunities, enter into foreign currency exchange contracts as an economic hedge against either specific transactions or portfolio instruments or to obtain exposure to foreign currencies (foreign currency exchange rate risk). A foreign currency exchange contract is an agreement between two parties to buy and sell a currency at a set exchange rate on a future date. Foreign currency exchange contracts, when used by the Funds, help to manage the overall exposure to the currencies in which some of the investments held by the Funds are denominated. The contract is marked-to-market daily and the change in market value is recorded by the Funds as an unrealized gain or loss. When the contract is closed, the Funds record a realized gain or loss equal to the difference between the value at the time it was opened and the value at the time it was closed.
The use of foreign currency exchange contracts involves the risk that the value of a foreign currency exchange contract changes unfavorably due to movements in the value of the referenced foreign currencies and the risk that a counterparty to the contract does not perform its obligations under the agreement.
Options: The Funds, except for International Opportunities, Science & Technology Opportunities and U.S. Opportunities, purchase and write call and put options to increase or decrease their exposure to underlying instruments (including equity risk) and/or, in the case of options written, to generate gains from options premiums. A call option gives the purchaser (holder) of the option the right (but not the obligation) to buy, and obligates the seller (writer) to sell (when the option is exercised), the underlying instrument at the exercise or strike price at any time or at a specified time during the option period. A put option gives the holder the right to sell and obligates the writer to buy the underlying instrument at the exercise or strike price at any time or at a specified time during the option period. When a Fund purchases (writes) an option, an amount equal to the premium paid (received) by a Fund is reflected as an asset (liability). The amount of the asset (liability) is subsequently marked-to-market to reflect the current market value of the option purchased (written). When an instrument is purchased or sold through an exercise of an option, the related premium paid (or received) is added to (or deducted from) the basis of the instrument acquired or deducted from (or added to) the proceeds of the instrument sold. When an option expires (or a Fund enters into a closing transaction), a Fund realizes a gain or loss on the option to the extent of the premiums received or paid (or gain or loss to the extent the cost of the closing transaction exceeds the premiums received or paid). When a Fund writes a call option, such option is “covered,” meaning that a Fund holds the underlying instrument subject to being called by the option counterparty. When a Fund writes a put option, such option is covered by cash in an amount sufficient to cover the obligation.
In purchasing and writing options, a Fund bears the risk of an unfavorable change in the value of the underlying instrument or the risk that a Fund may not be able to enter into a closing transaction due to an illiquid market. Exercise of a written option could result in a Fund purchasing or selling a security at a price different from the current market value.
Derivative Financial Instruments Categorized by Risk Exposure:
| | | | | | | | | | | | | | | | |
|
| | | Fair Values of Derivative Financial Instruments as of March 31, 2012 | | | |
|
| | | | | Asset Derivatives | | | | | | |
|
| | | Statements of Assets
and Liabilities Location | | Global
Opportunities | | | Health Sciences
Opportunities | | | International
Opportunities | | | Science & Technology
Opportunities |
|
Foreign currency exchange contracts | | Unrealized appreciation on foreign currency exchange contracts | | | $1,920,237 | | | | $936,236 | | | | $11,793,885 | | | $100,193 |
|
| | | | | Liability Derivatives | | | | | | |
|
| | | Statements of Assets
and Liabilities Location | | Global
Opportunities | | | Health Sciences
Opportunities | | | International
Opportunities | | | Science & Technology
Opportunities |
|
Foreign currency exchange contracts | | Unrealized depreciation on foreign currency exchange contracts | | | $2,721,491 | | | | $7,750,965 | | | | $17,932,686 | | | $312,310 |
Equity contracts | | Options written at value | | | – | | | | 197,760 | | | | – | | | – |
| | | | | |
Total | | | | | $2,721,491 | | | | $7,948,725 | | | | $17,932,686 | | | $312,310 |
|
| | | | | | |
| | | | | | |
| | BLACKROCK FUNDS | | MARCH 31, 2012 | | 57 |
| | |
| Notes to Financial Statements (continued) | | |
| | |
| | | | | | | | | | |
|
| | | The Effect of Derivative Financial Instruments in the Statements of Operations Six Months Ended March 31, 2012 | | |
|
| | | Net Realized Gain (Loss) From |
|
| | | Global
Opportunities | | Health Sciences
Opportunities | | International
Opportunities | | Science & Technology
Opportunities | | U.S.
Opportunities |
|
Foreign currency exchange contracts | | $(1,357,741) | | $ 12,742,659 | | $ 6,821,891 | | $1,213,869 | | – |
Equity contracts: | | | | | | | | | | |
Financial futures contracts | | – | | – | | 4,387,622 | | (307,584) | | $ 3,640,472 |
Options | | 311,864 | | 1,206,001 | | – | | – | | – |
| | |
Total | | $(1,045,877) | | $ 13,948,660 | | $11,209,513 | | $ 906,285 | | $ 3,640,472 |
|
|
|
| | | | | Net Change in Unrealized Appreciation/Depreciation on | | |
|
| | | Global
Opportunities | | Health Sciences
Opportunities | | International
Opportunities | | Science & Technology
Opportunities | | U.S.
Opportunities |
|
Foreign currency exchange contracts | | $ 578,879 | | $(12,116,807) | | $ (7,957,534) | | $(1,034,160) | | – |
Equity contracts: | | | | | | | | | | |
Financial futures contracts | | – | | – | | 1,617,815 | | – | | $10,765,517 |
Options | | – | | 466,536 | | – | | – | | – |
| | |
Total | | $ 578,879 | | $(11,650,271) | | $ (6,339,719) | | $(1,034,160) | | $10,765,517 |
|
For the six months ended March 31, 2012, the average quarterly balances of outstanding derivative financial instruments were as follows:
| | | | | | | | | | | | | | | | | | | | |
| |
| | | Global
Opportunities | | | Health Sciences
Opportunities | | | International
Opportunities | | | Science & Technology
Opportunities | | | U.S.
Opportunities | |
| |
Financial futures contracts: | | | | | | | | | | | | | | | | | | | | |
Average number of contracts purchased | | | – | | | | – | | | | 453 | | | | 126 | 1 | | | 609 | 1 |
Average notional value of contracts purchased | | | – | | | | – | | | | $ 28,371,390 | | | | $ 7,956,982 | 1 | | | $43,682,183 | 1 |
Foreign currency exchange contracts: | | | | | | | | | | | | | | | | | | | | |
Average number of contracts - US dollars purchased | | | 33 | | | | 20 | | | | 52 | | | | 9 | | | | – | |
Average number of contracts - US dollars sold | | | 32 | | | | 6 | | | | 37 | | | | 9 | | | | – | |
Average US dollar amounts purchased | | | $53,277,762 | | | | $188,467,035 | | | | $428,623,568 | | | | $13,138,859 | | | | – | |
Average US dollar amounts sold | | | $77,857,987 | | | | $ 43,730,341 | | | | $513,303,180 | | | | $ 7,091,243 | | | | – | |
Options: | | | | | | | | | | | | | | | | | | | | |
Average number of option contracts written | | | 1 | | | | 5 | | | | – | | | | – | | | | – | |
Average notional value of option contracts written | | | $ 1,063,750 | | | | $ 30,494,750 | | | | – | | | | – | | | | – | |
| |
1 Average contract amount shown due to limited activity.
3. Investment Advisory Agreements and Other Transactions with Affiliates:
The PNC Financial Services Group, Inc. (“PNC”) and Barclays Bank PLC (“Barclays”) are the largest stockholders of BlackRock, Inc. (“BlackRock”). Due to the ownership structure, PNC is an affiliate for 1940 Act purposes, but Barclays is not.
The Trust, on behalf of the Funds, entered into an Investment Advisory Agreement with the Manager, the Funds’ investment advisor, an indirect, wholly owned subsidiary of BlackRock, to provide investment advisory and administration services. The Manager is responsible for the management of each Fund’s portfolio and provides the necessary personnel, facilities, equipment and certain other services necessary to the operations of each Fund. For such services, each Fund pays the Manager a monthly fee based on a percentage of each Fund’s average daily net assets at the following annual rates:
| | | | | | | | |
|
| | | First $1 Billion | | $1 Billion - $2 Billion | | $2 Billion - $3 Billion | | Greater Than $3 Billion |
|
Global Opportunities and Science & Technology Opportunities | | 0.900% | | 0.850% | | 0.800% | | 0.750% |
Health Sciences Opportunities | | 0.750% | | 0.700% | | 0.675% | | 0.650% |
International Opportunities | | 1.000% | | 0.950% | | 0.900% | | 0.850% |
U.S. Opportunities | | 1.100% | | 1.050% | | 1.025% | | 1.000% |
|
The Manager contractually agreed to waive and/or reimburse fees or expenses, excluding interest expense, dividend expense, acquired fund fees and expenses and certain other fund expenses, in order to limit expenses.
| | | | |
| | | | |
58 | | BLACKROCK FUNDS | | MARCH 31, 2012 |
Notes to Financial Statements (continued)
The expense limitations as a percentage of average daily net assets are as follows:
| | | | | | | | | | |
| | | Global Opportunities | | Health Sciences Opportunities2 | | International Opportunities2 | | Science & Technology Opportunities2 | | U.S. Opportunities2 |
Institutional | | 1.06%1 | | N/A | | 1.49% | | 1.39% | | 1.03% |
Service | | 1.70%2,3 | | N/A | | 1.80% | | 1.78% | | 1.65% |
Investor A | | 1.33%1 | | N/A | | 1.98% | | 1.80% | | 1.65% |
Investor B | | 2.18%1 | | N/A | | 2.75% | | 2.73% | | 2.32% |
Investor C | | 2.14%1 | | N/A | | 2.75% | | 2.73% | | 2.32% |
Class R | | 1.72%1 | | 1.81% | | 2.18%3 | | 2.57% | | 2.39%3 |
| 1 | The Manager has agreed not to reduce or discontinue this contractual waiver or reimbursement prior to February 1, 2015 unless approved by the Board, including a majority of the Independent Trustees. |
| 2 | The Manager has agreed not to reduce or discontinue this contractual waiver or reimbursement prior to February 1, 2013 unless approved by the Board, including a majority of the Independent Trustees. |
| 3 | There were no shares outstanding as of March 31, 2012. |
Prior to January 31, 2012, the expense limitations as a percentage of average daily net assets of Health Sciences Opportunities were as follows.
| | |
| | | Health Sciences
Opportunities |
Institutional | | 1.25% |
Service | | 1.55% |
Investor A | | 1.55% |
Investor B | | 2.25% |
Investor C | | 2.25% |
These amounts are included in fees waived by advisor and shown as administration fees waived – class specific, transfer agent fees waived – class specific and transfer agent fees reimbursed – class specific, respectively, in the Statements of Operations. For the six months ended March 31, 2012, the amounts included in fees waived by advisor were as follows:
| | | | |
Global Opportunities | | $ | 1,363 | |
Science & Technology Opportunities | | $ | 150 | |
U.S. Opportunities | | $ | 1,729,503 | |
Class specific expense waivers and reimbursements are as follows:
| | | | | | | | | | | | | | | | | | | | | | | | | | | | |
| Administration Fees Waived | | | | | | | | Share Classes | | | | | | | | | | |
| | | Institutional | | | Service | | | Investor A | | | Investor B | | | Investor C | | | Class R | | | Total | |
Global Opportunities | | $ | 7,712 | | | | – | | | $ | 27,418 | | | $ | 137 | | | $ | 7,684 | | | $ | 1,251 | | | $ | 44,202 | |
Health Sciences Opportunities | | | – | | | | – | | | | – | | | | – | | | | – | | | $ | 651 | | | $ | 651 | |
International Opportunities | | | – | | | $ | 1,720 | | | | – | | | | – | | | | – | | | | – | | | $ | 1,720 | |
Science & Technology Opportunities | | $ | 4,429 | | | $ | 2 | | | $ | 219 | | | | – | | | $ | 57 | | | $ | 7 | | | $ | 4,714 | |
U.S. Opportunities | | $ | 123,659 | | | | – | | | $ | 969 | | | $ | 1,199 | | | | – | | | | – | | | $ | 125,827 | |
| | | | | | | | | | | | | | | | | | | | | | | | | | | | |
| Transfer Agent Fees Waived | | | | | | | | Share Classes | | | | | | | | | | |
| | | Institutional | | | Service | | | Investor A | | | Investor B | | | Investor C | | | Class R | | | Total | |
Global Opportunities | | $ | 1,095 | | | | – | | | $ | 4,376 | | | $ | 9 | | | $ | 1,540 | | | $ | 96 | | | $ | 7,116 | |
Health Sciences Opportunities | | | – | | | | – | | | | – | | | | – | | | | – | | | $ | 85 | | | $ | 85 | |
International Opportunities | | | – | | | $ | 2,306 | | | | – | | | | – | | | | – | | | | – | | | $ | 2,306 | |
Science & Technology Opportunities | | $ | 1,757 | | | $ | 1 | | | $ | 73 | | | | – | | | $ | 28 | | | $ | 2 | | | $ | 1,861 | |
U.S. Opportunities | | $ | 86,264 | | | | – | | | | – | | | $ | 434 | | | | – | | | | – | | | $ | 86,698 | |
| | | | | | | | | | | | | | | | | | | | | | | | | | | | |
| Transfer Agent Fees Reimbursed | | | | | | | | Share Classes | | | | | | | | | | |
| | | Institutional | | | Service | | | Investor A | | | Investor B | | | Investor C | | | Class R | | | Total | |
Global Opportunities | | $ | 46,490 | | | | – | | | $ | 146,762 | | | $ | 135 | | | $ | 42,310 | | | $ | 18,974 | | | $ | 254,671 | |
Health Sciences Opportunities | | | – | | | | – | | | | – | | | | – | | | | – | | | $ | 531 | | | $ | 531 | |
International Opportunities | | | – | | | $ | 245 | | | | – | | | | – | | | | – | | | | – | | | $ | 245 | |
Science & Technology Opportunities | | $ | 6,919 | | | $ | 14 | | | $ | 1,855 | | | | – | | | $ | 315 | | | $ | 9 | | | $ | 9,112 | |
U.S. Opportunities | | $ | 2,111,467 | | | | – | | | | – | | | $ | 251 | | | | – | | | | – | | | $ | 2,111,718 | |
The Manager voluntarily agreed to waive its investment advisory fees by the amount of investment advisory fees each Fund pays to the Manager indirectly through its investment in affiliated money market funds. However the Manager does not waive its investment advisory fees by the amount of investment advisory fees paid in connection with each Fund’s investment in other affiliated investment companies, if any. These amounts are included in fees waived by advisor in the Statements of
Operations. For the six months ended March 31, 2012, the amounts waived were as follows:
| | | | |
Global Opportunities | | $ | 3,204 | |
Health Sciences Opportunities | | $ | 27,966 | |
International Opportunities | | $ | 30,756 | |
Science & Technology Opportunities | | $ | 2,231 | |
U.S. Opportunities | | $ | 49,082 | |
| | | | | | |
| | | | | | |
| | BLACKROCK FUNDS | | MARCH 31, 2012 | | 59 |
| | |
| Notes to Financial Statements (continued) | | |
The Manager entered into separate sub-advisory agreements with BlackRock Financial Management, Inc. (“BFM”), an affiliate of the Manager, to serve as sub-advisor for a portion of the assets of Global Opportunities and with BlackRock International Limited (“BIL”), an affiliate of the Manager, to serve as sub-advisor for International Opportunities. The Manager pays BFM and BIL, for services they provide, a monthly fee that is a percentage of the investment advisory fees paid by the applicable Fund to the Manager.
If during a Fund’s fiscal year the operating expenses of a share class, that at any time during the prior two fiscal years received a waiver or reimbursement from the Manager, are less than the expense limit for that share class, the Manager is entitled to be reimbursed by such share class up to the lesser of (a) the amount of fees waived or expenses
reimbursed during those prior two fiscal years under the agreement and (b) the amount by which the expense limit for that share class exceeds the operating expenses of the share class for the current fiscal year, provided that: (1) the Fund of which the share class is a part has more than $50 million in assets for the fiscal year and (2) the Manager or an affiliate continues to serve as the Fund’s investment advisor or administrator. In the event the expense limit for a share class is changed subsequent to a fiscal year in which the Manager becomes entitled to reimbursement for fees waived or reimbursed, the amount available to reimburse the Manager shall be calculated by reference to the expense limit for that share class in effect at the time the Manager became entitled to receive such reimbursement, rather than the subsequently changed expense limit for that share class.
For the six months ended March 31, 2012, the Manager recouped the following waivers previously recorded by the Funds:
| | | | | | | | | | | | | | | | | | | | | | | | | | | | | | |
| Recoupment of Past Waived Fees | | Share Classes | | |
| | | Service | | Investor A | | Investor B | | Investor C | | Class
R | | Total |
Global Opportunities | | | | – | | | | | – | | | | | $74 | | | | | – | | | | $ | 1,987 | | | | $ | 2,061 | |
International Opportunities | | | $ | 1,304 | | | | | – | | | | | – | | | | | – | | | | | – | | | | $ | 1,304 | |
Science & Technology Opportunities | | | $ | 150 | | | | $ | 16,313 | | | | | – | | | | $ | 2,760 | | | | $ | 79 | | | | $ | 19,302 | |
U.S. Opportunities | | | | – | | | | $ | 549 | | | | | $ 1 | | | | | | | | | | – | | | | $ | 550 | |
On March 31, 2012, the amounts subject to possible future recoupment under the expense limitation agreement are as follows:
| | | | | | | | | | | | |
| | | Expiring September 30, | |
| | | 2012 | | | 2013 | | | 2014 | |
Global Opportunities | | $ | 27,177 | | | $ | 164,811 | | | $ | 307,350 | |
Health Sciences Opportunities | | | – | | | | – | | | $ | 1,267 | |
International Opportunities | | | – | | | | – | | | $ | 4,267 | |
Science & Technology Opportunities | | $ | 49,307 | | | $ | 27,435 | | | $ | 15,837 | |
U.S. Opportunities | | $ | 5,213,829 | | | $ | 9,403,382 | | | $ | 4,053,746 | |
The Trust, on behalf of the Funds, entered into a Distribution Agreement and Distribution and Service Plan with BlackRock Investments, LLC (“BRIL”), an affiliate of the Manager. Pursuant to the Distribution and Service Plan and in accordance with Rule 12b-1 under the 1940 Act, the Funds pay BRIL ongoing service and distribution fees. The fees are
accrued daily and paid monthly at annual rates based upon the average daily net assets of the shares of each Fund as follows:
| | | | | | | | | | |
| | | Service
Fee | | Distribution
Fee |
Service | | | | 0.25 | % | | | | – | |
Investor A | | | | 0.25 | % | | | | – | |
Investor B | | | | 0.25 | % | | | | 0.75 | % |
Investor C | | | | 0.25 | % | | | | 0.75 | % |
Class R | | | | 0.25 | % | | | | 0.25 | % |
Pursuant to sub-agreements with BRIL, broker-dealers and BRIL provide shareholder servicing and distribution services to each Fund. The ongoing service and/or distribution fee compensate BRIL and each broker-dealer for providing shareholder servicing and/or distribution related services to Service, Investor A, Investor B, Investor C and Class R shareholders.
For the six months ended March 31, 2012, the following table shows the class specific service and distribution fees borne directly by each class of each Fund:
| | | | | | | | | | | | | | | | | | | | | | | | |
| Service and Distribution Fees | | Share Classes | | | | |
| | | Service | | | Investor A | | | Investor B | | | Investor C | | | Class R | | | Total | |
Global Opportunities | | | – | | | $ | 274,185 | | | $ | 33,485 | | | $ | 307,371 | | | $ | 39,720 | | | $ | 654,761 | |
Health Sciences Opportunities | | $ | 18,753 | | | $ | 1,117,370 | | | $ | 230,904 | | | $ | 1,721,693 | | | $ | 26,972 | | | $ | 3,115,692 | |
International Opportunities | | $ | 62,887 | | | $ | 936,756 | | | $ | 75,071 | | | $ | 866,125 | | | | – | | | $ | 1,940,839 | |
Science & Technology Opportunities | | $ | 1,224 | | | $ | 141,132 | | | $ | 15,504 | | | $ | 146,847 | | | $ | 9,834 | | | $ | 314,541 | |
U.S. Opportunities | | $ | 239,613 | | | $ | 1,088,427 | | | $ | 78,715 | | | $ | 1,455,831 | | | | – | | | $ | 2,862,586 | |
| | | | |
| | | | |
60 | | BLACKROCK FUNDS | | MARCH 31, 2012 |
| | |
| Notes to Financial Statements (continued) | | |
For the six months ended March 31, 2012, affiliates earned underwriting discounts, direct commissions and dealer concessions on sales of each Fund’s Investor A Shares as follows:
| | | | |
Global Opportunities | | $ | 1,819 | |
Health Sciences Opportunities | | $ | 49,719 | |
International Opportunities | | $ | 16,386 | |
Science & Technology Opportunities | | $ | 2,772 | |
U.S. Opportunities | | $ | 3,210 | |
For the six months ended March 31, 2012, affiliates received the following CDSCs relating to transactions in Investor A, Investor B and Investor C Shares as follows:
| | | | | | | | | | | | |
| | | Investor A | | | Investor B | | | Investor C | |
Global Opportunities | | $ | 28,857 | | | $ | 6,661 | | | $ | 2,2245 | |
Health Sciences Opportunities | | $ | 609 | | | $ | 24,592 | | | $ | 18,220 | |
International Opportunities | | $ | 5,859 | | | $ | 8,916 | | | $ | 10,174 | |
Science & Technology Opportunities | | $ | 866 | | | $ | 2,264 | | | $ | 2,529 | |
U.S. Opportunities | | $ | 2,467 | | | $ | 17,924 | | | $ | 21,509 | |
Pursuant to written agreements, certain financial intermediaries, some of which may be affiliates, provide the Funds with sub-accounting, recordkeeping, sub-transfer agency and other administrative services with respect to sub-accounts they service. For these services, these entities receive an annual fee per shareholder account, which will vary depending on share class and/or net assets. For the six months ended March 31, 2012, the Funds paid the following to affiliates in return for these services, which are included in transfer agent – class specific in the Statements of Operations:
| | | | |
Global Opportunities | | $ | 17 | |
Health Sciences Opportunities | | $ | 74 | |
International Opportunities | | $ | 220,031 | |
Science & Technology Opportunities | | $ | 1,612 | |
U.S. Opportunities | | $ | 158,505 | |
For the six months ended March 31, 2012, the following table shows the class specific transfer agent fees borne directly by each class of each Fund:
| | | | | | | | | | | | | | | | | | | | | | | | | | | | |
| Transfer Agent Fees | | Share Classes | | | | |
| | | Institutional | | | Service | | | Investor A | | | Investor B | | | Investor C | | | Class R | | | Total | |
Global Opportunities | | $ | 52,028 | | | | – | | | $ | 187,884 | | | $ | 3,798 | | | $ | 72,102 | | | $ | 27,703 | | | $ | 343,515 | |
Health Sciences Opportunities | | $ | 260,882 | | | $ | 12,736 | | | $ | 837,494 | | | $ | 57,036 | | | $ | 287,882 | | | $ | 18,576 | | | $ | 1,474,606 | |
International Opportunities | | $ | 880,386 | | | $ | 113,927 | | | $ | 764,902 | | | $ | 20,087 | | | $ | 209,746 | | | | – | | | $ | 1,989,048 | |
Science & Technology Opportunities | | $ | 64,809 | | | $ | 863 | | | $ | 197,940 | | | $ | 7,035 | | | $ | 72,022 | | | $ | 6,644 | | | $ | 349,313 | |
U.S. Opportunities | | $ | 2,197,930 | | | $ | 196,169 | | | $ | 1,084,729 | | | $ | 21,845 | | | $ | 302,608 | | | | – | | | $ | 3,803,281 | |
The Manager maintains a call center, which is responsible for providing certain shareholder services to the Funds, such as responding to shareholder inquiries and processing transactions based upon instructions from shareholders with respect to the subscription and redemption of Fund shares. For the six months ended March 31, 2012, each Fund reimbursed the Manager the following amounts for costs incurred in running the call center, which are included in transfer agent — class specific in the Statements of Operations:
| | | | | | | | | | | | | | | | | | | | | | | | | | | | |
| | | Share Classes | | | | |
| | | Institutional | | | Service | | | Investor A | | | Investor B | | | Investor C | | | Class R | | | Total | |
Global Opportunities | | $ | 1,095 | | | | – | | | $ | 4,376 | | | $ | 456 | | | $ | 1,540 | | | $ | 182 | | | $ | 7,649 | |
Health Sciences Opportunities | | $ | 4,978 | | | $ | 496 | | | $ | 28,486 | | | $ | 2,521 | | | $ | 7,883 | | | $ | 246 | | | $ | 44,610 | |
International Opportunities | | $ | 4,498 | | | $ | 3,121 | | | $ | 14,507 | | | $ | 1,090 | | | $ | 6,440 | | | | – | | | $ | 29,656 | |
Science & Technology Opportunities | | $ | 1,997 | | | $ | 56 | | | $ | 4,188 | | | $ | 174 | | | $ | 1,388 | | | $ | 76 | | | $ | 7,879 | |
U.S. Opportunities | | $ | 86,264 | | | $ | 1,815 | | | $ | 26,438 | | | $ | 935 | | | $ | 10,386 | | | | – | | | $ | 125,838 | |
BNY Mellon Investment Servicing (US) Inc. (“BNYMIS”) and the Manager act as co-administrators for the Funds. For these services, the co-administrators receive a combined administration fee computed daily and payable monthly, based on a percentage of the average daily net assets of each Fund. The combined administration fee is paid at the following annual rates: 0.075% of the first $500 million, 0.065% of the next $500 million and 0.055% of the average daily net assets in excess of $1 billion. In addition, each of the share classes is charged an administration fee based on the following percentages of average daily net assets of each respective class: 0.025% of the first $500 million, 0.015% of the next $500 million and 0.005% of the average daily net assets in excess of $1 billion. In addition, BNYMIS and the Manager may have, at their discretion, voluntarily waived all or any portion of their administration fees for a Fund or a share class which are included in
administration fees waived – class specific in the Statements of Operations. For the six months ended March 31, 2012, the Funds paid the following to the Manager in return for these services, which are included in administration, administration – class specific and administration fees waived – class specific in the Statements of Operations:
| | | | |
| Administration Fees | | | |
Global Opportunities | | $ | 85,717 | |
Health Sciences Opportunities | | $ | 529,334 | |
International Opportunities | | $ | 567,190 | |
Science & Technology Opportunities | | $ | 58,808 | |
U.S. Opportunities | | $ | 880,929 | |
| | | | | | |
| | | | | | |
| | BLACKROCK FUNDS | | MARCH 31, 2012 | | 61 |
| | |
| Notes to Financial Statements (continued) | | |
For the six months ended March 31, 2012, the following table shows the administration fees — class specific borne directly by each class of each Fund:
| | | | | | | | | | | | | | | | | | | | | | | | | | | | | | | | | | | |
| Administration Fees–Class Specific | | | | | | Share Classes | | | | | | |
| | | Institutional | | Service | | Investor A | | Investor B | | Investor C | | Class R | | Total |
Global Opportunities | | | $ | 7,711 | | | | | – | | | | $ | 27,418 | | | | $ | 837 | | | | $ | 7,685 | | | | $ | 1,986 | | | | $ | 45,637 | |
Health Sciences Opportunities | | | $ | 47,809 | | | | $ | 1,875 | | | | $ | 92,042 | | | | $ | 5,772 | | | | $ | 43,042 | | | | $ | 1,350 | | | | $ | 191,890 | |
International Opportunities | | | $ | 90,513 | | | | $ | 6,289 | | | | $ | 81,205 | | | | $ | 1,877 | | | | $ | 21,653 | | | | | – | | | | $ | 201,537 | |
Science & Technology Opportunities | | | $ | 4,659 | | | | $ | 122 | | | | $ | 14,113 | | | | $ | 391 | | | | $ | 3,671 | | | | $ | 492 | | | | $ | 23,448 | |
U.S. Opportunities | | | $ | 123,660 | | | | $ | 23,961 | | | | $ | 90,305 | | | | $ | 1,968 | | | | $ | 36,395 | | | | | – | | | | $ | 276,289 | |
The Funds received an exemptive order from the SEC permitting them, among other things, to pay an affiliated securities lending agent a fee based on a share of the income derived from the securities lending activities and have retained BlackRock Investment Management, LLC (“BIM”) as the securities lending agent. BIM may, on behalf of the Funds, invest cash collateral received by a Fund for such loans, among other things, in a private investment company managed by the Manager or in registered money market funds advised by the Manager or its affiliates. As securities lending agent, BIM is responsible for all transaction fees and all other operational costs relating to securities lending activities, other than extraordinary expenses. BIM does not receive any fees for managing the cash collateral. The market value of securities on loan and the value of the related collateral, if applicable, are shown in the Statements of Assets and Liabilities as securities loaned at value and collateral on securities loaned at value, respectively. The cash collateral invested by BIM is disclosed in the Schedules of Investments, if any. Securities lending income is equal to the total of income earned from the reinvestment of cash collateral, net of rebates paid to, or fees paid by, borrowers of securities. The Fund retains 65% of securities lending income and pay a fee to BIM equal to 35% of such income. The share of income earned by the Funds on the reinvestment of cash collateral is shown as securities lending – affiliated in the Statements of Operations. For the six months ended March 31, 2012, BIM received $501,117 in securities lending agent fees related to securities lending activities for the Funds.
During the six months ended March 31, 2012, Science & Technology Opportunities received reimbursements of $93 from an affiliate, which is included in capital share transactions on the Statements of Changes in Net Assets, relating to processing errors.
Certain officers and/or trustees of the Trust are officers and/or directors of BlackRock or its affiliates. The Funds reimburse the Manager for compensation paid to the Trust’s Chief Compliance Officer.
4. Investments:
Purchases and sales of investments, excluding short-term securities, for the six months ended March 31, 2012, were as follows:
| | | | | | | | | | |
| | | Purchases | | Sales |
Global Opportunities | | | $ | 188,898,947 | | | | $ | 241,866,786 | |
Health Sciences Opportunities | | | $ | 1,197,524,993 | | | | $ | 1,166,700,034 | |
International Opportunities | | | $ | 713,000,537 | | | | $ | 801,271,763 | |
Science & Technology Opportunities | | | $ | 296,426,312 | | | | $ | 300,444,015 | |
U.S. Opportunities | | | $ | 1,481,609,414 | | | | $ | 2,205,042,139 | |
Transactions in options written for the six months ended March 31, 2012, were as follows:
| | | | | | | | | | | | | | | | | | | | |
| | | Global Opportunities |
| | | Calls | | Puts |
| | | Contracts | | Premiums
Received | | Contracts | | Premiums
Received |
Outstanding options, beginning of period | | | | – | | | | | – | | | | | – | | | | | – | |
Options written | | | | 4,299 | | | | $ | 214,096 | | | | | 4,255 | | | | $ | 97,767 | |
Options expired | | | | (4,299 | ) | | | | (214,096 | ) | | | | (4,255 | ) | | | | (97,767 | ) |
| | | | | |
Outstanding options, at end of period | | | | – | | | | | – | | | | | – | | | | | – | |
| | | | | | | | | | | | | | | | | | | | | |
| | | Health Sciences Opportunities |
| | | Calls | | Puts |
| | | Contracts | | Premiums
Received | | Contracts | | Premiums
Received |
Outstanding options, beginning of period | | | | – | | | | | – | | | | | – | | | | | – | |
Options written | | | | 10,947 | | | | $ | 1,733,794 | | | | | 19,925 | | | | $ | 2,212,924 | |
Options expired | | | | (3,312 | ) | | | | (467,230 | ) | | | | (15,275 | ) | | | | (1,597,212 | ) |
Options closed | | | | (7,028 | ) | | | | (1,216,601 | ) | | | | – | | | | | – | |
Options exercised | | | | (7 | ) | | | | (1,379 | ) | | | | – | | | | | – | |
| | | | | |
Outstanding options, at end of period | | | | 600 | | | | $ | 48,584 | | | | | 4,650 | | | | $ | 615,712 | |
| | |
5. Income Tax Information:
As of September 30, 2011, the Funds had capital loss carryforwards available to offset future realized capital gains through the indicated expiration dates as follows:
| | | | | | | | | | | | | | | |
Expires September 30, | | Global
Opportunities | | International
Opportunities | | Science &
Technology
Opportunities |
2015 | | | $ | 25,919,213 | | | | | – | | | | $ | 53,421,695 | |
2016 | | | | 106,463,888 | | | | | – | | | | | – | |
2017 | | | | 11,844,687 | | | | $ | 10,669,404 | | | | | 4,448,928 | |
2018 | | | | 6,825,363 | | | | | 63,081,604 | | | | | – | |
2019 | | | | – | | | | | – | | | | | 783,208 | |
No expiration date1 | | | | 3,120,805 | | | | | – | | | | | – | |
| | | | | |
Total | | | $ | 154,173,956 | | | | $ | 73,751,008 | | | | $ | 58,653,831 | |
| | | | | |
| 1 | Not subject to expiration and must be utilized prior to losses subject |
to expiration.
Under the Regulated Investment Company Modernization Act of 2010, capital losses incurred by the Funds after September 30, 2011 will not be subject to expiration. In addition, any such losses must be utilized prior to the losses incurred in pre-enactment taxable years.
| | | | |
| | | | |
62 | | BLACKROCK FUNDS | | MARCH 31, 2012 |
Notes to Financial Statements (continued)
As of March 31, 2012, gross unrealized appreciation and gross unrealized depreciation based on cost for federal income tax purposes were as follows:
| | | | | | | | | | | | | | | | | | | | | | | | | |
| | | Global
Opportunities | | Health Sciences
Opportunities | | International
Opportunities | | Science &
Technology
Opportunities | | U.S.
Opportunities |
Tax cost | | | $ | 327,593,567 | | | | $ | 1,704,949,288 | | | | $ | 1,753,108,797 | | | | $ | 174,184,343 | | | | $ | 2,976,291,757 | |
Gross unrealized appreciation | | | $ | 43,201,431 | | | | $ | 308,639,690 | | | | $ | 205,429,919 | | | | $ | 35,680,428 | | | | $ | 513,519,252 | |
Gross unrealized depreciation | | | | (12,435,047 | ) | | | | (11,158,602 | ) | | | | (88,122,817 | ) | | | | (365,006 | ) | | | | (63,475,340 | ) |
Net unrealized appreciation | | | $ | 30,766,384 | | | | $ | 297,481,088 | | | | $ | 117,307,102 | | | | $ | 35,315,422 | | | | $ | 450,043,912 | |
6. Borrowings:
The Trust, on behalf of the Funds, along with certain other funds managed by the Manager and its affiliates, is a party to a $500 million credit agreement with a group of lenders. The Funds may borrow under the credit agreement to fund shareholder redemptions. Effective November 2010 to November 2011, the credit agreement had the following terms: a commitment fee of 0.08% per annum based on the Funds’ pro rata share of the unused portion of the credit agreement and interest at a rate equal to the higher of (a) the one-month LIBOR plus 1.00% per annum or (b) the Fed Funds rate plus 1.00% per annum on amounts borrowed. In addition, the Funds paid administration and arrangement fees which were allocated to the Funds based on their net assets as of October 31, 2010. The credit agreement, which expired in November 2011, was renewed until November 2012. Effective November 2011 to November 2012, the credit agreement has the following terms: a commitment fee of 0.065% per annum based on the Funds’ pro rata share of the unused portion of the credit agreement and interest at a rate equal to the higher of (a) the one-month LIBOR plus 0.80% per annum or (b) the Fed Funds rate plus 0.80% per annum on amounts borrowed. In addition, the Funds paid administration and arrangement fees which were allocated to the Funds based on their net assets as of October 31, 2011. The Funds did not borrow under the credit agreement during the six months ended March 31, 2012.
7. Concentration, Market and Credit Risk:
In the normal course of business, the Funds invest in securities and enter into transactions where risks exist due to fluctuations in the market (market risk) or failure of the issuer of a security to meet all its obligations (issuer credit risk). The value of securities held by the Funds may decline in response to certain events, including those directly involving the issuers whose securities are owned by the Funds; conditions affecting the general economy; overall market changes; local, regional or global political, social or economic instability; and currency and interest rate and price fluctuations. Similar to issuer credit risk, the Funds may be exposed to counterparty credit risk, or the risk that an entity with which the Funds have unsettled or open transactions may fail to or be unable to perform on its commitments. The Funds manage counterparty credit risk by entering into transactions only with counterparties that they believe have the financial resources to honor their obligations and by monitoring the financial stability of those counterparties. Financial assets, which potentially expose the Funds to market, issuer and counterparty credit risks, consist principally of financial instruments and receivables due from counterparties. The extent of the Funds’ exposure to market, issuer and counterparty credit risks with respect to these
financial assets is generally approximated by their value recorded in the Funds’ Statements of Assets and Liabilities, less any collateral held by the Funds.
As of March 31, 2012, Health Sciences Opportunities invested a significant portion of its assets in securities in the health care sector. Changes in economic conditions affecting the health care sector would have a greater impact on Health Sciences Opportunities and could affect the value, income and/or liquidity of positions in such securities.
As of March 31, 2012, Science & Technology Opportunities invested a significant portion of its assets in securities in the information technology sector. Changes in economic conditions affecting the information technology sector would have a greater impact on Science & Technology Opportunities and could affect the value, income and/or liquidity of positions in such securities.
As of March 31, 2012, Global Opportunities invested a substantial amount of its assets in issuers located in a single country or a limited number of countries. When the Fund concentrates its investments in this manner, it assumes the risk that economic, political and social conditions in those countries may have a significant impact on its investment performance.
As of March 31, 2012, the Funds listed below had the following industry classifications:
| | | | |
| Industry | | Global
Opportunities | | International
Opportunities |
Oil, Gas & Consumable Fuels | | 9% | | 9% |
Commercial Banks | | 7 | | 13 |
Pharmaceuticals | | 6 | | 5 |
Machinery | | 5 | | 5 |
Chemicals | | – | | 5 |
Insurance | | – | | 6 |
Metals & Mining | | – | | 5 |
Other1 | | 73 | | 52 |
| 1 | All other industries held were each less than 5% of long-term investments. |
| | | | | | |
| | | | | | |
| | BLACKROCK FUNDS | | MARCH 31, 2012 | | 63 |
| | |
| Notes to Financial Statements (continued) | | |
8. Capital Shares Transactions:
Transactions in capital shares for each class were as follows:
| | | | | | | | | | | | | | | | | | | | | | | | | |
| | | Six Months Ended March 31, 2012 | | | | Year Ended September 30, 2011 |
| Global Opportunities | | Shares | | Amount | | | | Shares | | Amount |
Institutional | | | | | | | | | | | | | | | | | | | | | | |
Shares issued in the reorganization1 | | | | – | | | | | – | | | | | | | 4,690,343 | | | | $ | 46,049,322 | |
Shares sold | | | | 436,289 | | | | $ | 4,454,266 | | | | | | | 550,794 | | | | | 6,086,117 | |
Shares issued in reinvestment of dividends | | | | 10,082 | | | | | 100,322 | | | | | | | 11,360 | | | | | 128,593 | |
Shares redeemed | | | | (1,095,285 | ) | | | | (11,311,325 | ) | | | | | | (1,004,993 | ) | | | | (11,033,445 | ) |
Net increase (decrease) | | | | (648,914 | ) | | | $ | (6,756,737 | ) | | | | | | 4,247,504 | | | | $ | 41,230,587 | |
| | | | | |
| | | | | | | | | | | | | | | | | | | | | | | |
Investor A | | | | | | | | | | | | | | | | | | | | | | |
Shares issued in the reorganization1 | | | | – | | | | | – | | | | | | | 19,605,539 | | | | $ | 191,318,695 | |
Shares sold and automatic conversion of shares | | | | 640,994 | | | | $ | 6,604,539 | | | | | | | 760,598 | | | | | 8,385,507 | |
Shares issued in reinvestment of dividends | | | | 24,774 | | | | | 245,035 | | | | | | | 10,826 | | | | | 122,113 | |
Shares redeemed | | | | (3,925,856 | ) | | | | (40,968,134 | ) | | | | | | (1,424,020 | ) | | | | (15,313,906 | ) |
Net increase (decrease) | | | | (3,260,088 | ) | | | $ | (34,118,560 | ) | | | | | | 18,952,943 | | | | $ | 184,512,409 | |
| | | | | |
| | | | | | | | | | | | | | | | | | | | | | | |
Investor B | | | | | | | | | | | | | | | | | | | | | | |
Shares issued in the reorganization1 | | | | – | | | | | – | | | | | | | 476,778 | | | | $ | 4,571,444 | |
Shares sold | | | | 2,147 | | | | $ | 21,847 | | | | | | | 8,464 | | | | | 96,689 | |
Shares redeemed and automatic conversion of shares | | | | (149,439 | ) | | | | (1,517,107 | ) | | | | | | (94,007 | ) | | | | (1,002,860 | ) |
Net increase (decrease) | | | | (147,292 | ) | | | $ | (1,495,260 | ) | | | | | | 391,235 | | | | $ | 3,665,273 | |
| | | | | |
| | | | | | | | | | | | | | | | | | | | | | | |
Investor C | | | | | | | | | | | | | | | | | | | | | | |
Shares issued in the reorganization1 | | | | – | | | | | – | | | | | | | 4,865,475 | | | | $ | 46,465,289 | |
Shares sold | | | | 147,839 | | | | $ | 1,476,358 | | | | | | | 308,404 | | | | | 3,430,169 | |
Shares redeemed | | | | (929,071 | ) | | | | (9,385,975 | ) | | | | | | (598,941 | ) | | | | (6,374,896 | ) |
Net increase (decrease) | | | | (781,232 | ) | | | $ | (7,909,617 | ) | | | | | | 4,574,938 | | | | $ | 43,520,562 | |
| | | | |
| | | | | | | | | Period
September 12, 20112 to
September 30, 2011 |
| | | | | | | | | Shares | | Amount |
Class R | | | | | | | | | | | | | | | | | | | | | | |
Shares issued in the reorganization1 | | | | – | | | | | – | | | | | | | 1,613,792 | | | | $ | 15,748,035 | |
Shares sold | | | | 260,790 | | | | $ | 2,663,564 | | | | | | | 36,132 | | | | | 355,964 | |
Shares issued in reinvestment of dividends | | | | 497 | | | | | 4,914 | | | | | | | 22,035 | | | | | 228,067 | |
Shares redeemed | | | | (403,153 | ) | | | | (4,180,708 | ) | | | | | | (42,000 | ) | | | | (399,037 | ) |
Net increase (decrease) | | | | (141,866 | ) | | | $ | (1,512,230 | ) | | | | | | 1,607,924 | | | | $ | 15,704,962 | |
Total net increase (decrease) | | | | (4,979,392 | ) | | | $ | (51,792,404 | ) | | | | | | 29,774,544 | | | | $ | 288,633,793 | |
| 1 | See Note 1 regarding the reorganization |
| 2 | Commencement of Operations |
| | | | |
| | | | |
64 | | BLACKROCK FUNDS | | MARCH 31, 2012 |
Notes to Financial Statements (continued)
| | | | | | | | | | | | | | | | | | | | | | | | | |
| | | Six Months Ended March 31, 2012 | | | | Year Ended September 30, 2011 |
| Health Sciences Opportunities | | Shares | | Amount | | | | Shares | | Amount |
Institutional | | | | | | | | | | | | | | | | | | | | | | |
Shares issued in the reorganization1 | | | | – | | | | | – | | | | | | | 2,520,951 | | | | $ | 72,864,825 | |
Shares sold | | | | 2,239,365 | | | | $ | 67,716,697 | | | | | | | 5,310,915 | | | | | 165,243,096 | |
Shares issued in reinvestment of dividends and distributions | | | | 616,409 | | | | | 17,222,456 | | | | | | | 342,151 | | | | | 9,686,180 | |
Shares redeemed | | | | (2,166,633 | ) | | | | (63,993,042 | ) | | | | | | (3,625,515 | ) | | | | (109,106,448 | ) |
Net increase | | | | 689,141 | | | | $ | 20,946,111 | | | | | | | 4,548,502 | | | | $ | 138,687,653 | |
| | | | | | | | | | | | | | | | | | | | | | | |
Service | | | | | | | | | | | | | | | | | | | | | | |
Shares sold | | | | 123,574 | | | | $ | 3,589,121 | | | | | | | 282,548 | | | | $ | 8,479,494 | |
Shares issued in reinvestment of distributions | | | | 27,004 | | | | | 736,672 | | | | | | | 17,268 | | | | | 477,975 | |
Shares redeemed | | | | (131,463 | ) | | | | (3,809,061 | ) | | | | | | (234,131 | ) | | | | (6,889,355 | ) |
Net increase | | | | 19,115 | | | | $ | 516,732 | | | | | | | 65,685 | | | | $ | 2,068,114 | |
| | | | | | | | | | | | | | | | | | | | | | | |
Investor A | | | | | | | | | | | | | | | | | | | | | | |
Shares issued in the reorganization1 | | | | – | | | | | – | | | | | | | 4,614,746 | | | | $ | 129,864,024 | |
Shares sold and automatic conversion of shares | | | | 5,000,254 | | | | $ | 146,282,644 | | | | | | | 8,538,548 | | | | | 256,119,158 | |
Shares issued in reinvestment of distributions | | | | 1,553,813 | | | | | 42,294,790 | | | | | | | 1,055,037 | | | | | 29,150,534 | |
Shares redeemed | | | | (5,162,823 | ) | | | | (150,375,392 | ) | | | | | | (8,979,890 | ) | | | | (263,921,203 | ) |
Net increase | | | | 1,391,244 | | | | $ | 38,202,042 | | | | | | | 5,228,441 | | | | $ | 151,212,513 | |
| | | | | | | | | | | | | | | | | | | | | | | |
Investor B | | | | | | | | | | | | | | | | | | | | | | |
Shares issued in the reorganization1 | | | | – | | | | | – | | | | | | | 264,033 | | | | $ | 6,971,367 | |
Shares sold | | | | 16,976 | | | | $ | 470,082 | | | | | | | 23,409 | | | | | 663,728 | |
Shares issued in reinvestment of distributions | | | | 78,735 | | | | | 2,017,206 | | | | | | | 62,470 | | | | | 1,628,570 | |
Shares redeemed and automatic conversion of shares | | | | (306,101 | ) | | | | (8,460,863 | ) | | | | | | (404,936 | ) | | | | (11,242,595 | ) |
Net decrease | | | | (210,390 | ) | | | $ | (5,973,575 | ) | | | | | | (55,024 | ) | | | $ | (1,978,930 | ) |
| | | | | |
| | | | | | | | | | | | | | | | | | | | | | | |
Investor C | | | | | | | | | | | | | | | | | | | | | | |
Shares issued in the reorganization1 | | | | – | | | | | – | | | | | | | 1,732,603 | | | | $ | 45,602,289 | |
Shares sold | | | | 792,297 | | | | $ | 21,836,095 | | | | | | | 1,964,605 | | | | | 55,634,617 | |
Shares issued in reinvestment of distributions | | | | 581,778 | | | | | 14,834,985 | | | | | | | 398,100 | | | | | 10,342,259 | |
Shares redeemed | | | | (1,281,445 | ) | | | | (34,970,554 | ) | | | | | | (2,395,905 | ) | | | | (66,305,169 | ) |
Net increase | | | | 92,630 | | | | $ | 1,700,526 | | | | | | | 1,699,403 | | | | $ | 45,273,996 | |
| | | | | | | | | Period
September 12, 20112 to
September 30, 2011 |
| | | | | | | | | Shares | | Amount |
Class R | | | | | | | | | | | | | | | | | | | | | | |
Shares issued in the reorganization1 | | | | – | | | | | – | | | | | | | 347,818 | | | | $ | 9,787,987 | |
Shares sold | | | | 109,922 | | | | $ | 3,226,291 | | | | | | | 11,745 | | | | | 335,213 | |
Shares issued in reinvestment of dividends | | | | 19,428 | | | | | 527,655 | | | | | | | – | | | | | – | |
Shares redeemed | | | | (70,062 | ) | | | | (2,055,392 | ) | | | | | | (17,412 | ) | | | | (498,734 | ) |
Net increase | | | | 59,288 | | | | $ | 1,698,554 | | | | | | | 342,151 | | | | $ | 9,624,466 | |
Total net increase | | | | 2,041,028 | | | | $ | 57,090,390 | | | | | | | 11,829,158 | | | | $ | 344,887,812 | |
| 1 | See Note 1 regarding the reorganization |
| 2 | Commencement of Operations |
| | | | | | |
| | | | | | |
| | BLACKROCK FUNDS | | MARCH 31, 2012 | | 65 |
| | |
| Notes to Financial Statements (continued) | | |
| | | | | | | | | | | | | | | | | | | | | | | | | |
| | | Six Months Ended March 31, 2012 | | | | Year Ended September 30, 2011 |
| International Opportunities | | Shares | | Amount | | | | Shares | | Amount |
Institutional | | | | | | | | | | | | | | | | | | | | | | |
Shares sold | | | | 5,671,214 | | | | $ | 175,717,406 | | | | | | | 16,478,827 | | | | $ | 566,277,414 | |
Shares issued in reinvestment of dividends | | | | 491,173 | | | | | 14,312,818 | | | | | | | 214,265 | | | | | 7,418,383 | |
Shares redeemed | | | | (6,171,722 | ) | | | | (188,885,167 | ) | | | | | | (13,232,744 | ) | | | | (457,095,405 | ) |
Net increase (decrease) | | | | (9,335 | ) | | | $ | 1,145,057 | | | | | | | 3,460,348 | | | | $ | 116,600,392 | |
| | | | | |
| | | | | | | | | | | | | | | | | | | | | | | |
Service | | | | | | | | | | | | | | | | | | | | | | |
Shares sold | | | | 121,102 | | | | $ | 3,597,850 | | | | | | | 310,969 | | | | $ | 10,329,417 | |
Shares issued in reinvestment of dividends | | | | 26,176 | | | | | 737,899 | | | | | | | 13,386 | | | | | 448,013 | |
Shares redeemed | | | | (240,964 | ) | | | | (7,136,962 | ) | | | | | | (802,715 | ) | | | | (26,887,480 | ) |
Net decrease | | | | (93,686 | ) | | | $ | (2,801,213 | ) | | | | | | (478,360 | ) | | | $ | (16,110,050 | ) |
| | | | | |
| | | | | | | | | | | | | | | | | | | | | | | |
Investor A | | | | | | | | | | | | | | | | | | | | | | |
Shares sold and automatic conversion of shares | | | | 3,331,252 | | | | $ | 97,644,783 | | | | | | | 9,774,128 | | | | $ | 314,050,543 | |
Shares issued in reinvestment of dividends | | | | 458,335 | | | | | 12,782,955 | | | | | | | 211,387 | | | | | 7,007,357 | |
Shares redeemed | | | | (5,093,703 | ) | | | | (149,715,490 | ) | | | | | | (9,380,973 | ) | | | | (312,127,798 | ) |
Net increase (decrease) | | | | (1,304,116 | ) | | | $ | (39,287,752 | ) | | | | | | 604,542 | | | | $ | 8,930,102 | |
| | | | | |
| | | | | | | | | | | | | | | | | | | | | | | |
Investor B | | | | | | | | | | | | | | | | | | | | | | |
Shares sold | | | | 3,035 | | | | $ | 83,684 | | | | | | | 10,981 | | | | $ | 340,576 | |
Shares issued in reinvestment of dividends | | | | 4,391 | | | | | 114,745 | | | | | | | 200 | | | | | 6,178 | |
Shares redeemed and automatic conversion of shares | | | | (158,281 | ) | | | | (4,349,548 | ) | | | | | | (254,785 | ) | | | | (7,867,647 | ) |
Net decrease | | | | (150,855 | ) | | | $ | (4,151,119 | ) | | | | | | (243,604 | ) | | | $ | (7,520,893 | ) |
| | | | | |
| | | | | | | | | | | | | | | | | | | | | | | |
Investor C | | | | | | | | | | | | | | | | | | | | | | |
Shares sold | | | | 313,175 | | | | $ | 8,538,781 | | | | | | | 1,317,687 | | | | $ | 40,785,132 | |
Shares issued in reinvestment of dividends | | | | 56,675 | | | | | 1,467,326 | | | | | | | 15,662 | | | | | 481,446 | |
Shares redeemed | | | | (1,191,551 | ) | | | | (32,308,111 | ) | | | | | | (2,327,389 | ) | | | | (71,180,146 | ) |
Net decrease | | | | (821,701 | ) | | | $ | (22,302,004 | ) | | | | | | (994,040 | ) | | | $ | (29,913,568 | ) |
Total net increase (decrease) | | | | (2,379,693 | ) | | | $ | (67,397,031 | ) | | | | | | 2,348,886 | | | | $ | 71,985,983 | |
| | | | |
| | | | |
66 | | BLACKROCK FUNDS | | MARCH 31, 2012 |
Notes to Financial Statements (continued)
| | | | | | | | | | | | | | | | | | | | | | | | | |
| | | Six Months Ended
March 31, 2012 | | | | Year Ended September 30, 2011 |
| Science & Technology Opportunities | | Shares | | Amount | | | | Shares | | Amount |
Institutional | | | | | | | | | | | | | | | | | | | | | | |
Shares sold | | | | 606,070 | | | | $ | 5,851,969 | | | | | | | 1,206,173 | | | | $ | 12,255,183 | |
Shares redeemed | | | | (637,128 | ) | | | | (6,148,309 | ) | | | | | | (935,690 | ) | | | | (9,390,243 | ) |
Net increase (decrease) | | | | (31,058 | ) | | | $ | (296,340 | ) | | | | | | 270,483 | | | | $ | 2,864,940 | |
| | | | | |
| | | | | | | | | | | | | | | | | | | | | | | |
Service | | | | | | | | | | | | | | | | | | | | | | |
Shares sold | | | | 17,654 | | | | $ | 167,504 | | | | | | | 76,484 | | | | $ | 728,734 | |
Shares redeemed | | | | (6,476 | ) | | | | (59,782 | ) | | | | | | (49,792 | ) | | | | (484,979 | ) |
Net increase | | | | 11,178 | | | | $ | 107,722 | | | | | | | 26,692 | | | | $ | 243,755 | |
| | | | | |
| | | | | | | | | | | | | | | | | | | | | | | |
Investor A | | | | | | | | | | | | | | | | | | | | | | |
Shares sold and automatic conversion of shares | | | | 755,068 | | | | $ | 6,993,893 | | | | | | | 4,564,043 | | | | $ | 43,817,474 | |
Shares redeemed | | | | (1,826,910 | ) | | | | (16,561,003 | ) | | | | | | (3,812,838 | ) | | | | (36,639,657 | ) |
Net increase (decrease) | | | | (1,071,842 | ) | | | $ | (9,567,110 | ) | | | | | | 751,205 | | | | $ | 7,177,817 | |
| | | | | |
| | | | | | | | | | | | | | | | | | | | | | | |
Investor B | | | | | | | | | | | | | | | | | | | | | | |
Shares sold | | | | 14,859 | | | | $ | 125,846 | | | | | | | 68,629 | | | | $ | 598,949 | |
Shares redeemed and automatic conversion of shares | | | | (78,600 | ) | | | | (676,426 | ) | | | | | | (203,615 | ) | | | | (1,789,504 | ) |
Net decrease | | | | (63,741 | ) | | | $ | (550,580 | ) | | | | | | (134,986 | ) | | | $ | (1,190,555 | ) |
| | | | | |
| | | | | | | | | | | | | | | | | | | | | | | |
Investor C | | | | | | | | | | | | | | | | | | | | | | |
Shares sold | | | | 282,348 | | | | $ | 2,362,487 | | | | | | | 1,125,911 | | | | $ | 10,129,287 | |
Shares redeemed | | | | (551,177 | ) | | | | (4,509,243 | ) | | | | | | (840,174 | ) | | | | (7,390,677 | ) |
Net increase (decrease) | | | | (268,829 | ) | | | $ | (2,146,756 | ) | | | | | | 285,737 | | | | $ | 2,738,610 | |
| | | | | |
| | | | | | | | | | | | | | | | | | | | | | | |
Class R | | | | | | | | | | | | | | | | | | | | | | |
Shares sold | | | | 115,167 | | | | $ | 1,095,072 | | | | | | | 252,128 | | | | $ | 2,505,574 | |
Shares redeemed | | | | (88,579 | ) | | | | (826,589 | ) | | | | | | (168,337 | ) | | | | (1,660,869 | ) |
Net increase | | | | 26,588 | | | | $ | 268,483 | | | | | | | 83,791 | | | | $ | 844,705 | |
Total net increase (decrease) | | | | (1,397,704 | ) | | | $ | (12,184,581 | ) | | | | | | 1,282,922 | | | | $ | 12,679,272 | |
| | | | | | |
| | | | | | |
| | BLACKROCK FUNDS | | MARCH 31, 2012 | | 67 |
| | |
| Notes to Financial Statements (concluded) | | |
| | | | | | | | | | | | | | | | | | | | | | | | | |
| | | Six Months Ended March 31, 2012 | | | | Year Ended September 30, 2011 |
| U.S. Opportunities | | Shares | | Amount | | | | Shares | | Amount |
Institutional | | | | | | | | | | | | | | | | | | | | | | |
Shares sold | | | | 8,586,070 | | | | $ | 303,242,752 | | | | | | | 34,490,335 | | | | $ | 1,403,849,188 | |
Shares issued in reinvestment of dividends and distributions | | | | 4,597,296 | | | | | 151,572,873 | | | | | | | 562,799 | | | | | 22,489,473 | |
Shares redeemed | | | | (20,930,559 | ) | | | | (755,987,158 | ) | | | | | | (21,778,639 | ) | | | | (883,122,611 | ) |
Net increase (decrease) | | | | (7,747,193 | ) | | | $ | (301,171,533 | ) | | | | | | 13,274,495 | | | | $ | 543,216,050 | |
| | | | | |
| | | | | | | | | | | | | | | | | | | | | | | |
Service | | | | | | | | | | | | | | | | | | | | | | |
Shares sold | | | | 50,759 | | | | $ | 1,714,289 | | | | | | | 746,753 | | | | $ | 29,457,121 | |
Shares issued in reinvestment of distributions | | | | 633,064 | | | | | 19,966,853 | | | | | | | 84,568 | | | | | 3,249,935 | |
Shares redeemed | | | | (1,032,906 | ) | | | | (35,408,841 | ) | | | | | | (1,835,825 | ) | | | | (71,884,470 | ) |
Net decrease | | | | (349,083 | ) | | | $ | (13,727,699 | ) | | | | | | (1,004,504 | ) | | | $ | (39,177,414 | ) |
| | | | | |
| | | | | | | | | | | | | | | | | | | | | | | |
Investor A | | | | | | | | | | | | | | | | | | | | | | |
Shares sold and automatic conversion of shares | | | | 1,376,377 | | | | $ | 46,675,969 | | | | | | | 8,996,743 | | | | $ | 349,422,572 | |
Shares issued in reinvestment of distributions | | | | 2,846,386 | | | | | 88,721,884 | | | | | | | 413,341 | | | | | 15,711,130 | |
Shares redeemed | | | | (9,462,210 | ) | | | | (319,704,493 | ) | | | | | | (14,804,518 | ) | | | | (575,969,728 | ) |
Net decrease | | | | (5,239,447 | ) | | | $ | (184,306,640 | ) | | | | | | (5,394,434 | ) | | | $ | (210,836,026 | ) |
| | | | | |
| | | | | | | | | | | | | | | | | | | | | | | |
Investor B | | | | | | | | | | | | | | | | | | | | | | |
Shares sold | | | | 1,652 | | | | $ | 50,752 | | | | | | | 19,782 | | | | $ | 714,834 | |
Shares issued in reinvestment of distributions | | | | 59,433 | | | | | 1,669,467 | | | | | | | 6,293 | | | | | 218,440 | |
Shares redeemed and automatic conversion of shares | | | | (89,105 | ) | | | | (2,720,626 | ) | | | | | | (142,776 | ) | | | | (5,054,884 | ) |
Net decrease | | | | (28,020 | ) | | | $ | (1,000,407 | ) | | | | | | (116,701 | ) | | | $ | (4,121,610 | ) |
| | | | | |
| | | | | | | | | | | | | | | | | | | | | | | |
Investor C | | | | | | | | | | | | | | | | | | | | | | |
Shares sold | | | | 198,498 | | | | $ | 6,062,838 | | | | | | | 2,022,997 | | | | $ | 71,961,051 | |
Shares issued in reinvestment of distributions | | | | 1,073,324 | | | | | 30,171,224 | | | | | | | 114,346 | | | | | 3,967,782 | |
Shares redeemed | | | | (2,001,794 | ) | | | | (61,849,789 | ) | | | | | | (2,912,160 | ) | | | | (101,772,168 | ) |
Net decrease | | | | (729,972 | ) | | | $ | (25,615,727 | ) | | | | | | (774,817 | ) | | | $ | (25,843,335 | ) |
Total net increase (decrease) | | | | (14,093,715 | ) | | | $ | (525,822,006 | ) | | | | | | 5,984,039 | | | | $ | 263,237,665 | |
Prior to April 1, 2011, there was a 2% redemption fee on shares redeemed or exchanged that have been held 30 days or less. The redemption fees were collected and retained by the Funds for the benefit of the remaining shareholders. The redemption fees were recorded as a credit to paid-in capital. Effective April 1, 2011, the redemption fee was terminated and is no longer charged by the Funds.
9. Subsequent Events:
Management has evaluated the impact of all subsequent events on the Funds through the date the financial statements were issued and has determined that there were no subsequent events requiring adjustment or additional disclosure in the financial statements.
| | | | |
| | | | |
68 | | BLACKROCK FUNDS | | MARCH 31, 2012 |
Officers and Trustees
Ronald W. Forbes, Co-Chairman of the Board and Trustee
Rodney D. Johnson, Co-Chairman of the Board and Trustee
Paul L. Audet, Trustee
David O. Beim, Trustee
Henry Gabbay, Trustee
Dr. Matina S. Horner, Trustee
Herbert I. London, Trustee
Cynthia A. Montgomery, Trustee
Joseph P. Platt, Trustee
Robert C. Robb, Jr., Trustee
Toby Rosenblatt, Trustee
Kenneth L. Urish, Trustee
Frederick W. Winter, Trustee
John M. Perlowski, President and Chief Executive Officer
Richard Hoerner, CFA, Vice President
Brendan Kyne, Vice President
Simon Mendelson, Vice President
Christopher Stavrakos, CFA, Vice President
Neal Andrews, Chief Financial Officer
Jay Fife, Treasurer
Brian Kindelan, Chief Compliance Officer and
Anti-Money Laundering Officer
Ira P. Shapiro, Secretary
Investment Advisor and Co-Administrator
BlackRock Advisors, LLC
Wilmington, DE 19809
Sub-Advisors
BlackRock Financial Management, Inc.1
New York, NY 10055
BlackRock International Limited2
Edinburgh, Scotland EH3 8JB
Accounting Agent, Co-Administrator and Transfer Agent
BNY Mellon Investment Servicing (US) Inc.
Wilmington, DE 19809
Custodians
The Bank of New York Mellon
New York, NY 10286
Distributor
BlackRock Investments, LLC
New York, NY 10022
Legal Counsel
Sidley Austin LLP
New York, NY 10019
Independent Registered Public Accounting Firm
Deloitte & Touche LLP
Philadelphia, PA 19103
Address of the Trust
100 Bellevue Parkway
Wilmington, DE 19809
| 1 | For Global Opportunities. |
| 2 | For International Opportunities. |
| | | | | | |
| | | | | | |
| | BLACKROCK FUNDS | | MARCH 31, 2012 | | 69 |
Electronic Delivery
Electronic copies of most financial reports and prospectuses are available on the Funds’ website or shareholders can sign up for e-mail notifications of quarterly statements, annual and semi-annual reports and prospectuses by enrolling in the Funds’ electronic delivery program.
To enroll:
Shareholders Who Hold Accounts with Investment Advisors, Banks or Brokerages:
Please contact your financial advisor. Please note that not all investment advisors, banks or brokerages may offer this service.
Shareholders Who Hold Accounts Directly With BlackRock:
| 1) | Access the BlackRock website at |
| | http://www.blackrock.com/ | edelivery |
| 2) | Select “eDelivery” under the “More |
Householding
The Funds will mail only one copy of shareholder documents, including prospectuses, annual and semi-annual reports and proxy statements, to shareholders with multiple accounts at the same address. This practice is commonly called “householding” and is intended to reduce expenses and eliminate duplicate mailings of shareholder documents. Mailings of your shareholder documents may be householded indefinitely unless you instruct us otherwise. If you do not want the mailing of these documents to be combined with those for other members of your household, please contact the Funds at (800) 441-7762.
Availability of Quarterly Schedule of Investments
The Funds file their complete schedule of portfolio holdings with the SEC for the first and third quarters of each fiscal year on Form N-Q. The Funds’ Forms N-Q are available on the SEC’s website at http:// www.sec.gov and may also be reviewed and copied at the SEC’s Public Reference Room in Washington, D.C. Information on how to access documents on the SEC’s website without charge may be obtained by calling (800) SEC-0330. The Funds’ Forms N-Q may also be obtained upon request and without charge by calling (800) 441-7762.
Availability of Proxy Voting Policies and Procedures
A description of the policies and procedures that the Funds use to determine how to vote proxies relating to portfolio securities is available (1) without charge, upon request by calling (800) 441-7762; (2) at http://www.blackrock.com; and (3) on the SEC’s website at http:// www.sec.gov.
Availability of Proxy Voting Record
Information about how the Funds voted proxies relating to securities held in the Funds’ portfolios during the most recent 12-month period ended June 30 is available upon request, and without charge (1) at http://www.blackrock.com or by calling (800) 441-7762 and (2) on the SEC’s website at http://www.sec.gov.
Account Information
Call us at (800) 441-7762 from 8:00 AM to 6:00 PM EST on any business day to get information about your account balances, recent transactions and share prices. You can also reach us on the Web at
http:// www.blackrock.com/funds.
Automatic Investment Plans
Investor Class shareholders who want to invest regularly can arrange to have $50 or more automatically deducted from their checking or savings account and invested in any of the BlackRock funds.
Systematic Withdrawal Plan
Investor Class shareholders can establish a systematic withdrawal plan and receive periodic payments of $50 or more from their BlackRock funds, as long as their account balance is at least $10,000.
Retirement Plans
Shareholders may make investments in conjunction with Traditional, Rollover, Roth, Coverdell, Simple IRAs, SEP IRAs and 403(b) Plans.
| | | | |
| | | | |
70 | | BLACKROCK FUNDS | | MARCH 31, 2012 |
| | |
| Additional Information (concluded) | | |
| | |
|
BlackRock Privacy Principles |
BlackRock is committed to maintaining the privacy of its current and former fund investors and individual clients (collectively, “Clients”) and to safeguarding their non-public personal information. The following information is provided to help you understand what personal information BlackRock collects, how we protect that information and why in certain cases we share such information with select parties.
If you are located in a jurisdiction where specific laws, rules or regulations require BlackRock to provide you with additional or different privacy-related rights beyond what is set forth below, then BlackRock will comply with those specific laws, rules or regulations.
BlackRock obtains or verifies personal non-public information from and about you from different sources, including the following: (i) information we receive from you or, if applicable, your financial intermediary, on applications, forms or other documents; (ii) information about your transactions with us, our affiliates, or others; (iii) information we receive from a consumer reporting agency; and (iv) from visits to our websites.
BlackRock does not sell or disclose to non-affiliated third parties any non-public personal information about its Clients, except as permitted by law or as is necessary to respond to regulatory requests or to service Client accounts. These non-affiliated third parties are required to protect the confidentiality and security of this information and to use it only for its intended purpose.
We may share information with our affiliates to service your account or to provide you with information about other BlackRock products or services that may be of interest to you. In addition, BlackRock restricts access to non-public personal information about its Clients to those BlackRock employees with a legitimate business need for the information. BlackRock maintains physical, electronic and procedural safeguards that are designed to protect the non-public personal information of its Clients, including procedures relating to the proper storage and disposal of such information.
| | | | | | |
| | | | | | |
| | BLACKROCK FUNDS | | MARCH 31, 2012 | | 71 |
| | |
| A World-Class Mutual Fund Family | | |
BlackRock offers a diverse lineup of open-end mutual funds crossing all investment styles and managed by experts in equity, fixed income and tax-exempt investing.
| | | | |
BlackRock ACWI ex-US Index Fund | | BlackRock Global Dynamic Equity Fund | | BlackRock Mid-Cap Value Equity Portfolio |
BlackRock All-Cap Energy & Resources Portfolio | | BlackRock Global Opportunities Portfolio | | BlackRock Mid Cap Value Opportunities Fund |
BlackRock Balanced Capital Fund† | | BlackRock Global SmallCap Fund | | BlackRock Natural Resources Trust |
BlackRock Basic Value Fund | | BlackRock Health Sciences Opportunities Portfolio | | BlackRock Pacific Fund |
BlackRock Capital Appreciation Fund | | BlackRock Index Equity Portfolio | | BlackRock Russell 1000 Index Fund |
BlackRock China Fund | | BlackRock India Fund | | BlackRock Science & Technology |
BlackRock Commodity Strategies Fund | | BlackRock International Fund | | Opportunities Portfolio |
BlackRock Emerging Markets Fund | | BlackRock International Index Fund | | BlackRock Small Cap Growth Equity Portfolio |
BlackRock Emerging Markets Long/Short | | BlackRock International Opportunities Portfolio | | BlackRock Small Cap Growth Fund II |
Equity Fund | | BlackRock Large Cap Core Fund | | BlackRock Small Cap Index Fund |
BlackRock Energy & Resources Portfolio | | BlackRock Large Cap Core Plus Fund | | BlackRock S&P 500 Index Fund |
BlackRock Equity Dividend Fund | | BlackRock Large Cap Growth Fund | | BlackRock S&P 500 Stock Fund |
BlackRock EuroFund | | BlackRock Large Cap Value Fund | | BlackRock U.S. Opportunities Portfolio |
BlackRock Focus Growth Fund | | BlackRock Latin America Fund | | BlackRock Value Opportunities Fund |
BlackRock Global Allocation Fund | | BlackRock Managed Volatility Portfolio† | | BlackRock World Gold Fund |
BlackRock Global Dividend Income Portfolio† | | BlackRock Mid-Cap Growth Equity Portfolio | | |
| | | | |
Fixed Income Funds | | | | |
BlackRock Bond Index Fund | | BlackRock High Yield Bond Portfolio | | BlackRock Strategic Income |
BlackRock CoreAlpha Bond Fund | | BlackRock Inflation Protected Bond Portfolio | | Opportunities Portfolio |
BlackRock Core Bond Portfolio | | BlackRock International Bond Portfolio | | BlackRock Total Return Fund |
BlackRock Emerging Market Debt Portfolio | | BlackRock Long Duration Bond Portfolio | | BlackRock US Government Bond Portfolio |
BlackRock Floating Rate Income Portfolio | | BlackRock Low Duration Bond Portfolio | | BlackRock US Mortgage Portfolio |
BlackRock Global Long/Short Credit Fund | | BlackRock Multi-Asset Income Portfolio† | | BlackRock World Income Fund |
BlackRock GNMA Portfolio | | BlackRock Multi-Sector Bond Portfolio | | |
| | | | |
Municipal Bond Funds | | | | |
BlackRock California Municipal Bond Fund | | BlackRock National Municipal Fund | | BlackRock Pennsylvania Municipal Bond Fund |
BlackRock High Yield Municipal Fund | | BlackRock New Jersey Municipal Bond Fund | | BlackRock Short-Term Municipal Fund |
BlackRock Intermediate Municipal Fund | | BlackRock New York Municipal Bond Fund | | |
|
Target Risk & Target Date Funds† |
| | | | | | | | | | | | |
BlackRock Prepared Portfolios | | BlackRock Lifecycle Prepared Portfolios | | LifePath Portfolios | | LifePath Index Portfolios |
Conservative Prepared Portfolio | | 2015 | | 2035 | | Retirement | | 2040 | | Retirement | | 2040 |
Moderate Prepared Portfolio | | 2020 | | 2040 | | 2020 | | 2045 | | 2020 | | 2045 |
Growth Prepared Portfolio | | 2025 | | 2045 | | 2025 | | 2050 | | 2025 | | 2050 |
Aggressive Growth Prepared Portfolio | | 2030 | | 2050 | | 2030 | | 2055 | | 2030 | | 2055 |
| | | | | | 2035 | | | | 2035 | | |
† Mixed asset fund.
BlackRock mutual funds are currently distributed by BlackRock Investments, LLC. You should consider the investment objectives, risks, charges and expenses of the funds under consideration carefully before investing. Each fund’s prospectus contains this and other information and is available at www.blackrock.com or by calling (800) 441-7762 or from your financial advisor. The prospectus should be read carefully before investing.
| | | | |
| | | | |
72 | | BLACKROCK FUNDS | | MARCH 31, 2012 |
[THIS PAGE INTENTIONALLY LEFT BLANK.]
[THIS PAGE INTENTIONALLY LEFT BLANK.]
[THIS PAGE INTENTIONALLY LEFT BLANK.]
This report is transmitted to shareholders only. It is not authorized for use as an offer of sale or a solicitation of an offer to buy shares of the Funds unless accompanied or preceded by that Fund’s current prospectus. Past performance results shown in this report should not be considered a representation of future performance. Investment returns and principal value of shares will fluctuate so that shares, when redeemed, may be worth more or less than their original cost. Statements and other information herein are as dated and are subject to change.
Investment in foreign securities involves special risks including fluctuating foreign exchange rates, foreign government regulations, differing degrees of liquidity and the possibility of substantial volatility due to adverse political, economic or other developments.

EQUITY5-3/12-SAR
| | |

| | March 31, 2012 |
|
Semi-Annual Report (Unaudited) |
|
| BlackRock Managed Volatility Portfolio | of BlackRock FundsSM |
| | |
Not FDIC Insured n No Bank Guarantee n May Lose Value | | |
Table of Contents
| | | | | | |
| | | | | | | |
| | | | | | |
| 2 | | BLACKROCK MANAGED VOLATILITY PORTFOLIO | | MARCH 31, 2012 | | |
| | | | | | | | |
Dear Shareholder Twelve months ago, risk assets were charging forward, only to be met with a sharp reversal in May 2011 when escalating political strife in Greece rekindled fears about sovereign debt problems spreading across Europe. Concurrently, global economic indicators signaled that the recovery had slowed. Confidence was further shaken by the prolonged debt ceiling debate in Washington, DC. On August 5, 2011, Standard & Poor’s made history by downgrading the US government’s credit rating, and turmoil erupted in financial markets around the world. Extraordinary levels of volatility persisted in the months that followed as the European debt crisis intensified. Macro news flow became a greater influence on trading decisions than the fundamentals of the securities traded, resulting in high correlations between asset prices. By the end of the third quarter, equity markets had fallen nearly 20% from their April peak while safe-haven assets such as US Treasuries and gold had rallied to historic highs. October brought enough positive economic data to assuage fears of a global double-dip recession. Additionally, European leaders began to show progress toward stemming the region’s debt crisis. Investors began to reenter the markets, putting risk assets on the road to recovery. Improving investor sentiment carried over into the first several months of 2012. Debt problems in Europe stabilized as policymakers secured a bailout plan for Greece and completed the nation’s debt restructuring without significant market disruptions. While concerns about slowing growth in China and a European recession weighed on the outlook for the global economy, an acceleration of the US recovery lifted sentiment. Several consecutive months of stronger jobs data signaled solid improvement in the US labor market, a pivotal factor for economic growth. Meanwhile, the European Central Bank revived financial markets with additional liquidity through its long-term refinancing operations. The improving market conditions and generally better-than-expected economic news lured investors still holding cash on the sidelines back to risk assets. Stocks, commodities and high yield bonds rallied through the first two months of the year while rising Treasury yields pressured higher-quality fixed income assets. The rally softened in late March, however, as concerns about slowing growth in China were refueled by negative signals from the world’s second-largest economy. Additionally, concerns over the European debt crisis resurfaced given uncertainty around policies for sovereign debt financing in peripheral countries and rising yields in Portugal and Spain. Thanks in large part to an exceptionally strong first quarter of 2012, risk assets, including equities and high yield bonds, posted solid returns for the 6-month period ended March 31, 2012. On a 12-month basis, US large-cap stocks and high yield bonds delivered positive results, while small-cap stocks finished in slightly negative territory. International and emerging markets, which experienced significant downturns in 2011, lagged the broader rebound. Fixed income securities experienced mixed results, given recent volatility in yields. US Treasury bonds performed particularly well for the 12-month period; however, an early-2012 sell-off resulted in a negative return for the 6-month period. Municipal bonds staged a solid advance over the past year. Continued low short-term interest rates kept yields on money market securities near their all-time lows. While markets have improved in recent months, considerable headwinds remain. Europe faces a prolonged recession and the financial situations in Italy, Portugal and Spain remain worrisome. Higher oil and gasoline prices along with slowing growth in China and other emerging-market countries weigh heavily on the future of the global economy. But, we believe that with these challenges come opportunities. We remain committed to working with you and your financial professional to identify actionable ideas for your portfolio. We encourage you to visit www.blackrock.com/newworld for more information. Sincerely, 
Rob Kapito President, BlackRock Advisors, LLC | | | | 
|
| | “While markets have improved in recent months, considerable headwinds remain.” Rob Kapito President, BlackRock Advisors, LLC Total Returns as of March 31, 2012 |
| | | | | | 6-month | | 12-month |
| | | US large cap equities (S&P 500® Index) | | 25.89% | | 8.54% |
| | | US small cap equities (Russell 2000® Index) | | 29.83 | | (0.18) |
| | | International equities (MSCI Europe, Australasia, Far East Index) | | 14.56 | | (5.77) |
| | | Emerging market equities (MSCI Emerging Markets Index) | | 19.12 | | (8.81) |
| | | 3-month Treasury bill (BofA Merrill Lynch 3-Month Treasury Bill Index) | | 0.01 | | 0.06 |
| | | US Treasury securities (BofA Merrill Lynch 10- Year US Treasury Index) | | (1.05) | | 14.92 |
| | | US investment grade bonds (Barclays US Aggregate Bond Index) | | 1.43 | | 7.71 |
| | | Tax-exempt municipal bonds (S&P Municipal Bond Index) | | 4.16 | | 12.56 |
| | | US high yield bonds (Barclays US Corporate High Yield 2% Issuer Capped Index) | | 12.17 | | 6.43 |
| | Past performance is no guarantee of future results. Index performance is shown for illustrative purposes only. You cannot invest directly in an index. |
| | | | | | | | |
| | | | | | | | |
| | | | | | | | |
| | | | | | | | |
| | | | | | | | |
| | | | | | | | |
| | | | | | | | |
| | | | | | | | |
| | | | | | | | |
| | | | | | | | |
| | | | | | | | |
| | | | | | | | |
| | | | | | | | |
| | | | | | | | |
| | | | | | | | |
| | | | | | | | |
| | | | | | | | |
| | | | | | | | |
| | | | | | | | |
| | | | | | | | |
| | | | | | | | |
| | | | | | | | |
| | | | | | | | |
| | | | | | | | |
| | | | | | | | |
| | | | | | | | |
| | | | | | | | |
| | | | | | | | |
| | | | | | | | |
| | | | | | | | |
| | | | | | | | |
| | | | | | | | |
| | | | | | | | |
| | | | | | | | |
| | | | | | | | |
| | | | | | | | |
| | | | | | |
| | | | | | | |
| | | | | | |
| | THIS PAGE NOT PART OF YOUR FUND REPORT | | | | 3 |
Fund Summary as of March 31, 2012
BlackRock Managed Volatility Portfolio’s (the “Fund”) (formerly known as BlackRock Asset Allocation Portfolio) investment objective is to seek total return.
On February 28, 2012, the Board of Trustees (the “Board”) of BlackRock FundsSM (the “Trust”), approved a proposal to amend the Fund’s investment objective, from “to seek to maximize total return, consistent with income generation and prudent investment management” to “to seek total return,” and policies and to change the name of the Fund from “BlackRock Asset Allocation Portfolio” to “BlackRock Managed Volatility Portfolio.” The Fund will change one of the components making up the customized weighted index from the Barclays US Aggregate Bond Index to the Citigroup World Government Bond Index (the “Citi WGBI Hedged Index”). Fund management believes that the Citi WGBI Hedged Index better reflects the Fund’s increasing global exposure. These changes were effective on May 15, 2012.
|
Portfolio Management Commentary |
How did the Fund perform?
| — | | Effective October 1, 2011, the Fund changed the equity component of its reference benchmark against which the Fund measures its performance from the S&P 500® Index to the MSCI All Country World Index (“ACWI”). Management believes that the MSCI ACWI better reflects the Fund’s increased exposure to non-US equities. |
| — | | For the six-month period ended March 31, 2012, the Fund outperformed its reference benchmark (60% MSCI ACWI Index/40% Barclays US Aggregate Bond Index). Individually, the Fund underperformed the MSCI ACWI Index and outperformed the Barclays US Aggregate Bond Index. For the same period, the Fund underperformed its former reference benchmark (60% S&P 500® Index/40% Barclays US Aggregate Bond Index). The following discussion of relative performance pertains to the current reference benchmark. |
What factors influenced performance?
| — | | The Fund’s allocation shifts during the period, including increased exposure to equities and reduced exposure to fixed income and cash, had a positive impact on Fund performance as risk assets globally rallied over the period. |
| — | | Within the Fund’s equity allocation, sector biases toward information technology (“IT”) and energy contributed positively as both sectors performed particularly well during the period. Most notable was the Fund’s holding of the Technology Select Sector SPDR Fund, which soared 29% during the period. Also beneficial was the Fund’s overweight exposure to emerging-market stocks as they outperformed other equity classes in early 2012. |
| — | | Within the Fund’s fixed income allocation, the Fund’s allocation to high yield bonds, which are not represented in the benchmark index, boosted returns as the sector benefited from the global risk-asset rally and significantly outperformed the Barclays US Aggregate Bond Index during the period. |
| — | | Detracting from relative performance was the Fund’s cautious positioning at the beginning of the period as markets began to rally. |
| — | | The Fund held a significant position in cash in the first half of the period as a tactical method of reducing risk in the portfolio during what was a highly volatile period across global markets. The Fund’s elevated cash position proved beneficial early in the period; however, the position detracted from relative performance in December 2011 as risk assets rebounded. As market volatility normalized in the first quarter of 2012, the Fund’s cash allocation was reduced significantly as cash was put to work within equities as markets rallied around the globe. |
Describe recent portfolio activity.
| — | | During the six-month period, the Fund increased exposure to equities while reducing its allocations to fixed income and cash. |
| — | | Within equities, the Fund tactically traded exposure to emerging markets throughout the period. Having underperformed developed markets in 2011, emerging-market stock valuations were particularly compelling coming into 2012, at which time the Fund increased exposure. Emerging-market stocks rallied strongly throughout January and early February, significantly outperforming developed market stocks. The Fund took profits on its emerging-market holdings in March as valuations grew less compelling and slower economic growth in China became increasingly concerning. The proceeds from these sales were used to increase exposure to US and Japanese equities as fundamentals appeared relatively more attractive for those economies. In the US equity space, the Fund maintained its preference for IT stocks as companies in the sector have recently shown very strong balance sheets, demand for technology products remains robust and prospects for growth continue to look positive. The Fund also continued to favor the energy sector for its attractive fundamentals. |
| ��� | | In fixed income, the Fund diversified its exposure by adding an out-of-index allocation to high yield bonds given their attractive yields and fundamentals in the low interest rate environment. |
Describe portfolio positioning at period end.
| — | | The Fund ended the period overweight relative to its reference benchmark in equities and underweight in fixed income, with a small allocation to cash and cash equivalents. |
The views expressed reflect the opinions of BlackRock as of the date of this report and are subject to change based on changes in market, economic or other conditions. These views are not intended to be a forecast of future events and are no guarantee of future results.
| | |
| | | Percent of |
| | | Long-Term |
| Ten Largest Holdings | | Investments |
|
Fannie Mae | | 13% |
Technology Select Sector SPDR Fund | | 6 |
U.S. Treasury Bonds | | 5 |
U.S. Treasury Notes | | 5 |
Ginnie Mae | | 3 |
iShares iBoxx $ High Yield Corporate Bonds Fund | | 2 |
Energy Select Sector SPDR Fund | | 2 |
Apple, Inc | | 1 |
Freddie Mac | | 1 |
Morgan Stanley Capital I | | 1 |
|
| | |
| | | Percent of |
| | | Long-Term |
| Portfolio Composition | | Investments |
|
Common Stocks | | 42% |
U.S. Government Sponsored Agency Securities | | 17 |
Corporate Bonds | | 11 |
Investment Companies | | 10 |
U.S. Treasury Obligations | | 10 |
Non-Agency Mortgage-Backed Securities | | 5 |
Asset-Backed Securities | | 3 |
Foreign Government Obligations | | 1 |
Foreign Agency Obligations | | 1 |
|
| | | | | | |
| | | | | | | |
| | | | | | |
| 4 | | BLACKROCK MANAGED VOLATILITY PORTFOLIO | | MARCH 31, 2012 | | |
|
Total Return Based on a $10,000 Investment |
| | | | |
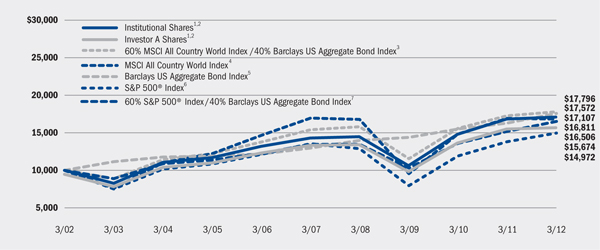
| | 1 | | Assuming maximum sales charges, if any, transaction costs and other operating expenses, including investment advisory fees. Institutional Shares do not have a sales charge. |
| | 2 | | The Fund uses an asset allocation strategy, investing varying percentages of its portfolio in three major categories: stocks, bonds and, to a lesser extent, money market instruments. |
| | 3 | | This customized weighted index is comprised of the returns of the MSCI All Country World Index (60%) and Barclays US Aggregate Bond Index (40%). |
| | 4 | | This is a free float-adjusted market capitalization weighted index designed to measure the equity market performance of developed and emerging markets. |
| | 5 | This unmanaged market-weighted index is comprised of investment grade corporate bonds (rated BBB or better), mortgages and US Treasury and government agency issues with at least one year to maturity. |
| | 6 | This unmanaged index covers 500 industrial, utility, transportation and financial companies of the US markets (mostly New York Stock Exchange (“NYSE”) issues) representing about 75% of NYSE market capitalization and 30% of NYSE issues. |
| | 7 | This customized weighted index is comprised of the returns of the S&P 500® Index (60%) and Barclays US Aggregate Bond Index (40%). |
|
Performance Summary for the Period Ended March 31, 2012 |
| | | | | | | | | | | | | | |
| | | | | Average Annual Total Returns6 |
| | | | | 1 Year | | 5 Years | | 10 Years |
| | | 6-Month
Total Returns | | w/o sales charge | | w/ sales
charge | | w/o sales
charge | | w/ sales
charge | | w/o sales
charge | | w/ sales
charge |
Institutional | | 13.41% | | 1.51% | | N/A | | 3.67% | | N/A | | 5.52% | | N/A |
Service | | 13.28 | | 1.23 | | N/A | | 3.40 | | N/A | | 5.25 | | N/A |
Investor A | | 13.27 | | 1.20 | | (4.09)% | | 3.32 | | 2.21% | | 5.16 | | 4.60% |
Investor B | | 12.73 | | 0.35 | | (4.05) | | 2.48 | | 2.13 | | 4.53 | | 4.53 |
Investor C | | 12.84 | | 0.49 | | (0.49) | | 2.58 | | 2.58 | | 4.41 | | 4.41 |
60% MSCI All Country World Index/40% Barclays US Aggregate Bond Index | | 12.36 | | 3.04 | | N/A | | 2.90 | | N/A | | 5.93 | | N/A |
MSCI All Country World Index | | 19.91 | | (0.73) | | N/A | | (0.19) | | N/A | | 5.33 | | N/A |
Barclays US Aggregate Bond Index | | 1.43 | | 7.71 | | N/A | | 6.25 | | N/A | | 5.80 | | N/A |
S&P 500® Index | | 25.89 | | 8.54 | | N/A | | 2.01 | | N/A | | 4.12 | | N/A |
60% S&P 500® Index/40% Barclays US Aggregate Bond Index | | 15.67 | | 8.58 | | N/A | | 4.15 | | N/A | | 5.14 | | N/A |
| | 8 | Assuming maximum sales charge, if any. Average annual total returns with and without sales charges reflect reductions for distribution and service fees. See “About Fund Performance” on page 6 for a detailed description of share classes, including any related sales charges and fees. |
N/A - Not applicable as share class and index do not have a sales charge.
Past performance is not indicative of future results.
| | | | | | | | | | | | | | | | | | | | |
| | | Actual | | | | Hypothetical11 |
| | | | | | | Including
Interest
Expense | | Excluding
Interest
Expense | | | | | | Including Interest Expense | | Excluding Interest Expense |
| | | | | | | and Fees | | and Fees | | | | | | and Fees | | and Fees |
| | | Beginning | | Ending | | | | | | | | Beginning | | Ending | | | | Ending | | |
| | | Account
Value
October 1,
2011 | | Account Value
March 31,
2012 | | Expenses
Paid During
the Period9 | | Expenses
Paid During
the Period10 | | | | Account
Value
October 1,
2011 | | Account
Value
March 31,
2012 | | Expenses
Paid During
the Period9 | | Account
Value
March 31,
2012 | | Expenses
Paid During
the Period10 |
Institutional | | $1,000.00 | | $1,134.10 | | $ 4.80 | | $ 4.75 | | | | $1,000.00 | | $1,020.50 | | $ 4.55 | | $1,020.55 | | $ 4.50 |
Service | | $1,000.00 | | $1,132.80 | | $ 6.29 | | $ 6.24 | | | | $1,000.00 | | $1,019.10 | | $ 5.96 | | $1,019.15 | | $ 5.91 |
Investor A | | $1,000.00 | | $1,132.70 | | $ 6.45 | | $ 6.40 | | | | $1,000.00 | | $1,018.95 | | $ 6.11 | | $1,019.00 | | $ 6.06 |
Investor B | | $1,000.00 | | $1,127.30 | | $11.06 | | $11.01 | | | | $1,000.00 | | $1,014.60 | | $10.48 | | $1,014.65 | | $10.43 |
Investor C | | $1,000.00 | | $1,128.40 | | $10.22 | | $10.16 | | | | $1,000.00 | | $1,015.40 | | $ 9.67 | | $1,015.45 | | $ 9.62 |
| | 9 | For each class of the Fund, expenses are equal to the annualized expense ratio for the class (0.90% for Institutional, 1.18% for Service, 1.21% for Investor A, 2.08% for Investor B and 1.92% for Investor C), multiplied by the average account value over the period, multiplied by 183/366 (to reflect the one-half year period shown). |
| | 10 | For each class of the Fund, expenses are equal to the annualized expense ratio for the class (0.89% for Institutional, 1.17% for Service, 1.20% for Investor A, 2.07% for Investor B and 1.91% for Investor C), multiplied by the average account value over the period, multiplied by 183/366 (to reflect the one-half year period shown). |
| | 11 | Hypothetical 5% annual return before expenses is calculated by pro rating the number of days in the most recent fiscal half year divided by 366. |
| | | See “Disclosure of Expenses” on page 6 for further information on how expenses were calculated. |
| | | | | | |
| | | | | | | |
| | | | | | |
| | BLACKROCK MANAGED VOLATILITY PORTFOLIO | | MARCH 31, 2012 | | 5 |
About Fund Performance
| — | | Institutional Shares are not subject to any sales charge. Institutional Shares bear no ongoing distribution or service fees and are available only to eligible investors. |
| — | | Service Shares are not subject to any sales charge (front-end load) or deferred sales charge. Service Shares are subject to a service fee of 0.25% per year (but no distribution fee). Prior to January 28, 2005, Service Shares’ performance results are those of Institutional Shares (which have no distribution or service fees) restated to reflect Service Shares’ fees. |
| — | | Investor A Shares incur a maximum initial sales charge (front-end load) of 5.25% and a service fee of 0.25% per year (but no distribution fee). |
| — | | Investor B Shares are subject to a maximum contingent deferred sales charge (“CDSC”) of 4.50% declining to 0% after six years. In addition, Investor B Shares are subject to a distribution fee of 0.75% per year and a service fee of 0.25% per year. Investor B Shares automatically convert to Investor A Shares after approximately eight years. (There is no initial sales charge for automatic share conversions.) All returns for periods greater than eight years reflect this conversion. Investor B Shares are only available through exchanges, dividend reinvestment by existing shareholders or for purchase by certain qualified employee benefit plans. |
| — | | Investor C Shares are subject to a 1.00% CDSC if redeemed within one year of purchase. In addition, Investor C Shares are subject to a distribution fee of 0.75% per year and a service fee of 0.25% per year. |
Performance information reflects past performance and does not guarantee future results. Current performance may be lower or higher than the performance data quoted. Refer to www.blackrock.com/funds to obtain performance data current to the most recent month-end. Performance results do not reflect the deduction of taxes that a shareholder would pay on Fund distributions or the redemption of Fund shares. Figures shown in the performance tables on the previous page assume reinvestment of all dividends and distributions, if any, at net asset value (“NAV”) on the ex-dividend date. Investment return and principal value of shares will fluctuate so that shares, when redeemed, may be worth more or less than their original cost.
Performance for the Fund for the periods prior to January 31, 2005 is based on performance of a certain former State Street Research mutual fund that reorganized with the Fund on that date.
The Fund’s investment advisor, BlackRock Advisors, LLC (the “Manager”), waived and/or reimbursed a portion of the Fund’s expenses. Without such waiver and/or reimbursement, the Fund’s performance would have been lower. The Manager is under no obligation to waive or reimburse or to continue waiving or reimbursing its fees after the applicable termination date. See Note 3 of the Notes to Financial Statements for additional information on waivers and reimbursements. Dividends paid to each class of shares will vary because of the different levels of service, distribution and transfer agency fees applicable to each class, which are deducted from the income available to be paid to shareholders.
Disclosure of Expenses
Shareholders of the Fund may incur the following charges: (a) expenses related to transactions, including sales charges and exchange fees; and (b) operating expenses, including investment advisory fees, service and distribution fees, including 12b-1 fees, acquired fund fees and expenses and other Fund expenses. The expense example on the previous page (which is based on a hypothetical investment of $1,000 invested on October 1, 2011 and held through March 31, 2012) is intended to assist shareholders both in calculating expenses based on an investment in the Fund and in comparing these expenses with similar costs of investing in other mutual funds.
The table provides information about actual account values and actual expenses. In order to estimate the expenses a shareholder paid during the period covered by this report, shareholders can divide their account value by $1,000 and then multiply the result by the number corresponding to their share class under the heading entitled “Expenses Paid During the Period.”
The table also provides information about hypothetical account values and hypothetical expenses based on the Fund’s actual expense ratio and an assumed rate of return of 5% per year before expenses. In order to assist shareholders in comparing the ongoing expenses of investing in the Fund and other funds, compare the 5% hypothetical example with the 5% hypothetical examples that appear in other funds’ shareholder reports.
The expenses shown in the table are intended to highlight shareholders’ ongoing costs only and do not reflect any transactional expenses, such as sales charges or exchange fees, if any. Therefore, the hypothetical examples are useful in comparing ongoing expenses only, and will not help shareholders determine the relative total expenses of owning different funds. If these transactional expenses were included, shareholder expenses would have been higher.
| | | | | | |
| | | | | | | |
| | | | | | |
| 6 | | BLACKROCK MANAGED VOLATILITY PORTFOLIO | | MARCH 31, 2012 | | |
The Benefits and Risks of Leveraging
The Fund may utilize leverage to seek to enhance its yield and NAV. However, these objectives cannot be achieved in all interest rate environments.
The Fund may utilize leverage through entering into reverse repurchase agreements and treasury roll transactions. In general, the concept of leveraging is based on the premise that the financing cost of assets to be obtained from leverage, which will be based on short-term interest rates, will normally be lower than the income earned by the Fund on its longer-term portfolio investments. To the extent that the total assets of the Fund (including the assets obtained through leverage) are invested in higher-yielding portfolio investments, the Fund’s shareholders will benefit from the incremental net income.
The interest earned on securities purchased with the proceeds from leverage is paid to shareholders in the form of dividends, and the value of these portfolio holdings is reflected in the per share NAV. However, in order to benefit shareholders, the yield curve must be positively sloped; that is, short-term interest rates must be lower than long-term interest rates. If the yield curve becomes negatively sloped, meaning short-term interest rates exceed long-term interest rates, income to shareholders will be lower than if the Fund had not used leverage.
If short-term interest rates rise, narrowing the differential between short-term and long-term interest rates, the incremental net income pickup will be reduced or eliminated completely. Furthermore, if prevailing short-term interest rates rise above long-term interest rates, the yield curve has a negative slope. In this case, the Fund pays higher short-term interest rates whereas the Fund’s total portfolio earns income based on lower long-term interest rates.
Furthermore, the value of the Fund’s portfolio investments generally varies inversely with the direction of long-term interest rates, although other factors can influence the value of portfolio investments. As a result, changes in interest rates can influence the Fund’s NAV positively or negatively in addition to the impact on the Fund’s performance from leverage and borrowings discussed above.
The use of leverage may enhance opportunities for increased income to the Fund, but as described above, it also creates risks as short- or long-term interest rates fluctuate. Leverage also will generally cause greater changes in the Fund’s NAVs and dividend rates than comparable portfolios without leverage. If the income derived from securities purchased with assets received from leverage exceeds the cost of leverage, the Fund’s net income will be greater than if leverage had not been used. Conversely, if the income from the securities purchased is not sufficient to cover the cost of leverage, the Fund’s net income will be less than if leverage had not been used, and therefore the amount available for distribution to shareholders will be reduced. The Fund may be required to sell portfolio securities at inopportune times or at distressed values in order to comply with regulatory requirements applicable to the use of leverage or as required by the terms of leverage instruments, which may cause the Fund to incur losses. The use of leverage may limit the Fund’s ability to invest in certain types of securities or use certain types of hedging strategies. The Fund will incur expenses in connection with the use of leverage, all of which are borne by Fund shareholders and may reduce income.
Derivative Financial Instruments
The Fund may invest in various derivative financial instruments, including financial futures contracts, foreign currency exchange contracts, options and swaps as specified in Note 2 of the Notes to Financial Statements, which may constitute forms of economic leverage. Such derivative financial instruments are used to obtain exposure to a market without owning or taking physical custody of securities or to hedge market, equity, credit, interest rate, foreign currency exchange rate and/or other risks. Derivative financial instruments involve risks, including the imperfect correlation between the value of a derivative financial instrument and the underlying asset, possible default of the counterparty to the transaction or illiquidity of the derivative financial instrument. The Fund’s ability to
use a derivative financial instrument successfully depends on the investment advisor’s ability to predict pertinent market movements accurately, which cannot be assured. The use of derivative financial instruments may result in losses greater than if they had not been used, may require the Fund to sell or purchase portfolio investments at inopportune times or for distressed values, may limit the amount of appreciation the Fund can realize on an investment, may result in lower dividends paid to shareholders or may cause the Fund to hold an investment that it might otherwise sell. The Fund’s investments in these instruments are discussed in detail in the Notes to Financial Statements.
| | | | | | |
| | | | | | | |
| | | | | | |
| | BLACKROCK MANAGED VOLATILITY PORTFOLIO | | MARCH 31, 2012 | | 7 |
| | |
| Schedule of Investments March 31, 2012 (Unaudited) | | (Percentages shown are based on Net Assets) |
| | | | | | | | |
| Asset-Backed Securities | | Par (000) | | | Value | |
| |
321 Henderson Receivables I LLC: | | | | | | | | |
Series 2010-1A, Class A, 5.56%, 8/15/35 (a) | | USD | 586 | | | $ | 637,731 | |
Series 2010-2A, Class A, 4.07%, 1/15/28 (a) | | | 436 | | | | 444,459 | |
Series 2010-3A, Class A, 3.82%, 1/15/32 (a) | | | 451 | | | | 450,364 | |
Series 2012-1A, Class A, 4.21%, 8/15/41 (a) | | | 250 | | | | 252,265 | |
AEP Texas Central Transition Funding LLC, Series 2012-1, Class A3, 2.84%, 12/01/24 | | | 560 | | | | 553,212 | |
AH Mortgage Advance Trust, Series SART-3, Class 1A1, 2.98%, 3/13/13 (a) | | | 305 | | | | 305,282 | |
AmeriCredit Automobile Receivables Trust: | | | | | | | | |
Series 2011-2, Class C, 3.19%, 10/12/16 | | | 30 | | | | 30,974 | |
Series 2011-5, Class C, 3.44%, 10/08/15 | | | 190 | | | | 193,762 | |
Amortizing Residential Collateral Trust, Series 2002-BC5, Class M2, 2.04%, 7/25/32 (b) | | | 11 | | | | 3,820 | |
CarMax Auto Owner Trust: | | | | | | | | |
Series 2012-1, Class B, 1.76%, 1/15/16 | | | 105 | | | | 104,557 | |
Series 2012-1, Class C, 2.20%, 1/15/16 | | | 60 | | | | 59,736 | |
Series 2012-1, Class D, 3.09%, 1/15/16 | | | 75 | | | | 74,676 | |
CenterPoint Energy Transition Bond Co. LLC, Series 2012-1, Class A3, 3.03%, 10/15/24 | | | 545 | | | | 548,633 | |
Centex Home Equity, Series 2003-B, Class M3, 3.34%, 6/25/33 (b) | | | 101 | | | | 41,512 | |
Conseco Financial Corp., Series 1996-7, Class A6, 7.65%, 10/15/27 (b) | | | 22 | | | | 22,699 | |
Countrywide Asset-Backed Certificates: | | | | | | | | |
Series 2003-2, Class M2, 2.72%, 3/26/33 (b) | | | 123 | | | | 11,711 | |
Series 2003-3, Class M6, 4.63%, 7/25/32 (b) | | | 3 | | | | 444 | |
Series 2003-BCI, Class M2, 3.24%, 9/25/32 (b) | | | 35 | | | | 13,516 | |
DT Auto Owner Trust, Series 2011-3A, Class C, 4.03%, 2/15/14 (a) | | | 250 | | | | 250,088 | |
Ford Credit Floorplan Master Owner Trust: | | | | | | | | |
Series 2010-5, Class C, 2.07%, 9/15/13 (a) | | | 150 | | | | 151,092 | |
Series 2010-5, Class D, 2.41%, 9/15/13 (a) | | | 80 | | | | 80,572 | |
Series 2011-2, Class C, 2.37%, 9/15/13 | | | 190 | | | | 190,302 | |
Series 2011-2, Class D, 2.86%, 9/15/13 | | | 135 | | | | 135,204 | |
Series 2012-1, Class B, 1.14%, 1/15/14 (b) | | | 100 | | | | 100,023 | |
Series 2012-1, Class C, 1.74%, 1/15/14 (b) | | | 230 | | | | 230,104 | |
Series 2012-1, Class D, 2.34%, 1/15/14 (b) | | | 215 | | | | 215,137 | |
| | | | | | | | |
| Asset-Backed Securities | | Par (000) | | | Value | |
| |
Series 2012-2, Class B, 2.32%, 1/15/17 | | USD | 120 | | | $ | 119,497 | |
Series 2012-2, Class C, 2.86%, 1/15/17 | | | 100 | | | | 99,372 | |
Series 2012-2, Class D, 3.51%, 1/15/17 | | | 100 | | | | 99,377 | |
Globaldrive BV, Series 2008-2, Class A, 4.00%, 10/20/16 | | EUR | 110 | | | | 148,479 | |
GSAA Trust, Series 2005-11, Class 2A1, 0.52%, 10/25/35 (b) | | USD | 646 | | | | 489,629 | |
Home Equity Asset Trust, Series 2007-2, Class 2A1, 0.35%, 7/25/37 (b) | | | 56 | | | | 54,692 | |
Hyundai Auto Receivables Trust, Series 2012-A, Class D, 2.61%, 3/15/16 | | | 135 | | | | 134,637 | |
Long Beach Mortgage Loan Trust: | | | | | | | | |
Series 2003-4, Class M5A, 6.24%, 8/25/33 (b) | | | 18 | | | | 8,533 | |
Series 2004-1, Class M5, 1.89%, 2/25/34 (b) | | | 74 | | | | 46,888 | |
Nelnet Student Loan Trust, Series 2008-3, Class A4, 2.14%, 11/25/17 (b) | | | 300 | | | | 309,224 | |
Option One Mortgage Loan Trust: | | | | | | | | |
Series 2002-6, Class M1, 1.37%, 11/25/32 (b) | | | 16 | | | | 10,449 | |
Series 2003-4, Class A2, 0.88%, 7/25/33 (b) | | | 50 | | | | 38,897 | |
Series 2003-4, Class M5A, 5.87%, 7/25/33 (b) | | | 19 | | | | 4,195 | |
Series 2003-5, Class M4, 4.59%, 8/25/33 (b) | | | 20 | | | | 5,229 | |
PFS Financing Corp., Series 2012-AA, Class A, 1.44%,
2/17/14 (a)(b) | | | 230 | | | | 230,023 | |
Residential Asset Mortgage Products, Inc., Series 2007-RS2, Class A1, 0.36%, 7/25/29 (b) | | | 30 | | | | 29,457 | |
Residential Asset Securities Corp., Series 2002-KS4, Class AIIB, 0.74%, 7/25/32 (b) | | | 26 | | | | 14,541 | |
Santander Consumer Acquired Receivables Trust: | | | | | | | | |
Series 2011-S1A, Class B, 1.66%, 6/15/13 (a)(b) | | | 246 | | | | 244,350 | |
Series 2011-S1A, Class C, 2.01%, 6/15/13 (a) | | | 212 | | | | 210,251 | |
Series 2011-WO, Class C, 3.19%, 8/15/14 (a) | | | 320 | | | | 319,485 | |
Santander Drive Auto Receivables Trust: | | | | | | | | |
Series 2010-2, Class B, 2.24%, 12/15/14 | | | 460 | | | | 461,765 | |
Series 2010-2, Class C, 3.89%, 7/17/17 | | | 540 | | | | 551,869 | |
Series 2010-B, Class B, 2.10%, 9/15/14 (a) | | | 385 | | | | 386,982 | |
Series 2010-B, Class C, 3.02%, 10/17/16 (a) | | | 405 | | | | 402,495 | |
Series 2011-1, Class D, 4.01%, 2/15/17 | | | 500 | | | | 501,678 | |
Series 2011-S1A, Class B, 1.48%, 7/15/13 (a) | | | 189 | | | | 188,840 | |
| | | | | | | | |
| To simplify the listings of portfolio holdings in the Schedule of Investments, the names and descriptions of many of the securities have been abbreviated according to the following list: | | ADR | | American Depositary Receipts | | LIBOR | | London Interbank Offered Rate |
| | AUD | | Australian Dollar | | PHP | | Philippine Peso |
| | CAD | | Canadian Dollar | | RB | | Revenue Bonds |
| | CHF | | Swiss Franc | | SGD | | Singapore Dollar |
| | EUR | | Euro | | SPDR | | Standard & Poor’s Depositary |
| | GBP | | British Pound | | | | Receipts |
| | HKD | | Hong Kong Dollar | | TBA | | To-Be-Announced |
| See Notes to Financial Statements. | | JPY | | Japanese Yen | | USD | | US Dollar |
| | | | | | |
| | | | | | | |
| | | | | | |
| 8 | | BLACKROCK MANAGED VOLATILITY PORTFOLIO | | MARCH 31, 2012 | | |
| | |
| Schedule of Investments (continued) | | (Percentages shown are based on Net Assets) |
| | | | | | | | |
| Asset-Backed Securities | | Par (000) | | | Value | |
| |
Series 2011-S1A, Class D, 3.10%, 3/15/13 (a) | | USD | 204 | | | $ | 203,948 | |
Series 2012-1, Class B, 2.72%, 8/15/14 | | | 120 | | | | 122,025 | |
Series 2012-1, Class C, 3.78%, 6/15/15 | | | 160 | | | | 163,683 | |
Series 2012-2, Class C, 3.20%, 9/15/15 | | | 430 | | | | 430,937 | |
Series 2012-2, Class D, 3.87%, 1/15/16 | | | 255 | | | | 255,864 | |
Scholar Funding Trust, Series 2011-A, Class A, 1.45%, 7/28/34 (a)(b) | | | 267 | | | | 256,544 | |
SLM Student Loan Trust: | | | | | | | | |
Series 2004-B, Class A2, 0.67%, 6/15/21 (b) | | | 300 | | | | 287,381 | |
Series 2008-5, Class A3, 1.86%, 1/25/18 (b) | | | 245 | | | | 250,263 | |
Series 2008-5, Class A4, 2.26%, 7/25/23 (b) | | | 445 | | | | 460,918 | |
Series 2012-A, Class A1, 1.64%, 4/15/16 (a)(b) | | | 174 | | | | 174,720 | |
Series 2012-A, Class A2, 3.83%, 3/15/18 (a) | | | 170 | | | | 169,426 | |
| |
| |
Total Asset-Backed Securities – 2.3% | | | | 12,988,418 | |
| |
| |
Collateralized Debt Obligations | | | | |
| |
Knollwood Ltd., Series 2004-1A, Class C, 3.59%, 1/10/39 (a)(b) | | | 124 | | | | – | |
Morgan Stanley, Series 2007-XLC1, Class A2 0.56%, 7/17/17 (b) | | | 297 | | | | 279,325 | |
| |
| |
Total Collateralized Debt Obligations – 0.0% | | | | 279,325 | |
| |
| |
Common Stocks | | Shares | | | | |
| |
Aerospace & Defense – 1.6% | | | | | |
Alliant Techsystems, Inc. | | | 4,900 | | | | 245,588 | |
The Boeing Co. | | | 33,600 | | | | 2,498,832 | |
General Dynamics Corp. | | | 12,400 | | | | 909,912 | |
L-3 Communications Holdings, Inc. | | | 10,700 | | | | 757,239 | |
Lockheed Martin Corp. | | | 8,100 | | | | 727,866 | |
Northrop Grumman Corp. | | | 14,200 | | | | 867,336 | |
Precision Castparts Corp. | | | 4,800 | | | | 829,920 | |
Raytheon Co. | | | 5,800 | | | | 306,124 | |
TransDigm Group, Inc. (c) | | | 7,810 | | | | 904,086 | |
United Technologies Corp. | | | 10,200 | | | | 845,988 | |
| | | | | | | | |
| | |
| | | | | | | 8,892,891 | |
| |
Airlines – 0.1% | | | | | | | | |
Copa Holdings SA, Class A | | | 8,200 | | | | 649,440 | |
| |
Auto Components – 0.2% | | | | | |
Allison Transmission Holdings, Inc. (c) | | | 11,200 | | | | 267,456 | |
BorgWarner, Inc. (c) | | | 3,800 | | | | 320,492 | |
Lear Corp. | | | 5,400 | | | | 251,046 | |
| | | | | | | | |
| | |
| | | | | | | 838,994 | |
| |
Automobiles – 0.4% | | | | | | | | |
Daimler AG | | | 11,892 | | | | 717,051 | |
Nissan Motor Co. Ltd. | | | 104,300 | | | | 1,110,164 | |
Tesla Motors, Inc. (c)(d) | | | 14,100 | | | | 525,084 | |
| | | | | | | | |
| | |
| | | | | | | 2,352,299 | |
| |
| | | | | | | | |
Common Stocks | | Shares | | | Value | |
| |
Beverages – 0.7% | | | | | | | | |
Anheuser-Busch InBev NV | | | 19,530 | | | $ | 1,426,871 | |
The Coca-Cola Co. | | | 23,998 | | | | 1,776,092 | |
Constellation Brands, Inc., Class A (c) | | | 28,900 | | | | 681,751 | |
PepsiCo, Inc. | | | 4,100 | | | | 272,035 | |
| | | | | | | | |
| | |
| | | | | | | 4,156,749 | |
| |
Biotechnology – 0.4% | | | | | | | | |
Biogen Idec, Inc. (c) | | | 7,500 | | | | 944,775 | |
Celgene Corp. (c) | | | 9,200 | | | | 713,184 | |
Gilead Sciences, Inc. (c) | | | 6,800 | | | | 332,180 | |
| | | | | | | | |
| | |
| | | | | | | 1,990,139 | |
| |
Capital Markets – 0.7% | | | | | | | | |
Ares Capital Corp. | | | 30,939 | | | | 505,853 | |
Eaton Vance Corp. | | | 3,428 | | | | 97,972 | |
Federated Investors, Inc., Class B (d) | | | 21,324 | | | | 477,871 | |
The Goldman Sachs Group, Inc. | | | 6,600 | | | | 820,842 | |
Jefferies Group, Inc. | | | 33,900 | | | | 638,676 | |
UBS AG | | | 77,507 | | | | 1,086,145 | |
Waddell & Reed Financial, Inc., Class A | | | 16,609 | | | | 538,298 | |
| | | | | | | | |
| | |
| | | | | | | 4,165,657 | |
| |
Chemicals – 1.2% | | | | | | | | |
Celanese Corp. | | | 16,500 | | | | 761,970 | |
CF Industries Holdings, Inc. | | | 4,000 | | | | 730,600 | |
Cytec Industries, Inc. | | | 11,300 | | | | 686,927 | |
E.I. du Pont de Nemours & Co. | | | 13,261 | | | | 701,507 | |
LG Chem Ltd. | | | 2,188 | | | | 714,496 | |
Linde AG | | | 8,220 | | | | 1,475,081 | |
Monsanto Co. | | | 14,425 | | | | 1,150,538 | |
Nitto Denko Corp. | | | 19,800 | | | | 797,789 | |
| | | | | | | | |
| | |
| | | | | | | 7,018,908 | |
| |
Commercial Banks – 1.0% | | | | | |
BNP Paribas SA | | | 12,808 | | | | 607,696 | |
China Construction Bank Corp., H Shares | | | 1,067,000 | | | | 824,410 | |
HSBC Holdings Plc | | | 141,928 | | | | 1,259,463 | |
ICICI Bank Ltd. - ADR | | | 20,900 | | | | 728,783 | |
Kasikornbank PCL | | | 116,500 | | | | 581,556 | |
Standard Chartered Plc | | | 33,326 | | | | 831,551 | |
Wells Fargo & Co. | | | 30,700 | | | | 1,048,098 | |
| | | | | | | | |
| | |
| | | | | | | 5,881,557 | |
| |
Commercial Services & Supplies – 0.2% | | | | | |
Corrections Corp. of America | | | 28,500 | | | | 778,335 | |
Pitney Bowes, Inc. | | | 22,468 | | | | 394,987 | |
| | | | | | | | |
| | |
| | | | | | | 1,173,322 | |
| |
Communications Equipment – 0.5% | | | | | |
F5 Networks, Inc. (c) | | | 2,100 | | | | 283,416 | |
QUALCOMM, Inc. | | | 39,500 | | | | 2,686,790 | |
| | | | | | | | |
| | |
| | | | | | | 2,970,206 | |
| |
Computers & Peripherals – 2.1% | | | | | |
Apple, Inc. | | | 10,827 | | | | 6,490,462 | |
Dell, Inc. (c) | | | 43,500 | | | | 722,100 | |
Diebold, Inc. | | | 15,576 | | | | 599,988 | |
EMC Corp. (c) | | | 9,376 | | | | 280,155 | |
Fusion-io, Inc. (c)(d) | | | 11,446 | | | | 325,181 | |
Hewlett-Packard Co. | | | 8,000 | | | | 190,640 | |
See Notes to Financial Statements.
| | | | | | |
| | | | | | | |
| | | | | | |
| | BLACKROCK MANAGED VOLATILITY PORTFOLIO | | MARCH 31, 2012 | | 9 |
| | |
| Schedule of Investments (continued) | | (Percentages shown are based on Net Assets) |
| | | | | | | | |
| Common Stocks | | Shares | | | Value | |
| |
Computers & Peripherals (concluded) | | | | | | | | |
Lexmark International, Inc., Class A | | | 20,800 | | | $ | 691,392 | |
NetApp, Inc. (c) | | | 18,600 | | | | 832,722 | |
QLogic Corp. (c) | | | 36,600 | | | | 650,016 | |
Seagate Technology Plc | | | 24,200 | | | | 652,190 | |
Western Digital Corp. (c) | | | 18,300 | | | | 757,437 | |
| | | | | | | | |
| | |
| | | | | | | 12,192,283 | |
| |
Construction & Engineering – 0.2% | |
Chicago Bridge & Iron Co. NV | | | 15,200 | | | | 656,488 | |
URS Corp. | | | 15,700 | | | | 667,564 | |
| | | | | | | | |
| | |
| | | | | | | 1,324,052 | |
| |
Consumer Finance – 0.1% | |
Discover Financial Services | | | 24,600 | | | | 820,164 | |
| |
Containers & Packaging – 0.1% | |
Sonoco Products Co. | | | 9,265 | | | | 307,598 | |
| |
Distributors – 0.1% | | | | | | | | |
Genuine Parts Co. | | | 11,205 | | | | 703,114 | |
| |
Diversified Consumer Services – 0.2% | |
Career Education Corp. (c)(d) | | | 36,800 | | | | 296,608 | |
Education Management Corp. (c) | | | 14,200 | | | | 194,398 | |
H&R Block, Inc. | | | 42,287 | | | | 696,467 | |
| | | | | | | | |
| | |
| | | | | | | 1,187,473 | |
| |
Diversified Financial Services – 0.6% | |
ING Groep NV (c) | | | 70,223 | | | | 585,075 | |
JPMorgan Chase & Co. | | | 51,200 | | | | 2,354,176 | |
The NASDAQ OMX Group, Inc. (c) | | | 25,500 | | | | 660,450 | |
| | | | | | | | |
| | |
| | | | | | | 3,599,701 | |
| |
Diversified Telecommunication Services – 0.6% | |
AT&T Inc. | | | 13,400 | | | | 418,482 | |
CenturyLink, Inc. | | | 12,869 | | | | 497,387 | |
Frontier Communications Corp. | | | 58,731 | | | | 244,908 | |
Level 3 Communications, Inc. (c) | | | 6,600 | | | | 169,818 | |
Verizon Communications, Inc. | | | 41,998 | | | | 1,605,584 | |
Windstream Corp. | | | 40,560 | | | | 474,958 | |
| | | | | | | | |
| | |
| | | | | | | 3,411,137 | |
| |
Electric Utilities – 0.2% | |
FirstEnergy Corp. | | | 2,235 | | | | 101,894 | |
Hawaiian Electric Industries, Inc. | | | 9,795 | | | | 248,303 | |
Pepco Holdings, Inc. | | | 17,796 | | | | 336,166 | |
Progress Energy, Inc. | | | 12,274 | | | | 651,872 | |
| | | | | | | | |
| | |
| | | | | | | 1,338,235 | |
| |
Electrical Equipment – 0.4% | |
Emerson Electric Co. | | | 2,278 | | | | 118,866 | |
Nidec Corp. | | | 10,100 | | | | 920,068 | |
Roper Industries, Inc. | | | 3,400 | | | | 337,144 | |
Schneider Electric SA | | | 16,108 | | | | 1,052,469 | |
| | | | | | | | |
| | |
| | | | | | | 2,428,547 | |
| |
Electronic Equipment, Instruments & Components – 0.6% | |
Avnet, Inc. (c) | | | 19,600 | | | | 713,244 | |
Ingram Micro, Inc., Class A (c) | | | 37,400 | | | | 694,144 | |
Jabil Circuit, Inc. | | | 18,300 | | | | 459,696 | |
Molex, Inc. | | | 378 | | | | 10,629 | |
Tech Data Corp. (c) | | | 12,700 | | | | 689,102 | |
Vishay Intertechnology, Inc. (c) | | | 53,700 | | | | 652,992 | |
| | | | | | | | |
| | |
| | | | | | | 3,219,807 | |
| |
| | | | | | | | |
| Common Stocks | | Shares | | | Value | |
| |
Energy Equipment & Services – 0.5% | |
Halliburton Co. | | | 8,773 | | | $ | 291,176 | |
National Oilwell Varco, Inc. | | | 9,100 | | | | 723,177 | |
Noble Corp. | | | 12,000 | | | | 449,640 | |
Schlumberger Ltd. | | | 17,967 | | | | 1,256,432 | |
| | | | | | | | |
| | |
| | | | | | | 2,720,425 | |
| |
Food & Staples Retailing – 0.5% | |
Costco Wholesale Corp. | | | 11,400 | | | | 1,035,120 | |
The Kroger Co. | | | 28,300 | | | | 685,709 | |
Safeway, Inc. | | | 16,500 | | | | 333,465 | |
Whole Foods Market, Inc. | | | 8,400 | | | | 698,880 | |
| | | | | | | | |
| | |
| | | | | | | 2,753,174 | |
| |
Food Products – 0.2% | |
Green Mountain Coffee Roasters, Inc. (c) | | | 6,900 | | | | 323,196 | |
Kraft Foods, Inc., Class A | | | 5,140 | | | | 195,371 | |
Smithfield Foods, Inc. (c) | | | 19,400 | | | | 427,382 | |
| | | | | | | | |
| | |
| | | | | | | 945,949 | |
| |
Health Care Equipment & Supplies – 0.2% | |
Intuitive Surgical, Inc. (c) | | | 610 | | | | 330,468 | |
Medtronic, Inc. | | | 1,699 | | | | 66,584 | |
Stryker Corp. | | | 2,902 | | | | 161,003 | |
Zimmer Holdings, Inc. | | | 12,500 | | | | 803,500 | |
| | | | | | | | |
| | |
| | | | | | | 1,361,555 | |
| |
Health Care Providers & Services – 1.2% | |
Aetna, Inc. | | | 18,300 | | | | 917,928 | |
AmerisourceBergen Corp. | | | 16,500 | | | | 654,720 | |
Cardinal Health, Inc. | | | 28,400 | | | | 1,224,324 | |
Coventry Health Care, Inc. | | | 22,200 | | | | 789,654 | |
Humana, Inc. | | | 8,600 | | | | 795,328 | |
Medco Health Solutions, Inc. (c) | | | 15,400 | | | | 1,082,620 | |
UnitedHealth Group, Inc. | | | 22,200 | | | | 1,308,468 | |
WellPoint, Inc. | | | 2,200 | | | | 162,360 | |
| | | | | | | | |
| | |
| | | | | | | 6,935,402 | |
| |
Health Care Technology – 0.2% | |
Cerner Corp. (c) | | | 15,400 | | | | 1,172,864 | |
| |
Hotels, Restaurants & Leisure – 0.4% | |
Chipotle Mexican Grill, Inc. (c) | | | 800 | | | | 334,400 | |
Las Vegas Sands Corp. | | | 18,000 | | | | 1,036,260 | |
Starbucks Corp. | | | 19,500 | | | | 1,089,855 | |
| | | | | | | | |
| | |
| | | | | | | 2,460,515 | |
| |
Household Durables – 0.1% | |
Leggett & Platt, Inc. | | | 25,886 | | | | 595,637 | |
| |
Household Products – 0.6% | |
Kimberly-Clark Corp. | | | 7,067 | | | | 522,181 | |
The Procter & Gamble Co. | | | 10,980 | | | | 737,966 | |
Reckitt Benckiser Group Plc | | | 33,100 | | | | 1,870,478 | |
| | | | | | | | |
| | |
| | | | | | | 3,130,625 | |
| |
Independent Power Producers & Energy Traders – 0.2% | |
The AES Corp. (c) | | | 53,800 | | | | 703,166 | |
NRG Energy, Inc. (c) | | | 29,200 | | | | 457,564 | |
| | | | | | | | |
| | |
| | | | | | | 1,160,730 | |
| |
Industrial Conglomerates – 0.8% | |
Danaher Corp. | | | 32,400 | | | | 1,814,400 | |
General Electric Co. | | | 90,099 | | | | 1,808,287 | |
See Notes to Financial Statements.
| | | | | | |
| | | | | | | |
| | | | | | |
| 10 | | BLACKROCK MANAGED VOLATILITY PORTFOLIO | | MARCH 31, 2012 | | |
| | |
| Schedule of Investments (continued) | | (Percentages shown are based on Net Assets) |
| | | | | | | | |
| Common Stocks | | Shares | | | Value | |
| |
Industrial Conglomerates (concluded) | |
Tyco International Ltd. | | | 17,200 | | | $ | 966,296 | |
| | | | | | | | |
| | |
| | | | | | | 4,588,983 | |
| |
Insurance – 1.4% | |
AFLAC, Inc. | | | 6,703 | | | | 308,271 | |
Allied World Assurance Co. Holdings AG | | | 10,000 | | | | 686,700 | |
American Financial Group, Inc. | | | 17,800 | | | | 686,724 | |
Assurant, Inc. | | | 16,300 | | | | 660,150 | |
China Life Insurance Co. Ltd., H Shares | | | 297,000 | | | | 770,654 | |
Chubb Corp. | | | 4,300 | | | | 297,173 | |
Cincinnati Financial Corp. | | | 17,368 | | | | 599,370 | |
Fidelity National Financial, Inc., Class A | | | 13,300 | | | | 239,799 | |
HCC Insurance Holdings, Inc. | | | 2,800 | | | | 87,276 | |
Principal Financial Group, Inc. | | | 3,886 | | | | 114,676 | |
Protective Life Corp. | | | 25,100 | | | | 743,462 | |
Prudential Financial, Inc. | | | 14,700 | | | | 931,833 | |
Reinsurance Group of America, Inc. | | | 12,800 | | | | 761,216 | |
Unum Group | | | 28,900 | | | | 707,472 | |
W.R. Berkley Corp. | | | 12,900 | | | | 465,948 | |
| | | | | | | | |
| | |
| | | | | | | 8,060,724 | |
| |
Internet & Catalog Retail – 0.6% | |
Amazon.com, Inc. (c)(d) | | | 10,000 | | | | 2,025,100 | |
Expedia, Inc. | | | 19,550 | | | | 653,752 | |
priceline.com, Inc. (c) | | | 900 | | | | 645,750 | |
| | | | | | | | |
| | |
| | | | | | | 3,324,602 | |
| |
Internet Software & Services – 0.7% | |
eBay, Inc. (c) | | | 21,400 | | | | 789,446 | |
Google, Inc., Class A (c) | | | 4,080 | | | | 2,616,259 | |
IAC/InterActiveCorp. | | | 2,400 | | | | 117,816 | |
Rackspace Hosting, Inc. (c) | | | 9,500 | | | | 549,005 | |
| | | | | | | | |
| | |
| | | | | | | 4,072,526 | |
| |
IT Services – 1.0% | |
Automatic Data Processing, Inc. | | | 12,505 | | | | 690,151 | |
Broadridge Financial Solutions, Inc. | | | 23,980 | | | | 573,362 | |
Computer Sciences Corp. | | | 22,700 | | | | 679,638 | |
DST Systems, Inc. | | | 13,100 | | | | 710,413 | |
Paychex, Inc. | | | 19,074 | | | | 591,103 | |
SAIC, Inc. | | | 51,700 | | | | 682,440 | |
VeriFone Systems, Inc. (c) | | | 14,000 | | | | 726,180 | |
Visa, Inc., A Shares | | | 6,900 | | | | 814,200 | |
| | | | | | | | |
| | |
| | | | | | | 5,467,487 | |
| |
Machinery – 1.4% | |
AGCO Corp. (c) | | | 7,500 | | | | 354,075 | |
Caterpillar, Inc. | | | 7,757 | | | | 826,276 | |
CNH Global NV | | | 16,400 | | | | 651,080 | |
Eaton Corp. | | | 17,200 | | | | 857,076 | |
Harsco Corp. | | | 6,541 | | | | 153,452 | |
Illinois Tool Works, Inc. | | | 11,886 | | | | 678,928 | |
Makita Corp. | | | 16,900 | | | | 677,878 | |
Oshkosh Corp. (c) | | | 12,400 | | | | 287,308 | |
PACCAR, Inc. | | | 10,600 | | | | 496,398 | |
Parker Hannifin Corp. | | | 8,300 | | | | 701,765 | |
Railpower Technologies Corp. (c) | | | 17,600 | | | | – | |
Stanley Black & Decker, Inc. | | | 10,000 | | | | 769,600 | |
Terex Corp. (c)(d) | | | 23,144 | | | | 520,740 | |
| | | | | | | | |
| Common Stocks | | Shares | | | Value | |
| |
Machinery (concluded) | |
Vallourec SA | | | 9,345 | | | $ | 592,016 | |
Zoomlion Heavy Industry Science and Technology Co. Ltd., H Shares | | | 332,520 | | | | 442,758 | |
| | | | | | | | |
| | |
| | | | | | | 8,009,350 | |
| |
Media – 0.6% | |
Comcast Corp., Class A | | | 27,600 | | | | 828,276 | |
DISH Network Corp., Class A (c) | | | 20,400 | | | | 671,772 | |
Gannett Co., Inc. | | | 37,900 | | | | 581,007 | |
The Interpublic Group of Cos., Inc. | | | 62,200 | | | | 709,702 | |
Liberty Global, Inc., Class A (c) | | | 12,494 | | | | 625,700 | |
The McGraw-Hill Cos., Inc. | | | 3,732 | | | | 180,890 | |
| | | | | | | | |
| | |
| | | | | | | 3,597,347 | |
| |
Metals & Mining – 0.4% | |
Freeport-McMoRan Copper & Gold, Inc. | | | 16,264 | | | | 618,683 | |
Rio Tinto Plc | | | 18,031 | | | | 993,839 | |
Southern Copper Corp. | | | 11,886 | | | | 376,900 | |
| | | | | | | | |
| | |
| | | | | | | 1,989,422 | |
| |
Multiline Retail – 0.1% | |
Dillard’s, Inc., Class A | | | 11,300 | | | | 712,126 | |
| |
Multi-Utilities – 0.3% | |
Ameren Corp. | | | 23,200 | | | | 755,856 | |
CenterPoint Energy, Inc. | | | 12,986 | | | | 256,084 | |
NiSource, Inc. | | | 30,281 | | | | 737,342 | |
| | | | | | | | |
| | |
| | | | | | | 1,749,282 | |
| |
Oil, Gas & Consumable Fuels – 3.1% | |
Alpha Natural Resources, Inc. (c) | | | 18,812 | | | | 286,131 | |
Anadarko Petroleum Corp. | | | 14,500 | | | | 1,135,930 | |
Apache Corp. | | | 9,500 | | | | 954,180 | |
BG Group Plc | | | 63,468 | | | | 1,469,956 | |
Chevron Corp. | | | 26,447 | | | | 2,836,176 | |
ConocoPhillips | | | 21,700 | | | | 1,649,417 | |
Devon Energy Corp. | | | 5,500 | | | | 391,160 | |
EQT Corp. | | | 1,133 | | | | 54,622 | |
Exxon Mobil Corp. | | | 22,712 | | | | 1,969,812 | |
Longview Energy Co. (Acquired 8/13/04, cost $48,000) (c)(e) | | | 3,200 | | | | 39,101 | |
Marathon Oil Corp. | | | 26,600 | | | | 843,220 | |
Marathon Petroleum Corp. | | | 18,000 | | | | 780,480 | |
Matador Resources Co. (Acquired 4/13/06, cost $8,451) (c)(e) | | | 939 | | | | 10,282 | |
Murphy Oil Corp. | | | 4,300 | | | | 241,961 | |
OGX Petroleo e Gas Participacoes SA (c) | | | 92,200 | | | | 763,682 | |
Range Resources Corp. | | | 13,300 | | | | 773,262 | |
Spectra Energy Corp. | | | 22,675 | | | | 715,396 | |
Tesoro Corp. (c) | | | 25,400 | | | | 681,736 | |
Tullow Oil Plc | | | 42,551 | | | | 1,039,273 | |
Valero Energy Corp. | | | 31,200 | | | | 804,024 | |
| | | | | | | | |
| | |
| | | | | | | 17,439,801 | |
| |
Paper & Forest Products – 0.3% | |
Ainsworth Lumber Co. Ltd. (a)(c) | | | 19,432 | | | | 27,664 | |
Ainsworth Lumber Co. Ltd. (c) | | | 17,115 | | | | 24,365 | |
Domtar Corp. | | | 7,000 | | | | 667,660 | |
See Notes to Financial Statements.
| | | | | | |
| | | | | | | |
| | | | | | |
| | BLACKROCK MANAGED VOLATILITY PORTFOLIO | | MARCH 31, 2012 | | 11 |
| | |
| Schedule of Investments (continued) | | (Percentages shown are based on Net Assets) |
| | | | | | | | |
| Common Stocks | | Shares | | | Value | |
| |
Paper & Forest Products (concluded) | |
International Paper Co. | | | 21,300 | | | $ | 747,630 | |
| | | | | | | | |
| | |
| | | | | | | 1,467,319 | |
| |
Personal Products – 0.1% | |
Herbalife Ltd. | | | 4,800 | | | | 330,336 | |
| |
Pharmaceuticals – 2.5% | |
Abbott Laboratories | | | 12,100 | | | | 741,609 | |
Bristol-Myers Squibb Co. | | | 13,763 | | | | 464,501 | |
Eli Lilly & Co. | | | 28,394 | | | | 1,143,426 | |
Forest Laboratories, Inc. (c) | | | 21,300 | | | | 738,897 | |
Johnson & Johnson | | | 6,360 | | | | 419,506 | |
Novartis AG | | | 32,057 | | | | 1,774,197 | |
Pfizer, Inc. | | | 183,877 | | | | 4,166,653 | |
Roche Holding AG | | | 6,201 | | | | 1,079,181 | |
Sanofi-Aventis SA | | | 29,907 | | | | 2,322,630 | |
Teva Pharmaceutical Industries Ltd. - ADR | | | 12,100 | | | | 545,226 | |
Valeant Pharmaceuticals International, Inc. (c) | | | 10,100 | | | | 542,269 | |
| | | | | | | | |
| | |
| | | | | | | 13,938,095 | |
| |
Professional Services – 0.1% | |
Manpower, Inc. | | | 9,400 | | | | 445,278 | |
| |
Real Estate Investment Trusts (REITs) – 0.5% | |
American Capital Agency Corp. | | | 19,878 | | | | 587,196 | |
American Tower Corp. | | | 10,300 | | | | 649,106 | |
Annaly Capital Management, Inc. (d) | | | 28,887 | | | | 456,992 | |
CommonWealth REIT | | | 4,660 | | | | 86,769 | |
Piedmont Office Realty Trust, Inc., Class A | | | 26,340 | | | | 467,535 | |
Senior Housing Properties Trust | | | 21,748 | | | | 479,543 | |
Simon Property Group, Inc. | | | 1 | | | | 144 | |
| | | | | | | | |
| | |
| | | | | | | 2,727,285 | |
| |
Semiconductors & Semiconductor Equipment – 1.4% | |
Avago Technologies Ltd. | | | 9,100 | | | | 354,627 | |
Broadcom Corp., Class A (c) | | | 18,334 | | | | 720,526 | |
Infineon Technologies AG | | | 106,327 | | | | 1,087,108 | |
Intel Corp. | | | 18,476 | | | | 519,360 | |
Lam Research Corp. (c) | | | 21,922 | | | | 978,160 | |
Marvell Technology Group Ltd. (c) | | | 51,800 | | | | 814,814 | |
Maxim Integrated Products, Inc. | | | 7,082 | | | | 202,474 | |
Microchip Technology, Inc. | | | 15,749 | | | | 585,863 | |
NXP Semiconductor NV (c) | | | 24,800 | | | | 659,928 | |
Tokyo Electron Ltd. | | | 17,800 | | | | 1,018,280 | |
Veeco Instruments, Inc. (c) | | | 23,247 | | | | 664,864 | |
Xilinx, Inc. | | | 14,200 | | | | 517,306 | |
| | | | | | | | |
| | |
| | | | | | | 8,123,310 | |
| |
Software – 1.5% | |
Activision Blizzard, Inc. | | | 108,999 | | | | 1,397,367 | |
Check Point Software Technologies Ltd. (c) | | | 13,900 | | | | 887,376 | |
Microsoft Corp. | | | 85,325 | | | | 2,751,731 | |
Red Hat, Inc. (c) | | | 12,400 | | | | 742,636 | |
Salesforce.com, Inc. (c) | | | 7,880 | | | | 1,217,539 | |
Symantec Corp. (c) | | | 34,300 | | | | 641,410 | |
VMware, Inc., Class A (c) | | | 6,100 | | | | 685,457 | |
| | | | | | | | |
| | |
| | | | | | | 8,323,516 | |
| |
Specialty Retail – 0.8% | |
American Eagle Outfitters, Inc. | | | 14,751 | | | | 253,570 | |
Best Buy Co., Inc. | | | 29,200 | | | | 691,456 | |
Foot Locker, Inc. | | | 17,500 | | | | 543,375 | |
GameStop Corp., Class A (d) | | | 28,800 | | | | 628,992 | |
| | | | | | | | |
| Common Stocks | | Shares | | | Value | |
| |
Specialty Retail (concluded) | |
Hennes & Mauritz AB, B Shares | | | 28,750 | | | $ | 1,040,350 | |
The Home Depot, Inc. | | | 23,500 | | | | 1,182,285 | |
| | | | | | | | |
| | |
| | | | | | | 4,340,028 | |
| |
Textiles, Apparel & Luxury Goods – 0.4% | |
Coach, Inc. | | | 8,900 | | | | 687,792 | |
Michael Kors Holdings Ltd. (c) | | | 9,500 | | | | 442,605 | |
The Swatch Group AG | | | 2,177 | | | | 1,002,042 | |
Under Armour, Inc., Class A (c) | | | 2,800 | | | | 263,200 | |
VF Corp. | | | 395 | | | | 57,662 | |
| | | | | | | | |
| | |
| | | | | | | 2,453,301 | |
| |
Thrifts & Mortgage Finance – 0.3% | |
Capitol Federal Financial, Inc. | | | 68,465 | | | | 811,995 | |
New York Community Bancorp, Inc. | | | 14,244 | | | | 198,134 | |
Washington Federal, Inc. | | | 33,200 | | | | 558,424 | |
| | | | | | | | |
| | |
| | | | | | | 1,568,553 | |
| |
Tobacco – 0.8% | |
Altria Group, Inc. | | | 25,809 | | | | 796,724 | |
Imperial Tobacco Group Plc | | | 52,072 | | | | 2,111,364 | |
Lorillard, Inc. | | | 6,178 | | | | 799,927 | |
Philip Morris International, Inc. | | | 8,900 | | | | 788,629 | |
Reynolds American, Inc. | | | 1,381 | | | | 57,229 | |
| | | | | | | | |
| | |
| | | | | | | 4,553,873 | |
| |
Trading Companies & Distributors – 0.1% | |
Noble Group Ltd. | | | 459,000 | | | | 503,894 | |
| |
Wireless Telecommunication Services – 0.8% | |
MetroPCS Communications, Inc. (c) | | | 47,200 | | | | 425,744 | |
NTT DoCoMo, Inc. | | | 714 | | | | 1,185,256 | |
Rogers Communications, Inc., Class B | | | 34,921 | | | | 1,386,407 | |
Vodafone Group Plc | | | 568,644 | | | | 1,566,227 | |
| | | | | | | | |
| | |
| | | | | | | 4,563,634 | |
| |
Total Common Stocks – 36.3% | | | | 206,209,221 | |
| |
| |
| Corporate Bonds | | Par (000) | | | | |
| |
Auto Components – 0.0% | |
BorgWarner, Inc., 4.63%, 9/15/20 | | USD | 145 | | | | 154,999 | |
| |
Building Products – 0.0% | |
Lafarge SA, 7.13%, 7/15/36 | | | 65 | | | | 59,957 | |
| |
Capital Markets – 0.6% | |
Credit Suisse AG, 5.40%, 1/14/20 | | | 105 | | | | 108,093 | |
Credit Suisse AG/Guernsey: | | | | | | | | |
1.63%, 3/06/15 (a) | | | 590 | | | | 588,598 | |
2.60%, 5/27/16 (a) | | | 280 | | | | 285,461 | |
The Goldman Sachs Group, Inc., 5.75%, 1/24/22 | | | 1,320 | | | | 1,357,937 | |
Morgan Stanley, 5.50%, 7/28/21 | | | 480 | | | | 469,096 | |
UBS AG, 2.25%, 3/30/17 (a) | | | 390 | | | | 389,049 | |
| | | | | | | | |
| | |
| | | | | | | 3,198,234 | |
| |
Chemicals – 0.2% | |
CF Industries, Inc., 7.13%, 5/01/20 | | | 395 | | | | 470,544 | |
The Dow Chemical Co., 4.13%, 11/15/21 | | | 170 | | | | 174,887 | |
See Notes to Financial Statements.
| | | | | | |
| | | | | | | |
| | | | | | |
| 12 | | BLACKROCK MANAGED VOLATILITY PORTFOLIO | | MARCH 31, 2012 | | |
| | |
| Schedule of Investments (continued) | | (Percentages shown are based on Net Assets) |
| | | | | | | | |
| Corporate Bonds | | Par (000) | | | Value | |
| |
Chemicals (concluded) | | | | | | | | |
Lyondell Chemical Co., 11.00%, 5/01/18 | | USD | 305 | | | $ | 336,617 | |
| | | | | | | | |
| | |
| | | | | | | 982,048 | |
| |
Commercial Banks – 0.8% | | | | | | | | |
ABN AMRO Bank NV, 6.38%, 4/27/21 | | EUR | 100 | | | | 134,294 | |
CIT Group, Inc., 7.00%, 5/02/17 (a) | | USD | 30 | | | | 30,075 | |
Commerzbank AG, 6.38%, 3/22/19 | | EUR | 100 | | | | 113,525 | |
DnB NOR Boligkreditt AS, 2.90%, 3/29/16 (a) | | USD | 1,265 | | | | 1,306,925 | |
HSBC Bank Brasil SA - Banco Multiplo, 4.00%, 5/11/16 (a) | | | 680 | | | | 685,100 | |
HSBC Bank Plc, 3.10%, 5/24/16 (a) | | | 335 | | | | 341,235 | |
HSBC Holdings Plc, 6.10%, 1/14/42 | | | 150 | | | | 174,529 | |
Sparebank 1 Boligkreditt AS: | | | | | | | | |
1.25%, 10/25/13 (a) | | | 845 | | | | 849,706 | |
2.30%, 6/30/17 | | | 435 | | | | 433,521 | |
Wells Fargo & Co., 3.50%, 3/08/22 | | | 540 | | | | 531,613 | |
| | | | | | | | |
| | |
| | | | | | | 4,600,523 | |
| |
Consumer Finance – 0.1% | | | | | | | | |
Capital One Financial Corp., 4.75%, 7/15/21 | | | 365 | | | | 384,061 | |
SLM Corp., 6.25%, 1/25/16 | | | 362 | | | | 376,480 | |
| | | | | | | | |
| | |
| | | | | | | 760,541 | |
| |
Diversified Financial Services – 0.9% | |
Bank of America Corp.: | | | | | | | | |
6.50%, 8/01/16 | | | 145 | | | | 159,425 | |
3.88%, 3/22/17 | | | 275 | | | | 276,517 | |
7.63%, 6/01/19 | | | 175 | | | | 201,795 | |
5.70%, 1/24/22 | | | 120 | | | | 127,030 | |
BP Capital Markets Plc, 3.13%, 10/01/15 | | | 160 | | | | 169,115 | |
Citigroup, Inc.: | | | | | | | | |
5.00%, 9/15/14 | | | 140 | | | | 144,988 | |
4.59%, 12/15/15 | | | 1,160 | | | | 1,221,596 | |
Ford Motor Credit Co. LLC: | | | | | | | | |
7.80%, 6/01/12 | | | 225 | | | | 226,969 | |
6.63%, 8/15/17 | | | 100 | | | | 110,813 | |
General Electric Capital Corp., 6.15%, 8/07/37 | | | 360 | | | | 407,665 | |
JPMorgan Chase Bank, N.A.: | | | | | | | | |
6.00%, 7/05/17 | | | 825 | | | | 934,890 | |
6.00%, 10/01/17 | | | 445 | | | | 509,174 | |
Northern Rock Asset Management Plc, 5.63%, 6/22/17 (a) | | | 200 | | | | 214,171 | |
Woodside Finance Ltd., 4.60%, 5/10/21 (a) | | | 100 | | | | 104,009 | |
| | | | | | | | |
| | |
| | | | | | | 4,808,157 | |
| |
Diversified Telecommunication Services – 0.3% | |
Intelsat Jackson Holdings SA, 7.25%, 4/01/19 | | | 176 | | | | 185,020 | |
Level 3 Financing, Inc., 8.13%, 7/01/19 (a) | | | 207 | | | | 213,727 | |
Sprint Capital Corp., 6.88%, 11/15/28 | | | 144 | | | | 110,160 | |
Telecom Italia Capital SA, 4.95%, 9/30/14 | | | 475 | | | | 489,250 | |
Verizon Communications, Inc.: | | | | | | | | |
3.50%, 11/01/21 | | | 240 | | | | 245,535 | |
6.40%, 2/15/38 | | | 332 | | | | 402,157 | |
Virgin Media Secured Finance Plc, 6.50%, 1/15/18 | | | 280 | | | | 304,150 | |
| | | | | | | | |
| | |
| | | | | | | 1,949,999 | |
| |
Electric Utilities – 0.5% | | | | | | | | |
Alabama Power Co., 3.95%, 6/01/21 | | | 220 | | | | 234,478 | |
The Cleveland Electric Illuminating Co.: | | | | | | | | |
8.88%, 11/15/18 | | | 66 | | | | 87,137 | |
5.95%, 12/15/36 | | | 151 | | | | 162,391 | |
| | | | | | | | |
| Corporate Bonds | | Par (000) | | | Value | |
| |
Electric Utilities (concluded) | | | | | | | | |
Duke Energy Carolinas LLC, 4.25%, 12/15/41 | | | USD 185 | | | $ | 184,586 | |
Energy Future Intermediate Holding Co. LLC/EFIH Finance, Inc., 10.00%, 12/01/20 | | | 290 | | | | 316,100 | |
Florida Power & Light Co., 5.95%, 2/01/38 | | | 225 | | | | 282,832 | |
Georgia Power Co., 3.00%, 4/15/16 | | | 390 | | | | 412,451 | |
Jersey Central Power & Light Co., 7.35%, 2/01/19 | | | 120 | | | | 150,158 | |
MidAmerican Energy Holdings Co., 6.50%, 9/15/37 | | | 250 | | | | 312,352 | |
PacifiCorp, 6.25%, 10/15/37 | | | 200 | | | | 254,848 | |
Trans-Allegheny Interstate Line Co., 4.00%, 1/15/15 (a) | | | 140 | | | | 147,782 | |
| | | | | | | | |
| | |
| | | | | | | 2,545,115 | |
| |
Energy Equipment & Services – 0.3% | |
Ensco Plc: | | | | | | | | |
3.25%, 3/15/16 | | | 90 | | | | 93,893 | |
4.70%, 3/15/21 | | | 195 | | | | 210,382 | |
Transocean, Inc.: | | | | | | | | |
5.05%, 12/15/16 | | | 420 | | | | 449,789 | |
6.50%, 11/15/20 | | | 150 | | | | 167,719 | |
6.38%, 12/15/21 | | | 840 | | | | 945,141 | |
| | | | | | | | |
| | |
| | | | | | | 1,866,924 | |
| |
Food Products – 0.1% | | | | | | | | |
Kraft Foods, Inc.: | | | | | | | | |
6.50%, 8/11/17 | | | 160 | | | | 193,012 | |
6.50%, 2/09/40 | | | 280 | | | | 344,549 | |
| | | | | | | | |
| | |
| | | | | | | 537,561 | |
| |
Gas Utilities – 0.0% | | | | | | | | |
KeySpan Gas East Corp., 5.82%, 4/01/41 (a) | | | 185 | | | | 221,143 | |
| |
Health Care Equipment & Supplies – 0.1% | |
Boston Scientific Corp., 6.25%, 11/15/15 | | | 614 | | | | 678,025 | |
| |
Health Care Providers & Services – 0.3% | |
HCA, Inc.: | | | | | | | | |
6.50%, 2/15/20 | | | 392 | | | | 411,600 | |
7.25%, 9/15/20 (a) | | | 455 | | | | 495,381 | |
Tenet Healthcare Corp.: | | | | | | | | |
6.25%, 11/01/18 (a) | | | 235 | | | | 242,637 | |
8.88%, 7/01/19 | | | 305 | | | | 341,600 | |
UnitedHealth Group, Inc., 3.38%, 11/15/21 | | | 80 | | | | 82,117 | |
| | | | | | | | |
| | |
| | | | | | | 1,573,335 | |
| |
Hotels, Restaurants & Leisure – 0.2% | |
MGM Resorts International: | | | | | | | | |
10.38%, 5/15/14 | | | 200 | | | | 226,750 | |
11.13%, 11/15/17 | | | 260 | | | | 294,125 | |
Wyndham Worldwide Corp., 4.25%, 3/01/22 | | | 330 | | | | 323,507 | |
| | | | | | | | |
| | |
| | | | | | | 844,382 | |
| |
See Notes to Financial Statements.
| | | | | | |
| | | | | | | |
| | | | | | |
| | BLACKROCK MANAGED VOLATILITY PORTFOLIO | | MARCH 31, 2012 | | 13 |
| | |
| Schedule of Investments (continued) | | (Percentages shown are based on Net Assets) |
| | | | | | | | |
| Corporate Bonds | | Par (000) | | | Value | |
| |
Household Products – 0.1% | | | | | | | | |
Reynolds Group Issuer, Inc./Reynolds Group Issuer LLC/Reynolds Group Issuer Luxembourg SA: | | | | | | | | |
7.88%, 8/15/19 (a) | | USD | 345 | | | $ | 370,875 | |
6.88%, 2/15/21 (a) | | | 270 | | | | 279,450 | |
| | | | | | | | |
| | |
| | | | | | | 650,325 | |
| |
Independent Power Producers & Energy Traders – 0.0% | |
Constellation Energy Group, Inc., 7.60%, 4/01/32 | | | 75 | | | | 97,511 | |
| |
Insurance – 1.2% | | | | | | | | |
Allianz Finance II BV, 5.75%, 7/08/41 (b) | | EUR | 300 | | | | 378,546 | |
American International Group, Inc.: | | | | | | | | |
3.80%, 3/22/17 | | USD | 423 | | | | 428,311 | |
5.45%, 5/18/17 | | | 180 | | | | 193,507 | |
AXA SA, 5.25%, 4/16/40 (b) | | EUR | 200 | | | | 228,225 | |
Berkshire Hathaway Finance Corp., 4.75%, 5/15/12 | | USD | 355 | | | | 356,768 | |
Fairfax Financial Holdings Ltd., 5.80%, 5/15/21 (a) | | | 251 | | | | 239,569 | |
Hartford Financial Services Group, Inc., 6.00%, 1/15/19 | | | 170 | | | | 185,701 | |
Hartford Life Global Funding Trusts, 0.65%, 6/16/14 (b) | | | 950 | | | | 902,123 | |
ING Verzekeringen NV, 2.69%, 6/21/21 (b) | | EUR | 40 | | | | 49,618 | |
Lincoln National Corp., 7.00%, 6/15/40 | | USD | 160 | | | | 187,906 | |
Manulife Financial Corp., 3.40%, 9/17/15 | | | 420 | | | | 432,342 | |
Metropolitan Life Global Funding I: | | | | | | | | |
2.88%, 9/17/12 (a) | | | 225 | | | | 227,085 | |
2.50%, 1/11/13 (a) | | | 1,370 | | | | 1,384,266 | |
5.13%, 6/10/14 (a) | | | 300 | | | | 325,784 | |
Muenchener Rueckversicherungs AG, 6.00%, 5/26/41 (b) | | EUR | 200 | | | | 264,222 | |
Prudential Financial, Inc.: | | | | | | | | |
4.75%, 9/17/15 | | USD | 620 | | | | 673,016 | |
5.38%, 6/21/20 | | | 200 | | | | 224,012 | |
4.50%, 11/15/20 | | | 270 | | | | 286,454 | |
| | | | | | | | |
| | |
| | | | | | | 6,967,455 | |
| |
Life Sciences Tools & Services – 0.1% | |
Life Technologies Corp., 6.00%, 3/01/20 | | | 230 | | | | 263,126 | |
| |
Machinery – 0.0% | | | | | | | | |
Joy Global, Inc., 5.13%, 10/15/21 | | | 100 | | | | 108,280 | |
| |
Media – 1.1% | | | | | | | | |
CBS Corp.: | | | | | | | | |
4.63%, 5/15/18 | | | 80 | | | | 87,108 | |
8.88%, 5/15/19 | | | 185 | | | | 243,059 | |
5.75%, 4/15/20 | | | 120 | | | | 137,961 | |
CCH II LLC/CCH II Capital Corp., 13.50%, 11/30/16 | | | 700 | | | | 798,000 | |
Clear Channel Worldwide Holdings, Inc.: | | | | | | | | |
9.25%, 12/15/17 | | | 104 | | | | 113,490 | |
Series B, 9.25%, 12/15/17 | | | 527 | | | | 577,724 | |
Comcast Corp.: | | | | | | | | |
5.88%, 2/15/18 | | | 392 | | | | 463,919 | |
6.95%, 8/15/37 | | | 145 | | | | 183,581 | |
COX Communications, Inc., 8.38%, 3/01/39 (a) | | | 375 | | | | 527,983 | |
CSC Holdings LLC, 8.50%, 4/15/14 | | | 133 | | | | 147,963 | |
DIRECTV Holdings LLC/DIRECTV Financing Co., Inc.: | | | | | | | | |
6.38%, 3/01/41 | | | 237 | | | | 267,469 | |
| | | | | | | | |
| Corporate Bonds | | Par (000) | | | Value | |
| |
Media (concluded) | | | | | | | | |
5.15%, 3/15/42 (a) | | USD | 108 | | | $ | 105,212 | |
NBCUniversal Media LLC: | | | | | | | | |
5.15%, 4/30/20 | | | 530 | | | | 599,857 | |
4.38%, 4/01/21 | | | 90 | | | | 96,403 | |
The New York Times Co., 6.63%, 12/15/16 | | | 1,000 | | | | 1,042,500 | |
News America, Inc., 6.20%, 12/15/34 | | | 100 | | | | 110,902 | |
Time Warner Cable, Inc.: | | | | | | | | |
5.88%, 11/15/40 | | | 250 | | | | 269,369 | |
5.50%, 9/01/41 | | | 240 | | | | 251,407 | |
Time Warner, Inc.: | | | | | | | | |
4.70%, 1/15/21 | | | 110 | | | | 120,178 | |
6.10%, 7/15/40 | | | 80 | | | | 89,533 | |
Unitymedia Hessen GmbH & Co. KG/Unitymedia NRW GmbH, 8.13%, 12/01/17 (a) | | | 200 | | | | 216,000 | |
| | | | | | | | |
| | |
| | | | | | | 6,449,618 | |
| |
Metals & Mining – 0.1% | | | | | | | | |
Freeport-McMoRan Copper & Gold, Inc., 2.15%, 3/01/17 | | | 90 | | | | 89,160 | |
Newcrest Finance Pty Ltd., 4.45%, 11/15/21 (a) | | | 190 | | | | 191,948 | |
Novelis, Inc., 8.75%, 12/15/20 | | | 295 | | | | 323,025 | |
| | | | | | | | |
| | |
| | | | | | | 604,133 | |
| |
Multiline Retail – 0.2% | | | | | | | | |
Dollar General Corp., 11.88%, 7/15/17 (b) | | | 400 | | | | 434,004 | |
Macy’s Retail Holdings, Inc.: | | | | | | | | |
5.90%, 12/01/16 | | | 395 | | | | 453,283 | |
7.45%, 7/15/17 | | | 286 | | | | 347,208 | |
| | | | | | | | |
| | |
| | | | | | | 1,234,495 | |
| |
Multi-Utilities – 0.1% | | | | | | | | |
Dominion Resources, Inc., 1.95%, 8/15/16 | | | 305 | | | | 309,196 | |
| |
Oil, Gas & Consumable Fuels – 1.2% | |
Anadarko Petroleum Corp.: | | | | | | | | |
5.95%, 9/15/16 | | | 634 | | | | 730,937 | |
6.38%, 9/15/17 | | | 443 | | | | 526,380 | |
Consol Energy, Inc.: | | | | | | | | |
8.00%, 4/01/17 | | | 153 | | | | 159,503 | |
8.25%, 4/01/20 | | | 37 | | | | 38,665 | |
El Paso Pipeline Partners Operating Co. LLC, 6.50%, 4/01/20 | | | 280 | | | | 312,900 | |
Enterprise Products Operating LLC: | | | | | | | | |
6.30%, 9/15/17 | | | 250 | | | | 294,719 | |
6.13%, 10/15/39 | | | 225 | | | | 253,384 | |
Kinder Morgan Energy Partners LP: | | | | | | | | |
5.95%, 2/15/18 | | | 225 | | | | 262,782 | |
6.55%, 9/15/40 | | | 55 | | | | 61,600 | |
6.38%, 3/01/41 | | | 80 | | | | 87,808 | |
Kinder Morgan Finance Co. ULC, 5.70%, 1/05/16 | | | 250 | | | | 263,750 | |
Linn Energy LLC/Linn Energy Finance Corp., 6.25%, 11/01/19 (a) | | | 345 | | | | 334,650 | |
Marathon Petroleum Corp., 6.50%, 3/01/41 | | | 401 | | | | 433,176 | |
MEG Energy Corp., 6.50%, 3/15/21 (a) | | | 475 | | | | 497,563 | |
Nexen, Inc.: | | | | | | | | |
6.40%, 5/15/37 | | | 200 | | | | 219,896 | |
7.50%, 7/30/39 | | | 335 | | | | 411,330 | |
Noble Holding International Ltd., 5.25%, 3/15/42 | | | 175 | | | | 173,849 | |
Peabody Energy Corp., 6.25%, 11/15/21 (a) | | | 375 | | | | 367,500 | |
See Notes to Financial Statements.
| | | | | | |
| | | | | | | |
| | | | | | |
| 14 | | BLACKROCK MANAGED VOLATILITY PORTFOLIO | | MARCH 31, 2012 | | |
| | |
| Schedule of Investments (continued) | | (Percentages shown are based on Net Assets) |
| | | | | | | | |
| Corporate Bonds | | Par (000) | | | Value | |
| |
Oil, Gas & Consumable Fuels (concluded) | |
Plains Exploration & Production Co., 10.00%, 3/01/16 | | USD | 50 | | | $ | 55,250 | |
Pride International, Inc., 6.88%, 8/15/20 | | | 115 | | | | 140,238 | |
Range Resources Corp.: | | | | | | | | |
7.25%, 5/01/18 | | | 405 | | | | 427,275 | |
5.75%, 6/01/21 | | | 55 | | | | 57,750 | |
Rockies Express Pipeline LLC, 3.90%, 4/15/15 (a) | | | 425 | | | | 391,000 | |
Western Gas Partners LP, 5.38%, 6/01/21 | | | 350 | | | | 375,200 | |
| | | | | | | | |
| | |
| | | | | | | 6,877,105 | |
| |
Paper & Forest Products – 0.1% | |
Ainsworth Lumber Co. Ltd., 11.00%, 7/29/15 (a)(f) | | | 169 | | | | 135,215 | |
International Paper Co.: | | | | | | | | |
7.50%, 8/15/21 | | | 25 | | | | 31,513 | |
4.75%, 2/15/22 | | | 200 | | | | 210,763 | |
6.00%, 11/15/41 | | | 225 | | | | 244,231 | |
| | | | | | | | |
| | |
| | | | | | | 621,722 | |
| |
Pharmaceuticals – 0.1% | | | | | | | | |
Teva Pharmaceutical Finance Co. BV, 3.65%, 11/10/21 | | | 100 | | | | 101,228 | |
Teva Pharmaceutical Finance II BV/Teva Pharmaceutical Finance III LLC, 3.00%, 6/15/15 | | | 270 | | | | 284,187 | |
Teva Pharmaceutical Finance IV BV, 3.65%, 11/10/21 | | | 240 | | | | 242,947 | |
| | | | | | | | |
| | |
| | | | | | | 628,362 | |
| |
Real Estate Investment Trusts (REITs) – 0.2% | |
ERP Operating LP, 4.63%, 12/15/21 | | | 245 | | | | 257,970 | |
Hospitality Properties Trust, 5.63%, 3/15/17 | | | 186 | | | | 198,392 | |
Ventas Realty LP/Ventas Capital Corp., 4.75%, 6/01/21 | | | 135 | | | | 136,210 | |
Vornado Realty LP, 5.00%, 1/15/22 | | | 580 | | | | 592,615 | |
| | | | | | | | |
| | |
| | | | | | | 1,185,187 | |
| |
Real Estate Management & Development – 0.1% | |
Realogy Corp., 7.88%, 2/15/19 (a)(g) | | | 210 | | | | 210,000 | |
WEA Finance LLC, 4.63%, 5/10/21 (a) | | | 150 | | | | 151,739 | |
| | | | | | | | |
| | |
| | | | | | | 361,739 | |
| |
Road & Rail – 0.1% | | | | | | | | |
Burlington Northern Santa Fe LLC, 5.75%, 5/01/40 | | | 500 | | | | 570,865 | |
| |
Software – 0.1% | | | | | | | | |
First Data Corp.: | | | | | | | | |
7.38%, 6/15/19 (a) | | | 100 | | | | 101,875 | |
8.25%, 1/15/21 (a) | | | 10 | | | | 9,775 | |
Oracle Corp., 5.38%, 7/15/40 | | | 200 | | | | 231,254 | |
| | | | | | | | |
| | |
| | | | | | | 342,904 | |
| |
Specialty Retail – 0.0% | | | | | | | | |
QVC, Inc., 7.50%, 10/01/19 (a) | | | 205 | | | | 224,987 | |
| |
Thrifts & Mortgage Finance – 0.1% | | | | | | | | |
Radian Group, Inc., 5.38%, 6/15/15 | | | 750 | | | | 570,000 | |
| |
Wireless Telecommunication Services – 0.4% | |
America Movil SAB de CV, 2.38%, 9/08/16 | | | 400 | | | | 404,930 | |
Cricket Communications, Inc., 7.75%, 5/15/16 | | | 227 | | | | 239,485 | |
Crown Castle Towers LLC, 6.11%, 1/15/20 (a) | | | 760 | | | | 844,685 | |
MetroPCS Wireless, Inc., 7.88%, 9/01/18 | | | 11 | | | | 11,577 | |
| | | | | | | | |
| Corporate Bonds | | Par (000) | | | Value | |
| |
Wireless Telecommunication Services (concluded) | |
SBA Tower Trust, 5.10%, 4/15/17 (a) | | USD | 180 | | | $ | 194,263 | |
Sprint Nextel Corp., 9.00%, 11/15/18 (a) | | | 440 | | | | 482,900 | |
| | | | | | | | |
| | |
| | | | | | | 2,177,840 | |
| |
Total Corporate Bonds – 9.7% | | | | | | | 55,025,793 | |
| |
| |
| | |
| Foreign Agency Obligations | | | | | | |
| |
Eksportfinans ASA, 5.50%, 5/25/16 | | | 255 | | | | 249,618 | |
Hydro Quebec: | | | | | | | | |
9.40%, 2/01/21 | | | 195 | | | | 285,826 | |
8.40%, 1/15/22 | | | 405 | | | | 571,510 | |
8.05%, 7/07/24 | | | 940 | | | | 1,352,958 | |
Kreditanstalt fuer Wiederaufbau, 1.38%, 7/15/13 | | | 350 | | | | 354,130 | |
Petrobras International Finance Co., 3.88%, 1/27/16 | | | 745 | | | | 784,189 | |
| |
| |
Total Foreign Agency Obligations – 0.6% | | | | 3,598,231 | |
| |
| |
| | |
| Foreign Government Obligations | | | | | | |
| |
Italy – 0.2% | | | | | | | | |
Buoni Poliennali Del Tesoro, 5.00%, 3/01/22 | | EUR | 800 | | | | 1,056,723 | |
| |
Mexico – 0.1% | | | | | | | | |
United Mexican States: | | | | | | | | |
8.30%, 8/15/31 | | USD | 194 | | | | 289,060 | |
6.75%, 9/27/34 | | | 150 | | | | 192,750 | |
6.05%, 1/11/40 | | | 125 | | | | 150,625 | |
| | | | | | | | |
| | |
| | | | | | | 632,435 | |
| |
Peru – 0.0% | | | | | | | | |
Republic of Peru, 6.55%, 3/14/37 | | | 215 | | | | 273,910 | |
| |
Poland – 0.1% | | | | | | | | |
Republic of Poland: | | | | | | | | |
5.13%, 4/21/21 | | | 200 | | | | 213,600 | |
5.00%, 3/23/22 | | | 250 | | | | 263,505 | |
| | | | | | | | |
| | |
| | | | | | | 477,105 | |
| |
Russia – 0.2% | | | | | | | | |
Russian Federation: | | | | | | | | |
4.50%, 4/04/22 (a) | | | 200 | | | | 199,400 | |
7.50%, 3/31/30 (h) | | | 757 | | | | 905,202 | |
| | | | | | | | |
| | |
| | | | | | | 1,104,602 | |
| |
South Africa – 0.1% | | | | | | | | |
Republic of South Africa, 5.50%, 3/09/20 | | | 500 | | | | 557,500 | |
| |
Turkey – 0.1% | | | | | | | | |
Republic of Turkey: | | | | | | | | |
6.75%, 4/03/18 | | | 260 | | | | 291,525 | |
6.25%, 9/26/22 | | | 250 | | | | 268,750 | |
| | | | | | | | |
| | |
| | | | | | | 560,275 | |
| |
Total Foreign Government Obligations – 0.8% | | | | 4,662,550 | |
| |
| |
See Notes to Financial Statements.
| | | | | | |
| | | | | | | |
| | | | | | |
| | BLACKROCK MANAGED VOLATILITY PORTFOLIO | | MARCH 31, 2012 | | 15 |
| | |
| Schedule of Investments (continued) | | (Percentages shown are based on Net Assets) |
| | | | | | | | |
| Investment Companies | | Shares | | | Value | |
| |
Energy Select Sector SPDR Fund | | | 156,000 | | | $ | 11,189,880 | |
iShares iBoxx $ High Yield Corporate Bonds Fund (i) | | | 125,000 | | | | 11,355,000 | |
Technology Select Sector SPDR Fund | | | 946,000 | | | | 28,521,900 | |
| |
| | |
Total Investment Companies – 9.0% | | | | | | | 51,066,780 | |
| |
| |
Non-Agency Mortgage-Backed
Securities | | Par (000) | | | | |
| |
Collateralized Mortgage Obligations – 1.4% | |
Countrywide Alternative Loan Trust: | | | | | | | | |
Series 2005-21CB, Class A17, 6.00%, 6/25/35 | | USD | 838 | | | | 780,828 | |
Series 2005-59, Class 1A1, 0.61%, 11/20/35 (b) | | | 1,114 | | | | 637,712 | |
Countrywide Home Loan Mortgage Pass-Through Trust: | | | | | | | | |
Series 2003-58, Class B1, 2.79%, 2/19/34 (b) | | | 110 | | | | 46,963 | |
Series 2006-J2, Class 1A1, 6.00%, 4/25/36 | | | 414 | | | | 317,995 | |
Series 2006-J4, Class A9, 6.25%, 9/25/36 | | | 483 | | | | 361,815 | |
Series 2006-OA5, Class 3A1, 0.44%, 4/25/46 (b) | | | 299 | | | | 190,329 | |
Series 2007-J3, Class A10, 6.00%, 7/25/37 (b) | | | 777 | | | | 647,170 | |
Credit Suisse Mortgage Capital Certificates: | | | | | | | | |
Series 2011-2R, Class 1A1, 2.83%, 3/27/37 (a)(b) | | | 296 | | | | 279,047 | |
Series 2011-2R, Class 2A1, 2.69%, 7/27/36 (a)(b) | | | 767 | | | | 735,709 | |
First Horizon Asset Securities, Inc., Series 2005-AR3, Class 3A1, 5.54%, 8/25/35 (b) | | | 94 | | | | 80,972 | |
FREMF Mortgage Trust, Series 2012-K706, Class C, 4.02%, 11/25/18 (a)(b) | | | 80 | | | | 71,764 | |
GMAC Mortgage Corp. Loan Trust, Series 2006-AR1, Class 2A1, 5.32%, 4/19/36 (b) | | | 766 | | | | 625,733 | |
Homebanc Mortgage Trust, Series 2006-2, Class A1, 0.42%, 12/25/36 (b) | | | 341 | | | | 223,790 | |
Impac Commercial Mortgage-Backed Trust, Series 2004-7, Class M4, 2.04%, 11/25/34 (b) | | | 44 | | | | 14,438 | |
IndyMac INDA Mortgage Loan Trust, Series 2007-AR7, Class 1A1, 5.65%, 9/25/37 (b) | | | 341 | | | | 272,934 | |
JPMorgan Mortgage Trust: | | | | | | | | |
Series 2006-S2, Class 2A2, 5.88%, 6/25/21 | | | 50 | | | | 48,857 | |
Series 2007-S1, Class 1A2, 5.50%, 3/25/22 | | | 51 | | | | 47,305 | |
Residential Accredit Loans, Inc., Series 2006-QO2, Class A1, 0.46%, 2/25/46 (b) | | | 215 | | | | 83,403 | |
Residential Funding Mortgage Securities I: | | | | | | | | |
Series 2005-S8, Class A1, 5.50%, 11/25/35 | | | 460 | | | | 447,383 | |
Series 2007-S4, Class A2, 6.00%, 4/25/37 | | | 610 | | | | 497,602 | |
Structured Adjustable Rate Mortgage Loan Trust, Series 2007-3, Class 3A1, 5.20%, 4/25/47 (b) | | | 815 | | | | 543,685 | |
| | | | | | | | |
| Non-Agency Mortgage-Backed Securities | | Par (000) | | | Value | |
| |
Collateralized Mortgage Obligations (concluded) | |
Structured Asset Securities Corp.: | | | | | | | | |
Series 2001-21A, Class B2, 2.33%, 1/25/32 (b) | | USD | 5 | | | $ | 498 | |
Series 2003-2A, Class B2II, 2.68%, 2/25/33 (b) | | | 37 | | | | 20,636 | |
WaMu Mortgage Pass-Through Certificates: | | | | | | | | |
Series 2003-AR3, Class B2, 2.48%, 4/25/33 (b) | | | 39 | | | | 5,785 | |
Series 2003-AR8, Class B1, 2.49%, 8/25/33 (b) | | | 149 | | | | 77,515 | |
Series 2004-AR1, Class B1, 2.57%, 3/25/34 (b) | | | 681 | | | | 244,290 | |
Series 2004-AR3, Class B1, 2.55%, 6/25/34 (b) | | | 165 | | | | 94,799 | |
Wells Fargo Mortgage Backed Securities Trust, Series 2006-AR10, Class 3A1, 2.71%, 7/25/36 (b) | | | 612 | | | | 600,911 | |
| | | | | | | | |
| | |
| | | | | | | 7,999,868 | |
| |
Commercial Mortgage-Backed Securities – 2.8% | |
Banc of America Merrill Lynch Commercial Mortgage, Inc.: | | | | | | | | |
Series 2006-5, Class AM, 5.45%, 9/10/16 | | | 65 | | | | 62,957 | |
Series 2007-3, Class A4, 5.63%, 5/10/17 (b) | | | 420 | | | | 466,406 | |
Bear Stearns Commercial Mortgage Securities: | | | | | | | | |
Series 2003-T12, Class A4, 4.68%, 8/13/39 (b) | | | 1,025 | | | | 1,064,516 | |
Series 2005-PW10, Class AM, 5.45%, 12/15/15 (b) | | | 70 | | | | 72,775 | |
Series 2007-PW17, Class A3, 5.74%, 6/11/50 | | | 495 | | | | 516,201 | |
Credit Suisse First Boston Mortgage Securities Corp.: | | | | | | | | |
Series 2002-CKN2, Class A3, 6.13%, 4/15/37 | | | 90 | | | | 89,722 | |
Series 2003-C3, Class A5, 3.94%, 5/15/38 | | | 996 | | | | 1,015,866 | |
CW Capital Cobalt Ltd., Series 2006-C1, Class A4, 5.22%, 8/15/48 | | | 330 | | | | 362,124 | |
Deutsche Bank ReREMIC Trust, Series 2011-C32, Class A3A, 5.74%, 6/17/49 (a)(b) | | | 175 | | | | 194,745 | |
Extended Stay America Trust: | | | | | | | | |
Series 2010-ESHA, Class B, 4.22%, 11/05/15 (a) | | | 300 | | | | 303,320 | |
Series 2010-ESHA, Class C, 4.86%, 11/05/15 (a) | | | 105 | | | | 106,316 | |
Series 2010-ESHA, Class D, 5.50%, 11/05/15 (a) | | | 230 | | | | 232,467 | |
GE Business Loan Trust: | | | | | | | | |
Series 2003-1, Class A, 0.67%, 4/15/31 (a)(b) | | | 80 | | | | 73,505 | |
Series 2003-2A, Class B, 1.24%, 11/15/31 (a)(b) | | | 378 | | | | 313,195 | |
Series 2004-1, Class B, 0.94%, 5/15/32 (a)(b) | | | 97 | | | | 75,969 | |
GMAC Commercial Mortgage Securities, Inc., Series 2006-C1, Class AM, 5.29%, 11/10/45 (b) | | | 110 | | | | 112,290 | |
See Notes to Financial Statements.
| | | | | | |
| | | | | | | |
| | | | | | |
| 16 | | BLACKROCK MANAGED VOLATILITY PORTFOLIO | | MARCH 31, 2012 | | |
| | |
| Schedule of Investments (continued) | | (Percentages shown are based on Net Assets) |
| | | | | | | | |
Non-Agency Mortgage-Backed
Securities | | Par (000) | | | Value | |
| |
Commercial Mortgage-Backed Securities (concluded) | |
Greenwich Capital Commercial Funding Corp., Series 2006-GG7, Class AJ, 5.88%, 7/10/38 (b) | | USD | 170 | | | $ | 144,788 | |
GS Mortgage Securities Corp. II, Series 2007-GG10, Class A4, 5.79%, 5/10/17 (b) | | | 405 | | | | 449,427 | |
JPMorgan Chase Commercial Mortgage Securities Corp.: | | | | | | | | |
Series 2004-LN2, Class A2, 5.12%, 8/15/14 | | | 400 | | | | 426,230 | |
Series 2006-CB14, Class AM, 5.45%, 12/12/44 (b) | | | 180 | | | | 185,351 | |
Series 2007-CB18, Class A3, 5.45%, 7/12/16 | | | 441 | | | | 463,350 | |
Series 2007-CB18, Class A4, 5.44%, 1/12/17 | | | 670 | | | | 744,897 | |
Series 2008-C2, Class ASB, 6.13%, 4/12/17 (b) | | | 915 | | | | 987,141 | |
LB-UBS Commercial Mortgage Trust: | | | | | | | | |
Series 2006-C4, Class AM, 5.89%, 6/15/38 (b) | | | 80 | | | | 84,879 | |
Series 2006-C7, Class AM, 5.38%, 10/15/16 | | | 80 | | | | 80,224 | |
Series 2007-C6, Class A4, 5.86%, 7/15/40 (b) | | | 295 | | | | 333,637 | |
Series 2007-C7, Class A3, 5.87%, 9/15/45 (b) | | | 200 | | | | 226,577 | |
Morgan Stanley Capital I: | | | | | | | | |
Series 1998-WF2, Class G, 6.34%, 7/15/30 (a)(b) | | | 290 | | | | 305,305 | |
Series 2003-IQ4, Class A2, 4.07%, 5/15/13 | | | 925 | | | | 945,743 | |
Series 2004-HQ4, Class A7, 4.97%, 4/14/40 | | | 500 | | | | 531,544 | |
Series 2005-HQ6, Class A4A, 4.99%, 8/13/42 | | | 2,000 | | | | 2,196,048 | |
Series 2007-HQ12, Class A2FX, 5.60%, 6/12/12 (b) | | | 349 | | | | 368,142 | |
Series 2012-C4, Class XA, 2.90%, 3/15/22 (a)(b) | | | 2,265 | | | | 351,166 | |
Morgan Stanley ReREMIC Trust: | | | | | | | | |
Series 2009-IO, Class B, 5.04%, 11/17/14 (a)(j) | | | 320 | | | | 280,800 | |
Series 2011-IO, Class A, 2.50%, 1/23/14 (a) | | | 431 | | | | 433,616 | |
Series 2012-XA, Class A, 2.00%, 7/27/49 | | | 384 | | | | 383,971 | |
RBSCF Trust, Series 2010-RR3, Class WBTA, 5.90%, 4/16/17 (a)(b) | | | 820 | | | | 914,683 | |
| | | | | | | | |
| | |
| | | | | | | 15,899,893 | |
| |
Interest Only Collateralized Mortgage Obligations – 0.0% | |
Salomon Brothers Mortgage Securities VI, Inc.: | | | | | | | | |
Series 1987-1, 11.00%, 2/17/17 | | | 7 | | | | 867 | |
Series 1987-2, 11.00%, 3/06/17 | | | 7 | | | | 1,017 | |
| | | | | | | | |
| | |
| | | | | | | 1,884 | |
| |
Interest Only Commercial Mortgage-Backed Securities – 0.0% | |
WaMu Commercial Mortgage Securities Trust, Series 2005-C1A, Class X, 1.35%, 5/25/36 (a)(b) | | | 1,472 | | | | 24,665 | |
| |
| | | | | | | | |
| Non-Agency Mortgage-Backed Securities | | Par (000) | | | Value | |
| |
Principal Only Collateralized Mortgage Obligations – 0.0% | |
Salomon Brothers Mortgage Securities VI, Inc.: | | | | | | | | |
Series 1987-1, 0.71%, 2/17/17 (j) | | | USD 8 | | | $ | 7,989 | |
Series 1987-2, 0.93%, 3/06/17 (j) | | | 7 | | | | 6,443 | |
| | | | | | | | |
| | |
| | | | | | | 14,432 | |
| |
Total Non-Agency Mortgage-Backed Securities – 4.2% | | | | | | | 23,940,742 | |
| |
| |
| | |
Preferred Securities | | | | | | | | |
| |
Capital Trusts | | | | | | | | |
| |
Capital Markets – 0.0% | |
State Street Capital Trust IV, 1.47%, 6/15/37 (b) | | | 30 | | | | 22,050 | |
| |
Commercial Banks – 0.0% | |
Barclays Bank Plc, 5.93% (a)(b)(k) | | | 100 | | | | 92,500 | |
Fifth Third Capital Trust IV, 6.50%, 4/15/37 (b) | | | 245 | | | | 243,775 | |
| | |
| | | | | | | 336,275 | |
| |
Consumer Finance – 0.1% | |
Capital One Capital V, 10.25%, 8/15/39 | | | 100 | | | | 102,750 | |
Capital One Capital VI, 8.88%, 5/15/40 | | | 330 | | | | 332,218 | |
| | |
| | | | | | | 434,968 | |
| |
Diversified Financial Services – 0.0% | |
JPMorgan Chase Capital XXV, 6.80%, 10/01/37 | | | 100 | | | | 100,560 | |
| |
Insurance – 0.2% | | | | | | | | |
American International Group, Inc., 8.18%, 5/15/58 (b) | | | 95 | | | | 100,557 | |
MetLife Capital Trust IV, 7.88%, 12/15/67 (a) | | | 305 | | | | 333,975 | |
Swiss Re Capital I LP, 6.85% (a)(b)(k) | | | 265 | | | | 250,152 | |
XL Group Plc, 6.50% (b)(k) | | | 280 | | | | 235,900 | |
| | |
| | | | | | | 920,584 | |
| |
Total Capital Trusts – 0.3% | | | | | | | 1,814,437 | |
| |
| |
| | |
| Preferred Stocks | | Shares | | | | |
| |
Thrifts & Mortgage Finance – 0.0% | |
Fannie Mae, 7.75% | | | 10,000 | | | | 13,500 | |
Freddie Mac, 8.38% | | | 10,000 | | | | 13,890 | |
| |
| | |
Total Preferred Stocks – 0.0% | | | | | | | 27,390 | |
| |
| |
| Trust Preferreds | | | | | | |
| |
Diversified Financial Services – 0.1% | |
Citigroup Capital XIII, 7.88%, 10/30/40 (b) | | | 7,286 | | | | 198,179 | |
| |
| | |
Total Preferred Securities – 0.4% | | | | | | | 2,040,006 | |
| |
| |
See Notes to Financial Statements.
| | | | | | |
| | | | | | | |
| | | | | | |
| | BLACKROCK MANAGED VOLATILITY PORTFOLIO | | MARCH 31, 2012 | | 17 |
| | |
| Schedule of Investments (continued) | | (Percentages shown are based on Net Assets) |
| | | | | | | | |
| Taxable Municipal Bonds | | Par (000) | | | Value | |
| |
New York City Municipal Water Finance Authority RB: | | | | | | | | |
5.38%, 6/15/43 | | USD | 215 | | | $ | 241,079 | |
5.50%, 6/15/43 | | | 260 | | | | 295,175 | |
| |
| |
Total Taxable Municipal Bonds – 0.1% | | | | 536,254 | |
| |
| |
| |
| U.S. Government Sponsored Agency Securities | | | | |
| |
Agency Obligations – 0.7% | | | | | | | | |
Fannie Mae, 3.45%, 10/09/19 (j) | | | 575 | | | | 444,660 | |
Federal Home Loan Bank, 5.63%, 6/13/16 (l) | | | 890 | | | | 1,012,710 | |
Freddie Mac, 5.25%, 4/18/16 | | | 760 | | | | 888,828 | |
Resolution Funding Corp. Interest Strip: | | | | | | | | |
1.80%, 7/15/18 (j) | | | 150 | | | | 134,002 | |
1.87%, 10/15/18 (j) | | | 150 | | | | 132,835 | |
Tennessee Valley Authority, 5.25%, 9/15/39 | | | 895 | | | | 1,073,109 | |
U.S. Small Business Administration, Series 1997-20F, Class 1, 7.20%, 6/01/17 | | | 131 | | | | 145,133 | |
| | | | | | | | |
| | |
| | | | | | | 3,831,277 | |
| |
Collateralized Mortgage Obligations – 0.2% | |
Fannie Mae, Series 2004-88, Class HA, 6.50%, 7/25/34 | | | 7 | | | | 7,682 | |
Freddie Mac: | | | | | | | | |
Series 2864, Class NA, 5.50%, 1/15/31 | | | 29 | | | | 29,532 | |
Series K013, Class A2, 3.97%, 1/25/21 (b) | | | 450 | | | | 490,099 | |
Series K017, Class A2, 2.60%, 12/25/21 | | | 970 | | | | 972,879 | |
| | | | | | | | |
| | |
| | | | | | | 1,500,192 | |
| |
Federal Deposit Insurance Corporation Guaranteed – 0.1% | |
General Electric Capital Corp., 2.13%, 12/21/12 | | | 385 | | | | 390,268 | |
| |
Interest Only Collateralized Mortgage Obligations – 0.3% | |
Fannie Mae, Series 2003-T1, Class IO, 0.48%, 11/25/12 (b) | | | 5,965 | | | | 18,409 | |
Ginnie Mae: | | | | | | | | |
Series 2010-20, Class SE, 6.01%, 2/20/40 (b) | | | 440 | | | | 76,976 | |
Series 2010-24, Class BS, 6.19%, 12/20/38 (b) | | | 502 | | | | 76,944 | |
Series 2010-26, Class QS, 6.01%, 2/20/40 (b) | | | 3,623 | | | | 704,102 | |
Series 2010-98, Class YS, 6.36%, 12/20/39 (b) | | | 1,660 | | | | 289,440 | |
Series 2010-146, Class LS, 6.46%, 4/20/39 (b) | | | 495 | | | | 77,236 | |
Series 2010-147, Class SA, 5.93%, 5/20/40 (b) | | | 1,529 | | | | 271,642 | |
Series 2011-80, Class KS, 6.43%, 6/20/41 (b) | | | 901 | | | | 155,981 | |
| | | | | | | | |
| | |
| | | | | | | 1,670,730 | |
| |
Interest Only Commercial Mortgage-Backed Securities – 0.0% | |
Freddie Mac, Series K706, Class X1, 1.60%, 10/25/18 (b) | | | 1,285 | | | | 112,724 | |
| |
| | | | | | | | |
U.S. Government Sponsored Agency
Securities | | Par (000) | | | Value | |
| |
Mortgage-Backed Securities – 13.9% | |
Fannie Mae Mortgage-Backed Securities: | | | | | | | | |
7.00%, 8/01/14-1/01/16 | | USD | 27 | | | $ | 27,951 | |
4.00%, 2/01/25-4/01/42 (m) | | | 9,370 | | | | 9,912,016 | |
3.50%, 11/01/26-4/01/42 (m) | | | 9,507 | | | | 9,799,988 | |
4.50%, 4/01/27-6/01/41 (m) | | | 16,194 | | | | 17,282,082 | |
6.00%, 12/01/28-4/01/42 (m) | | | 11,503 | | | | 12,694,333 | |
5.00%, 9/01/33-4/01/42 (m) | | | 4,123 | | | | 4,460,942 | |
5.50%, 9/01/34-4/01/42 (m) | | | 4,736 | | | | 5,194,786 | |
2.33%, 12/01/34 (b) | | | 380 | | | | 401,096 | |
6.50%, 7/01/37-10/01/39 | | | 1,811 | | | | 2,031,507 | |
3.31%, 12/01/40 (b) | | | 422 | | | | 443,915 | |
3.09%, 3/01/41 (b) | | | 161 | | | | 167,954 | |
3.15%, 3/01/41 (b) | | | 302 | | | | 314,634 | |
Freddie Mac Mortgage-Backed Securities: | | | | | | | | |
6.00%, 4/01/13-6/01/16 | | | 17 | | | | 18,494 | |
9.50%, 12/01/22 | | | 74 | | | | 84,285 | |
8.00%, 2/01/23-8/01/27 | | | 10 | | | | 11,333 | |
5.50%, 8/01/33-4/01/42 (m) | | | 113 | | | | 122,222 | |
2.36%, 12/01/35 (b) | | | 218 | | | | 231,492 | |
4.95%, 4/01/38 (b) | | | 407 | | | | 432,794 | |
3.05%, 2/01/41 (b) | | | 332 | | | | 346,718 | |
4.50%, 4/01/42 (m) | | | 200 | | | | 211,906 | |
5.00%, 4/01/42 (m) | | | 2,300 | | | | 2,472,859 | |
Ginnie Mae Mortgage-Backed Securities: | | | | | | | | |
5.50%, 4/15/33-4/15/42 (m) | | | 1,619 | | | | 1,811,086 | |
5.00%, 10/20/33-4/15/42 (m) | | | 3,642 | | | | 4,025,169 | |
1.75%, 5/20/34 (b) | | | 76 | | | | 78,795 | |
4.00%, 4/15/42 (m) | | | 1,600 | | | | 1,717,000 | |
4.50%, 4/15/42 (m) | | | 2,900 | | | | 3,154,656 | |
6.00%, 4/15/42 (m) | | | 1,300 | | | | 1,468,187 | |
| | | | | | | | |
| | |
| | | | | | | 78,918,200 | |
| |
Total U.S. Government Sponsored Agency Securities – 15.2% | | | | 86,423,391 | |
| |
| |
| | |
| U.S. Treasury Obligations | | | | | | |
| |
U.S. Treasury Bonds: | | | | | | | | |
8.13%, 5/15/21-8/15/21 | | | 2,140 | | | | 3,241,354 | |
6.25%, 8/15/23 | | | 1,700 | | | | 2,354,500 | |
3.50%, 2/15/39 | | | 1,380 | | | | 1,433,690 | |
4.25%, 5/15/39 (g) | | | 2,020 | | | | 2,379,813 | |
4.38%, 5/15/40-5/15/41 | | | 870 | | | | 1,045,667 | |
4.75%, 2/15/41 | | | 1,400 | | | | 1,784,343 | |
3.13%, 11/15/41-2/15/42 | | | 12,899 | | | | 12,371,916 | |
U.S. Treasury Inflation Indexed Bonds: | | | | | | | | |
2.13%, 2/15/41 | | | 823 | | | | 1,085,078 | |
0.75%, 2/15/42 | | | 767 | | | | 731,475 | |
See Notes to Financial Statements.
| | | | | | |
| | | | | | | |
| | | | | | |
| 18 | | BLACKROCK MANAGED VOLATILITY PORTFOLIO | | MARCH 31, 2012 | | |
| | |
| Schedule of Investments (continued) | | (Percentages shown are based on Net Assets) |
| | | | | | | | |
| U.S. Treasury Obligations | | Par (000) | | | Value | |
| |
U.S. Treasury Notes: | | | | | | | | |
0.25%, 1/31/14-2/15/15 (g) | | | USD 4,610 | | | $ | 4,580,625 | |
0.50%, 8/15/14 | | | 525 | | | | 525,943 | |
0.38%, 3/15/15 | | | 1,675 | | | | 1,668,588 | |
2.50%, 4/30/15 | | | 610 | | | | 646,028 | |
0.88%, 2/28/17 (g) | | | 2,227 | | | | 2,211,342 | |
1.00%, 3/31/17 | | | 3,415 | | | | 3,407,798 | |
2.25%, 7/31/18 | | | 1,370 | | | | 1,437,857 | |
2.63%, 8/15/20 | | | 595 | | | | 627,307 | |
2.00%, 2/15/22 (g) | | | 8,467 | | | | 8,304,273 | |
| |
| |
Total U.S. Treasury Obligations – 8.8% | | | | 49,837,597 | |
| |
Total Long-Term Investments (Cost – $446,178,781) – 87.4% | | | | 496,608,308 | |
| |
| |
Short-Term Securities | | Shares | | | | |
| |
BlackRock Liquidity Funds, TempFund, Institutional Class, 0.14% (i)(n) | | | 114,236,739 | | | | 114,236,739 | |
| |
| | | Beneficial Interest (000) | | | | |
| |
BlackRock Liquidity Series, LLC Money Market Series, 0.24% (i)(n)(o) | | | USD 2,591 | | | | 2,590,791 | |
| |
Total Short-Term Securities (Cost – $116,827,530) – 20.6% | | | | 116,827,530 | |
| |
| |
Options Purchased | | Contracts | | | | |
| |
Exchange-Traded Put Options – 0.0% | |
Euro Dollar (2 Year) Mid-Curve, Strike Price USD 99, Expires 5/11/12 | | | 111 | | | | 29,831 | |
| |
| | | Notional Amount (000) | | | | |
| |
Over-the-Counter Put Options – 0.0% | |
AUD Currency, Strike Price USD 1, Expires 6/27/12, Broker Citibank, N.A. | | | AUD 4,485 | | | | 70,830 | |
| |
Over-the-Counter Interest Rate Call Swaptions – 0.0% | |
Receive a fixed rate of 1.900% and pay a floating rate based on 3-month LIBOR, Expires 6/01/12, Broker Morgan Stanley Capital Services, Inc. | | | USD 1,600 | | | | 2,018 | |
Receive a fixed rate of 2.650% and pay a floating rate based on 3-month LIBOR, Expires 5/01/12, Broker Bank of America, N.A. | | | 1,700 | | | | 2,310 | |
| | |
| | | | | | | 4,328 | |
| |
Over-the-Counter Interest Rate Put Swaptions – 0.0% | |
Pay a fixed rate of 2.130% and receive a floating rate based on 3-month LIBOR, Expires 3/21/13, Broker Deutsche Bank AG | | | 3,100 | | | | 28,154 | |
Pay a fixed rate of 2.700% and receive a floating rate based on 3-month LIBOR, Expires 7/23/12, Broker Deutsche Bank AG | | | 1,700 | | | | 15,946 | |
Pay a fixed rate of 2.750% and receive a floating rate based on 3-month LIBOR, Expires 5/11/12, Broker JPMorgan Chase Bank, N.A. | | | 1,800 | | | | 3,429 | |
| | | | | | | | |
| Options Purchased | | Notional
Amount
(000) | | | Value | |
| |
Over-the-Counter Interest Rate Put Swaptions (concluded) | |
Pay a fixed rate of 2.950% and receive a floating rate based on 3-month LIBOR, Expires 6/14/12, Broker Deutsche Bank AG | | USD | 600 | | | $ | 28,621 | |
Pay a fixed rate of 4.500% and receive a floating rate based on 3-month LIBOR, Expires 3/20/17, Broker Deutsche Bank AG | | | 1,100 | | | | 47,327 | |
| | | | | | | | |
| | |
| | | | | | | 123,477 | |
| |
Total Options Purchased (Cost – $308,724) – 0.0% | | | | 228,466 | |
| |
Total Investments Before TBA Sale Commitments and Options Written (Cost – $563,315,035) – 108.0% | | | | | | | 613,664,304 | |
| |
| |
| TBA Sale Commitments (m) | | Par (000) | | | | |
| |
Fannie Mae Mortgage-Backed Securities: | | | | | | | | |
4.00%, 4/01/27-4/01/42 | | | 8,990 | | | | (9,436,337 | ) |
3.50%, 4/01/42 | | | 4,800 | | | | (4,929,000 | ) |
4.50%, 4/01/42 | | | 8,300 | | | | (8,825,672 | ) |
5.00%, 4/01/42 | | | 700 | | | | (754,908 | ) |
5.50%, 4/01/42 | | | 4,700 | | | | (5,116,011 | ) |
6.00%, 4/01/42 | | | 600 | | | | (660,938 | ) |
| |
| |
Total TBA Sale Commitments (Proceeds – $29,661,663) – (5.2)% | | | | (29,722,866 | ) |
| |
| |
| Options Written | | Notional
Amount (000) | | | | |
| |
Over-the-Counter Interest Rate Call Swaptions – (0.0)% | |
Pay a fixed rate of 1.965% and receive a floating rate based on 3-month LIBOR, Expires 1/27/14, Broker Citibank, N.A. | | | 1,200 | | | | (19,403 | ) |
Pay a fixed rate of 2.090% and receive a floating rate based on 3-month LIBOR, Expires 1/03/14, Broker Deutsche Bank AG | | | 2,000 | | | | (39,254 | ) |
Pay a fixed rate of 3.645% and receive a floating rate based on 3-month LIBOR, Expires 3/27/17, Broker JPMorgan Chase Bank, N.A. | | | 500 | | | | (33,805 | ) |
| | |
| | | | | | | (92,462 | ) |
| |
Over-the-Counter Interest Rate Put Swaptions – (0.1)% | |
Receive a fixed rate of 1.618% and pay a floating rate based on 3-month LIBOR, Expires 6/28/12, Broker Bank of America, N.A. | | | 1,500 | | | | (5,198 | ) |
Receive a fixed rate of 1.703% and pay a floating rate based on 3-month LIBOR, Expires 8/10/12, Broker Bank of America, N.A. | | | 1,900 | | | | (8,710 | ) |
Receive a fixed rate of 1.715% and pay a floating rate based on 3-month LIBOR, Expires 6/22/12, Broker Morgan Stanley Capital Services, Inc. | | | 3,200 | | | | (7,480 | ) |
Receive a fixed rate of 1.850% and pay a floating rate based on 3-month LIBOR, Expires 8/15/12, Broker Deutsche Bank AG | | | 9,400 | | | | (31,742 | ) |
See Notes to Financial Statements.
| | | | | | |
| | | | | | | |
| | | | | | |
| | BLACKROCK MANAGED VOLATILITY PORTFOLIO | | MARCH 31, 2012 | | 19 |
| | |
| Schedule of Investments (continued) | | (Percentages shown are based on Net Assets) |
| | | | | | | | |
| Options Written | | Notional
Amount
(000) | | | Value | |
| |
Over-the-Counter Interest Rate Put Swaptions (concluded) | |
Receive a fixed rate of 1.965% and pay a floating rate based on 3-month LIBOR, Expires 1/27/14, Broker Citibank, N.A. | | | USD 1,200 | | | $ | (32,672 | ) |
Receive a fixed rate of 2.090% and pay a floating rate based on 3-month LIBOR, Expires 1/03/14, Broker Deutsche Bank AG | | | 2,000 | | | | (46,588 | ) |
Receive a fixed rate of 2.900% and pay a floating rate based on 3-month LIBOR, Expires 1/09/13, Broker Citibank, N.A. | | | 2,900 | | | | (54,138 | ) |
Receive a fixed rate of 3.645% and pay a floating rate based on 3-month LIBOR, Expires 3/27/17, Broker JPMorgan Chase Bank, N.A. | | | 500 | | | | (34,114 | ) |
Receive a fixed rate of 6.000% and pay a floating rate based on 3-month LIBOR, Expires 3/20/17, Broker Deutsche Bank AG | | | 2,200 | | | | (43,558 | ) |
| | | | | | | | |
| | |
| | | | | | | (264,200 | ) |
| |
Total Options Written (Premiums Received – $404,303) – (0.1)% | | | | (356,662 | ) |
| |
Total Investments Net of TBA Sale Commitments and Options Written – 102.7% | | | | 583,584,776 | |
Liabilities in Excess of Other Assets – (2.7)% | | | | (15,343,437 | ) |
| | | | | | | | |
Net Assets – 100.0% | | | | | | $ | 568,241,339 | |
| | | | | | | | |
| (a) | Security exempt from registration pursuant to Rule 144A under the Securities Act of 1933. These securities may be resold in transactions exempt from registration to qualified institutional investors. |
| (b) | Variable rate security. Rate shown is as of report date. |
| (c) | Non-income producing security. |
| (d) | Security, or a portion of security, is on loan. |
| (e) | Restricted security as to resale. As of report date, the Fund held less than 0.1% of its net assets, with a current value of $49,383 and an original cost of $56,451, in these securities. |
| (f) | Represents a payment-in-kind security which may pay interest/dividends in additional par/shares. |
| (g) | All or a portion of security has been pledged as collateral in connection with open reverse repurchase agreements. |
| (h) | Represents a step-up bond that pays an initial coupon rate for the first period and then a higher coupon rate for the following periods. Rate shown is as of report date. |
| (i) | Investments in companies considered to be an affiliate of the Fund during the period, for purposes of Section 2(a)(3) of the Investment Company Act of 1940, as amended, were as follows: |
| | | | | | | | | | | | | | | | | | | | |
| |
| Affiliate | | Shares/
Bene- ficial
Interest
Held at
Sep- tember 30, 2011 | | | Net Activity | | | Shares/
Bene- ficial
Interest
Held at
March 31,
2012 | | | Value at
March 31,
2012 | | | Income | |
| |
| | | | | |
BlackRock Liquidity Funds, Temp- Fund, Institu- tional Class | | | 91,218,601 | | | | 23,018,138 | | | | 114,236,739 | | | $ | 114,236,739 | | | $ | 46,878 | |
| | | | | | | | | | | | | | | | | | | | |
| |
| Affiliate | | Shares/ Bene- ficial Interest
Held at
Sep- tember 30,
2011 | | | Net
Activity | | | Shares/
Bene- ficial
Interest
Held at
March 31,
2012 | | | Value at
March 31,
2012 | | | Income | |
| |
| | | | | |
BlackRock Liquidity Series, LLC Money Market Series | | | 2,411,435 | | | | 179,356 | | | | 2,590,791 | | | $ | 2,590,791 | | | $ | 26,972 | |
| | | | | |
iShares iBoxx $ High Yield Corporate Bonds Fund | | | – | | | | 125,000 | | | | 125,000 | | | $ | 11,355,000 | | | | – | |
| |
| (j) | Represents a zero-coupon bond. Rate shown reflects the current yield as of report date. |
| (k) | Security is perpetual in nature and has no stated maturity date. |
| (l) | All or a portion of security has been pledged as collateral in connection with open financial futures contracts. |
| (m) | Represents or includes a to-be-announced (“TBA”) transaction. Unsettled TBA transactions as of March 31, 2012 were as follows: |
| | | | | | | | |
| |
| Counterparty | | Value | | | Unrealized
Appreciation
(Depreciation) | |
| |
Bank of America, N.A. | | $ | (174,016) | | | $ | (2,945) | |
Barclays Bank Plc | | $ | 1,971,531 | | | $ | 4,234 | |
BNP Paribas SA | | $ | 7,495,122 | | | $ | (20,850) | |
Citibank, N.A. | | $ | 4,720,672 | | | $ | 3,063 | |
Credit Suisse International | | $ | (2,470,500) | | | $ | (4,236) | |
Deutsche Bank AG | | $ | (8,459,000) | | | $ | (12,914) | |
Goldman Sachs Bank USA | | $ | (3,517,650) | | | $ | (26,002) | |
JPMorgan Chase Bank, N.A. | | $ | 2,179,723 | | | $ | (3,668) | |
Morgan Stanley Capital Services, Inc. | | $ | 2,034,766 | | | $ | (7,582) | |
Nomura Securities International, Inc. | | $ | 1,334,938 | | | $ | 4,469 | |
Royal Bank of Scotland Plc | | $ | (856,408) | | | $ | (1,767) | |
UBS AG | | $ | 718,813 | | | $ | 2,324 | |
| |
| (n) | Represents the current yield as of report date. |
| (o) | Security was purchased with the cash collateral from loaned securities. |
| — | | Reverse repurchase agreements outstanding as of March 31, 2012 were as follows: |
| | | | | | | | | | | | | | |
| |
| Counterparty | | Interest
Rate | | Trade
Date | | Maturity
Date | | Net Closing
Amount | | | Face
Amount | |
| |
Bank of America, N.A. | | 0.11% | | 2/07/12 | | Open | | | $2,389,012 | | | | $2,388,625 | |
Deutsche Bank AG | | (1.25)% | | 3/12/12 | | Open | | | 173,136 | | | | 173,250 | |
BNP Paribas SA | | (0.51)% | | 3/30/12 | | 4/02/12 | | | 2,215,771 | | | | 2,215,865 | |
See Notes to Financial Statements.
| | | | | | |
| | | | | | | |
| | | | | | |
| 20 | | BLACKROCK MANAGED VOLATILITY PORTFOLIO | | MARCH 31, 2012 | | |
| | |
| Schedule of Investments (continued) | | |
| | | | | | | | | | | | | | |
| |
| Counterparty | | Interest
Rate | | Trade
Date | | Maturity
Date | | Net Closing
Amount | | | Face
Amount | |
| |
Morgan Stanley Capital Services, Inc. | | (0.05)% | | 3/30/12 | | 4/02/12 | | $ | 1,974,992 | | | $ | 1,975,000 | |
Bank of America, N.A. | | 0.03% | | 3/30/12 | | 4/02/12 | | | 3,925,347 | | | | 3,925,338 | |
| |
| | | | | |
Total | | | | | | | | $ | 10,678,258 | | | $ | 10,678,078 | |
| | | | | | | | | | |
| — | | Foreign currency exchange contracts as of March 31, 2012 were as follows: |
| | | | | | | | | | | | |
| |
Currency
Purchased | | Currency Sold | | | Counter- party | | Settle- ment
Date | | Unrea- lized Appre- ciation
(Depre- ciation) | |
| |
| | | | |
| USD 229,368 | | JPY | 19,050,848 | | | State Street Bank | | 4/02/12 | | | $ (798 | ) |
| | | | |
| CAD 53,858 | | USD | 54,041 | | | Citibank, N.A. | | 4/03/12 | | | (45 | ) |
| | | | |
| CHF 113,546 | | USD | 125,757 | | | Goldman Sachs Bank USA | | 4/03/12 | | | 28 | |
| | | | |
| EUR 229,063 | | USD | 305,616 | | | Goldman Sachs Bank USA | | 4/03/12 | | | (113 | ) |
| | | | |
| GBP 256,309 | | USD | 409,813 | | | Goldman Sachs Bank USA | | 4/03/12 | | | 151 | |
| | | | |
| HKD 629,388 | | USD | 81,068 | | | Citibank, N.A. | | 4/03/12 | | | (19 | ) |
| | | | |
| JPY 15,227,843 | | USD | 185,797 | | | Citibank, N.A. | | 4/04/12 | | | (1,819 | ) |
| | | | |
| SGD 24,886 | | USD | 19,823 | | | Citibank, N.A. | | 4/04/12 | | | (26 | ) |
| | | | |
| USD 470,269 | | AUD | 442,500 | | | Citibank, N.A. | | 4/10/12 | | | 12,474 | |
| | | | |
| USD 939,976 | | AUD | 885,000 | | | UBS AG | | 4/10/12 | | | 24,386 | |
| | | | |
| AUD 1,265,000 | | USD | 1,310,761 | | | Citibank, N.A. | | 4/12/12 | | | (2,333 | ) |
| | | | |
| USD 1,310,863 | | AUD | 1,265,000 | | | Citibank, N.A. | | 4/12/12 | | | 2,434 | |
| | | | |
| USD 466,294 | | AUD | 440,000 | | | UBS AG | | 4/12/12 | | | 11,189 | |
| | | | |
| PHP 25,925,392 | | USD | 610,000 | | | Royal Bank of Scotland Plc | | 4/17/12 | | | (6,972 | ) |
| | | | |
| SGD 757,254 | | USD | 610,000 | | | HSBC Bank USA, N.A. | | 4/17/12 | | | (7,586 | ) |
| | | | |
| USD 610,000 | | PHP | 26,053,100 | | | Morgan Stanley Capital Services, Inc. | | 4/17/12 | | | 4,001 | |
| | | | |
| USD 610,000 | | SGD | 769,814 | | | Standard Chartered Bank | | 4/17/12 | | | (2,406 | ) |
| | | | |
| EUR 547,000 | | USD | 720,620 | | | Citibank, N.A. | | 4/18/12 | | | 8,976 | |
| | | | |
| EUR 907,000 | | USD | 1,219,849 | | | Deutsche Bank AG | | 4/18/12 | | | (10,080 | ) |
| | | | |
| USD 2,136,124 | | EUR | 1,663,000 | | | Citibank, N.A. | | 4/18/12 | | | (82,009 | ) |
| | | | |
| USD 991,638 | | EUR | 758,000 | | | Citibank, N.A. | | 4/18/12 | | | (19,392 | ) |
| | | | |
| USD 1,463,595 | | EUR | 1,113,000 | | | Deutsche Bank AG | | 4/18/12 | | | (20,940 | ) |
| | | | |
| AUD 1,608,000 | | USD | 1,643,416 | | | Citibank, N.A. | | 4/19/12 | | | 18,472 | |
| | | | |
| USD 866,796 | | AUD | 817,000 | | | Citibank, N.A. | | 4/19/12 | | | 22,416 | |
| | | | |
| USD 505,000 | | JPY | 41,649,875 | | | Citibank, N.A. | | 6/18/12 | | | 1,429 | |
| | | | |
| USD 475,000 | | JPY | 39,706,057 | | | Deutsche Bank AG | | 6/18/12 | | | (5,069 | ) |
| |
| | | | |
| Total | | | | | | | | | | | $(53,651 | ) |
| | | | | | | | | | | | |
| — | | Financial futures contracts purchased as of March 31, 2012 were as follows: |
| | | | | | | | | | | | | | |
| |
Con- tracts | | Issue | | Ex- change | | Expi- ration | | Notional
Value | | | Unrea- lized Appre- ciation (Depre- ciation) | |
| |
| 237 | | DAX Index Futures | | Eurex | | June 2012 | | $ | 55,007,302 | | | $ | (1,091,100 | ) |
| 705 | | Nikkei 225 Futures | | Chicago Mercantile | | June 2012 | | $ | 43,290,594 | | | | 2,296,883 | |
| 65 | | U.S. Treasury Notes (2 Year) | | Chicago Board Options | | June 2012 | | $ | 14,309,141 | | | | (5,819 | ) |
| 141 | | U.S. Treasury Notes (5 Year) | | Chicago Board Options | | June 2012 | | $ | 17,278,008 | | | | 50,126 | |
| 50 | | U.S. Treasury Bonds (30 Year) | | Chicago Board Options | | June 2012 | | $ | 6,887,500 | | | | (46,175 | ) |
| 1 | | Euro Dollar Futures | | Chicago Mercantile | | June 2013 | | $ | 248,488 | | | | 190 | |
| 3 | | Euro Dollar Futures | | Chicago Mercantile | | September 2013 | | $ | 744,900 | | | | 658 | |
| 2 | | Euro Dollar Futures | | Chicago Mercantile | | December 2013 | | $ | 496,100 | | | | 430 | |
| |
| | | | | |
| Total | | | | | | | | | | | | $ | 1,205,193 | |
| | | | | | | | | | | | | | |
| — | | Financial futures contracts sold as of March 31, 2012 were as follows: |
| | | | | | | | | | | | |
| |
Con- tracts | | Issue | | Ex- change | | Expi- ration | | Notional
Value | | Unrea- lized Appre- ciation
(Depre- ciation) | |
| |
| 224 | | E-Mini S&P 500® Futures | | Chicago Mercantile | | June 2012 | | $15,715,840 | | | $(140,201 | ) |
| 1 | | Euro-Bobl | | Eurex | | June 2012 | | $ 165,526 | | | 81 | |
| 7 | | Euro-Bund | | Eurex | | June 2012 | | $ 1,292,935 | | | 103 | |
| 85 | | U.S. Treasury Notes (10 Year) | | Chicago Board Options | | June 2012 | | $11,006,172 | | | (17,465 | ) |
| 112 | | Ultra Treasury Bonds | | Chicago Board Options | | June 2012 | | $16,908,500 | | | 753,160 | |
| 5 | | Euro Dollar Futures | | Chicago Mercantile | | June 2012 | | $ 1,244,125 | | | 163 | |
| 2 | | Euro Dollar Futures | | Chicago Mercantile | | March 2013 | | $ 497,250 | | | (70 | ) |
| 7 | | Euro Dollar Futures | | Chicago Mercantile | | March 2014 | | $ 1,734,600 | | | 2,156 | |
| 6 | | Euro Dollar Futures | | Chicago Mercantile | | June 2014 | | $ 1,484,850 | | | 2,573 | |
| 4 | | Euro Dollar Futures | | Chicago Mercantile | | September 2014 | | $ 988,450 | | | 1,985 | |
| 1 | | Euro Dollar Futures | | Chicago Mercantile | | December 2014 | | $ 246,663 | | | 105 | |
| | | | | | |
See Notes to Financial Statements. | | |
| | | | | | | |
| | | | | | |
| | BLACKROCK MANAGED VOLATILITY PORTFOLIO | | MARCH 31, 2012 | | 21 |
| | |
| Schedule of Investments (continued) | | |
| | | | | | | | | | | | |
| |
Con- tracts | | Issue | | Exchange | | Expiration | | Notional Value | | Unrea- lized Appre- ciation (Depre- ciation) | |
| |
43 | | Euro
Dollar
Futures | | Chicago
Mercantile | | March
2015 | | $10,587,675 | | | $ 12,822 | |
44 | | Euro
Dollar
Futures | | Chicago
Mercantile | | June 2015 | | $10,813,000 | | | 15,209 | |
44 | | Euro
Dollar
Futures | | Chicago
Mercantile | | September
2015 | | $10,792,650 | | | 16,721 | |
44 | | Euro
Dollar
Futures | | Chicago
Mercantile | | December
2015 | | $10,772,850 | | | 17,852 | |
| |
| | | | | |
Total | | | | | | | | | | | $665,194 | |
| | | | | | | | | | | | |
| — | | Interest rate swaps outstanding as of March 31, 2012 were as follows: |
| | | | | | | | | | | | | | |
| |
Fixed
Rate | | Floating
Rate | | Counter- party | | Expiration
Date | | Notional
Amount
(000) | | | Unrea- lized Appre- ciation
(Depre- ciation) | |
| |
| | | | | |
| 0.92%1 | | 3-month LIBOR | | Deutsche Bank AG | | 2/28/13 | | USD | 4,600 | | | | $ (18,954 | ) |
| | | | | |
| 1.32%1 | | 3-month LIBOR | | Citibank, N.A. | | 12/17/13 | | USD | 1,600 | | | | (26,775 | ) |
| | | | | |
| 1.41%1 | | 3-month LIBOR | | Deutsche Bank AG | | 12/20/13 | | USD | 2,400 | | | | (44,349 | ) |
| | | | | |
| 1.26%1 | | 3-month LIBOR | | Deutsche Bank AG | | 12/24/13 | | USD | 1,900 | | | | (29,185 | ) |
| | | | | |
| 0.60%1 | | 3-month LIBOR | | Deutsche Bank AG | | 3/15/14 | | USD | 2,600 | | | | (1,031 | ) |
| | | | | |
| 1.25%1 | | 3-month LIBOR | | Deutsche Bank AG | | 10/05/16 | | USD | 1,600 | | | | (14,965 | ) |
| | | | | |
| 1.39%1 | | 3-month LIBOR | | Deutsche Bank AG | | 3/19/17 | | USD | 6,500 | | | | (41,078 | ) |
| | | | | |
| 1.39%1 | | 3-month LIBOR | | Deutsche Bank AG | | 3/19/17 | | USD | 2,800 | | | | (17,695 | ) |
| | | | | |
| 2.38%1 | | 3-month LIBOR | | Morgan Stanley Capital Services, Inc. | | 11/17/17 | | USD | 300 | | | | (17,688 | ) |
| | | | | |
| 1.74%2 | | 3-month LIBOR | | Deutsche Bank AG | | 3/30/18 | | USD | 500 | | | | (361 | ) |
| | | | | |
| 2.57%2 | | 3-month LIBOR | | Deutsche Bank AG | | 10/27/20 | | USD | 400 | | | | 19,613 | |
| | | | | |
| 3.27%1 | | 3-month LIBOR | | Deutsche Bank AG | | 5/16/21 | | USD | 440 | | | | (46,152 | ) |
| | | | | |
| 2.08%2 | | 3-month LIBOR | | Deutsche Bank AG | | 1/03/22 | | USD | 100 | | | | (1,205 | ) |
| | | | | |
| 2.36%2 | | 3-month LIBOR | | Deutsche Bank AG | | 3/20/22 | | USD | 300 | | | | 2,180 | |
| | | | | |
| 2.46%1 | | 3-month LIBOR | | Goldman Sachs Bank USA | | 3/22/22 | | USD | 1,700 | | | | (27,506 | ) |
| | | | | |
| 2.36%1 | | 3-month LIBOR | | Citibank, N.A. | | 3/26/22 | | USD | 900 | | | | (6,330 | ) |
| | | | | |
| 2.29%2 | | 3-month LIBOR | | Morgan Stanley Capital Services, Inc. | | 4/03/22 | | USD | 500 | | | | 21 | |
| | | | | | | | | | | | | | |
| |
Fixed
Rate | | Floating
Rate | | Counter- party | | Expiration
Date | | Notional
Amount
(000) | | | Unrea- lized Appre- ciation
(Depre- ciation) | |
| |
| | | | | |
| 2.70%1 | | 3-month LIBOR | | Deutsche Bank AG | | 1/11/42 | | USD | 500 | | | $ | 33,034 | |
| | | | | |
| 2.85%1 | | 3-month LIBOR | | Bank of America, N.A. | | 2/09/42 | | USD | 200 | | | | 7,447 | |
| |
| | | | | |
| Total | | | | | | | | | | | | $ | (230,979 | ) |
| | | | | | | | | | | | | | |
| 1 | Fund pays a fixed interest rate and receives a floating rate. |
| 2 | Fund pays a floating interest rate and receives a fixed rate. |
| — | | Credit default swaps on single-name issues - buy protection outstanding as of March 31, 2012 were as follows: |
| | | | | | | | | | | | |
| |
| Issuer | | Pay
Fixed
Rate | | Counter- party | | Expiration
Date | | Notional
Amount
(000) | | Unrealized
Appreciation
(Depreciation) | |
| |
| | | | | |
| Radian Group, Inc. | | 5.00% | | Citibank, N.A. | | 6/20/15 | | USD 750 | | $ | 154,272 | |
| | | | | |
| The New York Times Co. | | 1.00% | | Barclays Bank Plc | | 12/20/16 | | USD 1,000 | | | (16,061 | ) |
| | | | | |
| Sara Lee Corp. | | 1.00% | | JPMorgan Chase Bank, N.A. | | 3/20/17 | | USD 202 | | | (363 | ) |
| |
| | | | | |
Total | | | | | | | | | | $ | 137,848 | |
| | | | | | | | | | | | |
| — | | Credit default swaps on single-name issues - sold protection outstanding as of March 31, 2012 were as follows: |
| | | | | | | | | | | | | | | | | | | | |
| |
| Issuer | | Receive
Fixed Rate | | | Counter-
party | | Expi- ration
Date | | | Issuer Credit
Rating1 | | Notio- nal
Amount
(000)2 | | | Unrea- lized
Appre- ciation | |
| |
| | | | | | |
| Aviva USA Corp. | | | 1.00% | | | Deutsche
Bank AG | | | 5/25/12 | | | Not
Rated | | | USD 560 | | | $ | 3,696 | |
| | | | | | |
| MetLife, Inc. | | | 1.00% | | | Credit
Suisse
International | | | 9/20/16 | | | A- | | | USD 70 | | | | 2,985 | |
| | | | | | |
| MetLife, Inc. | | | 1.00% | | | Deutsche
Bank AG | | | 9/20/16 | | | A- | | | USD 180 | | | | 6,410 | |
| | | | | | |
| MetLife, Inc. | | | 1.00% | | | Goldman
Sachs Bank USA | | | 9/20/16 | | | A- | | | USD 125 | | | | 4,199 | |
| | | | | | |
| MetLife, Inc. | | | 1.00% | | | Morgan
Stanley
Capital
Services,
Inc. | | | 9/20/16 | | | A- | | | USD 135 | | | | 3,560 | |
| | | | | | |
| MetLife, Inc. | | | 1.00% | | | Morgan
Stanley
Capital
Services,
Inc. | | | 9/20/16 | | | A- | | | USD 220 | | | | 7,514 | |
| | | | | | |
| MetLife, Inc. | | | 1.00% | | | Citibank,
N.A. | | | 12/20/16 | | | A- | | | USD 130 | | | | 4,030 | |
| | | | | | |
| MetLife, Inc. | | | 1.00% | | | Citibank,
N.A. | | | 12/20/16 | | | A- | | | USD 170 | | | | 4,282 | |
See Notes to Financial Statements.
| | | | | | |
| | | | | | | |
| | | | | | |
| 22 | | BLACKROCK MANAGED VOLATILITY PORTFOLIO | | MARCH 31, 2012 | | |
| | |
| Schedule of Investments (continued) | | |
| | | | | | | | | | | | | | | | |
| |
| Issuer | | Receive Fixed Rate | | Counterparty | | Expiration
Date | | Issuer
Credit
Rating1 | | Notional
Amount
(000)2 | | | Unrealized
Appreciation | |
| |
| | | | | | |
| MetLife, Inc. | | 1.00% | | Bank of America, N.A. | | 3/20/17 | | A- | | USD | 300 | | | | $ 3,758 | |
| | | | | | |
| MetLife, Inc. | | 1.00% | | Citibank, N.A. | | 3/20/17 | | A- | | USD | 160 | | | | 2,004 | |
| | | | | | |
| MetLife, Inc. | | 1.00% | | UBS AG | | 3/20/17 | | A- | | USD | 115 | | | | 1,440 | |
| |
| | | | | | |
Total | | | | | | | | | | | | | | | $43,878 | |
| | | | | | | | | | | | | | | | |
| 1 | Using Standard & Poor’s (“S&P’s”) rating. |
| 2 | The maximum potential amount the Fund may pay should a negative credit event take place as defined under the terms of the agreement. |
| — | | Credit default swaps on traded indexes - buy protection outstanding as of March 31, 2012 were as follows: |
| | | | | | | | | | | | | | |
| |
| Index | | Pay
Fixed
Rate | | | Counterparty | | Expiration
Date | | Notional
Amount
(000) | | Unrealized
Appreciation
(Depreciation) | |
| |
| | | | | |
| CDX.EM Series 14 Version 1 | | | 5.00 | % | | Morgan Stanley Capital Services, Inc. | | 12/20/15 | | USD 540 | | | $ 13,679 | |
| | | | | |
| CDX.NA.IG Series 16 Version 1 | | | 1.00 | % | | Credit Suisse International | | 6/20/16 | | USD 190 | | | (3,301) | |
| | | | | |
| CDX.NA.IG Series 16 Version 1 | | | 1.00 | % | | JPMorgan Chase Bank, N.A. | | 6/20/16 | | USD 11 | | | (164) | |
| | | | | |
| CDX.NA.IG Series 17 Version 1 | | | 1.00 | % | | Morgan Stanley Capital Services, Inc. | | 12/20/16 | | USD 1,910 | | | (33,399) | |
| |
| | | | | |
Total | | | | | | | | | | | | | $ (23,185) | |
| | | | | | | | | | | | | | |
| — | | Credit default swaps on traded indexes - sold protection outstanding as of March 31, 2012 were as follows: |
| | | | | | | | | | | | | | | | | | | | |
| |
| Index | | Receive Fixed Rate | | | Counter- party | | Expi- ration
Date | | | Credit
Rating1 | | Notional
Amount
(000)2 | | | Unrea- lized
Appre- ciation | |
| |
| | | | | | |
| CMBX.NA Series 3 | | | 0.08 | % | | Morgan
Stanley
Capital
Services,
Inc. | | | 12/13/49 | | | A+ | | USD | 260 | | | | $ 12,324 | |
| | | | | | |
| CMBX.NA Series 4 | | | 0.35 | % | | Morgan
Stanley
Capital
Services,
Inc. | | | 2/17/51 | | | A- | | USD | 260 | | | | 12,607 | |
|
| |
| | | | | | |
Total | | | | | | | | | | | | | | | | | | | $ 24,931 | |
| | | | | | | | | | | | | | | | | | | | |
| 1 | Using S&P’s rating of the underlying securities. |
| 2 | The maximum potential amount the Fund may pay should a negative credit event take place as defined under the terms of the agreement. |
| — | | Total return swaps outstanding as of March 31, 2012 were as follows: |
| | | | | | | | | | | | | | | | |
|
| Reference Entity | | Fund Pays/Receives the
Total Return of the
Reference Entity | | Fixed Rate/
Floating Rate | | Counterparty | | Expiration
Date | | | Notional
Amount (000) | | | Unrealized
Appreciation
(Depreciation) |
|
| | | | | | |
| Change in Return of the MSCI Emerging Markets Index | | Receives | | 1-month LIBOR
plus 0.63% | | Credit Suisse International | | | 9/21/12 | | | USD | 66 | | | $(157,894) |
| | | | | | |
| Change in Return of the Consumer Price Index for All Urban Consumers | | Pays | | 2.18%1 | | Bank of America, N.A. | | | 10/06/21 | | | USD | 915 | | | (30,013) |
| | | | | | |
| Return on Markit IOS 4.50%, 30-year, fixed rate Fannie Mae | | Receives | | 1-month LIBOR | | Goldman Sachs Bank USA | | | 1/12/40 | | | USD | 511 | | | 73 |
| | | | | | |
Return on Markit IOS 4.50%, 30-year, fixed rate Fannie Mae | | Pays | | 1-month LIBOR | | Citibank, N.A. | | | 1/12/41 | | | USD | 698 | | | (14,882) |
|
| | | | | | |
Total | | | | | | | | | | | | | | | | $(202,716) |
| | | | | | | | | | | | | | | | |
| 1 | Net payment made at termination. |
See Notes to Financial Statements.
| | | | | | |
| | | | | | | |
| | | | | | |
| | BLACKROCK MANAGED VOLATILITY PORTFOLIO | | MARCH 31, 2012 | | 23 |
| | |
| Schedule of Investments (concluded) | | |
| — | | For Fund compliance purposes, the Fund’s industry classifications refer to any one or more of the industry sub-classifications used by one or more widely recognized market indexes or ratings group indexes and/or as defined by Fund management. These definitions may not apply for purposes of this report, which may combine industry sub-classifications for reporting ease. |
| — | | Fair Value Measurements – Various inputs are used in determining the fair value of investments and derivative financial instruments. These inputs are categorized into a disclosure hierarchy consisting of three broad levels for financial statement purposes as follows: |
| | — | | Level 1 – unadjusted price quotations in active markets/exchanges for identical assets and liabilities |
| | — | | Level 2 – other observable inputs (including, but not limited to: quoted prices for similar assets or liabilities in markets that are active, quoted prices for identical or similar assets or liabilities in markets that are not active, inputs other than quoted prices that are observable for the assets or liabilities (such as interest rates, yield curves, volatilities, prepayment speeds, loss severities, credit risks and default rates) or other market–corroborated inputs) |
| | — | | Level 3 – unobservable inputs based on the best information available in the circumstances, to the extent observable inputs are not available (including the Fund’s own assumptions used in determining the fair value of investments and derivative financial instruments) |
Changes in valuation techniques may result in transfers into or out of an assigned level within the disclosure hierarchy. The categorization of a value determined for investments and derivative financial instruments is based on the pricing transparency of the investment and derivative financial instrument and is not necessarily an indication of the risks associated with investing in those securities. For information about the Fund’s policy regarding valuation of investments and derivative financial instruments and other significant accounting policies, please refer to Note 1 of the Notes to Financial Statements.
The following tables summarize the inputs used as of March 31, 2012 in determining the fair valuation of the Fund’s investments and derivative financial instruments:
| | | | | | | | | | | | | | | | |
| |
| Valuation Inputs | | Level 1 | | | Level 2 | | | Level 3 | | | Total | |
| |
Assets: | | | | | | | | | | | | | | | | |
Investments: | | | | | | | | | | | | | | | | |
Long-Term Investments: | | | | | | | | | | | | | | | | |
Asset-Backed Securities | | | – | | | $ | 12,778,167 | | | $ | 210,251 | | | $ | 12,988,418 | |
Collateralized Debt Obligations | | | – | | | | – | | | | 279,325 | | | | 279,325 | |
Common Stocks | | $ | 171,955,484 | | | | 34,214,636 | | | | 39,101 | | | | 206,209,221 | |
Corporate Bonds | | | – | | | | 55,025,793 | | | | – | | | | 55,025,793 | |
Foreign Agency Obligations | | | – | | | | 3,598,231 | | | | – | | | | 3,598,231 | |
Foreign Government Obligations | | | – | | | | 4,662,550 | | | | – | | | | 4,662,550 | |
Investment Companies | | | 51,066,780 | | | | – | | | | – | | | | 51,066,780 | |
Non-Agency Mortgage-Backed Securities | | | – | | | | 23,940,742 | | | | – | | | | 23,940,742 | |
Preferred Securities | | | 225,569 | | | | 1,814,437 | | | | – | | | | 2,040,006 | |
Taxable Municipal Bonds | | | – | | | | 536,254 | | | | – | | | | 536,254 | |
| | | | | | | | | | | | |
| |
| Valuation Inputs | | Level 1 | | Level 2 | | | Level 3 | | Total | |
| |
U.S. Govern- ment Sponsored Agency Securities | | – | | $ | 86,423,391 | | | – | | $ | 86,423,391 | |
U.S. Treasury Obligations | | – | | | 49,837,597 | | | – | | | 49,837,597 | |
Short-Term Securities | | $114,236,739 | | | 2,590,791 | | | – | | | 116,827,530 | |
Liabilities: | | | | | | | | | | | | |
Investments in Securities: | | | | | | | | | | | | |
TBA Sale Commit-ments | | – | | | (29,722,866 | ) | | – | | | (29,722,866 | ) |
|
| |
| | | | |
Total | | $337,484,572 | | $ | 245,699,723 | | | $ 528,677 | | $ | 583,712,972 | |
| | | |
| | | | | | | | | | | | | | |
| |
| Valuation Inputs | | Level 1 | | | Level 2 | | | Level 3 | | Total | |
| |
Derivative Financial Instruments1 | | | | | | | | | | | |
Assets: | | | | | | | | | | | | | | |
Credit contracts | | | – | | | $ | 236,760 | | | – | | $ | 236,760 | |
Equity contracts | | $ | 2,296,883 | | | | – | | | – | | | 2,296,883 | |
Foreign currency exchange contracts | | | 179 | | | | 176,607 | | | – | | | 176,786 | |
Interest rate contracts | | | 904,165 | | | | 190,173 | | | – | | | 1,094,338 | |
Liabilities: | | | | | | | | | | | | | | |
Credit contracts | | | – | | | | (53,288 | ) | | – | | | (53,288 | ) |
Equity contracts | | | (1,231,301 | ) | | | – | | | – | | | (1,231,301 | ) |
Foreign currency exchange contracts | | | (2,820 | ) | | | (156,787 | ) | | – | | | (159,607 | ) |
Interest rate contracts | | | (69,529 | ) | | | (664,818 | ) | | – | | | (734,347 | ) |
Other contracts | | | – | | | | (187,907 | ) | | – | | | (187,907 | ) |
| |
| | | | |
Total | | $ | 1,897,577 | | | $ | (459,260 | ) | | – | | $ | 1,438,317 | |
| | | | |
| 1 | Derivative financial instruments are swaps, financial futures contracts, foreign currency exchange contracts and options. Swaps, financial futures contracts and foreign currency exchange contracts are valued at the unrealized appreciation/ depreciation on the instrument and options are shown at value. |
See Notes to Financial Statements.
| | | | | | |
| | | | | | | |
| | | | | | |
| 24 | | BLACKROCK MANAGED VOLATILITY PORTFOLIO | | MARCH 31, 2012 | | |
Statement of Assets and Liabilities
March 31, 2012 (Unaudited)
| | | | |
| |
Assets | | | | |
| |
Investments at value – unaffiliated (including securities loaned at value of $2,485,338) (cost – $435,109,030) | | $ | 485,481,774 | |
Investments at value – affiliated (cost – $128,206,005) | | | 128,182,530 | |
Cash | | | 1,279,621 | |
Cash pledged as collateral for financial futures contracts | | | 7,091,000 | |
Cash pledged as collateral for swaps contracts | | | 300,000 | |
Foreign currency at value (cost – $613,309) | | | 615,959 | |
Swap premiums paid | | | 161,773 | |
Investments sold receivable | | | 107,725,346 | |
TBA sale commitments receivable | | | 29,661,663 | |
Interest receivable | | | 1,529,247 | |
Variation margin receivable | | | 967,671 | |
Capital shares sold receivable | | | 524,538 | |
Dividends and reclaims receivable – unaffiliated | | | 477,086 | |
Unrealized appreciation on swaps | | | 299,128 | |
Unrealized appreciation on foreign currency exchange contracts | | | 105,956 | |
Principal paydown receivable | | | 27,510 | |
Dividends receivable – affiliated | | | 14,288 | |
Securities lending income receivable – affiliated | | | 7,525 | |
Receivable from advisor | | | 143 | |
Prepaid expenses | | | 51,008 | |
Total assets | | | 764,503,766 | |
|
| |
Liabilities | | | | |
| |
Investments purchased payable | | | 150,191,630 | |
TBA sale commitments at value (proceeds $29,661,663) | | | 29,722,866 | |
Reverse repurchase agreements | | | 10,678,078 | |
Collateral on securities loaned at value | | | 2,590,791 | |
Options written at value (premiums received $404,303) | | | 356,662 | |
Capital shares redeemed payable | | | 650,428 | |
Unrealized depreciation on swaps | | | 549,351 | |
Investment advisory fees payable | | | 257,747 | |
Swap premiums received | | | 243,625 | |
Service and distribution fees payable | | | 191,728 | |
Unrealized depreciation on foreign currency exchange contracts | | | 159,607 | |
Other affiliates payable | | | 67,353 | |
Variation margin payable | | | 30,557 | |
Officer’s and Trustees’ fees payable | | | 4,373 | |
Interest expense payable | | | 390 | |
Other accrued expenses payable | | | 567,241 | |
Total liabilities | | | 196,262,427 | |
Net Assets | | $ | 568,241,339 | |
|
| |
Net Assets Consist of | | | | |
| |
Paid-in capital | | $ | 502,021,433 | |
Undistributed net investment income | | | 797,081 | |
Accumulated net realized gain | | | 13,761,214 | |
Net unrealized appreciation/depreciation | | | 51,661,611 | |
Net Assets | | $ | 568,241,339 | |
|
| |
Net Asset Value | | | | |
| |
Institutional – Based on net assets of $40,955,484 and 2,646,809 shares outstanding, unlimited number of shares authorized, $0.001 par value | | $ | 15.47 | |
Service – Based on net assets of $1,783,174 and 115,588 shares outstanding, unlimited number of shares authorized, $0.001 par value | | $ | 15.43 | |
Investor A – Based on net assets of $407,304,106 and 26,420,636 shares outstanding, unlimited number of shares authorized, $0.001 par value | | $ | 15.42 | |
Investor B – Based on net assets of $26,672,544 and 1,750,864 shares outstanding, unlimited number of shares authorized, $0.001 par value | | $ | 15.23 | |
Investor C – Based on net assets of $91,526,031 and 6,037,686 shares outstanding, unlimited number of shares authorized, $0.001 par value | | $ | 15.16 | |
See Notes to Financial Statements.
| | | | | | |
| | | | | | | |
| | | | | | |
| | BLACKROCK MANAGED VOLATILITY PORTFOLIO | | MARCH 31, 2012 | | 25 |
Statement of Operations
Six Months Ended March 31, 2012 (Unaudited)
| | | | |
| |
Investment Income | | | | |
| |
Interest | | $ | 4,095,896 | |
Dividends and reclaims – unaffiliated | | | 3,020,155 | |
Foreign taxes withheld | | | (30,048 | ) |
Dividends – affiliated | | | 46,878 | |
Securities lending – affiliated | | | 26,972 | |
Total income | | | 7,159,853 | |
|
| |
Expenses | | | | |
| |
Investment advisory | | | 1,512,667 | |
Service and distribution – class specific | | | 1,074,141 | |
Transfer agent – class specific | | | 475,488 | |
Administration | | | 203,770 | |
Custodian | | | 148,482 | |
Administration – class specific | | | 68,797 | |
Professional | | | 67,623 | |
Printing | | | 38,310 | |
Registration | | | 32,409 | |
Officer and Trustees | | | 8,506 | |
Miscellaneous | | | 82,465 | |
Total expenses excluding interest expense | | | 3,712,658 | |
Interest expense | | | 40,622 | |
Total expenses | | | 3,753,280 | |
Less fees waived by advisor | | | (26,073 | ) |
Less administration fees waived – class specific | | | (5,359 | ) |
Less transfer agent fees waived – class specific | | | (379 | ) |
Less transfer agent fees reimbursed – class specific | | | (3,304 | ) |
Less fees paid indirectly | | | (274 | ) |
Total expenses after fees waived, reimbursed and paid indirectly | | | 3,717,891 | |
Net investment income | | | 3,441,962 | |
|
| |
Realized and Unrealized Gain (Loss) | | | | |
| |
Net realized gain (loss) from: | | | | |
Investments | | | 7,326,308 | |
Options written | | | 579,518 | |
Financial futures contracts | | | 3,668,979 | |
Swaps | | | 5,149,547 | |
Foreign currency transactions | | | 739,319 | |
| | | 17,463,671 | |
Net change in unrealized appreciation/depreciation on: | | | | |
Investments – unaffiliated | | | 45,720,929 | |
Investments – affiliated | | | (23,475 | ) |
Options written | | | 682,755 | |
Financial futures contracts | | | 2,176,411 | |
Swaps | | | (1,566,676 | ) |
Foreign currency transactions | | | 44,994 | |
| | | 47,034,938 | |
Total realized and unrealized gain | | | 64,498,609 | |
Net Increase in Net Assets Resulting from Operations | | $ | 67,940,571 | |
See Notes to Financial Statements.
| | | | | | |
| | | | | | | |
| | | | | | |
| 26 | | BLACKROCK MANAGED VOLATILITY PORTFOLIO | | MARCH 31, 2012 | | |
Statements of Changes in Net Assets
| | | | | | | | |
Increase (Decrease) in Net Assets: | | Six Months
Ended
March 31, 2012
(Unaudited) | | | Year Ended
September 30,
2011 | |
| |
Operations | | | | | | | | |
| |
Net investment income | | $ | 3,441,962 | | | $ | 8,645,327 | |
Net realized gain | | | 17,463,671 | | | | 52,723,163 | |
Net change in unrealized appreciation/depreciation | | | 47,034,938 | | | | (60,944,465) | |
Net increase in net assets resulting from operations | | | 67,940,571 | | | | 424,025 | |
|
| |
Dividends and Distributions to Shareholders From | | | | | | | | |
| |
Net investment income: | | | | | | | | |
Institutional | | | (274,673) | | | | (885,056) | |
Service | | | (8,925) | | | | (31,935) | |
Investor A | | | (1,892,937) | | | | (7,180,490) | |
Investor B | | | (51,675) | | | | (422,113) | |
Investor C | | | (172,578) | | | | (969,379) | |
Net realized gain: | | | | | | | | |
Institutional | | | (878,568) | | | | – | |
Service | | | (35,472) | | | | – | |
Investor A | | | (8,053,733) | | | | – | |
Investor B | | | (650,345) | | | | – | |
Investor C | | | (1,802,237) | | | | – | |
Decrease in net assets resulting from dividends and distributions to shareholders | | | (13,821,143) | | | | (9,488,973) | |
|
| |
Capital Share Transactions | | | | | | | | |
| |
Net decrease in net assets derived from capital share transactions | | | (11,968,019) | | | | (24,771,731) | |
|
| |
Net Assets | | | | | | | | |
| |
Total increase (decrease) in net assets | | | 42,151,409 | | | | (33,836,679) | |
Beginning of period | | | 526,089,930 | | | | 559,926,609 | |
End of period | | $ | 568,241,339 | | | $ | 526,089,930 | |
Undistributed (distributions in excess of) net investment income | | $ | 797,081 | | | $ | (244,093) | |
See Notes to Financial Statements.
| | | | | | |
| | | | | | | |
| | | | | | |
| | BLACKROCK MANAGED VOLATILITY PORTFOLIO | | MARCH 31, 2012 | | 27 |
Financial Highlights
| | | | | | | | | | | | | | | | | | | | | | | | | | | | | | | | | | | | | | | | | | | | | | | | | | |
| | | Institutional | | | | | Service | |
| | | Six Months Ended | | | Year Ended September 30, | | | | | Six Months Ended | | | Year Ended September 30, | |
| | | March 31,
2012
(Unaudited) | | | 2011 | | | 2010 | | | 2009 | | | 2008 | | | 2007 | | | | | March 31,
2012
(Unaudited) | | | 2011 | | | 2010 | | | 2009 | | | 2008 | | | 2007 | |
|
| |
Per Share Operating Performance | | | | | | | | | | | | | | | | | | | | | | | | | | | | | | | | | | | | | | | | | | | | | | | | | | |
| |
Net asset value, beginning of period | | | $ 14.03 | | | $ | 14.31 | | | $ | 13.28 | | | | $ 12.96 | | | $ | 17.07 | | | | $ 15.53 | | | | | | $ 13.99 | | | $ | 14.27 | | | $ | 13.24 | | | | $ 12.93 | | | $ | 17.03 | | | $ | 15.51 | |
Net investment income1 | | | 0.13 | | | | 0.29 | | | | 0.29 | | | | 0.27 | | | | 0.33 | | | | 0.33 | | | | | | 0.11 | | | | 0.25 | | | | 0.25 | | | | 0.24 | | | | 0.30 | | | | 0.29 | |
Net realized and unrealized gain (loss) | | | 1.72 | | | | (0.26 | ) | | | 1.02 | | | | 0.45 | | | | (2.76 | ) | | | 2.08 | 2 | | | | | 1.71 | | | | (0.26 | ) | | | 1.03 | | | | 0.44 | | | | (2.76 | ) | | | 2.08 | 2 |
Net increase (decrease) from investment operations | | | 1.85 | | | | 0.03 | | | | 1.31 | | | | 0.72 | | | | (2.43 | ) | | | 2.41 | | | | | | 1.82 | | | | (0.01 | ) | | | 1.28 | | | | 0.68 | | | | (2.46 | ) | | | 2.37 | |
Dividends and distributions from: | | | | | | | | | | | | | | | | | | | | | | | | | | | | | | | | | | | | | | | | | | | | | | | | | | |
Net investment income | | | (0.10) | | | | (0.31 | ) | | | (0.28 | ) | | | (0.21 | ) | | | (0.38 | ) | | | (0.24 | ) | | | | | (0.07) | | | | (0.27 | ) | | | (0.25 | ) | | | (0.18 | ) | | | (0.34 | ) | | | (0.22 | ) |
Net realized gain | | | (0.31) | | | | – | | | | – | | | | (0.19 | ) | | | (1.30 | ) | | | (0.63 | ) | | | | | (0.31) | | | | – | | | | – | | | | (0.19 | ) | | | (1.30 | ) | | | (0.63 | ) |
Total dividends and distributions | | | (0.41) | | | | (0.31 | ) | | | (0.28 | ) | | | (0.40 | ) | | | (1.68 | ) | | | (0.87 | ) | | | | | (0.38) | | | | (0.27 | ) | | | (0.25 | ) | | | (0.37 | ) | | | (1.64 | ) | | | (0.85 | ) |
Net asset value, end of period | | | $ 15.47 | | | $ | 14.03 | | | $ | 14.31 | | | | $ 13.28 | | | $ | 12.96 | | | | $ 17.07 | | | | | | $ 15.43 | | | $ | 13.99 | | | $ | 14.27 | | | | $ 13.24 | | | $ | 12.93 | | | $ | 17.03 | |
|
| |
Total Investment Return3 | | | | | | | | | | | | | | | | | | | | | | | | | | | | | | | | | | | | | | | | | | | | | | | | | | |
| |
Based on net asset value | | | 13.41%4 | | | | 0.06% | | | | 9.99% | | | | 6.15% | 5 | | | (15.81)% | | | | 16.04% | 6 | | | | | 13.28%4 | | | | (0.21)% | | | | 9.74% | | | | 5.83% | 7 | | | (16.00)% | | | | 15.74% | 6 |
|
| |
Ratios to Average Net Assets | | | | | | | | | | | | | | | | | | | | | | | | | | | | | | | | | | | | | | | | | | | | | | | | | | |
| |
Total expenses | | | 0.95%8 | | | | 0.94% | | | | 0.95% | | | | 0.95% | | | | 0.94% | | | | 0.93% | | | | | | 1.27%8 | | | | 1.24% | | | | 1.27% | | | | 1.18% | | | | 1.11% | | | | 1.31% | |
Total expenses excluding recoupment of past waived fees | | | 0.95%8 | | | | 0.94% | | | | 0.95% | | | | 0.95% | | | | 0.94% | | | | 0.93% | | | | | | 1.27%8 | | | | 1.24% | | | | 1.27% | | | | 1.15% | | | | 1.11% | | | | 1.31% | |
Total expenses after fees waived, reimbursed and paid indirectly | | | 0.90%8 | | | | 0.90% | | | | 0.91% | | | | 0.88% | | | | 0.89% | | | | 0.86% | | | | | | 1.18%8 | | | | 1.18% | | | | 1.19% | | | | 1.14% | | | | 1.11% | | | | 1.10% | |
Total expenses after fees waived, reimbursed and paid indirectly and excluding interest expense | | | 0.89%8 | | | | 0.89% | | | | 0.89% | | | | 0.88% | | | | 0.85% | | | | 0.86% | | | | | | 1.17%8 | | | | 1.17% | | | | 1.17% | | | | 1.14% | | | | 1.07% | | | | 1.10% | |
Net investment income | | | 1.72%8 | | | | 1.91% | | | | 2.09% | | | | 2.43% | | | | 2.20% | | | | 2.03% | | | | | | 1.42%8 | | | | 1.63% | | | | 1.80% | | | | 2.17% | | | | 1.96% | | | | 1.80% | |
|
| |
Supplemental Data | | | | | | | | | | | | | | | | | | | | | | | | | | | | | | | | | | | | | | | | | | | | | | | | | | |
| |
Net assets, end of period (000) | | | $ 40,955 | | | $ | 40,259 | | | $ | 39,083 | | | | $29,127 | | | $ | 23,083 | | | | $ 34,720 | | | | | | $ 1,783 | | | $ | 1,676 | | | $ | 1,652 | | | | $ 1,472 | | | $ | 1,552 | | | $ | 2,325 | |
Portfolio turnover | | | 192%9 | | | | 401% | 10 | | | 400% | 11 | | | 354% | 12 | | | 391% | 13 | | | 93% | | | | | | 192%9 | | | | 401% | 10 | | | 400% | 11 | | | 354% | 12 | | | 391% | 13 | | | 93% | |
| | 1 | Based on average shares outstanding. |
| | 2 | Includes redemption fees, which are less than $0.01 per share. |
| | 3 | Where applicable, total investment returns exclude the effects of any sales charges and include the reinvestment of dividends and distributions. |
| | 4 | Aggregate total investment return. |
| | 5 | Includes proceeds received from a settlement of litigation, which impacted the Fund’s total return. Excluding these proceeds, the Fund’s total return would have been 5.92%. |
| | 6 | Redemption fee of 2.00% is reflected in total return calculations. There was no impact to the return. |
| | 7 | Includes proceeds received from a settlement of litigation, which impacted the Fund’s total return. Excluding these proceeds, the Fund’s total return would have been 5.60%. |
| | 9 | Includes mortgage dollar roll transactions; excluding these transactions the portfolio turnover would have been 114%. |
| | 10 | Includes mortgage dollar roll transactions; excluding these transactions the portfolio turnover would have been 236%. |
| | 11 | Includes mortgage dollar roll transactions; excluding these transactions the portfolio turnover would have been 302%. |
| | 12 | Includes mortgage dollar roll transactions; excluding these transactions the portfolio turnover would have been 227%. |
| | 13 | Includes TBA transactions; excluding these transactions the portfolio turnover would have been 121%. |
See Notes to Financial Statements.
| | | | | | |
| | | | | | | |
| | | | | | |
| 28 | | BLACKROCK MANAGED VOLATILITY PORTFOLIO | | MARCH 31, 2012 | | |
| | |
| Financial Highlights (continued) | | |
| | | | | | | | | | | | | | | | | | | | | | | | | | | | | | | | | | | | | | | | | | | | | | | | | | |
| | | Investor A | | | | | Investor B | |
| | | Six Months Ended | | | Year Ended September 30, | | | | | Six Months Ended | | | Year Ended September 30, | |
| | | March 31,
2012
(Unaudited) | | | 2011 | | | 2010 | | | 2009 | | | 2008 | | | 2007 | | | | | March 31,
2012
(Unaudited) | | | 2011 | | | 2010 | | | 2009 | | | 2008 | | | 2007 | |
|
| |
Per Share Operating Performance | | | | | | | | | | | | | | | | | | | | | | | | | | | | | | | | | | | | | | | | | | | | | | | |
Net asset value, beginning of period | | | $ 13.98 | | | $ | 14.26 | | | $ | 13.23 | | | $ | 12.92 | | | $ | 17.01 | | | | $ 15.50 | | | | | | $ 13.83 | | | $ | 14.10 | | | $ | 13.08 | | | $ | 12.75 | | | $ | 16.83 | | | $ | 15.35 | |
Net investment income1 | | | 0.10 | | | | 0.25 | | | | 0.24 | | | | 0.23 | | | | 0.28 | | | | 0.27 | | | | | | 0.05 | | | | 0.13 | | | | 0.12 | | | | 0.14 | | | | 0.16 | | | | 0.14 | |
Net realized and unrealized gain (loss) | | | 1.72 | | | | (0.26 | ) | | | 1.03 | | | | 0.43 | | | | (2.75 | ) | | | 2.07 | 2 | | | | | 1.68 | | | | (0.26 | ) | | | 1.03 | | | | 0.43 | | | | (2.75 | ) | | | 2.07 | 2 |
Net increase (decrease) from investment operations | | | 1.82 | | | | (0.01 | ) | | | 1.27 | | | | 0.66 | | | | (2.47 | ) | | | 2.34 | | | | | | 1.73 | | | | (0.13 | ) | | | 1.15 | | | | 0.57 | | | | (2.59 | ) | | | 2.21 | |
Dividends and distributions from: | | | | | | | | | | | | | | | | | | | | | | | | | | | | | | | | | | | | | | | | | | | | | | | | | | |
Net investment income | | | (0.07) | | | | (0.27 | ) | | | (0.24 | ) | | | (0.16 | ) | | | (0.32 | ) | | | (0.20 | ) | | | | | (0.02) | | | | (0.14 | ) | | | (0.13 | ) | | | (0.05 | ) | | | (0.19 | ) | | | (0.10 | ) |
Net realized gain | | | (0.31) | | | | – | | | | – | | | | (0.19 | ) | | | (1.30 | ) | | | (0.63 | ) | | | | | (0.31) | | | | – | | | | – | | | | (0.19 | ) | | | (1.30 | ) | | | (0.63 | ) |
Total dividends and distributions | | | (0.38) | | | | (0.27 | ) | | | (0.24 | ) | | | (0.35 | ) | | | (1.62 | ) | | | (0.83 | ) | | | | | (0.33) | | | | (0.14 | ) | | | (0.13 | ) | | | (0.24 | ) | | | (1.49 | ) | | | (0.73 | ) |
Net asset value, end of period | | | $ 15.42 | | | $ | 13.98 | | | $ | 14.26 | | | $ | 13.23 | | | $ | 12.92 | | | | $ 17.01 | | | | | | $ 15.23 | | | $ | 13.83 | | | $ | 14.10 | | | $ | 13.08 | | | $ | 12.75 | | | $ | 16.83 | |
|
| |
Total Investment Return3 | | | | | | | | | | | | | | | | | | | | | | | | | | | | | | | | | | | | | | | | | | | | | | | | | | |
Based on net asset value | | | 13.27%4 | | | | (0.23)% | | | | 9.70% | | | | 5.66% | 5 | | | (16.05)% | | | | 15.58% | 6 | | | | | 12.73%4 | | | | (1.01)% | | | | 8.78% | | | | 4.93% | 7 | | | (16.89)% | | | | 14.81% | 6 |
|
| |
Ratios to Average Net Assets | | | | | | | | | | | | | | | | | | | | | | | | | | | | | | | | | | | | | | | | | | | | | | | | | | |
Total expenses | | | 1.22%8 | | | | 1.20% | | | | 1.23% | | | | 1.27% | | | | 1.24% | | | | 1.21% | | | | | | 2.09%8 | | | | 2.00% | | | | 2.04% | | | | 2.07% | | | | 2.02% | | | | 2.01% | |
Total expenses excluding recoupment of past waived fees | | | 1.22%8 | | | | 1.20% | | | | 1.22% | | | | 1.27% | | | | 1.24% | | | | 1.21% | | | | | | 2.09%8 | | | | 2.00% | | | | 2.02% | | | | 2.06% | | | | 2.02% | | | | 2.01% | |
Total expenses after fees waived, reimbursed and paid indirectly | | | 1.21%8 | | | | 1.20% | | | | 1.22% | | | | 1.26% | | | | 1.24% | | | | 1.21% | | | | | | 2.08%8 | | | | 2.00% | | | | 2.04% | | | | 2.04% | | | | 2.02% | | | | 2.01% | |
Total expenses after fees waived, reimbursed and paid indirectly and excluding interest expense | | | 1.20%8 | | | | 1.19% | | | | 1.20% | | | | 1.26% | | | | 1.20% | | | | 1.21% | | | | | | 2.07%8 | | | | 1.98% | | | | 2.02% | | | | 2.04% | | | | 1.97% | | | | 2.01% | |
Net investment income | | | 1.39%8 | | | | 1.61% | | | | 1.75% | | | | 2.04% | | | | 1.84% | | | | 1.68% | | | | | | 0.53%8 | | | | 0.84% | | | | 0.91% | | | | 1.27% | | | | 1.06% | | | | 0.89% | |
|
| |
Supplemental Data | | | | | | | | | | | | | | | | | | | | | | | | | | | | | | | | | | | | | | | | | | | | | | | | | | |
Net assets, end of period (000) | | | $407,304 | | | $ | 370,916 | | | $ | 385,511 | | | $ | 361,751 | | | $ | 390,051 | | | | $506,537 | | | | | | $ 26,673 | | | $ | 31,595 | | | $ | 49,315 | | | $ | 69,934 | | | $ | 97,710 | | | $ | 152,820 | |
Portfolio turnover | | | 192%9 | | | | 401% | 10 | | | 400% | 11 | | | 354% | 12 | | | 391% | 13 | | | 93% | | | | | | 192%9 | | | | 401% | 10 | | | 400% | 11 | | | 354% | 12 | | | 391% | 13 | | | 93% | |
| | 1 | Based on average shares outstanding. |
| | 2 | Includes redemption fees, which are less than $0.01 per share. |
| | 3 | Where applicable, total investment returns exclude the effects of any sales charges and include the reinvestment of dividends and distributions. |
| | 4 | Aggregate total investment return. |
| | 5 | Includes proceeds received from a settlement of litigation, which impacted the Fund’s total return. Excluding these proceeds, the Fund’s total return would have been 5.42%. |
| | 6 | Redemption fee of 2.00% is reflected in total return calculations. There was no impact to the return. |
| | 7 | Includes proceeds received from a settlement of litigation, which impacted the Fund’s total return. Excluding these proceeds, the Fund’s total return would have been 4.69%. |
| | 9 | Includes mortgage dollar roll transactions; excluding these transactions the portfolio turnover would have been 114%. |
| | 10 | Includes mortgage dollar roll transactions; excluding these transactions the portfolio turnover would have been 236%. |
| | 11 | Includes mortgage dollar roll transactions; excluding these transactions the portfolio turnover would have been 302%. |
| | 12 | Includes mortgage dollar roll transactions; excluding these transactions the portfolio turnover would have been 227%. |
| | 13 | Includes TBA transactions; excluding these transactions the portfolio turnover would have been 121%. |
See Notes to Financial Statements.
| | | | | | |
| | | | | | | |
| | | | | | |
| | BLACKROCK MANAGED VOLATILITY PORTFOLIO | | MARCH 31, 2012 | | 29 |
| | |
| Financial Highlights (concluded) | | |
| | | | | | | | | | | | | | | | | | | | | | | | |
| | | Investor C | |
| | | Six Months Ended | | | Year Ended September 30, | |
| | | March 31,
2012
(Unaudited) | | | 2011 | | | 2010 | | | 2009 | | | 2008 | | | 2007 | |
|
| |
Per Share Operating Performance | | | | | | | | | | | | | | | | | | | | | | | | |
Net asset value, beginning of period | | $ | 13.76 | | | $ | 14.04 | | | $ | 13.04 | | | $ | 12.73 | | | $ | 16.78 | | | $ | 15.34 | |
Net investment income1 | | | 0.05 | | | | 0.13 | | | | 0.14 | | | | 0.15 | | | | 0.17 | | | | 0.15 | |
Net realized and unrealized gain (loss) | | | 1.69 | | | | (0.25 | ) | | | 1.02 | | | | 0.43 | | | | (2.71 | ) | | | 2.042 | |
Net increase (decrease) from investment operations | | | 1.74 | | | | (0.12 | ) | | | 1.16 | | | | 0.58 | | | | (2.54 | ) | | | 2.19 | |
Dividends and distributions from: | | | | | | | | | | | | | | | | | | | | | | | | |
Net investment income | | | (0.03 | ) | | | (0.16 | ) | | | (0.16 | ) | | | (0.08 | ) | | | (0.21 | ) | | | (0.12) | |
Net realized gain | | | (0.31 | ) | | | – | | | | – | | | | (0.19 | ) | | | (1.30 | ) | | | (0.63) | |
Total dividends and distributions | | | (0.34 | ) | | | (0.16 | ) | | | (0.16 | ) | | | (0.27 | ) | | | (1.51 | ) | | | (0.75) | |
Net asset value, end of period | | $ | 15.16 | | | $ | 13.76 | | | $ | 14.04 | | | $ | 13.04 | | | $ | 12.73 | | | $ | 16.78 | |
|
| |
Total Investment Return3 | | | | | | | | | | | | | | | | | | | | | | | | |
| |
Based on net asset value | | | 12.84% | 4 | | | (0.94)% | | | | 8.86% | | | | 4.99% | 5 | | | (16.66)% | | | | 14.68%6 | |
|
| |
Ratios to Average Net Assets | | | | | | | | | | | | | | | | | | | | | | | | |
| |
Total expenses | | | 1.93% | 7 | | | 1.93% | | | | 1.94% | | | | 1.98% | | | | 1.94% | | | | 1.95% | |
Total expenses excluding recoupment of past waived fees | | | 1.93% | 7 | | | 1.93% | | | | 1.94% | | | | 1.97% | | | | 1.94% | | | | 1.95% | |
Total expenses after fees waived, reimbursed and paid indirectly | | | 1.92% | 7 | | | 1.93% | | | | 1.94% | | | | 1.98% | | | | 1.94% | | | | 1.94% | |
Total expenses after fees waived, reimbursed and paid indirectly and excluding interest expense | | | 1.91% | 7 | | | 1.92% | | | | 1.92% | | | | 1.98% | | | | 1.90% | | | | 1.94% | |
Net investment income | | | 0.67% | 7 | | | 0.89% | | | | 1.05% | | | | 1.32% | | | | 1.14% | | | | 0.96% | |
|
| |
Supplemental Data | | | | | | | | | | | | | | | | | | | | | | | | |
| |
Net assets, end of period (000) | | $ | 91,526 | | | $ | 81,644 | | | $ | 84,367 | | | $ | 72,063 | | | $ | 69,584 | | | $ | 84,596 | |
Portfolio turnover | | | 192% | 8 | | | 401% | 9 | | | 400% | 10 | | | 354% | 11 | | | 391% | 12 | | | 93% | |
| | 1 | Based on average shares outstanding. |
| | 2 | Includes redemption fees, which are less than $0.01 per share. |
| | 3 | Where applicable, total investment returns exclude the effects of any sales charges and include the reinvestment of dividends and distributions. |
| | 4 | Aggregate total investment return. |
| | 5 | Includes proceeds received from a settlement of litigation, which impacted the Fund’s total return. Excluding these proceeds, the Fund’s total return would have been 4.75%. |
| | 6 | Redemption fee of 2.00% is reflected in total return calculations. There was no impact to the return. |
| | 8 | Includes mortgage dollar roll transactions; excluding these transactions the portfolio turnover would have been 114%. |
| | 9 | Includes mortgage dollar roll transactions; excluding these transactions the portfolio turnover would have been 236%. |
| | 10 | Includes mortgage dollar roll transactions; excluding these transactions the portfolio turnover would have been 302%. |
| | 11 | Includes mortgage dollar roll transactions; excluding these transactions the portfolio turnover would have been 227%. |
| | 12 | Includes TBA transactions; excluding these transactions the portfolio turnover would have been 121%. |
See Notes to Financial Statements.
| | | | | | |
| | | | | | | |
| | | | | | |
| 30 | | BLACKROCK MANAGED VOLATILITY PORTFOLIO | | MARCH 31, 2012 | | |
Notes to Financial Statements (Unaudited)
1. Organization and Significant Accounting Policies:
BlackRock FundsSM (the “Trust”) is registered under the Investment Company Act of 1940, as amended (the “1940 Act”), as an open-end management investment company. The Trust is organized as a Massachusetts business trust. These financial statements relate to one series of the Trust, BlackRock Managed Volatility Portfolio (formerly known as BlackRock Asset Allocation Portfolio) (the “Fund”). The Fund is classified as diversified. The Fund’s financial statements are prepared in conformity with accounting principles generally accepted in the United States of America (“US GAAP”), which may require management to make estimates and assumptions that affect the reported amounts and disclosures in the financial statements. Actual results could differ from those estimates. The Fund offers multiple classes of shares. Institutional Shares are sold without a sales charge and only to certain eligible investors. Service Shares are sold without a sales charge. Investor A Shares are generally sold with a front-end sales charge. Investor B and Investor C Shares may be subject to a CDSC. All classes of shares have identical voting, dividend, liquidation and other rights and the same terms and conditions, except that Service, Investor A, Investor B and Investor C Shares bear certain expenses related to the shareholder servicing of such shares, and Investor B and Investor C Shares also bear certain expenses related to the distribution of such shares. Investor B Shares automatically convert to Investor A Shares after approximately eight years. Investor B Shares are only available through exchanges, dividend reinvestment by existing shareholders or for purchase by certain qualified employee benefit plans. Each class has exclusive voting rights with respect to matters relating to its shareholder servicing and distribution expenditures (except that Investor B shareholders may vote on material changes to the Investor A distribution and service plan).
The following is a summary of significant accounting policies followed by the Fund:
Valuation: US GAAP defines fair value as the price the Fund would receive to sell an asset or pay to transfer a liability in an orderly transaction between market participants at the measurement date. The Fund fair values its financial instruments at market value using independent dealers or pricing services under policies approved by the Board of Trustees of the Trust (the “Board”). Equity investments traded on a recognized securities exchange or the NASDAQ Global Market System (“NASDAQ”) are valued at the last reported sale price that day or the NASDAQ official closing price, if applicable. For equity investments traded on more than one exchange, the last reported sale price on the exchange where the stock is primarily traded is used. Equity investments traded on a recognized exchange for which there were no sales on that day are valued at the last available bid price. If no bid price is available, the prior day’s price will be used, unless it is determined that such prior day’s price no longer reflects the fair value of the security. The Fund values its bond investments on the basis of last available bid prices or current market quotations provided by dealers or pricing services. In determining the value of a particular investment, pricing services may use certain information with respect to transactions in such investments, quotations from
dealers, pricing matrixes, market transactions in comparable investments, various relationships observed in the market between investments and calculated yield measures. Asset-backed and mortgage-backed securities are valued by independent pricing services using models that consider estimated cash flows of each tranche of the security, establish a benchmark yield and develop an estimated tranche specific spread to the benchmark yield based on the unique attributes of the tranche. Financial futures contracts traded on exchanges are valued at their last sale price. Swap agreements are valued utilizing quotes received daily by the Fund’s pricing service or through brokers, which are derived using daily swap curves and models that incorporate a number of market data factors, such as discounted cash flows, trades and values of the underlying reference instruments. To-be-announced (“TBA”) commitments are valued on the basis of last available bid prices or current market quotations provided by pricing services. Investments in open-end registered investment companies are valued at NAV each business day. Short-term securities with remaining maturities of 60 days or less may be valued at amortized cost, which approximates fair value.
The Fund values its investment in BlackRock Liquidity Series, LLC Money Market Series (the “Money Market Series”) at fair value, which is ordinarily based upon its pro rata ownership in the underlying fund’s net assets. The Money Market Series seeks current income consistent with maintaining liquidity and preserving capital. Although the Money Market Series is not registered under the 1940 Act, its investments will follow the parameters of investments by a money market fund that is subject to Rule 2a-7 under the 1940 Act. The Fund may withdraw up to 25% of its investment daily, although the manager of the Money Market Series, in its sole discretion, may permit an investor to withdraw more than 25% on any one day.
Securities and other assets and liabilities denominated in foreign currencies are translated into US dollars using exchange rates determined as of the close of business on the New York Stock Exchange (“NYSE”). Foreign currency exchange contracts are valued at the mean between the bid and ask prices and are determined as of the close of business on the NYSE. Interpolated values are derived when the settlement date of the contract is an interim date for which quotations are not available.
Exchange-traded options are valued at the mean between the last bid and ask prices at the close of the options market in which the options trade. An exchange-traded option for which there is no mean price is valued at the last bid (long positions) or ask (short positions) price. If no bid or ask price is available, the prior day’s price will be used, unless it is determined that the prior day’s price no longer reflects the fair value of the option. Over-the-counter (“OTC”) options and swaptions are valued by an independent pricing service using a mathematical model which incorporates a number of market data factors, such as the trades and prices of the underlying instruments.
In the event that application of these methods of valuation results in a price for an investment which is deemed not to be representative of the
| | | | | | |
| | | | | | | |
| | | | | | |
| | BLACKROCK MANAGED VOLATILITY PORTFOLIO | | MARCH 31, 2012 | | 31 |
Notes to Financial Statements (continued)
market value of such investment or if a price is not available, the investment will be valued in accordance with a policy approved by the Board as reflecting fair value (“Fair Value Assets”). When determining the price for Fair Value Assets, the investment advisor and/or the sub-advisor seek to determine the price that the Fund might reasonably expect to receive from the current sale of that asset in an arm’s-length transaction. Fair value determinations shall be based upon all available factors that the investment advisor and/or sub-advisor deem relevant. The pricing of all Fair Value Assets is subsequently reported to the Board or a committee thereof.
Generally, trading in foreign instruments is substantially completed each day at various times prior to the close of business on the NYSE. Occasionally, events affecting the values of such instruments may occur between the foreign market close and the close of business on the NYSE that may not be reflected in the computation of the Fund’s net assets. If events (for example, a company announcement, market volatility or a natural disaster) occur during such periods that are expected to materially affect the value of such instruments, those instruments may be Fair Value Assets and be valued at their fair value, as determined in good faith by the investment advisor using a pricing service and/or policies approved by the Board. Each business day, the Fund uses a pricing service to assist with the valuation of certain foreign exchange-traded equity securities and foreign exchange-traded and OTC options (the “Systematic Fair Value Price”). Using current market factors, the Systematic Fair Value Price is designed to value such foreign securities and foreign options at fair value as of the close of business on the NYSE, which follows the close of the local markets.
Foreign Currency Transactions: The Fund’s books and records are maintained in US dollars. Purchases and sales of investment securities are recorded at the rates of exchange prevailing on the respective date of such transactions. Generally, when the US dollar rises in value against a foreign currency, the Fund’s investments denominated in that currency will lose value because its currency is worth fewer US dollars; the opposite effect occurs if the US dollar falls in relative value.
The Fund does not isolate the portion of the results of operations arising as a result of changes in the foreign exchange rates from the changes in the market prices of investments held or sold for financial reporting purposes. Accordingly, the effects of changes in foreign currency exchange rates on investments are not segregated on the Statement of Operations from the effects of changes in market prices of those investments but are included as a component of net realized and unrealized gain (loss) from investments. The Fund reports realized currency gains (losses) on foreign currency related transactions as components of net realized gain (loss) for financial reporting purposes, whereas such components are treated as ordinary income for federal income tax purposes.
Asset-Backed and Mortgage-Backed Securities: The Fund may invest in asset-backed securities. Asset-backed securities are generally issued as pass-through certificates, which represent undivided fractional ownership interests in an underlying pool of assets, or as debt instruments,
which are also known as collateralized obligations, and are generally issued as the debt of a special purpose entity organized solely for the purpose of owning such assets and issuing such debt. Asset-backed securities are often backed by a pool of assets representing the obligations of a number of different parties. The yield characteristics of certain asset-backed securities may differ from traditional debt securities. One such major difference is that all or a principal part of the obligations may be prepaid at any time because the underlying assets (i.e., loans) may be prepaid at any time. As a result, a decrease in interest rates in the market may result in increases in the level of prepayments as borrowers, particularly mortgagors, refinance and repay their loans. An increased prepayment rate with respect to an asset-backed security subject to such a prepayment feature will have the effect of shortening the maturity of the security. If the Fund has purchased such an asset-backed security at a premium, a faster than anticipated prepayment rate could result in a loss of principal to the extent of the premium paid.
The Fund may purchase certain mortgage pass-through securities. There are a number of important differences among the agencies and instrumentalities of the US government that issue mortgage-related securities and among the securities that they issue. For example, mortgage-related securities guaranteed by Ginnie Mae are guaranteed as to the timely payment of principal and interest by Ginnie Mae and such guarantee is backed by the full faith and credit of the United States. However, mortgage-related securities issued by Freddie Mac and Fannie Mae, including Freddie Mac and Fannie Mae guaranteed Mortgage Pass-Through Certificates, which are solely the obligations of Freddie Mac and Fannie Mae, are not backed by or entitled to the full faith and credit of the United States but are supported by the right of the issuer to borrow from the Treasury.
Multiple Class Pass-Through Securities: The Fund may invest in multiple class pass-through securities, including collateralized mortgage obligations (“CMOs”) and commercial mortgage-backed securities. These multiple class securities may be issued by Ginnie Mae, US government agencies or instrumentalities or by trusts formed by private originators of, or investors in, mortgage loans. In general, CMOs are debt obligations of a legal entity that are collateralized by, and multiple class pass-through securities represent direct ownership interests in, a pool of residential or commercial mortgage loans or mortgage pass-through securities (the “Mortgage Assets”), the payments on which are used to make payments on the CMOs or multiple pass-through securities. Classes of CMOs include interest only (“IOs”), principal only (“POs”), planned amortization classes and targeted amortization classes. IOs and POs are stripped mortgage-backed securities representing interests in a pool of mortgages, the cash flow from which has been separated into interest and principal components. IOs receive the interest portion of the cash flow while POs receive the principal portion. IOs and POs can be extremely volatile in response to changes in interest rates. As interest rates rise and fall, the value of IOs tends to move in the same direction as interest rates. POs perform best when prepayments on the underlying mortgages rise since this increases the rate at which the principal is
| | | | | | |
| | | | | | | |
| | | | | | |
| 32 | | BLACKROCK MANAGED VOLATILITY PORTFOLIO | | MARCH 31, 2012 | | |
Notes to Financial Statements (continued)
returned and the yield to maturity on the PO. When payments on mortgages underlying a PO are slower than anticipated, the life of the PO is lengthened and the yield to maturity is reduced. If the underlying Mortgage Assets experience greater than anticipated pre-payments of principal, the Fund may not fully recoup its initial investments in IOs.
Stripped Mortgage-Backed Securities: The Fund may invest in stripped mortgage-backed securities issued by the US government, its agencies and instrumentalities. Stripped mortgage-backed securities are usually structured with two classes that receive different proportions of the interest (IOs) and principal (POs) distributions on a pool of Mortgage Assets. The Fund also may invest in stripped mortgage-backed securities that are privately issued.
Capital Trusts: The Fund may invest in capital trusts. These securities are typically issued by corporations, generally in the form of interest-bearing notes with preferred securities characteristics, or by an affiliated business trust of a corporation, generally in the form of beneficial interests in subordinated debentures or similarly structured securities. The securities can be structured as either fixed or adjustable coupon securities that can have either a perpetual or stated maturity date. Dividends can be deferred without creating an event of default or acceleration, although maturity cannot take place unless all cumulative payment obligations have been met. The deferral of payments does not affect the purchase or sale of these securities in the open market. Payments on these securities are treated as interest rather than dividends for federal income tax purposes. These securities generally are rated below that of the issuing company’s senior debt securities.
Preferred Stock: The Fund may invest in preferred stock. Preferred stock has a preference over common stock in liquidation (and generally in receiving dividends as well) but is subordinated to the liabilities of the issuer in all respects. As a general rule, the market value of preferred stock with a fixed dividend rate and no conversion element varies inversely with interest rates and perceived credit risk, while the market price of convertible preferred stock generally also reflects some element of conversion value. Because preferred stock is junior to debt securities and other obligations of the issuer, deterioration in the credit quality of the issuer will cause greater changes in the value of a preferred stock than in a more senior debt security with similar stated yield characteristics. Unlike interest payments on debt securities, preferred stock dividends are payable only if declared by the issuer’s board of directors. Preferred stock also may be subject to optional or mandatory redemption provisions.
Collateralized Debt Obligations: The Fund may invest in collateralized debt obligations (“CDOs”), which include collateralized bond obligations (“CBOs”) and collateralized loan obligations (“CLOs”). CBOs and CLOs are types of asset-backed securities. A CDO is a bankruptcy remote entity which is backed by a diversified pool of debt securities (CBOs) or syndicated bank loans (CLOs). The cash flows of the CDO can be split into multiple segments, called “tranches”, which will vary in risk profile and yield. The riskiest segment is the subordinated or “equity” tranche.
This tranche bears the greatest risk of defaults from the underlying assets in the CDO and serves to protect the other, more senior, tranches from default in all but the most severe circumstances. Since it is shielded from defaults by the more junior tranches, a “senior” tranche will typically have higher credit ratings and lower yields than their underlying securities, and often receive investment grade ratings from one or more of the nationally recognized rating agencies. Despite the protection from the more junior tranches, senior tranches can experience substantial losses due to actual defaults, increased sensitivity to future defaults and the disappearance of one or more protecting tranches as a result of changes in the credit profile of the underlying pool of assets.
Forward Commitments and When-Issued Delayed Delivery Securities: The Fund may purchase securities on a when-issued basis and may purchase or sell securities on a forward commitment basis. Settlement of such transactions normally occurs within a month or more after the purchase or sale commitment is made. The Fund may purchase securities under such conditions with the intention of actually acquiring them, but may enter into a separate agreement to sell the securities before the settlement date. Since the value of securities purchased may fluctuate prior to settlement, the Fund may be required to pay more at settlement than the security is worth. In addition, the Fund is not entitled to any of the interest earned prior to settlement. When purchasing a security on a delayed delivery basis, the Fund assumes the rights and risks of ownership of the security, including the risk of price and yield fluctuations. In the event of default by the counterparty, the Fund’s maximum amount of loss is the unrealized appreciation of unsettled when-issued transactions, which is shown in the Schedule of Investments.
Inflation-Indexed Bonds: The Fund may invest in inflation-indexed bonds. Inflation-indexed bonds are fixed income securities whose principal value is periodically adjusted according to the rate of inflation. If the index measuring inflation rises or falls, the principal value of inflation-indexed bonds will be adjusted upward or downward, and consequently the interest payable on these securities (calculated with respect to a larger or smaller principal amount) will be increased or reduced, respectively. Repayment of the original bond principal upon maturity (as adjusted for inflation) is guaranteed in the case of US Treasury inflation-indexed bonds. For bonds that do not provide a similar guarantee, the adjusted principal value of the bond repaid at maturity may be less than the original principal.
TBA Commitments: The Fund may enter into TBA commitments. TBA commitments are forward agreements for the purchase or sale of mortgage-backed securities for a fixed price, with payment and delivery on an agreed upon future settlement date. The specific securities to be delivered are not identified at the trade date. However, delivered securities must meet specified terms, including issuer, rate and mortgage terms. The Fund generally enters into TBA commitments with the intent to take possession of or deliver the underlying mortgage-backed securities but can extend the settlement or roll the transaction. TBA commitments involve a risk of loss if the value of the security to be purchased or sold declines or increases, respectively, prior to settlement date.
| | | | | | |
| | | | | | | |
| | | | | | |
| | BLACKROCK MANAGED VOLATILITY PORTFOLIO | | MARCH 31, 2012 | | 33 |
Notes to Financial Statements (continued)
Mortgage Dollar Roll Transactions: The Fund may sell TBA mortgage-backed securities and simultaneously contract to repurchase substantially similar (same type, coupon and maturity) securities on a specific future date at an agreed-upon price. During the period between the sale and repurchase, the Fund will not be entitled to receive interest and principal payments on the securities sold. The Fund accounts for mortgage dollar roll transactions as purchases and sales and realizes gains and losses on these transactions. These transactions may increase the Fund’s portfolio turnover rate. Mortgage dollar rolls involve the risk that the market value of the securities that the Fund is required to purchase may decline below the agreed upon repurchase price of those securities.
Treasury Roll Transactions: The Fund may enter into treasury roll transactions. In a treasury roll transaction, the Fund sells a treasury security to a counterparty with a simultaneous agreement to repurchase the same security at an agreed upon price and future settlement date. The Fund receives cash from the sale of the treasury security to use for other investment purposes. The difference between the sale price and repurchase price represents net interest income or net interest expense reflective of an agreed upon rate between the Fund and the counterparty over the term of the borrowing. For US GAAP purposes, a treasury roll transaction is accounted for as a secured borrowing and not as a purchase or sale. During the term of the borrowing, interest income from the Treasury security and the related interest expense on the secured borrowing is recorded by the Fund on an accrual basis. The Fund will benefit from the transaction if the income earned on the investment purchased with the cash received in the treasury roll transaction exceeds the interest expense incurred by the Fund. If the interest expense exceeds the income earned, the Fund’s net investment income and dividends to shareholders may be adversely impacted. Treasury roll transactions involve the risk that the market value of the securities that the Fund is required to repurchase may decline below the agreed upon repurchase price of those securities.
Reverse Repurchase Agreements: The Fund may enter into reverse repurchase agreements with qualified third party broker-dealers. In a reverse repurchase agreement, the Fund sells securities to a bank or broker-dealer and agrees to repurchase the same securities at a mutually agreed upon date and price. Securities sold under reverse repurchase agreements are recorded at face value as a liability in the Statement of Assets and Liabilities. Due to the short term nature of the reverse repurchase agreements, face value approximates fair value. During the term of the reverse repurchase agreement, the Fund continues to receive the principal and interest payments on these securities. Certain agreements have no stated maturity and can be terminated by either party at any time. Interest on the value of the reverse repurchase agreements issued and outstanding is based upon competitive market rates determined at the time of issuance. The Fund may utilize reverse repurchase agreements when it is anticipated that the interest income to be earned from the investment of the proceeds of the transaction is greater than the interest expense of the transaction. Reverse repurchase agreements involve leverage risk and also the risk that the market value of the securities that the Fund is obligated to repurchase under the agreement may
decline below the repurchase price. In the event the buyer of securities under a reverse repurchase agreement files for bankruptcy or becomes insolvent, the Fund’s use of the proceeds of the agreement may be restricted while the other party, or its trustee or receiver, determines whether or not to enforce the Fund’s obligation to repurchase the securities.
Zero-Coupon Bonds: The Fund may invest in zero-coupon bonds, which are normally issued at a significant discount from face value and do not provide for periodic interest payments. Zero-coupon bonds may experience greater volatility in market value than similar maturity debt obligations which provide for regular interest payments.
Segregation and Collateralization: In cases in which the 1940 Act and the interpretive positions of the Securities and Exchange Commission (“SEC”) require that the Fund either delivers collateral or segregates assets in connection with certain investments (e.g., dollar rolls, TBA sale commitments, financial futures contracts, foreign currency exchange contracts, swaps and options written), or certain borrowings (e.g., reverse repurchase agreements and treasury roll transactions), the Fund will, consistent with SEC rules and/or certain interpretive letters issued by the SEC, segregate collateral or designate on its books and records cash or liquid securities having a market value at least equal to the amount that would otherwise be required to be physically segregated. Furthermore, based on requirements and agreements with certain exchanges and third party broker-dealers, each party to such transactions has requirements to deliver/deposit securities as collateral for certain investments.
Investment Transactions and Investment Income: For financial reporting purposes, investment transactions are recorded on the dates the transactions are entered into (the trade dates). Realized gains and losses on investment transactions are determined on the identified cost basis. Dividend income is recorded on the ex-dividend dates. Dividends from foreign securities where the ex-dividend date may have passed are subsequently recorded when the Fund is informed of the ex-dividend date. Under the applicable foreign tax laws, a withholding tax at various rates may be imposed on capital gains, dividends and interest. Upon notification from issuers, some of the dividend income received from a real estate investment trust may be redesignated as a reduction of cost of the related investment and/or realized gain. Interest income, including amortization and accretion of premiums and discounts on debt securities, is recognized on the accrual basis. Income and realized and unrealized gains and losses are allocated daily to each class based on its relative net assets. Consent fees are compensation for agreeing to changes in the terms of debt instruments and are included in interest income in the Statement of Operations.
Dividends and Distributions: Dividends and distributions paid by the Fund are recorded on the ex-dividend dates. The amount and timing of dividends and distributions are determined in accordance with federal income tax regulations, which may differ from US GAAP.
| | | | | | |
| | | | | | | |
| | | | | | |
| 34 | | BLACKROCK MANAGED VOLATILITY PORTFOLIO | | MARCH 31, 2012 | | |
Notes to Financial Statements (continued)
Securities Lending: The Fund may lend securities to approved borrowers, such as banks, brokers and other financial institutions. The borrower pledges cash, securities issued or guaranteed by the US government or irrevocable letters of credit issued by a bank as collateral, which will be maintained at all times in an amount equal to at least 100% of the current market value of the loaned securities. The market value of the loaned securities is determined at the close of business of the Fund and any additional required collateral is delivered to the Fund on the next business day. Securities lending income, as disclosed in the Statement of Operations, represents the income earned from the investment of the cash collateral, net of rebates paid to, or fees paid by, borrowers and less the fees paid to the securities lending agent. During the term of the loan, the Fund earns dividend or interest income on the securities loaned but does not receive dividend or interest income on the securities received as collateral. Loans of securities are terminable at any time and the borrower, after notice, is required to return borrowed securities within the standard time period for settlement of securities transactions. In the event that the borrower defaults on its obligation to return borrowed securities because of insolvency or for any other reason, the Fund could experience delays and costs in gaining access to the collateral. The Fund also could suffer a loss if the value of an investment purchased with cash collateral falls below the market value of loaned securities or if the value of an investment purchased with cash collateral falls below the value of the original cash collateral received. During the six months ended March 31, 2012, any securities on loan were collaterized by cash.
Income Taxes: It is the Fund’s policy to comply with the requirements of the Internal Revenue Code of 1986, as amended, applicable to regulated investment companies and to distribute substantially all of its taxable income to its shareholders. Therefore, no federal income tax provision is required.
The Fund files US federal and various state and local tax returns. No income tax returns are currently under examination. The statute of limitations on the Fund’s US federal tax returns remains open for each of the four years ended September 30, 2011. The statutes of limitations on the Fund’s state and local tax returns may remain open for an additional year depending upon the jurisdiction. Management does not believe there are any uncertain tax positions that require recognition of a tax liability.
Recent Accounting Standards: In May 2011, the Financial Accounting Standards Board (the “FASB”) issued amended guidance to improve disclosure about fair value measurements which will require the following disclosures for fair value measurements categorized as Level 3: quantitative information about the unobservable inputs and assumptions used in the fair value measurement, a description of the valuation policies and procedures and a narrative description of the sensitivity of the fair value measurement to changes in unobservable inputs and the interrelationships between those unobservable inputs. In addition, the amounts and reasons for all transfers in and out of Level 1 and Level 2 will be required to be disclosed, as well as disclosure of the level in the fair value hierarchy of assets and liabilities not recorded at fair value but where fair value
is disclosed. The amended guidance is effective for financial statements for fiscal years beginning after December 15, 2011, and interim periods within those fiscal years. Management is evaluating the impact of this guidance on the Fund’s financial statement disclosures.
In December 2011, the FASB issued guidance that will expand current disclosure requirements on the offsetting of certain assets and liabilities. The new disclosures will be required for investments and derivative financial instruments subject to master netting or similar agreements which are eligible for offset in the Statement of Assets and Liabilities and will require an entity to disclose both gross and net information about such investments and transactions in the financial statements. The guidance is effective for financial statements with fiscal years beginning on or after January 1, 2013, and interim periods within those fiscal years. Management is evaluating the impact of this guidance on the Fund’s financial statement disclosures.
Other: Expenses directly related to the Fund or its classes are charged to the Fund or class. Other operating expenses shared by several funds are pro rated among those funds on the basis of relative net assets or other appropriate methods. Expenses directly related to the Fund and other shared expenses pro rated to the Fund are allocated daily to each class based on its relative net assets or other appropriate methods.
The Fund has an arrangement with the custodian whereby fees may be reduced by credits earned on uninvested cash balances, which, if applicable, are shown as fees paid indirectly in the Statement of Operations. The custodian imposes fees on overdrawn cash balances, which can be offset by accumulated credits earned or may result in additional custody charges.
2. Derivative Financial Instruments:
The Fund engages in various portfolio investment strategies using derivative contracts both to increase the returns of the Fund and/or to economically hedge, or protect, its exposure to certain risks such as credit risk, equity risk, interest rate risk, foreign currency exchange rate risk or other risk (inflation risk). These contracts may be transacted on an exchange or OTC.
Losses may arise if the value of the contract decreases due to an unfavorable change in the market rates or values of the underlying instrument or if the counterparty does not perform under the contract. The Fund’s maximum risk of loss from counterparty credit risk on OTC derivatives is generally the aggregate unrealized gain netted against any collateral pledged by/posted to the counterparty. For OTC options purchased, the Fund bears the risk of loss in the amount of the premiums paid plus the positive change in market values net of any collateral received on the options should the counterparty fail to perform under the contracts. Options written by the Fund do not give rise to counterparty credit risk, as options written obligate the Fund to perform and not the counterparty. Counterparty risk related to exchange-traded financial futures contracts and options and centrally cleared swaps is deemed to be minimal due to the protection against defaults provided by the exchange on which these contracts trade.
| | | | | | |
| | | | | | | |
| | | | | | |
| | BLACKROCK MANAGED VOLATILITY PORTFOLIO | | MARCH 31, 2012 | | 35 |
Notes to Financial Statements (continued)
The Fund may mitigate counterparty risk by procuring collateral and through netting provisions included within an International Swaps and Derivatives Association, Inc. master agreement (“ISDA Master Agreement”) implemented between the Fund and each of its respective counterparties. An ISDA Master Agreement allows the Fund to offset with each separate counterparty certain derivative financial instrument’s payables and/or receivables with collateral held. The amount of collateral moved to/from applicable counterparties is generally based upon minimum transfer amounts of up to $500,000. To the extent amounts due to the Fund from its counterparties are not fully collateralized contractually or otherwise, the Fund bears the risk of loss from counterparty non-performance. See Note 1 “Segregation and Collateralization” for information with respect to collateral practices. In addition, the Fund manages counterparty risk by entering into agreements only with counterparties that it believes have the financial resources to honor their obligations and by monitoring the financial stability of those counterparties.
Certain ISDA Master Agreements allow counterparties to OTC derivatives to terminate derivative contracts prior to maturity in the event the Fund’s net assets decline by a stated percentage or the Fund fails to meet the terms of its ISDA Master Agreements, which would cause the Fund to accelerate payment of any net liability owed to the counterparty.
Financial Futures Contracts: The Fund purchases or sells financial futures contracts and options on financial futures contracts to gain exposure to, or economically hedge against, changes in the value of equity securities (equity risk), interest rates (interest rate risk) or foreign currencies (foreign currency exchange rate risk). Financial futures contracts are agreements between the Fund and counterparty to buy or sell a specific quantity of an underlying instrument at a specified price and at a specified date. Depending on the terms of the particular contract, financial futures contracts are settled either through physical delivery of the underlying instrument on the settlement date or by payment of a cash settlement amount on the settlement date. Pursuant to the contract, the Fund agrees to receive from or pay to the broker an amount of cash equal to the daily fluctuation in value of the contract. Such receipts or payments are known as variation margin and are recorded by the Fund as unrealized appreciation or depreciation. When the contract is closed, the Fund records a realized gain or loss equal to the difference between the value of the contract at the time it was opened and the value at the time it was closed. The use of financial futures contracts involves the risk of an imperfect correlation in the movements in the price of financial futures contracts, interest or foreign currency exchange rates and the underlying assets.
Foreign Currency Exchange Contracts: The Fund enters into foreign currency exchange contracts as an economic hedge against either specific transactions or portfolio instruments or to obtain exposure to foreign currencies (foreign currency exchange rate risk). A foreign currency
exchange contract is an agreement between two parties to buy and sell a currency at a set exchange rate on a future date. Foreign currency exchange contracts, when used by the Fund, help to manage the overall exposure to the currencies in which some of the investments held by the Fund are denominated. The contract is marked-to-market daily and the change in market value is recorded by the Fund as an unrealized gain or loss. When the contract is closed, the Fund records a realized gain or loss equal to the difference between the value at the time it was opened and the value at the time it was closed. The use of foreign currency exchange contracts involves the risk that the value of a foreign currency exchange contract changes unfavorably due to movements in the value of the referenced foreign currencies and the risk that a counterparty to the contract does not perform its obligations under the agreement.
Options: The Fund purchases and writes call and put options to increase or decrease its exposure to underlying instruments (including interest rate risk) and/or, in the case of options written, to generate gains from options premiums. A call option gives the purchaser (holder) of the option the right (but not the obligation) to buy, and obligates the seller (writer) to sell (when the option is exercised), the underlying instrument at the exercise or strike price at any time or at a specified time during the option period. A put option gives the holder the right to sell and obligates the writer to buy the underlying instrument at the exercise or strike price at any time or at a specified time during the option period. When the Fund purchases (writes) an option, an amount equal to the premium paid (received) by the Fund is reflected as an asset (liability). The amount of the asset (liability) is subsequently marked-to-market to reflect the current market value of the option purchased (written). When an instrument is purchased or sold through an exercise of an option, the related premium paid (or received) is added to (or deducted from) the basis of the instrument acquired or deducted from (or added to) the proceeds of the instrument sold. When an option expires (or the Fund enters into a closing transaction), the Fund realizes a gain or loss on the option to the extent of the premiums received or paid (or gain or loss to the extent the cost of the closing transaction exceeds the premiums received or paid). When the Fund writes a call option, such option is “covered,” meaning that the Fund holds the underlying instrument subject to being called by the option counterparty. When the Fund writes a put option, such option is covered by cash in an amount sufficient to cover the obligation.
Options on swaps (swaptions) are similar to options on securities except that instead of selling or purchasing the right to buy or sell a security, the writer or purchaser of the swap option is granting or buying the right to enter into a previously agreed upon interest rate or credit default swap agreement (interest rate risk and/or credit risk) at any time before the expiration of the option.
The Fund also purchases or sells listed or OTC foreign currency options, foreign currency futures and related options on foreign currency futures as a short or long hedge against possible variations in foreign exchange rates or to gain exposure to foreign currencies (foreign currency exchange rate risk). When foreign currency is purchased or sold through
| | | | | | |
| | | | | | | |
| | | | | | |
| 36 | | BLACKROCK MANAGED VOLATILITY PORTFOLIO | | MARCH 31, 2012 | | |
Notes to Financial Statements (continued)
an exercise of a foreign currency option, the related premium paid (or received) is added to (or deducted from) the basis of the foreign currency acquired or deducted from (or added to) the proceeds of the foreign currency sold. Such transactions may be effected with respect to hedges on non-US dollar denominated instruments owned by the Fund but not yet delivered, or committed or anticipated to be purchased by the Fund.
In purchasing and writing options, the Fund bears the risk of an unfavorable change in the value of the underlying instrument or the risk that the Fund may not be able to enter into a closing transaction due to an illiquid market. Exercise of a written option could result in the Fund purchasing or selling a security at a price different from the current market value.
Swaps: The Fund enters into swap agreements, in which the Fund and a counterparty agree to either make periodic net payments on a specified notional amount or net payment upon termination. Swap agreements are privately negotiated in the OTC market and may be executed on a registered financial and commodities exchange (“centrally cleared swaps”). In a centrally cleared swap, the Funds typically enter into an agreement with a counterparty; however, performance is guaranteed by the central clearinghouse reducing or eliminating the Fund’s exposure to the credit risk of the counterparty. These payments received or made by the Fund are recorded in the Statement of Operations as realized gains or losses, respectively. Any upfront fees paid are recorded as assets and any upfront fees received are recorded as liabilities and amortized over the term of the swap. Swaps are marked-to-market daily and changes in value are recorded as unrealized appreciation (depreciation). The daily change in valuation of centrally cleared swaps, if any, is recorded as a receivable or payable for variation margin in the Statement of Assets and Liabilities. When the swap is terminated, the Fund will record a realized gain or loss equal to the difference between the proceeds from (or cost of) the closing transaction and the Fund’s basis in the contract, if any. Generally, the basis of the contracts is the premium received or paid. Swap transactions involve, to varying degrees, elements of interest rate, credit and market risk in excess of the amounts recognized in the Statement of Assets and Liabilities. Such risks involve the possibility that there will be no liquid market for these agreements, that the counterparty to the agreements may default on its obligation to perform or disagree as to the meaning of the contractual terms in the agreements, and that there may be unfavorable changes in interest rates and/or market values associated with these transactions.
| — | | Credit default swaps – The Fund enters into credit default swaps to manage its exposure to the market or certain sectors of the market, to reduce its risk exposure to defaults of corporate and/or sovereign issuers or to create exposure to corporate and/or sovereign issuers to which it is not otherwise exposed (credit risk). The Fund enters into credit default swap agreements to provide a measure of protection against the default of an issuer (as buyer of protection) and/or gain credit exposure to an issuer to which it is not otherwise exposed (as seller of protection). The Fund may either buy or sell (write) credit |
| | | default swaps on single-name issuers (corporate or sovereign), a combination or basket of single-name issuers or traded indexes. Credit default swaps on single-name issuers are agreements in which the buyer pays fixed periodic payments to the seller in consideration for a guarantee from the seller to make a specific payment should a negative credit event take place with respect to the referenced entity (e.g., bankruptcy, failure to pay, obligation accelerators, repudiation, moratorium or restructuring). Credit default swaps on traded indexes are agreements in which the buyer pays fixed periodic payments to the seller in consideration for a guarantee from the seller to make a specific payment should a write-down, principal or interest shortfall or default of all or individual underlying securities included in the index occurs. As a buyer, if an underlying credit event occurs, the Fund will either receive from the seller an amount equal to the notional amount of the swap and deliver the referenced security or underlying securities comprising the index or receive a net settlement of cash equal to the notional amount of the swap less the recovery value of the security or underlying securities comprising the index. As a seller (writer), if an underlying credit event occurs, the Fund will either pay the buyer an amount equal to the notional amount of the swap and take delivery of the referenced security or underlying securities comprising the index or pay a net settlement of cash equal to the notional amount of the swap less the recovery value of the security or underlying securities comprising the index. |
| — | | Total return swaps – The Fund enters into total return swaps to obtain exposure to a security or market without owning such security or investing directly in that market or to transfer the risk/return of one market (e.g., fixed income) to another market (e.g., equity) (equity risk and/or interest rate risk). Total return swaps are agreements in which there is an exchange of cash flows whereby one party commits to make payments based on the total return (coupons plus capital gains/losses) of an underlying instrument in exchange for fixed or floating rate interest payments. To the extent the total return of the instrument or index underlying the transaction exceeds or falls short of the offsetting interest rate obligation, the Fund will receive a payment from or make a payment to the counterparty. |
| — | | Interest rate swaps – The Fund enters into interest rate swaps to gain or reduce exposure to interest rates or to manage duration, the yield curve or interest rate risk by economically hedging the value of the fixed rate bonds which may decrease when interest rates rise (interest rate risk). Interest rate swaps are agreements in which one party pays a stream of interest payments, either fixed or floating rate, for another party’s stream of interest payments, either fixed or floating, on the same notional amount for a specified period of time. In more complex swaps, the notional principal amount may decline (or amortize) over time. |
| | | | | | |
| | | | | | | |
| | | | | | |
| | BLACKROCK MANAGED VOLATILITY PORTFOLIO | | MARCH 31, 2012 | | 37 |
Notes to Financial Statements (continued)
Derivative Financial Instruments Categorized by Risk Exposure:
| | | | | | |
| |
Fair Values of Derivative Financial Instruments as of March 31, 2012 | |
| |
| Asset Derivatives | |
| |
| | | Statement of Assets and Liabilities
Location | | Value | |
| |
Interest rate contracts | | Net unrealized appreciation/depreciation1; Unrealized appreciation on swaps1; Investments at value – unaffiliated2; Swap premiums paid | | $ | 1,106,484 | |
Foreign currency exchange contracts | | Investments at value – unaffiliated2; Unrealized appreciation on foreign currency exchange contracts | | | 176,786 | |
Credit contracts | | Unrealized appreciation on swaps1; Swap premiums paid | | | 386,387 | |
Equity contracts | | Net unrealized appreciation/depreciation1 | | | 2,296,883 | |
| | | | | | |
Total | | | | $ | 3,966,540 | |
| | | | | | |
|
| |
| | | Liability Derivatives | | | |
| |
| | | Statement of Assets and Liabilities
Location | | Value | |
| |
Interest rate contracts | | Net unrealized appreciation/depreciation1; Unrealized depreciation on swaps1; Options written at value | | $ | 734,347 | |
Foreign currency exchange contracts | | Unrealized depreciation on foreign currency exchange contracts | | | 159,607 | |
Credit contracts | | Unrealized depreciation on swaps1; Swap premiums received | | | 296,913 | |
Equity contracts | | Net unrealized appreciation/depreciation1 | | | 1,231,301 | |
Other contracts | | Unrealized depreciation on swaps1 | | | 187,907 | |
| | | | | | |
Total | | | | $ | 2,610,075 | |
| | | | | | |
| | 1 | Includes cumulative appreciation/depreciation on financial futures contracts and centrally cleared swaps as reported in the Schedule of Investments. Only current day’s variation margin is reported within the Statement of Assets and Liabilities. | |
| | 2 | Includes options purchased at value as reported in the Schedule of Investments. | |
| | | | |
| |
The Effect of Derivative Financial Instruments in the Statement of
Operations Six Months Ended March 31, 2012 | |
| |
| Net Realized Gain (Loss) From | |
| |
Interest rate contracts: | | | | |
Financial futures contracts | | $ | 6,392,227 | |
Swaps | | | 417,389 | |
Options3 | | | (170,855 | ) |
Foreign currency exchange contracts: | | | | |
Financial futures contracts | | | 131,573 | |
Foreign currency exchange contracts | | | 473,156 | |
Options3 | | | (106,854 | ) |
Credit contracts: | | | | |
Swaps | | | 383,628 | |
Options3 | | | (22,569 | ) |
Equity contracts: | | | | |
Financial futures contracts | | | (2,854,821 | ) |
Other contracts: | | | | |
Swaps | | | 4,348,530 | |
| | | | |
Total | | $ | 8,991,404 | |
| | | | |
|
| |
| | | | |
| |
| Net Change in Unrealized Appreciation/Depreciation on | |
| |
Interest rate contracts: | | | | |
Financial futures contracts | | $ | 2,208,001 | |
Swaps | | | (677,076 | ) |
Options3 | | | 446,211 | |
Foreign currency exchange contracts: | | | | |
Financial futures contracts | | | 120,988 | |
Foreign currency exchange contracts | | | 50,036 | |
Options3 | | | (185,771 | ) |
Credit contracts: | | | | |
Swaps | | | (696,491 | ) |
Equity contracts: | | | | |
Financial futures contracts | | | (152,578 | ) |
Other contracts: | | | | |
Swaps | | | (193,109 | ) |
| | | | |
Total | | $ | 920,211 | |
| | | | |
|
| |
| | 3 | Options purchased are included in the net realized gain (loss) from investments and net change in unrealized appreciation/depreciation on investments. |
For the six months ended March 31, 2012, the average quarterly balances of outstanding derivative financial instruments were as follows:
| | | | |
| |
Financial futures contracts: | | | | |
Average number of contracts purchased | | | 1,049 | |
Average number of contracts sold | | | 938 | |
Average notional value of contracts purchased | | $ | 124,699,906 | |
Average notional value of contracts sold | | $ | 110,788,604 | |
Foreign currency exchange contracts: | | | | |
Average number of contracts - US dollars purchased | | | 25 | |
Average number of contracts - US dollars sold | | | 24 | |
Average US dollar amounts purchased | | $ | 14,112,829 | |
Average US dollar amounts sold | | $ | 11,147,228 | |
Options: | | | | |
Average number of option contracts purchased | | | 9 | |
Average number of option contracts written | | | 4 | |
Average notional value of option contracts purchased | | $ | 59,630,281 | |
Average notional value of option contracts written | | $ | 12,538,446 | |
Average number of swaption contracts purchased | | | 9 | |
Average number of swaption contracts written | | | 10 | |
Average notional value of swaption contracts purchased | | $ | 19,752,035 | |
Average notional value of swaption contracts written | | $ | 22,217,000 | |
Credit default swaps: | | | | |
Average number of contracts - buy protection | | | 9 | |
Average number of contracts - sell protection | | | 14 | |
Average notional value - buy protection | | $ | 6,632,500 | |
Average notional value - sell protection | | $ | 3,092,000 | |
Interest rate swaps: | | | | |
Average number of contracts - pays fixed rate | | | 14 | |
Average number of contracts - receives fixed rate | | | 11 | |
Average notional value - pays fixed rate | | $ | 23,473,269 | |
Average notional value - receives fixed rate | | $ | 22,469,517 | |
Total return swaps: | | | | |
Average number of contracts | | | 6 | |
Average notional value | | $ | 9,465,000 | |
| |
3. Investment Advisory Agreements and Other Transactions with Affiliates:
The PNC Financial Services Group, Inc. (“PNC”) and Barclays Bank PLC (“Barclays”) are the largest stockholders of BlackRock, Inc. (“BlackRock”). Due to the ownership structure, PNC is an affiliate for 1940 Act purposes, but Barclays is not.
| | | | | | |
| | | | | | | |
| | | | | | |
| 38 | | BLACKROCK MANAGED VOLATILITY PORTFOLIO | | MARCH 31, 2012 | | |
Notes to Financial Statements (continued)
The Trust, on behalf of the Fund, entered into an Investment Advisory Agreement with the Manager, the Fund’s investment advisor, an indirect, wholly owned subsidiary of BlackRock, to provide investment advisory and administration services. The Manager is responsible for the management of the Fund’s portfolio and provides the necessary personnel, facilities, equipment and certain other services necessary to the operations of the Fund. For such services, the Fund pays the Manager a monthly fee based on a percentage of the Fund’s average daily net assets at the following annual rates:
| | | | |
| |
| Average Daily Net Assets | | Investment
Advisory Fee | |
| |
First $1 Billion | | | 0.550% | |
$1 Billion - $2 Billion | | | 0.500% | |
$2 Billion - $3 Billion | | | 0.475% | |
Greater than $3 Billion | | | 0.450% | |
| |
The Manager contractually agreed to waive and/or reimburse fees or expenses, excluding interest expense, dividend expense, acquired fund fees and expenses and certain other fund expenses, in order to limit expenses. The expense limitations as a percentage of average daily net assets is as follows:
| | | | | | | | | | | | | | | | | | | | | | |
| | | | | | | Share Classes | | | | | | | |
| | |
| Institutional | | | Service | | | Investor A | | | Investor B | | | Investor C | | | Class R1 | |
| | |
| | 0.89% | | | | 1.17% | | | | 1.37% | | | | 2.14% | | | | 2.14% | | | | 1.81% | |
| | |
| 1 | There were no shares outstanding as of March 31, 2012. |
The Manager has agreed not to reduce or discontinue this contractual waiver or reimbursement prior to February 1, 2013 unless approved by the Board, including a majority of the Independent Trustees. These amounts are included in fees waived by advisor and shown as administration fees waived – class specific, transfer agent fees waived – class specific and transfer agent fees reimbursed – class specific, respectively, in the Statement of Operations. For the six months ended March 31, 2012, the Manager waived $9,044 of investment advisory fees which are included in fees waived by advisor. Class specific expense waivers or reimbursements are as follows:
| | | | | | | | | | | | |
| |
| | | Share Classes | |
| |
| | | Institutional | | | Service | | | Total | |
| |
Administration Fees Waived | | $ | 5,144 | | | $ | 215 | | | $ | 5,359 | |
Transfer Agent Fees Waived | | $ | 329 | | | $ | 50 | | | $ | 379 | |
Transfer Agent Fees Reimbursed | | $ | 2,906 | | | $ | 398 | | | $ | 3,304 | |
| |
The Manager voluntarily agreed to waive its investment advisory fees by the amount of investment advisory fees the Fund pays to the Manager indirectly through its investment in affiliated money market funds. However, the Manager does not waive its investment advisory fees by the amount of investment advisory fees paid in connection with the Fund’s investment in other affiliated investment companies, if any. This amount is shown as fees waived by advisor in the Statement of Operations. For the six months ended March 31, 2012, the Manager waived $26,073.
The Manager entered into a sub-advisory agreement with BlackRock Financial Management, Inc. (“BFM”), an affiliate of the Manager. The
Manager pays BFM, for services it provides, a monthly fee that is a percentage of the investment advisory fees paid by the Fund to the Manager.
If during the Fund’s fiscal year the operating expenses of a share class, that at any time during the prior two fiscal years received a waiver or reimbursement from the Manager, are less than the expense limit for that share class, the Manager is entitled to be reimbursed by such share class up to the lesser of (a) the amount of fees waived or expenses reimbursed during those prior two fiscal years under the agreement and (b) the amount by which the expense limit for that share class exceeds the operating expenses of the share class for the current fiscal year, provided that: (1) the Fund has more than $50 million in assets for the fiscal year and (2) the Manager or an affiliate continues to serve as the Fund’s investment advisor or administrator. In the event the expense limit for a share class is changed subsequent to a fiscal year in which the Manager becomes entitled to reimbursement for fees waived or reimbursed, the amount available to reimburse the Manager shall be calculated by reference to the expense limit for that share class in effect at the time the Manager became entitled to receive such reimbursement, rather than the subsequently changed expense limit for that share class.
On March 31, 2012, the amounts subject to possible future recoupment under the expense limitation agreement are as follows:
| | | | |
| Expiring September 30, |
|
| 2012 | | 2013 | | 2014 |
|
| $14,357 | | $14,019 | | $9,042 |
|
The Trust, on behalf of the Fund, entered into a Distribution Agreement and Distribution and Service Plan with BlackRock Investments, LLC (“BRIL”), an affiliate of the Manager. Pursuant to the Distribution and Service Plan and in accordance with Rule 12b-1 under the 1940 Act, the Fund pays BRIL ongoing service and distribution fees. The fees are accrued daily and paid monthly at annual rates based upon the average daily net assets of the shares of the Fund as follows:
| | | | | | |
|
| | | Service Fee | | | Distribution Fee |
|
Service | | | 0.25% | | | – |
Investor A | | | 0.25% | | | – |
Investor B | | | 0.25% | | | 0.75% |
Investor C | | | 0.25% | | | 0.75% |
|
Pursuant to sub-agreements with BRIL, broker-dealers and BRIL provide shareholder servicing and distribution services to the Fund. The ongoing service and/or distribution fee compensate BRIL and each broker-dealer for providing shareholder servicing and/or distribution related services to Service, Investor A, Investor B and Investor C shareholders.
For the six months ended March 31, 2012, the following table shows the class specific service and distribution fees borne directly by each class of the Fund:
| | | | | | | | |
| Share Classes |
|
| Service | | Investor A | | Investor B | | Investor C | | Total |
|
| $ 2,155 | | $488,510 | | $149,379 | | $434,097 | | $1,074,141 |
|
| | | | | | |
| | | | | | | |
| | | | | | |
| | BLACKROCK MANAGED VOLATILITY PORTFOLIO | | MARCH 31, 2012 | | 39 |
Notes to Financial Statements (continued)
For the six months ended March 31, 2012, affiliates earned underwriting discounts, direct commissions and dealer concessions on sales of the Fund’s Investor A Shares of $13,836.
For the six months ended March 31, 2012, affiliates received CDSCs relating to transactions in Investor A, Investor B, and Investor C Shares of $724, $10,486 and $6,427, respectively.
Pursuant to written agreements, certain financial intermediaries, some of which may be affiliates, provide the Fund with sub-accounting, recordkeeping, sub-transfer agency and other administrative services with respect to sub-accounts they service. For these services, these entities receive an annual fee per shareholder account, which will vary depending on share class and/or net assets. For the six months ended March 31, 2012, the Fund paid $11,139 to the Manager in return for these services, which are included in transfer agent – class specific in the Statement of Operations.
The Manager maintains a call center, which is responsible for providing certain shareholder services to the Fund, such as responding to shareholder inquiries and processing transactions based upon instructions from shareholders with respect to the subscription and redemption of Fund shares. For the six months ended March 31, 2012, the Fund reimbursed the Manager the following amounts for costs incurred in running the call center, which are included in transfer agent – class specific in the Statement of Operations:
| | | | | | | | | | |
| | | | | Share Classes | | | | |
|
| Institutional | | Service | | Investor A | | Investor B | | Investor C | | Total |
|
| $334 | | $50 | | $20,545 | | $2,784 | | $2,265 | | $25,978 |
|
For the six months ended March 31, 2012, the following table shows the class specific transfer agent fees borne directly by each class of the Fund:
| | | | | | | | | | |
| | | | | Share Classes | | | | |
|
| Institutional | | Service | | Investor A | | Investor B | | Investor C | | Total |
|
| $31,689 | | $1,897 | | $338,685 | | $44,248 | | $58,969 | | $475,488 |
|
BNY Mellon Investment Servicing (US) Inc. (“BNYMIS”) and the Manager act as co-administrators for the Fund. For these services, the co-administrators receive a combined administration fee computed daily and payable monthly, based on a percentage of the average daily net assets of the Fund. The combined administration fee is paid at the following annual rates: 0.075% of the first $500 million, 0.065% of the next $500 million and 0.055% of the average daily net assets in excess of $1 billion. In addition, each of the share classes is charged an administration fee based on the following percentages of average daily net assets of each respective class: 0.025% of the first $500 million, 0.015% of the next $500 million and 0.005% of the average daily net assets in excess of $1 billion. In addition, BNYMIS and the Manager may have, at their discretion, voluntarily waived all or any portion of their administration fees for the Fund or a share class which are included in administration fees waived – class specific in the Statement of Operations. For the six months ended March 31, 2012, the Fund paid $189,577 to the Manager in return for these services, which are included in administration, administration – class specific and administration fees waived – class specific in the Statement of Operations.
For the six months ended March 31, 2012, the following table shows the administration fees – class specific borne directly by each class of the Fund:
| | | | | | | | | | |
| | | | | Share Classes | | | | |
|
| Institutional | | Service | | Investor A | | Investor B | | Investor C | | Total |
|
| $5,144 | | $215 | | $48,851 | | $3,735 | | $10,852 | | $68,797 |
|
The Fund received an exemptive order from the SEC permitting it, among other things, to pay an affiliated securities lending agent a fee based on a share of the income derived from the securities lending activities and has retained BlackRock Investment Management, LLC (the “BIM”) as the securities lending agent. BIM may, on behalf of the Fund, invest cash collateral received by the Fund for such loans, among other things, in a private investment company managed by the Manager or in registered money market funds advised by the Manager or its affiliates. As securities lending agent, BIM is responsible for all transaction fees and all other operational costs relating to securities lending activities, other than extraordinary expenses. BIM does not receive any fees for managing the cash collateral. The market value of securities on loan and the value of the related collateral, if applicable, are shown in the Statement of Assets and Liabilities as securities loaned at value and collateral on securities loaned at value, respectively. The cash collateral invested by BIM is disclosed in the Schedule of Investments, if any. Securities lending income is equal to the total of income earned from the reinvestment of cash collateral, net of rebates paid to, or fees paid by, borrowers of securities. The Fund retains 65% of securities lending income and pays a fee to BIM equal to 35% of such income. The share of income earned by the Fund on the reinvestment of cash collateral is shown as securities lending – affiliated in the Statement of Operations. For the six months ended March 31, 2012, BIM received $16,660 in securities lending agent fees related to securities lending activities for the Fund.
Certain officers and/or trustees of the Trust are officers and/or directors of BlackRock or its affiliates. The Fund reimburses the Manager for compensation paid to the Trust’s Chief Compliance Officer.
4. Investments:
Purchases and sales of investments including paydowns, mortgage dollar roll and TBA transactions and excluding short-term securities and US government securities for the six months ended March 31, 2012, were $721,603,882 and $801,638,862, respectively.
Purchases and sales of US government securities for the six months ended March 31, 2012, were $315,755,990 and $306,669,733, respectively.
Purchases and sales of mortgage dollar rolls for the six months ended March 31, 2012, were $419,585,162 and $419,819,811, respectively.
| | | | | | |
| | | | | | | |
| | | | | | |
| 40 | | BLACKROCK MANAGED VOLATILITY PORTFOLIO | | MARCH 31, 2012 | | |
Notes to Financial Statements (continued)
Transactions in options written for the six months ended March 31, 2012, were as follows:
| | | | | | | | | | | | | | | | | | | | |
| |
| | | Calls | | | Puts | |
| | | |
| | | Contracts | | Notional (000) | | | Premiums
Received | | | Contracts | | Notional (000) | | | Premiums
Received | |
| | | | | | |
Outstanding options, beginning of period | | 62 | | | 16,550 | | | $ | 290,810 | | | – | | | 26,705 | | | | $357,923 | |
Options written | | 169 | | | 25,735 | | | | 701,062 | | | 383 | | | 63,211 | | | | 1,496,764 | |
Options expired | | (99) | | | (14,685) | | | | (213,067) | | | (29) | | | (37,787) | | | | (497,569) | |
Options closed | | (132) | | | (23,900) | | | | (669,797) | | | (354) | | | (27,329) | | | | (1,061,823) | |
| | | | | | |
Outstanding options, end of period | | – | | | 3,700 | | | $ | 109,008 | | | – | | | 24,800 | | | | $295,295 | |
| |
5. Income Tax Information:
As of March 31, 2012, gross unrealized appreciation and gross unrealized depreciation based on cost for federal income tax purposes were as follows:
| | | | |
| |
Tax cost | | $ | 567,867,719 | |
| | | | |
Gross unrealized appreciation | | $ | 51,997,094 | |
Gross unrealized depreciation | | | (6,200,509 | ) |
| | | | |
Net unrealized appreciation | | $ | 45,796,585 | |
| | | | |
6. Borrowings:
The Trust, on behalf of the Fund, along with certain other funds managed by the Manager and its affiliates, is a party to a $500 million credit agreement with a group of lenders. The Fund may borrow under the credit agreement to fund shareholder redemptions. Effective November 2010 to November 2011, the credit agreement had the following terms: a commitment fee of 0.08% per annum based on the Fund’s pro rata share of the unused portion of the credit agreement and interest at a rate equal to the higher of (a) the one-month LIBOR plus 1.00% per annum and (b) the Fed Funds rate plus 1.00% per annum on amounts borrowed. In addition, the Fund paid administration and arrangement fees which were allocated to the Fund based on its net assets as of October 31, 2010. The credit agreement, which expired in November 2011, was renewed until November 2012. Effective November 2011 to November 2012, the credit agreement has the following terms: a commitment fee of 0.065% per annum based on the Fund’s pro rata share of the unused portion of the credit agreement and interest at a rate equal to the higher of (a) the one-month LIBOR plus 0.80% per annum or (b) the Fed Funds rate plus 0.80% per annum on amounts borrowed. In addition, the Fund paid administration and arrangement fees which were allocated to the Fund based on its net assets as of October 31, 2011. The Fund did not borrow under the credit agreement during the six months ended March 31, 2012.
For the six months ended March 31, 2012, the Fund’s daily average amount of transactions considered as borrowings from reverse repurchase agreements and treasury rolls transactions was approximately $52,844,009 and the daily weighted average interest rates were 0.01%.
7. Concentration, Market and Credit Risk:
The Fund invested a significant portion of its assets in securities backed by commercial or residential mortgage loans or in issuers that hold mortgage and other asset-backed securities. Please see the Schedule of Investments for these securities. Changes in economic conditions, including delinquencies and/or defaults on assets underlying these securities, can affect the value, income and/or liquidity of such positions.
In the normal course of business, the Fund invests in securities and enters into transactions where risks exist due to fluctuations in the market (market risk) or failure of the issuer of a security to meet all its obligations (issuer credit risk). The value of securities held by the Fund may decline in response to certain events, including those directly involving the issuers whose securities are owned by the Fund; conditions affecting the general economy; overall market changes; local, regional or global political, social or economic instability; and currency and interest rate and price fluctuations. Similar to issuer credit risk, the Fund may be exposed to counterparty credit risk, or the risk that an entity with which the Fund has unsettled or open transactions may fail to or be unable to perform on its commitments. The Fund manages counterparty credit risk by entering into transactions only with counterparties that it believes have the financial resources to honor their obligations and by monitoring the financial stability of those counterparties. Financial assets, which potentially expose the Fund to market, issuer and counterparty credit risks, consist principally of financial instruments and receivables due from counterparties. The extent of the Fund’s exposure to market, issuer and counterparty credit risks with respect to these financial assets is generally approximated by their value recorded in the Fund’s Statement of Assets and Liabilities, less any collateral held by the Fund.
| | | | | | |
| | | | | | | |
| | | | | | |
| | BLACKROCK MANAGED VOLATILITY PORTFOLIO | | MARCH 31, 2012 | | 41 |
Notes to Financial Statements (concluded)
8. Capital Shares Transactions:
Transactions in capital shares for each class were as follows:
| | | | | | | | | | | | | | | | |
| | | Six Months Ended
March 31, 2012 | | | Year Ended
September 30, 2011 | |
| | | Shares | | | Amount | | | Shares | | | Amount | |
| |
| | | | |
Institutional | | | | | | | | | | | | | | | | |
| |
Shares sold | | | 486,813 | | | | $ 7,012,021 | | | | 767,577 | | | | $ 11,749,107 | |
Shares issued in reinvestment of dividends | | | 78,331 | | | | 1,107,350 | | | | 53,454 | | | | 816,733 | |
Shares redeemed | | | (787,227 | ) | | | (11,448,224) | | | | (683,594 | ) | | | (10,429,065) | |
| | | | | | | | |
Net increase (decrease) | | | (222,083 | ) | | | $ (3,328,853) | | | | 137,437 | | | | $ 2,136,775 | |
| | | | | | | | |
| | | | |
| | | | | | | | | | | | | | | | |
| |
Service | | | | | | | | | | | | | | | | |
| |
Shares sold | | | 2,834 | | | | $ 41,446 | | | | 34,908 | | | | $ 535,953 | |
Shares issued in reinvestment of dividends | | | 3,024 | | | | 42,639 | | | | 1,860 | | | | 28,363 | |
Shares redeemed | | | (10,076 | ) | | | (144,604) | | | | (32,736 | ) | | | (492,985) | |
| | | | | | | | |
Net increase (decrease) | | | (4,218 | ) | | | $ (60,519) | | | | 4,032 | | | | $ 71,331 | |
| | | | | | | | |
| | | | | | | | | | | | | | | | |
| |
Investor A | | | | | | | | | | | | | | | | |
| |
Shares sold and automatic conversion of shares | | | 1,484,028 | | | | $ 21,736,882 | | | | 3,114,748 | | | | $ 47,609,574 | |
Shares issued in reinvestment of dividends | | | 685,616 | | | | 9,666,578 | | | | 456,769 | | | | 6,944,504 | |
Shares redeemed | | | (2,281,104 | ) | | | (33,512,690) | | | | (4,078,562 | ) | | | (62,130,535) | |
| | | | | | | | |
Net decrease | | | (111,460 | ) | | | $ (2,109,230) | | | | (507,045 | ) | | | $ (7,576,457) | |
| | | | | | | | |
| | | | |
| | | | | | | | | | | | | | | | |
| |
Investor B | | | | | | | | | | | | | | | | |
| |
Shares sold | | | 18,088 | | | | $ 265,082 | | | | 55,091 | | | | $ 828,679 | |
Shares issued in reinvestment of dividends | | | 48,979 | | | | 682,990 | | | | 27,249 | | | | 406,173 | |
Shares redeemed and automatic conversion of shares | | | (600,448 | ) | | | (8,777,810) | | | | (1,295,998 | ) | | | (19,544,899) | |
| | | | | | | | |
Net decrease | | | (533,381 | ) | | | $ (7,829,738) | | | | (1,213,658 | ) | | | $(18,310,047) | |
| | | | | | | | |
| | | | |
| | | | | | | | | | | | | | | | |
| |
Investor C | | | | | | | | | | | | | | | | |
| |
Shares sold | | | 596,196 | | | | $ 8,558,405 | | | | 1,040,589 | | | | $ 15,590,367 | |
Shares issued in reinvestment of dividends | | | 135,848 | | | | 1,884,050 | | | | 60,569 | | | | 904,720 | |
Shares redeemed | | | (627,711 | ) | | | (9,082,134) | | | | (1,177,536 | ) | | | (17,588,420) | |
| | | | | | | | |
Net increase (decrease) | | | 104,333 | | | | $ 1,360,321 | | | | (76,378 | ) | | | $ (1,093,333) | |
| | | | | | | | | | | | | | | | |
| |
Total net decrease | | | (766,809 | ) | | | $(11,968,019) | | | | (1,655,612 | ) | | | $(24,771,731) | |
| | | | | | | | |
9. Subsequent Events:
Management has evaluated the impact of all subsequent events on the Fund through the date the financial statements were issued and has determined that there were no subsequent events requiring adjustment or additional disclosure in the financial statements.
| | | | | | |
| | | | | | | |
| | | | | | |
| 42 | | BLACKROCK MANAGED VOLATILITY PORTFOLIO | | MARCH 31, 2012 | | |
Officers and Trustees
Ronald W. Forbes, Co-Chairman of the Board and Trustee
Rodney D. Johnson, Co-Chairman of the Board and Trustee
Paul L. Audet, Trustee
David O. Beim, Trustee
Henry Gabbay, Trustee
Dr. Matina S. Horner, Trustee
Herbert I. London, Trustee
Cynthia A. Montgomery, Trustee
Joseph P. Platt, Trustee
Robert C. Robb, Jr., Trustee
Toby Rosenblatt, Trustee
Kenneth L. Urish, Trustee
Frederick W. Winter, Trustee
John M. Perlowski, President and Chief Executive Officer
Richard Hoerner, CFA, Vice President
Brendan Kyne, Vice President
Simon Mendelson, Vice President
Christopher Stavrakos, CFA, Vice President
Neal Andrews, Chief Financial Officer
Jay Fife, Treasurer
Brian Kindelan, Chief Compliance Officer and Anti-Money Laundering Officer
Ira P. Shapiro, Secretary
Investment Advisor and Co-Administrator
BlackRock Advisors, LLC
Wilmington, DE 19809
Sub-Advisor
BlackRock Financial Management, Inc.
New York, NY 10055
Accounting Agent, Co-Administrator and Transfer Agent
BNY Mellon Investment Servicing (US) Inc.
Wilmington, DE 19809
Custodian
The Bank of New York
New York, NY 10286
Distributor
BlackRock Investments, LLC
New York, NY 10022
Legal Counsel
Sidley Austin LLP
New York, NY 10019
Independent Registered Public Accounting Firm
Deloitte & Touche LLP
Philadelphia, PA 19103
Address of the Trust
100 Bellevue Parkway
Wilmington, DE 19809
| | | | | | |
| | | | | | | |
| | | | | | |
| | BLACKROCK MANAGED VOLATILITY PORTFOLIO | | MARCH 31, 2012 | | 43 |
Additional Information
Electronic Delivery
Electronic copies of most financial reports and prospectuses are available on the Fund’s websites or shareholders can sign up for e-mail notifications of quarterly statements, annual and semi-annual reports and prospectuses by enrolling in the Fund’s electronic delivery program.
To enroll:
Shareholders Who Hold Accounts with Investment Advisors, Banks or Brokerages:
Please contact your financial advisor. Please note that not all investment advisors, banks or brokerages may offer this service.
Shareholders Who Hold Accounts Directly With BlackRock:
| 1) | Access the BlackRock website at http://www.blackrock.com/edelivery |
| 2) | Select “eDelivery” under the “More Information” section |
Householding
The Fund will mail only one copy of shareholder documents, including prospectuses, annual and semi-annual reports and proxy statements, to shareholders with multiple accounts at the same address. This practice is commonly called “householding” and is intended to reduce expenses and eliminate duplicate mailings of shareholder documents. Mailings of your shareholder documents may be householded indefinitely unless you instruct us otherwise. If you do not want the mailing of these documents to be combined with those for other members of your household, please contact the Fund at (800) 441-7762.
Availability of Quarterly Schedule of Investments
The Fund files its complete schedule of portfolio holdings with the SEC for the first and third quarters of each fiscal year on Form N-Q. The Fund’s Forms N-Q are available on the SEC’s website at http:// www.sec.gov and may also be reviewed and copied at the SEC’s Public Reference Room in Washington, D.C. Information on how to access documents on the SEC’s website without charge may be obtained by calling (800) SEC-0330. The Fund’s Forms N-Q may also be obtained upon request and without charge by calling (800) 441-7762.
Availability of Proxy Voting Policies and Procedures
A description of the policies and procedures that the Fund uses to determine how to vote proxies relating to portfolio securities is available (1) without charge, upon request, by calling (800) 441-7762; (2) at http://www.blackrock.com; and (3) on the SEC’s website at http:// www.sec.gov.
Availability of Proxy Voting Record
Information about how the Fund voted proxies relating to securities held in the Fund’s portfolios during the most recent 12-month period ended June 30 is available upon request and without charge (1) at http:// www.blackrock.com or by calling (800) 441-7762 and (2) on the SEC’s website at http://www.sec.gov.
Account Information
Call us at (800) 441-7762 from 8:00 AM to 6:00 PM EST on any business day to get information about your account balances, recent transactions and share prices. You can also reach us on the Web at http://www.blackrock.com/funds.
Automatic Investment Plans
Investor Class shareholders who want to invest regularly can arrange to have $50 or more automatically deducted from their checking or savings account and invested in any of the BlackRock funds.
Systematic Withdrawal Plan
Investor Class shareholders can establish a systematic withdrawal plan and receive periodic payments of $50 or more from their BlackRock funds, as long as their account balance is at least $10,000.
Retirement Plans
Shareholders may make investments in conjunction with Traditional, Rollover, Roth, Coverdell, Simple IRAs, SEP IRAs and 403(b) Plans.
| | | | | | |
| | | | | | | |
| | | | | | |
| 44 | | BLACKROCK MANAGED VOLATILITY PORTFOLIO | | MARCH 31, 2012 | | |
Additional Information (concluded)
|
BlackRock Privacy Principles |
BlackRock is committed to maintaining the privacy of its current and former fund investors and individual clients (collectively, “Clients”) and to safeguarding their non-public personal information. The following information is provided to help you understand what personal information BlackRock collects, how we protect that information and why in certain cases we share such information with select parties.
If you are located in a jurisdiction where specific laws, rules or regulations require BlackRock to provide you with additional or different privacy-related rights beyond what is set forth below, then BlackRock will comply with those specific laws, rules or regulations.
BlackRock obtains or verifies personal non-public information from and about you from different sources, including the following: (i) information we receive from you or, if applicable, your financial intermediary, on applications, forms or other documents; (ii) information about your transactions with us, our affiliates, or others; (iii) information we receive from a consumer reporting agency; and (iv) from visits to our websites.
BlackRock does not sell or disclose to non-affiliated third parties any non-public personal information about its Clients, except as permitted by law or as is necessary to respond to regulatory requests or to service Client accounts. These non-affiliated third parties are required to protect the confidentiality and security of this information and to use it only for its intended purpose.
We may share information with our affiliates to service your account or to provide you with information about other BlackRock products or services that may be of interest to you. In addition, BlackRock restricts access to non-public personal information about its Clients to those BlackRock employees with a legitimate business need for the information. BlackRock maintains physical, electronic and procedural safeguards that are designed to protect the non-public personal information of its Clients, including procedures relating to the proper storage and disposal of such information.
| | | | | | |
| | | | | | | |
| | | | | | |
| | BLACKROCK MANAGED VOLATILITY PORTFOLIO | | MARCH 31, 2012 | | 45 |
A World-Class Mutual Fund Family
BlackRock offers a diverse lineup of open-end mutual funds crossing all investment styles and managed by experts in equity, fixed income and tax-exempt investing.
BlackRock ACWI ex-US Index Fund
BlackRock All-Cap Energy & Resources Portfolio
BlackRock Balanced Capital Fund†
BlackRock Basic Value Fund
BlackRock Capital Appreciation Fund
BlackRock China Fund
BlackRock Commodity Strategies Fund
BlackRock Emerging Markets Fund
BlackRock Emerging Markets Long/Short Equity Fund
BlackRock Energy & Resources Portfolio
BlackRock Equity Dividend Fund
BlackRock EuroFund
BlackRock Focus Growth Fund
BlackRock Global Allocation Fund
BlackRock Global Dividend Income Portfolio†
BlackRock Global Dynamic Equity Fund
BlackRock Global Opportunities Portfolio
BlackRock Global SmallCap Fund
BlackRock Health Sciences Opportunities Portfolio
BlackRock Index Equity Portfolio
BlackRock India Fund
BlackRock International Fund
BlackRock International Index Fund
BlackRock International Opportunities Portfolio
BlackRock Large Cap Core Fund
BlackRock Large Cap Core Plus Fund
BlackRock Large Cap Growth Fund
BlackRock Large Cap Value Fund
BlackRock Latin America Fund
BlackRock Managed Volatility Portfolio†
BlackRock Mid-Cap Growth Equity Portfolio
BlackRock Mid-Cap Value Equity Portfolio
BlackRock Mid Cap Value Opportunities Fund
BlackRock Natural Resources Trust
BlackRock Pacific Fund
BlackRock Russell 1000 Index Fund
BlackRock Science & Technology Opportunities Portfolio
BlackRock Small Cap Growth Equity Portfolio
BlackRock Small Cap Growth Fund II
BlackRock Small Cap Index Fund
BlackRock S&P 500 Index Fund
BlackRock S&P 500 Stock Fund
BlackRock U.S. Opportunities Portfolio
BlackRock Value Opportunities Fund
BlackRock World Gold Fund
BlackRock Bond Index Fund
BlackRock Core Bond Portfolio
BlackRock CoreAlpha Bond Fund
BlackRock Emerging Market Debt Portfolio
BlackRock Floating Rate Income Portfolio
BlackRock Global Long/Short Credit Fund
BlackRock GNMA Portfolio
BlackRock High Yield Bond Portfolio
BlackRock Inflation Protected Bond Portfolio
BlackRock International Bond Portfolio
BlackRock Long Duration Bond Portfolio
BlackRock Low Duration Bond Portfolio
BlackRock Multi-Asset Income Portfolio†
BlackRock Multi-Sector Bond Portfolio
BlackRock Strategic Income Opportunities Portfolio
BlackRock Total Return Fund
BlackRock US Government Bond Portfolio
BlackRock US Mortgage Portfolio
BlackRock World Income Fund
BlackRock California Municipal Bond Fund
BlackRock High Yield Municipal Fund
BlackRock Intermediate Municipal Fund
BlackRock National Municipal Fund
BlackRock New Jersey Municipal Bond Fund
BlackRock New York Municipal Bond Fund
BlackRock Pennsylvania Municipal Bond Fund
BlackRock Short-Term Municipal Fund
|
Target Risk & Target Date Funds† |
| | | | | | | | | | | | |
BlackRock Prepared Portfolios | | BlackRock Lifecycle Prepared Portfolios | | LifePath Portfolios | | LifePath Index Portfolios |
Conservative Prepared Portfolio | | 2015 | | 2035 | | Retirement | | 2040 | | Retirement | | 2040 |
Moderate Prepared Portfolio | | 2020 | | 2040 | | 2020 | | 2045 | | 2020 | | 2045 |
Growth Prepared Portfolio | | 2025 | | 2045 | | 2025 | | 2050 | | 2025 | | 2050 |
Aggressive Growth Prepared Portfolio | | 2030 | | 2050 | | 2030 | | 2055 | | 2030 | | 2055 |
| | | | | | 2035 | | | | 2035 | | |
† Mixed asset fund.
BlackRock mutual funds are currently distributed by BlackRock Investments, LLC. You should consider the investment objectives, risks, charges and expenses of the funds under consideration carefully before investing. Each fund’s prospectus contains this and other information and is available at www.blackrock.com or by calling (800) 441-7762 or from your financial advisor. The prospectus should be read carefully before investing.
| | | | | | |
| | | | | | | |
| | | | | | |
| 46 | | BLACKROCK MANAGED VOLATILITY PORTFOLIO | | MARCH 31, 2012 | | |
[THIS PAGE INTENTIONALLY LEFT BLANK.]
This report is transmitted to shareholders only. It is not authorized for use as an offer of sale or a solicitation of an offer to buy shares of the Fund unless accompanied or preceded by the Fund’s current prospectus. Past performance results shown in this report should not be considered a representation of future performance. Investment returns and principal value of shares will fluctuate so that shares, when redeemed, may be worth more or less than their original cost. Statements and other information herein are as dated and are subject to change.
Investment in foreign securities involves special risks including fluctuating foreign exchange rates, foreign government regulations, differing degrees of liquidity and the possibility of substantial volatility due to adverse political, economic or other developments.
| | |
| AA-3/12-SAR | |  |
Item 2 – Code of Ethics – Not Applicable to this semi-annual report
Item 3 – Audit Committee Financial Expert – Not Applicable to this semi-annual report
Item 4 – Principal Accountant Fees and Services – Not Applicable to this semi-annual report
Item 5 – Audit Committee of Listed Registrants – Not Applicable
Item 6 – Investments
(a) The registrant’s Schedule of Investments is included as part of the Report to Stockholders filed under Item 1 of this Form.
(b) Not Applicable due to no such divestments during the semi-annual period covered since the previous Form N-CSR filing.
Item 7 – Disclosure of Proxy Voting Policies and Procedures for Closed-End Management Investment Companies – Not Applicable
Item 8 – Portfolio Managers of Closed-End Management Investment Companies – Not Applicable
Item 9 – Purchases of Equity Securities by Closed-End Management Investment Company and Affiliated Purchasers – Not
Applicable
Item 10 – Submission of Matters to a Vote of Security Holders –There have been no material changes to these procedures.
Item 11 – Controls and Procedures
(a) – | The registrant’s principal executive and principal financial officers, or persons performing similar functions, have concluded that the registrant’s disclosure controls and procedures (as defined in Rule 30a-3(c) under the Investment Company Act of 1940, as amended (the “1940 Act”)) are effective as of a date within 90 days of the filing of this report based on the evaluation of these controls and procedures required by Rule 30a-3(b) under the 1940 Act and Rule 15d-15(b) under the Securities Exchange Act of 1934, as amended. |
(b) – | There were no changes in the registrant’s internal control over financial reporting (as defined in Rule 30a-3(d) under the 1940 Act) that occurred during the second fiscal quarter of the period covered by this report that have materially affected, or are reasonably likely to materially affect, the registrant’s internal control over financial reporting. |
Item 12 – Exhibits attached hereto
(a)(1) – Code of Ethics – Not Applicable to this semi-annual report
(a)(2) – Certifications – Attached hereto
(a)(3) – Not Applicable
(b) – Certifications – Attached hereto
2
Pursuant to the requirements of the Securities Exchange Act of 1934 and the Investment Company Act of 1940, the registrant has duly caused this report to be signed on its behalf by the undersigned, thereunto duly authorized.
BlackRock Funds
| | |
By: | | /s/ John M. Perlowski |
| | John M. Perlowski |
| | Chief Executive Officer (principal executive officer) of |
| | BlackRock Funds |
Date: June 4, 2012
Pursuant to the requirements of the Securities Exchange Act of 1934 and the Investment Company Act of 1940, this report has been signed below by the following persons on behalf of the registrant and in the capacities and on the dates indicated.
| | |
By: | | /s/ John M. Perlowski |
| | John M. Perlowski |
| | Chief Executive Officer (principal executive officer) of |
| | BlackRock Funds |
Date: June 4, 2012
| | |
By: | | /s/ Neal J. Andrews |
| | Neal J. Andrews |
| | Chief Financial Officer (principal financial officer) of |
| | BlackRock Funds |
Date: June 4, 2012
3