UNITED STATES
SECURITIES AND EXCHANGE COMMISSION
Washington, D.C. 20549
FORM N-CSR
CERTIFIED SHAREHOLDER REPORT OF REGISTERED MANAGEMENT INVESTMENT COMPANIES
Investment Company Act file number: 811-05742
Name of Fund: BlackRock Funds
BlackRock Real Estate Securities Fund
Fund Address: 100 Bellevue Parkway, Wilmington, DE 19809
Name and address of agent for service: John M. Perlowski, Chief Executive Officer, BlackRock Funds, 55 East 52nd
Street, New York, NY 10055
Registrant’s telephone number, including area code: (800) 441-7762
Date of fiscal year end: 01/31/2017
Date of reporting period: 07/31/2016
Item 1 – Report to Stockholders
JULY 31, 2016
| | | | |
SEMI-ANNUAL REPORT (UNAUDITED) | | | | BLACKROCK® |
| | | | |
| | BlackRock Real Estate Securities Fund | | of BlackRock FundsSM |
| | |
| Not FDIC Insured ¡ May Lose Value ¡ No Bank Guarantee | | |
| | |
 | | Shareholders can sign up for e-mail notifications of quarterly statements, annual and semi-annual shareholder reports and prospectuses by enrolling in the electronic delivery program. Electronic copies of shareholder reports and prospectuses are also available on BlackRock’s website. |
| | TO ENROLL IN ELECTRONIC DELIVERY: |
| | Shareholders Who Hold Accounts with Investment Advisors, Banks or Brokerages: |
| | Please contact your financial advisor. Please note that not all investment advisors, banks or brokerages may offer this service. |
| | Shareholders Who Hold Accounts Directly with BlackRock: |
| | 1. Access the BlackRock website at blackrock.com |
| | 2. Select “Access Your Account” |
| | 3. Next, select “eDelivery” in the “Related Resources” box and follow the sign-up instructions |
| | | | | | |
| 2 | | BLACKROCK REAL ESTATE SECURITIES FUND | | JULY 31, 2016 | | |
Dear Shareholder,
Uneven economic outlooks and the divergence of monetary policies across regions have been the overarching themes driving financial markets over the past couple of years. In the latter half of 2015, as U.S. growth outpaced other developed markets, investors were focused largely on the timing of the Federal Reserve’s (the “Fed”) decision to end its near-zero interest rate policy. The Fed ultimately hiked rates in December, whereas the European Central Bank and the Bank of Japan took additional steps to stimulate growth, even introducing negative interest rates. The U.S. dollar had strengthened considerably ahead of these developments, causing profit challenges for U.S. companies that generate revenues overseas, and pressuring emerging market currencies and commodities prices.
Also during this time period, oil prices collapsed due to excess global supply. China, one of the world’s largest consumers of oil, was another notable source of stress for financial markets as the country showed signs of slowing economic growth and took measures to devalue its currency. Declining confidence in the country’s policymakers stoked investors’ worries about the potential impact of China’s weakness on the global economy. Global market volatility increased and risk assets (such as equities and high yield bonds) suffered in this environment.
The elevated market volatility spilled over into 2016, but as the first quarter wore on, fears of a global recession began to fade, allowing markets to calm and risk assets to rebound. Central bank stimulus in Europe and Japan, combined with a more tempered outlook for rate hikes in the United States, helped bolster financial markets. A softening in U.S. dollar strength brought relief to U.S. exporters and emerging market economies. Oil prices rebounded as the world’s largest producers agreed to reduce supply.
Volatility spiked again in late June when the United Kingdom shocked investors with its vote to leave the European Union. Uncertainty around how the British exit might affect the global economy and political landscape drove investors to high-quality assets, pushing already low global yields to even lower levels. But markets recovered swiftly in July as economic data suggested that the negative impact had thus far been contained to the United Kingdom and investors returned to risk assets.
At BlackRock, we believe investors need to think globally, extend their scope across a broad array of asset classes and be prepared to adjust accordingly as market conditions change over time. We encourage you to talk with your financial advisor and visit blackrock.com for further insight about investing in today’s markets.
Sincerely,

Rob Kapito
President, BlackRock Advisors, LLC

Rob Kapito
President, BlackRock Advisors, LLC
| | | | | | | | | | |
| Total Returns as of July 31, 2016 |
| | | 6-month | | 12-month |
U.S. large cap equities
(S&P 500® Index) | | | | 13.29 | % | | | | 5.61 | % |
U.S. small cap equities
(Russell 2000® Index) | | | | 18.76 | | | | | 0.00 | |
International equities
(MSCI Europe, Australasia, Far East Index) | | | | 8.25 | | | | | (7.53 | ) |
Emerging market equities
(MSCI Emerging Markets Index) | | | | 19.52 | | | | | (0.75 | ) |
3-month Treasury bills
(BofA Merrill Lynch
3-Month U.S. Treasury
Bill Index) | | | | 0.17 | | | | | 0.22 | |
U.S. Treasury securities
(BofA Merrill Lynch
10-Year U.S. Treasury
Index) | | | | 5.01 | | | | | 8.53 | |
U.S. investment grade
bonds (Barclays U.S.
Aggregate Bond Index) | | | | 4.54 | | | | | 5.94 | |
Tax-exempt municipal
bonds (S&P Municipal Bond Index) | | | | 3.27 | | | | | 7.06 | |
U.S. high yield bonds
(Barclays U.S. Corporate
High Yield 2% Issuer
Capped Index) | | | | 13.84 | | | | | 5.01 | |
|
| Past performance is no guarantee of future results. Index performance is shown for illustrative purposes only. You cannot invest directly in an index. | |
| | | | | | |
| | | THIS PAGE NOT PART OF YOUR FUND REPORT | | | | 3 |
| | | | |
| Fund Summary as of July 31, 2016 | | | | |
BlackRock Real Estate Securities Fund’s (the “Fund”) investment objective is to seek total return comprised of long-term growth of capital and dividend income.
|
| Portfolio Management Commentary |
How did the Fund perform?
| • | | For the six-month period ended July 31, 2016, the Fund outperformed the benchmark, the FTSE EPRA/NAREIT United States Index. |
What factors influenced performance?
| • | | During the period, the Fund’s holdings within health care, specialty real estate investment trusts (“REITs”) (primarily data centers), triple net lease, self-storage and residential (single family housing and apartments) contributed to performance. In particular, positions in CareTrust REIT, Inc. (health care), STAG Industrial, Inc. (triple net lease) and CyrusOne, Inc. (data centers) added to returns. |
| • | | Conversely, the Fund’s cash position and its holdings in lodging REITs and manufactured housing detracted from performance. In addition, the Fund’s position in the data center REIT company InterXion Holding NV weighed on returns. |
Describe recent portfolio activity.
| • | | Over the period, the Fund reduced its overall risk level by selling some positions within the office and self-storage sectors, and adding to holdings within the triple net lease and industrial sectors. The Fund’s health care allocation also was realigned, moving away from owners of skilled nursing facilities due to unfavorable earnings reports from certain major operators, while purchasing what the investment adviser views as more stable medical office building companies that are less subject to government regulation. |
Describe portfolio positioning at period end.
| • | | The Fund intentionally maintains relatively modest property type tilts at most times given the investment adviser’s preference to deploy risk budget/risk-taking toward bottom-up stock selection in each market. |
| • | | As of period end, the Fund had overweight positions in the mall, single family housing and student housing segments, and underweight positions in manufactured housing, self-storage and shopping centers. |
The views expressed reflect the opinions of BlackRock as of the date of this report and are subject to change based on changes in market, economic or other conditions. These views are not intended to be a forecast of future events and are no guarantee of future results.
| | | | | |
| Ten Largest Holdings | | Percent of Net Assets |
Simon Property Group, Inc. | | | | 12 | % |
Ventas, Inc. | | | | 8 | |
Boston Properties, Inc. | | | | 6 | |
AvalonBay Communities, Inc. | | | | 6 | |
General Growth Properties, Inc. | | | | 4 | |
Retail Properties of America, Inc., Class A | | | | 4 | |
Essex Property Trust, Inc. | | | | 4 | |
Extra Space Storage, Inc. | | | | 4 | |
Kilroy Realty Corp. | | | | 4 | |
First Industrial Realty Trust, Inc. | | | | 3 | |
| | | | | |
| Industry Allocation | | Percent of
Net Assets |
Retail | | | | 24 | % |
Residential | | | | 16 | |
Office | | | | 14 | |
Health Care | | | | 13 | |
Triple Net Lease | | | | 10 | |
Industrial | | | | 8 | |
Self Storage | | | | 5 | |
Lodging | | | | 5 | |
Specialty | | | | 3 | |
Diversified | | | | 1 | |
Short-Term Securities | | | | 1 | |
For Fund compliance purposes, the Fund’s industry classifications refer to one or more of the industry sub-classifications used by one or more widely recognized market indexes or ratings group indexes, and/or as defined by the investment adviser. These definitions may not apply for purposes of this report, which may combine such industry sub-classifications for reporting ease.
| | | | | | |
| 4 | | BLACKROCK REAL ESTATE SECURITIES FUND | | JULY 31, 2016 | | |
|
| Total Return Based on a $10,000 Investment |
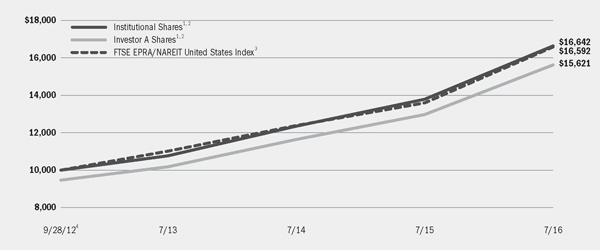
| | 1 | Assuming maximum sales charges, if any, transaction costs and other operating expenses, including investment advisory fees and administration fees, if any. Institutional Shares do not have a sales charge. |
| | 2 | Under normal conditions, the Fund invests at least 80% of its net assets plus any borrowings for investment purposes (measured at the time of purchase) in a portfolio of equity investments in issuers that are primarily engaged in or related to the real estate industry inside the United States. |
| | 3 | A subset of the EPRA/NAREIT Global Index and the EPRA/NAREIT North America Index containing publicly quoted real estate companies that meet the EPRA Ground Rules. |
| | 4 | Commencement of operations. |
| | | | | | | | | | |
| Performance Summary for the Period Ended July 31, 2016 |
| | | | | Average Annual Total Returns5 |
| | | | | 1 Year | | Since Inception6 |
| | | 6-Month
Total Returns | | w/o sales
charge | | w/ sales
charge | | w/o sales
charge | | w/ sales
charge |
Institutional | | 23.05% | | 20.67% | | N/A | | 14.19% | | N/A |
Investor A | | 22.93 | | 20.39 | | 14.07% | | 13.91 | | 12.32% |
Investor C | | 22.49 | | 19.49 | | 18.49 | | 13.06 | | 13.06 |
FTSE EPRA/NAREIT United States Index | | 21.80 | | 21.98 | | N/A | | 14.10 | | N/A |
| | 5 | | Assuming maximum sales charges, if any. Average annual total returns with and without sales charges reflect reductions for distribution and service fees. See “About Fund Performance” on page 6 for a detailed description of share classes, including any related sales charges and fees. |
| | 6 | | The Fund commenced operations on September 28, 2012. |
| | | | N/A—Not applicable as share class and index do not have a sales charge. |
| | | | Past performance is not indicative of future results. |
| | | | | | | | | | | | | | |
| Expense Example |
| | | Actual | | Hypothetical8 | | |
| | | Beginning Account Value
February 1, 2016 | | Ending Account Value July 31, 2016 | | Expenses Paid
During the Period7 | | Beginning Account Value
February 1, 2016 | | Ending Account Value July 31, 2016 | | Expenses Paid
During the Period7 | | Annualized Expense Ratio |
Institutional | | $1,000.00 | | $1,230.50 | | $ 5.82 | | $1,000.00 | | $1,019.64 | | $ 5.27 | | 1.05% |
Investor A | | $1,000.00 | | $1,229.30 | | $ 7.21 | | $1,000.00 | | $1,018.40 | | $ 6.52 | | 1.30% |
Investor C | | $1,000.00 | | $1,224.90 | | $11.34 | | $1,000.00 | | $1,014.67 | | $10.27 | | 2.05% |
| | 7 | | For each class of the Fund, expenses are equal to the annualized expense ratio for the class, multiplied by the average account value over the period, multiplied by 182/366 (to reflect the one-half year period shown). |
| | 8 | | Hypothetical 5% annual return before expenses is calculated by prorating the number of days in the most recent fiscal half year divided by 366. |
| | | | See “Disclosure of Expenses” on page 6 for further information on how expenses were calculated. |
| | | | | | |
| | | BLACKROCK REAL ESTATE SECURITIES FUND | | JULY 31, 2016 | | 5 |
| • | | Institutional Shares are not subject to any sales charge. These shares bear no ongoing distribution or service fees and are available only to certain eligible investors. |
| • | | Investor A Shares are subject to a maximum initial sales charge (front-end load) of 5.25% and a service fee of 0.25% per year (but no distribution fee). Certain redemptions of these shares may be subject to a contingent deferred sales charge (“CDSC”) where no initial sales charge was paid at the time of purchase. These shares are generally available through financial intermediaries. |
| • | | Investor C Shares are subject to a 1.00% CDSC if redeemed within one year of purchase. In addition, these shares are subject to a distribution fee of 0.75% per year and a service fee of 0.25% per year. These shares are generally available through financial intermediaries. |
Performance information reflects past performance and does not guarantee future results. Current performance may be lower or higher than the performance data quoted. Refer to www.blackrock.com/funds to obtain performance data current to the most recent month end. Performance results do not reflect the deduction of taxes that a shareholder
would pay on fund distributions or the redemption of fund shares. Figures shown in the performance table on the previous page assume reinvestment of all distributions, if any, at net asset value (“NAV”) on the ex-dividend date. Investment return and principal value of shares will fluctuate so that shares, when redeemed, may be worth more or less than their original cost. Distributions paid to each class of shares will vary because of the different levels of service, distribution and transfer agency fees applicable to each class, which are deducted from the income available to be paid to shareholders.
BlackRock Advisors, LLC (the “Manager”), the Fund’s investment adviser, has contractually agreed to waive and/or reimburse a portion of the Fund’s expenses. Without such waiver and/or reimbursement, the Fund’s performance would have been lower. The Manager is under no obligation to continue waiving and/or reimbursing its fees after the applicable termination date of such agreement. See Note 4 of the Notes to Financial Statements for additional information on waivers and/or reimbursements.
Shareholders of the Fund may incur the following charges: (a) transactional expenses, such as sales charges; and (b) operating expenses, including investment advisory fees, administration fees, service and distribution fees, including 12b-1 fees, acquired fund fees and expenses and other fund expenses. The expense example on the previous page (which is based on a hypothetical investment of $1,000 invested on February 1, 2016 and held through July 31, 2016) is intended to assist shareholders both in calculating expenses based on an investment in the Fund and in comparing these expenses with similar costs of investing in other mutual funds.
The expense example provides information about actual account values and actual expenses. In order to estimate the expenses a shareholder paid during the period covered by this report, shareholders can divide their account value by $1,000 and then multiply the result by the number corresponding to their share class under the heading entitled “Expenses Paid During the Period.”
The expense example also provides information about hypothetical account values and hypothetical expenses based on the Fund’s actual expense ratio and an assumed rate of return of 5% per year before expenses. In order to assist shareholders in comparing the ongoing expenses of investing in the Fund and other funds, compare the 5% hypothetical example with the 5% hypothetical examples that appear in shareholder reports of other funds.
The expenses shown in the expense example are intended to highlight shareholders’ ongoing costs only and do not reflect any transactional expenses, such as sales charges, if any. Therefore, the hypothetical example is useful in comparing ongoing expenses only, and will not help shareholders determine the relative total expenses of owning different funds. If these transactional expenses were included, shareholder expenses would have been higher.
| | | | | | |
| 6 | | BLACKROCK REAL ESTATE SECURITIES FUND | | JULY 31, 2016 | | |
| | | | |
| Schedule of Investments July 31, 2016 (Unaudited) | | | | |
| | | (Percentages shown are based on Net Assets) | |
| | | | | | | | |
| Common Stocks | | Shares | | | Value | |
Diversified — 1.0% | | | | | | | | |
Howard Hughes Corp. (a) | | | 3,525 | | | $ | 421,097 | |
Health Care — 12.6% | | | | | | | | |
Healthcare Trust of America, Inc., Class A | | | 27,624 | | | | 940,597 | |
National Health Investors, Inc. | | | 11,865 | | | | 932,233 | |
Ventas, Inc. | | | 44,619 | | | | 3,398,183 | |
| | | | | | | | |
| | | | | | | | 5,271,013 | |
Industrial — 7.5% | | | | | | | | |
First Industrial Realty Trust, Inc. | | | 47,280 | | | | 1,393,342 | |
Rexford Industrial Realty, Inc. | | | 23,608 | | | | 539,679 | |
Terreno Realty Corp. | | | 42,231 | | | | 1,176,133 | |
| | | | | | | | |
| | | | | | | | 3,109,154 | |
Lodging — 5.1% | | | | | | | | |
DiamondRock Hospitality Co. | | | 75,542 | | | | 741,822 | |
Hilton Worldwide Holdings, Inc. | | | 13,976 | | | | 324,103 | |
Host Hotels & Resorts, Inc. | | | 60,848 | | | | 1,079,444 | |
| | | | | | | | |
| | | | | | | | 2,145,369 | |
Office — 13.9% | | | | | | | | |
Alexandria Real Estate Equities, Inc. | | | 7,845 | | | | 880,993 | |
Boston Properties, Inc. | | | 18,201 | | | | 2,586,908 | |
Kilroy Realty Corp. | | | 21,308 | | | | 1,559,959 | |
SL Green Realty Corp. | | | 6,580 | | | | 775,256 | |
| | | | | | | | |
| | | | | | | | 5,803,116 | |
Residential — 16.3% | | | | | | | | |
American Campus Communities, Inc. | | | 17,366 | | | | 938,980 | |
American Homes 4 Rent, Class A | | | 38,455 | | | | 834,473 | |
AvalonBay Communities, Inc. | | | 12,382 | | | | 2,298,718 | |
Essex Property Trust, Inc. | | | 7,005 | | | | 1,638,329 | |
UDR, Inc. | | | 30,044 | | | | 1,118,538 | |
| | | | | | | | |
| | | | | | | | 6,829,038 | |
Retail — 23.8% | | | | | | | | |
DDR Corp. | | | 54,165 | | | | 1,069,217 | |
Equity One, Inc. | | | 18,392 | | | | 611,902 | |
General Growth Properties, Inc. | | | 52,730 | | | | 1,684,723 | |
Retail Properties of America, Inc., Class A | | | 95,182 | | | | 1,678,059 | |
Simon Property Group, Inc. | | | 21,592 | | | | 4,902,248 | |
| | | | | | | | |
| | | | | | | | 9,946,149 | |
| | | | | | | | |
| Common Stocks | | Shares | | | Value | |
Self Storage — 5.4% | | | | | | | | |
Extra Space Storage, Inc. | | | 18,482 | | | $ | 1,589,822 | |
Public Storage | | | 2,842 | | | | 679,011 | |
| | | | | | | | |
| | | | | | | | 2,268,833 | |
Specialty — 3.0% | | | | | | | | |
CyrusOne, Inc. | | | 22,759 | | | | 1,247,648 | |
Triple Net Lease — 10.3% | | | | | | | | |
EPR Properties | | | 10,062 | | | | 845,409 | |
Gramercy Property Trust | | | 83,035 | | | | 829,520 | |
MGM Growth Properties LLC, Class A | | | 16,000 | | | | 433,760 | |
STAG Industrial, Inc. | | | 41,852 | | | | 1,062,204 | |
STORE Capital Corp. | | | 36,678 | | | | 1,143,987 | |
| | | | | | | | |
| | | | | | | | 4,314,880 | |
Total Long-Term Investments (Cost — $34,090,378) — 98.9% | | | | 41,356,297 | |
| | | | | | | | |
| Short-Term Securities | | | | | | |
BlackRock Liquidity Funds, TempFund, Institutional Class, 0.36% (b)(c) | | | 540,053 | | | | 540,053 | |
Total Short-Term Securities (Cost — $540,053) — 1.3% | | | | 540,053 | |
Total Investments (Cost — $34,630,431) — 100.2% | | | | 41,896,350 | |
Liabilities in Excess of Other Assets — (0.2)% | | | | (88,375 | ) |
| | | | | | | | |
Net Assets — 100.0% | | | | | | $ | 41,807,975 | |
| | | | | | | | |
| | |
| Portfolio Abbreviation |
| REIT | | Real Estate Investment Trust |
See Notes to Financial Statements.
| | | | | | |
| | | BLACKROCK REAL ESTATE SECURITIES FUND | | JULY 31, 2016 | | 7 |
| | | | |
| Schedule of Investments (concluded) | | | | |
|
| Notes to Schedule of Investments |
| (a) | Non-income producing security. |
| (b) | Current yield as of period end. |
| (c) | During the six months ended July 31, 2016, investments in issuers considered to be an affiliate of the Fund for purposes of Section 2(a)(3) of the Investment Company Act of 1940, as amended, were as follows: |
| | | | | | | | | | | | | | | | | | | | |
| Affiliate | | Shares Held at
January 31, 2016 | | | Net
Activity | | | Shares Held at
July 31,
2016 | | | Value at
July 31, 2016 | | | Income | |
BlackRock Liquidity Funds, TempFund, Institutional Class | | | 242,077 | | | | 297,976 | | | | 540,053 | | | | $540,053 | | | | $1,130 | |
| • | | For Fund compliance purposes, the Fund’s industry classifications refer to one or more of the industry sub-classifications used by one or more widely recognized market indexes or ratings group indexes, and/or as defined by the investment adviser. These definitions may not apply for purposes of this report, which may combine such industry sub-classifications for reporting ease. |
|
| Fair Value Hierarchy as of Period End |
Various inputs are used in determining the fair value of investments. For information about the Fund’s policy regarding valuation of investments, refer to the Notes to Financial Statements.
The following table summarizes the Fund’s investments categorized in the disclosure hierarchy
| | | | | | | | | | | | | | | | |
| | | Level 1 | | | Level 2 | | | Level 3 | | | Total | |
Assets: | | | | | | | | | | | | | | | | |
Investments: | | | | | | | | | | | | | | | | |
Long-Term Investments1 | | $ | 41,356,297 | | | | — | | | | — | | | $ | 41,356,297 | |
Short-Term Securities. | | | 540,053 | | | | — | | | | — | | | | 540,053 | |
| | | | |
Total | | $ | 41,896,350 | | | | — | | | | — | | | $ | 41,896,350 | |
| | | | |
| | 1 | | See above Schedule of Investments for values in each industry. |
During the six months ended July 31, 2016, there were no transfers between levels.
See Notes to Financial Statements.
| | | | | | |
| 8 | | BLACKROCK REAL ESTATE SECURITIES FUND | | JULY 31, 2016 | | |
| | | | |
| Statement of Assets and Liabilities | | | | |
| | | | |
| July 31, 2016 (Unaudited) | | | |
| | | | |
| Assets | | | | |
Investments at value — unaffiliated (cost — $34,090,378) | | $ | 41,356,297 | |
Investments at value — affiliated (cost — $540,053) | | | 540,053 | |
Receivables: | | | | |
Investments sold | | | 499,917 | |
Capital shares sold | | | 158,545 | |
Dividends — affiliated | | | 319 | |
Dividends — unaffiliated | | | 24,925 | |
From the Manager | | | 10,580 | |
Prepaid expenses | | | 13,491 | |
| | | | |
Total assets | | | 42,604,127 | |
| | | | |
| | | | |
| Liabilities | | | | |
Payables: | | | | |
Investments purchased | | | 584,262 | |
Capital shares redeemed | | | 108,380 | |
Investment advisory fees | | | 18,793 | |
Officer’s and Trustees’ fees | | | 361 | |
Other accrued expenses | | | 32,034 | |
Other affiliates | | | 1,237 | |
Professional fees | | | 42,806 | |
Service and distribution fees | | | 8,279 | |
| | | | |
Total liabilities | | | 796,152 | |
| | | | |
Net Assets | | $ | 41,807,975 | |
| | | | |
| | | | |
| Net Assets Consist of | | | | |
Paid-in capital | | $ | 33,048,295 | |
Undistributed net investment income | | | 180,693 | |
Accumulated net realized gain | | | 1,313,068 | |
Net unrealized appreciation (depreciation) | | | 7,265,919 | |
| | | | |
Net Assets | | $ | 41,807,975 | |
| | | | |
| | | | |
| Net Asset Value | | | | |
Institutional — Based on net assets of $13,467,311 and 933,787 shares outstanding, unlimited number of shares authorized, $0.001 par value | | $ | 14.42 | |
| | | | |
Investor A — Based on net assets of $24,094,630 and 1,673,566 shares outstanding, unlimited number of shares authorized, $0.001 par value | | $ | 14.40 | |
| | | | |
Investor C — Based on net assets of $4,246,034 and 296,674 shares outstanding, unlimited number of shares authorized, $0.001 par value | | $ | 14.31 | |
| | | | |
See Notes to Financial Statements.
| | | | | | |
| | | BLACKROCK REAL ESTATE SECURITIES FUND | | JULY 31, 2016 | | 9 |
| | | | |
| Six Months Ended July 31, 2016 (Unaudited) | | | |
| | | | |
| Investment Income | | | | |
Dividends — unaffiliated | | $ | 664,539 | |
Dividends — affiliated | | | 1,130 | |
Interest | | | 4 | |
| | | | |
Total income | | | 665,673 | |
| | | | |
| | | | |
| Expenses | | | | |
Investment advisory | | | 134,041 | |
Service and distribution — class specific | | | 43,602 | |
Professional | | | 39,332 | |
Transfer agent — class specific | | | 22,550 | |
Registration | | | 21,120 | |
Printing | | | 14,517 | |
Accounting services | | | 7,626 | |
Administration | | | 7,596 | |
Officer and Trustees | | | 4,596 | |
Administration — class specific | | | 3,572 | |
Custodian | | | 2,928 | |
Miscellaneous | | | 5,923 | |
| | | | |
Total expenses | | | 307,403 | |
Less: | | | | |
Fees waived by the Manager | | | (50,635 | ) |
Administration fees waived — class specific | | | (3,551 | ) |
Transfer agent fees waived — class specific | | | (1,257 | ) |
Transfer agent fees reimbursed — class specific | | | (20,708 | ) |
| | | | |
Total expenses after fees waived and/or reimbursed | | | 231,252 | |
| | | | |
Net investment income | | | 434,421 | |
| | | | |
| | | | |
| Realized and Unrealized Gain | | | | |
Net realized gain from investments | | | 1,578,413 | |
Net change in unrealized appreciation (depreciation) on investments | | | 5,504,100 | |
| | | | |
Net realized and unrealized gain | | | 7,082,513 | |
| | | | |
Net Increase in Net Assets Resulting from Operations | | $ | 7,516,934 | |
| | | | |
See Notes to Financial Statements.
| | | | | | |
| 10 | | BLACKROCK REAL ESTATE SECURITIES FUND | | JULY 31, 2016 | | |
| | | | |
| Statements of Changes in Net Assets | | | | |
| | | | | | | | |
| Increase (Decrease) in Net Assets: | | Six Months
Ended
July 31, 2016
(Unaudited) | | | Year Ended January 31, 2016 | |
| | | | | | | | |
| Operations | | | | | | | | |
Net investment income | | $ | 434,421 | | | $ | 496,743 | |
Net realized gain | | | 1,578,413 | | | | 665,392 | |
Net change in unrealized appreciation (depreciation) | | | 5,504,100 | | | | (4,763,831 | ) |
| | | | |
Net increase (decrease) in net assets resulting from operations | | | 7,516,934 | | | | (3,601,696 | ) |
| | | | |
| | | | | | | | |
| Distributions to Shareholders1 | | | | | | | | |
From net investment income: | | | | | | | | |
Institutional | | | (89,208 | ) | | | (196,762 | ) |
Investor A | | | (131,783 | ) | | | (284,107 | ) |
Investor C | | | (10,013 | ) | | | (18,859 | ) |
From net realized gain: | | | | | | | | |
Institutional | | | (7,719 | ) | | | (588,295 | ) |
Investor A | | | (13,838 | ) | | | (1,045,809 | ) |
Investor C | | | (2,447 | ) | | | (160,465 | ) |
| | | | |
Decrease in net assets resulting from distributions to shareholders | | | (255,008 | ) | | | (2,294,297 | ) |
| | | | |
| | | | | | | | |
| Capital Share Transactions | | | | | | | | |
Net increase (decrease) in net assets derived from capital share transactions | | | 2,137,169 | | | | (6,895,631 | ) |
| | | | |
| | | | | | | | |
| Net Assets | | | | | | | | |
Total increase (decrease) in net assets | | | 9,399,095 | | | | (12,791,624 | ) |
Beginning of period | | | 32,408,880 | | | | 45,200,504 | |
| | | | |
End of period | | $ | 41,807,975 | | | $ | 32,408,880 | |
| | | | |
Undistributed (distributions in excess of) net investment income, end of period | | $ | 180,693 | | | $ | (22,724 | ) |
| | | | |
| 1 | Distributions for annual periods determined in accordance with federal income tax regulations. |
See Notes to Financial Statements.
| | | | | | |
| | | BLACKROCK REAL ESTATE SECURITIES FUND | | JULY 31, 2016 | | 11 |
| | | | | | | | | | | | | | | | | | | | |
| | | Institutional | |
| | | Six Months
Ended
July 31, 2016 | | | Year Ended January 31, | | | Period
September 28,
20121 to January 31, | |
| | | (Unaudited) | | | 2016 | | | 2015 | | | 2014 | | | 2013 | |
| | | | | | | | | | | | | | | | | | | | |
| Per Share Operating Performance | | | | | | | | | | | | | | | | | | | | |
Net asset value, beginning of period | | | $ 11.81 | | | | $13.71 | | | | $ 10.47 | | | | $10.44 | | | | $ 10.00 | |
| | | | |
Net investment income2 | | | 0.17 | | | | 0.21 | | | | 0.20 | | | | 0.16 | | | | 0.04 | |
Net realized and unrealized gain (loss) | | | 2.55 | | | | (1.27) | | | | 3.32 | | | | 0.29 | | | | 0.45 | |
| | | | |
Net increase (decrease) from investment operations | | | 2.72 | | | | (1.06) | | | | 3.52 | | | | 0.45 | | | | 0.49 | |
| | | | |
Distributions:3 | | | | | | | | | | | | | | | | | | | | |
From net investment income | | | (0.10) | | | | (0.20) | | | | (0.17) | | | | (0.21 | ) | | | (0.04 | ) |
From net realized gain | | | (0.01) | | | | (0.64) | | | | (0.11) | | | | (0.21 | ) | | | (0.01 | ) |
| | | | |
Total distributions | | | (0.11) | | | | (0.84) | | | | (0.28) | | | | (0.42 | ) | | | (0.05 | ) |
| | | | |
Net asset value, end of period | | | $ 14.42 | | | | $11.81 | | | | $ 13.71 | | | | $10.47 | | | | $ 10.44 | |
| | | | |
| | | | | | | | | | | | | | | | | | | | |
| Total Return4 | | | | | | | | | | | | | | | | | | | | |
Based on net asset value | | | 23.05%5 | | | | (7.85)% | | | | 33.92% | | | | 4.45 | % | | | 4.91 | %5 |
| | | | |
| | | | | | | | | | | | | | | | | | | | |
| Ratios to Average Net Assets | | | | | | | | | | | | | | | | | | | | |
Total expenses | | | 1.37%6 | | | | 1.39% | | | | 1.67% | | | | 4.44 | % | | | 7.77 | %6,7 |
| | | | |
Total expenses after fees waived and/or reimbursed | | | 1.05%6 | | | | 1.04% | | | | 1.05% | | | | 1.06 | % | | | 1.05 | %6,7 |
| | | | |
Net investment income | | | 2.61%6 | | | | 1.66% | | | | 1.67% | | | | 1.54 | % | | | 1.32 | %6 |
| | | | |
| | | | | | | | | | | | | | | | | | | | |
| Supplemental Data | | | | | | | | | | | | | | | | | | | | |
Net assets, end of period (000) | | | $13,467 | | | | $9,593 | | | | $17,862 | | | | $5,594 | | | | $ 5,273 | |
| | | | |
Portfolio turnover rate | | | 73% | | | | 86% | | | | 74% | | | | 59 | % | | | 25 | % |
| | | | |
| | 1 | | Commencement of operations. |
| | 2 | | Based on average shares outstanding. |
| | 3 | | Distributions for annual periods determined in accordance with federal income tax regulations. |
| | 4 | | Where applicable, assumes the reinvestment of distributions. |
| | 5 | | Aggregate total return. |
| | 7 | | Organization costs were not annualized in the calculation of the expense ratios. If these expenses were annualized, the total expenses would have been 8.36%. |
See Notes to Financial Statements.
| | | | | | |
| 12 | | BLACKROCK REAL ESTATE SECURITIES FUND | | JULY 31, 2016 | | |
| | | | |
| Financial Highlights (continued) | | | | |
| | | | | | | | | | | | | | | | | | | | |
| | | Investor A | |
| | | Six Months
Ended July 31, 2016 | | | Year Ended January 31, | | | Period
September 28,
20121 to January 31, | |
| | | (Unaudited) | | | 2016 | | | 2015 | | | 2014 | | | 2013 | |
| | | | | | | | | | | | | | | | | | | | |
| Per Share Operating Performance | | | | | | | | | | | | | | | | | | | | |
Net asset value, beginning of period | | | $ 11.79 | | | | $ 13.69 | | | | $ 10.46 | | | | $10.44 | | | | $ 10.00 | |
| | | | |
Net investment income2 | | | 0.16 | | | | 0.16 | | | | 0.13 | | | | 0.10 | | | | 0.04 | |
Net realized and unrealized gain (loss) | | | 2.54 | | | | (1.25 | ) | | | 3.36 | | | | 0.33 | | | | 0.44 | |
| | | | |
Net increase (decrease) from investment operations | | | 2.70 | | | | (1.09 | ) | | | 3.49 | | | | 0.43 | | | | 0.48 | |
| | | | |
Distributions:3 | | | | | | | | | | | | | | | | | | | | |
From net investment income | | | (0.08) | | | | (0.17 | ) | | | (0.15 | ) | | | (0.20 | ) | | | (0.03 | ) |
From net realized gain | | | (0.01) | | | | (0.64 | ) | | | (0.11 | ) | | | (0.21 | ) | | | (0.01 | ) |
| | | | |
Total distributions | | | (0.09) | | | | (0.81 | ) | | | (0.26 | ) | | | (0.41 | ) | | | (0.04 | ) |
| | | | |
Net asset value, end of period | | | $ 14.40 | | | | $ 11.79 | | | | $ 13.69 | | | | $10.46 | | | | $ 10.44 | |
| | | | |
| | | | | | | | | | | | | | | | | | | | |
| Total Return4 | | | | | | | | | | | | | | | | | | | | |
Based on net asset value | | | 22.93%5 | | | | (8.10 | )% | | | 33.61 | % | | | 4.17 | % | | | 4.85 | %5 |
| | | | |
| | | | | | | | | | | | | | | | | | | | |
| Ratios to Average Net Assets | | | | | | | | | | | | | | | | | | | | |
Total expenses | | | 1.77%6 | | | | 1.76 | % | | | 1.88 | % | | | 4.82 | % | | | 7.96 | %6,7 |
| | | | |
Total expenses after fees waived and/or reimbursed | | | 1.30%6 | | | | 1.30 | % | | | 1.30 | % | | | 1.30 | % | | | 1.30 | %6,7 |
| | | | |
Net investment income | | | 2.45%6 | | | | 1.27 | % | | | 1.10 | % | | | 0.94 | % | | | 1.17 | %6 |
| | | | |
| | | | | | | | | | | | | | | | | | | | |
| Supplemental Data | | | | | | | | | | | �� | | | | | | | | | |
Net assets, end of period (000) | | | $24,095 | | | | $19,641 | | | | $23,792 | | | | $1,808 | | | | $ 357 | |
| | | | |
Portfolio turnover rate | | | 73% | | | | 86 | % | | | 74 | % | | | 59 | % | | | 25 | % |
| | | | |
| | 1 | | Commencement of operations. |
| | 2 | | Based on average shares outstanding. |
| | 3 | | Distributions for annual periods determined in accordance with federal income tax regulations. |
| | 4 | | Where applicable, excludes the effects of any sales charges and assumes the reinvestment of distributions. |
| | 5 | | Aggregate total return. |
| | 7 | | Organization costs were not annualized in the calculation of the expense ratios. If these expenses were annualized, the total expenses would have been 8.55%. |
See Notes to Financial Statements.
| | | | | | |
| | | BLACKROCK REAL ESTATE SECURITIES FUND | | JULY 31, 2016 | | 13 |
| | | | |
| Financial Highlights (concluded) | | | | |
| | | | | | | | | | | | | | | | | | | | |
| | | Investor C | |
| | | Six Months
Ended July 31, 2016 | | | Year Ended January 31, | | | Period
September 28,
20121 to January 31, | |
| | | (Unaudited) | | | 2016 | | | 2015 | | | 2014 | | | 2013 | |
| | | | | | | | | | | | | | | | | | | | |
| Per Share Operating Performance | | | | | | | | | | | | | | | | | | | | |
Net asset value, beginning of period | | | $11.72 | | | | $13.61 | | | | $10.42 | | | | $10.43 | | | | $ 10.00 | |
| | | | |
Net investment income (loss)2 | | | 0.11 | | | | 0.05 | | | | 0.02 | | | | (0.00 | )3 | | | 0.01 | |
Net realized and unrealized gain (loss) | | | 2.53 | | | | (1.23 | ) | | | 3.37 | | | | 0.33 | | | | 0.45 | |
| | | | |
Net increase (decrease) from investment operations | | | 2.64 | | | | (1.18 | ) | | | 3.39 | | | | 0.33 | | | | 0.46 | |
| | | | |
Distributions:4 | | | | | | | | | | | | | | | | | | | | |
From net investment income | | | (0.04) | | | | (0.07 | ) | | | (0.09 | ) | | | (0.14 | ) | | | (0.02 | ) |
From net realized gain | | | (0.01) | | | | (0.64 | ) | | | (0.11 | ) | | | (0.20 | ) | | | (0.01 | ) |
| | | | |
Total distributions | | | (0.05) | | | | (0.71 | ) | | | (0.20 | ) | | | (0.34 | ) | | | (0.03 | ) |
| | | | |
Net asset value, end of period | | | $14.31 | | | | $11.72 | | | | $13.61 | | | | $10.42 | | | | $ 10.43 | |
| | | | |
| | | | | | | | | | | | | | | | | | | | |
| Total Return5 | | | | | | | | | | | | | | | | | | | | |
Based on net asset value | | | 22.49%6 | | | | (8.76 | )% | | | 32.65 | % | | | 3.34 | % | | | 4.57 | %6 |
| | | | |
| | | | | | | | | | | | | | | | | | | | |
| Ratios to Average Net Assets | | | | | | | | | | | | | | | | | | | | |
Total expenses | | | 2.58%7 | | | | 2.61 | % | | | 2.70 | % | | | 5.72 | % | | | 8.90 | %7,8 |
| | | | |
Total expenses after fees waived and/or reimbursed | | | 2.05%7 | | | | 2.05 | % | | | 2.05 | % | | | 2.05 | % | | | 2.05 | %7,8 |
| | | | |
Net investment income (loss) | | | 1.70%7 | | | | 0.43 | % | | | 0.15 | % | | | (0.01 | )% | | | 0.43 | %7 |
| | | | |
| | | | | | | | | | | | | | | | | | | | |
| Supplemental Data | | | | | | | | | | | | | | | | | | | | |
Net assets, end of period (000) | | | $4,246 | | | | $3,175 | | | | $3,546 | | | | $ 303 | | | | $ 24 | |
| | | | |
Portfolio turnover rate | | | 73% | | | | 86 | % | | | 74 | % | | | 59 | % | | | 25 | % |
| | | | |
| | 1 | | Commencement of operations. |
| | 2 | | Based on average shares outstanding. |
| | 3 | | Amount is greater than $(0.005) per share. |
| | 4 | | Distributions for annual periods determined in accordance with federal income tax regulations. |
| | 5 | | Where applicable, excludes the effects of any sales charges and assumes the reinvestment of distributions. |
| | 6 | | Aggregate total return. |
| | 8 | | Organization costs were not annualized in the calculation of the expense ratios. If these expenses were annualized, the total expenses would have been 9.48%. |
See Notes to Financial Statements.
| | | | | | |
| 14 | | BLACKROCK REAL ESTATE SECURITIES FUND | | JULY 31, 2016 | | |
| | | | |
| Notes to Financial Statements (Unaudited) | | | | |
1. Organization:
BlackRock FundsSM (the “Trust”) is registered under the Investment Company Act of 1940, as amended (the “1940 Act”), as an open-end management investment company. The Trust is organized as a Massachusetts business trust. These financial statements relate to one series of the Trust, BlackRock Real Estate Securities Fund (the “Fund”). The Fund is classified as non-diversified.
The Fund offers multiple classes of shares. All classes of shares have identical voting, dividend, liquidation and other rights and are subject to the same terms and conditions, except that certain classes bear expenses related to the shareholder servicing and distribution of such shares. Institutional Shares are sold only to certain eligible investors. Investor A and Investor C Shares are generally available through financial intermediaries. Each class has exclusive voting rights with respect to matters relating to its shareholder servicing and distribution expenditures.
| | | | | | |
| Share Class | | Initial Sales Charge | | CDSC | | Conversion Privilege |
Institutional Shares | | No | | No | | None |
Investor A Shares | | Yes | | No1 | | None |
Investor C Shares | | No | | Yes | | None |
| | 1 | | Investor A Shares may be subject to a CDSC for certain redemptions where no initial sales charge was paid at the time of purchase. |
The Fund, together with certain other registered investment companies advised by BlackRock Advisors, LLC (the “Manager”) or its affiliates, is included in a complex of open-end funds referred to as the Equity-Liquidity Complex.
2. Significant Accounting Policies:
The financial statements are prepared in conformity with accounting principles generally accepted in the United States of America (“U.S. GAAP”), which may require management to make estimates and assumptions that affect the reported amounts of assets and liabilities in the financial statements, disclosure of contingent assets and liabilities at the date of the financial statements and the reported amounts of increases and decreases in net assets from operations during the reporting period. Actual results could differ from those estimates. The Fund is considered an investment company under U.S. GAAP and follows the accounting and reporting guidance applicable to investment companies. Below is a summary of significant accounting policies:
Investment Transactions and Investment Income: For financial reporting purposes, investment transactions are recorded on the dates the transactions are entered into (the trade dates). Realized gains and losses on investment transactions are determined on the identified cost basis. Dividend income is recorded on the ex-dividend date. Upon notification from issuers, some of the dividend income received from a real estate investment trust may be redesignated as a reduction of cost of the related investment and/or realized gain. Income, expenses and realized and unrealized gains and losses are allocated daily to each class based on its relative net assets.
Distributions: Distributions paid by the Fund are recorded on the ex-dividend date. The character and timing of distributions are determined in accordance with federal income tax regulations, which may differ from U.S. GAAP.
Indemnifications: In the normal course of business, the Fund enters into contracts that contain a variety of representations that provide general indemnification. The Fund’s maximum exposure under these arrangements is unknown because it involves future potential claims against the Fund, which cannot be predicted with any certainty.
Other: Expenses directly related to the Fund or its classes are charged to the Fund or the applicable class. Other operating expenses shared by several funds, including other funds managed by the Manager, are prorated among those funds on the basis of relative net assets or other appropriate methods. Expenses directly related to the Fund and other shared expenses prorated to the Fund are allocated daily to each class based on its relative net assets or other appropriate methods.
The Fund has an arrangement with its custodian whereby credits are earned on uninvested cash balances, which could be used to reduce custody fees and/or overdraft charges. The Fund may incur charges on certain univested cash balances and overdrafts, subject to certain conditions.
3. Investment Valuation and Fair Value Measurements:
Investment Valuation Policies: The Fund’s investments are valued at fair value (also referred to as “market value” within the financial statements) as of the close of trading on the New York Stock Exchange (“NYSE”) (generally 4:00 p.m., Eastern time) (or if the reporting date falls on a day the NYSE is closed, investments are valued at fair value as of the report date). U.S. GAAP defines fair value as the price the Fund would receive to sell an asset or pay to transfer a liability in an orderly transaction between market participants at the measurement date. The Fund determines the fair values of its financial instruments using independent dealers or pricing services under policies approved by the Board of Trustees of the Trust (the “Board”). The
| | | | | | |
| | | BLACKROCK REAL ESTATE SECURITIES FUND | | JULY 31, 2016 | | 15 |
| | | | |
| Notes to Financial Statements (continued) | | | | |
BlackRock Global Valuation Methodologies Committee (the “Global Valuation Committee”) is the committee formed by management to develop global pricing policies and procedures and to provide oversight of the pricing function for the Fund for all financial instruments.
Fair Value Inputs and Methodologies: The following methods (or “techniques”) and inputs are used to establish the fair value of the Fund’s assets and liabilities:
| | • | | Equity investments traded on a recognized securities exchange are valued at the official closing price each day, if available. For equity investments traded on more than one exchange, the official closing price on the exchange where the stock is primarily traded is used. Equity investments traded on a recognized exchange for which there were no sales on that day may be valued at the last available bid (long positions) or ask (short positions) price. |
| | • | | Investments in open-end U.S. mutual funds are valued at net asset value each business day. |
If events (e.g., a company announcement, market volatility or a natural disaster) occur that are expected to materially affect the value of such instruments, or in the event that the application of these methods of valuation results in a price for an investment that is deemed not to be representative of the market value of such investment, or if a price is not available, the investment will be valued by the Global Valuation Committee, or its delegate, in accordance with a policy approved by the Board as reflecting fair value (“Fair Valued Investments”). When determining the price for Fair Valued Investments, the Global Valuation Committee, or its delegate, seeks to determine the price that the Fund might reasonably expect to receive or pay from the current sale or purchase of that asset or liability in an arm’s-length transaction. Fair value determinations shall be based upon all available factors that the Global Valuation Committee, or its delegate, deems relevant consistent with the principles of fair value measurement. The pricing of all Fair Valued Investments is subsequently reported to the Board or a committee thereof on a quarterly basis.
Fair Value Hierarchy: Various inputs are used in determining the fair value of investments. These inputs to valuation techniques are categorized into a fair value hierarchy consisting of three broad levels for financial statement purposes as follows:
| | • | | Level 1 — unadjusted price quotations in active markets/exchanges for identical assets or liabilities that the Fund has the ability to access |
| | • | | Level 2 — other observable inputs (including, but not limited to, quoted prices for similar assets or liabilities in markets that are active, quoted prices for identical or similar assets or liabilities in markets that are not active, inputs other than quoted prices that are observable for the assets or liabilities (such as interest rates, yield curves, volatilities, prepayment speeds, loss severities, credit risks and default rates) or other market-corroborated inputs) |
| | • | | Level 3 — unobservable inputs based on the best information available in the circumstances, to the extent observable inputs are not available (including the Fund’s own assumptions used in determining the fair value of investments) |
The hierarchy gives the highest priority to unadjusted quoted prices in active markets for identical assets or liabilities (Level 1 measurements) and the lowest priority to unobservable inputs (Level 3 measurements). Accordingly, the degree of judgment exercised in determining fair value is greatest for instruments categorized in Level 3. The inputs used to measure fair value may fall into different levels of the fair value hierarchy. In such cases, for disclosure purposes, the fair value hierarchy classification is determined based on the lowest level input that is significant to the fair value measurement in its entirety. The significant unobservable inputs used by the Global Valuation Committee in determining the price for Fair Valued Investments are typically categorized as Level 3. The fair value hierarchy for the Fund’s investments has been included in the Schedule of Investments.
Changes in valuation techniques may result in transfers into or out of an assigned level within the hierarchy. In accordance with the Fund’s policy, transfers between different levels of the fair value hierarchy are deemed to have occurred as of the beginning of the reporting period. The categorization of a value determined for investments is based on the pricing transparency of the investments and is not necessarily an indication of the risks associated with investing in those securities.
| | | | | | |
| 16 | | BLACKROCK REAL ESTATE SECURITIES FUND | | JULY 31, 2016 | | |
| | | | |
| Notes to Financial Statements (continued) | | | | |
4. Investment Advisory Agreement and Other Transactions with Affiliates:
The PNC Financial Services Group, Inc. is the largest stockholder and an affiliate of BlackRock, Inc. (“BlackRock”) for 1940 Act purposes.
Investment Advisory
The Trust, on behalf of the Fund, entered into an Investment Advisory Agreement with the Manager, the Fund’s investment adviser, an indirect, wholly-owned subsidiary of BlackRock, to provide investment advisory services. The Manager is responsible for the management of the Fund’s portfolio and provides the personnel, facilities, equipment and certain other services necessary to the operations of the Fund. For such services, the Fund pays the Manager a monthly fee, which is determined by calculating a percentage of the Fund’s average daily net assets at the following annual rates:
| | |
| Average Daily Net Assets | | Investment Advisory Fees |
First $1 Billion | | 0.75% |
$1 Billion - $3 Billion | | 0.71% |
$3 Billion - $5 Billion | | 0.68% |
$5 Billion - $10 Billion | | 0.65% |
Greater than $10 Billion | | 0.64% |
The Manager, with respect to the Fund, entered into separate sub-advisory agreements with BlackRock International Limited (“BIL”) and BlackRock (Singapore) Limited (“BRS”), affiliates of the Manager. The Manager pays BIL and BRS, for services they provide, a monthly fee that is a percentage of the investment advisory fees paid by the Fund to the Manager.
Service and Distribution Fees
The Trust, on behalf of the Fund, entered into a Distribution Agreement and a Distribution and Service Plan with BlackRock Investments, LLC (“BRIL”), an affiliate of the Manager. Pursuant to the Distribution and Service Plan and in accordance with Rule 12b-1 under the 1940 Act, the Fund pays BRIL ongoing service and distribution fees. The fees are accrued daily and paid monthly at annual rates based upon the average daily net assets of the relevant share class of the Fund as follows:
| | | | |
| | | Investor A | | Investor C |
Service Fee | | 0.25% | | 0.25% |
Distribution Fee | | — | | 0.75% |
BRIL and broker-dealers, pursuant to sub-agreements with BRIL, provide shareholder servicing and distribution services to the Fund. The ongoing service and/or distribution fee compensates BRIL and each broker-dealer for providing shareholder servicing and/or distribution related services to the shareholders.
For the six months ended July 31, 2016, the following table shows the class specific service and distribution fees borne directly by each share class of the Fund:
| | | | |
| Investor A | | Investor C | | Total |
$26,285 | | $17,317 | | $43,602 |
Administration
The Trust, on behalf of the Fund, entered into an Administration Agreement with the Manager, an indirect, wholly-owned subsidiary of BlackRock, to provide administrative services. For these services, the Manager receives an administration fee computed daily and payable monthly, based on a percentage of the average daily net assets of the Fund. The administration fee, which is shown as administration in the Statement of Operations, is paid at the annual rates below
| | |
| Average Daily Net Assets | | Administration Fees |
First $500 Million | | 0.0425% |
$500 Million - $1 Billion | | 0.0400% |
$1 Billion - $2 Billion | | 0.0375% |
$2 Billion - $4 Billion | | 0.0350% |
$4 Billion - $13 Billion | | 0.0325% |
Greater than $13 Billion | | 0.0300% |
| | | | | | |
| | | BLACKROCK REAL ESTATE SECURITIES FUND | | JULY 31, 2016 | | 17 |
| | | | |
| Notes to Financial Statements (continued) | | | | |
In addition, the Manager charges each of the share classes an administration fee, which is shown as administration — class specific in the Statement of Operations, at an annual rate of 0.02% of the average daily net assets of each respective class.
For the six months ended July 31, 2016, the following table shows the class specific administration fees borne directly by each share class of the Fund:
| | | | | | |
| Institutional | | Investor A | | Investor C | | Total |
$1,123 | | $2,103 | | $346 | | $3,572 |
The Manager may have, at their discretion, voluntarily waived all or any portion of its administration fees for the Fund or a share class, which are shown as administration fees waived — class specific in the Statement of Operations.
Transfer Agent
Pursuant to written agreements, certain financial intermediaries, some of which may be affiliates, provide the Fund with sub-accounting, recordkeeping, sub-transfer agency and other administrative services with respect to sub-accounts they service. For these services, these entities receive an asset-based fee or an annual fee per shareholder account, which will vary depending on share class and/or net assets. For the six months ended July 31, 2016, the Fund did not pay any amount to affiliates in return for these services.
The Manager maintains a call center that is responsible for providing certain shareholder services to the Fund. Shareholder services include responding to inquiries and processing subscriptions and redemptions based upon instructions from shareholders. For the six months ended July 31, 2016, the Fund reimbursed the Manager the following amounts for costs incurred in running the call center, which are included in transfer agent — class specific in the Statement of Operations:
| | | | | | |
| Institutional | | Investor A | | Investor C | | Total |
$117 | | $797 | | $390 | | $1,304 |
For the six months ended July 31, 2016, the following table shows the class specific transfer agent fees borne directly by each class of the Fund:
| | | | | | |
| Institutional | | Investor A | | Investor C | | Total |
$1,009 | | $17,612 | | $3,929 | | $22,550 |
Other Fees
For the six months ended July 31, 2016, affiliates earned underwriting discounts, direct commissions and dealer concessions on sales of the Fund’s Investor A Shares of $3,195.
For the six months ended July 31, 2016, affiliates received CDSCs on Investor C Shares of $672.
Expense Limitations, Waivers, Reimbursements and Recoupments
The Manager, with respect to the Fund, contractually agreed to waive and/or reimburse fees or expenses in order to limit expenses, excluding interest expense, dividend expense, tax expense, acquired fund fees and expenses and certain other fund expenses, which constitute extraordinary expenses not incurred in the ordinary course of the Fund’s business. The expense limitations as a percentage of average daily net assets are as follows:
| | | | |
Institutional | | | 1.05 | % |
Investor A | | | 1.30 | % |
Investor C | | | 2.05 | % |
The Manager has agreed not to reduce or discontinue these contractual expense limitations prior to June 1, 2017 unless approved by the Board, including a majority of the Independent Trustees who are not “interested persons” of the Fund, as defined in the 1940 Act (“Independent Trustee”) or by a majority of the outstanding voting securities of the Fund.
The Manager, with respect to the Fund, voluntarily agreed to waive its investment advisory fees by the amount of investment advisory fees the Fund pays to the Manager indirectly through its investment in affiliated money market funds. This amount is included in fees waived by the Manager in the
| | | | | | |
| 18 | | BLACKROCK REAL ESTATE SECURITIES FUND | | JULY 31, 2016 | | |
| | | | |
| Notes to Financial Statements (continued) | | | | |
Statement of Operations. However, the Manager does not waive its investment advisory fees by the amount of investment advisory fees paid in connection with the Fund’s investments in other affiliated investment companies, if any. For the six months ended July 31, 2016, the amount waived was $190.
In addition, the Fund had a waiver of investment advisory fees, which is included in fees waived by the Manager in the Statement of Operations. For the six months ended July 31, 2016, the amount waived was $50,445.
These amounts waived and/or reimbursed are included in fees waived by the Manager, and shown as administration fees waived — class specific, transfer agent fees waived — class specific and transfer agent fees reimbursed — class specific, respectively, in the Statement of Operations.
Class specific expense waivers and/or reimbursements are as follows:
| | | | | | | | |
| | | Institutional | | Investor A | | Investor C | | Total |
Administration Fees Waived | | $1,102 | | $ 2,103 | | $ 346 | | $ 3,551 |
Transfer Agent Fees Waived | | $ 106 | | $ 761 | | $ 390 | | $ 1,257 |
Transfer Agent Fees Reimbursed | | $ 774 | | $16,460 | | $3,474 | | $20,708 |
If during the Fund’s fiscal year the operating expenses of a share class, that at any time during the prior two fiscal years received a waiver and/or reimbursement from the Manager, are less than the expense cap for that share class, the Manager is entitled to be reimbursed by such share class up to the lesser of the following expenses:
| | (a) | The amount of fees waived and/or expenses reimbursed during those prior two fiscal years under the agreement. |
| | (b) | The amount by which the expense cap for that share class exceeds the operating expenses of the share class for the current fiscal year, provided that: |
| | • | | The Fund, of which the share class is a part, has more than $50 million in assets for the fiscal year. |
| | • | | The Manager or an affiliate continues to serve as the Fund’s investment adviser or administrator. |
In the event the cap limit for a share class is changed subsequent to a fiscal year in which the Manager becomes entitled to reimbursement for fees waived and/or reimbursed, the amount available to reimburse the Manager shall be calculated by reference to the expense cap for that share class in effect at the time the Manager became entitled to receive such reimbursement, rather than the subsequently changed expense cap for that share class.
On July 31, 2016, the Fund level and class specific waivers and/or reimbursements subject to possible future recoupment under the expense limitation agreement are as follows:
| | | | | | | | | | | | |
| | | Expires January 31, | |
| | | 2017 | | | 2018 | | | 2019 | |
Fund Level | | $ | 126,079 | | | $ | 106,406 | | | $ | 50,445 | |
Institutional | | $ | 10,290 | | | $ | 9,811 | | | $ | 1,982 | |
Investor A | | $ | 20,581 | | | $ | 36,278 | | | $ | 19,324 | |
Investor C | | $ | 3,901 | | | $ | 8,529 | | | $ | 4,210 | |
Officers and Trustees
Certain officers and/or trustees of the Trust are officers and/or trustees of BlackRock or its affiliates. The Fund reimburses the Manager for a portion of the compensation paid to the Trust’s Chief Compliance Officer, which is included in Officer and Trustees in the Statement of Operations.
5. Purchases and Sales:
For the six months ended July 31, 2016, purchases and sales of investments, excluding short-term securities, were $28,052,248 and $26,153,754, respectively.
6. Income Tax Information:
It is the Fund’s policy to comply with the requirements of the Internal Revenue Code of 1986, as amended, applicable to regulated investment companies, and to distribute substantially all of its taxable income to its shareholders. Therefore, no federal income tax provision is required.
| | | | | | |
| | | BLACKROCK REAL ESTATE SECURITIES FUND | | JULY 31, 2016 | | 19 |
| | | | |
| Notes to Financial Statements (continued) | | | | |
The Fund files U.S. federal and various state and local tax returns. No income tax returns are currently under examination. The statute of limitations on the Fund’s U.S. federal tax returns generally remains open for each of the three years ended January 31, 2016 and the period ended January 31, 2013. The statues of limitations on the Fund’s state and local tax returns may remain open for an additional year depending upon the jurisdiction.
Management has analyzed tax laws and regulations and their application to the Fund as of July 31, 2016, inclusive of the open tax return years, and does not believe there are any uncertain tax positions that require recognition of a tax liability in the Fund’s financial statements.
As of July 31, 2016, gross unrealized appreciation and depreciation based on cost for federal income tax purposes were as follows:
| | | | |
Tax cost | | $ | 34,835,522 | |
| | | | |
Gross unrealized appreciation | | $ | 7,140,327 | |
Gross unrealized depreciation | | | (79,499 | ) |
| | | | |
Net unrealized appreciation | | $ | 7,060,828 | |
| | | | |
7. Bank Borrowings:
The Trust, on behalf of the Fund, along with certain other funds managed by the Manager and its affiliates (“Participating Funds”), is a party to a 364-day, $2.1 billion credit agreement with a group of lenders, under which the Fund may borrow to fund shareholder redemptions. Excluding commitments designated for certain funds, the Participating Funds, including the Fund, can borrow up to an aggregate commitment amount of $1.6 billion at any time outstanding, subject to asset coverage and other limitations as specified in the agreement. The credit agreement has the following terms: a fee of 0.06% per annum on unused commitment amounts and interest at a rate equal to the higher of (a) one-month LIBOR (but, in any event, not less than 0.00%) on the date the loan is made plus 0.80% per annum or (b) the Fed Funds rate (but, in any event, not less than 0.00%) in effect from time to time plus 0.80% per annum on amounts borrowed. The agreement expires in April 2017 unless extended or renewed. Participating Funds paid administration, legal and arrangement fees, which, if applicable, are included in miscellaneous expenses in the Statement of Operations, and along with commitment fees, were allocated among such funds based upon portions of the aggregate commitment available to them and relative net assets of Participating Funds. During the six months ended July 31, 2016, the Fund did not borrow under the credit agreement.
8. Principal Risks:
In the normal course of business, the Fund invests in securities and enters into transactions where risks exist due to fluctuations in the market (market risk) or failure of the issuer to meet all its obligations, including the ability to pay principal and interest when due (issuer credit risk). The value of securities held by the Fund may decline in response to certain events, including those directly involving the issuers of securities owned by the Fund. Changes arising from the general economy, the overall market and local, regional or global political and/or social instability, as well as currency, interest rate and price fluctuations, may also affect the securities’ value.
Counterparty Credit Risk: Similar to issuer credit risk, the Fund may be exposed to counterparty credit risk, or the risk that an entity may fail to or be unable to perform on its commitments related to unsettled or open transactions. The Fund manages counterparty credit risk by entering into transactions only with counterparties that the Manager believes have the financial resources to honor their obligations and by monitoring the financial stability of those counterparties. Financial assets, which potentially expose the Fund to market, issuer and counterparty credit risks, consist principally of financial instruments and receivables due from counterparties. The extent of the Fund’s exposure to market, issuer and counterparty credit risks with respect to these financial assets is approximately their value recorded in the Statement of Assets and Liabilities, less any collateral held by the Fund.
Concentration Risk: As of period end, the Fund invested a significant portion of its assets in REITs. Changes in economic conditions affecting REITs would have a greater impact on the Fund and could affect the value, income and/or liquidity of positions in such securities.
| | | | | | |
| 20 | | BLACKROCK REAL ESTATE SECURITIES FUND | | JULY 31, 2016 | | |
| | | | |
| Notes to Financial Statements (concluded) | | | | |
9. Capital Share Transactions:
Transactions in capital shares for each class were as follows:
| | | | | | | | | | | | | | | | | | | | |
| | | Six Months Ended
July 31, 2016 | | | | | | Year Ended
January 31, 2016 | |
| | | Shares | | | Amount | | | | | | Shares | | | Amount | |
Institutional | | | | | | | | | | | | | | | | | | | | |
Shares sold | | | 146,875 | | | | $1,903,637 | | | | | | | | 142,365 | | | | $ 1,842,115 | |
Shares issued in reinvestment of distributions | | | 2,906 | | | | 39,601 | | | | | | | | 28,156 | | | | 348,976 | |
Shares redeemed | | | (28,294 | ) | | | (350,145) | | | | | | | | (661,380 | ) | | | (8,381,150) | |
| | | | | | | | | | | | |
Net increase (decrease) | | | 121,487 | | | | $1,593,093 | | | | | | | | (490,859 | ) | | | $(6,190,059) | |
| | | | | | | | | | | | |
| | | | | | | | | | | | | | | | | | | | |
Investor A | | | | | | | | | | | | | | | | | | | | |
Shares sold | | | 256,533 | | | | $ 3,366,982 | | | | | | | | 726,328 | | | | $ 9,308,338 | |
Shares issued in reinvestment of distributions | | | 10,591 | | | | 144,327 | | | | | | | | 107,598 | | | | 1,322,604 | |
Shares redeemed | | | (259,665 | ) | | | (3,339,174) | | | | | | | | (905,587 | ) | | | (11,458,424) | |
| | | | | | | | | | | | |
Net increase (decrease) | | | 7,459 | | | | $ 172,135 | | | | | | | | (71,661 | ) | | | $ (827,482) | |
| | | | | | | | | | | | |
| | | | | | | | | | | | | | | | | | | | |
Investor C | | | | | | | | | | | | | | | | | | | | |
Shares sold | | | 80,669 | | | | $1,057,129 | | | | | | | | 106,205 | | | | $ 1,355,788 | |
Shares issued in reinvestment of distributions | | | 828 | | | | 11,354 | | | | | | | | 14,014 | | | | 170,899 | |
Shares redeemed | | | (55,689 | ) | | | (696,542) | | | | | | | | (109,960 | ) | | | (1,404,777) | |
| | | | | | | | | | | | |
Net increase | | | 25,808 | | | | $ 371,941 | | | | | | | | 10,259 | | | | $ 121,910 | |
| | | | | | | | | | | | |
Total Net Increase (Decrease) | | | 154,754 | | | | $2,137,169 | | | | | | | | (552,261 | ) | | | $(6,895,631) | |
| | | | | | | | | | | | |
At July 31, 2016, shares owned by BlackRock HoldCo 2, Inc., an affiliate of the Fund, were as follows:
| | | | | | |
| | | Institutional | | Investor A | | Investor C |
Shares | | 517,586 | | 2,082 | | 2,066 |
10. Subsequent Events:
Management has evaluated the impact of all subsequent events on the Fund through the date the financial statements were issued and has determined that there were no subsequent events requiring adjustment or additional disclosure in the financial statements.
| | | | | | |
| | | BLACKROCK REAL ESTATE SECURITIES FUND | | JULY 31, 2016 | | 21 |
| | | | |
| Disclosure of Investment Advisory Agreement and Sub-Advisory Agreements | | | | |
The Board of Trustees (the “Board,” and the members of which are referred to as “Board Members”) of BlackRock FundsSM (the “Trust”) met in person on April 21, 2016 (the “April Meeting”) and May 18-20, 2016 (the “May Meeting”) to consider the approval of the investment advisory agreement (the “Advisory Agreement”) between the Trust, on behalf of BlackRock Real Estate Securities Fund (the “Fund”), a series of the Trust, and BlackRock Advisors, LLC (the “Manager”), the Trust’s investment advisor. The Board also considered the approval of the sub-advisory agreement between the Manager and BlackRock International Limited (“BIL”) with respect to the Fund (the “BIL Sub-Advisory Agreement”) and the approval of the sub-advisory agreement between the Manager and BlackRock (Singapore) Limited (“BRS,” and together with BIL, the “Sub-Advisors”) with respect to the Fund (the “BRS Sub-Advisory Agreement,” and together with the BIL Sub-Advisory Agreement, the “Sub-Advisory Agreements”). The Manager and the Sub-Advisors are referred to herein as “BlackRock.” The Advisory Agreement and the Sub-Advisory Agreements are referred to herein as the “Agreements.”
Activities and Composition of the Board
On the date of the May Meeting, the Board consisted of fifteen individuals, thirteen of whom were not “interested persons” of the Trust as defined in the Investment Company Act of 1940, as amended (the “1940 Act”) (the “Independent Board Members”). The Board Members are responsible for the oversight of the operations of the Trust and perform the various duties imposed on the directors of investment companies by the 1940 Act. The Independent Board Members have retained independent legal counsel to assist them in connection with their duties. The Chair of the Board is an Independent Board Member. The Board has established five standing committees: an Audit Committee, a Governance and Nominating Committee, a Compliance Committee, a Performance Oversight and Contract Committee and an Executive Committee, each of which is chaired by an Independent Board Member and composed of Independent Board Members (except for the Executive Committee, which also has one interested Board Member).
The Agreements
Pursuant to the 1940 Act, the Board is required to consider the continuation of the Agreements on an annual basis. The Board has four quarterly meetings per year, each extending over two days, a fifth one-day meeting to consider specific information surrounding the consideration of renewing the Agreements and additional in-person and telephonic meetings as needed. In connection with this year-long deliberative process, the Board assessed, among other things, the nature, extent and quality of the services provided to the Fund by BlackRock, BlackRock’s personnel and affiliates, including (as applicable): investment management; administrative and shareholder services; the oversight of fund service providers; marketing; risk oversight; compliance; and ability to meet applicable legal and regulatory requirements.
The Board, acting directly and through its committees, considers at each of its meetings, and from time to time as appropriate, factors that are relevant to its annual consideration of the renewal of the Agreements, including the services and support provided by BlackRock to the Fund and its shareholders. BlackRock also furnished additional information to the Board in response to specific questions from the Board. This additional information is discussed further below in the section titled “Board Considerations in Approving the Agreements.” Among the matters the Board considered were: (a) investment performance for one-year, three-year, five-year, ten-year, and/or since inception periods, as applicable, against peer funds, applicable benchmark, and performance metrics, as applicable, as well as senior management’s and portfolio managers’ analysis of the reasons for any over-performance or underperformance relative to its peers, benchmarks, and other performance metrics, as applicable; (b) fees, including advisory, administration, if applicable, and other amounts paid to BlackRock and its affiliates by the Fund for services; (c) Fund operating expenses and how BlackRock allocates expenses to the Fund; (d) the resources devoted to, risk oversight of, and compliance reports relating to, implementation of the Fund’s investment objective(s), policies and restrictions, and meeting regulatory requirements; (e) the Trust’s compliance with its compliance policies and procedures; (f) the nature, cost and character of non-investment management services provided by BlackRock and its affiliates; (g) BlackRock’s and other service providers’ internal controls and risk and compliance oversight mechanisms; (h) BlackRock’s implementation of the proxy voting policies approved by the Board; (i) the use of brokerage commissions and execution quality of portfolio transactions; (j) BlackRock’s implementation of the Trust’s valuation and liquidity procedures; (k) an analysis of management fees for products with similar investment mandates across the open-end fund, exchange-traded fund (“ETF”), closed-end fund and institutional account product channels, as applicable, and the similarities and differences between these products and the services provided as compared to the Fund; (l) BlackRock’s compensation methodology for its investment professionals and the incentives and accountability it creates, along with investment professionals’ investments in the fund(s) they manage; and (m) periodic updates on BlackRock’s business. With respect to the Fund, which pursues an alternative investment strategy, the Board has been engaged in an iterative process with BlackRock to identify the most appropriate performance benchmarks and metrics by which the Board should measure the Fund’s performance.
Board Considerations in Approving the Agreements
The Approval Process: Prior to the April Meeting, the Board requested and received materials specifically relating to the Agreements. The Board is continuously engaged in a process with its independent legal counsel and BlackRock to review the nature and scope of the information provided to better assist its deliberations. The materials provided in connection with the April Meeting included (a) information independently compiled and prepared by Broadridge Financial Solutions, Inc. (“Broadridge”) on Fund fees and expenses as compared with a peer group of funds as determined by
| | | | | | |
| 22 | | BLACKROCK REAL ESTATE SECURITIES FUND | | JULY 31, 2016 | | |
| | | | |
| Disclosure of Investment Advisory Agreement and Sub-Advisory Agreements (continued) | | | | |
Broadridge (“Expense Peers”) and the investment performance of the Fund as compared with a peer group of funds as determined by Broadridge1 and a customized peer group selected by BlackRock (“Customized Peer Group”); (b) information on the profits realized by BlackRock and its affiliates pursuant to the Agreements and a discussion of fall-out benefits to BlackRock and its affiliates; (c) a general analysis provided by BlackRock concerning investment management fees charged to other clients, such as institutional clients, sub-advised mutual funds, ETFs and closed-end funds, under similar investment mandates, as well as the performance of such other clients, as applicable; (d) review of non-management fees; (e) the existence, impact and sharing of potential economies of scale; (f) a summary of aggregate amounts paid by the Fund to BlackRock; and (g) sales and redemption data regarding the Fund’s shares.
At the April Meeting, the Board reviewed materials relating to its consideration of the Agreements. As a result of the discussions that occurred during the April Meeting, and as a culmination of the Board’s year-long deliberative process, the Board presented BlackRock with questions and requests for additional information. BlackRock responded to these requests with additional written information in advance of the May Meeting.
At the May Meeting, the Board, including the Independent Board Members, approved the continuation of the Advisory Agreement between the Manager and the Trust with respect to the Fund, the Sub-Advisory Agreement between the Manager and BIL with respect to the Fund and the Sub-Advisory Agreement between the Manager and BRS with respect to the Fund, each for a one-year term ending June 30, 2017. In approving the continuation of the Agreements, the Board considered: (a) the nature, extent and quality of the services provided by BlackRock; (b) the investment performance of the Fund; (c) the advisory fee and the cost of the services and profits to be realized by BlackRock and its affiliates from their relationship with the Fund; (d) the Fund’s costs to investors compared to the costs of Expense Peers and performance compared to the relevant performance metrics as previously discussed; (e) the sharing of potential economies of scale; (f) fall-out benefits to BlackRock and its affiliates as a result of its relationship with the Fund; and (g) other factors deemed relevant by the Board Members.
The Board also considered other matters it deemed important to the approval process, such as other payments made to BlackRock or its affiliates, securities lending and cash management, services related to the valuation and pricing of Fund portfolio holdings, and advice from independent legal counsel with respect to the review process and materials submitted for the Board’s review. The Board noted the willingness of BlackRock personnel to engage in open, candid discussions with the Board. The Board did not identify any particular information as determinative, and each Board Member may have attributed different weights to the various items considered.
A. Nature, Extent and Quality of the Services Provided by BlackRock: The Board, including the Independent Board Members, reviewed the nature, extent and quality of services provided by BlackRock, including the investment advisory services and the resulting performance of the Fund. Throughout the year, the Board compared Fund performance to the performance of a comparable group of mutual funds, relevant benchmark, and performance metrics, as applicable. The Board met with BlackRock’s senior management personnel responsible for investment activities, including the senior investment officers. The Board also reviewed the materials provided by the Fund’s portfolio management team discussing the Fund’s performance and the Fund’s investment objective(s), strategies and outlook.
The Board considered, among other factors, with respect to BlackRock: the number, education and experience of investment personnel generally and the Fund’s portfolio management team; BlackRock’s research capabilities; investments by portfolio managers in the funds they manage; portfolio trading capabilities; use of technology; commitment to compliance; credit analysis capabilities; risk analysis and oversight capabilities; and the approach to training and retaining portfolio managers and other research, advisory and management personnel. The Board engaged in a review of BlackRock’s compensation structure with respect to the Fund’s portfolio management team and BlackRock’s ability to attract and retain high-quality talent and create performance incentives.
In addition to investment advisory services, the Board considered the quality of the administrative and other non-investment advisory services provided to the Fund. BlackRock and its affiliates provide the Fund with certain administrative, shareholder and other services (in addition to any such services provided to the Fund by third parties) and officers and other personnel as are necessary for the operations of the Fund. In particular, BlackRock and its affiliates provide the Fund with administrative services including, among others: (i) preparing disclosure documents, such as the prospectus, the summary prospectus (as applicable), the statement of additional information and periodic shareholder reports; (ii) oversight of daily accounting and pricing; (iii) preparing periodic filings with regulators; (iv) overseeing and coordinating the activities of other service providers; (v) organizing Board
| 1 | Funds are ranked by Broadbridge in quartiles, ranging from first to fourth, where first is the most desirable quartile position and fourth is the least desirable. |
| | | | | | |
| | | BLACKROCK REAL ESTATE SECURITIES FUND | | JULY 31, 2016 | | 23 |
| | | | |
| Disclosure of Investment Advisory Agreement and Sub-Advisory Agreements (continued) | | | | |
meetings and preparing the materials for such Board meetings; (vi) providing legal and compliance support; (vii) furnishing analytical and other support to assist the Board in its consideration of strategic issues such as the merger, consolidation or repurposing of certain open-end funds; and (viii) performing other administrative functions necessary for the operation of the Fund, such as tax reporting, fulfilling regulatory filing requirements and call center services. The Board reviewed the structure and duties of BlackRock’s fund administration, shareholder services, and legal & compliance departments and considered BlackRock’s policies and procedures for assuring compliance with applicable laws and regulations.
B. The Investment Performance of the Fund and BlackRock: The Board, including the Independent Board Members, also reviewed and considered the performance history of the Fund. In preparation for the April Meeting, the Board was provided with reports independently prepared by Broadridge, which included a comprehensive analysis of the Fund’s performance. The Board also reviewed a narrative and statistical analysis of the Broadridge data that was prepared by BlackRock. In connection with its review, the Board received and reviewed information regarding the investment performance of the Fund as compared to other funds in its applicable Broadridge category and the Customized Peer Group. With respect to the Fund, which pursues an alternative investment strategy, the Board has been engaged in an iterative process with BlackRock to identify the most appropriate performance benchmarks and metrics by which the Board should measure the Fund’s performance. The Board was provided with a description of the methodology used by Broadridge to select peer funds and periodically meets with Broadridge representatives to review its methodology. The Board was provided with information on the composition of the Broadridge performance universes and expense universes. The Board and its Performance Oversight and Contract Committee regularly review, and meet with Fund management to discuss, the performance of the Fund throughout the year.
In evaluating performance, the Board recognized that the performance data reflects a snapshot of a period as of a particular date and that selecting a different performance period could produce significantly different results. Further, the Board recognized that it is possible that long-term performance can be adversely affected by even one period of significant underperformance so that a single investment decision or theme has the ability to affect long-term performance disproportionately.
The Board noted that for the one-year, three-year and since-inception periods reported, the Fund ranked in the second, first and first quartiles, respectively, against its Customized Peer Group. BlackRock believes that the Customized Peer Group is an appropriate performance metric for the Fund.
C. Consideration of the Advisory/Management Fees and the Cost of the Services and Profits to be Realized by BlackRock and its Affiliates from their Relationship with the Fund: The Board, including the Independent Board Members, reviewed the Fund’s contractual management fee rate compared with the other funds in its Broadridge category. The contractual management fee rate represents a combination of the advisory fee and any administration fees, before taking into account any reimbursements or fee waivers. The Board also compared the Fund’s total expense ratio, as well as its actual management fee rate, to those of other funds in its Broadridge category. The total expense ratio represents a fund’s total net operating expenses, including any 12b-1 or non 12b-1 service fees. The total expense ratio gives effect to any expense reimbursements or fee waivers that benefit a fund, and the actual management fee rate gives effect to any management fee reimbursements or waivers that benefit a fund. The Board considered the services provided and the fees charged by BlackRock and its affiliates to other types of clients with similar investment mandates, as applicable, including institutional accounts and sub-advised mutual funds (including mutual funds sponsored by third parties).
The Board received and reviewed statements relating to BlackRock’s financial condition. The Board reviewed BlackRock’s profitability methodology and was also provided with a profitability analysis that detailed the revenues earned and the expenses incurred by BlackRock for services provided to the Fund. The Board reviewed BlackRock’s profitability with respect to the Fund and other funds the Board currently oversees for the year ended December 31, 2015 compared to available aggregate profitability data provided for the prior two years. The Board reviewed BlackRock’s profitability with respect to certain other U.S. fund complexes managed by the Manager and/or its affiliates. The Board reviewed BlackRock’s assumptions and methodology of allocating expenses in the profitability analysis, noting the inherent limitations in allocating costs among various advisory products. The Board recognized that profitability may be affected by numerous factors including, among other things, fee waivers and expense reimbursements by the Manager, the types of funds managed, precision of expense allocations and business mix. As a result, calculating and comparing profitability at individual fund levels is difficult.
The Board noted that, in general, individual fund or product line profitability of other advisors is not publicly available. The Board reviewed BlackRock’s overall operating margin, in general, compared to that of certain other publicly-traded asset management firms. The Board considered the differences between BlackRock and these other firms, including the contribution of technology at BlackRock, BlackRock’s expense management, and the relative product mix.
In addition, the Board considered the cost of the services provided to the Fund by BlackRock, and BlackRock’s and its affiliates’ profits relating to the management and distribution of the Fund and the other funds advised by BlackRock and its affiliates. As part of its analysis, the Board reviewed BlackRock’s methodology in allocating its costs of managing the Fund, to the Fund. The Board may receive and review information from independent third parties as part of its annual evaluation. The Board considered whether BlackRock has the financial resources necessary to attract and retain
| | | | | | |
| 24 | | BLACKROCK REAL ESTATE SECURITIES FUND | | JULY 31, 2016 | | |
| | | | |
| Disclosure of Investment Advisory Agreement and Sub-Advisory Agreements (concluded) | | | | |
high quality investment management personnel to perform its obligations under the Agreements and to continue to provide the high quality of services that is expected by the Board. The Board further considered factors including but not limited to BlackRock’s commitment of time, assumption of risk, and liability profile in servicing the Fund in contrast to what is required of BlackRock with respect to other products with similar investment mandates across the open-end fund, ETF, closed-end fund, sub-advised mutual fund and institutional account product channels, as applicable.
The Board noted that the Fund’s contractual management fee rate ranked in the first quartile, and that the actual management fee rate and total expense ratio each ranked in the second quartile, relative to the Fund’s Expense Peers. The Board also noted that the Fund has an advisory fee arrangement that includes breakpoints that adjust the fee rate downward as the size of the Fund increases above certain contractually specified levels. The Board further noted that BlackRock has contractually agreed to a cap on the Fund’s total expenses as a percentage of the Fund’s average daily net assets on a class-by-class basis.
D. Economies of Scale: The Board, including the Independent Board Members, considered the extent to which economies of scale might be realized as the assets of the Fund increase, as well as the existence of expense caps, as applicable. The Board also considered the extent to which the Fund benefits from such economies in a variety of ways and whether there should be changes in the advisory fee rate or breakpoint structure in order to enable the Fund to more fully participate in these economies of scale. The Board considered the Fund’s asset levels and whether the current fee schedule was appropriate. In their consideration, the Board Members took into account the existence of any expense caps and further considered the continuation and/or implementation, as applicable, of such caps.
E. Other Factors Deemed Relevant by the Board Members: The Board, including the Independent Board Members, also took into account other ancillary or “fall-out” benefits that BlackRock or its affiliates may derive from their respective relationships with the Fund, both tangible and intangible, such as BlackRock’s ability to leverage its investment professionals who manage other portfolios and risk management personnel, an increase in BlackRock’s profile in the investment advisory community, and the engagement of BlackRock’s affiliates as service providers to the Fund, including for administrative, distribution, securities lending and cash management services. The Board also considered BlackRock’s overall operations and its efforts to expand the scale of, and improve the quality of, its operations. The Board also noted that BlackRock may use and benefit from third party research obtained by soft dollars generated by certain registered fund transactions to assist in managing all or a number of its other client accounts. The Board further noted that it had considered the investment by BlackRock’s funds in affiliated ETFs without any offset against the management fees payable by the funds to BlackRock.
In connection with its consideration of the Agreements, the Board also received information regarding BlackRock’s brokerage and soft dollar practices. The Board received reports from BlackRock which included information on brokerage commissions and trade execution practices throughout the year.
The Board noted the competitive nature of the open-end fund marketplace, and that shareholders are able to redeem their Fund shares if they believe that the Fund’s fees and expenses are too high or if they are dissatisfied with the performance of the Fund.
Conclusion
The Board, including the Independent Board Members, approved the continuation of the Advisory Agreement between the Manager and the Trust with respect to the Fund, the Sub-Advisory Agreement between the Manager and BIL with respect to the Fund and the Sub-Advisory Agreement between the Manager and BRS with respect to the Fund, each for a one-year term ending June 30, 2017. Based upon its evaluation of all of the aforementioned factors in their totality, as well as other information, the Board, including the Independent Board Members, was satisfied that the terms of the Agreements were fair and reasonable and in the best interest of the Fund and its shareholders. In arriving at its decision to approve the Agreements, the Board did not identify any single factor or group of factors as all-important or controlling, but considered all factors together, and different Board Members may have attributed different weights to the various factors considered. The Independent Board Members were also assisted by the advice of independent legal counsel in making this determination. The contractual fee arrangements for the Fund reflect the results of several years of review by the Board Members and predecessor Board Members, and discussions between such Board Members (and predecessor Board Members) and BlackRock. As a result, the Board Members’ conclusions may be based in part on their consideration of these arrangements in prior years.
| | | | | | |
| | | BLACKROCK REAL ESTATE SECURITIES FUND | | JULY 31, 2016 | | 25 |
Rodney D. Johnson, Chair of the Board and Trustee
David O. Beim, Trustee
Susan J. Carter, Trustee
Collette Chilton, Trustee
Neil A. Cotty, Trustee
Dr. Matina S. Horner, Trustee
Cynthia A. Montgomery, Trustee
Barbara G. Novick, Trustee
Joseph P. Platt, Trustee
Robert C. Robb, Jr., Trustee
Mark Stalnecker, Trustee
Kenneth L. Urish, Trustee
Claire A. Walton, Trustee
Frederick W. Winter, Trustee
John M. Perlowski, Trustee, President and Chief Executive Officer
Richard Hoerner, CFA, Vice President
Jennifer McGovern, Vice President
Neal J. Andrews, Chief Financial Officer
Jay M. Fife, Treasurer
Charles Park, Chief Compliance Officer
Fernanda Piedra, Anti-Money Laundering Compliance Officer
Benjamin Archibald, Secretary
| | | | | | |
| | | | |
Investment Adviser and Administrator BlackRock Advisors, LLC Wilmington, DE 19809 | | Sub-Advisers BlackRock International Limited Edinburgh, EH3 8BL United Kingdom BlackRock (Singapore) Limited 079912 Singapore | | Accounting Agent and Transfer Agent BNY Mellon Investment Servicing (US) Inc. Wilmington, DE 19809 | | Custodian The Bank of New York Mellon New York, NY 10286 |
| | | | | | |
Distributor BlackRock Investments, LLC New York, NY 10022 | | Legal Counsel Sidley Austin LLP New York, NY 10019 | | Independent Registered Public Accounting Firm Deloitte & Touche LLP Philadelphia, PA 19103 | | Address of the Trust 100 Bellevue Parkway Wilmington, DE 19809 |
| | | | | | |
| 26 | | BLACKROCK REAL ESTATE SECURITIES FUND | | JULY 31, 2016 | | |
A Special Meeting of Shareholders was held on February 8, 2016 for shareholders of record on December 11, 2015, to elect a Board of Trustees of the Trust.
| | | | | | | | | | |
| | | | | Votes For | | | | Votes Withheld | | |
| | | | | |
Approved the Trustees* as follows: | | David O. Beim | | 3,327,629,620 | | | | 22,971,395 | | |
| | Susan J. Carter | | 3,329,237,692 | | | | 21,363,323 | | |
| | Collette Chilton | | 3,329,179,365 | | | | 21,421,650 | | |
| | Neil A. Cotty | | 3,328,526,288 | | | | 22,074,727 | | |
| | Matina S. Horner | | 3,326,965,973 | | | | 23,635,042 | | |
| | Rodney D. Johnson | | 3,327,844,311 | | | | 22,756,704 | | |
| | Cynthia A. Montgomery | | 3,328,882,847 | | | | 21,718,168 | | |
| | Joseph P. Platt | | 3,327,563,553 | | | | 23,037,462 | | |
| | Robert C. Robb, Jr. | | 3,327,822,475 | | | | 22,778,540 | | |
| | Mark Stalnecker | | 3,327,691,900 | | | | 22,909,115 | | |
| | Kenneth L. Urish | | 3,324,875,151 | | | | 25,725,864 | | |
| | Claire A. Walton | �� | 3,329,000,010 | | | | 21,601,005 | | |
| | Frederick W. Winter | | 3,327,879,107 | | | | 22,721,908 | | |
| | Barbara G. Novick | | 3,327,607,976 | | | | 22,993,039 | | |
| | | John M. Perlowski | | 3,326,473,221 | | | | 24,127,794 | | |
| | * | | Denotes Trust-wide proposal and voting results. |
Householding
The Fund will mail only one copy of shareholder documents, including prospectuses, annual and semi-annual reports and proxy statements, to shareholders with multiple accounts at the same address. This practice is commonly called “householding” and is intended to reduce expenses and eliminate duplicate mailings of shareholder documents. Mailings of your shareholder documents may be householded indefinitely unless you instruct us otherwise. If you do not want the mailing of these documents to be combined with those for other members of your household, please call the Fund at (800) 441-7762.
Availability of Quarterly Schedule of Investments
The Fund files its complete schedule of portfolio holdings with the SEC for the first and third quarters of each fiscal year on Form N-Q. The Fund’s Forms N-Q are available on the SEC’s website at http://www.sec.gov and may also be reviewed and copied at the SEC’s Public Reference Room in Washington, D.C. Information on the operation of the Public Reference Room or how to access documents on the SEC’s website without charge may be obtained by calling (800) SEC-0330.The Fund’s Forms N-Q may also be obtained upon request and without charge by calling (800) 441-7762.
Availability of Proxy Voting Policies and Procedures
A description of the policies and procedures that the Fund uses to determine how to vote proxies relating to portfolio securities is available upon request and without charge (1) by calling (800) 441-7762; (2) at http://www.blackrock.com; and (3) on the SEC’s website at http://www.sec.gov.
Availability of Proxy Voting Record
Information about how the Fund voted proxies relating to securities held in the Fund’s portfolios during the most recent 12-month period ended June 30 is available upon request and without charge (1) at http://www.blackrock.com or by calling (800) 441-7762 and (2) on the SEC’s website at http://www.sec.gov.
BlackRock’s Mutual Fund Family
BlackRock offers a diverse lineup of open-end mutual funds crossing all investment styles and managed by experts in equity, fixed income and tax-exempt investing. Visit http://www.blackrock.com for more information.
| | | | | | |
| | | BLACKROCK REAL ESTATE SECURITIES FUND | | JULY 31, 2016 | | 27 |
| | | | |
| Additional Information (concluded) | | | | |
Account Information
Call us at (800) 441-7762 from 8:00 AM to 6:00 PM EST on any business day to get information about your account balances, recent transactions and share prices. You can also reach us on the Web at http://www.blackrock.com/funds.
Automatic Investment Plans
Investor Class shareholders who want to invest regularly can arrange to have $50 or more automatically deducted from their checking or savings account and invested in any of the BlackRock funds.
Systematic Withdrawal Plans
Investor Class shareholders can establish a systematic withdrawal plan and receive periodic payments of $50 or more from their BlackRock funds, as long as their account balance is at least $10,000.
Retirement Plans
Shareholders may make investments in conjunction with Traditional, Rollover, Roth, Coverdell, Simple IRAs, SEP IRAs and 403(b) Plans.
|
| BlackRock Privacy Principles |
BlackRock is committed to maintaining the privacy of its current and former fund investors and individual clients (collectively, “Clients”) and to safeguarding their non-public personal information. The following information is provided to help you understand what personal information BlackRock collects, how we protect that information and why in certain cases we share such information with select parties.
If you are located in a jurisdiction where specific laws, rules or regulations require BlackRock to provide you with additional or different privacy-related rights beyond what is set forth below, then BlackRock will comply with those specific laws, rules or regulations.
BlackRock obtains or verifies personal non-public information from and about you from different sources, including the following: (i) information we receive from you or, if applicable, your financial intermediary, on applications, forms or other documents; (ii) information about your transactions with us, our affiliates, or others; (iii) information we receive from a consumer reporting agency; and (iv) from visits to our websites.
BlackRock does not sell or disclose to non-affiliated third parties any non-public personal information about its Clients, except as permitted by law or as is necessary to respond to regulatory requests or to service Client accounts. These non-affiliated third parties are required to protect the confidentiality and security of this information and to use it only for its intended purpose.
We may share information with our affiliates to service your account or to provide you with information about other BlackRock products or services that may be of interest to you. In addition, BlackRock restricts access to non-public personal information about its Clients to those BlackRock employees with a legitimate business need for the information. BlackRock maintains physical, electronic and procedural safeguards that are designed to protect the non-public personal information of its Clients, including procedures relating to the proper storage and disposal of such information.
| | | | | | |
| 28 | | BLACKROCK REAL ESTATE SECURITIES FUND | | JULY 31, 2016 | | |
| | |
This report is intended for current holders. It is not authorized for use as an offer of sale or a solicitation of an offer to buy shares of the Fund unless preceded or accompanied by the Fund’s current prospectus. Past performance results shown in this report should not be considered a representation of future performance. Investment returns and principal value of shares will fluctuate so that shares, when redeemed, may be worth more or less than their original cost. Statements and other information herein are as dated and are subject to change. | |  |
| | |
REALES-7/16-SAR | |  |
| | |
| |
| Item 2 – | | Code of Ethics – Not Applicable to this semi-annual report |
| |
| Item 3 – | | Audit Committee Financial Expert – Not Applicable to this semi-annual report |
| |
| Item 4 – | | Principal Accountant Fees and Services – Not Applicable to this semi-annual report |
| |
| Item 5 – | | Audit Committee of Listed Registrants – Not Applicable |
| |
| Item 6 – | | Investments |
| | (a) The registrant’s Schedule of Investments is included as part of the Report to Stockholders filed under Item 1 of this Form. |
| | (b) Not Applicable due to no such divestments during the semi-annual period covered since the previous Form N-CSR filing. |
| |
| Item 7 – | | Disclosure of Proxy Voting Policies and Procedures for Closed-End Management Investment Companies – Not Applicable |
| |
| Item 8 – | | Portfolio Managers of Closed-End Management Investment Companies – Not Applicable |
| |
| Item 9 – | | Purchases of Equity Securities by Closed-End Management Investment Company and Affiliated Purchasers – Not Applicable |
| |
| Item 10 – | | Submission of Matters to a Vote of Security Holders –There have been no material changes to these procedures. |
| |
| Item 11 – | | Controls and Procedures |
| |
| | (a) – The registrant’s principal executive and principal financial officers, or persons performing similar functions, have concluded that the registrant’s disclosure controls and procedures (as defined in Rule 30a-3(c) under the Investment Company Act of 1940, as amended (the “1940 Act”)) are effective as of a date within 90 days of the filing of this report based on the evaluation of these controls and procedures required by Rule 30a-3(b) under the 1940 Act and Rule 15d-15(b) under the Securities Exchange Act of 1934, as amended. |
| |
| | (b) – There were no changes in the registrant’s internal control over financial reporting (as defined in Rule 30a-3(d) under the 1940 Act) that occurred during the second fiscal quarter of the period covered by this report that have materially affected, or are reasonably likely to materially affect, the registrant’s internal control over financial reporting. |
| |
| Item 12 – | | Exhibits attached hereto |
| |
| | (a)(1) – Code of Ethics – Not Applicable to this semi-annual report |
| |
| | (a)(2) – Certifications – Attached hereto |
| |
| | (a)(3) – Not Applicable |
| |
| | (b) – Certifications – Attached hereto |
2
Pursuant to the requirements of the Securities Exchange Act of 1934 and the Investment Company Act of 1940, the registrant has duly caused this report to be signed on its behalf by the undersigned, thereunto duly authorized.
| | |
| BlackRock Funds |
| |
| By: | | /s/ John M. Perlowski |
| | John M. Perlowski |
| | Chief Executive Officer (principal executive officer) of |
| | BlackRock Funds |
|
| Date: October 3, 2016 |
Pursuant to the requirements of the Securities Exchange Act of 1934 and the Investment Company Act of 1940, this report has been signed below by the following persons on behalf of the registrant and in the capacities and on the dates indicated.
| | |
| By: | | /s/ John M. Perlowski |
| | John M. Perlowski |
| | Chief Executive Officer (principal executive officer) of |
| | BlackRock Funds |
|
| Date: October 3, 2016 |
| | |
| By: | | /s/ Neal J. Andrews |
| | Neal J. Andrews |
| | Chief Financial Officer (principal financial officer) of |
| | BlackRock Funds |
|
| Date: October 3, 2016 |
3