UNITED STATES
SECURITIES AND EXCHANGE COMMISSION
Washington, D.C. 20549
FORM N-CSR
CERTIFIED SHAREHOLDER REPORT OF REGISTERED MANAGEMENT INVESTMENT COMPANIES
Investment Company Act file number: 811-05742
Name of Fund: BlackRock Funds
BlackRock Impact Bond Fund
BlackRock Impact U.S. Equity Fund
Fund Address: 100 Bellevue Parkway, Wilmington, DE 19809
Name and address of agent for service: John M. Perlowski, Chief Executive Officer, BlackRock Funds, 55 East 52nd Street, New York, NY 10055
Registrant’s telephone number, including area code: (800) 441-7762
Date of fiscal year end: 05/31/2017
Date of reporting period: 11/30/2016
| | | | |
| Item 1 | | – | | Report to Stockholders |
NOVEMBER 30, 2016
| | | | |
SEMI-ANNUAL REPORT (UNAUDITED) | | | |  |
BlackRock FundsSM
| Ø | BlackRock Impact Bond Fund |
| Ø | BlackRock Impact U.S. Equity Fund |
|
| Not FDIC Insured • May Lose Value • No Bank Guarantee |

| | | | | | |
| | | | | | | |
| 2 | | BLACKROCK FUNDS | | NOVEMBER 30, 2016 | | |
Dear Shareholder,
Central bank policy decisions have continued to provide support to financial markets, while changing economic outlooks and geopolitical risks have been major drivers of investor sentiment. After ending its near-zero interest rate policy at the end of 2015, the Federal Reserve (the “Fed”) remained in focus as investors considered the anticipated pace of future rate hikes. With the European Central Bank and the Bank of Japan having moved into stimulus mode, the divergence in global monetary policies drove heightened market volatility at the beginning of 2016 and the U.S. dollar strengthened considerably.
Financial markets had a rough start to the year. The strong dollar challenged U.S. companies that generate revenues overseas and pressured emerging market currencies and commodities prices. Low and volatile oil prices and signs of slowing growth in China were also meaningful factors behind the decline in risk assets. However, as the first quarter wore on, these pressures abated and a more tempered outlook for U.S. rate hikes helped the markets rebound.
Volatility spiked in late June when the United Kingdom shocked investors with its vote to leave the European Union. Uncertainty around how the British exit might affect the global economy and the political landscape drove investors to high-quality assets, pushing already low global yields to even lower levels. However, risk assets recovered swiftly in July as economic data suggested that the consequences had thus far been contained to the United Kingdom.
The U.S. presidential election brought another episode of vote-induced volatility in November. Equities fell sharply in response to Donald Trump’s victory, but quickly recovered and rallied. Interest rates moved higher (and bond prices lower) given expectations for rising inflation. Broadly, a reflation theme has been building amid signs of rising price pressures, central banks signaling a greater tolerance to let inflation run hotter, and policy emphasis shifting from monetary to fiscal stimulus.
At BlackRock, we believe investors need to think globally, extend their scope across a broad array of asset classes and be prepared to adjust accordingly as market conditions change over time. We encourage you to talk with your financial advisor and visit blackrock.com for further insight about investing in today’s markets.
Sincerely,

Rob Kapito
President, BlackRock Advisors, LLC

Rob Kapito
President, BlackRock Advisors, LLC
| | | | | | | | |
| Total Returns as of November 30, 2016 | |
| | | 6-month | | | 12-month | |
U.S. large cap equities
(S&P 500® Index) | | | 6.01 | % | | | 8.06 | % |
U.S. small cap equities
(Russell 2000® Index) | | | 15.37 | | | | 12.08 | |
International equities
(MSCI Europe, Australasia,
Far East Index) | | | (1.25 | ) | | | (3.66 | ) |
Emerging market equities
(MSCI Emerging
Markets Index) | | | 8.42 | | | | 8.47 | |
3-month Treasury bills
(BofA Merrill Lynch 3-Month
U.S. Treasury Bill Index) | | | 0.18 | | | | 0.32 | |
U.S. Treasury securities
(BofA Merrill Lynch 10-Year
U.S. Treasury Index) | | | (4.11 | ) | | | (0.09 | ) |
U.S. investment grade
bonds (Bloomberg Barclays
U.S. Aggregate Bond Index) | | | (0.92 | ) | | | 2.17 | |
Tax-exempt municipal
bonds (S&P Municipal
Bond Index) | | | (2.82 | ) | | | 0.48 | |
U.S. high yield bonds
(Bloomberg Barclays U.S.
Corporate High Yield 2%
Issuer Capped Index) | | | 6.43 | | | | 12.11 | |
| Past performance is no guarantee of future results. Index performance is shown for illustrative purposes only. You cannot invest directly in an index. | |
| | | | | | |
| | | | | | | |
| | THIS PAGE NOT PART OF YOUR FUND REPORT | | | | 3 |
| | |
| Fund Summary as of November 30, 2016 | | BlackRock Impact Bond Fund |
BlackRock Impact Bond Fund’s (the “Fund”) investment objective is to provide a combination of income and capital growth.
|
| Overview of the Fund’s Total Investments |
| | | | |
| Portfolio Composition1 | | 11/30/16 | |
Corporate Bonds | | | 59 | % |
U.S. Government Sponsored Agency Securities | | | 41 | |
| | 1 | | Excludes Short-Term Securities. |
| | | | |
| Credit Quality Allocation2 | | 11/30/16 | |
AAA/Aaa3 | | | 42 | % |
AA/Aa | | | 11 | |
A | | | 21 | |
BBB/Baa | | | 21 | |
BB/Ba | | | 3 | |
B | | | 2 | |
CCC/Caa | | | — | 4 |
| | 2 | | For financial reporting purposes, credit quality ratings shown above reflect the highest rating assigned by either Standard & Poor’s (“S&P”) or Moody’s Investors Service (“Moody’s”) if ratings differ. These rating agencies are independent, nationally recognized statistical rating organizations and are widely used. Investment grade ratings are credit ratings of BBB/Baa or higher. Below investment grade ratings are credit ratings of BB/Ba or lower. Credit quality ratings are subject to change. |
| | 3 | | Includes U.S. Government Sponsored Agency Securities which are deemed AAA/Aaa by the investment adviser. |
| | 4 | | Representing less than 0.50% of the Fund’s total investments. |
| | | | | | | | | | | | | | | | | | | | | | | | | | | | |
| | | Actual | | | Hypothetical2 | | | | |
| | | Beginning Account Value August 23, 2016 | | | Ending Account Value November 30, 2016 | | | Expenses Paid
During the Period1 | | | Beginning Account Value August 23, 2016 | | | Ending Account Value November 30, 2016 | | | Expenses Paid
During the Period1 | | | Annualized
Expense Ratio | |
Institutional | | $ | 1,000.00 | | | $ | 969.30 | | | $ | 1.18 | | | $ | 1,000.00 | | | $ | 1,012.37 | | | $ | 1.20 | | | | 0.44 | % |
Investor A | | $ | 1,000.00 | | | $ | 968.70 | | | $ | 1.87 | | | $ | 1,000.00 | | | $ | 1,011.66 | | | $ | 1.91 | | | | 0.70 | % |
Investor C | | $ | 1,000.00 | | | $ | 966.60 | | | $ | 3.87 | | | $ | 1,000.00 | | | $ | 1,009.63 | | | $ | 3.95 | | | | 1.45 | % |
Class K | | $ | 1,000.00 | | | $ | 969.40 | | | $ | 1.07 | | | $ | 1,000.00 | | | $ | 1,012.48 | | | $ | 1.09 | | | | 0.40 | % |
| | 1 | | For each class of the Fund, expenses are equal to the annualized expense ratio for the class, multiplied by the average account value over the period, multiplied by 99/365 (to reflect the period from August 23, 2016, the commencement of operations, to November 30, 2016). |
| | 2 | | Hypothetical 5% annual return before expenses is calculated by prorating the number of days in the most recent fiscal half year divided by 365. |
| | See | | “Disclosure of Expenses” on page 8 for further information on how expenses were calculated. |
The views expressed reflect the opinions of BlackRock as of the date of this report and are subject to change based on changes in market, economic or other conditions. These views are not intended to be a forecast of future events and are no guarantee of future results.
| | | | | | |
| | | | | | | |
| 4 | | BLACKROCK FUNDS | | NOVEMBER 30, 2016 | | |
| | |
| Fund Summary as of November 30, 2016 | | BlackRock Impact U.S. Equity Fund |
BlackRock Impact U.S. Equity Fund’s (the “Fund”) investment objective is to seek to provide total return.
|
| Portfolio Management Commentary |
How did the Fund perform?
| • | | For the six-month period ended November 30, 2016, the Fund’s Institutional, Investor A, Class K Shares outperformed and Investor C Shares performed in line with its benchmark, the Russell 3000® Index (the “Benchmark”). |
Investment Process
The Fund will seek to provide total return by investing in a portfolio of equity securities of companies with positive aggregate societal impact outcomes, as determined by the investment adviser using the BlackRock Scientific Active Equity Impact Methodology (as developed for the Fund), compared to the Benchmark, and systematic, quantitative security selection models. The investment process is fundamentally driven with systematic and quantitative implementation based on expected returns.
The principal societal impact outcomes that are currently measured include the following, although they may change at any time:
| • | | Green Innovation — Companies that demonstrate “green innovation” focus on environmentally sustainable technologies as described by the United Nations Framework Convention on Climate Change and the World Intellectual Property Organization. |
| • | | Corporate Citizenship — “Corporate citizenship” focuses on companies whose employees have a high level of satisfaction working for their employers. |
| • | | High Impact Disease Research — Companies that work on “high impact disease research” are companies that are researching treatments for diseases with the highest potential for global impact, measured by the number of lives affected due to potential reduction in early mortality and disability. |
| • | | Ethics Controversies — “Ethics controversies” reflect factors such as misuse of company funds, falsification of company records and other illegal activities, as well as factors in the areas of diversity, labor rights, health and safety, and the environment. |
| • | | Litigation — “Litigation” reflects the presence of lawsuits and/or labor issues at a company. |
What factors influenced performance?
| • | | The Fund implemented its strategy of investing in a portfolio of companies that the investment adviser believes carry the potential in the aggregate to promote positive societal outcomes. |
| • | | Leading contributors to the Fund’s performance relative to the benchmark, which can reflect both overweight and underweight positions, included Texas Instruments, Inc. (information technology), Applied Materials, Inc. (information technology), Illinois Toolworks, Inc. (industrials), The Coca Cola Company (consumer staples), and Wintrust Financial Corp. (financials). |
| • | | Conversely, the leading detractors from performance, which also can reflect overweight and underweight positions, included Medtronic (healthcare), The Clorox Company (consumer staples), Monster Beverage Corp. (consumer staples), Welltower Inc. (real estate), and Dr. Pepper Snapple Group Inc. (consumer staples). |
Describe recent portfolio activity.
| • | | During the six-month period, Fund holdings were regularly and systematically assessed against their alpha forecast (outperformance versus the benchmark) and impact outcome forecasts, and rebalances were implemented weekly after adjusting for transaction costs and risks. No material changes were implemented during the reporting period. |
Describe portfolio positioning at period end.
| • | | As of November 30, 2016, the Fund held overweight positions in the utilities, consumer staples, information technology, real estate, materials, and health care sectors, and was underweight in financials, industrials, telecommunication services, energy and consumer discretionary. The Fund was invested in more than 500 public U.S. listed equities. |
| • | | The Fund maintained an equity portfolio designed to reflect higher exposure to positive societal impact than the benchmark with respect to the following outcomes: High Impact Disease Research, Corporate Citizenship, and Green Innovation. The Fund had lower-than-benchmark exposure to the following negative outcomes: Ethics Controversies and Litigation. |
The views expressed reflect the opinions of BlackRock as of the date of this report and are subject to change based on changes in market, economic or other conditions. These views are not intended to be a forecast of future events and are no guarantee of future results.
| | | | | | |
| | | | | | | |
| | BLACKROCK FUNDS | | NOVEMBER 30, 2016 | | 5 |
| | |
| | | BlackRock Impact U.S. Equity Fund |
|
| Total Return Based on a $10,000 Investment |
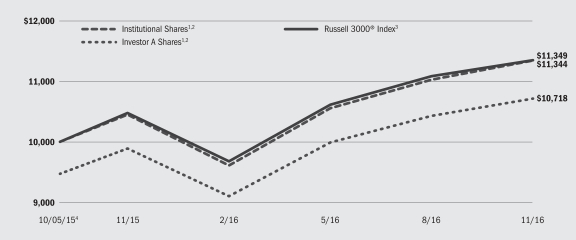
| | 1 | | Assuming maximum sales charges, if any, transaction costs and other operating expenses, including investment advisory fees. Institutional Shares do not have a sales charge. |
| | 2 | | Under normal circumstances, the Fund seeks to invest at least 80% of its net assets plus any borrowings for investment purposes in U.S. equity securities. |
| | 3 | | An index that measures the performance of the largest 3,000 U.S. companies representing approximately 98% of the investable U.S. equity market. |
| | 4 | | Commencement of operations. |
|
| Performance Summary for the Period Ended November 30, 2016 |
| | | | | | | | | | | | | | | | | | | | |
| | | | | | Average Annual Total Returns5 | |
| | | | | | 1-Year | | | Since Inception6 | |
| | | 6-Month
Total Returns | | | w/o sales
charge | | | w/sales
charge | | | w/o sales
charge | | | w/sales
charge | |
Institutional | | | 7.44 | % | | | 8.55 | % | | | N/A | | | | 11.55 | % | | | N/A | |
Investor A | | | 7.28 | | | | 8.35 | | | | 2.66 | % | | | 11.28 | | | | 6.20 | % |
Investor C | | | 6.96 | | | | 7.60 | | | | 6.60 | | | | 10.52 | | | | 10.52 | |
Class K | | | 7.44 | | | | 8.58 | | | | N/A | | | | 11.58 | | | | N/A | |
Russell 3000® Index | | | 6.93 | | | | 8.31 | | | | N/A | | | | 11.60 | | | | N/A | |
| | 5 | | Assuming maximum sales charges, if any. Average annual total returns with and without sales charges reflect reductions for distribution and service fees. See “About Fund Performance” on page 7 for a detailed description of share classes, including any related sales charges and fees. |
| | 6 | | The Fund commenced operations on October 5, 2015. |
N/A — Not applicable as share class and index do not have a sales charge.
Past performance is not indicative of future results.
| | | | Performance results may include adjustments made for financial reporting purposes in accordance with U.S. generally accepted accounting principles. |
| | | | | | | | | | | | | | | | | | | | | | | | | | | | |
| | | Actual | | | Hypothetical2 | | | | |
| | | Beginning Account Value June 1, 2016 | | | Ending Account Value November 30, 2016 | | | Expenses Paid
During the Period1 | | | Beginning Account Value June 1, 2016 | | | Ending Account Value November 30, 2016 | | | Expenses Paid
During the Period1 | | | Annualized
Expense Ratio | |
Institutional | | $ | 1,000.00 | | | $ | 1,074.40 | | | $ | 3.22 | | | $ | 1,000.00 | | | $ | 1,021.96 | | | $ | 3.14 | | | | 0.62 | % |
Investor A | | $ | 1,000.00 | | | $ | 1,072.80 | | | $ | 4.68 | | | $ | 1,000.00 | | | $ | 1,020.56 | | | $ | 4.56 | | | | 0.90 | % |
Investor C | | $ | 1,000.00 | | | $ | 1,069.60 | | | $ | 8.46 | | | $ | 1,000.00 | | | $ | 1,016.90 | | | $ | 8.24 | | | | 1.63 | % |
Class K | | $ | 1,000.00 | | | $ | 1,074.40 | | | $ | 3.12 | | | $ | 1,000.00 | | | $ | 1,022.06 | | | $ | 3.04 | | | | 0.60 | % |
| | 1 | | For each class of the Fund, expenses are equal to the annualized expense ratio for the class, multiplied by the average account value over the period, multiplied by 183/365 (to reflect the one-half year period shown). |
| | 2 | | Hypothetical 5% annual return before expenses is calculated by prorating the number of days in the most recent fiscal half year divided by 365. |
| | See | | “Disclosure of Expenses” on page 8 for further information on how expenses were calculated. |
| | | | | | |
| | | | | | | |
| 6 | | BLACKROCK FUNDS | | NOVEMBER 30, 2016 | | |
| | |
| | | BlackRock Impact U.S. Equity Fund |
| | |
| Portfolio Information as of November 30, 2016 | | |
| | | | |
| Ten Largest Holdings | | Percent of
Net Assets | |
Apple, Inc. | | | 3 | % |
Microsoft Corp. | | | 3 | |
General Electric Co. | | | 2 | |
Procter & Gamble Co. | | | 2 | |
JPMorgan Chase & Co. | | | 2 | |
Amazon.com, Inc. | | | 1 | |
Medtronic PLC | | | 1 | |
Johnson & Johnson | | | 1 | |
Texas Instruments, Inc. | | | 1 | |
Citigroup, Inc. | | | 1 | |
| | | | |
| Sector Allocation | | Percent of
Net Assets | |
Information Technology | | | 20 | % |
Financials | | | 14 | |
Health Care | | | 13 | |
Consumer Discretionary | | | 12 | |
Industrials | | | 10 | |
Consumer Staples | | | 9 | |
Energy | | | 7 | |
Real Estate | | | 4 | |
Materials | | | 4 | |
Utilities | | | 4 | |
Telecommunication Services | | | 2 | |
Short-Terms Securities | | | 1 | |
Institutional and Class K Shares are not subject to any sales charge. These shares bear no ongoing distribution or service fees and are available only to eligible investors. For Impact U.S. Equity Fund, prior to the Class K Shares inception date of March 28, 2016, Class K Shares performance results are those of Institutional Shares (which have no distribution or service fees) and were restated to reflect Class K Shares fees.
Investor A Shares are subject to a maximum initial sales charge (front-end load) of 4.00% for Impact Bond Fund and 5.25% for Impact U.S. Equity Fund, respectively, and a service fee of 0.25% per year (but no distribution fee). Certain redemptions of these shares may be subject to a contingent deferred sales charge (“CDSC”) where no initial sales charge was paid at the time of purchase. These shares are generally available through financial intermediaries.
Investor C Shares are subject to a 1.00% CDSC if redeemed within one year of purchase. In addition, these shares are subject to a distribution fee of 0.75% per year and a service fee of 0.25% per year. These shares are generally available through financial intermediaries.
Performance information reflects past performance and does not guarantee future results. Current performance may be lower or higher
than the performance data quoted. Refer to www.blackrock.com/funds to obtain performance data current to the most recent month end. Performance results do not reflect the deduction of taxes that a shareholder would pay on fund distributions or the redemption of fund shares. Figures shown in the performance table on the previous page assume reinvestment of all distributions, if any, at net asset value (“NAV”) on ex-dividend/payable dates. Investment return and principal value of shares will fluctuate so that shares, when redeemed, may be worth more or less than their original cost. Distributions paid to each class of shares will vary because of the different levels of service, distribution and transfer agency fees applicable to each class, which are deducted from the income available to be paid to shareholders.
BlackRock Advisors, LLC (the “Manager”), the Funds’ investment adviser, has contractually agreed to waive and/or reimburse a portion of the Funds’ expenses. Without such waiver and/or reimbursement, the Funds’ performance would have been lower. The Manager is under no obligation to continue waiving and/or reimbursing its fees after the applicable termination date of such agreement. See Note 6 of the Notes to Financial Statements for additional information on waivers and/or reimbursements.
| | | | | | |
| | | | | | | |
| | BLACKROCK FUNDS | | NOVEMBER 30, 2016 | | 7 |
Shareholders of these Funds may incur the following charges: (a) transactional expenses, such as sales charges; and (b) operating expenses, including investment advisory fees, service and distribution fees, including 12b-1 fees, acquired fund fees and expenses, and other fund expenses. The expense examples on previous pages (which are based on a hypothetical investment of $1,000 invested on August 23, 2016 (commencement of operations) and held through November 30, 2016 for BlackRock Impact Bond Fund and are based on a hypothetical investment of $1,000 invested on June 1, 2016 and held through November 30, 2016 for BlackRock Impact U.S. Equity Fund) are intended to assist shareholders both in calculating expenses based on an investment in each Fund and in comparing these expenses with similar costs of investing in other mutual funds.
The expense examples provide information about actual account values and actual expenses. In order to estimate the expenses a shareholder paid during the period covered by this report, shareholders can divide their account value by $1,000 and then multiply the result by the
number corresponding to their Fund and share class under the heading entitled “Expenses Paid During the Period.”
The expense examples also provide information about hypothetical account values and hypothetical expenses based on a Fund’s actual expense ratio and an assumed rate of return of 5% per year before expenses. In order to assist shareholders in comparing the ongoing expenses of investing in these Funds and other funds, compare the 5% hypothetical examples with the 5% hypothetical examples that appear in shareholder reports of other funds.
The expenses shown in the expense examples are intended to highlight shareholders’ ongoing costs only and do not reflect any transactional expenses, such as sales charges, if any. Therefore, the hypothetical examples are useful in comparing ongoing expenses only, and will not help shareholders determine the relative total expenses of owning different funds. If these transactional expenses were included, shareholder expenses would have been higher.
|
| Derivative Financial Instruments |
The Funds may invest in various derivative financial instruments. These instruments are used to obtain exposure to a security, commodity index, market and/or other asset without owning or taking physical custody of securities, commodities and/or other referenced assets or to manage market, equity, credit, interest rate, foreign currency exchange rate, commodity and/or other risks. Derivative financial instruments may give rise to a form of economic leverage and involve risks, including the imperfect correlation between the value of a derivative financial instrument and the underlying asset, possible default of the
counterparty to the transaction or illiquidity of the instrument. The Funds’ successful use of a derivative financial instrument depends on the investment adviser’s ability to predict pertinent market movements accurately, which cannot be assured. The use of these instruments may result in losses greater than if they had not been used, may limit the amount of appreciation a Fund can realize on an investment and/or may result in lower distributions paid to shareholders. The Funds’ investments in these instruments, if any, are discussed in detail in the Notes to Financial Statements.
| | | | | | |
| | | | | | | |
| 8 | | BLACKROCK FUNDS | | NOVEMBER 30, 2016 | | |
| | |
Schedule of Investments November 30, 2016 (Unaudited) | | BlackRock Impact Bond Fund (Percentages shown are based on Net Assets) |
| | | | | | | | |
| Corporate Bonds | | Par (000) | | | Value | |
Aerospace & Defense — 0.8% | |
Boeing Co., 6.00%, 3/15/19 | | $ | 40 | | | $ | 43,761 | |
Bombardier, Inc., 5.75%, 3/15/22 (a) | | | 25 | | | | 21,875 | |
DigitalGlobe, Inc., 5.25%, 2/01/21 (a) | | | 25 | | | | 25,000 | |
Embraer SA, 5.15%, 6/15/22 | | | 40 | | | | 40,800 | |
TransDigm, Inc., 6.38%, 6/15/26 (a) | | | 25 | | | | 25,438 | |
| | | | | | | | |
| | | | | | | | 156,874 | |
Auto Components — 0.4% | |
Toyota Motor Credit Corp., 1.45%, 1/12/18 | | | 80 | | | | 79,992 | |
Banks — 12.9% | |
Bank of Montreal: | | | | | | | | |
1.40%, 9/11/17 | | | 50 | | | | 50,033 | |
1.45%, 4/09/18 | | | 50 | | | | 49,924 | |
1.40%, 4/10/18 | | | 80 | | | | 79,815 | |
1.50%, 7/18/19 | | | 80 | | | | 78,963 | |
Bank of Nova Scotia: | | | | | | | | |
2.05%, 10/30/18 | | | 100 | | | | 100,526 | |
1.65%, 6/14/19 | | | 125 | | | | 123,737 | |
4.38%, 1/13/21 | | | 50 | | | | 53,632 | |
Boston Properties LP, 5.63%, 11/15/20 | | | 100 | | | | 110,572 | |
Canadian Imperial Bank of Commerce, 1.60%, 9/06/19 | | | 50 | | | | 49,460 | |
CIT Group, Inc., 5.50%, 2/15/19 (a) | | | 25 | | | | 26,391 | |
Compass Bank, 6.40%, 10/01/17 | | | 100 | | | | 103,295 | |
Cooperatieve Rabobank UA, 4.50%, 1/11/21 | | | 100 | | | | 107,746 | |
Credit Suisse, New York, 5.40%, 1/14/20 | | | 80 | | | | 85,321 | |
Fifth Third Bancorp, 4.30%, 1/16/24 | | | 50 | | | | 51,853 | |
HSBC Finance Corp., 6.68%, 1/15/21 | | | 45 | | | | 50,558 | |
HSBC USA, Inc., 3.50%, 6/23/24 | | | 100 | | | | 100,458 | |
Huntington Bancshares, Inc., 2.60%, 8/02/18 | | | 100 | | | | 100,964 | |
KeyCorp, 5.10%, 3/24/21 | | | 100 | | | | 109,638 | |
Royal Bank of Canada: | | | | | | | | |
1.40%, 10/13/17 | | | 50 | | | | 50,019 | |
1.80%, 7/30/18 | | | 100 | | | | 100,091 | |
2.15%, 3/15/19 | | | 110 | | | | 110,453 | |
1.50%, 7/29/19 | | | 30 | | | | 29,603 | |
Santander Holdings USA, Inc., 2.70%, 5/24/19 | | | 100 | | | | 99,892 | |
Santander UK PLC, 2.50%, 3/14/19 | | | 80 | | | | 80,400 | |
Sumitomo Mitsui Financial Group, Inc., 2.06%, 7/14/21 | | | 80 | | | | 77,495 | |
SVB Financial Group, 3.50%, 1/29/25 | | | 50 | | | | 48,214 | |
Toronto-Dominion Bank: | | | | | | | | |
1.40%, 4/30/18 | | | 80 | | | | 79,815 | |
1.45%, 9/06/18 | | | 50 | | | | 49,790 | |
2.63%, 9/10/18 | | | 100 | | | | 101,622 | |
U.S. Bancorp, 2.20%, 4/25/19 | | | 80 | | | | 80,663 | |
Wells Fargo & Co.: | | | | | | | | |
3.45%, 2/13/23 | | | 25 | | | | 24,953 | |
3.00%, 4/22/26 | | | 50 | | | | 47,975 | |
Westpac Banking Corp., 1.55%, 5/25/18 | | | 80 | | | | 79,829 | |
| | | | | | | | |
| | | | | | | | 2,493,700 | |
Beverages — 0.1% | |
Ball Corp., 5.25%, 7/01/25 | | | 25 | | | | 26,016 | |
Biotechnology — 0.5% | |
Genzyme Corp., 5.00%, 6/15/20 | | | 80 | | | | 87,566 | |
Cable Television Services — 0.2% | |
Motorola Solutions, Inc., 7.50%, 5/15/25 | | | 25 | | | | 29,230 | |
| | | | | | | | |
| Corporate Bonds | | Par (000) | | | Value | |
Capital Markets — 4.4% | |
Goldman Sachs Group, Inc.: | | | | | | | | |
2.63%, 1/31/19 | | $ | 75 | | | $ | 75,793 | |
5.38%, 3/15/20 | | | 75 | | | | 81,497 | |
3.63%, 1/22/23 | | | 50 | | | | 51,197 | |
4.25%, 10/21/25 | | | 25 | | | | 25,376 | |
3.75%, 2/25/26 | | | 25 | | | | 25,160 | |
Morgan Stanley: | | | | | | | | |
1.88%, 1/05/18 | | | 100 | | | | 100,088 | |
2.20%, 12/07/18 | | | 50 | | | | 50,229 | |
2.38%, 7/23/19 | | | 100 | | | | 100,371 | |
4.88%, 11/01/22 | | | 50 | | | | 53,808 | |
3.88%, 1/27/26 | | | 75 | | | | 75,994 | |
Northern Trust Corp., 3.45%, 11/04/20 | | | 100 | | | | 103,959 | |
State Street Corp., 1.95%, 5/19/21 | | | 100 | | | | 98,039 | |
| | | | | | | | |
| | | | | | | | 841,511 | |
Chemicals — 1.5% | |
Albemarle Corp., 4.15%, 12/01/24 | | | 50 | | | | 51,458 | |
Dow Chemical Co., 8.55%, 5/15/19 | | | 80 | | | | 91,916 | |
Sherwin-Williams Co., 1.35%, 12/15/17 | | | 100 | | | | 99,990 | |
Valspar Corp., 3.30%, 2/01/25 | | | 50 | | | | 47,998 | |
| | | | | | | | |
| | | | | | | | 291,362 | |
Commercial Services & Supplies — 0.4% | |
Iron Mountain US Holdings, Inc., 5.38%, 6/01/26 (a) | | | 25 | | | | 24,563 | |
Novant Health, Inc., 5.85%, 11/01/19 | | | 50 | | | | 55,410 | |
| | | | | | | | |
| | | | | | | | 79,973 | |
Communications Equipment — 0.4% | |
Avaya, Inc., 7.00%, 4/01/19 (a) | | | 25 | | | | 21,781 | |
Juniper Networks, Inc., 4.35%, 6/15/25 | | | 25 | | | | 25,093 | |
Zayo Group LLC/Zayo Capital, Inc., 6.38%, 5/15/25 | | | 25 | | | | 26,000 | |
| | | | | | | | |
| | | | | | | | 72,874 | |
Construction Materials — 0.1% | |
HD Supply, Inc., 5.75%, 4/15/24 (a) | | | 25 | | | | 25,562 | |
Consumer Finance — 2.0% | |
American Express Co.: | | | | | | | | |
7.00%, 3/19/18 | | | 25 | | | | 26,653 | |
3.63%, 12/05/24 | | | 25 | | | | 25,015 | |
Automatic Data Processing, Inc., 2.25%, 9/15/20 | | | 80 | | | | 80,334 | |
Capital One Financial Corp., 2.45%, 4/24/19 | | | 80 | | | | 80,598 | |
Discover Financial Services: | | | | | | | | |
5.20%, 4/27/22 | | | 50 | | | | 53,921 | |
3.75%, 3/04/25 | | | 25 | | | | 24,276 | |
Navient Corp., 5.88%, 10/25/24 | | | 25 | | | | 23,125 | |
OneMain Financial Holdings LLC, 6.75%, 12/15/19 (a) | | | 25 | | | | 25,438 | |
Synchrony Financial, 4.25%, 8/15/24 | | | 50 | | | | 50,804 | |
| | | | | | | | |
| | | | | | | | 390,164 | |
Containers & Packaging — 0.4% | |
International Paper Co., 3.80%, 1/15/26 | | | 50 | | | | 50,494 | |
Reynolds Group Issuer, Inc./Reynolds Group Issuer LLC/Reynolds Group Issuer Lu, 7.00%, 7/15/24 (a) | | | 25 | | | | 26,390 | |
| | | | | | | | |
| | | | | | | | 76,884 | |
Diversified Consumer Services — 0.1% | |
ADT Corp., 6.25%, 10/15/21 | | | 25 | | | | 26,937 | |
Diversified Financial Services — 7.9% | |
Ally Financial, Inc., 4.25%, 4/15/21 | | | 25 | | | | 24,688 | |
See Notes to Financial Statements.
| | | | | | |
| | | | | | | |
| | BLACKROCK FUNDS | | NOVEMBER 30, 2016 | | 9 |
| | |
Schedule of Investments (continued) | | BlackRock Impact Bond Fund |
| | | | | | | | |
| Corporate Bonds | | Par (000) | | | Value | |
Diversified Financial Services (continued) | |
Bank of America Corp., 5.63%, 7/01/20 | | $ | 50 | | | $ | 55,087 | |
Citigroup, Inc.: | | | | | | | | |
2.70%, 3/30/21 | | | 75 | | | | 74,908 | |
3.70%, 1/12/26 | | | 50 | | | | 49,901 | |
Ford Motor Credit Co. LLC, 2.46%, 3/27/20 | | | 200 | | | | 197,257 | |
FS Investment Corp., 4.00%, 7/15/19 | | | 50 | | | | 50,440 | |
General Motors Financial Co., Inc.: | | | | | | | | |
3.50%, 7/10/19 | | | 50 | | | | 50,844 | |
5.25%, 3/01/26 | | | 50 | | | | 52,229 | |
HRG Group, Inc., 7.75%, 1/15/22 | | | 25 | | | | 25,937 | |
HSBC Holdings PLC, 5.10%, 4/05/21 | | | 100 | | | | 107,976 | |
Intercontinental Exchange, Inc., 2.75%, 12/01/20 | | | 100 | | | | 101,052 | |
International Lease Finance Corp., 3.88%, 4/15/18 | | | 100 | | | | 101,950 | |
John Deere Capital Corp.: | | | | | | | | |
1.55%, 12/15/17 | | | 100 | | | | 100,375 | |
1.35%, 1/16/18 | | | 80 | | | | 79,951 | |
1.95%, 1/08/19 | | | 50 | | | | 50,161 | |
JPMorgan Chase & Co.: | | | | | | | | |
6.30%, 4/23/19 | | | 40 | | | | 43,898 | |
4.25%, 10/15/20 | | | 80 | | | | 84,941 | |
3.88%, 9/10/24 | | | 70 | | | | 70,834 | |
Morgan Stanley, 2.13%, 4/25/18 | | | 100 | | | | 100,318 | |
Nationstar Mortgage LLC/Nationstar Capital Corp., 6.50%, 7/01/21 | | | 25 | | | | 25,062 | |
PACCAR Financial Corp., 1.40%, 5/18/18 | | | 50 | | | | 49,990 | |
Royal Bank of Scotland Group PLC, 6.13%, 12/15/22 | | | 25 | | | | 25,904 | |
| | | | | | | | |
| | | | | | | | 1,523,703 | |
Diversified Telecommunication Services — 1.3% | |
AT&T, Inc.: | | | | | | | | |
2.38%, 11/27/18 | | | 50 | | | | 50,364 | |
4.13%, 2/17/26 | | | 50 | | | | 50,364 | |
CenturyLink, Inc., Series Y, 7.50%, 4/01/24 | | | 25 | | | | 25,810 | |
Frontier Communications Corp., 11.00%, 9/15/25 | | | 25 | | | | 25,063 | |
Verizon Communications, Inc.: | | | | | | | | |
4.50%, 9/15/20 | | | 50 | | | | 53,523 | |
4.15%, 3/15/24 | | | 50 | | | | 52,426 | |
| | | | | | | | |
| | | | | | | | 257,550 | |
Electric Utilities — 3.7% | |
Ameren Corp., 2.70%, 11/15/20 | | | 100 | | | | 100,814 | |
Black Hills Corp., 4.25%, 11/30/23 | | | 20 | | | | 21,056 | |
CenterPoint Energy Houston Electric LLC, 1.85%, 6/01/21 | | | 100 | | | | 98,150 | |
Commonwealth Edison Co., 3.40%, 9/01/21 | | | 50 | | | | 52,098 | |
Consolidated Edison, Inc., 2.00%, 5/15/21 | | | 125 | | | | 122,362 | |
NV Energy, Inc., 6.25%, 11/15/20 | | | 80 | | | | 90,865 | |
Pacific Gas & Electric Co., 4.25%, 5/15/21 | | | 50 | | | | 53,455 | |
Public Service Electric & Gas Co., 2.00%, 8/15/19 | | | 80 | | | | 80,536 | |
Talen Energy Supply LLC, 4.63%, 7/15/19 (a) | | | 100 | | | | 95,125 | |
| | | | | | | | |
| | | | | | | | 714,461 | |
Electronic Equipment, Instruments & Components — 0.2% | |
Avnet, Inc., 4.88%, 12/01/22 | | | 40 | | | | 41,720 | |
Energy Equipment & Services — 0.1% | |
Weatherford International, Ltd., 8.25%, 6/15/23 | | | 25 | | | | 24,375 | |
Food & Staples Retailing — 1.5% | |
Costco Wholesale Corp., 1.70%, 12/15/19 | | | 80 | | | | 80,060 | |
JM Smucker Co., 1.75%, 3/15/18 | | | 75 | | | | 75,137 | |
| | | | | | | | |
| Corporate Bonds | | Par (000) | | | Value | |
Food & Staples Retailing (continued) | |
Sysco Corp.: | | | | | | | | |
1.90%, 4/01/19 | | $ | 75 | | | $ | 74,772 | |
2.60%, 6/12/22 | | | 50 | | | | 49,541 | |
| | | | | | | | |
| | | | | | | | 279,510 | |
Food Products — 1.9% | |
Hershey Co., 4.13%, 12/01/20 | | | 75 | | | | 80,204 | |
Kellogg Co., 3.25%, 4/01/26 | | | 50 | | | | 48,671 | |
Kraft Heinz Foods Co., 5.38%, 2/10/20 | | | 50 | | | | 54,151 | |
Post Holdings, Inc., 5.00%, 8/15/26 (a) | | | 25 | | | | 23,656 | |
Tyson Foods, Inc., 4.50%, 6/15/22 | | | 50 | | | | 53,635 | |
Unilever Capital Corp., 2.20%, 3/06/19 | | | 100 | | | | 101,021 | |
| | | | | | | | |
| | | | | | | | 361,338 | |
Forest Products — 0.4% | |
Bunge, Ltd. Finance Corp., 3.50%, 11/24/20 | | | 80 | | | | 81,437 | |
Health Care Equipment & Supplies — 2.0% | |
Becton Dickinson & Co., 2.68%, 12/15/19 | | | 75 | | | | 76,344 | |
Edwards Lifesciences Corp., 2.88%, 10/15/18 | | | 30 | | | | 30,517 | |
Kinetic Concepts, Inc./KCI USA, Inc., 7.88%, 2/15/21 (a) | | | 25 | | | | 26,375 | |
Mallinckrodt International Finance SA/Mallinckrodt CB LLC, 5.63%, 10/15/23 (a) | | | 25 | | | | 22,625 | |
Medtronic, Inc., 5.60%, 3/15/19 | | | 80 | | | | 86,682 | |
St. Jude Medical, Inc., 3.88%, 9/15/25 | | | 70 | | | | 70,522 | |
Zimmer Holdings, Inc., 2.00%, 4/01/18 | | | 75 | | | | 75,036 | |
| | | | | | | | |
| | | | | | | | 388,101 | |
Health Care Providers & Services — 1.6% | |
Aetna, Inc.: | | | | | | | | |
1.90%, 6/07/19 | | | 80 | | | | 79,634 | |
3.20%, 6/15/26 | | | 40 | | | | 39,142 | |
Centene Corp., 5.63%, 2/15/21 | | | 25 | | | | 25,750 | |
HCA, Inc., 5.25%, 6/15/26 | | | 25 | | | | 25,027 | |
Humana, Inc., 7.20%, 6/15/18 | | | 80 | | | | 86,599 | |
Kindred Healthcare, Inc., 8.75%, 1/15/23 | | | 25 | | | | 22,250 | |
Tenet Healthcare Corp., 6.25%, 11/01/18 | | | 25 | | | | 26,063 | |
| | | | | | | | |
| | | | | | | | 304,465 | |
Household Durables — 0.1% | |
PulteGroup, Inc., 5.00%, 1/15/27 | | | 25 | | | | 23,531 | |
Independent Power and Renewable Electricity Producers — 0.1% | |
AES Corp., 6.00%, 5/15/26 | | | 25 | | | | 24,562 | |
Industrial Conglomerates — 0.9% | |
General Electric Co.: | | | | | | | | |
2.10%, 12/11/19 | | | 100 | | | | 100,586 | |
3.45%, 5/15/24 | | | 75 | | | | 77,499 | |
| | | | | | | | |
| | | | | | | | 178,085 | |
Insurance — 2.7% | |
Aflac, Inc., 2.40%, 3/16/20 | | | 100 | | | | 100,539 | |
Berkshire Hathaway Finance Corp., 1.70%, 3/15/19 | | | 80 | | | | 79,964 | |
Markel Corp., 4.90%, 7/01/22 | | | 70 | | | | 75,448 | |
Marsh & McLennan Cos., Inc.: | | | | | | | | |
3.30%, 3/14/23 | | | 50 | | | | 50,719 | |
3.50%, 3/10/25 | | | 50 | | | | 50,504 | |
MetLife, Inc.: | | | | | | | | |
7.72%, 2/15/19 | | | 80 | | | | 89,859 | |
Series D, 4.37%, 9/15/23 | | | 70 | | | | 75,552 | |
| | | | | | | | |
| | | | | | | | 522,585 | |
See Notes to Financial Statements.
| | | | | | |
| | | | | | | |
| 10 | | BLACKROCK FUNDS | | NOVEMBER 30, 2016 | | |
| | |
Schedule of Investments (continued) | | BlackRock Impact Bond Fund |
| | | | | | | | |
| Corporate Bonds | | Par (000) | | | Value | |
Internet Software & Services — 0.6% | |
Alphabet, Inc., 3.63%, 5/19/21 | | $ | 75 | | | $ | 79,535 | |
Equinix, Inc., 5.88%, 1/15/26 | | | 25 | | | | 25,938 | |
| | | | | | | | |
| | | | | | | | 105,473 | |
IT Services — 0.5% | |
Xerox Corp., 2.75%, 9/01/20 | | | 100 | | | | 98,008 | |
Life Sciences Tools & Services — 0.5% | |
Thermo Fisher Scientific, Inc., 4.50%, 3/01/21 | | | 80 | | | | 85,755 | |
Machinery — 0.6% | |
CNH Industrial Capital LLC, 4.88%, 4/01/21 | | | 25 | | | | 25,750 | |
Illinois Tool Works, Inc., 6.25%, 4/01/19 | | | 80 | | | | 87,967 | |
| | | | | | | | |
| | | | | | | | 113,717 | |
Media — 3.0% | |
CCO Holdings LLC/CCO Holdings Capital Corp., 5.88%, 4/01/24 (a) | | | 25 | | | | 26,469 | |
Cequel Communications Holdings I LLC/Cequel Capital Corp., 5.13%, 12/15/21 (a) | | | 25 | | | | 24,625 | |
Charter Communications Operating LLC/Charter Communications Operating Capital, 3.58%, 7/23/20 (a) | | | 80 | | | | 81,650 | |
CSC Holdings LLC, 8.63%, 2/15/19 | | | 25 | | | | 27,562 | |
DISH DBS Corp., 7.75%, 7/01/26 | | | 25 | | | | 27,594 | |
Intelsat Jackson Holdings SA, 7.25%, 10/15/20 | | | 25 | | | | 18,219 | |
Omnicom Group, Inc., 4.45%, 8/15/20 | | | 100 | | | | 106,569 | |
Thomson Reuters Corp., 4.30%, 11/23/23 | | | 100 | | | | 104,750 | |
Walt Disney Co.: | | | | | | | | |
1.65%, 1/08/19 | | | 80 | | | | 80,190 | |
0.88%, 7/12/19 | | | 80 | | | | 78,467 | |
| | | | | | | | |
| | | | | | | | 576,095 | |
Metals & Mining — 1.0% | |
Alcoa, Inc., 5.13%, 10/01/24 | | | 25 | | | | 25,500 | |
Goldcorp, Inc., 3.63%, 6/09/21 | | | 80 | | | | 81,537 | |
Nucor Corp., 5.85%, 6/01/18 | | | 80 | | | | 84,756 | |
| | | | | | | | |
| | | | | | | | 191,793 | |
Multi-Utilities — 0.1% | |
AmeriGas Partners LP / AmeriGas Finance Corp., 5.88%, 8/20/26 | | | 25 | | | | 24,867 | |
Oil, Gas & Consumable Fuels — 3.7% | |
BP Capital Markets PLC, 3.56%, 11/01/21 | | | 70 | | | | 72,859 | |
Buckeye Partners LP, 4.88%, 2/01/21 | | | 80 | | | | 84,907 | |
Canadian Natural Resources Ltd., 3.90%, 2/01/25 | | | 40 | | | | 39,305 | |
Chevron Corp.: | | | | | | | | |
1.56%, 5/16/19 | | | 80 | | | | 79,524 | |
3.19%, 6/24/23 | | | 70 | | | | 71,378 | |
Concho Resources, Inc., 5.50%, 4/01/23 | | | 25 | | | | 25,704 | |
DCP Midstream Operating LP, 3.88%, 3/15/23 | | | 25 | | | | 23,988 | |
Enbridge, Inc., 4.00%, 10/01/23 | | | 40 | | | | 40,142 | |
Energy Transfer Partners LP, 4.75%, 1/15/26 | | | 50 | | | | 50,373 | |
Occidental Petroleum Corp., 3.40%, 4/15/26 | | | 25 | | | | 24,980 | |
ONEOK Partners LP, 3.38%, 10/01/22 | | | 70 | | | | 69,700 | |
Parsley Energy LLC/Parsley Finance Corp., 7.50%, 2/15/22 (a) | | | 25 | | | | 26,500 | |
Permian Resources LLC, 13.00%, 11/30/20 (a) | | | 25 | | | | 29,000 | |
Shell International Finance BV, 1.38%, 5/10/19 | | | 80 | | | | 79,032 | |
| | | | | | | | |
| | | | | | | | 717,392 | |
| | | | | | | | |
| Corporate Bonds | | Par (000) | | | Value | |
Personal Products — 0.4% | |
Procter & Gamble Co., 1.90%, 11/01/19 | | $ | 80 | | | $ | 80,589 | |
Pharmaceuticals — 4.3% | |
AstraZeneca PLC: | | | | | | | | |
1.75%, 11/16/18 | | | 125 | | | | 125,048 | |
3.38%, 11/16/25 | | | 50 | | | | 49,792 | |
GlaxoSmithKline Capital, Inc., 5.65%, 5/15/18 | | | 100 | | | | 105,667 | |
Johnson & Johnson: | | | | | | | | |
1.13%, 3/01/19 | | | 80 | | | | 79,329 | |
3.55%, 5/15/21 | | | 80 | | | | 84,649 | |
Novartis Securities Investment, Ltd., 5.13%, 2/10/19 | | | 80 | | | | 85,730 | |
Teva Pharmaceutical Finance Netherlands III BV, 1.40%, 7/20/18 | | | 150 | | | | 148,539 | |
Wyeth LLC, 6.45%, 2/01/24 | | | 70 | | | | 85,787 | |
Zoetis, Inc., 3.25%, 2/01/23 | | | 70 | | | | 69,407 | |
| | | | | | | | |
| | | | | | | | 833,948 | |
Professional Services — 0.1% | |
Verisk Analytics, Inc., 4.13%, 9/12/22 | | | 25 | | | | 25,912 | |
Real Estate — 0.4% | |
Prologis LP, 3.75%, 11/01/25 | | | 75 | | | | 77,191 | |
Real Estate Investment Trusts (REITs) — 2.6% | |
American Tower Corp.: | | | | | | | | |
4.50%, 1/15/18 | | | 80 | | | | 82,271 | |
2.80%, 6/01/20 | | | 50 | | | | 50,238 | |
Camden Property Trust, 2.95%, 12/15/22 | | | 20 | | | | 19,658 | |
HCP, Inc.: | | | | | | | | |
3.75%, 2/01/19 | | | 80 | | | | 82,223 | |
5.38%, 2/01/21 | | | 80 | | | | 87,618 | |
Kilroy Realty LP, 3.80%, 1/15/23 | | | 20 | | | | 20,128 | |
Realty Income Corp., 2.00%, 1/31/18 | | | 75 | | | | 75,248 | |
Welltower, Inc., 4.13%, 4/01/19 | | | 80 | | | | 83,096 | |
| | | | | | | | |
| | | | | | | | 500,480 | |
Road & Rail — 0.5% | |
Burlington Northern Santa Fe LLC, 4.70%, 10/01/19 | | | 80 | | | | 86,192 | |
Semiconductors & Semiconductor Equipment — 0.8% | |
Seagate HDD Cayman, 3.75%, 11/15/18 | | | 50 | | | | 51,063 | |
Texas Instruments, Inc., 1.85%, 5/15/22 | | | 100 | | | | 96,152 | |
| | | | | | | | |
| | | | | | | | 147,215 | |
Software — 1.1% | |
Autodesk, Inc., 4.38%, 6/15/25 | | | 25 | | | | 25,722 | |
BMC Software Finance, Inc., 8.13%, 7/15/21 (a) | | | 25 | | | | 22,500 | |
Microsoft Corp., 1.30%, 11/03/18 | | | 80 | | | | 79,885 | |
Oracle Corp., 2.25%, 10/08/19 | | | 80 | | | | 80,952 | |
| | | | | | | | |
| | | | | | | | 209,059 | |
Specialty Retail — 1.8% | |
Best Buy Co., Inc.: | | | | | | | | |
5.00%, 8/01/18 | | | 50 | | | | 52,397 | |
5.50%, 3/15/21 | | | 80 | | | | 87,654 | |
Coach, Inc., 4.25%, 4/01/25 | | | 40 | | | | 39,934 | |
Home Depot, Inc., 2.00%, 6/15/19 | | | 80 | | | | 80,851 | |
L Brands, Inc., 8.50%, 6/15/19 | | | 25 | | | | 28,719 | |
QVC, Inc., 5.13%, 7/02/22 | | | 50 | | | | 51,114 | |
| | | | | | | | |
| | | | | | | | 340,669 | |
Technology Hardware, Storage & Peripherals — 2.0% | |
Apple, Inc., 2.85%, 2/23/23 | | | 50 | | | | 50,125 | |
See Notes to Financial Statements.
| | | | | | |
| | | | | | | |
| | BLACKROCK FUNDS | | NOVEMBER 30, 2016 | | 11 |
| | |
Schedule of Investments (continued) | | BlackRock Impact Bond Fund |
| | | | | | | | |
| Corporate Bonds | | Par (000) | | | Value | |
Technology Hardware, Storage & Peripherals (continued) | |
Diamond 1 Finance Corp./Diamond 2 Finance Corp. (a): | | | | | | | | |
3.48%, 6/01/19 | | $ | 100 | | | $ | 101,856 | |
5.45%, 6/15/23 | | | 25 | | | | 26,077 | |
EMC Corp.: | | | | | | | | |
1.88%, 6/01/18 | | | 75 | | | | 73,903 | |
2.65%, 6/01/20 | | | 50 | | | | 47,944 | |
Hewlett Packard Enterprise Co., 3.10%, 10/05/18 (a) | | | 75 | | | | 76,102 | |
| | | | | | | | |
| | | | | | | | 376,007 | |
Textiles, Apparel & Luxury Goods — 0.1% | |
Levi Strauss & Co., 5.00%, 5/01/25 | | | 25 | | | | 24,937 | |
Wireless Telecommunication Services — 1.5% | |
Crown Castle International Corp.: | | | | | | | | |
3.40%, 2/15/21 | | | 80 | | | | 81,382 | |
5.25%, 1/15/23 | | | 50 | | | | 54,353 | |
SBA Communications Corp., 4.88%, 7/15/22 | | | 25 | | | | 25,021 | |
Sprint Communications, Inc., 9.00%, 11/15/18 (a) | | | 25 | | | | 27,469 | |
Sprint Corp., 7.63%, 2/15/25 | | | 25 | | | | 25,406 | |
T-Mobile USA, Inc., 6.00%, 4/15/24 | | | 25 | | | | 26,250 | |
Weyerhaeuser Co., 4.63%, 9/15/23 | | | 50 | | | | 53,801 | |
| | | | | | | | |
| | | | | | | | 293,682 | |
| Total Corporate Bonds — 74.2% | | | | | | | 14,313,049 | |
| | | | | | | | |
| | | | | | | | | |
|
| U.S. Government Sponsored Agency Securities | |
Mortgage-Backed Securities — 52.1% | |
Fannie Mae Mortgage-Backed Securities: | | | | | | | | |
3.00%, 12/01/46 (b) | | | 150 | | | | 149,414 | |
3.50%, 12/01/46 (b) | | | 1,086 | | | | 1,115,108 | |
4.00%, 12/01/31 - 4/01/46 (b) | | | 1,557 | | | | 1,643,977 | |
4.50%, 12/01/31 - 12/01/46 (b) | | | 1,420 | | | | 1,529,493 | |
5.00%, 6/01/39 - 3/01/41 | | | 1,114 | | | | 1,233,796 | |
5.50%, 12/01/46 (b) | | | 400 | | | | 446,502 | |
| | | | | | | | |
U.S. Government Sponsored Agency Securities | | Par (000) | | | Value | |
Mortgage-Backed Securities (continued) | |
Freddie Mac Mortgage-Backed Securities (b): | | | | | | | | |
3.00%, 12/01/46 | | $ | 465 | | | $ | 462,929 | |
3.50%, 12/01/46 | | | 815 | | | | 836,553 | |
4.00%, 12/01/46 | | | 325 | | | | 341,967 | |
4.50%, 12/01/46 | | | 475 | | | | 511,989 | |
Ginnie Mae Mortgage-Backed Securities (b): | | | | | | | | |
3.50%, 12/01/46 | | | 775 | | | | 806,908 | |
4.00%, 12/01/46 | | | 525 | | | | 556,705 | |
4.50%, 12/01/46 | | | 400 | | | | 428,555 | |
| Total U.S. Government Sponsored Agency Securities — 52.1% | | | | 10,063,896 | |
Total Long-Term Investments
(Cost — $24,871,196) — 126.3% | | | | 24,376,945 | |
| | | | | | | | |
| | | | | | | | | |
| | |
| Short-Term Securities — 11.0% | | Shares | | | | |
BlackRock Liquidity Funds, T-Fund, Institutional Class, 0.25% (c)(d) | | | 2,127,852 | | | | 2,127,852 | |
Total Short-Term Securities
(Cost — $2,127,852) — 11.0% | | | | | | | 2,127,852 | |
| Total Investments (Cost — $26,999,048) — 137.3% | | | | 26,504,797 | |
Liabilities in Excess of Other Assets — (37.3)% | | | | | | | (7,196,856 | ) |
| | | | | | | | |
Net Assets — 100.0% | | | | | | $ | 19,307,941 | |
| | | | | | | | |
|
| Notes to Schedule of Investments |
| (a) | | Security exempt from registration pursuant to Rule 144A under the Securities Act of 1933, as amended. These securities may be resold in transactions exempt from registration to qualified institutional investors. |
| (b) | | Represents or includes a TBA transaction. As of period end, unsettled TBA transactions were as follows: |
| | | | | | | | |
| Counterparty | | Value | | | Unrealized
Depreciation | |
Bank of America N.A. | | $ | 341,967 | | | $ | (5,427 | ) |
Barclays Capital, Inc. | | $ | 1,529,494 | | | $ | (18,805 | ) |
BNP Paribas Securities Corp. | | $ | 224,717 | | | $ | (3,339 | ) |
Citigroup Global Markets, Inc. | | $ | 950,773 | | | $ | (4,689 | ) |
Credit Suisse Securities (USA) LLC | | $ | 2,531,330 | | | $ | (39,988 | ) |
Goldman Sachs & Co. | | $ | 19,922 | | | $ | (629 | ) |
J.P. Morgan Securities LLC | | $ | 447,704 | | | $ | (2,049 | ) |
Mizuho Securities USA, Inc. | | $ | 102,770 | | | $ | (605 | ) |
Morgan Stanley & Co. LLC | | $ | 144,376 | | | $ | (4,569 | ) |
Nomura Securities International, Inc. | | $ | 836,553 | | | $ | (17,796 | ) |
RBC Capital Markets, LLC | | $ | 159,287 | | | $ | (5,063 | ) |
See Notes to Financial Statements.
| | | | | | |
| | | | | | | |
| 12 | | BLACKROCK FUNDS | | NOVEMBER 30, 2016 | | |
| | |
Schedule of Investments (continued) | | BlackRock Impact Bond Fund |
| (c) | | During the period ended November 30, 2016, investments in issuers considered to be affiliates of the Fund for purposes of Section 2(a)(3) of the Investment Company Act of 1940, as amended, were as follows: |
| | | | | | | | | | | | | | | | | | | | |
| Affiliate | | Net
Activity | | | Shares Held
at November 30,
2016 | | | Value at
November 30,
2016 | | | Income | | | | |
BlackRock Liquidity Funds, T-Fund, Institutional Class | | | 2,127,852 | | | | 2,127,852 | | | $ | 2,127,852 | | | $ | 1,334 | | | | | |
BlackRock Liquidity Funds, TempFund, Institutional Class | | | — | | | | — | | | | — | | | | 853 | | | | | |
Total | | | | | | | | | | $ | 2,127,852 | | | $ | 2,187 | | | | | |
| | | | | | | | | | | | |
| (d) | | Current yield as of period end. |
For Fund compliance purposes, the Fund’s sector classifications refer to one or more of the sector sub-classifications used by one or more widely recognized market indexes or rating group indexes, and/or as defined by the investment advisor. These definitions may not apply for purposes of this report, which may combine such sector sub-classifications for reporting ease.
|
| Derivative Financial Instruments Outstanding as of Period End |
| | | | | | | | | | | | | | | | | | | | | | | | |
| Futures Contracts | | | | |
Contracts
Long (Short) | | | Issue | | Expiration | | | Notional
Value | | | Unrealized
Appreciation
(Depreciation) | | | | |
| | (3 | ) | | 2-Year U.S. Treasury Note | | | March 2017 | | | $ | | | | | 650,438 | | | $ | 371 | | | | | |
| | 9 | | | 5-Year U.S. Treasury Note | | | March 2017 | | | $ | | | | | 1,060,594 | | | | (2,107 | ) | | | | |
| | 5 | | | 10-Year U.S. Treasury Note | | | March 2017 | | | $ | | | | | 622,578 | | | | (1,937 | ) | | | | |
| | 1 | | | 10-Year U.S. Ultra Long Treasury Note | | | March 2017 | | | $ | | | | | 134,438 | | | | (658 | ) | | | | |
| | (2 | ) | | Long U.S. Treasury Bond | | | March 2017 | | | $ | | | | | 302,563 | | | | 1,263 | | | | | |
| | 6 | | | Ultra Long U.S. Treasury Bond | | | March 2017 | | | $ | | | | | 968,438 | | | | (2,026 | ) | | | | |
| | Total | | | | | | | | | | | | | | | | | $ | (5,094 | ) | | | | |
| | | | | | | | | | | | | | | | | | | | |
|
| Derivative Financial Instruments Categorized by Risk Exposure |
As of period end, the fair values of derivative financial instruments located in the Statements of Assets and Liabilities were as follows:
| | | | | | | | | | | | | | | | | | | | | | | | | | | | | | | | | | |
| Assets — Derivative Financial Instruments | | Commodity
Contracts | | | Credit
Contracts | | | Equity
Contracts | | | Foreign
Currency
Exchange
Contracts | | | Interest
Rate
Contracts | | | Other
Contracts | | | Total | | | | |
Futures contracts | | Net unrealized appreciation1 | | | — | | | | — | | | | — | | | | — | | | $ | 1,634 | | | | — | | | $ | 1,634 | | | | | |
| Liabilities — Derivative Financial Instruments | | | | | | | | | | | | | | | | | | | | | | | | |
Futures contracts | | Net unrealized depreciation1 | | | — | | | | — | | | | — | | | | — | | | $ | 6,728 | | | | — | | | $ | 6,728 | | | | | |
1 Includes cumulative appreciation (depreciation) on futures contracts, if any, as reported in the Schedule of Investments. Only current day’s variation margin is reported within the Statements of Assets and Liabilities. | �� |
For the period ended November 30, 2016, the effect of derivative financial instruments in the Statements of Operations was as follows:
| | | | | | | | | | | | | | | | | | | | | | | | | | | | | | | | |
| Net Realized Gain (Loss) from: | | Commodity
Contracts | | | Credit
Contracts | | | Equity
Contracts | | | Foreign
Currency
Exchange
Contracts | | | Interest
Rate
Contracts | | | Other
Contracts | | | Total | | | | |
Futures contracts | | | — | | | | — | | | | — | | | | — | | | $ | (180,053 | ) | | | — | | | $ | (180,053 | ) | | | | |
| Net Change in Unrealized Appreciation (Depreciation) on: | |
Futures contracts | | | — | | | | — | | | | — | | | | — | | | $ | (5,094 | ) | | | — | | | $ | (5,094 | ) | | | | |
See Notes to Financial Statements.
| | | | | | |
| | | | | | | |
| | BLACKROCK FUNDS | | NOVEMBER 30, 2016 | | 13 |
| | |
Schedule of Investments (concluded) | | BlackRock Impact Bond Fund |
| | |
| Average Quarterly Balances of Outstanding Derivative Financial Instruments | | |
| | | | |
| Futures contracts: | | | | |
Average notional value of contracts — long | | $ | 1,988,914 | |
Average notional value of contracts — short | | $ | 541,961 | |
For more information about the Fund’s investment risks regarding derivative financial instruments, refer to the Notes to Financial Statements.
|
| Fair Value Hierarchy as of Period End |
Various inputs are used in determining the fair value of investments and derivative financial instruments. For information about the Fund’s policy regarding valuation of investments and derivative financial instruments, refer to the Notes to Financial Statements.
The following tables summarize the Fund’s investments and derivative financial instruments categorized in the disclosure hierarchy:
| | | | | | | | | | | | | | | | |
| | | Level 1 | | | Level 2 | | | Level 3 | | | Total | |
Assets: | | | | | | | | | | | | | | | | |
| Investments: | | | | | | | | | | | | | | | | |
Long Term Investments1 | | | — | | | $ | 24,376,945 | | | | — | | | $ | 24,376,945 | |
Short-Term Securities | | $ | 2,127,852 | | | | — | | | | — | | | | 2,127,852 | |
| | | | |
Total | | $ | 2,127,852 | | | $ | 24,376,945 | | | | — | | | $ | 26,504,797 | |
| | | | |
| | | | | | | | | | | | | | | | |
| Derivative Financial Instruments2 | | | | | | | | | | | | | | | | |
Assets: | | | | | | | | | | | | | | | | |
Interest rate contracts | | $ | 1,634 | | | | — | | | | — | | | $ | 1,634 | |
Liabilities: | | | | | | | | | | | | | | | | |
Interest rate contracts | | | (6,728 | ) | | | — | | | | — | | | | (6,728 | ) |
| | | | |
Total | | $ | (5,094 | ) | | | — | | | | — | | | $ | (5,094 | ) |
| | | | |
1 See above Schedule of Investments for values in each sector. | |
2 Derivative financial instruments are futures contracts. Futures contracts are valued at the unrealized appreciation (depreciation) on the instrument. | |
The Fund may hold assets and/or liabilities in which the fair value approximates the carrying amount for financial statement purposes. As of period end, cash pledged for futures contracts of $41,000 is categorized as Level 1 within the disclosure hierarchy.
See Notes to Financial Statements.
| | | | | | |
| | | | | | | |
| 14 | | BLACKROCK FUNDS | | NOVEMBER 30, 2016 | | |
| | |
Schedule of Investments November 30, 2016 (Unaudited) | | BlackRock Impact U.S. Equity Fund (Percentages shown are based on Net Assets) |
| | | | | | | | |
| Common Stocks | | Shares | | | Value | |
Aerospace & Defense — 1.2% | |
Boeing Co. | | | 643 | | | $ | 96,810 | |
HEICO Corp., Class A | | | 37 | | | | 2,486 | |
Northrop Grumman Corp. | | | 168 | | | | 41,941 | |
Raytheon Co. | | | 308 | | | | 46,058 | |
Rockwell Collins, Inc. | | | 120 | | | | 11,127 | |
United Technologies Corp. | | | 797 | | | | 85,853 | |
| | | | | | | | |
| | | | | 284,275 | |
Air Freight & Logistics — 0.1% | |
Hub Group, Inc., Class A (a) | | | 424 | | | | 18,168 | |
XPO Logistics, Inc. (a) | | | 119 | | | | 5,299 | |
| | | | | | | | |
| | | | | 23,467 | |
Airlines — 0.7% | |
Delta Air Lines, Inc. | | | 428 | | | | 20,621 | |
Hawaiian Holdings, Inc. (a) | | | 196 | | | | 10,065 | |
SkyWest, Inc. | | | 281 | | | | 10,355 | |
United Continental Holdings, Inc. (a) | | | 1,754 | | | | 120,938 | |
| | | | | | | | |
| | | | | 161,979 | |
Auto Components — 0.2% | |
American Axle & Manufacturing Holdings, Inc. (a) | | | 337 | | | | 5,277 | |
BorgWarner, Inc. | | | 91 | | | | 3,240 | |
Lear Corp. | | | 53 | | | | 6,864 | |
Tenneco, Inc. (a) | | | 718 | | | | 42,326 | |
| | | | | | | | |
| | | | | 57,707 | |
Automobiles — 0.6% | |
Ford Motor Co. | | | 11,650 | | | | 139,334 | |
Banks — 7.2% | |
Ameris Bancorp | | | 151 | | | | 6,772 | |
Bank of America Corp. | | | 9,247 | | | | 195,297 | |
Bank of Hawaii Corp. | | | 632 | | | | 52,690 | |
Banner Corp. | | | 430 | | | | 22,416 | |
Chemical Financial Corp. | | | 308 | | | | 15,979 | |
CIT Group, Inc. | | | 491 | | | | 20,057 | |
Citigroup, Inc. | | | 4,607 | | | | 259,789 | |
Citizens Financial Group, Inc. | | | 1,743 | | | | 58,408 | |
CoBiz Financial, Inc. | | | 360 | | | | 5,447 | |
Enterprise Financial Services Corp. | | | 324 | | | | 12,442 | |
FCB Financial Holdings, Inc., Class A (a) | | | 278 | | | | 12,301 | |
First Horizon National Corp. | | | 332 | | | | 6,335 | |
First Interstate Bancsystem, Inc. | | | 1,284 | | | | 48,471 | |
First Merchants Corp. | | | 100 | | | | 3,433 | |
First Republic Bank | | | 611 | | | | 50,041 | |
Glacier Bancorp, Inc. | | | 996 | | | | 34,163 | |
JPMorgan Chase & Co. | | | 5,276 | | | | 422,977 | |
MutualFirst Financial, Inc. | | | 176 | | | | 5,236 | |
Sandy Spring Bancorp, Inc. | | | 96 | | | | 3,494 | |
SVB Financial Group (a) | | | 94 | | | | 14,855 | |
United Community Banks, Inc. | | | 2,269 | | | | 61,671 | |
Webster Financial Corp. | | | 1,066 | | | | 52,884 | |
Wells Fargo & Co. | | | 4,760 | | | | 251,899 | |
Wintrust Financial Corp. | | | 1,842 | | | | 121,277 | |
| | | | | | | | |
| | | | | 1,738,334 | |
Beverages — 2.2% | |
Coca-Cola European Partners PLC | | | 1,037 | | | | 33,661 | |
Dr. Pepper Snapple Group, Inc. | | | 2,529 | | | | 219,366 | |
Monster Beverage Corp. (a) | | | 3,243 | | | | 145,124 | |
PepsiCo, Inc. | | | 1,236 | | | | 123,724 | |
| | | | | | | | |
| Common Stocks | | Shares | | | Value | |
Beverages (continued) | |
Primo Water Corp. (a) | | | 669 | | | $ | 8,603 | |
| | | | | | | | |
| | | | | 530,478 | |
Biotechnology — 3.5% | |
AbbVie, Inc. | | | 2,307 | | | | 140,266 | |
Alder Biopharmaceuticals, Inc. (a) | | | 244 | | | | 5,746 | |
Alkermes PLC (a) | | | 51 | | | | 2,898 | |
AMAG Pharmaceuticals, Inc. (a) | | | 284 | | | | 9,429 | |
Amgen, Inc. | | | 645 | | | | 92,925 | |
Biogen, Inc. (a) | | | 326 | | | | 95,867 | |
Celgene Corp. (a) | | | 1,078 | | | | 127,754 | |
Exelixis, Inc. (a) | | | 1,488 | | | | 25,177 | |
FibroGen, Inc. (a) | | | 228 | | | | 5,050 | |
Gilead Sciences, Inc. | | | 1,925 | | | | 141,872 | |
Halozyme Therapeutics, Inc. (a) | | | 2,158 | | | | 25,486 | |
Incyte Corp. (a) | | | 401 | | | | 41,018 | |
Innoviva, Inc. (a) | | | 2,308 | | | | 23,865 | |
Kindred Biosciences, Inc. (a) | | | 1,062 | | | | 4,514 | |
Puma Biotechnology, Inc. (a) | | | 265 | | | | 11,408 | |
Regeneron Pharmaceuticals, Inc. (a) | | | 166 | | | | 62,954 | |
Rigel Pharmaceuticals, Inc. (a) | | | 2,669 | | | | 6,939 | |
Sangamo Biosciences, Inc. (a) | | | 1,094 | | | | 3,501 | |
Seattle Genetics, Inc. (a) | | | 65 | | | | 4,213 | |
United Therapeutics Corp. (a) | | | 22 | | | | 2,763 | |
Vertex Pharmaceuticals, Inc. (a) | | | 59 | | | | 4,815 | |
| | | | | | | | |
| | | | | 838,460 | |
Building Products — 0.0% | |
Owens Corning | | | 78 | | | | 4,008 | |
Capital Markets — 1.7% | |
Ameriprise Financial, Inc. | | | 536 | | | | 61,217 | |
Charles Schwab Corp. | | | 537 | | | | 20,760 | |
CME Group, Inc. | | | 563 | | | | 63,568 | |
Donnelley Financial Solutions, Inc. (a) | | | 579 | | | | 11,042 | |
Evercore Partners, Inc., Class A | | | 1,599 | | | | 107,773 | |
Franklin Resources, Inc. | | | 1,399 | | | | 54,925 | |
Houlihan Lokey, Inc. | | | 715 | | | | 20,370 | |
Invesco Ltd. | | | 1,199 | | | | 37,541 | |
Janus Capital Group, Inc. | | | 147 | | | | 1,984 | |
Piper Jaffray Cos. (a) | | | 116 | | | | 8,462 | |
T. Rowe Price Group, Inc. | | | 262 | | | | 19,404 | |
| | | | | | | | |
| | | | | 407,046 | |
Chemicals — 2.7% | |
Chemtura Corp. (a) | | | 64 | | | | 2,109 | |
Dow Chemical Co. | | | 4,635 | | | | 258,262 | |
Ecolab, Inc. | | | 1,919 | | | | 224,005 | |
FMC Corp. | | | 474 | | | | 26,601 | |
Monsanto Co. | | | 147 | | | | 15,098 | |
Stepan Co. | | | 502 | | | | 40,747 | |
Trinseo SA | | | 392 | | | | 22,952 | |
Valspar Corp. | | | 78 | | | | 7,963 | |
WR Grace & Co. | | | 767 | | | | 50,054 | |
| | | | | | | | |
| | | | | 647,791 | |
Commercial Services & Supplies — 1.1% | |
ABM Industries, Inc. | | | 1,495 | | | | 65,780 | |
ACCO Brands Corp. (a) | | | 4,365 | | | | 54,344 | |
InnerWorkings, Inc. (a) | | | 275 | | | | 2,544 | |
Knoll, Inc. | | | 438 | | | | 11,612 | |
See Notes to Financial Statements.
| | | | | | |
| | | | | | | |
| | BLACKROCK FUNDS | | NOVEMBER 30, 2016 | | 15 |
| | |
Schedule of Investments (continued) | | BlackRock Impact U.S. Equity Fund |
| | | | | | | | |
| Common Stocks | | Shares | | | Value | |
Commercial Services & Supplies (continued) | |
Steelcase, Inc., Class A | | | 5,331 | | | $ | 82,897 | |
Tetra Tech, Inc. | | | 932 | | | | 39,936 | |
| | | | | | | | |
| | | | | 257,113 | |
Communications Equipment — 1.2% | |
Ciena Corp. (a) | | | 1,046 | | | | 22,437 | |
Cisco Systems, Inc. | | | 6,743 | | | | 201,076 | |
CommScope Holding Co., Inc. (a) | | | 233 | | | | 8,383 | |
Harris Corp. | | | 114 | | | | 11,806 | |
Ubiquiti Networks, Inc. (a) | | | 678 | | | | 37,941 | |
| | | | | | | | |
| | | | | 281,643 | |
Construction & Engineering — 0.1% | |
MasTec, Inc. (a) | | | 426 | | | | 16,167 | |
Construction Materials — 0.2% | |
Vulcan Materials Co. | | | 342 | | | | 42,972 | |
Consumer Finance — 1.2% | |
Ally Financial, Inc. | | | 357 | | | | 6,933 | |
American Express Co. | | | 1,013 | | | | 72,977 | |
Capital One Financial Corp. | | | 1,315 | | | | 110,513 | |
Credit Acceptance Corp. (a) | | | 37 | | | | 7,098 | |
Discover Financial Services | | | 324 | | | | 21,957 | |
Enova International, Inc. (a) | | | 679 | | | | 7,910 | |
Synchrony Financial | | | 1,948 | | | | 67,323 | |
| | | | | | | | |
| | | | | 294,711 | |
Containers & Packaging — 0.2% | |
Avery Dennison Corp. | | | 196 | | | | 14,124 | |
Bemis Co., Inc. | | | 626 | | | | 31,344 | |
| | | | | | | | |
| | | | | 45,468 | |
Diversified Consumer Services — 0.1% | |
Regis Corp. (a) | | | 1,635 | | | | 22,072 | |
ServiceMaster Global Holdings, Inc. (a) | | | 113 | | | | 4,319 | |
| | | | | | | | |
| | | | | 26,391 | |
Diversified Financial Services — 1.0% | |
Berkshire Hathaway, Inc., Class B (a) | | | 1,447 | | | | 227,816 | |
Intercontinental Exchange, Inc. | | | 110 | | | | 6,094 | |
MarketAxess Holdings, Inc. | | | 30 | | | | 4,973 | |
Voya Financial, Inc. | | | 72 | | | | 2,798 | |
| | | | | | | | |
| | | | | 241,681 | |
Diversified Telecommunication Services — 1.2% | |
AT&T, Inc. | | | 3,654 | | | | 141,154 | |
Cogent Communications Group, Inc. | | | 60 | | | | 2,247 | |
IDT Corp., Class B | | | 948 | | | | 20,069 | |
Verizon Communications, Inc. | | | 2,276 | | | | 113,572 | |
Zayo Group Holdings, Inc. (a) | | | 163 | | | | 5,624 | |
| | | | | | | | |
| | | | | 282,666 | |
Electric Utilities — 0.9% | |
NextEra Energy, Inc. | | | 1,925 | | | | 219,893 | |
Electrical Equipment — 0.5% | |
Eaton Corp. PLC | | | 321 | | | | 21,350 | |
Emerson Electric Co. | | | 1,990 | | | | 112,315 | |
| | | | | | | | |
| | | | | 133,665 | |
Electronic Equipment, Instruments & Components — 0.4% | |
Corning, Inc. | | | 914 | | | | 21,964 | |
Ingram Micro, Inc., Class A | | | 148 | | | | 5,541 | |
| | | | | | | | |
| Common Stocks | | Shares | | | Value | |
Electronic Equipment, Instruments & Components (continued) | |
SYNNEX Corp. | | | 566 | | | $ | 66,171 | |
| | | | | | | | |
| | | | | 93,676 | |
Energy Equipment & Services — 1.2% | |
Baker Hughes, Inc. | | | 1,332 | | | | 85,688 | |
Diamond Offshore Drilling, Inc. | | | 389 | | | | 7,025 | |
Ensco PLC, Class A | | | 4,972 | | | | 48,029 | |
Helix Energy Solutions Group, Inc. (a) | | | 584 | | | | 6,103 | |
Mammoth Energy Services, Inc. (a) | | | 584 | | | | 9,362 | |
Matrix Service Co. (a) | | | 349 | | | | 7,277 | |
Noble Corp. PLC | | | 735 | | | | 4,572 | |
Schlumberger Ltd. | | | 1,178 | | | | 99,011 | |
Superior Energy Services, Inc. | | | 334 | | | | 5,758 | |
Unit Corp. (a) | | | 693 | | | | 16,840 | |
Weatherford International PLC (a) | | | 586 | | | | 2,994 | |
| | | | | | | | |
| | | | | 292,659 | |
Food & Staples Retailing — 2.0% | |
Costco Wholesale Corp. | | | 903 | | | | 135,549 | |
CVS Health Corp. | | | 1,731 | | | | 133,097 | |
Kroger Co. | | | 708 | | | | 22,868 | |
Performance Food Group Co. (a) | | | 633 | | | | 13,356 | |
U.S. Foods Holding Corp. (a) | | | 84 | | | | 1,920 | |
Wal-Mart Stores, Inc. | | | 2,080 | | | | 146,495 | |
Walgreens Boots Alliance, Inc. | | | 385 | | | | 32,621 | |
| | | | | | | | |
| | | | | 485,906 | |
Food Products — 1.6% | |
Archer-Daniels-Midland Co. | | | 3,314 | | | | 143,264 | |
B&G Foods, Inc. | | | 146 | | | | 6,249 | |
Cal-Maine Foods, Inc. (b) | | | 583 | | | | 23,728 | |
Dean Foods Co. | | | 340 | | | | 6,752 | |
J.M. Smucker Co. | | | 532 | | | | 67,006 | |
Lancaster Colony Corp. | | | 328 | | | | 44,447 | |
McCormick & Co., Inc. | | | 387 | | | | 35,295 | |
Pinnacle Foods, Inc. | | | 265 | | | | 13,133 | |
Post Holdings, Inc. (a) | | | 361 | | | | 27,555 | |
WhiteWave Foods Co. (a) | | | 226 | | | | 12,450 | |
| | | | | | | | |
| | | | | 379,879 | |
Gas Utilities — 0.7% | |
Southwest Gas Corp. | | | 2,356 | | | | 174,650 | |
Health Care Equipment & Supplies — 2.6% | |
Align Technology, Inc. (a) | | | 534 | | | | 49,689 | |
Anika Therapeutics, Inc. (a) | | | 407 | | | | 18,991 | |
Baxter International, Inc. | | | 100 | | | | 4,437 | |
Boston Scientific Corp. (a) | | | 3,401 | | | | 69,584 | |
Cantel Medical Corp. | | | 235 | | | | 19,169 | |
Cutera, Inc. (a) | | | 533 | | | | 8,715 | |
Edwards Lifesciences Corp. (a) | | | 262 | | | | 21,707 | |
Hologic, Inc. (a) | | | 2,439 | | | | 93,365 | |
Medtronic PLC | | | 4,146 | | | | 302,699 | |
NxStage Medical, Inc. (a) | | | 420 | | | | 10,382 | |
St. Jude Medical, Inc. | | | 289 | | | | 22,889 | |
| | | | | | | | |
| | | | | 621,627 | |
Health Care Providers & Services — 2.4% | |
AmerisourceBergen Corp. | | | 514 | | | | 40,087 | |
Anthem, Inc. | | | 406 | | | | 57,867 | |
Cardinal Health, Inc. | | | 1,521 | | | | 108,006 | |
Express Scripts Holding Co. (a) | | | 44 | | | | 3,339 | |
See Notes to Financial Statements.
| | | | | | |
| | | | | | | |
| 16 | | BLACKROCK FUNDS | | NOVEMBER 30, 2016 | | |
| | |
Schedule of Investments (continued) | | BlackRock Impact U.S. Equity Fund |
| | | | | | | | |
| Common Stocks | | Shares | | | Value | |
Health Care Providers & Services (continued) | |
Henry Schein, Inc. (a) | | | 142 | | | $ | 21,152 | |
Humana, Inc. | | | 203 | | | | 43,166 | |
McKesson Corp. | | | 254 | | | | 36,528 | |
UnitedHealth Group, Inc. | | | 1,214 | | | | 192,200 | |
VCA, Inc. (a) | | | 1,255 | | | | 78,563 | |
| | | | | | | | |
| | | | | 580,908 | |
Hotels, Restaurants & Leisure — 1.3% | |
Aramark | | | 195 | | | | 6,710 | |
Brinker International, Inc. | | | 561 | | | | 29,795 | |
Cheesecake Factory, Inc. | | | 774 | | | | 45,797 | |
Domino’s Pizza, Inc. | | | 92 | | | | 15,459 | |
J Alexander’s Holdings, Inc. (a) | | | 1,454 | | | | 13,813 | |
Marriott International, Inc., Class A | | | 1 | | | | 79 | |
Papa John’s International, Inc. | | | 77 | | | | 6,804 | |
Ruth’s Hospitality Group, Inc. | | | 1,006 | | | | 17,102 | |
Texas Roadhouse, Inc. | | | 920 | | | | 43,139 | |
Vail Resorts, Inc. | | | 742 | | | | 117,533 | |
Yum China Holdings, Inc. (a) | | | 718 | | | | 20,190 | |
| | | | | | | | |
| | | | | 316,421 | |
Household Durables — 0.6% | |
Harman International Industries, Inc. | | | 57 | | | | 6,234 | |
iRobot Corp. (a) | | | 940 | | | | 53,580 | |
Whirlpool Corp. | | | 548 | | | | 89,017 | |
| | | | | | | | |
| | | | | 148,831 | |
Household Products — 2.8% | |
Clorox Co. | | | 1,369 | | | | 158,202 | |
Kimberly-Clark Corp. | | | 700 | | | | 80,927 | |
Procter & Gamble Co. | | | 5,286 | | | | 435,883 | |
| | | | | | | | |
| | | | | 675,012 | |
Independent Power and Renewable Electricity Producers — 0.3% | |
NRG Energy, Inc. | | | 2,557 | | | | 28,996 | |
Ormat Technologies, Inc. | | | 820 | | | | 39,221 | |
| | | | | | | | |
| | | | | 68,217 | |
Industrial Conglomerates — 2.3% | |
Danaher Corp. | | | 760 | | | | 59,409 | |
General Electric Co. | | | 16,549 | | | | 509,047 | |
| | | | | | | | |
| | | | | 568,456 | |
Insurance — 3.1% | |
Aflac, Inc. | | | 767 | | | | 54,749 | |
Allstate Corp. | | | 632 | | | | 44,189 | |
Argo Group International Holdings Ltd. | | | 917 | | | | 58,184 | |
Assured Guaranty Ltd. | | | 291 | | | | 10,406 | |
CNO Financial Group, Inc. | | | 492 | | | | 8,807 | |
Endurance Specialty Holdings Ltd. | | | 65 | | | | 5,993 | |
First American Financial Corp. | | | 253 | | | | 9,548 | |
FNF Group | | | 486 | | | | 15,523 | |
Hanover Insurance Group, Inc. | | | 1,158 | | | | 100,271 | |
Loews Corp. | | | 883 | | | | 39,426 | |
Marsh & McLennan Cos., Inc. | | | 961 | | | | 66,607 | |
MetLife, Inc. | | | 1,003 | | | | 55,175 | |
Progressive Corp. | | | 724 | | | | 24,109 | |
Prudential Financial, Inc. | | | 922 | | | | 92,753 | |
Reinsurance Group of America, Inc. | | | 681 | | | | 83,116 | |
Selective Insurance Group, Inc. | | | 55 | | | | 2,261 | |
Travelers Cos., Inc. | | | 683 | | | | 77,418 | |
United Insurance Holdings Corp. | | | 162 | | | | 2,200 | |
| | | | | | | | |
| Common Stocks | | Shares | | | Value | |
Insurance (continued) | |
W.R. Berkley Corp. | | | 91 | | | $ | 5,623 | |
| | | | | | | | |
| | | | | 756,358 | |
Internet & Direct Marketing Retail — 2.0% | |
Amazon.com, Inc. (a) | | | 429 | | | | 321,994 | |
Expedia, Inc. | | | 191 | | | | 23,694 | |
Liberty Interactive Corp QVC Group, Series A (a) | | | 1,754 | | | | 36,325 | |
Liberty TripAdvisor Holdings, Inc., Series A (a) | | | 240 | | | | 3,852 | |
Netflix, Inc. (a) | | | 547 | | | | 63,999 | |
Priceline Group, Inc. (a) | | | 19 | | | | 28,570 | |
| | | | | | | | |
| | | | | | | | 478,434 | |
Internet Software & Services — 3.2% | |
Alphabet, Inc., Class A (a) | | | 262 | | | | 203,281 | |
Alphabet, Inc., Class C (a) | | | 308 | | | | 233,476 | |
EarthLink Holdings Corp. | | | 3,467 | | | | 18,306 | |
Facebook, Inc., Class A (a) | | | 1,839 | | | | 217,774 | |
j2 Global, Inc. | | | 286 | | | | 21,024 | |
LogMeIn, Inc. | | | 452 | | | | 45,584 | |
VeriSign, Inc. (a) | | | 373 | | | | 29,411 | |
Wix.com Ltd. (a) | | | 171 | | | | 8,465 | |
XO Group, Inc. (a) | | | 311 | | | | 5,747 | |
Yandex NV, Class A (a) | | | 109 | | | | 2,072 | |
| | | | | | | | |
| | | | | | | | 785,140 | |
IT Services — 3.8% | |
Accenture PLC, Class A | | | 1,189 | | | | 142,002 | |
Alliance Data Systems Corp. | | | 95 | | | | 21,734 | |
Amdocs Ltd. | | | 465 | | | | 27,421 | |
Automatic Data Processing, Inc. | | | 1,112 | | | | 106,774 | |
Booz Allen Hamilton Holding Corp. | | | 1,887 | | | | 71,347 | |
CSG Systems International, Inc. | | | 472 | | | | 21,004 | |
CSRA, Inc. | | | 184 | | | | 5,890 | |
Euronet Worldwide, Inc. (a) | | | 772 | | | | 55,368 | |
Fidelity National Information Services, Inc. | | | 260 | | | | 20,069 | |
First Data Corp., Class A (a) | | | 583 | | | | 8,494 | |
Fiserv, Inc. (a) | | | 906 | | | | 94,786 | |
Forrester Research, Inc. | | | 1,679 | | | | 68,671 | |
Gartner, Inc. (a) | | | 257 | | | | 26,425 | |
Hackett Group, Inc. | | | 2,435 | | | | 43,246 | |
International Business Machines Corp. | | | 459 | | | | 74,459 | |
Paychex, Inc. | | | 1,882 | | | | 110,944 | |
PayPal Holdings, Inc. (a) | | | 763 | | | | 29,971 | |
Vantiv, Inc., Class A (a) | | | 67 | | | | 3,781 | |
| | | | | | | | |
| | | | | | | | 932,386 | |
Leisure Products — 0.9% | |
Brunswick Corp. | | | 2,889 | | | | 144,797 | |
Callaway Golf Co. | | | 2,797 | | | | 33,983 | |
Hasbro, Inc. | | | 507 | | | | 43,293 | |
| | | | | | | | |
| | | | | | | | 222,073 | |
Life Sciences Tools & Services — 0.3% | |
Medpace Holdings, Inc. (a) | | | 134 | | | | 4,781 | |
NanoString Technologies, Inc. (a) | | | 935 | | | | 20,570 | |
PRA Health Sciences, Inc. (a) | | | 614 | | | | 32,984 | |
Waters Corp. (a) | | | 123 | | | | 16,552 | |
| | | | | | | | |
| | | | | | | | 74,887 | |
Machinery — 3.3% | |
Briggs & Stratton Corp. | | | 249 | | | | 5,159 | |
Caterpillar, Inc. | | | 614 | | | | 58,674 | |
See Notes to Financial Statements.
| | | | | | |
| | | | | | | |
| | BLACKROCK FUNDS | | NOVEMBER 30, 2016 | | 17 |
| | |
Schedule of Investments (continued) | | BlackRock Impact U.S. Equity Fund |
| | | | | | | | |
| Common Stocks | | Shares | | | Value | |
Machinery (continued) | |
Cummins, Inc. | | | 234 | | | $ | 33,177 | |
Deere & Co. | | | 697 | | | | 69,839 | |
Illinois Tool Works, Inc. | | | 2,058 | | | | 257,620 | |
Ingersoll-Rand PLC | | | 3,177 | | | | 236,814 | |
Joy Global, Inc. | | | 97 | | | | 2,719 | |
Mueller Water Products, Inc., Series A | | | 481 | | | | 6,364 | |
Oshkosh Corp. | | | 121 | | | | 8,470 | |
PACCAR, Inc. | | | 2,134 | | | | 132,628 | |
| | | | | | | | |
| | | | | | | | 811,464 | |
Media — 3.2% | |
AMC Networks, Inc., Class A (a) | | | 1,026 | | | | 56,687 | |
CBS Corp., Class B | | | 1,643 | | | | 99,763 | |
Comcast Corp., Class A | | | 1,740 | | | | 120,947 | |
Discovery Communications, Inc., Class A (a) | | | 847 | | | | 22,945 | |
Discovery Communications, Inc., Class C (a) | | | 243 | | | | 6,425 | |
Entercom Communications Corp., Class A | | | 495 | | | | 7,524 | |
Gray Television, Inc. (a) | | | 533 | | | | 5,383 | |
New Media Investment Group, Inc. | | | 346 | | | | 5,315 | |
Omnicom Group, Inc. | | | 740 | | | | 64,336 | |
Scripps Networks Interactive, Inc., Class A | | | 431 | | | | 29,851 | |
Time Warner, Inc. | | | 1,610 | | | | 147,830 | |
Walt Disney Co. | | | 2,132 | | | | 211,324 | |
| | | | | | | | |
| | | | | | | | 778,330 | |
Metals & Mining — 0.6% | |
Arconic, Inc. | | | 286 | | | | 5,514 | |
Freeport-McMoRan, Inc. | | | 2,436 | | | | 37,393 | |
Hecla Mining Co. | | | 718 | | | | 4,365 | |
Royal Gold, Inc. | | | 143 | | | | 9,959 | |
Schnitzer Steel Industries, Inc., Class A | | | 290 | | | | 8,091 | |
Steel Dynamics, Inc. | | | 475 | | | | 16,853 | |
Worthington Industries, Inc. | | | 983 | | | | 55,323 | |
| | | | | | | | |
| | | | | | | | 137,498 | |
Multi-Utilities — 1.6% | |
Consolidated Edison, Inc. | | | 3,310 | | | | 230,939 | |
PG&E Corp. | | | 2,775 | | | | 163,170 | |
| | | | | | | | |
| | | | | | | | 394,109 | |
Multiline Retail — 0.8% | |
Burlington Stores, Inc. (a) | | | 264 | | | | 23,211 | |
Kohl’s Corp. | | | 877 | | | | 47,209 | |
Nordstrom, Inc. | | | 419 | | | | 23,430 | |
Target Corp. | | | 1,150 | | | | 88,826 | |
| | | | | | | | |
| | | | | | | | 182,676 | |
Oil, Gas & Consumable Fuels — 5.3% | |
Anadarko Petroleum Corp. | | | 429 | | | | 29,665 | |
Antero Resources Corp. (a) | | | 689 | | | | 16,874 | |
Apache Corp. | | | 311 | | | | 20,510 | |
Bill Barrett Corp. (a) | | | 711 | | | | 5,560 | |
Chevron Corp. | | | 1,870 | | | | 208,617 | |
Concho Resources, Inc. (a) | | | 667 | | | | 95,394 | |
ConocoPhillips | | | 2,572 | | | | 124,793 | |
Devon Energy Corp. | | | 1,190 | | | | 57,513 | |
EP Energy Corp., Class A (a) | | | 2,874 | | | | 15,261 | |
Exxon Mobil Corp. | | | 2,354 | | | | 205,504 | |
Gulfport Energy Corp. (a) | | | 894 | | | | 22,967 | |
Kinder Morgan, Inc. | | | 852 | | | | 18,914 | |
Laredo Petroleum, Inc. (a) | | | 241 | | | | 3,854 | |
Marathon Petroleum Corp. | | | 842 | | | | 39,591 | |
| | | | | | | | |
| Common Stocks | | Shares | | | Value | |
Oil, Gas & Consumable Fuels (continued) | |
Newfield Exploration Co. (a) | | | 607 | | | $ | 27,449 | |
Oasis Petroleum, Inc. (a) | | | 294 | | | | 4,401 | |
Occidental Petroleum Corp. | | | 580 | | | | 41,389 | |
Phillips 66 | | | 2,739 | | | | 227,556 | |
SM Energy Co. | | | 625 | | | | 24,913 | |
Spectra Energy Corp. | | | 305 | | | | 12,490 | |
Valero Energy Corp. | | | 1,340 | | | | 82,490 | |
| | | | | | | | |
| | | | | | | | 1,285,705 | |
Paper & Forest Products — 0.1% | |
Boise Cascade Co. (a) | | | 841 | | | | 19,175 | |
Domtar Corp. | | | 150 | | | | 5,890 | |
Louisiana-Pacific Corp. (a) | | | 196 | | | | 3,791 | |
| | | | | | | | |
| | | | | | | | 28,856 | |
Personal Products — 0.0% | |
Avon Products, Inc. | | | 1,243 | | | | 6,675 | |
Herbalife Ltd. (a) | | | 67 | | | | 3,285 | |
| | | | | | | | |
| | | | | | | | 9,960 | |
Pharmaceuticals — 4.5% | |
Allergan PLC (a) | | | 158 | | | | 30,699 | |
Amphastar Pharmaceuticals, Inc. (a) | | | 955 | | | | 19,358 | |
Bristol-Myers Squibb Co. | | | 1,212 | | | | 68,405 | |
Catalent, Inc. (a) | | | 204 | | | | 4,882 | |
Corcept Therapeutics, Inc. (a) | | | 1,165 | | | | 9,774 | |
Eli Lilly & Co. | | | 1,666 | | | | 111,822 | |
Johnson & Johnson | | | 2,676 | | | | 297,839 | |
Mallinckrodt PLC (a) | | | 530 | | | | 27,931 | |
Merck & Co., Inc. | | | 292 | | | | 17,867 | |
Nektar Therapeutics (a) | | | 2,189 | | | | 26,892 | |
Pfizer, Inc. | | | 7,555 | | | | 242,818 | |
Prestige Brands Holdings, Inc. (a) | | | 2,603 | | | | 123,825 | |
Zoetis, Inc. | | | 1,998 | | | | 100,659 | |
| | | | | | | | |
| | | | | | | | 1,082,771 | |
Professional Services — 0.3% | |
ManpowerGroup, Inc. | | | 914 | | | | 78,065 | |
Real Estate Investment Trusts (REITs) — 4.2% | |
American Tower Corp. | | | 667 | | | | 68,214 | |
Apartment Investment & Management Co., Class A | | | 1,521 | | | | 64,034 | |
Arbor Realty Trust, Inc. | | | 1,686 | | | | 12,561 | |
Ares Commercial Real Estate Corp. | | | 927 | | | | 12,542 | |
Ashford Hospitality Trust, Inc. | | | 483 | | | | 3,395 | |
Brandywine Realty Trust | | | 1,113 | | | | 17,085 | |
Crown Castle International Corp. | | | 1,462 | | | | 122,018 | |
DCT Industrial Trust, Inc. | | | 1,503 | | | | 69,063 | |
DDR Corp. | | | 1,826 | | | | 27,792 | |
Equinix, Inc. | | | 322 | | | | 109,081 | |
Extra Space Storage, Inc. | | | 119 | | | | 8,349 | |
FelCor Lodging Trust, Inc. | | | 1,492 | | | | 10,832 | |
Hudson Pacific Properties, Inc. | | | 223 | | | | 7,776 | |
Invesco Mortgage Capital, Inc. | | | 156 | | | | 2,324 | |
National Storage Affiliates Trust | | | 1,163 | | | | 23,934 | |
Post Properties, Inc. | | | 303 | | | | 19,701 | |
Prologis, Inc. | | | 3,772 | | | | 191,995 | |
Realty Income Corp. | | | 388 | | | | 21,511 | |
Regency Centers Corp. | | | 108 | | | | 7,219 | |
Summit Hotel Properties, Inc. | | | 636 | | | | 9,044 | |
UDR, Inc. | | | 971 | | | | 33,053 | |
See Notes to Financial Statements.
| | | | | | |
| | | | | | | |
| 18 | | BLACKROCK FUNDS | | NOVEMBER 30, 2016 | | |
| | |
Schedule of Investments (continued) | | BlackRock Impact U.S. Equity Fund |
| | | | | | | | |
| Common Stocks | | Shares | | | Value | |
Real Estate Investment Trusts (REITs) (continued) | |
Welltower, Inc. | | | 2,620 | | | $ | 164,484 | |
| | | | | | | | |
| | | | | | | | 1,006,007 | |
Real Estate Management & Development — 0.2% | |
Realogy Holdings Corp. | | | 1,819 | | | | 43,929 | |
Road & Rail — 0.8% | |
ArcBest Corp. | | | 1,141 | | | | 34,743 | |
Old Dominion Freight Line, Inc. (a) | | | 779 | | | | 68,007 | |
Ryder System, Inc. | | | 1,044 | | | | 81,745 | |
| | | | | | | | |
| | | | | | | | 184,495 | |
Semiconductors & Semiconductor Equipment — 3.9% | |
Analog Devices, Inc. | | | 933 | | | | 69,266 | |
Applied Materials, Inc. | | | 3,543 | | | | 114,085 | |
Entegris, Inc. (a) | | | 4,145 | | | | 74,403 | |
Intel Corp. | | | 4,758 | | | | 165,102 | |
Micron Technology, Inc. (a) | | | 237 | | | | 4,629 | |
NVIDIA Corp. | | | 727 | | | | 67,029 | |
QUALCOMM, Inc. | | | 373 | | | | 25,412 | |
Texas Instruments, Inc. | | | 3,912 | | | | 289,214 | |
Xilinx, Inc. | | | 2,761 | | | | 149,039 | |
| | | | | | | | |
| | | | | | | | 958,179 | |
Software — 4.4% | |
Cadence Design Systems, Inc. (a) | | | 2,454 | | | | 64,491 | |
Dell Technologies, Inc., Class V (a) | | | 1 | | | | 54 | |
Guidewire Software, Inc. (a) | | | 494 | | | | 27,521 | |
Imperva, Inc. (a) | | | 188 | | | | 7,172 | |
Microsoft Corp. | | | 11,475 | | | | 691,483 | |
Qualys, Inc. (a) | | | 231 | | | | 7,669 | |
Red Hat, Inc. (a) | | | 874 | | | | 69,142 | |
salesforce.com, Inc. (a) | | | 1,020 | | | | 73,440 | |
Silver Spring Networks, Inc. (a) | | | 744 | | | | 10,379 | |
Take-Two Interactive Software, Inc. (a) | | | 1,646 | | | | 81,033 | |
VMware, Inc., Class A (a) | | | 316 | | | | 25,640 | |
| | | | | | | | |
| | | | | | | | 1,058,024 | |
Specialty Retail — 2.6% | |
Aaron’s, Inc. | | | 63 | | | | 1,835 | |
Best Buy Co., Inc. | | | 741 | | | | 33,864 | |
Dick’s Sporting Goods, Inc. | | | 300 | | | | 17,721 | |
Home Depot, Inc. | | | 1,721 | | | | 222,697 | |
L Brands, Inc. | | | 284 | | | | 19,942 | |
Lithia Motors, Inc., Class A | | | 194 | | | | 17,829 | |
Lowe’s Cos., Inc. | | | 2,570 | | | | 181,314 | |
TJX Cos., Inc. | | | 1,050 | | | | 82,257 | |
Ulta Salon Cosmetics & Fragrance, Inc. (a) | | | 122 | | | | 31,659 | |
West Marine, Inc. (a) | | | 1,133 | | | | 10,899 | |
| | | | | | | | |
| | | | | | | | 620,017 | |
| Common Stocks | | Shares | | | Value | |
Technology Hardware, Storage & Peripherals — 3.3% | |
Apple, Inc. | | | 7,278 | | | $ | 804,365 | |
Hewlett Packard Enterprise Co. | | | 163 | | | | 3,879 | |
| | | | | | | | |
| | | | | | | | 808,244 | |
| | | | | | | | |
| Common Stocks | | Shares | | | Value | |
Textiles, Apparel & Luxury Goods — 0.1% | |
Coach, Inc. | | | 349 | | | $ | 12,700 | |
Oxford Industries, Inc. | | | 54 | | | | 3,924 | |
Under Armour, Inc., Class A (a) | | | 255 | | | | 7,854 | |
Under Armour, Inc., Class C (a) | | | 95 | | | | 2,449 | |
| | | | | | | | |
| | | | | | | | 26,927 | |
Thrifts & Mortgage Finance — 0.2% | |
Essent Group Ltd. (a) | | | 690 | | | | 21,059 | |
First Defiance Financial Corp. | | | 135 | | | | 6,249 | |
HomeStreet, Inc. (a) | | | 271 | | | | 7,872 | |
TFS Financial Corp. | | | 527 | | | | 9,818 | |
Walker & Dunlop, Inc. (a) | | | 133 | | | | 3,909 | |
| | | | | | | | |
| | | | | | | | 48,907 | |
Trading Companies & Distributors — 0.1% | |
Beacon Roofing Supply, Inc. (a) | | | 241 | | | | 11,180 | |
GMS, Inc. (a) | | | 695 | | | | 17,452 | |
MRC Global, Inc. (a) | | | 234 | | | | 4,710 | |
| | | | | | | | |
| | | | | | | | 33,342 | |
Transportation Infrastructure — 0.0% | |
Macquarie Infrastructure Corp. | | | 120 | | | | 9,833 | |
Wireless Telecommunication Services — 0.6% | |
SBA Communications Corp., Class A (a) | | | 1,151 | | | | 113,903 | |
Telephone & Data Systems, Inc. | | | 1,649 | | | | 44,408 | |
| | | | | | | | |
| | | | | | | | 158,311 | |
| Total Common Stocks — 99.4% | | | | | | | 24,076,718 | |
| | | | | | | | |
| | | | | | | | | |
| | |
| Rights — 0.0% | | | | | | |
Biotechnology — 0.0% | | | | | | | | |
Dyax Corp. | | | 64 | | | | 71 | |
Total Long-Term Investments
(Cost — $22,060,606) — 99.4% | | | | 24,076,489 | |
| | | | | | | | |
| | | | | | | | | |
|
| Short-Term Securities | |
BlackRock Liquidity Funds, T-Fund, Institutional Class, 0.25% (c)(d) | | | 160,235 | | | | 160,235 | |
SL Liquidity Series, LLC, Money Market Series, 0.65% (c)(d)(e) | | | 20,457 | | | | 20,461 | |
Total Short-Term Securities
(Cost — $180,694) — 0.7% | | | | 180,696 | |
| Total Investments (Cost — $22,241,300) — 100.1% | | | | 24,257,185 | |
Liabilities in Excess of Other Assets — (0.1)% | | | | | | | (17,701 | ) |
| | | | | | | | |
Net Assets — 100.0% | | | | | | $ | 24,239,484 | |
| | | | | | | | |
|
| Notes to Schedule of Investments |
| (a) | | Non-income producing security. |
| (b) | | Security, or a portion of security, is on loan. |
See Notes to Financial Statements.
| | | | | | |
| | | | | | | |
| | BLACKROCK FUNDS | | NOVEMBER 30, 2016 | | 19 |
| | |
Schedule of Investments (continued) | | BlackRock Impact U.S. Equity Fund |
| (c) | | During the six months ended November 30, 2016, investments in issuers considered to be affiliates of the Fund for purposes of Section 2(a)(3) of the Investment Company Act of 1940, as amended, were as follows: |
| | | | | | | | | | | | | | | | | | | | | | | | | | | | |
| Affiliate | | Shares Held
at May 31,
2016 | | | Shares Purchased | | | Shares
Sold | | | Shares Held
at November 30,
2016 | | | Value at
November 30,
2016 | | | Income | | | Realized
Loss | |
BlackRock Liquidity Funds, T-Fund, Institutional Class | | | — | | | | 160,235 | 1 | | | — | | | | 160,235 | | | $ | 160,235 | | | $ | 114 | | | | — | |
BlackRock Liquidity Funds, TempFund, Institutional Class | | | 168,630 | | | | — | | | | (168,630 | )2 | | | — | | | | — | | | | 136 | | | | — | |
SL Liquidity Series, LLC, Money Market Series | | | — | | | | 20,457 | 1 | | | — | | | | 20,457 | | | | 20,461 | | | | 819 | 3 | | | — | |
PNC Financial Services Group, Inc. | | | 25 | | | | — | | | | (25 | )2 | | | — | | | | — | | | | — | | | $ | (144 | ) |
Total | | | | | | | | | | | | | | | | | | $ | 180,696 | | | $ | 1,069 | | | $ | (144 | ) |
| | | | | | | | | | | | | | | | | | | | | | | | | | | | |
1 Represents net shares purchased. | |
2 Represents net shares sold. | |
3 Represents securities lending income earned from the reinvestments of cash collateral from loaned securities, net of fees and collateral investment expenses, and other payments to and from borrowers of securities. | |
| (d) | | Current yield as of period end. |
| (e) | | Security was purchased with the cash collateral from loaned securities. |
For Fund compliance purposes, the Fund’s sector classifications refer to one or more of the sector sub-classifications used by one or more widely recognized market indexes or rating group indexes, and/or as defined by the investment advisor. These definitions may not apply for purposes of this report, which may combine such sector sub-classifications for reporting ease.
| | | | | | | | |
| Derivative Financial Instruments Outstanding as of Period End | | | | | | | | |
| | | | | | | | | | | | |
| Futures Contracts | | | | | | |
Contracts
Long | | Issue | | Expiration | | Notional
Value | | | Unrealized
Appreciation | |
| 1 | | Russell 2000 E-Mini Index | | December 2016 | | $ | 132,230 | | | $ | 13,747 | |
|
| Derivative Financial Instruments Categorized by Risk Exposure |
As of period end, the fair values of derivative financial instruments located in the Statements of Assets and Liabilities were as follows:
| | | | | | | | | | | | | | | | | | | | | | | | | | | | | | | | | | |
| Assets — Derivative Financial Instruments | | Commodity
Contracts | | | Credit
Contracts | | | Equity
Contracts | | | Foreign
Currency
Exchange
Contracts | | | Interest
Rate
Contracts | | | Other
Contracts | | | Total | | | | |
Futures contracts | | Net unrealized appreciation1 | | | — | | | | — | | | $ | 13,747 | | | | — | | | | — | | | | — | | | $ | 13,747 | | | | | |
1 Includes cumulative appreciation (depreciation) on futures contracts, if any, as reported in the Schedule of Investments. Only current day’s variation margin is reported within the Statements of Assets and Liabilities. | |
For the six months ended November 30, 2016, the effect of derivative financial instruments in the Statements of Operations was as follows:
| | | | | | | | | | | | | | | | | | | | | | | | | | | | | | | | |
| Net Realized Gain (Loss) from: | | Commodity
Contracts | | | Credit
Contracts | | | Equity
Contracts | | | Foreign
Currency
Exchange
Contracts | | | Interest
Rate
Contracts | | | Other
Contracts | | | Total | | | | |
Futures contracts | | | — | | | | — | | | $ | 8,595 | | | | — | | | | — | | | | — | | | $ | 8,595 | | | | | |
| Net Change in Unrealized Appreciation (Depreciation) on: | |
Futures contracts | | | — | | | | — | | | $ | 7,810 | | | | — | | | | — | | | | — | | | $ | 7,810 | | | | | |
See Notes to Financial Statements.
| | | | | | |
| | | | | | | |
| 20 | | BLACKROCK FUNDS | | NOVEMBER 30, 2016 | | |
| | |
Schedule of Investments (concluded) | | BlackRock Impact U.S. Equity Fund |
| | | | |
| Average Quarterly Balances of Outstanding Derivative Financial Instruments | | | |
| | | | |
| Futures contracts: | | | | |
Average notional value of contracts — long | | $ | 128,055 | |
For more information about the Fund’s investment risks regarding derivative financial instruments, refer to the Notes to Financial Statements.
|
| Fair Value Hierarchy as of Period End |
Various inputs are used in determining the fair value of investments and derivative financial instruments. For information about the Fund’s policy regarding valuation of investments and derivative financial instruments, refer to the Notes to Financial Statements.
The following tables summarize the Fund’s investments and derivative financial instruments categorized in the disclosure hierarchy:
| | | | | | | | | | | | | | | | |
| | | Level 1 | | | Level 2 | | | Level 3 | | | Total | |
Assets: | | | | | | | | | | | | | | | | |
| Investments:1 | | | | | | | | | | | | | | | | |
Common Stocks | | $ | 24,076,418 | | | | — | | | | — | | | $ | 24,076,418 | |
Rights | | | — | | | | — | | | $ | 71 | | | | 71 | |
Short-Term Securities | | | 160,235 | | | | — | | | | — | | | | 160,235 | |
| | | | |
Subtotal | | $ | 24,236,653 | | | | — | | | $ | 71 | | | $ | 24,236,724 | |
| | | | |
Investments Valued at NAV2 | | | | | | | | | | | | | | | 20,461 | |
| | | | | | | | | | | | | | | | |
Total Investments | | | | | | | | | | | | | | $ | 24,257,185 | |
| | | | | | | | | | | | | | | | |
| | | | | | | | | | | | | | | | |
| Derivative Financial Instruments3 | | | | | | | | | | | | | | | | |
Assets: | | | | | | | | | | | | | | | | |
Equity contracts | | $ | 13,747 | | | | — | | | | — | | | $ | 13,747 | |
1 See above Schedule of Investments for values in each sector. | |
2 As of November 30, 2016, certain of the Fund’s investments were valued using NAV per share (or its equivalent) as no quoted market value is available and have been excluded from the fair value hierarchy. | |
3 Derivative financial instruments are futures contracts. Futures contracts are valued at the unrealized appreciation (depreciation) on the instrument. | |
|
| The Fund may hold assets and/or liabilities in which the fair value approximates the carrying amount for financial statement purposes. As of period end, such assets and/or liabilities are categorized within the disclosure hierarchy as follows: | |
| | | Level 1 | | | Level 2 | | | Level 3 | | | Total | |
Assets: | | | | | | | | | | | | | | | | |
Cash pledged for futures contracts | | $ | 6,000 | | | | — | | | | — | | | $ | 6,000 | |
Liabilities: | | | | | | | | | | | | | | | | |
Collateral on securities loaned at value | | | — | | | $ | (20,461 | ) | | | — | | | | (20,461 | ) |
| | | | |
Total | | $ | 6,000 | | | $ | (20,461 | ) | | | — | | | $ | (14,461 | ) |
| | | | |
During the six months ended November 30, 2016, there were no transfers between levels.
See Notes to Financial Statements.
| | | | | | |
| | | | | | | |
| | BLACKROCK FUNDS | | NOVEMBER 30, 2016 | | 21 |
| | |
| Statements of Assets and Liabilities | | |
| | | | | | | | |
| November 30, 2016 (Unaudited) | | BlackRock
Impact Bond Fund | | | BlackRock
Impact U.S.
Equity Fund | |
| | | | | | | | |
| Assets | | | | | | | | |
Investments at value — unaffiliated1,2 | | $ | 24,376,945 | | | $ | 24,076,489 | |
Investments at value — affiliated3 | | | 2,127,852 | | | | 180,696 | |
Cash pledged for futures contracts | | | 41,000 | | | | 6,000 | |
| Receivables: | | | | | | | | |
Investments sold — unaffiliated | | | — | | | | 391,735 | |
Securities lending income — affiliated | | | — | | | | 81 | |
Capital shares sold | | | — | | | | 10,087 | |
Dividends — affiliated | | | 386 | | | | 38 | |
Dividends — unaffiliated | | | — | | | | 46,551 | |
Interest — unaffiliated | | | 151,250 | | | | — | |
From the Manager | | | 38,536 | | | | 15,369 | |
Deferred offering costs | | | 116,980 | | | | 13,344 | |
Prepaid expenses | | | 1,096 | | | | 33,667 | |
| | | | | | | | |
Total assets | | | 26,854,045 | | | | 24,774,057 | |
| | | | | | | | |
| | | | | | | | |
| Liabilities | | | | | | | | |
Cash collateral on securities loaned at value | | | — | | | | 20,461 | |
| Payables: | | | | | | | | |
Investments purchased — unaffiliated | | | 7,402,601 | | | | 442,184 | |
Administration fees | | | 318 | | | | 376 | |
Income dividends | | | 29,738 | | | | — | |
Offering costs | | | 65,245 | | | | — | |
Officer’s and Trustees’ fees | | | 1,526 | | | | 1,140 | |
Other accrued expenses | | | 33,249 | | | | 69,511 | |
Service and distribution fees | | | 49 | | | | 221 | |
Variation margin on futures contracts | | | 13,378 | | | | 680 | |
| | | | | | | | |
Total liabilities | | | 7,546,104 | | | | 534,573 | |
| | | | | | | | |
Net Assets | | $ | 19,307,941 | | | $ | 24,239,484 | |
| | | | | | | | |
| | | | | | | | |
| Net Assets Consist of | | | | | | | | |
Paid-in capital | | $ | 20,010,017 | | | $ | 21,677,465 | |
Undistributed net investment income | | | 2,703 | | | | 155,144 | |
Accumulated net realized gain (loss) | | | (205,434 | ) | | | 377,243 | |
Net unrealized appreciation (depreciation) | | | (499,345 | ) | | | 2,029,632 | |
| | | | | | | | |
Net Assets | | $ | 19,307,941 | | | $ | 24,239,484 | |
| | | | | | | | |
1 Investments at cost — unaffiliated | | $ | 24,871,196 | | | $ | 22,060,606 | |
2 Securities loaned at value | | | — | | | $ | 20,309 | |
3 Investments at cost — affiliated | | $ | 2,127,852 | | | $ | 180,694 | |
| | | | | | |
| See Notes to Financial Statements. | | | | |
| | | | | | | |
| 22 | | BLACKROCK FUNDS | | NOVEMBER 30, 2016 | | |
| | |
| Statements of Assets and Liabilities (concluded) | | |
| | | | | | | | |
| November 30, 2016 (Unaudited) | | BlackRock
Impact Bond Fund | | | BlackRock
Impact U.S.
Equity Fund | |
| | | | | | | | |
| Net Assets Value | | | | | | | | |
| Institutional: | | | | | | | | |
Net assets | | $ | 19,163,204 | | | $ | 23,265,418 | |
| | | | | | | | |
Shares outstanding | | | 1,986,011 | | | | 2,076,850 | |
| | | | | | | | |
Net asset value | | $ | 9.65 | | | $ | 11.20 | |
| | | | | | | | |
Shares authorized | | | Unlimited | | | | Unlimited | |
| | | | | | | | |
Par value | | $ | 0.001 | | | $ | 0.001 | |
| | | | | | | | |
| Investor A: | | | | | | | | |
Net assets | | $ | 48,246 | | | $ | 596,321 | |
| | | | | | | | |
Shares outstanding | | | 5,000 | | | | 53,335 | |
| | | | | | | | |
Net asset value | | $ | 9.65 | | | $ | 11.18 | |
| | | | | | | | |
Shares authorized | | | Unlimited | | | | Unlimited | |
| | | | | | | | |
Par value | | $ | 0.001 | | | $ | 0.001 | |
| | | | | | | | |
| Investor C: | | | | | | | | |
Net assets | | $ | 48,246 | | | $ | 155,869 | |
| | | | | | | | |
Shares outstanding | | | 5,000 | | | | 13,997 | |
| | | | | | | | |
Net asset value | | $ | 9.65 | | | $ | 11.14 | |
| | | | | | | | |
Shares authorized | | | Unlimited | | | | Unlimited | |
| | | | | | | | |
Par value | | $ | 0.001 | | | $ | 0.001 | |
| | | | | | | | |
| Class K: | | | | | | | | |
Net assets | | $ | 48,245 | | | $ | 221,876 | |
| | | | | | | | |
Shares outstanding | | | 5,000 | | | | 19,802 | |
| | | | | | | | |
Net asset value | | $ | 9.65 | | | $ | 11.20 | |
| | | | | | | | |
Shares authorized | | | Unlimited | | | | Unlimited | |
| | | | | | | | |
Par value | | $ | 0.001 | | | $ | 0.001 | |
| | | | | | | | |
| | | | | | |
| See Notes to Financial Statements. | | | | |
| | | | | | | |
| | BLACKROCK FUNDS | | NOVEMBER 30, 2016 | | 23 |
| | | | | | | | |
| Six Months Ended November 30, 2016 (Unaudited) | | BlackRock
Impact
Bond Fund1 | | | BlackRock
Impact U.S.
Equity Fund | |
| | | | | | | | |
| Investment Income | | | | | | | | |
Dividends — unaffiliated | | | — | | | $ | 214,186 | |
Dividends — affiliated | | $ | 2,187 | | | | 250 | |
Interest — unaffiliated | | | 111,797 | | | | — | |
Securities lending — affiliated — net | | | — | | | | 819 | |
Foreign taxes withheld | | | — | | | | (3 | ) |
| | | | | | | | |
Total investment income | | | 113,984 | | | | 215,252 | |
| | | | | | | | |
| | | | | | | | |
| Expenses | | | | | | | | |
Organization and offering | | | 56,038 | | | | 87,065 | |
Professional | | | 21,285 | | | | 26,427 | |
Investment advisory | | | 16,096 | | | | 45,372 | |
Miscellaneous | | | 5,742 | | | | 6,982 | |
Officer and Trustees | | | 3,564 | | | | 5,826 | |
Printing | | | 3,465 | | | | 4,623 | |
Custodian | | | 2,376 | | | | 17,814 | |
Administration | | | 2,280 | | | | 4,821 | |
Accounting services | | | 2,178 | | | | 6,222 | |
Transfer agent — class specific | | | 1,101 | | | | 834 | |
Administration — class specific | | | 1,074 | | | | 2,269 | |
Service and distribution — class specific | | | 168 | | | | 911 | |
Registration | | | 29 | | | | 14,500 | |
| | | | | | | | |
Total expenses | | | 115,396 | | | | 223,666 | |
| Less: | | | | | | | | |
Fees waived and/or reimbursed by the Manager | | | (89,332 | ) | | | (146,717 | ) |
Administration fees waived | | | (2,280 | ) | | | (4,821 | ) |
Transfer agent fees reimbursed — class specific | | | (10 | ) | | | (256 | ) |
Administration fees waived — class specific | | | (7 | ) | | | (66 | ) |
| | | | | | | | |
Total expenses after fees waived and/or reimbursed | | | 23,767 | | | | 71,806 | |
| | | | | | | | |
Net investment income | | | 90,217 | | | | 143,446 | |
| | | | | | | | |
| | | | | | | | |
| Realized and Unrealized Gain (Loss) | | | | | | | | |
| Net realized gain (loss) from: | | | | | | | | |
Investments — unaffiliated | | | (25,381 | ) | | | 527,733 | |
Investments — affiliated | | | — | | | | (144 | ) |
Futures contracts | | | (180,053 | ) | | | 8,595 | |
| | | | | | | | |
| | | (205,434 | ) | | | 536,184 | |
| | | | | | | | |
| Net change in unrealized appreciation (depreciation) on: | | | | | | | | |
Investments — unaffiliated | | | (494,251 | ) | | | 958,283 | |
Investments — affiliated | | | — | | | | (1 | ) |
Futures contracts | | | (5,094 | ) | | | 7,810 | |
| | | | | | | | |
| | | (499,345 | ) | | | 966,092 | |
| | | | | | | | |
Net realized and unrealized gain (loss) | | | (704,779 | ) | | | 1,502,276 | |
| | | | | | | | |
Net Increase (Decrease) in Net Assets Resulting from Operations | | $ | (614,562 | ) | | $ | 1,645,722 | |
| | | | | | | | |
1 Commenced operations on August 23, 2016. | |
| | | | | | |
| See Notes to Financial Statements. | | | | |
| | | | | | | |
| 24 | | BLACKROCK FUNDS | | NOVEMBER 30, 2016 | | |
| | |
| Statements of Changes in Net Assets | | |
| | | | | | | | | | | | | | | | | | | | |
| | | BlackRock Impact
Bond Fund | | | BlackRock Impact U.S. Equity Fund | | | | |
| Increase (Decrease) in Net Assets: | | Period
August 23, 20161
to November 30,
2016
(Unaudited) | | | Six Months Ended
November 30,
2016
(Unaudited) | | | Period
October 5, 20151
to May 31,
2016 | | | | | | | |
| | | | | | | | | | | | | | | | | | | | |
| Operations | | | | | | | | | | | | | | | | | | | | |
Net investment income | | $ | 90,217 | | | $ | 143,446 | | | $ | 216,430 | | | | | | | | | |
Net realized gain (loss) | | | (205,434 | ) | | | 536,184 | | | | (140,295 | ) | | | | | | | | |
Net change in unrealized appreciation (depreciation) | | | (499,345 | ) | | | 966,092 | | | | 1,063,540 | | | | | | | | | |
| | | | | | | | | | | | |
Net increase (decrease) in net assets resulting from operations | | | (614,562 | ) | | | 1,645,722 | | | | 1,139,675 | | | | | | | | | |
| | | | | | | | | | | | |
| | | | | | | | | | | | | | | | | | | | |
| Distributions to Shareholders2 | | | | | | | | | | | | | | | | | | | | |
| From net investment income: | | | | | | | | | | | | | | | | | | | | |
Institutional | | | (87,020 | ) | | | (135,949 | ) | | | (109,504 | ) | | | | | | | | |
Investor A | | | (186 | ) | | | (1,899 | ) | | | (421 | ) | | | | | | | | |
Investor C | | | (84 | ) | | | (117 | ) | | | (76 | ) | | | | | | | | |
Class K | | | (224 | ) | | | (1,348 | ) | | | — | | | | | | | | | |
| From net realized gain: | | | | | | | | | | | | | | | | | | | | |
Institutional | | | — | | | | — | | | | (20,295 | ) | | | | | | | | |
Investor A | | | — | | | | — | | | | (84 | ) | | | | | | | | |
Investor C | | | — | | | | — | | | | (26 | ) | | | | | | | | |
| | | | | | | | | | | | |
Decrease in net assets resulting from distributions to shareholders | | | (87,514 | ) | | | (139,313 | ) | | | (130,406 | ) | | | | | | | | |
| | | | | | | | | | | | |
| | | | | | | | | | | | | | | | | | | | |
| Capital Share Transactions | | | | | | | | | | | | | | | | | | | | |
Net increase in net assets derived from capital share transactions | | | 20,010,017 | | | | 1,112,066 | | | | 20,611,740 | | | | | | | | | |
| | | | | | | | | | | | |
| | | | | | | | | | | | | | | | | | | | |
| Net Assets | | | | | | | | | | | | | | | | | | | | |
Total increase in net assets | | | 19,307,941 | | | | 2,618,475 | | | | 21,621,009 | | | | | | | | | |
Beginning of period | | | — | | | | 21,621,009 | | | | — | | | | | | | | | |
| | | | | | | | | | | | |
End of period | | $ | 19,307,941 | | | $ | 24,239,484 | | | $ | 21,621,009 | | | | | | | | | |
| | | | | | | | | | | | |
Undistributed net investment income, end of period | | $ | 2,703 | | | $ | 155,144 | | | $ | 151,011 | | | | | | | | | |
| | | | | | | | | | | | |
1 Commencement of operations. | | | | | |
2 Distributions for annual periods determined in accordance with federal income tax regulations. | | | | | |
| | | | | | |
| See Notes to Financial Statements. | | | | |
| | | | | | | |
| | BLACKROCK FUNDS | | NOVEMBER 30, 2016 | | 25 |
| | |
| Financial Highlights | | BlackRock Impact Bond Fund |
| | | | | | | | | | | | |
| | | Institutional | | | | | | | |
| | | Period August 23, 20161 to November 30, 2016 (Unaudited) | | | | | | | |
| | | | | | | | | | | | |
| Per Share Operating Performance | | | | | | | | | | | | |
Net asset value, beginning of period | | $ | 10.00 | | | | | | | | | |
| | | | | | | | |
Net investment income2 | | | 0.05 | | | | | | | | | |
Net realized and unrealized (loss) | | | (0.36 | ) | | | | | | | | |
| | | | | | | | |
Net decrease from investment operations | | | (0.31 | ) | | | | | | | | |
| | | | | | | | |
Distributions from net investment income3 | | | (0.04 | ) | | | | | | | | |
| | | | | | | | |
Net asset value, end of period | | $ | 9.65 | | | | | | | | | |
| | | | | | | | |
| | | | | | | | | | | | |
| Total Return4,5 | | | | | | | | | | | | |
Based on net asset value | | | (3.07)% | | | | | | | | | |
| | | | | | | | |
| | | | | | | | | | | | |
| Ratios to Average Net Assets | | | | | | | | | | | | |
Total expenses6,7 | | | 1.13% | 8 | | | | | | | | |
| | | | | | | | |
Total expenses after fees waived and/or reimbursed6,7 | | | 0.44% | | | | | | | | | |
| | | | | | | | |
Net investment income6,7 | | | 1.68% | | | | | | | | | |
| | | | | | | | |
| | | | | | | | | | | | |
| Supplemental Data | | | | | | | | | | | | |
Net assets, end of period (000) | | $ | 19,163 | | | | | | | | | |
| | | | | | | | |
Portfolio turnover rate9 | | | 173% | | | | | | | | | |
| | | | | | | | |
| | 1 | | Commencement of operations. |
| | 2 | | Based on average shares outstanding. |
| | 3 | | Distributions for annual periods determined in accordance with federal income tax regulations. |
| | 4 | | Where applicable, assumes the reinvestment of distributions. |
| | 5 | | Aggregate total return. |
| | 7 | | Excludes 0.02% of expenses incurred indirectly as a result of investments in underlying funds. |
| | 8 | | Audit, offering and organization costs were not annualized in the calculation of the expense ratios. If these expenses were annualized, the total expenses would have been 2.15%. |
| | 9 | | Includes mortgage dollar roll transactions (“MDRs”). Additional information regarding portfolio turnover rate is as follows: |
| | | | |
| | | Period August 23, 20161 to November 30, 2016 (Unaudited) | |
| | | | |
Portfolio turnover rate (excluding MDRs) | | | 126% | |
| | | | �� |
| | | | | | |
| See Notes to Financial Statements. | | | | |
| | | | | | | |
| 26 | | BLACKROCK FUNDS | | NOVEMBER 30, 2016 | | |
| | |
| Financial Highlights (continued) | | BlackRock Impact Bond Fund |
| | | | | | | | | | | | | | | | | | | | | | | | |
| | | Investor A | | | | | | | | | Investor C | | | | | | | |
| | | Period August 23, 20161 to November 30, 2016 (Unaudited) | | | | | | | | | Period August 23, 20161 to November 30, 2016
(Unaudited) | | | | | | | |
| | | | | | | | | | | | | | | | | | | | | | | | |
| Per Share Operating Performance | | | | | | | | | | | | | | | | | | | | | | | | |
Net asset value, beginning of period | | $ | 10.00 | | | | | | | | | | | $ | 10.00 | | | | | | | | | |
| | | | | | | | | | | | | | | | |
Net investment income2 | | | 0.04 | | | | | | | | | | | | 0.02 | | | | | | | | | |
Net realized and unrealized (loss) | | | (0.35 | ) | | | | | | | | | | | (0.35 | ) | | | | | | | | |
| | | | | | | | | | | | | | | | |
Net decrease from investment operations | | | (0.31 | ) | | | | | | | | | | | (0.33 | ) | | | | | | | | |
| | | | | | | | | | | | | | | | |
Distributions from net investment income3 | | | (0.04 | ) | | | | | | | | | | | (0.02 | ) | | | | | | | | |
| | | | | | | | | | | | | | | | |
Net asset value, end of period | | $ | 9.65 | | | | | | | | | | | $ | 9.65 | | | | | | | | | |
| | | | | | | | | | | | | | | | |
| | | | | | | | | | | | | | | | | | | | | | | | |
| Total Return4,5 | | | | | | | | | | | | | | | | | | | | | | | | |
Based on net asset value | | | (3.13)% | | | | | | | | | | | | (3.34)% | | | | | | | | | |
| | | | | | | | | | | | | | | | |
| | | | | | | | | | | | | | | | | | | | | | | | |
| Ratios to Average Net Assets | | | | | | | | | | | | | | | | | | | | | | | | |
Total expenses6,7 | | | 1.39% | 8 | | | | | | | | | | | 2.17% | 8 | | | | | | | | |
| | | | | | | | | | | | | | | | |
Total expenses after fees waived and/or reimbursed6,7 | | | 0.70% | | | | | | | | | | | | 1.45% | | | | | | | | | |
| | | | | | | | | | | | | | | | |
Net investment income6,7 | | | 1.43% | | | | | | | | | | | | 0.67% | | | | | | | | | |
| | | | | | | | | | | | | | | | |
| | | | | | | | | | | | | | | | | | | | | | | | |
| Supplemental Data | | | | | | | | | | | | | | | | | | | | | | | | |
Net assets, end of period (000) | | $ | 48 | | | | | | | | | | | $ | 48 | | | | | | | | | |
| | | | | | | | | | | | | | | | |
Portfolio turnover rate9 | | | 173% | | | | | | | | | | | | 173% | | | | | | | | | |
| | | | | | | | | | | | | | | | |
| | 1 | | Commencement of operations. |
| | 2 | | Based on average shares outstanding. |
| | 3 | | Distributions for annual periods determined in accordance with federal income tax regulations. |
| | 4 | | Where applicable, excludes the effects of any sales charges and assumes the reinvestment of distributions. |
| | 5 | | Aggregate total return. |
| | 7 | | Excludes 0.02% of expenses incurred indirectly as a result of investments in underlying funds. |
| | 8 | | Audit, offering and organization costs were not annualized in the calculation of the expense ratios. If these expenses were annualized, the total expenses would have been 2.42% and 3.19%, respectively. |
| | 9 | | Includes MDRs. Additional information regarding portfolio turnover rate is as follows: |
| | | | |
| | | Period August 23, 20161 to November 30, 2016 (Unaudited) | |
| | | | |
Portfolio turnover rate (excluding MDRs) | | | 126% | |
| | | | |
| | | | | | |
| See Notes to Financial Statements. | | | | |
| | | | | | | |
| | BLACKROCK FUNDS | | NOVEMBER 30, 2016 | | 27 |
| | |
| Financial Highlights (concluded) | | BlackRock Impact Bond Fund |
| | | | | | | | | | | | |
| | | Class K | | | | | | | |
| | | Period August 23, 20161 to November 30, 2016 (Unaudited) | | | | | | | |
| | | | | | | | | | | | |
| Per Share Operating Performance | | | | | | | | | | | | |
Net asset value, beginning of period | | $ | 10.00 | | | | | | | | | |
| | | | | | | | |
Net investment income2 | | | 0.05 | | | | | | | | | |
Net realized and unrealized (loss) | | | (0.36 | ) | | | | | | | | |
| | | | | | | | |
Net decrease from investment operations | | | (0.31 | ) | | | | | | | | |
| | | | | | | | |
Distributions from net investment income3 | | | (0.04 | ) | | | | | | | | |
| | | | | | | | |
Net asset value, end of period | | $ | 9.65 | | | | | | | | | |
| | | | | | | | |
| | | | | | | | | | | | |
| Total Return4,5 | | | | | | | | | | | | |
Based on net asset value | | | (3.06)% | | | | | | | | | |
| | | | | | | | |
| | | | | | | | | | | | |
| Ratios to Average Net Assets | | | | | | | | | | | | |
Total expenses6,7 | | | 1.17% | 8 | | | | | | | | |
| | | | | | | | |
Total expenses after fees waived and/or reimbursed6,7 | | | 0.40% | | | | | | | | | |
| | | | | | | | |
Net investment income6,7 | | | 1.72% | | | | | | | | | |
| | | | | | | | |
| | | | | | | | | | | | |
| Supplemental Data | | | | | | | | | | | | |
Net assets, end of period (000) | | $ | 48 | | | | | | | | | |
| | | | | | | | |
Portfolio turnover rate9 | | | 173% | | | | | | | | | |
| | | | | | | | |
| | 1 | | Commencement of operations. |
| | 2 | | Based on average shares outstanding. |
| | 3 | | Distributions for annual periods determined in accordance with federal income tax regulations. |
| | 4 | | Where applicable, assumes the reinvestment of distributions. |
| | 5 | | Aggregate total return. |
| | 7 | | Excludes 0.02% of expenses incurred indirectly as a result of investments in underlying funds. |
| | 8 | | Audit, offering and organization costs were not annualized in the calculation of the expense ratios. If these expenses were annualized, the total expenses would have been 2.19%. |
| | 9 | | Includes MDRs. Additional information regarding portfolio turnover rate is as follows: |
| | | | |
| | | Period August 23, 20161 to November 30, 2016 (Unaudited) | |
| | | | |
Portfolio turnover rate (excluding MDRs) | | | 126% | |
| | | | |
| | | | | | |
| See Notes to Financial Statements. | | | | |
| | | | | | | |
| 28 | | BLACKROCK FUNDS | | NOVEMBER 30, 2016 | | |
| | |
| Financial Highlights | | BlackRock U.S. Impact Equity Fund |
| | | | | | | | | | | | | | | | |
| | | Institutional | | | | |
| | | Six Months Ended
November 30,
2016
(Unaudited) | | | Period
October 5, 20151
to May 31,
2016 | | | | | | | |
| | | | | | | | | | | | | | | | |
| Per Share Operating Performance | | | | | | | | | | | | | | | | |
Net asset value, beginning of period | | $ | 10.49 | | | $ | 10.00 | | | | | | | | | |
| | | | | | | | |
Net investment income2 | | | 0.07 | | | | 0.11 | | | | | | | | | |
Net realized and unrealized gain | | | 0.71 | | | | 0.45 | | | | | | | | | |
| | | | | | | | |
Net increase from investment operations | | | 0.78 | | | | 0.56 | | | | | | | | | |
| | | | | | | | |
| Distributions:3 | | | | | | | | | | | | | | | | |
From net investment income | | | (0.07 | ) | | | (0.06 | ) | | | | | | | | |
From net realized gain | | | — | | | | (0.01 | ) | | | | | | | | |
| | | | | | | | |
Total distributions | | | (0.07 | ) | | | (0.07 | ) | | | | | | | | |
| | | | | | | | |
Net asset value, end of period | | $ | 11.20 | | | $ | 10.49 | | | | | | | | | |
| | | | | | | | |
| | | | | | | | | | | | | | | | |
| Total Return4,5 | | | | | | | | | | | | | | | | |
Based on net asset value | | | 7.44% | | | | 5.59% | | | | | | | | | |
| | | | | | | | |
| | | | | | | | | | | | | | | | |
| Ratios to Average Net Assets | | | | | | | | | | | | | | | | |
Total expenses6 | | | 1.58% | 7 | | | 1.91% | 8,9 | | | | | | | | |
| | | | | | | | |
Total expenses after fees waived and/or reimbursed6 | | | 0.62% | | | | 0.64% | 8 | | | | | | | | |
| | | | | | | | |
Net investment income6 | | | 1.27% | | | | 1.64% | 8 | | | | | | | | |
| | | | | | | | |
| | | | | | | | | | | | | | | | |
| Supplemental Data | | | | | | | | | | | | | | | | |
Net assets, end of period (000) | | $ | 23,265 | | | $ | 21,080 | | | | | | | | | |
| | | | | | | | |
Portfolio turnover rate | | | 44% | | | | 56% | | | | | | | | | |
| | | | | | | | |
| | 1 | | Commencement of operations. |
| | 2 | | Based on average shares outstanding. |
| | 3 | | Distributions for annual periods determined in accordance with federal income tax regulations. |
| | 4 | | Where applicable, assumes the reinvestment of distributions. |
| | 5 | | Aggregate total return. |
| | 7 | | Offering costs were not annualized in the calculation of the expense ratios. If these expenses were annualized, the total expenses would have been 1.96%. |
| | 8 | | Excludes 0.01% of expenses incurred indirectly as a result of investments in underlying funds. |
| | 9 | | Audit, offering and organization costs were not annualized in the calculation of the expense ratios. If these expenses were annualized, the total expenses would have been 2.42%. |
| | | | | | |
| See Notes to Financial Statements. | | | | |
| | | | | | | |
| | BLACKROCK FUNDS | | NOVEMBER 30, 2016 | | 29 |
| | |
| Financial Highlights (continued) | | BlackRock U.S. Impact Equity Fund |
| | | | | | | | | | | | | | | | | | | | | | | | | | | | | | | | | | | | |
| | | Investor A | | | | | | | | | Investor C | | | | |
| | | Six Months Ended
November 30,
2016
(Unaudited) | | | | | | Period
October 5, 20151
to May 31,
2016 | | | | | | | | | Six Months Ended
November 30,
2016
(Unaudited) | | | | | | Period
October 5, 20151
to May 31,
2016 | | | | |
| | | | | | | | | | | | | | | | | | | | | | | | | | | | | | | | | | | | |
| Per Share Operating Performance | | | | | | | | | | | | | | | | | | | | | | | | | | | | | | | | | | | | |
Net asset value, beginning of period | | $ | 10.48 | | | | | | | $ | 10.00 | | | | | | | | | | | $ | 10.45 | | | | | | | $ | 10.00 | | | | | |
| | | | | | | | | | | | |
Net investment income2 | | | 0.06 | | | | | | | | 0.09 | | | | | | | | | | | | 0.02 | | | | | | | | 0.04 | | | | | |
Net realized and unrealized gain | | | 0.70 | | | | | | | | 0.45 | | | | | | | | | | | | 0.71 | | | | | | | | 0.45 | | | | | |
| | | | | | | | | | | | |
Net increase from investment operations | | | 0.76 | | | | | | | | 0.54 | | | | | | | | | | | | 0.73 | | | | | | | | 0.49 | | | | | |
| | | | | | | | | | | | |
| Distributions:3 | | | | | | | | | | | | | | | | | | | | | | | | | | | | | | | | | | | | |
From net investment income | | | (0.06 | ) | | | | | | | (0.05 | ) | | | | | | | | | | | (0.04 | ) | | | | | | | (0.03 | ) | | | | |
From net realized gain | | | — | | | | | | | | (0.01 | ) | | | | | | | | | | | — | | | | | | | | (0.01 | ) | | | | |
| | | | | | | | | | | | |
Total distributions | | | (0.06 | ) | | | | | | | (0.06 | ) | | | | | | | | | | | (0.04 | ) | | | | | | | (0.04 | ) | | | | |
| | | | | | | | | | | | |
Net asset value, end of period | | $ | 11.18 | | | | | | | $ | 10.48 | | | | | | | | | | | $ | 11.14 | | | | | | | $ | 10.45 | | | | | |
| | | | | | | | | | | | |
| | | | | | | | | | | | | | | | | | | | | | | | | | | | | | | | | | | | |
| Total Return4,5 | | | | | | | | | | | | | | | | | | | | | | | | | | | | | | | | | | | | |
Based on net asset value | | | 7.28% | | | | | | | | 5.44% | | | | | | | | | | | | 6.96% | | | | | | | | 4.92% | | | | | |
| | | | | | | | | | | | |
| | | | | | | | | | | | | | | | | | | | | | | | | | | | | | | | | | | | |
| Ratios to Average Net Assets | | | | | | | | | | | | | | | | | | | | | | | | | | | | | | | | | | | | |
Total expenses6 | | | 1.93% | 7 | | | | | | | 2.21% | 8,9 | | | | | | | | | | | 2.60% | 7 | | | | | | | 3.27% | 8,9 | | | | |
| | | | | | | | | | | | |
Total expenses after fees waived and/or reimbursed6 | | | 0.90% | | | | | | | | 0.89% | 8 | | | | | | | | | | | 1.63% | | | | | | | | 1.64% | 8 | | | | |
| | | | | | | | | | | | |
Net investment income6 | | | 1.06% | | | | | | | | 1.40% | 8 | | | | | | | | | | | 0.39% | | | | | | | | 0.64% | 8 | | | | |
| | | | | | | | | | | | |
| | | | | | | | | | | | | | | | | | | | | | | | | | | | | | | | | | | | |
| Supplemental Data | | | | | | | | | | | | | | | | | | | | | | | | | | | | | | | | | | | | |
Net assets, end of period (000) | | $ | 596 | | | | | | | $ | 307 | | | | | | | | | | | $ | 156 | | | | | | | $ | 26 | | | | | |
| | | | | | | | | | | | |
Portfolio turnover rate | | | 44% | | | | | | | | 56% | | | | | | | | | | | | 44% | | | | | | | | 56% | | | | | |
| | | | | | | | | | | | |
| | 1 | | Commencement of operations. |
| | 2 | | Based on average shares outstanding. |
| | 3 | | Distributions for annual periods determined in accordance with federal income tax regulations. |
| | 4 | | Where applicable, excludes the effects of any sales charges and assumes the reinvestment of distributions. |
| | 5 | | Aggregate total return. |
| | 7 | | Offering costs were not annualized in the calculation of the expense ratios. If these expenses were annualized, the total expenses would have been 2.28% and 2.89%, respectively. |
| | 8 | | Excludes 0.01% of expenses incurred indirectly as a result of investments in underlying funds. |
| | 9 | | Audit, offering and organization costs were not annualized in the calculation of the expense ratios. If these expenses were annualized, the total expenses would have been 2.70% and 3.78%, respectively. |
| | | | | | |
| See Notes to Financial Statements. | | | | |
| | | | | | | |
| 30 | | BLACKROCK FUNDS | | NOVEMBER 30, 2016 | | |
| | |
| Financial Highlights (concluded) | | BlackRock U.S. Impact Equity Fund |
| | | | | | | | | | | | | | | | |
| | | Class K | | | | |
| | | Six Months Ended
November 30,
2016
(Unaudited) | | | Period
March 28, 20161
to May 31,
2016 | | | | | | | |
| | | | | | | | | | | | | | | | |
| Per Share Operating Performance | | | | | | | | | | | | | | | | |
Net asset value, beginning of period | | $ | 10.49 | | | $ | 10.10 | | | | | | | | | |
| | | | | | | | |
Net investment income2 | | | 0.07 | | | | 0.03 | | | | | | | | | |
Net realized and unrealized gain | | | 0.71 | | | | 0.36 | | | | | | | | | |
| | | | | | | | |
Net increase from investment operations | | | 0.78 | | | | 0.39 | | | | | | | | | |
| | | | | | | | |
| Distributions:3 | | | | | | | | | | | | | | | | |
From net investment income | | | (0.07 | ) | | | — | | | | | | | | | |
From net realized gain | | | — | | | | — | | | | | | | | | |
| | | | | | | | |
Total distributions | | | (0.07 | ) | | | — | | | | | | | | | |
| | | | | | | | |
Net asset value, end of period | | $ | 11.20 | | | $ | 10.49 | | | | | | | | | |
| | | | | | | | |
| | | | | | | | | | | | | | | | |
| Total Return4,5 | | | | | | | | | | | | | | | | |
Based on net asset value | | | 7.44% | | | | 3.86% | | | | | | | | | |
| | | | | | | | |
| | | | | | | | | | | | | | | | |
| Ratios to Average Net Assets | | | | | | | | | | | | | | | | |
Total expenses6 | | | 1.63% | 7 | | | 1.27% | 8,9 | | | | | | | | |
| | | | | | | | |
Total expenses after fees waived and/or reimbursed6 | | | 0.60% | | | | 0.60% | 8 | | | | | | | | |
| | | | | | | | |
Net investment income6 | | | 1.29% | | | | 1.81% | 8 | | | | | | | | |
| | | | | | | | |
| | | | | | | | | | | | | | | | |
| Supplemental Data | | | | | | | | | | | | | | | | |
Net assets, end of period (000) | | $ | 222 | | | $ | 208 | | | | | | | | | |
| | | | | | | | |
Portfolio turnover rate | | | 44% | | | | 56% | | | | | | | | | |
| | | | | | | | |
| | 1 | | Commencement of operations. |
| | 2 | | Based on average shares outstanding. |
| | 3 | | Distributions for annual periods determined in accordance with federal income tax regulations. |
| | 4 | | Where applicable, assumes the reinvestment of distributions. |
| | 5 | | Aggregate total return. |
| | 7 | | Offering costs were not annualized in the calculation of the expense ratios. If these expenses were annualized, the total expenses would have been 2.01%. |
| | 8 | | Excludes 0.01% of expenses incurred indirectly as a result of investments in underlying funds. |
| | 9 | | Audit, offering and organization costs were not annualized in the calculation of the expense ratios. If these expenses were annualized, the total expenses would have been 2.53%. |
| | | | | | |
| See Notes to Financial Statements. | | | | |
| | | | | | | |
| | BLACKROCK FUNDS | | NOVEMBER 30, 2016 | | 31 |
| | | | |
| Notes to Financial Statements (Unaudited) | | |
1. Organization:
BlackRock FundsSM (the “Trust”) is registered under the Investment Company Act of 1940, as amended (the “1940 Act”), as an open-end management investment company. The Trust is organized as a Massachusetts business trust. The following are referred to herein collectively as the “Funds” or individually, a “Fund”:
| | | | | | |
| Fund Name | | Herein Referred To As | | Diversification Classification | |
BlackRock Impact Bond Fund | | Impact Bond Fund | | | Diversified | |
BlackRock Impact U.S. Equity Fund | | Impact U.S. Equity Fund | | | Diversified | |
Each Fund offers multiple classes of shares. All classes of shares have identical voting, dividend, liquidation and other rights and are subject to the same terms and conditions, except that certain classes bear expenses related to the shareholder servicing and distribution of such shares, and may be subject to a contingent deferred sales charge (“CDSC”). Institutional and Class K Shares are sold only to certain eligible investors. Investor A and Investor C Shares are generally available through financial intermediaries. Each class has exclusive voting rights with respect to matters relating to its shareholder servicing and distribution expenditures.
| | | | | | | | | | |
| Share Class | | Initial Sales
Charge | | CDSC | | | Conversion
Privilege | |
Institutional | | No | | | No | | | | None | |
Investor A Shares | | Yes | | | No | 1 | | | None | |
Investor C Shares | | No | | | Yes | | | | None | |
Class K Shares | | No | | | No | | | | None | |
| | 1 | | Investor A Shares may be subject to a CDSC for certain redemptions where no initial sales charge was paid at the time of purchase. |
The Funds, together with certain other registered investment companies advised by BlackRock Advisors, LLC (the “Manager”) or its affiliates, are included in a complex of open-end funds referred to as the Equity-Liquidity Complex.
2. Significant Accounting Policies:
The financial statements are prepared in conformity with accounting principles generally accepted in the United States of America (“U.S. GAAP”), which may require management to make estimates and assumptions that affect the reported amounts of assets and liabilities in the financial statements, disclosure of contingent assets and liabilities at the date of the financial statements and the reported amounts of increases and decreases in net assets from operations during the reporting period. Actual results could differ from those estimates. Each Fund is considered an investment company under U.S. GAAP and follows the accounting and reporting guidance applicable to investment companies. Below is a summary of significant accounting policies:
Segregation and Collateralization: In cases where a Fund enters into certain investments (e.g., futures contracts) that would be treated as “senior securities” for 1940 Act purposes, a Fund may segregate or designate on its books and records cash or liquid assets having a market value at least equal to the amount of its future obligations under such investments. Doing so allows the investment to be excluded from treatment as a “senior security.” Furthermore, if required by an exchange or counterparty agreement, the Funds may be required to deliver/deposit cash and/or securities to/with an exchange, or broker-dealer or custodian as collateral for certain investments or obligations.
Investment Transactions and Investment Income: For financial reporting purposes, investment transactions are recorded on the dates the transactions are entered into (the trade dates). Realized gains and losses on investment transactions are determined on the identified cost basis. Dividend income is recorded on the ex-dividend date. Interest income, including amortization and accretion of premiums and discounts on debt securities, is recognized on the accrual basis. Income, expenses and realized and unrealized gains and losses are allocated daily to each class based on its relative net assets.
Distributions: Distributions paid by Impact U.S. Equity Fund are recorded on the ex-dividend date. For Impact Bond Fund, distributions from net investment income are declared and paid monthly. Distributions of capital gains are recorded on the ex-dividend date and made at least annually. The character and timing of distributions are determined in accordance with federal income tax regulations, which may differ from U.S. GAAP.
Organization and Offering Costs: Upon commencement of operations, organization costs associated with the establishment of the Funds were expensed by the Funds and reimbursed by the Manager. The Manager reimbursed Impact Bond Fund $12,500, which is included in fees waived and/or reimbursed by the Manager in the Statements of Operations. Offering costs are amortized over a 12-month period beginning with the commencement of operations.
| | | | | | |
| | | | | | | |
| 32 | | BLACKROCK FUNDS | | NOVEMBER 30, 2016 | | |
| | | | |
| Notes to Financial Statements (continued) | | |
Indemnifications: In the normal course of business, a Fund enters into contracts that contain a variety of representations that provide general indemnification. A Fund’s maximum exposure under these arrangements is unknown because it involves future potential claims against a Fund, which cannot be predicted with any certainty.
Other: Expenses directly related to a Fund or its classes are charged to that Fund or the applicable class. Other operating expenses shared by several funds, including other funds managed by the Manager, are prorated among those funds on the basis of relative net assets or other appropriate methods. Expenses directly related to the Funds and other shared expenses prorated to the Funds are allocated daily to each class based on its relative net assets or other appropriate methods.
Through May 31, 2016, the Funds had an arrangement with their custodian whereby credits were earned on uninvested cash balances, which could be used to reduce custody fees and/or overdraft charges. Credits previously earned may be utilized until December 31, 2016. Under current arrangements effective June 1, 2016, the Funds no longer earn credits on uninvested cash, and may incur charges on uninvested cash balances and overdrafts, subject to certain conditions.
3. Investment Valuation and Fair Value Measurements:
Investment Valuation Policies: The Funds’ investments are valued at fair value (also referred to as “market value” within the financial statements) as of the close of trading on the New York Stock Exchange (“NYSE”) (generally 4:00 p.m., Eastern time). U.S. GAAP defines fair value as the price the Funds would receive to sell an asset or pay to transfer a liability in an orderly transaction between market participants at the measurement date. The Funds determine the fair values of their financial instruments using various independent dealers or pricing services under policies approved by the Board of Trustees of the Trust (the “Board”). The BlackRock Global Valuation Methodologies Committee (the “Global Valuation Committee”) is the committee formed by management to develop global pricing policies and procedures and to oversee the pricing function for all financial instruments.
Fair Value Inputs and Methodologies: The following methods and inputs are used to establish the fair value of each Fund’s assets and liabilities:
| • | | Equity investments traded on a recognized securities exchange are valued at the official closing price each day, if available. For equity investments traded on more than one exchange, the official closing price on the exchange where the stock is primarily traded is used. Equity investments traded on a recognized exchange for which there were no sales on that day may be valued at the last available bid (long positions) or ask (short positions) price. |
| • | | Fixed-income securities for which market quotations are readily available are generally valued using the last available bid prices or current market quotations provided by independent dealers or third party pricing services. Floating rate loan interests are valued at the mean of the bid prices from one or more independent brokers or dealers as obtained from a third party pricing service. Pricing services generally value fixed-income securities assuming orderly transactions of an institutional round lot size, but the Funds may hold or transact in such securities in smaller, odd lot sizes. Odd lots often trade at lower prices than institutional round lots. The pricing services may use matrix pricing or valuation models that utilize certain inputs and assumptions to derive values, including transaction data (e.g., recent representative bids and offers), credit quality information, perceived market movements, news, and other relevant information. Certain fixed-income securities, including asset-backed and mortgage related securities may be valued based on valuation models that consider the estimated cash flows of each tranche of the entity, establish a benchmark yield and develop an estimated tranche specific spread to the benchmark yield based on the unique attributes of the tranche. The amortized cost method of valuation may be used with respect to debt obligations with sixty days or less remaining to maturity unless the Manager determines such method does not represent fair value. |
| • | | Investments in open-end U.S. mutual funds are valued at NAV each business day. |
| • | | The Funds value their investment in SL Liquidity Series, LLC, Money Market Series (the “Money Market Series”) at fair value, which is ordinarily based upon their pro rata ownership in the underlying fund’s net assets. The Money Market Series seeks current income consistent with maintaining liquidity and preserving capital. Although the Money Market Series is not registered under the 1940 Act, its investments may follow the parameters of investments by a money market fund that is subject to Rule 2a-7 under the 1940 Act. |
| • | | Futures contracts traded on exchanges are valued at their last sale price. |
| • | | To-be-announced (“TBA”) commitments are valued on the basis of last available bid prices or current market quotations provided by pricing services. |
| | | | | | |
| | | | | | | |
| | BLACKROCK FUNDS | | NOVEMBER 30, 2016 | | 33 |
| | |
| Notes to Financial Statements (continued) | | |
If events (e.g., a company announcement, market volatility or a natural disaster) occur that are expected to materially affect the value of such investments, or in the event that the application of these methods of valuation results in a price for an investment that is deemed not to be representative of the market value of such investment, or if a price is not available, the investment will be valued by the Global Valuation Committee, or its delegate, in accordance with a policy approved by the Board as reflecting fair value (“Fair Valued Investments”). When determining the price for Fair Valued Investments, the Global Valuation Committee, or its delegate, seeks to determine the price that each Fund might reasonably expect to receive or pay from the current sale or purchase of that asset or liability in an arm’s-length transaction. Fair value determinations shall be based upon all available factors that the Global Valuation Committee, or its delegate, deems relevant and consistent with the principles of fair value measurement.
The Global Valuation Committee, or its delegate, employs various methods for calibrating valuation approaches for investments where an active market does not exist, including regular due diligence of each Fund’s pricing vendors, regular reviews of key inputs and assumptions, transactional back-testing or disposition analysis to compare unrealized gains and losses to realized gains and losses, reviews of missing or stale prices and large movements in market values and reviews of any market related activity. The pricing of all Fair Valued Investments is subsequently reported to the Board or a committee thereof on a quarterly basis. As a result of the inherent uncertainty in valuation of these investments, the fair values may differ from the values that would have been used had an active market existed.
For investments in equity or debt issued by privately-held companies or funds (“Private Company” or collectively, the “Private Companies”) and other Fair Valued Investments, the fair valuation approaches that are used by third party pricing services utilize one or a combination of, but not limited to, the following inputs.
Standard Inputs Generally Considered By Third Party Pricing Services
| | |
Market approach | | (i) recent market transactions, including subsequent rounds of financing, in the underlying investment or comparable issuers; (ii) recapitalizations and other transactions across the capital structure; and (iii) market multiples of comparable issuers. |
Income approach | | (i) future cash flows discounted to present and adjusted as appropriate for liquidity, credit, and/or market risks; (ii) quoted prices for similar investments or assets in active markets; and (iii) other risk factors, such as interest rates, yield curves, volatilities, prepayment speeds, loss severities, credit risks, recovery rates, liquidation amounts and/or default rates. |
Cost approach | | (i) audited or unaudited financial statements, investor communications and financial or operational metrics issued by the Private Company; (ii) changes in the valuation of relevant indices or publicly traded companies comparable to the Private Company; (iii) relevant news and other public sources; and (iv) known secondary market transactions in the Private Company’s interests and merger or acquisition activity in companies comparable to the Private Company. |
The Private Companies are not subject to the public company disclosure, timing, and reporting standards as other investments held by a Fund. Typically, the most recently available information by a Private Company is as of a date that is earlier than the date a Fund is calculating its NAV. This factor may result in a difference between the value of the investment and the price a Fund could receive upon the sale of the investment.
Fair Value Hierarchy: Various inputs are used in determining the fair value of investments and derivative financial instruments. These inputs to valuation techniques are categorized into a fair value hierarchy consisting of three broad levels for financial statement purposes as follows:
| • | | Level 1 — unadjusted price quotations in active markets/exchanges for identical assets or liabilities that each Fund has the ability to access |
| • | | Level 2 — other observable inputs (including, but not limited to, quoted prices for similar assets or liabilities in markets that are active, quoted prices for identical or similar assets or liabilities in markets that are not active, inputs other than quoted prices that are observable for the assets or liabilities (such as interest rates, yield curves, volatilities, prepayment speeds, loss severities, credit risks and default rates) or other market–corroborated inputs) |
| • | | Level 3 — unobservable inputs based on the best information available in the circumstances, to the extent observable inputs are not available (including each Fund’s own assumptions used in determining the fair value of investments and derivative financial instruments) |
The hierarchy gives the highest priority to unadjusted quoted prices in active markets for identical assets or liabilities (Level 1 measurements) and the lowest priority to unobservable inputs (Level 3 measurements). Accordingly, the degree of judgment exercised in determining fair value is greatest for
| | | | | | |
| | | | | | | |
| 34 | | BLACKROCK FUNDS | | NOVEMBER 30, 2016 | | |
| | | | |
| Notes to Financial Statements (continued) | | |
instruments categorized in Level 3. The inputs used to measure fair value may fall into different levels of the fair value hierarchy. In such cases, for disclosure purposes, the fair value hierarchy classification is determined based on the lowest level input that is significant to the fair value measurement in its entirety. Investments classified within Level 3 have significant unobservable inputs used by the Global Valuation Committee in determining the price for Fair Valued investments. Level 3 investments include equity or debt issued by Private Companies. There may not be a secondary market, and/or there are a limited number of investors. Level 3 investments may also be adjusted to reflect illiquidity and/or non-transferability, with the amount of such discount estimated by the Global Valuation Committee in the absence of market information.
Changes in valuation methodologies may result in transfers into or out of an assigned level within the hierarchy. In accordance with each Fund’s policy, transfers between different levels of the fair value hierarchy are deemed to have occurred as of the beginning of the reporting period. The categorization of a value determined for investments and derivative financial instruments is based on the pricing transparency of the investments and derivative financial instruments and is not necessarily an indication of the risks associated with investing in those securities.
As of November 30, 2016, certain of the Funds’ investments were valued using NAV per share (or its equivalent) as no quoted market value is available and have been excluded from the fair value hierarchy.
4. Securities and Other Investments:
Asset-Backed and Mortgage-Backed Securities: Asset-backed securities are generally issued as pass-through certificates or as debt instruments. Asset-backed securities issued as pass-through certificates represent undivided fractional ownership interests in an underlying pool of assets. Asset-backed securities issued as debt instruments, which are also known as collateralized obligations are typically issued as the debt of a special purpose entity organized solely for the purpose of owning such assets and issuing such debt. Asset-backed securities are often backed by a pool of assets representing the obligations of a number of different parties. The yield characteristics of certain asset-backed securities may differ from traditional debt securities. One such major difference is that all or a principal part of the obligations may be prepaid at any time because the underlying assets (i.e., loans) may be prepaid at any time. As a result, a decrease in interest rates in the market may result in increases in the level of prepayments as borrowers, particularly mortgagors, refinance and repay their loans. An increased prepayment rate with respect to an asset-backed security will have the effect of shortening the maturity of the security. In addition, a Fund may subsequently have to reinvest the proceeds at lower interest rates. If a Fund has purchased such an asset-backed security at a premium, a faster than anticipated prepayment rate could result in a loss of principal to the extent of the premium paid.
For mortgage pass-through securities (the “Mortgage Assets”), there are a number of important differences among the agencies and instrumentalities of the U.S. Government that issue mortgage-related securities and among the securities that they issue. For example, mortgage-related securities guaranteed by Ginnie Mae are guaranteed as to the timely payment of principal and interest by Ginnie Mae and such guarantee is backed by the full faith and credit of the United States. However, mortgage-related securities issued by Freddie Mac and Fannie Mae, including Freddie Mac and Fannie Mae guaranteed mortgage pass-through certificates, which are solely the obligations of Freddie Mac and Fannie Mae, are not backed by or entitled to the full faith and credit of the United States, but are supported by the right of the issuer to borrow from the U.S. Treasury.
Non-agency mortgage-backed securities are securities issued by non-governmental issuers and have no direct or indirect government guarantees of payment and are subject to various risks. Non-agency mortgage loans are obligations of the borrowers thereunder only and are not typically insured or guaranteed by any other person or entity. The ability of a borrower to repay a loan is dependent upon the income or assets of the borrower. A number of factors, including a general economic downturn, acts of God, terrorism, social unrest and civil disturbances, may impair a borrower’s ability to repay its loans.
TBA Commitments: TBA commitments are forward agreements for the purchase or sale of mortgage-backed securities for a fixed price, with payment and delivery on an agreed upon future settlement date. The specific securities to be delivered are not identified at the trade date. However, delivered securities must meet specified terms, including issuer, rate and mortgage terms. When entering into TBA commitments, a Fund may take possession of or deliver the underlying mortgage-backed securities but can extend the settlement or roll the transaction. TBA commitments involve a risk of loss if the value of the security to be purchased or sold declines or increases, respectively, prior to settlement date.
In order to better define contractual rights and to secure rights that will help a Fund mitigate their counterparty risk, TBA commitments may be entered into by a Fund under Master Securities Forward Transaction Agreements (each, an “MSFTA”). An MSFTA typically contains, among other things, collateral posting terms and netting provisions in the event of default and/or termination event. The collateral requirements are typically calculated by netting the mark-to-market amount for each transaction under such agreement and comparing that amount to the value of the collateral currently pledged by a Fund and the counterparty. Cash collateral that has been pledged to cover the obligations of a Fund and cash collateral received from
| | | | | | |
| | | | | | | |
| | BLACKROCK FUNDS | | NOVEMBER 30, 2016 | | 35 |
| | |
| Notes to Financial Statements (continued) | | |
the counterparty, if any, is reported separately on the Statements of Assets and Liabilities as cash pledged as collateral for TBA commitments or cash received as collateral for TBA commitments, respectively. Non-cash collateral pledged by a Fund, if any, is noted in the Schedule of Investments. Typically, a Fund is permitted to sell, repledge or use the collateral it receives; however, the counterparty is not permitted to do so. To the extent amounts due to a Fund is not fully collateralized, contractually or otherwise, a Fund bears the risk of loss from counterparty non-performance.
Mortgage Dollar Roll Transactions: Certain Fund may sell TBA mortgage-backed securities and simultaneously contract to repurchase substantially similar (i.e., same type, coupon and maturity) securities on a specific future date at an agreed upon price. During the period between the sale and repurchase, a Fund is not entitled to receive interest and principal payments on the securities sold. Mortgage dollar roll transactions are treated as purchases and sales and realize gains and losses on these transactions. Mortgage dollar rolls involve the risk that the market value of the securities that a Fund is required to purchase may decline below the agreed upon repurchase price of those securities.
Securities Lending: Certain Funds may lend their securities to approved borrowers, such as brokers, dealers and other financial institutions. The borrower pledges and maintains with the Funds collateral consisting of cash, an irrevocable letter of credit issued by a bank, or securities issued or guaranteed by the U.S. Government. The initial collateral received by each Fund is required to have a value of at least 102% of the current value of the loaned securities for securities traded on U.S. exchanges and a value of at least 105% for all other securities. The collateral is maintained thereafter at a value equal to at least 100% of the current market value of the securities on loan. The market value of the loaned securities is determined at the close of each business day of the Fund and any additional required collateral is delivered to the Fund, or excess collateral returned by the Fund, on the next business day. During the term of the loan, the Funds are entitled to all distributions made on or in respect of the loaned securities, but does not receive interest income on securities received as collateral. Loans of securities are terminable at any time and the borrower, after notice, is required to return borrowed securities within the standard time period for settlement of securities transactions.
The market value of any securities on loan, all of which were classified as common stocks/corporate bonds in the Funds’ Schedules of Investments, and the value of any related collateral are shown separately in the Statements of Assets and Liabilities as a component of investments at value-unaffiliated, and collateral on securities loaned at value, respectively. As of period end, any securities on loan were collateralized by cash and/or U.S. Government obligations. Cash collateral invested by the securities lending agent, BlackRock Investment Management, LLC (“BIM”), if any, is disclosed in the Schedules of Investments.
Securities lending transactions are entered into by the Funds under Master Securities Lending Agreements (each, an “MSLA”), which provide the right, in the event of default (including bankruptcy or insolvency), for the non-defaulting party to liquidate the collateral and calculate a net exposure to the defaulting party or request additional collateral. In the event that a borrower defaults, the Funds, as lender, would offset the market value of the collateral received against the market value of the securities loaned. When the value of the collateral is greater than that of the market value of the securities loaned, the lender is left with a net amount payable to the defaulting party. However, bankruptcy or insolvency laws of a particular jurisdiction may impose restrictions on or prohibitions against such a right of offset in the event of an MSLA counterparty’s bankruptcy or insolvency. Under the MSLA, absent an event of default the borrower can resell or re-pledge the loaned securities, and a Fund can reinvest cash collateral received in connection with loaned securities. Upon an event of default, the parties’ obligations to return the securities or collateral to the other party are extinguished, and the parties can resell or re-pledge the loaned securities or the collateral received in connection with the loaned securities in order to satisfy the defaulting party’s net payment obligation for all transactions under the MSLA. The defaulting party remains liable for any deficiency.
As of period end, the following table is a summary of securities lending agreements by counterparty which are subject to offset under an MSLA:
Impact U.S. Equity Fund
| | | | | | | | | | | | |
| Counterparty | | Securities
Loaned at Value | | | Cash
Collateral
Received1 | | | Net
Amount | |
Credit Suisse Securities (USA) LLC | | $ | 20,309 | | | $ | (20,309 | ) | | | — | |
| | 1 | | Cash collateral with a value of $20,461 has been received in connection with securities lending agreements. Collateral received in excess of the value of securities loaned from the individual counterparty is not shown for financial reporting purposes in the table above. |
The risks of securities lending include the risk that the borrower may not provide additional collateral when required or may not return the securities when due. To mitigate these risks, the Funds benefit from a borrower default indemnity provided by BIM. BIM’s indemnity allows for full replacement of the securities loaned if the collateral received does not cover the value on the securities loaned in the event of borrower default. Each Fund could suffer a loss if the value of an investment purchased with cash collateral falls below the market value of loaned securities or if the value of an investment purchased with cash collateral falls below the value of the original cash collateral received.
| | | | | | |
| | | | | | | |
| 36 | | BLACKROCK FUNDS | | NOVEMBER 30, 2016 | | |
| | | | |
| Notes to Financial Statements (continued) | | |
5. Derivative Financial Instruments:
The Funds engage in various portfolio investment strategies using derivative contracts both to increase the returns of the Funds and/or to manage their exposure to certain risks such as credit risk, equity risk, interest rate risk, foreign currency exchange rate risk, commodity price risk or other risks (e.g., inflation risk). Derivative financial instruments categorized by risk exposure are included in the Schedules of Investments. These contracts may be transacted on an exchange.
Futures Contracts: Certain Funds invest in long and/or short positions in futures and options on futures contracts to gain exposure to, or manage exposure to changes in interest rates (interest rate risk), changes in the value of equity securities (equity risk) or foreign currencies (foreign currency exchange rate risk).
Futures contracts are agreements between the Funds and a counterparty to buy or sell a specific quantity of an underlying instrument at a specified price and on a specified date. Depending on the terms of a contract, it is settled either through physical delivery of the underlying instrument on the settlement date or by payment of a cash amount on the settlement date. Upon entering into a futures contract, the Funds are required to deposit initial margin with the broker in the form of cash or securities in an amount that varies depending on a contract’s size and risk profile. The initial margin deposit must then be maintained at an established level over the life of the contract.
Securities deposited as initial margin are designated in the Schedules of Investments and cash deposited, if any, is shown as cash pledged for futures contracts in the Statements of Assets and Liabilities. Pursuant to the contract, the Funds agree to receive from or pay to the broker an amount of cash equal to the daily fluctuation in market value of the contract (“variation margin”). Variation margin is recorded as unrealized appreciation (depreciation) and, if any, shown as variation margin receivable (or payable) on futures contracts in the Statements of Assets and Liabilities. When the contract is closed, a realized gain or loss is recorded in the Statements of Operations equal to the difference between the value of the contract at the time it was opened and the value at the time it was closed. The use of futures contracts involves the risk of an imperfect correlation in the movements in the price of futures contracts and interest, foreign currency exchange rates or underlying assets.
6. Investment Advisory Agreement and Other Transactions with Affiliates:
The PNC Financial Services Group, Inc. is the largest stockholder and an affiliate of BlackRock, Inc. (“BlackRock”) for 1940 Act purposes.
Investment Advisory: The Trust, on behalf of the Funds, entered into an Investment Advisory Agreement with the Manager, the Funds’ investment adviser, an indirect, wholly-owned subsidiary of BlackRock, to provide investment advisory services. The Manager is responsible for the management of each Fund’s portfolio and provides the personnel, facilities, equipment and certain other services necessary to the operations of each Fund.
For such services, each Fund pays the Manager a monthly fee at an annual rate equal to the following percentages of the average daily value of each Fund’s net assets.
| | | | | | | | |
| | | Investment Advisory Fees | |
| Average Daily Net Assets | | Impact Bond Fund | | | Impact U.S.
Equity Fund | |
First $1 Billion | | | 0.30% | | | | 0.40% | |
$1 Billion — $3 Billion | | | 0.28% | | | | 0.38% | |
$3 Billion — $5 Billion | | | 0.27% | | | | 0.36% | |
$5 Billion — $10 Billion | | | 0.26% | | | | 0.35% | |
Greater than $10 Billion | | | 0.26% | | | | 0.34% | |
Service and Distribution Fees: The Trust, on behalf of the Funds, entered into a Distribution Agreement and a Distribution and Service Plan with BlackRock Investments, LLC (“BRIL”), an affiliate of the Manager. Pursuant to the Distribution and Service Plan and in accordance with Rule 12b-1 under the 1940 Act, each Fund pays BRIL ongoing service and distribution fees. The fees are accrued daily and paid monthly at annual rates based upon the average daily net assets of the relevant share class of each Fund as follows:
| | | | | | | | |
| | | Service Fee | | | Distribution Fee | |
Investor A | | | 0.25% | | | | — | |
Investor C | | | 0.25% | | | | 0.75% | |
BRIL and broker-dealers, pursuant to sub-agreements with BRIL, provide shareholder servicing and distribution services to the Funds. The ongoing service and/or distribution fee compensates BRIL and each broker-dealer for providing shareholder servicing and/or distribution related services to the shareholders.
| | | | | | |
| | | | | | | |
| | BLACKROCK FUNDS | | NOVEMBER 30, 2016 | | 37 |
| | |
| Notes to Financial Statements (continued) | | |
For the six months ended November 30, 2016, the following table shows the class specific service and distribution fees borne directly by each share class of each Fund:
| | | | | | | | | | | | | | | | | | | | |
| | | Institutional | | | Investor A | | | Investor C | | | Class K | | | Total | |
Impact Bond Fund | | | — | | | $ | 34 | | | $ | 134 | | | | — | | | $ | 168 | |
Impact U.S. Equity Fund | | | — | | | $ | 576 | | | $ | 335 | | | | — | | | $ | 911 | |
Administration: The Trust, on behalf of the Funds, entered into an Administration Agreement with the Manager, an indirect, wholly-owned subsidiary of BlackRock, to provide administrative services. For these services, the Manager receives an administration fee computed daily and payable monthly, based on a percentage of the average daily net assets of each Fund. The administration fee, which is shown as administration in the Statements of Operations, is paid at the annual rates below.
| | | | |
| Average Daily Net Assets | | Administration Fee | |
First $500 Million | | | 0.0425% | |
$500 Million — $1 Billion | | | 0.0400% | |
$1 Billion — $2 Billion | | | 0.0375% | |
$2 Billion — $4 Billion | | | 0.0350% | |
$4 Billion — $13 Billion | | | 0.0325% | |
Greater than $13 Billion | | | 0.0300% | |
In addition, the Manager charges each of the share classes an administration fee, which is shown as administration — class specific in the Statements of Operations, at an annual rate of 0.02% of the average daily net assets of each respective class.
For the six months ended November 30, 2016, the Funds paid the following to the Manager in return for these services, which are included in administration — class specific in the Statements of Operations:
| | | | | | | | | | | | | | | | | | | | |
| Administration Fees | | Institutional | | | Investor A | | | Investor C | | | Class K | | | Total | |
Impact Bond Fund | | $ | 1,065 | | | $ | 3 | | | $ | 3 | | | $ | 3 | | | $ | 1,074 | |
Impact U.S. Equity Fund | | $ | 2,195 | | | $ | 45 | | | $ | 7 | | | $ | 22 | | | $ | 2,269 | |
Transfer Agent: Pursuant to written agreements, certain financial intermediaries, some of which may be affiliates, provide the Funds with sub-accounting, recordkeeping, sub-transfer agency and other administrative services with respect to sub-accounts they service. For these services, these entities receive an asset-based fee or an annual fee per shareholder account, which will vary depending on share class and/or net assets.
The Manager maintains a call center that is responsible for providing certain shareholder services to the Funds. Shareholder services include responding to inquiries and processing subscriptions and redemptions transactions based upon instructions from shareholders. For the six months ended November 30, 2016, each Fund reimbursed the Manager the following amounts for costs incurred in running the call center, which are included in transfer agent — class specific in the Statements of Operations:
| | | | | | | | | | | | | | | | | | | | |
| | | Institutional | | | Investor A | | | Investor C | | | Class K | | | Total | |
Impact Bond Fund | | $ | 8 | | | | — | | | | — | | | | — | | | $ | 8 | |
Impact U.S. Equity Fund | | $ | 11 | | | $ | 7 | | | | — | | | $ | 2 | | | $ | 20 | |
For the six months ended November 30, 2016, the following table shows the class specific transfer agent fees borne directly by each class of each Fund:
| | | | | | | | | | | | | | | | | | | | |
| | | Institutional | | | Investor A | | | Investor C | | | Class K | | | Total | |
Impact Bond Fund | | $ | 1,079 | | | $ | 6 | | | $ | 8 | | | $ | 8 | | | $ | 1,101 | |
Impact U.S. Equity Fund | | $ | 473 | | | $ | 277 | | | $ | 30 | | | $ | 54 | | | $ | 834 | |
Other Fees: For the six months ended November 30, 2016, affiliates earned underwriting discounts, direct commissions and dealer concessions on sales of each Fund’s Investor A Shares as follows:
| | | | |
| | | Investor A | |
Impact Bond Fund | | | — | |
Impact U.S. Equity Fund | | $ | 130 | |
For the six months ended November 30, 2016, affiliates did not receive CDSCs for Investor C Shares.
| | | | | | |
| | | | | | | |
| 38 | | BLACKROCK FUNDS | | NOVEMBER 30, 2016 | | |
| | | | |
| Notes to Financial Statements (continued) | | |
Expense Limitations, Waivers, Reimbursements, and Recoupments: With respect to each Fund, the Manager contractually agreed to waive and/or reimburse fees or expenses in order to limit expenses, excluding interest expense, dividend expense, tax expense, acquired fund fees and expenses, and certain other fund expenses, which constitute extraordinary expenses not incurred in the ordinary course of each Fund’s business (“expense limitation”). The expense limitations as a percentage of average daily net assets are as follows:
| | | | | | | | |
| | | Impact Bond Fund | | | Impact U.S. Equity Fund | |
Institutional | | | 0.45% | | | | 0.65% | |
Investor A | | | 0.70% | | | | 0.90% | |
Investor C | | | 1.45% | | | | 1.65% | |
Class K | | | 0.40% | | | | 0.60% | |
The Manager has agreed not to reduce or discontinue these contractual expense limitations prior to September 30, 2017, unless approved by the Board, including a majority of the trustees, who are not “interested persons” of the Funds, as defined in the 1940 Act (“Independent Trustees”) or by a vote of a majority of the outstanding voting securities of the Funds. These amounts waived and/or reimbursed are shown as administration fees waived, administration fees waived — class specific, transfer agent fees reimbursed — class specific and fees waived and/or reimbursed by the Manager, respectively, in the Statements of Operations. For the six months ended November 30, 2016, the amounts included in fees waived and/or reimbursed by the Manager in the Statements of Operations were as follows:
| | | | |
| | | Total | |
Impact Bond Fund | | $ | 76,283 | |
Impact U.S. Equity Fund | | $ | 146,661 | |
With respect to each Fund, the Manager voluntarily agreed to waive its investment advisory fees by the amount of investment advisory fees each Fund pays to the Manager indirectly through its investment in affiliated money market funds. These amounts are included in fees waived and/or reimbursed by the Manager in the Statements of Operations.
For the six months ended November 30, 2016, the amounts waived were as follows:
| | | | |
| | | Total | |
Impact Bond Fund | | $ | 549 | |
Impact U.S. Equity Fund | | $ | 56 | |
Effective September 1, 2016, the Manager voluntarily agreed to waive its advisory fee with respect to any portion of each Fund’s assets invested in affiliated equity or fixed-income mutual funds or affiliated exchange-traded funds. Prior to September 1, 2016, the Manager did not waive such fees. This voluntary waiver may be reduced or discontinued at any time without notice. With respect to Impact U.S. Equity Fund, on September 28, 2016, this waiver became contractual through September 30, 2017. The contractual agreement may be terminated upon 90 days’ notice by a majority of the non-interested directors of the Corporation or by a vote of a majority of the outstanding voting securities of the Funds.
Class specific expense waivers and/or reimbursements are as follows:
Administration Fees Waived
| | | | | | | | | | | | | | | | | | | | |
| | | Institutional | | | Investor A | | | Investor C | | | Class K | | | Total | |
Impact Bond Fund | | | — | | | $ | 1 | | | $ | 3 | | | $ | 3 | | | $ | 7 | |
Impact U.S. Equity Fund | | | — | | | $ | 43 | | | $ | 1 | | | $ | 22 | | | $ | 66 | |
Transfer Agent Fees Reimbursed
| | | | | | | | | | | | | | | | | | | | |
| | | Institutional | | | Investor A | | | Investor C | | | Class K | | | Total | |
Impact Bond Fund | | | — | | | | — | | | $ | 2 | | | $ | 8 | | | $ | 10 | |
Impact U.S. Equity Fund | | | — | | | $ | 178 | | | $ | 25 | | | $ | 53 | | | $ | 256 | |
| | | | | | |
| | | | | | | |
| | BLACKROCK FUNDS | | NOVEMBER 30, 2016 | | 39 |
| | |
| Notes to Financial Statements (continued) | | |
With respect to the contractual expense caps, if during a Fund’s fiscal year the operating expenses of a share class, that at any time during the prior two fiscal years received a waiver and/or reimbursement from the Manager, are less than the expense cap for that share class, the Manager is entitled to be reimbursed by such share class up to the lesser of the following expenses:
| | (a) | The amount of fees waived and/or expenses reimbursed during those prior two fiscal years under the agreement. |
| | (b) | The amount by which the expense cap for that share class exceeds the operating expenses of the share class for the current fiscal year, provided that: |
| | • | | Each Fund, of which the share class is a part, has more than $50 million in assets for the fiscal year; and |
| | • | | The Manager or an affiliate continues to serve as a Fund’s investment adviser or administrator. |
In the event the expense cap for a share class is changed subsequent to a fiscal year in which the Manager becomes entitled to reimbursement for fees waived and/or reimbursed, the amount available to reimburse the Manager shall be calculated by reference to the expense cap for that share class in effect at the time the Manager became entitled to receive such reimbursement, rather than the subsequently changed expense cap for that share class.
On November 30, 2016, the fund level and class specific waivers and/or reimbursements subject to possible future recoupment under the expense limitation agreement are as follows:
| | | | | | | | | | | | |
| | | Expiring May 31, 2018 | | | Expiring May 31, 2019 | |
| | | Impact U.S. Equity Fund | | | Impact Bond Fund | | | Impact U.S. Equity Fund | |
Fund Level | | $ | 217,121 | | | $ | 75,861 | | | $ | 151,481 | |
Institutional | | $ | 2,859 | | | | — | | | | — | |
Investor A | | $ | 82 | | | $ | 2 | | | $ | 221 | |
Investor C | | $ | 64 | | | $ | 5 | | | $ | 26 | |
Class K | | $ | 23 | | | $ | 11 | | | $ | 75 | |
Securities Lending: The U.S. Securities and Exchange Commission has issued an exemptive order which permits BIM, an affiliate of the Manager, to serve as securities lending agent for the Funds, subject to applicable conditions. As securities lending agent, BIM bears all operational costs directly related to securities lending. The Funds are responsible for expenses in connection with the investment of cash collateral received for securities on loan (the “collateral investment expenses”). The cash collateral is invested in a private investment company managed by the Manager or its affiliates. However, BIM has agreed to cap the collateral investment expenses of the private investment company to an annual rate of 0.04%. The investment adviser to the private investment company will not charge any advisory fees with respect to shares purchased by the Funds.
Securities lending income is equal to the total of income earned from the reinvestment of cash collateral, net of fees and other payments to and from borrowers of securities, and less the collateral investment expenses. Each Fund retains a portion of securities lending income and remits a remaining portion to BIM as compensation for its services as securities lending agent.
Pursuant to such agreement, each Fund retains 80% of securities lending income. In addition, commencing the business day following the date that the aggregate securities lending income earned across certain funds in the Equity-Liquidity Complex in a calendar year exceeds a specified threshold, each Fund, pursuant to the securities lending agreement, will retain for the remainder of the calendar year securities lending income in an amount equal to 85% of securities lending income.
The share of securities lending income earned by Impact U.S. Equity Fund is shown as securities lending — affiliated — net in the Statements of Operations. For the six months ended November 30, 2016, the Fund paid BIM $205 for securities lending agent services.
Officers and Trustees: Certain officers and/or trustees of the Trusts are officers and/or trustees of BlackRock or its affiliates. The Funds reimburse the Manager for a portion of the compensation paid to the Funds’ Chief Compliance Officer, which is included in Officer and Trustees in the Statements of Operations.
| | | | | | |
| | | | | | | |
| 40 | | BLACKROCK FUNDS | | NOVEMBER 30, 2016 | | |
| | | | |
| Notes to Financial Statements (continued) | | |
7. Purchases and Sales:
For the six months ended November 30, 2016, purchases and sales of investments, excluding short-term securities were as follows:
| | | | | | | | |
| | | Impact Bond Fund | | | Impact U.S.
Equity Fund | |
Purchases | | $ | 89,688,354 | | | $ | 11,087,144 | |
Sales | | $ | 43,083,019 | | | $ | 9,924,625 | |
For the six months ended November 30, 2016, purchases and sales related to mortgage dollar rolls for Impact Bond Fund were $11,701,840 and $11,715,487, respectively.
8. Income Tax Information:
It is the Funds’ policy to comply with the requirements of the Internal Revenue Code of 1986, as amended, applicable to regulated investment companies, and to distribute substantially all of their taxable income to their shareholders. Therefore, no federal income tax provision is required.
Each Fund files U.S. federal and various state and local tax returns. No income tax returns are currently under examination. The statute of limitations on Impact U.S. Equity Fund’s U.S. federal tax return generally remains open for the period ended May 31, 2016.
Management has analyzed tax laws and regulations and their application to the Funds as of November 30, 2016, inclusive of the open tax return years, and does not believe that there are any uncertain tax positions that require recognition of a tax liability in the Funds’ financial statements.
As of November 30, 2016, gross unrealized appreciation and depreciation based on cost for federal income tax purposes were as follows:
| | | | | | | | | | | | |
| | | Impact Bond Fund | | | Impact U.S.
Equity Fund | | | | |
Tax cost | | $ | 26,999,048 | | | $ | 22,280,554 | | | | | |
| | | | |
Gross unrealized appreciation | | $ | 5,870 | | | $ | 2,477,017 | | | | | |
Gross unrealized depreciation | | | (500,121 | ) | | | (500,386 | ) | | | | |
| | | | |
Net unrealized appreciation (depreciation) | | $ | (494,251 | ) | | $ | 1,976,631 | | | | | |
| | | | |
9. Bank Borrowings:
The Trust, on behalf of the Funds, along with certain other funds managed by the Manager and its affiliates (“Participating Funds”), is a party to a 364-day, $2.1 billion credit agreement with a group of lenders. Under this agreement, the Funds may borrow to fund shareholder redemptions. Excluding commitments designated for certain individual funds, the Participating Funds, including the Funds, can borrow up to an aggregate commitment amount of $1.6 billion at any time outstanding, subject to asset coverage and other limitations as specified in the agreement. The credit agreement has the following terms: a fee of 0.12% per annum on unused commitment amounts and interest at a rate equal to the higher of (a) one-month LIBOR (but, in any event, not less than 0.00%) on the date the loan is made plus 0.80% per annum or (b) the Fed Funds rate (but, in any event, not less than 0.00%) in effect from time to time plus 0.80% per annum on amounts borrowed. The agreement expires in April 2017 unless extended or renewed. Prior to April 21, 2016, the credit agreement had a fee per annum of 0.06% on unused commitment amounts and interest at a rate equal to the higher of (a) one-month LIBOR (but, in any event, not less than 0.00%) on the date the loan is made plus 0.80% per annum or (b) the Fed Funds rate (but, in any event, not less than 0.00%) in effect from time to time plus 0.80% per annum on amounts borrowed. Participating Funds paid administration, legal and arrangement fees, which, if applicable, are included in miscellaneous expenses in the Statements of Operations. These fees were allocated among such funds based upon portions of the aggregate commitment available to them and relative net assets of Participating Funds. During the six months ended November 30, 2016, the Funds did not borrow under the credit agreement.
10. Principal Risks:
In the normal course of business, certain Funds invest in securities and enter into transactions where risks exist due to fluctuations in the market (market risk) or failure of the issuer to meet all its obligations, including the ability to pay principal and interest when due (issuer credit risk). The value of securities held by the Funds may decline in response to certain events, including those directly involving the issuers of securities owned by the Funds. Changes arising from the general economy, the overall market and local, regional or global political and/or social instability, as well as currency, interest rate and price fluctuations, may also affect the securities’ value.
| | | | | | |
| | | | | | | |
| | BLACKROCK FUNDS | | NOVEMBER 30, 2016 | | 41 |
| | |
| Notes to Financial Statements (continued) | | |
Impact Bond Fund may be exposed to prepayment risk, which is the risk that borrowers may exercise their option to prepay principal earlier than scheduled during periods of declining interest rates, which would force the Fund to reinvest in lower yielding securities. The Fund may also be exposed to reinvestment risk, which is the risk that income from the Fund’s portfolio will decline if the Fund invests the proceeds from matured, traded or called fixed income securities at market interest rates that are below the Fund portfolio’s current earnings rate.
On October 11, 2016, BlackRock implemented certain changes required by amendments to Rule 2a-7 under the 1940 Act, which governs the operations of U.S. money market funds. The Funds may be exposed to additional risks when reinvesting cash collateral in money market funds that do not seek to maintain a stable NAV per share of $1.00 and which may be subject to redemption gates or liquidity fees under certain circumstances.
Valuation Risk: The market values of equities, such as common stocks and preferred securities or equity related investments, such as futures and options, may decline due to general market conditions which are not specifically related to a particular company. They may also decline due to factors which affect a particular industry or industries. A Fund may invest in illiquid investments and may experience difficulty in selling those investments in a timely manner at the price that it believes the investments are worth. Prices may fluctuate widely over short or extended periods in response to company, market or economic news. Markets also tend to move in cycles, with periods of rising and falling prices. This volatility may cause each Fund’s NAV to experience significant increases or decreases over short periods of time. If there is a general decline in the securities and other markets, the NAV of a Fund may lose value, regardless of the individual results of the securities and other instruments in which the Fund invests.
The price a Fund could receive upon the sale of any particular portfolio investment may differ from a Fund’s valuation of the investment, particularly for securities that trade in thin or volatile markets or that are valued using a fair valuation technique or a price provided by an independent pricing service. Changes to significant unobservable inputs and assumptions (i.e., publicly traded company multiples, growth rate, time to exit) due to the lack of observable inputs may significantly impact the resulting fair value and therefore a Fund’s results of operations. As a result, the price received upon the sale of an investment may be less than the value ascribed by a Fund, and a Fund could realize a greater than expected loss or lesser than expected gain upon the sale of the investment. A Fund’s ability to value its investments may also be impacted by technological issues and/or errors by pricing services or other third party service providers.
Counterparty Credit Risk: Similar to issuer credit risk, the Funds may be exposed to counterparty credit risk, or the risk that an entity may fail to or be unable to perform on its commitments related to unsettled or open transactions. The Funds manage counterparty credit risk by entering into transactions only with counterparties that the Manager believes have the financial resources to honor their obligations and by monitoring the financial stability of those counterparties. Financial assets, which potentially expose the Funds to market, issuer and counterparty credit risks, consist principally of financial instruments and receivables due from counterparties. The extent of the Funds’ exposure to market, issuer and counterparty credit risks with respect to these financial assets is approximately their value recorded in the Statements of Assets and Liabilities, less any collateral held by the Funds.
A derivative contract may suffer a mark-to-market loss if the value of the contract decreases due to an unfavorable change in the market rates or values of the underlying instrument. Losses can also occur if the counterparty does not perform under the contract.
With exchange-traded futures, there is less counterparty credit risk to the Funds since the exchange or clearinghouse, as counterparty to such instruments, guarantees against a possible default. The clearinghouse stands between the buyer and the seller of the contract; therefore, credit risk is limited to failure of the clearinghouse. While offset rights may exist under applicable law, a Fund does not have a contractual right of offset against a clearing broker or clearinghouse in the event of a default (including the bankruptcy or insolvency). Additionally, credit risk exists in exchange-traded futures with respect to initial and variation margin that is held in a clearing broker’s customer accounts. While clearing brokers are required to segregate customer margin from their own assets, in the event that a clearing broker becomes insolvent or goes into bankruptcy and at that time there is a shortfall in the aggregate amount of margin held by the clearing broker for all its clients, typically the shortfall would be allocated on a pro rata basis across all the clearing broker’s customers, potentially resulting in losses to the Funds.
Concentration Risk: Impact Bond Fund invests a significant portion of its assets in fixed income securities and/or uses derivatives tied to the fixed income markets. Changes in market interest rates or economic conditions may affect the value and/or liquidity of such investments. Interest rate risk is the risk that prices of bonds and other fixed income securities will increase as interest rates fall and decrease as interest rates rise. The Fund may be subject to a greater risk of rising interest rates due to the current period of historically low rates.
| | | | | | |
| | | | | | | |
| 42 | | BLACKROCK FUNDS | | NOVEMBER 30, 2016 | | |
| | |
| Notes to Financial Statements (continued) | | |
11. Capital Share Transactions:
Transactions in capital shares for each class were as follows:
| | | | | | | | | | | | | | | | | | | | |
| | | | | | | | | | | | Period
August 23, 20161
to November 30, 2016 | |
| Impact Bond Fund | | | | | | | | | | | Shares | | | Amount | |
| Institutional | | | | | | | | | | | | | | | | | | | | |
Shares sold | | | | 1,986,009 | | | $ | 19,860,000 | |
Shares issued in reinvestment of distributions | | | | 2 | | | | 17 | |
| | | | | | | | | | | | |
Net increase | | | | 1,986,011 | | | $ | 19,860,017 | |
| | | | | | | | | | | | |
| | | | | | | | | | | | | | | | | | | | |
| Investor A | | | | | | | | | | | | | | | | | | | | |
Shares sold | | | | 5,000 | | | $ | 50,000 | |
| | | | | | | | | | | | |
Net increase | | | | 5,000 | | | $ | 50,000 | |
| | | | | | | | | | | | |
| | | | | | | | | | | | | | | | | | | | |
| Investor C | | | | | | | | | | | | | | | | | | | | |
Shares sold | | | | 5,000 | | | $ | 50,000 | |
| | | | | | | | | | | | |
Net increase | | | | 5,000 | | | $ | 50,000 | |
| | | | | | | | | | | | |
| | | | | | | | | | | | | | | | | | | | |
| Class K | | | | | | | | | | | | | | | | | | | | |
Shares sold | | | | 5,000 | | | $ | 50,000 | |
| | | | | | | | | | | | |
Net increase | | | | 5,000 | | | $ | 50,000 | |
| | | | | | | | | | | | |
Total Net Increase | | | | 2,001,011 | | | $ | 20,010,017 | |
| | | | | | | | | | | | |
| | | |
| | | Six Months Ended
November 30, 2016 | | | | | | Period
October 5, 20151
to May 31, 2016 | |
| Impact U.S. Equity Fund | | Shares | | | Amount | | | | | | Shares | | | Amount | |
| Institutional | | | | | | | | | | | | | | | | | | | | |
Shares sold | | | 70,559 | | | $ | 758,357 | | | | | | | | 2,009,171 | | | $ | 20,096,042 | |
Shares issued in reinvestment of distributions | | | 108 | | | | 1,164 | | | | | | | | 1 | | | | 12 | |
Shares redeemed | | | (2,989 | ) | | | (33,546 | ) | | | | | | | — | | | | — | |
| | | | | | | | | | | | |
Net increase | | | 67,678 | | | $ | 725,975 | | | | | | | | 2,009,172 | | | $ | 20,096,054 | |
| | | | | | | | | | | | |
| | | | | | | | | | | | | | | | | | | | |
| Investor A | | | | | | | | | | | | | | | | | | | | |
Shares sold | | | 24,655 | | | $ | 267,365 | | | | | | | | 29,225 | | | $ | 290,334 | |
Shares issued in reinvestment of distributions | | | 155 | | | | 1,664 | | | | | | | | 35 | | | | 352 | |
Shares redeemed | | | (735 | ) | | | (7,808 | ) | | | | | | | — | | | | — | |
| | | | | | | | | | | | |
Net increase | | | 24,075 | | | $ | 261,221 | | | | | | | | 29,260 | | | $ | 290,686 | |
| | | | | | | | | | | | |
| | | | | | | | | | | | | | | | | | | | |
| Investor C | | | | | | | | | | | | | | | | | | | | |
Shares sold | | | 11,496 | | | $ | 124,859 | | | | | | | | 2,500 | | | $ | 25,000 | |
Shares issued in reinvestment of distributions | | | 1 | | | | 11 | | | | | | | | — | | | | — | |
| | | | | | | | | | | | |
Net increase | | | 11,497 | | | $ | 124,870 | | | | | | | | 2,500 | | | $ | 25,000 | |
| | | | | | | | | | | | |
| | | | | | | | | | | | | | | | | | | | |
| Class K2 | | | | | | | | | | | | | | | | | | | | |
Shares sold | | | — | | | | — | | | | | | | | 19,802 | | | $ | 200,000 | |
| | | | | | | | | | | | |
Net increase | | | — | | | | — | | | | | | | | 19,802 | | | $ | 200,000 | |
| | | | | | | | | | | | |
Total Net Increase | | | 103,250 | | | $ | 1,112,066 | | | | | | | | 2,060,734 | | | $ | 20,611,740 | |
| | | | | | | | | | | | |
| | 1 | | Commencement of operations. |
| | 2 | | Commenced operations on March 28, 2016. |
| | | | | | |
| | | | | | | |
| | BLACKROCK FUNDS | | NOVEMBER 30, 2016 | | 43 |
| | |
| Notes to Financial Statements (concluded) | | |
At period end, shares owned by BlackRock HoldCo 2, Inc., an affiliate of the Funds, were as follows:
| | | | | | | | |
| | | Impact Bond Fund | | | Impact U.S. Equity Fund | |
Institutional | | | 1,985,000 | | | | 1,995,000 | |
Investor A | | | 5,000 | | | | 2,500 | |
Investor C | | | 5,000 | | | | 2,500 | |
Class K | | | 5,000 | | | | 19,802 | |
12. Subsequent Events:
Management has evaluated the impact of all subsequent events on the Funds through the date the financial statements were issued and has determined that there were no subsequent events requiring adjustment or additional disclosure in the financial statements.
| | | | | | |
| | | | | | | |
| 44 | | BLACKROCK FUNDS | | NOVEMBER 30, 2016 | | |
| | |
| Disclosure of Investment Advisory Agreement and Sub-Advisory Agreement | | |
The Board of Trustees (the “Board,” and the members of which are referred to as “Board Members”) of BlackRock FundsSM (the “Trust”) met in person on May 18-20, 2016 (the “Meeting”) to consider the approval of the Trust’s proposed investment advisory agreement (the “Advisory Agreement”) with BlackRock Advisors, LLC (the “Manager”), the Trust’s investment advisor, on behalf of BlackRock Impact Bond Fund (the “Fund”), a portfolio of the Trust. The Advisory Agreement was the same agreement that had previously been approved by the Board with respect to other portfolios of the Trust. The Board also considered the approval of the proposed sub-advisory agreement (the “Sub-Advisory Agreement”) between the Manager and BlackRock International Limited (the “Sub-Advisor”) with respect to the Fund. The Sub-Advisory Agreement was substantially the same as the sub-advisory agreements previously approved with respect to certain other portfolios of the Trust. The Advisory Agreement and the Sub-Advisory Agreement are referred to herein as the “Agreements.” The Manager and the Sub-Advisor are referred to herein as “BlackRock.” The Fund commenced operations in August 2016.
Activities and Composition of the Board
On the date of the Meeting, the Board consisted of fifteen individuals, thirteen of whom were not “interested persons” of the Trust as defined in the Investment Company Act of 1940, as amended (the “1940 Act”) (the “Independent Board Members”). The Board Members are responsible for the oversight of the operations of the Fund and perform the various duties imposed on the directors of investment companies by the 1940 Act. The Independent Board Members have retained independent legal counsel to assist them in connection with their duties. The Chair of the Board is an Independent Board Member. The Board has established five standing committees: an Audit Committee, a Governance and Nominating Committee, a Compliance Committee, a Performance Oversight and Contract Committee and an Executive Committee, each of which is chaired by an Independent Board Member and composed of Independent Board Members (except for the Executive Committee, which also has one interested Board Member).
The Agreements
Pursuant to the 1940 Act, the Board is required to consider the initial approval of the Agreements. In connection with this process, the Board assessed, among other things, the nature, extent and quality of the services to be provided to the Fund by BlackRock, BlackRock’s personnel and affiliates, including (as applicable): investment management; administrative and shareholder services; the oversight of fund service providers; marketing; risk oversight; compliance; and ability to meet applicable legal and regulatory requirements.
Board Considerations in Approving the Agreements
The Approval Process: At the Meeting, the Board reviewed materials relating to its consideration of the Agreements. The Board considered all factors it believed relevant with respect to the Trust and the Fund, including, among other factors: (a) the nature, extent and quality of the services to be provided by BlackRock; (b) the investment performance of BlackRock portfolio management; (c) the advisory fee and the cost of the services and profits to be realized by BlackRock and its affiliates from their relationship with the Fund; (d) the sharing of potential economies of scale; (e) fall out benefits to BlackRock and its affiliates from their relationship with the Fund; (f) possible alternatives to the proposed Agreements; (g) the policies and practices of BlackRock with respect to portfolio transactions for the Fund; (h) BlackRock’s portfolio compliance systems and capabilities; and (i) other factors deemed relevant by the Board Members.
In considering approval of the Agreements, the Board met with the relevant investment advisory personnel from BlackRock and considered all information it deemed reasonably necessary to evaluate the terms of the Agreements. The Board received materials in advance of the Meeting relating to its consideration of the Agreements, including fees and estimated expense ratios of each class of the Fund, and for a representative class of the Fund, as compared with the fees and expense ratios of a peer group of funds as determined by Broadridge Financial Solutions, Inc. (“Broadridge”)1. The Board also received (a) information regarding BlackRock’s economic outlook for the Fund and its general investment outlook for the markets; (b) information regarding fees paid to service providers that are affiliates of BlackRock; and (c) information outlining the legal duties of the Board under the 1940 Act with respect to the consideration and approval of the Agreements. The Board also noted information received at prior Board meetings concerning compliance records and regulatory matters relating to BlackRock.
The Board also considered other matters it deemed important to the approval process, such as payments made to BlackRock or its affiliates relating to the distribution of Fund shares, securities lending and cash management, services related to the valuation and pricing of Fund portfolio holdings, direct and indirect benefits to BlackRock and its affiliates from their relationship with the Fund and advice from independent legal counsel with respect to the review process and materials submitted for the Board’s review. The Board noted the willingness of BlackRock personnel to engage in open, candid discussions with the Board. The Board did not identify any particular information as determinative, and each Board Member may have attributed different weights to the various items considered.
| 1 | | Funds are ranked by Broadridge in quartiles, ranging from first to fourth, where first is the most desirable quartile position and fourth is the least desirable. |
| | | | | | |
| | | | | | | |
| | BLACKROCK FUNDS | | NOVEMBER 30, 2016 | | 45 |
| | | | |
| Disclosure of Investment Advisory Agreement and Sub-Advisory Agreement (continued) | | |
A. Nature, Extent and Quality of the Services: The Board, including the Independent Board Members, reviewed the nature, extent and quality of services to be provided by BlackRock, including the investment advisory services to be provided to the Fund. The Board received information concerning the investment philosophy and investment process to be used by BlackRock in managing the Fund, as well as a description of the capabilities, personnel and services of BlackRock. In connection with this review, the Board considered BlackRock’s in-house research capabilities as well as other resources available to its personnel. The Board considered the scope of the services provided by BlackRock to the Fund under the Agreements relative to services typically provided by third parties to other funds. The Board noted that the standard of care applicable under the Agreements was comparable to that found generally in investment company advisory agreements. The Board concluded that the scope of BlackRock’s services to be provided to the Fund was consistent with the Fund’s operational requirements, including, in addition to seeking to meet its investment objective(s), compliance with investment restrictions, tax and reporting requirements and related shareholder services.
The Board, including the Independent Board Members, also considered the quality of the administrative and other non-investment advisory services to be provided by BlackRock and its affiliates to the Fund. The Board evaluated the procedures of BlackRock designed to fulfill its fiduciary duty to the Fund with respect to possible conflicts of interest, including BlackRock’s code of ethics (regulating the personal trading of BlackRock’s officers and employees), the procedures by which BlackRock allocates trades among its various investment advisory clients, the integrity of the systems in place to ensure compliance with the foregoing and the record of BlackRock in these matters. The Board also noted information received at prior Board meetings concerning standards of BlackRock with respect to the execution of portfolio transactions.
The Board considered, among other factors, with respect to BlackRock: the number, education and experience of investment personnel generally and the Fund’s portfolio management team; BlackRock’s research capabilities; investments by portfolio managers in the funds they manage; portfolio trading capabilities; use of technology; commitment to compliance; credit analysis capabilities; risk analysis and oversight capabilities; and the approach to training and retaining portfolio managers and other research, advisory and management personnel. The Board reviewed BlackRock’s compensation structure with respect to the Fund’s portfolio management team and BlackRock’s ability to attract and retain high-quality talent and create performance incentives. The Board also considered the business reputation of BlackRock and its financial resources and concluded that BlackRock would be able to meet any reasonably foreseeable obligation under the Agreements.
In addition to investment advisory services, the Board considered the quality of the administrative and other non-investment advisory services to be provided to the Fund. The Board noted that BlackRock and its affiliates will provide the Fund with certain administrative, shareholder and other services (in addition to any such services provided to the Fund by third parties) and officers and other personnel as are necessary for the operations of the Fund. In particular, BlackRock and its affiliates will provide the Fund with administrative services, including, among others: (i) preparing disclosure documents, such as the prospectus, the summary prospectus, the statement of additional information and periodic shareholder reports; (ii) oversight of daily accounting and pricing; (iii) preparing periodic filings with regulators; (iv) overseeing and coordinating the activities of other service providers; (v) organizing Board meetings and preparing the materials for such Board meetings; (vi) providing legal and compliance support; (vii) furnishing analytical and other support to assist the Board in its consideration of strategic issues such as the merger, consolidation or repurposing of certain open-end funds; and (viii) performing other administrative functions necessary for the operation of the Fund, such as tax reporting, fulfilling regulatory filing requirements and call center services. The Board reviewed the structure and duties of BlackRock’s fund administration, shareholder services, and legal & compliance departments and considered BlackRock’s policies and procedures for assuring compliance with applicable laws and regulations.
B. The Investment Performance of the Fund and BlackRock: With respect to the Meeting, the Board, including the Independent Board Members, previously received and considered information about BlackRock’s investment performance for other funds. The Board, however, did not consider the performance history of the Fund because the Fund was newly organized and had not yet commenced operations as of the date of the Meeting.
C. Consideration of the Advisory Fees and the Cost of the Services and Profits to be Realized by BlackRock and its Affiliates from their Relationship with the Fund: In connection with the initial approval of the Agreements, the Board, including the Independent Board Members, reviewed the Fund’s contractual management fee rate compared with the other funds in its Broadridge category. The contractual management fee rate represents a combination of the advisory fee and any administrative fees, before taking into account any reimbursements or fee waivers. The Board also compared the Fund’s estimated total expense ratio, as well as its estimated actual management fee rate, to those of other funds in its Broadridge category. The total expense ratio represents a fund’s total net operating expenses, including any 12b-1 or non 12b-1 service fees. The total expense ratio gives effect to any expense reimbursements or fee waivers that benefit a fund, and the actual management fee rate gives effect to any management fee reimbursements or waivers that benefit a fund. Additionally, the Board noted information received at prior Board meetings concerning the services provided and the fees charged by BlackRock and its affiliates to other types of clients with similar investment mandates, as applicable, including institutional accounts and sub-advised mutual funds (including mutual funds sponsored by third parties).
| | | | | | |
| | | | | | | |
| 46 | | BLACKROCK FUNDS | | NOVEMBER 30, 2016 | | |
| | |
| Disclosure of Investment Advisory Agreement and Sub-Advisory Agreement (concluded) | | |
The Board noted that the Fund’s contractual management fee rate ranked in the first quartile, and that the estimated actual management fee rate and the estimated total expense ratio ranked in the second and first quartiles, respectively, relative to the Fund’s Expense Peers. The Board also noted that BlackRock has contractually agreed to a cap on the Fund’s total net operating expenses as a percentage of the Fund’s average daily net assets on a class-by-class basis. The Board further noted that the Fund has an advisory fee arrangement that includes breakpoints that adjust the fee rate downward as the size of the Fund increases above certain contractually specified levels.
Following consideration of this information, as pertinent, the Board, including the independent Board Members, concluded that the fees to be paid pursuant to the Agreements were fair and reasonable in light of the services provided.
As the Fund had not commenced operations as of the date of the Meeting, BlackRock was not able to provide the Board with specific information concerning the expected profits to be realized by BlackRock and its affiliates from their relationships with the Fund. BlackRock, however, will provide the Board with such information at future meetings.
D. Economies of Scale: The Board, including the Independent Board Members, considered the extent to which economies of scale might be realized as the assets of the Fund increase. The Board also noted the existence of expense caps.
E. Other Factors Deemed Relevant by the Board Members: The Board, including a majority of the Independent Board Members, also took into account other ancillary or “fall-out” benefits that BlackRock or its affiliates may derive from their respective relationships with the Fund, both tangible and intangible, such as BlackRock’s ability to leverage its investment professionals who manage other portfolios and risk management personnel, an increase in BlackRock’s profile in the investment advisory community, and the engagement of BlackRock’s affiliates as service providers to the Fund, including for administrative, distribution, securities lending and cash management services. The Board also considered BlackRock’s overall operations and its efforts to expand the scale of, and improve the quality of, its operations. The Board also noted that BlackRock may use and benefit from third party research obtained by soft dollars generated by certain registered fund transactions to assist in managing all or a number of its other client accounts. The Board further noted that it had considered the investment by BlackRock’s funds in affiliated ETFs without any offset against the management fees payable by the funds to BlackRock.
The Board, including the Independent Board Members, concluded that these ancillary benefits that BlackRock and its affiliates could receive with regard to providing investment advisory and other services to the Fund were consistent with those generally available to other mutual fund sponsors.
Conclusion
The Board, including a majority of the Independent Board Members, approved the Advisory Agreement between the Manager and the Trust, on behalf of the Fund, and the Sub-Advisory Agreement between the Manager and the Sub-Advisor with respect to the Fund, each for a two-year term beginning on the effective date of the Agreements. Based upon its evaluation of all of the aforementioned factors in their totality, the Board, including a majority of the Independent Board Members, was satisfied that the terms of the Agreements were fair and reasonable and in the best interest of the Fund and its shareholders. In arriving at a decision to approve the Agreements, the Board did not identify any single factor or group of factors as all-important or controlling, but considered all factors together, and different Board Members may have attributed different weights to the various factors considered. The Independent Board Members were also assisted by the advice of independent legal counsel in making this determination.
| | | | | | |
| | | | | | | |
| | BLACKROCK FUNDS | | NOVEMBER 30, 2016 | | 47 |
Rodney D. Johnson, Chair of the Board and Trustee
David O. Beim, Trustee
Susan J. Carter, Trustee
Collette Chilton, Trustee
Neil A. Cotty, Trustee
Dr. Matina S. Horner, Trustee
Cynthia A. Montgomery, Trustee
Joseph P. Platt, Trustee
Robert C. Robb, Jr., Trustee
Mark Stalnecker, Trustee
Kenneth L. Urish, Trustee
Claire A. Walton, Trustee
Frederick W. Winter, Trustee
Barbara G. Novick, Trustee
John M. Perlowski, Trustee, President and Chief Executive Officer
Thomas Callahan, Vice President
Jennifer McGovern, Vice President
Neal J. Andrews, Chief Financial Officer
Jay M. Fife, Treasurer
Charles Park, Chief Compliance Officer
Fernanda Piedra, Anti-Money Laundering Compliance Officer
Benjamin Archibald, Secretary
Effective December 31, 2016, David O. Beim and Dr. Matina S. Horner resigned as Trustees of the Trust.
| | | | | | |
| | | | |
Investment Adviser and Administrator BlackRock Advisors, LLC Wilmington, DE 19809 Sub-Advisor1 BlackRock International Limited Edinburgh, EH3 8BL United Kingdom | | Custodian and Accounting Agent State Street Bank and Trust Company Boston, MA 02110 Transfer Agent BNY Mellon Investment Servicing (US) Inc. Wilmington, DE 19809 | | Distributor BlackRock Investments, LLC New York, NY 10022 Independent Registered Public Accounting Firm Deloitte & Touche LLP Boston, MA 02116 | | Legal Counsel Sidley Austin LLP New York, NY 10019 Address of the Trust 100 Bellevue Parkway Wilmington, DE 19809 |
| | | | | | |
| | | | | | | |
| 48 | | BLACKROCK FUNDS | | NOVEMBER 30, 2016 | | |
Householding
The Funds will mail only one copy of shareholder documents, including prospectuses, annual and semi-annual reports and proxy statements, to shareholders with multiple accounts at the same address. This practice is commonly called “householding” and is intended to reduce expenses and eliminate duplicate mailings of shareholder documents. Mailings of your shareholder documents may be householded indefinitely unless you instruct us otherwise. If you do not want the mailing of these documents to be combined with those for other members of your household, please call the Funds at (800) 441-7762.
Availability of Quarterly Schedule of Investments
The Funds files their complete schedule of portfolio holdings with the SEC for the first and third quarters of each fiscal year on Form N-Q. The Funds’ Forms N-Q are available on the SEC’s website at http://www.sec.gov and may also be reviewed and copied at the SEC’s Public Reference Room in Washington, D.C. Information on the operation of the Public Reference Room or how to access documents on the SEC’s website without charge may be obtained by calling (800) SEC-0330. The Funds’ Forms N-Q may also be obtained upon request and without charge by calling (800) 441-7762.
Availability of Proxy Voting Policies and Procedures
A description of the policies and procedures that the Funds use to determine how to vote proxies relating to portfolio securities is available upon request and without charge (1) by calling (800) 441-7762; (2) at http://www.blackrock.com; and (3) on the SEC’s website at http://www.sec.gov.
Availability of Proxy Voting Record
Information about how the Funds voted proxies relating to securities held in the Funds’ portfolios during the most recent 12-month period ended June 30 is available upon request and without charge (1) at http://www.blackrock.com; or by calling (800) 441-7762; and (2) on the SEC’s website at http://www.sec.gov.
BlackRock’s Mutual Fund Family
BlackRock offers a diverse lineup of open-end mutual funds crossing all investment styles and managed by experts in equity, fixed income and tax-exempt investing. Visit BlackRock online at http://www.blackrock.com for more information.
| | | | | | |
| | | | | | | |
| | BLACKROCK FUNDS | | NOVEMBER 30, 2016 | | 49 |
| | | | |
| Additional Information (concluded) | | |
Account Information
Call us at (800) 441-7762 from 8:00 AM to 6:00 PM ET on any business day to get information about your account balances, recent transactions and share prices. You can also reach us on the Web at http://www.blackrock.com/funds.
Automatic Investment Plans
Investor Class shareholders who want to invest regularly can arrange to have $50 or more automatically deducted from their checking or savings account and invested in any of the BlackRock funds.
Systematic Withdrawal Plans
Investor Class shareholders can establish a systematic withdrawal plan and receive periodic payments of $50 or more from their BlackRock funds, as long as their account balance is at least $10,000.
Retirement Plans
Shareholders may make investments in conjunction with Traditional, Rollover, Roth, Coverdell, Simple IRAs, SEP IRAs and 403(b) Plans.
| | |
| BlackRock Privacy Principles | | |
BlackRock is committed to maintaining the privacy of its current and former fund investors and individual clients (collectively, “Clients”) and to safeguarding their non-public personal information. The following information is provided to help you understand what personal information BlackRock collects, how we protect that information and why in certain cases we share such information with select parties.
If you are located in a jurisdiction where specific laws, rules or regulations require BlackRock to provide you with additional or different privacy-related rights beyond what is set forth below, then BlackRock will comply with those specific laws, rules or regulations.
BlackRock obtains or verifies personal non-public information from and about you from different sources, including the following: (i) information we receive from you or, if applicable, your financial intermediary, on applications, forms or other documents; (ii) information about your transactions with us, our affiliates, or others; (iii) information we receive from a consumer reporting agency; and (iv) from visits to our websites.
BlackRock does not sell or disclose to non-affiliated third parties any non-public personal information about its Clients, except as permitted by law or as is necessary to respond to regulatory requests or to service Client accounts. These non-affiliated third parties are required to protect the confidentiality and security of this information and to use it only for its intended purpose.
We may share information with our affiliates to service your account or to provide you with information about other BlackRock products or services that may be of interest to you. In addition, BlackRock restricts access to non-public personal information about its Clients to those BlackRock employees with a legitimate business need for the information. BlackRock maintains physical, electronic and procedural safeguards that are designed to protect the non-public personal information of its Clients, including procedures relating to the proper storage and disposal of such information.
| | | | | | |
| | | | | | | |
| 50 | | BLACKROCK FUNDS | | NOVEMBER 30, 2016 | | |
This report is intended for current holders. It is not authorized for use as an offer of sale or a solicitation of an offer to buy shares of a Fund unless preceded or accompanied by the Fund’s current prospectus. Past performance results shown in this report should not be considered a representation of future performance. Investment returns and principal value of shares will fluctuate so that shares, when redeemed, may be worth more or less than their original cost. Statements and other information herein are as dated and are subject to change.

| | |
| IMP-11/16-SAR | | |
| |
| |  |
| | | | |
| Item 2 | | – | | Code of Ethics – Not Applicable to this semi-annual report |
| | |
| Item 3 | | – | | Audit Committee Financial Expert – Not Applicable to this semi-annual report |
| | |
| Item 4 | | – | | Principal Accountant Fees and Services – Not Applicable to this semi-annual report |
| | |
| Item 5 | | – | | Audit Committee of Listed Registrants – Not Applicable |
| | |
| Item 6 | | – | | Investments |
| | | | (a) The registrant’s Schedule of Investments is included as part of the Report to Stockholders filed under Item 1 of this Form. |
| | | | (b) Not Applicable due to no such divestments during the semi-annual period covered since the previous Form N-CSR filing. |
| | |
| Item 7 | | – | | Disclosure of Proxy Voting Policies and Procedures for Closed-End Management Investment Companies – Not Applicable |
| | |
| Item 8 | | – | | Portfolio Managers of Closed-End Management Investment Companies – Not Applicable |
| | |
| Item 9 | | – | | Purchases of Equity Securities by Closed-End Management Investment Company and Affiliated Purchasers – Not Applicable |
| | |
| Item 10 | | – | | Submission of Matters to a Vote of Security Holders –There have been no material changes to these procedures. |
| | |
| Item 11 | | – | | Controls and Procedures |
| | |
| | | | (a) – The registrant’s principal executive and principal financial officers, or persons performing similar functions, have concluded that the registrant’s disclosure controls and procedures (as defined in Rule 30a-3(c) under the Investment Company Act of 1940, as amended (the “1940 Act”)) are effective as of a date within 90 days of the filing of this report based on the evaluation of these controls and procedures required by Rule 30a-3(b) under the 1940 Act and Rule 15d-15(b) under the Securities Exchange Act of 1934, as amended. |
| | |
| | | | (b) – There were no changes in the registrant’s internal control over financial reporting (as defined in Rule 30a-3(d) under the 1940 Act) that occurred during the second fiscal quarter of the period covered by this report that have materially affected, or are reasonably likely to materially affect, the registrant’s internal control over financial reporting. |
| | |
| Item 12 | | – | | Exhibits attached hereto |
| | |
| | | | (a)(1) – Code of Ethics – Not Applicable to this semi-annual report |
| | |
| | | | (a)(2) – Certifications – Attached hereto |
| | |
| | | | (a)(3) – Not Applicable |
| | |
| | | | (b) – Certifications – Attached hereto |
2
Pursuant to the requirements of the Securities Exchange Act of 1934 and the Investment Company Act of 1940, the registrant has duly caused this report to be signed on its behalf by the undersigned, thereunto duly authorized.
| | | | |
| BlackRock Funds | | |
| | |
| By: | | /s/ John M. Perlowski | | |
| | John M. Perlowski | | |
| | Chief Executive Officer (principal executive officer) of |
| | BlackRock Funds | | |
| | |
| Date: | | February 3, 2017 | | |
Pursuant to the requirements of the Securities Exchange Act of 1934 and the Investment Company Act of 1940, this report has been signed below by the following persons on behalf of the registrant and in the capacities and on the dates indicated.
| | | | |
| By: | | /s/ John M. Perlowski | | |
| | John M. Perlowski | | |
| | Chief Executive Officer (principal executive officer) of |
| | BlackRock Funds | | |
| | |
| Date: | | February 3, 2017 | | |
| | |
| By: | | /s/ Neal J. Andrews | | |
| | Neal J. Andrews | | |
| | Chief Financial Officer (principal financial officer) of |
| | BlackRock Funds | | |
| | |
| Date: | | February 3, 2017 | | |
3