UNITED STATES
SECURITIES AND EXCHANGE COMMISSION
Washington, D.C. 20549
FORM N-CSR
CERTIFIED SHAREHOLDER REPORT OF REGISTERED MANAGEMENT INVESTMENT COMPANIES
Investment Company Act file number: 811-05742
Name of Fund: BlackRock Funds
BlackRock Commodity Strategies Fund
BlackRock Global Long/Short Credit Fund
BlackRock Short Obligations Fund
BlackRock Total Factor Fund (Formerly BlackRock Strategic Risk Allocation Fund)
Fund Address: 100 Bellevue Parkway, Wilmington, DE 19809
Name and address of agent for service: John M. Perlowski, Chief Executive Officer, BlackRock Funds, 55 East 52nd
Street, New York, NY 10055
Registrant’s telephone number, including area code: (800) 441-7762
Date of fiscal year end: 07/31/2017
Date of reporting period: 01/31/2017
Item 1 – Report to Stockholders
JANUARY 31, 2017
| | | | |
SEMI-ANNUAL REPORT (UNAUDITED) | | | | BLACKROCK® |
BlackRock FundsSM
▶ BlackRock Commodity Strategies Fund
▶ BlackRock Global Long/Short Credit Fund
| | |
| Not FDIC Insured ◾ May Lose Value ◾ No Bank Guarantee | | |
Dear Shareholder,
The 12 months ended January 31, 2017 was an exceptionally strong period for risk assets (such as stocks and high yield bonds), while higher-quality assets generated muted returns after struggling in the latter part of 2016. As the period began, worries about slowing growth in China and the instability of oil prices had global equity prices sliding. However, the broad market momentum shifted in the second half of 2016 as reflationary expectations in the United States helped drive a pick-up in global growth.
Markets were remarkably resilient during the period. Big surprises such as the United Kingdom’s vote to leave the European Union and the outcome of the U.S. presidential election brought spikes in equity market volatility, but they were ultimately short-lived. Instead, investors used the sell-offs to seize upon buying opportunities, allowing markets to quickly rebound. We believe this reinforces the case for taking the long view rather than reacting to short-term market noise.
The global reflationary theme — rising nominal growth, wages and inflation — was the dominant driver of asset returns during the period, outweighing significant political upheavals and uncertainty. This trend accelerated after the U.S. election and continued into the beginning of 2017, stoked by expectations for an extra boost to U.S. growth via fiscal policy.
Although economic momentum is gaining traction, the capacity for rapid global growth is restrained by structural factors including an aging population, low productivity growth and excess savings. A tempered economic growth trend and high valuations across most assets have set the stage for muted investment returns going forward.
Equity markets still have room to move, although the disparity between winners and losers is widening, making stock selection increasingly important. Fixed income investors are also facing challenges as bond markets recalibrate to accommodate rising rates and higher inflation expectations. And in a world where political risk and policy uncertainty abound, there is no lack of potential catalysts for higher volatility.
In this environment, investors need to think globally, extend their scope across a broad array of asset classes and be nimble as market conditions change. We encourage you to talk with your financial advisor and visit blackrock.com for further insight about investing in today’s markets.
Sincerely,

Rob Kapito
President, BlackRock Advisors, LLC

Rob Kapito
President, BlackRock Advisors, LLC
| | | | | | | | |
| Total Returns as of January 31, 2017 | |
| | | 6-month | | | 12-month | |
U.S. large cap equities (S&P 500® Index) | | | 5.96% | | | | 20.04% | |
U.S. small cap equities (Russell 2000® Index) | | | 12.43 | | | | 33.53 | |
International equities (MSCI Europe, Australasia, Far East Index) | | | 3.49 | | | | 12.03 | |
Emerging market equities (MSCI Emerging Markets Index) | | | 4.92 | | | | 25.41 | |
3-month Treasury bills (BofA Merrill Lynch 3-Month U.S. Treasury Bill Index) | | | 0.20 | | | | 0.37 | |
U.S. Treasury securities (BofA Merrill Lynch 10- Year U.S. Treasury Index) | | | (7.87) | | | | (3.26) | |
U.S. investment grade bonds (Bloomberg Barclays U.S. Aggregate Bond Index) | | | (2.95) | | | | 1.45 | |
Tax-exempt municipal bonds (S&P Municipal Bond Index) | | | (2.94) | | | | 0.24 | |
U.S. high yield bonds (Bloomberg Barclays U.S. Corporate High Yield 2% Issuer Capped Index) | | | 6.09 | | | | 20.77 | |
|
| Past performance is no guarantee of future results. Index performance is shown for illustrative purposes only. You cannot invest directly in an index. | |
| | | | | | |
| 2 | | THIS PAGE NOT PART OF YOUR FUND REPORT | | | | |
| | |

| | Shareholders can sign up for e-mail notifications of quarterly statements, annual and semi-annual shareholder reports and prospectuses by enrolling in the electronic delivery program. Electronic copies of shareholder reports and prospectuses are also available on BlackRock’s website. TO ENROLL IN ELECTRONIC DELIVERY: Shareholders Who Hold Accounts with Investment Advisors, Banks or Brokerages: Please contact your financial advisor. Please note that not all investment advisors, banks or brokerages may offer this service. Shareholders Who Hold Accounts Directly with BlackRock: 1. Access the BlackRock website at blackrock.com 2. Select "Access Your Account" 3. Next, select "eDelivery" in the "Related Resources" box and follow the sign-up instructions |
| | | | | | |
| | | BLACKROCK FUNDS | | JANUARY 31, 2017 | | 3 |
| | | | |
| Fund Summary as of January 31, 2017 | | | BlackRock Commodity Strategies Fund | |
BlackRock Commodity Strategies Fund’s (the “Fund”) investment objective is to seek total return.
|
| Portfolio Management Commentary |
How did the Fund perform?
| • | | For the six-month period ended January 31, 2017, the Fund outperformed its benchmark, the Bloomberg Commodity Index Total Return. |
What factors influenced performance?
| • | | The Fund’s positions in agriculture, mining and energy stocks contributed positively to relative performance versus the commodity-only benchmark. Agriculture stocks, which were supported by the same reflationary trends that helped the rest of the commodity space. In this environment, the Fund’s bias towards upstream agricultural companies (such as fertilizer and agriculture equipment companies) was beneficial. |
| • | | The prices of industrial metals were buoyed by subsiding concerns about a possible “hard landing” in China’s economy, boosting the returns of the Fund’s positions in the related equities. The Fund’s allocation to energy stocks also contributed positively. While the sector lagged the gains achieved by crude oil, it outperformed its benchmark thanks to the general strength in oil prices. Oil moved significantly higher during the reporting period as signs emerged that supply and demand were coming into balance. In addition, the Organization of Petroleum Exporting Countries surprised the market by announcing a coordinated production cut. Curve strategies within the commodity futures-based segment of the portfolio also contributed positively, with the majority of the return generated in the second half of the period. |
| • | | The Fund’s exposure to gold stocks was by far the most significant detractor from relative performance. After performing very well in the first half of 2016 and making a substantial contribution to the Fund’s results, gold stocks gave back some of their gains once the gold price came under pressure. The combination of rising stock prices, improving economic growth expectations and surging U.S. Treasury yields acted as a headwind for the gold price in the second half of 2016, hurting the performance of gold stocks. |
| • | | Approximately 50% of the portfolio was held in fully collateralized, commodity-linked notes tied to commodity indices, using an enhanced index approach. This aspect of the Fund’s strategy contributed to returns. |
Describe recent portfolio activity.
| • | | The Fund’s positions in equity and commodity-linked notes were rebal-anced to a roughly equal weighting late in the period through increased exposure to equities and a corresponding reduction to commodity-based investments. |
| • | | The investment adviser took some profits in gold stocks during the third quarter of 2016 following their strong run. This move aided relative performance by cushioning the impact of the sector’s subsequent decline, but the benefit would have been larger if the investment adviser had been more aggressive in reducing the size of the position. The Fund also added to its allocation to energy stocks, reflecting an improvement in the investment advisor’s outlook for oil prices. |
| • | | The Fund maintained a position in cash and cash equivalents, predominantly comprised of U.S. Treasury bills, as collateral against its exposure to commodity-linked notes. The cash balance did not have a material impact on returns. |
Describe portfolio positioning at period end.
| • | | As of January 31, 2017, the Fund had approximately 50% invested in natural resources equities and 50% in the commodity-linked derivatives strategy (including collateral held against the position in commodity-linked notes). In the aggregate, the Fund held an overweight position relative to the benchmark in the precious metals and energy sub-sectors and underweights in the agriculture & livestock and industrial metals sub-sectors. |
The views expressed reflect the opinions of BlackRock as of the date of this report and are subject to change based on changes in market, economic or other conditions. These views are not intended to be a forecast of future events and are no guarantee of future results.
| | | | |
| Ten Largest Holdings | | Percent of Total Investments1 | |
UBS AG, 3-month LIBOR, 2/13/172 | | | 7% | |
Bank of America Corp. 3-month LIBOR, 1/26/182 | | | 6 | |
JPMorgan Chase Bank, N.A., 3-month LIBOR, 1/26/182 | | | 6 | |
Morgan Stanley B.V. 3-month LIBOR, 2/10/172 | | | 6 | |
Royal Dutch Shell PLC, A Shares | | | 3 | |
Exxon Mobil Corp. | | | 2 | |
Monsanto Co. | | | 2 | |
PowerShares DB Commodity Index Tracking Fund | | | 2 | |
Deere & Co. | | | 2 | |
Syngenta AG, Registered Shares | | | 2 | |
| | 1 | | Total investments exclude short-term securities. |
| | 2 | | Represents a commodity-linked note. |
| | | | |
| Portfolio Composition | | Percent of
Total Investments1 | |
Common Stocks | | | 70% | |
Commodity-Linked Notes | | | 26 | |
Investment Companies | | | 4 | |
| | | | | | |
| 4 | | BLACKROCK FUNDS | | JANUARY 31, 2017 | | |
| | | | |
| | | | BlackRock Commodity Strategies Fund | |
|
| Total Return Based on a $10,000 Investment |
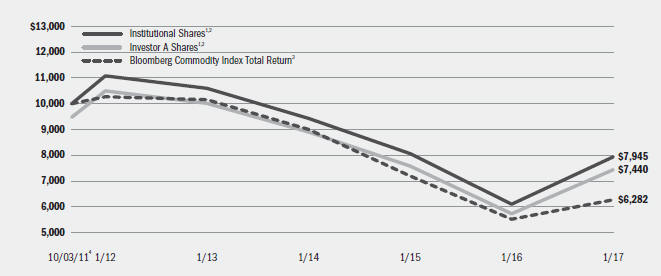
| | 1 | | Assuming maximum sales charges, if any, transaction costs and other operating expenses, including investment advisory fees and administration fees, if any. Institutional Shares do not have a sales charge. |
| | 2 | | The Fund utilizes two strategies and under normal circumstances expects to invest approximately 50% of its total assets in each strategy; provided, however, that from time to time, Fund management may alter the weightings if it deems it prudent to do so based on market conditions, trends or movements or other similar factors. |
| | 3 | | An unmanaged commodity index currently composed of futures contracts on 20 physical commodities that assumes that the futures positions are fully collateralized. Prior to July 1, 2014, the Bloomberg Commodity Index Total Return was known as the Dow Jones-UBS Commodity Index Total ReturnSM. |
| | 4 | | Commencement of operations. |
| | | | | | | | | | | | | | | | | | | | | | | | | | | | | | | | | | | |
| Performance Summary for the Period Ended January 31, 2017 | |
| | | | | Average Annual Total Returns5 |
| | | | | 1 Year | | 5 Years | | Since Inception6 |
| | | 6-Month
Total Returns | | w/o sales charge | | w/sales charge | | w/o sales
charge | | w/sales
charge | | w/o sales
charge | | w/sales
charge |
Institutional | | | | 5.05 | % | | | | 30.16 | % | | | | N/A | | | | | (6.46 | )% | | | | N/A | | | | | (4.22 | )% | | | | N/A | |
Investor A | | | | 4.89 | | | | | 29.82 | | | | | 23.01 | % | | | | (6.67 | ) | | | | (7.67 | )% | | | | (4.44 | ) | | | | (5.40 | )% |
Investor C | | | | 4.40 | | | | | 28.72 | | | | | 27.72 | | | | | (7.37 | ) | | | | (7.37 | ) | | | | (5.15 | ) | | | | (5.15 | ) |
Bloomberg Commodity Index Total Return | | | | 4.15 | | | | | 13.83 | | | | | N/A | | | | | (9.37 | ) | | | | N/A | | | | | (8.36 | ) | | | | N/A | |
| | 5 | | Assuming maximum sales charges, if any. Average annual total returns with and without sales charges reflect reductions for distribution and service fees. See “About Fund Performance” on page 9 for a detailed description of share classes, including any related sales charges and fees. |
| | 6 | | The Fund commenced operations on October 3, 2011. |
| | | | N/A—Not applicable as share class and index do not have a sales charge. |
| | | | Past performance is not indicative of future results. |
| | | | Performance results may include adjustments made for financial reporting purposes in accordance with U.S. generally accepted accounting principles. |
| | | | | | | | | | | | | | |
| Expense Example | | | | | | | | | | | | | | |
| | | Actual | | Hypothetical8 |
| | | Beginning
Account Value
August 1, 2016 | | Ending
Account Value
January 31, 2017 | | Expenses Paid
During the Period7 | | Beginning
Account Value
August 1, 2016 | | Ending
Account Value
January 31, 2017 | | Expenses Paid
During the Period7 | | Annualized
Expense
Ratio |
Institutional | | $1,000.00 | | $1,050.50 | | $ 5.12 | | $1,000.00 | | $1,020.21 | | $ 5.04 | | 0.99% |
Investor A | | $1,000.00 | | $1,048.90 | | $ 6.40 | | $1,000.00 | | $1,018.95 | | $ 6.31 | | 1.24% |
Investor C | | $1,000.00 | | $1,044.00 | | $10.25 | | $1,000.00 | | $1,015.17 | | $10.11 | | 1.99% |
| | 7 | | For each class of the Fund, expenses are equal to the annualized expense ratio for the class, multiplied by the average account value over the period, multiplied by 184/365 (to reflect the one-half year period shown). The fees and expenses of the underlying funds in which the Fund invests are not included in the Fund’s annualized expense ratio. |
| | 8 | | Hypothetical 5% annual return before expenses is calculated by prorating the number of days in the most recent fiscal half year divided by 365. |
| | | | See “Disclosure of Expenses” on page 10 for further information on how expenses were calculated. |
| | | | | | |
| | | BLACKROCK FUNDS | | JANUARY 31, 2017 | | 5 |
| | |
| Fund Summary as of January 31, 2017 | | BlackRock Global Long/Short Credit Fund |
BlackRock Global Long/Short Credit Fund’s (the “Fund”) investment objective is to seek absolute total returns over a complete market cycle.
|
| Portfolio Management Commentary |
How did the Fund perform?
| • | | For the six-month period ended January 31, 2017, the Fund outperformed the benchmark, the BofA Merrill Lynch 3-Month U.S. Treasury Bill Index. |
What factors influenced performance?
| • | | The Fund’s U.S.-based strategies led performance for the six-month period. In particular, absolute return strategies focused on event trades in select technology companies, idiosyncratic long positions in industrial credits, and capital structure trades in technology, pharmaceutical and energy companies added to performance. U.S. exposures based on carry (income) including bank loans, enhanced equipment trust certificates, asset backed securities and commercial mortgage backed securities were also additive. Similar European assets, specifically collateralized loan obligations and U.K. public companies, contributed to returns as well. |
| • | | Additionally, long exposures in high yield bonds across commodity-related sectors, health care, technology and telecommunications were additive, along with U.S. investment grade exposures in industrial credits, especially within health care and pharmaceuticals. |
| • | | Finally, long positions in select peripheral European financials performed well, as they responded positively to higher interest rates and an easing of negative headlines during the period. |
| • | | There were only modest detractors for the six-month period, with the most significant being a short position in the European credit default swap crossover index (comprised of credit default swaps which reference bonds that straddle the investment grade and high yield markets). Idiosyncratic single name short positions in the U.S. also detracted from performance. Additionally, strategies to manage risk across regions detracted from performance given a lack of volatility and strong equity performance. |
| • | | As part of its investment strategy, the Fund uses derivatives to manage duration (sensitivity to interest rate movements) and currency risk. The Fund also has the flexibility to utilize derivatives in order to express a positive or negative view on a particular issuer or sector, or to manage overall credit risk. Derivatives may also serve as a more liquid way to express exposures and depending on the market environment the Fund may utilize various instruments, including but not limited to: bonds, equities and derivatives. During the period, the Fund’s derivative holdings had a net positive impact on performance. This included the usage of futures contracts to manage the impact of movements in interest rates as well as foreign currency strategies, which help manage the risk of non-dollar currency exposure back to U.S. dollars. Swap contracts in aggregate detracted and were primarily used to express short positions in individual credits and baskets of credits. |
Describe recent portfolio activity.
| • | | The Fund’s net long position was increased from 29% to 44% over the course of the period. |
| • | | Throughout the period, the Fund remained focused on U.S. assets on the view that non-U.S. assets were subject to event risk on a number of fronts, including the U.S. political agenda under President Trump, monetary policy shifts, Brexit taking shape, and elections across the Eurozone. In light of the uncertainty across markets, the Fund was positioned to maintain a low level of market directionality, while remaining focused on long/short relative value and event-oriented strategies. |
| • | | Given this backdrop, the Fund selectively increased long positions in the United States over the period while reducing short exposures. The Fund added to holdings of collateralized loan obligations and bank loans, which appeared attractively valued relative to high quality, investment grade credits. During the period, the Fund also rotated between high quality, low beta (market sensitivity) industrial credits and longer-dated financials and bank capital securities. Additionally, the Fund made tactical adjustments to pharmaceutical, technology and media exposures within the absolute return strategy. Strategies to manage the risk of investment grade credit positions was reduced over the period. |
| • | | While maintaining a focus on U.S. assets during the period, the Fund increased long positions and decreased short positions in Europe to end the period with modestly higher net exposure to the region. In particular, the Fund built exposure to investment grade corporates through select names within pharmaceuticals, specialty retailers, and telecommunications. Additionally, the Fund reduced sovereign short exposures late in 2016, and tactically traded the crossover high yield credit default swap index and Brexit-related hedges throughout the period. |
Describe portfolio positioning at period end.
| • | | At period end, against a backdrop of low yields, narrow credit spreads, elevated geopolitical uncertainty and evolving global central bank policies, the Fund’s investment adviser preferred to maintain a cautious stance with respect to assuming directional risk. |
| • | | The Fund was holding a neutral to slightly net long European credit positioning. The Fund’s U.S. exposures were diversified across directional, carry and absolute return strategies. The Fund maintained a cautious stance with respect to high yield credit, and a tilt toward financials versus industrials within investment grade. From an absolute return standpoint, the Fund continued to prefer credits with a potential catalyst such as mergers and acquisition (“M&A”) activity. From a sector perspective, the Fund was focused on technology, manufacturing, infrastructure, media/cable, pharmaceuticals and, to a lesser extent, hospitals. Thematic exposures included M&A activity, consolidation and the impact of tax reform. |
| • | | The Fund ended the period with a net long credit position in Europe at 15% of net assets, 23% in the United States, 5% in Asia and emerging markets, and 44% overall. |
The views expressed reflect the opinions of BlackRock as of the date of this report and are subject to change based on changes in market, economic or other conditions. These views are not intended to be a forecast of future events and are no guarantee of future results.
| | | | | | |
| 6 | | BLACKROCK FUNDS | | JANUARY 31, 2017 | | |
| | | | |
| | | | BlackRock Global Long/Short Credit Fund | |
|
| Total Return Based on a $10,000 Investment |
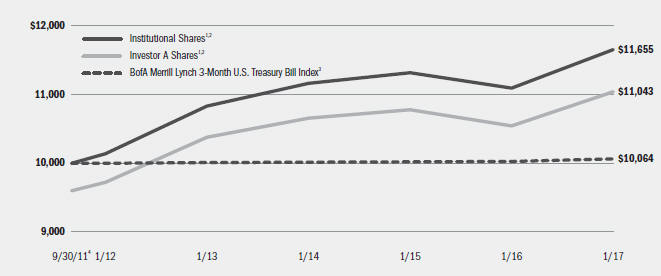
| | 1 | | Assuming maximum sales charges, if any, transaction costs and other operating expenses, including investment advisory fees and administration fees, if any. Institutional Shares do not have a sales charge. |
| | 2 | | The Fund seeks to provide absolute total returns over a complete market cycle through diversified long and short exposure to the global fixed income markets. Under normal circumstances, the Fund invests at least 80% of its total assets in credit-related instruments. |
| | 3 | | An unmanaged index that tracks 3-month U.S. Treasury securities. |
| | 4 | | Commencement of operations. |
| | | | | | | | | | | | | | | | | | | | | | | | | | | | | | | | | | | | | | | | | | | | | |
| Performance Summary for the Period Ended January 31, 2017 | |
| | | | | | | | | Average Annual Total Returns5 |
| | | | | | | | | 1 Year | | 5 Years | | Since Inception6 |
| | | Standardized
30-Day Yield | | Unsubsidized
30-Day Yield | | 6-Month Total Returns | | w/o sales
charge | | w/sales
charge | | w/o sales
charge | | w/sales
charge | | w/o sales
charge | | w/sales
charge |
Institutional | | | | 2.63 | % | | | | 2.63 | % | | | | 3.03 | % | | | | 5.04 | % | | | | N/A | | | | | 2.83 | % | | | | N/A | | | | | 2.91 | % | | | | N/A | |
Investor A | | | | 2.31 | | | | | 2.30 | | | | | 2.94 | | | | | 4.74 | | | | | 0.55 | % | | | | 2.58 | | | | | 1.74 | % | | | | 2.66 | | | | | 1.88 | % |
Investor C | | | | 1.65 | | | | | 1.65 | | | | | 2.46 | | | | | 3.95 | | | | | 2.95 | | | | | 1.81 | | | | | 1.81 | | | | | 1.90 | | | | | 1.90 | |
Class K | | | | 2.66 | | | | | 2.66 | | | | | 3.02 | | | | | 5.15 | | | | | N/A | | | | | 2.89 | | | | | N/A | | | | | 2.98 | | | | | N/A | |
BofA Merrill Lynch 3-Month U.S. Treasury Bill Index | | | | — | | | | | — | | | | | 0.20 | | | | | 0.37 | | | | | N/A | | | | | 0.13 | | | | | N/A | | | | | 0.12 | | | | | N/A | |
| | 5 | | Assuming maximum sales charges, if any. Average annual total returns with and without sales charges reflect reductions for distribution and service fees. See “About Fund Performance” on page 9 for a detailed description of share classes, including any related sales charges and fees. |
| | 6 | | The Fund commenced operations on September 30, 2011. |
| | | | N/A—Not applicable as share class and index do not have a sales charge. |
| | | | Past performance is not indicative of future results. |
| | | | Performance results may include adjustments made for financial reporting purposes in accordance with U.S. generally accepted accounting principles. |
| | | | | | | | | | | | | | | | | | | | | | | | | | | | | | | | | | | | | | | | | | | | | |
| Expense Example | |
| | | Actual | | Hypothetical9 |
| | | | | | | Including Interest
Expense, Dividend
Expense and Broker
Fees and Expenses
on Short Sales | | Excluding Interest
Expense, Dividend
Expense and Broker
Fees and Expenses
on Short Sales | | | | Including Interest
Expense, Dividend
Expense and Broker
Fees and Expenses
on Short Sales | | Excluding Interest
Expense, Dividend
Expense and Broker
Fees and Expenses
on Short Sales |
| | | Beginning
Account Value
August 1, 2016 | | Ending
Account Value
January 31, 2017 | | Expenses Paid During the Period7 | | Expenses Paid During the Period8 | | Beginning
Account Value
August 1, 2016 | | Ending
Account Value
January 31, 2017 | | Expenses
Paid During
the Period7 | | Ending
Account Value
January 31, 2017 | | Expenses
Paid During
the Period8 |
Institutional | | | | $1,000.00 | | | | | $1,030.30 | | | | | $ 9.62 | | | | | $ 5.68 | | | | | $1,000.00 | | | | | $1,015.73 | | | | | $ 9.55 | | | | | $1,019.61 | | | | | $ 5.65 | |
Investor A | | | | $1,000.00 | | | | | $1,029.40 | | | | | $11.00 | | | | | $ 7.06 | | | | | $1,000.00 | | | | | $1,014.37 | | | | | $10.92 | | | | | $1,018.25 | | | | | $ 7.02 | |
Investor C | | | | $1,000.00 | | | | | $1,024.60 | | | | | $14.75 | | | | | $10.82 | | | | | $1,000.00 | | | | | $1,010.64 | | | | | $14.65 | | | | | $1,014.52 | | | | | $10.76 | |
Class K | | | | $1,000.00 | | | | | $1,030.20 | | | | | $ 9.21 | | | | | $ 5.27 | | | | | $1,000.00 | | | | | $1,015.22 | | | | | $ 9.14 | | | | | $1,020.01 | | | | | $ 5.24 | |
| | 7 | | For each class of the Fund, expenses are equal to the annualized expense ratio for the class (1.88% for Institutional, 2.15% for Investor A, 2.89% for Investor C and 1.80% for Class K), multiplied by the average account value over the period, multiplied by 184/365 (to reflect the one-half year period shown). The fees and expenses of the underlying funds in which the Fund invests are not included in the Fund’s annualized expense ratio. |
| | 8 | | For each class of the Fund, expenses are equal to the annualized expense ratio for the class (1.11% for Institutional, 1.38% for Investor A, 2.12% for Investor C and 1.03% for Class K), multiplied by the average account value over the period, multiplied by 184/365 (to reflect the one-half year period shown). The fees and expenses of the underlying funds in which the Fund invests are not included in the Fund’s annualized expense ratio. |
| | 9 | | Hypothetical 5% annual return before expenses is calculated by prorating the number of days in the most recent fiscal half year divided by 365. |
| | | | See “Disclosure of Expenses” on page 10 for further information on how expenses were calculated. |
| | | | | | |
| | | BLACKROCK FUNDS | | JANUARY 31, 2017 | | 7 |
| | |
| | | BlackRock Global Long/Short Credit Fund |
| | | | | | |
| | | Percent of Total Investments1 |
| Geographic Allocation | | Long | | Short | | Total |
United States | | 47% | | 19% | | 66% |
United Kingdom | | 4 | | — | | 4 |
Cayman Islands | | 3 | | — | | 3 |
Canada | | 3 | | — | | 3 |
France | | 2 | | 1 | | 3 |
Italy | | 2 | | — | | 2 |
Ireland | | 2 | | — | | 2 |
Germany | | 2 | | — | | 2 |
Netherlands | | 2 | | — | | 2 |
Spain | | 2 | | — | | 2 |
Other2 | | 9 | | 2 | | 11 |
| | |
Total | | 78% | | 22% | | 100% |
| | 1 | | Total investments include the gross market values of long and short positions and exclude Short-Term Securities, Options Purchased and Options Written. |
| | 2 | | Includes holdings within countries that are 1% or less of long-term investments. Please refer to the Schedule of Investments for such countries. |
| | |
| Credit Quality Allocation3 | | Percent of
Total Investments4 |
AAA/Aaa5 | | 4% |
AA/Aa | | 2 |
A | | 7 |
BBB/Baa | | 35 |
BB/Ba | | 27 |
B | | 17 |
CCC/Caa | | 3 |
N/R | | 5 |
| | 3 | | For financial reporting purposes, credit quality ratings shown above reflect the highest rating assigned by either Standard & Poor’s (“S&P”) or Moody’s Investors Service if ratings differ. These rating agencies are independent, nationally recognized statistical rating organizations and are widely used. Investment grade ratings are credit ratings of BBB/Baa or higher. Below investment grade ratings are credit ratings of BB/Ba or lower. Investments designated N/R are not rated by either rating agency. Unrated investments do not necessarily indicate low credit quality. Credit quality ratings are subject to change. |
| | 4 | | Total investments exclude Short-Term Securities, Options Purchased, Options Written, Borrowed Bonds and Investments Sold Short. |
| | 5 | | The investment adviser evaluates the credit quality of not-rated investments based upon certain factors including, but not limited to, credit ratings for similar investments and financial analysis of sectors, individual investments and/or issuers. Using this approach, the investment adviser has deemed not-rated U.S. Government Sponsored Agency Securities and U.S. Treasury Obligations as AAA/Aaa. |
| | | | | | |
| 8 | | BLACKROCK FUNDS | | JANUARY 31, 2017 | | |
| | |
| The Benefits and Risks of Leveraging | | |
BlackRock Global Long/Short Credit Fund may utilize leverage to seek to enhance returns and net asset value (“NAV”). However, these objectives cannot be achieved in all interest rate environments.
BlackRock Global Long/Short Credit Fund may utilize leverage by entering into reverse repurchase agreements.
In general, the concept of leveraging is based on the premise that the financing cost of leverage, which is based on short-term interest rates, is normally lower than the income earned by BlackRock Global Long/Short Credit Fund on its longer-term portfolio investments purchased with the proceeds from leverage. To the extent that the total assets of BlackRock Global Long/Short Credit Fund (including the assets obtained from leverage) are invested in higher-yielding portfolio investments, BlackRock Global Long/Short Credit Fund’s shareholders benefit from the incremental net income.
The interest earned on securities purchased with the proceeds from leverage is distributed to BlackRock Global Long/Short Credit Fund’s shareholders, and the value of these portfolio holdings is reflected in BlackRock Global Long/Short Credit Fund’s per share NAV. However, in order to benefit shareholders, the return on assets purchased with leverage proceeds must exceed the ongoing costs associated with the leverage. If interest and other ongoing costs of leverage exceed BlackRock Global Long/Short Credit Fund’s return on assets purchased with leverage proceeds, income to shareholders is lower than if BlackRock Global Long/Short Credit Fund had not used leverage.
Furthermore, the value of BlackRock Global Long/Short Credit Fund’s portfolio investments generally varies inversely with the direction of long-term interest rates, although other factors can also influence the value of portfolio investments. As a result, changes in interest rates can influence BlackRock Global Long/Short Credit Fund’s NAV positively or negatively in addition to the impact on BlackRock Global Long/Short Credit Fund’s performance from leverage. Changes in the direction of interest rates are difficult to predict accurately, and there is no assurance that BlackRock Global Long/Short Credit Fund’s leveraging strategy will be successful.
The use of leverage also generally causes greater changes in BlackRock Global Long/Short Credit Fund’s NAV and dividend rates than comparable portfolios without leverage. In a declining market, leverage is likely to cause a greater decline in the NAV of BlackRock Global Long/Short Credit Fund’s shares than if BlackRock Global Long/Short Credit Fund were not leveraged. In addition, BlackRock Global Long/Short Credit Fund may be required to sell portfolio securities at inopportune times or at distressed values in order to comply with regulatory requirements applicable to the use of leverage or as required by the terms of the leverage instruments, which may cause BlackRock Global Long/Short Credit Fund to incur losses. The use of leverage may limit BlackRock Global Long/Short Credit Fund’s ability to invest in certain types of securities or use certain types of hedging strategies. BlackRock Global Long/Short Credit Fund incurs expenses in connection with the use of leverage, all of which are borne by BlackRock Global Long/Short Credit Fund’s shareholders and may reduce income.
| • | | Institutional and Class K Shares (Class K Shares are available only in BlackRock Global Long/Short Credit Fund) are not subject to any sales charge. These shares bear no ongoing distribution or service fees and are available only to certain eligible investors. Prior to the Class K Shares inception date of March 28, 2016, Class K Share performance results are those of Institutional Shares (which have no distribution or service fees) and were restated to reflect Class K Share fees. |
| • | | Investor A Shares are subject to a maximum initial sales charge (front-end load) of 5.25% for BlackRock Commodity Strategies Fund and 4.00% for BlackRock Global Long/Short Credit Fund. These shares are subject to a service fee of 0.25% per year (but no distribution fee). Certain redemptions of these shares may be subject to a contingent deferred sales charge (“CDSC”) where no initial sales charge was paid at the time of purchase. These shares are generally available through financial intermediaries. |
| • | | Investor C Shares are subject to a 1.00% CDSC if redeemed within one year of purchase. In addition, these shares are subject to a distribution fee of 0.75% per year and a service fee of 0.25% per year. These shares are generally available through financial intermediaries. |
Performance information reflects past performance and does not guarantee future results. Current performance may be lower or higher than the performance data quoted. Refer to www.blackrock.com/funds to obtain performance data current to the most recent month end.
Performance results do not reflect the deduction of taxes that a share- holder would pay on fund distributions or the redemption of fund shares. Figures shown in the performance tables on the previous pages assume reinvestment of all distributions, if any, at NAV on the ex-dividend/ payable dates. Investment return and principal value of shares will fluctuate so that shares, when redeemed, may be worth more or less than their original cost.Distributions paid to each class of shares will vary because of the different levels of service, distribution and transfer agency fees applicable to each class, which are deducted from the income available to be paid to shareholders.
BlackRock Advisors, LLC (the “Manager”), each Funds’ investment adviser, has contractually agreed to waive and/or reimburse a portion of the Funds’ expenses. Without such waiver and/or reimbursement, the Funds’ performance would have been lower. The Manager is under no obligation to continue waiving and/or reimbursing its fees after the applicable termination date of such agreement. See Note 6 of the Notes to Financial Statements for additional information on waivers and/or reimbursements. The standardized 30-day yield includes the effects of any waivers and/or reimbursements. The unsubsidized 30-day yield excludes the effects of any waivers and/or reimbursements.
| | | | | | |
| | | BLACKROCK FUNDS | | JANUARY 31, 2017 | | 9 |
Shareholders of the Funds may incur the following charges: (a) transactional expenses, such as sales charges; and (b) operating expenses, including investment advisory fees, administration fees, service and distribution fees, including 12b-1 fees, acquired fund fees and expenses, and other fund expenses. The expense examples shown on the previous pages (which are based on a hypothetical investment of $1,000 invested on August 1, 2016 and held through January 31, 2017) are intended to assist shareholders both in calculating expenses based on an investment in each Fund and in comparing these expenses with similar costs of investing in other mutual funds.
The expense examples provide information about actual account values and actual expenses. In order to estimate the expenses a shareholder paid during the period covered by this report, shareholders can divide their account value by $1,000 and then multiply the result by the number corresponding to their Fund and share class under the headings entitled “Expenses Paid During the Period.”
The expense examples also provide information about hypothetical account values and hypothetical expenses based on a Fund’s actual expense ratio and an assumed rate of return of 5% per year before expenses. In order to assist shareholders in comparing the ongoing expenses of investing in these Funds and other funds, compare the 5% hypothetical examples with the 5% hypothetical examples that appear in shareholder reports of other funds.
The expenses shown in the expense examples are intended to highlight shareholders’ ongoing costs only and do not reflect any transactional expenses, such as sales charges, if any. Therefore, the hypothetical examples are useful in comparing ongoing expenses only, and will not help shareholders determine the relative total expenses of owning different funds. If these transactional expenses were included, shareholder expenses would have been higher.
|
| Derivative Financial Instruments |
The Funds may invest in various derivative financial instruments. These instruments are used to obtain exposure to a security, commodity, index, market, and/or other asset without owning or taking physical custody of securities, commodities and/or other referenced assets or to manage market, equity, credit, interest rate, foreign currency exchange rate, commodity and/or other risks. Derivative financial instruments may give rise to a form of economic leverage and involve risks, including the imperfect correlation between the value of a derivative financial instrument and the underlying asset, possible default of the counterparty to the transaction
or illiquidity of the instrument. The Funds’ successful use of a derivative financial instrument depends on the investment adviser’s ability to predict pertinent market movements accurately, which cannot be assured. The use of these instruments may result in losses greater than if they had not been used, may limit the amount of appreciation a Fund can realize on an investment and/or may result in lower distributions paid to shareholders. The Funds’ investments in these instruments, if any, are discussed in detail in the Notes to Financial Statements.
| | | | | | |
| 10 | | BLACKROCK FUNDS | | JANUARY 31, 2017 | | |
| | | | |
| Consolidated Schedule of Investments January 31, 2017 (Unaudited) | | | BlackRock Commodity Strategies Fund | |
| | | (Percentages shown are based on Net Assets) | |
| | | | | | | | |
| Commodity-Linked Notes | | Par (000) | | | Value | |
Bank of America Corp., 3-month LIBOR (Indexed to the Bloomberg Commodity Index Roll Select Total Return, multiplied by 3), 1/26/18 (a) | | $ | 7,000 | | | $ | 7,398,754 | |
JPMorgan Chase Bank, N.A., 3-month LIBOR (Indexed to the Performance of the J.P. Morgan Enhanced Beta Select Alternative Benchmark Total Return Index, multiplied by 3), 1/26/18 (a)(b) | | | 7,000 | | | | 7,375,487 | |
Morgan Stanley B.V., 3-month LIBOR (Indexed to the Morgan Stanley HDX RADAR MS Dynamic Roll Total Return IndexSM, multiplied by 3), 2/10/17 (a)(b) | | | 4,000 | | | | 6,946,796 | |
UBS AG, 3-month LIBOR (Indexed to the Bloomberg Commodity Total Return IndexSM, multiplied by 3), 2/13/17 (a)(b) | | | 5,000 | | | | 7,643,798 | |
Total Commodity-Linked Notes — 17.9% | | | | | | | 29,364,835 | |
| | | | | | | | |
| Common Stocks | | Shares | | | | |
Chemicals — 6.8% | | | | | | | | |
Agrium, Inc. | | | 15,907 | | | | 1,638,314 | |
Albemarle Corp. | | | 1,346 | | | | 124,693 | |
CF Industries Holdings, Inc. | | | 45,083 | | | | 1,590,979 | |
Highfield Resources Ltd. (c)(d) | | | 332,885 | | | | 308,132 | |
Monsanto Co. | | | 23,480 | | | | 2,543,119 | |
Mosaic Co. | | | 8,177 | | | | 256,512 | |
Neo Lithium Units | | | 162,874 | | | | 137,684 | |
Plant Impact PLC (c) | | | 209,392 | | | | 123,147 | |
Potash Corp. of Saskatchewan, Inc. | | | 59,753 | | | | 1,111,406 | |
Syngenta AG, Registered Shares | | | 4,641 | | | | 1,972,488 | |
Yara International ASA | | | 30,091 | | | | 1,268,805 | |
| | | | | | | | |
| | | | | | | | 11,075,279 | |
Construction Materials — 0.1% | | | | | | | | |
Imerys SA | | | 1,760 | | | | 141,340 | |
Energy Equipment & Services — 1.9% | | | | | | | | |
Baker Hughes, Inc. | | | 14,882 | | | | 938,757 | |
Halliburton Co. | | | 17,000 | | | | 961,690 | |
Precision Drilling Corp. (c) | | | 34,262 | | | | 192,736 | |
Schlumberger Ltd. | | | 10,875 | | | | 910,346 | |
Superior Energy Services, Inc. | | | 6,927 | | | | 122,400 | |
| | | | | | | | |
| | | | | | | | 3,125,929 | |
Food Products — 5.7% | | | | | | | | |
AGT Food & Ingredients, Inc. | | | 19,035 | | | | 520,912 | |
Archer-Daniels-Midland Co. | | | 24,470 | | | | 1,083,042 | |
| | | | | | | | |
Common Stocks | | Shares | | | Value | |
Food Products (continued) | | | | | | | | |
Astra Agro Lestari Tbk PT | | | 280,122 | | | $ | 330,944 | |
BRF SA — ADR | | | 29,162 | | | | 412,059 | |
Bunge Ltd. | | | 14,920 | | | | 1,032,613 | |
Elders Ltd. (c) | | | 114,688 | | | | 369,661 | |
First Resources Ltd. | | | 458,300 | | | | 625,457 | |
Glanbia PLC | | | 43,321 | | | | 731,876 | |
Golden Agri-Resources Ltd. | | | 1,812,000 | | | | 545,039 | |
Marfrig Global Foods SA (c) | | | 62,442 | | | | 128,011 | |
Minerva SA Brazil (c) | | | 150,034 | | | | 571,835 | |
Origin Enterprises PLC (c) | | | 63,575 | | | | 435,935 | |
PureCircle Ltd. (c)(d) | | | 121,172 | | | | 426,818 | |
SunOpta, Inc. (c) | | | 57,139 | | | | 399,973 | |
Synlait Milk Ltd. (c) | | | 79,215 | | | | 180,743 | |
Tegel Group Holdings Ltd. (d) | | | 261,757 | | | | 257,210 | |
Tyson Foods, Inc., Class A | | | 9,746 | | | | 611,951 | |
Wilmar International Ltd. | | | 234,000 | | | | 643,971 | |
| | | | | | | | |
| | | | | | | | 9,308,050 | |
Machinery — 2.6% | | | | | | | | |
AGCO Corp. | | | 10,339 | | | | 649,289 | |
Deere & Co. | | | 21,315 | | | | 2,281,771 | |
Kubota Corp. | | | 83,800 | | | | 1,332,191 | |
| | | | | | | | |
| | | | | | | | 4,263,251 | |
Metals & Mining — 17.8% | | | | | | | | |
Acacia Mining PLC | | | 102,145 | | | | 553,918 | |
Agnico Eagle Mines Ltd. | | | 28,709 | | | | 1,369,428 | |
Alamos Gold, Inc., Class A | | | 63,271 | | | | 474,563 | |
AngloGold Ashanti Ltd. (c) | | | 30,582 | | | | 388,631 | |
ArcelorMittal (c) | | | 16,677 | | | | 130,040 | |
Arizona Mining, Inc. (c)(d) | | | 51,643 | | | | 117,077 | |
B2Gold Corp. (c) | | | 170,196 | | | | 516,637 | |
Bacanora Minerals Ltd. (c) | | | 38,884 | | | | 36,443 | |
Barrick Gold Corp. | | | 76,716 | | | | 1,414,449 | |
Beadell Resources Ltd. (c)(d) | | | 776,934 | | | | 180,920 | |
Belo Sun Mining Corp. (c) | | | 222,630 | | | | 152,269 | |
BHP Billiton PLC | | | 88,654 | | | | 1,616,861 | |
Boliden AB | | | 13,490 | | | | 393,536 | |
Centamin PLC | | | 212,934 | | | | 421,053 | |
Centerra Gold, Inc. | | | 38,659 | | | | 191,030 | |
Dalradian Resources, Inc. (c) | | | 60,000 | | | | 61,326 | |
Detour Gold Corp. (c) | | | 30,829 | | | | 418,161 | |
Eldorado Gold Corp. (c) | | | 140,125 | | | | 495,351 | |
First Quantum Minerals Ltd. | | | 43,636 | | | | 550,291 | |
Franco-Nevada Corp. | | | 9,264 | | | | 602,578 | |
Fresnillo PLC | | | 49,441 | | | | 907,564 | |
Glencore PLC (c) | | | 280,596 | | | | 1,162,144 | |
| | | | | | | | | | |
| Portfolio Abbreviations | | | | | | | | |
| CNH | | Chinese Yuan Offshore | | HKD | | Hong Kong Dollar | | S&P | | Standard & Poor’s |
| ETF | | Exchange-Traded Fund | | JPY | | Japanese Yen | | SGD | | Singapore Dollar |
| EUR | | Euro | | LIBOR | | London Interbank Offered Rate | | USD | | U.S. Dollar |
| GBP | | British Pound | | OTC | | Over-the-Counter | | | | |
See Notes to Financial Statements.
| | | | | | |
| | | BLACKROCK FUNDS | | JANUARY 31, 2017 | | 11 |
| | | | |
| Consolidated Schedule of Investments (continued) | | | BlackRock Commodity Strategies Fund | |
| | | | |
| | | | | | | | |
| Common Stocks | | Shares | | | Value | |
Metals & Mining (continued) | | | | | | | | |
Gold Fields Ltd. — ADR | | | 58,795 | | | $ | 206,370 | |
Gold Standard Ventures Corp. (c)(d) | | | 14,337 | | | | 39,224 | |
Goldcorp, Inc. | | | 42,246 | | | | 683,078 | |
HudBay Minerals, Inc. | | | 17,957 | | | | 140,620 | |
Iluka Resources Ltd. | | | 36,952 | | | | 212,065 | |
Integra Gold Corp. (c) | | | 95,251 | | | | 54,168 | |
Kinross Gold Corp. (c) | | | 37,735 | | | | 147,025 | |
Lundin Mining Corp. (c) | | | 89,993 | | | | 550,505 | |
MAG Silver Corp. (c) | | | 31,254 | | | | 444,341 | |
Metals X Ltd. (c) | | | 278,743 | | | | 169,127 | |
MMC Norilsk Nickel PJSC — ADR | | | 13,580 | | | | 219,724 | |
Nemaska Lithium, Inc. (c)(d) | | | 35,926 | | | | 39,205 | |
Nevsun Resources Ltd. | | | 47,205 | | | | 148,734 | |
Newcrest Mining Ltd. | | | 113,391 | | | | 1,859,511 | |
Newmont Mining Corp. | | | 47,737 | | | | 1,731,898 | |
Northern Star Resources Ltd. | | | 135,878 | | | | 395,291 | |
Nyrstar NV (c) | | | 7,914 | | | | 66,842 | |
Oceanagold Corp. | | | 158,305 | | | | 549,886 | |
Orocobre Ltd. (c) | | | 19,673 | | | | 63,094 | |
Osisko Gold Royalties Ltd. | | | 10,015 | | | | 109,905 | |
OZ Minerals Ltd. | | | 55,591 | | | | 379,329 | |
Petra Diamonds Ltd. (c) | | | 42,072 | | | | 80,325 | |
Pretium Resources, Inc. (c) | | | 26,574 | | | | 286,315 | |
Randgold Resources Ltd. | | | 3,310 | | | | 281,752 | |
Randgold Resources Ltd. — ADR | | | 11,218 | | | | 952,857 | |
Rio Tinto PLC | | | 40,069 | | | | 1,775,182 | |
Sierra Metals, Inc. (c) | | | 171,368 | | | | 330,554 | |
Silver Wheaton Corp. | | | 50,827 | | | | 1,123,760 | |
Sociedad Minera Cerro Verde SAA (c) | | | 12,664 | | | | 291,272 | |
South32 Ltd. | | | 184,809 | | | | 386,801 | |
Tahoe Resources, Inc. | | | 14,516 | | | | 132,415 | |
Teck Resources Ltd., Class B | | | 27,761 | | | | 680,345 | |
TMAC Resources, Inc. (c) | | | 39,016 | | | | 502,523 | |
Torex Gold Resources, Inc. (c) | | | 14,170 | | | | 300,551 | |
Trevali Mining Corp. (c)(d) | | | 63,043 | | | | 61,529 | |
Vale SA — ADR, Preference Shares | | | 118,638 | | | | 1,149,602 | |
Volcan Cia Minera SAA, Class B | | | 439,371 | | | | 110,145 | |
Western Areas Ltd. (c) | | | 59,911 | | | | 111,861 | |
Westgold Resources Ltd. (c) | | | 136,097 | | | | 204,883 | |
Yamana Gold, Inc. | | | 32,639 | | | | 107,856 | |
| | | | | | | | |
| | | | | | | | 29,234,740 | |
Oil, Gas & Consumable Fuels — 14.1% | | | | | | | | |
AltaGas Ltd. | | | 22,021 | | | | 523,766 | |
Anadarko Petroleum Corp. | | | 16,442 | | | | 1,143,212 | |
BP PLC | | | 281,411 | | | | 1,680,743 | |
Cabot Oil & Gas Corp. | | | 15,858 | | | | 340,630 | |
Cairn Energy PLC (c) | | | 81,209 | | | | 232,542 | |
Chevron Corp. | | | 12,982 | | | | 1,445,546 | |
Cimarex Energy Co. | | | 5,296 | | | | 716,072 | |
ConocoPhillips | | | 27,045 | | | | 1,318,714 | |
Devon Energy Corp. | | | 14,346 | | | | 653,317 | |
Enbridge, Inc. | | | 13,046 | | | | 555,426 | |
EnCana Corp. | | | 53,583 | | | | 683,968 | |
EOG Resources, Inc. | | | 13,075 | | | | 1,328,159 | |
EQT Corp. | | | 6,193 | | | | 375,482 | |
Exxon Mobil Corp. | | | 30,799 | | | | 2,583,728 | |
Hess Corp. | | | 13,056 | | | | 707,374 | |
Kosmos Energy Ltd. (c) | | | 35,002 | | | | 228,913 | |
Lundin Petroleum AB (c) | | | 8,966 | | | | 193,490 | |
Marathon Oil Corp. | | | 37,397 | | | | 626,400 | |
Nexgen Energy Ltd. (c)(d) | | | 38,884 | | | | 106,679 | |
Noble Energy, Inc. | | | 16,006 | | | | 636,399 | |
Occidental Petroleum Corp. | | | 8,352 | | | | 566,015 | |
Oil Search Ltd. | | | 91,644 | | | | 478,616 | |
Phillips 66 | | | 3,116 | | | | 254,328 | |
| | | | | | | | |
| Common Stocks | | Shares | | | Value | |
Oil, Gas & Consumable Fuels (continued) | | | | | | | | |
Pioneer Natural Resources Co. | | | 4,929 | | | $ | 888,354 | |
Royal Dutch Shell PLC, A Shares | | | 115,142 | | | | 3,122,854 | |
Tesoro Corp. | | | 4,500 | | | | 363,825 | |
TransCanada Corp. | | | 18,272 | | | | 862,031 | |
Valero Energy Corp. | | | 8,886 | | | | 584,343 | |
| | | | | | | | |
| | | | | | | | 23,200,926 | |
Paper & Forest Products — 0.4% | | | | | | | | |
TFS Corp. Ltd. (d) | | | 530,915 | | | | 632,773 | |
Trading Companies & Distributors — 0.1% | | | | | | | | |
Titan Machinery, Inc. (c) | | | 9,571 | | | | 132,175 | |
Total Common Stocks — 49.5% | | | | | | | 81,114,463 | |
| | | | | | | | |
| Investment Companies | | | | | | |
ELEMENTSSM Linked to the Rogers International Commodity Index — Total Return (c) | | | 177,000 | | | | 925,710 | |
ETFS All Commodities DJ-UBSCISM (c) | | | 105,000 | | | | 931,350 | |
PowerShares DB Commodity Index Tracking Fund (c) | | | 150,000 | | | | 2,362,500 | |
Total Investment Companies — 2.6% | | | | | | | 4,219,560 | |
| | | | | | | | |
| Preferred Stocks | | | | | | |
Food Products — 0.2% | | | | | | | | |
Tyson Foods, Inc., 4.75% (e) | | | 4,368 | | | | 297,723 | |
| | | | | | | | |
| Warrants — 0.0% | | | | | | |
Nemaska Lithium, Inc.(Issued/exercisable 7/08/16, 1 Share for 1 Warrant, Expires 7/08/19, Strike Price CAD 1.50) | | | 13,155 | | | | 3,235 | |
Total Warrants — 0.0% | | | | | | | 3,235 | |
Total Long-Term Investments (Cost — $91,162,320) — 70.2% | | | | | | | 114,999,816 | |
| | | | | | | | |
| Short-Term Securities | | | | | | |
Money Market Funds | | | | | | | | |
BlackRock Liquidity Funds, T-Fund, Institutional Class, 0.40% (f)(g) | | | 2,310,035 | | | | 2,310,035 | |
SL Liquidity Series, LLC, Money Market Series, 0.94% (f)(g)(h) | | | 1,313,666 | | | | 1,313,929 | |
Total Money Market Funds — 2.2% | | | | | | | 3,623,964 | |
| U.S. Treasury Obligations | | Par (000) | | | | |
U.S. Treasury Bills (i): | | | | | | | | |
0.45%, 2/23/17-3/30/17 | | $ | 16,000 | | | | 15,991,717 | |
0.53%, 4/20/17-6/29/17 | | | 12,000 | | | | 11,980,534 | |
0.52%, 4/27/17 | | | 8,000 | | | | 7,990,555 | |
0.58%, 5/25/17 | | | 10,000 | | | | 9,984,070 | |
Total U.S. Treasury Obligations — 28.0% | | | | | | | 45,946,876 | |
Total Short-Term Securities (Cost — $49,567,982) — 30.2% | | | | 49,570,840 | |
Total Investments (Cost — $140,730,302) — 100.4% | | | | 164,570,656 | |
Liabilities in Excess of Other Assets — (0.4)% | | | | | | | (663,436 | ) |
| | | | | | | | |
Net Assets — 100.0% | | | | | | $ | 163,907,220 | |
| | | | | | | | |
See Notes to Financial Statements.
| | | | | | |
| 12 | | BLACKROCK FUNDS | | JANUARY 31, 2017 | | |
| | | | |
| Consolidated Schedule of Investments (continued) | | | BlackRock Commodity Strategies Fund | |
|
| Notes to Consolidated Schedule of Investments |
| (a) | Variable rate security. Rate as of period end. |
| (b) | Security exempt from registration pursuant to Rule 144A under the Securities Act of 1933, as amended. These securities may be resold in transactions exempt from registration to qualified institutional investors. |
| (c) | Non-income producing security. |
| (d) | Security, or a portion of security, is on loan. |
| (f) | During the six months ended January 31, 2017, investments in issuers considered to be affiliates of the Fund for purposes of Section 2(a)(3) of the Investment Company Act of 1940, as amended, were as follows: |
| | | | | | | | | | | | | | | | | | | | | | | | | | | | |
| Affiliate | | Shares Held at July 31, 2016 | | | Net Activity | | | Shares Held at January 31, 2017 | | | Value at
January 31,
2017 | | | Income | | | Net
Realized
Gain1 | | | Change in
Unrealized
Appreciation | |
BlackRock Liquidity Funds, TempFund, Institutional Class | | | 1,697,413 | | | | (1,697,413 | ) | | | — | | | | — | | | | $ 367 | | | | — | | | | — | |
BlackRock Liquidity Funds, T-Fund, Institutional Class | | | — | | | | 2,310,035 | | | | 2,310,035 | | | | $2,310,035 | | | | 1,962 | | | | $20 | | | | — | |
SL Liquidity Series, LLC, Money Market Series | | | 1,036,738 | | | | 276,928 | | | | 1,313,666 | | | | 1,313,929 | | | | 18,000 | 2 | | | — | | | | $175 | |
Total | | | | | | | | | | | | | | | $3,623,964 | | | | $20,329 | | | | $20 | | | | $175 | |
| | | | | | | | | | | | | | | | |
| | 1 | | Includes net capital gain distributions. |
| | 2 | | Represents securities lending income earned from the reinvestment of cash collateral from loaned securities, net of fees and collateral investment expenses, and other payments to and from borrowers of securities. |
| (g) | Current yield as of period end. |
| (h) | Security was purchased with the cash collateral from loaned securities. |
| (i) | Rates are discount rates or a range of discount rates at the time of purchase. |
| • | | For Fund compliance purposes, the Fund’s industry classifications refer to one or more of the industry sub-classifications used by one or more widely recognized market indexes or ratings group indexes, and/or as defined by the investment adviser. These definitions may not apply for purposes of this report, which may combine such industry sub-classifications for reporting ease. |
|
| Fair Value Hierarchy as of Period End |
Various inputs are used in determining the fair value of investments. For information about the Fund’s policy regarding valuation of investments, refer to the Notes to Financial Statements.
The following table summarizes the Fund’s investments categorized in the disclosure hierarchy:
| | | | | | | | | | | | | | | | |
| | | Level 1 | | | Level 2 | | | Level 3 | | | Total | |
Assets: | | | | | | | | | | | | | | | | |
Investments: | | | | | | | | | | | | | | | | |
Long-Term Investments: | | | | | | | | | | | | | | | | |
Commodity-Linked Notes | | | — | | | | — | | | $ | 29,364,835 | | | $ | 29,364,835 | |
Common Stocks: | | | | | | | | | | | | | | | | |
Chemicals | | $ | 7,388,170 | | | $ | 3,687,109 | | | | — | | | | 11,075,279 | |
Construction Materials | | | — | | | | 141,340 | | | | — | | | | 141,340 | |
Energy Equipment & Services | | | 3,125,929 | | | | — | | | | — | | | | 3,125,929 | |
Food Products | | | 7,055,630 | | | | 2,252,420 | | | | — | | | | 9,308,050 | |
Machinery | | | 2,931,060 | | | | 1,332,191 | | | | — | | | | 4,263,251 | |
Metals & Mining | | | 17,765,735 | | | | 11,469,005 | | | | — | | | | 29,234,740 | |
Oil, Gas & Consumable Fuels | | | 17,492,681 | | | | 5,708,245 | | | | — | | | | 23,200,926 | |
Paper & Forest Products | | | — | | | | 632,773 | | | | — | | | | 632,773 | |
Trading Companies & Distributors | | | 132,175 | | | | — | | | | — | | | | 132,175 | |
Investment Companies | | | 4,219,560 | | | | — | | | | — | | | | 4,219,560 | |
Preferred Stocks | | | 297,723 | | | | — | | | | — | | | | 297,723 | |
Warrants | | | 3,235 | | | | — | | | | — | | | | 3,235 | |
Short Term Investments: | | | | | | | | | | | | | | | | |
Money Market Funds | | | 2,310,035 | | | | — | | | | — | | | | 2,310,035 | |
U.S. Treasury Obligations | | | — | | | | 45,946,876 | | | | — | | | | 45,946,876 | |
| | | | |
Subtotal | | $ | 62,721,933 | | | $ | 71,169,959 | | | $ | 29,364,835 | | | $ | 163,256,727 | |
| | | | |
Investments Valued at NAV1 | | | | | | | | | | | | | | | 1,313,929 | |
| | | | | | | | | | | | | | | | |
Total Investments | | | | | | | | | | | | | | $ | 164,570,656 | |
| | | | | | | | | | | | | | | | |
| | 1 | | As of January 31, 2017, certain investments of the Fund were fair valued using NAV per share as no quoted market value is available and therefore have been excluded from the fair value hierarchy. |
During the six months ended January 31, 2017, there were no transfers between Level 1 and Level 2.
See Notes to Financial Statements.
| | | | | | |
| | | BLACKROCK FUNDS | | JANUARY 31, 2017 | | 13 |
| | | | |
| Consolidated Schedule of Investments (concluded) | | | BlackRock Commodity Strategies Fund | |
A reconciliation of Level 3 investments is presented when the Fund had a significant amount of Level 3 investments at the beginning and/or end of the period in relation to net assets. The following table is a reconciliation of Level 3 investments for which significant unobservable inputs were used in determining fair value:
| | | | |
| | | Commodity-Linked
Notes | |
Assets: | | | | |
Opening Balance, as of July 31, 2016 | | | $ 24,743,066 | |
Transfers into Level 3 | | | — | |
Transfers out of Level 3 | | | — | |
Accrued discounts/premiums | | | — | |
Net realized gain (loss) | | | 3,111,968 | |
Net change in unrealized appreciation (depreciation)1,2 | | | 621,769 | |
Purchases | | | 14,000,000 | |
Sales | | | (13,111,968 | ) |
| | | | |
Closing Balance, as of January 31, 2017 | | | $ 29,364,835 | |
| | | | |
Net change in unrealized appreciation (depreciation) on investments still held at January 31, 20172 | | | $ 2,521,106 | |
| | | | |
| | 1 | Included in the related net change in unrealized appreciation (depreciation) in the Statements of Operations. |
| | 2 | Any difference between net change in unrealized appreciation (depreciation) and net change in unrealized appreciation (depreciation) on investments still held at January 31, 2017 is generally due to investments no longer held or categorized as Level 3 at period end. |
The Fund’s investments that are categorized as Level 3 were valued utilizing third party pricing information without adjustment. Such valuations are based on unobservable inputs. A significant change in third party information could result in a significantly lower or higher value of such Level 3 investments.
See Notes to Financial Statements.
| | | | | | |
| 14 | | BLACKROCK FUNDS | | JANUARY 31, 2017 | | |
| | | | |
| Schedule of Investments January 31, 2017 (Unaudited) | | | BlackRock Global Long/Short Credit Fund | |
| | | (Percentages shown are based on Net Assets) | |
| | | | | | | | | | | | |
| Asset-Backed Securities | | | | | Par (000) | | | Value | |
Cayman Islands — 3.7% | | | | | | | | | | | | |
ACAS CLO Ltd.: | | | | | | | | | | | | |
Series 2014-1A, Class C,
3.92%, 7/18/26 (a)(b) | | | USD | | | | 995 | | | $ | 996,678 | |
Series 2015-2A, Class A1,
2.39%, 10/28/27 (a)(b) | | | | | | | 2,000 | | | | 2,000,526 | |
ALM VII Ltd., Series 2012-7A, Class A1R,
2.50%, 10/15/28 (a)(b) | | | | | | | 12,000 | | | | 12,006,133 | |
ALM VIII Ltd., Series 2013-8A, Class A1R,
2.51%, 10/15/28 (a)(b) | | | | | | | 2,750 | | | | 2,749,774 | |
ALM XIV Ltd., Series 2014-14A, Class C,
4.34%, 7/28/26 (a)(b) | | | | | | | 2,375 | | | | 2,343,460 | |
Anchorage Capital CLO Ltd., Series 2014-3A, Class A2AR, 2.91%, 4/28/26 (a)(b) | | | | | | | 2,000 | | | | 1,999,216 | |
Apidos CLO XII, Series 2013-12A, Class D,
4.07%, 4/15/25 (a)(b) | | | | | | | 1,500 | | | | 1,463,020 | |
Apidos CLO XVIII, Series 2014-18A, Class C,
4.69%, 7/22/26 (a)(b) | | | | | | | 880 | | | | 876,258 | |
Apidos CLO XXV, Series 2016-25A, Class A1,
2.20%, 10/20/28 (a)(b) | | | | | | | 3,500 | | | | 3,502,148 | |
Ares XXVII CLO Ltd., Series 2013-2A, Class B,
2.84%, 7/28/25 (a)(b) | | | | | | | 3,000 | | | | 3,000,787 | |
Atlas Senior Loan Fund IV Ltd., Series 2013-2A, Class A3L, 3.61%, 2/17/26 (a)(b) | | | | | | | 1,800 | | | | 1,775,212 | |
Atlas Senior Loan Fund V Ltd.: | | | | | | | | | | | | |
Series 2014-1A, Class AR,
2.45%, 7/16/26 (a)(b) | | | | | | | 2,000 | | | | 2,002,194 | |
Series 2014-1A, Class BR, 3.02%, 7/16/26 (a)(b) | | | | | | | 2,250 | | | | 2,241,070 | |
BlueMountain CLO Ltd., Series 2013-2A, Class A, 2.24%, 1/22/25 (a)(b) | | | | | | | 2,500 | | | | 2,501,669 | |
Burnham Park CLO Ltd., Series 2016-1A, Class A, 2.32%, 10/20/29 (a)(b) | | | | | | | 3,000 | | | | 2,997,291 | |
Cedar Funding III CLO Ltd., Series 2014-3A, Class D, 4.46%, 5/20/26 (a)(b) | | | | | | | 1,105 | | | | 1,076,876 | |
Cedar Funding IV CLO Ltd., Series 2014-4A, Class A1, 2.54%, 10/23/26 (a)(b) | | | | | | | 1,800 | | | | 1,800,487 | |
Cedar Funding VI CLO Ltd., Series 2016-6A, Class A1, 2.34%, 10/20/28 (a)(b) | | | | | | | 7,250 | | | | 7,233,289 | |
CIFC Funding Ltd.: | | | | | | | | | | | | |
Series 2012-1AR, Class B1R,
5.05%, 8/14/24 (a)(b) | | | | | | | 1,500 | | | | 1,498,502 | |
Series 2013-3A, Class A2A,
2.89%, 10/24/25 (a)(b) | | | | | | | 3,250 | | | | 3,253,359 | |
Series 2014-2A, Class B1L,
4.43%, 5/24/26 (a)(b) | | | | | | | 1,355 | | | | 1,349,484 | |
Series 2014-4A, Class D,
4.42%, 10/17/26 (a)(b) | | | | | | | 3,250 | | | | 3,238,293 | |
Series 2014-5A, Class A1R,
2.42%, 1/17/27 (a)(b) | | | | | | | 4,000 | | | | 4,007,766 | |
Dryden 34 Senior Loan Fund, Series 2014-34A, Class C, 3.82%, 10/15/26 (a)(b) | | | | | | | 500 | | | | 501,480 | |
Flatiron CLO Ltd., Series 2013-1A, Class A1,
2.42%, 1/17/26 (a)(b) | | | | | | | 3,205 | | | | 3,205,863 | |
Fraser Sullivan CLO VII Ltd.: | | | | | | | | | | | | |
Series 2012-7A, Class ER,
5.78%, 4/20/23 (a)(b) | | | | | | | 1,045 | | | | 995,073 | |
Series 2012-7A, Class SUBR,
0.00%, 4/20/23 (a)(c) | | | | | | | 1,455 | | | | 516,012 | |
Galaxy XIX CLO Ltd., Series 2015-19A, Class A1A, 2.59%, 1/24/27 (a)(b) | | | | | | | 3,500 | | | | 3,510,921 | |
Galaxy XV CLO Ltd.: | | | | | | | | | | | | |
Series 2013-15A, Class A,
2.27%, 4/15/25 (a)(b) | | | | | | | 1,000 | | | | 998,402 | |
Series 2013-15A, Class C,
3.28%, 4/15/25 (a)(b) | | | | | | | 1,000 | | | | 1,001,338 | |
Galaxy XVII CLO Ltd., Series 2014-17A, Class AR, 2.42%, 7/15/26 (a)(b) | | | | | | | 1,500 | | | | 1,500,563 | |
GoldenTree Loan Opportunities IX Ltd., Series 2014-9A, Class AR, 2.41%, 10/29/26 (a)(b) | | | | | | | 3,250 | | | | 3,247,502 | |
| | | | | | | | | | | | |
| Asset-Backed Securities | | | | | Par (000) | | | Value | |
Cayman Islands (continued) | | | | | | | | | | | | |
KKR Financial CLO Ltd., Series 2013-1A, Class A1, 2.17%, 7/15/25 (a)(b) | | | USD | | | | 1,640 | | | $ | 1,640,043 | |
LCM XVIII LP, Series 18A, Class B1,
3.33%, 4/20/27 (a)(b) | | | | | | | 5,250 | | | | 5,250,821 | |
LCM XXI LP, Series 21A, Class A,
2.58%, 4/20/28 (a)(b) | | | | | | | 4,000 | | | | 4,021,805 | |
Madison Park Funding IX Ltd., Series 2012-9AR, Class DR, 4.76%, 8/15/22 (a)(b) | | | | | | | 1,500 | | | | 1,498,672 | |
Madison Park Funding X Ltd.: | | | | | | | | | | | | |
Series 2012-10A, Class AR,
2.48%, 1/20/29 (a)(b) | | | | | | | 5,500 | | | | 5,503,057 | |
Series 2012-10A, Class DR,
5.23%, 1/20/29 (a)(b) | | | | | | | 2,630 | | | | 2,625,912 | |
Madison Park Funding XI Ltd.: | | | | | | | | | | | | |
Series 2013-11A, Class A1B,
2.49%, 10/23/25 (a)(b) | | | | | | | 5,500 | | | | 5,505,546 | |
Series 2013-11A, Class C,
3.79%, 10/23/25 (a)(b) | | | | | | | 2,680 | | | | 2,683,556 | |
Mountain Hawk II CLO Ltd., Series 2013-2A, Class A1, 2.19%, 7/22/24 (a)(b) | | | | | | | 2,320 | | | | 2,306,209 | |
Neuberger Berman CLO XVII Ltd., Series 2014-17A, Class D, 4.43%, 8/04/25 (a)(b) | | | | | | | 568 | | | | 567,906 | |
OCP CLO Ltd., Series 2016-12A, Class A1,
2.46%, 10/18/28 (a)(b) | | | | | | | 3,250 | | | | 3,257,041 | |
Octagon Investment Partners XVIII Ltd.,
Series 2013-1A, Class C, 4.61%, 12/16/24 (a)(b) | | | | | | | 1,000 | | | | 991,420 | |
OHA Credit Partners VIII Ltd., Series 2013-8A, Class A, 2.15%, 4/20/25 (a)(b) | | | | | | | 1,000 | | | | 997,874 | |
OZLM VIII Ltd., Series 2014-8A, Class B,
4.02%, 10/17/26 (a)(b) | | | | | | | 3,000 | | | | 3,008,306 | |
Palmer Square CLO Ltd., Series 2014-1A, Class CR, 4.96%, 1/17/27 (a)(b) | | | | | | | 515 | | | | 510,726 | |
Pinnacle Park CLO Ltd., Series 2014-1A, Class D, 4.52%, 4/15/26 (a)(b) | | | | | | | 1,050 | | | | 1,045,931 | |
Race Point V CLO Ltd., Series 2011-5AR, Class DR, 4.71%, 12/15/22 (a)(b) | | | | | | | 1,645 | | | | 1,644,840 | |
Race Point VIII CLO Ltd., Series 2013-8A, Class A, 2.16%, 2/20/25 (a)(b) | | | | | | | 4,750 | | | | 4,755,445 | |
Regatta IV Funding Ltd., Series 2014-1A, Class C, 3.99%, 7/25/26 (a)(b) | | | | | | | 550 | | | | 550,898 | |
Shackleton II CLO Ltd., Series 2012-2A, Class B1R, 2.05%, 10/20/23 (a)(b) | | | | | | | 2,000 | | | | 1,983,149 | |
Sound Point CLO II Ltd., Series 2013-1A, Class A1L, 2.23%, 4/26/25 (a)(b) | | | | | | | 1,000 | | | | 997,342 | |
Sound Point CLO IV Ltd., Series 2013-3A, Class A, 2.41%, 1/21/26 (a)(b) | | | | | | | 1,274 | | | | 1,272,175 | |
Steele Creek CLO Ltd., Series 2014-1A, Class C, 4.11%, 8/21/26 (a)(b) | | | | | | | 1,110 | | | | 1,109,917 | |
Venture X CLO Ltd., Series 2012-10A, Class BR, 2.86%, 7/20/22 (a)(b) | | | | | | | 6,500 | | | | 6,512,738 | |
Venture XIII CLO Ltd., Series 2013-13A, Class D, 4.50%, 6/10/25 (a)(b) | | | | | | | 500 | | | | 497,824 | |
Venture XXIV CLO Ltd., Series 2016-24A, Class A1P, 2.38%, 10/20/28 (a)(b) | | | | | | | 2,250 | | | | 2,256,221 | |
Voya CLO Ltd., Series 2013-3A, Class B,
3.72%, 1/18/26 (a)(b) | | | | | | | 2,120 | | | | 2,122,856 | |
| | | | | | | | | | | | |
| | | | | | | | | | | | 146,508,876 | |
Ireland — 1.9% | | | | | | | | | | | | |
Adagio IV CLO Ltd., Series IV-X, Class F,
6.65%, 10/15/29 (b) | | | EUR | | | | 1,700 | | | | 1,623,400 | |
Arbour CLO IV DAC: | | | | | | | | | | | | |
Series 4X, Class E, 5.60%, 1/15/30 (b) | | | | | | | 1,833 | | | | 1,914,764 | |
Series 4X, Class F, 8.15%, 1/15/30 (b) | | | | | | | 1,500 | | | | 1,550,749 | |
Arbour CLO Ltd.: Series 2014-1X, Class E,
5.00%, 7/15/27 (b) | | | | | | | 5,313 | | | | 5,461,105 | |
See Notes to Financial Statements.
| | | | | | |
| | | BLACKROCK FUNDS | | JANUARY 31, 2017 | | 15 |
| | | | |
| Schedule of Investments (continued) | | | BlackRock Global Long/Short Credit Fund | |
| | | | |
| | | | | | | | | | | | |
| Asset-Backed Securities | | | | | Par (000) | | | Value | |
Ireland (continued) | | | | | | | | | | | | |
Series 2014-1X, Class F, 5.75%, 7/15/27 (b) | | | EUR | | | | 2,883 | | | $ | 2,836,810 | |
Avoca CLO XIII Ltd, Series 13X, Class E,
5.18%, 12/29/27 (b) | | | | | | | 3,530 | | | | 3,760,538 | |
Avoca CLO XIV Ltd.: | | | | | | | | | | | | |
Series 14X, Class E, 4.75%, 7/12/28 (b) | | | | | | | 1,070 | | | | 1,087,224 | |
Series 14X, Class F, 5.75%, 7/12/28 (b) | | | | | | | 2,200 | | | | 2,078,809 | |
Series 14X, Class SUB, 0.00%, 7/12/28 | | | | | | | 1,500 | | | | 1,450,117 | |
Avoca CLO XV Ltd.: | | | | | | | | | | | | |
Series 15X, Class E, 5.00%, 1/15/29 (b) | | | | | | | 3,240 | | | | 3,309,686 | |
Series 15X, Class F, 6.75%, 1/15/29 (b) | | | | | | | 3,195 | | | | 3,087,932 | |
Series 15X, Class M1, 0.00%, 1/15/29 (b) | | | | | | | 5,300 | | | | 5,325,483 | |
Avoca CLO XVII Ltd., Series 17X, Class E,
5.95%, 1/15/30 (b) | | | | | | | 1,829 | | | | 1,926,208 | |
BlueMountain EUR CLO DAC, Series 2016-1X, Class E, 6.60%, 4/25/30 (b) | | | | | | | 3,300 | | | | 3,478,582 | |
CVC Cordatus Loan Fund IV Ltd.: | | | | | | | | | | | | |
Series 4X, Class E, 5.90%, 1/22/28 (b) | | | | | | | 1,300 | | | | 1,392,185 | |
Series 4X, Class F, 6.50%, 1/22/28 (b) | | | | | | | 4,400 | | | | 4,498,622 | |
Series 4X, Class SUB, 0.21%, 1/24/28 (b) | | | | | | | 21,100 | | | | 20,792,885 | |
CVC Cordatus Loan Fund VII DAC, Series 7X, Class E, 7.00%, 8/15/29 (b) | | | | | | | 2,160 | | | | 2,351,216 | |
Harvest CLO: | | | | | | | | | | | | |
Series 11X, Class E, 4.95%, 3/26/29 (b) | | | | | | | 420 | | | | 446,865 | |
Series 16X, Class E, 6.40%, 10/15/29 (b) | | | | | | | 1,690 | | | | 1,810,556 | |
Sorrento Park CLO Ltd., Series 1X, Class E,
6.07%, 11/16/27 (b) | | | | | | | 1,400 | | | | 1,385,173 | |
St. Paul’s CLO VI DAC, Series 6X, Class D,
6.50%, 7/22/29 (b) | | | | | | | 3,710 | | | | 3,844,767 | |
| | | | | | | | | | | | |
| | | | | | | | | | | | 75,413,676 | |
Italy — 0.3% | | | | | | | | | | | | |
Arianna SPV Srl: | | | | | | | | | | | | |
Series 2014-1, Class A, 3.60%, 10/20/30 | | | | | | | 4,080 | | | | 4,446,392 | |
Series 2014-1, Class B, 5.50%, 10/20/30 | | | | | | | 5,200 | | | | 5,772,003 | |
Colombo Srl, Series 2014-1, Class B,
0.25%, 8/28/26 (b) | | | | | | | 23 | | | | 25,314 | |
| | | | | | | | | | | | |
| | | | | | | | | | | | 10,243,709 | |
Netherlands — 1.4% | | | | | | | | | | | | |
ALME Loan Funding V BV, Series 5X, Class E,
6.00%, 7/15/29 (b) | | | | | | | 3,975 | | | | 4,204,173 | |
Cadogan Square CLO VII BV, Series 7X, Class E, 6.00%, 5/25/29 (b) | | | | | | | 3,625 | | | | 3,845,757 | |
Cairn CLO VI BV, Series 2016-6X, Class E,
6.25%, 7/25/29 (b) | | | | | | | 2,100 | | | | 2,230,889 | |
Dryden 46 Euro CLO BV, Series 2016-46X, Class E, 5.75%, 1/15/30 (b) | | | | | | | 1,352 | | | | 1,405,266 | |
Euro-Galaxy IV CLO BV: | | | | | | | | | | | | |
Series 2015-4X, Class D, 3.35%, 7/30/28 (b) | | | | | | | 1,480 | | | | 1,588,604 | |
Series 2015-4X, Class E, 4.50%, 7/30/28 (b) | | | | | | | 1,965 | | | | 1,977,582 | |
Series 2015-4X, Class F, 6.25%, 7/30/28 (b) | | | | | | | 750 | | | | 718,047 | |
Euro-Galaxy V CLO BV, Series 2016-5X, Class E, 6.30%, 11/10/30 (b) | | | | | | | 1,400 | | | | 1,502,448 | |
Jubilee CDO BV, Series 2014-VIII-X, Class SUB,
4.81%, 1/15/24 (b) | | | | | | | 11,440 | | | | 7,812,689 | |
North Westerly CLO IV BV: | | | | | | | | | | | | |
Series 2014-IV-X, Class A-1, 0.00%, 1/15/26 (b) | | | | | | | 6,166 | | | | 6,079,423 | |
Series 2014-IV-X, Class A-1, 1.22%, 1/15/26 (b) | | | | | | | 19,350 | | | | 21,024,337 | |
| | | | | | | | | | | | |
| Asset-Backed Securities | | | | | Par (000) | | | Value | |
Netherlands (continued) | | | | | | | | | | | | |
OZLME BV, Series 1X, Class E, 6.45%, 1/18/30 (b) | | | EUR | | | | 1,582 | | | $ | 1,623,755 | |
St. Paul’s CLO VII DAC, Series 7X, Class E,
0.00%, 4/30/30 (b) | | | | | | | 1,000 | | | | 1,024,775 | |
Tikehau CLO BV, Series 2015-1X, Class E,
4.60%, 8/04/28 (b) | | | | | | | 2,300 | | | | 2,324,194 | |
| | | | | | | | | | | | |
| | | | | | | | | | | | 57,361,939 | |
United States — 2.6% | | | | | | | | | | | | |
Aircraft Loan Trust, Series 2015-1, Class X,
0.00%, 3/20/22 (c) | | | USD | | | | — | (d) | | | 1,473,464 | |
Carlyle Global Market Strategies CLO Ltd.: | | | | | | | | | | | | |
Series 2012-3A, Class CR,
5.12%, 10/14/28 (a)(b) | | | | | | | 3,495 | | | | 3,489,822 | |
Series 2012-4A, Class BR,
2.93%, 1/20/29 (a)(b) | | | | | | | 1,500 | | | | 1,491,910 | |
Carlyle Global Market Strategies Euro CLO Ltd.: | | | | | | | | | | | | |
Series 2015-2X, Class D, 5.50%, 9/21/29 (b) | | | EUR | | | | 2,000 | | | | 2,121,092 | |
Series 2015-2X, Class E, 6.50%, 9/21/29 (b) | | | | | | | 1,260 | | | | 1,211,742 | |
Credit Acceptance Auto Loan Trust: | | | | | | | | | | | | |
Series 2014-2A, Class B, 2.67%, 9/15/22 (a) | | | USD | | | | 2,000 | | | | 2,008,549 | |
Series 2015-1A, Class B, 2.61%, 1/17/23 (a) | | | | | | | 4,240 | | | | 4,252,905 | |
Series 2015-1A, Class C, 3.30%, 7/17/23 (a) | | | | | | | 1,500 | | | | 1,498,548 | |
Series 2015-2A, Class B, 3.04%, 8/15/23 (a) | | | | | | | 3,695 | | | | 3,722,936 | |
Series 2015-2A, Class C, 3.76%, 2/15/24 (a) | | | | | | | 2,000 | | | | 1,999,286 | |
DCP Rights LLC, Series 2014-1A, Class A,
5.46%, 10/25/44 (a) | | | | | | | 4,570 | | | | 4,561,357 | |
Navient Private Education Loan Trust: | | | | | | | | | | | | |
Series 2015-AA, Class A3,
2.47%, 11/15/30 (a)(b) | | | | | | | 4,705 | | | | 4,865,974 | |
Series 2015-AA, Class B,
3.50%, 12/15/44 (a) | | | | | | | 1,400 | | | | 1,301,436 | |
Series 2014-CTA, Class A,
1.47%, 9/16/24 (a)(b) | | | | | | | 452 | | | | 452,315 | |
Series 2014-CTA, Class B,
2.52%, 10/17/44 (a)(b) | | | | | | | 1,500 | | | | 1,431,025 | |
OneMain Financial Issuance Trust: | | | | | | | | | | | | |
Series 2015-1A, Class B, 3.85%, 3/18/26 (a) | | | | | | | 4,710 | | | | 4,737,323 | |
Series 2014-1A, Class A, 2.43%, 6/18/24 (a) | | | | | | | 2,251 | | | | 2,251,329 | |
Series 2014-2A, Class A, 2.47%, 9/18/24 (a) | | | | | | | 2,147 | | | | 2,149,440 | |
Series 2014-2A, Class B, 3.02%, 9/18/24 (a) | | | | | | | 1,000 | | | | 999,241 | |
Series 2015-1A, Class A, 3.19%, 3/18/26 (a) | | | | | | | 4,710 | | | | 4,749,793 | |
Series 2015-2A, Class A, 2.57%, 7/18/25 (a) | | | | | | | 9,235 | | | | 9,231,877 | |
Series 2015-2A, Class B, 3.10%, 7/18/25 (a) | | | | | | | 1,845 | | | | 1,822,983 | |
Santander Drive Auto Receivables Trust: | | | | | | | | | | | | |
Series 2012-AA, Class Cert,
0.00%, 12/16/19 (a)(c) | | | | | | | — | (d) | | | 1,926,600 | |
Series 2014-3, Class C, 2.13%, 8/17/20 | | | | | | | 1,500 | | | | 1,504,871 | |
Series 2014-3, Class D, 2.65%, 8/17/20 | | | | | | | 5,000 | | | | 5,054,119 | |
Series 2014-4, Class D, 3.10%, 11/16/20 | | | | | | | 1,250 | | | | 1,267,870 | |
Series 2014-S6, Class Cert,
0.00%, 12/16/19 (a)(c) | | | | | | | — | (d) | | | 2,433,600 | |
See Notes to Financial Statements.
| | | | | | |
| 16 | | BLACKROCK FUNDS | | JANUARY 31, 2017 | | |
| | |
| Schedule of Investments (continued) | | BlackRock Global Long/Short Credit Fund |
| | |
| | | | | | | | | | | | |
| Asset-Backed Securities | | | | | Par (000) | | | Value | |
United States (continued) | | | | | | | | | | | | |
SLM Private Education Loan Trust: | | | | | | | | | | | | |
Series 2011-B, Class A3,
3.02%, 6/16/42 (a)(b) | | | USD | | | | 9,870 | | | $ | 10,300,605 | |
Series 2013-B, Class B,
3.00%, 5/16/44 (a) | | | | | | | 5,640 | | | | 5,474,522 | |
SMB Private Education Loan Trust,
Series 2015-C, Class B, 3.50%, 9/15/43 (a) | | | | | | | 9,225 | | | | 8,879,717 | |
Springleaf Funding Trust,
Series 2015-AA, Class A, 3.16%, 11/15/24 (a) | | | | | | | 7,525 | | | | 7,594,289 | |
| | | | | | | | | | | | |
| | | | | | | | | | | | 106,260,540 | |
Total Asset-Backed Securities — 9.9% | | | | | | | | | | | 395,788,740 | |
| | | | | | | | | | | | |
| Common Stocks | | | | | Shares | | | | |
Italy — 0.0% | | | | | | | | | | | | |
Telecom Italia SpA (e) | | | 2,751,393 | | | | 2,361,265 | |
Luxembourg — 0.3% | | | | | | | | | | | | |
Concrete Investment I SCA (e)(f)(g) | | | | | | | 207,748 | | | | 11,717,854 | |
Concrete Investment II SCA (e)(g) | | | | | | | 11,824 | | | | — | |
| | | | | | | | | | | | |
| | | | | | | | | | | | 11,717,854 | |
United States — 0.5% | | | | | | | | | | | | |
Alere, Inc. (e) | | | | | | | 10,000 | | | | 370,000 | |
AMC Networks, Inc., Class A (e) | | | | | | | 159,000 | | | | 9,118,650 | |
Apple Inc. | | | | | | | 28,700 | | | | 3,482,745 | |
Emerson Electric Co. | | | | | | | 25,000 | | | | 1,466,500 | |
Herc Holdings, Inc. | | | | | | | 14,000 | | | | 695,380 | |
Mylan NV | | | | | | | 128,500 | | | | 4,889,425 | |
Ovation Acquisition I LLC (Acquired 12/28/15,
cost $10,049) (e)(h) | | | | | | | 10,049 | | | | 10,049 | |
| | | | | | | | | | | | |
| | | | | | | | | | | | 20,032,749 | |
Total Common Stocks — 0.8% | | | | | | | | | | | 34,111,868 | |
| | | | | | | | | | | | |
| Corporate Bonds | | | | | Par
(000) | | | | |
Australia — 0.9% | | | | | | | | | | | | |
APT Pipelines Ltd., 3.88%, 10/11/22 | | | USD | | | | 379 | | | | 381,584 | |
QBE Insurance Group Ltd., 5.88%, 6/17/46 (b) | | | | | | | 477 | | | | 482,434 | |
Virgin Australia Holdings Ltd., 7.88%, 10/15/21 | | | | | | | 1,300 | | | | 1,303,250 | |
Virgin Australia Trust: | | | | | | | | | | | | |
Series 2013-1, Class B, 6.00%, 4/23/22 (a) | | | | | | | 2,363 | | | | 2,398,269 | |
Series 2013-1, Class C, 7.13%, 10/23/18 (a) | | | | | | | 4,610 | | | | 4,701,742 | |
Westpac Banking Corp., 4.32%, 11/23/31 (b) | | | | | | | 25,000 | | | | 24,938,775 | |
| | | | | | | | | | | | |
| | | | | | | | | | | | 34,206,054 | |
Belgium — 0.1% | | | | | | | | | | | | |
Anheuser-Busch InBev SA/NV,
2.00%, 3/17/28 | | | EUR | | | | 4,700 | | | | 5,254,035 | |
Canada — 2.8% | | | | | | | | | | | | |
Air Canada Pass-Through Trust: | | | | | | | | | | | | |
Series 2013-1, Class B, 5.38%, 11/15/22 (a) | | | USD | | | | 1,539 | | | | 1,569,829 | |
Series 2013-1, Class C, 6.63%, 5/15/18 (a) | | | | | | | 3,045 | | | | 3,159,187 | |
Series 2015-2, Class B, 5.00%, 12/15/23 (a) | | | | | | | 19,067 | | | | 19,066,614 | |
BC ULC/New Red Finance, Inc., 6.00%, 4/01/22 (a) | | | | | | | 21,315 | | | | 22,208,525 | |
| | | | | | | | | | | | |
| Corporate Bonds | | | | | Par
(000) | | | Value | |
Canada (continued) | | | | | | | | | | | | |
Cenovus Energy, Inc., 5.70%, 10/15/19 | | | USD | | | | 41,300 | | | $ | 44,614,573 | |
MEG Energy Corp., 6.50%, 1/15/25 (a) | | | | | | | 2,027 | | | | 2,047,270 | |
Teck Resources Ltd.: | | | | | | | | | | | | |
8.00%, 6/01/21 (a) | | | | | | | 952 | | | | 1,049,580 | |
8.50%, 6/01/24 (a) | | | | | | | 5,286 | | | | 6,151,583 | |
6.00%, 8/15/40 | | | | | | | 7,375 | | | | 7,393,437 | |
6.25%, 7/15/41 | | | | | | | 5,319 | | | | 5,465,273 | |
5.20%, 3/01/42 | | | | | | | 563 | | | | 523,590 | |
| | | | | | | | | | | | |
| | | | | | | | | | | | 113,249,461 | |
Cayman Islands — 0.1% | | | | | | | | | | | | |
Hutchison Whampoa International 11 Ltd.,
4.63%, 1/13/22 | | | | | | | 1,076 | | | | 1,155,901 | |
Hutchison Whampoa International 14 Ltd.,
3.63%, 10/31/24 | | | | | | | 1,500 | | | | 1,506,519 | |
| | | | | | | | | | | | |
| | | | | | | | | | | | 2,662,420 | |
China — 0.6% | | | | | | | | | | | | |
Baoxin Auto Finance I Ltd., 9.00% (b)(f) | | | | | | | 750 | | | | 768,287 | |
China Aoyuan Property Group Ltd.: | | | | | | | | | | | | |
10.88%, 5/26/18 | | | | | | | 450 | | | | 483,173 | |
6.35%, 1/11/20 | | | | | | | 1,342 | | | | 1,360,220 | |
China Evergrande Group, 8.75%, 10/30/18 | | | | | | | 207 | | | | 213,665 | |
CIFI Holdings Group Co. Ltd., 7.75%, 6/05/20 | | | | | | | 948 | | | | 1,022,504 | |
Easy Tactic Ltd., 5.75%, 1/13/22 | | | | | | | 1,700 | | | | 1,685,344 | |
Fantasia Holdings Group Co. Ltd.,
7.38%, 10/04/21 | | | | | | | 433 | | | | 439,611 | |
Far East Horizon Ltd., 5.55% (b)(f) | | | | | | | 400 | | | | 401,909 | |
FUXIANG Investment Management Ltd.,
3.63%, 11/30/19 | | | | | | | 1,400 | | | | 1,405,288 | |
Gansu Provincial Highway Aviation Tourism Investment Group Co. Ltd., 3.00%, 11/18/19 | | | | | | | 450 | | | | 446,848 | |
Guangxi Communications Investment Group Co. Ltd., 3.00%, 11/04/19 | | | | | | | 700 | | | | 691,932 | |
Jingneng Clean Energy Investment Holdings Ltd., 4.30%, 12/23/17 | | | CNH | | | | 6,000 | | | | 863,868 | |
Kaisa Group Holdings Ltd., 6.56% (6.56% Cash or 6.56% PIK), 6/30/20 (i) | | | USD | | | | 1,354 | | | | 1,273,162 | |
Powerlong Real Estate Holdings Ltd.,
4.88%, 9/15/21 | | | | | | | 430 | | | | 404,191 | |
Reward International Investment Ltd.,
7.25%, 1/25/20 | | | | | | | 750 | | | | 754,411 | |
Shenzhen Expressway Co. Ltd., 2.88%, 7/18/21 | | | | | | | 450 | | | | 441,795 | |
Shougang Corp., 3.38%, 12/09/19 | | | | | | | 1,500 | | | | 1,490,784 | |
SPIC U.S. Dollar Bond Co. Ltd.,
3.88%, 12/06/26 | | | | | | | 775 | | | | 780,944 | |
Times Property Holdings Ltd., 6.25%, 1/23/20 | | | | | | | 1,257 | | | | 1,269,138 | |
Union Life Insurance Co. Ltd., 3.00%, 9/19/21 | | | | | | | 4,400 | | | | 4,150,868 | |
Vanke Real Estate Hong Kong Co. Ltd.,
3.95%, 12/23/19 | | | | | | | 1,550 | | | | 1,585,607 | |
West China Cement Ltd., 6.50%, 9/11/19 | | | | | | | 410 | | | | 425,284 | |
Wuhan Metro Group Co. Ltd., 2.38%, 11/08/19 | | | | | | | 1,450 | | | | 1,436,337 | |
Xinyuan Real Estate Co. Ltd., 8.13%, 8/30/19 | | | | | | | 350 | | | | 340,968 | |
Yestar International Holdings Co. Ltd.,
6.90%, 9/15/21 | | | | | | | 382 | | | | 393,057 | |
Yuzhou Properties Co. Ltd., 6.00%, 1/25/22 | | | | | | | 800 | | | | 799,278 | |
| | | | | | | | | | | | |
| | | | | | | | | | | | 25,328,473 | |
Cyprus — 0.4% | | | | | | | | | | | | |
Aroundtown Property Holdings PLC,
3.00%, 5/05/20 (j) | | | EUR | | | | 13,000 | | | | 17,541,966 | |
See Notes to Financial Statements.
| | | | | | |
| | | BLACKROCK FUNDS | | JANUARY 31, 2017 | | 17 |
| | |
| Schedule of Investments (continued) | | BlackRock Global Long/Short Credit Fund |
| | |
| | | | | | | | | | | | |
| Corporate Bonds | | | | | Par
(000) | | | Value | |
France — 2.2% | | | | | | | | | | | | |
Alcatel-Lucent USA, Inc., 6.45%, 3/15/29 | | | USD | | | | 300 | | | $ | 312,870 | |
BNP Paribas Cardif SA, 4.03% (b)(f) | | | EUR | | | | 6,700 | | | | 7,231,928 | |
Bouygues SA, 1.38%, 6/07/27 | | | | | | | 5,000 | | | | 5,277,303 | |
Casino Guichard Perrachon SA, 2.33%, 2/07/25 | | | | | | | 4,500 | | | | 5,037,386 | |
Credit Agricole Assurances SA, 4.25% (b)(f) | | | | | | | 9,800 | | | | 10,408,301 | |
Credit Agricole SA, 4.13%, 1/10/27 (a) | | | USD | | | | 25,000 | | | | 24,886,875 | |
Dry Mix Solutions Investissements SAS,
4.03%, 6/15/21 (b) | | | EUR | | | | 1,835 | | | | 1,985,845 | |
Lion/Seneca France 2, 7.88%, 4/15/19 | | | | | | | 2,041 | | | | 2,181,459 | |
SFR Group SA, 7.38%, 5/01/26 (a) | | | USD | | | | 7,283 | | | | 7,474,179 | |
Societe Generale SA, 4.00%, 1/12/27 (a) | | | | | | | 25,000 | | | | 24,498,925 | |
| | | | | | | | | | | | |
| | | | | | | | | | | | 89,295,071 | |
Germany — 2.0% | | | | | | | | | | | | |
Commerzbank AG: | | | | | | | | | | | | |
7.75%, 3/16/21 | | | EUR | | | | 5,500 | | | | 7,113,224 | |
4.00%, 3/23/26 | | | | | | | 1,110 | | | | 1,207,823 | |
Deutsche Bank AG: | | | | | | | | | | | | |
4.25%, 10/14/21 (a) | | | USD | | | | 16,625 | | | | 16,721,342 | |
4.30%, 5/24/28 (b) | | | | | | | 4,700 | | | | 4,369,519 | |
HSH Nordbank AG: | | | | | | | | | | | | |
0.49%, 2/14/17 (b) | | | EUR | | | | 13,100 | | | | 14,034,048 | |
0.53%, 2/14/17 (b) | | | | | | | 5,287 | | | | 5,677,440 | |
IHO Verwaltungs GmbH: | | | | | | | | | | | | |
2.75% (2.75% Cash or 3.50% PIK),
9/15/21 (i) | | | | | | | 1,875 | | | | 2,079,735 | |
3.25% (3.25% Cash or 4.00% PIK),
9/15/23 (i) | | | | | | | 5,700 | | | | 6,310,088 | |
Unitymedia Hessen GmbH & Co. KG/Unitymedia
NRW GmbH: | | | | | | | | | | | | |
5.63%, 4/15/23 | | | | | | | 997 | | | | 1,154,065 | |
4.00%, 1/15/25 | | | | | | | 6,730 | | | | 7,537,295 | |
4.63%, 2/15/26 | | | | | | | 1,200 | | | | 1,374,167 | |
3.50%, 1/15/27 | | | | | | | 7,790 | | | | 8,321,891 | |
6.25%, 1/15/29 | | | | | | | 4,149 | | | | 5,024,843 | |
| | | | | | | | | | | | |
| | | | | | | | | | | | 80,925,480 | |
Guernsey — 0.1% | | | | | | | | | | | | |
Doric Nimrod Air Alpha Pass-Through Trust,
Series 2013-1, 5.25%, 5/30/23 (a) | | | USD | | | | 3,164 | | | | 3,298,564 | |
Hong Kong — 0.2% | | | | | | | | | | | | |
AIA Group Ltd., 3.20%, 3/11/25 | | | | | | | 1,350 | | | | 1,307,086 | |
Dah Sing Bank Ltd., 4.25%, 11/30/26 (b) | | | | | | | 1,350 | | | | 1,349,309 | |
Haitong International Securities Group Ltd.,
0.00%, 10/25/21 (c)(j) | | | HKD | | | | 6,000 | | | | 777,172 | |
New World China Land Ltd., 4.75%, 1/23/27 | | | USD | | | | 1,267 | | | | 1,273,466 | |
Noble Group Ltd., 3.63%, 3/20/18 | | | | | | | 624 | | | | 596,544 | |
Studio City Co. Ltd.: | | | | | | | | | | | | |
5.88%, 11/30/19 | | | | | | | 257 | | | | 265,031 | |
7.25%, 11/30/21 | | | | | | | 1,100 | | | | 1,162,095 | |
Sun Hung Kai Properties Capital Market Ltd.,
4.50%, 2/14/22 | | | | | | | 260 | | | | 278,234 | |
| | | | | | | | | | | | |
| | | | | | | | | | | | 7,008,937 | |
India — 0.3% | | | | | | | | | | | | |
Adani Ports & Special Economic Zone Ltd.,
3.95%, 1/19/22 (a) | | | | | | | 2,300 | | | | 2,287,113 | |
Bharti Airtel International Netherlands BV,
5.13%, 3/11/23 | | | | | | | 2,900 | | | | 3,039,705 | |
Greenko Dutch BV, 8.00%, 8/01/19 | | | | | | | 200 | | | | 212,250 | |
HT Global IT Solutions Holdings Ltd., 7.00%, 7/14/21 | | | | | | | 1,250 | | | | 1,289,659 | |
ICICI Bank Ltd., 4.00%, 3/18/26 | | | | | | | 636 | | | | 624,819 | |
Reliance Industries Ltd., 5.88%, 2/28/49 | | | | | | | 1,487 | | | | 1,513,023 | |
TML Holdings Pte. Ltd., 5.75%, 5/07/21 | | | | | | | 212 | | | | 223,121 | |
| | | | | | | | | | | | |
| Corporate Bonds | | | | | Par
(000) | | | Value | |
India (continued) | | | | | | | | | | | | |
Vedanta Resources PLC: | | | | | | | | | | | | |
6.00%, 1/31/19 | | | USD | | | | 1,000 | | | $ | 1,023,750 | |
8.25%, 6/07/21 | | | | | | | 1,411 | | | | 1,533,052 | |
6.38%, 7/30/22 | | | | | | | 1,600 | | | | 1,600,000 | |
| | | | | | | | | | | | |
| | | | | | | | | | | | 13,346,492 | |
Indonesia — 0.0% | | | | | | | | | | | | |
Alam Synergy Pte. Ltd., 6.63%, 4/24/22 | | | | | | | 241 | | | | 239,307 | |
Jababeka International BV, 6.50%, 10/05/23 (a) | | | | | | | 435 | | | | 431,890 | |
PB International BV, 7.63%, 1/26/22 | | | | | | | 425 | | | | 424,494 | |
| | | | | | | | | | | | |
| | | | | | | | | | | | 1,095,691 | |
Ireland — 0.4% | | | | | | | | | | | | |
Allied Irish Banks PLC, 4.13%, 11/26/25 (b) | | | EUR | | | | 4,275 | | | | 4,747,564 | |
Ardagh Packaging Finance PLC/Ardagh Holdings
USA, Inc.: | | | | | | | | | | | | |
4.16%, 5/15/21 (a)(b) | | | USD | | | | 4,100 | | | | 4,207,625 | |
4.63%, 5/15/23 (a) | | | | | | | 1,428 | | | | 1,441,388 | |
7.25%, 5/15/24 (a) | | | | | | | 2,302 | | | | 2,466,018 | |
Bank of Ireland, 4.25%, 6/11/24 (b) | | | EUR | | | | 4,050 | | | | 4,514,074 | |
| | | | | | | | | | | | |
| | | | | | | | | | | | 17,376,669 | |
Italy — 2.2% | | | | | | | | | | | | |
Assicurazioni Generali SpA, 5.50%, 10/27/47 (b) | | | | | | | 4,700 | | | | 5,249,124 | |
Intesa Sanpaolo SpA: | | | | | | | | | | | | |
6.63%, 9/13/23 | | | | | | | 8,995 | | | | 11,282,226 | |
3.93%, 9/15/26 | | | | | | | 6,000 | | | | 6,478,355 | |
Meccanica Holdings USA, Inc.: | | | | | | | | | | | | |
7.38%, 7/15/39 (a) | | | USD | | | | 6,850 | | | | 7,552,125 | |
6.25%, 1/15/40 (a) | | | | | | | 6,880 | | | | 6,967,720 | |
Mercury Bondco PLC, 8.25% (8.25% Cash or 9.00% PIK), 5/30/21 (i) | | | EUR | | | | 2,492 | | | | 2,841,058 | |
Telecom Italia Capital SA: | | | | | | | | | | | | |
6.38%, 11/15/33 | | | USD | | | | 6,033 | | | | 6,087,599 | |
6.00%, 9/30/34 | | | | | | | 5,447 | | | | 5,365,295 | |
Telecom Italia Finance SA, 7.75%, 1/24/33 | | | EUR | | | | 7,060 | | | | 9,744,835 | |
Telecom Italia SpA, 1.13%, 3/26/22 (j) | | | | | | | 4,800 | | | | 4,938,090 | |
UniCredit SpA: | | | | | | | | | | | | |
6.95%, 10/31/22 | | | | | | | 4,520 | | | | 5,581,106 | |
5.75%, 10/28/25 (b) | | | | | | | 12,590 | | | | 14,397,056 | |
| | | | | | | | | | | | |
| | | | | | | | | | | | 86,484,589 | |
Japan — 0.2% | | | | | | | | | | | | |
ORIX Corp., 3.95%, 1/19/27 | | | USD | | | | 1,500 | | | | 1,483,209 | |
Universal Entertainment Corp., 8.50% (8.50% Cash or 8.50% PIK), 8/24/20 (a)(i) | | | | | | | 4,222 | | | | 4,332,991 | |
| | | | | | | | | | | | |
| | | | | | | | | | | | 5,816,200 | |
Luxembourg — 0.2% | | | | | | | | | | | | |
Altice Financing SA, 6.63%, 2/15/23 (a) | | | | | | | 2,329 | | | | 2,439,628 | |
Bilbao Luxembourg SA, 10.50% (10.50% Cash or 11.25% PIK), 12/01/18 (i) | | | EUR | | | | 3,272 | | | | 3,618,176 | |
| | | | | | | | | | | | |
| | | | | | | | | | | | 6,057,804 | |
Malaysia — 0.1% | | | | | | | | | | | | |
Gohl Capital Ltd., 4.25%, 1/24/27 | | | USD | | | | 2,100 | | | | 2,082,812 | |
Netherlands — 0.5% | | | | | | | | | | | | |
AerCap Ireland Capital Ltd./AerCap Global
Aviation Trust: | | | | | | | | | | | | |
4.25%, 7/01/20 | | | | | | | 9,981 | | | | 10,352,193 | |
4.63%, 7/01/22 | | | | | | | 6,469 | | | | 6,785,399 | |
Constellium NV, 8.00%, 1/15/23 (a) | | | | | | | 2,020 | | | | 2,131,100 | |
| | | | | | | | | | | | |
| | | | | | | | | | | | 19,268,692 | |
See Notes to Financial Statements.
| | | | | | |
| 18 | | BLACKROCK FUNDS | | JANUARY 31, 2017 | | |
| | |
| Schedule of Investments (continued) | | BlackRock Global Long/Short Credit Fund |
| | |
| | | | | | | | | | | | |
| Corporate Bonds | | | | | Par
(000) | | | Value | |
New Zealand — 0.1% | | | | | | | | | | | | |
Reynolds Group Issuer, Inc./Reynolds Group Issuer LLC/Reynolds Group Issuer Luxembourg SA: | | | | | | | | | | | | |
4.52%, 7/15/21 (a)(b) | | | USD | | | | 1,957 | | | $ | 2,013,264 | |
7.00%, 7/15/24 (a) | | | | | | | 769 | | | | 819,370 | |
| | | | | | | | | | | | |
| | | | | | | | | | | | 2,832,634 | |
Norway — 0.4% | | | | | | | | | | | | |
Norwegian Air Shuttle ASA Pass-Through Trust, 7.50%, 11/10/23 (a) | | | | | | | 14,835 | | | | 14,909,175 | |
Philippines — 0.0% | | | | | | | | | | | | |
Rizal Commercial Banking Corp.,
4.25%, 1/22/20 | | | | | | | 400 | | | | 414,262 | |
Portugal — 0.4% | | | | | | | | | | | | |
Banco Espirito Santo SA: | | | | | | | | | | | | |
2.63%, 5/08/17 (e)(k) | | | EUR | | | | 6,100 | | | | 2,041,345 | |
4.75%, 1/15/18 (e)(k) | | | | | | | 19,300 | | | | 6,458,682 | |
4.00%, 1/21/19 (e)(k) | | | | | | | 22,800 | | | | 7,629,945 | |
| | | | | | | | | | | | |
| | | | | | | | | | | | 16,129,972 | |
Singapore — 0.1% | | | | | | | | | | | | |
Global A&T Electronics Ltd., 10.00%, 2/01/19 | | | USD | | | | 2,575 | | | | 1,918,375 | |
STATS ChipPAC Pte. Ltd., 8.50%, 11/24/20 | | | | | | | 204 | | | | 214,200 | |
Suntec Real Estate Investment Trust,
1.75%, 9/05/21 (j) | | | SGD | | | | 1,250 | | | | 861,434 | |
United Overseas Bank Ltd.: | | | | | | | | | | | | |
3.50%, 9/16/26 (b) | | | USD | | | | 1,600 | | | | 1,588,590 | |
2.88%, 3/08/27 (b) | | | | | | | 900 | | | | 860,546 | |
| | | | | | | | | | | | |
| | | | | | | | | | | | 5,443,145 | |
South Korea — 0.1% | | | | | | | | | | | | |
Hyundai Capital Services, Inc.,
2.88%, 3/16/21 | | | | | | | 1,095 | | | | 1,091,281 | |
Shinhan Bank, 3.88%, 12/07/26 (b) | | | | | | | 2,158 | | | | 2,176,157 | |
Woori Bank, 4.75%, 4/30/24 | | | | | | | 2,130 | | | | 2,174,276 | |
| | | | | | | | | | | | |
| | | | | | | | | | | | 5,441,714 | |
Spain — 0.9% | | | | | | | | | | | | |
Bankia SA, 4.00%, 5/22/24 (b) | | | EUR | | | | 17,900 | | | | 19,687,391 | |
BPE Financiaciones SA, 2.00%, 2/03/20 | | | | | | | 10,500 | | | | 11,379,944 | |
Santander Issuances SAU, 3.25%, 4/04/26 | | | | | | | 3,700 | | | | 4,031,508 | |
| | | | | | | | | | | | |
| | | | | | | | | | | | 35,098,843 | |
Switzerland — 1.1% | | | | | | | | | | | | |
Credit Suisse AG, 5.75%, 9/18/25 (b) | | | | | | | 3,970 | | | | 4,765,796 | |
Credit Suisse Group AG: | | | | | | | | | | | | |
3.57%, 1/09/23 (a) | | | USD | | | | 15,000 | | | | 14,930,865 | |
4.28%, 1/09/28 (a) | | | | | | | 25,000 | | | | 24,874,425 | |
| | | | | | | | | | | | |
| | | | | | | | | | | | 44,571,086 | |
Thailand — 0.0% | | | | | | | | | | | | |
CP Foods Holdings Ltd., 0.50%, 9/22/21 (j) | | | | | | | 800 | | | | 791,800 | |
Turkey — 0.3% | | | | | | | | | | | | |
Turkish Airlines Pass-Through Trust,
Series 2015-1, Class A, 4.20%, 3/15/27 (a) | | | | | | | 14,025 | | | | 13,727,248 | |
United Kingdom — 5.2% | | | | | | | | | | | | |
Annington Finance No. 4 PLC, 1.33%, 1/10/23 (b) | | | GBP | | | | — | (d) | | | 664 | |
Annington Finance No. 5 PLC, 13.00% (13.00% Cash or 13.50% PIK), 1/15/23 (i) | | | | | | | 2,488 | | | | 3,598,908 | |
Barclays PLC: | | | | | | | | | | | | |
4.34%, 1/10/28 | | | USD | | | | 10,000 | | | | 9,987,410 | |
4.95%, 1/10/47 | | | | | | | 30,000 | | | | 30,032,730 | |
HSBC Holdings PLC, 4.38%, 11/23/26 | | | | | | | 11,120 | | | | 11,179,225 | |
Iceland Bondco PLC, 6.75%, 7/15/24 | | | GBP | | | | 1,500 | | | | 1,914,028 | |
Ineos Finance PLC, 4.00%, 5/01/23 | | | EUR | | | | 2,840 | | | | 3,188,428 | |
| | | | | | | | | | | | |
| Corporate Bonds | | | | | Par
(000) | | | Value | |
United Kingdom (continued) | | | | | | | | | | | | |
ITV PLC, 2.00%, 12/01/23 | | | EUR | | | | 12,500 | | | $ | 13,561,289 | |
Marks & Spencer PLC, 3.00%, 12/08/23 | | | GBP | | | | 3,050 | | | | 3,845,027 | |
New Look Secured Issuer PLC, 6.50%, 7/01/22 | | | | | | | 11,030 | | | | 12,552,034 | |
Noble Holding International Ltd.,
7.75%, 1/15/24 | | | USD | | | | 1,234 | | | | 1,226,288 | |
Pension Insurance Corp. PLC, 6.50%, 7/03/24 | | | GBP | | | | 825 | | | | 1,017,379 | |
Pizzaexpress Financing 2 PLC, 6.63%, 8/01/21 | | | | | | | 5,800 | | | | 7,405,818 | |
Punch Taverns Finance B Ltd.: | | | | | | | | | | | | |
Series A3, 7.37%, 9/30/21 | | | | | | | 736 | | | | 989,159 | |
Series A6, 5.94%, 9/30/22 | | | | | | | 4,323 | | | | 5,528,351 | |
Series A7, 5.27%, 3/30/24 | | | | | | | 2,403 | | | | 2,907,252 | |
Punch Taverns Finance PLC: | | | | | | | | | | | | |
0.36%, 7/15/21 (b) | | | | | | | 698 | | | | 860,873 | |
Series 2014, 6.03%, 10/15/27 (a)(b) | | | | | | | 10,514 | | | | 12,864,072 | |
Santander UK Group Holdings PLC,
3.85%, 1/10/23 | | | USD | | | | 30,000 | | | | 30,111,480 | |
Synlab Unsecured Bondco PLC,
8.25%, 7/01/23 | | | EUR | | | | 2,400 | | | | 2,862,434 | |
Tullow Oil Jersey Ltd., 6.63%, 7/12/21 (j) | | | USD | | | | 1,800 | | | | 2,322,180 | |
Tullow Oil PLC, 6.25%, 4/15/22 | | | | | | | 4,300 | | | | 3,977,500 | |
Unique Pub Finance Co. PLC: | | | | | | | | | | | | |
7.40%, 3/28/24 | | | GBP | | | | 4,666 | | | | 6,221,709 | |
5.66%, 6/30/27 | | | | | | | 9,549 | | | | 12,758,399 | |
6.46%, 3/30/32 | | | | | | | 5,595 | | | | 6,384,202 | |
Virgin Media Receivables Financing Notes I DAC, 5.50%, 9/15/24 | | | | | | | 3,900 | | | | 4,956,019 | |
Virgin Media Secured Finance PLC: | | | | | | | | | | | | |
4.88%, 1/15/27 | | | | | | | 2,800 | | | | 3,487,187 | |
6.25%, 3/28/29 | | | | | | | 4,595 | | | | 6,118,689 | |
Voyage Care Bondco PLC, 11.00%, 2/01/19 | | | | | | | 4,700 | | | | 5,847,580 | |
| | | | | | | | | | | | |
| | | | | | | | | | | | 207,706,314 | |
United States — 36.2% | | | | | | | | | | | | |
21st Century Fox America, Inc.: | | | | | | | | | | | | |
3.38%, 11/15/26 (a) | | | USD | | | | 10,000 | | | | 9,735,630 | |
4.75%, 11/15/46 (a) | | | | | | | 15,000 | | | | 14,898,705 | |
Abbott Laboratories: | | | | | | | | | | | | |
2.90%, 11/30/21 | | | | | | | 15,000 | | | | 14,934,120 | |
3.75%, 11/30/26 | | | | | | | 15,000 | | | | 14,768,100 | |
Acadia Healthcare Co., Inc., 5.63%, 2/15/23 | | | | | | | 740 | | | | 751,100 | |
Actavis Funding SCS: | | | | | | | | | | | | |
4.55%, 3/15/35 | | | | | | | 10,000 | | | | 9,859,480 | |
4.85%, 6/15/44 | | | | | | | 10,000 | | | | 9,980,890 | |
4.75%, 3/15/45 | | | | | | | 20,000 | | | | 19,723,100 | |
Albertsons Cos. LLC/Safeway, Inc./New Albertson’s, Inc./Albertson’s LLC,
6.63%, 6/15/24 (a) | | | | | | | 1,271 | | | | 1,324,636 | |
Alcoa Nederland Holding BV, 7.00%, 9/30/26 (a) | | | | | | | 339 | | | | 371,205 | |
Alere, Inc.: | | | | | | | | | | | | |
6.50%, 6/15/20 | | | | | | | 14,125 | | | | 14,095,337 | |
6.38%, 7/01/23 (a) | | | | | | | 14,530 | | | | 14,702,544 | |
Allstate Corp.: | | | | | | | | | | | | |
3.28%, 12/15/26 | | | | | | | 10,000 | | | | 9,955,980 | |
4.20%, 12/15/46 | | | | | | | 13,416 | | | | 13,476,224 | |
AMC Networks, Inc., 4.75%, 12/15/22 | | | | | | | 250 | | | | 255,000 | |
American Airlines Group, Inc., 4.63%, 3/01/20 (a) | | | | | | | 8,135 | | | | 8,206,588 | |
American Airlines Pass-Through Trust: | | | | | | | | | | | | |
Series 2001-1, Class A-1, 6.98%, 5/23/21 | | | | | | | 9,484 | | | | 9,673,245 | |
Series 2011-1, Class B, 7.00%, 1/31/18 (a) | | | | | | | 2,811 | | | | 2,939,311 | |
Series 2013-1, Class C, 6.13%, 7/15/18 (a) | | | | | | | 12,304 | | | | 12,826,920 | |
See Notes to Financial Statements.
| | | | | | |
| | | BLACKROCK FUNDS | | JANUARY 31, 2017 | | 19 |
| | |
| Schedule of Investments (continued) | | BlackRock Global Long/Short Credit Fund |
| | |
| | | | | | | | | | | | |
| Corporate Bonds | | | | | Par
(000) | | | Value | |
United States (continued) | | | | | | | | | | | | |
American Airlines Pass-Through Trust, Series 2017-1B, Class B, 4.95%, 2/15/25 | | | USD | | | | 8,411 | | | $ | 8,547,679 | |
American Tire Distributors, Inc.,
10.25%, 3/01/22 (a) | | | | | | | 173 | | | | 168,243 | |
Amgen, Inc., 2.60%, 8/19/26 | | | | | | | 15,000 | | | | 13,760,985 | |
AT&T Inc.: | | | | | | | | | | | | |
0.00%, 11/27/22 (a)(c) | | | | | | | 50,000 | | | | 40,063,600 | |
3.80%, 3/01/24 | | | | | | | 2,825 | | | | 2,825,000 | |
4.25%, 3/01/27 | | | | | | | 20,000 | | | | 19,988,000 | |
5.25%, 3/01/37 | | | | | | | 9,830 | | | | 9,875,021 | |
5.45%, 3/01/47 | | | | | | | 22,625 | | | | 22,625,000 | |
Ball Corp., 4.38%, 12/15/23 | | | EUR | | | | 1,100 | | | | 1,328,467 | |
Bank of America Corp., 4.18%, 11/25/27 | | | USD | | | | 15,000 | | | | 14,883,855 | |
Blackstone CQP HoldCo LP, 9.30%, 3/31/19 | | | | | | | 11,302 | | | | 11,387,067 | |
Boardwalk Pipelines LP, 4.45%, 7/15/27 | | | | | | | 1,900 | | | | 1,899,191 | |
Broadcom Corp./Broadcom Cayman Finance Ltd.: | | | | | | | | | | | | |
3.63%, 1/15/24 (a) | | | | | | | 15,200 | | | | 15,219,258 | |
3.88%, 1/15/27 (a) | | | | | | | 15,305 | | | | 15,188,284 | |
Cablevision Systems Corp.: | | | | | | | | | | | | |
7.75%, 4/15/18 | | | | | | | 5,850 | | | | 6,157,125 | |
5.88%, 9/15/22 | | | | | | | 4,250 | | | | 4,271,250 | |
Capital One Financial Corp., 3.75%, 7/28/26 | | | | | | | 12,000 | | | | 11,596,536 | |
CCO Holdings LLC/CCO Holdings Capital Corp., | | | | | | | | | | | | |
5.88%, 4/01/24 (a) | | | | | | | 2,802 | | | | 3,006,910 | |
CenturyLink, Inc.: | | | | | | | | | | | | |
5.80%, 3/15/22 | | | | | | | 9,300 | | | | 9,564,492 | |
7.50%, 4/01/24 | | | | | | | 11,500 | | | | 12,175,625 | |
CF Industries, Inc.: | | | | | | | | | | | | |
3.40%, 12/01/21 (a) | | | | | | | 15,000 | | | | 14,946,735 | |
4.50%, 12/01/26 (a) | | | | | | | 15,000 | | | | 14,991,000 | |
Charter Communications Operating LLC/Charter Communications Operating Capital,
4.91%, 7/23/25 | | | | | | | 31,075 | | | | 32,675,673 | |
Cheniere Corpus Christi Holdings LLC: | | | | | | | | | | | | |
7.00%, 6/30/24 (a) | | | | | | | 1,453 | | | | 1,621,911 | |
5.88%, 3/31/25 (a) | | | | | | | 1,687 | | | | 1,784,003 | |
Chesapeake Energy Corp., 8.00%, 1/15/25 (a) | | | | | | | 4,789 | | | | 4,905,732 | |
Citigroup, Inc.: | | | | | | | | | | | | |
3.89%, 1/10/28 (b) | | | | | | | 25,000 | | | | 24,983,200 | |
4.75%, 5/18/46 | | | | | | | 20,000 | | | | 19,850,420 | |
Clear Channel Worldwide Holdings, Inc.,
6.50%, 11/15/22 | | | | | | | 4,595 | | | | 4,797,180 | |
CONSOL Energy, Inc., 5.88%, 4/15/22 | | | | | | | 8,375 | | | | 8,102,813 | |
Continental Airlines Pass-Through Certificates: | | | | | | | | | | | | |
Series 2012-2, Class A, 4.00%, 10/29/24 | | | | | | | 2,372 | | | | 2,419,603 | |
Series 2012-3, Class C, 6.13%, 4/29/18 | | | | | | | 4,500 | | | | 4,686,750 | |
Cox Communications, Inc.: | | | | | | | | | | | | |
3.25%, 12/15/22 (a) | | | | | | | 6,385 | | | | 6,224,692 | |
2.95%, 6/30/23 (a) | | | | | | | 9,529 | | | | 9,031,110 | |
4.50%, 6/30/43 (a) | | | | | | | 5,000 | | | | 4,203,735 | |
CSC Holdings LLC: | | | | | | | | | | | | |
10.13%, 1/15/23 (a) | | | | | | | 1,984 | | | | 2,300,210 | |
5.25%, 6/01/24 | | | | | | | 1,785 | | | | 1,793,925 | |
Delta Air Lines Pass Through Trust,
Series 2015-1, Class B, 4.25%, 7/30/23 | | | | | | | 17,127 | | | | 17,511,934 | |
Discovery Communications LLC, 4.90%, 3/11/26 | | | | | | | 8,415 | | | | 8,782,071 | |
DJO Finco, Inc./DJO Finance LLC/DJO Finance Corp., 8.13%, 6/15/21 (a) | | | | | | | 2,555 | | | | 2,210,075 | |
Dollar Tree, Inc., 5.25%, 3/01/20 | | | | | | | 291 | | | | 299,003 | |
Dynegy, Inc., 6.75%, 11/01/19 | | | | | | | 640 | | | | 656,800 | |
E*TRADE Financial Corp., 4.63%, 9/15/23 | | | | | | | 301 | | | | 308,901 | |
EMC Corp., 1.88%, 6/01/18 | | | | | | | 8,834 | | | | 8,788,920 | |
Endo Ltd./Endo Finance LLC/Endo Finco, Inc.: | | | | | | | | | | | | |
6.00%, 7/15/23 (a) | | | | | | | 4,953 | | | | 4,222,433 | |
| | | | | | | | | | | | |
| Corporate Bonds | | | | | Par
(000) | | | Value | |
United States (continued) | | | | | | | | | | | | |
6.00%, 2/01/25 (a) | | | USD | | | | 2,698 | | | $ | 2,195,498 | |
Energy Transfer Partners LP: | | | | | | | | | | | | |
6.50%, 2/01/42 | | | | | | | 9,932 | | | | 11,203,415 | |
5.95%, 10/01/43 | | | | | | | 5,312 | | | | 5,602,019 | |
6.13%, 12/15/45 | | | | | | | 19,688 | | | | 21,466,653 | |
5.30%, 4/15/47 | | | | | | | 10,000 | | | | 9,843,450 | |
Envision Healthcare Corp., 5.63%, 7/15/22 | | | | | | | 4,595 | | | | 4,732,850 | |
First Data Corp.: | | | | | | | | | | | | |
7.00%, 12/01/23 (a) | | | | | | | 9,449 | | | | 10,020,665 | |
5.75%, 1/15/24 (a) | | | | | | | 3,564 | | | | 3,675,375 | |
Florida East Coast Holdings Corp.,
6.75%, 5/01/19 (a) | | | | | | | 5,985 | | | | 6,149,587 | |
Ford Motor Co., 5.29%, 12/08/46 | | | | | | | 10,000 | | | | 9,927,450 | |
Freeport-McMoRan, Inc.: | | | | | | | | | | | | |
2.38%, 3/15/18 | | | | | | | 3,620 | | | | 3,609,140 | |
3.10%, 3/15/20 | | | | | | | 6,255 | | | | 6,208,087 | |
4.00%, 11/14/21 | | | | | | | 1,685 | | | | 1,642,875 | |
5.45%, 3/15/43 | | | | | | | 2,410 | | | | 2,072,600 | |
General Motors Financial Co., Inc.: | | | | | | | | | | | | |
2.57%, 1/14/22 (b) | | | | | | | 15,000 | | | | 15,173,250 | |
4.35%, 1/17/27 | | | | | | | 15,000 | | | | 14,871,225 | |
Goldman Sachs Group, Inc.: | | | | | | | | | | | | |
2.79%, 10/28/27 (b)(l) | | | | | | | 45,000 | | | | 45,786,600 | |
5.15%, 5/22/45 | | | | | | | 20,000 | | | | 20,688,420 | |
Gulfport Energy Corp., 6.38%, 5/15/25 (a) | | | | | | | 567 | | | | 581,175 | |
HCA, Inc.: | | | | | | | | | | | | |
4.25%, 10/15/19 | | | | | | | 9,075 | | | | 9,392,625 | |
7.50%, 2/15/22 | | | | | | | 610 | | | | 693,875 | |
Herc Rentals, Inc.: | | | | | | | | | | | | |
7.50%, 6/01/22 (a) | | | | | | | 14,510 | | | | 15,670,800 | |
7.75%, 6/01/24 (a) | | | | | | | 7,500 | | | | 8,118,750 | |
Hess Corp., 5.80%, 4/01/47 | | | | | | | 25,000 | | | | 26,618,725 | |
Hilton Worldwide Finance LLC/Hilton Worldwide Finance Corp., 5.63%, 10/15/21 | | | | | | | 5,575 | | | | 5,748,244 | |
Hologic, Inc., 5.25%, 7/15/22 (a) | | | | | | | 1,881 | | | | 1,960,943 | |
Informatica LLC, 7.13%, 7/15/23 (a) | | | | | | | 14,142 | | | | 13,611,675 | |
Iron Mountain, Inc., 6.00%, 10/01/20 (a) | | | | | | | 660 | | | | 691,350 | |
Jaguar Holding Co. II/Pharmaceutical Product Development LLC, 6.38%, 8/01/23 (a) | | | | | | | 2,992 | | | | 3,171,520 | |
JC Penney Corp., Inc., 5.88%, 7/01/23 | | | | | | | 1,500 | | | | 1,521,000 | |
KLX, Inc., 5.88%, 12/01/22 (a) | | | | | | | 920 | | | | 963,700 | |
Level 3 Financing, Inc.: | | | | | | | | | | | | |
6.13%, 1/15/21 | | | | | | | 9,808 | | | | 10,139,020 | |
5.13%, 5/01/23 | | | | | | | 2,754 | | | | 2,774,655 | |
5.38%, 1/15/24 | | | | | | | 1,120 | | | | 1,132,600 | |
Lions Gate Entertainment Corp.,
5.88%, 11/01/24 (a) | | | | | | | 6,500 | | | | 6,613,750 | |
Mallinckrodt International Finance SA/Mallinckrodt CB LLC: | | | | | | | | | | | | |
4.88%, 4/15/20 (a) | | | | | | | 709 | | | | 698,365 | |
5.75%, 8/01/22 (a) | | | | | | | 14,990 | | | | 13,903,225 | |
5.50%, 4/15/25 (a) | | | | | | | 4,014 | | | | 3,457,057 | |
MDC Partners, Inc., 6.50%, 5/01/24 (a) | | | | | | | 1,606 | | | | 1,397,220 | |
Micron Technology, Inc.: | | | | | | | | | | | | |
5.25%, 8/01/23 (a) | | | | | | | 21,411 | | | | 21,464,527 | |
7.50%, 9/15/23 (a) | | | | | | | 11,538 | | | | 12,807,180 | |
Mylan NV, 3.13%, 11/22/28 | | | EUR | | | | 4,790 | | | | 5,175,237 | |
Nature’s Bounty Co., 7.63%, 5/15/21 (a) | | | USD | | | | 1,720 | | | | 1,801,700 | |
Nexstar Escrow Corp., 5.63%, 8/01/24 (a) | | | | | | | 1,009 | | | | 1,007,739 | |
Northwest Florida Timber Finance LLC,
4.75%, 3/04/29 (a) | | | | | | | 8,970 | | | | 8,360,758 | |
Novelis Corp.: | | | | | | | | | | | | |
6.25%, 8/15/24 (a) | | | | | | | 2,703 | | | | 2,844,908 | |
5.88%, 9/30/26 (a) | | | | | | | 2,060 | | | | 2,090,900 | |
NRG Energy, Inc., 6.63%, 1/15/27 (a) | | | | | | | 1,908 | | | | 1,893,690 | |
See Notes to Financial Statements.
| | | | | | |
| 20 | | BLACKROCK FUNDS | | JANUARY 31, 2017 | | |
| | | | |
| Schedule of Investments (continued) | | | BlackRock Global Long/Short Credit Fund | |
| | | | |
| | | | | | | | | | | | |
| Corporate Bonds | | | | | Par (000) | | | Value | |
United States (continued) | | | | | | | | | | | | |
Nuance Communications, Inc., 5.38%, 8/15/20 (a) | | | USD | | | | 1,954 | | | $ | 2,002,850 | |
Plains All American Pipeline LP/PAA Finance Corp.: | | | | | | | | | | | | |
4.50%, 12/15/26 | | | | | | | 10,000 | | | | 10,119,520 | |
4.70%, 6/15/44 | | | | | | | 10,000 | | | | 8,986,600 | |
Post Holdings, Inc.: | | | | | | | | | | | | |
7.75%, 3/15/24 (a) | | | | | | | 2,561 | | | | 2,834,720 | |
8.00%, 7/15/25 (a) | | | | | | | 1,083 | | | | 1,218,375 | |
PQ Corp., 6.75%, 11/15/22 (a) | | | | | | | 659 | | | | 713,368 | |
Prime Security Services Borrower LLC/Prime Finance, Inc., 9.25%, 5/15/23 (a) | | | | | | | 16,830 | | | | 18,239,513 | |
Qorvo, Inc.: | | | | | | | | | | | | |
6.75%, 12/01/23 | | | | | | | 10,450 | | | | 11,389,977 | |
7.00%, 12/01/25 | | | | | | | 11,854 | | | | 13,098,670 | |
QUALCOMM, Inc., 4.80%, 5/20/45 | | | | | | | 5,069 | | | | 5,195,102 | |
Rackspace Hosting, Inc., 8.63%, 11/15/24 (a) | | | | | | | 1,982 | | | | 2,056,325 | |
Realogy Group LLC/Realogy Co-Issuer Corp.,
4.88%, 6/01/23 (a) | | | | | | | 1,560 | | | | 1,521,000 | |
RegionalCare Hospital Partners Holdings, Inc.,
8.25%, 5/01/23 (a) | | | | | | | 1,127 | | | | 1,163,628 | |
Rite Aid Corp., 6.13%, 4/01/23 (a) | | | | | | | 4,655 | | | | 4,847,019 | |
Riverbed Technology, Inc., 8.88%, 3/01/23 (a) | | | | | | | 6,430 | | | | 6,831,875 | |
Sabine Pass Liquefaction LLC: | | | | | | | | | | | | |
5.63%, 2/01/21 | | | | | | | 2,135 | | | | 2,305,800 | |
5.88%, 6/30/26 (a) | | | | | | | 1,626 | | | | 1,802,828 | |
Sabre GLBL, Inc.: | | | | | | | | | | | | |
5.38%, 4/15/23 (a) | | | | | | | 9,957 | | | | 10,128,141 | |
5.25%, 11/15/23 (a) | | | | | | | 3,156 | | | | 3,195,450 | |
Seagate HDD Cayman: | | | | | | | | | | | | |
4.25%, 3/01/22 (a) | | | | | | | 3,315 | | | | 3,307,375 | |
4.88%, 3/01/24 (a) | | | | | | | 4,515 | | | | 4,484,659 | |
Shea Homes LP/Shea Homes Funding Corp.,
5.88%, 4/01/23 (a) | | | | | | | 680 | | | | 680,000 | |
Smithfield Foods, Inc.: | | | | | | | | | | | | |
3.35%, 2/01/22 (a) | | | | | | | 13,977 | | | | 14,052,196 | |
4.25%, 2/01/27 (a) | | | | | | | 20,000 | | | | 20,226,800 | |
Sprint Communications, Inc.: | | | | | | | | | | | | |
9.00%, 11/15/18 (a) | | | | | | | 7,209 | | | | 7,893,855 | |
6.00%, 11/15/22 | | | | | | | 4,200 | | | | 4,263,000 | |
Sprint Spectrum Co. LLC/Sprint Spectrum Co. II LLC/Sprint Spectrum Co. III LLC, 3.36%, 9/20/21 (a) | | | | | | | 6,683 | | | | 6,691,354 | |
Standard Industries, Inc., 5.13%, 2/15/21 (a) | | | | | | | 566 | | | | 591,470 | |
Station Casinos LLC, 7.50%, 3/01/21 | | | | | | | 680 | | | | 707,200 | |
Symantec Corp., 3.95%, 6/15/22 | | | | | | | 3,680 | | | | 3,652,440 | |
Tenet Healthcare Corp.: | | | | | | | | | | | | |
5.00%, 3/01/19 | | | | | | | 6,812 | | | | 6,701,305 | |
4.46%, 6/15/20 (b) | | | | | | | 6,100 | | | | 6,176,250 | |
6.00%, 10/01/20 | | | | | | | 3,227 | | | | 3,404,485 | |
7.50%, 1/01/22 (a) | | | | | | | 404 | | | | 433,290 | |
Tennessee Merger Sub, Inc., 6.38%, 2/01/25 (a) | | | | | | | 16,427 | | | | 16,139,527 | |
Time Warner Cable, Inc.: | | | | | | | | | | | | |
5.00%, 2/01/20 | | | | | | | 14,897 | | | | 15,847,101 | |
5.88%, 11/15/40 | | | | | | | 15,000 | | | | 16,125,135 | |
Time Warner, Inc.: | | | | | | | | | | | | |
4.65%, 6/01/44 | | | | | | | 1,179 | | | | 1,131,558 | |
4.85%, 7/15/45 | | | | | | | 8,821 | | | | 8,631,666 | |
Time, Inc., 5.75%, 4/15/22 (a) | | | | | | | 3,400 | | | | 3,493,500 | |
T-Mobile USA, Inc.: | | | | | | | | | | | | |
6.63%, 4/28/21 | | | | | | | 2,895 | | | | 3,018,037 | |
6.73%, 4/28/22 | | | | | | | 1,490 | | | | 1,549,600 | |
6.00%, 3/01/23 | | | | | | | 7,092 | | | | 7,499,790 | |
6.50%, 1/15/24 | | | | | | | 2,810 | | | | 3,028,056 | |
6.38%, 3/01/25 | | | | | | | 6,975 | | | | 7,541,719 | |
| | | | | | | | | | | | |
| Corporate Bonds | | | | | Par (000) | | | Value | |
United States (continued) | | | | | | | | | | | | |
TransDigm, Inc.: | | | | | | | | | | | | |
6.00%, 7/15/22 | | | USD | | | | 12,820 | | | $ | 12,916,150 | |
6.50%, 7/15/24 | | | | | | | 7,835 | | | | 7,844,794 | |
U.S. Airways Pass-Through Trust: | | | | | | | | | | | | |
Series 2012-1, Class B, 8.00%, 10/01/19 | | | | | | | 755 | | | | 838,351 | |
Series 2012-2, Class B, 6.75%, 6/03/22 | | | | | | | 2,468 | | | | 2,683,766 | |
Series 2012-2, Class C, 5.45%, 6/03/18 | | | | | | | 12,800 | | | | 13,088,000 | |
Series 2013-1, Class B, 5.38%, 11/15/21 | | | | | | | 6,123 | | | | 6,321,554 | |
United Airlines Pass-Through Trust: | | | | | | | | | | | | |
Series 2013-1, Class A, 4.30%, 8/15/25 | | | | | | | 5,368 | | | | 5,542,284 | |
Series 2014-2, Class B, 4.63%, 9/03/22 | | | | | | | 8,084 | | | | 8,205,046 | |
United States Steel Corp., 8.38%, 7/01/21 (a) | | | | | | | 1,127 | | | | 1,250,970 | |
Univision Communications, Inc., 5.13%, 2/15/25 (a) | | | | | | | 1,369 | | | | 1,306,546 | |
USG Corp., 8.25%, 1/15/18 | | | | | | | 1,160 | | | | 1,226,700 | |
Viacom, Inc., 3.45%, 10/04/26 | | | | | | | 725 | | | | 672,959 | |
Wayne Merger Sub LLC, 8.25%, 8/01/23 (a) | | | | | | | 2,350 | | | | 2,482,188 | |
Weatherford International Ltd., 9.88%, 2/15/24 (a) | | | | | | | 1,391 | | | | 1,502,280 | |
Wells Fargo & Co., 4.75%, 12/07/46 | | | | | | | 35,000 | | | | 35,591,395 | |
Western Digital Corp.: | | | | | | | | | | | | |
7.38%, 4/01/23 (a) | | | | | | | 14,227 | | | | 15,649,700 | |
10.50%, 4/01/24 (a) | | | | | | | 20,221 | | | | 23,810,227 | |
Williams Cos., Inc., 5.75%, 6/24/44 | | | | | | | 20,000 | | | | 20,250,000 | |
Williams Partners LP: | | | | | | | | | | | | |
4.90%, 1/15/45 | | | | | | | 10,000 | | | | 9,642,000 | |
5.10%, 9/15/45 | | | | | | | 10,000 | | | | 9,988,480 | |
WMG Acquisition Corp., 4.13%, 11/01/24 | | | EUR | | | | 2,200 | | | | 2,475,846 | |
XPO Logistics, Inc., 6.50%, 6/15/22 (a) | | | USD | | | | 2,834 | | | | 2,954,445 | |
Zayo Group LLC/Zayo Capital, Inc.: | | | | | | | | | | | | |
6.00%, 4/01/23 | | | | | | | 2,460 | | | | 2,570,700 | |
6.38%, 5/15/25 | | | | | | | 1,609 | | | | 1,702,531 | |
| | | | | | | | | | | | |
| | | | | | | | | | | | 1,455,723,645 | |
Total Corporate Bonds — 58.1% | | | | | | | | | | | 2,333,089,248 | |
| | | | | | | | | | | | |
| Floating Rate Loan Interests (b) | | | | | | | | | |
Canada — 0.2% | | | | | | | | | | | | |
B.C. Unlimited Liability Co. (New Red Finance, Inc.) (AKA Burger King/Tim Hortons), Term B-2 Loan, 3.75%, 12/10/21 | | | | | | | 8,331 | | | | 8,405,780 | |
Ceva Logistics Canada ULC (FKA TNT Canada ULC), Canadian Term Loan, 6.54%, 3/19/21 | | | | | | | 127 | | | | 110,751 | |
| | | | | | | | | | | | |
| | | | | | | | | | | | 8,516,531 | |
France — 0.2% | | | | | | | | | | | | |
SFR Group SA (Ypso France SAS), EUR TLB-10 Loan, 3.75%, 1/14/25 | | | EUR | | | | 2,195 | | | | 2,391,599 | |
Technicolor SA (FKA Thomson), Euro Term Loan, 3.50%, 12/06/23 | | | | | | | 6,200 | | | | 6,733,092 | |
Vivarte, Bond, 4.00% - 7.00%, 10/29/19 | | | | | | | 107 | | | | 93,928 | |
| | | | | | | | | | | | |
| | | | | | | | | | | | 9,218,619 | |
See Notes to Financial Statements.
| | | | | | |
| | | BLACKROCK FUNDS | | JANUARY 31, 2017 | | 21 |
| | | | |
| Schedule of Investments (continued) | | | BlackRock Global Long/Short Credit Fund | |
| | | | |
| | | | | | | | | | | | |
| Floating Rate Loan Interests (b) | | | | | Par
(000) | | | Value | |
Germany — 0.3% | | | | | | | | | | | | |
IVG Immobilien AG: | | | | | | | | | | | | |
Facility A1 Loan, 9.50%, 6/02/17 | | | EUR | | | | 2,506 | | | $ | 2,704,802 | |
Facility A2 Loan, 9.50%, 6/02/17 | | | | | | | 3,715 | | | | 4,009,957 | |
Springer SBM Two GmbH: | | | | | | | | | | | | |
Initial Term B8 Loan, 4.50%, 8/14/20 | | | | | | | 4,048 | | | | 4,410,097 | |
Term Loan, 9.00%, 8/16/21 | | | | | | | 1,031 | | | | 1,124,373 | |
| | | | | | | | | | | | |
| | | | | | | | | | | | 12,249,229 | |
Italy — 0.3% | | | | | | | | | | | | |
Sit SpA, Medium Term Facility B, 5.50%, 4/30/20 | | | | | | | 12,000 | | | | 12,694,986 | |
Luxembourg — 0.4% | | | | | | | | | | | | |
Azelis Finance SA (Azelis U.S. Holding, Inc.): | | | | | | | | | | | | |
Euro Term Loan (First Lien), 5.00%, 12/16/22 | | | | | | | 1,406 | | | | 1,526,596 | |
Euro Term Loan (Second Lien),
9.50%, 12/18/23 | | | | | | | 5,040 | | | | 5,440,708 | |
BSN Medical Luxembourg Finance Holding S.à r.l. (FKA Boston Luxembourg III S.à r.l.), Facility (Second Lien), 8.00%, 8/31/21 | | | | | | | 1,600 | | | | 1,735,845 | |
Endo Luxembourg Finance Co. I S.à r.l., 2015 Incremental Term B Loan, 3.81%, 9/26/22 | | | USD | | | | 3,321 | | | | 3,310,390 | |
Intelsat Jackson Holdings SA, Tranche B-2 Term Loan, 3.75%, 6/30/19 | | | | | | | 1,196 | | | | 1,176,069 | |
IVG Immobilien AG: | | | | | | | | | | | | |
Facility A2, 2.00%, 6/02/17 | | | EUR | | | | 56 | | | | 3,010 | |
Facility A2 (EUR), 2.00%, 6/02/17 | | | | | | | 71 | | | | 3,838 | |
Facility A3, 2.00%, 6/02/18 | | | | | | | 39 | | | | 2,129 | |
Facility A3 (EUR), 2.00%, 10/31/17 | | | | | | | 10 | | | | 532 | |
Lully Finance S.à r.l. (Lully Finance LLC), Initial Term B-2 Loan (Second Lien), 9.25%, 10/16/23 | | | | | | | 1,090 | | | | 1,176,661 | |
Oxea Finance & Cy SCA (Oxea Finance LLC), Tranche B-2 Term Loan (First Lien),
4.25%, 1/15/20 | | | USD | | | | 2,564 | | | | 2,502,342 | |
| | | | | | | | | | | | |
| | | | | | | | | | | | 16,878,120 | |
Netherlands — 0.2% | | | | | | | | | | | | |
Amaya Holdings BV, Initial Term B Loan (First Lien), 5.00%, 8/01/21 | | | | | | | 4,619 | | | | 4,640,883 | |
Ceva Intercompany BV, Dutch BV Term Loan,
6.54%, 3/19/21 | | | | | | | 738 | | | | 642,358 | |
MediArena Acquisition BV (FKA AP NMT Acquisition BV), Euro Term B Loan (First Lien), 7.00%, 8/13/21 | | | EUR | | | | 992 | | | | 992,729 | |
| | | | | | | | | | | | |
| | | | | | | | | | | | 6,275,970 | |
South Korea — 0.0% | | | | | | | | | | | | |
CCC Information Services, Inc. (FKA CCC Holdings, Inc.), Term Loan, 4.00%, 12/20/19 | | | USD | | | | 451 | | | | 452,048 | |
Spain — 0.1% | | | | | | | | | | | | |
Car Rentals Subsidiary, S.L.U. (AKA Goldcar), Facility B, 6.00%, 6/18/20 | | | EUR | | | | 1,120 | | | | 1,215,430 | |
Sweden — 0.1% | | | | | | | | | | | | |
Unilabs Diagnostics AB, Facility B, 4.25%, 10/11/21 | | | | | | | 1,700 | | | | 1,864,155 | |
Verisure Holding AB (Public), Facility B1C,
3.75%, 10/23/23 | | | | | | | 2,500 | | | | 2,746,829 | |
| | | | | | | | | | | | |
| | | | | | | | | | | | 4,610,984 | |
United Kingdom — 0.3% | | | | | | | | | | | | |
Ceva Group PLC (FKA Louis No.1 PLC/TNT Logistics), Pre-Funded L/C Loan, 6.50%, 3/19/21 | | | USD | | | | 719 | | | | 626,357 | |
Intervias Finco Ltd. (FKA Optima Sub-Finco Ltd.): | | | | | | | | | | | | |
Term Facility B2 (EUR), 5.00%, 1/30/23 | | | EUR | | | | 3,888 | | | | 4,226,833 | |
| | | | | | | | | | | | |
| Floating Rate Loan Interests (b) | | | | | Par
(000) | | | Value | |
United Kingdom (continued) | | | | | | | | | | | | |
Term Facility C2 (EUR), 5.00%, 1/30/23 | | | EUR | | | | 3,042 | | | $ | 3,307,597 | |
LSF9 Robin Investments Ltd., Facility B1,
5.00%, 12/14/23 | | | GBP | | | | 1,300 | | | | 1,649,306 | |
R&R Ice Cream PLC, Facility B1, 3.00%, 9/29/23 | | | EUR | | | | 2,500 | | | | 2,735,602 | |
| | | | | | | | | | | | |
| | | | | | | | | | | | 12,545,695 | |
United States — 13.8% | | | | | | | | | | | | |
Accudyne Industries Borrower SCA/Accudyne Industries LLC (FKA Silver II U.S. Holdings LLC), Refinancing Term Loan, 4.00%, 12/13/19 | | | USD | | | | 894 | | | | 847,097 | |
Alere, Inc. (FKA IM U.S. Holdings LLC), B Term Loan, 4.25%, 6/20/22 | | | | | | | 15,204 | | | | 15,206,898 | |
Alliant Holdings Intermediate LLC, Initial Term Loan, 4.75%, 8/12/22 | | | | | | | 2,711 | | | | 2,722,381 | |
Allied Universal Holdco LLC (FKA USAGM Holdco LLC): | | | | | | | | | | | | |
Amendment Delayed Draw Term Loan,
4.50% - 5.50%, 7/28/22 | | | | | | | 1,472 | | | | 1,480,889 | |
Incremental Term Loan, 5.50%, 7/28/22 | | | | | | | 12,115 | | | | 12,190,365 | |
American Builders & Contractors Supply Co., Inc., Restatement Effective Date Term Loan,
3.53%, 10/31/23 | | | | | | | 1,687 | | | | 1,700,869 | |
AmWINS Group, Inc., Term Loan (First Lien),
2.75%, 1/25/24 | | | | | | | 1,010 | | | | 1,013,535 | |
Ascend Performance Materials Operations LLC, Term B Loan, 6.50%, 8/12/22 | | | | | | | 170 | | | | 170,740 | |
Ascent Resources — Marcellus LLC (FKA American Energy — Marcellus LLC), Initial Loan (Second Lien), 8.50%, 8/04/21 | | | | | | | 9,433 | | | | 966,831 | |
AssuredPartners, Inc., 2016 Refinancing Term Loan, 5.25%, 10/21/22 | | | | | | | 1,985 | | | | 2,007,853 | |
Atotech BV, Term Loan B-1, 3.00%, 1/31/24 | | | | | | | 515 | | | | 517,575 | |
Avolon TLB Borrower 1 (Luxembourg) S.à r.l., Term Loan B2, 2.75%, 1/20/22 | | | | | | | 3,715 | | | | 3,762,775 | |
Axalta Coating Systems Dutch Holding B BV (Axalta Coating Systems U.S. Holdings, Inc.): | | | | | | | | | | | | |
Term B-1 Dollar Loan, 3.50%, 2/01/23 | | | | | | | 816 | | | | 824,978 | |
Term B-1 Euro Loan, 3.00%, 2/01/23 | | | EUR | | | | 1,750 | | | | 1,913,656 | |
B/E Aerospace, Inc., Term Loan,
3.89% - 4.00%, 12/16/21 | | | USD | | | | 1,937 | | | | 1,944,126 | |
Bass Pro Group LLC: | | | | | | | | | | | | |
Initial Term Loan, 5.97%, 12/15/23 | | | | | | | 610 | | | | 590,651 | |
New Term Loan (2015), 4.02%, 6/05/20 | | | | | | | 1,219 | | | | 1,213,204 | |
Berry Plastics Corp., Term I Loan, 3.29%, 10/01/22 | | | | | | | 1,543 | | | | 1,551,740 | |
BJ’s Wholesale Club, Inc.: | | | | | | | | | | | | |
New 2013 (November) Replacement Loan (First Lien), 4.50%, 9/26/19 | | | | | | | 1,344 | | | | 1,344,356 | |
Term Loan B, 3.75%, 1/26/24 | | | | | | | 1,915 | | | | 1,909,619 | |
Boyd Gaming Corp., Term B Loan, 4.00%, 8/14/20 | | | | | | | 894 | | | | 896,660 | |
Bright Horizons Family Solutions LLC (FKA Bright Horizons Family Solutions, Inc.), Effective Date Incremental Term Loan, 3.52%, 11/07/23 | | | | | | | 2,546 | | | | 2,572,109 | |
Caesars Entertainment Resort Properties LLC, Term B Loan, 7.00%, 10/11/20 | | | | | | | 7,884 | | | | 7,951,296 | |
Calpine Corp., Term Loan, 3.75%, 1/15/24 | | | | | | | 2,015 | | | | 2,023,913 | |
Camelot U.S. Acquisition 1 Co. (AKA Thomson Reuters Intellectual Property & Science), Initial Term Loan, 4.75%, 10/03/23 | | | | | | | 1,147 | | | | 1,156,681 | |
Capsugel Holdings U.S., Inc., New Dollar Term Loan, 4.00%, 7/31/21 | | | | | | | 1,687 | | | | 1,690,849 | |
Catalent Pharma Solutions, Inc. (FKA Cardinal Health 409, Inc.), Dollar Term Loan, 3.75%, 5/20/21 | | | | | | | 2,974 | | | | 2,999,769 | |
See Notes to Financial Statements.
| | | | | | |
| 22 | | BLACKROCK FUNDS | | JANUARY 31, 2017 | | |
| | | | |
| Schedule of Investments (continued) | | | BlackRock Global Long/Short Credit Fund | |
| | | | |
| | | | | | | | | | | | |
| Floating Rate Loan Interests (b) | | | | | Par (000) | | | Value | |
United States (continued) | | | | | | | | | | | | |
Cavium, Inc., Initial Term B Loan, 3.77%, 8/16/22 | | | USD | | | | 3,758 | | | $ | 3,795,924 | |
CBS Radio, Inc., Term Loan, 4.50%, 10/17/23 | | | | | | | 1,010 | | | | 1,018,021 | |
Ceva Logistics U.S. Holdings, Inc. (FKA Louis U.S. Holdco, Inc.), U.S. Term Loan, 6.54%, 3/19/21 | | | | | | | 1,017 | | | | 886,011 | |
Charter Communications Operating LLC (AKA CCO Safari LLC), Term I-1 Loan, 3.03%, 1/15/24 | | | | | | | 4,923 | | | | 4,938,504 | |
Chesapeake Energy Corp., Class A Loan,
8.50%, 8/23/21 | | | | | | | 9,730 | | | | 10,638,091 | |
CHG Healthcare Services, Inc. (FKA CHG Buyer Corp.), Term Loan (First Lien), 4.75%, 6/07/23 | | | | | | | 1,916 | | | | 1,934,201 | |
Chobani LLC (Chobani Idaho LLC), Closing Date Term Loan (First Lien), 5.25%, 10/09/23 | | | | | | | 6,820 | | | | 6,905,250 | |
CHS/Community Health Systems, Inc., Incremental 2019 Term G Loan, 3.75%, 12/31/19 | | | | | | | 4,257 | | | | 4,038,105 | |
Continental Building Products, Inc., Term Loan,
3.75%, 8/18/23 | | | | | | | 1,630 | | | | 1,648,627 | |
Cortes NP Acquisition Corp. (Vertiv Co.), Initial Term Loan, 6.00% - 6.04%, 11/30/23 | | | | | | | 2,260 | | | | 2,271,300 | |
Cotiviti Corp. (Cotiviti Domestic Holdings, Inc.), Initial Term B Loan (First Lien), 3.75%, 9/28/23 | | | | | | | 2,675 | | | | 2,693,238 | |
CPG International, Inc., Term Loan, 4.75%, 9/30/20 | | | | | | | 2,665 | | | | 2,687,133 | |
CSC Holdings LLC (FKA CSC Holdings, Inc. (Cablevision)), 2016 Extended Term Loan,
3.77%, 10/11/24 | | | | | | | 1,875 | | | | 1,887,021 | |
Cypress Semiconductor Corp., 2016 Incremental Term Loan, 6.50%, 7/05/21 | | | | | | | 2,681 | | | | 2,731,523 | |
DaVita Inc. (FKA DaVita HealthCare Partners, Inc.), Tranche B Term Loan, 3.53%, 6/24/21 | | | | | | | 1,370 | | | | 1,385,820 | |
Dell International LLC (EMC Corp.), Term B Loan, 4.03%, 9/07/23 | | | | | | | 24,189 | | | | 24,292,180 | |
DPX Holdings BV (FKA JLL/Delta Dutch Newco BV), 2015 Incremental Dollar Term Loan,
4.25%, 3/11/21 | | | | | | | 3,225 | | | | 3,244,542 | |
DTZ U.S. Borrower LLC (DTZ AUS Holdco PTY Ltd.) (AKA Cushman & Wakefield), 2015-1 Additional Term Loan (First Lien), 4.25% - 4.29%, 11/04/21 | | | | | | | 2,356 | | | | 2,369,058 | |
Dynegy Finance IV, Inc., Term Loan, 5.00%, 6/27/23 | | | | | | | 3,602 | | | | 3,625,763 | |
Energy Future Intermediate Holding Co. LLC (EFIH Finance, Inc.), 2016 Additional Term Loan (DIP),
4.25%, 6/30/17 | | | | | | | 6,165 | | | | 6,198,414 | |
Energy Transfer Equity LP, Term Loan B (First Lien),
3.79%, 1/31/24 | | | | | | | 6,607 | | | | 6,529,606 | |
Envision Healthcare Corp. (FKA Emergency Medical Services Corp.), Initial Term Loan,
4.00%, 12/01/23 | | | | | | | 4,020 | | | | 4,058,954 | |
Equinix, Inc., Term B-2 Loan, 3.25%, 12/22/23 | | | EUR | | | | 1,400 | | | | 1,534,688 | |
ESH Hospitality, Inc., Initial Term Loan,
3.78%, 8/30/23 | | | USD | | | | 1,385 | | | | 1,389,944 | |
Filtration Group Corp.: | | | | | | | | | | | | |
Series B Incremental Term Loan,
3.25%, 11/21/20 | | | | | | | 1,400 | | | | 1,403,956 | |
Term Loan (First Lien), 4.25%, 11/23/20 | | | | | | | 613 | | | | 618,633 | |
First Data Corp.: | | | | | | | | | | | | |
2021C New Dollar Term Loan, 3.78%, 3/24/21 | | | | | | | 8,475 | | | | 8,523,938 | |
Term Loan A, 2.00%, 6/02/20 | | | | | | | 13,720 | | | | 13,708,612 | |
Flex Acquisition Co., Inc. (AKA Novolex), Initial Term Loan, 4.25%, 12/29/23 | | | | | | | 855 | | | | 861,951 | |
Gates Global LLC, Initial Dollar Term Loan,
4.25%, 7/06/21 | | | | | | | 6,646 | | | | 6,621,491 | |
| | | | | | | | | | | | |
| Floating Rate Loan Interests (b) | | | | | Par
(000) | | | Value | |
United States (continued) | | | | | | | | | | | | |
Gol Luxco SA, Term Loan, 6.50%, 8/31/20 | | | USD | | | | 19,925 | | | $ | 20,373,313 | |
Grifols Worldwide Operations USA, Inc., Term Loan B, 2.25%, 1/24/25 | | | | | | | 4,100 | | | | 4,121,033 | |
Harbor Freight Tools USA, Inc., Initial Loan (2016), 3.78%, 8/18/23 | | | | | | | 1,550 | | | | 1,556,000 | |
HD Supply, Inc., Term B-1 Loan, 3.75%, 8/13/21 | | | | | | | 1,739 | | | | 1,749,258 | |
Hostess Brands LLC, 2016 Refinancing Term B Loan (First Lien), 4.00%, 8/03/22 | | | | | | | 1,791 | | | | 1,807,073 | |
Informatica Corp., Dollar Term Loan, 4.50%, 8/05/22 | | | | | | | 12,904 | | | | 12,849,161 | |
Inventiv Group Holdings, Inc., Initial Term Loan,
4.75%, 11/09/23 | | | | | | | 17,206 | | | | 17,349,782 | |
Jaguar Holding Co. I (AKA Pharmaceutical Product Development, Inc.), Initial Term Loan,
4.25%, 8/18/22 | | | | | | | 12,064 | | | | 12,121,768 | |
JBS USA Lux SA, Term Loan B (First Lien),
3.50%, 10/30/22 | | | | | | | 1,445 | | | | 1,448,006 | |
KAR Auction Services, Inc., Tranche B-3 Term Loan, 4.50%, 3/09/23 | | | | | | | 953 | | | | 963,814 | |
KFC Holding Co. (AKA Yum! Brands), Term B Loan, 3.52%, 6/16/23 | | | | | | | 9,925 | | | | 10,070,925 | |
Kronos, Inc., Initial Term Loan (First Lien),
5.00%, 11/01/23 | | | | | | | 2,185 | | | | 2,208,227 | |
Las Vegas Sands LLC, Refinancing Term Loan,
3.02%, 12/19/20 | | | | | | | 5,238 | | | | 5,258,952 | |
Level 3 Financing, Inc., Tranche B 2020 Term Loan, 4.00%, 1/15/20 | | | | | | | 405 | | | | 409,961 | |
LTS Buyer LLC (Sidera Networks, Inc.), Term B Loan (First Lien), 4.25%, 4/13/20 | | | | | | | 2,294 | | | | 2,305,527 | |
MacDermid European Holdings BV (MacDermid Funding LLC), Euro Tranche C-4 Term Loan,
4.25%, 6/07/20 | | | EUR | | | | 4,589 | | | | 5,023,203 | |
MacDermid, Inc. (Platform Specialty Products Corp.): | | | | | | | | | | | | |
Tranche B-4 Term Loan, 5.00%, 6/07/23 | | | USD | | | | 1,042 | | | | 1,055,153 | |
Tranche B-5 Term Loan, 4.50%, 6/07/20 | | | | | | | 1,019 | | | | 1,031,460 | |
MGM Growth Properties Operating Partnership LP,
Term B Loan, 3.52%, 4/25/23 | | | | | | | 3,173 | | | | 3,198,036 | |
Michaels Stores, Inc., 2016 New Replacement
Term B-1 Loan, 3.75%, 1/30/23 | | | | | | | 3,615 | | | | 3,593,329 | |
Micron Technology, Inc., Term Loan, 4.53%, 4/26/22 | | | | | | | 11,745 | | | | 11,900,647 | |
Microsemi Corp., Closing Date Term B Loan,
2.25%, 1/15/23 | | | | | | | 6,400 | | | | 6,433,984 | |
Mission Broadcasting, Inc., Term B Loan,
3.00%, 1/17/24 | | | | | | | 259 | | | | 262,552 | |
MPH Acquisition Holdings LLC, Initial Term Loan,
5.00%, 6/07/23 | | | | | | | 1,629 | | | | 1,651,294 | |
National Vision, Inc., Initial Term Loan (First Lien), 4.00%, 3/12/21 | | | | | | | 1,985 | | | | 1,978,899 | |
NBTY, Inc. (NKA The Nature’s Bounty Co.), Dollar
Term B Loan, 5.00%, 5/05/23 | | | | | | | 821 | | | | 825,751 | |
Nexstar Broadcasting, Inc., Term B Loan,
3.00%, 1/17/24 | | | | | | | 2,816 | | | | 2,849,594 | |
Northwest Airlines, Inc.: | | | | | | | | | | | | |
Loan B757-200, 2.46%, 9/10/18 | | | | | | | 185 | | | | 181,195 | |
Loan B757-200, 2.46%, 9/10/18 | | | | | | | 183 | | | | 179,887 | |
Loan B757-300, 2.46%, 3/10/17 | | | | | | | 182 | | | | 178,578 | |
Loan B757-300, 3.08%, 3/10/17 | | | | | | | 75 | | | | 74,826 | |
Loan B757-300, 3.08%, 3/10/17 | | | | | | | 75 | | | | 74,604 | |
NXP BV (NXP Funding LLC), Tranche F Loan,
3.24%, 12/07/20 | | | | | | | 13,257 | | | | 13,312,457 | |
ON Semiconductor Corp., 2016 New Replacement Term Loan, 4.03%, 3/31/23 | | | | | | | 10,744 | | | | 10,856,026 | |
Optiv Security, Inc., Term Loan, 3.25%, 1/13/24 | | | | | | | 2,801 | | | | 2,816,181 | |
See Notes to Financial Statements.
| | | | | | |
| | | BLACKROCK FUNDS | | JANUARY 31, 2017 | | 23 |
| | | | |
| Schedule of Investments (continued) | | | BlackRock Global Long/Short Credit Fund | |
| | | | |
| | | | | | | | | | | | |
| Floating Rate Loan Interests (b) | | | | | Par (000) | | | Value | |
United States (continued) | | | | | | | | | | | | |
Ortho-Clinical Diagnostics Holdings Luxembourg S.à r.l., Initial Term Loan, 4.75%, 6/30/21 | | | USD | | | | 3,656 | | | $ | 3,627,293 | |
PetCo Animal Supplies, Inc., Tranche B-1 Term Loan,
5.00%, 1/26/23 | | | | | | | 2,459 | | | | 2,424,268 | |
Pinnacle Foods Finance LLC: | | | | | | | | | | | | |
Tranche B Term Loan, 2.25%, 1/31/24 | | | | | | | 1,885 | | | | 1,888,544 | |
Tranche H Term Loan, 3.28%, 4/29/20 | | | | | | | 1,325 | | | | 1,325,475 | |
PQ Corp., First Amendment Tranche B-1 Term Loan,
5.29%, 11/04/22 | | | | | | | 647 | | | | 654,974 | |
Prestige Brands, Inc., Term B-4 Loan, 2.75%, 1/26/24 | | | | | | | 1,518 | | | | 1,531,558 | |
Prime Security Services Borrower LLC (AKA Protection 1 Security Solutions), 2016-2 Refinancing Term B-1 Loan (First Lien), 4.25%, 5/02/22 | | | | | | | 9,308 | | | | 9,394,978 | |
Quikrete Holdings, Inc., Initial Loan (First Lien),
4.02%, 11/15/23 | | | | | | | 995 | | | | 1,006,751 | |
Quintiles IMS, Inc., Term B Dollar Loan,
3.50% - 3.54%, 3/17/21 | | | | | | | 8,217 | | | | 8,264,426 | |
Rackspace Hosting, Inc., Term B Loan (First Lien),
4.50%, 11/03/23 | | | | | | | 1,490 | | | | 1,501,711 | |
Radiate Holdco LLC (AKA RCN Grande), Term Loan,
3.00%, 12/09/23 | | | | | | | 745 | | | | 750,468 | |
RBS Global, Inc. (Rexnord LLC), Term B Loan Refinancing (First Lien), 3.75% - 3.79%, 8/21/23 | | | | | | | 1,979 | | | | 1,990,270 | |
Revlon Consumer Products Corp., Initial Term B Loan,
4.28% - 4.44%, 9/07/23 | | | | | | | 1,411 | | | | 1,422,585 | |
Rite Aid Corp., Tranche 1 Term Loan (Second Lien),
5.75%, 8/21/20 | | | | | | | 360 | | | | 360,900 | |
RP Crown Parent LLC, Initial Term Loan,
4.50%, 10/12/23 | | | | | | | 5,290 | | | | 5,327,030 | |
Sabre GLBL, Inc. (FKA Sabre, Inc.), Term B Loan,
4.00%, 2/19/19 | | | | | | | 8,400 | | | | 8,439,900 | |
Serta Simmons Bedding LLC, Initial Term Loan (First Lien), 4.50%, 11/08/23 | | | | | | | 2,570 | | | | 2,564,500 | |
ServiceMaster Co. LLC, Tranche C Term Loan,
3.28%, 11/08/23 | | | | | | | 3,740 | | | | 3,757,129 | |
Signode Industrial Group Lux SA (Signode Industrial Group U.S., Inc.), Initial Term B Loan,
3.75% - 4.00%, 5/01/21 | | | | | | | 672 | | | | 677,493 | |
SolarWinds Holdings, Inc., 2016 Refinancing Term Loan, 5.50%, 2/03/23 | | | | | | | 14,701 | | | | 14,711,563 | |
Solera LLC (Solera Finance, Inc.), Dollar Term Loan,
4.75%, 3/03/23 | | | | | | | 545 | | | | 550,526 | |
Spectrum Brands Canada, Inc., 2016 Replacement USD Term Loan, 3.31% - 3.51%, 6/23/22 | | | | | | | 2,498 | | | | 2,525,576 | |
Spin Holdco, Inc., Initial Term Loan (First Lien),
4.25% - 4.29%, 11/14/19 | | | | | | | 2,944 | | | | 2,931,049 | |
Sprint Communications Inc.: Tl-B, , 1/30/24 | | | | | | | 12,481 | | | | 12,496,601 | |
Station Casinos LLC, Term B Facility Loan,
3.77%, 6/08/23 | | | | | | | 1,283 | | | | 1,286,646 | |
Surgery Center Holdings, Inc., Initial Term Loan (First Lien), 4.75%, 11/03/20 | | | | | | | 2,175 | | | | 2,199,132 | |
Surgical Care Affiliates, Inc., Incremental Term Loan,
3.75%, 3/17/22 | | | | | | | 786 | | | | 787,995 | |
Team Health, Inc.: | | | | | | | | | | | | |
New Tranche B Term Loan, 3.78%, 11/23/22 | | | | | | | 1,985 | | | | 1,977,556 | |
Term Loan, 2.75%, 1/12/24 | | | | | | | 4,685 | | | | 4,676,239 | |
Telenet Financing USD LLC, Term Loan AF Facility, 3.77%, 1/31/25 | | | | | | | 2,130 | | | | 2,148,254 | |
TKC Holdings, Inc., Term Loan B, 4.79%, 1/31/23 | | | | | | | 1,035 | | | | 1,037,588 | |
TransDigm, Inc., Tranche F Term Loan,
3.78%, 6/09/23 | | | | | | | 10,999 | | | | 10,967,000 | |
U.S. Foods, Inc. (AKA U.S. Foodservice, Inc.), Initial Term Loan, 3.78%, 6/27/23 | | | | | | | 3,940 | | | | 3,965,846 | |
| | | | | | | | | | | | |
| Floating Rate Loan Interests (b) | | | | | Par
(000) | | | Value | |
United States (continued) | | | | | | | | | | | | |
Univision Communications, Inc., Replacement First-Lien Term Loan (C-4), 4.00%, 3/01/20 | | | USD | | | | 6,425 | | | $ | 6,439,138 | |
UPC Financing Partnership, Facility AO,
3.00%, 1/15/26 | | | EUR | | | | 2,500 | | | | 2,720,192 | |
Veritas U.S., Inc., Initial Euro Term B-1 Loan,
6.63%, 1/27/23 | | | | | | | 6,389 | | | | 6,433,629 | |
VF Holding Corp., Term B-1 Loan (First Lien),
4.25%, 6/30/23 | | | USD | | | | 938 | | | | 943,510 | |
Virgin Media Bristol LLC, I Facility, 3.52%, 1/31/25 | | | | | | | 290 | | | | 291,633 | |
Vistra Operations Co. LLC (FKA Tex Operations Co. LLC): | | | | | | | | | | | | |
Initial Term C Loan, 5.00%, 8/04/23 | | | | | | | 2,646 | | | | 2,657,568 | |
Initial Term Loan, 5.00%, 8/04/23 | | | | | | | 11,597 | | | | 11,647,527 | |
WESCO Distribution, Inc., Tranche B-1 Loan,
3.78%, 12/12/19 | | | | | | | 106 | | | | 105,786 | |
Western Digital Corp., U.S. Term B-1 Loan,
4.53%, 4/29/23 | | | | | | | 16,696 | | | | 16,821,321 | |
WEX, Inc., Term B Loan, 4.28%, 6/30/23 | | | | | | | 2,144 | | | | 2,168,348 | |
Wilsonart LLC, Tranche C Term Loan,
4.50%, 12/19/23 | | | | | | | 5,397 | | | | 5,427,534 | |
XPO Logistics, Inc., Refinanced Term Loan,
4.25%, 11/01/21 | | | | | | | 381 | | | | 383,378 | |
Zayo Group LLC (Zayo Capital, Inc.): | | | | | | | | | | | | |
2017 Incremental Acquisition Term Loan,
2.50%, 1/19/24 | | | | | | | 2,260 | | | | 2,277,899 | |
2017 Incremental Refinancing B-2 Term Loan, 2.50%, 1/19/24 | | | | | | | 4,700 | | | | 4,737,224 | |
Ziggo Secured Finance Partnership, Term Loan E, 2.50%, 4/15/25 | | | | | | | 2,115 | | | | 2,119,188 | |
| | | | | | | | | | | | |
| | | | | | | | | | | | 554,028,069 | |
Total Floating Rate Loan Interests — 15.9% | | | | | | | | | | | 638,685,681 | |
| | | | | | | | | | | | |
| Foreign Agency Obligations | | | | | | | | | |
Brazil — 0.3% | | | | | | | | | | | | |
Petrobras Global Finance BV: | | | | | | | | | | | | |
4.75%, 1/14/25 | | | EUR | | | | 3,700 | | | | 3,962,940 | |
8.75%, 5/23/26 | | | USD | | | | 2,800 | | | | 3,153,920 | |
6.63%, 1/16/34 | | | GBP | | | | 3,260 | | | | 3,688,773 | |
| | | | | | | | | | | | |
| | | | | | | | | | | | 10,805,633 | |
China — 0.7% | | | | | | | | | | | | |
Avi Funding Co. Ltd., 2.85%, 9/16/20 | | | USD | | | | 1,100 | | | | 1,101,305 | |
Bluestar Finance Holdings Ltd.: | | | | | | | | | | | | |
3.13%, 9/30/19 | | | | | | | 1,700 | | | | 1,700,515 | |
3.50%, 9/30/21 | | | | | | | 1,700 | | | | 1,683,292 | |
CCCI Treasure Ltd., 3.50% (b)(f) | | | | | | | 2,700 | | | | 2,714,828 | |
CDBI Treasure I Ltd., 2.25%, 8/02/21 | | | | | | | 800 | | | | 771,996 | |
Chang Development International Ltd.,
3.63%, 1/20/20 | | | | | | | 3,000 | | | | 2,960,319 | |
China Cinda Finance 2015 I Ltd., 4.25%, 4/23/25 | | | | | | | 1,170 | | | | 1,155,829 | |
China Overseas Finance Cayman III Ltd.,
6.38%, 10/29/43 | | | | | | | 680 | | | | 785,738 | |
CITIC Ltd.: | | | | | | | | | | | | |
2.80%, 12/14/21 | | | | | | | 2,550 | | | | 2,500,739 | |
6.80%, 1/17/23 | | | | | | | 2,000 | | | | 2,333,984 | |
COSCO Finance 2011 Ltd., 4.00%, 12/03/22 | | | | | | | 1,950 | | | | 2,016,686 | |
Huarong Finance II Co. Ltd., 4.88%, 11/22/26 | | | | | | | 215 | | | | 215,183 | |
Industrial & Commercial Bank of China Ltd.,
2.50%, 6/16/21 | | | | | | | 2,000 | | | | 1,960,458 | |
Jinan West City Investment & Development Group Co. Ltd., 3.13%, 10/11/21 | | | | | | | 1,200 | | | | 1,150,836 | |
See Notes to Financial Statements.
| | | | | | |
| 24 | | BLACKROCK FUNDS | | JANUARY 31, 2017 | | |
| | | | |
| Schedule of Investments (continued) | | | BlackRock Global Long/Short Credit Fund | |
| | | | |
| | | | | | | | | | | | |
| Foreign Agency Obligations | | | | | Par
(000) | | | Value | |
China (continued) | | | | | | | | | | | | |
Minmetals Bounteous Finance BVI Ltd., 4.75%, 7/30/25 | | | USD | | | | 1,900 | | | $ | 1,948,556 | |
Tewoo Group Finance No. 2 Ltd., 4.50%, 12/16/19 | | | | | | | 1,000 | | | | 990,192 | |
| | | | | | | | | | | | |
| | | | | | | | | | | | 25,990,456 | |
France — 0.3% | | | | | | | | | | | | |
NEW Areva Holding SA, 4.88%, 9/23/24 | | | EUR | | | | 11,050 | | | | 12,279,713 | |
Hong Kong — 0.0% | | | | | | | | | | | | |
China Great Wall International Holdings III Ltd., 2.63%, 10/27/21 | | | USD | | | | 1,150 | | | | 1,107,186 | |
India — 0.2% | | | | | | | | | | | | |
BPRL International Singapore Pte. Ltd., 4.38%, 1/18/27 | | | | | | | 2,725 | | | | 2,724,253 | |
Greenko Investment Co., 4.88%, 8/16/23 | | | | | | | 1,414 | | | | 1,354,486 | |
NTPC Ltd., 5.63%, 7/14/21 | | | | | | | 1,100 | | | | 1,206,752 | |
ONGC Videsh Vankorneft Pte. Ltd., 3.75%, 7/27/26 | | | | | | | 886 | | | | 847,618 | |
State Bank of India, 3.25%, 1/24/22 | | | | | | | 2,725 | | | | 2,715,596 | |
| | | | | | | | | | | | |
| | | | | | | | | | | | 8,848,705 | |
Indonesia — 0.1% | | | | | | | | | | | | |
Pertamina Persero PT: | | | | | | | | | | | | |
5.63%, 5/20/43 | | | | | | | 3,250 | | | | 3,079,934 | |
6.45%, 5/30/44 | | | | | | | 2,460 | | | | 2,571,598 | |
| | | | | | | | | | | | |
| | | | | | | | | | | | 5,651,532 | |
Mongolia — 0.1% | | | | | | | | | | | | |
Development Bank of Mongolia LLC, 5.75%, 3/21/17 | | | | | | | 800 | | | | 785,200 | |
Trade & Development Bank of Mongolia LLC, 9.38%, 5/19/20 | | | | | | | 1,671 | | | | 1,654,181 | |
| | | | | | | | | | | | |
| | | | | | | | | | | | 2,439,381 | |
United Arab Emirates — 0.0% | | | | | | | | | | | | |
Abu Dhabi National Energy Co. PJSC, 3.63%, 1/12/23 | | | | | | | 1,300 | | | | 1,308,125 | |
DP World Crescent Ltd., 3.91%, 5/31/23 | | | | | | | 200 | | | | 200,760 | |
| | | | | | | | | | | | |
| | | | | | | | | | | | 1,508,885 | |
Venezuela — 0.0% | | | | | | | | | | | | |
Petroleos de Venezuela SA, 6.00%, 11/15/26 | | | | | | | 4,200 | | | | 1,594,530 | |
Total Foreign Agency Obligations — 1.7% | | | | | | | | | | | 70,226,021 | |
| | | | | | | | | | | | |
| Foreign Government Obligations | | | | | | | | | |
Argentina — 0.1% | | | | | | | | | | | | |
Republic of Argentina, 6.88%, 4/22/21 | | | | | | | 4,705 | | | | 5,003,767 | |
Belarus — 0.0% | | | | | | | | | | | | |
Republic of Belarus, 8.95%, 1/26/18 | | | | | | | 1,400 | | | | 1,438,080 | |
Brazil — 0.4% | | | | | | | | | | | | |
Federal Republic of Brazil, 2.88%, 4/01/21 | | | EUR | | | | 15,300 | | | | 17,012,920 | |
Croatia — 0.2% | | | | | | | | | | | | |
Republic of Croatia, 3.88%, 5/30/22 | | | | | | | 6,000 | | | | 6,979,004 | |
Greece — 0.2% | | | | | | | | | | | | |
Hellenic Republic: | | | | | | | | | | | | |
4.75%, 4/17/19 | | | | | | | 2,380 | | | | 2,363,942 | |
3.00%, 2/24/24 (m) | | | | | | | 8,450 | | | | 7,011,689 | |
| | | | | | | | | | | | |
| | | | | | | | | | | | 9,375,631 | |
| | | | | | | | | | | | |
| Foreign Government Obligations | | | | | Par (000) | | | Value | |
Hungary — 0.1% | | | | | | | | | | | | |
Republic of Hungary, 5.38%, 3/25/24 | | | USD | | | | 4,500 | | | $ | 4,938,750 | |
Indonesia — 0.3% | | | | | | | | | | | | |
Republic of Indonesia: | | | | | | | | | | | | |
2.88%, 7/08/21 | | | EUR | | | | 6,200 | | | | 7,022,562 | |
3.70%, 1/08/22 | | | USD | | | | 1,150 | | | | 1,165,733 | |
5.88%, 1/15/24 | | | | | | | 950 | | | | 1,060,031 | |
3.38%, 7/30/25 | | | EUR | | | | 1,300 | | | | 1,471,214 | |
5.25%, 1/08/47 | | | USD | | | | 1,950 | | | | 1,996,806 | |
| | | | | | | | | | | | |
| | | | | | | | | | | | 12,716,346 | |
Ivory Coast — 0.0% | | | | | | | | | | | | |
Republic of Ivory Coast, 5.75%, 12/31/32 (m) | | | | | | | 1,470 | | | | 1,361,191 | |
Mongolia — 0.1% | | | | | | | | | | | | |
Government of Mongolia: | | | | | | | | | | | | |
7.50%, 6/30/18 | | | CNH | | | | 4,000 | | | | 542,247 | |
10.88%, 4/06/21 | | | USD | | | | 425 | | | | 448,231 | |
5.13%, 12/05/22 | | | | | | | 1,996 | | | | 1,730,285 | |
| | | | | | | | | | | | |
| | | | | | | | | | | | 2,720,763 | |
Philippines — 0.1% | | | | | | | | | | | | |
Republic of Philippines, 3.70%, 2/02/42 | | | | | | | 1,750 | | | | 1,694,620 | |
Portugal — 0.3% | | | | | | | | | | | | |
Republic of Portugal, 5.13%, 10/15/24 | | | | | | | 12,875 | | | | 12,441,988 | |
Russia — 0.4% | | | | | | | | | | | | |
Russian Federation: | | | | | | | | | | | | |
3.25%, 4/04/17 | | | | | | | 5,800 | | | | 5,811,600 | |
5.00%, 4/29/20 | | | | | | | 8,500 | | | | 9,073,750 | |
| | | | | | | | | | | | |
| | | | | | | | | | | | 14,885,350 | |
Serbia — 0.4% | | | | | | | | | | | | |
Republic of Serbia: | | | | | | | | | | | | |
5.88%, 12/03/18 | | | | | | | 7,400 | | | | 7,760,750 | |
4.88%, 2/25/20 | | | | | | | 5,700 | | | | 5,849,625 | |
| | | | | | | | | | | | |
| | | | | | | | | | | | 13,610,375 | |
South Korea — 0.1% | | | | | | | | | | | | |
Republic of Korea, 2.75%, 1/19/27 | | | | | | | 3,000 | | | | 2,936,400 | |
Sri Lanka — 0.2% | | | | | | | | | | | | |
Republic of Sri Lanka: | | | | | | | | | | | | |
6.00%, 1/14/19 | | | | | | | 429 | | | | 442,205 | |
6.25%, 10/04/20 | | | | | | | 1,597 | | | | 1,642,495 | |
6.25%, 7/27/21 | | | | | | | 211 | | | | 215,654 | |
5.75%, 1/18/22 | | | | | | | 1,200 | | | | 1,200,739 | |
6.13%, 6/03/25 | | | | | | | 1,800 | | | | 1,726,157 | |
6.85%, 11/03/25 | | | | | | | 1,300 | | | | 1,298,571 | |
6.83%, 7/18/26 | | | | | | | 1,450 | | | | 1,446,549 | |
| | | | | | | | | | | | |
| | | | | | | | | | | | 7,972,370 | |
Venezuela — 0.0% | | | | | | | | | | | | |
Bolivarian Republic of Venezuela, 11.75%, 10/21/26 | | | | | | | 1,500 | | | | 881,250 | |
Total Foreign Government Obligations — 2.9% | | | | | | | | | | | 115,968,805 | |
| | | | | | | | | | | | |
| Investment Companies — 0.4% | | | | | Shares | | | | |
iShares iBoxx $ High Yield Corporate Bond ETF (n) | | | | | | | 193,748 | | | | 16,921,950 | |
| | | | | | | | | | | | |
| | | | | | | | | | | | | |
See Notes to Financial Statements.
| | | | | | |
| | | BLACKROCK FUNDS | | JANUARY 31, 2017 | | 25 |
| | | | |
| Schedule of Investments (continued) | | | BlackRock Global Long/Short Credit Fund | |
| | | | |
| | | | | | | | | | | | |
| Non-Agency Mortgage-Backed Securities | | | | | Par (000) | | | Value | |
Collateralized Mortgage Obligations — 0.1% | | | | | | | | | | | | |
United Kingdom — 0.1% | | | | | | | | | | | | |
Paragon Mortgages No. 13 PLC, Series 2006-13X, Class A2C, 1.20%, 1/15/39 (b) | | | USD | | | | 5,364 | | | $ | 4,950,892 | |
Commercial Mortgage-Backed Securities — 1.5% | | | | | | | | | |
United States — 1.5% | | | | | | | | | | | | |
Banc of America Commercial Mortgage Trust, Series 2007-3, Class AJ, 5.60%, 6/10/49 (b) | | | | | | | 4,000 | | | | 4,034,784 | |
CDGJ Commercial Mortgage Trust, Series 2014-BXCH, Class EPA, 4.79%, 12/15/27 (a)(b) | | | | | | | 4,323 | | | | 4,349,735 | |
Commercial Mortgage Trust: | | | | | | | | | | | | |
Series 2014-PAT, Class E,
3.92%, 8/13/27 (a)(b) | | | | | | | 1,000 | | | | 997,516 | |
Series 2014-PAT, Class F,
3.21%, 8/13/27 (a)(b) | | | | | | | 2,000 | | | | 1,935,029 | |
Series 2014-PAT, Class G,
2.36%, 8/13/27 (a)(b) | | | | | | | 2,000 | | | | 1,802,770 | |
Core Industrial Trust: | | | | | | | | | | | | |
Series 2015-CALW, Class F,
3.85%, 2/10/34 (a)(b) | | | | | | | 4,620 | | | | 4,565,332 | |
Series 2015-CALW, Class G,
3.85%, 2/10/34 (a)(b) | | | | | | | 5,640 | | | | 5,320,438 | |
Credit Suisse First Boston Mortgage Securities Corp., Series 2005-C2, Class AMFX,
4.88%, 4/15/37 | | | | | | | 213 | | | | 207,384 | |
GAHR Commercial Mortgage Trust: | | | | | | | | | | | | |
Series 2015-NRF, Class EFX,
3.38%, 12/15/34 (a)(b) | | | | | | | 8,740 | | | | 8,617,467 | |
Series 2015-NRF, Class FFX,
3.38%, 12/15/34 (a)(b) | | | | | | | 4,620 | | | | 4,470,365 | |
Series 2015-NRF, Class GFX,
3.38%, 12/15/34 (a)(b) | | | | | | | 14,125 | | | | 13,550,676 | |
GRACE Mortgage Trust, Series 2014-GRCE, Class F, 3.59%, 6/10/28 (a)(b) | | | | | | | 2,545 | | | | 2,509,356 | |
LB-UBS Commercial Mortgage Trust: | | | | | | | | | | | | |
Series 2006-C4, Class B, 5.87%, 6/15/38 (b) | | | | | | | 2,297 | | | | 2,300,720 | |
Series 2007-C1, Class AJ, 5.48%, 2/15/40 | | | | | | | 14 | | | | 13,750 | |
Lone Star Portfolio Trust, Series 2015-LSP, Class E, 6.37%, 9/15/28 (a)(b) | | | | | | | 5,533 | | | | 5,602,656 | |
Wells Fargo Commercial Mortgage Trust,
Series 2015-C31, Class D, 3.85%, 11/15/48 | | | | | | | 2,585 | | | | 1,917,396 | |
| | | | | | | | | | | | |
| | | | | | | | | | | | 62,195,374 | |
Interest Only Commercial Mortgage-Backed Securities — 0.1% | | | | | |
United States — 0.1% | | | | | | | | | | | | |
CFCRE Commercial Mortgage Trust,
Series 2016-C4, Class XA, 1.77%, 5/10/58 (b) | | | | | | | 21,324 | | | | 2,469,996 | |
Total Non-Agency Mortgage-Backed Securities — 1.7% | | | | 69,616,262 | |
| | | | | | | | | | | | |
| Preferred Securities | | | | | | | | | |
Capital Trusts | | | | | | | | | | | | |
Australia — 0.0% | | | | | | | | | | | | |
AusNet Services Holdings Pty. Ltd,
5.75%, 3/17/76 (b) | | | | | | | 693 | | | | 741,484 | |
Canada — 0.3% | | | | | | | | | | | | |
Enbridge, Inc., 6.00%, 1/15/77 (b) | | | | | | | 10,000 | | | | 10,125,000 | |
| | | | | | | | | | | | |
| Preferred Securities | | | | | Par (000) | | | Value | |
China — 0.2% | | | | | | | | | | | | |
Chalieco Hong Kong Corp. Ltd., 5.70% (b)(f) | | | USD | | | | 841 | | | $ | 861,655 | |
China Life Insurance Co. Ltd., 4.00%, 7/03/75 (b) | | | | | | | 2,800 | | | | 2,761,772 | |
CITIC Ltd., 8.63% (b)(f) | | | | | | | 2,000 | | | | 2,184,536 | |
Huarong Finance Co. Ltd., 4.50% (b)(f) | | | | | | | 1,375 | | | | 1,366,650 | |
Huarong Finance II Co. Ltd., 2.88% (b)(f) | | | | | | | 1,500 | | | | 1,411,031 | |
| | | | | | | | | | | | |
| | | | | | | | | | | | 8,585,644 | |
Germany — 0.2% | | | | | | | | | | | | |
HSH Nordbank AG, 7.25% (b)(f) | | | | | | | 23,784 | | | | 6,679,023 | |
Hong Kong — 0.1% | | | | | | | | | | | | |
Bank of East Asia Ltd., 5.50% (b)(f) | | | | | | | 1,062 | | | | 1,027,683 | |
FWD Ltd., 6.25% (b)(f) | | | | | | | 475 | | | | 488,557 | |
Industrial & Commercial Bank of China Asia Ltd., 4.25% (b)(f) | | | | | | | 1,400 | | | | 1,352,910 | |
Li & Fung Ltd., 5.25% (f) | | | | | | | 423 | | | | 376,693 | |
Noble Group Ltd., 6.00% (b)(f) | | | | | | | 1,400 | | | | 882,000 | |
| | | | | | | | | | | | |
| | | | | | | | | | | | 4,127,843 | |
Ireland — 0.4% | | | | | | | | | | | | |
Allied Irish Banks PLC, 7.38% (b)(f) | | | EUR | | | | 7,200 | | | | 7,916,619 | |
Bank of Ireland, 7.38% (b)(f) | | | | | | | 7,900 | | | | 8,766,881 | |
| | | | | | | | | | | | |
| | | | | | | | | | | | 16,683,500 | |
Italy — 0.3% | | | | | | | | | | | | |
Intesa Sanpaolo SpA, 7.00% (b)(f) | | | | | | | 9,544 | | | | 10,083,867 | |
UniCredit SpA, 9.25% (b)(f) | | | | | | | 1,334 | | | | 1,548,077 | |
| | | | | | | | | | | | |
| | | | | | | | | | | | 11,631,944 | |
Netherlands — 0.1% | | | | | | | | | | | | |
Cooperatieve Rabobank UA, 6.63% (b)(f) | | | | | | | 4,400 | | | | 5,089,565 | |
Philippines — 0.0% | | | | | | | | | | | | |
Royal Capital BV, 4.88% (b)(f) | | | USD | | | | 354 | | | | 340,545 | |
South Korea — 0.1% | | | | | | | | | | | | |
Shinsegae Co. Ltd., 2.63%, 5/08/45 (b) | | | | | | | 900 | | | | 881,156 | |
Woori Bank, 4.50% (b)(f) | | | | | | | 1,870 | | | | 1,809,156 | |
| | | | | | | | | | | | |
| | | | | | | | | | | | 2,690,312 | |
Spain — 1.1% | | | | | | | | | | | | |
Banco Bilbao Vizcaya Argentaria SA: | | | | | | | | | | | | |
8.88% (b)(f) | | | EUR | | | | 4,000 | | | | 4,663,464 | |
9.00% (b)(f) | | | USD | | | | 2,200 | | | | 2,295,550 | |
Banco Popular Espanol SA: | | | | | | | | | | | | |
8.25% (b)(f) | | | EUR | | | | 4,800 | | | | 4,710,617 | |
11.50% (b)(f) | | | | | | | 7,400 | | | | 8,327,846 | |
Banco Santander SA, 6.25% (b)(f) | | | | | | | 20,400 | | | | 20,948,742 | |
Telefonica Europe BV: | | | | | | | | | | | | |
3.75% (b)(f) | | | | | | | 2,000 | | | | 2,121,228 | |
5.88% (b)(f) | | | | | | | 1,500 | | | | 1,712,793 | |
| | | | | | | | | | | | |
| | | | | | | | | | | | 44,780,240 | |
Switzerland — 0.3% | | | | | | | | | | | | |
Credit Suisse Group AG, 6.25% (a)(b)(f) | | | USD | | | | 4,200 | | | | 4,142,250 | |
UBS Group AG: | | | | | | | | | | | | |
5.75% (b)(f) | | | EUR | | | | 1,700 | | | | 1,961,327 | |
6.88% (b)(f) | | | USD | | | | 4,325 | | | | 4,439,215 | |
7.00% (b)(f) | | | | | | | 2,000 | | | | 2,107,500 | |
| | | | | | | | | | | | |
| | | | | | | | | | | | 12,650,292 | |
United Kingdom — 0.1% | | | | | | | | | | | | |
HBOS Capital Funding LP, 6.85% (b)(f) | | | | | | | 4,341 | | | | 4,402,859 | |
See Notes to Financial Statements.
| | | | | | |
| 26 | | BLACKROCK FUNDS | | JANUARY 31, 2017 | | |
| | | | |
| Schedule of Investments (continued) | | | BlackRock Global Long/Short Credit Fund | |
| | | | |
| | | | | | | | | | | | |
| Preferred Securities | | | | | Par (000) | | | Value | |
United States — 3.4% | | | | | | | | | | | | |
Bank of America Corp.: | | | | | | | | | | | | |
6.10% (b)(f) | | | USD | | | | 10,000 | | | $ | 10,425,000 | |
6.25% (b)(f) | | | | | | | 12,534 | | | | 13,085,496 | |
6.50% (b)(f) | | | | | | | 15,000 | | | | 16,087,500 | |
Bank of New York Mellon Corp., 4.63% (b)(f) | | | | | | | 5,719 | | | | 5,434,766 | |
Goldman Sachs Group, Inc., 5.30% (b)(f) | | | | | | | 9,100 | | | | 8,899,800 | |
JPMorgan Chase & Co., 6.10% (b) | | | | | | | 10,000 | | | | 10,312,900 | |
JPMorgan Chase Capital XXIII, 1.91%, 5/15/47 (b) | | | | | | | 50,000 | | | | 42,625,000 | |
State Street Corp., 1.96%, 6/15/37 (b) | | | | | | | 20,000 | | | | 17,620,000 | |
Wells Fargo & Co., 5.90% (b) | | | | | | | 10,000 | | | | 10,282,000 | |
| | | | | | | | | | | | |
| | | | | | | | | | | | 134,772,462 | |
Total Capital Trusts — 6.6% | | | | | | | | | | | 263,300,713 | |
| | | | | | | | | | | | |
| Preferred Stocks | | | | | Shares | | | | |
Israel — 0.1% | | | | | | | | | | | | |
Teva Pharmaceutical Industries Ltd., 7.00% (f) | | | | | | | 5,793 | | | | 3,571,964 | |
Luxembourg — 0.0% | | | | | | | | | | | | |
Concrete Investment II SCA, 0.00%, 8/27/44 (e) | | | | | | | 11,824 | | | | 1,333,846 | |
Novartex Holding Luxembourg SCA Equity, 0.00% (e)(f) | | | | | | | 94 | | | | — | |
| | | | | | | | | | | | |
| | | | | | | | | | | | 1,333,846 | |
United States — 0.9% | | | | | | | | | | | | |
Morgan Stanley, 5.85% (b)(f) | | | | | | | 1,400,000 | | | | 35,168,000 | |
Total Preferred Stocks — 1.0% | | | | | | | | | | | 40,073,810 | |
Total Preferred Securities — 7.6% | | | | | | | | | | | 303,374,523 | |
| | | | | | | | | | | | |
| U.S. Treasury Obligations | | | | | Par (000) | | | | |
U.S. Treasury Bonds, 2.88%, 11/15/46 | | | USD | | | | 14,465 | | | | 13,965,509 | |
U.S. Treasury Notes: | | | | | | | | | | | | |
1.88%, 1/31/22 | | | | | | | 3,360 | | | | 3,354,617 | |
2.00%, 11/15/26 | | | | | | | 20,414 | | | | 19,617,384 | |
Total U.S. Treasury Obligations — 0.9% | | | | | | | | | | | 36,937,510 | |
Total Long-Term Investments (Cost — $4,081,327,556) — 99.9% | | | | | | | | | | | 4,014,720,608 | |
| | | | | | | | | | | | |
| Short-Term Securities | | | | | | | | | |
Borrowed Bond Agreements — 26.4% (o) | | | | | | | | | | | | |
Amherst Pierpont Securities LLC,
0.05%, Open (p) | | | | | | | 14,100 | | | | 14,100,000 | |
(Purchased on 12/12/16 to be repurchased at $14,100,960, collateralized by Express Scripts Holding Co., 4.80% due at 7/15/46, par and fair value of USD 15,000,000 and $14,026,020, respectively) | | | | | | | | | | | | |
Amherst Pierpont Securities LLC, 0.55%, 2/01/17 | | | | | | | 11,940 | | | | 11,940,000 | |
(Purchased on 1/31/17 to be repurchased at $11,940,182, collateralized by U.S. Treasury Notes, 2.13% due at 11/30/23, par and fair value of USD 12,000,000 and $11,924,532, respectively) | | | | | | | | | | | | |
| | | | | | | | | | | | |
| Short-Term Securities | | | | | Par
(000) | | | Value | |
Borrowed Bond Agreements (continued) (o) | | | | | | | | | | | | |
Amherst Pierpont Securities LLC, 0.55%, 2/01/17 | | | USD | | | | 14,111 | | | $ | 14,110,616 | |
(Purchased on 1/31/17 to be repurchased at $14,110,832, collateralized by U.S. Treasury Notes, 2.25% due at 12/31/23, par and fair value of USD 14,093,000 and $14,102,907, respectively) | | | | | | | | | | | | |
Amherst Pierpont Securities LLC, 0.55%, 2/01/17 | | | | | | | 4,619 | | | | 4,618,750 | |
(Purchased on 1/31/17 to be repurchased at $4,618,821, collateralized by U.S. Treasury Notes, 1.50% due at 8/15/26, par and fair value of USD 5,000,000 and $4,596,875, respectively) | | | | | | | | | | | | |
Barclays Bank PLC, (2.75)%, Open (p) | | | | | | | 2,714 | | | | 2,713,750 | |
(Purchased on 1/26/17 to be repurchased at $2,713,335, collateralized by Bank of Communications Co. Ltd., 5.00% (f), par and fair value of USD 2,600,000 and $2,648,750, respectively) | | | | | | | | | | | | |
Barclays Bank PLC, (1.60)%, Open (p) | | | EUR | | | | 338 | | | | 365,085 | |
(Purchased on 11/25/16 to be repurchased at EUR 337,250, collateralized by Grupo Antolin Dutch BV, 5.13% due at 6/30/22, par and fair value of EUR 313,000 and $362,404, respectively) | | | | | | | | | | | | |
Barclays Bank PLC, (1.60)%, Open (p) | | | | | | | 605 | | | | 653,187 | |
(Purchased on 11/25/16 to be repurchased at EUR 603,386, collateralized by Grupo Antolin Dutch BV, 5.13% due at 6/30/22, par and fair value of EUR 560,000 and $648,391, respectively) | | | | | | | | | | | | |
Barclays Bank PLC, (1.50)%, Open (p) | | | USD | | | | 1,583 | | | | 1,582,671 | |
(Purchased on 11/25/16 to be repurchased at $1,578,385, collateralized by Deutsche Bank AG, 7.50% (f), par and fair value of USD 1,800,000 and $1,648,188, respectively) | | | | | | | | | | | | |
Barclays Bank PLC, (0.85)%, Open (p) | | | EUR | | | | 23,749 | | | | 25,637,259 | |
(Purchased on 11/30/16 to be repurchased at EUR 23,714,870, collateralized by Republic of France, 2.25% due at 10/25/22, par and fair value of EUR 20,800,000 and $25,092,028, respectively) | | | | | | | | | | | | |
Barclays Capital, Inc., (0.10)%, Open (p) | | | USD | | | | 8,385 | | | | 8,385,335 | |
(Purchased on 12/15/16 to be repurchased at $8,384,240, collateralized by Citigroup, Inc., 6.13% (f), par and fair value of USD 8,092,000 and $8,500,646, respectively) | | | | | | | | | | | | |
Barclays Capital, Inc., 0.00%, Open (p) | | | | | | | 4,147 | | | | 4,147,000 | |
(Purchased on 1/31/17 to be repurchased at $4,147,000, collateralized by Macy’s Retail Holdings, Inc., 2.88% due at 2/15/23, par and fair value of USD 4,400,000 and $4,090,931, respectively) | | | | | | | | | | | | |
Barclays Capital, Inc., 0.25%, Open (p) | | | | | | | 23,952 | | | | 23,952,367 | |
(Purchased on 1/24/17 to be repurchased at $23,953,366, collateralized by Wells Fargo & Co., 2.10% due at 7/26/21, par and fair value of USD 24,379,000 and $23,705,043, respectively) | | | | | | | | | | | | |
See Notes to Financial Statements.
| | | | | | |
| | | BLACKROCK FUNDS | | JANUARY 31, 2017 | | 27 |
| | | | |
| Schedule of Investments (continued) | | | BlackRock Global Long/Short Credit Fund | |
| | | | |
| | | | | | | | | | | | |
| Short-Term Securities | | | | | Par
(000) | | | Value | |
Borrowed Bond Agreements (continued) (o) | | | | | | | | | | | | |
Barclays Capital, Inc., 0.25%, Open (p) | | | USD | | | | 14,981 | | | $ | 14,981,250 | |
(Purchased on 12/15/16 to be repurchased at $14,986,140, collateralized by Exxon Mobil Corp., 3.04% due at 3/01/26, par and fair value of USD 15,000,000 and $14,866,320, respectively) | | | | | | | | | | | | |
Barclays Capital, Inc., 0.25%, Open (p) | | | | | | | 15,150 | | | | 15,150,000 | |
(Purchased on 12/15/16 to be repurchased at $15,154,945, collateralized by Exxon Mobil Corp., 4.11% due at 3/01/46, par and fair value of USD 15,000,000 and $15,281,910, respectively) | | | | | | | | | | | | |
Barclays Capital, Inc., 0.25%, Open (p) | | | | | | | 5,827 | | | | 5,826,557 | |
(Purchased on 12/15/16 to be repurchased at $5,828,459, collateralized by CVS Health Corp., 5.13% due at 7/20/45, par and fair value of USD 5,261,000 and $5,786,211, respectively) | | | | | | | | | | | | |
Barclays Capital, Inc., 0.25%, Open (p) | | | | | | | 8,453 | | | | 8,453,000 | |
(Purchased on 12/15/16 to be repurchased at $8,455,759, collateralized by Seagate HDD, 4.75% due at 6/01/23, par and fair value of USD 8,560,000 and $8,582,256, respectively) | | | | | | | | | | | | |
Barclays Capital, Inc., 0.25%, Open (p) | | | | | | | 29,400 | | | | 29,400,000 | |
(Purchased on 12/16/16 to be repurchased at $29,408,779, collateralized by JPMorgan Chase & Co., 2.30% due at 8/15/21, par and fair value of USD 30,000,000 and $29,479,170, respectively) | | | | | | | | | | | | |
BNP Paribas Securities Corp., 0.32%, 2/01/17 | | | | | | | 70,774 | | | | 70,774,342 | |
(Purchased on 1/31/17 to be repurchased at $70,774,971, collateralized by U.S. Treasury Bonds, 2.25% due at 8/15/46, par and fair value of USD 83,632,900 and $70,343,131, respectively) | | | | | | | | | | | | |
Citigroup Global Markets, Inc., (0.50)%, Open (p) | | | | | | | 2,525 | | | | 2,525,000 | |
(Purchased on 11/17/16 to be repurchased at $2,522,475, collateralized by Ally Financial, Inc., 5.13% due at 9/30/24, par and fair value of USD 2,500,000 and $2,568,000, respectively) | | | | | | | | | | | | |
Citigroup Global Markets, Inc., (0.30)%, Open (p) | | | | | | | 7,158 | | | | 7,158,415 | |
(Purchased on 12/12/16 to be repurchased at $7,155,492, collateralized by Citigroup, Inc., 6.13% (f), par and fair value of USD 6,908,000 and $7,256,854, respectively) | | | | | | | | | | | | |
Citigroup Global Markets, Inc., (0.25)%, Open (p) | | | | | | | 10,665 | | | | 10,665,044 | |
(Purchased on 1/20/17 to be repurchased at $10,664,451, collateralized by JPMorgan Chase & Co., 6.75% (f), par and fair value of USD 9,533,000 and $10,433,011, respectively) | | | | | | | | | | | | |
Citigroup Global Markets, Inc., 0.00%, Open (p) | | | | | | | 438 | | | | 437,546 | |
(Purchased on 1/12/16 to be repurchased at $437,546, collateralized by Kennametal, Inc., 3.88% due at 2/15/22, par and fair value of USD 437,000 and $430,268, respectively) | | | | | | | | | | | | |
| | | | | | | | | | | | |
| Short-Term Securities | | | | | Par
(000) | | | Value | |
Borrowed Bond Agreements (continued) (o) | | | | | | | | | | | | |
Citigroup Global Markets, Inc., 0.00%, Open (p) | | | USD | | | | 3,851 | | | $ | 3,851,063 | |
(Purchased on 11/03/16 to be repurchased at $3,851,063, collateralized by AECOM, 5.88% due at 10/15/24, par and fair value of USD 3,450,000 and $3,717,375, respectively) | | | | | | | | | | | | |
Citigroup Global Markets, Inc., 0.00%, Open (p) | | | | | | | 10,250 | | | | 10,250,000 | |
(Purchased on 12/28/16 to be repurchased at $10,250,000, collateralized by Enterprise Products Operating LLC, 3.95% due at 2/15/27, par and fair value of USD 10,000,000 and $10,196,900, respectively) | | | | | | | | | | | | |
Citigroup Global Markets, Inc., 0.30%, Open (p) | | | | | | | 5,308 | | | | 5,307,500 | |
(Purchased on 11/07/16 to be repurchased at $5,311,215, collateralized by Anadarko Petroleum Corp., 6.60% due at 3/15/46, par and fair value of USD 4,400,000 and $5,513,464, respectively) | | | | | | | | | | | | |
Citigroup Global Markets, Inc., 0.30%, Open (p) | | | | | | | 17,982 | | | | 17,981,580 | |
(Purchased on 11/14/16 to be repurchased at $17,993,118, collateralized by CVS Health Corp., 5.13% due at 7/20/45, par and fair value of USD 14,739,000 and $16,210,409, respectively) | | | | | | | | | | | | |
Citigroup Global Markets, Inc., 0.35%, Open (p) | | | | | | | 15,994 | | | | 15,993,750 | |
(Purchased on 10/06/16 to be repurchased at $16,011,321, collateralized by Morgan Stanley, 3.88% due at 1/27/26, par and fair value of USD 15,000,000 and $15,093,300, respectively) | | | | | | | | | | | | |
Citigroup Global Markets, Inc., 0.35%, Open (p) | | | | | | | 16,650 | | | | 16,650,000 | |
(Purchased on 10/06/16 to be repurchased at $16,668,292, collateralized by Verizon Communications, Inc., 4.86% due at 8/21/46, par and fair value of USD 15,000,000 and $14,405,700, respectively) | | | | | | | | | | | | |
Citigroup Global Markets, Inc., 0.35%, Open (p) | | | | | | | 15,713 | | | | 15,712,500 | |
(Purchased on 11/04/16 to be repurchased at $15,725,485, collateralized by Mylan NV, 5.25% due at 6/15/46, par and fair value of USD 15,000,000 and $14,098,200, respectively) | | | | | | | | | | | | |
Citigroup Global Markets, Inc., 0.35%, Open (p) | | | | | | | 2,906 | | | | 2,906,250 | |
(Purchased on 11/04/16 to be repurchased at $2,908,652, collateralized by Teva Pharmaceutical Finance Netherlands III BV, 3.15% due at 10/01/26, par and fair value of USD 3,000,000 and $2,719,662, respectively) | | | | | | | | | | | | |
Citigroup Global Markets, Inc., 0.35%, Open (p) | | | | | | | 8,530 | | | | 8,530,000 | |
(Purchased on 11/18/16 to be repurchased at $8,535,888, collateralized by Ford Motor Credit Co. LLC, 4.39% due at 1/08/26, par and fair value of USD 8,000,000 and $8,054,600, respectively) | | | | | | | | | | | | |
Citigroup Global Markets, Inc., 0.35%, Open (p) | | | | | | | 3,999 | | | | 3,999,000 | |
(Purchased on 3/17/16 to be repurchased at $4,011,480, collateralized by Infor U.S., Inc., 6.50% due at 5/15/22, par and fair value of USD 4,300,000 and $4,412,875, respectively) | | | | | | | | | | | | |
See Notes to Financial Statements.
| | | | | | |
| 28 | | BLACKROCK FUNDS | | JANUARY 31, 2017 | | |
| | | | |
| Schedule of Investments (continued) | | | BlackRock Global Long/Short Credit Fund | |
| | | | |
| | | | | | | | | | | | |
| Short-Term Securities | | | | | Par
(000) | | | Value | |
Borrowed Bond Agreements (continued) (o) | | | | | | | | | | | | |
Credit Suisse Securities (USA) LLC, (0.25)%, Open (p) | | | USD | | | | 24,250 | | | $ | 24,250,000 | |
(Purchased on 1/20/17 to be repurchased at $24,248,653, collateralized by Philip Morris International, Inc., 2.75% due at 2/25/26, par and fair value of USD 25,000,000 and $23,882,125, respectively) | | | | | | | | | | | | |
Credit Suisse Securities (USA) LLC, 0.35%, Open (p) | | | | | | | 14,456 | | | | 14,456,250 | |
(Purchased on 11/04/16 to be repurchased at $14,468,196, collateralized by Verizon Communications, Inc., 2.63% due at 8/15/26, par and fair value of USD 15,000,000 and $13,606,425, respectively) | | | | | | | | | | | | |
Credit Suisse Securities (USA) LLC, 0.55%, 2/01/17 | | | | | | | 33,889 | | | | 33,888,600 | |
(Purchased on 1/31/17 to be repurchased at $33,889,118, collateralized by U.S. Treasury Notes, 2.00% due at 12/31/21, par and fair value of USD 33,720,000 and $33,864,894, respectively) | | | | | | | | | | | | |
Credit Suisse Securities (USA) LLC, 0.60%, 2/01/17 | | | | | | | 12,258 | | | | 12,258,400 | |
(Purchased on 1/31/17 to be repurchased at $12,258,604, collateralized by U.S. Treasury Notes, 1.75% due at 11/30/21, par and fair value of USD 12,320,000 and $12,240,117, respectively) | | | | | | | | | | | | |
Deutsche Bank AG, (0.98)%, Open (p) | | | EUR | | | | 20,168 | | | | 21,770,992 | |
(Purchased on 12/08/16 to be repurchased at EUR 20,139,559, collateralized by Republic of France, 2.25% due at 10/25/22, par and fair value of EUR 17,800,000 and $21,472,985, respectively) | | | | | | | | | | | | |
Deutsche Bank AG, 0.00%, Open (p) | | | | | | | 9,861 | | | | 10,645,315 | |
(Purchased on 1/31/17 to be repurchased at EUR 9,861,287, collateralized by Kingdom of Spain, 5.40% due at 1/31/23, par and fair value of EUR 7,600,000 and $10,439,160, respectively) | | | | | | | | | | | | |
Deutsche Bank Securities, Inc., 0.25%, Open (p) | | | USD | | | | 14,513 | | | | 14,512,500 | |
(Purchased on 1/11/17 to be repurchased at $14,514,616, collateralized by Morgan Stanley, 3.13% due at 7/27/26, par and fair value of USD 15,000,000 and $14,242,350, respectively) | | | | | | | | | | | | |
Deutsche Bank Securities, Inc., 0.25%, Open (p) | | | | | | | 24,125 | | | | 24,125,000 | |
(Purchased on 1/13/17 to be repurchased at $24,127,345, collateralized by AbbVie, Inc., 4.45% due at 5/14/46, par and fair value of USD 25,000,000 and $23,420,450, respectively) | | | | | | | | | | | | |
Deutsche Bank Securities, Inc., 0.34%, Open (p) | | | | | | | 31,528 | | | | 31,528,219 | |
(Purchased on 11/03/16 to be repurchased at $31,555,018, collateralized by U.S. Treasury Bonds, 2.25% due at 8/15/46, par and fair value of USD 33,675,000 and $28,323,840, respectively) | | | | | | | | | | | | |
Deutsche Bank Securities, Inc., 0.57%, 2/01/17 | | | | | | | 7,750 | | | | 7,750,300 | |
(Purchased on 1/31/17 to be repurchased at $7,750,423, collateralized by U.S. Treasury Notes, 1.00% due at 11/30/18, par and fair value of USD 7,760,000 and $7,736,355, respectively) | | | | | | | | | | | | |
| | | | | | | | | | | | |
| Short-Term Securities | | | | | Par (000) | | | Value | |
Borrowed Bond Agreements (continued) (o) | | | | | | | | | | | | |
J.P. Morgan Securities LLC, 0.52%, Open (p) | | | USD | | | | 47,875 | | | $ | 47,875,000 | |
(Purchased on 1/26/17 to be repurchased at $47,879,149, collateralized by U.S. Treasury Notes, 2.00% due at 11/15/26, par and fair value of USD 50,000,000 and $48,048,850, respectively) | | | | | | | | | | | | |
J.P. Morgan Securities LLC, 0.57%, Open (p) | | | | | | | 36,823 | | | | 36,823,050 | |
(Purchased on 11/23/16 to be repurchased at $36,863,862, collateralized by U.S. Treasury Notes, 1.00% due at 11/15/19, par and fair value of USD 37,195,000 and $36,764,951, respectively) | | | | | | | | | | | | |
J.P. Morgan Securities LLC, 0.59%, Open (p) | | | | | | | 46,624 | | | | 46,623,975 | |
(Purchased on 12/14/16 to be repurchased at $46,661,417, collateralized by U.S. Treasury Notes, 1.63% due at 10/31/23, par and fair value of USD 48,315,000 and $46,522,079, respectively) | | | | | | | | | | | | |
J.P. Morgan Securities PLC, (1.30)%, Open (p) | | | EUR | | | | 2,116 | | | | 2,283,964 | |
(Purchased on 1/16/17 to be repurchased at EUR 2,114,604, collateralized by Jaguar Land Rover Automotive PLC, 2.20% due at 1/15/24, par and fair value of EUR 2,000,000 and $2,159,011, respectively) | | | | | | | | | | | | |
J.P. Morgan Securities PLC, (1.05)%, Open (p) | | | | | | | 794 | | | | 857,502 | |
(Purchased on 10/18/16 to be repurchased at EUR 791,937, collateralized by Syngenta Finance NV, 1.88% due at 11/02/21, par and fair value of EUR 700,000 and $799,561, respectively) | | | | | | | | | | | | |
J.P. Morgan Securities PLC, (0.90)%, Open (p) | | | | | | | 23,643 | | | | 25,523,139 | |
(Purchased on 12/01/16 to be repurchased at EUR 23,609,077, collateralized by Republic of France, 2.25% due at 10/25/22, par and fair value of EUR 20,800,000 and $25,092,028, respectively) | | | | | | | | | | | | |
J.P. Morgan Securities PLC, (0.50)%, 2/03/17 | | | USD | | | | 2,864 | | | | 2,863,797 | |
(Purchased on 12/15/16 to be repurchased at $2,861,968, collateralized by Industrial & Commercial Bank of China Ltd., 6.00% (f), par and fair value of USD 2,600,000 and $2,735,767, respectively) | | | | | | | | | | | | |
J.P. Morgan Securities PLC, (0.50)%, 2/03/17 | | | | | | | 3,402 | | | | 3,401,982 | |
(Purchased on 12/15/16 to be repurchased at $3,399,667, collateralized by Republic of Ecuador, 7.95% due at 6/20/24, par and fair value of USD 3,000,000 and $2,970,000, respectively) | | | | | | | | | | | | |
J.P. Morgan Securities PLC, 0.00%, Open (p) | | | EUR | | | | 784 | | | | 845,917 | |
(Purchased on 1/31/17 to be repurchased at EUR 783,615, collateralized by Syngenta Finance NV, 1.88% due at 11/02/21, par and fair value of EUR 700,000 and $799,561, respectively) | | | | | | | | | | | | |
Merrill Lynch, Pierce, Fenner & Smith, Inc.,
0.15%, Open (p) | | | USD | | | | 13,350 | | | | 13,350,000 | |
(Purchased on 5/10/16 to be repurchased at $13,364,741, collateralized by Novartis Capital Corp., 4.00% due at 11/20/45, par and fair value of USD 12,000,000 and $12,079,908, respectively) | | | | | | | | | | | | |
See Notes to Financial Statements.
| | | | | | |
| | | BLACKROCK FUNDS | | JANUARY 31, 2017 | | 29 |
| | | | |
| Schedule of Investments (continued) | | | BlackRock Global Long/Short Credit Fund | |
| | | | |
| | | | | | | | | | | | |
| Short-Term Securities | | | | | Par
(000) | | | Value | |
Borrowed Bond Agreements (continued) (o) | | | | | | | | | | | | |
Merrill Lynch, Pierce, Fenner & Smith, Inc.,
0.30%, Open (p) | | | USD | | | | 12,270 | | | $ | 12,270,000 | |
(Purchased on 5/10/16 to be repurchased at $12,297,096, collateralized by Merck & Co., Inc., 3.70% due at 2/10/45, par and fair value of USD 12,000,000 and $11,366,640, respectively) | | | | | | | | | | | | |
Merrill Lynch, Pierce, Fenner & Smith, Inc., 0.56%, 2/02/17 | | | | | | | 8,921 | | | | 8,921,250 | |
(Purchased on 1/31/17 to be repurchased at $8,921,528, collateralized by U.S. Treasury Notes, 1.00% due at 11/15/19, par and fair value of USD 9,000,000 and $8,895,942, respectively) | | | | | | | | | | | | |
Morgan Stanley & Co. LLC, 0.55%, 2/01/17 | | | | | | | 86,168 | | | | 86,167,813 | |
(Purchased on 1/31/17 to be repurchased at $86,169,129, collateralized by U.S. Treasury Notes, 2.00% due at 11/15/26, par and fair value of USD 89,525,000 and $86,031,466, respectively) | | | | | | | | | | | | |
RBC Capital Markets, LLC, 0.00%, Open (p) | | | | | | | 15,600 | | | | 15,600,000 | |
(Purchased on 1/10/17 to be repurchased at $15,600,000, collateralized by Kinder Morgan, Inc., 4.30% due at 6/01/25, par and fair value of USD 15,000,000 and $15,402,000, respectively) | | | | | | | | | | | | |
RBC Capital Markets, LLC, 0.00%, Open (p) | | | | | | | 8,798 | | | | 8,797,500 | |
(Purchased on 1/18/17 to be repurchased at $8,797,500, collateralized by JC Penney Corp., Inc., 5.88% due at 7/01/23, par and fair value of USD 8,500,000 and $8,619,000, respectively) | | | | | | | | | | | | |
RBC Capital Markets, LLC, 0.00%, Open (p) | | | | | | | 7,210 | | | | 7,210,000 | |
(Purchased on 1/31/17 to be repurchased at $7,210,000, collateralized by JC Penney Corp., Inc., 5.88% due at 7/01/23, par and fair value of USD 7,000,000 and $7,098,000, respectively) | | | | | | | | | | | | |
RBC Capital Markets, LLC, 0.10%, Open (p) | | | | | | | 17,200 | | | | 17,200,000 | |
(Purchased on 11/18/16 to be repurchased at $17,203,392, collateralized by Teva Pharmaceutical Finance Netherlands III BV, 4.10% due at 10/01/46, par and fair value of USD 20,000,000 and $16,876,160, respectively) | | | | | | | | | | | | |
RBC Capital Markets, LLC, 0.15%, Open (p) | | | | | | | 1,811 | | | | 1,810,500 | |
(Purchased on 11/10/16 to be repurchased at $1,811,088, collateralized by CDW LLC/CDW Finance Corp., 5.50% due at 12/01/24, par and fair value of USD 1,700,000 and $1,770,125, respectively) | | | | | | | | | | | | |
RBC Capital Markets, LLC, 0.15%, Open (p) | | | | | | | 4,361 | | | | 4,360,500 | |
(Purchased on 11/15/16 to be repurchased at $4,361,881, collateralized by United Rentals North America, Inc., 5.88% due at 9/15/26, par and fair value of USD 4,275,000 and $4,440,656, respectively) | | | | | | | | | | | | |
RBC Capital Markets, LLC, 0.15%, Open (p) | | | | | | | 10,300 | | | | 10,300,000 | |
(Purchased on 11/18/16 to be repurchased at $10,303,047, collateralized by Celgene Corp., 3.88% due at 8/15/25, par and fair value of USD 10,000,000 and $10,117,080, respectively) | | | | | | | | | | | | |
RBC Capital Markets, LLC, 0.15%, Open (p) | | | | | | | 5,890 | | | | 5,890,125 | |
(Purchased on 11/18/16 to be repurchased at $5,891,867, collateralized by LifePoint Health, Inc., 5.50% due at 12/01/21, par and fair value of USD 5,650,000 and $5,791,250, respectively) | | | | | | | | | | | | |
| | | | | | | | | | | | |
| Short-Term Securities | | | | | Par
(000) | | | Value | |
Borrowed Bond Agreements (continued) (o) | | | | | | | | | | | | |
RBC Capital Markets, LLC, 0.15%, Open (p) | | | USD | | | | 9,300 | | | $ | 9,300,000 | |
(Purchased on 12/13/16 to be repurchased at $9,301,860, collateralized by CBS Corp., 2.90% due at 1/15/27, par and fair value of USD 10,000,000 and $9,177,260, respectively) | | | | | | | | | | | | |
RBC Capital Markets, LLC, 0.40%, Open (p) | | | | | | | 5,400 | | | | 5,400,000 | |
(Purchased on 1/05/17 to be repurchased at $5,401,380, collateralized by Dollar Tree, Inc., 5.75% due at 3/01/23, par and fair value of USD 5,000,000 and $5,295,000, respectively) | | | | | | | | | | | | |
RBC Capital Markets, LLC, 0.40%, Open (p) | | | | | | | 6,580 | | | | 6,580,000 | |
(Purchased on 1/09/17 to be repurchased at $6,581,535, collateralized by Teva Pharmaceutical Finance Netherlands III BV, 3.15% due at 10/01/26, par and fair value of USD 7,000,000 and $6,345,878, respectively) | | | | | | | | | | | | |
RBC Capital Markets, LLC, 0.40%, Open (p) | | | | | | | 15,300 | | | | 15,300,000 | |
(Purchased on 1/10/17 to be repurchased at $15,303,570, collateralized by JPMorgan Chase & Co., 4.13% due at 12/15/26, par and fair value of USD 15,000,000 and $15,194,505, respectively) | | | | | | | | | | | | |
RBC Capital Markets, LLC, 0.40%, Open (p) | | | | | | | 16,575 | | | | 16,575,000 | |
(Purchased on 1/10/17 to be repurchased at $16,578,868, collateralized by Anheuser-Busch InBev Finance, Inc., 4.90% due at 2/01/46, par and fair value of USD 15,000,000 and $16,051,575, respectively) | | | | | | | | | | | | |
RBC Capital Markets, LLC, 0.40%, Open (p) | | | | | | | 5,400 | | | | 5,400,000 | |
(Purchased on 1/10/17 to be repurchased at $5,401,260, collateralized by Baxalta, Inc., 5.25% due at 6/23/45, par and fair value of USD 5,000,000 and $5,318,700, respectively) | | | | | | | | | | | | |
RBC Capital Markets, LLC, 0.40%, Open (p) | | | | | | | 2,488 | | | | 2,487,500 | |
(Purchased on 1/23/17 to be repurchased at $2,487,693, collateralized by Netflix, Inc., 4.38% due at 11/15/26, par and fair value of USD 2,500,000 and $2,453,125, respectively) | | | | | | | | | | | | |
RBC Capital Markets, LLC, 0.40%, Open (p) | | | | | | | 8,855 | | | | 8,854,917 | |
(Purchased on 1/24/17 to be repurchased at $8,855,508, collateralized by QUALCOMM, Inc., 3.45% due at 5/20/25, par and fair value of USD 8,789,000 and $8,802,491, respectively) | | | | | | | | | | | | |
RBC Capital Markets, LLC, 0.40%, Open (p) | | | | | | | 30,150 | | | | 30,150,000 | |
(Purchased on 12/15/16 to be repurchased at $30,165,745, collateralized by Goldman Sachs Group, Inc., 3.75% due at 2/25/26, par and fair value of USD 30,000,000 and $29,968,470, respectively) | | | | | | | | | | | | |
RBC Capital Markets, LLC, 0.40%, Open (p) | | | | | | | 20,000 | | | | 20,000,000 | |
(Purchased on 12/16/16 to be repurchased at $20,010,444, collateralized by Target Corp., 4.00% due at 7/01/42, par and fair value of USD 20,000,000 and $19,484,020, respectively) | | | | | | | | | | | | |
See Notes to Financial Statements.
| | | | | | |
| 30 | | BLACKROCK FUNDS | | JANUARY 31, 2017 | | |
| | |
| Schedule of Investments (continued) | | BlackRock Global Long/Short Credit Fund |
| | |
| | | | | | | | | | | | |
| Short-Term Securities | | | | | Par (000) | | | Value | |
Borrowed Bond Agreements (continued) (o) | | | | | |
RBC Capital Markets, LLC, 0.40%, Open (p) | | | USD | | | | 6,641 | | | $ | 6,641,223 | |
(Purchased on 12/21/16 to be repurchased at $6,644,248, collateralized by Health Care REIT, Inc., 4.00% due at 6/01/25, par and fair value of USD 6,527,000 and $6,642,228, respectively) | | | | | | | | | | | | |
| | | | | | | | | | | | |
| | | | | | | | | | | | 1,059,609,047 | |
| | | | | | Shares | | | | |
Money Market Funds — 3.0% | | | | | | | | | | | | |
BlackRock Liquidity Funds, T-Fund, Institutional Class, 0.40% | | | | | | | 119,347,759 | | | | 119,347,759 | |
Total Short-Term Securities (Cost — $1,177,678,044) — 29.4% | | | | 1,178,956,806 | |
| | | | | | | | | | | | |
| Options Purchased | | | | | | | | | |
(Cost — $8,292,422) — 0.2% | | | | 7,033,600 | |
Total Investments Before Options Written, Borrowed Bonds
and Investments Sold Short (Cost — $5,267,298,022) — 129.5% | | | | 5,200,711,014 | |
| | | | | | | | | | | | |
| Options Written | | | | | | | | | |
(Premiums Received — $455,504) — (0.0)% | | | | (207,352 | ) |
| | | | | | | | | | | | |
| Borrowed Bonds | | | | | Par (000) | | | | |
Corporate Bonds — (13.2)% | | | | | | | | | | | | |
AbbVie, Inc., 4.45%, 5/14/46 | | | USD | | | | 25,000 | | | | (23,420,450 | ) |
AECOM, 5.88%, 10/15/24 | | | | | | | 3,450 | | | | (3,717,375 | ) |
Ally Financial, Inc., 5.13%, 9/30/24 | | | | | | | 2,500 | | | | (2,568,000 | ) |
Anadarko Petroleum Corp., 6.60%, 3/15/46 | | | | | | | 4,400 | | | | (5,513,464 | ) |
Anheuser-Busch InBev Finance, Inc.,
4.90%, 2/01/46 | | | | | | | 15,000 | | | | (16,051,575 | ) |
Bank of Communications Co. Ltd., 5.00% (b) (f) | | | | | | | 2,600 | | | | (2,648,750 | ) |
Baxalta, Inc., 5.25%, 6/23/45 | | | | | | | 5,000 | | | | (5,318,700 | ) |
CBS Corp., 2.90%, 1/15/27 | | | | | | | 10,000 | | | | (9,177,260 | ) |
CDW LLC/CDW Finance Corp.,
5.50%, 12/01/24 | | | | | | | 1,700 | | | | (1,770,125 | ) |
Celgene Corp., 3.88%, 8/15/25 | | | | | | | 10,000 | | | | (10,117,080 | ) |
Citigroup, Inc., 6.13% (b)(f) | | | | | | | 15,000 | | | | (15,757,500 | ) |
CVS Health Corp., 5.13%, 7/20/45 | | | | | | | 20,000 | | | | (21,996,620 | ) |
Deutsche Bank AG, 7.50% (b)(f) | | | | | | | 1,800 | | | | (1,648,188 | ) |
Dollar Tree, Inc., 5.75%, 3/01/23 | | | | | | | 5,000 | | | | (5,295,000 | ) |
Enterprise Products Operating LLC,
3.95%, 2/15/27 | | | | | | | 10,000 | | | | (10,196,900 | ) |
Express Scripts Holding Co.,
4.80%, 7/15/46 | | | | | | | 15,000 | | | | (14,026,020 | ) |
Exxon Mobil Corp.: | | | | | | | | | | | | |
3.04%, 3/01/26 | | | | | | | 15,000 | | | | (14,866,320 | ) |
4.11%, 3/01/46 | | | | | | | 15,000 | | | | (15,281,910 | ) |
Ford Motor Credit Co. LLC,
4.39%, 1/08/26 | | | | | | | 8,000 | | | | (8,054,600 | ) |
Goldman Sachs Group, Inc.,
3.75%, 2/25/26 | | | | | | | 30,000 | | | | (29,968,470 | ) |
Grupo Antolin Dutch BV,
5.13%, 6/30/22 | | | EUR | | | | 873 | | | | (1,010,795 | ) |
Health Care REIT, Inc.,
4.00%, 6/01/25 | | | USD | | | | 6,527 | | | | (6,642,228 | ) |
Infor U.S., Inc., 6.50%, 5/15/22 | | | | | | | 4,300 | | | | (4,412,875 | ) |
Jaguar Land Rover Automotive PLC,
2.20%, 1/15/24 | | | EUR | | | | 2,000 | | | | (2,159,011 | ) |
JC Penney Corp., Inc.,
5.88%, 7/01/23 (a) | | | USD | | | | 8,500 | | | | (8,619,000 | ) |
JPMorgan Chase & Co.:
6.75% (b)(f) | | | | | | | 9,533 | | | | (10,433,011 | ) |
2.30%, 8/15/21 | | | | | | | 30,000 | | | | (29,479,170 | ) |
4.13%, 12/15/26 | | | | | | | 15,000 | | | | (15,194,505 | ) |
| | | | | | | | | | | | |
| Borrowed Bonds | | | | | Par (000) | | | Value | |
Corporate Bonds (continued) | | | | | | | | | | | | |
Kennametal, Inc., 3.88%, 2/15/22 | | | USD | | | | 437 | | | $ | (430,268 | ) |
Kinder Morgan, Inc., 4.30%, 6/01/25 | | | | | | | 15,000 | | | | (15,402,000 | ) |
LifePoint Health, Inc., 5.50%, 12/01/21 | | | | | | | 5,650 | | | | (5,791,250 | ) |
Merck & Co., Inc., 3.70%, 2/10/45 | | | | | | | 12,000 | | | | (11,366,640 | ) |
Morgan Stanley: | | | | | | | | | | | | |
3.88%, 1/27/26 | | | | | | | 15,000 | | | | (15,093,300 | ) |
3.13%, 7/27/26 | | | | | | | 15,000 | | | | (14,242,350 | ) |
Mylan NV, 5.25%, 6/15/46 (a) | | | | | | | 15,000 | | | | (14,098,200 | ) |
Netflix, Inc., 4.38%, 11/15/26 (a) | | | | | | | 2,500 | | | | (2,453,125 | ) |
Novartis Capital Corp., 4.00%, 11/20/45 | | | | | | | 12,000 | | | | (12,079,908 | ) |
Philip Morris International, Inc.,
2.75%, 2/25/26 | | | | | | | 25,000 | | | | (23,882,125 | ) |
QUALCOMM, Inc., 3.45%, 5/20/25 | | | | | | | 8,789 | | | | (8,802,491 | ) |
Seagate HDD, 4.75%, 6/01/23 | | | | | | | 8,560 | | | | (8,582,256 | ) |
Syngenta Finance NV, 1.88%, 11/02/21 | | | EUR | | | | 700 | | | | (799,561 | ) |
Target Corp., 4.00%, 7/01/42 | | | USD | | | | 20,000 | | | | (19,484,020 | ) |
Teva Pharmaceutical Finance Netherlands III BV: | | | | | | | | | | | | |
3.15%, 10/01/26 | | | | | | | 10,000 | | | | (9,065,540 | ) |
4.10%, 10/01/46 | | | | | | | 20,000 | | | | (16,876,160 | ) |
United Rentals North America, Inc., 5.88%, 9/15/26 | | | | | | | 4,275 | | | | (4,440,656 | ) |
Verizon Communications, Inc.: | | | | | | | | | | | | |
2.63%, 8/15/26 | | | | | | | 15,000 | | | | (13,606,425 | ) |
4.86%, 8/21/46 | | | | | | | 15,000 | | | | (14,405,700 | ) |
Wells Fargo & Co., 2.10%, 7/26/21 | | | | | | | 24,379 | | | | (23,705,043 | ) |
| | | | | | | | | | | | |
| | | | | | | | | | | | (529,951,920 | ) |
Foreign Agency Obligations — (0.1)% | | | | | | | | | | | | |
Industrial & Commercial Bank of China Ltd., 6.00% (b) (f) | | | | | | | 2,600 | | | | (2,735,767 | ) |
Foreign Government Obligations — (1.8)% | | | | | | | | | | | | |
Republic of Ecuador, 7.95%, 6/20/24 | | | | | | | 3,000 | | | | (2,970,000 | ) |
Republic of France, 2.25%, 10/25/22 | | | EUR | | | | 59,400 | | | | (71,657,041 | ) |
| | | | | | | | | | | | |
| | | | | | | | | | | | (74,627,041 | ) |
U.S. Treasury Obligations — (10.2)% | | | | | | | | | | | | |
U.S. Treasury Bonds, 2.25%, 8/15/46 | | | USD | | | | 117,308 | | | | (98,666,971 | ) |
U.S. Treasury Notes: | | | | | | | | | | | | |
1.00%, 11/30/18-11/15/19 | | | | | | | 53,955 | | | | (53,397,248 | ) |
1.75%, 11/30/21 | | | | | | | 12,320 | | | | (12,240,117 | ) |
2.00%, 12/31/21-11/15/26 | | | | | | | 173,245 | | | | (167,945,210 | ) |
1.63%, 10/31/23 | | | | | | | 48,315 | | | | (46,522,079 | ) |
2.13%, 11/30/23 | | | | | | | 12,000 | | | | (11,924,532 | ) |
2.25%, 12/31/23 | | | | | | | 14,093 | | | | (14,102,907 | ) |
1.50%, 8/15/26 | | | | | | | 5,000 | | | | (4,596,875 | ) |
| | | | | | | | | | | | |
| | | | | | | | | | | | (409,395,939 | ) |
Total Borrowed Bonds (Proceeds — $1,037,715,637) — (25.3)% | | | | (1,016,710,667 | ) |
| | | | | | | | | | | | |
| Investments Sold Short | | | | | Shares | | | | |
| Common Stocks — (0.1)% | | | | | | | | | |
Caterpillar, Inc. | | | | | | | 45,875 | | | | (4,388,403 | ) |
Chesapeake Energy Corp. | | | | | | | 40,000 | | | | (258,000 | ) |
Mallinckrodt PLC | | | | | | | 10,500 | | | | (511,665 | ) |
Tenet Healthcare Corp. | | | | | | | 10,500 | | | | (184,695 | ) |
| | | | | | | | | | | | |
| | | | | | | | | | | | (5,342,763 | ) |
| | | | | | | | | | | | |
| | | | | | | | | | |
See Notes to Financial Statements.
| | | | | | |
| | | BLACKROCK FUNDS | | JANUARY 31, 2017 | | 31 |
| | | | |
| Schedule of Investments (continued) | | | BlackRock Global Long/Short Credit Fund | |
| | | | |
| | | | | | | | | | | | |
| Corporate Bonds — (0.2)% | | | | | Par (000) | | | Value | |
Macy’s Retail Holdings, Inc., 2.88%, 02/15/23 | | | USD | | | | 4,400 | | | $ | (4,090,931 | ) |
Teva Pharmaceutical Finance Netherlands III BV, 3.15%, 10/01/26 | | | | | | | 2,500 | | | | (2,266,385 | ) |
| | | | | | | | | | | | |
| | | | | | | | | | | | (6,357,316 | ) |
| | | | | | | | | | | | |
| | | | |
| Foreign Government Obligations — (0.3)% | | | | | | | | | |
Kingdom of Spain, 5.40%, 01/31/23 | | | EUR | | | | 7,600 | | | | (10,439,160 | ) |
| | | | | | | | | | | | |
| | | | |
| Investment Companies — (1.0)% | | | | | Shares | | | | |
Industrial Select Sector SPDR Fund | | | | | | | 60,000 | | | | (3,802,800 | ) |
iShares iBoxx $ High Yield Corporate Bond ETF (n) | | | | | | | 309,000 | | | | (26,988,060 | ) |
iShares iBoxx $ Investment Grade Corporate Bond ETF (n) | | | | | | | 51,500 | | | | (6,043,525 | ) |
Powershares QQQ Trust Series 1 | | | | | | | 16,100 | | | | (2,005,577 | ) |
| | | | | | | | | | | | |
| | | | | | | | | | | | (38,839,962 | ) |
| | | | | | | | | | | | |
| | | | |
| | | | | | | | | | |
| | | | | | | | | | | | |
| U.S. Treasury Obligations — (1.5)% | | | | | Par
(000) | | | Value | |
U.S. Treasury Bonds, 2.25%, 08/15/46 | | | USD | | | | 26,190 | | | $ | (22,028,252 | ) |
U.S. Treasury Notes: | | | | | | | | | | | | |
2.00%, 12/31/21 | | | | | | | 2,470 | | | | (2,480,614 | ) |
2.00%, 11/15/26 | | | | | | | 38,141 | | | | (36,652,623 | ) |
| | | | | | | | | | | | |
| | | | | | | | | | | | (61,161,489 | ) |
Total Investments Sold Short (Proceeds — $120,625,032) — (3.1)% | | | | (122,140,690 | ) |
Total Investments Net of Options Written, Borrowed Bonds and Investments Sold Short — 101.1% | | | | 4,061,652,305 | |
Liabilities in Excess of Other Assets — (1.1)% | | | | (44,702,915 | ) |
| | | | | | | | | | | | |
Net Assets — 100.0% | | | $ | 4,016,949,390 | |
| | | | | | | | | | | | |
|
| Notes to Schedule of Investments |
| (a) | Security exempt from registration pursuant to Rule 144A under the Securities Act of 1933, as amended. These securities may be resold in transactions exempt from registration to qualified institutional investors. |
| (b) | Variable rate security. Rate as of period end. |
| (d) | Amount is less than $500. |
| (e) | Non-income producing security. |
| (f) | Perpetual security with no stated maturity date. |
| (g) | Stapled Security—A security contractually bound to one or more other securities to form a single saleable unit which cannot be sold separately. |
| (h) | Restricted security as to resale, excluding 144a securities. As of period end, the Fund held restricted securities with a current value of $10,049 and an original cost of $10,049, which was less than 0.05% of its net assets. |
| (i) | Payment-in-kind security which may pay interest/dividends in additional par/shares and/or in cash. Rates shown are the current rate and possible payment rates. |
| (k) | Issuer filed for bankruptcy and/or is in default. |
| (l) | All or a portion of security has been pledged as collateral in connection with outstanding borrowed bonds. |
| (m) | Step-up bond that pays an initial coupon rate for the first period and then a higher coupon rate for the following periods. Rate as of period end. |
| (n) | During the period ended January 31, 2017, investments in issuers considered to be affiliates of the Fund for purposes of Section 2(a)(3) of the Investment Company Act of 1940, as amended, were as follows: |
| | | | | | | | | | | | | | | | | | | | | | | | | | | | | | | | |
| Affiliate | | Shares Held at
July 31, 2016 | | | Shares
Purchased | | | Shares
Sold | | | Shares Held at
January 31, 2017 | | | Value at
January 31, 2017 | | | Income | | | Net
Realized
Gain1 | | | Change in
Unrealized
Appreciation (Depreciation) | |
BlackRock Liquidity | | | | | | | | | | | | | | | | | | | | | | | | | | | | | | | | |
Funds, TempFund, | | | | | | | | | | | | | | | | | | | | | | | | | | | | | | | | |
Institutional Class | | | 15,672,026 | | | | — | | | | (15,672,026 | )2 | | | — | | | | — | | | $ | 5,062 | | | $ | 775 | | | | — | |
BlackRock Liquidity | | | | | | | | | | | | | | | | | | | | | | | | | | | | | | | | |
Funds, T-Fund, | | | | | | | | | | | | | | | | | | | | | | | | | | | | | | | | |
Institutional Class | | | — | | | | 119,347,759 | 3 | | | — | | | | 119,347,759 | | | $ | 119,347,759 | | | | 231,010 | | | | — | | | | — | |
iShares 20+ Year | | | | | | | | | | | | | | | | | | | | | | | | | | | | | | | | |
Treasury Bond ETF | | | — | | | | 72,500 | | | | (72,500 | ) | | | — | | | | — | | | | — | | | | 194,275 | | | | — | |
iShares iBoxx $ High | | | | | | | | | | | | | | | | | | | | | | | | | | | | | | | | |
Yield Corporate Bond | | | | | | | | | | | | | | | | | | | | | | | | | | | | | | | | |
ETF | | | — | | | | 236,152 | | | | (42,404 | ) | | | 193,748 | | | | 16,921,950 | | | | — | | | | 1,191 | | | $ | 2,038 | |
Total | | | | | | | | | | | | | | | | | | $ | 136,269,709 | | | $ | 236,072 | | | $ | 196,241 | | | $ | 2,038 | |
| | | | | | | | | | | | | | | | | | | | |
| | 1 | | Includes net capital gain distributions. |
| | 2 | | Represents net shares sold. |
| | 3 | | Represents net shares purchased. |
See Notes to Financial Statements.
| | | | | | |
| 32 | | BLACKROCK FUNDS | | JANUARY 31, 2017 | | |
| | | | |
| Schedule of Investments (continued) | | | BlackRock Global Long/Short Credit Fund | |
| | | | | | | | | | | | | | | | | | | | | | | | | | | | | | | | |
| Affiliate | | Shares Held at
July 31, 2016 | | | Shares
Purchased | | | Shares
Sold | | | Shares Held at
January 31, 2017 | | | Value at
January 31, 2017 | | | Expense | | | Net
Realized
Gain (Loss) | | | Change in
Unrealized
Appreciation
(Depreciation) | |
iShares iBoxx $ High Yield | | | | | | | | | | | | | | | | | | | | | | | | | | | | | | | | |
Corporate Bond ETF | | | (535,000 | ) | | | 271,000 | | | | (45,000 | ) | | | (309,000 | ) | | $ | (26,988,060 | ) | | $ | (819,400 | ) | | $ | (958,014 | ) | | $ | 101,524 | |
iShares iBoxx $ Investment | | | | | | | | | | | | | | | | | | | | | | | | | | | | | | | | |
Grade Corporate Bond | | | | | | | | | | | | | | | | | | | | | | | | | | | | | | | | |
ETF | | | — | | | | 33,500 | | | | (85,000 | ) | | | (51,500 | ) | | | (6,043,525 | ) | | | (85,477 | ) | | | 117,433 | | | | 219,684 | |
iShares U.S. Preferred Stock | | | | | | | | | | | | | | | | | | | | | | | | | | | | | | | | |
ETF | | | — | | | | 290,000 | | | | (290,000 | ) | | | — | | | | — | | | | (41,978 | ) | | | 25,710 | | | | — | |
Total | | | | | | | | | | | | | | | | | | $ | (33,031,585 | ) | | $ | (946,855 | ) | | $ | (814,871 | ) | | $ | 321,208 | |
| | | | | | | | | | | | | | | | | | | | | | | | | | | | | | | | |
| (o) | Certain agreements have no stated maturity and can be terminated by either party at any time. |
| (p) | The amount to be repurchased assumes the maturity will be the day after the period end. |
| | | | | | | | | | | | | | | | | | | | | | | | | | | | |
Reverse Repurchase Agreements | | | | | | | | | | | | | | | | | | | | | | | | | | | | |
| Counterparty | | Interest
Rate | | | Trade
Date | | | Maturity
Date1 | | | Face Value | | | Face Value
Including
Accrued
Interest | | | Non-Cash Type of Underlying
Collateral | | | Remaining
Contractual
Maturity of the
Agreements | |
RBC Capital Markets, LLC | | | 1.04% | | | | 1/20/17 | | | | Open | | | $ | 33,558,000 | | | $ | 33,569,633 | | | | Corporate Bonds | | | | Open/Demand | |
| | 1 | | Certain agreements have no stated maturity and can be terminated by either party at any time. |
|
| Derivative Financial Instruments Outstanding as of Period End |
| | | | | | | | | | | | | | | | | | |
| | Futures Contracts | | | | | | | | | | | | | |
Contracts
Long (Short) | | | Issue | | | Expiration | | | Notional Value | | | Unrealized
Appreciation
(Depreciation) | |
| | 1,301 | | | | Euro STOXX 50 Index | | | | March 2017 | | | USD | 45,419,485 | | | $ | (656,746 | ) |
| | (657 | ) | | | Euro-Bobl | | | | March 2017 | | | USD | 94,285,724 | | | | (251,444 | ) |
| | 72 | | | | Euro-BTP Italian Government Bond | | | | March 2017 | | | USD | 10,174,901 | | | | 1,891 | |
| | (1,187 | ) | | | Euro-Bund | | | | March 2017 | | | USD | 207,749,026 | | | | (662,612 | ) |
| | (88 | ) | | | Euro-OAT | | | | March 2017 | | | USD | 14,047,131 | | | | 232,707 | |
| | (79 | ) | | | Euro-Schatz | | | | March 2017 | | | USD | 9,570,654 | | | | (11,579 | ) |
| | (154 | ) | | | Long Gilt British | | | | March 2017 | | | USD | 23,997,659 | | | | (79,156 | ) |
| | (282 | ) | | | S&P 500 E-Mini Index | | | | March 2017 | | | USD | 32,070,450 | | | | (82,067 | ) |
| | (96 | ) | | | U.S. Treasury Bonds (30 Year) | | | | March 2017 | | | USD | 14,481,000 | | | | (15,695 | ) |
| | (369 | ) | | | U.S. Treasury Notes (10 Year) | | | | March 2017 | | | USD | 45,928,969 | | | | (53,689 | ) |
| | (78 | ) | | | U.S. Treasury Notes (2 Year) | | | | March 2017 | | | USD | 16,910,156 | | | | (3,549 | ) |
| | (418 | ) | | | U.S. Treasury Notes (5 Year) | | | | March 2017 | | | USD | 49,268,485 | | | | (3,355 | ) |
| | (77 | ) | | | U.S. Ultra Treasury Bonds | | | | March 2017 | | | USD | 12,372,937 | | | | 109,999 | |
| | (100 | ) | | | U.S. Ultra Treasury Notes (10 Year) | | | | March 2017 | | | USD | 13,415,625 | | | | 77,266 | |
| | Total | | | | | | | | | | | | | | | $ | (1,398,029 | ) |
| | | | | | | | | | | | | | | | | | |
|
Forward Foreign Currency Exchange Contracts |
| | | | | | | | | | | | | | | | | | | | |
Currency
Purchased | | | | | Currency
Sold | | | | | Counterparty | | Settlement
Date | | | Unrealized
Appreciation
(Depreciation) | |
| EUR | | | 15,000,000 | | | USD | | | 15,693,601 | | | Bank of New York Mellon | | | 2/03/17 | | | $ | 500,635 | |
| EUR | | | 1,852,000 | | | USD | | | 1,973,677 | | | BNP Paribas S.A. | | | 2/03/17 | | | | 25,772 | |
| EUR | | | 55,000,000 | | | USD | | | 58,870,519 | | | Citibank N.A. | | | 2/03/17 | | | | 508,346 | |
| EUR | | | 548,211,000 | | | USD | | | 584,982,284 | | | Citibank N.A. | | | 2/03/17 | | | | 6,874,930 | |
| EUR | | | 34,350,000 | | | USD | | | 36,599,033 | | | Deutsche Bank AG | | | 2/03/17 | | | | 485,768 | |
| GBP | | | 5,200,000 | | | USD | | | 6,372,600 | | | Bank of New York Mellon | | | 2/03/17 | | | | 169,337 | |
| GBP | | | 118,736,301 | | | USD | | | 148,531,870 | | | Citibank N.A. | | | 2/03/17 | | | | 846,103 | |
See Notes to Financial Statements.
| | | | | | |
| | | BLACKROCK FUNDS | | JANUARY 31, 2017 | | 33 |
| | | | |
| Schedule of Investments (continued) | | | BlackRock Global Long/Short Credit Fund | |
| | | | | | | | | | | | | | | | | | | | | | |
Currency
Purchased | | | | | Currency
Sold | | | | | | Counterparty | | Settlement
Date | | | Unrealized
Appreciation
(Depreciation) | |
| GBP | | | 9,373,000 | | | | USD | | | | 11,486,790 | | | Deutsche Bank AG | | | 2/03/17 | | | $ | 305,053 | |
| USD | | | 362,694 | | | | CNH | | | | 2,551,000 | | | Morgan Stanley & Co. International PLC | | | 2/03/17 | | | | (10,791 | ) |
| USD | | | 15,975,001 | | | | EUR | | | | 15,000,000 | | | Bank of New York Mellon | | | 2/03/17 | | | | (219,235 | ) |
| USD | | | 1,939,285 | | | | EUR | | | | 1,852,000 | | | BNP Paribas S.A. | | | 2/03/17 | | | | (60,163 | ) |
| USD | | | 631,383,985 | | | | EUR | | | | 603,211,000 | | | Citibank N.A. | | | 2/03/17 | | | | (19,852,094 | ) |
| USD | | | 35,964,794 | | | | EUR | | | | 34,350,000 | | | Deutsche Bank AG | | | 2/03/17 | | | | (1,120,006 | ) |
| USD | | | 6,507,800 | | | | GBP | | | | 5,200,000 | | | Bank of New York Mellon | | | 2/03/17 | | | | (34,137 | ) |
| USD | | | 145,563,581 | | | | GBP | | | | 118,736,301 | | | Citibank N.A. | | | 2/03/17 | | | | (3,814,392 | ) |
| USD | | | 11,730,703 | | | | GBP | | | | 9,373,000 | | | Deutsche Bank AG | | | 2/03/17 | | | | (61,139 | ) |
| EUR | | | 31,679,810 | | | | GBP | | | | 27,124,000 | | | JPMorgan Chase Bank N.A. | | | 2/17/17 | | | | 86,852 | |
| EUR | | | 391,522 | | | | USD | | | | 418,815 | | | BNP Paribas S.A. | | | 2/17/17 | | | | 4,080 | |
| EUR | | | 2,074,810 | | | | USD | | | | 2,215,179 | | | BNP Paribas S.A. | | | 2/17/17 | | | | 25,885 | |
| EUR | | | 2,593,512 | | | | USD | | | | 2,785,640 | | | Credit Suisse International | | | 2/17/17 | | | | 15,691 | |
| EUR | | | 1,105,000 | | | | USD | | | | 1,169,138 | | | Deutsche Bank AG | | | 2/17/17 | | | | 24,406 | |
| EUR | | | 19,457,000 | | | | USD | | | | 20,682,793 | | | JPMorgan Chase Bank N.A. | | | 2/17/17 | | | | 333,296 | |
| EUR | | | 1,296,756 | | | | USD | | | | 1,382,583 | | | UBS AG | | | 2/17/17 | | | | 18,082 | |
| GBP | | | 8,399,198 | | | | EUR | | | | 9,622,507 | | | BNP Paribas S.A. | | | 2/17/17 | | | | 175,565 | |
| GBP | | | 1,680,802 | | | | EUR | | | | 1,925,461 | | | Deutsche Bank AG | | | 2/17/17 | | | | 35,288 | |
| USD | | | 5,307,175 | | | | EUR | | | | 5,000,000 | | | Bank of America N.A. | | | 2/17/17 | | | | (93,475 | ) |
| USD | | | 3,241,771 | | | | EUR | | | | 3,014,198 | | | Bank of America N.A. | | | 2/17/17 | | | | (13,955 | ) |
| USD | | | 623,945 | | | | EUR | | | | 585,600 | | | Barclays Bank PLC | | | 2/17/17 | | | | (8,579 | ) |
| USD | | | 7,310,447 | | | | EUR | | | | 6,876,000 | | | Citibank N.A. | | | 2/17/17 | | | | (116,527 | ) |
| USD | | | 1,718,230 | | | | EUR | | | | 1,597,595 | | | Credit Suisse International | | | 2/17/17 | | | | (7,381 | ) |
| USD | | | 5,129,514 | | | | GBP | | | | 4,100,000 | | | Credit Suisse International | | | 2/17/17 | | | | (29,717 | ) |
| USD | | | 26,658,495 | | | | GBP | | | | 21,472,038 | | | JPMorgan Chase Bank N.A. | | | 2/17/17 | | | | (360,825 | ) |
| USD | | | 5,088,391 | | | | GBP | | | | 4,140,000 | | | JPMorgan Chase Bank N.A. | | | 2/17/17 | | | | (121,174 | ) |
| EUR | | | 15,000,000 | | | | USD | | | | 15,992,250 | | | Bank of New York Mellon | | | 3/03/17 | | | | 217,838 | |
| GBP | | | 5,200,000 | | | | USD | | | | 6,511,180 | | | Bank of New York Mellon | | | 3/03/17 | | | | 33,824 | |
| GBP | | | 9,373,000 | | | | USD | | | | 11,736,589 | | | Deutsche Bank AG | | | 3/03/17 | | | | 60,780 | |
| USD | | | 1,975,741 | | | | EUR | | | | 1,852,000 | | | BNP Paribas S.A. | | | 3/03/17 | | | | (25,666 | ) |
| USD | | | 585,593,535 | | | | EUR | | | | 548,211,000 | | | Citibank N.A. | | | 3/03/17 | | | | (6,843,033 | ) |
| USD | | | 36,637,714 | | | | EUR | | | | 34,350,000 | | | Deutsche Bank AG | | | 3/03/17 | | | | (483,388 | ) |
| USD | | | 148,603,824 | | | | GBP | | | | 118,736,301 | | | Citibank N.A. | | | 3/03/17 | | | | (844,168 | ) |
| USD | | | 371,028 | | | | CNH | | | | 2,551,000 | | | Royal Bank of Canada | | | 3/06/17 | | | | (701 | ) |
| USD | | | 1,531,002 | | | | EUR | | | | 1,414,818 | | | JPMorgan Chase Bank N.A. | | | 3/15/17 | | | | 949 | |
| USD | | | 806,633 | | | | HKD | | | | 6,253,000 | | | Morgan Stanley & Co. International PLC | | | 3/15/17 | | | | 342 | |
| USD | | | 881,822 | | | | SGD | | | | 1,250,000 | | | Barclays Bank PLC | | | 3/15/17 | | | | (5,433 | ) |
| Total | | | | | | | | | | | | | | | | | | | | $ | (23,377,157 | ) |
| | | | | | | | | | | | | | | | | | | | | | |
|
Exchange-Traded Options Purchased |
| | | | | | | | | | | | | | | | | | | | | | |
| Description | | Put/
Call | | | Expiration
Date | | | | | Strike
Price | | | Contracts | | | Value | |
CBOE Volatility Index | | | Call | | | 2/15/17 | | | USD | | | | 16.00 | | | | 1,000 | | | $ | 40,000 | |
CBOE Volatility Index | | | Call | | | 2/15/17 | | | USD | | | | 21.00 | | | | 750 | | | | 13,125 | |
Emerson Electric Co. | | | Call | | | 2/17/17 | | | USD | | | | 62.50 | | | | 1,000 | | | | 10,000 | |
Energy Select Sector SPDR ETF | | | Call | | | 2/17/17 | | | USD | | | | 77.00 | | | | 1,500 | | | | 10,500 | |
EURO STOXX 50 Index | | | Call | | | 2/17/17 | | | EUR | | | | 3,325.00 | | | | 743 | | | | 62,562 | |
EURO STOXX 50 Index | | | Call | | | 2/17/17 | | | EUR | | | | 3,350.00 | | | | 743 | | | | 33,687 | |
iShares Barclays 20 Year Treasury Bond ETF | | | Call | | | 2/17/17 | | | USD | | | | 126.00 | | | | 1,350 | | | | 13,500 | |
See Notes to Financial Statements.
| | | | | | |
| 34 | | BLACKROCK FUNDS | | JANUARY 31, 2017 | | |
| | | | |
| Schedule of Investments (continued) | | | BlackRock Global Long/Short Credit Fund | |
| | | | | | | | | | | | |
| Description | | Put/
Call | | Expiration
Date | | Strike Price | | Contracts | | Value |
Micron Technology, Inc. | | Call | | 2/17/17 | | USD | | 25.00 | | 1,500 | | $66,000 |
Microsoft Corp. | | Call | | 2/17/17 | | USD | | 67.00 | | 750 | | 8,250 |
Microsoft Corp. | | Call | | 2/17/17 | | USD | | 65.00 | | 375 | | 23,250 |
PowerShares QQQ Trust, Series 1 ETF | | Call | | 2/17/17 | | USD | | 128.00 | | 4,550 | | 75,075 |
SPDR S&P 500 ETF Trust | | Call | | 2/17/17 | | USD | | 233.00 | | 330 | | 5,940 |
SPDR S&P 500 ETF Trust | | Call | | 2/17/17 | | USD | | 231.00 | | 150 | | 7,275 |
United Technologies Corp. | | Call | | 2/17/17 | | USD | | 120.00 | | 750 | | 2,250 |
AMC Networks, Inc. | | Call | | 3/17/17 | | USD | | 65.00 | | 600 | | 24,000 |
Apple Inc. | | Call | | 3/17/17 | | USD | | 130.00 | | 2,750 | | 130,625 |
Herc Holdings, Inc. | | Call | | 3/17/17 | | USD | | 55.00 | | 750 | | 93,750 |
iShares Barclays 20 Year Treasury Bond ETF | | Call | | 3/17/17 | | USD | | 125.00 | | 750 | | 42,000 |
Microsoft Corp. | | Call | | 3/17/17 | | USD | | 67.50 | | 750 | | 24,750 |
Mylan, Inc. | | Call | | 3/17/17 | | USD | | 40.00 | | 850 | | 83,300 |
SPDR Dow Jones Industrial Average ETF | | Call | | 3/17/17 | | USD | | 205.00 | | 500 | | 21,250 |
Teva Pharmaceutical Industries Ltd. - ADR | | Call | | 3/17/17 | | USD | | 40.00 | | 1,000 | | 12,000 |
Microsoft Corp. | | Call | | 4/21/17 | | USD | | 70.00 | | 1,100 | | 28,600 |
Alere, Inc. | | Call | | 5/19/17 | | USD | | 50.00 | | 850 | | 48,875 |
Alere, Inc. | | Put | | 2/17/17 | | USD | | 32.00 | | 350 | | 1,750 |
Caterpillar, Inc. | | Put | | 2/17/17 | | USD | | 90.00 | | 600 | | 21,600 |
Caterpillar, Inc. | | Put | | 2/17/17 | | USD | | 87.50 | | 500 | | 9,500 |
Chesapeake Energy Corp. | | Put | | 2/17/17 | | USD | | 6.00 | | 3,000 | | 37,500 |
Chesapeake Energy Corp. | | Put | | 2/17/17 | | USD | | 5.00 | | 1,500 | | 1,500 |
EURO STOXX 50 Index | | Put | | 2/17/17 | | EUR | | 3,300.00 | | 1,910 | | 1,641,237 |
Hanesbrands, Inc. | | Put | | 2/17/17 | | USD | | 20.00 | | 250 | | 2,500 |
Health Care SPDR ETF | | Put | | 2/17/17 | | USD | | 69.00 | | 1,000 | | 26,000 |
Herc Holdings, Inc. | | Put | | 2/17/17 | | USD | | 35.00 | | 500 | | 10,000 |
Hewlett Packard Enterprise Co. | | Put | | 2/17/17 | | USD | | 22.00 | | 1,250 | | 31,250 |
Industrial Select Sector SPDR Fund | | Put | | 2/17/17 | | USD | | 60.00 | | 1,150 | | 11,500 |
iShares iBoxx $ High Yield Corporate Bond ETF | | Put | | 2/17/17 | | USD | | 86.00 | | 8,834 | | 225,267 |
iShares iBoxx $ High Yield Corporate Bond ETF | | Put | | 2/17/17 | | USD | | 87.00 | | 4,864 | | 228,608 |
iShares Russell 2000 Index ETF | | Put | | 2/17/17 | | USD | | 132.00 | | 2,000 | | 182,000 |
Qorvo, Inc. | | Put | | 2/17/17 | | USD | | 45.00 | | 500 | | 5,000 |
SPDR S&P 500 ETF Trust | | Put | | 2/17/17 | | USD | | 223.00 | | 1,100 | | 79,750 |
SPDR S&P Metals & Mining ETF | | Put | | 2/17/17 | | USD | | 31.00 | | 750 | | 13,875 |
Western Digital Corp. | | Put | | 2/17/17 | | USD | | 60.00 | | 750 | | 1,875 |
Ally Financial, Inc. | | Put | | 3/17/17 | | USD | | 18.00 | | 1,100 | | 13,750 |
EURO STOXX 50 Index | | Put | | 3/17/17 | | EUR | | 3,325.00 | | 929 | | 1,211,455 |
Financial Select Sector SPDR Fund | | Put | | 3/17/17 | | USD | | 22.00 | | 4,000 | | 76,000 |
Financial Select Sector SPDR Fund | | Put | | 3/17/17 | | USD | | 21.00 | | 2,500 | | 20,000 |
Industrial Select Sector SPDR Fund | | Put | | 3/17/17 | | USD | | 60.00 | | 1,000 | | 37,000 |
iShares iBoxx $ High Yield Corporate Bond ETF | | Put | | 3/17/17 | | USD | | 85.00 | | 1,000 | | 50,500 |
iShares iBoxx $ Investment Grade Corporate Bond ETF | | Put | | 3/17/17 | | USD | | 115.00 | | 1,500 | | 67,500 |
iShares iBoxx $ Investment Grade Corporate Bond ETF | | Put | | 3/17/17 | | USD | | 113.00 | | 800 | | 12,000 |
S&P 500 Index | | Put | | 3/17/17 | | USD | | 2,290.00 | | 244 | | 960,140 |
S&P 500 Index | | Put | | 3/17/17 | | USD | | 2,275.00 | | 133 | | 436,905 |
CONSOL Energy, Inc. | | Put | | 4/21/17 | | USD | | 14.00 | | 1,250 | | 65,625 |
Micron Technology, Inc. | | Put | | 4/21/17 | | USD | | 16.00 | | 1,150 | | 8,050 |
Micron Technology, Inc. | | Put | | 4/21/17 | | USD | | 19.00 | | 750 | | 20,250 |
Western Digital Corp. | | Put | | 4/21/17 | | USD | | 45.00 | | 650 | | 2,600 |
Caterpillar, Inc. | | Put | | 8/18/17 | | USD | | 70.00 | | 750 | | 73,500 |
Total | | | | | | | | | | | | $6,466,551 |
| | | | | | | | | | | | |
See Notes to Financial Statements.
| | | | | | |
| | | BLACKROCK FUNDS | | JANUARY 31, 2017 | | 35 |
| | | | |
| Schedule of Investments (continued) | | | BlackRock Global Long/Short Credit Fund | |
OTC Interest Rate Swaptions Purchased
| | | | | | | | | | | | | | | | | | | | | | | | | | |
| Description | | Counterparty | | Put/
Call | | Exercise Rate | | | Pay/Receive
Exercise Rate | | Floating Rate
Index | | Expiration
Date | | | Notional
Amount (000) | | | Value | |
5-Year Interest Rate Swap | | Barclays Bank PLC | | Put | | | 2.01% | | | Pay | | 3-month LIBOR | | | 2/21/17 | | | USD | | | 34,400 | | | $ | 117,377 | |
7-Year Interest Rate Swap | | Barclays Bank PLC | | Put | | | 2.19% | | | Pay | | 3-month LIBOR | | | 2/21/17 | | | USD | | | 12,400 | | | | 60,093 | |
10-Year Interest Rate Swap | | Citibank N.A. | | Put | | | 2.67% | | | Pay | | 3-month LIBOR | | | 3/15/17 | | | USD | | | 15,000 | | | | 36,255 | |
10-Year Interest Rate Swap | | Citibank N.A. | | Put | | | 2.67% | | | Pay | | 3-month LIBOR | | | 3/15/17 | | | USD | | | 10,000 | | | | 24,170 | |
5-Year Interest Rate Swap | | Citibank N.A. | | Put | | | 2.27% | | | Pay | | 3-month LIBOR | | | 3/15/17 | | | USD | | | 76,000 | | | | 119,657 | |
5-Year Interest Rate Swap | | Citibank N.A. | | Put | | | 2.27% | | | Pay | | 3-month LIBOR | | | 3/15/17 | | | USD | | | 40,000 | | | | 62,978 | |
10-Year Interest Rate Swap | | Citibank N.A. | | Put | | | 2.65% | | | Pay | | 3-month LIBOR | | | 4/13/17 | | | USD | | | 26,500 | | | | 146,519 | |
Total | | | | | | | | | | | | | | | | | | | | | | | | $ | 567,049 | |
| | | | | | | | | | | | | | | | | | | | | | | | | | |
|
| |
| Exchange-Traded Options Written |
| | | | | | | | | | | | | | | | | | |
| Description | | Put/ Call | | Expiration
Date | | | Strike Price | | Contracts | | | Value | |
Health Care SPDR ETF | | Put | | | 2/17/17 | | | USD | | 65.00 | | | 1,000 | | | $ | (4,500 | ) |
iShares iBoxx $ High Yield Corporate Bond ETF | | Put | | | 2/17/17 | | | USD | | 85.00 | | | 1,000 | | | | (12,500 | ) |
iShares iBoxx $ High Yield Corporate Bond ETF | | Put | | | 2/17/17 | | | USD | | 84.00 | | | 2,500 | | | | (35,000 | ) |
iShares iBoxx $ High Yield Corporate Bond ETF | | Put | | | 2/17/17 | | | USD | | 83.00 | | | 4,434 | | | | (62,076 | ) |
iShares Russell 2000 Index ETF | | Put | | | 2/17/17 | | | USD | | 125.00 | | | 2,000 | | | | (37,000 | ) |
SPDR S&P 500 ETF Trust | | Put | | | 2/17/17 | | | USD | | 215.00 | | | 1,100 | | | | (24,750 | ) |
SPDR S&P Metals & Mining ETF | | Put | | | 2/17/17 | | | USD | | 28.00 | | | 750 | | | | (3,750 | ) |
Total | | | | | | | | | | | | | | | | $ | (179,576 | ) |
| | | | | | | | | | | | | | | | | | |
|
| |
| OTC Credit Default Swaptions Written |
| | | | | | | | | | | | | | | | | | |
| Description | | Counterparty | | Put/
Call | | Strike Price | | Pay/Receive
Floating
Rate Index | | Floating Rate
Index | | Credit
Rating1 | | Expiration
Date | | Notional
Amount
(000)2 | | Value |
Bought Protection on | | | | | | | | | | | | | | | | | | |
5-Year Credit Default | | | | | | | | | | iTraxx Crossover | | | | | | | | |
Swaps | | Citibank N.A. | | Call | | 275.00% | | Receive | | Series 26 Version 1 | | B+ | | 2/15/17 | | EUR 123,780 | | $(27,776) |
| | 1 | | Using S&P’s rating of the issuer or the underlying securities of the index, as applicable. |
| | 2 | | The maximum potential amount the Fund may pay should a negative credit event take place as defined under the terms of the agreement. |
|
| |
| Centrally Cleared Credit Default Swaps — Buy Protection |
| | | | | | | | | | | | | | | | | | | | |
| Index | | Pay
Fixed
Rate | | | Expiration
Date | | | Notional Amount (000) | | | Unrealized
Depreciation | |
iTraxx Europe Crossover Series 26 Version 1 | | | 5.00% | | | | 12/20/21 | | | | EUR | | | | 235,799 | | | $ | (3,583,385 | ) |
iTraxx Europe Series 26 Version 1 | | | 1.00% | | | | 12/20/21 | | | | EUR | | | | 23,300 | | | | (51,734 | ) |
CDX.NA.IG Series 27 Version 1 | | | 1.00% | | | | 12/20/21 | | | | USD | | | | 200,000 | | | | (421,977 | ) |
Total | | | | | | | | | | | | | | | | | | $ | (4,057,096 | ) |
| | | | | | | | | | | | | | | | | | | | |
See Notes to Financial Statements.
| | | | | | |
| 36 | | BLACKROCK FUNDS | | JANUARY 31, 2017 | | |
| | |
| Schedule of Investments (continued) | | BlackRock Global Long/Short Credit Fund |
Centrally Cleared Credit Default Swaps — Sell Protection
| | | | | | | | | | | | |
| Index | | Receive
Fixed
Rate | | Expiration
Date | | Credit
Rating1 | | Notional Amount (000)2 | | Unrealized
Appreciation
(Depreciation) |
iTraxx Europe Series 21 Version 1 | | 1.00% | | 6/20/19 | | BBB+ | | EUR | | 22,298 | | $66,484 |
iTraxx Europe Series 25 Version 1 | | 1.00% | | 6/20/21 | | BBB+ | | EUR | | 8,360 | | (8,885) |
iTraxx Financials Series 25 Version 1 | | 1.00% | | 6/20/21 | | A- | | EUR | | 13,790 | | 530,466 |
iTraxx Financials Series 26 Version 1 | | 1.00% | | 12/20/21 | | A- | | EUR | | 18,390 | | 921,065 |
Total | | | | | | | | | | | | $1,509,130 |
| | | | | | | | | | | | |
| | 1 | | Using S&P’s rating of the issuer or the underlying securities of the index, as applicable. |
| | 2 | | The maximum potential amount the Fund may pay should a negative credit event take place as defined under the terms of the agreement. |
Centrally Cleared Interest Rate Swaps
| | | | | | | | | | | | | | | | |
Fixed Rate | | Floating Rate | | Expiration Date | | Notional Amount (000) | | | Unrealized
Appreciation
(Depreciation) | |
1.03%1 | | 3-month LIBOR | | 4/07/17 | | | USD | | | | 8,000 | | | $ | (21,535 | ) |
1.01%1 | | 3-month LIBOR | | 4/28/17 | | | USD | | | | 9,000 | | | | (22,515 | ) |
0.92%1 | | 3-month LIBOR | | 5/16/17 | | | USD | | | | 5,000 | | | | 1,264 | |
1.03%1 | | 3-month LIBOR | | 6/16/17 | | | USD | | | | 3,000 | | | | (499 | ) |
1.30%1 | | 3-month LIBOR | | 9/23/17 | | | USD | | | | 3,250 | | | | (15,261 | ) |
1.10%1 | | 3-month LIBOR | | 1/26/18 | | | USD | | | | 5,700 | | | | 7,376 | |
1.02%1 | | 3-month LIBOR | | 1/30/18 | | | USD | | | | 12,000 | | | | 26,022 | |
1.25%2 | | 3-month LIBOR | | 2/13/18 | | | USD | | | | 3,660 | | | | 14,985 | |
1.24%1 | | 3-month LIBOR | | 5/14/18 | | | USD | | | | 4,000 | | | | 498 | |
1.22%1 | | 3-month LIBOR | | 8/14/18 | | | USD | | | | 6,300 | | | | (8,191 | ) |
1.89%1 | | 3-month LIBOR | | 9/11/19 | | | USD | | | | 5,000 | | | | (67,245 | ) |
1.99%1 | | 3-month LIBOR | | 9/23/19 | | | USD | | | | 7,500 | | | | (118,861 | ) |
1.78%1 | | 3-month LIBOR | | 12/23/19 | | | USD | | | | 6,000 | | | | (24,258 | ) |
1.44%2 | | 3-month LIBOR | | 1/22/20 | | | USD | | | | 2,790 | | | | (19,801 | ) |
1.44%1 | | 3-month LIBOR | | 1/22/20 | | | USD | | | | 2,480 | | | | 17,438 | |
1.67%1 | | 3-month LIBOR | | 2/13/20 | | | USD | | | | 1,930 | | | | (9,489 | ) |
1.69%1 | | 3-month LIBOR | | 2/20/20 | | | USD | | | | 4,000 | | | | (21,033 | ) |
1.69%1 | | 3-month LIBOR | | 5/29/20 | | | USD | | | | 6,000 | | | | 2,586 | |
1.92%1 | | 3-month LIBOR | | 6/12/20 | | | USD | | | | 4,000 | | | | (28,337 | ) |
1.54%1 | | 3-month LIBOR | | 11/04/20 | | | USD | | | | 9,000 | | | | 73,803 | |
2.38%1 | | 3-month LIBOR | | 9/23/21 | | | USD | | | | 1,000 | | | | (27,872 | ) |
1.91%1 | | 3-month LIBOR | | 2/13/22 | | | USD | | | | 2,080 | | | | (7,033 | ) |
1.80%1 | | 3-month LIBOR | | 4/02/22 | | | USD | | | | 3,000 | | | | 13,043 | |
1.92%1 | | 3-month LIBOR | | 1/22/25 | | | USD | | | | 4,230 | | | | 99,493 | |
1.92%1 | | 3-month LIBOR | | 1/22/25 | | | USD | | | | 920 | | | | 21,605 | |
2.01%1 | | 3-month LIBOR | | 10/23/25 | | | USD | | | | 8,200 | | | | 141,414 | |
Total | | | | | | | | | | | | | | $ | 27,597 | |
| | | | | | | | | | | | | | | | |
| | 1 | | Fund pays the fixed rate and receives the floating rate. |
| | 2 | | Fund pays the floating rate and receives the fixed rate. |
|
| |
| OTC Credit Default Swaps — Buy Protection |
| | | | | | | | | | | | | | | | | | | | | | |
| Issuer/Index | | Pay
Fixed
Rate | | Counterparty | | Expiration
Date | | Notional
Amount (000) | | | Value | | Premiums
Paid
(Received) | | Unrealized
Appreciation
(Depreciation) | |
Republic of Ireland | | 1.00% | | Citibank N.A. | | 3/20/17 | | | USD | | | | 500 | | | $(1,112) | | $2,427 | | $ | (3,539 | ) |
Republic of Italy | | 1.00% | | Barclays Bank PLC | | 3/20/18 | | | USD | | | | 6,750 | | | (21,579) | | 93,571 | | | (115,150 | ) |
iTraxx Europe Series 9 3-6% | | 5.00% | | Citibank N.A. | | 6/20/18 | | | EUR | | | | 10,350 | | | (767,577) | | 474,737 | | | (1,242,314 | ) |
iTraxx Financials Series 19 | | | | | | | | | | | | | | | | | | | | | | |
Version 1 | | 1.00% | | Citibank N.A. | | 6/20/18 | | | EUR | | | | 31,100 | | | (336,304) | | (269,733) | | | (66,571 | ) |
Republic of France | | 0.25% | | Barclays Bank PLC | | 6/20/18 | | | USD | | | | 6,590 | | | (11,298) | | 32,718 | | | (44,016 | ) |
See Notes to Financial Statements.
| | | | | | |
| | | BLACKROCK FUNDS | | JANUARY 31, 2017 | | 37 |
| | |
| Schedule of Investments (continued) | | BlackRock Global Long/Short Credit Fund |
| | | | | | | | | | | | | | | | | | | | | | | | | | |
| Issuer/Index | | Pay Fixed Rate | | Counterparty | | Expiration
Date | | Notional
Amount (000) | | | Value | | | Premiums
Paid
(Received) | | | Unrealized
Appreciation
(Depreciation) | |
Republic of France | | 0.25% | | Citibank N.A. | | 6/20/18 | | | USD | | | | 7,125 | | | $ | (12,215 | ) | | $ | 40,064 | | | $ | (52,279 | ) |
Republic of France | | 0.25% | | JPMorgan Chase Bank N.A. | | 6/20/18 | | | USD | | | | 7,135 | | | | (12,233 | ) | | | 30,803 | | | | (43,036 | ) |
Dow Chemical Co. | | 1.00% | | JPMorgan Chase Bank N.A. | | 9/20/18 | | | USD | | | | 5,000 | | | | (70,831 | ) | | | (7,590 | ) | | | (63,241 | ) |
Abbott Laboratories | | 1.00% | | JPMorgan Chase Bank N.A. | | 12/20/18 | | | USD | | | | 15,000 | | | | (233,673 | ) | | | (192,770 | ) | | | (40,903 | ) |
Cardinal Health, Inc. | | 1.00% | | Barclays Bank PLC | | 12/20/18 | | | USD | | | | 15,000 | | | | (263,103 | ) | | | (167,302 | ) | | | (95,801 | ) |
Dell, Inc. | | 1.00% | | Goldman Sachs Bank USA | | 12/20/18 | | | USD | | | | 4,000 | | | | (24,268 | ) | | | 39,287 | | | | (63,555 | ) |
International Business | | | | Goldman Sachs | | | | | | | | | | | | | | | | | | | | | | |
Machines Corp. | | 1.00% | | International | | 12/20/18 | | | USD | | | | 15,000 | | | | (269,975 | ) | | | (167,302 | ) | | | (102,673 | ) |
iTraxx Financials Series 20 | | | | | | | | | | | | | | | | | | | | | | | | | | |
Version 1 | | 1.00% | | Barclays Bank PLC | | 12/20/18 | | | EUR | | | | 17,690 | | | | (230,483 | ) | | | (51,949 | ) | | | (178,534 | ) |
iTraxx Financials Series 20 | | | | | | | | | | | | | | | | | | | | | | | | | | |
Version 1 | | 1.00% | | Citibank N.A. | | 12/20/18 | | | EUR | | | | 37,890 | | | | (493,669 | ) | | | (109,089 | ) | | | (384,580 | ) |
iTraxx Financials Series 20 | | | | | | | | | | | | | | | | | | | | | | | | | | |
Version 1 | | 1.00% | | Citibank N.A. | | 12/20/18 | | | EUR | | | | 22,500 | | | | (293,153 | ) | | | (232,177 | ) | | | (60,976 | ) |
Microsoft Corp. | | 1.00% | | Credit Suisse International | | 12/20/18 | | | USD | | | | 11,841 | | | | (213,197 | ) | | | (127,543 | ) | | | (85,654 | ) |
| | | | Goldman Sachs | | | | | | | | | | | | | | | | | | | | | | |
Microsoft Corp. | | 1.00% | | International | | 12/20/18 | | | USD | | | | 3,159 | | | | (56,874 | ) | | | (34,639 | ) | | | (22,235 | ) |
Sony Corp. | | 1.00% | | JPMorgan Chase Bank N.A. | | 3/20/19 | | | JPY | | | | 2,000,000 | | | | (329,061 | ) | | | 597,187 | | | | (926,248 | ) |
Republic of Portugal | | 1.00% | | BNP Paribas S.A. | | 9/20/19 | | | USD | | | | 12,875 | | | | 291,189 | | | | 199,571 | | | | 91,618 | |
Navient Corp. | | 1.00% | | JPMorgan Chase Bank N.A. | | 12/20/19 | | | USD | | | | 2,000 | | | | 81,543 | | | | 78,292 | | | | 3,251 | |
Southwest Airlines Co. | | 1.00% | | Credit Suisse International | | 12/20/19 | | | USD | | | | 10,000 | | | | (223,082 | ) | | | (95,603 | ) | | | (127,479 | ) |
AT&T Inc. | | 1.00% | | Goldman Sachs Bank USA | | 3/20/20 | | | USD | | | | 30,000 | | | | (469,308 | ) | | | (302,664 | ) | | | (166,644 | ) |
Raytheon Co. | | 1.00% | | Goldman Sachs Bank USA | | 3/20/20 | | | USD | | | | 15,555 | | | | (437,469 | ) | | | (392,847 | ) | | | (44,622 | ) |
Raytheon Co. | | 1.00% | | Goldman Sachs Bank USA | | 3/20/20 | | | USD | | | | 15,485 | | | | (435,500 | ) | | | (390,961 | ) | | | (44,539 | ) |
Boston Scientific Corp. | | 1.00% | | JPMorgan Chase Bank N.A. | | 6/20/20 | | | USD | | | | 15,000 | | | | (385,135 | ) | | | (242,557 | ) | | | (142,578 | ) |
Navient Corp. | | 5.00% | | Citibank N.A. | | 9/20/20 | | | USD | | | | 2,000 | | | | (124,761 | ) | | | 10,969 | | | | (135,730 | ) |
Textron, Inc. | | 1.00% | | JPMorgan Chase Bank N.A. | | 9/20/20 | | | USD | | | | 8,000 | | | | (112,723 | ) | | | (35,143 | ) | | | (77,580 | ) |
AT&T Inc. | | 1.00% | | Credit Suisse International | | 12/20/20 | | | USD | | | | 10,000 | | | | (137,492 | ) | | | 73,681 | | | | (211,173 | ) |
Banco Comercial | | | | | | | | | | | | | | | | | | | | | | | | | | |
Portugues SA | | 5.00% | | BNP Paribas S.A. | | 12/20/20 | | | EUR | | | | 1,284 | | | | 39,945 | | | | (17,494 | ) | | | 57,439 | |
| | | | Goldman Sachs | | | | | | | | | | | | | | | | | | | | | | |
Sprint Nextel Corp. | | 5.00% | | International | | 12/20/20 | | | USD | | | | 4,600 | | | | (446,768 | ) | | | 1,241,686 | | | | (1,688,454 | ) |
VF Corp. | | 1.00% | | BNP Paribas S.A. | | 12/20/20 | | | USD | | | | 3,435 | | | | (60,918 | ) | | | (61,771 | ) | | | 853 | |
21st Century Fox America, | | | | | | | | | | | | | | | | | | | | | | | | | | |
Inc. | | 1.00% | | JPMorgan Chase Bank N.A. | | 6/20/21 | | | USD | | | | 20,000 | | | | (506,085 | ) | | | (464,512 | ) | | | (41,573 | ) |
American Express Co. | | 1.00% | | Citibank N.A. | | 6/20/21 | | | USD | | | | 20,000 | | | | (614,381 | ) | | | (421,281 | ) | | | (193,100 | ) |
American Express Co. | | 1.00% | | Citibank N.A. | | 6/20/21 | | | USD | | | | 16,320 | | | | (501,335 | ) | | | (395,498 | ) | | | (105,837 | ) |
American Express Co. | | 1.00% | | Citibank N.A. | | 6/20/21 | | | USD | | | | 13,680 | | | | (420,237 | ) | | | (337,752 | ) | | | (82,485 | ) |
American International | | | | | | | | | | | | | | | | | | | | | | | | | | |
Group, Inc. | | 1.00% | | Citibank N.A. | | 6/20/21 | | | USD | | | | 15,410 | | | | (191,830 | ) | | | (200,578 | ) | | | 8,748 | |
American International | | | | | | | | | | | | | | | | | | | | | | | | | | |
Group, Inc. | | 1.00% | | JPMorgan Chase Bank N.A. | | 6/20/21 | | | USD | | | | 14,590 | | | | (181,623 | ) | | | (171,020 | ) | | | (10,603 | ) |
| | | | Goldman Sachs | | | | | | | | | | | | | | | | | | | | | | |
Bank of America Corp. | | 1.00% | | International | | 6/20/21 | | | USD | | | | 20,000 | | | | (326,791 | ) | | | 33,925 | | | | (360,716 | ) |
| | | | Goldman Sachs | | | | | | | | | | | | | | | | | | | | | | |
Bank of America N.A. | | 1.00% | | International | | 6/20/21 | | �� | USD | | | | 13,685 | | | | (223,606 | ) | | | 23,490 | | | | (247,096 | ) |
| | | | Goldman Sachs | | | | | | | | | | | | | | | | | | | | | | |
Bank of America N.A. | | 1.00% | | International | | 6/20/21 | | | USD | | | | 11,315 | | | | (184,882 | ) | | | 19,422 | | | | (204,304 | ) |
Cable & Wireless | | | | Goldman Sachs | | | | | | | | | | | | | | | | | | | | | | |
International Finance BV | | 5.00% | | International | | 6/20/21 | | | EUR | | | | 2,620 | | | | (421,083 | ) | | | (296,818 | ) | | | (124,265 | ) |
| | | | Goldman Sachs | | | | | | | | | | | | | | | | | | | | | | |
Citigroup, Inc. | | 1.00% | | International | | 6/20/21 | | | USD | | | | 20,000 | | | | (311,078 | ) | | | 13,316 | | | | (324,394 | ) |
Citigroup, Inc. | | 1.00% | | JPMorgan Chase Bank N.A. | | 6/20/21 | | | USD | | | | 13,685 | | | | (212,855 | ) | | | 29,183 | | | | (242,038 | ) |
Citigroup, Inc. | | 1.00% | | JPMorgan Chase Bank N.A. | | 6/20/21 | | | USD | | | | 11,315 | | | | (175,993 | ) | | | 24,129 | | | | (200,122 | ) |
Goldman Sachs & Co. | | 1.00% | | Bank of America N.A. | | 6/20/21 | | | USD | | | | 15,875 | | | | (146,035 | ) | | | 79,903 | | | | (225,938 | ) |
Goldman Sachs & Co. | | 1.00% | | Citibank N.A. | | 6/20/21 | | | USD | | | | 9,125 | | | | (83,941 | ) | | | 83,519 | | | | (167,460 | ) |
Goldman Sachs Group, | | | | | | | | | | | | | | | | | | | | | | | | | | |
Inc. | | 1.00% | | Bank of America N.A. | | 6/20/21 | | | USD | | | | 20,000 | | | | (183,981 | ) | | | 132,235 | | | | (316,216 | ) |
See Notes to Financial Statements.
| | | | | | |
| 38 | | BLACKROCK FUNDS | | JANUARY 31, 2017 | | |
| | |
| Schedule of Investments (continued) | | BlackRock Global Long/Short Credit Fund |
| | | | | | | | | | | | | | | | | | | | | | | | | | |
| Issuer/Index | | Pay Fixed Rate | | Counterparty | | Expiration
Date | | Notional Amount (000) | | | Value | | | Premiums
Paid
(Received) | | | Unrealized
Appreciation
(Depreciation) | |
| | | | Goldman Sachs | | | | | | | | | | | | | | | | | | | | | | |
Hewlett-Packard Co. | | 1.00% | | International | | 6/20/21 | | | USD | | | | 5,500 | | | $ | (45,570 | ) | | $ | 229,828 | | | $ | (275,398 | ) |
Home Depot, Inc. | | 1.00% | | JPMorgan Chase Bank N.A. | | 6/20/21 | | | USD | | | | 15,000 | | | | (486,670 | ) | | | (465,615 | ) | | | (21,055 | ) |
| | | | Goldman Sachs | | | | | | | | | | | | | | | | | | | | | | |
JPMorgan Chase & Co. | | 1.00% | | International | | 6/20/21 | | | USD | | | | 37,428 | | | | (739,448 | ) | | | (365,377 | ) | | | (374,071 | ) |
Kingdom of Thailand | | 1.00% | | Barclays Bank PLC | | 6/20/21 | | | USD | | | | 1,333 | | | | (21,919 | ) | | | (1,601 | ) | | | (20,318 | ) |
Kingdom of Thailand | | 1.00% | | Citibank N.A. | | 6/20/21 | | | USD | | | | 728 | | | | (11,967 | ) | | | (1,143 | ) | | | (10,824 | ) |
Kingdom of Thailand | | 1.00% | | JPMorgan Chase Bank N.A. | | 6/20/21 | | | USD | | | | 936 | | | | (15,391 | ) | | | (687 | ) | | | (14,704 | ) |
Kingdom of Thailand | | 1.00% | | JPMorgan Chase Bank N.A. | | 6/20/21 | | | USD | | | | 936 | | | | (15,392 | ) | | | (297 | ) | | | (15,095 | ) |
Loews Corp. | | 1.00% | | Citibank N.A. | | 6/20/21 | | | USD | | | | 20,000 | | | | (659,411 | ) | | | (516,637 | ) | | | (142,774 | ) |
Loews Corp. | | 1.00% | | JPMorgan Chase Bank N.A. | | 6/20/21 | | | USD | | | | 15,000 | | | | (489,624 | ) | | | (479,487 | ) | | | (10,137 | ) |
| | | | Goldman Sachs | | | | | | | | | | | | | | | | | | | | | | |
Marriott International, Inc. | | 1.00% | | International | | 6/20/21 | | | USD | | | | 7,615 | | | | (197,095 | ) | | | (95,267 | ) | | | (101,828 | ) |
| | | | Goldman Sachs | | | | | | | | | | | | | | | | | | | | | | |
Marriott International, Inc. | | 1.00% | | International | | 6/20/21 | | | USD | | | | 7,385 | | | | (191,142 | ) | | | (92,389 | ) | | | (98,753 | ) |
Morgan Stanley | | 1.00% | | JPMorgan Chase Bank N.A. | | 6/20/21 | | | USD | | | | 25,000 | | | | (265,205 | ) | | | 228,820 | | | | (494,025 | ) |
Morgan Stanley | | 1.00% | | JPMorgan Chase Bank N.A. | | 6/20/21 | | | USD | | | | 20,000 | | | | (212,164 | ) | | | 107,753 | | | | (319,917 | ) |
Omnicom Group, Inc. | | 1.00% | | JPMorgan Chase Bank N.A. | | 6/20/21 | | | USD | | | | 11,111 | | | | (374,131 | ) | | | (272,532 | ) | | | (101,599 | ) |
Prudential Financial, Inc. | | 1.00% | | Citibank N.A. | | 6/20/21 | | | USD | | | | 11,000 | | | | (143,819 | ) | | | 139,535 | | | | (283,354 | ) |
Republic of Colombia | | 1.00% | | JPMorgan Chase Bank N.A. | | 6/20/21 | | | USD | | | | 2,700 | | | | 37,991 | | | | 125,652 | | | | (87,661 | ) |
Republic of the Philippines | | 1.00% | | Bank of America N.A. | | 6/20/21 | | | USD | | | | 25,000 | | | | (991,136 | ) | | | (912,854 | ) | | | (78,282 | ) |
Staples, Inc. | | 1.00% | | JPMorgan Chase Bank N.A. | | 6/20/21 | | | USD | | | | 13,278 | | | | 395,139 | | | | 675,291 | | | | (280,152 | ) |
| | | | Goldman Sachs | | | | | | | | | | | | | | | | | | | | | | |
Target Corp. | | 1.00% | | International | | 6/20/21 | | | USD | | | | 16,080 | | | | (343,038 | ) | | | (439,326 | ) | | | 96,288 | |
| | | | Goldman Sachs | | | | | | | | | | | | | | | | | | | | | | |
Target Corp. | | 1.00% | | International | | 6/20/21 | | | USD | | | | 6,965 | | | | (148,586 | ) | | | (180,692 | ) | | | 32,106 | |
| | | | Goldman Sachs | | | | | | | | | | | | | | | | | | | | | | |
Target Corp. | | 1.00% | | International | | 6/20/21 | | | USD | | | | 6,955 | | | | (148,372 | ) | | | (186,750 | ) | | | 38,378 | |
Target Corp. | | 1.00% | | JPMorgan Chase Bank N.A. | | 6/20/21 | | | USD | | | | 15,000 | | | | (319,998 | ) | | | (453,085 | ) | | | 133,087 | |
Thai Airways International | | | | | | | | | | | | | | | | | | | | | | | | | | |
PCL | | 1.00% | | BNP Paribas S.A. | | 6/20/21 | | | USD | | | | 1,267 | | | | (20,831 | ) | | | (3,048 | ) | | | (17,783 | ) |
Time Warner, Inc. | | 1.00% | | JPMorgan Chase Bank N.A. | | 6/20/21 | | | USD | | | | 35,000 | | | | (1,003,198 | ) | | | (393,402 | ) | | | (609,796 | ) |
United Mexican States | | 1.00% | | Credit Suisse International | | 6/20/21 | | | USD | | | | 5,000 | | | | 97,210 | | | | 120,884 | | | | (23,674 | ) |
Viacom, Inc. | | 1.00% | | Bank of America N.A. | | 6/20/21 | | | USD | | | | 7,500 | | | | 12,346 | | | | 368,920 | | | | (356,574 | ) |
Walt Disney Co. | | 1.00% | | JPMorgan Chase Bank N.A. | | 6/20/21 | | | USD | | | | 20,000 | | | | (633,434 | ) | | | (595,332 | ) | | | (38,102 | ) |
| | | | Goldman Sachs | | | | | | | | | | | | | | | | | | | | | | |
Wells Fargo & Co. | | 1.00% | | International | | 6/20/21 | | | USD | | | | 15,000 | | | | (350,293 | ) | | | (225,915 | ) | | | (124,378 | ) |
XLIT Ltd. | | 1.00% | | JPMorgan Chase Bank N.A. | | 6/20/21 | | | USD | | | | 15,000 | | | | (350,863 | ) | | | (341,888 | ) | | | (8,975 | ) |
| | | | Goldman Sachs | | | | | | | | | | | | | | | | | | | | | | |
Ally Financial, Inc. | | 5.00% | | International | | 12/20/21 | | | USD | | | | 5,000 | | | | (625,671 | ) | | | (551,623 | ) | | | (74,048 | ) |
| | | | Goldman Sachs | | | | | | | | | | | | | | | | | | | | | | |
Ally Financial, Inc. | | 5.00% | | International | | 12/20/21 | | | USD | | | | 4,400 | | | | (550,590 | ) | | | (409,457 | ) | | | (141,133 | ) |
| | | | Goldman Sachs | | | | | | | | | | | | | | | | | | | | | | |
Avis Budget Group, Inc. | | 5.00% | | International | | 12/20/21 | | | USD | | | | 3,500 | | | | (194,092 | ) | | | (154,515 | ) | | | (39,577 | ) |
Avis Budget Group, Inc. | | 5.00% | | JPMorgan Chase Bank N.A. | | 12/20/21 | | | USD | | | | 4,300 | | | | (238,455 | ) | | | (189,832 | ) | | | (48,623 | ) |
Best Buy Co., Inc. | | 5.00% | | BNP Paribas S.A. | | 12/20/21 | | | USD | | | | 5,250 | | | | (796,132 | ) | | | (738,823 | ) | | | (57,309 | ) |
BNP Paribas SA | | 1.00% | | JPMorgan Chase Bank N.A. | | 12/20/21 | | | EUR | | | | 4,133 | | | | (38,416 | ) | | | (61,203 | ) | | | 22,787 | |
Caterpillar, Inc. | | 1.00% | | Citibank N.A. | | 12/20/21 | | | USD | | | | 2,833 | | | | (56,314 | ) | | | (32,683 | ) | | | (23,631 | ) |
| | | | Goldman Sachs | | | | | | | | | | | | | | | | | | | | | | |
Caterpillar, Inc. | | 1.00% | | International | | 12/20/21 | | | USD | | | | 17,500 | | | | (347,860 | ) | | | (285,446 | ) | | | (62,414 | ) |
| | | | Goldman Sachs | | | | | | | | | | | | | | | | | | | | | | |
Caterpillar, Inc. | | 1.00% | | International | | 12/20/21 | | | USD | | | | 5,667 | | | | (112,647 | ) | | | (65,338 | ) | | | (47,309 | ) |
Caterpillar, Inc. | | 1.00% | | JPMorgan Chase Bank N.A. | | 12/20/21 | | | USD | | | | 17,500 | | | | (347,860 | ) | | | (285,446 | ) | | | (62,414 | ) |
| | | | Morgan Stanley Capital | | | | | | | | | | | | | | | | | | | | | | |
Caterpillar, Inc. | | 1.00% | | Services LLC | | 12/20/21 | | | USD | | | | 10,000 | | | | (198,777 | ) | | | (134,526 | ) | | | (64,251 | ) |
Clariant AG | | 1.00% | | BNP Paribas S.A. | | 12/20/21 | | | EUR | | | | 2,450 | | | | (16,933 | ) | | | (6,377 | ) | | | (10,556 | ) |
Credit Suisse Group AG | | | | | | | | | | | | | | | | | | | | | | | | | | |
ADR | | 1.00% | | Société Générale | | 12/20/21 | | | EUR | | | | 3,400 | | | | 19,079 | | | | 75,760 | | | | (56,681 | ) |
See Notes to Financial Statements.
| | | | | | |
| | | BLACKROCK FUNDS | | JANUARY 31, 2017 | | 39 |
| | |
| Schedule of Investments (continued) | | BlackRock Global Long/Short Credit Fund |
| | | | | | | | | | | | | | | | | | | | | | | | | | | | |
| Issuer/Index | | Pay
Fixed
Rate | | | Counterparty | | Expiration
Date | | Notional
Amount (000) | | | Value | | | Premiums
Paid
(Received) | | | Unrealized
Appreciation
(Depreciation) | |
Ephios Holdco II PLC | | | 5.00 | % | | JPMorgan Chase Bank N.A. | | 12/20/21 | | | EUR | | | | 2,400 | | | $ | (218,960 | ) | | $ | (164,904 | ) | | $ | (54,056 | ) |
HP, Inc. | | | 1.00 | % | | Citibank N.A. | | 12/20/21 | | | USD | | | | 8,500 | | | | (24,246 | ) | | | 97,043 | | | | (121,289 | ) |
Humana, Inc. | | | 1.00 | % | | BNP Paribas S.A. | | 12/20/21 | | | USD | | | | 4,545 | | | | (124,545 | ) | | | (121,856 | ) | | | (2,689 | ) |
Iberdrola SA | | | 1.00 | % | | JPMorgan Chase Bank N.A. | | 12/20/21 | | | EUR | | | | 3,600 | | | | (52,930 | ) | | | (50,548 | ) | | | (2,382 | ) |
Iceland Bondco PLC | | | 5.00 | % | | Citibank N.A. | | 12/20/21 | | | EUR | | | | 1,500 | | | | (50,672 | ) | | | 49,309 | | | | (99,981 | ) |
JPMorgan Chase & Co. | | | 1.00 | % | | Bank of America N.A. | | 12/20/21 | | | USD | | | | 10,000 | | | | (195,022 | ) | | | (167,979 | ) | | | (27,043 | ) |
Ladbrokes PLC | | | 1.00 | % | | JPMorgan Chase Bank N.A. | | 12/20/21 | | | EUR | | | | 1,300 | | | | 141,757 | | | | 147,981 | | | | (6,224 | ) |
Lanxess AG | | | 1.00 | % | | BNP Paribas S.A. | | 12/20/21 | | | EUR | | | | 6,120 | | | | (116,387 | ) | | | (123,392 | ) | | | 7,005 | |
Lanxess AG | | | 1.00 | % | | Citibank N.A. | | 12/20/21 | | | EUR | | | | 6,073 | | | | (115,494 | ) | | | (117,377 | ) | | | 1,883 | |
Louis Dreyfus Commodities BV | | | 5.00 | % | | Goldman Sachs International | | 12/20/21 | | | EUR | | | | 2,934 | | | | (290,035 | ) | | | (201,596 | ) | | | (88,439 | ) |
Marks & Spencer PLC | | | 1.00 | % | | Bank of America N.A. | | 12/20/21 | | | EUR | | | | 6,192 | | | | 170,380 | | | | 130,112 | | | | 40,268 | |
Marks & Spencer PLC | | | 1.00 | % | | Barclays Bank PLC | | 12/20/21 | | | EUR | | | | 7,260 | | | | 199,768 | | | | 165,773 | | | | 33,995 | |
MONITCHEM HOLDCO 3 SA | | | 5.00 | % | | JPMorgan Chase Bank N.A. | | 12/20/21 | | | EUR | | | | 4,370 | | | | (362,981 | ) | | | (88,490 | ) | | | (274,491 | ) |
New Look Senior Issuer PLC | | | 5.00 | % | | JPMorgan Chase Bank N.A. | | 12/20/21 | | | EUR | | | | 12,380 | | | | 2,184,128 | | | | 1,352,051 | | | | 832,077 | |
People’s Republic of China | | | 1.00 | % | | Goldman Sachs International | | 12/20/21 | | | USD | | | | 10,000 | | | | 34,443 | | | | 32,619 | | | | 1,824 | |
People’s Republic of China | | | 1.00 | % | | JPMorgan Chase Bank N.A. | | 12/20/21 | | | USD | | | | 19,600 | | | | 67,508 | | | | 72,891 | | | | (5,383 | ) |
Pizza Express Financing 1 PLC | | | 5.00 | % | | Credit Suisse International | | 12/20/21 | | | EUR | | | | 4,510 | | | | 190,092 | | | | 393,129 | | | | (203,037 | ) |
Republic of South Africa | | | 1.00 | % | | Barclays Bank PLC | | 12/20/21 | | | USD | | | | 440 | | | | 21,124 | | | | 31,490 | | | | (10,366 | ) |
Republic of South Africa | | | 1.00 | % | | BNP Paribas S.A. | | 12/20/21 | | | USD | | | | 17,580 | | | | 844,011 | | | | 1,265,451 | | | | (421,440 | ) |
Republic of South Africa | | | 1.00 | % | | Citibank N.A. | | 12/20/21 | | | USD | | | | 2,070 | | | | 99,380 | | | | 147,288 | | | | (47,908 | ) |
Simon Property Group, Inc. | | | 1.00 | % | | Goldman Sachs International | | 12/20/21 | | | USD | | | | 27,400 | | | | (364,951 | ) | | | (325,662 | ) | | | (39,289 | ) |
Simon Property Group, Inc. | | | 1.00 | % | | Goldman Sachs International | | 12/20/21 | | | USD | | | | 4,855 | | | | (64,666 | ) | | | (48,858 | ) | | | (15,808 | ) |
Simon Property Group, Inc. | | | 1.00 | % | | Goldman Sachs International | | 12/20/21 | | | USD | | | | 2,745 | | | | (36,562 | ) | | | (27,624 | ) | | | (8,938 | ) |
Sol Melia Europe BV | | | 5.00 | % | | JPMorgan Chase Bank N.A. | | 12/20/21 | | | EUR | | | | 4,285 | | | | (906,326 | ) | | | (824,216 | ) | | | (82,110 | ) |
Standard Chartered PLC | | | 1.00 | % | | JPMorgan Chase Bank N.A. | | 12/20/21 | | | EUR | | | | 3,590 | | | | 151,670 | | | | 261,902 | | | | (110,232 | ) |
Statoil ASA | | | 1.00 | % | | BNP Paribas S.A. | | 12/20/21 | | | EUR | | | | 2,500 | | | | (86,157 | ) | | | (59,392 | ) | | | (26,765 | ) |
STMicroelectronics NV | | | 1.00 | % | | Bank of America N.A. | | 12/20/21 | | | EUR | | | | 4,156 | | | | (39,176 | ) | | | 4,957 | | | | (44,133 | ) |
Techem GmbH | | | 5.00 | % | | Credit Suisse International | | 12/20/21 | | | EUR | | | | 2,550 | | | | (466,172 | ) | | | (462,862 | ) | | | (3,310 | ) |
Western Union Co. | | | 1.00 | % | | JPMorgan Chase Bank N.A. | | 12/20/21 | | | USD | | | | 7,640 | | | | (6,368 | ) | | | 35,900 | | | | (42,268 | ) |
Total | | | | | | | | | | | | | | | | | | $ | (21,304,888 | ) | | $ | (7,295,488 | ) | | $ | (14,009,400 | ) |
| | | | | | | | | | | | | | | | | | | | |
|
| OTC Credit Default Swaps — Sell Protection |
| | | | | | | | | | | | | | | | | | | | | | | | | | | | |
| Issuer/Index | | Receive
Fixed
Rate | | Counterparty | | Expiration
Date | | Credit
Rating1 | | Notional
Amount
(000)2 | | | Value | | | Premiums
Paid
(Received) | | | Unrealized
Appreciation
(Depreciation) | |
SAS AB | | 5.00% | | Goldman Sachs International | | 12/20/17 | | Not Rated | | | EUR | | | | 1,325 | | | $ | 15,853 | | | $ | (26,015 | ) | | $ | 41,868 | |
Republic of Italy | | 1.00% | | Barclays Bank PLC | | 3/20/18 | | BBB- | | | EUR | | | | 5,050 | | | | 26,981 | | | | (93,484 | ) | | | 120,465 | |
Republic of Italy | | 1.00% | | Barclays Bank PLC | | 3/20/18 | | BBB- | | | USD | | | | 59 | | | | 189 | | | | (1,072 | ) | | | 1,261 | |
iTraxx Sub Financials Series 19 Version 1 | | 5.00% | | Citibank N.A. | | 6/20/18 | | BBB | | | EUR | | | | 22,500 | | | | 1,524,429 | | | | 1,471,110 | | | | 53,319 | |
iTraxx Sub Financials Series 20 Version 1 | | 5.00% | | Barclays Bank PLC | | 12/20/18 | | BBB | | | EUR | | | | 14,150 | | | | 1,245,591 | | | | 1,584,448 | | | | (338,857 | ) |
iTraxx Sub Financials Series 20 Version 1 | | 5.00% | | Citibank N.A. | | 12/20/18 | | BBB | | | EUR | | | | 20,210 | | | | 1,779,037 | | | | 2,242,574 | | | | (463,537 | ) |
iTraxx Sub Financials Series 20 Version 1 | | 5.00% | | Citibank N.A. | | 12/20/18 | | BBB | | | EUR | | | | 17,400 | | | | 1,531,679 | | | | 1,487,469 | | | | 44,210 | |
iTraxx Sub Financials Series 20 Version 1 | | 5.00% | | Deutsche Bank AG | | 12/20/18 | | BBB | | | EUR | | | | 10,120 | | | | 890,838 | | | | 1,128,069 | | | | (237,231 | ) |
SAS AB | | 5.00% | | Goldman Sachs International | | 6/20/19 | | Not Rated | | | EUR | | | | 4,890 | | | | (111,813 | ) | | | (336,090 | ) | | | 224,277 | |
See Notes to Financial Statements.
| | | | | | |
| 40 | | BLACKROCK FUNDS | | JANUARY 31, 2017 | | |
| | | | |
| Schedule of Investments (continued) | | | BlackRock Global Long/Short Credit Fund | |
| | | | | | | | | | | | | | | | | | | | | | | | | | | | |
| Issuer/Index | | Receive
Fixed
Rate | | Counterparty | | Expiration
Date | | Credit
Rating1 | | Notional
Amount
(000)2 | | | Value | | | Premiums
Paid
(Received) | | | Unrealized
Appreciation
(Depreciation) | |
iTraxx Asia ex-Japan IG Series 24 Version 1 | | 1.00% | | Goldman Sachs International | | 12/20/20 | | A- | | | USD | | | | 3,750 | | | $ | 33,805 | | | $ | (81,399 | ) | | $ | 115,204 | |
Deutsche Bank AG | | 1.00% | | Barclays Bank PLC | | 6/20/21 | | BBB+ | | | EUR | | | | 4,200 | | | | (104,788 | ) | | | (199,490 | ) | | | 94,702 | |
Deutsche Bank AG | | 1.00% | | Barclays Bank PLC | | 6/20/21 | | BBB+ | | | EUR | | | | 1,500 | | | | (37,425 | ) | | | (70,258 | ) | | | 32,833 | |
Deutsche Bank AG | | 1.00% | | BNP Paribas S.A. | | 6/20/21 | | BBB+ | | | EUR | | | | 3,800 | | | | (94,809 | ) | | | (201,112 | ) | | | 106,303 | |
Deutsche Bank AG | | 1.00% | | BNP Paribas S.A. | | 6/20/21 | | BBB+ | | | EUR | | | | 3,119 | | | | (77,818 | ) | | | (155,066 | ) | | | 77,248 | |
Deutsche Bank AG | | 1.00% | | Credit Suisse International | | 6/20/21 | | BBB+ | | | EUR | | | | 11,835 | | | | (295,278 | ) | | | (588,394 | ) | | | 293,116 | |
Deutsche Bank AG | | 1.00% | | JPMorgan Chase Bank N.A. | | 6/20/21 | | BBB+ | | | EUR | | | | 5,046 | | | | (125,895 | ) | | | (255,219 | ) | | | 129,324 | |
Federative Republic of Brazil | | 1.00% | | Citibank N.A. | | 6/20/21 | | BB | | | USD | | | | 2,300 | | | | (111,045 | ) | | | (144,428 | ) | | | 33,383 | |
International Business Machines Corp. | | 1.00% | | Credit Suisse International | | 6/20/21 | | AA- | | | USD | | | | 13,370 | | | | 364,297 | | | | 248,661 | | | | 115,636 | |
International Business Machines Corp. | | 1.00% | | Credit Suisse International | | 6/20/21 | | AA- | | | USD | | | | 10,725 | | | | 292,227 | | | | 208,411 | | | | 83,816 | |
International Business Machines Corp. | | 1.00% | | Goldman Sachs International | | 6/20/21 | | AA- | | | USD | | | | 10,685 | | | | 291,138 | | | | 207,296 | | | | 83,842 | |
International Business Machines Corp. | | 1.00% | | JPMorgan Chase Bank N.A. | | 6/20/21 | | AA- | | | USD | | | | 10,220 | | | | 278,468 | | | | 234,297 | | | | 44,171 | |
Telecom Italia SpA | | 1.00% | | BNP Paribas S.A. | | 6/20/21 | | BB+ | | | EUR | | | | 4,800 | | | | (229,382 | ) | | | (179,358 | ) | | | (50,024 | ) |
Telecom Italia SpA | | 1.00% | | BNP Paribas S.A. | | 6/20/21 | | BB+ | | | EUR | | | | 4,360 | | | | (208,355 | ) | | | (185,410 | ) | | | (22,945 | ) |
Telecom Italia SpA | | 1.00% | | Citibank N.A. | | 6/20/21 | | BB+ | | | EUR | | | | 2,010 | | | | (96,054 | ) | | | (108,194 | ) | | | 12,140 | |
UniCredit SpA | | 1.00% | | Barclays Bank PLC | | 6/20/21 | | BBB- | | | EUR | | | | 4,200 | | | | (116,617 | ) | | | (127,327 | ) | | | 10,710 | |
UniCredit SpA | | 1.00% | | Barclays Bank PLC | | 6/20/21 | | BBB- | | | EUR | | | | 1,500 | | | | (41,649 | ) | | | (46,154 | ) | | | 4,505 | |
Unicredit SpA | | 1.00% | | Citibank N.A. | | 6/20/21 | | BBB- | | | EUR | | | | 10,000 | | | | (277,660 | ) | | | (526,091 | ) | | | 248,431 | |
Unicredit SpA | | 1.00% | | Citibank N.A. | | 6/20/21 | | BBB- | | | EUR | | | | 5,790 | | | | (160,765 | ) | | | (304,615 | ) | | | 143,850 | |
Unicredit SpA | | 1.00% | | Citibank N.A. | | 6/20/21 | | BBB- | | | EUR | | | | 4,300 | | | | (119,393 | ) | | | (244,854 | ) | | | 125,461 | |
UniCredit SpA | | 1.00% | | Citibank N.A. | | 6/20/21 | | BBB- | | | EUR | | | | 2,800 | | | | (77,745 | ) | | | (90,143 | ) | | | 12,398 | |
Anadarko Petroleum Corp. | | 1.00% | | JPMorgan Chase Bank N.A. | | 12/20/21 | | BBB | | | USD | | | | 5,303 | | | | (34,313 | ) | | | (188,179 | ) | | | 153,866 | |
Anadarko Petroleum Corp. | | 1.00% | | JPMorgan Chase Bank N.A. | | 12/20/21 | | BBB | | | USD | | | | 4,697 | | | | (30,393 | ) | | | (176,325 | ) | | | 145,932 | |
Apache Corp. | | 1.00% | | JPMorgan Chase Bank N.A. | | 12/20/21 | | BBB | | | USD | | | | 4,697 | | | | 17,880 | | | | (78,431 | ) | | | 96,311 | |
Banco Santander SA | | 1.00% | | Citibank N.A. | | 12/20/21 | | A- | | | EUR | | | | 9,350 | | | | 1,669 | | | | (84,366 | ) | | | 86,035 | |
Banco Santander SA | | 1.00% | | Citibank N.A. | | 12/20/21 | | A- | | | EUR | | | | 782 | | | | 139 | | | | (4,438 | ) | | | 4,577 | |
Cablevision Systems Corp. | | 5.00% | | Goldman Sachs International | | 12/20/21 | | B- | | | USD | | | | 4,300 | | | | 436,989 | | | | 399,571 | | | | 37,418 | |
Canadian Natural Resources Ltd. | | 1.00% | | JPMorgan Chase Bank N.A. | | 12/20/21 | | BBB+ | | | USD | | | | 5,303 | | | | (42,472 | ) | | | (194,556 | ) | | | 152,084 | |
Centurylink, Inc. | | 1.00% | | Goldman Sachs International | | 12/20/21 | | BB | | | USD | | | | 4,250 | | | | (323,230 | ) | | | (341,848 | ) | | | 18,618 | |
Centurylink, Inc. | | 1.00% | | JPMorgan Chase Bank N.A. | | 12/20/21 | | BB | | | USD | | | | 3,650 | | | | (277,598 | ) | | | (303,440 | ) | | | 25,842 | |
Chesapeake Energy Corp. | | 5.00% | | JPMorgan Chase Bank N.A. | | 12/20/21 | | CCC | | | USD | | | | 4,200 | | | | (87,262 | ) | | | (85,281 | ) | | | (1,981 | ) |
ConocoPhillips Co. | | 1.00% | | JPMorgan Chase Bank N.A. | | 12/20/21 | | A- | | | USD | | | | 4,697 | | | | 39,835 | | | | (70,095 | ) | | | 109,930 | |
Dell, Inc. | | 1.00% | | Goldman Sachs International | | 12/20/21 | | BB- | | | USD | | | | 4,400 | | | | (320,433 | ) | | | (414,142 | ) | | | 93,709 | |
Dell, Inc. | | 1.00% | | Goldman Sachs International | | 12/20/21 | | BB- | | | USD | | | | 4,300 | | | | (313,149 | ) | | | (312,342 | ) | | | (807 | ) |
Dell, Inc. | | 1.00% | | JPMorgan Chase Bank N.A. | | 12/20/21 | | BB- | | | USD | | | | 8,800 | | | | (640,865 | ) | | | (874,679 | ) | | | 233,814 | |
Deutsche Bank AG | | 1.00% | | Barclays Bank PLC | | 12/20/21 | | BBB+ | | | EUR | | | | 1,900 | | | | (59,000 | ) | | | (102,509 | ) | | | 43,509 | |
Deutsche Bank AG | | 1.00% | | BNP Paribas S.A. | | 12/20/21 | | BBB+ | | | EUR | | | | 1,224 | | | | (38,008 | ) | | | (58,363 | ) | | | 20,355 | |
Deutsche Bank AG | | 1.00% | | JPMorgan Chase Bank N.A. | | 12/20/21 | | BBB+ | | | EUR | | | | 1,958 | | | | (60,802 | ) | | | (91,664 | ) | | | 30,862 | |
Deutsche Bank AG | | 1.00% | | JPMorgan Chase Bank N.A. | | 12/20/21 | | BBB+ | | | EUR | | | | 1,548 | | | | (48,070 | ) | | | (72,470 | ) | | | 24,400 | |
See Notes to Financial Statements.
| | | | | | |
| | | BLACKROCK FUNDS | | JANUARY 31, 2017 | | 41 |
| | | | |
| Schedule of Investments (continued) | | | BlackRock Global Long/Short Credit Fund | |
| | | | | | | | | | | | | | | | | | | | | | | | | | | | | | | | | | |
| Issuer/Index | | Receive
Fixed
Rate | | | Counterparty | | Expiration
Date | | | Credit
Rating1 | | | Notional
Amount
(000)2 | | | Value | | | Premiums
Paid
(Received) | | | Unrealized
Appreciation
(Depreciation) | |
Devon Energy Corp. | | | 1.00% | | | Barclays Bank PLC | | | 12/20/21 | | | | BBB | | | | USD | | | | 4,679 | | | $ | (41,911 | ) | | $ | (171,312 | ) | | $ | 129,401 | |
Devon Energy Corp. | | | 1.00% | | | JPMorgan Chase Bank N.A. | | | 12/20/21 | | | | BBB | | | | USD | | | | 5,303 | | | | (47,500 | ) | | | (210,334 | ) | | | 162,834 | |
Hertz Global Holdings, Inc. | | | 5.00% | | | Goldman Sachs International | | | 12/20/21 | | | | B | | | | USD | | | | 8,800 | | | | (340,131 | ) | | | 465,419 | | | | (805,550 | ) |
Hertz Global Holdings, Inc. | | | 5.00% | | | JPMorgan Chase Bank N.A. | | | 12/20/21 | | | | B | | | | USD | | | | 7,900 | | | | (305,341 | ) | | | 412,556 | | | | (717,897 | ) |
UniCredit SpA | | | 1.00% | | | BNP Paribas S.A. | | | 12/20/21 | | | | BBB- | | | | EUR | | | | 2,799 | | | | (101,795 | ) | | | (127,227 | ) | | | 25,432 | |
UniCredit SpA | | | 1.00% | | | JPMorgan Chase Bank N.A. | | | 12/20/21 | | | | BBB- | | | | EUR | | | | 3,700 | | | | (134,555 | ) | | | (200,895 | ) | | | 66,340 | |
Republic of France | | | 0.25% | | | Barclays Bank PLC | | | 6/20/23 | | | | AA | | | | USD | | | | 4,035 | | | | (55,055 | ) | | | (199,348 | ) | | | 144,293 | |
Republic of France | | | 0.25% | | | Citibank N.A. | | | 6/20/23 | | | | AA | | | | USD | | | | 4,350 | | | | (59,352 | ) | | | (226,959 | ) | | | 167,607 | |
Republic of France | | | 0.25% | | | JPMorgan Chase Bank N.A. | | | 6/20/23 | | | | AA | | | | USD | | | | 4,350 | | | | (59,353 | ) | | | (210,888 | ) | | | 151,535 | |
Total | | | | | | | | | | | | | | | | | | | | | | | | $ | 3,063,965 | | | $ | 1,325,617 | | | $ | 1,738,348 | |
| | | | | | | | | | | | | | | | | | | | | | | | | | |
| | 1 | | Using S&P’s rating of the issuer or the underlying securities of the index, as applicable. |
| | 2 | | The maximum potential amount the Fund may pay should a negative credit event take place as defined under the terms of the agreement. |
| | | | | | | | | | | | | | | | | | | | | | | | | | |
| OTC Total Return Swaps | |
| Reference Entity | | Floating Rate | | Counterparty | | Expiration
Date | | Contract
Amount | | | Value | | | Premiums
Paid
(Received) | | | Unrealized
Appreciation
(Depreciation) | |
Micron Technology, Inc. | | 3-month LIBOR minus 0.30%1 | | Bank of America N.A. | | 10/11/17 | | | USD | | | | 60,000 | | | $ | (78,789 | ) | | | — | | | $ | (78,789 | ) |
iShares iBoxx $ High Yield Corporate Bond ETF | | 1-month LIBOR minus 0.50%1 | | Bank of America N.A. | | 10/27/17 | | | USD | | | | 85,000 | | | | (84,278 | ) | | | — | | | | (84,278 | ) |
iShares iBoxx $ High Yield Corporate Bond ETF | | 1-month LIBOR minus 1.55%1 | | Citibank N.A. | | 11/10/17 | | | USD | | | | 50,000 | | | | (7,707 | ) | | | — | | | | (7,707 | ) |
iShares Russell 2000 ETF | | 1-month LIBOR minus 0.60%1 | | Citibank N.A. | | 11/16/17 | | | USD | | | | 25,000 | | | | (20,319 | ) | | | — | | | | (20,319 | ) |
Mallinckrodt PLC | | 3-month LIBOR minus 0.60%1 | | BNP Paribas S.A. | | 11/16/17 | | | USD | | | | 8,000 | | | | 108,666 | | | | — | | | | 108,666 | |
iShares iBoxx $ High Yield Corporate Bond ETF | | 1-month LIBOR minus 1.65%1 | | Citibank N.A. | | 11/17/17 | | | USD | | | | 160,000 | | | | (7,512 | ) | | | — | | | | (7,512 | ) |
iShares iBoxx $ Investment Grade Corporate Bond ETF | | 1-month LIBOR plus 0.25%1 | | BNP Paribas S.A. | | 11/17/17 | | | USD | | | | 65,000 | | | | 12,142 | | | | — | | | | 12,142 | |
iShares Russell 2000 ETF | | 1-month LIBOR minus 0.60%1 | | Citibank N.A. | | 11/17/17 | | | USD | | | | 11,500 | | | | (9,347 | ) | | | — | | | | (9,347 | ) |
iShares U.S. Preferred Stock ETF | | 1-month LIBOR minus 0.45%1 | | Citibank N.A. | | 11/17/17 | | | USD | | | | 175,000 | | | | (20,337 | ) | | | — | | | | (20,337 | ) |
iShares Russell 2000 ETF | | 1-month LIBOR minus 0.50%1 | | Citibank N.A. | | 12/02/17 | | | USD | | | | 37,500 | | | | 11,812 | | | | — | | | | 11,812 | |
Health Care Select Sector SPDR Fund | | 1-month LIBOR plus 0.05%1 | | Citibank N.A. | | 12/07/17 | | | USD | | | | 30,000 | | | | 1,735 | | | | — | | | | 1,735 | |
Ally Financial, Inc. | | 1-month LIBOR minus 0.35%1 | | Citibank N.A. | | 12/21/17 | | | USD | | | | 50,000 | | | | (99,442 | ) | | | — | | | | (99,442 | ) |
Mallinckrodt PLC | | 3-month LIBOR minus 0.30%1 | | Bank of America N.A. | | 1/18/18 | | | USD | | | | 7,500 | | | | (11,043 | ) | | | — | | | | (11,043 | ) |
AVIS Budget Group, Inc. | | 3-month LIBOR minus 0.30%1 | | BNP Paribas S.A. | | 1/20/18 | | | USD | | | | 20,000 | | | | (30,012 | ) | | | — | | | | (30,012 | ) |
Hertz Global Holdings, Inc. | | 3-month LIBOR minus 0.25%1 | | BNP Paribas S.A. | | 1/20/18 | | | USD | | | | 30,000 | | | | (1,568 | ) | | | — | | | | (1,568 | ) |
Chesapeake Energy Corp. | | 3-month LIBOR minus 0.30%1 | | Bank of America N.A. | | 1/23/18 | | | USD | | | | 40,000 | | | | 2,947 | | | | — | | | | 2,947 | |
Caterpillar, Inc. | | 3-month LIBOR minus 0.30%1 | | Merrill Lynch International | | 1/26/18 | | | USD | | | | 10,000 | | | | 13,552 | | | | — | | | | 13,552 | |
See Notes to Financial Statements.
| | | | | | |
| 42 | | BLACKROCK FUNDS | | JANUARY 31, 2017 | | |
| | | | |
| Schedule of Investments (continued) | | | BlackRock Global Long/Short Credit Fund | |
| | | | | | | | | | | | | | | | | | | | | | | | | | | | | | |
| Reference Entity | | Floating Rate | | | Counterparty | | | Expiration
Date | | | Contract
Amount | | | Value | | | Premiums
Paid
(Received) | | Unrealized
Appreciation
(Depreciation) | |
Hewlett Packard Enterprise Co. | | | 3-month LIBOR minus 0.30%1 | | | | Merrill Lynch International | | | | 1/30/18 | | | | USD | | | | 35,000 | | | $ | (22,512 | ) | | — | | $ | (22,512 | ) |
Total | | | | | | | | | | | | | | | | | | | | | | $ | (242,012 | ) | | — | | $ | (242,012 | ) |
| | | | | | | | | | | | | | | | | | | | | | | | |
| | 1 | | Fund pays the total return of the reference entity and receives the floating rate. |
| | | | | | | | | | | | | | | | |
| Reference Entity1 | | Counterparty | | Expiration
Date | | Notional
Amount | | | Unrealized
Depreciation | | | Net Value of
Reference
Entity | |
Equity Securities Long/Short | | Bank of America N.A. | | 4/17/17 | | | USD (2,994,896 | ) | | $ | (526,999 | )2 | | $ | (3,515,864 | ) |
| | 1 | | The Fund receives or pays the total return on a portfolio of long and short positions underlying the total return swap. In addition, the Fund pays or receives a variable rate of interest, based on a specified benchmark, plus or minus a spread in a range of 28-103 basis points. The benchmark and spread are determined based upon the country and/or currency of the individual underlying positions. The following are the specified benchmarks used in determining the variable rate of interest: |
Intercontinental Exchange LIBOR:
EUR 1 Week
GBP 1 Week
| | 2 | | Amount includes $(6,031) of net financing fees. |
The following table represents the individual long and short positions and related values of equity securities underlying the total return swap with Bank of America N.A., as of period end, expiration date 4/17/17:
| | | | | | | | |
| | | Shares | | | Value | |
| Reference Entity — Long | | | | | | |
Eurobank Ergasias SA | | | 2,850,347 | | | $ | 1,730,796 | |
Hellenic Telecommunications Organization SA | | | 579,648 | | | | 5,257,249 | |
National Bank of Greece SA | | | 8,180,513 | | | | 1,957,583 | |
Total Reference Entity — Long | | | | | | | 8,945,628 | |
| | |
| | | | | | | | | |
| | | | | | | | |
| | | Shares | | | Value | |
| Reference Entity — Short | | | | | | | | |
Anglo American PLC | | | (137,822 | ) | | $ | (2,375,825 | ) |
ArcelorMittal | | | (507,031 | ) | | | (3,953,620 | ) |
Deutsche Bank AG | | | (194,709 | ) | | | (3,888,549 | ) |
Tullow Oil PLC | | | (602,063 | ) | | | (2,243,498 | ) |
Total Reference Entity — Short | | | | | | | (12,461,492 | ) |
Net Value of Reference Entity — Bank of America N.A. | | | | | | $ | (3,515,864 | ) |
| | | | | | | | | | | | | | | | | | | | | | | | | | | | |
| Transactions in Options Written for the Six Months Ended January 31, 2017 | |
| | | Calls | | | | | | Puts | |
| | | | | | Notional (000) | | | | | | | | | | | | Notional (000) | | | | |
| | | | | | | | | | | | |
| | | Contracts | | | EUR | | | Premiums
Received | | | | | | Contracts | | | EUR | | | Premiums
Received | |
| | | | | | | | | | | | |
Outstanding options, beginning of year | | | — | | | | 100,600 | | | $ | 869,849 | | | | | | | | 27,000 | | | | 60,300 | | | $ | 1,465,184 | |
Options written | | | 9,150 | | | | 252,180 | | | | 1,318,115 | | | | | | | | 85,830 | | | | — | | | | 2,815,247 | |
Options exercised | | | — | | | | (60,300 | ) | | | (453,475 | ) | | | | | | | — | | | | — | | | | — | |
Options expired | | | (6,425 | ) | | | (168,700 | ) | | | (1,455,062 | ) | | | | | | | (86,596 | ) | | | (60,300 | ) | | | (3,648,105 | ) |
Options closed | | | (2,725 | ) | | | — | | | | (105,387 | ) | | | | | | | (13,450 | ) | | | — | | | | (350,862 | ) |
| | | | | | | | | | | | |
Outstanding options, end of year | | | — | | | | 123,780 | | | $ | 174,040 | | | | | | | | 12,784 | | | | — | | | $ | 281,464 | |
| | | | | | | | | | | | |
See Notes to Financial Statements.
| | | | | | |
| | | BLACKROCK FUNDS | | JANUARY 31, 2017 | | 43 |
| | | | |
| Schedule of Investments (continued) | | | BlackRock Global Long/Short Credit Fund | |
|
| Derivative Financial Instruments Categorized by Risk Exposure |
As of period end, the fair values of derivative financial instruments located in the Statements of Assets and Liabilities were as follows:
| | | | | | | | | | | | | | | | | | | | | | | | | | |
| Assets — Derivative Financial Instruments | | Commodity
Contracts | | Credit
Contracts | | | Equity
Contracts | | | Foreign
Currency
Exchange
Contracts | | | Interest Rate
Contracts | | | Other Contracts | | Total | |
Futures contracts | | Net unrealized appreciation1 | | — | | | — | | | | — | | | | — | | | $ | 421,863 | | | — | | $ | 421,863 | |
Forward foreign currency exchange contracts | | Unrealized appreciation on
forward foreign currency exchange contracts | | — | | | — | | | | — | | | $ | 10,748,822 | | | | — | | | — | | | 10,748,822 | |
Options purchased | | Investments at value — unaffiliated2 | | — | | | — | | | $ | 6,466,551 | | | | — | | | | 567,049 | | | — | | | 7,033,600 | |
Swaps — centrally cleared | | Net unrealized appreciation1 | | — | | $ | 1,518,015 | | | | — | | | | — | | | | 419,527 | | | — | | | 1,937,542 | |
Swaps — OTC | | Unrealized appreciation on OTC swaps;
Swap premiums paid | | — | | | 25,483,119 | | | | 150,854 | | | | — | | | | — | | | — | | | 25,633,973 | |
Total | | | | — | | $ | 27,001,134 | | | $ | 6,617,405 | | | $ | 10,748,822 | | | $ | 1,408,439 | | | — | | $ | 45,775,800 | |
| | | | | | | | | | | | | | | | | | | | | | | | | | |
Liabilities — Derivative Financial Instruments | | | | | | | | | | | | | | | | | | | | | | | | |
Futures contracts | | Net unrealized depreciation1 | | — | | | — | | | $ | 738,813 | | | | — | | | $ | 1,081,079 | | | — | | $ | 1,819,892 | |
Forward foreign currency exchange contracts | | Unrealized depreciation on
forward foreign currency exchange contracts | | — | | | — | | | | — | | | $ | 34,125,979 | | | | — | | | — | | | 34,125,979 | |
Options written | | Options written, at value | | — | | $ | 27,776 | | | | 179,576 | | | | — | | | | — | | | — | | | 207,352 | |
Swaps — centrally cleared | | Net unrealized depreciation1 | | — | | | 4,065,981 | | | | — | | | | — | | | | 391,930 | | | — | | | 4,457,911 | |
Swaps - OTC | | Unrealized depreciation on OTC swaps;
Swap premiums received | | — | | | 43,724,042 | | | | 919,865 | | | | — | | | | — | | | — | | | 44,643,907 | |
Total | | | | — | | $ | 47,817,799 | | | $ | 1,838,254 | | | $ | 34,125,979 | | | $ | 1,473,009 | | | — | | $ | 85,255,041 | |
| | 1 | | Includes cumulative appreciation (depreciation) on futures contracts and centrally cleared swaps, if any, as reported in the Schedule of Investments. Only current day’s variation margin is reported within the Statements of Assets and Liabilities. |
| | 2 | | Includes options purchased at value as reported in the Schedule of Investments. |
For the six months ended January 31, 2017, the effect of derivative financial instruments in the Statements of Operations was as follows:
| | | | | | | | | | | | | | | | | | | | | | | | | | |
| Net Realized Gain (Loss) from: | | Commodity
Contracts | | Credit
Contracts | | | Equity
Contracts | | | Foreign
Currency
Exchange
Contracts | | | Interest
Rate
Contracts | | | Other
Contracts | | | Total | |
Futures contracts | | — | | | — | | | $ | (4,569,452 | ) | | $ | (19 | ) | | $ | 6,864,604 | | | | — | | | $ | 2,295,133 | |
Forward foreign currency exchange contracts | | — | | | — | | | | — | | | | 57,728,658 | | | | — | | | | — | | | | 57,728,658 | |
Options purchased1 | | — | | $ | (1,178,487 | ) | | | (17,545,097 | ) | | | — | | | | 1,190,586 | | | | — | | | | (17,532,998 | ) |
Options written | | — | | | 1,840,819 | | | | 3,174,925 | | | | — | | | | — | | | | — | | | | 5,015,744 | |
Swaps | | — | | | (24,461,397 | ) | | | (5,227,984 | ) | | | — | | | | (558,333 | ) | | | — | | | | (30,247,714 | ) |
Total | | — | | $ | (23,799,065 | ) | | $ | (24,167,608 | ) | | $ | 57,728,639 | | | $ | 7,496,857 | | | | — | | | $ | 17,258,823 | |
1 Options purchased are included in the net realized gain (loss) from investments. | | | | | | | | | | | | | | | | | | | | | | | | |
| Net Change in Unrealized Appreciation (Depreciation) on: | | | | | | | | | | | | | | | | | | | | |
Futures contracts | | — | | | — | | | $ | 2,573,441 | | | | — | | | $ | 15,794,912 | | | | — | | | $ | 18,368,353 | |
Forward foreign currency exchange contracts | | — | | | — | | | | — | | | $ | (20,126,097 | ) | | | — | | | | — | | | | (20,126,097 | ) |
Options purchased1 | | — | | $ | 932,331 | | | | 1,724,648 | | | | — | | | | 482,141 | | | | — | | | | 3,139,120 | |
Options written | | — | | | 586,784 | | | | (611,384 | ) | | | — | | | | — | | | | — | | | | (24,600 | ) |
Swaps | | — | | | (2,233,779 | ) | | | (891,340 | ) | | | — | | | | 2,935,889 | | | | — | | | | (189,230 | ) |
Total | | — | | $ | (714,664 | ) | | $ | 2,795,365 | | | $ | (20,126,097 | ) | | $ | 19,212,942 | | | | — | | | $ | 1,167,546 | |
| | 1 | | Options purchased are included in net change in unrealized appreciation (depreciation) on investments. |
See Notes to Financial Statements.
| | | | | | |
| 44 | | BLACKROCK FUNDS | | JANUARY 31, 2017 | | |
| | | | |
| Schedule of Investments (continued) | | | BlackRock Global Long/Short Credit Fund | |
| | | | |
| Average Quarterly Balances of Outstanding Derivative Financial Instruments | | | | |
| |
Futures contracts: | | | | |
Average notional value of contracts - long | | $ | 27,797,193 | |
Average notional value of contracts - short | | $ | 621,155,338 | |
Forward foreign currency exchange contracts: | | | | |
Average amounts purchased - in USD | | $ | 1,740,905,970 | |
Average amounts sold - in USD | | $ | 951,692,578 | |
Options: | | | | |
Average value of option contracts purchased | | $ | 5,851,960 | |
Average value of option contracts written | | $ | 495,588 | |
Average notional value of swaption contracts purchased | | $ | 184,150,000 | |
Average notional value of swaption contracts written | | $ | 66,810,601 | |
Credit default swaps: | | | | |
Average notional value - buy protection | | $ | 1,826,717,237 | |
Average notional value - sell protection | | $ | 442,879,014 | |
Interest rate swaps: | | | | |
Average notional value - pays fixed rate | | $ | 121,590,000 | |
Average notional value - receives fixed rate | | $ | 6,450,000 | |
Total return swaps: | | | | |
Average notional value | | $ | 45,140,518 | |
For information about the Fund’s investment risks regarding derivative financial instruments, refer to the Notes to Financial Statements.
|
| Derivative Financial Instruments — Offsetting as of Period End |
The Fund’s derivative assets and liabilities (by type) were as follows:
| | | | | | | | |
| | | Assets | | | Liabilities | |
Derivative Financial Instruments: | | | | | | | | |
Futures contracts | | $ | 438,683 | | | $ | 953,701 | |
Forward foreign currency exchange contracts | | | 10,748,822 | | | | 34,125,979 | |
Options | | | 7,033,600 | 1 | | | 207,352 | |
Swaps — Centrally cleared | | | — | | | | 39,729 | |
Swaps — OTC2 | | | 25,633,973 | | | | 44,643,907 | |
Total derivative assets and liabilities in the Statements of Assets and Liabilities | | $ | 43,855,078 | | | $ | 79,970,668 | |
Derivatives not subject to a Master Netting Agreement or similar agreement (“MNA”) | | | (6,905,234 | ) | | | (1,173,006 | ) |
Total derivative assets and liabilities subject to an MNA | | $ | 36,949,844 | | | $ | 78,797,662 | |
| | 1 | | Includes options purchased at value which is included in Investments at value — unaffiliated in the Statements of Assets and Liabilities and reported in the Schedule of Investments. |
| | 2 | | Includes unrealized appreciation (depreciation) on OTC swaps and swap premiums paid/received in the Statements of Assets and Liabilities. |
The following tables present the Fund’s derivative assets and liabilities by counterparty net of amounts for offset under an MNA and net of the related collateral received and pledged by the Fund:
| | | | | | | | | | | | | | | | | | |
| | | Gross Amounts Not Offset in the Statements of Assets and Liabilities
and Subject to an MNA | |
| Counterparty | | Derivative Assets
Subject to an MNA by
Counterparty | | | Derivatives Available
for Offset1 | | | Non-cash
Collateral
Received | | Cash
Collateral
Received2 | | | Net Amount of
Derivative Assets3,4 | |
Bank of America N.A. | | $ | 759,342 | | | $ | (759,342 | ) | | — | | | — | | | | — | |
Bank of New York Mellon | | | 921,634 | | | | (253,372 | ) | | — | | | — | | | $ | 668,262 | |
Barclays Bank PLC | | | 2,701,144 | | | | (2,048,860 | ) | | — | | $ | (590,000 | ) | | | 62,284 | |
BNP Paribas S.A. | | | 2,203,385 | | | | (2,203,385 | ) | | — | | | — | | | | — | |
Citibank N.A. | | | 15,820,591 | | | | (15,820,591 | ) | | — | | | — | | | | — | |
Credit Suisse International | | | 1,553,025 | | | | (1,553,025 | ) | | — | | | — | | | | — | |
Deutsche Bank AG | | | 2,039,364 | | | | (1,901,764 | ) | | — | | | (137,600 | ) | | | — | |
Goldman Sachs Bank USA | | | 39,287 | | | | (39,287 | ) | | — | | | — | | | | — | |
Goldman Sachs International | | | 3,450,104 | | | | (3,450,104 | ) | | — | | | — | | | | — | |
JPMorgan Chase Bank N.A. | | | 7,354,232 | | | | (7,354,232 | ) | | — | | | — | | | | — | |
Merrill Lynch International | | | 13,552 | | | | (13,552 | ) | | — | | | — | | | | — | |
Morgan Stanley & Co. International PLC | | | 342 | | | | (342 | ) | | — | | | — | | | | — | |
Société Générale | | | 75,760 | | | | (56,681 | ) | | — | | | — | | | | 19,079 | |
UBS AG | | | 18,082 | | | | — | | | — | | | — | | | | 18,082 | |
| | | | |
Total | | $ | 36,949,844 | | | $ | (35,454,537 | ) | | — | | $ | (727,600 | ) | | $ | 767,707 | |
| | | | |
See Notes to Financial Statements.
| | | | | | |
| | | BLACKROCK FUNDS | | JANUARY 31, 2017 | | 45 |
| | | | |
| Schedule of Investments (continued) | | | BlackRock Global Long/Short Credit Fund | |
| | | | | | | | | | | | | | | | | | |
| Counterparty | | Derivative Liabilities
Subject to an MNA by
Counterparty | | | Derivatives Available
for Offset1 | | | Non-cash
Collateral
Pledged | | Cash Collateral
Pledged5 | | | Net Amount of
Derivative Liabilities4,6 | |
Bank of America N.A. | | $ | 2,937,558 | | | $ | (759,342 | ) | | — | | $ | (1,800,000 | ) | | $ | 378,216 | |
Bank of New York Mellon | | | 253,372 | | | | (253,372 | ) | | — | | | — | | | | — | |
Barclays Bank PLC | | | 2,048,860 | | | | (2,048,860 | ) | | — | | | — | | | | — | |
BNP Paribas S.A. | | | 2,765,609 | | | | (2,203,385 | ) | | — | | | (562,224 | ) | | | — | |
Citibank N.A. | | | 39,718,859 | | | | (15,820,591 | ) | | — | | | (400,000 | ) | | | 23,498,268 | |
Credit Suisse International | | | 1,965,827 | | | | (1,553,025 | ) | | — | | | (412,802 | ) | | | — | |
Deutsche Bank AG | | | 1,901,764 | | | | (1,901,764 | ) | | — | | | — | | | | — | |
Goldman Sachs Bank USA | | | 1,405,832 | | | | (39,287 | ) | | — | | | (1,366,545 | ) | | | — | |
Goldman Sachs International | | | 11,038,307 | | | | (3,450,104 | ) | | — | | | (7,300,000 | ) | | | 288,203 | |
JPMorgan Chase Bank N.A. | | | 14,472,212 | | | | (7,354,232 | ) | | — | | | (6,580,000 | ) | | | 537,980 | |
Merrill Lynch International | | | 22,512 | | | | (13,552 | ) | | — | | | — | | | | 8,960 | |
Morgan Stanley & Co. International PLC | | | 10,791 | | | | (342 | ) | | — | | | — | | | | 10,449 | |
Morgan Stanley Capital Services LLC | | | 198,777 | | | | — | | | — | | | — | | | | 198,777 | |
Royal Bank of Canada | | | 701 | | | | — | | | — | | | — | | | | 701 | |
Société Générale | | | 56,681 | | | | (56,681 | ) | | — | | | — | | | | — | |
| | | | |
Total | | $ | 78,797,662 | | | $ | (35,454,537 | ) | | — | | $ | (18,421,571 | ) | | $ | 24,921,554 | |
| | | | |
| | 1 | | The amount of derivatives available for offset is limited to the amount of derivative assets and/or liabilities that are subject to an MNA. |
| | 2 | | Excess of collateral received from the individual counterparty is not shown for financial reporting purposes. |
| | 3 | | Net amount represents the net amount receivable from the counterparty in the event of default. |
| | 4 | | Net amount may also include forward foreign currency exchange contracts that are not required to be collateralized. |
| | 5 | | Excess of collateral pledged to the individual counterparty is not shown for financial reporting purposes. |
| | 6 | | Net amount represents the net amount payable due to the counterparty in the event of default. Net amount may be offset further by the options written receivable/payable on the Statements of Assets and Liabilities. |
|
| Fair Value Hierarchy as of Period End |
Various inputs are used in determining the fair value of investments and derivative financial instruments. For information about the Fund’s policy regarding valuation of investments and derivative financial instruments, refer to the Notes to Financial Statements.
The following tables summarize the Fund’s investments and derivative financial instruments categorized in the disclosure hierarchy:
| | | | | | | | | | | | | | | | |
| | | Level 1 | | | Level 2 | | | Level 3 | | | Total | |
Assets: | | | | | | | | | | | | | | | | |
Investments: | | | | | | | | | | | | | | | | |
Long-Term Investments: | | | | | | | | | | | | | | | | |
Asset-Backed Securities | | | — | | | $ | 383,950,514 | | | $ | 11,838,226 | | | $ | 395,788,740 | |
Common Stocks | | $ | 20,022,700 | | | | 2,361,265 | | | | 11,727,903 | | | | 34,111,868 | |
Corporate Bonds | | | — | | | | 2,318,179,409 | | | | 14,909,839 | | | | 2,333,089,248 | |
Floating Rate Loan Interests | | | — | | | | 597,395,260 | | | | 41,290,421 | | | | 638,685,681 | |
Foreign Agency Obligations | | | — | | | | 70,226,021 | | | | — | | | | 70,226,021 | |
Foreign Government Obligations | | | — | | | | 115,968,805 | | | | — | | | | 115,968,805 | |
Investment Companies | | | 16,921,950 | | | | — | | | | — | | | | 16,921,950 | |
Non-Agency Mortgage-Backed Securities | | | — | | | | 69,616,262 | | | | — | | | | 69,616,262 | |
Preferred Securities | | | 38,739,964 | | | | 263,300,713 | | | | 1,333,846 | | | | 303,374,523 | |
U.S. Treasury Obligations | | | — | | | | 36,937,510 | | | | — | | | | 36,937,510 | |
Short-Term Securities: | | | | | | | | | | | | | | | | |
Borrowed Bond Agreements | | | — | | | | 1,059,609,047 | | | | — | | | | 1,059,609,047 | |
Money Market Funds | | | 119,347,759 | | | | — | | | | — | | | | 119,347,759 | |
Options Purchased: | | | | | | | | | | | | | | | | |
Equity contracts | | | 6,466,551 | | | | — | | | | — | | | | 6,466,551 | |
Interest rate contracts | | | — | | | | 567,049 | | | | — | | | | 567,049 | |
Unfunded floating rate loan interests1 | | | — | | | | 5,844 | | | | — | | | | 5,844 | |
Liabilities: | | | | | | | | | | | | | | | | |
Investments: | | | | | | | | | | | | | | | | |
Borrowed Bonds | | | — | | | | (1,016,710,667 | ) | | | — | | | | (1,016,710,667 | ) |
Investments Sold Short | | | (44,182,725 | ) | | | (77,957,965 | ) | | | — | | | | (122,140,690 | ) |
| | | | |
Total | | $ | 157,316,199 | | | $ | 3,823,449,067 | | | $ | 81,100,235 | | | $ | 4,061,865,501 | |
| | | | |
| | 1 | | Unfunded floating rate loan interests are valued at the unrealized appreciation (depreciation) on the commitment. |
See Notes to Financial Statements.
| | | | | | |
| 46 | | BLACKROCK FUNDS | | JANUARY 31, 2017 | | |
| | | | |
| Schedule of Investments (concluded) | | | BlackRock Global Long/Short Credit Fund | |
| | | | | | | | | | | | | | | | |
| | | Level 1 | | | Level 2 | | | Level 3 | | | Total | |
Derivative Financial Instruments1 | | | | | | | | | | | | | | | | |
Assets: | | | | | | | | | | | | | | | | |
Credit contracts | | | — | | | $ | 7,296,799 | | | | — | | | $ | 7,296,799 | |
Equity contracts | | | — | | | | 150,854 | | | | — | | | | 150,854 | |
Foreign currency exchange contracts | | | — | | | | 10,748,822 | | | | — | | | | 10,748,822 | |
Interest rate contracts | | $ | 421,863 | | | | 419,527 | | | | — | | | | 841,390 | |
Liabilities: | | | | | | | | | | | | | | | | |
Credit contracts | | | — | | | | (22,143,593 | ) | | | — | | | | (22,143,593 | ) |
Equity contracts | | | (918,389 | ) | | | (919,865 | ) | | | — | | | | (1,838,254 | ) |
Foreign currency exchange contracts | | | — | | | | (34,125,979 | ) | | | — | | | | (34,125,979 | ) |
Interest rate contracts | | | (1,081,079 | ) | | | (391,930 | ) | | | — | | | | (1,473,009 | ) |
Total | | $ | (1,577,605 | ) | | $ | (38,965,365 | ) | | | — | | | $ | (40,542,970 | ) |
| | | | |
| | 1 | | Derivative financial instruments are swaps, futures contracts, forward foreign currency exchange contracts and options written. Swaps, futures contracts and forward foreign currency exchange contracts are valued at the unrealized appreciation (depreciation) on the instrument and options written are shown at value. |
The Fund may hold assets and/or liabilities in which the fair value approximates the carrying amount or face value, including accrued interest, for financial statement purposes. As of period end, Reverse Repurchase Agreements of $33,569,633 are categorized as Level 2 within the disclosure hierarchy.
During the six months ended January 31, 2017, there were no transfers between Level 1 and Level 2.
A reconciliation of Level 3 investments is presented when the Fund had a significant amount of Level 3 investments at the beginning and/or end of the period in relation to net assets. The following table is a reconciliation of Level 3 investments for which significant unobservable inputs were used in determining fair value:
| | | | | | | | | | | | | | | | | | | | | | | | |
| | | Asset-Backed
Securities | | | Common Stocks | | | Corporate Bonds | | | Floating Rate
Loan Interests | | | Preferred
Securities | | | Total | |
Assets: | | | | | | | | | | | | | | | | | | | | | | | | |
Opening Balance, as of July 31, 2016 | | $ | 37,699,968 | | | $ | 1,284,575 | | | $ | 607 | | | $ | 36,363,366 | | | $ | 1,487,171 | | | $ | 76,835,687 | |
Transfers into Level 3 | | | — | | | | — | | | | 14,631,315 | | | | 7,602,676 | | | | — | | | | 22,233,991 | |
Transfers out of Level 3 | | | (15,000,609 | ) | | | — | | | | — | | | | (4,859,789 | ) | | | — | | | | (19,860,398 | ) |
Accrued discounts/premiums | | | 8,160 | | | | — | | | | 16,429 | | | | 48,360 | | | | — | | | | 72,949 | |
Net realized gain (loss) | | | 225,566 | | | | — | | | | — | | | | 27,525 | | | | — | | | | 253,091 | |
Net change in unrealized appreciation (depreciation)1,2 | | | (916,270 | ) | | | 198,547 | | | | 261,488 | | | | (873,427 | ) | | | (153,325 | ) | | | (1,482,987 | ) |
Purchases | | | 2,182,021 | | | | 10,244,781 | | | | — | | | | 9,674,464 | | | | — | | | | 22,101,266 | |
Sales | | | (12,360,610 | ) | | | — | | | | — | | | | (6,692,754 | ) | | | — | | | | (19,053,364 | ) |
| | | | |
Closing Balance, as of January 31, 2017 | | $ | 11,838,226 | | | $ | 11,727,903 | | | $ | 14,909,839 | | | $ | 41,290,421 | | | $ | 1,333,846 | | | $ | 81,100,235 | |
| | | | |
Net change in unrealized appreciation (depreciation) on investments still held at January 31, 20172 | | $ | (1,393,182 | ) | | $ | 198,547 | | | $ | 261,488 | | | $ | (1,000,842 | ) | | $ | (153,325 | ) | | $ | (2,087,314 | ) |
| | | | |
| | 1 | | Included in the related net change in unrealized appreciation (depreciation) in the Statements of Operations. |
| | 2 | | Any difference between net change in unrealized appreciation (depreciation) and net change in unrealized appreciation (depreciation) on investments still held at January 31, 2017 is generally due to investments no longer held or categorized as Level 3 at period end. |
The Fund’s investments that are categorized as Level 3 were valued utilizing third party pricing information without adjustment. Such valuations are based on unobservable inputs. A significant change in third party information could result in a significantly lower or higher value of such Level 3 investments.
See Notes to Financial Statements.
| | | | | | |
| | | BLACKROCK FUNDS | | JANUARY 31, 2017 | | 47 |
| | |
| Statements of Assets and Liabilities | | |
| | | | | | | | |
| January 31, 2017 (Unaudited) | | BlackRock
Commodity
Strategies Fund1 | | | BlackRock
Global Long/Short
Credit Fund | |
| | | | | | | | |
| Assets | | | | | | | | |
Investments at value — unaffiliated2,3 | | $ | 160,946,692 | | | $ | 5,064,441,305 | |
Investments at value — affiliated4 | | | 3,623,964 | | | | 136,269,709 | |
Cash | | | 2,237,606 | | | | 51,799,762 | |
Cash pledged: | | | | | | | | |
Collateral — OTC derivatives | | | — | | | | 19,180,000 | |
Futures contracts | | | — | | | | 10,788,880 | |
Centrally cleared swaps | | | — | | | | 11,008,760 | |
Foreign currency at value5 | | | 4,881 | | | | 47,003,070 | |
Receivables: | | | | | | | | |
Investments sold | | | 79,399 | | | | 181,345,567 | |
Securities lending income — affiliated | | | 3,615 | | | | — | |
Swaps | | | — | | | | 228,757 | |
Capital shares sold | | | 1,071,942 | | | | 15,137,335 | |
Dividends — affiliated | | | 515 | | | | 26,640 | |
Dividends — unaffiliated | | | 124,040 | | | | 79,794 | |
Interest | | | 83,444 | | | | 32,045,587 | |
From the Manager | | | 30,687 | | | | 4,461 | |
Variation margin on futures contracts | | | — | | | | 438,683 | |
Swap premiums paid | | | — | | | | 19,704,335 | |
Unrealized appreciation on: | | | | | | | | |
Forward foreign currency exchange contracts | | | — | | | | 10,748,822 | |
OTC swaps | | | — | | | | 5,929,638 | |
Unfunded floating rate loan interests | | | — | | | | 5,844 | |
Prepaid expenses | | | 33,331 | | | | 106,150 | |
| | | | |
Total assets | | | 168,240,116 | | | | 5,606,293,099 | |
| | | | |
| | | | | | | | |
| Liabilities | | | | | | | | |
Investments sold short at value — affiliated6 | | | — | | | | 33,031,585 | |
Investments sold short at value — unaffiliated7 | | | — | | | | 89,109,105 | |
Cash received: | | | | | | | | |
Collateral — borrowed bond agreements | | | — | | | | 6,486,000 | |
Collateral — OTC derivatives | | | — | | | | 1,420,000 | |
Borrowed bonds at value8 | | | — | | | | 1,016,710,667 | |
Collateral on securities loaned at value | | | 1,313,714 | | | | — | |
Options written at value9 | | | — | | | | 207,352 | |
Reverse repurchase agreements | | | — | | | | 33,569,633 | |
Payables: | | | | | | | | |
Investments purchased — unaffiliated | | | 2,405,078 | | | | 301,022,641 | |
Administration fees | | | 5,721 | | | | 176,989 | |
Capital shares redeemed | | | 342,037 | | | | 12,790,612 | |
Custodian | | | 10,402 | | | | 283,145 | |
Deferred foreign capital gain tax | | | 1,605 | | | | — | |
Dividends on short sales — unaffiliated | | | — | | | | 27,624 | |
Interest expense | | | — | | | | 9,264,026 | |
Investment advisory fees | | | 102,712 | | | | 3,056,494 | |
Officer’s and Trustees’ fees | | | 4,540 | | | | 36,290 | |
Other accrued expenses | | | 41,855 | | | | 523,658 | |
Other affiliates | | | 584 | | | | 65,446 | |
Professional fees | | | 72,085 | | | | 99,837 | |
Service and distribution fees | | | 12,084 | | | | 250,441 | |
Transfer agent fees | | | 20,479 | | | | 1,448,848 | |
Variation margin on futures contracts | | | — | | | | 953,701 | |
Variation margin on centrally cleared swaps | | | — | | | | 39,729 | |
Swap premiums received | | | — | | | | 25,674,206 | |
Unrealized depreciation on: | | | | | | | | |
Forward foreign currency exchange contracts | | | — | | | | 34,125,979 | |
OTC swaps | | | — | | | | 18,969,701 | |
| | | | |
Total liabilities | | | 4,332,896 | | | | 1,589,343,709 | |
| | | | |
Net Assets | | $ | 163,907,220 | | | $ | 4,016,949,390 | |
| | | | |
1 Consolidated Statement of Assets and Liabilities | | | | | | | | |
2 Investments at cost — unaffiliated | | $ | 137,106,513 | | | $ | 5,131,030,351 | |
3 Securities loaned at value | | $ | 1,083,445 | | | | — | |
4 Investments at cost — affiliated | | $ | 3,623,789 | | | $ | 136,267,671 | |
5 Foreign currency at cost | | $ | 4,839 | | | $ | 45,685,218 | |
6 Proceeds received from investments sold short at value — affiliated | | | — | | | $ | 32,152,552 | |
7 Proceeds received from investments sold short at value — unaffiliated | | | — | | | $ | 88,472,480 | |
8 Proceeds received from borrowed bonds | | | — | | | $ | 1,037,715,637 | |
9 Premiums received | | | — | | | $ | 455,504 | |
See Notes to Financial Statements.
| | | | | | |
| 48 | | BLACKROCK FUNDS | | JANUARY 31, 2017 | | |
| | |
| Statements of Assets and Liabilities (concluded) | | |
| | | | | | | | |
| January 31, 2017 (Unaudited) | | BlackRock
Commodity
Strategies Fund1 | | | BlackRock
Global Long/Short
Credit Fund | |
| | | | | | | | |
| Net Assets Consist of | | | | | | | | |
Paid-in capital | | $ | 318,930,433 | | | $ | 4,383,312,167 | |
Distributions in excess of net investment income | | | (1,108,091 | ) | | | (12,637,720 | ) |
Accumulated net realized loss | | | (177,750,357 | ) | | | (266,436,795 | ) |
Net unrealized appreciation (depreciation) | | | 23,835,235 | | | | (87,288,262 | ) |
| | | | |
Net Assets | | $ | 163,907,220 | | | $ | 4,016,949,390 | |
| | | | |
| | | | | | | | |
| Net Asset Value | | | | | | | | |
Institutional | | | | | | | | |
Net assets | | $ | 123,755,410 | | | $ | 3,486,641,715 | |
| | | | |
Shares outstanding2 | | | 16,158,815 | | | | 341,607,561 | |
| | | | |
Net asset value | | $ | 7.66 | | | $ | 10.21 | |
| | | | |
Investor A | | | | | | | | |
Net assets | | $ | 33,964,396 | | | $ | 332,987,036 | |
| | | | |
Shares outstanding2 | | | 4,472,144 | | | | 32,753,007 | |
| | | | |
Net asset value | | $ | 7.59 | | | $ | 10.17 | |
| | | | |
Investor C | | | | | | | | |
Net assets | | $ | 6,187,414 | | | $ | 165,990,897 | |
| | | | |
Shares outstanding2 | | | 841,443 | | | | 16,603,257 | |
| | | | |
Net asset value | | $ | 7.35 | | | $ | 10.00 | |
| | | | |
Class K | | | | | | | | |
Net assets | | | — | | | $ | 31,329,742 | |
| | | | |
Shares outstanding2 | | | — | | | | 3,065,569 | |
| | | | |
Net asset value | | | — | | | $ | 10.22 | |
| | | | |
| | 1 | | Consolidated Statement of Assets and Liabilities. |
| | 2 | | Unlimited number of shares authorized, $0.001 par value. |
See Notes to Financial Statements.
| | | | | | |
| | | BLACKROCK FUNDS | | JANUARY 31, 2017 | | 49 |
| | | | | | | | |
| Six Months Ended January 31, 2017 (Unaudited) | | BlackRock
Commodity
Strategies Fund1 | | | BlackRock
Global Long/Short
Credit Fund | |
| | | | | | | | |
| Investment Income | | | | | | | | |
Dividends — unaffiliated | | $ | 816,562 | | | $ | 215,539 | |
Dividends — affiliated | | | 2,329 | | | | 236,072 | |
Interest — unaffiliated | | | 231,866 | | | | 96,737,308 | |
Securities lending — affiliated — net | | | 18,000 | | | | — | |
Foreign taxes withheld | | | (35,908 | ) | | | (2,346 | ) |
| | | | |
Total investment income | | | 1,032,849 | | | | 97,186,573 | |
| | | | |
| | | | | | | | |
| Expenses | | | | | | | | |
Investment advisory. | | | 645,563 | | | | 18,375,204 | |
Service and distribution — class specific | | | 63,710 | | | | 1,439,044 | |
Professional | | | 55,799 | | | | 141,434 | |
Transfer agent — class specific | | | 53,978 | | | | 2,203,184 | |
Administration | | | 30,485 | | | | 760,344 | |
Administration — class specific | | | 14,312 | | | | 306,608 | |
Registration | | | 26,226 | | | | 88,558 | |
Accounting services | | | 20,700 | | | | 435,445 | |
Printing | | | 18,148 | | | | 81,334 | |
Officer and Trustees | | | 6,323 | | | | 73,640 | |
Custodian | | | 3,435 | | | | 165,172 | |
Offering | | | — | | | | 27,279 | |
Miscellaneous | | | 16,293 | | | | 146,210 | |
| | | | |
Total expenses excluding interest expense, dividend expense and broker fees and expenses on short sales | | | 954,972 | | | | 24,243,456 | |
Interest expense | | | — | | | | 14,467,273 | |
Dividend expense — affiliated | | | — | | | | 946,855 | |
Dividend expense — unaffiliated | | | — | | | | 160,248 | |
Broker fees and expenses on short sales | | | — | | | | 227,162 | |
| | | | |
Total expenses | | | 954,972 | | | | 40,044,994 | |
Less: | | | | | | | | |
Fees waived by the Manager | | | (114,309 | ) | | | (58,257 | ) |
Administration fees waived — class specific | | | (14,312 | ) | | | (5,385 | ) |
Transfer agent fees waived — class specific | | | (921 | ) | | | (216 | ) |
Transfer agent fees reimbursed — class specific | | | (51,521 | ) | | | (4,460 | ) |
| | | | |
Total expenses after fees waived and/or reimbursed | | | 773,909 | | | | 39,976,676 | |
| | | | |
Net investment income | | | 258,940 | | | | 57,209,897 | |
| | | | |
| | | | | | | | |
| Realized and Unrealized Gain (Loss) | | | | | | | | |
Net realized gain (loss) from: | | | | | | | | |
Investments — unaffiliated | | | 5,416,937 | | | | (34,179,883 | ) |
Investments — affiliated | | | — | | | | 195,466 | |
Borrowed bonds | | | — | | | | (5,488,958 | ) |
Capital gain distributions from investment companies — affiliated | | | 20 | | | | 775 | |
Foreign currency transactions | | | (11,260 | ) | | | 3,407,059 | |
Forward foreign currency exchange contracts | | | — | | | | 57,728,658 | |
Futures contracts | | | — | | | | 2,295,133 | |
Options written | | | — | | | | 5,015,744 | |
Short sales — unaffiliated | | | — | | | | (4,536,195 | ) |
Short sales — affiliated | | | — | | | | (814,871 | ) |
Swaps | | | — | | | | (30,247,714 | ) |
| | | | |
| | | 5,405,697 | | | | (6,624,786 | ) |
| | | | |
Net change in unrealized appreciation (depreciation) on: | | | | | | | | |
Investments — unaffiliated | | | 1,186,089 | 2 | | | 4,349,246 | |
Investments — affiliated | | | 175 | | | | 2,038 | |
Borrowed bonds | | | — | | | | 64,892,647 | |
Foreign currency translations | | | (2,319 | ) | | | (1,018,226 | ) |
Forward foreign currency exchange contracts | | | — | | | | (20,126,097 | ) |
Futures contracts | | | — | | | | 18,368,353 | |
Options written | | | — | | | | (24,600 | ) |
Short sales — unaffiliated | | | — | | | | 1,074,823 | |
Short sales — affiliated | | | — | | | | 321,208 | |
Swaps | | | — | | | | (189,230 | ) |
Unfunded loan commitments | | | — | | | | 5,844 | |
| | | | |
| | | 1,183,945 | | | | 67,656,006 | |
| | | | |
Net realized and unrealized gain. | | | 6,589,642 | | | | 61,031,220 | |
| | | | |
Net Increase in Net Assets Resulting from Operations | | $ | 6,848,582 | | | $ | 118,241,117 | |
| | | | |
| | 1 | | Consolidated Statement of Operations. |
| | 2 | | Net of $1,605 foreign capital gain tax. |
See Notes to Financial Statements.
| | | | | | |
| 50 | | BLACKROCK FUNDS | | JANUARY 31, 2017 | | |
| | |
| Statements of Changes in Net Assets | | |
| | | | | | | | | | | | | | | | |
| | | BlackRock
Commodity
Strategies Fund1 | | | BlackRock
Global Long/Short
Credit Fund | |
| Increase (Decrease) in Net Assets: | | Six Months Ended
January 31, 2017
(Unaudited) | | | Year Ended
July 31,
2016 | | | Six Months Ended
January 31, 2017
(Unaudited) | | | Year Ended
July 31,
2016 | |
| | | | | | | | | | | | | | | | |
| Operations | | | | | | | | | | | | | | | | |
Net investment income (loss) | | $ | 258,940 | | | $ | (25,754 | ) | | $ | 57,209,897 | | | $ | 135,055,647 | |
Net realized gain (loss) | | | 5,405,697 | | | | (68,625,168 | ) | | | (6,624,786 | ) | | | (327,960,405 | ) |
Net change in unrealized appreciation (depreciation) | | | 1,183,945 | | | | 64,080,447 | | | | 67,656,006 | | | | 114,206,273 | |
| | | | | | | | |
Net increase (decrease) in net assets resulting from operations | | | 6,848,582 | | | | (4,570,475 | ) | | | 118,241,117 | | | | (78,698,485 | ) |
| | | | | | | | |
| | | | | | | | | | | | | | | | |
| Distributions to Shareholders2 | | | | | | | | | | | | | | | | |
From net investment income: | | | | | | | | | | | | | | | | |
Institutional | | | (1,046,410 | ) | | | — | | | | — | | | | (221,093,317 | ) |
Investor A | | | (203,610 | ) | | | — | | | | — | | | | (33,094,847 | ) |
Investor C | | | — | | | | — | | | | — | | | | (12,441,201 | ) |
| | | | | | | | |
Decrease in net assets resulting from distributions to shareholders | | | (1,250,020 | ) | | | — | | | | — | | | | (266,629,365 | ) |
| | | | | | | | |
| | | | | | | | | | | | | | | | |
| Capital Share Transactions | | | | | | | | | | | | | | | | |
Net increase (decrease) in net assets derived from capital share
transactions | | | 21,831,233 | | | | (223,850,993 | ) | | | (144,596,809 | ) | | | (1,491,855,673 | ) |
| | | | | | | | |
| | | | | | | | | | | | | | | | |
| Net Assets | | | | | | | | | | | | | | | | |
Total increase (decrease) in net assets | | | 27,429,795 | | | | (228,421,468 | ) | | | (26,355,692 | ) | | | (1,837,183,523 | ) |
Beginning of period | | | 136,477,425 | | | | 364,898,893 | | | | 4,043,305,082 | | | | 5,880,488,605 | |
| | | | | | | | |
End of period | | $ | 163,907,220 | | | $ | 136,477,425 | | | $ | 4,016,949,390 | | | $ | 4,043,305,082 | |
| | | | | | | | |
Distributions in excess of net investment income, at end of period | | $ | (1,108,091 | ) | | $ | (117,011 | ) | | $ | (12,637,720 | ) | | $ | (69,847,617 | ) |
| | | | | | | | |
| | 1 | | Consolidated Statements of Changes in Net Assets. |
| | 2 | | Distributions for annual periods determined in accordance with federal income tax regulations. |
See Notes to Financial Statements.
| | | | | | |
| | | BLACKROCK FUNDS | | JANUARY 31, 2017 | | 51 |
| | | | |
| Consolidated Statement of Cash Flows | | | | |
| | | | |
| Six Months Ended January 31, 2017 (Unaudited) | | BlackRock
Commodity
Strategies Fund | |
| | | | |
| Cash Used for Operating Activities | | | | |
Net increase in net assets resulting from operations | | $ | 6,848,582 | |
Adjustments to reconcile net increase in net assets resulting from operations to net cash used for operating activities: | | | | |
Proceeds from sales of long-term investments | | | 48,429,900 | |
Purchases of long term investments | | | (60,121,485 | ) |
Net purchases of short-term securities | | | (8,861,695 | ) |
Net realized gain on investments and foreign currency translations | | | (5,416,957 | ) |
Net unrealized (gain) loss on investments and foreign currency translations | | | (1,183,512 | ) |
(Increase) decrease in assets: | | | | |
Receivables: | | | | |
Dividends — affiliated | | | 220 | |
Dividends — unaffiliated | | | 4,292 | |
From the Manager | | | (13,089 | ) |
Interest | | | (21,350 | ) |
Securities lending income — affiliated | | | 186 | |
Prepaid expenses | | | (23,215 | ) |
Increase (decrease) in liabilities: | | | | |
Collateral on securities loaned at value | | | 276,976 | |
Payables: | | | | |
Administration fees | | | 804 | |
Custodian | | | 1,989 | |
Deferred foreign capital gain tax | | | 1,605 | |
Investment advisory fees | | | 24,847 | |
Officer’s and Trustees’ fees | | | 528 | |
Other accrued expenses | | | 9,755 | |
Other affiliates | | | (20 | ) |
Professional fees | | | 6,985 | |
Service and distribution fees | | | 2,343 | |
Transfer agent fees | | | (1,386 | ) |
| | | | |
Cash used for operating activities | | | (20,033,697 | ) |
| | | | |
| | | | |
| Cash Provided by Financing Activities | | | | |
Cash dividends paid to shareholders | | | (106,745 | ) |
Payments on redemption of capital shares | | | (34,255,075 | ) |
Decrease in bank overdraft | | | (7,799 | ) |
Proceeds from issuance of capital shares | | | 54,388,917 | |
| | | | |
Cash provided by financing activities | | | 20,019,298 | |
| | | | |
| | | | |
| Cash Impact from Foreign Exchange Fluctuations | | | | |
Cash impact from foreign exchange fluctuations | | | 475 | |
| | | | |
| | | | |
| Cash and Foreign Currency | | | | |
Net decrease in cash and foreign currency at value | | | (13,924 | ) |
Cash and foreign currency at beginning of period | | | 2,256,411 | |
| | | | |
Cash and foreign currency at end of period | | $ | 2,242,487 | |
| | | | |
| | | | |
| Non-Cash Financing Activities | | | | |
Capital shares issued in reinvestment of dividends paid to shareholders | | $ | 1,143,275 | |
| | | | |
See Notes to Financial Statements.
| | | | | | |
| 52 | | BLACKROCK FUNDS | | JANUARY 31, 2017 | | |
| | | | |
| Consolidated Financial Highlights | | | BlackRock Commodity Strategies Fund | |
| | | | | | | | | | | | | | | | | | | | | | | | |
| | | Institutional | |
| | | Six Months
Ended
January 31,
2017 (Unaudited) | | | Year Ended July 31, | | | Period
October 3,
20111 to July 31, 2012 | |
| | | | 2016 | | | 2015 | | | 2014 | | | 2013 | | |
| Per Share Operating Performance | | | | | | | | | | | | | | | | | | | | | | | | |
Net asset value, beginning of period | | $ | 7.36 | | | $ | 6.98 | | | $ | 9.89 | | | $ | 9.17 | | | $ | 9.93 | | | $ | 10.00 | |
| | | | |
Net investment income (loss)2 | | | 0.02 | 3 | | | 0.00 | 3 | | | 0.00 | 3 | | | (0.02 | ) | | | (0.03 | ) | | | (0.01 | ) |
Net realized and unrealized gain (loss) | | | 0.35 | | | | 0.38 | | | | (2.91 | ) | | | 0.74 | | | | (0.73 | ) | | | 0.22 | |
| | | | |
Net increase (decrease) from investment operations | | | 0.37 | | | | 0.38 | | | | (2.91 | ) | | | 0.72 | | | | (0.76 | ) | | | 0.21 | |
| | | | |
Distributions:4 | | | | | | | | | | | | | | | | | | | | | | | | |
From net investment income | | | (0.07 | ) | | | — | | | | (0.00 | )5 | | | — | | | | (0.00 | )5 | | | (0.01 | ) |
From net realized gain | | | — | | | | — | | | | — | | | | — | | | | — | | | | (0.27 | ) |
| | | | |
Total distributions | | | (0.07 | ) | | | — | | | | (0.00 | )5 | | | — | | | | (0.00 | )5 | | | (0.28 | ) |
| | | | |
Net asset value, end of period | | $ | 7.66 | | | $ | 7.36 | | | $ | 6.98 | | | $ | 9.89 | | | $ | 9.17 | | | $ | 9.93 | |
| | | | |
| | | | | | | | | | | | | | | | | | | | | | | | |
| Total Return6 | | | | | | | | | | | | | | | | | | | | | | | | |
Based on net asset value | | | 5.05 | %7 | | | 5.44 | % | | | (29.41 | )% | | | 7.85 | % | | | (7.63 | )% | | | 2.00 | %7 |
| | | | |
| | | | | | | | | | | | | | | | | | | | | | | | |
| Ratios to Average Net Assets | | | | | | | | | | | | | | | | | | | | | | | | |
Total expenses8 | | | 1.19 | %9 | | | 1.39 | % | | | 1.33 | % | | | 1.33 | % | | | 1.38 | % | | | 1.87 | %9,10 |
| | | | |
Total expenses excluding recoupment of past waived and/or reimbursed fees8 | | | 1.19 | %9 | | | 1.39 | % | | | 1.33 | % | | | 1.33 | % | | | 1.38 | % | | | 1.87 | %9,10 |
| | | | |
Total expenses after fees waived and/or reimbursed8 | | | 0.99 | %9 | | | 1.26 | % | | | 1.28 | % | | | 1.29 | % | | | 1.29 | % | | | 1.30 | %9 |
| | | | |
Net investment income (loss)8 | | | 0.45 | %9 | | | 0.05 | % | | | 0.00 | %11 | | | (0.22 | )% | | | (0.24 | )% | | | (0.08 | )%9 |
| | | | |
| | | | | | | | | | | | | | | | | | | | | | | | |
| Supplemental Data | | | | | | | | | | | | | | | | | | | | | | | | |
Net assets, end of period (000) | | $ | 123,755 | | | $ | 107,021 | | | $ | 348,529 | | | $ | 413,506 | | | $ | 378,747 | | | $ | 62,974 | |
| | | | |
Portfolio turnover rate | | | 48 | % | | | 132 | % | | | 85 | % | | | 71 | % | | | 63 | % | | | 127 | % |
| | | | |
| | 1 | | Commencement of operations. |
| | 2 | | Based on average shares outstanding. |
| | 3 | | Amount is less than $0.005 per share. |
| | 4 | | Distributions for annual periods determined in accordance with federal income tax regulations. |
| | 5 | | Amount is greater than $(0.005) per share. |
| | 6 | | Where applicable, assumes the reinvestment of distributions. |
| | 7 | | Aggregate total return. |
| | 8 | | Excludes expenses incurred indirectly as a result of investments in underlying funds as follows: |
| | | | | | | | | | | | | | | | | | | | | | | | |
| | | Six Months
Ended
January 31,
2017 (Unaudited) | | | Year Ended July 31, | | | Period
October 3,
20111 to July 31, 2012 | |
| | | | 2016 | | | 2015 | | | 2014 | | | 2013 | | |
Investments in underlying funds | | | 0.02 | % | | | 0.01 | % | | | 0.01 | % | | | 0.05 | % | | | 0.01 | % | | | — | |
| | 10 | | Organization costs were not annualized in the calculation of the expense ratios. If these expenses were annualized, the total expenses would have been 1.89%. |
| | 11 | | Amount is less than 0.005%. |
See Notes to Financial Statements.
| | | | | | |
| | | BLACKROCK FUNDS | | JANUARY 31, 2017 | | 53 |
| | | | |
| Consolidated Financial Highlights (continued) | | | BlackRock Commodity Strategies Fund | |
| | | | | | | | | | | | | | | | | | | | | | | | |
| | | Investor A | |
| | | Six Months
Ended
January 31,
2017
(Unaudited) | | | Year Ended July 31, | | | Period
October 3,
20111 to July 31, 2012 | |
| | | | 2016 | | | 2015 | | | 2014 | | | 2013 | | |
| Per Share Operating Performance | | | | | | | | | | | | | | | | | | | | | | | | |
Net asset value, beginning of period | | $ | 7.29 | | | $ | 6.94 | | | $ | 9.85 | | | $ | 9.15 | | | $ | 9.93 | | | $ | 10.00 | |
| | | | |
Net investment income (loss)2 | | | 0.01 | | | | (0.02 | ) | | | (0.02 | ) | | | (0.04 | ) | | | (0.04 | ) | | | (0.02 | ) |
Net realized and unrealized gain (loss) | | | 0.35 | | | | 0.37 | | | | (2.89 | ) | | | 0.74 | | | | (0.74 | ) | | | 0.22 | |
| | | | |
Net increase (decrease) from investment operations | | | 0.36 | | | | 0.35 | | | | (2.91 | ) | | | 0.70 | | | | (0.78 | ) | | | 0.20 | |
| | | | |
Distributions:3 | | | | | | | | | | | | | | | | | | | | | | | | |
From net investment income | | | (0.06 | ) | | | — | | | | — | | | | — | | | | — | | | | (0.00 | )4 |
From net realized gain | | | — | | | | — | | | | — | | | | — | | | | — | | | | (0.27 | ) |
| | | | |
Total distributions | | | (0.06 | ) | | | — | | | | — | | | | — | | | | — | | | | (0.27 | ) |
| | | | |
Net asset value, end of period | | $ | 7.59 | | | $ | 7.29 | | | $ | 6.94 | | | $ | 9.85 | | | $ | 9.15 | | | $ | 9.93 | |
| | | | |
| | | | | | | | | | | | | | | | | | | | | | | | |
| Total Return5 | | | | | | | | | | | | | | | | | | | | | | | | |
Based on net asset value | | | 4.89 | %6 | | | 5.04 | % | | | (29.54 | )% | | | 7.65 | % | | | (7.86 | )% | | | 1.97 | %6 |
| | | | |
| | | | | | | | | | | | | | | | | | | | | | | | |
| Ratios to Average Net Assets | | | | | | | | | | | | | | | | | | | | | | | | |
Total expenses7 | | | 1.66 | %8 | | | 1.97 | % | | | 1.85 | % | | | 1.78 | % | | | 1.79 | % | | | 2.08 | %8,9 |
| | | | |
Total expenses excluding recoupment of past waived and/or reimbursed fees7 | | | 1.66 | %8 | | | 1.97 | % | | | 1.85 | % | | | 1.78 | % | | | 1.79 | % | | | 2.08 | %8,9 |
| | | | |
Total expenses after fees waived and/or reimbursed7 | | | 1.24 | %8 | | | 1.45 | % | | | 1.50 | % | | | 1.50 | % | | | 1.50 | % | | | 1.50 | %8 |
| | | | |
Net investment income (loss)7 | | | 0.20 | %8 | | | (0.33 | )% | | | (0.23 | )% | | | (0.43 | )% | | | (0.39 | )% | | | (0.26 | )%8 |
| | | | |
| | | | | | | | | | | | | | | | | | | | | | | | |
| Supplemental Data | | | | | | | | | | | | | | | | | | | | | | | | |
Net assets, end of period (000) | | $ | 33,964 | | | $ | 23,652 | | | $ | 11,308 | | | $ | 21,402 | | | $ | 17,399 | | | $ | 15,274 | |
| | | | |
Portfolio turnover rate | | | 48 | % | | | 132 | % | | | 85 | % | | | 71 | % | | | 63 | % | | | 127 | % |
| | | | |
| | 1 | | Commencement of operations. |
| | 2 | | Based on average shares outstanding. |
| | 3 | | Distributions for annual periods determined in accordance with federal income tax regulations. |
| | 4 | | Amount is greater than $(0.005) per share. |
| | 5 | | Where applicable, excludes the effects of any sales charges and assumes the reinvestment of distributions. |
| | 6 | | Aggregate total return. |
| | 7 | | Excludes expenses incurred indirectly as a result of investments in underlying funds as follows: |
| | | | | | | | | | | | | | | | | | | | | | | | |
| | | Six Months Ended
January 31, 2017 (Unaudited) | | | Year Ended July 31, | | | Period October 3, 20111 to July 31, 2012 | |
| | | | 2016 | | | 2015 | | | 2014 | | | 2013 | | |
Investments in underlying funds | | | 0.02% | | | | 0.01 | % | | | 0.01 | % | | | 0.05 | % | | | 0.01 | % | | | — | |
| | 9 | | Organization costs were not annualized in the calculation of the expense ratios. If these expenses were annualized, the total expenses would have been 2.08%. |
See Notes to Financial Statements.
| | | | | | |
| 54 | | BLACKROCK FUNDS | | JANUARY 31, 2017 | | |
| | | | |
| Consolidated Financial Highlights (concluded) | | | BlackRock Commodity Strategies Fund | |
| | | | | | | | | | | | | | | | | | | | | | | | |
| | | Investor C | |
| | | Six Months
Ended
January 31,
2017 (Unaudited) | | | Year Ended July 31, | | | Period
October 3,
20111 to July 31, 2012 | |
| | | | 2016 | | | 2015 | | | 2014 | | | 2013 | | |
| Per Share Operating Performance | | | | | | | | | | | | | | | | | | | | | | | | |
Net asset value, beginning of period | | $ | 7.04 | | | $ | 6.74 | | | $ | 9.64 | | | $ | 9.02 | | | $ | 9.87 | | | | $10.00 | |
| | | | |
Net investment loss2 | | | (0.02 | ) | | | (0.07 | ) | | | (0.08 | ) | | | (0.11 | ) | | | (0.11 | ) | | | (0.08 | ) |
Net realized and unrealized gain (loss) | | | 0.33 | | | | 0.37 | | | | (2.82 | ) | | | 0.73 | | | | (0.74 | ) | | | 0.22 | |
| | | | |
Net increase (decrease) from investment operations | | | 0.31 | | | | 0.30 | | | | (2.90 | ) | | | 0.62 | | | | (0.85 | ) | | | 0.14 | |
| | | | |
Distributions from net realized gain3 | | | — | | | | — | | | | — | | | | — | | | | — | | | | (0.27 | ) |
| | | | |
Net asset value, end of period | | $ | 7.35 | | | $ | 7.04 | | | $ | 6.74 | | | $ | 9.64 | | | $ | 9.02 | | | | $ 9.87 | |
| | | | |
| | | | | | | | | | | | | | | | | | | | | | | | |
| Total Return4 | | | | | | | | | | | | | | | | | | | | | | | | |
Based on net asset value | | | 4.40 | %5 | | | 4.45 | % | | | (30.08 | )% | | | 6.87 | % | | | (8.61 | )% | | | 1.29 | %5 |
| | | | |
| | | | | | | | | | | | | | | | | | | | | | | | |
| Ratios to Average Net Assets | | | | | | | | | | | | | | | | | | | | | | | | |
Total expenses6 | | | 2.42 | %7 | | | 2.68 | % | | | 2.50 | % | | | 2.43 | % | | | 2.49 | % | | | 2.85 | %7,8 |
| | | | |
Total expenses excluding recoupment of past waived and/or reimbursed fees6 | | | 2.42 | %7 | | | 2.68 | % | | | 2.50 | % | | | 2.43 | % | | | 2.49 | % | | | 2.85 | %7,8 |
| | | | |
Total expenses after fees waived and/or reimbursed6 | | | 1.99 | %7 | | | 2.21 | % | | | 2.25 | % | | | 2.25 | % | | | 2.25 | % | | | 2.24 | %7 |
| | | | |
Net investment loss6 | | | (0.53 | )%7 | | | (1.03 | )% | | | (0.99 | )% | | | (1.17 | )% | | | (1.14 | )% | | | (0.97 | )%7 |
| | | | |
| | | | | | | | | | | | | | | | | | | | | | | | |
| Supplemental Data | | | | | | | | | | | | | | | | | | | | | | | | |
Net assets, end of period (000) | | $ | 6,187 | | | $ | 5,804 | | | $ | 5,062 | | | $ | 9,443 | | | $ | 10,332 | | | | $8,651 | |
| | | | |
Portfolio turnover rate | | | 48 | % | | | 132 | % | | | 85 | % | | | 71 | % | | | 63 | % | | | 127 | % |
| | | | |
| | 1 | | Commencement of operations. |
| | 2 | | Based on average shares outstanding. |
| | 3 | | Distributions for annual periods determined in accordance with federal income tax regulations. |
| | 4 | | Where applicable, excludes the effects of any sales charges and assumes the reinvestment of distributions. |
| | 5 | | Aggregate total return. |
| | 6 | | Excludes expenses incurred indirectly as a result of investments in underlying funds as follows: |
| | | | | | | | | | | | | | | | | | | | | | | | |
| | | Six Months Ended
January 31, 2017 (Unaudited) | | | Year Ended July 31, | | | Period October 3,
20111 to July 31, 2012 | |
| | | | 2016 | | | 2015 | | | 2014 | | | 2013 | | |
Investments in underlying funds | | | 0.02% | | | | 0.01 | % | | | 0.01 | % | | | 0.05 | % | | | 0.01 | % | | | — | |
| | 8 | | Organization costs were not annualized in the calculation of the expense ratios. If these expenses were annualized, the total expenses would have been 2.85%. |
See Notes to Financial Statements.
| | | | | | |
| | | BLACKROCK FUNDS | | JANUARY 31, 2017 | | 55 |
| | | | |
| Financial Highlights | | | BlackRock Global Long/Short Credit Fund | |
| | | | | | | | | | | | | | | | | | | | | | | | |
| | | Institutional | |
| | | Six Months
Ended
January 31,
2017 (Unaudited) | | | Year Ended July 31, | | | Period
September 30,
20111 to July 31, 2012 | |
| | | | 2016 | | | 2015 | | | 2014 | | | 2013 | | |
| Per Share Operating Performance | | | | | | | | | | | | | | | | | | | | | | | | |
Net asset value, beginning of period | | $ | 9.91 | | | $ | 10.51 | | | $ | 10.95 | | | $ | 10.63 | | | $ | 10.32 | | | | $ 10.00 | |
| | | | |
Net investment income2 | | | 0.15 | | | | 0.27 | | | | 0.28 | | | | 0.20 | | | | 0.15 | | | | 0.06 | |
Net realized and unrealized gain (loss) | | | 0.15 | | | | (0.37 | ) | | | (0.26 | ) | | | 0.26 | | | | 0.41 | | | | 0.30 | |
| | | | |
Net increase (decrease) from investment operations | | | 0.30 | | | | (0.10 | ) | | | 0.02 | | | | 0.46 | | | | 0.56 | | | | 0.36 | |
| | | | |
Distributions:3 | | | | | | | | | | | | | | | | | | | | | | | | |
From net investment income | | | — | | | | (0.50 | ) | | | (0.34 | ) | | | (0.14 | ) | | | (0.13 | ) | | | (0.03 | ) |
From net realized gain | | | — | | | | — | | | | (0.12 | ) | | | — | | | | (0.11 | ) | | | (0.01 | ) |
From return of capital | | | — | | | | — | | | | — | | | | — | | | | (0.01 | ) | | | — | |
| | | | |
Total distributions | | | — | | | | (0.50 | ) | | | (0.46 | ) | | | (0.14 | ) | | | (0.25 | ) | | | (0.04 | ) |
| | | | |
Net asset value, end of period | | $ | 10.21 | | | $ | 9.91 | | | $ | 10.51 | | | $ | 10.95 | | | $ | 10.63 | | | | $ 10.32 | |
| | | | |
| | | | | | | | | | | | | | | | | | | | | | | | |
| Total Return4 | | | | | | | | | | | | | | | | | | | | | | | | |
Based on net asset value | | | 3.03 | %5 | | | (0.92 | )% | | | 0.20 | % | | | 4.36 | % | | | 5.45 | % | | | 3.55 | %5 |
| | | | |
| | | | | | | | | | | | | | | | | | | | | | | | |
| Ratios to Average Net Assets | | | | | | | | | | | | | | | | | | | | | | | | |
Total expenses6 | | | 1.88 | %7 | | | 2.08 | % | | | 1.73 | % | | | 1.61 | % | | | 1.56 | % | | | 1.73 | %7,8 |
| | | | |
Total expenses excluding recoupment of past waived and/or reimbursed fees6 | | | 1.88 | %7 | | | 2.08 | % | | | 1.73 | % | | | 1.61 | % | | | 1.54 | % | | | 1.73 | %7,8 |
| | | | |
Total expenses after fees waived and/or reimbursed6 | | | 1.88 | %7 | | | 2.07 | % | | | 1.72 | % | | | 1.59 | % | | | 1.53 | % | | | 1.46 | %7 |
| | | | |
Total expenses after fees waived, reimbursed and excluding interest expense, dividend expense and broker fees and expenses on short sales6 | | | 1.11 | %7 | | | 1.09 | % | | | 1.07 | % | | | 1.03 | % | | | 1.18 | % | | | 1.20 | %7 |
| | | | |
Net investment income6 | | | 2.87 | %7 | | | 2.69 | % | | | 2.63 | % | | | 1.83 | % | | | 1.38 | % | | | 0.70 | %7 |
| | | | |
| | | | | | | | | | | | | | | | | | | | | | | | |
| Supplemental Data | | | | | | | | | | | | | | | | | | | | | | | | |
Net assets, end of period (000) | | $ | 3,486,642 | | | $ | 3,378,151 | | | $ | 4,505,530 | | | $ | 4,623,194 | | | $ | 1,335,924 | | | | $133,444 | |
| | | | |
Portfolio turnover rate | | | 116 | % | | | 253 | % | | | 211 | % | | | 207 | % | | | 185 | % | | | 355 | % |
| | | | |
| | 1 | | Commencement of operations. |
| | 2 | | Based on average shares outstanding. |
| | 3 | | Distributions for annual periods determined in accordance with federal income tax regulations. |
| | 4 | | Where applicable, assumes the reinvestment of distributions. |
| | 5 | | Aggregate total return. |
| | 6 | | Excludes expenses incurred indirectly as a result of investments in underlying funds as follows: |
| | | | | | | | | | | | | | | | | | | | | | | | |
| | | Six Months Ended
January 31, 2017 (Unaudited) | | | Year Ended July 31, | | | Period September 30,
20111 to July 31, 2012 | |
| | | | 2016 | | | 2015 | | | 2014 | | | 2013 | | |
Investments in underlying funds | | | 0.01% | | | | 0.01 | % | | | — | | | | 0.05 | % | | | — | | | | — | |
| | 8 | | Organization costs were not annualized in the calculation of the expense ratios. If these expenses were annualized, the total expenses would have been 1.75%. |
See Notes to Financial Statements.
| | | | | | |
| 56 | | BLACKROCK FUNDS | | JANUARY 31, 2017 | | |
| | | | |
| Financial Highlights (continued) | | | BlackRock Global Long/Short Credit Fund | |
| | | | | | | | | | | | | | | | | | | | | | | | |
| | | Investor A | |
| | | Six Months Ended January 31, 2017 (Unaudited) | | | Year Ended July 31, | | | Period September 30, 20111 to July 31, 2012 | |
| | | | 2016 | | | 2015 | | | 2014 | | | 2013 | | |
| Per Share Operating Performance | | | | | | | | | | | | | | | | | | | | | | | | |
Net asset value, beginning of period | | $ | 9.88 | | | $ | 10.48 | | | $ | 10.93 | | | $ | 10.61 | | | $ | 10.30 | | | | $ 10.00 | |
| | | | |
Net investment income2 | | | 0.13 | | | | 0.24 | | | | 0.25 | | | | 0.16 | | | | 0.12 | | | | 0.06 | |
Net realized and unrealized gain (loss) | | | 0.16 | | | | (0.36 | ) | | | (0.27 | ) | | | 0.27 | | | | 0.42 | | | | 0.28 | |
| | | | |
Net increase (decrease) from investment operations | | | 0.29 | | | | (0.12 | ) | | | (0.02 | ) | | | 0.43 | | | | 0.54 | | | | 0.34 | |
| | | | |
Distributions:3 | | | | | | | | | | | | | | | | | | | | | | | | |
From net investment income | | | — | | | | (0.48 | ) | | | (0.31 | ) | | | (0.11 | ) | | | (0.11 | ) | | | (0.03 | ) |
From net realized gain | | | — | | | | — | | | | (0.12 | ) | | | — | | | | (0.11 | ) | | | (0.01 | ) |
From return of capital | | | — | | | | — | | | | — | | | | — | | | | (0.01 | ) | | | — | |
| | | | |
Total distributions | | | — | | | | (0.48 | ) | | | (0.43 | ) | | | (0.11 | ) | | | (0.23 | ) | | | (0.04 | ) |
| | | | |
Net asset value, end of period | | $ | 10.17 | | | $ | 9.88 | | | $ | 10.48 | | | $ | 10.93 | | | $ | 10.61 | | | | $ 10.30 | |
| | | | |
| | | | | | | | | | | | | | | | | | | | | | | | |
| Total Return4 | | | | | | | | | | | | | | | | | | | | | | | | |
Based on net asset value | | | 2.94 | %5 | | | (1.15 | )% | | | (0.10 | )% | | | 4.09 | % | | | 5.23 | % | | | 3.32 | %5 |
| | | | |
| | | | | | | | | | | | | | | | | | | | | | | | |
| Ratios to Average Net Assets | | | | | | | | | | | | | | | | | | | | | | | | |
Total expenses6 | | | 2.15 | %7 | | | 2.29 | % | | | 1.98 | % | | | 1.91 | % | | | 1.79 | % | | | 1.93 | %7,8 |
| | | | |
Total expenses excluding recoupment of past waived and/or reimbursed fees6 | | | 2.15 | %7 | | | 2.29 | % | | | 1.98 | % | | | 1.91 | % | | | 1.77 | % | | | 1.93 | %7,8 |
| | | | |
Total expenses after fees waived and/or reimbursed6 | | | 2.15 | %7 | | | 2.29 | % | | | 1.98 | % | | | 1.89 | % | | | 1.75 | % | | | 1.66 | %7 |
| | | | |
Total expenses after fees waived, reimbursed and excluding interest expense, dividend expense and broker fees and expenses on short sales6 | | | 1.38 | %7 | | | 1.34 | % | | | 1.33 | % | | | 1.32 | % | | | 1.40 | % | | | 1.39 | %7 |
| | | | |
Net investment income6 | | | 2.58 | %7 | | | 2.41 | % | | | 2.36 | % | | | 1.48 | % | | | 1.11 | % | | | 0.67 | %7 |
| | | | |
| | | | | | | | | | | | | | | | | | | | | | | | |
| Supplemental Data | | | | | | | | | | | | | | | | | | | | | | | | |
Net assets, end of period (000) | | $ | 332,987 | | | $ | 422,079 | | | $ | 1,032,811 | | | $ | 1,575,812 | | | $ | 910,247 | | | | $71,053 | |
| | | | |
Portfolio turnover rate | | | 116 | % | | | 253 | % | | | 211 | % | | | 207 | % | | | 185 | % | | | 355 | % |
| | | | |
| | 1 | | Commencement of operations. |
| | 2 | | Based on average shares outstanding. |
| | 3 | | Distributions for annual periods determined in accordance with federal income tax regulations. |
| | 4 | | Where applicable, excludes the effects of any sales charges and assumes the reinvestment of distributions. |
| | 5 | | Aggregate total return. |
| | 6 | | Excludes expenses incurred indirectly as a result of investments in underlying funds as follows: |
| | | | | | | | | | | | | | | | | | | | | | | | |
| | | Six Months Ended January 31, 2017 (Unaudited) | | | Year Ended July 31, | | | Period September 30, 20111 to July 31, 2012 | |
| | | | 2016 | | | 2015 | | | 2014 | | | 2013 | | |
Investments in underlying funds | | | 0.01% | | | | 0.01 | % | | | — | | | | 0.05 | % | | | — | | | | — | |
| | 8 | | Organization costs were not annualized in the calculation of the expense ratios. If these expenses were annualized, the total expenses would have been 1.93%. |
See Notes to Financial Statements.
| | | | | | |
| | | BLACKROCK FUNDS | | JANUARY 31, 2017 | | 57 |
| | | | |
| Financial Highlights (continued) | | | BlackRock Global Long/Short Credit Fund | |
| | | | | | | | | | | | | | | | | | | | | | | | |
| | | Investor C | |
| | | Six Months Ended January 31, 2017 (Unaudited) | | | Year Ended July 31, | | | Period September 30,
20111 to July 31, 2012 | |
| | | | 2016 | | | 2015 | | | 2014 | | | 2013 | | |
| Per Share Operating Performance | | | | | | | | | | | | | | | | | | | | | | | | |
Net asset value, beginning of period | | $ | 9.76 | | | $ | 10.38 | | | $ | 10.87 | | | $ | 10.56 | | | $ | 10.26 | | | | $ 10.00 | |
| | | | |
Net investment income (loss)2 | | | 0.09 | | | | 0.17 | | | | 0.17 | | | | 0.08 | | | | 0.04 | | | | (0.01 | ) |
Net realized and unrealized gain (loss) | | | 0.15 | | | | (0.36 | ) | | | (0.26 | )�� | | | 0.27 | | | | 0.41 | | | | 0.29 | |
| | | | |
Net increase (decrease) from investment operations | | | 0.24 | | | | (0.19 | ) | | | (0.09 | ) | | | 0.35 | | | | 0.45 | | | | 0.28 | |
| | | | |
Distributions:3 | | | | | | | | | | | | | | | | | | | | | | | | |
From net investment income | | | — | | | | (0.43 | ) | | | (0.28 | ) | | | (0.04 | ) | | | (0.03 | ) | | | (0.01 | ) |
From net realized gain | | | — | | | | — | | | | (0.12 | ) | | | — | | | | (0.11 | ) | | | (0.01 | ) |
From return of capital | | | — | | | | — | | | | — | | | | — | | | | (0.01 | ) | | | — | |
| | | | |
Total distributions | | | — | | | | (0.43 | ) | | | (0.40 | ) | | | (0.04 | ) | | | (0.15 | ) | | | (0.02 | ) |
| | | | |
Net asset value, end of period | | $ | 10.00 | | | $ | 9.76 | | | $ | 10.38 | | | $ | 10.87 | | | $ | 10.56 | | | | $ 10.26 | |
| | | | |
| | | | | | | | | | | | | | | | | | | | | | | | |
| Total Return4 | | | | | | | | | | | | | | | | | | | | | | | | |
Based on net asset value | | | 2.46 | %5 | | | (1.85 | )% | | | (0.82 | )% | | | 3.31 | % | | | 4.39 | % | | | 2.79 | %5 |
| | | | |
| | | | | | | | | | | | | | | | | | | | | | | | |
| Ratios to Average Net Assets | | | | | | | | | | | | | | | | | | | | | | | | |
Total expenses6 | | | 2.89 | %7 | | | 3.06 | % | | | 2.72 | % | | | 2.63 | % | | | 2.50 | % | | | 2.66 | %7,8 |
| | | | |
Total expenses excluding recoupment of past waived and/or reimbursed fees6 | | | 2.89 | %7 | | | 3.06 | % | | | 2.72 | % | | | 2.63 | % | | | 2.48 | % | | | 2.66 | %7,8 |
| | | | |
Total expenses after fees waived and/or reimbursed6 | | | 2.89 | %7 | | | 3.06 | % | | | 2.72 | % | | | 2.62 | % | | | 2.47 | % | | | 2.40 | %7 |
| | | | |
Total expenses after fees waived, reimbursed and excluding interest expense, dividend expense and broker fees and expenses on short sales6 | | | 2.12 | %7 | | | 2.09 | % | | | 2.07 | % | | | 2.05 | % | | | 2.12 | % | | | 2.14 | %7 |
| | | | |
Net investment income (loss)6 | | | 1.84 | %7 | | | 1.69 | % | | | 1.64 | % | | | 0.76 | % | | | 0.39 | % | | | (0.16 | )%7 |
| | | | |
| | | | | | | | | | | | | | | | | | | | | | | | |
| Supplemental Data | | | | | | | | | | | | | | | | | | | | | | | | |
Net assets, end of period (000) | | $ | 165,991 | | | $ | 215,364 | | | $ | 342,148 | | | $ | 390,031 | | | $ | 156,619 | | | | $13,132 | |
| | | | |
Portfolio turnover rate | | | 116 | % | | | 253 | % | | | 211 | % | | | 207 | % | | | 185 | % | | | 355 | % |
| | | | |
| | 1 | | Commencement of operations. |
| | 2 | | Based on average shares outstanding. |
| | 3 | | Distributions for annual periods determined in accordance with federal income tax regulations. |
| | 4 | | Where applicable, excludes the effects of any sales charges and assumes the reinvestment of distributions. |
| | 5 | | Aggregate total return. |
| | 6 | | Excludes expenses incurred indirectly as a result of investments in underlying funds as follows: |
| | | | | | | | | | | | | | | | | | | | | | | | |
| | | Six Months Ended
January 31, 2017 (Unaudited) | | | Year Ended July 31, | | | Period September 30,
20111 to July 31, 2012 | |
| | | | 2016 | | | 2015 | | | 2014 | | | 2013 | | |
Investments in underlying funds | | | 0.01% | | | | 0.01 | % | | | — | | | | 0.05 | % | | | — | | | | — | |
| | 8 | | Organization costs were not annualized in the calculation of the expense ratios. If these expenses were annualized, the total expenses would have been 2.66%. |
See Notes to Financial Statements.
| | | | | | |
| 58 | | BLACKROCK FUNDS | | JANUARY 31, 2017 | | |
| | | | |
| Financial Highlights (concluded) | | | BlackRock Global Long/Short Credit Fund | |
| | | | | | | | | | | | |
| | | Class K | |
| | | Six Months Ended January 31, 2017 (Unaudited) | | | | | | Period
March 28, 20161
to July 31, 2016 | |
| Per Share Operating Performance | | | | | | | | | | | | |
Net asset value, beginning of period | | | $ 9.92 | | | | | | | | $ 9.70 | |
| | | | |
Net investment income2 | | | 0.15 | | | | | | | | 0.11 | |
Net realized and unrealized gain | | | 0.15 | | | | | | | | 0.11 | |
| | | | |
Net increase from investment operations | | | 0.30 | | | | | | | | 0.22 | |
| | | | |
Net asset value, end of period | | | $ 10.22 | | | | | | | | $ 9.92 | |
| | | | |
| | | | | | | | | | | | |
| Total Return3 | | | | | | | | | | | | |
Based on net asset value | | | 3.02 | %4 | | | | | | | 2.27 | %4 |
| | | | |
| | | | | | | | | | | | |
| Ratios to Average Net Assets | | | | | | | | | | | | |
Total expenses5,6 | | | 1.80 | % | | | | | | | 2.14 | % |
| | | | |
Total expenses excluding recoupment of past waived and/or reimbursed fees5,6 | | | 1.80 | % | | | | | | | 2.14 | % |
| | | | |
Total expenses after fees waived and/or reimbursed5,6 | | | 1.80 | % | | | | | | | 2.14 | % |
| | | | |
Total expenses after fees waived, reimbursed and excluding interest expense, dividend expense and broker fees and expenses on short sales5,6 | | | 1.03 | % | | | | | | | 1.01 | % |
| | | | |
Net investment income5,6 | | | 2.93 | % | | | | | | | 3.35 | % |
| | | | |
| | | | | | | | | | | | |
| Supplemental Data | | | | | | | | | | | | |
Net assets, end of period (000) | | | $31,330 | | | | | | | | $27,712 | |
| | | | |
Portfolio turnover rate | | | 116 | % | | | | | | | 253 | % |
| | | | |
| | 1 | | Commencement of operations. |
| | 2 | | Based on average shares outstanding. |
| | 3 | | Where applicable, assumes the reinvestment of distributions. |
| | 4 | | Aggregate total return. |
| | 5 | | Excludes expenses incurred indirectly as a result of investments in underlying funds as follows: |
| | | | | | | | |
| | | Six Months Ended January 31, 2017
(Unaudited) | | | Period March 28,20161 to July 31, 2016 | |
Investments in underlying funds | | | 0.01% | | | | 0.01 | % |
See Notes to Financial Statements.
| | | | | | |
| | | BLACKROCK FUNDS | | JANUARY 31, 2017 | | 59 |
| | | | |
| Notes to Financial Statements (Unaudited) | | | | |
1. Organization:
BlackRock FundsSM (the “Trust”) is registered under the Investment Company Act of 1940, as amended (the “1940 Act”), as an open-end management investment company. The Trust is organized as a Massachusetts business trust. The following series of the Trust are referred to herein collectively asthe “Funds” or individually, a “Fund”:
| | | | |
| Fund Name | | Herein Referred To As | | Diversification Classification |
BlackRock Commodity Strategies Fund | | Commodity Strategies | | Non-diversified |
BlackRock Global Long/Short Credit Fund | | Global Long/Short Credit | | Diversified |
Each Fund offers multiple classes of shares. All classes of shares have identical voting, dividend, liquidation and other rights and are subject to the same terms and conditions, except that certain classes bear expenses related to the shareholder servicing and distribution of such shares. Institutional and Class K Shares are sold only to certain eligible investors. Investor A and Investor C Shares are generally available through financial intermediaries. Each class has exclusive voting rights with respect to matters relating to its shareholder servicing and distribution expenditures.
| | | | | | | | | | | | | | | |
| Share Class | | Initial Sales Charge | | CDSC | | Conversion Privilege |
| Institutional and Class K Shares | | | | No | | | | | No | | | | | None | |
Investor A Shares | | | | Yes | | | | | No | 1 | | | | None | |
Investor C Shares | | | | No | | | | | Yes | | | | | None | |
| | 1 | | Investor A Shares may be subject to a contingent deferred sales charge (“CDSC”) for certain redemptions where no initial sales charge was paid at the time of purchase. |
The Funds, together with certain other registered investment companies advised by the BlackRock Advisors, LLC (the “Manager”) or its affiliates, are included in a complex of open-end funds referred to as the Equity-Liquidity Complex.
Basis of Consolidation: The accompanying consolidated financial statements of Commodity Strategies include the accounts of BlackRock Cayman Commodity Strategies Fund, Ltd. (the “Subsidiary”), which is a wholly-owned subsidiary of Commodity Strategies and primarily invests in commodity-related instruments. The Subsidiary enables Commodity Strategies to hold these commodity-related instruments and satisfy regulated investment company tax requirements. Commodity Strategies may invest up to 25% of its total assets in the Subsidiary. The net assets of the Subsidiary as of period end were $3,321,351, which is 2.0% of Commodity Strategies’ consolidated net assets. Intercompany accounts and transactions, if any, have been eliminated. The Subsidiary is subject to the same investment policies and restrictions that apply to Commodity Strategies, except that the Subsidiary does not invest in equity securities of commodity-related companies, and may invest without limitation in commodity-related instruments.
The following table shows a summary of the selected financial information of the Subsidiary included in the consolidated financial statements:
| | | | |
| Statement of Assets and Liabilities | | | |
Total assets | | $ | 4,219,561 | |
Total liabilities | | | 898,210 | |
| | | | |
Net assets | | $ | 3,321,351 | |
Statement of Operations | | | | |
Net realized gain from investments — unaffiliated | | $ | 41,619 | |
Net change in unrealized appreciation (depreciation) on investments — unaffiliated | | | (3,762 | ) |
| | | | |
Net increase in net assets resulting from operations | | $ | 37,857 | |
Statement of Changes in Net Assets | | | | |
Net realized gain | | $ | 41,619 | |
Net change in unrealized appreciation (depreciation) | | | (3,762 | ) |
| | | | |
Net increase in net assets resulting from operations | | $ | 37,857 | |
Net increase in net assets derived from capital share transactions | | | 3,283,493 | |
| | | | |
Net increase in net assets | | $ | 3,321,350 | |
| | | | |
2. Significant Accounting Policies:
The financial statements are prepared in conformity with accounting principles generally accepted in the United States of America (“U.S. GAAP”), which may require management to make estimates and assumptions that affect the reported amounts of assets and liabilities in the financial statements, disclosure of contingent assets and liabilities at the date of the financial statements and the reported amounts of increases and decreases in net assets from operations during the reporting period. Actual results could differ from those estimates. Each Fund is considered an investment company under U.S. GAAP and follows the accounting and reporting guidance applicable to investment companies. Below is a summary of significant accounting policies:
Foreign Currency: Each Fund’s books and records are maintained in U.S. dollars. Purchases and sales of investments are recorded at the rates of exchange prevailing on the respective dates of such transactions. Generally, when the U.S. dollar rises in value against a foreign currency, the investments denominated in that currency will lose value; the opposite effect occurs if the U.S. dollar falls in relative value.
| | | | | | |
| 60 | | BLACKROCK FUNDS | | JANUARY 31, 2017 | | |
| | | | |
| Notes to Financial Statements (continued) | | | | |
Each Fund does not isolate the portion of the results of operations arising as a result of changes in the exchange rates from the changes in the market prices of investments held or sold for financial reporting purposes. Accordingly, the effects of changes in exchange rates on investments are not segregated in the Statements of Operations from the effects of changes in market prices of those investments, but are included as a component of net realized and unrealized gain (loss) from investments. Each Fund reports realized currency gains (losses) on foreign currency related transactions as components of net realized gain (loss) for financial reporting purposes, whereas such components are generally treated as ordinary income for federal income tax purposes.
Defensive Positions: Investment policies may vary for temporary defensive purposes during periods in which the investment adviser believes that conditions in the securities markets or other economic, financial or political conditions warrant. Under such conditions, a Fund may invest up to 100% of its total assets in U.S. Government securities, certificates of deposit, repurchase agreements that involve purchases of debt securities, bankers’ acceptances and other bank obligations, commercial paper, money market funds and/or other debt securities, or may hold its assets in cash. The investment adviser applies this defensive posture as applicable and is consistent with each Fund’s investment policies.
Segregation and Collateralization: In cases where a Fund enters into certain investments (e.g., dollar rolls, TBA sale commitments, futures contracts, forward foreign currency exchange contracts, options written, swaps and short sales), or certain borrowings (e.g., reverse repurchase transactions) that would be treated as “senior securities” for 1940 Act purposes, a Fund may segregate or designate on its books and records cash or liquid assets having a market value at least equal to the amount of its future obligations under such investments or borrowings. Doing so allows the investment or borrowing to be excluded from treatment as a “senior security.” Furthermore, if required by an exchange or counterparty agreement, the Funds may be required to deliver/deposit cash and/or securities to/with an exchange, or broker-dealer or custodian as collateral for certain investments or obligations.
Investment Transactions and Investment Income: For financial reporting purposes, investment transactions are recorded on the dates the transactions are entered into (the trade dates). Realized gains and losses on investment transactions are determined on the identified cost basis. Dividend income is recorded on the ex-dividend date. Dividends from foreign securities where the ex-dividend date may have passed are subsequently recorded when the Funds are informed of the ex-dividend date. Under the applicable foreign tax laws, a withholding tax at various rates may be imposed on capital gains, dividends and interest. Upon notification from issuers, some of the dividend income received from a real estate investment trust may be redesignated as a reduction of cost of the related investment and/or realized gain. Interest income, including amortization and accretion of premiums and discounts on debt securities, is recognized on the accrual basis. Income, expenses and realized and unrealized gains and losses are allocated daily to each class based on its relative net assets.
Distributions: Distributions paid by the Funds are recorded on the ex-dividend date and made at least annually. The character and timing of distributions are determined in accordance with federal income tax regulations, which may differ from U.S. GAAP.
Net income and realized gains from investments held by the Subsidiary are treated as ordinary income for tax purposes. If a net loss is realized by the Subsidiary in any taxable year, the loss will generally not be available to offset Commodity Strategies’ ordinary income and/or capital gains for that year.
Offering Costs: Offering costs are amortized over a 12-month period beginning with the commencement of operations.
Recent Accounting Standards: In April 2015, the Financial Accounting Standards Board issued “Disclosures for Investments in Certain Entities that Calculate Net Asset Value (“NAV”) per Share” which eliminates the requirement to categorize investments within the fair value hierarchy when fair value is based on the NAV per share and no quoted market value is available. As of January 31, 2017, certain investments of the Funds were valued using NAV per share as no quoted market value was available and therefore have been excluded from the fair value hierarchy.
In November 2016, the Financial Accounting Standards Board issued Accounting Standards Update “Restricted Cash” which will require entities to include the total of cash, cash equivalents, restricted cash, and restricted cash equivalents in the beginning and ending cash balances in the Statements of Cash Flows. The guidance will be applied retrospectively and is effective for fiscal years beginning after December 15, 2017, and interim periods within those years. Management is evaluating the impact, if any, of this guidance on the Funds’ presentation in the Statements of Cash Flows.
Indemnifications: In the normal course of business, a Fund enters into contracts that contain a variety of representations that provide general indemnification. A Fund’s maximum exposure under these arrangements is unknown because it involves future potential claims against a Fund, which cannot be predicted with any certainty.
Other: Expenses directly related to a Fund or its classes are charged to that Fund or the applicable class. Other operating expenses shared by several funds, including other funds managed by the Manager, are prorated among those funds on the basis of relative net assets or other appropriate methods. Expenses directly related to the Funds and other shared expenses prorated to the Funds are allocated daily to each class based on their relative net assets or other appropriate methods.
| | | | | | |
| | | BLACKROCK FUNDS | | JANUARY 31, 2017 | | 61 |
| | | | |
| Notes to Financial Statements (continued) | | | | |
The Funds have an arrangement with their custodian whereby credits are earned on uninvested cash balances, which could be used to reduce custody fees and/or overdraft charges. The Funds may incur charges on certain uninvested cash balances and overdrafts, subject to certain conditions.
3. Investment Valuation and Fair Value Measurements:
Investment Valuation Policies: The Funds’ investments are valued at fair value (also referred to as “market value” within the financial statements) as of the close of trading on the New York Stock Exchange (“NYSE”) (generally 4:00 p.m., Eastern time). U.S. GAAP defines fair value as the price the Funds would receive to sell an asset or pay to transfer a liability in an orderly transaction between market participants at the measurement date. The Funds determine the fair values of their financial instruments using various independent dealers or pricing services under policies approved by the Board of Trustees of the Trust (the “Board”). The BlackRock Global Valuation Methodologies Committee (the “Global Valuation Committee”) is the committee formed by management to develop global pricing policies and procedures and to oversee the pricing function for all financial instruments.
Fair Value Inputs and Methodologies: The following methods and inputs are used to establish the fair value of each Fund’s assets and liabilities:
| • | | Equity investments traded on a recognized securities exchange are valued at the official closing price each day, if available. For equity investments traded on more than one exchange, the official closing price on the exchange where the stock is primarily traded is used. Equity investments traded on a recognized exchange for which there were no sales on that day may be valued at the last available bid (long positions) or ask (short positions) price. |
| • | | Fixed-income securities for which market quotations are readily available are generally valued using the last available bid prices or current market quotations provided by independent dealers or third party pricing services. Floating rate loan interests are valued at the mean of the bid prices from one or more independent brokers or dealers as obtained from a third party pricing service. Pricing services generally value fixed-income securities assuming orderly transactions of an institutional round lot size, but the Funds may hold or transact in such securities in smaller, odd lot sizes. Odd lots often trade at lower prices than institutional round lots. The pricing services may use matrix pricing or valuation models that utilize certain inputs and assumptions to derive values, including transaction data (e.g., recent representative bids and offers), credit quality information, perceived market movements, news, and other relevant information. Certain fixed-income securities, including asset-backed and mortgage related securities may be valued based on valuation models that consider the estimated cash flows of each tranche of the entity, establish a benchmark yield and develop an estimated tranche specific spread to the benchmark yield based on the unique attributes of the tranche. The amortized cost method of valuation may be used with respect to debt obligations with sixty days or less remaining to maturity unless the Manager determines such method does not represent fair value. |
Generally, trading in foreign instruments is substantially completed each day at various times prior to the close of trading on the NYSE. Occasionally, events affecting the values of such instruments may occur between the foreign market close and the close of trading on the NYSE that may not be reflected in the computation of the Funds’ net assets. Each business day, the Funds use a pricing service to assist with the valuation of certain foreign exchange-traded equity securities and foreign exchange-traded over-the-counter (“OTC”) options (the “Systematic Fair Value Price”). Using current market factors, the Systematic Fair Value Price is designed to value such foreign securities and foreign options at fair value as of the close of trading on the NYSE, which follows the close of the local markets.
| • | | Investments in open-end U.S. mutual funds are valued at NAV each business day. |
| • | | The Funds value their investment in SL Liquidity Series, LLC, Money Market Series (the “Money Market Series”) at fair value, which is ordinarily based upon their pro rata ownership in the underlying fund’s net assets. The Money Market Series seeks current income consistent with maintaining liquidity and preserving capital. Although the Money Market Series is not registered under the 1940 Act, its investments may follow the parameters of investments by a money market fund that is subject to Rule 2a-7 under the 1940 Act. |
| • | | Futures contracts traded on exchanges are valued at their last sale price. |
| • | | Securities and other assets and liabilities denominated in foreign currencies are translated into U.S. dollars using exchange rates determined as of the close of trading on the NYSE. Forward foreign currency exchange contracts are valued at the mean between the bid and ask prices and are determined as of the close of trading on the NYSE. Interpolated values are derived when the settlement date of the contract is an interim date for which quotations are not available. |
| • | | Exchange-traded options are valued at the mean between the last bid and ask prices at the close of the options market in which the options trade. An exchange-traded option for which there is no mean price is valued at the last bid (long positions) or ask (short positions) price. If no bid or ask price is available, the prior day’s price will be used, unless it is determined that the prior day’s price no longer reflects the fair value of the option. OTC options and options on swaps (“swaptions”) are valued by an independent pricing service using a mathematical model, which incorporates a number of market data factors, such as the trades and prices of the underlying instruments. |
| • | | Swap agreements are valued utilizing quotes received daily by the Funds’ pricing service or through brokers, which are derived using daily swap curves and models that incorporate a number of market data factors, such as discounted cash flows, trades and values of the underlying reference instruments. |
| | | | | | |
| 62 | | BLACKROCK FUNDS | | JANUARY 31, 2017 | | |
| | | | |
| Notes to Financial Statements (continued) | | | | |
| • | | Commodity-Linked Notes are valued utilizing quotes received daily by the Funds’ pricing service or through brokers. The Funds’ pricing service utilizes valuation models, which incorporate a number of transaction specific data factors, such as the performance return multiple and upfront interest paid, as well as the price of the underlying index. |
If events (e.g., a company announcement, market volatility or a natural disaster) occur that are expected to materially affect the value of such investments, or in the event that the application of these methods of valuation results in a price for an investment that is deemed not to be representative of the market value of such investment, or if a price is not available, the investment will be valued by the Global Valuation Committee, or its delegate, in accordance with a policy approved by the Board as reflecting fair value (“Fair Valued Investments”). The fair valuation approaches that may be used by the Global Valuation Committee will include Market approach, Income approach and Cost approach. Valuation techniques such as discounted cash flow, use of market comparables and matrix pricing are types of valuation approaches and typically used in determining fair value. When determining the price for Fair Valued Investments, the Global Valuation Committee, or its delegate, seeks to determine the price that each Fund might reasonably expect to receive or pay from the current sale or purchase of that asset or liability in an arm’s-length transaction. Fair value determinations shall be based upon all available factors that the Global Valuation Committee, or its delegate, deems relevant and consistent with the principles of fair value measurement.
The Global Valuation Committee, or its delegate, employs various methods for calibrating valuation approaches for investments where an active market does not exist, including regular due diligence of each Fund’s pricing vendors, regular reviews of key inputs and assumptions, transactional back-testing or disposition analysis to compare unrealized gains and losses to realized gains and losses, reviews of missing or stale prices and large movements in market values and reviews of any market related activity. The pricing of all Fair Valued Investments is subsequently reported to the Board or a committee thereof on a quarterly basis. As a result of the inherent uncertainty in valuation of these investments, the fair values may differ from the values that would have been used had an active market existed.
For investments in equity or debt issued by privately-held companies or funds (“Private Company” or collectively, the “Private Companies”) and other Fair Valued Investments, the fair valuation approaches that are used by third party pricing services utilize one or a combination of, but not limited to, the following inputs.
| | | | |
| | | | | Standard Inputs Generally Considered By Third Party Pricing Services |
| Market approach | | (i) | | recent market transactions, including subsequent rounds of financing, in the underlying investment or comparable issuers; |
| | (ii) | | recapitalizations and other transactions across the capital structure; and |
| | (iii) | | market multiples of comparable issuers. |
| Income approach | | (i) | | future cash flows discounted to present and adjusted as appropriate for liquidity, credit and/or market risks; |
| | (ii) | | quoted prices for similar investments or assets in active markets; and |
| | (iii) | | other risk factors, such as interest rates, yield curves, volatilities, prepayment speeds, loss severities, credit risks, recovery rates, liquidation amounts and/or default rates. |
| Cost approach | | (i) | | audited or unaudited financial statements, investor communications and financial or operational metrics issued by the Private Company; |
| | (ii) | | changes in the valuation of relevant indices or publicly traded companies comparable to the Private Company; |
| | (iii) | | relevant news and other public sources; and |
| | | (iv) | | known secondary market transactions in the Private Company’s interests and merger or acquisition activity in companies comparable to the Private Company. |
Investments in series of preferred stock issued by Private Companies are typically valued utilizing Market approach in determining the enterprise value of the company. Such investments often contain rights and preferences that differ from other series of preferred and common stock of the same issuer. Valuation techniques such as an option pricing model (“OPM”), a probability weighted expected return model (“PWERM”) or a hybrid of those techniques are used in allocating enterprise value of the company, as deemed appropriate under the circumstances. The use of OPM and PWERM techniques involve a determination of the exit scenarios of the investment in order to appropriately allocate the enterprise value of the company among the various parts of its capital structure.
The Private Companies are not subject to the public company disclosure, timing, and reporting standards as other investments held by a Fund. Typically, the most recently available information by a Private Company is as of a date that is earlier than the date a Fund is calculating its NAV. This factor may result in a difference between the value of the investment and the price a Fund could receive upon the sale of the investment.
| | | | | | |
| | | BLACKROCK FUNDS | | JANUARY 31, 2017 | | 63 |
| | | | |
| Notes to Financial Statements (continued) | | | | |
Fair Value Hierarchy: Various inputs are used in determining the fair value of investments and derivative financial instruments. These inputs to valuation techniques are categorized into a fair value hierarchy consisting of three broad levels for financial statement purposes as follows:
| • | | Level 1 — unadjusted price quotations in active markets/exchanges for identical assets or liabilities that each Fund has the ability to access |
| • | | Level 2 — other observable inputs (including, but not limited to, quoted prices for similar assets or liabilities in markets that are active, quoted prices for identical or similar assets or liabilities in markets that are not active, inputs other than quoted prices that are observable for the assets or liabilities (such as interest rates, yield curves, volatilities, prepayment speeds, loss severities, credit risks and default rates) or other
market–corroborated inputs) |
| • | | Level 3 — unobservable inputs based on the best information available in the circumstances, to the extent observable inputs are not available (including each Fund’s own assumptions used in determining the fair value of investments and derivative financial instruments) |
The hierarchy gives the highest priority to unadjusted quoted prices in active markets for identical assets or liabilities (Level 1 measurements) and the lowest priority to unobservable inputs (Level 3 measurements). Accordingly, the degree of judgment exercised in determining fair value is greatest for instruments categorized in Level 3. The inputs used to measure fair value may fall into different levels of the fair value hierarchy. In such cases, for disclosure purposes, the fair value hierarchy classification is determined based on the lowest level input that is significant to the fair value measurement in its entirety. Investments classified within Level 3 have significant unobservable inputs used by the Global Valuation Committee in determining the price for Fair Valued Investments. Level 3 investments include equity or debt issued by Private Companies. There may not be a secondary market, and/or there are a limited number of investors. Level 3 investments may also be adjusted to reflect illiquidity and/or non-transferability, with the amount of such discount estimated by the Global Valuation Committee in the absence of market information.
Changes in valuation techniques may result in transfers into or out of an assigned level within the hierarchy. In accordance with each Fund’s policy, transfers between different levels of the fair value hierarchy are deemed to have occurred as of the beginning of the reporting period. The categorization of a value determined for investments and derivative financial instruments is based on the pricing transparency of the investments and derivative financial instruments and is not necessarily an indication of the risks associated with investing in those securities.
As of January 31, 2017, certain investments of the Funds were valued using NAV per share as no quoted market value is available and therefore have been excluded from the fair value hierarchy.
4. Securities and Other Investments:
Asset-Backed and Mortgage-Backed Securities: Asset-backed securities are generally issued as pass-through certificates or as debt instruments. Asset-backed securities issued as pass-through certificates represent undivided fractional ownership interests in an underlying pool of assets. Asset-backed securities issued as debt instruments, which are also known as collateralized obligations, are typically issued as the debt of a special purpose entity organized solely for the purpose of owning such assets and issuing such debt. Asset-backed securities are often backed by a pool of assets representing the obligations of a number of different parties. The yield characteristics of certain asset-backed securities may differ from traditional debt securities. One such major difference is that all or a principal part of the obligations may be prepaid at any time because the underlying assets (i.e., loans) may be prepaid at any time. As a result, a decrease in interest rates in the market may result in increases in the level of prepayments as borrowers, particularly mortgagors, refinance and repay their loans. An increased prepayment rate with respect to an asset-backed security will have the effect of shortening the maturity of the security. In addition, a Fund may subsequently have to reinvest the proceeds at lower interest rates. If a Fund has purchased such an asset-backed security at a premium, a faster than anticipated prepayment rate could result in a loss of principal to the extent of the premium paid.
For mortgage pass-through securities (the “Mortgage Assets”) there are a number of important differences among the agencies and instrumentalities of the U.S. Government that issue mortgage-related securities and among the securities that they issue. For example, mortgage-related securities guaranteed by Ginnie Mae are guaranteed as to the timely payment of principal and interest by Ginnie Mae and such guarantee is backed by the full faith and credit of the United States. However, mortgage-related securities issued by Freddie Mac and Fannie Mae, including Freddie Mac and Fannie Mae guaranteed mortgage pass-through certificates, which are solely the obligations of Freddie Mac and Fannie Mae, are not backed by or entitled to the full faith and credit of the United States, but are supported by the right of the issuer to borrow from the U.S. Treasury.
Non-agency mortgage-backed securities are securities issued by non-governmental issuers and have no direct or indirect government guarantees of payment and are subject to various risks. Non-agency mortgage loans are obligations of the borrowers thereunder only and are not typically insured or guaranteed by any other person or entity. The ability of a borrower to repay a loan is dependent upon the income or assets of the borrower. A number of factors, including a general economic downturn, acts of God, terrorism, social unrest and civil disturbances, may impair a borrower’s ability to repay its loans.
| | | | | | |
| 64 | | BLACKROCK FUNDS | | JANUARY 31, 2017 | | |
| | | | |
| Notes to Financial Statements (continued) | | | | |
Collateralized Debt Obligations: Collateralized debt obligations (“CDOs”), including collateralized bond obligations (“CBOs”) and collateralized loan obligations (“CLOs”), are types of asset-backed securities. A CDO is an entity that is backed by a diversified pool of debt securities (CBOs) or syndicated bank loans (CLOs). The cash flows of the CDO can be split into multiple segments, called “tranches,” which will vary in risk profile and yield. The riskiest segment is the subordinated or “equity” tranche. This tranche bears the greatest risk of defaults from the underlying assets in the CDO and serves to protect the other, more senior, tranches from default in all but the most severe circumstances. Since it is shielded from defaults by the more junior tranches, a “senior” tranche will typically have higher credit ratings and lower yields than their underlying securities, and often receive investment grade ratings from one or more of the nationally recognized rating agencies. Despite the protection from the more junior tranches, senior tranches can experience substantial losses due to actual defaults, increased sensitivity to future defaults and the disappearance of one or more protecting tranches as a result of changes in the credit profile of the underlying pool of assets.
Inflation-Indexed Bonds: Inflation-indexed bonds (other than municipal inflation-indexed and certain corporate inflation-indexed bonds) are fixed income securities whose principal value is periodically adjusted according to the rate of inflation. If the index measuring inflation rises or falls, the principal value of inflation-indexed bonds (other than municipal inflation-indexed and certain corporate inflation-indexed bonds) will be adjusted upward or downward, and consequently the interest payable on these securities (calculated with respect to a larger or smaller principal amount) will be increased or reduced, respectively. Any upward or downward adjustment in the principal amount of an inflation-indexed bond will be included as interest income in the Statements of Operations, even though investors do not receive their principal until maturity. Repayment of the original bond principal upon maturity (as adjusted for inflation) is guaranteed in the case of U.S. Treasury inflation-indexed bonds. For bonds that do not provide a similar guarantee, the adjusted principal value of the bond repaid at maturity may be less than the original principal. With regard to municipal inflation-indexed bonds and certain corporate inflation-indexed bonds, the inflation adjustment is typically reflected in the semi-annual coupon payment. As a result, the principal value of municipal inflation-indexed bonds and such corporate inflation-indexed bonds does not adjust according to the rate of inflation.
Multiple Class Pass-Through Securities: Multiple class pass-through securities, including collateralized mortgage obligations (“CMOs”) and commercial mortgage-backed securities, may be issued by Ginnie Mae, U.S. Government agencies or instrumentalities or by trusts formed by private originators of, or investors in, mortgage loans. In general, CMOs are debt obligations of a legal entity that are collateralized by a pool of residential or commercial mortgage loans or Mortgage Assets. The payments on these are used to make payments on the CMOs or multiple pass-through securities. Multiple class pass-through securities represent direct ownership interests in the Mortgage Assets. Classes of CMOs include interest only (“IOs”), principal only (“POs”), planned amortization classes and targeted amortization classes. IOs and POs are stripped mortgage-backed securities representing interests in a pool of mortgages, the cash flow from which has been separated into interest and principal components. IOs receive the interest portion of the cash flow while POs receive the principal portion. IOs and POs can be extremely volatile in response to changes in interest rates. As interest rates rise and fall, the value of IOs tends to move in the same direction as interest rates. POs perform best when prepayments on the underlying mortgages rise since this increases the rate at which the principal is returned and the yield to maturity on the PO. When payments on mortgages underlying a PO are slower than anticipated, the life of the PO is lengthened and the yield to maturity is reduced. If the underlying Mortgage Assets experience greater than anticipated prepayments of principal, a Fund’s initial investment in the IOs may not fully recoup.
Stripped Mortgage-Backed Securities: Stripped mortgage-backed securities are typically issued by the U.S. Government, its agencies and instrumentalities. Stripped mortgage-backed securities are usually structured with two classes that receive different proportions of the interest (IOs) and principal (POs) distributions on a pool of Mortgage Assets. Stripped mortgage-backed securities may be privately issued.
Zero-Coupon Bonds: Zero-coupon bonds, are normally issued at a significant discount from face value and do not provide for periodic interest payments. These bonds may experience greater volatility in market value than other debt obligations of similar maturity which provide for regular interest payments.
Commodity-Linked Notes: Commodity-linked notes seek to provide exposure to the investment returns of the commodities markets, without investing directly in commodities. In a commodity-linked note, a Fund purchases a note and, in return, the issuer typically provides for an interest payment and a principal payment at maturity linked to the price movement of the underlying commodity index less an agreed-upon fee. These notes may be issued by U.S. and foreign banks, brokerage firms, insurance companies and other corporations. In addition to credit, interest rate and counterparty risk typically associated with traditional debt investments, commodity-linked notes are subject to risks affecting the underlying commodity index. The value of the commodity-linked notes may fluctuate by changes in overall market movements, volatility of the underlying benchmark, changes in interest rates or factors affecting a particular industry or commodity, such as drought, floods, weather, livestock disease, embargoes, tariffs and international economic, political and regulatory developments. The commodity-linked notes have an automatic redemption feature if the underlying index declines from the original trade date by the amount specified in the agreement. A Fund has the option to request prepayment from the issuer at any time.
| | | | | | |
| | | BLACKROCK FUNDS | | JANUARY 31, 2017 | | 65 |
| | | | |
| Notes to Financial Statements (continued) | | | | |
Capital Securities and Trust Preferred Securities: Capital securities, including trust preferred securities, are typically issued by corporations, generally in the form of interest-bearing notes with preferred securities characteristics. In the case of trust preferred securities, an affiliated business trust of a corporation issues these securities, generally in the form of beneficial interests in subordinated debentures or similarly structured securities. The securities can be structured with either a fixed or adjustable coupon that can have either a perpetual or stated maturity date. For trust preferred securities, the issuing bank or corporation pays interest to the trust, which is then distributed to holders of these securities as a dividend. Dividends can be deferred without creating an event of default or acceleration, although maturity cannot take place unless all cumulative payment obligations have been met. The deferral of payments does not affect the purchase or sale of these securities in the open market. Payments on these securities are treated as interest rather than dividends for federal income tax purposes. These securities generally are rated below that of the issuing company’s senior debt securities and are freely callable at the issuer’s option.
Preferred Stock: Preferred stock has a preference over common stock in liquidation (and generally in receiving dividends as well), but is subordinated to the liabilities of the issuer in all respects. As a general rule, the market value of preferred stock with a fixed dividend rate and no conversion element varies inversely with interest rates and perceived credit risk, while the market price of convertible preferred stock generally also reflects some element of conversion value. Because preferred stock is junior to debt securities and other obligations of the issuer, deterioration in the credit quality of the issuer will cause greater changes in the value of a preferred stock than in a more senior debt security with similar stated yield characteristics. Unlike interest payments on debt securities, preferred stock dividends are payable only if declared by the issuer’s board of directors. Preferred stock also may be subject to optional or mandatory redemption provisions.
Warrants: Warrants entitle a Fund to purchase a specified number of shares of common stock and are non-income producing. The purchase price and number of shares are subject to adjustment under certain conditions until the expiration date of the warrants, if any. If the price of the underlying stock does not rise above the strike price before the warrant expires, the warrant generally expires without any value and a Fund will lose any amount it paid for the warrant. Thus, investments in warrants may involve more risk than investments in common stock. Warrants may trade in the same markets as their underlying stock; however, the price of the warrant does not necessarily move with the price of the underlying stock.
Floating Rate Loan Interests: Floating rate loan interests are typically issued to companies (the “borrower”) by banks, other financial institutions, or privately and publicly offered corporations (the “lender”). Floating rate loan interests are generally non-investment grade, often involve borrowers whose financial condition is troubled or uncertain and companies that are highly leveraged or in bankruptcy proceedings. In addition, transactions in floating rate loan interests may settle on a delayed basis, which may result to proceeds from the sale to not be readily available for a Fund to make additional investments or meet its redemption obligations. Floating rate loan interests may include fully funded term loans or revolving lines of credit. Floating rate loan interests are typically senior in the corporate capital structure of the borrower. Floating rate loan interests generally pay interest at rates that are periodically determined by reference to a base lending rate plus a premium. Since the rates reset only periodically, changes in prevailing interest rates (and particularly sudden and significant changes) can be expected to cause some fluctuations in the NAV of a Fund to the extent that it invests in floating rate loan interest. The base lending rates are generally the lending rate offered by one or more European banks, such as the London Interbank Offered Rate (“LIBOR”), the prime rate offered by one or more U.S. banks or the certificate of deposit rate. Floating rate loan interests may involve foreign borrowers, and investments may be denominated in foreign currencies. These investments are treated as investments in debt securities for purposes of a Fund’s investment policies.
When a Fund purchases a floating rate loan interest, it may receive a facility fee and when it sells a floating rate loan interest, it may pay a facility fee. On an ongoing basis, a Fund may receive a commitment fee based on the undrawn portion of the underlying line of credit amount of a floating rate loan interest. Facility and commitment fees are typically amortized to income over the term of the loan or term of the commitment, respectively. Consent and amendment fees are recorded to income as earned. Prepayment penalty fees, which may be received by a Fund upon the prepayment of a floating rate loan interest by a borrower, are recorded as realized gains. A Fund may invest in multiple series or tranches of a loan. A different series or tranche may have varying terms and carry different associated risks.
Floating rate loan interests are usually freely callable at the borrower’s option. A Fund may invest in such loans in the form of participations in loans (“Participations”) or assignments (“Assignments”) of all or a portion of loans from third parties. Participations typically will result in a Fund having a contractual relationship only with the lender, not with the borrower. A Fund has the right to receive payments of principal, interest and any fees to which it is entitled only from the lender selling the Participation and only upon receipt by the lender of the payments from the borrower. In connection with purchasing Participations, a Fund generally will have no right to enforce compliance by the borrower with the terms of the loan agreement, nor any rights of offset against the borrower. A Fund may not benefit directly from any collateral supporting the loan in which it has purchased the Participation. As a result, a Fund assumes the credit risk of both the borrower and the lender that is selling the Participation. A Fund’s investment in loan participation interests involves the risk of insolvency of the financial intermediaries who are parties to the transactions. In the event of the insolvency of the lender selling the Participation, a Fund may be treated as a general creditor of the lender and may not benefit from any offset between the lender and the borrower. Assignments typically result in a Fund having a direct contractual relationship with the borrower, and a Fund may enforce compliance by the borrower with the terms of the loan agreement.
| | | | | | |
| 66 | | BLACKROCK FUNDS | | JANUARY 31, 2017 | | |
| | | | |
| Notes to Financial Statements (continued) | | | | |
In connection with floating rate loan interests, Global Long/Short Credit may also enter into unfunded floating rate loan interests (“commitments”). In connection with these commitments, the Fund earns a commitment fee, typically set as a percentage of the commitment amount. Such fee income, which is included in interest income in the Statements of Operations, is recognized ratably over the commitment period. Unfunded floating rate loan interests are marked-to-market daily, and any unrealized appreciation (depreciation) is included in the Statements of Assets and Liabilities and Statements of Operations. As of period end, Global Long/Short Credit had the following unfunded floating rate loan interests:
| | | | | | | | |
| Borrower | | Par | | Commitment Amount | | Value | | Unrealized Appreciation |
Allied Universal Holdco LLC (FKA USAGM Holdco LLC) | | $934,973 | | $934,973 | | $940,817 | | $5,844 |
Borrowed Bond Agreements: Repurchase agreements may be referred to as borrowed bond agreements when entered into in connection with short sales of bonds. In a borrowed bond agreement, a Fund borrows a bond from a counterparty in exchange for cash collateral. The agreement contains a commitment that the security and the cash will be returned to the counterparty and a Fund at a mutually agreed upon date. Certain agreements have no stated maturity and can be terminated by either party at any time. Earnings on cash collateral and compensation to the lender of the bond are based on agreed upon rates between a Fund and the counterparty. The value of the underlying cash collateral approximates the market value and accrued interest of the borrowed bond. To the extent that a borrowed bond transaction exceeds one business day, the value of the cash collateral in the possession of the counterparty is monitored on a daily basis to ensure the adequacy of the collateral. As the market value of the borrowed bond changes, the cash collateral is periodically increased or decreased with a frequency and in amounts prescribed in the borrowed bond agreement. A Fund may also experience delays in gaining access to the collateral.
Reverse Repurchase Agreements: Reverse repurchase agreements are agreements with qualified third party broker dealers in which a Fund sells securities to a bank or broker-dealer and agrees to repurchase the same securities at a mutually agreed upon date and price. A Fund receives cash from the sale to use for other investment purposes. During the term of the reverse repurchase agreement, a Fund continues to receive the principal and interest payments on the securities sold. Certain agreements have no stated maturity and can be terminated by either party at any time. Interest on the value of the reverse repurchase agreements issued and outstanding is based upon competitive market rates determined at the time of issuance. A Fund may utilize reverse repurchase agreements when it is anticipated that the interest income to be earned from the investment of the proceeds of the transaction is greater than the interest expense of the transaction. Reverse repurchase agreements involve leverage risk. If a Fund suffers a loss on its investment of the transaction proceeds from a reverse repurchase agreement, a Fund would still be required to pay the full repurchase price. Further, a Fund remains subject to the risk that the market value of the securities repurchased declines below the repurchase price. In such cases, a Fund would be required to return a portion of the cash received from the transaction or provide additional securities to the counterparty.
Cash received in exchange for securities delivered plus accrued interest due to the counterparty is recorded as a liability in the Statements of Assets and Liabilities at face value including accrued interest. Due to the short- term nature of the reverse repurchase agreements, face value approximates fair value. Interest payments made by a Fund to the counterparties are recorded as a component of interest expense in the Statements of Operations. In periods of increased demand for the security, a Fund may receive a fee for use of the security by the counterparty, which may result in interest income to a Fund.
For the six months ended January 31, 2017, the average amount of reverse repurchase agreements outstanding and the daily weighted average interest rate for Global Long/Short Credit were $45,810,452 and (0.08)%, respectively.
Borrowed bond agreements and reverse repurchase transactions are entered into by a Fund under Master Repurchase Agreements (each, an “MRA”), which permit a Fund, under certain circumstances, including an event of default (such as bankruptcy or insolvency), to offset payables and/or receivables under the MRA with collateral held and/or posted to the counterparty and create one single net payment due to or from a Fund. With borrowed bond agreements and reverse repurchase transactions, typically a Fund and counterparty under an MRA are permitted to sell, re-pledge, or use the collateral associated with the transaction. Bankruptcy or insolvency laws of a particular jurisdiction may impose restrictions on or prohibitions against such a right of offset in the event of the MRA counterparty’s bankruptcy or insolvency. Pursuant to the terms of the MRA, a Fund receives or posts securities as collateral with a market value in excess of the repurchase price to be paid or received by a Fund upon the maturity of the transaction. Upon a bankruptcy or insolvency of the MRA counterparty, a Fund is considered an unsecured creditor with respect to excess collateral and, as such, the return of excess collateral may be delayed.
| | | | | | |
| | | BLACKROCK FUNDS | | JANUARY 31, 2017 | | 67 |
| | | | |
| Notes to Financial Statements (continued) | | | | |
As of period end, the following table is a summary of Global Long/Short Credit’s open borrowed bond agreements and reverse repurchase agreements by counterparty which are subject to offset under an MRA on a net basis:
| | | | | | | | | | | | | | | | | | | | | | | | | | | | | | | | | | | | |
| Counterparty | | Borrowed Bond
Agreements1 | | | Reverse
Repurchase
Agreements | | | Borrowed Bonds at Value
including
Accrued Interest2 | | | Net Amount
before
Collateral | | | Non-cash
Collateral
Received | | | Cash Collateral
Received | | | Non-cash
Collateral
Pledged | | | Net Collateral
(Received)/
Pledged3 | | | Net Exposure Due (to)/from Counterparty4 | |
Amherst Pierpont Securities LLC | | $ | 44,769,366 | | | | — | | | $ | (44,790,875 | ) | | $ | (21,509 | ) | | | — | | | | — | | | $ | 21,509 | | | $ | 21,509 | | | | — | |
Barclays Bank PLC | | | 30,951,952 | | | | — | | | | (30,707,384 | ) | | | 244,568 | | | | — | | | $ | (244,568 | ) | | | — | | | | (244,568 | ) | | | — | |
Barclays Capital, Inc. | | | 110,295,509 | | | | — | | | | (107,180,699 | ) | | | 3,114,810 | | | | — | | | | — | | | | 1,002,370 | | | | 1,002,370 | | | $ | 4,117,180 | 5 |
BNP Paribas Securities Corp. | | | 70,774,342 | | | | — | | | | (71,219,845 | ) | | | (445,503 | ) | | | — | | | | — | | | | — | | | | — | | | | (445,503 | ) |
Citigroup Global Markets, Inc. | | | 121,967,648 | | | | — | | | | (116,525,344 | ) | | | 5,442,304 | | | | — | | | | (5,442,304 | ) | | | — | | | | (5,442,304 | ) | | | — | |
Credit Suisse Securities (USA) LLC | | | 84,853,250 | | | | — | | | | (84,186,554 | ) | | | 666,696 | | | | — | | | | — | | | | — | | | | — | | | | 666,696 | |
Deutsche Bank AG | | | 32,416,307 | | | | — | | | | (21,588,047 | ) | | | 10,828,260 | | | | — | | | | — | | | | — | | | | — | | | | 10,828,260 | 6 |
Deutsche Bank Securities, Inc. | | | 77,916,019 | | | | — | | | | (74,337,789 | ) | | | 3,578,230 | | | $ | (3,578,230 | ) | | | — | | | | — | | | | (3,578,230 | ) | | | — | |
J.P. Morgan Securities LLC | | | 131,322,025 | | | | — | | | | (131,834,880 | ) | | | (512,855 | ) | | | — | | | | — | | | | — | | | | — | | | | (512,855 | ) |
J.P. Morgan Securities PLC | | | 35,776,301 | | | | — | | | | (33,947,093 | ) | | | 1,829,208 | | | | — | | | | (50,000 | ) | | | — | | | | (50,000 | ) | | | 1,779,208 | 7 |
Merrill Lynch, Pierce, Fenner & Smith, Inc. | | | 34,541,250 | | | | — | | | | (32,669,819 | ) | | | 1,871,431 | | | | (1,871,431 | ) | | | — | | | | — | | | | (1,871,431 | ) | | | — | |
Morgan Stanley & Co. LLC | | | 86,167,813 | | | | — | | | | (86,422,058 | ) | | | (254,245 | ) | | | — | | | | — | | | | — | | | | — | | | | (254,245 | ) |
RBC Capital Markets, LLC | | | 197,857,265 | | | $ | (33,569,633 | ) | | | (190,104,693 | ) | | | (25,817,061 | ) | | | (542,572 | ) | | | — | | | | 33,569,633 | | | | 33,027,061 | | | | 7,210,000 | 8 |
| | | | |
Total | | $ | 1,059,609,047 | | | $ | (33,569,633 | ) | | $ | (1,025,515,080 | ) | | $ | 524,334 | | | $ | (5,992,233 | ) | | $ | (5,736,872 | ) | | $ | 34,593,512 | | | $ | 22,864,407 | | | $ | 23,388,741 | |
| | | | |
| | 1 | | Included in Investments at value — unaffiliated in the Statements of Assets and Liabilities. |
| | 2 | | Includes accrued interest on borrowed bonds in the amount of $8,804,413 which is included in interest expense payable in the Statements of Assets and Liabilities. |
| | 3 | | Net collateral with a value including accrued interest of $35,842,842 has been pledged/received in connection with open reverse repurchase agreements. Excess of net collateral pledged to the individual counterparty is not shown for financial reporting purposes. |
| | 4 | | Net exposure represents the net receivable (payable) that would be due from/to the counterparty in the event of default. |
| | 5 | | Borrowed bond agreements with a value of $4,147,000, have been purchased and are pending settlement as of January 31, 2017. |
| | 6 | | Borrowed bond agreements with a value of $10,645,315, have been purchased and are pending settlement as of January 31, 2017. |
| | 7 | | Borrowed bond agreements with a value of $845,917, have been purchased and are pending settlement as of January 31, 2017. |
| | 8 | | Borrowed bond agreements with a value of $7,210,000, have been purchased and are pending settlement as of January 31, 2017. |
When a Fund enters into an MRA and International Swaps and Derivatives Association, Inc. (an “ISDA”) and/or Master Securities Lending Agreements (“MSLA”) with the same counterparty, the agreements may contain a set-off provision allowing a fund to offset a net amount payable with a net amount receivable upon default of the counterparty. Bankruptcy or insolvency laws of a particular jurisdiction may restrict or prohibit the right of offset in bankruptcy, insolvency or other events. For example, regardless of the contractual rights included in an MRA, such laws may prohibit a Fund from setting off amounts owed to a defaulting counterparty under an MRA against amounts owed to a Fund by affiliates of the defaulting counterparty. However, the insolvency regimes of many jurisdictions generally permit set-off of simultaneous payables and receivables with the same legal entity under certain types of financial contracts. These rules would apply upon a default of the legal entity, regardless of the existence of a contractual set-off right in those contracts.
In the event the counterparty of securities under an MRA files for bankruptcy or becomes insolvent, a Fund’s use of the proceeds from the agreement may be restricted while the counterparty, or its trustee or receiver, determines whether or not to enforce a Fund’s obligation to repurchase the securities.
Short Sales (Borrowed Bonds): In short sale transactions, a Fund sells a security it does not hold in anticipation of a decline in the market price of that security. When a Fund makes a short sale, it will borrow the security sold short (borrowed bond) and deliver the fixed-income security to the counterparty to which it sold the security short. An amount equal to the proceeds received by a Fund is reflected as an asset and an equivalent liability. The amount of the liability is subsequently marked-to-market to reflect the market value of the short sale. A Fund is required to repay the counterparty interest on the security sold short, which, if applicable, is shown as interest expense in the Statements of Operations. A Fund is exposed to market risk based on the amount, if any, that the market value of the security increases beyond the market value at which the position was sold. Thus, a short sale of a security involves the risk that instead of declining, the price of the security sold short will rise. The short sale of securities involves the possibility of an unlimited loss since there is an unlimited potential for the market price of the security sold short to increase. A gain is limited to the price at which a Fund sold the security short. A realized gain or loss is recognized upon the termination of a short sale if the market price is either less than or greater than the proceeds originally received. There is no assurance that a Fund will be able to close out a short position at a particular time or at an acceptable price.
| | | | | | |
| 68 | | BLACKROCK FUNDS | | JANUARY 31, 2017 | | |
| | | | |
| Notes to Financial Statements (continued) | | | | |
Short Sales (Investments Sold Short): In short sale transaction, a Fund sells a security it does not hold in anticipation of a decline in the market price of that security. When a Fund makes a short sale, it will borrow the security sold short from a broker/counterparty and deliver the security to the purchaser. To close out a short position, a Fund delivers the same security to the broker and records a liability to reflect the obligation to return the security to the broker. The amount of the liability is subsequently marked-to-market to reflect the market value of the short sale. A Fund maintains a segregated account of securities or deposits cash with the broker-dealer as collateral for the short sales. Cash deposited with the broker is recorded as an asset in the Statements of Assets and Liabilities. Securities segregated as collateral are denoted in the Schedules of Investments. A Fund may pay a financing fee for the difference between the market value of the short position and the cash collateral deposited with the broker which would be recorded as interest expense. A Fund is required to repay the counterparty any dividends received on the security sold short, which, if applicable, is shown as dividend expense in the Statements of Operations. A Fund may pay a fee on the assets borrowed from the counterparty, which, if applicable, is shown as broker fees and expenses on short sales in the Statements of Operations. A Fund is exposed to market risk based on the amount, if any, that the market value of the security increases beyond the market value at which the position was sold. Thus, a short sale of a security involves the risk that instead of declining, the price of the security sold short will rise. The short sale of securities involves the possibility of an unlimited loss since there is an unlimited potential for the market price of the security sold short to increase. A gain, limited to the price at which a Fund sold the security short. A realized gain or loss is recognized upon the termination of a short sale if the market price is either less than or greater than the proceeds originally received. There is no assurance that a Fund will be able to close out a short position at a particular time or at an acceptable price.
Securities Lending: Certain Funds may lend their securities to approved borrowers, such as brokers, dealers and other financial institutions. The borrower pledges and maintains with the Funds collateral consisting of cash, an irrevocable letter of credit issued by a bank, or securities issued or guaranteed by the U.S. Government. The initial collateral received by each Fund is required to have a value of at least 102% of the current value of the loaned securities for securities traded on U.S. exchanges and a value of at least 105% for all other securities. The collateral is maintained thereafter at a value equal to at least 100% of the current market value of the securities on loan. The market value of the loaned securities is determined at the close of each business day of the Fund and any additional required collateral is delivered to the Fund, or excess collateral returned by the Fund, on the next business day. During the term of the loan, the Funds are entitled to all distributions made on or in respect of the loaned securities, but does not receive interest income on securities received as collateral. Loans of securities are terminable at any time and the borrower, after notice, is required to return borrowed securities within the standard time period for settlement of securities transactions.
The market value of any securities on loan, all of which were classified as common stocks in the Funds’ Schedules of Investments, and the value of any related collateral are shown separately in the Statements of Assets and Liabilities as a component of investments at value-unaffiliated, and collateral on securities loaned at value, respectively. As of period end, any securities on loan were collateralized by cash and/or U.S. Government obligations. Cash collateral invested by the securities lending agent, BlackRock Investment Management, LLC (“BIM”), if any, is disclosed in the Schedules of Investments.
Securities lending transactions are entered into by the Funds under an MSLA, which provide the right, in the event of default (including bankruptcy or insolvency), for the non-defaulting party to liquidate the collateral and calculate a net exposure to the defaulting party or request additional collateral. In the event that a borrower defaults, the Funds, as lender, would offset the market value of the collateral received against the market value of the securities loaned. When the value of the collateral is greater than that of the market value of the securities loaned, the lender is left with a net amount payable to the defaulting party. However, bankruptcy or insolvency laws of a particular jurisdiction may impose restrictions on or prohibitions against such a right of offset in the event of an MSLA counterparty’s bankruptcy or insolvency. Under the MSLA, absent an event of default, the borrower can resell or re-pledge the loaned securities, and a Fund can reinvest cash collateral received in connection with loaned securities. Upon an event of default, the parties’ obligations to return the securities or collateral to the other party are extinguished, and the parties can resell or re-pledge the loaned securities or the collateral received in connection with the loaned securities in order to satisfy the defaulting party’s net payment obligation for all transactions under the MSLA. The defaulting party remains liable for any deficiency.
As of period end, the following table is a summary of Commodity Strategies’ securities lending agreements by counterparty which are subject to offset under an MSLA:
| | | | | | | | | | |
| Counterparty | | Securities Loaned
at Value | | | Cash Collateral
Received1 | | | Net Amount |
Barclays Capital Inc. | | | $ 115,846 | | | | $ (115,846 | ) | | — |
Citigroup Global Markets, Inc. | | | 17,783 | | | | (17,783 | ) | | — |
Credit Suisse Securities (USA) LLC | | | 324,620 | | | | (324,620 | ) | | — |
JP Morgan Securities LLC | | | 27,282 | | | | (27,282 | ) | | — |
Merrill Lynch, Pierce, Fenner & Smith Inc. | | | 97,542 | | | | (97,542 | ) | | — |
Morgan Stanley & Co. LLC | | | 500,372 | | | | (500,372 | ) | | — |
| | | |
Total | | | $1,083,445 | | | | $(1,083,445 | ) | | — |
| | | |
| | 1 | | Collateral with a value of $1,313,714 has been received in connection with securities lending agreements. Collateral received in excess of the value of securities loaned from the individual counterparty is not shown for financial reporting purposes in the table above. |
| | | | | | |
| | | BLACKROCK FUNDS | | JANUARY 31, 2017 | | 69 |
| | | | |
| Notes to Financial Statements (continued) | | | | |
The risks of securities lending include the risk that the borrower may not provide additional collateral when required or may not return the securities when due. To mitigate these risks, the Funds benefit from a borrower default indemnity provided by BIM. BIM’s indemnity allows for full replacement of the securities loaned if the collateral received does not cover the value on the securities loaned in the event of borrower default. Each Fund could suffer a loss if the value of an investment purchased with cash collateral falls below the market value of loaned securities or if the value of an investment purchased with cash collateral falls below the value of the original cash collateral received.
5. Derivative Financial Instruments:
Certain Funds engage in various portfolio investment strategies using derivative contracts both to increase the returns of the Funds and/or to manage their exposure to certain risks such as credit risk, equity risk, interest rate risk, foreign currency exchange rate risk, commodity price risk or other risks (e.g., inflation risk). Derivative financial instruments categorized by risk exposure are included in the Schedules of Investments. These contracts may be transacted on an exchange or OTC.
Futures Contracts: Certain Funds invest in long and/or short positions in futures and options on futures contracts to gain exposure to, or manage exposure to, changes in interest rates (interest rate risk), changes in the value of equity securities (equity risk) or foreign currencies (foreign currency exchange rate risk).
Futures contracts are agreements between the Funds and a counterparty to buy or sell a specific quantity of an underlying instrument at a specified price and on a specified date. Depending on the terms of a contract, it is settled either through physical delivery of the underlying instrument on the settlement date or by payment of a cash amount on the settlement date. Upon entering into a futures contract, the Funds are required to deposit initial margin with the broker in the form of cash or securities in an amount that varies depending on a contract’s size and risk profile. The initial margin deposit must then be maintained at an established level over the life of the contract.
Securities deposited as initial margin are designated in the Schedules of Investments and cash deposited, if any, is shown as cash pledged for futures contracts in the Statements of Assets and Liabilities. Pursuant to the contract, the Funds agree to receive from or pay to the broker an amount of cash equal to the daily fluctuation in market value of the contract (“variation margin”). Variation margin is recorded as unrealized appreciation (depreciation) and, if any, shown as variation margin receivable (or payable) on futures contracts in the Statements of Assets and Liabilities. When the contract is closed, a realized gain or loss is recorded in the Statements of Operations equal to the difference between the value of the contract at the time it was opened and the value at the time it was closed. The use of futures contracts involves the risk of an imperfect correlation in the movements in the price of futures contracts and interest, foreign currency exchange rates or underlying assets.
Forward Foreign Currency Exchange Contracts: Certain Funds enter into forward foreign currency exchange contracts to gain or reduce exposure to foreign currencies (foreign currency exchange rate risk).
A forward foreign currency exchange contract is an agreement between two parties to buy and sell a currency at a set exchange rate on a specified date. These contracts help to manage the overall exposure to the currencies in which some of the investments held by the Funds are denominated and in some cases, may be used to obtain exposure to a particular market.
The contract is marked to market daily and the change in market value is recorded as unrealized appreciation (depreciation) in the Statements of Assets and Liabilities. When a contract is closed, a realized gain or loss is recorded in the Statements of Operations equal to the difference between the value at the time it was opened and the value at the time it was closed. Non-deliverable forward foreign currency exchange contracts are settled with the counterparty in cash without the delivery of foreign currency. The use of forward foreign currency exchange contracts involves the risk that the value of a forward foreign currency exchange contract changes unfavorably due to movements in the value of the referenced foreign currencies.
Options: Certain Funds purchase and write call and put options to increase or decrease their exposure to the risks of underlying instruments, including equity risk, interest rate risk and/or commodity price risk and/or, in the case of options written, to generate gains from options premiums.
A call option gives the purchaser (holder) of the option the right (but not the obligation) to buy, and obligates the seller (writer) to sell (when the option is exercised) the underlying instrument at the exercise or strike price at any time or at a specified time during the option period. A put option gives the holder the right to sell and obligates the writer to buy the underlying instrument at the exercise or strike price at any time or at a specified time during the option period.
Premiums paid on options purchased and premiums received on options written, as well as the daily fluctuation in market value, are included in investments at value — unaffiliated and options written at value, respectively, in the Statements of Assets and Liabilities. When an instrument is purchased or sold through the exercise of an option, the premium is offset against the cost or proceeds of the underlying instrument. When an option expires, a realized gain or loss is recorded in the Statements of Operations to the extent of the premiums received or paid. When an option is closed or sold, a gain or loss is recorded in the Statements of Operations to the extent the cost of the closing transaction exceeds the premiums received or paid. When
| | | | | | |
| 70 | | BLACKROCK FUNDS | | JANUARY 31, 2017 | | |
| | | | |
| Notes to Financial Statements (continued) | | | | |
the Funds write a call option, such option is typically “covered,” meaning that they hold the underlying instrument subject to being called by the option counterparty. When the Funds write a put option, such option is covered by cash in an amount sufficient to cover the obligation.
| • | | Swaptions — Certain Funds purchase and write options on swaps (“swaptions”) primarily to preserve a return or spread on a particular investment or portion of the Funds’ holdings, as a duration management technique or to protect against an increase in the price of securities it anticipates purchasing at a later date. The purchaser and writer of a swaption is buying or granting the right to enter into a previously agreed upon interest rate or credit default swap agreement (interest rate risk and/or credit risk) at any time before the expiration of the option. |
| • | | Foreign Currency options — Certain Funds purchase and write foreign currency options, foreign currency futures and options on foreign currency futures to gain or reduce exposure to foreign currencies (foreign currency exchange rate risk). Foreign currency options give the purchaser the right to buy from or sell to the writer a foreign currency at any time before the expiration of the option. |
In purchasing and writing options, the Funds bear the risk of an unfavorable change in the value of the underlying instrument or the risk that they may not be able to enter into a closing transaction due to an illiquid market. Exercise of a written option could result in the Funds purchasing or selling a security when it otherwise would not, or at a price different from the current market value.
Swaps: Certain Funds enter into swap contracts to manage exposure to issuers, markets and securities. Such contracts are agreements between the Funds and a counterparty to make periodic net payments on a specified notional amount or a net payment upon termination. Swap agreements are privately negotiated in the OTC market and may be entered into as a bilateral contract (“OTC swaps”) or centrally cleared (“centrally cleared swaps”).
For OTC swaps, any upfront premiums paid and any upfront fees received are shown as swap premiums paid and swap premiums received, respectively, in the Statements of Assets and Liabilities and amortized over the term of the contract. The daily fluctuation in market value is recorded as unrealized appreciation (depreciation) on OTC Swaps in the Statements of Assets and Liabilities. Payments received or paid are recorded in the Statements of Operations as realized gains or losses, respectively. When an OTC swap is terminated, a realized gain or loss is recorded in the Statements of Operations equal to the difference between the proceeds from (or cost of) the closing transaction and the Funds’ basis in the contract, if any. Generally, the basis of the contract is the premium received or paid.
In a centrally cleared swap, immediately following execution of the swap contract, the swap contract is novated to a central counterparty (the “CCP”) and the Funds’ counterparty on the swap agreement becomes the CCP. The Funds are required to interface with the CCP through the broker. Upon entering into a centrally cleared swap, the Funds are required to deposit initial margin with the broker in the form of cash or securities in an amount that varies depending on the size and risk profile of the particular swap. Securities deposited as initial margin are designated in the Schedules of Investments and cash deposited is shown as cash pledged for centrally cleared swaps in the Statements of Assets and Liabilities. Pursuant to the contract, the Funds agree to receive from or pay to the broker an amount of cash equal to the daily fluctuation in market value of the contract (“variation margin”). Variation margin is recorded as unrealized appreciation (depreciation) and shown as variation margin receivable (or payable) on centrally cleared swaps in the Statements of Assets and Liabilities. Payments received from (paid to) the counterparty, including at termination, are recorded as realized gains (losses) in the Statements of Operations.
| • | | Credit default swaps — Certain Funds enter into credit default swaps to manage their exposure to the market or certain sectors of the market, to reduce their risk exposure to defaults of corporate and/or sovereign issuers or to create exposure to corporate and/or sovereign issuers to which they are not otherwise exposed (credit risk). |
The Funds may either buy or sell (write) credit default swaps on single-name issuers (corporate or sovereign), a combination or basket of single-name issuers or traded indexes. Credit default swaps are agreements in which the protection buyer pays fixed periodic payments to the seller in consideration for a promise from the protection seller to make a specific payment should a negative credit event take place with respect to the referenced entity (e.g., bankruptcy, failure to pay, obligation acceleration, repudiation, moratorium or restructuring). As a buyer, if an underlying credit event occurs, the Funds will either (i) receive from the seller an amount equal to the notional amount of the swap and deliver the referenced security or underlying securities comprising the index, or (ii) receive a net settlement of cash equal to the notional amount of the swap less the recovery value of the security or underlying securities comprising the index. As a seller (writer), if an underlying credit event occurs, the Funds will either pay the buyer an amount equal to the notional amount of the swap and take delivery of the referenced security or underlying securities comprising the index or pay a net settlement of cash equal to the notional amount of the swap less the recovery value of the security or underlying securities comprising the index.
| • | | Total return swaps — Certain Funds enter into total return swaps to obtain exposure to a security or market without owning such security or investing directly in such market or to exchange the risk/return of one market (e.g., fixed income) with another market (e.g., equity or commodity prices) (equity risk, commodity price risk and/or interest rate risk). |
Total return swaps are agreements in which there is an exchange of cash flows whereby one party commits to make payments based on the total return (distributions plus capital gains/losses) of an underlying instrument in exchange for fixed or floating rate interest payments. If the total return
| | | | | | |
| | | BLACKROCK FUNDS | | JANUARY 31, 2017 | | 71 |
| | | | |
| Notes to Financial Statements (continued) | | | | |
of the instrument or index underlying the transaction exceeds or falls short of the offsetting fixed or floating interest rate obligation, the Funds receive payment from or make a payment to the counterparty.
| • | | Total return basket swaps — Certain Funds enter into total return swaps to obtain exposure to a portfolio of long and short securities without owning such securities. |
Under the terms of a contract, the swap is designed to function as a portfolio of direct investments in long and short equity positions. This means that each Fund has the ability to trade in and out of these long and short positions within the swap and will receive the economic benefits and risks equivalent to direct investment in these positions, subject to certain adjustments due to events related to the counterparty. Benefits and risks include capital appreciation (depreciation), corporate actions and dividends received and paid, all of which are reflected in the swap’s market value. The market value also includes interest charges and credits (“financing fees”) related to the notional values of the long and short positions and cash balances within the swap. These interest charges and credits are based on a specified benchmark rate plus or minus a specified spread determined based upon the country and/or currency of the positions in the portfolio.
Positions within the swap and financing fees are reset periodically. During a reset, any unrealized appreciation (depreciation) on positions and accrued financing fees become available for cash settlement between the Funds and the counterparty. The amounts that are available for cash settlement are recorded as realized gains or losses in the Statements of Operations. Cash settlement in and out of the swap may occur at a reset date or any other date, at the discretion of the Funds and the counterparty, over the life of the agreement. Certain swaps have no stated expiration and can be terminated by either party at any time.
| • | | Interest rate swaps — Certain Funds enter into interest rate swaps to gain or reduce exposure to interest rates or to manage duration, the yield curve or interest rate (interest rate risk). |
Interest rate swaps are agreements in which one party pays a stream of interest payments, either fixed or floating, in exchange for another party’s stream of interest payments, either fixed or floating, on the same notional amount for a specified period of time. In more complex interest rate swaps, the notional principal amount may decline (or amortize) over time.
| • | | Currency swaps — Certain Funds enter into currency swaps to gain or reduce exposure to foreign currencies (foreign currency exchange rate risk). |
Currency swaps are interest rate swaps in which one party pays a stream of interest payments, either fixed or floating, in exchange for another party’s stream of interest payments, either fixed or floating, based on the notional amounts of two different currencies. The notional amounts are typically determined based on the spot exchange rates at the inception of the trade. Currency swaps may also involve an exchange of notional amounts at the start, during and/or at expiration of the contract, either at the current spot rate or another specified rate.
| • | | Forward swaps — Certain Funds enter into forward interest rate swaps and forward total return swaps. In a forward swap, each Fund and the counterparty agree to make periodic net payments beginning on a specified date or a net payment at termination. |
| • | | Inflation swaps — Certain Funds enter into inflation swaps to gain or reduce exposure to inflation (inflation risk). In an inflation swap, one party makes fixed interest payments on a notional principal amount in exchange for another party’s stream of variable payments based on an inflation index, such as the Consumer Price Index. |
Swap transactions involve, to varying degrees, elements of interest rate, credit and market risk in excess of the amounts recognized in the Statements of Assets and Liabilities. Such risks involve the possibility that there will be no liquid market for these agreements, that the counterparty to the agreements may default on its obligation to perform or disagree as to the meaning of the contractual terms in the agreements, and that there may be unfavorable changes in interest rates and/or market values associated with these transactions.
Master Netting Arrangements: In order to define their contractual rights and to secure rights that will help them mitigate their counterparty risk, the Funds may enter into an International Swaps and Derivatives Association, Inc. Master Agreement (“ISDA Master Agreement”) or similar agreement with their counterparties. An ISDA Master Agreement is a bilateral agreement between each Fund and a counterparty that governs certain OTC derivatives and typically contains, among other things, collateral posting terms and netting provisions in the event of a default and/or termination event. Under an ISDA Master Agreement, each Fund may, under certain circumstances, offset with the counterparty certain derivative financial instruments’ payables and/or receivables with collateral held and/or posted and create one single net payment. The provisions of the ISDA Master Agreement typically permit a single net payment in the event of default including the bankruptcy or insolvency of the counterparty. Bankruptcy or insolvency laws of a particular jurisdiction may restrict or prohibit the right of offset in bankruptcy, insolvency or other events. In addition, certain ISDA Master Agreements allow counterparties to terminate derivative contracts prior to maturity in the event the Funds’ net assets decline by a stated percentage or the Funds fail to meet the terms of their ISDA Master Agreements. The result would cause the Funds to accelerate payment of any net liability owed to the counterparty.
| | | | | | |
| 72 | | BLACKROCK FUNDS | | JANUARY 31, 2017 | | |
| | | | |
| Notes to Financial Statements (continued) | | | | |
Collateral Requirements: For derivatives traded under an ISDA Master Agreement, the collateral requirements are typically calculated by netting the mark-to-market amount for each transaction under such agreement and comparing that amount to the value of any collateral currently pledged by the Fund and the counterparty.
Cash collateral that has been pledged to cover obligations of the Funds and cash collateral received from the counterparty, if any, is reported separately on the Statements of Assets and Liabilities as cash pledged as collateral and cash received as collateral, respectively. Non-cash collateral pledged by the Funds, if any, is noted in the Schedules of Investments. Generally, the amount of collateral due from or to a counterparty is subject to a certain minimum transfer amount threshold before a transfer is required, which is determined at the close of business of the Funds. Any additional required collateral is delivered to/pledged by the Funds on the next business day. Typically, the counterparty is not permitted to sell, re-pledge or use cash and non-cash collateral it receives. A Fund generally agrees not to use non-cash collateral that it receives but may, absent default or certain other circumstances defined in the underlying ISDA Master Agreement, be permitted to use cash collateral received. In such cases, interest may be paid pursuant to the collateral arrangement with the counterparty. To the extent amounts due to the Funds from their counterparties are not fully collateralized, they bear the risk of loss from counterparty non-performance. Likewise, to the extent the Funds have delivered collateral to a counterparty and stand ready to perform under the terms of their agreement with such counterparty, they bear the risk of loss from a counterparty in the amount of the value of the collateral in the event the counterparty fails to return such collateral. Based on the terms of agreements, collateral may not be required for all derivative contracts.
For financial reporting purposes, the Funds do not offset derivative assets and derivative liabilities that are subject to netting arrangements, if any, in the Statements of Assets and Liabilities.
6. Investment Advisory Agreement and Other Transactions with Affiliates:
The PNC Financial Services Group, Inc. is the largest stockholder and an affiliate of BlackRock, Inc. (“BlackRock”) for 1940 Act purposes.
Investment Advisory: The Trust, on behalf of the Funds, entered into an Investment Advisory Agreement with the Manager, the Funds’ investment adviser, an indirect, wholly-owned subsidiary of BlackRock, to provide investment advisory services. The Manager is responsible for the management of each Fund’s portfolio and provides the personnel, facilities, equipment and certain other services necessary to the operations of each Fund.
For such services, each Fund pays the Manager a monthly fee at an annual rate equal to the following percentages of the average daily value of each Fund’s net assets:
| | | | |
| | | Investment Advisory Fee |
| Average Daily Net Assets | | Commodity
Strategies | | Global
Long/Short
Credit |
First $1 Billion | | 0.90% | | 0.95% |
$1 Billion - $3 Billion | | 0.85% | | 0.89% |
$3 Billion - $5 Billion | | 0.81% | | 0.86% |
$5 Billion - $6.5 Billion | | 0.78% | | 0.83% |
$6.5 Billion - $10 Billion | | 0.78% | | 0.80% |
Greater than $10 Billion | | 0.77% | | 0.76% |
For Commodity Strategies, the Manager provides investment management and other services to the Subsidiary. The Manager does not receive separate compensation from the Subsidiary for providing investment management or administrative services. However, the Fund pays the Manager based on its net assets, which includes the assets of the Subsidiary.
With respect to the Funds, the Manager entered into separate sub-advisory agreements with BlackRock International Limited (“BIL”), an affiliate of the Manager. With respect to Global Long/Short Credit, the Manager has also entered into a separate sub-advisory agreement with BlackRock (Singapore) Limited (“BRS”), which is also an affiliate of the Manager. The Manager pays BIL and BRS, for services they provide, a monthly fee that is a percentage of the investment advisory fees paid by each Fund to the Manager.
Service and Distribution Fees: The Trust, on behalf of the Funds, entered into a Distribution Agreement and a Distribution and Service Plan with BlackRock Investments, LLC (“BRIL”), an affiliate of the Manager. Pursuant to the Distribution and Service Plan and in accordance with Rule 12b-1 under the 1940 Act, each Fund pays BRIL ongoing service and distribution fees. The fees are accrued daily and paid monthly at annual rates based upon the average daily net assets of the relevant share class of each Fund as follows:
| | | | | | | | |
| | | Investor A | | | Investor C | |
Service Fee | | | 0.25% | | | | 0.25% | |
Distribution Fee | | | — | | | | 0.75% | |
| | | | | | |
| | | BLACKROCK FUNDS | | JANUARY 31, 2017 | | 73 |
| | | | |
| Notes to Financial Statements (continued) | | | | |
BRIL and broker-dealers, pursuant to sub-agreements with BRIL, provide shareholder servicing and distribution services to the Funds. The ongoing service and/or distribution fee compensates BRIL and each broker-dealer for providing shareholder servicing and/or distribution related services to the shareholders.
For the six months ended January 31, 2017, the following table shows the class specific service and distribution fees borne directly by each share class of each Fund:
| | | | | | | | | | | | |
| | | | Investor A | | | | Investor C | | | | Total | |
Commodity Strategies | | $ | 33,938 | | | $ | 29,772 | | | $ | 63,710 | |
Global Long/Short Credit | | $ | 470,259 | | | $ | 968,785 | | | $ | 1,439,044 | |
Administration: The Trust, on behalf of the Funds, entered into an Administration Agreement with the Manager, an indirect, wholly-owned subsidiary of BlackRock, to provide administrative services. For these services, the Manager receives an administration fee computed daily and payable monthly, based on a percentage of the average daily net assets of each Fund. The administration fee, which is shown as administration in the Statements of Operations, is paid at the annual rates below.
| | |
| Average Daily Net Assets | | Administration Fee |
First $500 Million | | 0.0425% |
$500 Million - $1 Billion | | 0.0400% |
$1 Billion - $2 Billion | | 0.0375% |
$2 Billion - $4 Billion | | 0.0350% |
$4 Billion - $13 Billion | | 0.0325% |
Greater than $13 Billion | | 0.0300% |
In addition, the Manager charges each of the share classes an administration fee, which is shown as administration — class specific in the Statements of Operations, at an annual rate of 0.02% for Commodity Strategies and 0.015% for Global Long/Short Credit of the average daily net assets of each respective class.
For the six months ended January 31, 2017, the Funds paid the following to the Manager in return for these services, which are included in administration — class specific in the Statements of Operations:
| | | | | | | | | | | | | | | | | | | | |
| | | Institutional | | | Investor A | | | Investor C | | | Class K | | | Total | |
Commodity Strategies | | $ | 11,001 | | | $ | 2,715 | | | $ | 596 | | | | — | | | $ | 14,312 | |
Global Long/Short Credit | | $ | 262,168 | | | $ | 28,216 | | | $ | 14,532 | | | $ | 1,692 | | | $ | 306,608 | |
Transfer Agent: Pursuant to written agreements, certain financial intermediaries, some of which may be affiliates, provide the Funds with sub-accounting, recordkeeping, sub-transfer agency and other administrative services with respect to sub-accounts they service. For these services, these entities receive an asset-based fee or an annual fee per shareholder account, which will vary depending on share class and/or net assets. For the six months ended January 31, 2017, Global Long/Short Credit paid the following amounts to affiliates of BlackRock in return for these services, which are included in transfer agent — class specific in the Statements of Operations:
| | | | | | | | | | | | |
| | | Institutional | | | Investor A | | | Total | |
Global Long/Short Credit | | $ | 149,337 | | | $ | 68 | | | $ | 149,405 | |
The Manager maintains a call center that is responsible for providing certain shareholder services to the Funds. Shareholder services include responding to inquiries and processing subscriptions and redemptions based upon instructions from shareholders. For the six months ended January 31, 2017, each Fund reimbursed the Manager the following amounts for costs incurred in running the call center, which are included in transfer agent — class specific in the Statements of Operations:
| | | | | | | | | | | | | | | | |
| | | Institutional | | | Investor A | | | Investor C | | | Total | |
Commodity Strategies | | $ | 162 | | | $ | 492 | | | $ | 267 | | | $ | 921 | |
Global Long/Short Credit | | $ | 5,820 | | | $ | 1,962 | | | $ | 1,605 | | | $ | 9,387 | |
For the six months ended January 31, 2017, the following table shows the class specific transfer agent fees borne directly by each class of each Fund:
| | | | | | | | | | | | | | | | | | | | |
| | | Institutional | | | Investor A | | | Investor C | | | Class K | | | Total | |
Commodity Strategies | | $ | 13,322 | | | $ | 33,265 | | | $ | 7,391 | | | | — | | | $ | 53,978 | |
Global Long/Short Credit | | $ | 1,855,509 | | | $ | 234,110 | | | $ | 107,426 | | | $ | 6,139 | | | $ | 2,203,184 | |
| | | | | | |
| 74 | | BLACKROCK FUNDS | | JANUARY 31, 2017 | | |
| | | | |
| Notes to Financial Statements (continued) | | | | |
Other Fees: For the six months ended January 31, 2017, affiliates earned underwriting discounts, direct commissions and dealer concessions on sales of each Fund’s Investor A Shares as follows:
| | | | |
Commodity Strategies | | $ | 2,793 | |
Global Long/Short Credit | | $ | 3,187 | |
For the six months ended January 31, 2017, affiliates received CDSCs as follows:
| | | | |
| | | Investor A | | Investor C |
Commodity Strategies | | $ 72 | | $ 816 |
Global Long/Short Credit | | $7,023 | | $7,027 |
Expense Limitations, Waivers, Reimbursements and Recoupments: With respect to each Fund, the Manager contractually agreed to waive and/or reimburse fees or expenses in order to limit expenses, excluding interest expense, dividend expense, tax expense, acquired fund fees and expenses and certain other fund expenses, which constitute extraordinary expenses not incurred in the ordinary course of each Fund’s business (“expense limitation”). The expense limitations as a percentage of average daily net assets are as follows:
| | | | | | | | | | |
| | | Institutional | | Investor A | | Investor C | | Class K | |
Commodity Strategies | | 0.99% | | 1.24% | | 1.99% | | | — | |
Global Long/Short Credit | | 1.20% | | 1.40% | | 2.15% | | | 1.15% | |
The Manager has agreed not to reduce or discontinue these contractual expense limitations prior to December 1, 2017 unless approved by the Board, including a majority of the independent trustees, who are not “interested persons” of the Funds as defined in the 1940 Act (“Independent Trustees”) or by a vote of a majority of the outstanding voting securities of the Funds. For the six months ended January 31, 2017, the Manager waived $113,827 of investment advisory fees for Commodity Strategies, which is included in fees waived by Manager in the Statements of Operations.
These amounts waived and/or reimbursed shown as administration fees waived — class specific, transfer agent fees waived — class specific and transfer agent fees reimbursed — class specific, respectively, in the Statements of Operations. For the six months ended January 31, 2017, class specific expense waivers and/or reimbursements are as follows:
| | | | | | | | |
| Administration Fees Waived | | Institutional | | Investor A | | Investor C | | Total |
Commodity Strategies | | $11,002 | | $2,715 | | $595 | | $14,312 |
Global Long/Short Credit | | — | | $4,516 | | $869 | | $5,385 |
| | | | | | | | |
| Transfer Agent Fees Waived | | Institutional | | Investor A | | Investor C | | Total |
Commodity Strategies | | $162 | | $492 | | $267 | | $921 |
Global Long/Short Credit Fund | | — | | $112 | | $104 | | $216 |
| | | | | | | | |
| Transfer Agent Fees Reimbursed | | Institutional | | Investor A | | Investor C | | Total |
Commodity Strategies | | $12,038 | | $32,426 | | $7,057 | | $51,521 |
Global Long/Short Credit | | — | | $3,130 | | $1,330 | | $4,460 |
With respect to each Fund, the Manager voluntarily agreed to waive its investment advisory fees by the amount of investment advisory fees each Fund pays to the Manager indirectly through its investment in affiliated money market funds (the “affiliated money market fund waiver”). This amount is included in fees waived by the Manager in the Statements of Operations. The amount of waivers and/or reimbursements of fees and expenses made pursuant to the expense limitation caps, as applicable, will be reduced by the amount of the affiliated money market fund waiver. For the six months ended January 31, 2017, the Manager waived $482 and $58,257 for Commodity Strategies and Global Long/Short Credit, respectively.
Effective September 1, 2016, the Manager voluntarily agreed to waive its investment advisory fee with respect to any portion of each Fund’s assets invested in affiliated equity or fixed-income mutual funds or affiliated exchange-traded funds that have a contractual management fee. Prior to September 1, 2016, the Manager did not waive such fees. Effective November 28, 2016, the waiver became contractual through November 30, 2017. This contractual agreement may be terminated with respect to each Fund upon 90 days’ notice by a majority of Independent Trustees or by a vote of a majority of the outstanding voting securities of each Fund.
| | | | | | |
| | | BLACKROCK FUNDS | | JANUARY 31, 2017 | | 75 |
| | | | |
| Notes to Financial Statements (continued) | | | | |
The Manager may have, at its discretion, voluntarily waived all or any portion of their administration fees for a Fund or a share class, which are shown as administration fees waived in the Statements of Operations.
With respect to the contractual expense caps, if during a Fund’s fiscal year the operating expenses of a share class, that at any time during the prior two fiscal years received a waiver and/or reimbursement from the Manager, are less than the expense cap for that share class, the Manager is entitled to be reimbursed by such share class up to the lesser of the following expenses:
(a) The amount of fees waived and/or expenses reimbursed during those prior two fiscal years under the agreement.
(b) The amount by which the expense cap for that share class exceeds the operating expenses of the share class for the current fiscal year, provided that:
• Each Fund, of which the share class is a part, has more than $50 million in assets for the fiscal year; and
• The Manager or an affiliate continues to serve as a Fund’s investment adviser or administrator.
In the event the expense cap for a share class is changed subsequent to a fiscal year in which the Manager becomes entitled to reimbursement for fees waived and/or reimbursed, the amount available to reimburse the Manager shall be calculated by reference to the expense cap for that share class in effect at the time the Manager became entitled to receive such reimbursement, rather than the subsequently changed expense cap for that share class.
On January 31, 2017, the fund level and class specific waivers and/or reimbursements subject to possible future recoupment under the expense limitation agreement are as follows:
| | | | | | | | | | | | |
| | | Expires July 31, | |
| | | 2017 | | | 2018 | | | 2019 | |
Commodity Strategies | | | | | | | | | | | | |
Fund Level | | $ | 187,877 | | | $ | 238,674 | | | $ | 113,827 | |
Institutional | | | — | | | $ | 5,759 | | | $ | 23,202 | |
Investor A | | $ | 43,817 | | | $ | 51,772 | | | $ | 35,633 | |
Investor C | | $ | 14,369 | | | $ | 14,379 | | | $ | 7,919 | |
Global Long/Short Credit | | | | | | | | | | | | |
Investor A | | | — | | | | — | | | $ | 7,758 | |
Investor C | | | — | | | | — | | | $ | 2,303 | |
Securities Lending: The U.S. Securities and Exchange Commission has issued an exemptive order which permits BIM, an affiliate of the Manager, to serve as securities lending agent for the Funds, subject to applicable conditions. As securities lending agent, BIM bears all operational costs directly related to securities lending. The Funds are responsible for expenses in connection with the investment of cash collateral received for securities on loan (the “collateral investment expenses”). The cash collateral is invested in a private investment company managed by the Manager or its affiliates. However, BIM has agreed to cap the collateral investment expenses of the private investment company to an annual rate of 0.04%. The investment adviser to the private investment company will not charge any advisory fees with respect to shares purchased by the Funds.
Securities lending income is equal to the total of income earned from the reinvestment of cash collateral, net of fees and other payments to and from borrowers of securities, and less the collateral investment expenses. Each Fund retains a portion of securities lending income and remits a remaining portion to BIM as compensation for its services as securities lending agent. Pursuant to a securities lending agreement, BIM may lend securities only when the difference between the borrower rebate rate and the risk free rate exceeds a certain level (such securities, the “specials only securities”).
Pursuant to such agreement, each Fund retains 80% of securities lending income. In addition, commencing the business day following the date that the aggregate securities lending income earned across certain funds in the Equity-Liquidity Complex in a calendar year exceeds a specified threshold, each Fund, pursuant to the securities lending agreement, will retain for the remainder of the calendar year securities lending income in an amount equal to 85% of securities lending income.
The share of securities lending income earned by each Fund is shown as securities lending — affiliated — net in the Statements of Operations. For the six months ended January 31, 2017, Commodity Strategies paid BIM $4,500 for securities lending agent services.
Interfund Lending: In accordance with an exemptive order (the “Order”) from the U.S. Securities and Exchange Commission, each Fund may participate in a joint lending and borrowing facility for temporary purposes (the “Interfund Lending Program”), subject to compliance with the terms and conditions of the Order, and to the extent permitted by each Fund’s investment policies and restrictions. Each Fund is currently permitted to borrow and lend under the Interfund Lending Program.
| | | | | | |
| 76 | | BLACKROCK FUNDS | | JANUARY 31, 2017 | | |
| | | | |
| Notes to Financial Statements (continued) | | | | |
A Fund may lend in aggregate up to 15% of its net assets, but may not lend more than 5% of its net assets, to any one borrowing fund through the Interfund Lending Program. A Fund may not borrow through the Interfund Lending Program or from any other source more than 33 1/3% of its total assets (or any lower threshold provided for by the Fund’s investment restrictions). If a Fund’s total outstanding borrowings exceed 10% of its total assets, each of its outstanding interfund loans will be subject to collateralization of at least 102% of the outstanding principal value of the loan. All interfund loans are for temporary or emergency purposes and the interest rate to be charged will be the average of the highest current overnight repurchase agreement rate available to a lending fund and the bank loan rate, as calculated according to a formula established by the Board.
During the period ended January 31, 2017, the Funds did not participate in the Interfund Lending Program.
Officers and Trustees: Certain officers and/or trustees of the Trust are officers and/or trustees of BlackRock or its affiliates. The Funds reimburse the Manager for a portion of the compensation paid to the Trust’s Chief Compliance Officer, which is included in Officer and Trustees in the Statements of Operations.
Other Transactions: Global Long/Short Credit may purchase securities from, or sell securities to, an affiliated fund provided the affiliation is due solely to having a common investment adviser, common officers, or common trustees. For the six months ended January 31, 2017, the purchase and sale transactions and any net realized gains (losses) with an affiliated fund in compliance with Rule 17a-7 under the 1940 Act were as follows:
| | | | | | |
| | | Purchases | | Sales | | Net Realized Loss |
Global Long/Short Credit | | $6,309,200 | | $21,519,318 | | $(1,352,123) |
7. Purchases and Sales:
For the six months ended January 31, 2017, purchases and sales of investments, including paydowns and excluding short-term securities, were as follows:
| | | | | | | | |
| Purchases | | Commodity
Strategies | | | Global
Long/Short
Credit | |
Non-U.S. Government Securities | | $ | 62,309,997 | | | $ | 3,721,041,053 | |
U.S. Government Securities | | | — | | | | 782,166,664 | |
Total Purchases | | $ | 62,309,997 | | | $ | 4,503,207,717 | |
| | | | | | | | |
| Sales | | Commodity
Strategies | | | Global
Long/Short
Credit | |
Non-U.S. Government Securities | | $ | 48,309,841 | | | $ | 3,481,573,801 | |
U.S. Government Securities | | | — | | | | 1,006,040,543 | |
Total Sales | | $ | 48,309,841 | | | $ | 4,487,614,344 | |
8. Income Tax Information:
It is the Funds’ policy to comply with the requirements of the Internal Revenue Code of 1986, as amended, applicable to regulated investment companies, and to distribute substantially all of their taxable income to their shareholders. Therefore, no federal income tax provision is required.
Each Fund files U.S. federal and various state and local tax returns. No income tax returns are currently under examination. The statute of limitations on each Fund’s U.S. federal tax returns generally remains open for each of the four years ended July 31, 2016. The statutes of limitations on each Fund’s state and local tax returns may remain open for an additional year depending upon the jurisdiction.
Management has analyzed tax laws and regulations and their application to the Funds as of January 31, 2017, inclusive of the open tax return years, and does not believe that there are any uncertain tax positions that require recognition of a tax liability in the Funds’ financial statements.
| | | | | | |
| | | BLACKROCK FUNDS | | JANUARY 31, 2017 | | 77 |
| | | | |
| Notes to Financial Statements (continued) | | | | |
As of July 31, 2016, the Funds had capital loss carryforwards, with no expiration dates, available to offset future realized capital gains as follows:
| | | | |
| | | Commodity
Strategies | | Global Long/Short Credit |
No expiration date | | $178,992,644 | | $254,327,799 |
As of January 31, 2017, gross unrealized appreciation and depreciation based on cost for federal income tax purposes were as follows:
| | | | | | | | | | | | |
| | | | | | Commodity Strategies | | | Global Long/Short Credit | |
Tax cost | | | | | | $ | 146,142,365 | | | $ | 5,281,877,372 | |
| | | | |
Gross unrealized appreciation | | | | | | $ | 19,003,956 | | | $ | 75,534,547 | |
Gross unrealized depreciation | | | | | | | (575,665 | ) | | | (156,700,905 | ) |
| | | | |
Net unrealized appreciation (depreciation) | | | | | | $ | 18,428,291 | | | $ | (81,166,358 | ) |
| | | | |
9. Bank Borrowings:
The Trust, on behalf of the Funds, along with certain other funds managed by the Manager and its affiliates (“Participating Funds”), is a party to a 364-day, $2.1 billion credit agreement with a group of lenders. Under this agreement, the Funds may borrow to fund shareholder redemptions. Excluding commitments designated for certain individual funds, the Participating Funds, including the Funds, can borrow up to an aggregate commitment amount of $1.6 billion at any time outstanding, subject to asset coverage and other limitations as specified in the agreement. The credit agreement has the following terms: a fee of 0.12% per annum on unused commitment amounts and interest at a rate equal to the higher of (a) one-month LIBOR (but, in any event, not less than 0.00%) on the date the loan is made plus 0.80% per annum or (b) the Fed Funds rate (but, in any event, not less than 0.00%) in effect from time to time plus 0.80% per annum on amounts borrowed. The agreement expires in April 2017 unless extended or renewed. Participating Funds paid administration, legal and arrangement fees, which, if applicable, are included in miscellaneous expenses in the Statements of Operations. These fees were allocated among such funds based upon portions of the aggregate commitment available to them and relative net assets of Participating Funds. During the six months ended January 31, 2017, the Funds did not borrow under the credit agreement.
10. Principal Risks:
In the normal course of business, certain Funds invest in securities and enter into transactions where risks exist due to fluctuations in the market (market risk) or failure of the issuer to meet all its obligations, including the ability to pay principal and interest when due (issuer credit risk). The value of securities held by the Funds may decline in response to certain events, including those directly involving the issuers of securities owned by the Funds. Changes arising from the general economy, the overall market and local, regional or global political and/or social instability, as well as currency, interest rate and price fluctuations, may also affect the securities’ value.
Each Fund may be exposed to prepayment risk, which is the risk that borrowers may exercise their option to prepay principal earlier than scheduled during periods of declining interest rates, which would force each Fund to reinvest in lower yielding securities. Each Fund may also be exposed to reinvestment risk, which is the risk that income from each Fund’s portfolio will decline if each Fund invests the proceeds from matured, traded or called fixed income securities at market interest rates that are below each Fund portfolio’s current earnings rate.
On October 11, 2016, BlackRock implemented certain changes required by amendments to Rule 2a-7 under the 1940 Act, which governs the operations of U.S. money market funds. The Funds may be exposed to additional risks when reinvesting cash collateral in money market funds that do not seek to maintain a stable NAV per share of $1.00 and which may be subject to redemption gates or liquidity fees under certain circumstances.
Valuation Risk: The market values of equities, such as common stocks and preferred securities or equity related investments, such as futures and options, may decline due to general market conditions which are not specifically related to a particular company. They may also decline due to factors which affect a particular industry or industries. A Fund may invest in illiquid investments and may experience difficulty in selling those investments in a timely manner at the price that they believe the investments are worth. Prices may fluctuate widely over short or extended periods in response to company, market or economic news. Markets also tend to move in cycles, with periods of rising and falling prices. This volatility may cause each Fund’s NAV to experience significant increases or decreases over short periods of time. If there is a general decline in the securities and other markets, the NAV of a Fund may lose value, regardless of the individual results of the securities and other instruments in which the Fund invests.
| | | | | | |
| 78 | | BLACKROCK FUNDS | | JANUARY 31, 2017 | | |
| | | | |
| Notes to Financial Statements (continued) | | | | |
The price a Fund could receive upon the sale of any particular portfolio investment may differ from a Fund’s valuation of the investment, particularly for securities that trade in thin or volatile markets or that are valued using a fair valuation technique or a price provided by an independent pricing service. Changes to significant unobservable inputs and assumptions (i.e., publicly traded company multiples, growth rate, time to exit) due to the lack of observable inputs may significantly impact the resulting fair value and therefore a Fund’s results of operations. As a result, the price received uponthe sale of an investment may be less than the value ascribed by a Fund, and a Fund could realize a greater than expected loss or lesser than expected gain upon the sale of the investment. A Fund’s ability to value its investments may also be impacted by technological issues and/or errors by pricing services or other third party service providers.
Counterparty Credit Risk: Similar to issuer credit risk, the Funds may be exposed to counterparty credit risk, or the risk that an entity may fail to or be unable to perform on its commitments related to unsettled or open transactions. The Funds manage counterparty credit risk by entering into transactions only with counterparties that the Manager believes have the financial resources to honor their obligations and by monitoring the financial stability of those counterparties. Financial assets, which potentially expose the Funds to market, issuer and counterparty credit risks, consist principally of financial instruments and receivables due from counterparties. The extent of the Funds’ exposure to market, issuer and counterparty credit risks with respect to these financial assets is approximately their value recorded in the Statements of Assets and Liabilities, less any collateral held by the Funds.
A derivative contract may suffer a mark-to-market loss if the value of the contract decreases due to an unfavorable change in the market rates or values of the underlying instrument. Losses can also occur if the counterparty does not perform under the contract.
A Fund’s risk of loss from counterparty credit risk on OTC derivatives is generally limited to the aggregate unrealized gain less the value of any collateral held by such Fund.
For OTC options purchased, each Fund bears the risk of loss in the amount of the premiums paid plus the positive change in market values net of any collateral held by the Funds should the counterparty fail to perform under the contracts. Options written by the Funds do not typically give rise to counterparty credit risk, as options written generally obligate the Funds, and not the counterparty, to perform. The Funds may be exposed to counterparty credit risk with respect to options written to the extent the Funds deposit collateral with their counterparty to a written option.
With exchange-traded options purchased, futures and centrally cleared swaps, there is less counterparty credit risk to the Funds since the exchange or clearinghouse, as counterparty to such instruments, guarantees against a possible default. The clearinghouse stands between the buyer and the seller of the contract; therefore, credit risk is limited to failure of the clearinghouse. While offset rights may exist under applicable law, a Fund does not have a contractual right of offset against a clearing broker or clearinghouse in the event of a default (including the bankruptcy or insolvency). Additionally, credit risk exists in exchange-traded futures and centrally cleared swaps with respect to initial and variation margin that is held in a clearing broker’s customer accounts. While clearing brokers are required to segregate customer margin from their own assets, in the event that a clearing broker becomes insolvent or goes into bankruptcy and at that time there is a shortfall in the aggregate amount of margin held by the clearing broker for all its clients, typically the shortfall would be allocated on a pro rata basis across all the clearing broker’s customers, potentially resulting in losses to the Funds.
Concentration Risk: As of period end, Commodity Strategies invested a significant portion of its assets in securities in the materials sector. Changes in economic conditions affecting such sector would have a greater impact on the Fund and could affect the value, income and/or liquidity of positions in such securities.
Global Long/Short Credit invests a significant portion of its assets in fixed income securities and/or use derivatives tied to the fixed income markets. Changes in market interest rates or economic conditions may affect the value and/or liquidity of such investments. Interest rate risk is the risk that prices of bonds and other fixed income securities will increase as interest rates fall and decrease as interest rates rise. The Fund may be subject to a greater risk of rising interest rates due to the current period of historically low rates.
Global Long/Short Credit invests a substantial amount of its assets in issuers located in a single country or a limited number of countries. When the Fund concentrates its investments in this manner, it assumes the risk that economic, political and social conditions in those countries may have a significant impact on their investment performance. Foreign issuers may not be subject to the same uniform accounting, auditing and financial reporting standards and practices as used in the United States. Foreign securities markets may also be less liquid, more volatile, and less subject to governmental supervision not typically associated with investing in U.S. securities. Investment percentages in specific countries are presented in the Schedule of Investments.
| | | | | | |
| | | BLACKROCK FUNDS | | JANUARY 31, 2017 | | 79 |
| | | | |
| Notes to Financial Statements (continued) | | | | |
Global Long/Short Credit invests a significant portion of its assets in securities of issuers located in Europe or with significant exposure to European issuers or countries. The European financial markets have recently experienced volatility and adverse trends due to concerns about economic downturns in, or rising government debt levels of, several European countries. These events may spread to other countries in Europe and may affect the value and liquidity of certain of the Fund’s investments.
The United Kingdom voted on June 23, 2016 to withdraw from the European Union, which may introduce significant new uncertainties and instability in the financial markets across Europe.
11. Capital Share Transactions:
Transactions in capital shares for each class were as follows:
| | | | | | | | | | | | | | | | | | | | |
| | | Six Months Ended
January 31, 2017 | | | | | | Year Ended
July 31, 2016 | |
| Commodity Strategies | | Shares | | | Amount | | | | | | Shares | | | Amount | |
Institutional | | | | | | | | | | | | | | | | | | | | |
Shares sold | | | 5,112,041 | | | $ | 37,902,158 | | | | | | | | 7,562,645 | | | $ | 50,029,305 | |
Shares issued in reinvestment of distributions | | | 125,545 | | | | 940,700 | | | | | | | | — | | | | — | |
Shares redeemed | | | (3,621,258 | ) | | | (26,295,614 | ) | | | | | | | (42,922,258 | ) | | | (285,641,550 | ) |
| | | | | | | | | | | | |
Net increase (decrease) | | | 1,616,328 | | | $ | 12,547,244 | | | | | | | | (35,359,613 | ) | | $ | (235,612,245 | ) |
| | | | | | | | | | | | |
| | | | | | | | | | | | | | | | | | | | |
Investor A | | | | | | | | | | | | | | | | | | | | |
Shares sold | | | 2,198,918 | | | $ | 16,185,535 | | | | | | | | 3,143,339 | | | $ | 21,078,911 | |
Shares issued in reinvestment of distributions | | | 27,241 | | | | 202,575 | | | | | | | | — | | | | — | |
Shares redeemed | | | (996,823 | ) | | | (7,228,950 | ) | | | | | | | (1,529,857 | ) | | | (9,858,610 | ) |
| | | | | | | | | | | | |
Net increase | | | 1,229,336 | | | $ | 9,159,160 | | | | | | | | 1,613,482 | | | $ | 11,220,301 | |
| | | | | | | | | | | | |
| | | | | | | | | | | | | | | | | | | | |
Investor C | | | | | | | | | | | | | | | | | | | | |
Shares sold | | | 144,986 | | | $ | 1,027,948 | | | | | | | | 470,934 | | | $ | 3,001,142 | |
Shares redeemed | | | (128,337 | ) | | | (903,119 | ) | | | | | | | (396,629 | ) | | | (2,460,191 | ) |
| | | | | | | | | | | | |
Net increase | | | 16,649 | | | $ | 124,829 | | | | | | | | 74,305 | | | $ | 540,951 | |
| | | | | | | | | | | | |
Total Net Increase (Decrease) | | | 2,862,313 | | | $ | 21,831,233 | | | | | | | | (33,671,826 | ) | | $ | (223,850,993 | ) |
| | | | | | | | | | | | |
| | | | | | | | | | | | | | | | | | | | |
| Global Long/Short Credit | | | | | | | | | | | | | | | |
Institutional | | | | | | | | | | | | | | | | | | | | |
Shares sold | | | 86,081,894 | | | $ | 863,338,636 | | | | | | | | 204,724,576 | | | $ | 2,067,651,799 | |
Shares issued in reinvestment of distributions | | | — | | | | — | | | | | | | | 14,414,698 | | | | 141,840,624 | |
Shares redeemed | | | (85,400,172 | ) | | | (857,178,986 | ) | | | | | | | (307,046,650 | ) | | | (3,059,489,796 | ) |
| | | | | | | | | | | | |
Net increase (decrease) | | | 681,722 | | | $ | 6,159,650 | | | | | | | | (87,907,376 | ) | | $ | (849,997,373 | ) |
| | | | | | | | | | | | |
| | | | | | | | | | | | | | | | | | | | |
Investor A | | | | | | | | | | | | | | | | | | | | |
Shares sold | | | 3,225,566 | | | $ | 32,352,899 | | | | | | | | 16,479,124 | | | $ | 165,640,534 | |
Shares issued in reinvestment of distributions | | | — | | | | — | | | | | | | | 3,298,566 | | | | 32,424,910 | |
Shares redeemed | | | (13,179,462 | ) | | | (131,821,916 | ) | | | | | | | (75,596,309 | ) | | | (759,459,804 | ) |
| | | | | | | | | | | | |
Net decrease | | | (9,953,896 | ) | | $ | (99,469,017 | ) | | | | | | | (55,818,619 | ) | | $ | (561,394,360 | ) |
| | | | | | | | | | | | |
| | | | | | | | | | | | | | | | | | | | |
Investor C | | | | | | | | | | | | | | | | | | | | |
Shares sold | | | 491,739 | | | $ | 4,849,122 | | | | | | | | 2,272,708 | | | $ | 22,710,466 | |
Shares issued in reinvestment of distributions | | | — | | | | — | | | | | | | | 1,183,266 | | | | 11,536,847 | |
Shares redeemed | | | (5,965,354 | ) | | | (58,833,844 | ) | | | | | | | (14,343,994 | ) | | | (141,419,873 | ) |
| | | | | | | | | | | | |
Net decrease | | | (5,473,615 | ) | | $ | (53,984,722 | ) | | | | | | | (10,888,020 | ) | | $ | (107,172,560 | ) |
| | | | | | | | | | | | |
| | | | | | |
| 80 | | BLACKROCK FUNDS | | JANUARY 31, 2017 | | |
| | | | |
| Notes to Financial Statements (concluded) | | | | |
| | | | | | | | | | | | | | | | | | | | |
| | | Six Months Ended
January 31, 2017 | | | | | | Period March 28, 20161
to July 31, 2016 | |
| | | Shares | | | Amount | | | | | | Shares | | | Amount | |
Class K | | | | | | | | | | | | | | | | | | | | |
Shares sold | | | 1,276,114 | | | $ | 12,795,340 | | | | | | | | 5,741,108 | | | $ | 55,841,272 | |
Shares redeemed | | | (1,004,995 | ) | | | (10,098,060 | ) | | | | | | | (2,946,658 | ) | | | (29,132,652 | ) |
| | | | | | | | | | | | |
Net increase | | | 271,119 | | | $ | 2,697,280 | | | | | | | | 2,794,450 | | | $ | 26,708,620 | |
| | | | | | | | | | | | |
Total Net Decrease | | | (14,474,670 | ) | | $ | (144,596,809 | ) | | | | | | | (151,819,565 | ) | | $ | (1,491,855,673 | ) |
| | | | | | | | | | | | |
| | 1 | | Commencement of operations. |
12. Subsequent Events:
Management has evaluated the impact of all subsequent events on the Funds through the date the financial statements were issued and has determined that there were no subsequent events requiring adjustment or additional disclosure in the financial statements.
| | | | | | |
| | | BLACKROCK FUNDS | | JANUARY 31, 2017 | | 81 |
Rodney D. Johnson, Chair of the Board and Trustee
Susan J. Carter, Trustee
Collette Chilton, Trustee
Neil A. Cotty, Trustee
Cynthia A. Montgomery, Trustee
Joseph P. Platt, Trustee
Robert C. Robb, Jr., Trustee
Mark Stalnecker, Trustee
Kenneth L. Urish, Trustee
Claire A. Walton, Trustee
Frederick W. Winter, Trustee
Barbara G. Novick, Trustee
John M. Perlowski, Trustee, President and Chief Executive Officer
Thomas Callahan, Vice President
Jennifer McGovern, Vice President
Neal J. Andrews, Chief Financial Officer
Jay M. Fife, Treasurer
Charles Park, Chief Compliance Officer
Fernanda Piedra, Anti-Money Laundering Compliance Officer
Benjamin Archibald, Secretary
Effective December 31, 2016, David O. Beim and Dr. Matina S. Horner resigned as Trustees of the Trust.
| | | | | | |
| | | | |
Investment Adviser and Administrator BlackRock Advisors, LLC Wilmington, DE 19809 | | Sub-Advisors BlackRock International Limited Edinburgh, EH3 8BL United Kingdom BlackRock (Singapore) Limited1 079912 Singapore | | Accounting Agent and Transfer Agent BNY Mellon Investment Servicing (US) Inc. Wilmington, DE 19809 | | Custodian The Bank of New York Mellon New York, NY 10286 |
| | | | | | |
Distributor BlackRock Investments, LLC New York, NY 10022 | | Legal Counsel Sidley Austin LLP New York, NY 10019 | | Independent Registered Public Accounting Firm PricewaterhouseCoopers LLP Philadelphia, PA 19103 | | Address of the Trust 100 Bellevue Parkway Wilmington, DE 19809 |
| | 1 | | For Global Long/Short Credit. |
Householding
The Funds will mail only one copy of shareholder documents, including prospectuses, annual and semi-annual reports and proxy statements, to shareholders with multiple accounts at the same address. This practice is commonly called “householding” and is intended to reduce expenses and eliminate duplicate mailings of shareholder documents. Mailings of your shareholder documents may be householded indefinitely unless you instruct us otherwise. If you do not want the mailing of these documents to be combined with those for other members of your household, please call the Funds at (800) 441-7762.
| | | | | | |
| 82 | | BLACKROCK FUNDS | | JANUARY 31, 2017 | | |
| | | | |
| Additional Information (concluded) | | | | |
|
| General Information (concluded) |
Availability of Quarterly Schedule of Investments
The Funds file their complete schedules of portfolio holdings with the SEC for the first and third quarters of each fiscal year on Form N-Q. The Funds’ Forms N-Q are available on the SEC’s website at http://www.sec.gov and may also be reviewed and copied at the SEC’s Public Reference Room in Washington, D.C. Information on the operation of the Public Reference Room or how to access documents on the SEC’s website without charge may be obtained by calling (800) SEC-0330. The Funds’ Forms N-Q may also be obtained upon request and without charge by calling (800) 441-7762.
Availability of Proxy Voting Policies and Procedures
A description of the policies and procedures that the Funds use to determine how to vote proxies relating to portfolio securities is available upon request and without charge (1) by calling (800) 441-7762; (2) at http://www.blackrock.com; and (3) on the SEC’s website at http://www.sec.gov.
Availability of Proxy Voting Record
Information about how the Funds voted proxies relating to securities held in the Funds’ portfolios during the most recent 12-month period ended June 30 is available upon request and without charge (1) at http://www.blackrock.com or by calling (800) 441-7762 and (2) on the SEC’s website at http://www.sec.gov.
BlackRock’s Mutual Fund Family
BlackRock offers a diverse lineup of open-end mutual funds crossing all investment styles and managed by experts in equity, fixed income and tax-exempt investing. Visit http://www.blackrock.com for more information.
Account Information
Call us at (800) 441-7762 from 8:00 AM to 6:00 PM ET on any business day to get information about your account balances, recent transactions and share prices. You can also reach us on the Web at http://www.blackrock.com/funds.
Automatic Investment Plans
Investor Class shareholders who want to invest regularly can arrange to have $50 or more automatically deducted from their checking or savings account and invested in any of the BlackRock funds.
Systematic Withdrawal Plans
Investor Class shareholders can establish a systematic withdrawal plan and receive periodic payments of $50 or more from their BlackRock funds, as long as their account balance is at least $10,000.
Retirement Plans
Shareholders may make investments in conjunction with Traditional, Rollover, Roth, Coverdell, Simple IRAs, SEP IRAs and 403(b) Plans.
|
| BlackRock Privacy Principles |
BlackRock is committed to maintaining the privacy of its current and former fund investors and individual clients (collectively, “Clients”) and to safeguarding their non-public personal information. The following information is provided to help you understand what personal information BlackRock collects, how we protect that information and why in certain cases we share such information with select parties.
If you are located in a jurisdiction where specific laws, rules or regulations require BlackRock to provide you with additional or different privacy-related rights beyond what is set forth below, then BlackRock will comply with those specific laws, rules or regulations.
BlackRock obtains or verifies personal non-public information from and about you from different sources, including the following: (i) information we receive from you or, if applicable, your financial intermediary, on applications, forms or other documents; (ii) information about your transactions with us, our affiliates, or others; (iii) information we receive from a consumer reporting agency; and (iv) from visits to our websites.
BlackRock does not sell or disclose to non-affiliated third parties any non-public personal information about its Clients, except as permitted by law or as is necessary to respond to regulatory requests or to service Client accounts. These non-affiliated third parties are required to protect the confidentiality and security of this information and to use it only for its intended purpose.
We may share information with our affiliates to service your account or to provide you with information about other BlackRock products or services that may be of interest to you. In addition, BlackRock restricts access to non-public personal information about its Clients to those BlackRock employees with a legitimate business need for the information. BlackRock maintains physical, electronic and procedural safeguards that are designed to protect the non-public personal information of its Clients, including procedures relating to the proper storage and disposal of such information.
| | | | | | |
| | | BLACKROCK FUNDS | | JANUARY 31, 2017 | | 83 |
This report is intended for current holders. It is not authorized for use as an offer of sale or a solicitation of an offer to buy shares of a Fund unless preceded or accompanied by the Funds’ current prospectus. Past performance results shown in this report should not be considered a representation of future performance. Investment returns and principal value of shares will fluctuate so that shares, when redeemed, may be worth more or less than their original cost. Statements and other information herein are as dated and are subject to change.

| | |
| |
CSGLSCMT-1/17-SAR | |  |
JANUARY 31, 2017
| | | | |
SEMI-ANNUAL REPORT | | | | BLACKROCK® |
| | | | |
| | BlackRock Short Obligations Fund | | of BlackRock FundsSM |
| | |
| Not FDIC Insured ◾ May Lose Value ◾ No Bank Guarantee | | |
Dear Shareholder,
The 12 months ended January 31, 2017 was an exceptionally strong period for risk assets (such as stocks and high yield bonds), while higher-quality assets generated muted returns after struggling in the latter part of 2016. As the period began, worries about slowing growth in China and the instability of oil prices had global equity prices sliding. However, the broad market momentum shifted in the second half of 2016 as reflationary expectations in the United States helped drive a pick-up in global growth.
Markets were remarkably resilient during the period. Big surprises such as the United Kingdom’s vote to leave the European Union and the outcome of the U.S. presidential election brought spikes in equity market volatility, but they were ultimately short-lived. Instead, investors used the sell-offs to seize upon buying opportunities, allowing markets to quickly rebound. We believe this reinforces the case for taking the long view rather than reacting to short-term market noise.
The global reflationary theme – rising nominal growth, wages and inflation – was the dominant driver of asset returns during the period, outweighing significant political upheavals and uncertainty. This trend accelerated after the U.S. election and continued into the beginning of 2017, stoked by expectations for an extra boost to U.S. growth via fiscal policy.
Although economic momentum is gaining traction, the capacity for rapid global growth is restrained by structural factors including an aging population, low productivity growth and excess savings. A tempered economic growth trend and high valuations across most assets have set the stage for muted investment returns going forward.
Equity markets still have room to move, although the disparity between winners and losers is widening, making stock selection increasingly important. Fixed income investors are also facing challenges as bond markets recalibrate to accommodate rising rates and higher inflation expectations. And in a world where political risk and policy uncertainty abound, there is no lack of potential catalysts for higher volatility.
In this environment, investors need to think globally, extend their scope across a broad array of asset classes and be nimble as market conditions change. We encourage you to talk with your financial advisor and visit blackrock.com for further insight about investing in today’s markets.
Sincerely,

Rob Kapito
President, BlackRock Advisors, LLC

Rob Kapito
President, BlackRock Advisors, LLC
| | | | | | | | |
| Total Returns as of January 31, 2017 | |
| | | 6-month | | | 12-month | |
U.S. large cap equities (S&P 500® Index) | | | 5.96 | % | | | 20.04 | % |
U.S. small cap equities (Russell 2000® Index) | | | 12.43 | | | | 33.53 | |
International equities (MSCI Europe, Australasia, Far East Index) | | | 3.49 | | | | 12.03 | |
Emerging market equities (MSCI Emerging Markets Index) | | | 4.92 | | | | 25.41 | |
3-month Treasury bills (BofA Merrill Lynch 3-Month U.S. Treasury Bill Index) | | | 0.20 | | | | 0.37 | |
U.S. Treasury securities (BofA Merrill Lynch 10- Year U.S. Treasury Index) | | | (7.87 | ) | | | (3.26 | ) |
U.S. investment grade bonds (Bloomberg Barclays U.S. Aggregate Bond Index) | | | (2.95 | ) | | | 1.45 | |
Tax-exempt municipal bonds (S&P Municipal Bond Index) | | | (2.94 | ) | | | 0.24 | |
U.S. high yield bonds (Bloomberg Barclays U.S. Corporate High Yield 2% Issuer Capped Index) | | | 6.09 | | | | 20.77 | |
|
| Past performance is no guarantee of future results. Index performance is shown for illustrative purposes only. You cannot invest directly in an index. | |
| | | | | | |
| 2 | | THIS PAGE NOT PART OF YOUR FUND REPORT | | | | |
| | |

| | Shareholders can sign up for e-mail notifications of quarterly statements, annual and semi-annual shareholder reports and prospectuses by enrolling in the electronic delivery program. Electronic copies of shareholder reports and prospectuses are also available on BlackRock’s website. TO ENROLL IN ELECTRONIC DELIVERY: Shareholders Who Hold Accounts with Investment Advisors, Banks or Brokerages: Please contact your financial advisor. Please note that not all investment advisors, banks or brokerages may offer this service. Shareholders Who Hold Accounts Directly with BlackRock: 1. Access the BlackRock website at blackrock.com 2. Select "Access Your Account" 3. Next, select "eDelivery" in the "Related Resources" box and follow the sign-up instructions |
| | | | | | |
| | | BLACKROCK SHORT OBLIGATIONS FUND | | JANUARY 31, 2017 | | 3 |
| | | | |
| Fund Summary as of January 31, 2017 | | | | |
BlackRock Short Obligations Fund’s (the “Fund”) investment objective is to seek current income consistent with preservation of capital.
|
| Portfolio Management Commentary |
How did the Fund perform?
| • | | For the six-month period ended January 31, 2017, the Fund outperformed its benchmark, the BofA Merrill Lynch 6-Month U.S. Treasury Bill Index. |
What factors influenced performance?
| • | | The Fund’s outperformance versus the benchmark was attributable to an overweighting of spread sectors, most notably corporate credit, which produced a significantly higher income stream for the Fund. |
| • | | During the period, credit spreads widened somewhat due in part to money market industry reform, leading to underperformance within specific credit issues. |
| • | | At certain times during the period, the Fund’s cash position was elevated. However, the higher cash position was transitory in nature and did not have a material impact on performance. |
Describe recent portfolio activity.
| • | | The Fund maintained a mix of corporate and financial exposures over the course of the period. |
Describe Fund positioning at period end.
| • | | At the end of the period, the Fund maintained an underweight duration (sensitivity to interest rate changes) versus the benchmark given expectations for potential U.S. Federal Reserve rate increases. |
The views expressed reflect the opinions of BlackRock as of the date of this report and are subject to change based on changes in market, economic or other conditions. These views are not intended to be a forecast of future events and are no guarantee of future results.
| | | | |
| Portfolio Composition | | Percent of Net Assets | |
Corporate Bonds | | | 48 | % |
Commercial Paper | | | 29 | |
Certificates of Deposit | | | 18 | |
Repurchase Agreements | | | 4 | |
Asset-Backed Securities | | | 1 | |
| | | | |
| Maturity Breakdown | | Percent of Net Assets | |
8-14 days | | | 1 | % |
15-30 days | | | 1 | |
31-60 days | | | 6 | |
61-90 days | | | 13 | |
91-120 days | | | 4 | |
121-150 days | | | 14 | |
> 150 days | | | 61 | |
| | | | | | |
| 4 | | BLACKROCK SHORT OBLIGATIONS FUND | | JANUARY 31, 2017 | | |
|
| Total Return Based on a $10,000 Investment |
| | 1 | | Assuming transaction costs and other operating expenses, including investment advisory fees and administration fees, if any. Institutional and Class K Shares do not have a sales charge. |
| | 2 | | Under normal market conditions, the Fund will invest in U.S. dollar denominated investment grade and short-term fixed and floating rate debt securities maturing in three years or less (with certain exceptions) and will maintain a dollar-weighted average maturity of 180 days or less and a dollar-weighted average life of 365 days or less. |
| | 3 | | An unmanaged index that tracks 6-Month U.S. Treasury securities. |
| | 4 | | Commencement of operations. |
| | | | | | | | | | | | | | | | | | | | | | | | | |
| Performance Summary for the Period Ended January 31, 2017 | |
| | | | | | | Average Annual Total Returns |
| | | Standardized
30-Day Yield5 | | Unsubsidized
30-Day Yield5 | | 6-Month
Total Returns | | 1 Year | | Since Inception6 |
Institutional | | | | 0.93 | % | | | | 0.64 | % | | | | 0.58 | % | | | | 1.33 | % | | | | 0.67 | % |
Class K | | | | 1.01 | | | | | 0.76 | | | | | 0.60 | | | | | 1.37 | | | | | 0.73 | |
BofA Merrill Lynch 6-Month U.S. Treasury Bill Index | | | | — | | | | | — | | | | | 0.30 | | | | | 0.66 | | | | | 0.31 | |
| | 5 | | The standardized 30-day yield includes the effects of any waivers and/or reimbursements. The unsubsidized 30-day yield excludes the effects of any waivers and/or reimbursements. |
| | 6 | | The Fund commenced operations on November 15, 2012. |
| | | | Past performance is not indicative of future results. Performance results do not reflect the deduction of taxes that a shareholder would pay on Fund distributions or the redemption of Fund shares. |
| | | | Performance results may include adjustments made for financial reporting purposes in accordance with U.S. generally accepted accounting principles. |
| | | | | | | | | | | | | | |
| Expense Example |
| | | Actual | | Hypothetical7 | | |
| | | Beginning
Account Value
August 1, 2016 | | Ending
Account Value
January 31, 2017 | | Expenses Paid
During the Period8 | | Beginning
Account Value
August 1, 2016 | | Ending Account Value
January 31, 2017 | | Expenses Paid
During the Period8 | | Annualized
Expense Ratio |
Institutional | | $1,000.00 | | $1,005.80 | | $1.01 | | $1,000.00 | | $1,024.20 | | $1.02 | | 0.20% |
Class K | | $1,000.00 | | $1,006.00 | | $0.66 | | $1,000.00 | | $1,024.55 | | $0.66 | | 0.13% |
| | 7 | | Hypothetical 5% annual return before expenses is calculated by prorating the number of days in the most recent fiscal period divided by 365. |
| | 8 | | For each class of the Fund, expenses are equal to the annualized expense ratio for the class, multiplied by the average account value over the period, multiplied by 184/365 (to reflect the one-half year period shown). |
| | | | See “Disclosure of Expenses” on page 6 for further information on how expenses were calculated. |
| | | | | | |
| | | BLACKROCK SHORT OBLIGATIONS FUND | | JANUARY 31, 2017 | | 5 |
| • | | Institutional and Class K Shares are not subject to any sales charge. These shares bear no ongoing distribution or service fees and are available only to certain eligible investors. Prior to July 9, 2013, the Fund’s Institutional Shares performance results are those of BlackRock Shares restated to reflect Institutional Shares fees. |
Performance information reflects past performance and does not guarantee future results. Current performance may be lower or higher than the performance data quoted. Refer to www.blackrock.com/funds to obtain performance data current to the most recent month-end. Performance results do not reflect the deduction of taxes that a shareholder would pay on fund distributions or the redemption of fund shares. Figures shown in the performance tables on the previous pages assume reinvestment of these distributions, if any, at net asset value (“NAV”) on the ex-dividend/payable dates. Investment return and principal value of shares will fluctuate so that shares, when redeemed, may be worth more
or less than their original cost. Distributions paid to each class of shares will vary because of different levels of service, distribution and transfer agency fees applicable to each class, which are deducted from the income available to be paid to shareholders.
BlackRock Advisors, LLC (the “Manager”), the Fund’s investment adviser, waived and/or reimbursed a portion of the Fund’s expenses. Without such waiver and/or reimbursement, the Fund’s performance would have been lower. The Manager is under no obligation to continue waiving or reimbursing its fees after the applicable termination date of the agreement. See Note 5 of the Notes to Financial Statements for additional information on waivers and/or reimbursements. The standardized 30-day yield includes the effects of any waivers and/or reimbursements. The unsubsidized 30-day yield excludes the effects of any waivers and/or reimbursements.
Shareholders of the Fund may incur the following charges: (a) transactional expenses and (b) operating expenses, including investment advisory fees, administration fees, service and distribution fees, including 12b-1 fees, acquired fund fees and expenses, and other fund expenses. The expense examples on the previous pages (which are based on a hypothetical investment of $1,000 invested on August 1, 2016 and held through January 31, 2017) are intended to assist shareholders both in calculating expenses based on an investment in the Fund and in comparing these expenses with similar costs of investing in other mutual funds.
The expense example provides information about actual account values and actual expenses. In order to estimate the expenses a shareholder paid during the period covered by this report, shareholders can divide their account value by $1,000 and then multiply the result by the number corresponding to their Fund and share class under the heading entitled “Expenses Paid During the Period.”
The expense example also provides information about hypothetical account values and hypothetical expenses based on the Fund’s actual expense ratio and an assumed rate of return of 5% per year before expenses. In order to assist shareholders in comparing the ongoing expenses of investing in the Fund and other funds, compare the 5% hypothetical example with the 5% hypothetical examples that appear in shareholder reports of other funds.
The expenses shown in the expense example are intended to highlight shareholders’ ongoing costs only and do not reflect any transactional expenses, such as sales charges, if any. Therefore, the hypothetical example is useful in comparing ongoing expenses only, and will not help shareholders determine the relative total expenses of owning different funds. If these transactional expenses were included, shareholder expenses would have been higher.
| | | | | | |
| 6 | | BLACKROCK SHORT OBLIGATIONS FUND | | JANUARY 31, 2017 | | |
| | | | |
| Schedule of Investments January 31, 2017 (Unaudited) | | | (Percentages shown are based on Net Assets) | |
| | | | |
| | | | | | | | |
| Asset-Backed Securities | | Par (000) | | | Value | |
CarMax Auto Owner Trust: | | | | | | | | |
0.82%, 6/15/18 | | $ | 6 | | | $ | 6,215 | |
1.09%, 4/15/19 | | | 206 | | | | 206,350 | |
1.24%, 6/17/19 | | | 246 | | | | 246,427 | |
CNH Equipment Trust, 0.84%, 8/15/18 | | | 18 | | | | 18,174 | |
Ford Credit Auto Owner Trust, 1.08%, 3/15/19 | | | 228 | | | | 227,665 | |
Honda Auto Receivables Owner Trust: | | | | | | | | |
0.92%, 11/20/17 | | | 26 | | | | 26,066 | |
0.82%, 7/23/18 | | | 240 | | | | 239,480 | |
Toyota Auto Receivables Owner Trust, 1.03%, 7/16/18 | | | 192 | | | | 192,161 | |
Volkswagen Credit Auto Master Trust,
1.13%, 7/22/19 (a)(b) | | | 100 | | | | 99,929 | |
Total Asset-Backed Securities — 1.3% | | | | | | | 1,262,467 | |
| | | | | | | | |
| Corporate Bonds | | | | | | |
Aerospace & Defense — 1.1% | | | | | | | | |
United Technologies Corp., 1.24%, 11/01/19 (b) | | | 1,000 | | | | 1,004,665 | |
Automobiles — 4.6% | | | | | | | | |
Daimler Finance North America LLC: | | | | | | | | |
1.23%, 8/01/17 (a)(b) | | | 2,000 | | | | 2,001,452 | |
1.66%, 10/30/19 (a)(b) | | | 500 | | | | 500,287 | |
1.64%, 1/06/20 (a)(b) | | | 750 | | | | 752,372 | |
Ford Motor Credit Company LLC, 1.72%, 12/06/17 | | | 1,000 | | | | 999,370 | |
| | | | | | | | |
| | | | | | | | 4,253,481 | |
Banks — 21.6% | | | | | | | | |
Bank of America Corp., 5.65%, 5/01/18 | | | 750 | | | | 784,049 | |
Bank of Montreal: | | | | | | | | |
1.30%, 7/14/17 | | | 2,500 | | | | 2,501,100 | |
1.55%, 12/12/19 (b) | | | 1,020 | | | | 1,022,387 | |
BNP Paribas S.A., 2.38%, 9/14/17 | | | 100 | | | | 100,528 | |
BP Capital Markets PLC, 1.38%, 11/06/17 | | | 1,500 | | | | 1,499,687 | |
BPCE S.A., 1.73%, 2/10/17 (b) | | | 750 | | | | 750,174 | |
Capital One N.A., 2.06%, 8/17/18 (b) | | | 500 | | | | 505,082 | |
Commonwealth Bank of Australia, 2.02%, 3/15/19 (a)(b) | | | 350 | | | | 353,745 | |
HSBC Bank USA Inc., 1.63%, 1/16/18 | | | 1,700 | | | | 1,701,103 | |
JPMorgan Chase & Co.: | | | | | | | | |
1.43%, 2/15/17 (b) | | | 500 | | | | 500,150 | |
2.00%, 8/15/17 | | | 500 | | | | 501,769 | |
JPMorgan Chase Bank N.A., 1.44%, 9/21/18 (b) | | | 1,000 | | | | 1,001,951 | |
Macquarie Bank Ltd., 1.67%, 10/27/17 (a)(b) | | | 250 | | | | 250,408 | |
Mizuho Bank Ltd., 1.45%, 4/16/17 (a)(b) | | | 500 | | | | 500,182 | |
Nordea Bank AB, 1.83%, 9/17/18 (a)(b) | | | 500 | | | | 502,969 | |
Royal Bank of Canada: | | | | | | | | |
1.65%, 12/10/18 (b) | | | 520 | | | | 522,543 | |
2.00%, 12/10/18 | | | 1,000 | | | | 1,004,376 | |
Swedbank AB, 2.13%, 9/29/17 (a) | | | 1,070 | | | | 1,074,958 | |
Toronto-Dominion Bank, 1.40%, 1/18/19 (b) | | | 1,760 | | | | 1,762,633 | |
US Bank N.A., 1.15%, 9/11/17 (b) | | | 500 | | | | 500,280 | |
Wells Fargo & Co., 1.23%, 6/02/17 (b) | | | 2,000 | | | | 2,000,900 | |
Wells Fargo Bank N.A., 1.50%, 9/07/17 (b) | | | 250 | | | | 250,472 | |
Westpac Banking Corp., 1.61%, 5/13/19 (b) | | | 500 | | | | 501,645 | |
| | | | | | | | |
| | | | | | | | 20,093,091 | |
Capital Markets — 1.9% | | | | | | | | |
Goldman Sachs Group Inc., 1.57%, 6/04/17 (b) | | | 1,500 | | | | 1,502,185 | |
Morgan Stanley, 2.32%, 4/25/18 (b) | | | 250 | | | | 252,745 | |
| | | | | | | | |
| | | | | | | | 1,754,930 | |
| | | | | | | | |
| Corporate Bonds | | Par (000) | | | Value | |
Consumer Finance — 1.3% | | | | | | | | |
American Express Credit Corp., 1.66%, 11/05/18 (b) | | $ | 500 | | | $ | 504,175 | |
Nissan Motor Acceptance Corp.: | | | | | | | | |
1.81%, 4/07/18 (a)(b) | | | 500 | | | | 502,575 | |
1.96%, 3/08/19 (a)(b) | | | 250 | | | | 252,533 | |
| | | | | | | | |
| | | | | | | | 1,259,283 | |
Diversified Financial Services — 1.8% | | | | | | | | |
American Honda Finance Corp., 1.74%, 2/22/19 (b) | | | 250 | | | | 252,861 | |
Citigroup Inc.: | | | | | | | | |
1.49%, 3/10/17 (b) | | | 900 | | | | 899,939 | |
1.81%, 12/07/18 (b) | | | 500 | | | | 502,509 | |
| | | | | | | | |
| | | | | | | | 1,655,309 | |
Diversified Telecommunication Services — 3.2% | | | | | | | | |
Verizon Communications, Inc., 1.35%, 6/09/17 (b) | | | 2,996 | | | | 2,999,763 | |
Health Care Providers & Services — 5.7% | | | | | | | | |
Principal Life Global Funding II, 1.43%, 12/01/17 (a)(b) | | | 2,000 | | | | 2,007,498 | |
Unitedhealth Group, Inc., 1.45%, 7/17/17 | | | 3,250 | | | | 3,255,203 | |
| | | | | | | | |
| | | | | | | | 5,262,701 | |
Insurance — 0.6% | | | | | | | | |
Berkshire Hathaway Finance Corp.: | | | | | | | | |
1.45%, 3/07/18 | | | 230 | | | | 230,277 | |
1.50%, 3/07/18 (b) | | | 295 | | | | 296,644 | |
| | | | | | | | |
| | | | | | | | 526,921 | |
IT Services — 0.5% | | | | | | | | |
International Business Machines Corp., 1.36%, 8/18/17 (b) | | | 500 | | | | 501,368 | |
Machinery — 1.6% | | | | | | | | |
Caterpillar Financial Services Corp., 1.62%, 2/23/18 (b) | | | 500 | | | | 503,153 | |
John Deere Capital Corp.: | | | | | | | | |
1.47%, 7/11/17 (b) | | | 500 | | | | 501,115 | |
1.58%, 1/08/19 (b) | | | 500 | | | | 502,846 | |
| | | | | | | | |
| | | | | | | | 1,507,114 | |
Oil, Gas & Consumable Fuels — 0.5% | | | | | | | | |
Exxon Mobil Corp., 1.54%, 2/28/18 (b) | | | 500 | | | | 503,325 | |
Semiconductors & Semiconductor Equipment — 1.6% | | | | | | | | |
Qualcomm, Inc., 1.40%, 5/18/18 | | | 1,500 | | | | 1,498,505 | |
Software — 0.7% | | | | | | | | |
Oracle Corp., 2.38%, 1/15/19 | | | 600 | | | | 608,945 | |
Specialty Retail — 0.2% | | | | | | | | |
Lowe’s Cos Inc., 1.56%, 9/14/18 (b) | | | 195 | | | | 196,578 | |
Technology Hardware, Storage & Peripherals — 0.5% | | | | | | | | |
Apple Inc., 1.30%, 2/23/18 | | | 500 | | | | 500,758 | |
Total Corporate Bonds — 47.4% | | | | | | | 44,126,737 | |
Total Long-Term Investments (Cost — $45,320,697) — 48.7% | | | | | | | 45,389,204 | |
| | | | | | | | |
| Short-Term Securities | | | | | | |
| Certificates of Deposit | | | | | | |
Domestic — 2.1% | | | | | | | | |
State Street Bank & Trust Co., 1.23%, 3/10/17 (b) | | | 475 | | | | 475,225 | |
See Notes to Financial Statements.
| | | | | | |
| | | BLACKROCK SHORT OBLIGATIONS FUND | | JANUARY 31, 2017 | | 7 |
| | | | |
| Schedule of Investments (continued) | | | | |
| | | | |
| | | | | | | | | | | | |
| Certificates of Deposit | | | | | Par (000) | | | Value | |
Wells Fargo Bank N.A.: | | | | | | | | | | | | |
1.48%, 9/22/17 (b) | | | | | | $ | 500 | | | $ | 500,673 | |
1.55%, 1/05/18 | | | | | | | 1,000 | | | | 1,001,119 | |
| | | | | | | | | | | | |
| | | | | | | | | | | | 1,977,017 | |
Yankee — 15.9% (c) | | | | | | | | | | | | |
Bank of Nova Scotia, Houston, 1.42%, 4/12/17 (b) | | | | | | | 1,000 | | | | 1,001,015 | |
Credit Suisse, New York: | | | | | | | | | | | | |
1.44%, 4/24/17 (b) | | | | | | | 750 | | | | 750,919 | |
1.68%, 8/25/17 | | | | | | | 1,480 | | | | 1,480,860 | |
Dexia Credit Local, New York, 1.07%, 5/24/17 (b) | | | | | | | 1,000 | | | | 1,000,857 | |
Mizuho Bank Ltd., New York, 1.61%, 5/17/17 (b) | | | | | | | 500 | | | | 500,707 | |
Natixis, New York, 1.56%, 9/18/17 | | | | | | | 750 | | | | 750,975 | |
Nordea Bank Finland PLC, New York, 1.45%, 12/11/17 (b) | | | | | | | 500 | | | | 500,830 | |
Norinchukin Bank, New York: | | | | | | | | | | | | |
1.50%, 3/21/17 (b) | | | | | | | 1,000 | | | | 1,000,919 | |
1.33%, 7/20/17 (b) | | | | | | | 800 | | | | 800,173 | |
1.55%, 9/22/17 | | | | | | | 500 | | | | 500,568 | |
Royal Bank of Canada, New York, 1.41%, 10/05/17 (b) | | | | | | | 1,000 | | | | 1,001,426 | |
Sumitomo Mitsui Banking Corp., New York, 1.37%, 7/05/17 (b) | | | | | | | 3,000 | | | | 3,000,932 | |
Svenska Handelsbanken AB, 1.44%, 4/21/17 (b) | | | | | | | 500 | | | | 500,552 | |
UBS A.G., Stamford: | | | | | | | | | | | | |
0.93%, 5/25/17 (b) | | | | | | | 1,000 | | | | 1,001,368 | |
1.65%, 9/20/17 (b) | | | | | | | 1,000 | | | | 1,002,329 | |
| | | | | | | | | | | | |
| | | | | | | | | | | | 14,794,430 | |
Total Certificates of Deposit — 18.0% | | | | | | | | | | | 16,771,447 | |
| | | | | | | | | | | | |
| Commercial Paper | | | | | | | | | |
ABN AMRO Funding USA LLC 7 5, 1.37%, 7/05/17 (d) | | | | | | | 2,000 | | | | 1,988,633 | |
Antalis S.A., 1.15%, 4/07/17 (d) | | | | | | | 1,250 | | | | 1,247,869 | |
Atlantic Asset Securitization LLC, 1.10%, 4/10/17 (d) | | | | | | | 650 | | | | 648,698 | |
AXA Financial Inc., 1.63%, 12/29/17 (d) | | | | | | | 2,000 | | | | 1,970,323 | |
Bank of Nova Scotia, 1.35%, 8/02/17 (d) | | | | | | | 1,000 | | | | 993,773 | |
| | | | | | | | | | | | |
| Commercial Paper | | | | | Par (000) | | | Value | |
Bank of Tokyo Mitsubishi UFJ, 1.13%, 4/19/17 (d) | | | | | | $ | 1,300 | | | $ | 1,297,375 | |
Bedford Row Funding Corp., 1.40%, 4/20/17 (b) | | | | | | | 1,000 | | | | 1,001,025 | |
BNP Paribas: | | | | | | | | | | | | |
1.32%, 4/03/17 (d) | | | | | | | 500 | | | | 499,290 | |
1.18%, 5/04/17 (d) | | | | | | | 1,300 | | | | 1,296,551 | |
Commonwealth Bank of Australia, 1.43%, 4/13/17 (b) | | | | | | | 500 | | | | 500,524 | |
Ford Motor Credit Company LLC: | | | | | | | | | | | | |
1.25%, 4/10/17 (d) | | | | | | | 450 | | | | 448,969 | |
1.75%, 7/06/17 (d) | | | | | | | 1,000 | | | | 993,153 | |
Glaxosmithkline Finance PLC, 1.25%, 6/05/17 (d) | | | | | | | 2,000 | | | | 1,992,639 | |
ING US Funding LLC: | | | | | | | | | | | | |
1.27%, 6/09/17 (d) | | | | | | | 500 | | | | 497,940 | |
1.50%, 6/23/17 (b) | | | | | | | 1,000 | | | | 1,001,499 | |
1.28%, 7/05/17 (d) | | | | | | | 2,000 | | | | 1,989,339 | |
Matchpoint Finance PLC, 1.18%, 4/18/17 (d) | | | | | | | 1,000 | | | | 997,722 | |
Natixis, 1.38%, 6/30/17 (d) | | | | | | | 750 | | | | 746,594 | |
Nissan Motor Acceptance Corp., 1.15%, 4/10/17 (d) | | | | | | | 2,500 | | | | 2,494,576 | |
Societe Generale S.A.: | | | | | | | | | | | | |
1.27%, 3/31/17 (d) | | | | | | | 250 | | | | 249,658 | |
1.51%, 9/27/17 (d) | | | | | | | 2,000 | | | | 1,982,009 | |
Toyota Motor Credit Corp.: | | | | | | | | | | | | |
1.12%, 6/12/17 (d) | | | | | | | 1,000 | | | | 996,289 | |
1.22%, 6/16/17 (d) | | | | | | | 1,000 | | | | 996,135 | |
1.22%, 7/07/17 (d) | | | | | | | 500 | | | | 497,647 | |
Total Commercial Paper — 29.4% | | | | | | | | | | | 27,328,230 | |
| | | | | | | | | | | | |
| Money Market Funds — 0.0% | | | | | Shares | | | | |
BlackRock Liquidity Funds, T-Fund, Institutional
Class, 0.40% (e)(f) | | | | | | | 48,061 | | | | 48,061 | |
| | | | | | | | | | | | |
| Total Repurchase Agreements — 3.8% | | | | | | | | 3,500,000 | |
Total Short-Term Securities (Cost — $47,616,739) — 51.2% | | | | | | | | | | | 47,647,738 | |
Total Investments (Cost — $92,937,436) — 99.9% | | | | | | | | | | | 93,036,942 | |
Other Assets Less Liabilities — 0.1% | | | | | | | | | | | 55,203 | |
| | | | | | | | | | | | |
Net Assets — 100.0% | | | | | | | | | | $ | 93,092,145 | |
| | | | | | | | | | | | |
|
| Notes to Schedule of Investments |
| (a) | Security exempt from registration pursuant to Rule 144A under the Securities Act of 1933, as amended. These securities may be resold in transactions exempt from registration to qualified institutional investors. |
| (b) | Variable rate security. Rate as of period end. |
| (c) | Issuer is a U.S. branch of a foreign domiciled bank. |
| (d) | Rates are discount rates or a range of discount rates at the time of purchase. |
| (e) | During the period ended January 31, 2017, investments in issuers considered to be an affiliate of the Fund for purposes of Section 2(a)(3) of the Investment Company Act of 1940, as amended, were as follows: |
| | | | | | | | | | | | | | | | | | | | | | | | |
| Affiliate | | Shares
Held at
July 31,
2016 | | | Net
Activity | | | Shares
Held at
January 31,
2017 | | | Value at
January 31,
2017 | | | Income | | | Change in
Unrealized
Appreciation
(Depreciation)
| |
BlackRock Liquidity Funds, T-Fund,
Institutional Class | | | — | | | | 48,061 | | | | 48,061 | | | | $48,061 | | | | $355 | | | | — | |
| (f) | Current yield as of period end. |
See Notes to Financial Statements.
| | | | | | |
| 8 | | BLACKROCK SHORT OBLIGATIONS FUND | | JANUARY 31, 2017 | | |
| | | | |
| Schedule of Investments (concluded) | | | | |
| | | | | | | | | | | | | | | | | | | | | | | | | | | | | | | | | | |
| | | Repurchase Agreements | | | Collateral | |
| Counterparty | | Coupon Rate | | | Purchase Date | | | Maturity Date | | | Par (000) | | | at Value (000) | | | Proceeds including Interest | | | Position | | Original Par | | | Position received, at Value | |
Citigroup Global Markets Inc. | | | 1.29%(a) | | | | 1/31/17 | | | | 4/06/17 | | | $ | 500 | | | $ | 500 | | | $ | 501,165 | | | Corporate/debt obligation, 3.75% due at 12/26/46 | | $ | 534,399 | | | $ | 535,000 | |
Merrill Lynch, Pierce, Fenner & Smith, Inc. | | | 1.26%(a) | | | | 1/31/17 | | | | 3/17/17 | | | | 1,000 | | | | 1,000 | | | | 1,001,575 | | | Corporate/Debt Obligation, 0.00% due at 2/16/17 | | | 1,050,600 | | | | 1,050,000 | |
Mizuho Securities USA, Inc. | | | 1.80%(a) | | | | 1/31/17 | | | | 3/07/17 | | | | 2,000 | | | | 2,000 | | | | 2,003,500 | | | U.S. government sponsored agency obligation, 2.73% due at 7/07/28 | | | 2,135,000 | | | | 2,043,964 | |
Total | | | | | | | | | | | | | | | | | | $ | 3,500 | | | | | | | | | | | | | $ | 3,628,964 | |
| | | | | | | | | | | | | | | | | | | | | | | | | | | | | | | | | | |
| (a) | | Variable rate security. Rate as of period end and maturity is the date the principal owed can be recovered through demand. |
| • | | For Fund compliance purposes, the Fund’s industry classifications refer to one or more of the industry sub-classifications used by one or more widely recognized market indexes or ratings group indexes and/or as defined by the investment adviser. These definitions may not apply for purposes of this report, which may combine industry sub-classifications for reporting ease. |
|
| Fair Value Hierarchy as of Period End |
Various inputs are used in determining the fair value of investments. For information about the Fund’s policy regarding valuation of investments, refer to the Notes to Financial Statements.
The following table summarizes the Fund’s investments categorized in the disclosure hierarchy:
| | | | | | | | | | | | | | | | |
| | | Level 1 | | | Level 2 | | | Level 3 | | | Total | |
Assets: | | | | | | | | | | | | | | | | |
Investments:1 | | | | | | | | | | | | | | | | |
Long-Term Investments | | | — | | | $ | 45,389,204 | | | | — | | | $ | 45,389,204 | |
Short-Term Securities | | $ | 48,061 | | | | 47,599,677 | | | | — | | | | 47,647,738 | |
Total | | $ | 48,061 | | | $ | 92,988,881 | | | | — | | | $ | 93,036,942 | |
| | | | |
1 See above Schedule of Investments for values in each security type. | | | | | | | | | | | | | | | | |
| | | During the period ended January 31, 2017, there were no transfers between levels. |
See Notes to Financial Statements.
| | | | | | |
| | | BLACKROCK SHORT OBLIGATIONS FUND | | JANUARY 31, 2017 | | 9 |
| | | | |
| Statement of Assets and Liabilities | | | | |
| | | | |
| January 31, 2017 (Unaudited) | | | |
| | | | |
| Assets | | | | |
Investments at value — unaffiliated (cost — $89,437,436) | | $ | 89,536,942 | |
Repurchase agreements at value (cost — $3,500,000) | | | 3,500,000 | |
Receivables: | | | | |
Capital shares sold | | | 15,125 | |
Dividends — affiliated | | | 160 | |
Interest — unaffiliated | | | 136,294 | |
From the Manager | | | 3,106 | |
Prepaid expenses | | | 21,729 | |
| | | | |
Total assets | | | 93,213,356 | |
| | | | |
| | | | |
| Liabilities | | | | |
Payables: | | | | |
Administration fees | | | 2,415 | |
Capital shares redeemed | | | 15,608 | |
Income dividends | | | 25,686 | |
Officer’s and Trustees’ fees | | | 3,044 | |
Other accrued expenses | | | 12,149 | |
Other affiliates | | | 73 | |
Printing fees | | | 11,172 | |
Professional fees | | | 51,064 | |
| | | | |
Total liabilities | | | 121,211 | |
| | | | |
Net Assets | | $ | 93,092,145 | |
| | | | |
| | | | |
| Net Assets Consist of | | | | |
Paid-in capital | | $ | 92,960,663 | |
Undistributed net investment income | | | 2,098 | |
Accumulated net realized gain | | | 29,878 | |
Net unrealized appreciation (depreciation) | | | 99,506 | |
| | | | |
Net Assets | | $ | 93,092,145 | |
| | | | |
| | | | |
| Net Asset Value | | | | |
Institutional — Based on net assets of $62,951,733 and 6,283,232 shares outstanding, unlimited number of shares authorized, $0.001 par value | | $ | 10.02 | |
| | | | |
Class K — Based on net assets of $30,140,412 and 3,003,809 shares outstanding, unlimited number of shares authorized, $0.001 par value | | $ | 10.03 | |
| | | | |
See Notes to Financial Statements.
| | | | | | |
| 10 | | BLACKROCK SHORT OBLIGATIONS FUND | | JANUARY 31, 2017 | | |
| | | | |
| Six Months Ended January 31, 2017 (Unaudited) | | | |
| | | | |
| Investment Income | |
Interest — unaffiliated | | $ | 455,819 | |
Dividends — affiliated | | | 355 | |
| | | | |
Total investment income | | | 456,174 | |
| | | | |
| | | | |
| Expenses | | | | |
Investment advisory | | | 94,184 | |
Professional | | | 36,616 | |
Registration | | | 16,845 | |
Administration | | | 16,011 | |
Administration — class specific | | | 7,538 | |
Printing | | | 15,885 | |
Officer and Trustees | | | 6,067 | |
Transfer agent — class specific | | | 3,141 | |
Accounting services | | | 2,831 | |
Custodian | | | 2,809 | |
Recoupment of past waived and/or reimbursed fees — class specific | | | 47 | |
Miscellaneous | | | 4,164 | |
| | | | |
Total expenses | | | 206,138 | |
Less: | | | | |
Fees waived by the Manager | | | (94,096 | ) |
Expenses reimbursed by the Manager | | | (36,410 | ) |
Administration fees waived | | | (13,262 | ) |
Administration fees waived — class specific | | | (4,821 | ) |
Transfer agent fees waived — class specific | | | (6 | ) |
Transfer agent fees reimbursed — class specific | | | (84 | ) |
| | | | |
Total expenses after fees waived and/or reimbursed | | | 57,459 | |
| | | | |
Net investment income | | | 398,715 | |
| | | | |
| | | | |
| Realized and Unrealized Gain | | | | |
Net realized gain from investments | | | 29,377 | |
Net change in unrealized appreciation (depreciation) | | | 37,915 | |
| | | | |
Net realized and unrealized gain | | | 67,292 | |
| | | | |
Net Increase in Net Assets Resulting from Operations | | $ | 466,007 | |
| | | | |
See Notes to Financial Statements.
| | | | | | |
| | | BLACKROCK SHORT OBLIGATIONS FUND | | JANUARY 31, 2017 | | 11 |
| | | | |
| Statements of Changes in Net Assets | | | | |
| | | | | | | | |
| Increase (Decrease) in Net Assets: | | Six Months Ended January 31, 2017 (Unaudited) | | | Year Ended July 31, 2016 | |
| | | | | | | | |
| Operations | | | | | | | | |
Net investment income | | $ | 398,715 | | | $ | 443,560 | |
Net realized gain | | | 29,377 | | | | 29,534 | |
Net change in unrealized appreciation (depreciation) | | | 37,915 | | | | 61,328 | |
| | | | |
Net increase in net assets resulting from operations | | | 466,007 | | | | 534,422 | |
| | | | |
| | | | | | | | |
| Distributions to Shareholders1 | | | | | | | | |
From net investment income: | | | | | | | | |
Institutional | | | (141,400 | ) | | | (94,059 | ) |
Class K | | | (262,714 | ) | | | (342,030 | ) |
From net realized gain: | | | | | | | | |
Institutional | | | (15,447 | ) | | | (1,611 | ) |
Class K | | | (13,560 | ) | | | (5,860 | ) |
| | | | |
Decrease in net assets resulting from distributions to shareholders | | | (433,121 | ) | | | (443,560 | ) |
| | | | |
| | | | | | | | |
| Capital Share Transactions | | | | | | | | |
Net increase (decrease) in net assets derived from capital share transactions | | | 44,196,196 | | | | (3,070,242 | ) |
| | | | |
| | | | | | | | |
| Net Assets | | | | | | | | |
Total increase (decrease) in net assets | | | 44,229,082 | | | | (2,979,380 | ) |
Beginning of period | | | 48,863,063 | | | | 51,842,443 | |
| | | | |
End of period | | $ | 93,092,145 | | | $ | 48,863,063 | |
| | | | |
Undistributed net investment income, end of period | | $ | 2,098 | | | $ | 7,497 | |
| | | | |
| 1 | | Distributions for annual periods determined in accordance with federal income tax regulations. |
See Notes to Financial Statements.
| | | | | | |
| 12 | | BLACKROCK SHORT OBLIGATIONS FUND | | JANUARY 31, 2017 | | |
| | | | | | | | | | | | | | | | | | | | |
| | | Institutional | |
| | | Six Months
Ended
January 31, 2017 | | | | | | | | | | | | Period
July 9,
20131
to July 31, | |
| | | | Year Ended July 31, | | |
| | (Unaudited) | | | 2016 | | | 2015 | | | 2014 | | | 2013 | |
| | | | | | | | | | | | | | | | | | | | |
| Per Share Operating Performance | | | | | | | | | | | | | | | | | | | | |
Net asset value, beginning of period | | $ | 10.02 | | | $ | 10.00 | | | $ | 10.01 | | | $ | 10.00 | | | $ | 10.00 | |
| | | | |
Net investment income2 | | | 0.05 | | | | 0.08 | | | | 0.05 | | | | 0.05 | | | | 0.00 | 3 |
Net realized and unrealized gain (loss) | | | 0.00 | 3 | | | 0.02 | | | | (0.01 | ) | | | 0.00 | 3 | | | 0.00 | 3 |
| | | | |
Net increase from investment operations | | | 0.05 | | | | 0.10 | | | | 0.04 | | | | 0.05 | | | | 0.00 | |
| | | | |
Distributions:4 | | | | | | | | | | | | | | | | | | | | |
From net investment income | | | (0.05 | ) | | | (0.08 | ) | | | (0.05 | ) | | | (0.04 | ) | | | (0.00 | )5 |
From net realized gain | | | (0.00 | )5 | | | (0.00 | )5 | | | — | | | | (0.00 | )5 | | | (0.00 | )5 |
| | | | |
Total distributions | | | (0.05 | ) | | | (0.08 | ) | | | (0.05 | ) | | | (0.04 | ) | | | 0.00 | |
| | | | |
Net asset value, end of period | | $ | 10.02 | | | $ | 10.02 | | | $ | 10.00 | | | $ | 10.01 | | | $ | 10.00 | |
| | | | |
| | | | | | | | | | | | | | | | | | | | |
| Total Return6 | | | | | | | | | | | | | | | | | | | | |
Based on net asset value | | | 0.58 | %7 | | | 0.98 | % | | | 0.45 | % | | | 0.56 | % | | | 0.03 | %7 |
| | | | |
| | | | | | | | | | | | | | | | | | | | |
| Ratios to Average Net Assets | | | | | | | | | | | | | | | | | | | | |
Total expenses | | | 0.55 | %8,9 | | | 0.58 | % | | | 1.02 | % | | | 1.15 | % | | | 1.53 | %8,10 |
| | | | |
Total expenses after fees waived and/or reimbursed | | | 0.20 | %8 | | | 0.13 | % | | | 0.12 | % | | | 0.13 | % | | | 0.13 | %8 |
| | | | |
Net investment income | | | 1.02 | %8 | | | 0.79 | % | | | 0.55 | % | | | 0.46 | % | | | 0.51 | %8 |
| | | | |
| | | | | | | | | | | | | | | | | | | | |
| Supplemental Data | | | | | | | | | | | | | | | | | | | | |
Net assets, end of period (000) | | $ | 62,952 | | | $ | 16,945 | | | $ | 10,182 | | | $ | 10,012 | | | $ | 10,004 | |
| | | | |
Portfolio turnover rate | | | 139 | % | | | 184 | % | | | 68 | % | | | 50 | % | | | 35 | % |
| | | | |
| | 1 | | Commencement of operations. |
| | 2 | | Based on average shares outstanding. |
| | 3 | | Amount is less than $0.005 per share. |
| | 4 | | Distributions for annual periods determined in accordance with federal income tax regulations. |
| | 5 | | Amount is greater than $(0.005) per share. |
| | 6 | | Where applicable, assumes the reinvestment of distributions. |
| | 7 | | Aggregate total return. |
| | 9 | | Includes recoupment of past waived and/or reimbursed fees with no financial impact to the expense ratio. |
| | 10 | | Organization costs were not annualized in the calculation of the expense ratio. If these expenses were annualized, the total expenses for Institutional Shares would have been 1.53%. |
See Notes to Financial Statements.
| | | | | | |
| | | BLACKROCK SHORT OBLIGATIONS FUND | | JANUARY 31, 2017 | | 13 |
| | | | |
| Financial Highlights (concluded) | | | | |
| | | | | | | | | | | | | | | | | | | | |
| | | Class K | |
| | | Six Months Ended January 31, 2017 | | | | | | | | | | | | Period November 15, 20121 to July 31, | |
| | | | Year Ended July 31, | | |
| | | (Unaudited) | | | 2016 | | | 2015 | | | 2014 | | | 2013 | |
| | | | | | | | | | | | | | | | | | | | |
| Per Share Operating Performance | | | | | | | | | | | | | | | | | | | | |
Net asset value, beginning of period | | $ | 10.03 | | | $ | 10.01 | | | $ | 10.02 | | | $ | 10.01 | | | $ | 10.00 | |
| | | | |
Net investment income2 | | | 0.05 | | | | 0.08 | | | | 0.06 | | | | 0.05 | | | | 0.03 | |
Net realized and unrealized gain (loss) | | | 0.01 | | | | 0.02 | | | | (0.01 | ) | | | 0.00 | 3 | | | 0.01 | |
| | | | |
Net increase from investment operations | | | 0.06 | | | | 0.10 | | | | 0.05 | | | | 0.05 | | | | 0.04 | |
| | | | |
Distributions:4 | | | | | | | | | | | | | | | | | | | | |
From net investment income | | | (0.06 | ) | | | (0.08 | ) | | | (0.06 | ) | | | (0.04 | ) | | | (0.03 | ) |
From net realized gain | | | (0.00 | )5 | | | (0.00 | )5 | | | — | | | | (0.00 | )5 | | | (0.00 | )5 |
| | | | |
Total distributions | | | (0.06 | ) | | | (0.08 | ) | | | (0.06 | ) | | | (0.04 | ) | | | (0.03 | ) |
| | | | |
Net asset value, end of period | | $ | 10.03 | | | $ | 10.03 | | | $ | 10.01 | | | $ | 10.02 | | | $ | 10.01 | |
| | | | |
| | | | | | | | | | | | | | | | | | | | |
| Total Return6 | | | | | | | | | | | | | | | | | | | | |
Based on net asset value | | | 0.60 | %7 | | | 1.01 | % | | | 0.47 | % | | | 0.59 | % | | | 0.43 | %7 |
| | | | |
| | | | | | | | | | | | | | | | | | | | |
| Ratios to Average Net Assets | | | | | | | | | | | | | | | | | | | | |
Total expenses | | | 0.54 | %8,9 | | | 0.55 | % | | | 0.99 | % | | | 1.15 | % | | | 1.00 | %8,10 |
| | | | |
Total expenses after fees waived and/or reimbursed | | | 0.13 | %8 | | | 0.10 | % | | | 0.10 | % | | | 0.10 | % | | | 0.13 | %8 |
| | | | |
Net investment income | | | 1.08 | %8 | | | 0.79 | % | | | 0.57 | % | | | 0.49 | % | | | 0.46 | %8 |
| | | | |
| | | | | | | | | | | | | | | | | | | | |
| Supplemental Data | | | | | | | | | | | | | | | | | | | | |
Net assets, end of period (000) | | $ | 30,140 | | | $ | 31,918 | | | $ | 41,660 | | | $ | 15,029 | | | $ | 15,017 | |
| | | | |
Portfolio turnover rate | | | 139 | % | | | 184 | % | | | 68 | % | | | 50 | % | | | 35 | % |
| | | | |
| | 1 | | Commencement of operations. |
| | 2 | | Based on average shares outstanding. |
| | 3 | | Amount is less than $0.005 per share. |
| | 4 | | Distributions for annual periods determined in accordance with federal income tax regulations. |
| | 5 | | Amount is greater than $(0.005) per share. |
| | 6 | | Where applicable, assumes the reinvestment of distributions. |
| | 7 | | Aggregate total return. |
| | 9 | | Includes recoupment of past waived and/or reimbursed fees with no financial impact to the expense ratio. |
| | 10 | | Organization costs were not annualized in the calculation of the expense ratio. If these expenses were annualized, the total expenses for Class K Shares (formerly BlackRock Shares) would have been 1.00%. |
See Notes to Financial Statements.
| | | | | | |
| 14 | | BLACKROCK SHORT OBLIGATIONS FUND | | JANUARY 31, 2017 | | |
| | | | |
| Notes to Financial Statements (Unaudited) | | | | |
1. Organization:
BlackRock FundsSM (the “Trust”) is registered under the Investment Company Act of 1940, as amended (the “1940 Act”), as an open-end management investment company. The Trust is organized as a Massachusetts business trust. BlackRock Short Obligations Fund (the “Fund”) is a series of the Trust. The Fund is classified as diversified.
The Fund offers multiple classes of shares. All classes of shares are sold without a sales charge and only to certain eligible investors and have equal voting, dividend, liquidation and other rights, except that only shares of the respective classes are entitled to vote on matters concerning only that class.
The Fund, together with certain other registered investment companies advised by BlackRock Advisors, LLC (the “Manager”) or its affiliates, is included in a complex of open-end funds referred to as the Equity-Liquidity Complex.
2. Significant Accounting Policies:
The financial statements are prepared in conformity with accounting principles generally accepted in the United States of America (“U.S. GAAP”), which may require management to make estimates and assumptions that affect the reported amounts of assets and liabilities in the financial statements, disclosure of contingent assets and liabilities at the date of the financial statements and the reported amounts of increases and decreases in net assets from operations during the reporting period. Actual results could differ from those estimates. The Fund is considered an investment company under U.S. GAAP and follows the accounting and reporting guidance applicable to investment companies. Below is a summary of significant accounting policies:
Investment Transactions and Investment Income: For financial reporting purposes, investment transactions are recorded on the dates the transactions are entered into (the trade dates). Realized gains and losses on investment transactions are determined on the identified cost basis. Interest income, including amortization and accretion of premiums and discounts on debt securities, is recognized on the accrual basis. Income, expenses and realized and unrealized gains and losses are allocated daily to each class based on its relative net assets.
Distributions: Distributions from net investment income are declared daily and paid monthly. Distributions of capital gains are recorded on the ex-dividend date and made at least annually. The character and timing of distributions are determined in accordance with federal income tax regulations, which may differ from U.S. GAAP.
Recent Accounting Standard: In November 2016, the Financial Accounting Standards Board issued Accounting Standards Update “Restricted Cash” which will require entities to include the total of cash, cash equivalents, restricted cash, and restricted cash equivalents in the beginning and ending cash balances in the Statement of Cash Flows. The guidance will be applied retrospectively and is effective for fiscal years beginning after December 15, 2017, and interim periods within those years. Management is evaluating the impact, if any, of this guidance on the Fund’s presentation in the Statements of Cash Flows.
Indemnifications: In the normal course of business, the Fund enters into contracts that contain a variety of representations that provide general indemnification. The Fund’s maximum exposure under these arrangements is unknown because it involves future potential claims against the Fund, which cannot be predicted with any certainty.
Other: Expenses directly related to the Fund or its classes are charged to the Fund or the applicable class. Other operating expenses shared by several funds, including other funds managed by the Manager, are prorated among those funds on the basis of relative net assets or other appropriate methods. Expenses directly related to the Fund and other shared expenses prorated to the Fund are allocated daily to each class based on its relative net assets or other appropriate methods.
The Fund has an arrangement with its custodian whereby credits are earned on uninvested cash balances, which could be used to reduce custody fees and/or overdraft charges. The Fund may incur charges on certain uninvested cash balances and overdrafts, subject to certain conditions.
3. Investment Valuation and Fair Value Measurements:
Investment Valuation Policies: The Fund’s investments are valued at fair value (also referred to as “market value” within the financial statements) as of the close of trading on the New York Stock Exchange (“NYSE”) (generally 4:00 p.m., Eastern time) (or if the reporting date falls on a day the NYSE is closed, investments are valued at fair value as of the period end). U.S. GAAP defines fair value as the price the Fund would receive to sell an asset or pay to transfer a liability in an orderly transaction between market participants at the measurement date. The Fund determines the fair values of its financial instruments using various independent dealers or pricing services under policies approved by the Board of Trustees of the Trust (the “Board”). The BlackRock Global Valuation Methodologies Committee (the “Global Valuation Committee”) is the committee formed by management to develop global pricing policies and procedures and to oversee the pricing function for all financial instruments.
| | | | | | |
| | | BLACKROCK SHORT OBLIGATIONS FUND | | JANUARY 31, 2017 | | 15 |
| | | | |
| Notes to Financial Statements (continued) | | | | |
Fair Value Inputs and Methodologies: The following methods and inputs are used to establish the fair value of the Fund’s assets and liabilities:
| • | | Fixed-income securities for which market quotations are readily available are generally valued using the last available bid prices or current market quotations provided by independent dealers or third party pricing services. Floating rate loan interests are valued at the mean of the bid prices from one or more independent brokers or dealers as obtained from a third party pricing service. Pricing services generally value fixed-income securities assuming orderly transactions of an institutional round lot size, but the Fund may hold or transact in such securities in smaller, odd lot sizes. Odd lots often trade at lower prices than institutional round lots. The pricing services may use matrix pricing or valuation models that utilize certain inputs and assumptions to derive values, including transaction data (e.g., recent representative bids and offers), credit quality information, perceived market movements, news, and other relevant information. Certain fixed-income securities, including asset-backed and mortgage related securities may be valued based on valuation models that consider the estimated cash flows of each tranche of the entity, establish a benchmark yield and develop an estimated tranche specific spread to the benchmark yield based on the unique attributes of the tranche. The amortized cost method of valuation may be used with respect to debt obligations with sixty days or less remaining to maturity unless the Manager determines such method does not represent fair value. |
| • | | Investments in open-end U.S. mutual funds are valued at net asset value (“NAV”) each business day. |
If events (e.g., a company announcement, market volatility or a natural disaster) occur that are expected to materially affect the value of such investments, or in the event that the application of these methods of valuation results in a price for an investment that is deemed not to be representative of the market value of such investment, or if a price is not available, the investment will be valued by the Global Valuation Committee, or its delegate, in accordance with a policy approved by the Board as reflecting fair value (“Fair Valued Investments”). The fair valuation approaches that may be used by the Global Valuation Committee will include Market approach, Income approach and Cost approach. Valuation techniques such as discounted cash flow, use of market comparables and matrix pricing are types of valuation approaches and typically used in determining fair value. When determining the price for Fair Valued Investments, the Global Valuation Committee, or its delegate, seeks to determine the price that the Fund might reasonably expect to receive or pay from the current sale or purchase of that asset or liability in an arm’s-length transaction. Fair value determinations shall be based upon all available factors that the Global Valuation Committee, or its delegate, deems relevant and consistent with the principles of fair value measurement. The pricing of all Fair Valued Investments is subsequently reported to the Board or a committee thereof on a quarterly basis.
Fair Value Hierarchy: Various inputs are used in determining the fair value of investments. These inputs to valuation techniques are categorized into a fair value hierarchy consisting of three broad levels for financial statement purposes as follows:
| | • | | Level 1 — unadjusted price quotations in active markets/exchanges for identical assets or liabilities that the Fund has the ability to access |
| | • | | Level 2 — other observable inputs (including, but not limited to, quoted prices for similar assets or liabilities in markets that are active, quoted prices for identical or similar assets or liabilities in markets that are not active, inputs other than quoted prices that are observable for the assets or liabilities (such as interest rates, yield curves, volatilities, prepayment speeds, loss severities, credit risks and default rates) or other market–corroborated inputs) |
| | • | | Level 3 — unobservable inputs based on the best information available in the circumstances, to the extent observable inputs are not available (including the Fund’s own assumptions used in determining the fair value of investments) |
The hierarchy gives the highest priority to unadjusted quoted prices in active markets for identical assets or liabilities (Level 1 measurements) and the lowest priority to unobservable inputs (Level 3 measurements). Accordingly, the degree of judgment exercised in determining fair value is greatest for instruments categorized in Level 3. The inputs used to measure fair value may fall into different levels of the fair value hierarchy. In such cases, for disclosure purposes, the fair value hierarchy classification is determined based on the lowest level input that is significant to the fair value measurement in its entirety. Investments classified within Level 3 have significant unobservable inputs used by the Global Valuation Committee in determining the price for Fair Valued Investments. Level 3 investments include equity or debt issued by Private Companies. There may not be a secondary market, and/or there are a limited number of investors. Level 3 investments may also be adjusted to reflect illiquidity and/or non-transferability, with the amount of such discount estimated by the Global Valuation Committee in the absence of market information.
Changes in valuation techniques may result in transfers into or out of an assigned level within the hierarchy. In accordance with the Fund’s policy, transfers between different levels of the fair value hierarchy are deemed to have occurred as of the beginning of the reporting period. The categorization of a value determined for investments is based on the pricing transparency of the investments and is not necessarily an indication of the risks associated with investing in those securities.
4. Securities and Other Investments:
Asset-Backed and Mortgage-Backed Securities: Asset-backed securities are generally issued as pass-through certificates or as debt instruments. Asset-backed securities issued as pass-through certificates represent undivided fractional ownership interests in an underlying pool of assets. Asset-backed securities issued as debt instruments, which are also known as collateralized obligations, are typically issued as the debt of a special purpose entity organized solely for the purpose of owning such assets and issuing such debt. Asset-backed securities are often backed by a pool of assets representing the obligations of a number of different parties. The yield characteristics of certain asset-backed securities may differ from traditional debt
| | | | | | |
| 16 | | BLACKROCK SHORT OBLIGATIONS FUND | | JANUARY 31, 2017 | | |
| | | | |
| Notes to Financial Statements (continued) | | | | |
securities. One such major difference is that all or a principal part of the obligations may be prepaid at any time because the underlying assets (i.e., loans) may be prepaid at any time. As a result, a decrease in interest rates in the market may result in increases in the level of prepayments as borrowers, particularly mortgagors, refinance and repay their loans. An increased prepayment rate with respect to an asset-backed security will have the effect of shortening the maturity of the security. In addition, the Fund may subsequently have to reinvest the proceeds at lower interest rates. If the Fund has purchased such an asset-backed security at a premium, a faster than anticipated prepayment rate could result in a loss of principal to the extent of the premium paid.
For mortgage pass-through securities (the “Mortgage Assets”) there are a number of important differences among the agencies and instrumentalities of the U.S. Government that issue mortgage-related securities and among the securities that they issue. For example, mortgage-related securities guaranteed by Ginnie Mae are guaranteed as to the timely payment of principal and interest by Ginnie Mae and such guarantee is backed by the full faith and credit of the United States. However, mortgage-related securities issued by Freddie Mac and Fannie Mae, including Freddie Mac and Fannie Mae guaranteed mortgage pass-through certificates, which are solely the obligations of Freddie Mac and Fannie Mae, are not backed by or entitled to the full faith and credit of the United States, but are supported by the right of the issuer to borrow from the U.S. Treasury.
Non-agency mortgage-backed securities are securities issued by non-governmental issuers and have no direct or indirect government guarantees of payment and are subject to various risks. Non-agency mortgage loans are obligations of the borrowers thereunder only and are not typically insured or guaranteed by any other person or entity. The ability of a borrower to repay a loan is dependent upon the income or assets of the borrower. A number of factors, including a general economic downturn, acts of God, terrorism, social unrest and civil disturbances, may impair a borrower’s ability to repay its loans.
Repurchase Agreements: Repurchase agreements are commitments to purchase a security from a counterparty who agrees to repurchase the same security at a mutually agreed upon date and price. On a daily basis, the counterparty is required to maintain collateral subject to the agreement and in value no less than the agreed upon repurchase amount. Pursuant to the custodial undertaking associated with a tri-party repurchase arrangement, an unaffiliated third party custodian maintains accounts to hold collateral for the Fund and its counterparties. Typically, the Fund and counterparty are not permitted to sell, re-pledge or use the collateral absent a default by the counterparty or the Fund, respectively.
In the event the counterparty defaults and the fair value of the collateral declines, the Fund could experience losses, delays and costs in liquidating the collateral.
Repurchase agreements are entered into by the Fund under Master Repurchase Agreements (each, an “MRA”). The MRA permits the Fund, under certain circumstances including an event of default (such as bankruptcy or insolvency), to offset payables and/or receivables with collateral held by and/or posted to the counterparty. As a result, one single net payment is created. Bankruptcy or insolvency laws of a particular jurisdiction may impose restrictions on or prohibitions against such a right of offset in the event of the MRA counterparty’s bankruptcy or insolvency. Based on the terms of the MRA, the Fund receives securities as collateral with a market value in excess of the repurchase price at maturity. Upon a bankruptcy or insolvency of the MRA counterparty, the Fund would recognize a liability with respect to such excess collateral. The liability reflects the Fund’s obligation under bankruptcy law to return the excess to the counterparty.
5. Investment Advisory Agreement and Other Transactions with Affiliates:
The PNC Financial Services Group, Inc. is the largest stockholder and an affiliate of BlackRock, Inc. (“BlackRock”) for 1940 Act purposes.
Investment Advisory: The Trust, on behalf of the Fund, entered into an Investment Advisory Agreement with the Manager, the Fund’s investment adviser, an indirect, wholly-owned subsidiary of BlackRock, to provide investment advisory services. The Manager is responsible for the management of the Fund’s portfolio and provides the personnel, facilities, equipment and certain other services necessary to the operations of the Fund.
For such services, the Fund pays the Manager a monthly fee at an annual rate equal to the following percentage of the average daily value of the Fund’s net assets:
| | |
| Average Daily Net Assets | | Investment Advisory Fees |
First $1 Billion | | 0.25% |
$1 billion - $3 Billion | | 0.24% |
$3 billion - $5 Billion | | 0.23% |
$5 billion - $10 Billion | | 0.22% |
Greater than $10 Billion | | 0.21% |
| | | | | | |
| | | BLACKROCK SHORT OBLIGATIONS FUND | | JANUARY 31, 2017 | | 17 |
| | | | |
| Notes to Financial Statements (continued) | | | | |
Administration: The Trust, on behalf of the Fund, entered into an Administration Agreement with the Manager, an indirect, wholly-owned subsidiary of BlackRock, to provide administrative services. For these services, the Manager receives an administration fee computed daily and payable monthly, based on a percentage of the average daily net assets of the Fund. The administration fee, which is shown as administration in the Statement of Operations, is paid at the annual rates below.
| | |
| Average Daily Net Assets | | Administration Fees |
First $500 Million | | 0.0425% |
$500 Million - $1 Billion | | 0.0400% |
$1 Billion - $2 Billion | | 0.0375% |
$2 Billion - $4 Billion | | 0.0350% |
$4 Billion - $13 Billion | | 0.0325% |
Greater than $13 Billion | | 0.0300% |
In addition, the Manager charges each of the share classes an administration fee, which is shown as administration — class specific in the Statement of Operations, at an annual rate of 0.02% of the average daily net assets of each respective class.
For the six months ended January 31, 2017, the following table shows the class specific administration fees borne directly by each share class of the Fund:
| | | | |
| Institutional | | Class K | | Total |
$ 2,675 | | $ 4,863 | | $ 7,538 |
The Manager may have, at its discretion, voluntarily waived all or any portion of its administration fees for the Fund or a share class, which are included in administration fees waived and administration fees waived — class specific in the Statement of Operations.
Transfer Agent: Pursuant to written agreements, certain financial intermediaries, some of which may be affiliates, provide the Fund with sub-accounting, recordkeeping, sub-transfer agency and other administrative services with respect to sub-accounts they service. For these services, these entities receive an asset-based fee or an annual fee per shareholder account, which will vary depending on share class and/or net assets.
The Manager maintains a call center that is responsible for providing certain shareholder services to the Fund. Shareholder services include responding to inquiries and processing subscriptions and redemptions based upon instructions from shareholders. For the six months ended January 31, 2017, the Fund reimbursed the Manager the following amounts for costs incurred in running the call center, which are included in transfer agent — class specific in the Statement of Operations:
| | | | |
| Institutional | | Class K | | Total |
$ 18 | | $ 5 | | $ 23 |
|
For the six months ended January 31, 2017, the following table shows the class specific transfer agent fees borne directly by each class of the Fund: |
| Institutional | | Class K | | Total |
$ 3,072 | | $ 69 | | $ 3,141 |
Expense Limitations, Waivers, Reimbursements and Recoupments: With respect to the Fund, the Manager contractually or voluntarily agreed to waive and/or reimburse fees or expenses in order to limit expenses, excluding interest expense, dividend expense, tax expense, acquired fund fees and expenses, and certain other fund expenses, which constitute extraordinary expenses not incurred in the ordinary course of the Fund’s business (“expense limitation”). The expense limitations as a percentage of average daily net assets are as follows:
| | | | |
| | | Contractual1 | | Voluntary2 |
Institutional | | 0.35% | | 0.30% |
Class K | | 0.30% | | 0.20% |
| | 1 | | The Manager has agreed not to reduce or discontinue this contractual waiver or reimbursement through November 30, 2017 unless approved by the Board, including a majority of the trustees who are not “interested persons” of the Fund, as defined in the 1940 Act (“Independent Trustees”) or by a vote of majority of the outstanding voting securities of the Fund. |
| | 2 | | The voluntary waiver or reimbursement may be reduced or discontinued at any time. |
Prior to November 28, 2016, the expense limitations as a percentage of average daily net assets were as follows:
| | | | |
| | | | | Voluntary |
Institutional | | | | 0.20% |
Class K | | | | 0.10% |
| | | | | | |
| 18 | | BLACKROCK SHORT OBLIGATIONS FUND | | JANUARY 31, 2017 | | |
| | | | |
| Notes to Financial Statements (continued) | | | | |
These amounts waived or reimbursed are included in fees waived by the Manager, expense reimbursed by the Manager and shown as administration fees waived, administration fees waived — class specific, transfer agent fees waived — class specific, transfer agent fees reimbursed — class specific and expenses reimbursed by the Manager, respectively, in the Statement of Operations. For the six months ended January 31, 2017, the Manager waived $94,018 of investment advisory fees, which is included in fees waived by the Manager in the Statement of Operations. For the six months ended January 31, 2017, the Manager waived $13,362 of administration fees, which is included in administration fees waived in the Statement of Operations. The Manager reimbursed expenses, which are shown as expenses reimbursed by the Manager in the Statement of Operations.
Class specific waivers or reimbursements are as follows:
| | | | | | |
| | | Institutional | | Class K | | Total |
Administration Fees Waived | | $58 | | $ 4,763 | | $ 4,821 |
Transfer Agent Fees Waived | | — | | $ 6 | | $ 6 |
Transfer Agent Fees Reimbursed | | $28 | | $ 56 | | $ 84 |
With respect to the Fund, the Manager voluntarily agreed to waive its investment advisory fees by the amount of investment advisory fees the Fund pays to the Manager indirectly through its investment in affiliated money market funds (the “affiliated money market fund waiver”). These amounts are included in fees waived by the Manager in the Statement of Operations. The amount of waivers and/or reimbursements of fees and expenses made pursuant to the expense limitation caps, as applicable, will be reduced by the amount of the affiliated money market fund waiver. For the six months ended January 31, 2017, the Manager waived $78 of investment advisory fees, which is included in fees waived by the Manager in the Statement of Operations.
Effective September 1, 2016, the Manager voluntarily agreed to waive its investment advisory fee with respect to any portion of Fund’s assets invested in affiliated equity or fixed-income mutual funds or affiliated exchange-traded funds that have a contractual management fee. Prior to September 1, 2016, the Manager did not waive such fees. Effective November 28, 2016, the waiver became contractual through November 30, 2017. This contractual agreement may be terminated upon 90 days’ notice by a majority of Independent Trustees or by a vote of a majority of the outstanding voting securities of the Fund.
With respect to the contractual expense caps, if during the Fund’s fiscal year the operating expenses of a share class, that at any time during the prior two fiscal years received a waiver and/or reimbursement from the Manager, are less than the expense cap for that share class, the Manager is entitled to be reimbursed by such share class up to the lesser of the following expenses:
(a) The amount of fees waived and/or expenses reimbursed during those prior two fiscal years under the agreement.
(b) The amount by which the expense cap for that share class exceeds the operating expenses of the share class for the current fiscal year, provided that:
• The Fund, of which the share class is a part, has more than $50 million in assets for the fiscal year; and
• The Manager or an affiliate continues to serve as the Fund’s investment adviser or administrator.
In the event the expense cap for a share class is changed subsequent to a fiscal year in which the Manager becomes entitled to reimbursement for fees waived and/or reimbursed, the amount available to reimburse the Manager shall be calculated by reference to the expense cap for that share class in effect at the time the Manager became entitled to receive such reimbursement, rather than the subsequently changed expense cap for that share class.
For the six months ended January 31, 2017, the Manager recouped the following fund level and class specific waivers and/or reimbursements previously recorded by the Fund:
| | | | | | |
| Institutional | | Class K | | Total | |
$ 42 | | $ 5 | | $ | 47 | |
On January 31, 2017, the Fund level and class specific waivers and/or reimbursements subject to possible future recoupment under the expense limitation agreement are as follows:
| | | | | | | | | | | | | | | | |
| | | Expiring July 31, | | | | |
| | | 2017 | | | 2018 | | | 2019 | | | | |
Fund Level | | $ | 200,721 | | | $ | 244,884 | | | $ | 132,388 | | | | | |
Institutional | | | — | | | | — | | | | — | | | | | |
Class K | | $ | 4,286 | | | $ | 9,004 | | | | — | | | | | |
| | | | | | |
| | | BLACKROCK SHORT OBLIGATIONS FUND | | JANUARY 31, 2017 | | 19 |
| | | | |
| Notes to Financial Statements (continued) | | | | |
Interfund Lending: In accordance with an exemptive order (the “Order”) from the U.S. Securities and Exchange Commission, the Fund may participate in a joint lending and borrowing facility for temporary purposes (the “Interfund Lending Program”), subject to compliance with the terms and conditions of the Order, and to the extent permitted by the Fund’s investment policies and restrictions. The Fund is currently permitted to borrow and lend under the Interfund Lending Program.
The Fund may lend in aggregate up to 15% of its net assets, but may not lend more than 5% of its net assets to any one borrowing fund through the Interfund Lending Program. The Fund may not borrow through the Interfund Lending Program or from any other source more than 33 1/3% of its total assets (or any lower threshold provided for by the Fund’s investment restrictions). If the Fund’s total outstanding borrowings exceed 10% of its total assets, each of its outstanding interfund loans will be subject to collateralization of at least 102% of the outstanding principal value of the loan. All interfund loans are for temporary or emergency purposes and the interest rate to be charged will be the average of the highest current overnight repurchase agreement rate available to a lending fund and the bank loan rate, as calculated according to a formula established by the Board.
During the period ended January 31, 2017, the Fund did not participate in the Interfund Lending Program.
Officers and Trustees: Certain officers and/or trustees of the Trust are officers and/or directors of BlackRock or its affiliates. The Fund reimburses the Manager for a portion of the compensation paid to the Trust’s Chief Compliance Officer, which is included in Officer and Trustees in the Statement of Operations.
6. Purchases and Sales:
For the six months ended January 31, 2017, purchases and sales of investments, excluding short-term securities, were $36,294,809 and $32,770,063, respectively.
7. Income Tax Information:
It is the Fund’s policy to comply with the requirements of the Internal Revenue Code of 1986, as amended, applicable to regulated investment companies, and to distribute substantially all of its taxable income to its shareholders. Therefore, no federal income tax provision is required.
The Fund files U.S. federal and various state and local tax returns. No income tax returns are currently under examination. The statute of limitations on the Fund’s U.S. federal tax returns generally remains open for each of the three years ended July 2016 and the period ended July 31, 2013. The statutes of limitations on the Fund’s state and local tax returns may remain open for an additional year depending upon the jurisdiction.
Management has analyzed tax laws and regulations and their application to the Fund as of January 31, 2017, inclusive of the open tax return years, and does not believe that there are any uncertain tax positions that require recognition of a tax liability in the Fund’s financial statements.
As of January 31, 2017, gross unrealized appreciation and depreciation based on cost for federal income tax purposes were as follows:
| | | | |
Tax cost | | $ | 92,937,436 | |
| | | | |
Gross unrealized appreciation | | $ | 102,857 | |
Gross unrealized depreciation | | | (3,351 | ) |
| | | | |
Net unrealized appreciation | | $ | 99,506 | |
| | | | |
8. Bank Borrowings:
The Trust, on behalf of the Fund, along with certain other funds managed by the Manager and its affiliates (“Participating Funds”), is a party to a 364-day, $2.1 billion credit agreement with a group of lenders. Under this agreement, the Fund may borrow to fund shareholder redemptions. Excluding commitments designated for certain individual funds, the Participating Funds, including the Fund, can borrow up to an aggregate commitment amount of $1.6 billion at any time outstanding, subject to asset coverage and other limitations as specified in the agreement. The credit agreement has the following terms: a fee of 0.12% per annum on unused commitment amounts and interest at a rate equal to the higher of (a) one-month LIBOR (but, in any event, not less than 0.00%) on the date the loan is made plus 0.80% per annum or (b) the Fed Funds rate (but, in any event, not less than 0.00%) in effect from time to time plus 0.80% per annum on amounts borrowed. The agreement expires in April 2017 unless extended or renewed. Participating Funds paid administration, legal and arrangement fees, which, if applicable, are included in miscellaneous expenses in the Statement of Operations. These fees were allocated among such funds based upon portions of the aggregate commitment available to them and relative net assets of Participating Funds. During the six months ended January 31, 2017, the Fund did not borrow under the credit agreement.
9. Principal Risks:
In the normal course of business, the Fund invests in securities and enters into transactions where risks exist due to fluctuations in the market (market risk) or failure of the issuer to meet all its obligations, including the ability to pay principal and interest when due (issuer credit risk). The value of securities held by the Fund may decline in response to certain events, including those directly involving the issuers of securities owned by the Fund.
| | | | | | |
| 20 | | BLACKROCK SHORT OBLIGATIONS FUND | | JANUARY 31, 2017 | | |
| | | | |
| Notes to Financial Statements (concluded) | | | | |
Changes arising from the general economy, the overall market and local, regional or global political and/or social instability, as well as currency, interest rate and price fluctuations, may also affect the securities’ value.
The Fund may be exposed to prepayment risk, which is the risk that borrowers may exercise their option to prepay principal earlier than scheduled during periods of declining interest rates, which would force the Fund to reinvest in lower yielding securities. The Fund may also be exposed to reinvestment risk, which is the risk that income from the Fund’s portfolio will decline if the Fund invests the proceeds from matured, traded or called fixed income securities at market interest rates that are below the Fund portfolio’s current earnings rate.
Counterparty Credit Risk: Similar to issuer credit risk, the Fund may be exposed to counterparty credit risk, or the risk that an entity may fail to or be unable to perform on its commitments related to unsettled or open transactions. The Fund manages counterparty credit risk by entering into transactions only with counterparties that the Manager believes have the financial resources to honor their obligations and by monitoring the financial stability of those counterparties. Financial assets, which potentially expose the Fund to market, issuer and counterparty credit risks, consist principally of financial instruments and receivables due from counterparties. The extent of the Fund’s exposure to market, issuer and counterparty credit risks with respect to these financial assets is approximately their value recorded in the Statement of Assets and Liabilities, less any collateral held by the Fund.
Concentration Risk: The Fund invests a significant portion of its assets in fixed income securities and/or uses derivatives tied to the fixed income markets. Changes in market interest rates or economic conditions may affect the value and/or liquidity of such investments. Interest rate risk is the risk that prices of bonds and other fixed income securities will increase as interest rates fall and decrease as interest rates rise. The Fund may be subject to a greater risk of rising interest rates due to the current period of historically low rates.
10. Capital Share Transactions:
Transactions in capital shares for each class were as follows:
| | | | | | | | | | | | | | | | | | | | |
| | | Six Months Ended
January 31, 2017 | | | | | | Year Ended
July 31, 2016 | |
| | | Shares | | | Amount | | | | | | Shares | | | Amount | |
| Institutional | | | | | | | | | | | | | | | |
Shares sold | | | 5,053,666 | | | $ | 50,637,586 | | | | | | | | 693,974 | | | $ | 6,940,552 | |
Shares issued in reinvestment of dividends | | | 9,907 | | | | 99,256 | | | | | | | | 1,841 | | | | 18,425 | |
Shares redeemed | | | (472,145 | ) | | | (4,730,882 | ) | | | | | | | (22,066 | ) | | | (220,824 | ) |
| | | | | | | | | | | | |
Net increase | | | 4,591,428 | | | $ | 46,005,960 | | | | | | | | 673,749 | | | $ | 6,738,153 | |
| | | | | | | | | | | | |
| | | | | | | | | | | | | | | | | | | | |
Class K | | | | | | | | | | | | | | | | | | | | |
Shares sold | | | 10,403,389 | | | $ | 104,351,623 | | | | | | | | 11,981,432 | | | $ | 120,013,856 | |
Shares issued in reinvestment of dividends | | | 16,493 | | | | 165,503 | | | | | | | | 22,741 | | | | 227,749 | |
Shares redeemed | | | (10,597,597 | ) | | | (106,326,890 | ) | | | | | | | (12,985,538 | ) | | | (130,050,000 | ) |
| | | | | | | | | | | | |
Net decrease | | | (177,715 | ) | | $ | (1,809,764 | ) | | | | | | | (981,365 | ) | | $ | (9,808,395 | ) |
| | | | | | | | | | | | |
Total Net Increase (Decrease) | | | 4,413,713 | | | $ | 44,196,196 | | | | | | | | (307,616 | ) | | $ | (3,070,242 | ) |
| | | | | | | | | | | | |
At January 31, 2017, 1,000,000 Institutional Shares and 1,500,450 Class K Shares of the Fund were owned by BlackRock HoldCo 2, Inc., an affiliate of the Fund.
11. Subsequent Events:
Management has evaluated the impact of all subsequent events on the Fund through the date the financial statements were issued and has determined that there were no subsequent events requiring adjustment or additional disclosure in the financial statements.
| | | | | | |
| | | BLACKROCK SHORT OBLIGATIONS FUND | | JANUARY 31, 2017 | | 21 |
Rodney D. Johnson, Chair of the Board and Trustee
Susan J. Carter, Trustee
Collette Chilton, Trustee
Neil A. Cotty, Trustee
Cynthia A. Montgomery, Trustee
Joseph P. Platt, Trustee
Robert C. Robb, Jr., Trustee
Mark Stalnecker, Trustee
Kenneth L. Urish, Trustee
Claire A. Walton, Trustee
Frederick W. Winter, Trustee
Barbara G. Novick, Trustee
John M. Perlowski, Trustee, President and Chief Executive Officer
Thomas Callahan, Vice President
Jennifer McGovern, Vice President
Neal J. Andrews, Chief Financial Officer
Jay M. Fife, Treasurer
Charles Park, Chief Compliance Officer
Fernanda Piedra, Anti-Money Laundering Compliance Officer
Benjamin Archibald, Secretary
Effective December 31, 2016, David O. Beim and Dr. Matina S. Horner resigned as Trustees of the Trust.
| | | | | | |
| | | | |
Investment Adviser and Administrator BlackRock Advisors, LLC Wilmington, DE 19809 | | Accounting Agent and Transfer Agent BNY Mellon Investment Servicing (US) Inc. Wilmington, DE 19809 | | Independent Registered Public Accounting Firm PricewaterhouseCoopers LLP Philadelphia, PA 19103 | | Address of the Trust 100 Bellevue Parkway Wilmington, DE 19809 |
| | | | | | |
Custodian The Bank of New York Mellon New York, NY 10286 | | Distributor BlackRock Investments, LLC New York, NY 10022 | | Legal Counsel Sidley Austin LLP New York, NY 10019 | | |
| | | | | | |
| 22 | | BLACKROCK SHORT OBLIGATIONS FUND | | JANUARY 31, 2017 | | |
Householding
The Fund will mail only one copy of shareholder documents, including prospectuses, annual and semi-annual reports and proxy statements, to shareholders with multiple accounts at the same address. This practice is commonly called “householding” and is intended to reduce expenses and eliminate duplicate mailings of shareholder documents. Mailings of your shareholder documents may be householded indefinitely unless you instruct us otherwise. If you do not want the mailing of these documents to be combined with those for other members of your household, please call the Fund at (800) 537-4942.
Availability of Quarterly Schedule of Investments
The Fund files its complete schedule of portfolio holdings with the SEC for the first and third quarters of each fiscal year on Form N-Q. The Fund’s Forms N-Q are available on the SEC’s website at http://www.sec.gov and may also be reviewed and copied at the SEC’s Public Reference Room in Washington, D.C. Information on the operation of the Public Reference Room or how to access documents on the SEC’s website without charge may be obtained by calling (800) SEC-0330. The Fund’s Forms N-Q may also be obtained upon request and without charge by calling (800) 537-4942.
Availability of Proxy Voting Policies and Procedures
A description of the policies and procedures that the Fund uses to determine how to vote proxies relating to portfolio securities is available upon request and without charge, (1) by calling (800) 537-4942; (2) at http://www.blackrock.com; and (3) on the SEC’s website at http://www.sec.gov.
Availability of Proxy Voting Record
Information about how the Fund voted proxies relating to securities held in the Fund’s portfolio during the most recent 12-month period ended June 30 is available upon request and without charge (1) at http://www.blackrock.com or by calling (800) 537-4942 and (2) on the SEC’s website at http:// www.sec.gov.
BlackRock’s Mutual Fund Family
BlackRock offers a diverse lineup of open-end mutual funds crossing all investment styles and managed by experts in equity, fixed income and tax-exempt investing. Visit http://www.blackrock.com for more information.
Account Information
Call us at (800) 537-4942 from 8:00 AM to 6:00 PM EST on any business day to get information about your account balances, recent transactions and share prices. You can also reach us on the Web at http://www.blackrock.com/funds.
Retirement Plans
Shareholders may make investments in conjunction with Traditional, Rollover, Roth, Coverdell, Simple IRAs, SEP IRAs and 403(b) Plans.
| | | | | | |
| | | BLACKROCK SHORT OBLIGATIONS FUND | | JANUARY 31, 2017 | | 23 |
| | | | |
| Additional Information (concluded) | | | | |
|
| BlackRock Privacy Principles |
BlackRock is committed to maintaining the privacy of its current and former fund investors and individual clients (collectively, “Clients”) and to safeguarding their non-public personal information. The following information is provided to help you understand what personal information BlackRock collects, how we protect that information and why in certain cases we share such information with select parties.
If you are located in a jurisdiction where specific laws, rules or regulations require BlackRock to provide you with additional or different privacy-related rights beyond what is set forth below, then BlackRock will comply with those specific laws, rules or regulations.
BlackRock obtains or verifies personal non-public information from and about you from different sources, including the following: (i) information we receive from you or, if applicable, your financial intermediary, on applications, forms or other documents; (ii) information about your transactions with us, our affiliates, or others; (iii) information we receive from a consumer reporting agency; and (iv) from visits to our websites.
BlackRock does not sell or disclose to non-affiliated third parties any non-public personal information about its Clients, except as permitted by law or as is necessary to respond to regulatory requests or to service Client accounts. These non-affiliated third parties are required to protect the confidentiality and security of this information and to use it only for its intended purpose.
We may share information with our affiliates to service your account or to provide you with information about other BlackRock products or services that may be of interest to you. In addition, BlackRock restricts access to non-public personal information about its Clients to those BlackRock employees with a legitimate business need for the information. BlackRock maintains physical, electronic and procedural safeguards that are designed to protect the non-public personal information of its Clients, including procedures relating to the proper storage and disposal of such information.
| | | | | | |
| 24 | | BLACKROCK SHORT OBLIGATIONS FUND | | JANUARY 31, 2017 | | |
This report is intended for current holders. It is not authorized for use as an offer of sale or a solicitation of an offer to buy shares of the Fund unless preceded or accompanied by the Fund’s current prospectus. Past performance results shown in this report should not be considered a representation of future performance. Investment returns and principal value of shares will fluctuate so that shares, when redeemed, may be worth more or less than their original cost. Statements and other information herein are as dated and are subject to change.

| | |
| |
SHORTS-1/17-SAR | |  |
JANUARY 31, 2017
| | | | |
SEMI-ANNUAL REPORT (UNAUDITED) | | | | BLACKROCK® |
| | | | |
| | BlackRock Strategic Risk Allocation Fund | | of BlackRock FundsSM |
| | |
| Not FDIC Insured ◾ May Lose Value ◾ No Bank Guarantee | | |
Dear Shareholder,
The 12 months ended January 31, 2017 was an exceptionally strong period for risk assets (such as stocks and high yield bonds), while higher-quality assets generated muted returns after struggling in the latter part of 2016. As the period began, worries about slowing growth in China and the instability of oil prices had global equity prices sliding. However, the broad market momentum shifted in the second half of 2016 as reflationary expectations in the United States helped drive a pick-up in global growth.
Markets were remarkably resilient during the period. Big surprises such as the United Kingdom’s vote to leave the European Union and the outcome of the U.S. presidential election brought spikes in equity market volatility, but they were ultimately short-lived. Instead, investors used the sell-offs to seize upon buying opportunities, allowing markets to quickly rebound. We believe this reinforces the case for taking the long view rather than reacting to short-term market noise.
The global reflationary theme — rising nominal growth, wages and inflation — was the dominant driver of asset returns during the period, outweighing significant political upheavals and uncertainty. This trend accelerated after the U.S. election and continued into the beginning of 2017, stoked by expectations for an extra boost to U.S. growth via fiscal policy.
Although economic momentum is gaining traction, the capacity for rapid global growth is restrained by structural factors including an aging population, low productivity growth and excess savings. A tempered economic growth trend and high valuations across most assets have set the stage for muted investment returns going forward.
Equity markets still have room to move, although the disparity between winners and losers is widening, making stock selection increasingly important. Fixed income investors are also facing challenges as bond markets recalibrate to accommodate rising rates and higher inflation expectations. And in a world where political risk and policy uncertainty abound, there is no lack of potential catalysts for higher volatility.
In this environment, investors need to think globally, extend their scope across a broad array of asset classes and be nimble as market conditions change. We encourage you to talk with your financial advisor and visit blackrock.com for further insight about investing in today’s markets.
Sincerely,

Rob Kapito
President, BlackRock Advisors, LLC

Rob Kapito
President, BlackRock Advisors, LLC
| | | | | | | | |
| Total Returns as of January 31, 2017 | |
| | | 6-month | | | 12-month | |
U.S. large cap equities
(S&P 500® Index) | | | 5.96 | % | | | 20.04 | % |
U.S. small cap equities
(Russell 2000® Index) | | | 12.43 | | | | 33.53 | |
International equities
(MSCI Europe, Australasia,
Far East Index) | | | 3.49 | | | | 12.03 | |
Emerging market equities
(MSCI Emerging Markets Index) | | | 4.92 | | | | 25.41 | |
3-month Treasury bills
(BofA Merrill Lynch
3-Month U.S. Treasury
Bill Index) | | | 0.20 | | | | 0.37 | |
U.S. Treasury securities
(BofA Merrill Lynch
10- Year U.S. Treasury
Index) | | | (7.87 | ) | | | (3.26 | ) |
U.S. investment grade
bonds (Bloomberg Barclays
U.S. Aggregate Bond Index) | | | (2.95 | ) | | | 1.45 | |
Tax-exempt municipal
bonds (S&P Municipal Bond Index) | | | (2.94 | ) | | | 0.24 | |
U.S. high yield bonds
(Bloomberg Barclays U.S. Corporate High Yield 2% Issuer Capped Index) | | | 6.09 | | | | 20.77 | |
|
| Past performance is no guarantee of future results. Index performance is shown for illustrative purposes only. You cannot invest directly in an index. | |
| | | | | | |
| 2 | | THIS PAGE NOT PART OF YOUR FUND REPORT | | | | |
| | |

| | Shareholders can sign up for e-mail notifications of quarterly statements, annual and semi-annual shareholder reports and prospectuses by enrolling in the electronic delivery program. Electronic copies of shareholder reports and prospectuses are also available on BlackRock’s website. TO ENROLL IN ELECTRONIC DELIVERY: Shareholders Who Hold Accounts with Investment Advisors, Banks or Brokerages: Please contact your financial advisor. Please note that not all investment advisors, banks or brokerages may offer this service. Shareholders Who Hold Accounts Directly with BlackRock: 1. Access the BlackRock website at blackrock.com 2. Select “Access Your Account” 3. Next, select “eDelivery” in the “Related Resources” box and follow the sign-up instructions |
| | | | | | |
| | | BLACKROCK STRATEGIC RISK ALLOCATION FUND | | JANUARY 31, 2017 | | 3 |
| | | | |
| Fund Summary as of January 31, 2017 | | | | |
BlackRock Strategic Risk Allocation Fund’s (the “Fund”) investment objective is to seek total return.
On November 18, 2016, the Board of Trustees of BlackRock FundsSM approved a change in the name of the Fund to “BlackRock Total Factor Fund” and certain changes to the Fund’s investment strategy and investment process which became effective on February 3, 2017.
|
| Portfolio Management Commentary |
How did the Fund perform?
| • | | For the six-month period ended January 31, 2017, the Fund underperformed its benchmark, a blend of 60% MSCI World Index Hedged USD Net/40% Bloomberg Barclays U.S. Aggregate Bond Index. |
What factors influenced performance?
| • | | The Fund has a global multi-asset strategy designed to balance sources of risk and return more optimally than traditional asset allocation portfolios. The Fund will determine the appropriate allocation across classes by seeking a balance of exposure to risks such as interest rate, credit, inflation, liquidity, economic and emerging market risks. |
| • | | The performance of the blend of 60% MSCI World Index Hedged USD Net/40% Bloomberg Barclays U.S. Aggregate Bond Index is primarily determined by the performance of equity markets. Measured in terms of risk rather than dollars, the comparative index has an allocation of approximately 90% in equities and 10% in bonds. |
| • | | During the six-month period, negative performance relative to the blended benchmark was driven by the Fund’s asset class exposures, with developed market sovereign debt, inflation-linked debt, and property holdings the biggest laggards. These areas were negatively impacted as real interest rates and inflation expectations rose over the period. |
| • | | The Fund’s exposures to the liquidity, economic growth, credit, and emerging markets factors contributed positively to returns over the six-month period, amidst the pro-growth, reflation theme that drove markets. From an asset class perspective, the strongest contributors to return |
| | | were developed market small-cap equities, developed market large-cap equities, high yield credit, and emerging markets credit. |
| • | | The Fund routinely holds derivatives to replicate the performance of global equity and bond market indices in a cost-efficient and capital-efficient manner. In addition, the Fund held derivatives designed to protect against the risk of an abrupt rise in U.S. interest rates. As yields rose over the period, these derivatives, in particular foreign currency transactions, contributed positively to performance. |
| • | | The Fund held cash in reserve in order to meet any potential margin calls. The cash balance did not have a material impact on performance. |
Describe recent portfolio activity.
| • | | From a broad perspective, the Fund entered the period with full risk exposure based on the view that investor sentiment and global markets had stabilized. This stance was maintained throughout the six months ended January 31, 2017. |
Describe portfolio positioning at period end.
| • | | The Fund seeks to deliver absolute returns by balancing risks between bonds, equities, and diversifying strategies. At the end of the period, the portfolio was underweight to real rates relative to economic risk as the investment adviser’s central scenario is that real rates will experience low returns and higher volatility. Equities and fixed income represented about 38% and 40% of total risk, respectively, with the remaining 22% of risk represented by property, commodities and volatility allocations. |
The views expressed reflect the opinions of BlackRock as of the date of this report and are subject to change based on changes in market, economic or other conditions. These views are not intended to be a forecast of future events and are no guarantee of future results.
| | |
| Portfolio Composition | | Percent of
Total Investments1 |
| | | | |
Foreign Government Obligations | | | 83 | % |
Investment Companies | | | 17 | |
| | 1 | | Total investments exclude short-term securities. |
| | |
| Portfolio Holdings | | Percent of
Total Investments1 |
| | | | |
Sweden Inflation Linked Bonds | | | 23 | % |
Australia Government Inflation Linked Bonds | | | 21 | |
iShares TIPS Bond ETF | | | 17 | |
Republic of France Inflation Linked Bonds | | | 14 | |
Canadian Government Inflation Linked Bonds | | | 11 | |
United Kingdom Gilt Inflation Linked Bonds | | | 9 | |
Deutsche Bundesrepublik Inflation Linked Bonds | | | 5 | |
| | | | | | |
| 4 | | BLACKROCK STRATEGIC RISK ALLOCATION FUND | | JANUARY 31, 2017 | | |
|
| Total Return Based on a $10,000 Investment |
| | 1 | Assuming maximum sales charges, if any, transaction costs and other operating expenses, including investment advisory fees and administration fees, if any. Institutional Shares do not have a sales charge. |
| | 2 | The Fund invests in a broad range of global asset classes, such as equity securities, fixed and floating rate debt instruments, derivatives, other investment companies, including ETFs, REITs and commodity-related instruments. |
| | 3 | This customized weighted index is comprised of the returns of the 60% MSCI World Index Hedged USD Net/40% Bloomberg Barclays U.S. Aggregate Bond Index. |
| | 4 | An index composed of the following 23 developed market country indices: Australia, Austria, Belgium, Canada, Denmark, Finland, France, Germany, Hong Kong, Ireland, Israel, Italy, Japan, Netherlands, New Zealand, Norway, Portugal, Singapore, Spain, Sweden, Switzerland, the United Kingdom, and the United States and calculated with net dividends reinvested daily on the ex-dividends date 100% hedged to USD using 1-month forward exchange rates. |
| | 5 | A widely recognized unmanaged market-weighted index, comprised of investment-grade corporate bonds rated BBB or better, mortgages and U.S. Treasury and U.S. Government agency issues with at least one year to maturity. |
| | 6 | Commencement of operations. |
|
| Performance Summary for the Period Ended January 31, 2017 |
| | | | | | | | | | | | | | | | | | | | | | | | | |
| | | | | Average Annual Total Returns7 |
| | | | | 1 Year | | Since Inception8 |
| | | 6-Month
Total Returns | | w/o sales charge | | w/ sales charge | | w/o sales charge | | w/ sales charge |
Institutional | | | | 0.90 | % | | | | 11.37 | % | | | | N/A | | | | | 2.81 | % | | | | N/A | |
Investor A | | | | 0.81 | | | | | 11.16 | | | | | 5.32 | % | | | | 2.57 | | | | | 1.23 | % |
Investor C | | | | 0.36 | | | | | 10.23 | | | | | 9.23 | | | | | 1.77 | | | | | 1.77 | |
60% MSCI World Index Hedged USD Net/40% Bloomberg Barclays U.S. Aggregate Bond Index | | | | 2.95 | | | | | 10.69 | | | | | N/A | | | | | 8.02 | | | | | N/A | |
MSCI World Index Hedged USD Net | | | | 7.01 | | | | | 17.13 | | | | | N/A | | | | | 12.17 | | | | | N/A | |
Bloomberg Barclays U.S. Aggregate Bond Index | | | | (2.95 | ) | | | | 1.45 | | | | | N/A | | | | | 1.73 | | | | | N/A | |
| | 7 | | Assuming maximum sales charges, if any. Average annual total returns with and without sales charges reflect reductions for distribution and service fees. See “About Fund Performance” on page 6 for a detailed description of share classes, including any related sales charges and fees. |
| | 8 | | The Fund commenced operations on December 27, 2012. |
| | | | N/A—Not applicable as share class and index do not have a sales charge. |
| | | | Past performance is not indicative of future results. |
| | | | Performance results may include adjustments made for financial reporting purposes in accordance with U.S. generally accepted accounting principles. |
| | | | | | | | | | | | | | |
| Expense Example |
| | | Actual | | Hypothetical10 | | |
| | | Beginning Account Value
August 1, 2016 | | Ending Account Value
January 31, 2017 | | Expenses Paid
During the Period9 | | Beginning Account Value
August 1, 2016 | | Ending Account Value
January 31, 2017 | | Expenses Paid
During the Period9 | | Annualized Expense Ratio |
Institutional | | $1,000.00 | | $1,009.00 | | $4.25 | | $1,000.00 | | $1,020.97 | | $4.28 | | 0.84% |
Investor A | | $1,000.00 | | $1,008.10 | | $5.42 | | $1,000.00 | | $1,019.81 | | $5.45 | | 1.07% |
Investor C | | $1,000.00 | | $1,003.60 | | $9.24 | | $1,000.00 | | $1,015.98 | | $9.30 | | 1.83% |
| | 9 | | For each class of the Fund, expenses are equal to the annualized expense ratio for the class, multiplied by the average account value over the period, multiplied by 184/365 (to reflect the one-half year period shown). |
| | 10 | | Hypothetical 5% annual return before expenses is calculated by prorating the number of days in the most recent fiscal period divided by 365. |
| | | | See “Disclosure of Expenses” on page 6 for further information on how expenses were calculated. |
| | | | | | |
| | | BLACKROCK STRATEGIC RISK ALLOCATION FUND | | JANUARY 31, 2017 | | 5 |
| • | | Institutional Shares are not subject to any sales charge. These shares bear no ongoing distribution or service fees and are available only to certain eligible investors. |
| • | | Investor A Shares are subject to a maximum initial sales charge (front-end load) of 5.25% and a service fee of 0.25% per year (but no distribution fee). Certain redemptions of these shares may be subject to a contingent deferred sales charge (“CDSC”) where no initial sales charge was paid at the time of purchase. These shares are generally available through financial intermediaries. |
| • | | Investor C Shares are subject to a 1.00% CDSC if redeemed within one year of purchase. In addition, these shares are subject to a distribution fee of 0.75% per year and a service fee of 0.25% per year. These shares are generally available through financial intermediaries. |
Performance information reflects past performance and does not guarantee future results. Current performance may be lower or higher than the performance data quoted. Refer to www.blackrock.com/funds to obtain performance data current to the most recent month end. Performance results do not reflect the deduction of taxes that a shareholder would pay on fund distributions or the redemption of fund shares.
Figures shown in the performance table on the previous page assumes reinvestment of all distributions, if any, at net asset value (“NAV”) on the ex-dividend date. Investment return and principal value of shares will fluctuate so that shares, when redeemed, may be worth more or less than their original cost. Distributions paid to each class of shares will vary because of the different levels of service, distribution and transfer agency fees applicable to each class, which are deducted from the income available to be paid to shareholders.
BlackRock Advisors, LLC (the “Manager”), the Fund’s investment adviser, has contractually agreed to waive and/or reimburse a portion of the Fund’s expenses. Without such waiver and/or reimbursement, the Fund’s performance would have been lower. The Manager is under no obligation to continue waiving and/or reimbursing its fees after the applicable termination date of such agreement. See Note 6 of the Notes to Consolidated Financial Statements for additional information on waivers and/or reimbursements.
Shareholders of the Fund may incur the following charges: (a) transactional expenses, such as sales charges; and (b) operating expenses, including investment advisory fees, service and distribution fees, including 12b-1 fees, acquired fund fees and expenses, and other fund expenses. The expense example on the previous page (which is based on a hypothetical investment of $1,000 invested on August 1, 2016 and held through January 31, 2017) is intended to assist shareholders both in calculating expenses based on an investment in the Fund and in comparing these expenses with similar costs of investing in other mutual funds.
The expense example provides information about actual account values and actual expenses. In order to estimate the expenses a shareholder paid during the period covered by this report, shareholders can divide their account value by $1,000 and then multiply the result by the number corresponding to their share class under the headings entitled “Expenses Paid During the Period.”
The expense example also provides information about hypothetical account values and hypothetical expenses based on the Fund’s actual expense ratio and an assumed rate of return of 5% per year before expenses. In order to assist shareholders in comparing the ongoing expenses of investing in the Fund and other funds, compare the 5% hypothetical example with the 5% hypothetical examples that appear in shareholder reports of other funds.
The expenses shown in the expense example are intended to highlight shareholders’ ongoing costs only and do not reflect any transactional expenses, such as sales charges, if any. Therefore, the hypothetical example is useful in comparing ongoing expenses only, and will not help shareholders determine the relative total expenses of owning different funds. If these transactional expenses were included, shareholder expenses would have been higher.
| | | | | | |
| 6 | | BLACKROCK STRATEGIC RISK ALLOCATION FUND | | JANUARY 31, 2017 | | |
| | | | |
| Derivative Financial Instruments | | | | |
The Fund may invest in various derivative financial instruments. These instruments are used to obtain exposure to a security, commodity, index, market, and/or other asset without owning or taking physical custody of securities, commodities and/or other referenced assets or to manage market, equity, credit, interest rate, foreign currency exchange rate, commodity and/or other risks. Derivative financial instruments may give rise to a form of economic leverage and involve risks, including the imperfect correlation between the value of a derivative financial instrument and the underlying asset, possible default of the counterparty to the transaction or illiquidity of the instrument. The Fund’s successful use of a derivative
financial instrument depends on the investment adviser’s ability to predict pertinent market movements accurately, which cannot be assured. The use of these instruments may result in losses greater than if they had not been used, may limit the amount of appreciation the Fund can realize on an investment and/or may result in lower distributions paid to shareholders. The Fund’s investments in these instruments, if any, are discussed in detail in the Notes to Consolidated Financial Statements.
| | | | | | |
| | | BLACKROCK STRATEGIC RISK ALLOCATION FUND | | JANUARY 31, 2017 | | 7 |
| | | | |
| Consolidated Schedule of Investments January 31, 2017 (Unaudited) | | | (Percentages shown are based on Net Assets) | |
| | | | |
| | | | | | | | | | | | |
| Foreign Government Obligations | | | | | Par
(000) | | | Value | |
Australia — 10.0% | | | | | | | | | | | | |
Australia Government Inflation Linked Bonds: | | | | | | | | | | | | |
1.00%, 11/21/18 | | | AUD | | | | 813 | | | $ | 658,388 | |
4.00%, 8/20/20 | | | | | | | 171 | | | | 242,716 | |
1.25%, 2/21/22 | | | | | | | 583 | | | | 504,884 | |
3.00%, 9/20/25 | | | | | | | 746 | | | | 796,148 | |
2.50%, 9/20/30 | | | | | | | 610 | | | | 641,347 | |
2.00%, 8/21/35 | | | | | | | 391 | | | | 362,472 | |
| | | | | | | | | | | | |
| | | | | | | | | | | | 3,205,955 | |
Canada — 5.0% | | | | | | | | | | | | |
Canadian Government Inflation Linked Bonds: | | | | | | | | | | | | |
4.25%, 12/01/26 | | | CAD | | | | 373 | | | | 399,474 | |
4.00%, 12/01/31 | | | | | | | 401 | | | | 466,706 | |
2.00%, 12/01/41 | | | | | | | 360 | | | | 361,236 | |
1.50%, 12/01/44 | | | | | | | 313 | | | | 291,387 | |
1.25%, 12/01/47 | | | | | | | 100 | | | | 89,929 | |
| | | | | | | | | | | | |
| | | | | | | | | | | | 1,608,732 | |
France — 6.5% | | | | | | | | | | | | |
Republic of France Inflation Linked Bonds: | | | | | | | | | | | | |
0.10%, 7/25/21 | | | EUR | | | | 457 | | | | 527,424 | |
1.10%, 7/25/22 | | | | | | | 369 | | | | 450,853 | |
1.85%, 7/25/27 | | | | | | | 479 | | | | 644,261 | |
0.70%, 7/25/30 | | | | | | | 389 | | | | 472,822 | |
| | | | | | | | | | | | |
| | | | | | | | | | | | 2,095,360 | |
Germany — 2.4% | | | | | | | | | | | | |
Deutsche Bundesrepublik Inflation Linked Bonds: | | | | | | | | | | | | |
0.75%, 4/15/18 | | | | | | | 127 | | | | 140,740 | |
1.75%, 4/15/20 | | | | | | | 50 | | | | 60,195 | |
0.10%, 4/15/23 | | | | | | | 213 | | | | 250,847 | |
0.50%, 4/15/30 | | | | | | | 256 | | | | 324,948 | |
| | | | | | | | | | | | |
| | | | | | | | | | | | 776,730 | |
Sweden — 10.8% | | | | | | | | | | | | |
Sweden Inflation Linked Bonds: | | | | | | | | | | | | |
0.50%, 6/01/17 | | | SEK | | | | 4,450 | | | | 538,396 | |
4.00%, 12/01/20 | | | | | | | 855 | | | | 157,997 | |
0.25%, 6/01/22 | | | | | | | 5,630 | | | | 735,307 | |
1.00%, 6/01/25 | | | | | | | 5,450 | | | | 768,442 | |
3.50%, 12/01/28 | | | | | | | 5,630 | | | | 1,268,141 | |
| | | | | | | | | | | | |
| | | | | | | | | | | | 3,468,283 | |
| | | | | | | | | | | | |
| Foreign Government Obligations | | | | | Par (000) | | | Value | |
United Kingdom — 4.4% | | | | | | | | | | | | |
United Kingdom Gilt Inflation Linked Bonds: | | | | | | | | | | | | |
0.13%, 3/22/24 | | | GBP | | | | 68 | | | $ | 99,738 | |
0.13%, 3/22/29 | | | | | | | 23 | | | | 35,542 | |
1.13%, 11/22/37 | | | | | | | 213 | | | | 455,397 | |
0.13%, 3/22/44 | | | | | | | 192 | | | | 380,548 | |
0.75%, 11/22/47 | | | | | | | 183 | | | | 442,570 | |
| | | | | | | | | | | | |
| | | | | | | | | | | | 1,413,795 | |
Total Foreign Government Obligations — 39.1% | | | | | | | | | | | 12,568,855 | |
| | | | | | | | | | | | |
| Investment Companies | | | | | Shares | | | | |
Fixed Income Funds — 8.1% | | | | | | | | | | | | |
iShares TIPS Bond ETF (a) | | | | | | | 22,928 | | | | 2,617,919 | |
Total Long-Term Investments (Cost — $16,157,662) — 47.2% | | | | | | | | | | | 15,186,774 | |
| | | | | | | | | | | | |
| Short-Term Securities | | | | | | | | | |
BlackRock Liquidity Funds, T-Fund, Institutional Class, 0.40% (a)(b)(c) | | | | | | | 15,197,279 | | | | 15,197,279 | |
Total Short-Term Securities (Cost — $15,197,279) — 47.2% | | | | | | | | | | | 15,197,279 | |
| | | | | | | | | | | | |
| | | | |
Total Investments (Cost — $31,354,941) — 94.4% | | | | | | | | | | | 30,384,053 | |
Other Assets Less Liabilities — 5.6% | | | | | | | | | | | 1,796,034 | |
| | | | | | | | | | | | |
Net Assets — 100.0% | | | | | | | | | | $ | 32,180,087 | |
| | | | | | | | | | | | |
| | | | | | | | | | |
| Portfolio Abbreviations |
| ASX | | Australian Securities Exchange | | GBP | | British Pound | | OTC | | Over-the-Counter |
| AUD | | Australian Dollar | | GSCI | | Goldman Sachs Commodity Index | | RUB | | Russian Ruble |
| BRL | | Brazilian Real | | INR | | Indian Rupee | | S&P | | Standard & Poor’s |
| CAD | | Canadian Dollar | | JPY | | Japanese Yen | | SEK | | Swedish Krona |
| CBOE | | Chicago Board Options Exchange | | KRW | | South Korean Won | | SPI | | Share Price Index Futures |
| EPRA | | European Public Real Estate Association | | LIBOR | | London Interbank Offered Rate | | TIPS | | Treasury Inflation Protected Securities |
| ETF | | Exchange-Traded Fund | | MSCI | | Morgan Stanley Capital International | | TOPIX | | Tokyo Stock Price Index |
| EUR | | Euro | | MYR | | Malaysian Ringgit | | TWD | | Taiwan New Dollar |
| FTSE | | Financial Times Stock Exchange | | NAREIT | | National Association of Real Estate Investment Trusts | | USD | | U.S. Dollar |
See Notes to Consolidated Financial Statements.
| | | | | | |
| 8 | | BLACKROCK STRATEGIC RISK ALLOCATION FUND | | JANUARY 31, 2017 | | |
| | | | |
| Consolidated Schedule of Investments (continued) | | | | |
|
Notes to Consolidated Schedule of Investments |
| (a) | During the six months ended January 31, 2017, investments in issuers considered to be affiliates of the Fund for purposes of Section 2(a)(3) of the Investment Company Act of 1940, as amended, were as follows: |
| | | | | | | | | | | | | | | | | | | | | | | | | | | | | | | | |
| Affiliate | | Shares
Held at
July 31, 2016 | | | Shares
Purchased | | | Shares Sold | | | Shares
Held at
January 31,
2017 | | | Value at
January 31,
2017 | | | Income | | | Net
Realized
Gain1 | | | Change in
Unrealized
Appreciation
(Depreciation) | |
BlackRock Liquidity Funds, TempFund, Institutional Class | | | 14,839,187 | | | | — | | | | 14,839,187 | 2 | | | — | | | | — | | | $ | 1,717 | | | | — | | | | — | |
BlackRock Liquidity Funds, T-Fund, Institutional Class | | | — | | | | 15,197,279 | 3 | | | — | | | | 15,197,279 | | | $ | 15,197,279 | | | | 17,788 | | | $ | 71 | | | | — | |
iShares TIPS Bond ETF | | | 20,592 | | | | 2,336 | | | | — | | | | 22,928 | | | | 2,617,919 | | | | — | | | | — | | | $ | (57,881 | ) |
Total | | | | | | | | | | | | | | | | | | $ | 17,815,198 | | | $ | 19,505 | | | $ | 71 | | | $ | (57,881 | ) |
| | | | | | | | | | | | | | | | | | | | |
1 Includes net capital gain distributions.
2 Represents net shares sold.
3 Represents net shares purchased.
| (b) | Current yield as of period end. |
| (c) | All or a portion of security is held by a wholly-owned subsidiary. See Note 1 of the Notes to Consolidated Financial Statements for details on the wholly-owned subsidiary. |
|
Derivative Financial Instruments Outstanding as of Period End |
Futures Contracts
| | | | | | | | | | | | | | |
Contracts Long (Short) | | Issue | | Expiration | | Notional Value | | | Unrealized
Appreciation
(Depreciation) | |
1 | | ASX SPI 200 Index1 | | March 2017 | | USD | | | 105,322 | | | $ | 927 | |
36 | | Australian Government Bonds (10 Year) | | March 2017 | | USD | | | 3,502,784 | | | | 47,236 | |
(24) | | CBOE Volatility Index | | March 2017 | | USD | | | 343,800 | | | | 29,913 | |
20 | | Euro STOXX 50 Index1 | | March 2017 | | USD | | | 698,224 | | | | 3,677 | |
4 | | FTSE 100 Index1 | | March 2017 | | USD | | | 354,531 | | | | 9,183 | |
51 | | Japanese Government Bonds (10 Year) | | March 2017 | | USD | | | 6,766,726 | | | | (23,010 | ) |
13 | | Mini MSCI Emerging Markets Index1 | | March 2017 | | USD | | | 594,815 | | | | 23,601 | |
5 | | Russell 2000 Mini Index1 | | March 2017 | | USD | | | 339,875 | | | | (5,080 | ) |
15 | | S&P 500 E-Mini Index1 | | March 2017 | | USD | | | 1,705,875 | | | | 17,984 | |
3 | | TOPIX Index1 | | March 2017 | | USD | | | 403,064 | | | | 11,335 | |
Total | | | | | | | | | | | | $ | 115,766 | |
| | | | | | | | | | | | | | |
1 All or a portion of security is held by a wholly-owned subsidiary. See Note 1 of the Notes to Consolidated Financial Statements for details on the wholly-owned subsidiary.
| | | | | | | | | | | | | | | | | | | | | | |
| Forward Foreign Currency Exchange Contracts | | | | |
Currency Purchased | | | Currency Sold | | | Counterparty | | Settlement
Date | | | Unrealized
Appreciation
(Depreciation) | |
| AUD | | | 84,000 | 1 | | | USD | | | | 62,797 | | | BNP Paribas S.A. | | | 3/01/17 | | | $ | 867 | |
| CAD | | | 62,000 | 1 | | | USD | | | | 47,245 | | | BNP Paribas S.A. | | | 3/01/17 | | | | 413 | |
| GBP | | | 89,000 | 1 | | | USD | | | | 111,253 | | | BNP Paribas S.A. | | | 3/01/17 | | | | 762 | |
| USD | | | 32,464 | 1 | | | AUD | | | | 45,000 | | | BNP Paribas S.A. | | | 3/01/17 | | | | (1,642 | ) |
| USD | | | 3,410,713 | 1 | | | AUD | | | | 4,573,062 | | | JPMorgan Chase Bank N.A. | | | 3/01/17 | | | | (55,234 | ) |
| USD | | | 248,922 | 1 | | | BRL | | | | 866,000 | | | JPMorgan Chase Bank N.A. | | | 3/01/17 | | | | (24,014 | ) |
| USD | | | 1,843,416 | 1 | | | CAD | | | | 2,475,724 | | | JPMorgan Chase Bank N.A. | | | 3/01/17 | | | | (59,646 | ) |
| USD | | | 62,610 | 1 | | | EUR | | | | 60,000 | | | BNP Paribas S.A. | | | 3/01/17 | | | | (2,225 | ) |
| USD | | | 94,328 | 1 | | | EUR | | | | 89,000 | | | BNP Paribas S.A. | | | 3/01/17 | | | | (1,843 | ) |
| USD | | | 3,491,560 | 1 | | | EUR | | | | 3,270,702 | | | JPMorgan Chase Bank N.A. | | | 3/01/17 | | | | (42,667 | ) |
| USD | | | 110,116 | 1 | | | EUR | | | | 105,000 | | | JPMorgan Chase Bank N.A. | | | 3/01/17 | | | | (3,344 | ) |
| USD | | | 94,325 | 1 | | | GBP | | | | 77,000 | | | BNP Paribas S.A. | | | 3/01/17 | | | | (2,586 | ) |
| USD | | | 46,624 | 1 | | | GBP | | | | 37,000 | | | BNP Paribas S.A. | | | 3/01/17 | | | | 56 | |
See Notes to Consolidated Financial Statements.
| | | | | | |
| | | BLACKROCK STRATEGIC RISK ALLOCATION FUND | | JANUARY 31, 2017 | | 9 |
| | | | |
| Consolidated Schedule of Investments (continued) | | | | |
| | | | |
| | | | | | | | | | | | | | | | | | | | | | |
Currency
Purchased | | | | | Currency Sold | | | Counterparty | | Settlement
Date | | | Unrealized
Appreciation
(Depreciation) | |
USD | | | 92,713 | 1 | | | GBP | | | | 73,000 | | | BNP Paribas S.A. | | | 3/01/17 | | | $ | 836 | |
USD | | | 1,680,164 | 1 | | | GBP | | | | 1,343,006 | | | JPMorgan Chase Bank N.A. | | | 3/01/17 | | | | (10,134 | ) |
USD | | | 178,489 | 1 | | | INR | | | | 12,330,000 | | | Deutsche Bank AG | | | 3/01/17 | | | | (2,598 | ) |
USD | | | 37,707 | 1 | | | JPY | | | | 4,329,000 | | | BNP Paribas S.A. | | | 3/01/17 | | | | (660 | ) |
USD | | | 692,202 | 1 | | | JPY | | | | 77,740,633 | | | JPMorgan Chase Bank N.A. | | | 3/01/17 | | | | 3,188 | |
USD | | | 86,428 | 1 | | | MYR | | | | 391,000 | | | JPMorgan Chase Bank N.A. | | | 3/01/17 | | | | (1,714 | ) |
USD | | | 70,214 | 1 | | | RUB | | | | 4,641,000 | | | JPMorgan Chase Bank N.A. | | | 3/01/17 | | | | (6,437 | ) |
USD | | | 78,725 | 1 | | | SEK | | | | 720,000 | | | BNP Paribas S.A. | | | 3/01/17 | | | | (3,683 | ) |
USD | | | 3,413,287 | 1 | | | SEK | | | | 31,167,468 | | | JPMorgan Chase Bank N.A. | | | 3/01/17 | | | | (154,009 | ) |
USD | | | 261,592 | 1 | | | TWD | | | | 8,333,000 | | | Deutsche Bank AG | | | 3/01/17 | | | | (4,436 | ) |
USD | | | 94,340 | 1 | | | TWD | | | | 2,995,000 | | | JPMorgan Chase Bank N.A. | | | 3/01/17 | | | | (1,275 | ) |
USD | | | 389,540 | 1 | | | KRW | | | | 456,952,000 | | | BNP Paribas S.A. | | | 3/02/17 | | | | (3,791 | ) |
Total | | | | | | | | | | | | | | | | | | | | $ | (375,816 | ) |
| | | | | | | | | | | | | | | | | | | | | | |
| 1 | All or a portion of security is held by a wholly-owned subsidiary. See Note 1 of the Notes to Consolidated Financial Statements for details on the wholly-owned subsidiary. |
| | | | | | | | | | | | | | | | | | | | | | | | |
Centrally Cleared Credit Default Swaps – Sell Protection | |
| Index | | Receive
Fixed
Rate | | | Expiration
Date | | | Credit
Rating1 | | | Notional
Amount (000)2 | | | Unrealized
Appreciation | |
CDX.NA.HY Series 27 Version 1 | | | 5.00% | | | | 12/20/21 | | | | B+ | | | | USD | | | | 3,131 | | | $ | 120,056 | |
CDX.NA.IG Series 27 Version 1 | | | 1.00% | | | | 12/20/21 | | | | BBB+ | | | | USD | | | | 7,980 | | | | 60,626 | |
iTraxx Europe Crossover Series 26 Version 1 | | | 5.00% | | | | 12/20/21 | | | | B+ | | | | EUR | | | | 1,045 | | | | 18,611 | |
iTraxx Europe Series 26 Version 1 | | | 1.00% | | | | 12/20/21 | | | | BBB+ | | | | EUR | | | | 6,950 | | | | 8,251 | |
Total | | | | | | | | | | | | | | | | | | | | | | $ | 207,544 | |
| | | | | | | | | | | | | | | | | | | | | | | | |
| | 1 | | Using S&P’s rating of the issuer or the underlying securities of the index, as applicable. |
| | 2 | | The maximum potential amount the Fund may pay should a negative credit event take place as defined under the terms of the agreement. |
| | | | | | | | | | | | | | | | | | | | | | | | | | | | | | | | | | |
OTC Credit Default Swaps – Sell Protection | |
| Index | | Receive Fixed Rate | | | Counterparty | | Expiration
Date | | | Credit
Rating1 | | | Notional
Amount
(000)2 | | | Value | | | Premiums
Received | | | Unrealized
Appreciation
(Depreciation) | |
CDX.EM Series 26 Version 1 | | | 1.00% | | | Bank of America N.A. | | | 12/20/21 | | | | BBB- | | | | USD | | | | 250 | | | $ | (14,708 | ) | | $ | (15,134 | ) | | $ | 426 | |
CDX.EM Series 26 Version 1 | | | 1.00% | | | Credit Suisse International | | | 12/20/21 | | | | BBB- | | | | USD | | | | 4,200 | | | | (247,105 | ) | | | (227,838 | ) | | | (19,267 | ) |
Total | | | | | | | | | | | | | | | | | | | | | | | | $ | (261,813 | ) | | $ | (242,972 | ) | | $ | (18,841 | ) |
| | | | | | | | | | | | | | | | | | | | | | | | | | |
| | 1 | | Using S&P’s rating of the issuer or the underlying securities of the index, as applicable. |
| | 2 | | The maximum potential amount the Fund may pay should a negative credit event take place as defined under the terms of the agreement. |
See Notes to Consolidated Financial Statements.
| | | | | | |
| 10 | | BLACKROCK STRATEGIC RISK ALLOCATION FUND | | JANUARY 31, 2017 | | |
| | | | |
| Consolidated Schedule of Investments (continued) | | | | |
OTC Total Return Swaps
| | | | | | | | | | | | | | | | | | | | |
| Reference Entity | | Fixed Rate
(Amount)/
Floating Rate | | Counterparty | | Expiration
Date | | Contract
Amount | | | Value | | | Premiums
Paid
(Received) | | Unrealized
Appreciation
(Depreciation) | |
Canadian (10 Year) Bond Futures March 2017 | | CAD 4,874,3842 | | Merrill Lynch
International | | 2/22/17 | | | 35 | | | $ | (49,171 | ) | | — | | $ | (49,171 | ) |
Long Gilt Futures March 2017 | | GBP 122,4012 | | Bank of America
N.A. | | 2/23/17 | | | 1 | | | | 1,848 | | | — | | | 1,848 | |
Long Gilt Futures March 2017 | | GBP 2,581,8662 | | Merrill Lynch
International | | 2/23/17 | | | 21 | | | | 24,410 | | | — | | | 24,410 | |
Long Gilt Futures March 2017 | | GBP 124,4512 | | Merrill Lynch
International | | 2/23/17 | | | 1 | | | | (731 | ) | | — | | | (731 | ) |
U.S. Treasury (10 Year) Notes Futures March 2017 | | USD 124,5312 | | Bank of America
N.A. | | 2/24/17 | | | 1 | | | | (62 | ) | | — | | | (62 | ) |
U.S. Treasury (10 Year) Notes Futures March 2017 | | USD 4,738,7412 | | Merrill Lynch
International | | 2/24/17 | | | 38 | | | | (8,928 | ) | | — | | | (8,928 | ) |
U.S. Treasury (10 Year) Notes Futures March 2017 | | USD 124,8122 | | Merrill Lynch
International | | 2/24/17 | | | 1 | | | | (344 | ) | | — | | | (344 | ) |
Euro-Bund Futures March 2017 | | EUR 160,9602 | | Bank of America
N.A. | | 3/06/17 | | | 1 | | | | 1,263 | | | — | | | 1,263 | |
Euro-Bund Futures March 2017 | | EUR 2,910,0782 | | Merrill Lynch
International | | 3/08/17 | | | 18 | | | | 8,919 | | | — | | | 8,919 | |
FTSE EPRA/NAREIT Developed Index1 | | 3-month LIBOR minus
0.23%3 | | JPMorgan Chase
Bank N.A. | | 3/17/17 | | | 81 | | | | 5,926 | | | — | | | 5,926 | |
FTSE EPRA/NAREIT Developed Index1 | | 3-month LIBOR minus
0.23%3 | | JPMorgan Chase
Bank N.A. | | 3/17/17 | | | 70 | | | | 5,121 | | | — | | | 5,121 | |
FTSE EPRA/NAREIT Developed Index1 | | 3-month LIBOR minus
0.23%3 | | JPMorgan Chase
Bank N.A. | | 3/17/17 | | | 23 | | | | 1,683 | | | — | | | 1,683 | |
MSCI Emerging Markets Net Total Return Index1 | | 3-month LIBOR plus
0.09%3 | | JPMorgan Chase
Bank N.A. | | 3/17/17 | | | 2,362 | | | | 56,372 | | | — | | | 56,372 | |
MSCI Emerging Markets Net Total Return Index1 | | 3-month LIBOR plus
0.40%3 | | JPMorgan Chase
Bank N.A. | | 3/17/17 | | | 1,402 | | | | 33,274 | | | — | | | 33,274 | |
MSCI World Small Cap Net Total Return Index1 | | 3-month LIBOR minus
0.23%3 | | JPMorgan Chase
Bank N.A. | | 3/17/17 | | | 1,744 | | | | 15,911 | | | — | | | 15,911 | |
S&P GSCI Excess Return on the Light Energy Index1 | | 3-month U.S. Treasury
Bill3 | | JPMorgan Chase
Bank N.A. | | 3/17/17 | | | 2,837 | | | | 7,562 | | | — | | | 7,562 | |
S&P GSCI Excess Return on the Light Energy Index1 | | USD 731,7262 | | BNP Paribas S.A. | | 3/17/17 | | | 3,948 | | | | 49,385 | | | — | | | 49,385 | |
S&P GSCI Excess Return on the Light Energy Index1 | | USD 323,8622 | | BNP Paribas S.A. | | 3/17/17 | | | 1,670 | | | | 20,890 | | | — | | | 20,890 | |
S&P GSCI Excess Return on the Light Energy Index1 | | USD 119,2872 | | BNP Paribas S.A. | | 3/17/17 | | | 646 | | | | 8,523 | | | — | | | 8,523 | |
S&P GSCI Excess Return on the Light Energy Index1 | | USD 667,3094 | | JPMorgan Chase
Bank N.A. | | 3/17/17 | | | 3,372 | | | | 9,291 | | | — | | | 9,291 | |
S&P GSCI Excess Return on the Light Energy Index1 | | USD 169,2022 | | JPMorgan Chase
Bank N.A. | | 3/17/17 | | | 855 | | | | 2,356 | | | — | | | 2,356 | |
S&P GSCI Excess Return on the Light Energy Index1 | | USD 132,9874 | | JPMorgan Chase
Bank N.A. | | 3/17/17 | | | 672 | | | | 1,852 | | | — | | | 1,852 | |
S&P GSCI Excess Return on the Light Energy Index1 | | USD 120,3204 | | JPMorgan Chase
Bank N.A. | | 3/17/17 | | | 613 | | | | 1,689 | | | — | | | 1,689 | |
MSCI Emerging Markets Net Total Return Index1 | | 3-month LIBOR plus
0.22%3 | | Deutsche Bank AG | | 6/16/17 | | | 2,009 | | | | 47,835 | | | — | | | 47,835 | |
See Notes to Consolidated Financial Statements.
| | | | | | |
| | | BLACKROCK STRATEGIC RISK ALLOCATION FUND | | JANUARY 31, 2017 | | 11 |
| | | | |
| Consolidated Schedule of Investments (continued) | | | | |
| | | | | | | | | | | | | | | | | | | | | | | | | | |
| Reference Entity | | Fixed Rate
(Amount)/
Floating Rate | | | Counterparty | | | Expiration
Date | | | Contract
Amount | | | Value | | | Premiums
Paid
(Received) | | Unrealized
Appreciation
(Depreciation) | |
MSCI World Small Cap Net Total Return Index1 | |
| 3-month LIBOR minus
0.24%3 |
| |
| JPMorgan Chase
Bank N.A. |
| | | 6/16/17 | | | | 5,802 | | | $ | 63,895 | | | — | | $ | 63,895 | |
MSCI World Small Cap Net Total Return Index1 | |
| 3-month LIBOR minus
0.24%3 |
| |
| JPMorgan Chase
Bank N.A. |
| | | 6/16/17 | | | | 434 | | | | 4,779 | | | — | | | 4,779 | |
S&P GSCI Excess Return on the Light Energy Index1 | | | USD 1,603,024 | | |
| JPMorgan Chase
Bank N.A. |
| | | 6/16/17 | | | | 8,167 | | | | 22,517 | | | — | | | 22,517 | |
Total | | | | | | | | | | | | | | | | | | $ | 336,065 | | | — | | $ | 336,065 | |
| | | | | | | | | | | | | | | | | | | | |
| | 1 | | All or a portion of security is held by a wholly-owned subsidiary. See Note 1 of the Notes to Consolidated Financial Statements for details on the wholly-owned subsidiary. |
| | 2 | | Fund receives the total return of the reference entity and pays the fixed amount. Net payment made at termination. |
| | 3 | | Fund receives the total return of the reference entity and pays the floating amount. |
| | 4 | | Fund receives the total return of the reference entity and pays the fixed amount. |
| | | | | | | | |
| Transactions in Options Written for the Period Ended January 31, 2017 | |
| | | Calls | |
| | | | |
| | | Notional (000) | | | | |
| | | | |
| | | USD | | | Premiums
Received | |
| | | | |
Outstanding options, beginning of period | | | 6,200 | | | $ | 92,774 | |
Options closed | | | (6,200 | ) | | | (92,774 | ) |
| | | | |
Outstanding options, end of period | | | — | | | | — | |
| | | | |
|
| Derivative Financial Instruments Categorized by Risk Exposure |
As of period end, the fair values of derivative financial instruments located in the Consolidated Statement of Assets and Liabilities were as follows:
| | | | | | | | | | | | | | | | | | | | | | | | | | | | |
| | | | | Commodity
Contracts | | | Credit
Contracts | | | Equity
Contracts | | | Foreign
Currency
Exchange
Contracts | | | Interest
Rate
Contracts | | | Other
Contracts | | Total | |
| Assets - Derivative Financial Instruments | | | | | | | | | | | | | | | | | | | | |
Futures contracts | | Net unrealized appreciation1 | | | — | | | | — | | | $ | 96,620 | | | | — | | | $ | 47,236 | | | — | | $ | 143,856 | |
Forward foreign currency exchange contracts | | Unrealized appreciation on forward foreign currency exchange contracts | | | — | | | | — | | | | — | | | $ | 6,122 | | | | — | | | — | | | 6,122 | |
Swaps - centrally cleared | | Net unrealized appreciation1 | | | — | | | $ | 207,544 | | | | — | | | | — | | | | — | | | — | | | 207,544 | |
Swaps - OTC | | Unrealized appreciation on OTC swaps | | $ | 124,065 | | | | 426 | | | | 234,796 | | | | — | | | | 36,440 | | | — | | | 395,727 | |
| | | |
Total | | | | $ | 124,065 | | | $ | 207,970 | | | $ | 331,416 | | | $ | 6,122 | | | $ | 83,676 | | | — | | $ | 753,249 | |
| | | | | | |
| | | | | | | | | | | | | | | | | | | | | | | | | | | | |
| Liabilities - Derivative Financial Instruments | | | | | | | | | | | | | | | | | | | | |
Futures contracts | | Net unrealized depreciation1 | | | — | | | | — | | | $ | 5,080 | | | | — | | | $ | 23,010 | | | — | | $ | 28,090 | |
Forward foreign currency exchange contracts | | Unrealized depreciation on forward foreign currency exchange contracts | | | — | | | | — | | | | — | | | $ | 381,938 | | | | — | | | — | | | 381,938 | |
Swaps - OTC | | Unrealized depreciation on OTC swaps; Swap premiums received | | | — | | | $ | 262,239 | | | | — | | | | — | | | | 59,236 | | | — | | | 321,475 | |
| | | |
Total | | | | | — | | | $ | 262,239 | | | $ | 5,080 | | | $ | 381,938 | | | $ | 82,246 | | | — | | $ | 731,503 | |
| | | | | | |
| | 1 | | Includes cumulative appreciation (depreciation) on futures contracts and centrally cleared swaps, if any, as reported in the Consolidated Schedule of Investments. Only current day’s variation margin is reported within the Consolidated Statement of Assets and Liabilities. |
See Notes to Consolidated Financial Statements.
| | | | | | |
| 12 | | BLACKROCK STRATEGIC RISK ALLOCATION FUND | | JANUARY 31, 2017 | | |
| | | | |
| Consolidated Schedule of Investments (continued) | | | | |
For the six months ended January 31, 2017, the effect of derivative financial instruments in the Consolidated Statement of Operations was as follows:
| | | | | | | | | | | | | | | | | | | | | | | | | | |
| | | Commodity
Contracts | | | Credit
Contracts | | | Equity
Contracts | | | Foreign
Currency
Exchange
Contracts | | | Interest
Rate
Contracts | | | Other
Contracts | | Total | |
Net Realized Gain (Loss) from: | | | | | | | | | | | | | | | | | | | | | | | | | | |
Futures contracts | | | — | | | | — | | | $ | 447,971 | | | | — | | | $ | (187,822 | ) | | — | | $ | 260,149 | |
Forward foreign currency exchange contracts | | | — | | | | — | | | | — | | | $ | 816,437 | | | | — | | | — | | | 816,437 | |
Options purchased1 | | | — | | | | — | | | | — | | | | — | | | | (197,516 | ) | | — | | | (197,516 | ) |
Options written | | | — | | | | — | | | | — | | | | — | | | | 58,674 | | | — | | | 58,674 | |
Swaps | | | $(10,569 | ) | | $ | 338,647 | | | | 146,351 | | | | — | | | | (142,636 | ) | | — | | | 331,793 | |
| | | | |
Total | | | $(10,569 | ) | | $ | 338,647 | | | $ | 594,322 | | | $ | 816,437 | | | $ | (469,300 | ) | | — | | $ | 1,269,537 | |
| | | | |
| | | | | | | | | | | | | | | | | | | | | | | | | | |
| Net Change in Unrealized Appreciation (Depreciation) on: | | | | | | | | | | | | | | | | | | | | |
Futures contracts | | | — | | | | — | | | $ | (3,929 | ) | | | — | | | $ | (21,831 | ) | | — | | $ | (25,760 | ) |
Forward foreign currency exchange contracts | | | — | | | | — | | | | — | | | $ | (440,421 | ) | | | — | | | — | | | (440,421 | ) |
Options purchased2 | | | — | | | | — | | | | — | | | | — | | | | 193,743 | | | — | | | 193,743 | |
Options written | | | — | | | | — | | | | — | | | | — | | | | 227,779 | | | — | | | 227,779 | |
Swaps | | | $322,823 | | | $ | 19,300 | | | | (245,845 | ) | | | — | | | | (489,934 | ) | | — | | | (393,656 | ) |
| | | | |
Total | | | $322,823 | | | $ | 19,300 | | | $ | (249,774 | ) | | $ | (440,421 | ) | | $ | (90,243 | ) | | — | | $ | (438,315 | ) |
| | | | |
| | 1 | | Options purchased are included in the net realized gain (loss) from investments. |
| | 2 | | Options purchased are included in net change in unrealized appreciation (depreciation) on investments. |
|
| Average Quarterly Balances of Outstanding Derivative Financial Instruments |
| | | | |
Futures contracts: | | | | |
Average notional value of contracts - long | | $ | 11,101,304 | |
Average notional value of contracts - short | | $ | 381,000 | |
Forward foreign currency exchange contracts: | | | | |
Average amounts purchased - in USD | | $ | 16,570,907 | |
Average amounts sold - in USD | | $ | 478,615 | |
Options: | | | | |
Average notional value of swaption contracts purchased | | $ | 8,250,000 | |
Average notional value of swaption contracts written | | $ | 3,100,000 | |
Credit default swaps: | | | | |
Average notional value - sell protection | | $ | 23,990,161 | |
Total return swaps: | | | | |
Average notional value | | $ | 26,634,712 | |
For more information about the Fund’s investment risks regarding derivative financial instruments, refer to the Notes to Consolidated Financial Statements.
|
| Derivative Financial Instruments - Offsetting as of Period End |
The Fund’s derivative assets and liabilities (by type) were as follows:
| | | | | | | | | | |
| | | Assets | | | | | Liabilities | |
Derivative Financial Instruments: | | | | | | | | | | |
Futures contracts | | $ | 6,076 | | | | | $ | 20,375 | |
Forward foreign currency exchange contracts | | | 6,122 | | | | | | 381,938 | |
Swaps - Centrally cleared | | | — | | | | | | 10,230 | |
Swaps - OTC1 | | | 395,727 | | | | | | 321,475 | |
| | | | |
Total derivative assets and liabilities in the Consolidated Statement of Assets and Liabilities | | $ | 407,925 | | | | | $ | 734,018 | |
Derivatives not subject to a Master Netting Agreement or similar agreement (“MNA”) | | | (6,076 | ) | | | | | (30,605 | ) |
| | | | |
Total derivative assets and liabilities subject to an MNA | | $ | 401,849 | | | | | $ | 703,413 | |
| | | | |
| | 1 | | Includes unrealized appreciation (depreciation) on OTC swaps and swap premiums received in the Consolidated Statement of Assets and Liabilities. |
See Notes to Consolidated Financial Statements.
| | | | | | |
| | | BLACKROCK STRATEGIC RISK ALLOCATION FUND | | JANUARY 31, 2017 | | 13 |
| | | | |
| Consolidated Schedule of Investments (concluded) | | | | |
The following tables present the Fund’s derivative assets and liabilities by counterparty net of amounts available for offset under an MNA and net of the related collateral received and pledged by the Fund:
| | | | | | | | | | | | | | | | |
| | | | | | | | | | | | | | |
| Counterparty | | Derivative Assets
Subject to an MNA by
Counterparty | | | Derivatives Available
for Offset1 | | | Non-cash
Collateral
Received | | Cash
Collateral
Received | | Net Amount of
Derivative Assets2 | |
Bank of America N.A. | | $ | 3,537 | | | $ | (3,537 | ) | | | | — | | | — | |
BNP Paribas S.A. | | | 81,732 | | | | (16,430 | ) | | — | | — | | $ | 65,302 | |
Deutsche Bank AG | | | 47,835 | | | | (7,034 | ) | | — | | — | | | 40,801 | |
JPMorgan Chase Bank N.A. | | | 235,416 | | | | (235,416 | ) | | — | | — | | | — | |
Merrill Lynch International | | | 33,329 | | | | (33,329 | ) | | — | | — | | | — | |
| | | | |
Total | | $ | 401,849 | | | $ | (295,746 | ) | | — | | — | | $ | 106,103 | |
| | | | |
| | | | | | | | | | | | | | | | |
| Counterparty | | Derivative Liabilities
Subject to an MNA by
Counterparty | | | Derivatives Available
for Offset1 | | | Non-cash
Collateral
Pledged | | Cash
Collateral
Pledged | | Net Amount of
Derivative Liabilities3
| |
Bank of America N.A. | | $ | 15,196 | | | $ | (3,537 | ) | | — | | — | | $ | 11,659 | |
BNP Paribas S.A. | | | 16,430 | | | | (16,430 | ) | | — | | — | | | — | |
Credit Suisse International | | | 247,105 | | | | — | | | — | | — | | | 247,105 | |
Deutsche Bank AG | | | 7,034 | | | | (7,034 | ) | | — | | — | | | — | |
JPMorgan Chase Bank N.A. | | | 358,474 | | | | (235,416 | ) | | — | | — | | | 123,058 | |
Merrill Lynch International | | | 59,174 | | | | (33,329 | ) | | — | | — | | | 25,845 | |
| | | | |
Total | | $ | 703,413 | | | $ | (295,746 | ) | | — | | — | | $ | 407,667 | |
| | | | |
| | 1 | | The amount of derivatives available for offset is limited to the amount of assets and/or liabilities that are subject to an MNA. |
| | 2 | | Net amount represents the net amount receivable from the counterparty in the event of default. |
| | 3 | | Net amount represents the net amount payable due to the counterparty in the event of default. |
|
| Fair Value Hierarchy as of Period End |
Various inputs are used in determining the fair value of investments and derivative financial instruments. For information about the Fund’s policy regarding valuation of investments and derivative financial instruments, refer to the Notes to Consolidated Financial Statements.
The following tables summarize the Fund’s investments and derivative financial instruments categorized in the disclosure hierarchy:
| | | | | | | | | | | | | | | | | | | | | | |
| | | Level 1 | | | | | Level 2 | | | | | Level 3 | | | | | Total | |
Assets: | | | | | | | | | | | | | | | | | | | | | | |
Investments: | | | | | | | | | | | | | | | | | | | | | | |
Long-Term Investments: | | | | | | | | | | | | | | | | | | | | | | |
Foreign Government Obligations | | | — | | | | | $ | 12,568,855 | | | | | | — | | | | | $ | 12,568,855 | |
Investment Companies | | $ | 2,617,919 | | | | | | — | | | | | | — | | | | | | 2,617,919 | |
Short-Term Securities | | | 15,197,279 | | | | | | — | | | | | | — | | | | | | 15,197,279 | |
| | | | |
Total | | $ | 17,815,198 | | | | | $ | 12,568,855 | | | | | | — | | | | | $ | 30,384,053 | |
| | | | |
| | | | | | | | | | | | | | | | | | | | | | |
Derivative Financial Instruments1 | | | | | | | | | | | | | | | | | | | | | | |
Assets: | | | | | | | | | | | | | | | | | | | | | | |
Commodity contracts | | | — | | | | | $ | 124,065 | | | | | | — | | | | | $ | 124,065 | |
Credit contracts | | | — | | | | | | 207,970 | | | | | | — | | | | | | 207,970 | |
Equity contracts | | $ | 96,620 | | | | | | 234,796 | | | | | | — | | | | | | 331,416 | |
Foreign currency exchange contracts | | | — | | | | | | 6,122 | | | | | | — | | | | | | 6,122 | |
Interest rate contracts | | | 47,236 | | | | | | 36,440 | | | | | | — | | | | | | 83,676 | |
Liabilities: | | | | | | | | | | | | | | | | | | | | | | |
Credit contracts | | | — | | | | | | (19,267 | ) | | | | | — | | | | | | (19,267 | ) |
Equity contracts | | | (5,080 | ) | | | | | — | | | | | | — | | | | | | (5,080 | ) |
Foreign currency exchange contracts | | | — | | | | | | (381,938 | ) | | | | | — | | | | | | (381,938 | ) |
Interest rate contracts | | | (23,010 | ) | | | | | (59,236 | ) | | | | | — | | | | | | (82,246 | ) |
| | | | |
Total | | $ | 115,766 | | | | | $ | 148,952 | | | | | | — | | | | | $ | 264,718 | |
| | | | |
| | 1 | | Derivative financial instruments are swaps, futures contracts and forward foreign currency exchange contracts. Swaps, futures contracts and forward foreign currency exchange contracts are valued at the unrealized appreciation (depreciation) on the instrument. |
During the six months ended January 31, 2017, there were no transfers between levels.
See Notes to Consolidated Financial Statements.
| | | | | | |
| 14 | | BLACKROCK STRATEGIC RISK ALLOCATION FUND | | JANUARY 31, 2017 | | |
| | | | |
| Consolidated Statement of Assets and Liabilities | | | | |
| | | | |
| January 31, 2017 (Unaudited) | | | |
| | | | |
Assets | | | | |
Investments at value — unaffiliated (cost — $13,524,661) | | $ | 12,568,855 | |
Investments at value — affiliated (cost — $17,830,280) | | | 17,815,198 | |
Cash pledged: | | | | |
Futures contracts | | | 410,260 | |
Centrally cleared swaps | | | 484,710 | |
Foreign currency at value (cost — $1,166,357) | | | 1,199,625 | |
Receivables: | | | | |
Capital shares sold | | | 29,282 | |
Dividends — affiliated | | | 4,668 | |
Interest — unaffiliated | | | 42,358 | |
From the Manager | | | 10,939 | |
Variation margin on futures contracts | | | 6,076 | |
Unrealized appreciation on: | | | | |
Forward foreign currency exchange contracts | | | 6,122 | |
OTC swaps | | | 395,727 | |
Prepaid expenses | | | 41,423 | |
| | | | |
Total assets | | | 33,015,243 | |
| | | | |
| | | | |
Liabilities | | | | |
Payables: | | | | |
Investment advisory fees | | | 5,112 | |
Officer’s and Trustees’ fees | | | 3,231 | |
Other accrued expenses | | | 26,378 | |
Professional fees | | | 65,299 | |
Service and distribution fees | | | 1,118 | |
Variation margin on futures contracts | | | 20,375 | |
Variation margin on centrally cleared swaps | | | 10,230 | |
Swap premiums received | | | 242,972 | |
Unrealized depreciation on: | | | | |
Forward foreign currency exchange contracts | | | 381,938 | |
OTC swaps | | | 78,503 | |
| | | | |
Total liabilities | | | 835,156 | |
| | | | |
Net Assets | | $ | 32,180,087 | |
| | | | |
| | | | |
Net Assets Consist of | | | | |
Paid-in capital | | $ | 31,946,805 | |
Undistributed net investment income | | | 82,883 | |
Accumulated net realized gain | | | 822,463 | |
Net unrealized appreciation (depreciation) | | | (672,064 | ) |
| | | | |
Net Assets | | $ | 32,180,087 | |
| | | | |
| | | | |
Net Asset Value | | | | |
Institutional — Based on net assets of $28,922,228 and 2,968,973 shares outstanding, unlimited shares authorized, $0.001 par value | | $ | 9.74 | |
| | | | |
Investor A — Based on net assets of $2,415,720 and 248,393 shares outstanding, unlimited shares authorized, $0.001 par value | | $ | 9.73 | |
| | | | |
Investor C — Based on net assets of $842,139 and 86,979 shares outstanding, unlimited shares authorized, $0.001 par value | | $ | 9.68 | |
| | | | |
See Notes to Consolidated Financial Statements.
| | | | | | |
| | | BLACKROCK STRATEGIC RISK ALLOCATION FUND | | JANUARY 31, 2017 | | 15 |
| | | | |
| Consolidated Statement of Operations | | | | |
| | | | |
| Six Months Ended January 31, 2017 (Unaudited) | | | |
| | | | |
Investment Income | | | | |
Dividends — affiliated | | $ | 19,505 | |
Dividends — unaffiliated | | | 23,690 | |
Interest — unaffiliated1 | | | 12,482 | |
| | | | |
Total investment income | | | 55,677 | |
| | | | |
| | | | |
Expenses | | | | |
Investment advisory | | | 102,841 | |
Registration | | | 34,729 | |
Professional | | | 34,523 | |
Printing | | | 14,397 | |
Administration | | | 6,620 | |
Administration — class specific | | | 3,114 | |
Accounting services | | | 6,133 | |
Service and distribution — class specific | | | 5,789 | |
Officer and Trustees | | | 5,453 | |
Transfer agent — class specific | | | 3,939 | |
Custodian | | | 1,920 | |
Miscellaneous | | | 7,770 | |
| | | | |
Total expenses | | | 227,228 | |
Less: | | | | |
Administration fees waived | | | (2,376 | ) |
Administration fees waived — class specific | | | (3,063 | ) |
Expenses reimbursed by the Manager | | | (816 | ) |
Fees waived by the Manager | | | (80,831 | ) |
Transfer agent fees reimbursed — class specific | | | (3,571 | ) |
Transfer agent fees waived — class specific | | | (207 | ) |
| | | | |
Total expenses after fees waived and reimbursed | | | 136,364 | |
| | | | |
Net investment loss | | | (80,687 | ) |
| | | | |
| | | | |
Realized and Unrealized Gain (Loss) | | | | |
Net realized gain (loss) from: | | | | |
Investments — unaffiliated | | | 321,735 | |
Capital gain distributions received from affiliated investment companies — affiliated | | | 71 | |
Futures contracts | | | 260,149 | |
Forward foreign currency exchange contracts | | | 816,437 | |
Foreign currency transactions | | | (33,824 | ) |
Options written | | | 58,674 | |
Swaps | | | 331,793 | |
| | | | |
| | | 1,755,035 | |
| | | | |
Net change in unrealized appreciation (depreciation) on: | | | | |
Investments — unaffiliated | | | (682,587 | ) |
Investments — affiliated | | | (57,881 | ) |
Futures contracts | | | (25,760 | ) |
Forward foreign currency exchange contracts | | | (440,421 | ) |
Foreign currency translations | | | 6,460 | |
Options written | | | 227,779 | |
Swaps | | | (393,656 | ) |
| | | | |
| | | (1,366,066 | ) |
| | | | |
Total realized and unrealized gain | | | 388,969 | |
| | | | |
Net Increase in Net Assets Resulting from Operations | | $ | 308,282 | |
| | | | |
| | 1 | | Includes net inflationary and deflationary adjustments. See Note 4 of the Notes to Consolidated Financial Statements. |
See Notes to Consolidated Financial Statements.
| | | | | | |
| 16 | | BLACKROCK STRATEGIC RISK ALLOCATION FUND | | JANUARY 31, 2017 | | |
| | | | |
| Consolidated Statements of Changes in Net Assets | | | | |
| | | | | | | | |
| Increase (Decrease) in Net Assets: | | Six Months
Ended
January 31, 2017
(Unaudited) | | | Year Ended
July 31, 2016 | |
| | | | | | | | |
| Operations | | | | | | | | |
Net investment loss | | $ | (80,687 | ) | | $ | (152,199 | ) |
Net realized gain (loss) | | | 1,755,035 | | | | (1,088,980 | ) |
Net change in unrealized appreciation (depreciation) | | | (1,366,066 | ) | | | 1,756,738 | |
| | | | |
Net increase in net assets resulting from operations | | | 308,282 | | | | 515,559 | |
| | | | |
| | | | | | | | |
| Distributions to Shareholders1 | | | | | | | | |
From net investment income: | | | | | | | | |
Institutional | | | (116,290 | ) | | | (1,283,526 | ) |
Investor A | | | (3,715 | ) | | | (59,585 | ) |
Investor C | | | — | | | | (15,733 | ) |
From net realized gain: | | | | | | | | |
Institutional | | | (288,659 | ) | | | — | |
Investor A | | | (18,217 | ) | | | — | |
Investor C | | | (5,387 | ) | | | — | |
| | | | |
Decrease in net assets resulting from distributions to shareholders | | | (432,268 | ) | | | (1,358,844 | ) |
| | | | |
| | | | | | | | |
| Capital Share Transactions | | | | | | | | |
Net increase (decrease) in net assets derived from capital share transactions | | | 2,485,162 | | | | (7,596,961 | ) |
| | | | |
| | | | | | | | |
| Net Assets | | | | | | | | |
Total increase (decrease) in net assets | | | 2,361,176 | | | | (8,440,246 | ) |
Beginning of period | | | 29,818,911 | | | | 38,259,157 | |
| | | | |
End of period | | $ | 32,180,087 | | | $ | 29,818,911 | |
| | | | |
Undistributed net investment income, end of period | | $ | 82,883 | | | $ | 283,575 | |
| | | | |
| | 1 | | Distributions for annual periods determined in accordance with federal income tax regulations. |
See Notes to Consolidated Financial Statements.
| | | | | | |
| | | BLACKROCK STRATEGIC RISK ALLOCATION FUND | | JANUARY 31, 2017 | | 17 |
| | | | |
| Consolidated Financial Highlights | | | | |
| | | | | | | | | | | | | | | | | | | | |
| | | Institutional | |
| | | Six Months
Ended
January 31, 2017 | | | Year Ended July 31, | | | Period
December 27,
20121 to | |
| | | (Unaudited) | | | 2016 | | | 2015 | | | 2014 | | | July 31, 2013 | |
| | | | | | | | | | | | | | | | | | | | |
| Per Share Operating Performance | | | | | | | | | | | | | | | | | | | | |
Net asset value, beginning of period | | $ | 9.79 | | | $ | 9.96 | | | $ | 10.11 | | | $ | 9.54 | | | $ | 10.00 | |
| | | | |
Net investment loss2 | | | (0.02 | ) | | | (0.04 | ) | | | (0.06 | ) | | | (0.07 | ) | | | (0.02 | ) |
Net realized and unrealized gain (loss) | | | 0.11 | | | | 0.29 | | | | 0.28 | | | | 1.02 | | | | (0.40 | ) |
| | | | |
Net increase (decrease) from investment operations | | | 0.09 | | | | 0.25 | | | | 0.22 | | | | 0.95 | | | | (0.42 | ) |
| | | | |
Distributions:3 | | | | | | | | | | | | | | | | | | | | |
From net investment income | | | (0.04 | ) | | | (0.42 | ) | | | (0.35 | ) | | | (0.38 | ) | | | (0.04 | ) |
From net realized gain | | | (0.10 | ) | | | — | | | | (0.02 | ) | | | — | | | | — | |
| | | | |
Total distributions | | | (0.14 | ) | | | (0.42 | ) | | | (0.37 | ) | | | (0.38 | ) | | | (0.04 | ) |
| | | | |
Net asset value, end of period | | $ | 9.74 | | | $ | 9.79 | | | $ | 9.96 | | | $ | 10.11 | | | $ | 9.54 | |
| | | | |
| | | | | | | | | | | | | | | | | | | | |
| Total Return4 | | | | | | | | | | | | | | | | | | | | |
Based on net asset value | | | 0.90 | %5 | | | 2.86 | % | | | 2.24 | % | | | 10.24 | % | | | (4.25 | )%5 |
| | | | |
| | | | | | | | | | | | | | | | | | | | |
| Ratios to Average Net Assets | | | | | | | | | | | | | | | | | | | | |
Total expenses6 | | | 1.41 | %7 | | | 1.61 | % | | | 1.52 | % | | | 1.69 | % | | | 2.36 | %7,8 |
| | | | |
Total expenses after fees waived and reimbursed6 | | | 0.84 | %7 | | | 1.00 | % | | | 1.00 | % | | | 1.00 | % | | | 0.99 | %7 |
| | | | |
Net investment loss6 | | | (0.48 | )%7 | | | (0.45 | )% | | | (0.61 | )% | | | (0.67 | )% | | | (0.35 | )%7 |
| | | | |
| | | | | | | | | | | | | | | | | | | | |
| Supplemental Data | | | | | | | | | | | | | | | | | | | | |
Net assets, end of period (000) | | $ | 28,922 | | | $ | 27,712 | | | $ | 35,597 | | | $ | 26,325 | | | $ | 24,404 | |
| | | | |
Portfolio turnover rate | | | 2 | % | | | 11 | % | | | 4 | % | | | 77 | % | | | 59 | % |
| | | | |
| | 1 | | Commencement of operations. |
| | 2 | | Based on average shares outstanding. |
| | 3 | | Distributions for annual periods determined in accordance with federal income tax regulations. |
| | 4 | | Where applicable, assumes the reinvestment of distributions. |
| | 5 | | Aggregate total return. |
| | 6 | | Excludes expenses incurred indirectly as a result of investments in underlying funds as follows: |
| | | | | | | | | | | | | | | | | | | | | | | | | | |
| | | Six Months
Ended
January 31, 2017 | | | | | | Year Ended July 31, | | | | | Period
December 27,
20121 to | |
| | | (Unaudited) | | | | | | 2016 | | | 2015 | | | 2014 | | | | | July 31, 2013 | |
Investments in underlying funds | | | 0.10 | % | | | | | | | 0.08 | % | | | 0.09 | % | | | 0.10 | % | | | | | 0.18 | % |
| | 8 | | Organization costs were not annualized in the calculation of the expense ratios. If these expenses were annualized, the total expenses for Institutional Shares would have been 2.57%. |
See Notes to Consolidated Financial Statements.
| | | | | | |
| 18 | | BLACKROCK STRATEGIC RISK ALLOCATION FUND | | JANUARY 31, 2017 | | |
| | | | |
| Consolidated Financial Highlights (continued) | | | | |
| | | | | | | | | | | | | | | | | | | | |
| | | Investor A | |
| | | Six Months
Ended
January 31,
2017 | | | Year Ended July 31, | | | Period
December 27,
20121 to | |
| | | (Unaudited) | | | 2016 | | | 2015 | | | 2014 | | | July 31, 2013 | |
| | | | | | | | | | | | | | | | | | | | |
| Per Share Operating Performance | | | | | | | | | | | | | | | | | | | | |
Net asset value, beginning of period | | $ | 9.77 | | | $ | 9.93 | | | $ | 10.09 | | | $ | 9.53 | | | $ | 10.00 | |
| | | | |
Net investment loss2 | | | (0.03 | ) | | | (0.07 | ) | | | (0.09 | ) | | | (0.08 | ) | | | (0.02 | ) |
Net realized and unrealized gain (loss) | | | 0.11 | | | | 0.30 | | | | 0.28 | | | | 1.00 | | | | (0.41 | ) |
| | | | |
Net increase (decrease) from investment operations | | | 0.08 | | | | 0.23 | | | | 0.19 | | | | 0.92 | | | | (0.43 | ) |
| | | | |
Distributions:3 | | | | | | | | | | | | | | | | | | | | |
From net investment income | | | (0.02 | ) | | | (0.39 | ) | | | (0.33 | ) | | | (0.36 | ) | | | (0.04 | ) |
From net realized gain | | | (0.10 | ) | | | — | | | | (0.02 | ) | | | — | | | | — | |
| | | | |
Total distributions | | | (0.12 | ) | | | (0.39 | ) | | | (0.35 | ) | | | (0.36 | ) | | | (0.04 | ) |
| | | | |
Net asset value, end of period | | $ | 9.73 | | | $ | 9.77 | | | $ | 9.93 | | | $ | 10.09 | | | $ | 9.53 | |
| | | | |
| | | | | | | | | | | | | | | | | | | | |
| Total Return4 | | | | | | | | | | | | | | | | | | | | |
Based on net asset value | | | 0.81 | %5 | | | 2.68 | % | | | 1.97 | % | | | 9.92 | % | | | (4.35 | )%5 |
| | | | |
| | | | | | | | | | | | | | | | | | | | |
| Ratios to Average Net Assets | | | | | | | | | | | | | | | | | | | | |
Total expenses6 | | | 1.81 | %7 | | | 2.03 | % | | | 1.94 | % | | | 2.09 | % | | | 2.38 | %7,8 |
| | | | |
Total expenses after fees waived and reimbursed6 | | | 1.07 | %7 | | | 1.25 | % | | | 1.25 | % | | | 1.25 | % | | | 1.24 | %7 |
| | | | |
Net investment loss6 | | | (0.68 | )%7 | | | (0.70 | )% | | | (0.86 | )% | | | (0.81 | )% | | | (0.30 | )%7 |
| | | | |
| | | | | | | | | | | | | | | | | | | | |
| Supplemental Data | | | | | | | | | | | | | | | | | | | | |
Net assets, end of period (000) | | $ | 2,416 | | | $ | 1,448 | | | $ | 1,811 | | | $ | 1,014 | | | $ | 378 | |
| | | | |
Portfolio turnover rate | | | 2 | % | | | 11 | % | | | 4 | % | | | 77 | % | | | 59 | % |
| | | | |
| | 1 | | Commencement of operations. |
| | 2 | | Based on average shares outstanding. |
| | 3 | | Distributions for annual periods determined in accordance with federal income tax regulations. |
| | 4 | | Where applicable, excludes the effects of any sales charges and assumes the reinvestment of distributions. |
| | 5 | | Aggregate total return. |
| | 6 | | Excludes expenses incurred indirectly as a result of investments in underlying funds as follows: |
| | | | | | | | | | | | | | | | | | | | | | | | | | |
| | | Six Months
Ended
January 31,
2017 | | | | | | Year Ended July 31, | | | | | Period
December 27,
20121 to | |
| | | (Unaudited) | | | | | | 2016 | | | 2015 | | | 2014 | | | | | July 31, 2013 | |
Investments in underlying funds | | | 0.10 | % | | | | | | | 0.08 | % | | | 0.09 | % | | | 0.10 | % | | | | | 0.18 | % |
| | 8 | | Organization costs were not annualized in the calculation of the expense ratios. If these expenses were annualized, the total expenses for Investor A Shares would have been 2.59%. |
See Notes to Consolidated Financial Statements.
| | | | | | |
| | | BLACKROCK STRATEGIC RISK ALLOCATION FUND | | JANUARY 31, 2017 | | 19 |
| | | | |
| Consolidated Financial Highlights (concluded) | | | | |
| | | | | | | | | | | | | | | | | | | | |
| | | Investor C | |
| | | Six Months
Ended
January 31,
2017 | | | Year Ended July 31, | | | Period
December 27,
20121 to | |
| | | (Unaudited) | | | 2016 | | | 2015 | | | 2014 | | | July 31, 2013 | |
| | | | | | | | | | | | | | | | | | | | |
| Per Share Operating Performance | | | | | | | | | | | | | | | | | | | | |
Net asset value, beginning of period | | $ | 9.71 | | | $ | 9.84 | | | $ | 10.02 | | | $ | 9.48 | | | $ | 10.00 | |
| | | | |
Net investment loss2 | | | (0.07 | ) | | | (0.13 | ) | | | (0.16 | ) | | | (0.16 | ) | | | (0.06 | ) |
Net realized and unrealized gain (loss) | | | 0.10 | | | | 0.29 | | | | 0.29 | | | | 1.00 | | | | (0.42 | ) |
| | | | |
Net increase (decrease) from investment operations | | | 0.03 | | | | 0.16 | | | | 0.13 | | | | 0.84 | | | | (0.48 | ) |
| | | | |
Distributions:3 | | | | | | | | | | | | | | | | | | | | |
From net investment income | | | — | | | | (0.29 | ) | | | (0.29 | ) | | | (0.30 | ) | | | (0.04 | ) |
From net realized gain | | | (0.06 | ) | | | — | | | | (0.02 | ) | | | — | | | | — | |
| | | | |
Total distributions | | | (0.06 | ) | | | (0.29 | ) | | | (0.31 | ) | | | (0.30 | ) | | | (0.04 | ) |
| | | | |
Net asset value, end of period | | $ | 9.68 | | | $ | 9.71 | | | $ | 9.84 | | | $ | 10.02 | | | $ | 9.48 | |
| | | | |
| | | | | | | | | | | | | | | | | | | | |
| Total Return4 | | | | | | | | | | | | | | | | | | | | |
Based on net asset value | | | 0.36 | %5 | | | 1.82 | % | | | 1.32 | % | | | 9.09 | % | | | (4.86 | )%5 |
| | | | |
| | | | | | | | | | | | | | | | | | | | |
| Ratios to Average Net Assets | | | | | | | | | | | | | | | | | | | | |
Total expenses6 | | | 2.51 | %7 | | | 2.72 | % | | | 2.59 | % | | | 2.80 | % | | | 3.00 | %7,8 |
| | | | |
Total expenses after fees waived and reimbursed6 | | | 1.83 | %7 | | | 2.00 | % | | | 2.00 | % | | | 2.00 | % | | | 1.98 | %7 |
| | | | |
Net investment loss6 | | | (1.44 | )%7 | | | (1.45 | )% | | | (1.56 | )% | | | (1.67 | )% | | | (0.98 | )%7 |
| | | | |
| | | | | | | | | | | | | | | | | | | | |
| Supplemental Data | | | | | | | | | | | | | | | | | | | | |
Net assets, end of period (000) | | $ | 842 | | | $ | 659 | | | $ | 851 | | | $ | 402 | | | $ | 313 | |
| | | | |
Portfolio turnover rate | | | 2 | % | | | 11 | % | | | 4 | % | | | 77 | % | | | 59 | % |
| | | | |
| | 1 | | Commencement of operations. |
| | 2 | | Based on average shares outstanding. |
| | 3 | | Distributions for annual periods determined in accordance with federal income tax regulations. |
| | 4 | | Where applicable, excludes the effects of any sales charges and assumes the reinvestment of distributions. |
| | 5 | | Aggregate total return. |
| | 6 | | Excludes expenses incurred indirectly as a result of investments in underlying funds as follows: |
| | | | | | | | | | | | | | | | | | | | | | | | | | |
| | | Six Months
Ended
January 31, 2017 | | | | | | Year Ended July 31, | | | | | Period
December 27,
20121 to | |
| | | (Unaudited) | | | | | | 2016 | | | 2015 | | | 2014 | | | | | July 31, 2013 | |
Investments in underlying funds | | | 0.10 | % | | | | | | | 0.08 | % | | | 0.09 | % | | | 0.10 | % | | | | | 0.18 | % |
| | 8 | | Organization costs were not annualized in the calculation of the expense ratios. If these expenses were annualized, the total expenses for Investor C Shares would have been 3.21%. |
See Notes to Consolidated Financial Statements.
| | | | | | |
| 20 | | BLACKROCK STRATEGIC RISK ALLOCATION FUND | | JANUARY 31, 2017 | | |
| | | | |
| Notes to Consolidated Financial Statements (Unaudited) | | | | |
1. Organization:
BlackRock FundsSM (the “Trust”) is registered under the Investment Company Act of 1940, as amended (the “1940 Act”), as an open-end management investment company. BlackRock Strategic Risk Allocation Fund (the “Fund”) is a series of the Trust. The Trust is organized as a Massachusetts business trust. The Fund is classified as non-diversified.
The Fund offers multiple classes of shares. All classes of shares have identical voting, dividend, liquidation and other rights and are subject to the same terms and conditions, except that certain classes bear expenses related to the shareholder servicing and distribution of such shares. Institutional Shares are sold only to certain eligible investors. Investor A and Investor C Shares are generally available through financial intermediaries. Each class has exclusive voting rights with respect to matters relating to its shareholder servicing and distribution expenditures.
| | | | | | |
| Share Class | | Initial Sales Charge | | CDSC | | Conversion Privilege |
Institutional Shares | | No | | No | | None |
Investor A Shares | | Yes | | No1 | | None |
Investor C Shares | | No | | Yes | | None |
| | 1 | | Investor A Shares may be subject to a contingent deferred sales charge (“CDSC”) for certain redemptions where no initial sales charge was paid at the time of purchase. |
The Fund, together with certain other registered investment companies advised by BlackRock Advisors, LLC (the “Manager”) or its affiliates, is included in a complex of open-end funds referred to as the Equity-Liquidity Complex.
Basis of Consolidation: The accompanying consolidated financial statements of the Fund include the accounts of BlackRock Cayman Strategic Risk Allocation Fund, Ltd. (the “Subsidiary”), which is a wholly-owned subsidiary of the Fund and primarily invests in commodity-related instruments and other derivatives. The Subsidiary enables the Fund to hold these commodity-related instruments and other derivatives and satisfy regulated investment company tax requirements. The Fund may invest up to 25% of its total assets in the Subsidiary. The accompanying Consolidated Schedule of Investments and consolidated financial statements of the Fund include the positions and accounts, respectively, of the Subsidiary. Intercompany accounts and transactions, if any, have been eliminated. The Subsidiary is subject to the same investment policies and restrictions that apply to the Fund, except that the Subsidiary may invest without limitation in commodity-related instruments.
The following table shows a summary of the selected financial information of the Subsidiary included in the consolidated financial statements:
| | | | |
| | | Cayman
Strategic Risk
Allocation | |
Consolidated Statement of Assets and Liabilities | | | | |
Total assets | | $ | 4,455,218 | |
Total liabilities | | | 11,567 | |
| | | | |
Net assets | | $ | 4,443,651 | |
| | | | |
| | | | |
Consolidated Statement of Operations | | | | |
Net investment income | | $ | 3,256 | |
Net realized gain from: | | | | |
Investments — affiliated | | | 19 | |
Futures contracts | | | 312,132 | |
Swaps | | | 251,258 | |
Foreign currency transactions | | | 794,926 | |
| | | | |
| | | 1,358,335 | |
| | | | |
Net change in unrealized appreciation (depreciation) on: | | | | |
Futures contracts | | | (33,843 | ) |
Swaps | | | 76,978 | |
Foreign currency translations | | | (448,397 | ) |
| | | | |
| | | (405,262 | ) |
| | | | |
Net increase in net assets resulting from operations | | $ | 956,329 | |
| | | | |
| | | | |
Consolidated Statement of Changes in Net Assets | | | | |
Net investment income | | $ | 3,256 | |
Net realized gain | | | 1,358,335 | |
Net change in unrealized appreciation (depreciation) | | | (405,262 | ) |
| | | | |
Net increase in net assets resulting from operations | | | 956,329 | |
Net increase (decrease) in net assets derived from capital share transactions | | | — | |
| | | | |
Net increase in net assets | | $ | 956,329 | |
| | | | |
| | | | | | |
| | | BLACKROCK STRATEGIC RISK ALLOCATION FUND | | JANUARY 31, 2017 | | 21 |
| | | | |
| Notes to Consolidated Financial Statements (continued) | | | | |
2. Significant Accounting Policies:
The consolidated financial statements are prepared in conformity with accounting principles generally accepted in the United States of America (“U.S. GAAP”), which may require management to make estimates and assumptions that affect the reported amounts of assets and liabilities in the consolidated financial statements, disclosure of contingent assets and liabilities at the date of the consolidated financial statements and the reported amounts of increases and decreases in net assets from operations during the reporting period. Actual results could differ from those estimates. The Fund is considered an investment company under U.S. GAAP and follows the accounting and reporting guidance applicable to investment companies. Below is a summary of significant accounting policies:
Foreign Currency: The Fund’s books and records are maintained in U.S. dollars. Purchases and sales of investments are recorded at the rates of exchange prevailing on the respective dates of such transactions. Generally, when the U.S. dollar rises in value against a foreign currency, the investments denominated in that currency will lose value; the opposite effect occurs if the U.S. dollar falls in relative value.
The Fund does not isolate the portion of the results of operations arising as a result of changes in the exchange rates from the changes in the market prices of investments held or sold for financial reporting purposes. Accordingly, the effects of changes in exchange rates on investments are not segregated in the Consolidated Statement of Operations from the effects of changes in market prices of those investments, but are included as a component of net realized and unrealized gain (loss) from investments. The Fund reports realized currency gains (losses) on foreign currency related transactions as components of net realized gain (loss) for financial reporting purposes, whereas such components are generally treated as ordinary income for federal income tax purposes.
Defensive Positions: Investment policies may vary for temporary defensive purposes during periods in which the investment adviser believes that conditions in the securities markets or other economic, financial or political conditions warrant. Under such conditions, the Fund may invest up to 100% of its total assets in U.S. Government securities, certificates of deposit, repurchase agreements that involve purchases of debt securities, bankers’ acceptances and other bank obligations, commercial paper, money market funds and/or other debt securities, or may hold its assets in cash. The investment adviser applies this defensive posture as applicable and is consistent with the Fund’s investment policies.
Segregation and Collateralization: In cases where the Fund enters into certain investments (e.g., futures contracts, forward foreign currency exchange contracts, options written and swaps) that would be treated as “senior securities” for 1940 Act purposes, the Fund may segregate or designate on its books and records cash or liquid assets having a market value at least equal to the amount of its future obligations under such investments. Doing so allows the investment to be excluded from treatment as a “senior security.” Furthermore, if required by an exchange or counterparty agreement, the Fund may be required to deliver/deposit cash and/or securities to/with an exchange, broker-dealer or custodian as collateral for certain investments or obligations.
Investment Transactions and Investment Income: For financial reporting purposes, investment transactions are recorded on the dates the transactions are entered into (the trade dates). Realized gains and losses on investment transactions are determined on the identified cost basis. Dividend income is recorded on the ex-dividend date. Dividends from foreign securities where the ex-dividend date may have passed are subsequently recorded when the Fund is informed of the ex-dividend date. Under the applicable foreign tax laws, a withholding tax at various rates may be imposed on capital gains, dividends and interest. Interest income, including amortization and accretion of premiums and discounts on debt securities, is recognized on the accrual basis. Income, expenses and realized and unrealized gains and losses are allocated daily to each class based on its relative net assets.
Distributions: Distributions paid by the Fund is recorded on the ex-dividend date. The character and timing of distributions are determined in accordance with federal income tax regulations, which may differ from U.S. GAAP.
Net income and realized gains from investments held by the Subsidiary are treated as ordinary income for tax purposes. If a net loss is realized by the Subsidiary in any taxable year, the loss will generally not be available to offset the Fund’s ordinary income and/or capital gains for that year.
Recent Accounting Standard: In November 2016, the Financial Accounting Standards Board issued Accounting Standards Update “Restricted Cash” which will require entities to include the total of cash, cash equivalents, restricted cash, and restricted cash equivalents in the beginning and ending cash balances in the Statements of Cash Flows. The guidance will be applied retrospectively and is effective for fiscal years beginning after December 15, 2017, and interim periods within those years. Management is evaluating the impact, if any, of this guidance on the Funds’ presentation in the Statements of Cash Flows.
Indemnifications: In the normal course of business, the Fund enters into contracts that contain a variety of representations that provide general indemnification. The Fund’s maximum exposure under these arrangements is unknown because it involves future potential claims against the Fund, which cannot be predicted with any certainty.
| | | | | | |
| 22 | | BLACKROCK STRATEGIC RISK ALLOCATION FUND | | JANUARY 31, 2017 | | |
| | | | |
| Notes to Consolidated Financial Statements (continued) | | | | |
Other: Expenses directly related to the Fund or its classes are charged to the Fund or the applicable class. Other operating expenses shared by several funds, including other funds managed by the Manager, are prorated among those funds on the basis of relative net assets or other appropriate methods. Expenses directly related to the Fund and other shared expenses prorated to the Fund are allocated daily to each class based on its relative net assets or other appropriate methods.
The Fund has an arrangement with its custodian whereby credits are earned on uninvested cash balances, which could be used to reduce custody fees and/or overdraft charges. The Fund may incur charges on certain uninvested cash balances and overdrafts, subject to certain conditions.
3. Investment Valuation and Fair Value Measurements:
Investment Valuation Policies: The Fund’s investments are valued at fair value (also referred to as “market value” within the consolidated financial statements) as of the close of trading on the New York Stock Exchange (“NYSE”) (generally 4:00 p.m., Eastern time). U.S. GAAP defines fair value as the price the Fund would receive to sell an asset or pay to transfer a liability in an orderly transaction between market participants at the measurement date. The Fund determines the fair values of its financial instruments using various independent dealers or pricing services under policies approved by the Board of Trustees of the Trust (the “Board”). The BlackRock Global Valuation Methodologies Committee (the “Global Valuation Committee”) is the committee formed by management to develop global pricing policies and procedures and to oversee the pricing function for all financial instruments.
Fair Value Inputs and Methodologies: The following methods and inputs are used to establish the fair value of the Fund’s assets and liabilities:
| • | | Equity investments traded on a recognized securities exchange are valued at the official closing price each day, if available. For equity investments traded on more than one exchange, the official closing price on the exchange where the stock is primarily traded is used. Equity investments traded on a recognized exchange for which there were no sales on that day may be valued at the last available bid (long positions) or ask (short positions) price. |
| • | | Fixed-income securities for which market quotations are readily available are generally valued using the last available bid prices or current market quotations provided by independent dealers or third party pricing services. Floating rate loan interests are valued at the mean of the bid prices from one or more independent brokers or dealers as obtained from a third party pricing service. Pricing services generally value fixed-income securities assuming orderly transactions of an institutional round lot size, but the Fund may hold or transact in such securities in smaller, odd lot sizes. Odd lots often trade at lower prices than institutional round lots. The pricing services may use matrix pricing or valuation models that utilize certain inputs and assumptions to derive values, including transaction data (e.g., recent representative bids and offers), credit quality information, perceived market movements, news, and other relevant information. Certain fixed-income securities, including asset-backed and mortgage related securities may be valued based on valuation models that consider the estimated cash flows of each tranche of the entity, establish a benchmark yield and develop an estimated tranche specific spread to the benchmark yield based on the unique attributes of the tranche. The amortized cost method of valuation may be used with respect to debt obligations with sixty days or less remaining to maturity unless the Manager determines such method does not represent fair value. |
Generally, trading in foreign instruments is substantially completed each day at various times prior to the close of trading on the NYSE. Occasionally, events affecting the values of such instruments may occur between the foreign market close and the close of trading on the NYSE that may not be reflected in the computation of the Fund’s net assets.
| • | | Investments in open-end U.S. mutual funds are valued at net asset value (“NAV”) each business day. |
| • | | Futures contracts traded on exchanges are valued at their last sale price. |
| • | | Securities and other assets and liabilities denominated in foreign currencies are translated into U.S. dollars using exchange rates determined as of the close of trading on the NYSE. Forward foreign currency exchange contracts are valued at the mean between the bid and ask prices and are determined as of the close of trading on the NYSE. Interpolated values are derived when the settlement date of the contract is an interim date for which quotations are not available. |
| • | | Exchange-traded options are valued at the mean between the last bid and ask prices at the close of the options market in which the options trade. An exchange-traded option for which there is no mean price is valued at the last bid (long positions) or ask (short positions) price. If no bid or ask price is available, the prior day’s price will be used, unless it is determined that the prior day’s price no longer reflects the fair value of the option. Over-the-counter (“OTC”) options and options on swaps (“swaptions”) are valued by an independent pricing service using a mathematical model, which incorporates a number of market data factors, such as the trades and prices of the underlying instruments. |
| • | | Swap agreements are valued utilizing quotes received daily by the Fund’s pricing service or through brokers, which are derived using daily swap curves and models that incorporate a number of market data factors, such as discounted cash flows, trades and values of the underlying reference instruments. |
| | | | | | |
| | | BLACKROCK STRATEGIC RISK ALLOCATION FUND | | JANUARY 31, 2017 | | 23 |
| | | | |
| Notes to Consolidated Financial Statements (continued) | | | | |
If events (e.g., a company announcement, market volatility or a natural disaster) occur that are expected to materially affect the value of such investments, or in the event that the application of these methods of valuation results in a price for an investment that is deemed not to be representative of the market value of such investment, or if a price is not available, the investment will be valued by the Global Valuation Committee, or its delegate, in accordance with a policy approved by the Board as reflecting fair value (“Fair Valued Investments”). The fair valuation approaches that may be used by the Global Valuation Committee will include Market approach, Income approach and Cost approach. Valuation techniques such as discounted cash flow, use of market comparables and matrix pricing are types of valuation approaches and typically used in determining fair value. When determining the price for Fair Valued Investments, the Global Valuation Committee, or its delegate, seeks to determine the price that the Fund might reasonably expect to receive or pay from the current sale or purchase of that asset or liability in an arm’s-length transaction. Fair value determinations shall be based upon all available factors that the Global Valuation Committee, or its delegate, deems relevant and consistent with the principles of fair value measurement. The pricing of all Fair Valued Investments is subsequently reported to the Board or a committee thereof on a quarterly basis.
Fair Value Hierarchy: Various inputs are used in determining the fair value of investments and derivative financial instruments. These inputs to valuation techniques are categorized into a fair value hierarchy consisting of three broad levels for financial statement purposes as follows:
| • | | Level 1 — unadjusted price quotations in active markets/exchanges for identical assets or liabilities that the Fund has the ability to access |
| • | | Level 2 — other observable inputs (including, but not limited to, quoted prices for similar assets or liabilities in markets that are active, quoted prices for identical or similar assets or liabilities in markets that are not active, inputs other than quoted prices that are observable for the assets or liabilities (such as interest rates, yield curves, volatilities, prepayment speeds, loss severities, credit risks and default rates) or other market–corroborated inputs) |
| • | | Level 3 — unobservable inputs based on the best information available in the circumstances, to the extent observable inputs are not available (including the Fund’s own assumptions used in determining the fair value of investments and derivative financial instruments) |
The hierarchy gives the highest priority to unadjusted quoted prices in active markets for identical assets or liabilities (Level 1 measurements) and the lowest priority to unobservable inputs (Level 3 measurements). Accordingly, the degree of judgment exercised in determining fair value is greatest for instruments categorized in Level 3. The inputs used to measure fair value may fall into different levels of the fair value hierarchy. In such cases, for disclosure purposes, the fair value hierarchy classification is determined based on the lowest level input that is significant to the fair value measurement in its entirety. Investments classified within Level 3 have significant unobservable inputs used by the Global Valuation Committee in determining the price for Fair Valued Investments. Level 3 investments include equity or debt issued by privately held companies or funds. There may not be a secondary market, and/or there are a limited number of investors. Level 3 investments may also be adjusted to reflect illiquidity and/or non-transferability, with the amount of such discount estimated by the Global Valuation Committee in the absence of market information.
Changes in valuation techniques may result in transfers into or out of an assigned level within the hierarchy. In accordance with the Fund’s policy, transfers between different levels of the fair value hierarchy are deemed to have occurred as of the beginning of the reporting period. The categorization of a value determined for investments and derivative financial instruments is based on the pricing transparency of the investments and derivative financial instruments and is not necessarily an indication of the risks associated with investing in those securities.
4. Securities and Other Investments:
Inflation-Indexed Bonds: Inflation-indexed bonds (other than municipal inflation-indexed and certain corporate inflation-indexed bonds) are fixed income securities whose principal value is periodically adjusted according to the rate of inflation. If the index measuring inflation rises or falls, the principal value of inflation-indexed bonds (other than municipal inflation-indexed and certain corporate inflation-indexed bonds) will be adjusted upward or downward, and consequently the interest payable on these securities (calculated with respect to a larger or smaller principal amount) will be increased or reduced, respectively. Any upward or downward adjustment in the principal amount of an inflation-indexed bond will be included as interest income in the Consolidated Statement of Operations, even though investors do not receive their principal until maturity. Repayment of the original bond principal upon maturity (as adjusted for inflation) is guaranteed in the case of U.S. Treasury inflation-indexed bonds. For bonds that do not provide a similar guarantee, the adjusted principal value of the bond repaid at maturity may be less than the original principal. With regard to municipal inflation-indexed bonds and certain corporate inflation-indexed bonds, the inflation adjustment is typically reflected in the semi-annual coupon payment. As a result, the principal value of municipal inflation-indexed bonds and such corporate inflation-indexed bonds does not adjust according to the rate of inflation.
5. Derivative Financial Instruments:
The Fund engages in various portfolio investment strategies using derivative contracts both to increase the returns of the Fund and/or to manage its exposure to certain risks such as credit risk, equity risk, interest rate risk, foreign currency exchange rate risk, commodity price risk or other risks (e.g., inflation risk). Derivative financial instruments categorized by risk exposure are included in the Consolidated Schedule of Investments. These contracts may be transacted on an exchange or OTC.
| | | | | | |
| 24 | | BLACKROCK STRATEGIC RISK ALLOCATION FUND | | JANUARY 31, 2017 | | |
| | | | |
| Notes to Consolidated Financial Statements (continued) | | | | |
Futures Contracts: The Fund invests in long and/or short positions in futures and options on futures contracts to gain exposure to, or manage exposure to, changes in interest rates (interest rate risk), changes in the value of equity securities (equity risk) or foreign currencies (foreign currency exchange rate risk).
Futures contracts are agreements between the Fund and a counterparty to buy or sell a specific quantity of an underlying instrument at a specified price and on a specified date. Depending on the terms of a contract, it is settled either through physical delivery of the underlying instrument on the settlement date or by payment of a cash amount on the settlement date. Upon entering into a futures contract, the Fund is required to deposit initial margin with the broker in the form of cash or securities in an amount that varies depending on a contract’s size and risk profile. The initial margin deposit must then be maintained at an established level over the life of the contract.
Securities deposited as initial margin are designated in the Consolidated Schedule of Investments and cash deposited, if any, is shown as cash pledged for futures contracts in the Consolidated Statement of Assets and Liabilities. Pursuant to the contract, the Fund agrees to receive from or pay to the broker an amount of cash equal to the daily fluctuation in market value of the contract (“variation margin”). Variation margin is recorded as unrealized appreciation (depreciation) and, if any, shown as variation margin receivable (or payable) on futures contracts in the Consolidated Statement of Assets and Liabilities. When the contract is closed, a realized gain or loss is recorded in the Consolidated Statement of Operations equal to the difference between the value of the contract at the time it was opened and the value at the time it was closed. The use of futures contracts involves the risk of an imperfect correlation in the movements in the price of futures contracts and interest, foreign currency exchange rates or underlying assets.
Forward Foreign Currency Exchange Contracts: The Fund enters into forward foreign currency exchange contracts to gain or reduce exposure to foreign currencies (foreign currency exchange rate risk).
A forward foreign currency exchange contract is an agreement between two parties to buy and sell a currency at a set exchange rate on a specified date. These contracts help to manage the overall exposure to the currencies in which some of the investments held by the Fund are denominated and in some cases, may be used to obtain exposure to a particular market.
The contract is marked to market daily and the change in market value is recorded as unrealized appreciation (depreciation) in the Consolidated Statement of Assets and Liabilities. When a contract is closed, a realized gain or loss is recorded in the Consolidated Statement of Operations equal to the difference between the value at the time it was opened and the value at the time it was closed. Non-deliverable forward foreign currency exchange contracts are settled with the counterparty in cash without the delivery of foreign currency. The use of forward foreign currency exchange contracts involves the risk that the value of a forward foreign currency exchange contract changes unfavorably due to movements in the value of the referenced foreign currencies.
Options: The Fund purchases and writes call and put options to increase or decrease its exposure to the risks of underlying instruments, including equity risk, interest rate risk and/or commodity price risk and/or, in the case of options written, to generate gains from options premiums.
A call option gives the purchaser (holder) of the option the right (but not the obligation) to buy, and obligates the seller (writer) to sell (when the option is exercised) the underlying instrument at the exercise or strike price at any time or at a specified time during the option period. A put option gives the holder the right to sell and obligates the writer to buy the underlying instrument at the exercise or strike price at any time or at a specified time during the option period.
Premiums paid on options purchased and premiums received on options written, as well as the daily fluctuation in market value, are included in investments at value — unaffiliated and options written at value, respectively, in the Consolidated Statement of Assets and Liabilities. When an instrument is purchased or sold through the exercise of an option, the premium is offset against the cost or proceeds of the underlying instrument. When an option expires, a realized gain or loss is recorded in the Consolidated Statement of Operations to the extent of the premiums received or paid. When an option is closed or sold, a gain or loss is recorded in the Consolidated Statement of Operations to the extent the cost of the closing transaction exceeds the premiums received or paid). When the Fund writes a call option, such option is typically “covered,” meaning that it holds the underlying instrument subject to being called by the option counterparty. When the Fund writes a put option, such option is covered by cash in an amount sufficient to cover the obligation.
| • | | Swaptions — The Fund purchases and writes options on swaps (“swaptions”) primarily to preserve a return or spread on a particular investment or portion of the Fund’s holdings, as a duration management technique or to protect against an increase in the price of securities it anticipates purchasing at a later date. The purchaser and writer of a swaption is buying or granting the right to enter into a previously agreed upon interest rate or credit default swap agreement (interest rate risk and/or credit risk) at any time before the expiration of the option. |
Swaps: The Fund enters into swap contracts to manage exposure to issuers, markets and securities. Such contracts are agreements between the Fund and a counterparty to make periodic net payments on a specified notional amount or a net payment upon termination. Swap agreements are privately negotiated in the OTC market and may be entered into as a bilateral contract (“OTC swaps”) or centrally cleared (“centrally cleared swaps”).
| | | | | | |
| | | BLACKROCK STRATEGIC RISK ALLOCATION FUND | | JANUARY 31, 2017 | | 25 |
| | | | |
| Notes to Consolidated Financial Statements (continued) | | | | |
For OTC swaps, any upfront premiums paid and any upfront fees received are shown as swap premiums paid and swap premiums received, respectively, in the Consolidated Statement of Assets and Liabilities and amortized over the term of the contract. The daily fluctuation in market value is recorded as unrealized appreciation (depreciation) on OTC Swaps in the Consolidated Statement of Assets and Liabilities. Payments received or paid are recorded in the Consolidated Statement of Operations as realized gains or losses, respectively. When an OTC swap is terminated, a realized gain or loss is recorded in the Consolidated Statement of Operations equal to the difference between the proceeds from (or cost of) the closing transaction and the Fund’s basis in the contract, if any. Generally, the basis of the contract is the premium received or paid.
In a centrally cleared swap, immediately following execution of the swap contract, the swap contract is novated to a central counterparty (the “CCP”) and the Fund’s counterparty on the swap agreement becomes the CCP. The Fund is required to interface with the CCP through the broker. Upon entering into a centrally cleared swap, the Fund is required to deposit initial margin with the broker in the form of cash or securities in an amount that varies depending on the size and risk profile of the particular swap. Securities deposited as initial margin are designated in the Consolidated Schedule of Investments and cash deposited is shown as cash pledged for centrally cleared swaps in the Consolidated Statement of Assets and Liabilities. Pursuant to the contract, the Fund agrees to receive from or pay to the broker an amount of cash equal to the daily fluctuation in market value of the contract (“variation margin”). Variation margin is recorded as unrealized appreciation (depreciation) and shown as variation margin receivable (or payable) on centrally cleared swaps in the Consolidated Statement of Assets and Liabilities. Payments received from (paid to) the counterparty, including at termination, are recorded as realized gains (losses) in the Consolidated Statement of Operations.
| • | | Credit default swaps — The Fund enters into credit default swaps to manage its exposure to the market or certain sectors of the market, to reduce its risk exposure to defaults of corporate and/or sovereign issuers or to create exposure to corporate and/or sovereign issuers to which it is not otherwise exposed (credit risk). |
The Fund may either buy or sell (write) credit default swaps on single-name issuers (corporate or sovereign), a combination or basket of single-name issuers or traded indexes. Credit default swaps are agreements in which the protection buyer pays fixed periodic payments to the seller in consideration for a promise from the protection seller to make a specific payment should a negative credit event take place with respect to the referenced entity (e.g., bankruptcy, failure to pay, obligation acceleration, repudiation, moratorium or restructuring). As a buyer, if an underlying credit event occurs, the Fund will either (i) receive from the seller an amount equal to the notional amount of the swap and deliver the referenced security or underlying securities comprising the index, or (ii) receive a net settlement of cash equal to the notional amount of the swap less the recovery value of the security or underlying securities comprising the index. As a seller (writer), if an underlying credit event occurs, the Fund will either pay the buyer an amount equal to the notional amount of the swap and take delivery of the referenced security or underlying securities comprising the index or pay a net settlement of cash equal to the notional amount of the swap less the recovery value of the security or underlying securities comprising the index.
| • | | Total return swaps — The Fund enters into total return swaps to obtain exposure to a security or market without owning such security or investing directly in such market or to exchange the risk/return of one market (e.g., fixed income) with another market (e.g., equity or commodity prices) (equity risk, commodity price risk and/or interest rate risk). |
Total return swaps are agreements in which there is an exchange of cash flows whereby one party commits to make payments based on the total return (distributions plus capital gains/losses) of an underlying instrument in exchange for fixed or floating rate interest payments. If the total return of the instrument or index underlying the transaction exceeds or falls short of the offsetting fixed or floating interest rate obligation, the Fund receives payment from or makes a payment to the counterparty.
Swap transactions involve, to varying degrees, elements of interest rate, credit and market risk in excess of the amounts recognized in the Consolidated Statement of Assets and Liabilities. Such risks involve the possibility that there will be no liquid market for these agreements, that the counterparty to the agreements may default on its obligation to perform or disagree as to the meaning of the contractual terms in the agreements, and that there may be unfavorable changes in interest rates and/or market values associated with these transactions.
Master Netting Arrangements: In order to define its contractual rights and to secure rights that will help it mitigate its counterparty risk, the Fund may enter into an International Swaps and Derivatives Association, Inc. Master Agreement (“ISDA Master Agreement”) or similar agreement with its counterparties. An ISDA Master Agreement is a bilateral agreement between the Fund and a counterparty that governs certain OTC derivatives and typically contains, among other things, collateral posting terms and netting provisions in the event of a default and/or termination event. Under an ISDA Master Agreement, the Fund may, under certain circumstances, offset with the counterparty certain derivative financial instruments’ payables and/or receivables with collateral held and/or posted and create one single net payment. The provisions of the ISDA Master Agreement typically permit a single net payment in the event of default including the bankruptcy or insolvency of the counterparty. Bankruptcy or insolvency laws of a particular jurisdiction may restrict or prohibit the right of offset in bankruptcy, insolvency or other events. In addition, certain ISDA Master Agreements allow counterparties to terminate derivative contracts prior to maturity in the event the Fund’s net assets decline by a stated percentage or the Fund fails to meet the terms of its ISDA Master Agreements. The result would cause the Fund to accelerate payment of any net liability owed to the counterparty.
| | | | | | |
| 26 | | BLACKROCK STRATEGIC RISK ALLOCATION FUND | | JANUARY 31, 2017 | | |
| | | | |
| Notes to Consolidated Financial Statements (continued) | | | | |
Collateral Requirements: For derivatives traded under an ISDA Master Agreement, the collateral requirements are typically calculated by netting the mark-to-market amount for each transaction under such agreement and comparing that amount to the value of any collateral currently pledged by the Fund and the counterparty.
Cash collateral that has been pledged to cover obligations of the Fund and cash collateral received from the counterparty, if any, is reported separately on the Consolidated Statement of Assets and Liabilities as cash pledged as collateral and cash received as collateral, respectively. Non-cash collateral pledged by the Fund, if any, is noted in the Consolidated Schedule of Investments. Generally, the amount of collateral due from or to a counterparty is subject to a certain minimum transfer amount threshold before a transfer is required, which is determined at the close of business of the Fund. Any additional required collateral is delivered to/pledged by the Fund on the next business day. Typically, the counterparty is not permitted to sell, re-pledge or use cash and non-cash collateral it receives. The Fund generally agrees not to use non-cash collateral that it receives but may, absent default or certain other circumstances defined in the underlying ISDA Master Agreement, be permitted to use cash collateral received. In such cases, interest may be paid pursuant to the collateral arrangement with the counterparty. To the extent amounts due to the Fund from its counterparties are not fully collateralized, it bears the risk of loss from counterparty non-performance. Likewise, to the extent the Fund has delivered collateral to a counterparty and stands ready to perform under the terms of its agreement with such counterparty, it bears the risk of loss from a counterparty in the amount of the value of the collateral in the event the counterparty fails to return such collateral. Based on the terms of agreements, collateral may not be required for all derivative contracts.
6. Investment Advisory Agreement and Other Transactions with Affiliates:
The PNC Financial Services Group, Inc. is the largest stockholder and an affiliate of BlackRock, Inc. (“BlackRock”) for 1940 Act purposes.
Investment Advisory: The Trust, on behalf of the Fund, entered into an Investment Advisory Agreement with the Manager, the Fund’s investment adviser, an indirect, wholly-owned subsidiary of BlackRock, to provide investment advisory services. The Manager is responsible for the management of the Fund’s portfolio and provides the personnel, facilities, equipment and certain other services necessary to the operations of the Fund.
For such services, the Fund pays the Manager a monthly fee at an annual rate equal to the following percentages of the average daily value of the Fund’s net assets:
| | |
| Average Daily Net Assets | | Investment Advisory Fee |
First $1 Billion | | 0.50% |
$1 Billion - $3 Billion | | 0.47% |
$3 Billion - $5 Billion | | 0.45% |
$5 Billion - $10 Billion | | 0.44% |
Greater than $10 Billion | | 0.43% |
Prior to November 28, 2016, the annual rates as a percentage of the average daily value of the Fund’s net assets were as follows:
| | |
| Average Daily Net Assets | | Investment Advisory Fee |
First $1 Billion | | 0.75% |
$1 Billion - $3 Billion | | 0.71% |
$3 Billion - $5 Billion | | 0.68% |
$5 Billion - $10 Billion | | 0.65% |
Greater than $10 Billion | | 0.64% |
The Manager provides investment management and other services to the Subsidiary. The Manager does not receive separate compensation from the Subsidiary for providing investment management or administrative services. However, the Fund pays the Manager based on the Fund’s net assets which includes the assets of the Subsidiary.
With respect to the Fund, the Manager entered into a sub-advisory agreement with BlackRock International Limited (“BIL”), an affiliate of the Manager. The Manager pays BIL, for services it provides, a monthly fee that is a percentage of the investment advisory fees paid by the Fund to the Manager.
Service and Distribution Fees: The Trust, on behalf of the Fund, entered into a Distribution Agreement and a Distribution and Service Plan with BlackRock Investments, LLC (“BRIL”), an affiliate of the Manager. Pursuant to the Distribution and Service Plan and in accordance with Rule 12b-1 under the 1940 Act, the Fund pays BRIL ongoing service and distribution fees. The fees are accrued daily and paid monthly at annual rates based upon the average daily net assets of the relevant share class of the Fund as follows:
| | | | |
| | | Investor A | | Investor C |
Distribution Fee | | — | | 0.75% |
Service Fee | | 0.25% | | 0.25% |
| | | | | | |
| | | BLACKROCK STRATEGIC RISK ALLOCATION FUND | | JANUARY 31, 2017 | | 27 |
| | | | |
| Notes to Consolidated Financial Statements (continued) | | | | |
BRIL and broker-dealers, pursuant to sub-agreements with BRIL, provide shareholder servicing and distribution services to the Fund. The ongoing service and/or distribution fee compensates BRIL and each broker-dealer for providing shareholder servicing and/or distribution related services to the shareholders.
For the six months ended January 31, 2017, the following table shows the class specific service and distribution fees borne directly by each share class of the Fund:
| | | | |
| Investor A | | Investor C | | Total |
| $2,096 | | $3,693 | | $5,789 |
Administration: The Trust, on behalf of the Fund, entered into an Administration Agreement with the Manager, an indirect, wholly-owned subsidiary of BlackRock, to provide administrative services. For these services, the Manager receives an administration fee computed daily and payable monthly, based on a percentage of the average daily net assets of the Fund. The administration fee, which is shown as administration in the Consolidated Statement of Operations, is paid at the annual rates below.
| | |
| Average Daily Net Assets | | Administration Fee |
First $500 Million | | 0.0425% |
$500 Million - $1 Billion | | 0.0400% |
$1 Billion - $2 Billion | | 0.0375% |
$2 Billion - $4 Billion | | 0.0350% |
$4 Billion - $13 Billion | | 0.0325% |
Greater than $13 Billion | | 0.0300% |
In addition, the Manager charges each of the share classes an administration fee, which is shown as administration — class specific in the Consolidated Statement of Operations, at an annual rate of 0.02% of the average daily net assets of each respective class.
For the six months ended January 31, 2017, the following table shows the class specific administration fees borne directly by each share class of the Fund:
| | | | | | |
| Institutional | | Investor A | | Investor C | | Total |
| $2,872 | | $168 | | $74 | | $3,114 |
The Manager may have, at its discretion, voluntarily waived all or any portion of its administration fees for the Fund or a share class, which are included in administration fees waived and administration fees waived — class specific in the Consolidated Statement of Operations. For the six months ended January 31, 2017, the administration fees waived at the Fund level was $2,376.
Transfer Agent: Pursuant to written agreements, certain financial intermediaries, some of which may be affiliates, provide the Fund with sub-accounting, recordkeeping, sub-transfer agency and other administrative services with respect to sub-accounts they service. For these services, these entities receive an asset-based fee or an annual fee per shareholder account, which will vary depending on share class and/or net assets. For the six months ended January 31, 2017, the Fund did not pay any amounts to affiliates in return for these services.
The Manager maintains a call center that is responsible for providing certain shareholder services to the Fund. Shareholder services include responding to inquiries and processing subscriptions and redemptions based upon instructions from shareholders. For the six months ended January 31, 2017, the Fund reimbursed the Manager the following amounts for costs incurred in running the call center, which are included in transfer agent — class specific in the Consolidated Statement of Operations:
| | | | | | |
| Institutional | | Investor A | | Investor C | | Total |
| $101 | | $72 | | $39 | | $212 |
For the six months ended January 31, 2017, the following table shows the class specific transfer agent fees borne directly by each class of the Fund:
| | | | | | |
| Institutional | | Investor A | | Investor C | | Total |
| $1,971 | | $1,506 | | $462 | | $3,939 |
Other Fees: For the six months ended January 31, 2017, affiliates earned underwriting discounts, direct commissions and dealer concessions on sales of the Fund’s Investor A Shares of $1,523.
Expense Limitations, Waivers, Reimbursements and Recoupments: With respect to the Fund, the Manager contractually agreed to waive and/or reimburse fees or expenses in order to limit expenses, excluding interest expense, dividend expense, tax expense, acquired fund fees and expenses, and
| | | | | | |
| 28 | | BLACKROCK STRATEGIC RISK ALLOCATION FUND | | JANUARY 31, 2017 | | |
| | | | |
| Notes to Consolidated Financial Statements (continued) | | | | |
certain other fund expenses, which constitute extraordinary expenses not incurred in the ordinary course of the Fund’s business (“expense limitation”). The expense limitations as a percentage of average daily net assets are as follows:
| | | | |
| Institutional | | Investor A | | Investor C |
| 0.55% | | 0.80% | | 1.55% |
Prior to November 28, 2016, the expense limitations as a percentage of average daily net assets were as follows:
| | | | |
| Institutional | | Investor A | | Investor C |
| 1.00% | | 1.25% | | 2.00% |
The Manager has agreed not to reduce or discontinue these contractual expense limitations prior to December 1, 2018, unless approved by the Board, including a majority of the Independent Trustees who are not “interested persons” of the Fund, as defined in the 1940 Act (“Independent Trustees”) or by a vote of a majority of the outstanding voting securities of the Fund. For the six months ended January 31, 2017, the amount included in fees waived by the Manager was $69,329.
These amounts waived and/or reimbursed are included in fees waived by the Manager, and shown as administration fees waived — class specific, transfer agent fees waived — class specific and transfer agent fees reimbursed — class specific, respectively, in the Consolidated Statement of Operations. As of January 31, 2017, class specific expense waivers and/or reimbursements are as follows:
| | | | | | | | | | | | | | | | |
| | | Institutional | | | Investor A | | | Investor C | | | Total | |
Administration fees waived | | $ | 2,821 | | | $ | 168 | | | $ | 74 | | | $ | 3,063 | |
Transfer agent fees waived | | $ | 96 | | | $ | 72 | | | $ | 39 | | | $ | 207 | |
Transfer agent fees reimbursed | | $ | 1,754 | | | $ | 1,407 | | | $ | 410 | | | $ | 3,571 | |
In addition, for the six months ended January 31, 2017, the Manager reimbursed $816 which is shown as expenses reimbursed by the Manager in the Consolidated Statement of Operations.
With respect to the Fund, the Manager voluntarily agreed to waive its investment advisory fees by the amount of investment advisory fees the Fund pays to the Manager indirectly through its investment in affiliated money market funds (the “affiliated money market fund waiver”). This amount is included in fees waived by the Manager in the Consolidated Statement of Operations. The amount of waivers and/or reimbursements of fees and expenses made pursuant to the expense limitation caps, as applicable, will be reduced by the amount of the affiliated money market fund waiver. For the six months ended January 31, 2017, the amount waived was $4,539.
Effective September 1, 2016, the Manager voluntarily agreed to waive its investment advisory fee with respect to any portion of Fund’s assets invested in affiliated equity or fixed-income mutual funds or affiliated exchange-traded funds that have a contractual management fee. Prior to September 1, 2016, the Manager did not waive such fees. Effective November 28, 2016, the waiver became contractual through November 30, 2018. This contractual agreement may be terminated with respect to each Fund upon 90 days’ notice by a majority of Independent Trustees or by a vote of a majority of the outstanding voting securities of the Fund. This amount is included in fees waived by the Manager in the Statement of Operations. For the six months ended January 31, 2017, the amount waived was $6,963.
With respect to the contractual expense caps, if during the Fund’s fiscal year the operating expenses of a share class, that at any time during the prior two fiscal years received a waiver and/or reimbursement from the Manager, are less than the expense cap for that share class, the Manager is entitled to be reimbursed by such share class up to the lesser of the following expenses:
| | (a) | | The amount of fees waived and/or expenses reimbursed during those prior two fiscal years under the agreement. |
| | (b) | | The amount by which the expense cap for that share class exceeds the operating expenses of the share class for the current fiscal year, provided that: |
• The Fund, of which the share class is a part, has more than $50 million in assets for the fiscal year; and
• The Manager or an affiliate continues to serve as the Fund’s investment adviser or administrator.
In the event the expense cap for a share class is changed subsequent to a fiscal year in which the Manager becomes entitled to reimbursement for fees waived and/or reimbursed, the amount available to reimburse the Manager shall be calculated by reference to the expense cap for that share class in effect at the time the Manager became entitled to receive such reimbursement, rather than the subsequently changed expense cap for that share class.
| | | | | | |
| | | BLACKROCK STRATEGIC RISK ALLOCATION FUND | | JANUARY 31, 2017 | | 29 |
| | | | |
| Notes to Consolidated Financial Statements (continued) | | | | |
On January 31, 2017, the Fund level and class specific waivers and/or reimbursements subject to possible future recoupment under the expense limitation agreement are as follows:
| | | | | | | | | | | | |
| | | Expiring July 31, | |
| | | 2017 | | | 2018 | | | 2019 | |
Fund Level | | $ | 151,290 | | | $ | 165,354 | | | $ | 72,521 | |
Institutional | | $ | 8,688 | | | $ | 16,993 | | | $ | 4,671 | |
Investor A | | $ | 2,796 | | | $ | 3,186 | | | $ | 1,647 | |
Investor C | | $ | 603 | | | $ | 936 | | | $ | 523 | |
Interfund Lending: In accordance with an exemptive order (the “Order”) from the U.S. Securities and Exchange Commission, the Fund may participate in a joint lending and borrowing facility for temporary purposes (the “Interfund Lending Program”), subject to compliance with the terms and conditions of the Order, and to the extent permitted by the Fund’s investment policies and restrictions. The Fund is currently permitted to borrow and lend under the Interfund Lending Program.
The Fund may lend in aggregate up to 15% of its net assets, but may not lend more than 5% of its net assets to any one borrowing fund through the Interfund Lending Program. The Fund may not borrow through the Interfund Lending Program or from any other source more than 33 1/3% of its total assets (or any lower threshold provided for by the Fund’s investment restrictions). If the Fund’s total outstanding borrowings exceed 10% of its total assets, each of its outstanding interfund loans will be subject to collateralization of at least 102% of the outstanding principal value of the loan. All interfund loans are for temporary or emergency purposes and the interest rate to be charged will be the average of the highest current overnight repurchase agreement rate available to a lending fund and the bank loan rate, as calculated according to a formula established by the Board.
During the period ended January 31, 2017, the Fund did not participate in the Interfund Lending Program.
Officers and Trustees: Certain officers and/or trustees of the Trust are officers and/or trustees of BlackRock or its affiliates. The Fund reimburses the Manager for a portion of the compensation paid to the Trust’s Chief Compliance Officer, which is included in Officer and Trustees in the Consolidated Statement of Operations.
7. Purchases and Sales:
For the six months ended January 31, 2017, purchases and sales of investments, excluding short-term securities were $1,992,236 and $236,954, respectively.
8. Income Tax Information:
It is the Fund’s policy to comply with the requirements of the Internal Revenue Code of 1986, as amended, applicable to regulated investment companies, and to distribute substantially all of its taxable income to its shareholders. Therefore, no federal income tax provision is required.
The Fund files U.S. federal and various state and local tax returns. No income tax returns are currently under examination. The statute of limitations on the Fund’s U.S. federal tax returns generally remains open for each of the three years ended July 31, 2016 and the period ended July 31, 2013. The statutes of limitations on the Fund’s state and local tax returns may remain open for an additional year depending upon the jurisdiction.
Management has analyzed tax laws and regulations and their application to the Fund as of January 31, 2017, inclusive of the open tax return years, and does not believe that there are any uncertain tax positions that require recognition of a tax liability in the Fund’s consolidated financial statements.
As of July 31, 2016, the Fund had a capital loss carryforward of $235,930 with no expiration dates, available to offset future realized capital gains.
As of January 31, 2017, gross unrealized appreciation and depreciation based on cost for federal income tax purposes were as follows:
| | | | |
Tax cost | | $ | 31,383,195 | |
| | | | |
Gross unrealized appreciation | | $ | 100,098 | |
Gross unrealized depreciation | | | (1,099,240 | ) |
| | | | |
Net unrealized depreciation | | $ | (999,142 | ) |
| | | | |
9. Bank Borrowings:
The Trust, on behalf of the Fund, along with certain other funds managed by the Manager and its affiliates (“Participating Funds”), is a party to a 364-day, $2.1 billion credit agreement with a group of lenders. Under this agreement, the Fund may borrow to fund shareholder redemptions. Excluding commitments designated for certain individual funds, the Participating Funds, including the Fund, can borrow up to an aggregate commitment amount of $1.6 billion at any time outstanding, subject to asset coverage and other limitations as specified in the agreement. The credit agreement has the following terms: a fee of 0.12% per annum on unused commitment amounts and interest at a rate equal to the higher of (a) one-month LIBOR (but, in
| | | | | | |
| 30 | | BLACKROCK STRATEGIC RISK ALLOCATION FUND | | JANUARY 31, 2017 | | |
| | | | |
| Notes to Consolidated Financial Statements (continued) | | | | |
any event, not less than 0.00%) on the date the loan is made plus 0.80% per annum or (b) the Fed Funds rate (but, in any event, not less than 0.00%) in effect from time to time plus 0.80% per annum on amounts borrowed. The agreement expires in April 2017 unless extended or renewed. Participating Funds paid administration, legal and arrangement fees, which, if applicable, are included in miscellaneous expenses in the Consolidated Statement of Operations. These fees were allocated among such funds based upon portions of the aggregate commitment available to them and relative net assets of Participating Funds. During the six months ended January 31, 2017, the Fund did not borrow under the credit agreement.
10. Principal Risks:
In the normal course of business, the Fund invests in securities and enters into transactions where risks exist due to fluctuations in the market (market risk) or failure of the issuer to meet all its obligations, including the ability to pay principal and interest when due (issuer credit risk). The value of securities held by the Fund may decline in response to certain events, including those directly involving the issuers of securities owned by the Fund. Changes arising from the general economy, the overall market and local, regional or global political and/or social instability, as well as currency, interest rate and price fluctuations, may also affect the securities’ value.
The Fund may be exposed to prepayment risk, which is the risk that borrowers may exercise their option to prepay principal earlier than scheduled during periods of declining interest rates, which would force the Fund to reinvest in lower yielding securities. The Fund may also be exposed to reinvestment risk, which is the risk that income from the Fund’s portfolio will decline if the Fund invests the proceeds from matured, traded or called fixed income securities at market interest rates that are below the Fund portfolio’s current earnings rate.
Valuation Risk: The market values of equities, such as common stocks and preferred securities or equity related investments, such as futures and options, may decline due to general market conditions which are not specifically related to a particular company. They may also decline due to factors which affect a particular industry or industries. The Fund may invest in illiquid investments and may experience difficulty in selling those investments in a timely manner at the price that it believes the investments are worth. Prices may fluctuate widely over short or extended periods in response to company, market or economic news. Markets also tend to move in cycles, with periods of rising and falling prices. This volatility may cause the Fund’s NAV to experience significant increases or decreases over short periods of time. If there is a general decline in the securities and other markets, the NAV of the Fund may lose value, regardless of the individual results of the securities and other instruments in which the Fund invests.
Counterparty Credit Risk: Similar to issuer credit risk, the Fund may be exposed to counterparty credit risk, or the risk that an entity may fail to or be unable to perform on its commitments related to unsettled or open transactions. The Fund manages counterparty credit risk by entering into transactions only with counterparties that the Manager believes have the financial resources to honor their obligations and by monitoring the financial stability of those counterparties. Financial assets, which potentially expose the Fund to market, issuer and counterparty credit risks, consist principally of financial instruments and receivables due from counterparties. The extent of the Fund’s exposure to market, issuer and counterparty credit risks with respect to these financial assets is approximately their value recorded in the Consolidated Statement of Assets and Liabilities, less any collateral held by the Fund.
A derivative contract may suffer a mark-to-market loss if the value of the contract decreases due to an unfavorable change in the market rates or values of the underlying instrument. Losses can also occur if the counterparty does not perform under the contract.
The Fund’s risk of loss from counterparty credit risk on OTC derivatives is generally limited to the aggregate unrealized gain less the value of any collateral held by the Fund.
For OTC options purchased, the Fund bears the risk of loss in the amount of the premiums paid plus the positive change in market values net of any collateral held by the Fund should the counterparty fail to perform under the contracts. Options written by the Fund do not typically give rise to counterparty credit risk, as options written generally obligate the Fund, and not the counterparty, to perform. The Fund may be exposed to counterparty credit risk with respect to options written to the extent the Fund deposits collateral with its counterparty to a written option.
With exchange-traded futures and centrally cleared swaps, there is less counterparty credit risk to the Fund since the exchange or clearinghouse, as counterparty to such instruments, guarantees against a possible default. The clearinghouse stands between the buyer and the seller of the contract; therefore, credit risk is limited to failure of the clearinghouse. While offset rights may exist under applicable law, the Fund does not have a contractual right of offset against a clearing broker or clearinghouse in the event of a default (including the bankruptcy or insolvency). Additionally, credit risk exists in exchange-traded futures and centrally cleared swaps with respect to initial and variation margin that is held in a clearing broker’s customer accounts. While clearing brokers are required to segregate customer margin from their own assets, in the event that a clearing broker becomes insolvent or goes into bankruptcy and at that time there is a shortfall in the aggregate amount of margin held by the clearing broker for all its clients, typically the shortfall would be allocated on a pro rata basis across all the clearing broker’s customers, potentially resulting in losses to the Fund.
| | | | | | |
| | | BLACKROCK STRATEGIC RISK ALLOCATION FUND | | JANUARY 31, 2017 | | 31 |
| | | | |
| Notes to Consolidated Financial Statements (concluded) | | | | |
Concentration Risk: The Fund invests a significant portion of its assets in fixed-income securities and/or uses derivatives tied to the fixed-income markets. Changes in market interest rates or economic conditions may affect the value and/or liquidity of such investments. Interest rate risk is the risk that prices of bonds and other fixed-income securities will increase as interest rates fall and decrease as interest rates rise. The Fund may be subject to a greater risk of rising interest rates due to the current period of historically low rates.
11. Capital Share Transactions:
Transactions in capital shares for each class were as follows:
| | | | | | | | | | | | | | | | | | |
| | | Six Months Ended
January 31, 2017 | | | | | Year Ended
July 31, 2016 | |
| | | Shares | | | Amount | | | | | Shares | | | Amount | |
| Institutional | | | | | | | | | | | | | | |
Shares sold | | | 184,101 | | | $ | 1,779,938 | | | | | | 76,384 | | | $ | 726,253 | |
Shares issued in reinvestment of distributions | | | 3,057 | | | | 29,504 | | | | | | 19,705 | | | | 177,740 | |
Shares redeemed | | | (49,034 | ) | | | (478,247 | ) | | | | | (839,324 | ) | | | (8,005,775 | ) |
| | | | | | | | | | |
Net increase (decrease) | | | 138,124 | | | $ | 1,331,195 | | | | | | (743,235 | ) | | $ | (7,101,782 | ) |
| | | | | | | | | | |
| | | | | | | | | | | | | | | | | | |
| Investor A | | | | | | | | | | | | | | |
Shares sold | | | 119,416 | | | $ | 1,158,856 | | | | | | 29,077 | | | $ | 274,036 | |
Shares issued in reinvestment of distributions | | | 2,247 | | | | 21,636 | | | | | | 6,504 | | | | 58,600 | |
Shares redeemed | | | (21,545 | ) | | | (209,446 | ) | | | | | (69,658 | ) | | | (651,001 | ) |
| | | | | | | | | | |
Net increase (decrease) | | | 100,118 | | | $ | 971,046 | | | | | | (34,077 | ) | | $ | (318,365 | ) |
| | | | | | | | | | |
| | | | | | | | | | | | | | | | | | |
| Investor C | | | | | | | | | | | | | | |
Shares sold | | | 23,332 | | | $ | 224,514 | | | | | | 17,668 | | | $ | 166,913 | |
Shares issued in reinvestment of distributions | | | 535 | | | | 5,128 | | | | | | 1,605 | | | | 14,432 | |
Shares redeemed | | | (4,817 | ) | | | (46,721 | ) | | | | | (37,872 | ) | | | (358,159 | ) |
| | | | | | | | | | |
Net increase (decrease) | | | 19,050 | | | $ | 182,921 | | | | | | (18,599 | ) | | $ | (176,814 | ) |
| | | | | | | | | | |
Total Net Increase (Decrease) | | | 257,292 | | | $ | 2,485,162 | | | | | | (795,911 | ) | | $ | (7,596,961 | ) |
| | | | | | | | | | |
At January 31, 2017, shares owned by BlackRock HoldCo 2, Inc., an affiliate of the Fund, were as follows:
| | | | |
| Institutional | | Investor A | | Investor C |
| $2,504,182 | | $2,509 | | $2,509 |
12. Subsequent Events:
Management’s evaluation of the impact of all subsequent events on the Fund’s financial statements was completed through the date the financial statements were issued and the following items were noted:
On November 18, 2016, the Board of Trustees of BlackRock FundsSM approved a change in the name of the Fund to “BlackRock Total Factor Fund” and certain changes to the Fund’s investment strategy.
| | | | | | |
| 32 | | BLACKROCK STRATEGIC RISK ALLOCATION FUND | | JANUARY 31, 2017 | | |
Rodney D. Johnson, Chair of the Board and Trustee
Susan J. Carter, Trustee
Collette Chilton, Trustee
Neil A. Cotty, Trustee
Cynthia A. Montgomery, Trustee
Joseph P. Platt, Trustee
Robert C. Robb, Jr., Trustee
Mark Stalnecker, Trustee
Kenneth L. Urish, Trustee
Claire A. Walton, Trustee
Frederick W. Winter, Trustee
Barbara G. Novick, Trustee
John M. Perlowski, Trustee, President and Chief Executive Officer
Thomas Callahan, Vice President
Jennifer McGovern, Vice President
Neal J. Andrews, Chief Financial Officer
Jay M. Fife, Treasurer
Charles Park, Chief Compliance Officer
Fernanda Piedra, Anti-Money Laundering Compliance Officer
Benjamin Archibald, Secretary
Effective December 31, 2016, David O. Beim and Dr. Matina S. Horner resigned as Trustees of the Trust.
| | | | | | |
| | | | |
Investment Adviser and Administrator BlackRock Advisors, LLC Wilmington, DE 19809 | | Sub-Adviser BlackRock International Limited Edinburgh, United Kingdom EH3 8BL | | Accounting Agent and Transfer Agent BNY Mellon Investment Servicing (US) Inc. Wilmington, DE 19809 | | Custodian The Bank of New York Mellon New York, NY 10286 |
| | | | | | |
Distributor BlackRock Investments, LLC New York, NY 10022 | | Legal Counsel Sidley Austin LLP New York, NY 10019 | | Independent Registered Public Accounting Firm PricewaterhouseCoopers LLP Philadelphia, PA 19103 | | Address of the Trust 100 Bellevue Parkway Wilmington, DE 19809 |
| | | | | | |
| | | BLACKROCK STRATEGIC RISK ALLOCATION FUND | | JANUARY 31, 2017 | | 33 |
Householding
The Fund will mail only one copy of shareholder documents, including prospectuses, annual and semi-annual reports and proxy statements, to shareholders with multiple accounts at the same address. This practice is commonly called “householding” and is intended to reduce expenses and eliminate duplicate mailings of shareholder documents. Mailings of your shareholder documents may be householded indefinitely unless you instruct us otherwise. If you do not want the mailing of these documents to be combined with those for other members of your household, please call the Fund at (800) 441-7762.
Availability of Quarterly Schedule of Investments
The Fund files its complete schedule of portfolio holdings with the SEC for the first and third quarters of each fiscal year on Form N-Q. The Fund’s Forms N-Q are available on the SEC’s website at http://www.sec.gov and may also be reviewed and copied at the SEC’s Public Reference Room in Washington, D.C. Information on the operation of the Public Reference Room or how to access documents on the SEC’s website without charge may be obtained by calling (800) SEC-0330. The Fund’s Forms N-Q may also be obtained upon request and without charge by calling (800) 441-7762.
Availability of Proxy Voting Policies and Procedures
A description of the policies and procedures that the Fund uses to determine how to vote proxies relating to portfolio securities is available upon request and without charge, (1) by calling (800) 441-7762; (2) at http://www.blackrock.com; and (3) on the SEC’s website at http://www.sec.gov.
Availability of Proxy Voting Record
Information about how the Fund voted proxies relating to securities held in the Fund’s portfolio during the most recent 12-month period ended June 30 is available upon request and without charge (1) at http://www.blackrock.com or by calling (800) 441-7762 and (2) on the SEC’s website at http://www.sec.gov.
BlackRock’s Mutual Fund Family
BlackRock offers a diverse lineup of open-end mutual funds crossing all investment styles and managed by experts in equity, fixed income and tax-exempt investing. Visit http://www.blackrock.com for more information.
Account Information
Call us at (800) 441-7762 from 8:00 AM to 6:00 PM ET on any business day to get information about your account balances, recent transactions and share prices. You can also reach us on the Web at http://www.blackrock.com/funds.
Automatic Investment Plans
Investor Class shareholders who want to invest regularly can arrange to have $50 or more automatically deducted from their checking or savings account and invested in any of the BlackRock funds.
Systematic Withdrawal Plans
Investor Class shareholders can establish a systematic withdrawal plan and receive periodic payments of $50 or more from their BlackRock funds, as long as their account balance is at least $10,000.
Retirement Plans
Shareholders may make investments in conjunction with Traditional, Rollover, Roth, Coverdell, Simple IRAs, SEP IRAs and 403(b) Plans.
| | | | | | |
| 34 | | BLACKROCK STRATEGIC RISK ALLOCATION FUND | | JANUARY 31, 2017 | | |
| | | | |
| Additional Information (concluded) | | | | |
|
| BlackRock Privacy Principles |
BlackRock is committed to maintaining the privacy of its current and former fund investors and individual clients (collectively, “Clients”) and to safeguarding their non-public personal information. The following information is provided to help you understand what personal information BlackRock collects, how we protect that information and why in certain cases we share such information with select parties.
If you are located in a jurisdiction where specific laws, rules or regulations require BlackRock to provide you with additional or different privacy-related rights beyond what is set forth below, then BlackRock will comply with those specific laws, rules or regulations.
BlackRock obtains or verifies personal non-public information from and about you from different sources, including the following: (i) information we receive from you or, if applicable, your financial intermediary, on applications, forms or other documents; (ii) information about your transactions with us, our affiliates, or others; (iii) information we receive from a consumer reporting agency; and (iv) from visits to our websites.
BlackRock does not sell or disclose to non-affiliated third parties any non-public personal information about its Clients, except as permitted by law or as is necessary to respond to regulatory requests or to service Client accounts. These non-affiliated third parties are required to protect the confidentiality and security of this information and to use it only for its intended purpose.
We may share information with our affiliates to service your account or to provide you with information about other BlackRock products or services that may be of interest to you. In addition, BlackRock restricts access to non-public personal information about its Clients to those BlackRock employees with a legitimate business need for the information. BlackRock maintains physical, electronic and procedural safeguards that are designed to protect the non-public personal information of its Clients, including procedures relating to the proper storage and disposal of such information.
|
| Change in Independent Registered Public Accounting Firm |
Effective February 24, 2017, Deloitte & Touche LLP (“D&T”) was dismissed as the independent registered public accounting firm to the Fund. The Audit Committee of the Fund’s Board of Trustees participated in, and approved, the decision to change the independent registered public accounting firm. D&T’s reports on the Fund’s financial statements for the fiscal periods ended July 31, 2016 and July 31, 2015 contained no adverse opinion or disclaimer of opinion nor were they qualified or modified as to uncertainty, audit scope or accounting principle. During the Fund’s fiscal periods ended July 31, 2016 and July 31, 2015 and the subsequent interim period through February 24, 2017, (i) there were no disagreements with D&T on any matter of accounting principles or practices, financial statement disclosure or auditing scope or procedure, which disagreements, if not resolved to the satisfaction of D&T, would have caused them to make reference to the subject matter of the disagreements in connection with their reports on the Fund’s financial statements for such periods, and (ii) there were no “reportable events” of the kind described in Item 304(a)(1)(v) of Regulation S-K under the Securities Exchange Act of 1934, as amended.
The Audit Committee of the Fund’s Board of Trustees approved the engagement of PricewaterhouseCoopers LLP (“PwC”) as the Fund’s independent registered public accounting firm for the fiscal year ending July 31, 2017. The selection of PwC does not reflect any disagreements with or dissatisfaction by the Fund or the Board of Trustees with the performance of the Fund’s prior independent registered public accounting firm, D&T. During the Fund’s fiscal periods ended July 31, 2016 and July 31, 2015 and the subsequent interim period through February 24, 2017, neither the Fund, nor anyone on its behalf, consulted with PwC on items which: (i) concerned the application of accounting principles to a specified transaction, either completed or proposed, or the type of audit opinion that might be rendered on the Fund’s financial statements; or (ii) concerned the subject of a disagreement (as defined in paragraph (a)(1)(iv) of Item 304 of Regulation S-K) or reportable events (as described in paragraph (a)(1)(v) of said Item 304).
| | | | | | |
| | | BLACKROCK STRATEGIC RISK ALLOCATION FUND | | JANUARY 31, 2017 | | 35 |
This report is intended for current holders. It is not authorized for use as an offer of sale or a solicitation of an offer to buy shares of the Fund unless preceded or accompanied by the Fund’s current prospectus. Past performance results shown in this report should not be considered a representation of future performance. Investment returns and principal value of shares will fluctuate so that shares, when redeemed, may be worth more or less than their original cost. Statements and other information herein are as dated and are subject to change.

| | |
| |
SRA-1/17-SAR | |  |
| | |
| |
| Item 2 – | | Code of Ethics – Not Applicable to this semi-annual report |
| |
| Item 3 – | | Audit Committee Financial Expert – Not Applicable to this semi-annual report |
| |
| Item 4 – | | Principal Accountant Fees and Services – Not Applicable to this semi-annual report |
| |
| Item 5 – | | Audit Committee of Listed Registrants – Not Applicable |
| |
| Item 6 – | | Investments |
| | (a) The registrant’s Schedule of Investments is included as part of the Report to Stockholders filed under Item 1 of this Form. |
| | (b) Not Applicable due to no such divestments during the semi-annual period covered since the previous Form N-CSR filing. |
| |
| Item 7 – | | Disclosure of Proxy Voting Policies and Procedures for Closed-End Management Investment Companies – Not Applicable |
| |
| Item 8 – | | Portfolio Managers of Closed-End Management Investment Companies – Not Applicable |
| |
| Item 9 – | | Purchases of Equity Securities by Closed-End Management Investment Company and Affiliated Purchasers – Not Applicable |
| | |
| |
| Item 10 – | | Submission of Matters to a Vote of Security Holders –There have been no material changes to these procedures. |
| |
| Item 11 – | | Controls and Procedures |
| |
| | (a) – The registrant’s principal executive and principal financial officers, or persons performing similar functions, have concluded that the registrant’s disclosure controls and procedures (as defined in Rule 30a-3(c) under the Investment Company Act of 1940, as amended (the “1940 Act”)) are effective as of a date within 90 days of the filing of this report based on the evaluation of these controls and procedures required by Rule 30a-3(b) under the 1940 Act and Rule 15d-15(b) under the Securities Exchange Act of 1934, as amended. |
| |
| | (b) – There were no changes in the registrant’s internal control over financial reporting (as defined in Rule 30a-3(d) under the 1940 Act) that occurred during the second fiscal quarter of the period covered by this report that have materially affected, or are reasonably likely to materially affect, the registrant’s internal control over financial reporting. |
| |
| Item 12 – | | Exhibits attached hereto |
| |
| | (a)(1) – Code of Ethics – Not Applicable to this semi-annual report |
| |
| | (a)(2) – Certifications – Attached hereto |
| |
| | (a)(3) – Not Applicable |
| |
| | (b) – Certifications – Attached hereto |
2
Pursuant to the requirements of the Securities Exchange Act of 1934 and the Investment Company Act of 1940, the registrant has duly caused this report to be signed on its behalf by the undersigned, thereunto duly authorized.
BlackRock Funds
| | |
By: | | /s/ John M. Perlowski |
| | John M. Perlowski |
| | Chief Executive Officer (principal executive officer) of |
| | BlackRock Funds |
| |
Date: | | April 5, 2017 |
Pursuant to the requirements of the Securities Exchange Act of 1934 and the Investment Company Act of 1940, this report has been signed below by the following persons on behalf of the registrant and in the capacities and on the dates indicated.
| | |
| By: | | /s/ John M. Perlowski |
| | John M. Perlowski |
| | Chief Executive Officer (principal executive officer) of |
| | BlackRock Funds |
| |
| Date: | | April 5, 2017 |
| |
| By: | | /s/ Neal J. Andrews |
| | Neal J. Andrews |
| | Chief Financial Officer (principal financial officer) of |
| | BlackRock Funds |
| |
| Date: | | April 5, 2017 |
3