UNITED STATES
SECURITIES AND EXCHANGE COMMISSION
Washington, D.C. 20549
FORM N-CSR
CERTIFIED SHAREHOLDER REPORT OF REGISTERED MANAGEMENT INVESTMENT COMPANIES
Investment Company Act file number: 811-05742
Name of Fund: BlackRock Funds
BlackRock Advantage Small Cap Growth Fund (formerly BlackRock Small Cap Growth Equity Portfolio)
BlackRock All-Cap Energy & Resources Portfolio
BlackRock Emerging Markets Dividend Fund
BlackRock Energy & Resources Portfolio
BlackRock Flexible Equity Fund
BlackRock Global Opportunities Portfolio
BlackRock Health Sciences Opportunities Portfolio
BlackRock International Opportunities Portfolio
BlackRock Mid-Cap Growth Equity Portfolio
BlackRock Science & Technology Opportunities Portfolio
BlackRock Tactical Opportunities Portfolio
BlackRock U.S. Opportunities Portfolio
Fund Address: 100 Bellevue Parkway, Wilmington, DE 19809
Name and address of agent for service: John M. Perlowski, Chief Executive Officer, BlackRock Funds, 55 East 52nd Street, New York, NY 10055
Registrant’s telephone number, including area code: (800) 441-7762
Date of fiscal year end: 09/30/2017
Date of reporting period: 03/31/2017
Item 1 – Report to Stockholders
MARCH 31, 2017
| | | | |
SEMI-ANNUAL REPORT (UNAUDITED) | | | | BLACKROCK® |
▶ BlackRock All-Cap Energy & Resources Portfolio
▶ BlackRock Emerging Markets Dividend Fund
▶ BlackRock Energy & Resources Portfolio
| | |
| Not FDIC Insured § May Lose Value § No Bank Guarantee | | |
Dear Shareholder,
In the 12 months ended March 31, 2017, risk assets, such as stocks and high-yield bonds, delivered strong performance, while U.S. Treasuries and other higher-quality assets generated negative returns. Markets showed great resilience during a period with big surprises, including the United Kingdom’s vote to leave the European Union and the outcome of the U.S. presidential election, which brought only brief spikes in equity market volatility. The more rate-sensitive high-quality assets, however, struggled as rising energy prices, modest wage increases and steady U.S. job growth led to expectations of higher inflation and anticipation of interest rate increases by the U.S. Federal Reserve (the “Fed”).
The global reflationary theme — rising nominal growth, wages and inflation — was the dominant driver of asset returns during the period, outweighing significant political upheavals and uncertainty. Reflationary expectations accelerated after the U.S. election and continued into the beginning of 2017, stoked by expectations for an extra boost to U.S. growth via fiscal policy. The primary tension surfacing in markets in 2017 has been between reflationary expectations and the realities of fiscal and monetary policy. Markets have been turning their attention to the Fed’s outlook for additional interest rate hikes, while assessing the probability of Congress passing meaningful fiscal stimulus amid political division and a limited budget.
Although economic momentum is gaining traction, the capacity for rapid global growth is restrained by structural factors, including an aging population, low productivity growth and excess savings, as well as cyclical factors, like the Fed leaning toward higher interest rates and the length of the current expansion. Tempered economic growth and high valuations across most assets have set the stage for muted long-term investment returns going forward.
Equity markets still present opportunities, although the disparity between winners and losers is widening — a dynamic that increases the risk and return potential of active investing. Fixed income investors are also facing challenges as bond markets recalibrate for higher inflation expectations after eight years of deflationary concerns. And in a world where political risk and policy uncertainty abound, there is no lack of potential catalysts for higher volatility.
In this environment, investors need to think globally, extend their scope across a broad array of asset classes and be nimble as market conditions change. We encourage you to talk with your financial advisor and visit blackrock.com for further insight about investing in today’s markets.
Sincerely,

Rob Kapito
President, BlackRock Advisors, LLC

Rob Kapito
President, BlackRock Advisors, LLC
| | | | | | | | |
| Total Returns as of March 31, 2017 | |
| | | 6-month | | | 12-month | |
U.S. large cap equities
(S&P 500® Index)
| | | 10.12 | % | | | 17.17 | % |
U.S. small cap equities
(Russell 2000® Index)
| | | 11.52 | | | | 26.22 | |
International equities
(MSCI Europe, Australasia, Far East Index) | | | 6.48 | | | | 11.67 | |
Emerging market equities (MSCI Emerging Markets Index) | | | 6.80 | | | | 17.21 | |
3-month Treasury bills
(BofA Merrill Lynch 3-Month U.S. Treasury Bill Index) | | | 0.19 | | | | 0.36 | |
U.S. Treasury securities
(BofA Merrill Lynch 10-Year U.S. Treasury Index) | | | (6.08 | ) | | | (3.97 | ) |
U.S. investment grade bonds (Bloomberg Barclays U.S. Aggregate Bond Index) | | | (2.18 | ) | | | 0.44 | |
Tax-exempt municipal bonds (S&P Municipal Bond Index) | | | (1.93 | ) | | | 0.55 | |
U.S. high yield bonds (Bloomberg Barclays U.S. Corporate High Yield 2% Issuer Capped Index) | | | 4.50 | | | | 16.39 | |
|
| Past performance is no guarantee of future results. Index performance is shown for illustrative purposes only. You cannot invest directly in an index. | |
| | | | | | |
| 2 | | THIS PAGE NOT PART OF YOUR FUND REPORT | | | | |
| | | | | | |
| | | 
| | Shareholders can sign up for e-mail notifications of quarterly statements, annual and semi-annual shareholder reports and prospectuses by enrolling in the electronic delivery program. Electronic copies of shareholder reports and prospectuses are also available on BlackRock’s website. TO ENROLL IN ELECTRONIC DELIVERY: Shareholders Who Hold Accounts with Investment Advisors, Banks or Brokerages: Please contact your financial advisor. Please note that not all investment advisors, banks or brokerages may offer this service. Shareholders Who Hold Accounts Directly with BlackRock: 1. Access the BlackRock website at blackrock.com 2. Select “Access Your Account” 3. Next, select “eDelivery” in the “Related Resources” box and follow the sign-up instructions | | |
| | | | | | |
| | | BLACKROCK FUNDS | | MARCH 31, 2017 | | 3 |
| | | | |
| Fund Summary as of March 31, 2017 | | | BlackRock All-Cap Energy & Resources Portfolio | |
BlackRock All-Cap Energy & Resources Portfolio’s (the “Fund”) investment objective is to provide long-term growth of capital.
|
| Portfolio Management Commentary |
How did the Fund perform?
| • | | For the six-month period ended March 31, 2017, the Fund underperformed its benchmark, the MSCI World Energy Index. |
What factors influenced performance?
| • | | The Fund’s overweight position in exploration & production (“E&P”) companies with natural gas exposure, including EQT Corp., came under pressure due to higher-than-predicted temperatures. |
| • | | A rising rig count in the United States in the latter part of the period increased investor concerns that growth in U.S. production would lead to higher oil supplies. The Fund’s overweights in the U.S. E&P companies Anadarko Petroleum Corp., Cimarex Energy Co. and Hess Corp. detracted from relative performance as a result. Hess was also negatively impacted by its announcement of a weaker-than-expected growth forecast for 2017. |
| • | | An overweight position in the pressure pumping and service provider Superior Energy Services, Inc. also detracted from relative performance. The stock lost ground following the announcement of a joint venture between Schlumberger Ltd. and Weatherford International Ltd. that will focus on pressure pumping and therefore potentially increase competition. |
| • | | The Fund’s overweight position in Baker Hughes Inc. was the leading contributor to relative performance. In late October 2016, General Electric Co. announced that it would merge its oil services business with Baker Hughes Inc. and would pay $7.4 billion to take a controlling stake in the combined company. Additionally, Baker Hughes announced stronger-than-expected results. |
| • | | An overweight in the E&P company ConocoPhillips was also a notable contributor. The market responded positively to the company’s plans to |
| | position itself for a lower oil price environment by reducing its break-even cost of production, divesting $5 to $8 billion in assets and beginning a $3 billion share repurchase program. The divestment plan began to show results when ConocoPhillips announced the sale of its higher-cost Canadian assets to Cenovus Energy, Inc. in March. |
Describe recent portfolio activity.
| • | | The investment adviser has positioned the portfolio for a positive oil price environment on the belief that the supply-and-demand backdrop will continue to improve. Accordingly, the investment adviser increased the Fund’s weighting in U.S. onshore oil-services companies by initiating a position in Superior Energy Services Inc. and adding to an existing position in Halliburton Co. These moves were funded by taking profits in certain E&P stocks that performed well in 2016, including Pioneer Natural Resources Co. and EOG Resources, Inc. Later in the period, the investment adviser used the pull-back in the energy sector to increase the portfolio’s beta (risk exposure) somewhat based on the positive fundamentals in the oil market. The investment adviser sought to accomplish this by adding to its favored oil services and E&P holdings and reducing exposure to integrated energy companies such as ExxonMobil Corp. and Chevron Corp. |
Describe portfolio positioning at period end.
| • | | Relative to the MSCI World Energy Index, the Fund closed the period with an overweight in E&Ps and an underweight in the integrated oil and gas sub-sector, based on the belief that the former is in a better position to benefit from rising oil prices. With that said, the investment adviser remains cognizant of near-term risks and is therefore maintaining a high-quality bias in the portfolio. |
The views expressed reflect the opinions of BlackRock as of the date of this report and are subject to change based on changes in market, economic or other conditions. These views are not intended to be a forecast of future events and are no guarantee of future results.
| | | | | |
| Ten Largest Holdings | | Percent of
Net Assets |
Royal Dutch Shell PLC, Class A | | | | 12 | % |
Exxon Mobil Corp. | | | | 10 | |
BP PLC | | | | 6 | |
ConocoPhillips | | | | 5 | |
EOG Resources, Inc. | | | | 5 | |
Chevron Corp. | | | | 5 | |
Anadarko Petroleum Corp. | | | | 4 | |
Pioneer Natural Resources Co. | | | | 4 | |
Baker Hughes, Inc. | | | | 4 | |
Schlumberger Ltd. | | | | 3 | |
| | | | | |
| Industry Allocation | | Percent of
Net Assets |
Oil, Gas & Consumable Fuels | | | | 87 | % |
Energy Equipment & Services | | | | 13 | |
For Fund compliance purposes, the Fund’s industry classifications refer to one or more of the industry sub-classifications used by one or more widely recognized market indexes or ratings group indexes, and/or as defined by the investment adviser. These definitions may not apply for purposes of this report, which may combine such industry sub-classifications for reporting ease.
| | | | | | |
| 4 | | BLACKROCK FUNDS | | MARCH 31, 2017 | | |
| | |
| | | BlackRock All-Cap Energy & Resources Portfolio |
|
| Total Return Based on a $10,000 Investment |
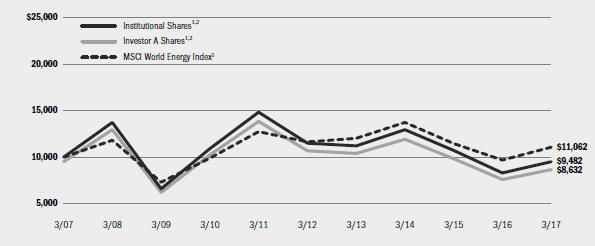
| | 1 | Assuming maximum sales charges, if any, transaction costs and other operating expenses, including investment advisory fees and administration fees, if any. Institutional Shares do not have a sales charge. |
| | 2 | Under normal market conditions, the Fund invests at least 80% of its total assets in equity securities of global energy and natural resources companies and companies in associated businesses, as well as utilities (such as gas, water, cable, electrical and telecommunications utilities). |
| | 3 | A free float-adjusted market capitalization index that represents the energy segment in global developed market equity performance. |
|
| Performance Summary for the Period Ended March 31, 2017 |
| | | | | | | | | | | | | | | | | | | | | | | | | | | | | | | | | | | |
| | | | | Average Annual Total Returns4 |
| | | | | 1 Year | | 5 Years | | 10 Years |
| | | 6-Month
Total Returns | | w/o sales
charge | | w/ sales
charge | | w/o sales
charge | | w/ sales
charge | | w/o sales
charge | | w/ sales
charge |
Institutional | | | | 1.31 | % | | | | 14.34 | % | | | | N/A | | | | | (3.76 | )% | | | | N/A | | | | | (0.53 | )% | | | | N/A | |
Service | | | | 1.16 | | | | | 13.80 | | | | | N/A | | | | | (4.14 | ) | | | | N/A | | | | | (0.91 | ) | | | | N/A | |
Investor A | | | | 1.15 | | | | | 13.84 | | | | | 7.87 | % | | | | (4.15 | ) | | | | (5.18 | )% | | | | (0.93 | ) | | | | (1.46 | )% |
Investor B | | | | 0.77 | | | | | 13.02 | | | | | 8.52 | | | | | (4.85 | ) | | | | (5.23 | ) | | | | (1.52 | ) | | | | (1.52 | ) |
Investor C | | | | 0.85 | | | | | 13.13 | | | | | 12.13 | | | | | (4.83 | ) | | | | (4.83 | ) | | | | (1.64 | ) | | | | (1.64 | ) |
MSCI World Energy Index | | | | 2.06 | | | | | 14.44 | | | | | N/A | | | | | (0.96 | ) | | | | N/A | | | | | 1.01 | | | | | N/A | |
| | 4 | | Assuming maximum sales charges, if any. Average annual total returns with and without sales charges reflect reductions for distribution and service fees. See “About Fund Performance” on page 10 for a detailed description of share classes, including any related sales charges and fees. |
| | | | N/A—Not applicable as share class and index do not have a sales charge. |
| | | | Past performance is not indicative of future results. |
| | | | Performance results may include adjustments made for financial reporting purposes in accordance with U.S. generally accepted accounting principles. |
| | | | | | | | | | | | | | | | | | | | | | | | | | | | | | | | | | | |
| | | Actual | | Hypothetical6 | | |
| | | Beginning
Account Value
October 1, 2016 | | Ending
Account Value
March 31, 2017 | | Expenses Paid
During the Period5 | | Beginning
Account Value
October 1, 2016 | | Ending
Account Value
March 31, 2017 | | Expenses Paid
During the Period5 | | Annualized
Expense
Ratio |
Institutional | | | $ | 1,000.00 | | | | $ | 1,013.10 | | | | $ | 4.55 | | | | $ | 1,000.00 | | | | $ | 1,020.34 | | | | $ | 4.57 | | | | | 0.91 | % |
Service | | | $ | 1,000.00 | | | | $ | 1,011.60 | | | | $ | 6.65 | | | | $ | 1,000.00 | | | | $ | 1,018.25 | | | | $ | 6.67 | | | | | 1.33 | % |
Investor A | | | $ | 1,000.00 | | | | $ | 1,011.50 | | | | $ | 6.65 | | | | $ | 1,000.00 | | | | $ | 1,018.25 | | | | $ | 6.67 | | | | | 1.33 | % |
Investor B | | | $ | 1,000.00 | | | | $ | 1,007.70 | | | | $ | 10.23 | | | | $ | 1,000.00 | | | | $ | 1,014.67 | | | | $ | 10.27 | | | | | 2.05 | % |
Investor C | | | $ | 1,000.00 | | | | $ | 1,008.50 | | | | $ | 10.24 | | | | $ | 1,000.00 | | | | $ | 1,014.67 | | | | $ | 10.27 | | | | | 2.05 | % |
| | 5 | | For each class of the Fund, expenses are equal to the annualized expense ratio for the class, multiplied by the average account value over the period, multiplied by 182/365 (to reflect the one-half year period shown). |
| | 6 | | Hypothetical 5% annual return before expenses is calculated by prorating the number of days in the most recent fiscal half year divided by 365. |
| | | | See “Disclosure of Expenses” on page 11 for further information on how expenses were calculated. |
| | | | | | |
| | | BLACKROCK FUNDS | | MARCH 31, 2017 | | 5 |
| | | | |
| Fund Summary as of March 31, 2017 | | | BlackRock Emerging Markets Dividend Fund | |
BlackRock Emerging Markets Dividend Fund’s (the “Fund”) investment objective is primarily to seek investment income; and, as a secondary objective, to seek capital appreciation.
|
| Portfolio Management Commentary |
How did the Fund perform?
| • | | For the six-month period ended March 31, 2017, the Fund outperformed its benchmark, the MSCI Emerging Markets Index. |
What factors influenced performance?
| • | | Stock selection in India made the largest contribution to the Fund’s positive relative performance. The country’s market produced a strong gain due to the combination of declining concerns about the government’s effort to remove paper money from the financial system and the announcement of a prudent budget for the 2018 fiscal year. More recently, state election wins from the Prime Minister’s party confirmed the support for more reforms. In this environment, the Indian stocks Indiabulls Housing Finance Ltd. and Sun TV Network Ltd. were among the top contributors to Fund performance. Shares of the latter surged after legal charges against its owners were dropped, removing a major overhang on the stock. The Brazilian bank Itau Unibanco Holding SA also performed well following guidance on lower loss-provision costs and an interest rate cut by the country’s central bank. Stock selection in Mexico was an additional contributor. |
| • | | Stock selection in South Korea detracted from results. The underperformance largely stemmed from the Fund’s investment in KT&G Corp. and its zero weighting in Samsung Electronics Co., Ltd. which performed well amid robust demand for memory chips and organic light emitting diodes. A zero weighting in the Brazilian miner Vale SA also weighed on returns as iron ore prices made robust gains. |
Describe recent portfolio activity.
| • | | The Fund increased its positions in the materials and health care sectors during the course of the period. |
| • | | At the country level, the investment adviser reduced the Fund’s weighting in Brazil by taking profits in Itau Unibanco SA and exiting a position in Ambev SA due to its weak earnings. Similarly, the Fund trimmed some of its allocation to China near the close of 2016, as companies had generally reported disappointing profits and growth rates seemed to be moderating going into 2017. The investment adviser later added back exposure by increasing the portfolio’s existing positions in certain financial and consumer stocks. |
Describe portfolio positioning at period end.
| • | | The Fund’s bottom-up positioning reflected the investment adviser’s positive view on the emerging markets, which was based on valuations that remain below the historical average and rising visibility regarding profit margins and earnings. The investment adviser continued to focus on identifying firms with high-quality balance sheets and strong cash flows. |
| • | | The Fund ended the period with its largest overweight positions in India and Thailand, while its most significant underweight was in South Korea. At the sector level, the Fund was overweight in health care and underweight in information technology. |
The views expressed reflect the opinions of BlackRock as of the date of this report and are subject to change based on changes in market, economic or other conditions. These views are not intended to be a forecast of future events and are no guarantee of future results.
| | | | | |
| Ten Largest Holdings | | Percent of
Net Assets |
Taiwan Semiconductor Manufacturing Co. Ltd. - ADR | | | | 3 | % |
KT&G Corp. | | | | 3 | |
China Mobile Ltd. | | | | 3 | |
NovaTek PJSC - GDR | | | | 2 | |
Indiabulls Housing Finance Ltd. | | | | 2 | |
NTPC Ltd. | | | | 2 | |
Powszechny Zaklad Ubezpieczen SA | | | | 2 | |
Sun TV Network Ltd. | | | | 2 | |
Siam Commercial Bank PCL - NVDR | | | | 2 | |
EcoRodovias Infraestrutura e Logistica SA | | | | 2 | |
| | | | | |
| Geographic Allocation | | Percent of
Net Assets |
China | | | | 18 | % |
India | | | | 14 | |
Taiwan | | | | 12 | |
Brazil | | | | 9 | |
Russia | | | | 6 | |
South Korea | | | | 6 | |
Thailand | | | | 6 | |
Hong Kong | | | | 4 | |
South Africa | | | | 3 | |
Mexico | | | | 3 | |
Other1 | | | | 19 | |
| | 1 | | Includes holdings within countries that are 2% or less of long-term investments. Please refer to the Schedule of Investments for such countries. |
| | | | | | |
| 6 | | BLACKROCK FUNDS | | MARCH 31, 2017 | | |
| | | | |
| | | | BlackRock Emerging Markets Dividend Fund | |
|
| Total Return Based on a $10,000 Investment |
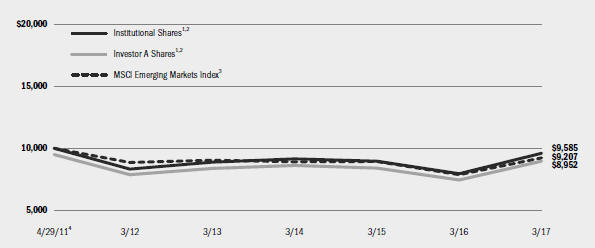
| | 1 | Assuming maximum sales charges, if any, transaction costs and other operating expenses, including investment advisory fees and administration fees, if any. Institutional Shares do not have a sales charge. |
| | 2 | Under normal circumstances, the Fund will invest at least 80% of its net assets (plus any borrowings for investment purposes) in dividend-paying equity securities of, or derivatives having economic characteristics similar to the dividend-paying equity securities of, companies domiciled in, or tied economically to, emerging market countries. The Fund’s total returns prior to August 16, 2013, are the returns of the Fund when it followed different investment strategies under the name BlackRock China Fund. |
| | 3 | A free float-adjusted market capitalization index that is designed to measure equity market performance of emerging markets. The MSCI Emerging Markets Index consists of the following 23 emerging market country indices: Brazil, Chile, China, Colombia, Czech Republic, Egypt, Greece, Hungary, India, Indonesia, Korea, Malaysia, Mexico, Peru, Philippines, Poland, Qatar, Russia, South Africa, Taiwan, Thailand, Turkey and the United Arab Emirates. |
| | 4 | Commencement of operations. |
| | | | | | | | | | | | | | |
| Performance Summary for the Period Ended March 31, 2017 |
| | | | | | | | | | | | | | | | | | | | | | | | | | | | | | | | | | | |
| | | | | Average Annual Total Returns2,5 |
| | | | | 1 Year | | 5 Years | | Since Inception6 |
| | | 6-Month
Total Returns | | w/o sales
charge | | w/ sales
charge | | w/o sales
charge | | w/ sales
charge | | w/o sales
charge | | w/ sales
charge |
Institutional | | | | 8.64 | % | | | | 20.70 | % | | | | N/A | | | | | 2.92 | % | | | | N/A | | | | | (0.71 | )% | | | | N/A | |
Investor A | | | | 8.41 | | | | | 20.34 | | | | | 14.02 | % | | | | 2.66 | | | | | 1.56 | % | | | | (0.95 | ) | | | | (1.85 | )% |
Investor C | | | | 8.08 | | | | | 19.56 | | | | | 18.56 | | | | | 1.95 | | | | | 1.95 | | | | | (1.66 | ) | | | | (1.66 | ) |
MSCI Emerging Markets Index | | | | 6.80 | | | | | 17.21 | | | | | N/A | | | | | 0.81 | | | | | N/A | | | | | (1.39 | ) | | | | N/A | |
| | 5 | | Assuming maximum sales charges, if any. Average annual total returns with and without sales charges reflect reductions for distribution and service fees. See “About Fund Performance” on page 10 for a detailed description of share classes, including any related sales charges and fees. |
| | 6 | | The Fund commenced operations on April 29, 2011. |
| | | | N/A—Not applicable as share class and index do not have a sales charge. |
| | | | Past performance is not indicative of future results. |
| | | | Performance results may include adjustments made for financial reporting purposes in accordance with U.S. generally accepted accounting principles. |
| | | | | | | | | | | | | | | | | | | | | | | | | | | | | | | | | | | |
| | | Actual | | Hypothetical8 | | |
| | | Beginning
Account Value
October 1, 2016 | | Ending
Account Value
March 31, 2017 | | Expenses Paid
During the Period7 | | Beginning
Account Value
October 1, 2016 | | Ending
Account Value
March 31, 2017 | | Expenses Paid
During the Period7 | | Annualized
Expense
Ratio |
Institutional | | | $ | 1,000.00 | | | | $ | 1,086.40 | | | | $ | 7.78 | | | | $ | 1,000.00 | | | | $ | 1,017.40 | | | | $ | 7.52 | | | | | 1.50 | % |
Investor A | | | $ | 1,000.00 | | | | $ | 1,084.10 | | | | $ | 9.07 | | | | $ | 1,000.00 | | | | $ | 1,016.16 | | | | $ | 8.77 | | | | | 1.75 | % |
Investor C | | | $ | 1,000.00 | | | | $ | 1,080.80 | | | | $ | 12.93 | | | | $ | 1,000.00 | | | | $ | 1,012.43 | | | | $ | 12.51 | | | | | 2.50 | % |
| | 7 | | For each class of the Fund, expenses are equal to the annualized expense ratio for the class, multiplied by the average account value over the period, multiplied by 182/365 (to reflect the one-half year period shown). |
| | 8 | | Hypothetical 5% annual return before expenses is calculated by prorating the number of days in the most recent fiscal half year divided by 365. |
| | | | See “Disclosure of Expenses” on page 11 for further information on how expenses were calculated. |
| | | | | | |
| | | BLACKROCK FUNDS | | MARCH 31, 2017 | | 7 |
| | |
| Fund Summary as of March 31, 2017 | | BlackRock Energy & Resources Portfolio |
BlackRock Energy & Resources Portfolio’s (the “Fund”) investment objective is to provide long-term growth of capital.
|
| Portfolio Management Commentary |
How did the Fund perform?
| • | | For the six-month period ended March 31, 2017, the Fund underperformed the MSCI World Small and Mid-Cap Energy Index. |
What factors influenced performance?
| • | | The Fund’s overweight position in exploration & production (“E&P”) companies with natural gas exposure, including Gulfport Energy Corp., Carrizo Oil & Gas, Inc. and EQT Corp., came under pressure due to higher-than-predicted temperatures. |
| • | | An overweight position in the pressure pumping and service provider Superior Energy Services, Inc. also detracted from relative performance. The stock lost ground following the announcement of a joint venture between Schlumberger Ltd. and Weatherford International Ltd. that will focus on pressure pumping and therefore potentially increase competition. |
| • | | The Fund’s overweight position in Baker Hughes Inc. was the leading contributor to relative performance. In late October 2016, General Electric Co. announced that it would merge its oil services business with Baker Hughes Inc. and would pay $7.4 billion to take a controlling stake in the combined company. Additionally, Baker Hughes announced stronger-than-expected results. |
| • | | An overweight in the E&P company Ithaca Energy, Inc., which received a takeover bid from the Israeli energy producer The Delek Group, was also a notable contributor. |
Describe recent portfolio activity.
| • | | The investment adviser has positioned the portfolio for a positive oil price environment on the belief that the supply-and-demand backdrop will continue to improve. Accordingly, the investment adviser increased exposure to U.S. onshore oil-services companies by initiating a position in Precision Drilling Corp. These moves were funded by taking profits in certain E&P stocks that performed well in 2016, including Cimarex Energy and Oil Search Ltd. Later in the period, the Fund used the pull-back in the energy sector to increase the portfolio’s beta (risk exposure) somewhat based on the positive fundamentals in the oil market. |
Describe portfolio positioning at period end.
| • | | Relative to the MSCI World Small and Mid-Cap Energy Index, the Fund closed the period with an overweight in E&Ps and underweights in the refining & marketing and oil services sub-sectors, based on the belief that the former is better positioned to benefit from rising oil prices. With that said, the investment adviser remains cognizant of near-term risks and is therefore maintaining a high-quality bias in the portfolio. |
The views expressed reflect the opinions of BlackRock as of the date of this report and are subject to change based on changes in market, economic or other conditions. These views are not intended to be a forecast of future events and are no guarantee of future results.
| | | | | |
| Ten Largest Holdings | | Percent of
Net Assets |
Encana Corp. | | | | 7 | % |
Cimarex Energy Co. | | | | 6 | |
Marathon Oil Corp. | | | | 6 | |
EQT Corp. | | | | 5 | |
TransCanada Corp. | | | | 5 | |
Cabot Oil & Gas Corp. | | | | 5 | |
Baker Hughes, Inc. | | | | 4 | |
Concho Resources, Inc. | | | | 4 | |
Pioneer Natural Resources Co. | | | | 4 | |
Devon Energy Corp. | | | | 4 | |
| | | | | |
| Industry Allocation | | Percent of
Net Assets |
Oil, Gas & Consumable Fuels | | | | 88 | % |
Energy Equipment & Services | | | | 16 | |
Short-Term Securities | | | | 1 | |
Liabilities in Excess of Other Assets | | | | (5 | ) |
| | | For Fund compliance purposes, the Fund’s industry classifications refer to one or more of the industry sub-classifications used by one or more widely recognized market indexes or ratings group indexes, and/or as defined by the investment adviser. These definitions may not apply for purposes of this report, which may combine such industry sub-classifications for reporting ease. |
| | | | | | |
| 8 | | BLACKROCK FUNDS | | MARCH 31, 2017 | | |
| | |
| | | BlackRock Energy & Resources Portfolio |
|
| Total Return Based on a $10,000 Investment |
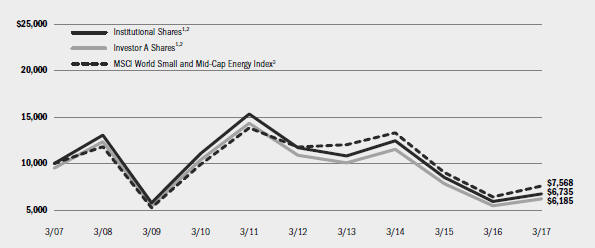
| | 1 | Assuming maximum sales charges, if any, transaction costs and other operating expenses, including investment advisory fees and administration fees, if any. Institutional Shares do not have a sales charge. |
| | 2 | Under normal conditions, the Fund invests at least 80% of its total assets in equity securities of global energy and natural resources companies and companies in associated businesses, as well as utilities (such as gas, water, cable, electrical and telecommunications utilities). |
| | 3 | An index comprised of the energy sector constituents of the MSCI World SMID Index, a free float-adjusted market capitalization weighted index designed to measure the equity market performance of the mid and small cap developed market. |
|
| Performance Summary for the Period Ended March 31, 2017 |
| | | | | | | | | | | | | | | | | | | | | | | | | | | | | | | | | | | |
| | | | | Average Annual Total Returns4 |
| | | | | 1 Year | | 5 Years | | 10 Years |
| | | 6-Month
Total Returns | | w/o sales
charge | | w/ sales
charge | | w/o sales
charge | | w/ sales
charge | | w/o sales
charge | | w/ sales
charge |
Institutional | | | | (3.16 | )% | | | | 14.10 | % | | | | N/A | | | | | (10.41 | )% | | | | N/A | | | | | (3.88 | )% | | | | N/A | |
Investor A | | | | (3.26 | ) | | | | 13.77 | | | | | 7.79 | % | | | | (10.68 | ) | | | | (11.63 | )% | | | | (4.18 | ) | | | | (4.69 | )% |
Investor B | | | | (3.67 | ) | | | | 12.92 | | | | | 8.42 | | | | | (11.35 | ) | | | | (11.70 | ) | | | | (4.76 | ) | | | | (4.76 | ) |
Investor C | | | | (3.63 | ) | | | | 12.95 | | | | | 11.95 | | | | | (11.34 | ) | | | | (11.34 | ) | | | | (4.88 | ) | �� | | | (4.88 | ) |
MSCI World Small and Mid-Cap Energy Index | | | | (0.75 | ) | | | | 17.94 | | | | | N/A | | | | | (8.43 | ) | | | | N/A | | | | | (2.75 | ) | | | | N/A | |
| | 4 | | Assuming maximum sales charges, if any. Average annual total returns with and without sales charges reflect reductions for distribution and service fees. See “About Fund Performance” on page 10 for a detailed description of share classes, including any related sales charges and fees. |
| | | | N/A—Not applicable as share class and index do not have a sales charge. |
| | | | Past performance is not indicative of future results |
| | | | Performance results may include adjustments made for financial reporting purposes in accordance with U.S. generally accepted accounting principles. |
| | | | | | | | | | | | | | | | | | | | | | | | | | | | | | | | | | | |
| | | Actual | | Hypothetical6 | | |
| | | Beginning
Account Value
October 1, 2016 | | Ending
Account Value
March 31, 2017 | | Expenses Paid
During the Period5 | | Beginning
Account Value
October 1, 2016 | | Ending
Account Value
March 31, 2017 | | Expenses Paid
During the Period5 | | Annualized
Expense
Ratio |
Institutional | | | $ | 1,000.00 | | | | $ | 1,086.40 | | | | $ | 5.29 | | | | $ | 1,000.00 | | | | $ | 1,019.79 | | | | $ | 5.12 | | | | | 1.02 | % |
Investor A | | | $ | 1,000.00 | | | | $ | 1,087.90 | | | | $ | 6.90 | | | | $ | 1,000.00 | | | | $ | 1,018.25 | | | | $ | 6.67 | | | | | 1.33 | % |
Investor B | | | $ | 1,000.00 | | | | $ | 963.30 | | | | $ | 10.01 | | | | $ | 1,000.00 | | | | $ | 1,014.67 | | | | $ | 10.27 | | | | | 2.05 | % |
Investor C | | | $ | 1,000.00 | | | | $ | 1,080.80 | | | | $ | 10.61 | | | | $ | 1,000.00 | | | | $ | 1,014.67 | | | | $ | 10.27 | | | | | 2.05 | % |
| | 5 | | For each class of the Fund, expenses are equal to the annualized expense ratio for the class, multiplied by the average account value over the period, multiplied by 182/365 (to reflect the one-half year period shown). |
| | 6 | | Hypothetical 5% annual return before expenses is calculated by prorating the number of days in the most recent fiscal half year divided by 365. |
| | | | See “Disclosure of Expenses” on page 11 for further information on how expenses were calculated. |
| | | | | | |
| | | BLACKROCK FUNDS | | MARCH 31, 2017 | | 9 |
| • | | Institutional Shares are not subject to any sales charge. These shares bear no ongoing distribution or service fees and are available only to certain eligible investors. |
| • | | Service Shares (available only in All-Cap Energy & Resources Portfolio) are not subject to any sales charge. These shares are subject to a service fee of 0.25% per year (but no distribution fee) and are only available to certain eligible investors. |
| • | | Investor A Shares are subject to a maximum initial sales charge (front-end load) of 5.25% and a service fee of 0.25% per year (but no distribution fee). Certain redemptions of these shares may be subject to a contingent deferred sales charge (“CDSC”) where no initial sales charge was paid at the time of purchase. These shares are generally available through financial intermediaries. |
| • | | Investor B Shares (available only in All-Cap Energy & Resources Portfolio and Energy & Resources Portfolio) are subject to a maximum CDSC of 4.50%, declining to 0% after six years. In addition, these shares are subject to a distribution fee of 0.75% per year and a service fee of 0.25% per year. These shares automatically convert to Investor A Shares after approximately eight years. (There is no initial sales charge for automatic share conversions.) All returns for periods greater than eight years reflect this conversion. These shares are only available through exchanges and dividend reinvestments by current holders and for purchase by certain employer-sponsored retirement plans. |
| • | | Investor C Shares are subject to a 1.00% CDSC if redeemed within one year of purchase. In addition, these shares are subject to a distribution fee of 0.75% per year and a service fee of 0.25% per year. These shares are generally available through financial intermediaries. |
Performance information reflects past performance and does not guarantee future results. Current performance may be lower or higher than the performance data quoted. Refer to www.blackrock.com/funds to obtain performance data current to the most recent month end. Performance results do not reflect the deduction of taxes that a shareholder would pay on Fund distributions or the redemption of Fund shares. Figures shown in the performance tables on the previous pages assume reinvestment of all distributions, if any, at net asset value (“NAV”) on the ex-dividend date. Investment return and principal value of shares will fluctuate so that shares, when redeemed, may be worth more or less than their original cost. Distributions paid to each class of shares will vary because of the different levels of service, distribution and transfer agency fees applicable to each class, which are deducted from the income available to be paid to shareholders.
BlackRock Advisors, LLC (the “Manager”), each Fund’s investment adviser, has contractually agreed to waive and/or reimburse a portion of the Funds’ expenses. Without such waiver and/or reimbursement, the Funds’ performance would have been lower. The Manager is under no obligation to continue waiving and/or reimbursing its fees after the applicable termination date of such agreement. See Note 6 of the Notes to Financial Statements for additional information on waivers and/or reimbursements.
The Manager has voluntarily waived and/or reimbursed a portion of the expenses of each fund. Without such waiver and/or reimbursement, each such Fund’s performance would have been lower. The Manager is under no obligation to waive and/or reimburse or to continue waiving and/or reimbursing its fees and such voluntary waiver may be reduced or discontinued at any time. See Note 6 of the Notes to Financial Statements for additional information on waivers and/or reimbursements.
| | | | | | |
| 10 | | BLACKROCK FUNDS | | MARCH 31, 2017 | | |
Shareholders of the Funds may incur the following charges: (a) transactional expenses, such as sales charges; and (b) operating expenses, including investment advisory fees, administration fees, service and distribution fees, including 12b-1 fees, acquired fund fees and expenses, and other fund expenses. The expense examples on the previous pages (which are based on a hypothetical investment of $1,000 invested on October 1, 2016 and held through March 31, 2017) are intended to assist shareholders both in calculating expenses based on an investment in each Fund and in comparing these expenses with similar costs of investing in other mutual funds.
The expense examples provide information about actual account values and actual expenses. In order to estimate the expenses a shareholder paid during the period covered by this report, shareholders can divide their account value by $1,000 and then multiply the result by the number corresponding to their Fund and share class under the headings entitled “Expenses Paid During the Period.”
The expense examples also provide information about hypothetical account values and hypothetical expenses based on a Fund’s actual expense ratio and an assumed rate of return of 5% per year before expenses. In order to assist shareholders in comparing the ongoing expenses of investing in these Funds and other funds, compare the 5% hypothetical examples with the 5% hypothetical examples that appear in shareholder reports of other funds.
The expenses shown in the expense examples are intended to highlight shareholders’ ongoing costs only and do not reflect transactional expenses, such as sales charges, if any. Therefore, the hypothetical examples are useful in comparing ongoing expenses only, and will not help shareholders determine the relative total expenses of owning different funds. If these transactional expenses were included, shareholder expenses would have been higher.
|
| Derivative Financial Instruments |
The Funds may invest in various derivative financial instruments. These instruments are used to obtain exposure to a security, commodity, index, market and/or other asset without owning or taking physical custody of securities, commodities and/or other referenced assets or to manage market, equity, credit, interest rate, foreign currency exchange rate, commodity and/or other risks. Derivative financial instruments may give rise to a form of economic leverage and involve risks, including the imperfect correlation between the value of a derivative financial instrument and the underlying asset, possible default of the counterparty to the transaction
or illiquidity of the instrument. The Funds’ successful use of a derivative financial instrument depends on the investment adviser’s ability to predict pertinent market movements accurately, which cannot be assured. The use of these instruments may result in losses greater than if they had not been used, may limit the amount of appreciation a Fund can realize on an investment and/or may result in lower distributions paid to shareholders. The Funds’ investments in these instruments, if any, are discussed in detail in the Notes to Financial Statements.
| | | | | | |
| | | BLACKROCK FUNDS | | MARCH 31, 2017 | | 11 |
| | | | |
| Schedule of Investments March 31, 2017 (Unaudited) | | | BlackRock All-Cap Energy & Resources Portfolio | |
| | | (Percentages shown are based on Net Assets) | |
| | | | | | | | |
| Common Stocks | | Shares | | | Value | |
Energy Equipment & Services — 12.6% | | | | | | | | |
Baker Hughes, Inc. | | | 63,866 | | | $ | 3,820,464 | |
Halliburton Co. | | | 74,500 | | | | 3,666,145 | |
Precision Drilling Corp. (a) | | | 178,460 | | | | 844,090 | |
Schlumberger Ltd. | | | 47,141 | | | | 3,681,712 | |
Superior Energy Services, Inc. (a) | | | 119,300 | | | | 1,701,218 | |
| | | | | | | | |
| | | | | | | | 13,713,629 | |
Oil, Gas & Consumable Fuels — 87.3% | | | | | | | | |
Anadarko Petroleum Corp. | | | 70,421 | | | | 4,366,102 | |
BP PLC | | | 1,198,198 | | | | 6,896,953 | |
Cabot Oil & Gas Corp. | | | 68,066 | | | | 1,627,458 | |
Cairn Energy PLC (a) | | | 416,978 | | | | 1,069,739 | |
Chevron Corp. | | | 48,797 | | | | 5,239,334 | |
Cimarex Energy Co. | | | 25,262 | | | | 3,018,556 | |
ConocoPhillips | | | 116,369 | | | | 5,803,322 | |
Devon Energy Corp. | | | 70,945 | | | | 2,959,825 | |
Enbridge, Inc. | | | 51,773 | | | | 2,168,872 | |
Encana Corp. | | | 239,892 | | | | 2,810,480 | |
Eni SpA | | | 142,496 | | | | 2,333,136 | |
EOG Resources, Inc. | | | 56,316 | | | | 5,493,626 | |
EQT Corp. | | | 27,617 | | | | 1,687,399 | |
Exxon Mobil Corp. | | | 129,852 | | | | 10,649,163 | |
Hess Corp. | | | 57,967 | | | | 2,794,589 | |
Kosmos Energy, Ltd. (a) | | | 180,417 | | | | 1,201,577 | |
Lundin Petroleum AB (a) | | | 32,167 | | | | 652,868 | |
Marathon Oil Corp. | | | 169,966 | | | | 2,685,463 | |
| | | | | | | | |
| Common Stocks | | Shares | | | Value | |
Oil, Gas & Consumable Fuels (continued) | | | | | | | | |
Noble Energy, Inc. | | | 69,502 | | | $ | 2,386,699 | |
Occidental Petroleum Corp. | | | 16,993 | | | | 1,076,676 | |
Oil Search Ltd. | | | 344,737 | | | | 1,900,692 | |
Phillips 66 | | | 13,495 | | | | 1,069,074 | |
Pioneer Natural Resources Co. | | | 21,314 | | | | 3,969,306 | |
Royal Dutch Shell PLC, Class A | | | 500,530 | | | | 13,193,078 | |
Tesoro Corp. | | | 19,598 | | | | 1,588,614 | |
TransCanada Corp. | | | 77,180 | | | | 3,561,707 | |
Valero Energy Corp. | | | 37,284 | | | | 2,471,556 | |
| | | | | | | | |
| | | | | | | | 94,675,864 | |
Total Long-Term Investments (Cost — $94,723,508) — 99.9% | | | | | | | 108,389,493 | |
| | | | | | | | |
| Short-Term Securities | | | | | | |
BlackRock Liquidity Funds, T-Fund,
Institutional Class, 0.60% (b)(c) | | | 443,067 | | | | 443,067 | |
Total Short-Term Securities (Cost — $443,067) — 0.4% | | | | 443,067 | |
Total Investments (Cost — $95,166,575) — 100.3% | | | | | | | 108,832,560 | |
Liabilities in Excess of Other Assets — (0.3)% | | | | | | | (332,793 | ) |
| | | | | | | | |
Net Assets — 100.0% | | | | | | $ | 108,499,767 | |
| | | | | | | | |
|
| Notes to Schedule of Investments |
| (a) | Non-income producing security. |
| (b) | During the six months ended March 31, 2017, investments in issuers considered to be an affiliate of the Fund for purposes of Section 2(a)(3) of the Investment Company Act of 1940, as amended, were as follows: |
| | | | | | | | | | | | | | | | | | | | | | | | | | | | | | | | | | | |
| Affiliate | | Shares
Held at
September 30,
2016 | | Net Activity | | Shares
Held at
March 31,
2017 | | Value at
March 31,
2017 | | Income | | Realized
Gain1 | | Chang in
Unrealized
Appreciation
(Depreciation) |
BlackRock Liquidity Funds, T-Fund, Institutional Class | | | | 154,227 | | | | | 288,840 | | | | | 443,067 | | | | | $443,067 | | | | $ | 1,456 | | | | | $7 | | | | | — | |
| | 1 | | Includes net capital gain distributions. |
| (c) | Current yield as of period end. |
| | | | | | | | |
| Portfolio Abbreviations | | | | |
| ADR | | American Depositary Receipts | | USD | | U.S. Dollar | | |
| GDR | | Global Depositary Receipts | | ZAR | | South African Rand | | |
| NVDR | | Non-Voting Depository Receipts | | | | | | |
See Notes to Financial Statements.
| | | | | | |
| 12 | | BLACKROCK FUNDS | | MARCH 31, 2017 | | |
| | | | |
| Schedule of Investments (concluded) | | | BlackRock All-Cap Energy & Resources Portfolio | |
| • | | For Fund compliance purposes, the Fund’s industry classifications refer to one or more of the industry sub-classifications used by one or more widely recognized market indexes or ratings group indexes, and/or as defined by the investment adviser. These definitions may not apply for purposes of this report, which may combine such industry sub-classifications for reporting ease. |
|
| Fair Value Hierarchy as of Period End |
Various inputs are used in determining the fair value of investments. For information about the Fund’s policy regarding valuation of investments, refer to the Notes to Financial Statements.
The following table summarizes the Fund’s investments categorized in the disclosure hierarchy:
| | | | | | | | | | | | | | | | |
| | | Level 1 | | | Level 2 | | | Level 3 | | | Total | |
Assets: | | | | | | | | | | | | | | | | |
Investments: | | | | | | | | | | | | | | | | |
Long-Term Investments: | | | | | | | | | | | | | | | | |
Common Stocks: | | | | | | | | | | | | | | | | |
Energy Equipment & Services | | $ | 13,713,629 | | | | — | | | | — | | | $ | 13,713,629 | |
Oil, Gas & Consumable Fuels | | | 68,629,398 | | | $ | 26,046,466 | | | | — | | | | 94,675,864 | |
Short-Term Securities. | | | 443,067 | | | | — | | | | — | | | | 443,067 | |
| | | | |
Total | | $ | 82,786,094 | | | $ | 26,046,466 | | | | — | | | $ | 108,832,560 | |
| | | | |
During the six months ended March 31, 2017, there were no transfers between levels.
See Notes to Financial Statements.
| | | | | | |
| | | BLACKROCK FUNDS | | MARCH 31, 2017 | | 13 |
| | | | |
| Schedule of Investments March 31, 2017 (Unaudited) | | | BlackRock Emerging Markets Dividend Fund | |
| | | (Percentages shown are based on Net Assets) | |
| | | | | | | | |
| Common Stocks | | Shares | | | Value | |
Brazil — 9.3% | | | | | | | | |
AES Tiete Energia SA | | | 7,523 | | | $ | 6,536 | |
AES Tiete Energia SA | | | 3,311 | | | | 14,479 | |
AES Tiete Energia SA, Preference | | | 30,152 | | | | 26,294 | |
BB Seguridade Participacoes SA | | | 10,411 | | | | 97,505 | |
EcoRodovias Infraestrutura e Logistica SA | | | 51,823 | | | | 149,149 | |
Hypermarcas SA | | | 15,693 | | | | 145,370 | |
Itau Unibanco Holding SA — ADR | | | 11,374 | | | | 137,284 | |
Kroton Educacional SA | | | 20,834 | | | | 88,311 | |
Qualicorp SA | | | 7,835 | | | | 49,704 | |
| | | | | | | | |
| | | | | | | | 714,632 | |
China — 13.8% | | | | | | | | |
Anhui Conch Cement Co. Ltd., H Shares | | | 25,500 | | | | 86,727 | |
ANTA Sports Products Ltd. | | | 48,000 | | | | 132,801 | |
China Construction Bank Corp., H Shares | | | 163,000 | | | | 131,330 | |
China Machinery Engineering Corp., H Shares | | | 108,000 | | | | 79,242 | |
China Mobile Ltd. | | | 18,000 | | | | 197,955 | |
CSPC Pharmaceutical Group Ltd. | | | 60,000 | | | | 78,607 | |
Industrial & Commercial Bank of China Ltd., H Shares | | | 141,000 | | | | 92,263 | |
Jiangsu Expressway Co. Ltd., H Shares | | | 74,000 | | | | 106,302 | |
NetEase, Inc. — ADR | | | 366 | | | | 103,944 | |
Silergy Corp. | | | 3,000 | | | | 55,358 | |
| | | | | | | | |
| | | | | | | | 1,064,529 | |
Hong Kong — 3.7% | | | | | | | | |
AIA Group Ltd. | | | 16,800 | | | | 106,041 | |
Sino Biopharmaceutical Ltd. | | | 101,000 | | | | 83,174 | |
Tongda Group Holdings Ltd. | | | 270,000 | | | | 95,312 | |
| | | | | | | | |
| | | | | | | | 284,527 | |
Hungary — 1.0% | | | | | | | | |
Richter Gedeon Nyrt | | | 3,282 | | | | 74,540 | |
India — 14.1% | | | | | | | | |
Ambuja Cements Ltd. | | | 31,363 | | | | 114,327 | |
Bharat Petroleum Corp. Ltd. | | | 10,424 | | | | 104,332 | |
Biocon Ltd. | | | 4,213 | | | | 73,469 | |
Housing Development Finance Corp. Ltd. | | | 4,976 | | | | 115,122 | |
Indiabulls Housing Finance Ltd. | | | 11,974 | | | | 183,977 | |
InterGlobe Aviation Ltd. (a) | | | 4,868 | | | | 78,829 | |
NTPC Ltd. | | | 71,861 | | | | 183,734 | |
Sun TV Network Ltd. | �� | | 12,873 | | | | 156,733 | |
Tata Consultancy Services Ltd. | | | 1,906 | | | | 71,378 | |
| | | | | | | | |
| | | | | | | | 1,081,901 | |
Indonesia — 2.0% | | | | | | | | |
Bank Negara Indonesia Persero Tbk PT | | | 202,000 | | | | 98,208 | |
Media Nusantara Citra Tbk PT | | | 403,324 | | | | 55,971 | |
| | | | | | | | |
| | | | | | | | 154,179 | |
Jersey — 1.4% | | | | | | | | |
Centamin PLC | | | 49,378 | | | | 106,818 | |
Luxembourg — 1.2% | | | | | | | | |
Ternium SA — ADR | | | 3,437 | | | | 89,774 | |
Mexico — 2.9% | | | | | | | | |
Grupo Aeroportuario del Pacifico SAB de CV, Class B | | | 8,868 | | | | 86,121 | |
Grupo Aeroportuario del Sureste SAB de CV — ADR | | | 790 | | | | 136,860 | |
| | | | | | | | |
| | | | | | | | 222,981 | |
| | | | | | | | |
| Common Stocks | | Shares | | | Value | |
Peru — 1.7% | | | | | | | | |
Credicorp Ltd. | | | 803 | | | $ | 131,130 | |
Poland — 2.2% | | | | | | | | |
Powszechny Zaklad Ubezpieczen SA | | | 19,518 | | | | 171,163 | |
Russia — 5.0% | | | | | | | | |
Inter RAO UES PJSC | | | 32,132 | | | | 2,291 | |
LUKOIL PJSC — ADR | | | 1,806 | | | | 95,736 | |
Mobile TeleSystems PJSC — ADR | | | 9,021 | | | | 99,502 | |
NovaTek PJSC — GDR | | | 1,476 | | | | 184,052 | |
| | | | | | | | |
| | | | | | | | 381,581 | |
Singapore — 1.3% | | | | | | | | |
Jardine Cycle & Carriage Ltd. | | | 3,300 | | | | 103,362 | |
South Africa — 3.1% | | | | | | | | |
Mr Price Group Ltd. | | | 6,674 | | | | 79,442 | |
Sanlam Ltd. | | | 17,172 | | | | 86,165 | |
SPAR Group Ltd. | | | 5,769 | | | | 74,845 | |
| | | | | | | | |
| | | | | | | | 240,452 | |
South Korea — 6.1% | | | | | | | | |
Hyundai Marine & Fire Insurance Co. Ltd. | | | 3,699 | | | | 115,776 | |
KT&G Corp. | | | 2,417 | | | | 210,728 | |
Samsung Life Insurance Co. Ltd. | | | 556 | | | | 53,936 | |
Shinhan Financial Group Co. Ltd. | | | 2,068 | | | | 86,168 | |
| | | | | | | | |
| | | | | | | | 466,608 | |
Taiwan — 11.9% | | | | | | | | |
Bizlink Holding, Inc. | | | 19,000 | | | | 108,005 | |
Far EasTone Telecommunications Co. Ltd. | | | 16,000 | | | | 39,284 | |
Lite-On Technology Corp. | | | 65,215 | | | | 112,408 | |
Mega Financial Holding Co. Ltd. | | | 85,000 | | | | 68,589 | |
Primax Electronics Ltd. | | | 68,000 | | | | 111,511 | |
Silicon Motion Technology Corp. — ADR | | | 1,982 | | | | 92,659 | |
Taiwan Semiconductor Manufacturing Co. Ltd. | | | 12,000 | | | | 75,248 | |
Taiwan Semiconductor Manufacturing Co. Ltd. — ADR | | | 8,165 | | | | 268,139 | |
TSRC Corp. | | | 31,000 | | | | 35,709 | |
| | | | | | | | |
| | | | | | | | 911,552 | |
Thailand — 5.9% | | | | | | | | |
Advanced Info Service PCL — NVDR | | | 25,900 | | | | 134,163 | |
Land & Houses PCL — NVDR | | | 272,000 | | | | 77,171 | |
PTT PCL — NVDR | | | 8,400 | | | | 94,600 | |
Siam Commercial Bank PCL — NVDR | | | 32,000 | | | | 151,805 | |
| | | | | | | | |
| | | | | | | | 457,739 | |
Turkey — 1.1% | | | | | | | | |
Tupras Turkiye Petrol Rafinerileri A/S | | | 3,293 | | | | 81,812 | |
United Arab Emirates — 1.0% | | | | | | | | |
DP World Ltd. | | | 3,573 | | | | 76,820 | |
United Kingdom — 1.0% | | | | | | | | |
Ferrexpo PLC | | | 35,546 | | | | 74,553 | |
Total Common Stocks — 89.7% | | | | | | | 6,890,653 | |
See Notes to Financial Statements.
| | | | | | |
| 14 | | BLACKROCK FUNDS | | MARCH 31, 2017 | | |
| | | | |
| Schedule of Investments (continued) | | | BlackRock Emerging Markets Dividend Fund | |
| | | | | | | | |
Participation Notes (b) | | | Shares | | | | Value | |
China — 3.7% | | | | | | | | |
Deutsche Bank AG (Kweichow Moutai Co., Ltd., Class A),
due 5/22/26 | | | 1,491 | | | $ | 83,617 | |
UBS AG (Hangzhou Hikvision Digital Technology Co., Ltd.,
Class A), due 04/17/17 | | | 26,147 | | | | 121,058 | |
UBS AG (Weifu High-Technology Group Co., Ltd.,
Class A), due 12/22/17 | | | 24,297 | | | | 80,580 | |
Russia — 1.1% | | | | | | | | |
Deutsche Bank AG (Inter RAO UES PJSC), due 01/13/2027 | | | 1,216,364 | | | | 86,717 | |
Total Participation Notes — 4.8% | | | | | | | 371,972 | |
| | | | |
| | | | Value | |
Total Long-Term Investments (Cost — $6,275,292) — 94.5% | | $ | 7,262,625 | |
Total Investments (Cost — $6,275,292) — 94.5% | | | 7,262,625 | |
Other Assets Less Liabilities — 5.5% | | | 423,091 | |
| | | | |
Net Assets — 100.0% | | $ | 7,685,716 | |
| | | | |
|
| Notes to Schedule of Investments |
| (a) | Security exempt from registration pursuant to Rule 144A under the Securities Act of 1933, as amended. These securities may be resold in transactions exempt from registration to qualified institutional investors. |
| (b) | Non-income producing security. |
During the six months ended March 31, 2017, investments in issuers considered to be an affiliate of the Fund for purposes of Section 2(a)(3) of the Investment Company Act of 1940, as amended, were as follows:
| | | | | | | | | | | | | | | | | | | | | | | | | | | | | | | | | | | |
| Affiliate | | Shares
Held at
September 30,
2016 | | Net Activity | | Shares
Held at
March 31,
2017 | | Value at
March 31,
2017 | | Income | | Realized
Gain | | Change in
Unrealized
Appreciation
(Depreciation) |
BlackRock Liquidity Funds, T-Fund, Institutional Class | | | | 54,357 | | | | | (54,357 | ) | | | | — | | | | | — | | | | $ | 31 | | | | | — | | | | | — | |
|
| Derivative Financial Instruments Outstanding as of Period End |
| | | | | | | | | | | | | | | | | | | | | | |
Forward Foreign Currency Exchange Contracts | | | | | | | | |
Currency Purchased | | | | | |
| Currency
Sold |
| | | | | | Counterparty | |
| Settlement
Date |
| |
| Unrealized
Appreciation (Depreciation) |
|
USD | | | 46,891 | | | | ZAR | | | | 697,500 | | | BNP Paribas S.A. | | | 5/11/17 | | | | $(4,729) | |
ZAR | | | 697,500 | | | | USD | | | | 48,853 | | | BNP Paribas S.A. | | | 5/11/17 | | | | 2,767 | |
Total | | | | | | | | | | | | | | | | | | | | | $(1,962) | |
|
| Derivative Financial Instruments Categorized by Risk Exposure |
As of period end, the fair values of derivative financial instruments located in the Statements of Assets and Liabilities were as follows:
| | | | | | | | | | | | | | | | |
| Assets — Derivative Financial Instruments | | Commodity
Contracts | | Credit
Contracts | | Equity
Contracts | | Foreign
Currency
Exchange
Contracts | | Interest
Rate
Contracts | | Other
Contracts | | Total |
Forward foreign currency exchange contracts | | Unrealized appreciation on
forward foreign currency exchange contracts | | — | | — | | — | | $2,767 | | — | | — | | $2,767 |
| | | | | | | | |
| Liabilities — Derivative Financial Instruments | | | | | | | | | | | | | | |
Forward foreign currency exchange contracts | | Unrealized depreciation on forward foreign currency exchange contracts | | — | | — | | — | | $4,729 | | — | | — | | $4,729 |
See Notes to Financial Statements.
| | | | | | |
| | | BLACKROCK FUNDS | | MARCH 31, 2017 | | 15 |
| | | | |
| Schedule of Investments (continued) | | | BlackRock Emerging Markets Dividend Fund | |
For the six months ended March 31, 2017, the effect of derivative financial instruments in the Statements of Operations was as follows:
| | | | | | | | | | | | | | | | | | | | | | | | | | | | | | | | | | | |
| Net Realized Gain (Loss) from: | | Commodity
Contracts | | Credit
Contracts | | Equity
Contracts | | Foreign
Currency
Exchange
Contracts | | Interest
Rate
Contracts | | Other
Contracts | | Total |
Forward foreign currency exchange contracts | | | | — | | | | | — | | | | | — | | | | $ | 3,964 | | | | | — | | | | | — | | | | $ | 3,964 | |
| | | | | | | |
Net Change in Unrealized Appreciation (Depreciation) on: | | | | | | | | | | | | | | | | | | | | | | | | | | | | | | | | | | | |
Forward foreign currency exchange contracts | | | | — | | | | | — | | | | | — | | | | $ | (420 | ) | | | | — | | | | | — | | | | $ | (420 | ) |
|
| Average Quarterly Balances of Outstanding Derivative Financial Instruments |
| | | | |
Forward foreign currency exchange contracts: | | | | |
Average amounts purchased — in USD | | $ | 46,891 | |
Average amounts sold — in USD | | $ | 48,853 | |
For more information about the Fund’s investment risks regarding derivative financial instruments, refer to the Notes to Financial Statements.
|
| Derivative Financial Instruments — Offsetting as of Period End |
The Fund’s derivative assets and liabilities (by type) were as follows:
| | | | | | | | |
| | | Assets | | | Liabilities | |
Derivative Financial Instruments: | | | | | | | | |
Forward foreign currency exchange contracts | | | $2,767 | | | | $4,729 | |
| | | | |
Total derivative assets and liabilities in the Statements of Assets and Liabilities | | | $2,767 | | | | $4,729 | |
Derivatives not subject to a Master Netting Agreement or similar agreement (“MNA”) | | | — | | | | — | |
| | | | |
Total derivative assets and liabilities subject to an MNA | | | $2,767 | | | | $4,729 | |
| | | | |
The following tables present the Fund’s derivative assets and liabilities by counterparty net of amounts available for offset under an MNA and net of the related collateral pledged by Fund:
| | | | | | | | | | | | | | | | | | | | | | | | | | | |
| Counterparty | | | | Derivative Assets
Subject to an MNA by
Counterparty | | Derivatives Available
for Offset1 | | Non-cash
Collateral
Received | | Cash
Collateral
Received | | Net Amount of
Derivative Assets |
BNP Paribas S.A. | | | | | $ | 2,767 | | | | $ | (2,767 | ) | | | | — | | | | | — | | | | | — | |
| | | |
| | | | | | | | | | | | | | | | | | | | | | | | | | | |
| Counterparty | | | | Derivative Liabilities
Subject to an MNA by
Counterparty | | Derivatives Available
for Offset | | Non-cash
Collateral
Pledged | | Cash
Collateral
Pledged | | Net Amount of
Derivative Liabilities2 |
BNP Paribas S.A. | | | | | $ | 4,729 | | | | $ | (2,767 | ) | | | | — | | | | | — | | | | $ | 1,962 | |
| | | |
| | 1 | | The amount of derivatives available for offset is limited to the amount of derivative assets and/or liabilities that are subject to an MNA. |
| | 2 | | Net amount represents the net amount payable due to the counterparty in the event of default. |
See Notes to Financial Statements.
| | | | | | |
| 16 | | BLACKROCK FUNDS | | MARCH 31, 2017 | | |
| | | | |
| Schedule of Investments (concluded) | | | BlackRock Emerging Markets Dividend Fund | |
|
| Fair Value Hierarchy as of Period End |
Various inputs are used in determining the fair value of investments and derivative financial instruments. For information about the Fund’s policy regarding valuation of investments and derivative financial instruments, refer to the Notes to Financial Statements.
The following tables summarize the Fund’s investments and derivative financial instruments categorized in the disclosure hierarchy:
| | | | | | | | | | | | | | | | |
| | | Level 1 | | | Level 2 | | | Level 3 | | | Total | |
Assets: | | | | | | | | | | | | | | | | |
Investments: | | | | | | | | | | | | | | | | |
Long-Term Investments: | | | | | | | | | | | | | | | | |
Common Stocks: | | | | | | | | | | | | | | | | |
Brazil | | $ | 714,632 | | | | — | | | | — | | | $ | 714,632 | |
China | | | 103,944 | | | $ | 960,585 | | | | — | | | | 1,064,529 | |
Hong Kong | | | — | | | | 284,527 | | | | — | | | | 284,527 | |
Hungary | | | — | | | | 74,540 | | | | — | | | | 74,540 | |
India | | | — | | | | 1,081,901 | | | | — | | | | 1,081,901 | |
Indonesia | | | — | | | | 154,179 | | | | — | | | | 154,179 | |
Jersey | | | — | | | | 106,818 | | | | — | | | | 106,818 | |
Luxembourg | | | 89,774 | | | | — | | | | — | | | | 89,774 | |
Mexico | | | 222,981 | | | | — | | | | — | | | | 222,981 | |
Peru | | | 131,130 | | | | — | | | | — | | | | 131,130 | |
Poland | | | — | | | | 171,163 | | | | — | | | | 171,163 | |
Russia | | | 99,502 | | | | 282,079 | | | | — | | | | 381,581 | |
Singapore | | | — | | | | 103,362 | | | | — | | | | 103,362 | |
South Africa | | | — | | | | 240,452 | | | | — | | | | 240,452 | |
South Korea | | | 210,728 | | | | 255,880 | | | | — | | | | 466,608 | |
Taiwan | | | 360,798 | | | | 550,754 | | | | — | | | | 911,552 | |
Thailand | | | — | | | | 457,739 | | | | — | | | | 457,739 | |
Turkey | | | — | | | | 81,812 | | | | — | | | | 81,812 | |
United Arab Emirates | | | 76,820 | | | | — | | | | — | | | | 76,820 | |
United Kingdom | | | — | | | | 74,553 | | | | — | | | | 74,553 | |
Participation Notes: | | | | | | | | | | | | | | | | |
China | | | 80,580 | | | | 204,675 | | | | — | | | | 285,255 | |
Russia | | | 86,717 | | | | — | | | | — | | | | 86,717 | |
| | | | |
Total | | $ | 2,177,606 | | | $ | 5,085,019 | | | | — | | | $ | 7,262,625 | |
| | | | |
| | | | | | | | | | | | | | | | |
Derivative Financial Instruments1 | | | | | | | | | | | | | | | | |
Assets: | | | | | | | | | | | | | | | | |
Foreign currency exchange contracts | | | — | | | $ | 2,767 | | | | — | | | $ | 2,767 | |
Liabilities: | | | | | | | | | | | | | | | | |
Foreign currency exchange contracts | | | — | | | | (4,729 | ) | | | — | | | | (4,729 | ) |
| | | | |
Total | | | — | | | $ | (1,962 | ) | | | — | | | $ | (1,962 | ) |
| | | | |
| |
1 Derivative financial instruments are forward foreign currency exchange contracts. Forward foreign currency exchange contracts are valued at the unrealized appreciation (depreciation) on the instrument. | | | | | |
| | | | | | | | | | | | | | | | |
Transfers between Level 1 and Level 2 were as follows: | | | | | | | | | | | | | | | | |
| | | | | | | | | | | | | | | | |
| | | Transfers into
Level 11 | | | Transfers out
of Level 12 | | | Transfers into
Level 22 | | | Transfers out
of Level 21 | |
Assets: | | | | | | | | | | | | | | | | |
Long-Term Investments: | | | | | | | | | | | | | | | | |
South Africa | | | — | | | $ | (56,185 | ) | | $ | 56,185 | | | | — | |
South Korea | | $ | 144,285 | | | | — | | | | — | | | $ | (144,285 | ) |
| | | | |
Total | | $ | 144,285 | | | $ | (56,185 | ) | | $ | 56,185 | | | $ | (144,285 | ) |
| | | | |
| | 1 | | Systematic Fair Value Prices were not utilized at period end for these investments. |
| | 2 | | External pricing service used to reflect any significant market movements between the time the Trust valued such foreign securities and the earlier closing of foreign markets. |
See Notes to Financial Statements.
| | | | | | |
| | | BLACKROCK FUNDS | | MARCH 31, 2017 | | 17 |
| | | | |
| Schedule of Investments March 31, 2017 (Unaudited) | | | BlackRock Energy & Resources Portfolio | |
| | | (Percentages shown are based on Net Assets) | |
| | | | | | | | |
| Common Stocks | | Shares | | | Value | |
Energy Equipment & Services — 16.4% | | | | | | | | |
Baker Hughes, Inc. | | | 178,650 | | | $ | 10,686,843 | |
Helmerich & Payne, Inc. | | | 53,850 | | | | 3,584,794 | |
Nabors Industries, Ltd. | | | 322,700 | | | | 4,217,689 | |
Patterson-UTI Energy, Inc. | | | 179,050 | | | | 4,345,544 | |
Poseidon Concepts Corp. (a) | | | 35,081 | | | | 18 | |
Precision Drilling Corp. (a) | | | 889,465 | | | | 4,207,042 | |
Superior Energy Services, Inc. (a) | | | 473,507 | | | | 6,752,210 | |
Tenaris SA | | | 349,600 | | | | 6,045,429 | |
| | | | | | | | |
| | | | | | | | 39,839,569 | |
Oil, Gas & Consumable Fuels — 88.1% | | | | | | | | |
AltaGas Ltd. | | | 116,500 | | | | 2,698,199 | |
Cabot Oil & Gas Corp. | | | 466,280 | | | | 11,148,755 | |
Cairn Energy PLC (a) | | | 3,108,842 | | | | 7,975,599 | |
Carrizo Oil & Gas, Inc. (a) | | | 157,700 | | | | 4,519,682 | |
Cimarex Energy Co. | | | 130,410 | | | | 15,582,691 | |
Concho Resources, Inc. (a) | | | 81,500 | | | | 10,459,710 | |
Devon Energy Corp. | | | 203,890 | | | | 8,506,291 | |
Enbridge, Inc. | | | 166,800 | | | | 6,987,576 | |
Encana Corp. | | | 1,372,050 | | | | 16,074,399 | |
Energen Corp. (a) | | | 77,100 | | | | 4,197,324 | |
EQT Corp. | | | 206,694 | | | | 12,629,003 | |
Gulfport Energy Corp. (a) | | | 274,905 | | | | 4,725,617 | |
Hess Corp. | | | 172,800 | | | | 8,330,688 | |
HollyFrontier Corp. | | | 128,700 | | | | 3,647,358 | |
Ithaca Energy, Inc. (a) | | | 3,057,950 | | | | 4,437,977 | |
Kosmos Energy, Ltd. (a) | | | 990,838 | | | | 6,598,981 | |
Longview Energy Co. (a) | | | 85,400 | | | | 137,494 | |
| | | | | | | | |
| Common Stocks | | Shares | | | Value | |
Oil, Gas & Consumable Fuels (continued) | | | | | | | | |
Lundin Petroleum AB (a) | | | 231,203 | | | $ | 4,692,542 | |
Marathon Oil Corp. | | | 966,750 | | | | 15,274,650 | |
Murphy Oil Corp. | | | 122,850 | | | | 3,512,281 | |
Newfield Exploration Co. (a) | | | 83,850 | | | | 3,094,903 | |
Noble Energy, Inc. | | | 222,120 | | | | 7,627,601 | |
Oil Search Ltd. | | | 1,541,650 | | | | 8,499,816 | |
Painted Pony Petroleum Ltd. (a) | | | 464,100 | | | | 1,877,549 | |
Pioneer Natural Resources Co. | | | 55,127 | | | | 10,266,301 | |
RSP Permian, Inc. (a) | | | 167,462 | | | | 6,937,951 | |
Tesoro Corp. | | | 96,150 | | | | 7,793,919 | |
TransCanada Corp. | | | 245,100 | | | | 11,310,890 | |
Western Refining, Inc. | | | 99,750 | | | | 3,498,232 | |
| | | | | | | | |
| | | | | | | | 213,043,979 | |
Total Long-Term Investments (Cost — $251,665,053) — 104.5% | | | | | | | 252,883,548 | |
| | | | | | | | |
| Short-Term Securities | | | | | | |
BlackRock Liquidity Funds, T-Fund, Institutional
Class, 0.60% (b)(c) | | | 1,108,790 | | | | 1,108,790 | |
Total Short-Term Securities (Cost — $1,108,790) — 0.5% | | | | 1,108,790 | |
Total Investments (Cost — $252,773,843) — 105.0% | | | | | | | 253,992,338 | |
Liabilities in Excess of Other Assets — (5.0)% | | | | | | | (12,102,068 | ) |
| | | | | | | | |
Net Assets — 100.0% | | | | | | $ | 241,890,270 | |
| | | | | | | | |
|
| Notes to Schedule of Investments |
| (a) | Non-income producing security. |
| (b) | During the six months ended March 31, 2017, investments in issuers considered to be affiliates of the Fund for purposes of Section 2(a)(3) of the Investment Company Act of 1940, as amended, were as follows: |
| | | | | | | | | | | | | | | | | | | | | | | | | | | | | | | | | | | |
| Affiliate | | Shares Held at
September 30,
2016 | | Net Activity | | Shares
Held at
March 31,
2017 | | Value at
March 31,
2017 | | Income | | Realized
Gain1 | | Change in
Unrealized
Appreciation
(Depreciation) |
BlackRock Liquidity Funds, T-Fund, Institutional Class | | | | 1,879,285 | | | | | (770,495 | ) | | | | 1,108,790 | | | | $ | 1,108,790 | | | | $ | 3,672 | | | | $ | 20 | | | | | — | |
SL Liquidity Series, LLC, Money Market Series | | | | — | | | | | — | | | | | — | | | | | — | | | | | 1,429 | 2 | | | | — | | | | | — | |
Total | | | | | | | | | | | | | | | | | | $ | 1,108,790 | | | | $ | 5,101 | | | | $ | 20 | | | | | — | |
| | | | | | | | | | | | | | | | | | | | |
| | 1 | | Includes net capital gain distributions. |
| | 2 | | Represents securities lending income earned from the reinvestment of cash collateral from loaned securities, net of fees and collateral investment expenses, and other payments to and from borrowers of securities. |
| (c) | Current yield as of period end. |
See Notes to Financial Statements.
| | | | | | |
| 18 | | BLACKROCK FUNDS | | MARCH 31, 2017 | | |
| | | | |
| Schedule of Investments (concluded) | | | BlackRock Energy & Resources Portfolio | |
| • | | For Fund compliance purposes, the Fund’s industry classifications refer to one or more of the industry sub-classifications used by one or more widely recognized market indexes or ratings group indexes, and/or as defined by the investment adviser. These definitions may not apply for purposes of this report, which may combine such industry sub-classifications for reporting ease. |
|
| Fair Value Hierarchy as of Period End |
Various inputs are used in determining the fair value of investments. For information about the Fund’s policy regarding valuation of investments, refer to the Notes to Financial Statements.
The following table summarizes the Fund’s investments categorized in the disclosure hierarchy:
| | | | | | | | | | | | | | | | |
| | | Level 1 | | | Level 2 | | | Level 3 | | | Total | |
Assets: | | | | | | | | | | | | | | | | |
Investments: | | | | | | | | | | | | | | | | |
Long-Term Investments: | | | | | | | | | | | | | | | | |
Common Stocks: | | | | | | | | | | | | | | | | |
Energy Equipment & Services | | $ | 33,794,122 | | | $ | 6,045,447 | | | | — | | | $ | 39,839,569 | |
Oil, Gas & Consumable Fuels | | | 191,738,528 | | | | 21,167,957 | | | | 137,494 | | | | 213,043,979 | |
Short-Term Securities | | | 1,108,790 | | | | — | | | | — | | | | 1,108,790 | |
| | | | |
Total | | $ | 226,641,440 | | | $ | 27,213,404 | | | | 137,494 | | | $ | 253,992,338 | |
| | | | |
During the six months ended March 31, 2017, there were no transfers between levels.
See Notes to Financial Statements.
| | | | | | |
| | | BLACKROCK FUNDS | | MARCH 31, 2017 | | 19 |
| | | | |
| Statements of Assets and Liabilities | | | | |
| | | | | | | | | | | | |
| March 31, 2017 (Unaudited) | | BlackRock All-Cap Energy &
Resources
Portfolio | | | BlackRock
Emerging
Markets
Dividend
Fund | | | BlackRock
Energy &
Resources
Portfolio | |
| | | | | | | | | | | | |
| Assets | | | | | | | | | | | | |
Investments at value — unaffiliated1 | | $ | 108,389,493 | | | $ | 7,262,625 | | | $ | 252,883,548 | |
Investments at value — affiliated2 | | | 443,067 | | | | — | | | | 1,108,790 | |
Cash | | | — | | | | 205,007 | | | | — | |
Foreign currency at value3 | | | 136,693 | | | | 4,558 | | | | 50,934 | |
Receivables: | | | | | | | | | | | | |
Investments sold | | | — | | | | 96,256 | | | | — | |
Capital shares sold | | | 133,500 | | | | 557,903 | | | | 342,326 | |
Dividends — affiliated | | | 144 | | | | — | | | | 416 | |
Dividends — unaffiliated | | | 83,080 | | | | 20,292 | | | | 128,947 | |
From the Manager | | | 10,239 | | | | 11,614 | | | | 13,433 | |
Unrealized appreciation on forward foreign currency exchange contracts | | | — | | | | 2,767 | | | | — | |
Prepaid expenses | | | 54,678 | | | | 39,183 | | | | 37,574 | |
| | | | |
Total assets | | | 109,250,894 | | | | 8,200,205 | | | | 254,565,968 | |
| | | | |
| | | | | | | | | | | | |
| Liabilities | | | | | | | | | | | | |
Payables: | | | | | | | | | | | | |
Investments purchased | | | — | | | | 330,024 | | | | — | |
Capital shares redeemed | | | 459,108 | | | | 3,090 | | | | 12,100,625 | |
Deferred foreign capital gain tax | | | — | | | | 18,163 | | | | — | |
Investment advisory fees | | | 57,304 | | | | — | | | | 175,199 | |
Officer’s and Trustees’ fees | | | 4,474 | | | | 3,279 | | | | 6,027 | |
Other accrued expenses | | | 42,076 | | | | 47,005 | | | | 51,554 | |
Other affiliates | | | 7,710 | | | | — | | | | 25,713 | |
Professional fees | | | 55,502 | | | | 103,401 | | | | 72,224 | |
Service and distribution fees | | | 38,380 | | | | 1,165 | | | | 61,985 | |
Transfer agent fees | | | 86,573 | | | | 3,633 | | | | 182,371 | |
Unrealized depreciation on forward foreign currency exchange contracts | | | — | | | | 4,729 | | | | — | |
| | | | |
Total liabilities | | | 751,127 | | | | 514,489 | | | | 12,675,698 | |
| | | | |
Net Assets | | $ | 108,499,767 | | | $ | 7,685,716 | | | $ | 241,890,270 | |
| | | | |
| | | | | | | | | | | | |
| Net Assets Consist of | | | | | | | | | | | | |
Paid-in capital | | $ | 183,818,062 | | | $ | 8,223,701 | | | $ | 463,630,836 | |
Undistributed (distributions in excess) net investment income (loss) | | | 366,790 | | | | 12,830 | | | | (381,285 | ) |
Accumulated net realized loss | | | (89,351,655 | ) | | | (1,518,271 | ) | | | (222,578,321 | ) |
Net unrealized appreciation (depreciation) | | | 13,666,570 | | | | 967,456 | | | | 1,219,040 | |
| | | | |
Net Assets | | $ | 108,499,767 | | | $ | 7,685,716 | | | $ | 241,890,270 | |
| | | | |
1 Investments at cost — unaffiliated | | $ | 94,723,508 | | | $ | 6,275,292 | | | $ | 251,665,053 | |
2 Investments at cost — affiliated | | $ | 443,067 | | | | — | | | $ | 1,108,790 | |
3 Foreign currency at cost | | $ | 136,127 | | | $ | 4,558 | | | $ | 51,029 | |
See Notes to Financial Statements.
| | | | | | |
| 20 | | BLACKROCK FUNDS | | MARCH 31, 2017 | | |
| | | | |
| Statements of Assets and Liabilities (concluded) | | | | |
| | | | | | | | | | | | |
| March 31, 2017 (Unaudited) | | BlackRock
All-Cap Energy &
Resources
Portfolio | | | BlackRock
Emerging
Markets
Dividend
Fund | | | BlackRock
Energy &
Resources
Portfolio | |
| | | | | | | | | | | | |
| Net Asset Value | | | | | | | | | | | | |
Institutional | | | | | | | | | | | | |
Net assets | | $ | 24,968,860 | | | $ | 3,771,624 | | | $ | 64,317,527 | |
| | | | |
Shares outstanding1 | | | 2,280,144 | | | | 440,669 | | | | 2,997,790 | |
| | | | |
Net asset value | | $ | 10.95 | | | $ | 8.56 | | | $ | 21.45 | |
| | | | |
Service | | | | | | | | | | | | |
Net assets | | $ | 680,937 | | | | — | | | | — | |
| | | | |
Shares outstanding1 | | | 63,462 | | | | — | | | | — | |
| | | | |
Net asset value | | $ | 10.73 | | | | — | | | | — | |
| | | | |
Investor A | | | | | | | | | | | | |
Net assets | | $ | 53,609,782 | | | $ | 3,247,556 | | | $ | 145,324,194 | |
| | | | |
Shares outstanding1 | | | 5,021,352 | | | | 380,951 | | | | 7,887,083 | |
| | | | |
Net asset value | | $ | 10.68 | | | $ | 8.52 | | | $ | 18.43 | |
| | | | |
Investor B | | | | | | | | | | | | |
Net assets | | $ | 213,263 | | | | — | | | $ | 121,269 | |
| | | | |
Shares outstanding1 | | | 20,474 | | | | — | | | | 9,250 | |
| | | | |
Net asset value | | $ | 10.42 | | | | — | | | $ | 13.11 | |
| | | | |
Investor C | | | | | | | | | | | | |
Net assets | | $ | 29,026,925 | | | $ | 666,536 | | | $ | 32,127,280 | |
| | | | |
Shares outstanding1 | | | 2,846,650 | | | | 79,077 | | | | 2,471,078 | |
| | | | |
Net asset value | | $ | 10.20 | | | $ | 8.43 | | | $ | 13.00 | |
| | | | |
| | 1 | | Unlimited number of shares authorized, $0.001 par value. |
See Notes to Financial Statements.
| | | | | | |
| | | BLACKROCK FUNDS | | MARCH 31, 2017 | | 21 |
| | | | | | | | | | | | |
| Six Months Ended March 31, 2017 (Unaudited) | | BlackRock
All-Cap Energy &
Resources
Portfolio | | | BlackRock
Emerging
Markets
Dividend
Fund | | | BlackRock
Energy &
Resources
Portfolio | |
| | | | | | | | | | | | |
| Investment Income | | | | | | | | | | | | |
Dividends — unaffiliated | | $ | 1,591,999 | | | $ | 63,210 | | | $ | 1,563,280 | |
Dividends — affiliated | | | 1,456 | | | | 31 | | | | 3,672 | |
Securities lending — affiliated — net | | | — | | | | — | | | | 1,429 | |
Foreign taxes withheld | | | (49,545 | ) | | | (4,136 | ) | | | (96,197 | ) |
| | | | |
Total income | | | 1,543,910 | | | | 59,105 | | | | 1,472,184 | |
| | | | |
| | | | | | | | | | | | |
| Expenses | | | | | | | | | | | | |
Investment advisory | | | 436,954 | | | | 26,899 | | | | 1,027,915 | |
Service and distribution — class specific | | | 233,752 | | | | 5,856 | | | | 383,754 | |
Transfer agent — class specific | | | 132,499 | | | | 8,111 | | | | 272,767 | |
Professional | | | 38,142 | | | | 38,395 | | | | 41,453 | |
Registration | | | 34,325 | | | | 19,285 | | | | 32,244 | |
Administration | | | 24,761 | | | | 1,143 | | | | 58,249 | |
Administration — class specific | | | 11,667 | | | | 534 | | | | 27,431 | |
Accounting services | | | 17,290 | | | | 3,274 | | | | 36,988 | |
Printing | | | 17,168 | | | | 11,543 | | | | 20,435 | |
Officer and Trustees | | | 6,500 | | | | 4,992 | | | | 8,541 | |
Custodian | | | 6,319 | | | | 11,863 | | | | 7,962 | |
Pricing | | | 1,455 | | | | 9,396 | | | | 2,040 | |
Recoupment of past waived and/or reimbursed fees — class specific | | | 234 | | | | — | | | | 15,742 | |
Miscellaneous | | | 9,319 | | | | 5,909 | | | | 6,957 | |
| | | | |
Total expenses | | | 970,385 | | | | 147,200 | | | | 1,942,478 | |
Less: | | | | | | | | | | | | |
Fees waived by the Manager | | | (62,060 | ) | | | (26,908 | ) | | | (686 | ) |
Administration fees waived | | | — | | | | (1,143 | ) | | | — | |
Administration fees waived — class specific | | | (11,574 | ) | | | (534 | ) | | | (19,764 | ) |
Transfer agent fees waived — class specific | | | (6,904 | ) | | | (205 | ) | | | (14,028 | ) |
Transfer agent fees reimbursed — class specific | | | (53,901 | ) | | | (7,808 | ) | | | (72,830 | ) |
Expenses reimbursed by the Manager | | | — | | | | (64,391 | ) | | | — | |
| | | | |
Total expenses after fees waived and/or reimbursed | | | 835,946 | | | | 46,211 | | | | 1,835,170 | |
| | | | |
Net investment income (loss) | | | 707,964 | | | | 12,894 | | | | (362,986 | ) |
| | | | |
| | | | | | | | | | | | |
| Realized and Unrealized Gain (Loss) | | | | | | | | | | | | |
Net realized gain (loss) from: | | | | | | | | | | | | |
Investments — unaffiliated | | | 688,766 | | | | 56,023 | 1 | | | (3,695,948 | ) |
Capital gain distributions received from affiliated investment companies | | | 7 | | | | — | | | | 20 | |
Forward foreign currency exchange contracts | | | — | | | | 3,964 | | | | — | |
Foreign currency transactions | | | (1,963 | ) | | | 1,673 | | | | (31,504 | ) |
| | | | |
| | | 686,810 | | | | 61,660 | | | | (3,727,432 | ) |
| | | | |
Net change in unrealized appreciation (depreciation) on: | | | | | | | | | | | | |
Investments | | | (78,058 | ) | | | 448,762 | 2 | | | (4,583,059 | ) |
Forward foreign currency exchange contracts | | | — | | | | (420 | ) | | | — | |
Foreign currency translations | | | (12 | ) | | | 680 | | | | 2,151 | |
| | | | |
| | | (78,070 | ) | | | 449,022 | | | | (4,580,908 | ) |
| | | | |
Net realized and unrealized gain (loss) | | | 608,740 | | | | 510,682 | | | | (8,308,340 | ) |
| | | | |
Net Increase (Decrease) in Net Assets Resulting from Operations | | $ | 1,316,704 | | | $ | 523,576 | | | $ | (8,671,326) | |
| | | | |
| | 1 | | Net of $8,114 realized tax deferral. |
| | 2 | | Net of $2,200 foreign capital gain tax. |
See Notes to Financial Statements.
| | | | | | |
| 22 | | BLACKROCK FUNDS | | MARCH 31, 2017 | | |
| | | | |
| Statements of Changes in Net Assets | | | | |
| | | | | | | | | | | | | | | | | | | | | | | | |
| | | BlackRock
All-Cap Energy &
Resources
Portfolio | | | BlackRock
Emerging
Markets
Dividend
Fund | | | BlackRock
Energy &
Resources
Portfolio | |
| Increase (Decrease) in Net Assets: | | Six Months
Ended
March 31, 2017
(Unaudited) | | | Year Ended
September 30,
2016 | | | Six Months
Ended
March 31, 2017
(Unaudited) | | | Year Ended
September 30,
2016 | | | Six Months
Ended
March 31, 2017
(Unaudited) | | | Year Ended
September 30,
2016 | |
| | | | | | | | | | | | | | | | | | | | | | | | |
| Operations | | | | | | | | | | | | | | | | | | | | | | | | |
Net investment income (loss) | | $ | 707,964 | | | $ | 1,936,661 | | | $ | 12,894 | | | $ | 45,726 | | | $ | (362,986 | ) | | $ | 46,851 | |
Net realized gain (loss) | | | 686,810 | | | | (20,634,863 | ) | | | 61,660 | | | | (482,566 | ) | | | (3,727,432 | ) | | | (73,655,928 | ) |
Net change in unrealized appreciation (depreciation) | | | (78,070 | ) | | | 36,814,835 | | | | 449,022 | | | | 738,925 | | | | (4,580,908 | ) | | | 107,421,623 | |
| | | | | | | | | | | | |
Net increase (decrease) in net assets resulting from operations | | | 1,316,704 | | | | 18,116,633 | | | | 523,576 | | | | 302,085 | | | | (8,671,326 | ) | | | 33,812,546 | |
| | | | | | | | | | | | |
| | | | | | | | | | | | | | | | | | | | | | | | |
| Distributions to Shareholders1 | | | | | | | | | | | | | | | | | | | | | | | | |
From net investment income: | | | | | | | | | | | | | | | | | | | | | | | | |
Institutional | | | (617,210 | ) | | | (485,170 | ) | | | (4,673 | ) | | | (17,881 | ) | | | — | | | | — | |
Service | | | (16,259 | ) | | | (10,079 | ) | | | — | | | | — | | | | — | | | | — | |
Investor A | | | (1,176,238 | ) | | | (975,004 | ) | | | (3,328 | ) | | | (24,538 | ) | | | — | | | | — | |
Investor C | | | (390,299 | ) | | | (271,932 | ) | | | — | | | | (2,792 | ) | | | — | | | | — | |
| | | | | | | | | | | | |
Decrease in net assets resulting from distributions to shareholders | | | (2,200,006 | ) | | | (1,742,185 | ) | | | (8,001 | ) | | | (45,211 | ) | | | — | | | | — | |
| | | | | | | | | | | | |
| | | | | | | | | | | | | | | | | | | | | | | | |
| Capital Share Transactions | | | | | | | | | | | | | | | | | | | | | | | | |
Net increase (decrease) in net assets derived from capital share transactions | | | (7,979,193 | ) | | | (5,731,029 | ) | | | 2,660,835 | | | | 1,894,356 | | | | (28,215,901 | ) | | | (9,922,707 | ) |
| | | | | | | | | | | | |
| | | | | | | | | | | | | | | | | | | | | | | | |
| Net Assets | | | | | | | | | | | | | | | | | | | | | | | | |
Total increase (decrease) in net assets | | | (8,862,495 | ) | | | 10,643,419 | | | | 3,176,410 | | | | 2,151,230 | | | | (36,887,227 | ) | | | 23,889,839 | |
Beginning of period | | | 117,362,262 | | | | 106,718,843 | | | | 4,509,306 | | | | 2,358,076 | | | | 278,777,497 | | | | 254,887,658 | |
| | | | | | | | | | | | |
End of period | | $ | 108,499,767 | | | $ | 117,362,262 | | | $ | 7,685,716 | | | $ | 4,509,306 | | | $ | 241,890,270 | | | $ | 278,777,497 | |
| | | | | | | | | | | | |
Undistributed (accumulated) net investment income (loss), end of period | | $ | 366,790 | | | $ | 1,858,832 | | | $ | 12,830 | | | $ | 7,937 | | | $ | (381,285 | ) | | $ | (18,299 | ) |
| | | | | | | | | | | | |
| 1 | Distributions for annual periods determined in accordance with federal income tax regulations. |
See Notes to Financial Statements.
| | | | | | |
| | | BLACKROCK FUNDS | | MARCH 31, 2017 | | 23 |
| | | | |
| Financial Highlights | | | BlackRock All-Cap Energy & Resources Portfolio | |
| | | | | | | | | | | | | | | | | | | | | | | | |
| | | Institutional | |
| | | Six Months
Ended
March 31, 2017
(Unaudited) | | | Year Ended September 30, | |
| | | | 2016 | | | 2015 | | | 2014 | | | 2013 | | | 2012 | |
| | | | | | | | | | | | | | | | | | | | | | | | |
| Per Share Operating Performance | | | | | | | | | | | | | | | | | | | | | | | | |
Net asset value, beginning of period | | $ | 11.06 | | | $ | 9.91 | | | $ | 16.26 | | | $ | 15.28 | | | $ | 13.51 | | | $ | 12.14 | |
| | | | |
Net investment income1 | | | 0.10 | | | | 0.22 | | | | 0.23 | | | | 0.19 | | | | 0.06 | | | | 0.05 | |
Net realized and unrealized gain (loss) | | | 0.07 | | | | 1.17 | | | | (6.34 | ) | | | 0.90 | | | | 1.71 | | | | 1.32 | |
| | | | |
Net increase (decrease) from investment operations | | | 0.17 | | | | 1.39 | | | | (6.11 | ) | | | 1.09 | | | | 1.77 | | | | 1.37 | |
| | | | |
Distributions from net investment income2 | | | (0.28 | ) | | | (0.24 | ) | | | (0.24 | ) | | | (0.11 | ) | | | (0.00 | )3 | | | — | |
| | | | |
Net asset value, end of period | | $ | 10.95 | | | $ | 11.06 | | | $ | 9.91 | | | $ | 16.26 | | | $ | 15.28 | | | $ | 13.51 | |
| | | | |
| | | | | | | | | | | | | | | | | | | | | | | | |
| Total Return4 | | | | | | | | | | | | | | | | | | | | | | | | |
Based on net asset value | | | 1.31 | %5 | | | 14.33 | % | | | (37.94 | )% | | | 7.16 | % | | | 13.13 | % | | | 11.29 | % |
| | | | |
| | | | | | | | | | | | | | | | | | | | | | | | |
| Ratios to Average Net Assets | | | | | | | | | | | | | | | | | | | | | | | | |
Total expenses | | | 1.19 | %6 | | | 1.18 | % | | | 1.11 | %7 | | | 1.00 | %7 | | | 0.98 | %7 | | | 0.95 | %7 |
| | | | |
Total expenses after fees waived and/or reimbursed and paid indirectly | | | 0.91 | %6 | | | 0.95 | % | | | 0.96 | % | | | 0.96 | % | | | 0.96 | % | | | 0.94 | % |
| | | | |
Net investment income | | | 1.73 | %6 | | | 2.16 | % | | | 1.75 | % | | | 1.15 | % | | | 0.49 | % | | | 0.34 | % |
| | | | |
| | | | | | | | | | | | | | | | | | | | | | | | |
| Supplemental Data | | | | | | | | | | | | | | | | | | | | | | | | |
Net assets, end of period (000) | | $ | 24,969 | | | $ | 25,123 | | | $ | 20,753 | | | $ | 36,865 | | | $ | 35,726 | | | $ | 272,779 | |
| | | | |
Portfolio turnover rate | | | 8 | % | | | 66 | % | | | 51 | % | | | 71 | % | | | 28 | % | | | 19 | % |
| | | | |
| | 1 | | Based on average shares outstanding. |
| | 2 | | Distributions for annual periods determined in accordance with U.S. federal income tax regulations. |
| | 3 | | Amount is greater than $(0.005) per share. |
| | 4 | | Where applicable, assumes the reinvestment of distributions. |
| | 5 | | Aggregate total return. |
| | 7 | | Includes recoupment of past waived and/or reimbursed fees with no financial impact to the expense ratios. |
See Notes to Financial Statements.
| | | | | | |
| 24 | | BLACKROCK FUNDS | | MARCH 31, 2017 | | |
| | | | |
Financial Highlights (continued) | |
| BlackRock All-Cap Energy & Resources Portfolio
|
|
| | | | | | | | | | | | | | | | | | | | | | | | |
| | | Service | |
| | | Six Months
Ended
March 31, 2017
(Unaudited) | | | Year Ended September 30, | |
| | | | 2016 | | | 2015 | | | 2014 | | | 2013 | | | 2012 | |
| | | | | | | | | | | | | | | | | | | | | | | | |
| Per Share Operating Performance | | | | | | | | | | | | | | | | | | | | | | | | |
Net asset value, beginning of period | | $ | 10.81 | | | $ | 9.65 | | | $ | 15.81 | | | $ | 14.87 | | | $ | 13.20 | | | $ | 11.90 | |
| | | | |
Net investment income1 | | | 0.07 | | | | 0.17 | | | | 0.17 | | | | 0.12 | | | | 0.02 | | | | 0.00 | 2 |
Net realized and unrealized gain (loss) | | | 0.07 | | | | 1.14 | | | | (6.16 | ) | | | 0.88 | | | | 1.65 | | | | 1.30 | |
| | | | |
Net increase (decrease) from investment operations | | | 0.14 | | | | 1.31 | | | | (5.99 | ) | | | 1.00 | | | | 1.67 | | | | 1.30 | |
| | | | |
Distributions from net investment income3 | | | (0.22 | ) | | | (0.15 | ) | | | (0.17 | ) | | | (0.06 | ) | | | — | | | | — | |
| | | | |
Net asset value, end of period | | $ | 10.73 | | | $ | 10.81 | | | $ | 9.65 | | | $ | 15.81 | | | $ | 14.87 | | | $ | 13.20 | |
| | | | |
| | | | | | | | | | | | | | | | | | | | | | | | |
| Total Return4 | | | | | | | | | | | | | | | | | | | | | | | | |
Based on net asset value | | | 1.16 | %5 | | | 13.77 | % | | | (38.17 | )% | | | 6.72 | % | | | 12.65 | % | | | 10.93 | % |
| | | | |
| | | | | | | | | | | | | | | | | | | | | | | | |
| Ratios to Average Net Assets | | | | | | | | | | | | | | | | | | | | | | | | |
Total expenses6 | | | 1.46 | %7 | | | 1.51 | % | | | 1.41 | % | | | 1.35 | % | | | 1.34 | % | | | 1.29 | % |
| | | | |
Total expenses after fees waived and/or reimbursed and paid indirectly | | | 1.33 | %7 | | | 1.36 | % | | | 1.38 | % | | | 1.34 | % | | | 1.33 | % | | | 1.29 | % |
| | | | |
Net investment income | | | 1.33 | %7 | | | 1.67 | % | | | 1.33 | % | | | 0.77 | % | | | 0.17 | % | | | 0.00 | % |
| | | | |
| | | | | | | | | | | | | | | | | | | | | | | | |
| Supplemental Data | | | | | | | | | | | | | | | | | | | | | | | | |
Net assets, end of period (000) | | $ | 681 | | | $ | 787 | | | $ | 1,025 | | | $ | 2,046 | | | $ | 2,298 | | | $ | 3,828 | |
| | | | |
Portfolio turnover rate | | | 8 | % | | | 66 | % | | | 51 | % | | | 71 | % | | | 28 | % | | | 19 | % |
| | | | |
| | 1 | | Based on average shares outstanding. |
| | 2 | | Amount is less than $0.005 per share. |
| | 3 | | Distributions for annual periods determined in accordance with U.S. federal income tax regulations. |
| | 4 | | Where applicable, assumes the reinvestment of distributions. |
| | 5 | | Aggregate total return. |
| | 6 | | Includes recoupment of past waived and/or reimbursed fees. Excluding the recoupment of past waived and/or reimbursed fees for the six months ended March 31, 2017, the ratio would have been 1.45%. There was no financial impact to the expense ratios for the years ended September 30, 2016, September 30, 2015, September 30, 2014, September 30, 2013, and September 30, 2012 |
See Notes to Financial Statements.
| | | | | | |
| | | BLACKROCK FUNDS | | MARCH 31, 2017 | | 25 |
| | | | |
| Financial Highlights (continued) | | | BlackRock All-Cap Energy & Resources Portfolio | |
| | | | | | | | | | | | | | | | | | | | | | | | |
| | | Investor A | |
| | | Six Months
Ended
March 31, 2017
(Unaudited) | | | Year Ended September 30, | |
| | | | 2016 | | | 2015 | | | 2014 | | | 2013 | | | 2012 | |
| | | | | | | | | | | | | | | | | | | | | | | | |
| Per Share Operating Performance | | | | | | | | | | | | | | | | | | | | | | | | |
Net asset value, beginning of period | | $ | 10.76 | | | $ | 9.63 | | | $ | 15.77 | | | $ | 14.85 | | | $ | 13.19 | | | $ | 11.90 | |
| | | | |
Net investment income (loss)1 | | | 0.07 | | | | 0.17 | | | | 0.17 | | | | 0.12 | | | | 0.02 | | | | (0.01 | ) |
Net realized and unrealized gain (loss) | | | 0.07 | | | | 1.14 | | | | (6.15 | ) | | | 0.86 | | | | 1.64 | | | | 1.30 | |
| | | | |
Net increase (decrease) from investment operations | | | 0.14 | | | | 1.31 | | | | (5.98 | ) | | | 0.98 | | | | 1.66 | | | | 1.29 | |
| | | | |
Distributions from net investment income2 | | | (0.22 | ) | | | (0.18 | ) | | | (0.16 | ) | | | (0.06 | ) | | | — | | | | — | |
| | | | |
Net asset value, end of period | | $ | 10.68 | | | $ | 10.76 | | | $ | 9.63 | | | $ | 15.77 | | | $ | 14.85 | | | $ | 13.19 | |
| | | | |
| | | | | | | | | | | | | | | | | | | | | | | | |
| Total Return3 | | | | | | | | | | | | | | | | | | | | | | | | |
Based on net asset value | | | 1.15 | %4 | | | 13.88 | % | | | (38.17 | )% | | | 6.65 | % | | | 12.59 | % | | | 10.84 | % |
| | | | |
| | | | | | | | | | | | | | | | | | | | | | | | |
| Ratios to Average Net Assets | | | | | | | | | | | | | | | | | | | | | | | | |
Total expenses | | | 1.55 | %5 | | | 1.55 | % | | | 1.48 | %6 | | | 1.40 | %6 | | | 1.39 | %6 | | | 1.35 | %6 |
| | | | |
Total expenses after fees waived and/or reimbursed and paid indirectly | | | 1.33 | %5 | | | 1.36 | % | | | 1.38 | % | | | 1.38 | % | | | 1.37 | % | | | 1.34 | % |
| | | | |
Net investment income (loss) | | | 1.33 | %5 | | | 1.72 | % | | | 1.33 | % | | | 0.73 | % | | | 0.12 | % | | | (0.09 | )% |
| | | | |
| | | | | | | | | | | | | | | | | | | | | | | | |
| Supplemental Data | | | | | | | | | | | | | | | | | | | | | | | | |
Net assets, end of period (000) | | $ | 53,610 | | | $ | 59,065 | | | $ | 51,005 | | | $ | 91,625 | | | $ | 103,388 | | | $ | 137,765 | |
| | | | |
Portfolio turnover rate | | | 8 | % | | | 66 | % | | | 51 | % | | | 71 | % | | | 28 | % | | | 19 | % |
| | | | |
| | 1 | | Based on average shares outstanding. |
| | 2 | | Distributions for annual periods determined in accordance with U.S. federal income tax regulations. |
| | 3 | | Where applicable, excludes the effects of any sales charges and assumes the reinvestment of distributions. |
| | 4 | | Aggregate total return. |
| | 6 | | Includes recoupment of past waived and/or reimbursed fees with no financial impact to the expense ratios. |
See Notes to Financial Statements.
| | | | | | |
| 26 | | BLACKROCK FUNDS | | MARCH 31, 2017 | | |
| | | | |
| Financial Highlights (continued) | | | BlackRock All-Cap Energy & Resources Portfolio | |
| | | | | | | | | | | | | | | | | | | | | | | | |
| | | Investor B | |
| | | Six Months
Ended
March 31, 2017
(Unaudited) | | | Year Ended September 30, | |
| | | | 2016 | | | 2015 | | | 2014 | | | 2013 | | | 2012 | |
| | | | | | | | | | | | | | | | | | | | | | | | |
| Per Share Operating Performance | | | | | | | | | | | | | | | | | | | | | | | | |
Net asset value, beginning of period | | $ | 10.34 | | | $ | 9.15 | | | $ | 14.91 | | | $ | 14.08 | | | $ | 12.59 | | | $ | 11.45 | |
| | | | |
Net investment income (loss)1 | | | 0.03 | | | | 0.10 | | | | 0.07 | | | | (0.00 | )2 | | | (0.08 | ) | | | (0.11 | ) |
Net realized and unrealized gain (loss) | | | 0.05 | | | | 1.09 | | | | (5.83 | ) | | | 0.83 | | | | 1.57 | | | | 1.25 | |
| | | | |
Net increase (decrease) from investment operations | | | 0.08 | | | | 1.19 | | | | (5.76 | ) | | | 0.83 | | | | 1.49 | | | | 1.14 | |
| | | | |
Net asset value, end of period | | $ | 10.42 | | | $ | 10.34 | | | $ | 9.15 | | | $ | 14.91 | | | $ | 14.08 | | | $ | 12.59 | |
| | | | |
| | | | | | | | | | | | | | | | | | | | | | | | |
| Total Return3 | | | | | | | | | | | | | | | | | | | | | | | | |
Based on net asset value | | | 0.77 | %4 | | | 13.01 | % | | | (38.63 | )% | | | 5.90 | % | | | 11.84 | % | | | 9.96 | % |
| | | | |
| | | | | | | | | | | | | | | | | | | | | | | | |
| Ratios to Average Net Assets | | | | | | | | | | | | | | | | | | | | | | | | |
Total expenses5 | | | 3.60 | %6 | | | 2.73 | % | | | 2.47 | % | | | 2.34 | % | | | 2.28 | % | | | 2.20 | % |
| | | | |
Total expenses after fees waived and/or reimbursed and paid indirectly | | | 2.05 | %6 | | | 2.09 | % | | | 2.10 | % | | | 2.10 | % | | | 2.10 | % | | | 2.10 | % |
| | | | |
Net investment income (loss) | | | 0.64 | %6 | | | 1.03 | % | | | 0.58 | % | | | (0.02 | )% | | | (0.60 | )% | | | (0.83 | )% |
| | | | |
| | | | | | | | | | | | | | | | | | | | | | | | |
| Supplemental Data | | | | | | | | | | | | | | | | | | | | | | | | |
Net assets, end of period (000) | | $ | 213 | | | $ | 540 | | | $ | 1,243 | | | $ | 3,935 | | | $ | 9,802 | | | $ | 15,162 | |
| | | | |
Portfolio turnover rate | | | 8 | % | | | 66 | % | | | 51 | % | | | 71 | % | | | 28 | % | | | 19 | % |
| | | | |
| | 1 | | Based on average shares outstanding. |
| | 2 | | Amount is greater than $(0.005) per share. |
| | 3 | | Where applicable, excludes the effects of any sales charges and assumes the reinvestment of distributions. |
| | 4 | | Aggregate total return. |
| | 5 | | Includes recoupment of past waived and/or reimbursed fees. Excluding the recoupment of past waived and/or reimbursed fees for the years ended September 30, 2016, September 30, 2014 and September 30, 2012, the ratio would have been 2.72%, 2.33% and 2.19%, respectively. There was no financial impact to the expense ratios for six months ended March 31, 2017 and the years ended September 30, 2015 and September 30, 2013. |
See Notes to Financial Statements.
| | | | | | |
| | | BLACKROCK FUNDS | | MARCH 31, 2017 | | 27 |
| | | | |
| Financial Highlights (concluded) | | | BlackRock All-Cap Energy & Resources Portfolio | |
| | | | | | | | | | | | | | | | | | | | | | | | |
| | | Investor C | |
| | | Six Months
Ended
March 31, 2017
(Unaudited) | | | Year Ended September 30, | |
| | | | 2016 | | | 2015 | | | 2014 | | | 2013 | | | 2012 | |
| | | | | | | | | | | | | | | | | | | | | |
| Per Share Operating Performance | | | | | | | | | | | | | | | | | | | | | | | | |
Net asset value, beginning of period | | $ | 10.23 | | | $ | 9.14 | | | $ | 14.94 | | | $ | 14.10 | | | $ | 12.62 | | | $ | 11.47 | |
| | | | |
Net investment income (loss)1 | | | 0.03 | | | | 0.09 | | | | 0.07 | | | | 0.00 | 2 | | | (0.07 | ) | | | (0.10 | ) |
Net realized and unrealized gain (loss) | | | 0.07 | | | | 1.08 | | | | (5.82 | ) | | | 0.84 | | | | 1.55 | | | | 1.25 | |
| | | | |
Net increase (decrease) from investment operations | | | 0.10 | | | | 1.17 | | | | (5.75 | ) | | | 0.84 | | | | 1.48 | | | | 1.15 | |
| | | | |
Distributions from net investment income3 | | | (0.13 | ) | | | (0.08 | ) | | | (0.05 | ) | | | — | | | | — | | | | — | |
| | | | |
Net asset value, end of period | | $ | 10.20 | | | $ | 10.23 | | | $ | 9.14 | | | $ | 14.94 | | | $ | 14.10 | | | $ | 12.62 | |
| | | | |
| | | | | | | | | | | | | | | | | | | | | | | | |
| Total Return4 | | | | | | | | | | | | | | | | | | | | | | | | |
Based on net asset value | | | 0.85 | %5 | | | 12.91 | % | | | (38.60 | )% | | | 5.96 | % | | | 11.73 | % | | | 10.03 | % |
| | | | |
| | | | | | | | | | | | | | | | | | | | | | | | |
| Ratios to Average Net Assets | | | | | | | | | | | | | | | | | | | | | | | | |
Total expenses6 | | | 2.27 | %7 | | | 2.28 | % | | | 2.18 | % | | | 2.12 | % | | | 2.12 | % | | | 2.08 | % |
| | | | |
Total expenses after fees waived and/or reimbursed and paid indirectly | | | 2.05 | %7 | | | 2.09 | % | | | 2.10 | % | | | 2.10 | % | | | 2.09 | % | | | 2.07 | % |
| | | | |
Net investment income (loss) | �� | | 0.60 | %7 | | | 1.00 | % | | | 0.61 | % | | | 0.00 | % | | | (0.59 | )% | | | (0.79 | )% |
| | | | |
| | | | | | | | | | | | | | | | | | | | | | | | |
| Supplemental Data | | | | | | | | | | | | | | | | | | | | | | | | |
Net assets, end of period (000) | | $ | 29,027 | | | $ | 31,847 | | | $ | 32,693 | | | $ | 63,133 | | | $ | 70,094 | | | $ | 85,649 | |
| | | | |
Portfolio turnover rate | | | 8 | % | | | 66 | % | | | 51 | % | | | 71 | % | | | 28 | % | | | 19 | % |
| | | | |
| | 1 | | Based on average shares outstanding. |
| | 2 | | Amount is less than $0.005 per share. |
| | 3 | | Distributions for annual periods determined in accordance with U.S. federal income tax regulations. |
| | 4 | | Where applicable, excludes the effects of any sales charges and assumes the reinvestment of distributions. |
| | 5 | | Aggregate total return. |
| | 6 | | Includes recoupment of past waived and/or reimbursed fees. Excluding the recoupment of past waived and/or reimbursed fees for the years ended September 30, 2016 and September 30, 2014, the ratio would have been 2.27% and 2.10%, respectively. There was no financial impact to the expense ratios for the six months ended March 31, 2017 and the years ended September 30, 2015, September 30, 2013 and September 30, 2012. |
See Notes to Financial Statements.
| | | | | | |
| 28 | | BLACKROCK FUNDS | | MARCH 31, 2017 | | |
| | | | |
| Financial Highlights | | | BlackRock Emerging Markets Dividend Fund | |
| | | | | | | | | | | | | | | | | | | | | | | | |
| | | Institutional | |
| | | Six Months
Ended
March 31, 2017
(Unaudited) | | | Year Ended September 30, | |
| | | | 2016 | | | 2015 | | | 2014 | | | 2013 | | | 2012 | |
| | | | | | | | | | | | | | | | | | | | | | | | |
| Per Share Operating Performance | | | | | | | | | | | | | | | | | | | | | | | | |
Net asset value, beginning of period | | $ | 7.90 | | | $ | 6.87 | | | $ | 8.75 | | | $ | 8.93 | | | $ | 7.79 | | | $ | 6.90 | |
| | | | |
Net investment income1 | | | 0.03 | | | | 0.09 | | | | 0.18 | | | | 0.22 | | | | 0.15 | | | | 0.12 | |
Net realized and unrealized gain (loss) | | | 0.65 | | | | 1.05 | | | | (1.78 | ) | | | (0.12 | ) | | | 1.11 | | | | 0.89 | |
| | | | |
Net increase (decrease) from investment operations | | | 0.68 | | | | 1.14 | | | | (1.60 | ) | | | 0.10 | | | | 1.26 | | | | 1.01 | |
| | | | |
Distributions from net investment income2 | | | (0.02 | ) | | | (0.11 | ) | | | (0.28 | ) | | | (0.28 | ) | | | (0.12 | ) | | | (0.12 | ) |
| | | | |
Net asset value, end of period | | $ | 8.56 | | | $ | 7.90 | | | $ | 6.87 | | | $ | 8.75 | | | $ | 8.93 | | | $ | 7.79 | |
| | | | |
| | | | | | | | | | | | | | | | | | | | | | | | |
| Total Return3 | | | | | | | | | | | | | | | | | | | | | | | | |
Based on net asset value | | | 8.64 | %4 | | | 16.72 | % | | | (18.71 | )% | | | 1.06 | % | | | 16.15 | %5 | | | 14.82 | % |
| | | | |
| | | | | | | | | | | | | | | | | | | | | | | | |
| Ratios to Average Net Assets | | | | | | | | | | | | | | | | | | | | | | | | |
Total expenses6 | | | 5.48 | %7 | | | 8.02 | % | | | 6.07 | % | | | 6.72 | % | | | 7.54 | % | | | 13.05 | % |
| | | | |
Total expenses after fees waived and/or reimbursed6 | | | 1.50 | %7 | | | 1.51 | % | | | 1.51 | % | | | 1.51 | % | | | 1.63 | % | | | 1.65 | % |
| | | | |
Net investment income6 | | | 0.75 | %7 | | | 1.25 | % | | | 2.11 | % | | | 2.41 | % | | | 1.71 | % | | | 1.55 | % |
| | | | |
| | | | | | | | | | | | | | | | | | | | | | | | |
| Supplemental Data | | | | | | | | | | | | | | | | | | | | | | | | |
Net assets, end of period (000) | | $ | 3,772 | | | $ | 1,586 | | | $ | 763 | | | $ | 2,774 | | | $ | 2,736 | | | $ | 2,355 | |
| | | | |
Portfolio turnover rate | | | 43 | % | | | 117 | % | | | 81 | % | | | 71 | % | | | 150 | % | | | 40 | % |
| | | | |
| | 1 | | Based on average shares outstanding. |
| | 2 | | Distributions for annual periods determined in accordance with U.S. federal income tax regulations. |
| | 3 | | Where applicable, assumes the reinvestment of distributions. |
| | 4 | | Aggregate total return. |
| | 5 | | Includes a payment from an affiliate related to securities lending which impacted the Fund’s total return. Not including this payment the Fund’s total return would have been 15.76%. |
| | 6 | | Excludes expenses incurred indirectly as a result of investments in underlying funds as follows: |
| | | | | | | | | | | | | | |
| | | Six Months
Ended
March 31, 2017
(Unaudited) | | | | | | | | | | | |
| | | | Year Ended September 30, |
| | | | 2016 | | 2015 | | 2014 | | | 2013 | | 2012 |
Investments in underlying funds | | — | | — | | — | | | 0.01 | % | | — | | — |
See Notes to Financial Statements.
| | | | | | |
| | | BLACKROCK FUNDS | | MARCH 31, 2017 | | 29 |
| | | | |
| Financial Highlights (continued) | | | BlackRock Emerging Markets Dividend Fund | |
| | | | | | | | | | | | | | | | | | | | | | | | |
| | | Investor A | |
| | | Six Months
Ended
March 31, 2017
(Unaudited) | | | Year Ended September 30, | |
| | | | 2016 | | | 2015 | | | 2014 | | | 2013 | | | 2012 | |
| | | | | | | | | | | | | | | | | | | | | | | | |
| Per Share Operating Performance | | | | | | | | | | | | | | | | | | | | | | | | |
Net asset value, beginning of period | | $ | 7.87 | | | $ | 6.84 | | | $ | 8.71 | | | $ | 8.89 | | | $ | 7.77 | | | $ | 6.89 | |
| | | | |
Net investment income1 | | | 0.02 | | | | 0.11 | | | | 0.14 | | | | 0.20 | | | | 0.21 | | | | 0.18 | |
Net realized and unrealized gain (loss) | | | 0.64 | | | | 1.02 | | | | (1.75 | ) | | | (0.13 | ) | | | 1.02 | | | | 0.82 | |
| | | | |
Net increase (decrease) from investment operations | | | 0.66 | | | | 1.13 | | | | (1.61 | ) | | | 0.07 | | | | 1.23 | | | | 1.00 | |
| | | | |
Distributions from net investment income2 | | | (0.01 | ) | | | (0.10 | ) | | | (0.26 | ) | | | (0.25 | ) | | | (0.11 | ) | | | (0.12 | ) |
| | | | |
Net asset value, end of period | | $ | 8.52 | | | $ | 7.87 | | | $ | 6.84 | | | $ | 8.71 | | | $ | 8.89 | | | $ | 7.77 | |
| | | | |
| | | | | | | | | | | | | | | | | | | | | | | | |
| Total Return3 | | | | | | | | | | | | | | | | | | | | | | | | |
Based on net asset value | | | 8.41 | %4 | | | 16.57 | % | | | (18.89 | )% | | | 0.77 | % | | | 15.82 | %5 | | | 14.64 | % |
| | | | |
| | | | | | | | | | | | | | | | | | | | | | | | |
| Ratios to Average Net Assets | | | | | | | | | | | | | | | | | | | | | | | | |
Total expenses6 | | | 5.38 | %7 | | | 8.48 | % | | | 7.38 | % | | | 7.17 | % | | | 8.33 | % | | | 14.41 | % |
| | | | |
Total expenses after fees waived and/or reimbursed6 | | | 1.75 | %7 | | | 1.76 | % | | | 1.75 | % | | | 1.76 | % | | | 1.87 | % | | | 1.90 | % |
| | | | |
Net investment income6 | | | 0.41 | %7 | | | 1.60 | % | | | 1.77 | % | | | 2.30 | % | | | 2.44 | % | | | 2.24 | % |
| | | | |
| | | | | | | | | | | | | | | | | | | | | | | | |
| Supplemental Data | | | | | | | | | | | | | | | | | | | | | | | | |
Net assets, end of period (000) | | $ | 3,248 | | | $ | 2,428 | | | $ | 1,296 | | | $ | 1,887 | | | $ | 1,308 | | | $ | 360 | |
| | | | |
Portfolio turnover rate | | | 43 | % | | | 117 | % | | | 81 | % | | | 71 | % | | | 150 | % | | | 40 | % |
| | | | |
| | 1 | | Based on average shares outstanding. |
| | 2 | | Distributions for annual periods determined in accordance with U.S. federal income tax regulations. |
| | 3 | | Where applicable, excludes the effects of any sales charges and assumes the reinvestment of distributions. |
| | 4 | | Aggregate total return. |
| | 5 | | Includes a payment from an affiliate related to securities lending which impacted the Fund’s total return. Not including this payment the Fund’s total return would have been 15.43%. |
| | 6 | | Excludes expenses incurred indirectly as a result of investments in underlying funds as follows: |
| | | | | | | | | | | | | | |
| | | Six Months
Ended
March 31, 2017
(Unaudited) | | | | | | | | | | | |
| | | | Year Ended September 30, |
| | | | 2016 | | 2015 | | 2014 | | | 2013 | | 2012 |
Investments in underlying funds | | — | | — | | — | | | 0.01 | % | | — | | — |
See Notes to Financial Statements.
| | | | | | |
| 30 | | BLACKROCK FUNDS | | MARCH 31, 2017 | | |
| | | | |
| Financial Highlights (concluded) | | | BlackRock Emerging Markets Dividend Fund | |
| | | | | | | | | | | | | | | | | | | | | | | | |
| | | Investor C | |
| | | Six Months
Ended
March 31, 2017
(Unaudited) | | | Year Ended September 30, | |
| | | | 2016 | | | 2015 | | | 2014 | | | 2013 | | | 2012 | |
| | | | | | | | | | | | | | | | | | | | | | | | |
| Per Share Operating Performance | | | | | | | | | | | | | | | | | | | | | | | | |
Net asset value, beginning of period | | $ | 7.80 | | | $ | 6.78 | | | $ | 8.65 | | | $ | 8.84 | | | $ | 7.72 | | | $ | 6.87 | |
| | | | |
Net investment income (loss)1 | | | (0.01 | ) | | | 0.06 | | | | 0.08 | | | | 0.16 | | | | 0.20 | | | | 0.05 | |
Net realized and unrealized gain (loss) | | | 0.64 | | | | 1.01 | | | | (1.75 | ) | | | (0.15 | ) | | | 0.95 | | | | 0.90 | |
| | | | |
Net increase (decrease) from investment operations | | | 0.63 | | | | 1.07 | | | | (1.67 | ) | | | 0.01 | | | | 1.15 | | | | 0.95 | |
| | | | |
Distributions from net investment income2 | | | — | | | | (0.05 | ) | | | (0.20 | ) | | | (0.20 | ) | | | (0.03 | ) | | | (0.10 | ) |
| | | | |
Net asset value, end of period | | $ | 8.43 | | | $ | 7.80 | | | $ | 6.78 | | | $ | 8.65 | | | $ | 8.84 | | | $ | 7.72 | |
| | | | |
| | | | | | | | | | | | | | | | | | | | | | | | |
| Total Return3 | | | | | | | | | | | | | | | | | | | | | | | | |
Based on net asset value | | | 8.08 | %4 | | | 15.83 | % | | | (19.67 | )% | | | 0.10 | % | | | 14.95 | %5 | | | 13.95 | % |
| | | | |
| | | | | | | | | | | | | | | | | | | | | | | | |
| Ratios to Average Net Assets | | | | | | | | | | | | | | | | | | | | | | | | |
Total expenses6 | | | 5.92 | %7 | | | 9.49 | % | | | 8.13 | % | | | 8.11 | % | | | 9.53 | % | | | 14.94 | % |
| | | | |
Total expenses after fees waived and/or reimbursed6 | | | 2.50 | %7 | | | 2.51 | % | | | 2.51 | % | | | 2.51 | % | | | 2.61 | % | | | 2.65 | % |
| | | | |
Net investment income (loss)6 | | | (0.35 | )%7 | | | 0.83 | % | | | 0.93 | % | | | 1.76 | % | | | 2.33 | % | | | 0.60 | % |
| | | | |
| | | | | | | | | | | | | | | | | | | | | | | | |
| Supplemental Data | | | | | | | | | | | | | | | | | | | | | | | | |
Net assets, end of period (000) | | $ | 667 | | | $ | 495 | | | $ | 299 | | | $ | 500 | | | $ | 214 | | | $ | 28 | |
| | | | |
Portfolio turnover rate | | | 43 | % | | | 117 | % | | | 81 | % | | | 71 | % | | | 150 | % | | | 40 | % |
| | | | |
| | 1 | | Based on average shares outstanding. |
| | 2 | | Distributions for annual periods determined in accordance with U.S. federal income tax regulations. |
| | 3 | | Where applicable, excludes the effects of any sales charges and assumes the reinvestment of distributions. |
| | 4 | | Aggregate total return. |
| | 5 | | Includes a payment from an affiliate related to securities lending which impacted the Fund’s total return. Not including this payment the Fund’s total return would have been 14.56%. |
| | 6 | | Excludes expenses incurred indirectly as a result of investments in underlying funds as follows: |
| | | | | | | | | | | | | | |
| | | Six Months
Ended
March 31, 2017
(Unaudited) | | | | | | | | | | | |
| | | | Year Ended September 30, |
| | | | 2016 | | 2015 | | 2014 | | | 2013 | | 2012 |
Investments in underlying funds | | — | | — | | — | | | 0.01 | % | | — | | — |
See Notes to Financial Statements.
| | | | | | |
| | | BLACKROCK FUNDS | | MARCH 31, 2017 | | 31 |
| | | | |
| Financial Highlights | | | BlackRock Energy & Resources Portfolio | |
| | | | | | | | | | | | | | | | | | | | | | | | |
| | | Institutional | |
| | | Six Months
Ended
March 31, 2017
(Unaudited) | | | Year Ended September 30, | |
| | | | 2016 | | | 2015 | | | 2014 | | | 2013 | | | 2012 | |
| | | | | | | | | | | | | | | | | | | | | | | | |
| Per Share Operating Performance | | | | | | | | | | | | | | | | | | | | | | | | |
Net asset value, beginning of period | | $ | 22.15 | | | $ | 19.44 | | | $ | 37.89 | | | $ | 37.36 | | | $ | 32.87 | | | $ | 31.70 | |
| | | | |
Net investment income (loss)1 | | | 0.01 | | | | 0.07 | | | | 0.03 | | | | (0.17 | ) | | | (0.04 | ) | | | (0.16 | ) |
Net realized and unrealized gain (loss) | | | (0.71 | ) | | | 2.64 | | | | (18.48 | ) | | | 0.70 | | | | 4.56 | | | | 2.79 | |
| | | | |
Net increase (decrease) from investment operations | | | (0.70 | ) | | | 2.71 | | | | (18.45 | ) | | | 0.53 | | | | 4.52 | | | | 2.63 | |
| | | | |
Distributions:2 | | | | | | | | | | | | | | | | | | | | | | | | |
From net investment income | | | — | | | | — | | | | — | | | | — | | | | — | | | | (0.25 | ) |
From return of capital | | | — | | | | — | | | | — | | | | — | | | | (0.03 | ) | | | (0.47 | ) |
From net realized gain | | | — | | | | — | | | | — | | | | — | | | | — | | | | (0.74 | ) |
| | | | |
Total distributions | | | — | | | | — | | | | — | | | | — | | | | (0.03 | ) | | | (1.46 | ) |
| | | | |
Net asset value, end of period | | $ | 21.45 | | | $ | 22.15 | | | $ | 19.44 | | | $ | 37.89 | | | $ | 37.36 | | | $ | 32.87 | |
| | | | |
| | | | | | | | | | | | | | | | | | | | | | | | |
| Total Return3 | | | | | | | | | | | | | | | | | | | | | | | | |
Based on net asset value | | | (3.16 | )%4 | | | 13.94 | % | | | (48.69 | )% | | | 1.42 | % | | | 13.78 | % | | | 7.76 | % |
| | | | |
| | | | | | | | | | | | | | | | | | | | | | | | |
| Ratios to Average Net Assets | | | | | | | | | | | | | | | | | | | | | | | | |
Total expenses5,6 | | | 1.02 | %7 | | | 1.10 | % | | | 1.11 | % | | | 1.03 | % | | | 1.04 | % | | | 0.99 | % |
| | | | |
Total expenses after fees waived and/or reimbursed and paid indirectly5 | | | 1.02 | %7 | | | 1.05 | % | | | 1.07 | % | | | 1.02 | % | | | 1.03 | % | | | 0.99 | % |
| | | | |
Net investment income (loss)5 | | | 0.06 | %7 | | | 0.35 | % | | | 0.12 | % | | | (0.43 | )% | | | (0.11 | )% | | | (0.44 | )% |
| | | | |
| | | | | | | | | | | | | | | | | | | | | | | | |
| Supplemental Data | | | | | | | | | | | | | | | | | | | | | | | | |
Net assets, end of period (000) | | $ | 64,318 | | | $ | 74,778 | | | $ | 65,091 | | | $ | 92,994 | | | $ | 105,317 | | | $ | 222,034 | |
| | | | |
Portfolio turnover rate | | | 6 | % | | | 44 | % | | | 55 | % | | | 56 | % | | | 33 | % | | | 15 | % |
| | | | |
| | 1 | | Based on average shares outstanding. |
| | 2 | | Distributions for annual periods determined in accordance with U.S. federal income tax regulations. |
| | 3 | | Where applicable, assumes the reinvestment of distributions. |
| | 4 | | Aggregate total return. |
| | 5 | | Excludes expenses incurred indirectly as a result of investments in underlying funds as follows: |
| | | | | | | | | | | | | | |
| | | Six Months
Ended
March 31, 2017
(Unaudited) | | | | | | | | | | | |
| | | | Year Ended September 30, |
| | | | 2016 | | 2015 | | 2014 | | | 2013 | | 2012 |
Investments in underlying funds | | — | | — | | — | | | 0.01 | % | | — | | — |
| | 6 | | Includes recoupment of past waived and/or reimbursed fees. Excluding the recoupment of past waived and/or reimbursed fees for the six months ended March 31, 2017, and the years ended September 30, 2016, September 30, 2015 and September 30, 2013, the ratio would have been 0.98%, 1.06%, 1.10% and 1.03%, respectively. There was no financial impact to the expense ratios for the years ended September 30, 2014 and September 30, 2012. |
See Notes to Financial Statements.
| | | | | | |
| 32 | | BLACKROCK FUNDS | | MARCH 31, 2017 | | |
| | | | |
| Financial Highlights (continued) | | | BlackRock Energy & Resources Portfolio | |
| | | | | | | | | | | | | | | | | | | | | | | | |
| | | Investor A | |
| | | Six Months
Ended
March 31, 2017
(Unaudited) | | | Year Ended September 30, | |
| | | | 2016 | | | 2015 | | | 2014 | | | 2013 | | | 2012 | |
| | | | | | | | | | | | | | | | | | | | | | | | |
| Per Share Operating Performance | | | | | | | | | | | | | | | | | | | | | | | | |
Net asset value, beginning of period | | $ | 19.05 | | | $ | 16.77 | | | $ | 32.79 | | | $ | 32.42 | | | $ | 28.62 | | | $ | 27.73 | |
| | | | |
Net investment income (loss)1 | | | (0.02 | ) | | | 0.01 | | | | (0.04 | ) | | | (0.25 | ) | | | (0.11 | ) | | | (0.24 | ) |
Net realized and unrealized gain (loss) | | | (0.60 | ) | | | 2.27 | | | | (15.98 | ) | | | 0.62 | | | | 3.94 | | | | 2.46 | |
| | | | |
Net increase (decrease) from investment operations | | | (0.62 | ) | | | 2.28 | | | | (16.02 | ) | | | 0.37 | | | | 3.83 | | | | 2.22 | |
| | | | |
Distributions:2 | | | | | | | | | | | | | | | | | | | | | | | | |
From net investment income | | | — | | | | — | | | | — | | | | — | | | | — | | | | (0.17 | ) |
From return of capital | | | — | | | | — | | | | — | | | | — | | | | (0.03 | ) | | | (0.42 | ) |
From net realized gain | | | — | | | | — | | | | — | | | | — | | | | — | | | | (0.74 | ) |
| | | | |
Total distributions | | | — | | | | — | | | | — | | | | — | | | | (0.03 | ) | | | (1.33 | ) |
| | | | |
Net asset value, end of period | | $ | 18.43 | | | $ | 19.05 | | | $ | 16.77 | | | $ | 32.79 | | | $ | 32.42 | | | $ | 28.62 | |
| | | | |
| | | | | | | | | | | | | | | | | | | | | | | | |
| Total Return3 | | | | | | | | | | | | | | | | | | | | | | | | |
Based on net asset value | | | (3.26 | )%4 | | | 13.60 | % | | | (48.86 | )% | | | 1.14 | % | | | 13.42 | % | | | 7.41 | % |
| | | | |
| | | | | | | | | | | | | | | | | | | | | | | | |
| Ratios to Average Net Assets | | | | | | | | | | | | | | | | | | | | | | | | |
Total expenses5 | | | 1.43 | %6 | | | 1.43 | %7 | | | 1.39 | %7 | | | 1.31 | %7 | | | 1.34 | %7 | | | 1.34 | %7 |
| | | | |
Total expenses after fees waived and/or reimbursed and paid indirectly5 | | | 1.33 | %6 | | | 1.36 | % | | | 1.37 | % | | | 1.31 | % | | | 1.34 | % | | | 1.34 | % |
| | | | |
Net investment income (loss)5 | | | (0.26 | )%6 | | | 0.04 | % | | | (0.16 | )% | | | (0.72 | )% | | | (0.38 | )% | | | (0.77 | )% |
| | | | |
| | | | | | | | | | | | | | | | | | | | | | | | |
| Supplemental Data | | | | | | | | | | | | | | | | | | | | | | | | |
Net assets, end of period (000) | | $ | 145,324 | | | $ | 165,504 | | | $ | 150,863 | | | $ | 353,706 | | | $ | 425,568 | | | $ | 539,085 | |
| | | | |
Portfolio turnover rate | | | 6 | % | | | 44 | % | | | 55 | % | | | 56 | % | | | 33 | % | | | 15 | % |
| | | | |
| | 1 | | Based on average shares outstanding. |
| | 2 | | Distributions for annual periods determined in accordance with U.S. federal income tax regulations. |
| | 3 | | Where applicable, excludes the effects of any sales charges and assumes the reinvestment of distributions. |
| | 4 | | Aggregate total return. |
| | 5 | | Excludes expenses incurred indirectly as a result of investments in underlying funds as follows: |
| | | | | | | | | | | | | | |
| | | Six Months
Ended
March 31, 2017
(Unaudited) | | | | | | | | | | | |
| | | | Year Ended September 30, |
| | | | 2016 | | 2015 | | 2014 | | | 2013 | | 2012 |
Investments in underlying funds | | — | | — | | — | | | 0.01 | % | | — | | — |
| | 7 | | Includes recoupment of past waived and/or reimbursed fees. Excluding the recoupment of past waived and/or reimbursed fees for the years ended September 30, 2013 and September 30, 2012, the ratio would have been 1.33% and 1.33%, respectively. There was no financial impact to the expense ratios for the years ended September 30, 2016, September 30, 2015 and September 30, 2014. |
See Notes to Financial Statements.
| | | | | | |
| | | BLACKROCK FUNDS | | MARCH 31, 2017 | | 33 |
| | | | |
| Financial Highlights (continued) | | | BlackRock Energy & Resources Portfolio | |
| | | | | | | | | | | | | | | | | | | | | | | | |
| | | Investor B | |
| | | Six Months
Ended
March 31, 2017
(Unaudited) | | | Year Ended September 30, | |
| | | | 2016 | | | 2015 | | | 2014 | | | 2013 | | | 2012 | |
| | | | | | | | | | | | | | | | | | | | | | | | |
| Per Share Operating Performance | | | | | | | | | | | | | | | | | | | | | | | | |
Net asset value, beginning of period | | $ | 13.61 | | | $ | 12.06 | | | $ | 23.76 | | | $ | 23.68 | | | $ | 21.07 | | | $ | 20.65 | |
| | | | |
Net investment loss1 | | | (0.07 | ) | | | (0.08 | ) | | | (0.16 | ) | | | (0.38 | ) | | | (0.25 | ) | | | (0.36 | ) |
Net realized and unrealized gain (loss) | | | (0.43 | ) | | | 1.63 | | | | (11.54 | ) | | | 0.46 | | | | 2.89 | | | | 1.87 | |
| | | | |
Net increase (decrease) from investment operations | | | (0.50 | ) | | | 1.55 | | | | (11.70 | ) | | | 0.08 | | | | 2.64 | | | | 1.51 | |
| | | | |
Distributions:2 | | | | | | | | | | | | | | | | | | | | | | | | |
From net investment income | | | — | | | | — | | | | — | | | | — | | | | — | | | | (0.06 | ) |
From return of capital | | | — | | | | — | | | | — | | | | — | | | | (0.03 | ) | | | (0.29 | ) |
From net realized gain | | | — | | | | — | | | | — | | | | — | | | | — | | | | (0.74 | ) |
| | | | |
Total distributions | | | — | | | | — | | | | — | | | | — | | | | (0.03 | ) | | | (1.09 | ) |
| | | | |
Net asset value, end of period | | $ | 13.11 | | | $ | 13.61 | | | $ | 12.06 | | | $ | 23.76 | | | $ | 23.68 | | | $ | 21.07 | |
| | | | |
| | | | | | | | | | | | | | | | | | | | | | | | |
| Total Return3 | | | | | | | | | | | | | | | | | | | | | | | | |
Based on net asset value | | | (3.67 | )%4 | | | 12.85 | % | | | (49.24 | )% | | | 0.34 | % | | | 12.57 | % | | | 6.63 | % |
| | | | |
| | | | | | | | | | | | | | | | | | | | | | | | |
| Ratios to Average Net Assets | | | | | | | | | | | | | | | | | | | | | | | | |
Total expenses5,6 | | | 3.85 | %7 | | | 3.18 | % | | | 2.55 | % | | | 2.32 | % | | | 2.31 | % | | | 2.16 | % |
| | | | |
Total expenses after fees waived and/or reimbursed and paid indirectly5 | | | 2.05 | %7 | | | 2.09 | % | | | 2.10 | % | | | 2.10 | % | | | 2.10 | % | | | 2.10 | % |
| | | | |
Net investment loss5 | | | (0.99 | )%7 | | | (0.64 | )% | | | (0.90 | )% | | | (1.53 | )% | | | (1.15 | )% | | | (1.56 | )% |
| | | | |
| | | | | | | | | | | | | | | | | | | | | | | | |
| Supplemental Data | | | | | | | | | | | | | | | | | | | | | | | | |
Net assets, end of period (000) | | $ | 121 | | | $ | 409 | | | $ | 966 | | | $ | 3,082 | | | $ | 4,576 | | | $ | 7,687 | |
| | | | |
Portfolio turnover rate | | | 6 | % | | | 44 | % | | | 55 | % | | | 56 | % | | | 33 | % | | | 15 | % |
| | | | |
| | 1 | | Based on average shares outstanding. |
| | 2 | | Distributions for annual periods determined in accordance with U.S. federal income tax regulations. |
| | 3 | | Where applicable, excludes the effects of any sales charges and assumes the reinvestment of distributions. |
| | 4 | | Aggregate total return. |
| | 5 | | Excludes expenses incurred indirectly as a result of investments in underlying funds as follows: |
| | | | | | | | | | | | | | |
| | | Six Months
Ended
March 31, 2017
(Unaudited) | | | | | | | | | | | |
| | | | Year Ended September 30, |
| | | | 2016 | | 2015 | | 2014 | | | 2013 | | 2012 |
Investments in underlying funds | | — | | — | | — | | | 0.01 | % | | — | | — |
| | 6 | | Includes recoupment of past waived and/or reimbursed fees. Excluding the recoupment of past waived and/or reimbursed fees for the years ended September 30, 2015, September 30, 2014 and September 30, 2013, the ratio would have been 2.54%, 2.31% and 2.30%, respectively. There was no financial impact to the expense ratios for the six months ended March 31, 2017 and the years ended September 30, 2016 and September 30, 2012. |
See Notes to Financial Statements.
| | | | | | |
| 34 | | BLACKROCK FUNDS | | MARCH 31, 2017 | | |
| | | | |
| Financial Highlights (concluded) | | | BlackRock Energy & Resources Portfolio | |
| | | | | | | | | | | | | | | | | | | | | | | | |
| | | Investor C | |
| | | Six Months
Ended
March 31, 2017
(Unaudited) | | | Year Ended September 30, | |
| | | | 2016 | | | 2015 | | | 2014 | | | 2013 | | | 2012 | |
| | | | | | | | | | | | | | | | | | | | | | | | |
| Per Share Operating Performance | | | | | | | | | | | | | | | | | | | | | | | | |
Net asset value, beginning of period | | $ | 13.49 | | | $ | 11.96 | | | $ | 23.56 | | | $ | 23.47 | | | $ | 20.88 | | | $ | 20.55 | |
| | | | |
Net investment loss1 | | | (0.07 | ) | | | (0.08 | ) | | | (0.15 | ) | | | (0.36 | ) | | | (0.24 | ) | | | (0.34 | ) |
Net realized and unrealized gain (loss) | | | (0.42 | ) | | | 1.61 | | | | (11.45 | ) | | | 0.45 | | | | 2.86 | | | | 1.84 | |
| | | | |
Net increase (decrease) from investment operations | | | (0.49 | ) | | | 1.53 | | | | (11.60 | ) | | | 0.09 | | | | 2.62 | | | | 1.50 | |
| | | | |
Distributions from:2 | | | | | | | | | | | | | | | | | | | | | | | | |
From net investment income | | | — | | | | — | | | | — | | | | — | | | | — | | | | (0.09 | ) |
From return of capital | | | — | | | | — | | | | — | | | | — | | | | (0.03 | ) | | | (0.34 | ) |
From net realized gain | | | — | | | | — | | | | — | | | | — | | | | — | | | | (0.74 | ) |
| | | | |
Total distributions | | | — | | | | — | | | | — | | | | — | | | | (0.03 | ) | | | (1.17 | ) |
| | | | |
Net asset value, end of period | | $ | 13.00 | | | $ | 13.49 | | | $ | 11.96 | | | $ | 23.56 | | | $ | 23.47 | | | $ | 20.88 | |
| | | | |
| | | | | | | | | | | | | | | | | | | | | | | | |
| Total Return3 | | | | | | | | | | | | | | | | | | | | | | | | |
Based on net asset value | | | (3.63 | )%4 | | | 12.79 | % | | | (49.24 | )% | | | 0.38 | % | | | 12.59 | % | | | 6.57 | % |
| | | | |
| | | | | | | | | | | | | | | | | | | | | | | | |
| Ratios to Average Net Assets | | | | | | | | | | | | | | | | | | | | | | | | |
Total expenses5,6 | | | 2.19 | %7 | | | 2.22 | % | | | 2.13 | % | | | 2.06 | % | | | 2.10 | % | | | 2.07 | % |
| | | | |
Total expenses after fees waived and/or reimbursed and paid indirectly5 | | | 2.05 | %7 | | | 2.08 | % | | | 2.09 | % | | | 2.05 | % | | | 2.09 | % | | | 2.07 | % |
| | | | |
Net investment loss5 | | | (0.98 | )%7 | | | (0.68 | )% | | | (0.88 | )% | | | (1.47 | )% | | | (1.12 | )% | | | (1.50 | )% |
| | | | |
| | | | | | | | | | | | | | | | | | | | | | | | |
| Supplemental Data | | | | | | | | | | | | | | | | | | | | | | | | |
Net assets, end of period (000) | | $ | 32,127 | | | $ | 38,086 | | | $ | 37,967 | | | $ | 83,948 | | | $ | 103,407 | | | $ | 132,808 | |
| | | | |
Portfolio turnover rate | | | 6 | % | | | 44 | % | | | 55 | % | | | 56 | % | | | 33 | % | | | 15 | % |
| | | | |
| | 1 | | Based on average shares outstanding. |
| | 2 | | Distributions for annual periods determined in accordance with U.S. federal income tax regulations. |
| | 3 | | Where applicable, excludes the effects of any sales charges and assumes the reinvestment of distributions. |
| | 4 | | Aggregate total return. |
| | 5 | | Excludes expenses incurred indirectly as a result of investments in underlying funds as follows: |
| | | | | | | | | | | | | | |
| | | Six Months
Ended
March 31, 2017
(Unaudited) | | | | | | | | | | | |
| | | | Year Ended September 30, |
| | | | 2016 | | 2015 | | 2014 | | | 2013 | | 2012 |
Investments in underlying funds | | — | | — | | — | | | 0.01 | % | | — | | — |
| | 6 | | Includes recoupment of past waived and/or reimbursed fees. Excluding the recoupment of past waived and/or reimbursed fees for the year ended September 30, 2014, the ratio would have been 2.05%. There was no financial impact to the expense ratios for the six months ended March 31, 2017 and the years ended September 30, 2016, September 30, 2015, September 30, 2013 and September 30, 2012. |
See Notes to Financial Statements.
| | | | | | |
| | | BLACKROCK FUNDS | | MARCH 31, 2017 | | 35 |
| | | | |
| Notes to Financial Statements | | | | |
1. Organization:
BlackRock FundsSM (the “Trust”) is registered under the Investment Company Act of 1940, as amended (the “1940 Act”), as an open-end management investment company. The Trust is organized as a Massachusetts business trust. The following are referred to herein collectively as the “Funds” or individually, a “Fund” are each a series of the Trust:
| | | | |
| Fund Name | | Herein Referred To As | | Diversification Classification |
BlackRock All-Cap Energy & Resources Portfolio | | All-Cap Energy & Resources | | Non-diversified |
BlackRock Emerging Markets Dividend Fund | | Emerging Markets Dividend | | Non-diversified1 |
BlackRock Energy & Resources Portfolio | | Energy & Resources | | Non-diversified |
| | 1 | | BlackRock Emerging Markets Dividend Fund is currently classified as non-diversified but intends to operate as a diversified fund. |
Each Fund offers multiple classes of shares. All classes of shares have identical voting, dividend, liquidation and other rights and are subject to the same terms and conditions, except that certain classes bear expenses related to the shareholder servicing and distribution of such shares. Institutional and Service Shares are sold only to certain eligible investors. Investor A and Investor C Shares are generally available through financial intermediaries. Investor B Shares are available only through exchanges and dividend and capital gain reinvestments by existing shareholders, and for purchase by certain employer-sponsored retirement plans. Each class has exclusive voting rights with respect to matters relating to its shareholder servicing and distribution expenditures (except that Investor B shareholders may vote on material changes to the Investor A distribution and service plan).
| | | | | | |
| Share Class | | Initial Sales Charge | | CDSC | | Conversion Privilege |
Institutional and Service Shares | | No | | No | | None |
Investor A Shares | | Yes | | No1 | | None |
Investor B Shares | | No | | Yes | | To Investor A Shares after approximately 8 years |
Investor C Shares | | No | | Yes | | None |
| | 1 | | Investor A Shares may be subject to a contingent deferred sales charge (“CDSC”) for certain redemptions where no initial sales charge was paid at the time of purchase. |
The Funds, together with certain other registered investment companies advised by the BlackRock Advisors, LLC (the “Manager”) or its affiliates, are included in a complex of open-end funds referred to as the Equity-Liquidity Complex.
2. Significant Accounting Policies:
The financial statements are prepared in conformity with accounting principles generally accepted in the United States of America (“U.S. GAAP”), which may require management to make estimates and assumptions that affect the reported amounts of assets and liabilities in the financial statements, disclosure of contingent assets and liabilities at the date of the financial statements and the reported amounts of increases and decreases in net assets from operations during the reporting period. Actual results could differ from those estimates. Each Fund is considered an investment company under U.S. GAAP and follows the accounting and reporting guidance applicable to investment companies. Below is a summary of significant accounting policies:
Foreign Currency: Each Fund’s books and records are maintained in U.S. dollars. Purchases and sales of investments are recorded at the rates of exchange prevailing on the respective dates of such transactions. Generally, when the U.S. dollar rises in value against a foreign currency, the investments denominated in that currency will lose value; the opposite effect occurs if the U.S. dollar falls in relative value.
Each Fund does not isolate the portion of the results of operations arising as a result of changes in the exchange rates from the changes in the market prices of investments held or sold for financial reporting purposes. Accordingly, the effects of changes in exchange rates on investments are not segregated in the Statements of Operations from the effects of changes in market prices of those investments, but are included as a component of net realized and unrealized gain (loss) from investments. Each Fund reports realized currency gains (losses) on foreign currency related transactions as components of net realized gain (loss) for financial reporting purposes, whereas such components are generally treated as ordinary income for federal income tax purposes.
Segregation and Collateralization: In cases where a Fund enters into certain investments (e.g., forward foreign currency exchange contracts) that would be treated as “senior securities” for 1940 Act purposes, a Fund may segregate or designate on its books and records cash or liquid assets having a market value at least equal to the amount of its future obligations under such investments. Doing so allows the investment to be excluded from treatment as a “senior security.” Furthermore, if required by an exchange or counterparty agreement, the Funds may be required to deliver/deposit cash and/or securities to/with an exchange, or broker-dealer or custodian as collateral for certain investments or obligations.
Investment Transactions and Investment Income: For financial reporting purposes, investment transactions are recorded on the dates the transactions are entered into (the trade dates). Realized gains and losses on investment transactions are determined on the identified cost basis. Dividend income is recorded on the ex-dividend date. Dividends from foreign securities where the ex-dividend date may have passed are subsequently recorded when the Funds are informed of the ex-dividend date. Under the applicable foreign tax laws, a withholding tax at various rates may be imposed on capital gains, dividends and interest. Income, expenses and realized and unrealized gains and losses are allocated daily to each class based on its relative net
| | | | | | |
| 36 | | BLACKROCK FUNDS | | MARCH 31, 2017 | | |
| | | | |
| Notes to Financial Statements (continued) | | | | |
assets. Emerging Markets Dividend recorded a $18,163 tax accrual on a foreign unrealized capital gains tax position as of March 31, 2017, which is shown as a liability in the Statements of Assets and Liabilities.
Distributions: Distributions paid by the Funds are recorded on the ex-dividend date. The character and timing of distributions are determined in accordance with U.S. federal income tax regulations, which may differ from U.S. GAAP.
Indemnifications: In the normal course of business, a Fund enters into contracts that contain a variety of representations that provide general indemnification. A Fund’s maximum exposure under these arrangements is unknown because it involves future potential claims against a Fund, which cannot be predicted with any certainty.
Other: Expenses directly related to a Fund or its classes are charged to that Fund or the applicable class. Other operating expenses shared by several funds, including other funds managed by the Manager, are prorated among those funds on the basis of relative net assets or other appropriate methods. Expenses directly related to the Funds and other shared expenses prorated to the Funds are allocated daily to each class based on its relative net assets or other appropriate methods.
The Funds have an arrangement with their custodian whereby credits are earned on uninvested cash balances, which could be used to reduce custody fees and/or overdraft charges. The Funds may incur charges on certain uninvested cash balances and overdrafts, subject to certain conditions.
3. Investment Valuation and Fair Value Measurements:
Investment Valuation Policies: The Funds’ investments are valued at fair value (also referred to as “market value” within the financial statements) as of the close of trading on the New York Stock Exchange (“NYSE”) (generally 4:00 p.m., Eastern time). U.S. GAAP defines fair value as the price the Funds would receive to sell an asset or pay to transfer a liability in an orderly transaction between market participants at the measurement date. The Funds determine the fair values of their financial instruments using various independent dealers or pricing services under policies approved by the Board of Trustees of the Trust (the “Board”). The BlackRock Global Valuation Methodologies Committee (the “Global Valuation Committee”) is the committee formed by management to develop global pricing policies and procedures and to oversee the pricing function for all financial instruments.
Fair Value Inputs and Methodologies: The following methods and inputs are used to establish the fair value of each Fund’s assets and liabilities:
| | • | | Equity investments traded on a recognized securities exchange are valued at the official closing price each day, if available. For equity investments traded on more than one exchange, the official closing price on the exchange where the stock is primarily traded is used. Equity investments traded on a recognized exchange for which there were no sales on that day may be valued at the last available bid (long positions) or ask (short positions) price. |
| | • | | Generally, trading in foreign instruments is substantially completed each day at various times prior to the close of trading on the NYSE. Occasionally, events affecting the values of such instruments may occur between the foreign market close and the close of trading on the NYSE that may not be reflected in the computation of each Fund’s net assets. Each business day, the Funds use a pricing service to assist with the valuation of certain foreign exchange-traded equity securities and foreign exchange-traded and over-the-counter (“OTC”) options (the “Systematic Fair Value Price”). Using current market factors, the Systematic Fair Value Price is designed to value such foreign securities and foreign options at fair value as of the close of trading on the NYSE, which follows the close of the local markets. |
| | • | | Investments in open-end U.S. mutual funds are valued at net asset value (“NAV”) per share each business day. |
| | • | | The Funds value their investment in SL Liquidity Series, LLC, Money Market Series (the “Money Market Series”) at fair value, which is ordinarily based upon their pro rata ownership in the underlying fund’s net assets. The Money Market Series seeks current income consistent with maintaining liquidity and preserving capital. Although the Money Market Series is not registered under the 1940 Act, its investments may follow the parameters of investments by a money market fund that is subject to Rule 2a-7 under the 1940 Act. |
| | • | | Securities and other assets and liabilities denominated in foreign currencies are translated into U.S. dollars using exchange rates determined as of the close of trading on the NYSE. Forward foreign currency exchange contracts are valued at the mean between the bid and ask prices and are determined as of the close of trading on the NYSE. Interpolated values are derived when the settlement date of the contract is an interim date for which quotations are not available. |
| | | | | | |
| | | BLACKROCK FUNDS | | MARCH 31, 2017 | | 37 |
| | | | |
| Notes to Financial Statements (continued) | | | | |
| | • | | Participation notes are valued on the basis of last available bid prices or current market quotations provided by dealers or pricing services. |
If events (e.g., a company announcement, market volatility or a natural disaster) occur that are expected to materially affect the value of such investments, or in the event that the application of these methods of valuation results in a price for an investment that is deemed not to be representative of the market value of such investment, or if a price is not available, the investment will be valued by the Global Valuation Committee, or its delegate, in accordance with a policy approved by the Board as reflecting fair value (“Fair Valued Investments”). The fair valuation approaches that may be used by the Global Valuation Committee will include Market approach, Income approach and Cost approach. Valuation techniques such as discounted cash flow, use of market comparables and matrix pricing are types of valuation approaches and typically used in determining fair value. When determining the price for Fair Valued Investments, the Global Valuation Committee, or its delegate, seeks to determine the price that each Fund might reasonably expect to receive or pay from the current sale or purchase of that asset or liability in an arm’s-length transaction. Fair value determinations shall be based upon all available factors that the Global Valuation Committee, or its delegate, deems relevant and consistent with the principles of fair value measurement.
The Global Valuation Committee, or its delegate, employs various methods for calibrating valuation approaches for investments where an active market does not exist, including regular due diligence of each Fund’s pricing vendors, regular reviews of key inputs and assumptions, transactional back-testing or disposition analysis to compare unrealized gains and losses to realized gains and losses, reviews of missing or stale prices and large movements in market values and reviews of any market related activity. The pricing of all Fair Valued Investments is subsequently reported to the Board or a committee thereof on a quarterly basis. As a result of the inherent uncertainty in valuation of these investments, the fair values may differ from the values that would have been used had an active market existed.
For investments in equity or debt issued by privately-held companies or funds (“Private Company” or collectively, the “Private Companies”) and other Fair Valued Investments, the fair valuation approaches that are used by third party pricing services utilize one or a combination of, but not limited to, the following inputs.
| | | | |
| | | Standard Inputs Generally Considered By Third Party Pricing Services |
Market approach | | (i) | | recent market transactions, including subsequent rounds of financing, in the underlying investment or comparable issuers; |
| | (ii) | | recapitalizations and other transactions across the capital structure; and |
| | | (iii) | | market multiples of comparable issuers. |
| | |
Income approach | | (i) | | future cash flows discounted to present and adjusted as appropriate for liquidity, credit, and/or market risks; |
| | (ii) | | quoted prices for similar investments or assets in active markets; and |
| | | (iii) | | other risk factors, such as interest rates, yield curves, volatilities, prepayment speeds, loss severities, credit risks, recovery rates, liquidation amounts and/or default rates. |
| | |
Cost approach | | (i) | | audited or unaudited financial statements, investor communications and financial or operational metrics issued by the Private Company; |
| | (ii) | | changes in the valuation of relevant indices or publicly traded companies comparable to the Private Company; |
| | (iii) | | relevant news and other public sources; and |
| | | (iv) | | known secondary market transactions in the Private Company’s interests and merger or acquisition activity in companies comparable to the Private Company. |
Investments in series of preferred stock issued by Private Companies are typically valued utilizing Market approach in determining the enterprise value of the company. Such investments often contain rights and preferences that differ from other series of preferred and common stock of the same issuer. Valuation techniques such as an option pricing model (“OPM”), a probability weighted expected return model (“PWERM”) or a hybrid of those techniques are used in allocating enterprise value of the company, as deemed appropriate under the circumstances. The use of OPM and PWERM techniques involve a determination of the exit scenarios of the investment in order to appropriately allocate the enterprise value of the company among the various parts of its capital structure.
The Private Companies are not subject to the public company disclosure, timing, and reporting standards as other investments held by a Fund. Typically, the most recently available information by a Private Company is as of a date that is earlier than the date a Fund is calculating its NAV. This factor may result in a difference between the value of the investment and the price a Fund could receive upon the sale of the investment.
Fair Value Hierarchy: Various inputs are used in determining the fair value of investments and derivative financial instruments. These inputs to valuation techniques are categorized into a fair value hierarchy consisting of three broad levels for financial statement purposes as follows:
| | • | | Level 1 — unadjusted price quotations in active markets/exchanges for identical assets or liabilities that each Fund has the ability to access |
| | | | | | |
| 38 | | BLACKROCK FUNDS | | MARCH 31, 2017 | | |
| | | | |
| Notes to Financial Statements (continued) | | | | |
| | • | | Level 2 — other observable inputs (including, but not limited to, quoted prices for similar assets or liabilities in markets that are active, quoted prices for identical or similar assets or liabilities in markets that are not active, inputs other than quoted prices that are observable for the assets or liabilities (such as interest rates, yield curves, volatilities, prepayment speeds, loss severities, credit risks and default rates) or other market–corroborated inputs) |
| | • | | Level 3 — unobservable inputs based on the best information available in the circumstances, to the extent observable inputs are not available (including each Fund’s own assumptions used in determining the fair value of investments and derivative financial instruments) |
The hierarchy gives the highest priority to unadjusted quoted prices in active markets for identical assets or liabilities (Level 1 measurements) and the lowest priority to unobservable inputs (Level 3 measurements). Accordingly, the degree of judgment exercised in determining fair value is greatest for instruments categorized in Level 3. The inputs used to measure fair value may fall into different levels of the fair value hierarchy. In such cases, for disclosure purposes, the fair value hierarchy classification is determined based on the lowest level input that is significant to the fair value measurement in its entirety. Investments classified within Level 3 have significant unobservable inputs used by the Global Valuation Committee in determining the price for Fair Valued Investments. Level 3 investments include equity or debt issued by Private Companies. There may not be a secondary market, and/or there are a limited number of investors. Level 3 investments may also be adjusted to reflect illiquidity and/or non-transferability, with the amount of such discount estimated by the Global Valuation Committee in the absence of market information.
Changes in valuation techniques may result in transfers into or out of an assigned level within the hierarchy. In accordance with each Fund’s policy, transfers between different levels of the fair value hierarchy are deemed to have occurred as of the beginning of the reporting period. The categorization of a value determined for investments and derivative financial instruments is based on the pricing transparency of the investments and derivative financial instruments and is not necessarily an indication of the risks associated with investing in those securities.
4. Securities and Other Investments:
Participation Notes: Participation notes (“P-Notes”) are promissory notes issued by banks or broker-dealers that are designed to offer a return measured by the change in the value of the underlying security or basket of securities (the “underlying security”) while not holding the actual shares of the underlying security. These investments are typically used to gain exposure to securities traded in foreign markets that may be restricted due to country-specific regulations. When the P-Note matures, the issuer will pay or receive the difference between the value of the underlying security at the time of the purchase and the underlying security’s value at maturity of the P-Notes. Income received on P-Notes is recorded by a Fund as dividend income in the Statements of Operations. An investment in a P-Note involves additional risks beyond the risks normally associated with a direct investment in the underlying security. While the holder of a P-Note is entitled to receive from the bank or broker-dealer any dividends paid by the underlying security, the holder is not entitled to the same rights (e.g., voting rights) as a direct owner of the underlying security. P-Notes are considered general unsecured contractual obligations of the bank or broker-dealer. The holder of a P-Note must rely on the creditworthiness of the issuer for its investment returns on the P-Notes and has no rights against the issuer of the underlying security. A P-Note may be more volatile and less liquid than other investments held by a Fund since the P-Note generally is dependent on the liquidity in the local trading market for the underlying security.
Warrants: Warrants entitle a Fund to purchase a specified number of shares of common stock and are non-income producing. The purchase price and number of shares are subject to adjustment under certain conditions until the expiration date of the warrants, if any. If the price of the underlying stock does not rise above the strike price before the warrant expires, the warrant generally expires without any value and a Fund will lose any amount it paid for the warrant. Thus, investments in warrants may involve more risk than investments in common stock. Warrants may trade in the same markets as their underlying stock; however, the price of the warrant does not necessarily move with the price of the underlying stock.
Securities Lending: Certain Funds may lend their securities to approved borrowers, such as brokers, dealers and other financial institutions. The borrower pledges and maintains with the Funds collateral consisting of cash, an irrevocable letter of credit issued by a bank, or securities issued or guaranteed by the U.S. Government. The initial collateral received by each Fund is required to have a value of at least 102% of the current value of the loaned securities for securities traded on U.S. exchanges and a value of at least 105% for all other securities. The collateral is maintained thereafter at a value equal to at least 100% of the current market value of the securities on loan. The market value of the loaned securities is determined at the close of each business day of the Fund and any additional required collateral is delivered to the Fund, or excess collateral returned by the Fund, on the next business day. During the term of the loan, the Funds are entitled to all distributions made on or in respect of the loaned securities but does not receive interest income on securities received as collateral. Loans of securities are terminable at any time and the borrower, after notice, is required to return borrowed securities within the standard time period for settlement of securities transactions.
The market value of any securities on loan, all of which were classified as common stocks in the Funds’ Schedules of Investments, and the value of any related collateral are shown separately in the Statements of Assets and Liabilities as a component of investments at value — unaffiliated, and collateral on securities loaned at value, respectively. As of period end, any securities on loan were collateralized by cash and/or U.S. Government obligations. Cash collateral invested by the securities lending agent, BlackRock Investment Management, LLC (“BIM”), if any, is disclosed in the Schedules of Investments.
| | | | | | |
| | | BLACKROCK FUNDS | | MARCH 31, 2017 | | 39 |
| | | | |
| Notes to Financial Statements (continued) | | | | |
Securities lending transactions are entered into by the Funds under Master Securities Lending Agreements (each, an “MSLA”) which provide the right, in the event of default (including bankruptcy or insolvency), for the non-defaulting party to liquidate the collateral and calculate a net exposure to the defaulting party or request additional collateral. In the event that a borrower defaults, each Fund, as lender, would offset the market value of the collateral received against the market value of the securities loaned. When the value of the collateral is greater than that of the market value of the securities loaned, the lender is left with a net amount payable to the defaulting party. However, bankruptcy or insolvency laws of a particular jurisdiction may impose restrictions on or prohibitions against such a right of offset in the event of an MSLA counterparty’s bankruptcy or insolvency. Under the MSLA, absent an event of default the borrower can resell or re-pledge the loaned securities, and a Fund can reinvest cash collateral received in connection with loaned securities. Upon an event of default, the parties’ obligations to return the securities or collateral to the other party are extinguished, and the parties can resell or re-pledge the loaned securities or the collateral received in connection with the loaned securities in order to satisfy the defaulting party’s net payment obligation for all transactions under the MSLA. The defaulting party remains liable for any deficiency.
The risks of securities lending include the risk that the borrower may not provide additional collateral when required or may not return the securities when due. To mitigate these risks, the Funds benefit from a borrower default indemnity provided by BIM. BIM’s indemnity allows for full replacement of the securities loaned if the collateral received does not cover the value on the securities loaned in the event of borrower default. Each Fund could incur a loss if the value of an investment purchased with cash collateral falls below the market value of loaned securities or if the value of an investment purchased with cash collateral falls below the value of the original cash collateral received.
5. Derivative Financial Instruments:
The Funds engage in various portfolio investment strategies using derivative contracts both to increase the returns of the Funds and/or to manage their exposure to certain risks such as credit risk, equity risk, interest rate risk, foreign currency exchange rate risk, commodity price risk or other risks (e.g., inflation risk). Derivative financial instruments categorized by risk exposure are included in the Schedules of Investments. These contracts may be transacted on an exchange or OTC.
Forward Foreign Currency Exchange Contracts: Certain Funds enter into forward foreign currency exchange contracts to gain or reduce exposure to foreign currencies (foreign currency exchange rate risk).
A forward foreign currency exchange contract is an agreement between two parties to buy and sell a currency at a set exchange rate on a specified date. These contracts help to manage the overall exposure to the currencies in which some of the investments held by the Funds are denominated and in some cases, may be used to obtain exposure to a particular market.
The contract is marked to market daily and the change in market value is recorded as unrealized appreciation (depreciation) in the Statements of Assets and Liabilities. When a contract is closed, a realized gain or loss is recorded in the Statements of Operations equal to the difference between the value at the time it was opened and the value at the time it was closed. Non-deliverable forward foreign currency exchange contracts are settled with the counterparty in cash without the delivery of foreign currency. The use of forward foreign currency exchange contracts involves the risk that the value of a forward foreign currency exchange contract changes unfavorably due to movements in the value of the referenced foreign currencies.
Master Netting Arrangements: In order to define their contractual rights and to secure rights that will help them mitigate their counterparty risk, the Funds may enter into an International Swaps and Derivatives Association, Inc. Master Agreement (“ISDA Master Agreement”) or similar agreement with their counterparties. An ISDA Master Agreement is a bilateral agreement between each Fund and a counterparty that governs certain OTC derivatives and typically contains, among other things, collateral posting terms and netting provisions in the event of a default and/or termination event. Under an ISDA Master Agreement, each Fund may, under certain circumstances, offset with the counterparty certain derivative financial instruments’ payables and/or receivables with collateral held and/or posted and create one single net payment. The provisions of the ISDA Master Agreement typically permit a single net payment in the event of default including the bankruptcy or insolvency of the counterparty. Bankruptcy or insolvency laws of a particular jurisdiction may restrict or prohibit the right of offset in bankruptcy, insolvency or other events. In addition, certain ISDA Master Agreements allow counterparties to terminate derivative contracts prior to maturity in the event the Funds’ net assets decline by a stated percentage or the Funds fail to meet the terms of their ISDA Master Agreements. The result would cause the Funds to accelerate payment of any net liability owed to the counterparty.
Collateral Requirements: For derivatives traded under an ISDA Master Agreement, the collateral requirements are typically calculated by netting the mark-to-market amount for each transaction under such agreement and comparing that amount to the value of any collateral currently pledged by the Funds and the counterparty.
Cash collateral that has been pledged to cover obligations of the Funds and cash collateral received from the counterparty, if any, is reported separately on the Statements of Assets and Liabilities as cash pledged as collateral and cash received as collateral, respectively. Non-cash collateral pledged by the Funds, if any, is noted in the Schedules of Investments. Generally, the amount of collateral due from or to a counterparty is subject to a certain minimum transfer amount threshold before a transfer is required, which is determined at the close of business of the Funds. Any additional required collateral is delivered to/pledged by the Funds on the next business day. Typically, the counterparty is not permitted to sell, re-pledge or use cash and
| | | | | | |
| 40 | | BLACKROCK FUNDS | | MARCH 31, 2017 | | |
| | | | |
| Notes to Financial Statements (continued) | | | | |
non-cash collateral it receives. A Fund generally agrees not to use non-cash collateral that it receives but may, absent default or certain other circumstances defined in the underlying ISDA Master Agreement, be permitted to use cash collateral received. In such cases, interest may be paid pursuant to the collateral arrangement with the counterparty. To the extent amounts due to the Funds from their counterparties are not fully collateralized, they bear the risk of loss from counterparty non-performance. Likewise, to the extent the Funds have delivered collateral to a counterparty and stand ready to perform under the terms of their agreement with such counterparty, they bear the risk of loss from a counterparty in the amount of the value of the collateral in the event the counterparty fails to return such collateral. Based on the terms of agreements, collateral may not be required for all derivative contracts.
6. Investment Advisory Agreement and Other Transactions with Affiliates:
The PNC Financial Services Group, Inc. is the largest stockholder and an affiliate of BlackRock, Inc. (“BlackRock”) for 1940 Act purposes.
Investment Advisory: The Trust, on behalf of the Funds, entered into an Investment Advisory Agreement with the Manager, the Funds’ investment adviser, an indirect, wholly-owned subsidiary of BlackRock, to provide investment advisory services. The Manager is responsible for the management of each Fund’s portfolio and provides the personnel, facilities, equipment and certain other services necessary to the operations of each Fund.
For such services, each Fund, except Emerging Markets Dividend, pays the Manager a monthly fee at an annual rate equal to the following percentages of the average daily value of each Fund’s net assets:
| | | | | |
| Average Daily Net Assets | | Investment Advisory Fee |
First $1 Billion | | | | 0.750 | % |
$1 Billion - $2 Billion | | | | 0.700 | % |
$2 Billion - $3 Billion | | | | 0.675 | % |
Greater than $3 Billion | | | | 0.650 | % |
Emerging Markets Dividend pays the Manager a monthly fee at an annual rate equal to the following percentages of the average daily value of the Fund’s net assets:
| | | | | |
| Average Daily Net Assets | | Investment Advisory Fee |
First $1 Billion | | | | 1.00 | % |
$1 Billion - $3 Billion | | | | 0.94 | % |
$3 Billion - $5 Billion | | | | 0.90 | % |
$5 Billion - $10 Billion | | | | 0.87 | % |
Greater than $10 Billion | | | | 0.85 | % |
With respect to each Fund, the Manager entered into separate sub-advisory agreements with BlackRock International Limited (“BIL”), an affiliate of the Manager. The Manager pays BIL, for services it provides, a monthly fee that is a percentage of the investment advisory fees paid by each Fund to the Manager.
With respect to Emerging Markets Dividend, the Manager entered into a separate sub-advisory agreement with BlackRock Asset Management North Asia Limited (“BAMNAL”), an affiliate of the Manager. The Manager pays BAMNAL, for services it provides, a monthly fee that is a percentage of the investment advisory fees paid by the Fund to the Manager.
Service and Distribution Fees: The Trust, on behalf of the Funds, entered into a Distribution Agreement and a Distribution and Service Plan with BlackRock Investments, LLC (“BRIL”), an affiliate of the Manager. Pursuant to the Distribution and Service Plan and in accordance with Rule 12b-1 under the 1940 Act, each Fund pays BRIL ongoing service and distribution fees. The fees are accrued daily and paid monthly at annual rates based upon the average daily net assets of the relevant share class of each Fund as follows:
| | | | | | | | | | | | | | | | | | | | |
| | | Service | | Investor A | | Investor B | | Investor C |
Service Fee | | | | 0.25 | % | | | | 0.25 | % | | | | 0.25 | % | | | | 0.25 | % |
Distribution Fee | | | | — | | | | | — | | | | | 0.75 | % | | | | 0.75 | % |
BRIL and broker-dealers, pursuant to sub-agreements with BRIL, provide shareholder servicing and distribution services to the Funds. The ongoing service and/or distribution fee compensates BRIL and each broker-dealer for providing shareholder servicing and/or distribution related services to the shareholders.
| | | | | | |
| | | BLACKROCK FUNDS | | MARCH 31, 2017 | | 41 |
| | | | |
| Notes to Financial Statements (continued) | | | | |
For the six months ended March 31, 2017, the following table shows the class specific service and distribution fees borne directly by each share class of each Fund:
| | | | | | | | | | | | | | | | | | | | | | | | | |
| | | Service | | Investor A | | Investor B | | Investor C | | Total |
All-Cap Energy & Resources | | | $ | 1,017 | | | | | $ 73,076 | | | | $ | 1,905 | | | | | $157,754 | | | | $ | 233,752 | |
Emerging Markets Dividend | | | | — | | | | | $ 3,205 | | | | | — | | | | | $ 2,651 | | | | $ | 5,856 | |
Energy & Resources | | | | — | | | | | $202,539 | | | | $ | 1,369 | | | | | $179,846 | | | | $ | 383,754 | |
Administration: The Trust, on behalf of the Funds, entered into an Administration Agreement with the Manager, an indirect, wholly-owned subsidiary of BlackRock, to provide administrative services. For these services, the Manager receives an administration fee computed daily and payable monthly, based on a percentage of the average daily net assets of each Fund. The administration fee, which is shown as administration in the Statements of Operations, is paid at the annual rates below.
| | | | | |
| Average Daily Net Assets | | Administration Fee |
First $500 Million | | | | 0.0425 | % |
$500 Million - $1 Billion | | | | 0.0400 | % |
$1 Billion - $2 Billion | | | | 0.0375 | % |
$2 Billion - $4 Billion | | | | 0.0350 | % |
$4 Billion - $13 Billion | | | | 0.0325 | % |
Greater than $13 Billion | | | | 0.0300 | % |
In addition, the Manager charges each of the share classes an administration fee, which is shown as administration — class specific in the Statements of Operations, at an annual rate of 0.02% of the average daily net assets of each respective class.
For the six months ended March 31, 2017, the following table shows the class specific administration fees borne directly by each share class of each Fund:
| | | | | | | | | | | | | | | | | | | | | | | | | | | | | | |
| | | Institutional | | Service | | Investor A | | Investor B | | Investor C | | Total |
All-Cap Energy & Resources | | | | $2,546 | | | | | $81 | | | | | $ 5,847 | | | | | $38 | | | | | $3,155 | | | | $ | 11,667 | |
Emerging Markets Dividend | | | | $ 225 | | | | | — | | | | | $ 256 | | | | | — | | | | | $ 53 | | | | $ | 534 | |
Energy & Resources | | | | $7,604 | | | | | — | | | | | $16,203 | | | | | $27 | | | | | $3,597 | | | | $ | 27,431 | |
The Manager may have, at its discretion, voluntarily waived all or any portion of its administration fees for a Fund or a share class, which are included in administration fees waived — class specific in the Statements of Operations. For the six months ended March 31, 2017, the administration fees waived at the Fund level for Emerging Markets Dividend was $1,143.
Transfer Agent: Pursuant to written agreements, certain financial intermediaries, some of which may be affiliates, provide the Funds with sub-accounting, recordkeeping, sub-transfer agency and other administrative services with respect to sub-accounts they service. For these services, these entities receive an asset-based fee or an annual fee per shareholder account, which will vary depending on share class and/or net assets. For the six months ended March 31, 2017, All-Cap Energy & Resources and Energy & Resources paid the following amounts to affiliates of BlackRock in return for these services, which are included in transfer agent — class specific in the Statements of Operations:
| | | | | | | | | | | | | | | |
| | | Institutional | | Investor A | | Total |
All-Cap Energy & Resources | | | | — | | | | | $ 4 | | | | $ | 4 | |
Energy & Resources | | | | $7,702 | | | | | $96 | | | | $ | 7,798 | |
The Manager maintains a call center that is responsible for providing certain shareholder services to the Funds. Shareholder services include responding to inquiries and processing subscriptions and redemptions based upon instructions from shareholders. For the six months ended March 31, 2017, each Fund reimbursed the Manager the following amounts for costs incurred in running the call center, which are included in transfer agent — class specific in the Statements of Operations:
| | | | | | | | | | | | | | | | | | | | | | | | | | | | | | |
| | | Institutional | | Service | | Investor A | | Investor B | | Investor C | | Total |
All-Cap Energy & Resources | | | | $411 | | | | | — | | | | | $ 5,124 | | | | | $370 | | | | | $1,017 | | | | $ | 6,922 | |
Emerging Markets Dividend | | | | $ 42 | | | | | — | | | | | $ 106 | | | | | — | | | | | $ 57 | | | | $ | 205 | |
Energy & Resources | | | | $591 | | | | | — | | | | | $12,154 | | | | | $325 | | | | | $1,570 | | | | $ | 14,640 | |
| | | | | | |
| 42 | | BLACKROCK FUNDS | | MARCH 31, 2017 | | |
| | | | |
| Notes to Financial Statements (continued) | | | | |
For the six months ended March 31, 2017, the following table shows the class specific transfer agent fees borne directly by each class of each Fund:
| | | | | | | | | | | | | | | | | | | | | | | | | | | | | | |
| | | Institutional | | Service | | Investor A | | Investor B | | Investor C | | Total |
All-Cap Energy & Resources | | | | $18,825 | | | | $ | 665 | | | | $ | 74,691 | | | | $ | 2,884 | | | | $ | 35,434 | | | | $ | 132,499 | |
Emerging Markets Dividend | | | | $ 4,710 | | | | | — | | | | $ | 2,594 | | | | | — | | | | $ | 807 | | | | $ | 8,111 | |
Energy & Resources | | | | $20,066 | | | | | — | | | | $ | 203,694 | | | | $ | 2,625 | | | | $ | 46,382 | | | | $ | 272,767 | |
Other Fees: For the six months ended March 31, 2017, affiliates earned underwriting discounts, direct commissions and dealer concessions on sales of each Fund’s Investor A Shares as follows:
| | | | |
All-Cap Energy & Resources | | $ | 2,268 | |
Emerging Markets Dividend | | $ | 628 | |
Energy & Resources | | $ | 4,644 | |
For the six months ended March 31, 2017, affiliates received CDSCs as follows:
| | | | | | | | | | | | | | | |
| | | Investor A | | Investor B | | Investor C |
All-Cap Energy & Resources | | | | — | | | | | — | | | | $ | 1,728 | |
Emerging Markets Dividend | | | | — | | | | | — | | | | $ | 52 | |
Energy & Resources | | | $ | 113 | | | | | — | | | | $ | 6,659 | |
Expense Limitations, Waivers, Reimbursements and Recoupments: With respect to each Fund, the Manager agreed to waive and/or reimburse fees or expenses in order to limit expenses, excluding interest expense, dividend expense, tax expense, acquired fund fees and expenses and certain other fund expenses, which constitute extraordinary expenses not incurred in the ordinary course of each Fund’s business (“expense limitation”). The current expense limitations as a percentage of average daily net assets are as follows:
| | | | | | | | | | | | | | | | | | | | | | | | | |
| | | All-Cap
Energy &
Resources | | Emerging
Markets
Dividend | | Energy &
Resources |
| | | Contractual1 | | Voluntary2,3 | | Contractual1 | | Contractual1 | | Voluntary2,3 |
Institutional | | | | 0.96 | % | | | | 0.91 | % | | | | 1.50 | % | | | | 1.07 | % | | | | 1.02 | % |
Service | | | | 1.38 | % | | | | 1.33 | % | | | | N/A | | | | | 1.38 | %4 | | | | N/A | |
Investor A | | | | 1.38 | % | | | | 1.33 | % | | | | 1.75 | % | | | | 1.38 | % | | | | 1.33 | % |
Investor B | | | | 2.10 | % | | | | 2.05 | % | | | | N/A | | | | | 2.10 | % | | | | 2.05 | % |
Investor C | | | | 2.10 | % | | | | 2.05 | % | | | | 2.50 | % | | | | 2.10 | % | | | | 2.05 | % |
Class R | | | | 1.83 | %4 | | | | N/A | | | | | N/A | | | | | 1.94 | %4 | | | | N/A | |
| 1 | | The Manager has agreed not to reduce or discontinue this contractual waiver or reimbursement prior to January 31, 2018 unless approved by the Board, including a majority of the trustees who are not “interested persons” of the Trust, as defined in the 1940 Act (“Independent Trustees”) or by a vote of a majority of the outstanding voting securities of the Fund. |
| 2 | | The voluntary waiver or reimbursement may be reduced or discontinued at any time without notice. |
| 3 | | Effective June 15, 2016. |
| 4 | | There were no shares outstanding as of March 31, 2017. |
These amounts are included in fees waived by the Manager in the Statements of Operations. For the six months ended March 31, 2017, the amounts waived were as follows:
| | | | |
All-Cap Energy & Resources | | $ | 61,809 | |
Emerging Markets Dividend | | $ | 26,900 | |
| | | | | | |
| | | BLACKROCK FUNDS | | MARCH 31, 2017 | | 43 |
| | | | |
| Notes to Financial Statements (continued) | | | | |
These amounts waived and/or reimbursed are included in fees waived by the Manager, and shown as administration fees waived, administration fees waived — class specific, transfer agent fees waived — class specific, transfer agent fees reimbursed — class specific and expenses reimbursed by the Manager, respectively, in the Statements of Operations. For the six months ended March 31, 2017, class specific expense waivers or reimbursements are as follows:
| | | | | | | | | | | | | | | | | | | | | | | | | | | | | | |
| Administration Fees Waived | | Institutional | | Service | | Investor A | | Investor B | | Investor C | | Total |
All-Cap Energy & Resources | | | | $2,546 | | | | | $42 | | | | | $ 5,846 | | | | | $37 | | | | | $3,103 | | | | | $11,574 | |
Emerging Markets Dividend | | | | $ 225 | | | | | — | | | | | $ 256 | | | | | — | | | | | $ 53 | | | | | $ 534 | |
Energy & Resources | | | | — | | | | | — | | | | | $16,203 | | | | | $27 | | | | | $3,534 | | | | | $19,764 | |
| | | | | | | | | | | | | | | | | | | | | | | | | | | | | | |
| Transfer Agent Fees Waived | | Institutional | | Service | | Investor A | | Investor B | | Investor C | | Total |
All-Cap Energy & Resources | | | | $411 | | | | | — | | | | | $ 5,108 | | | | | $370 | | | | | $1,015 | | | | | $ 6,904 | |
Emerging Markets Dividend | | | | $ 42 | | | | | — | | | | | $ 106 | | | | | — | | | | | $ 57 | | | | | $ 205 | |
Energy & Resources | | | | — | | | | | — | | | | | $12,154 | | | | | $325 | | | | | $1,549 | | | | | $14,028 | |
| | | | | | | | | | | | | | | | | | | | | | | | | | | | | | |
| Transfer Agent Fees Reimbursed | | Institutional | | Service | | Investor A | | Investor B | | Investor C | | Total |
All-Cap Energy & Resources | | | | $18,413 | | | | | $34 | | | | | $20,045 | | | | $ | 2,309 | | | | | $13,100 | | | | | $53,901 | |
Emerging Markets Dividend | | | | $ 4,631 | | | | | — | | | | | $ 2,433 | | | | | — | | | | | $ 744 | | | | | $ 7,808 | |
Energy & Resources | | | | — | | | | | — | | | | | $50,960 | | | | $ | 2,110 | | | | | $19,760 | | | | | $72,830 | |
With respect to each Fund, the Manager voluntarily agreed to waive its investment advisory fees by the amount of investment advisory fees each Fund pays to the Manager indirectly through its investment in affiliated money market funds (the “affiliated money market fund waiver”). These amounts are included in fees waived by the Manager in the Statements of Operations. The amount of waivers and/or reimbursements of fees and expenses made pursuant to the expense limitation caps, as applicable, will be reduced by the amount of the affiliated money market fund waiver. For the six months ended March 31, 2017, the amount waived were as follows:
| | | | |
All-Cap Energy & Resources | | $ | 251 | |
Emerging Markets Dividend | | $ | 8 | |
Energy & Resources | | $ | 686 | |
The Manager has voluntarily agreed to waive its investment advisory fee with respect to any portion of each Fund’s assets invested in affiliated equity and fixed-income mutual funds and affiliated exchange-traded funds that have a contractual management fee. Effective January 27, 2017, the waiver became contractual through January 31, 2018. This contractual agreement may be terminated with respect to each Fund upon 90 days’ notice by a majority of independent trustees or by a vote of a majority of the outstanding voting securities of the Funds. These amounts are included in fees waived by the Manager in the Statements of Operations. For the six months ended March 31, 2017, there were no fees waived by the manager.
In addition, for the six months ended March 31, 2017, the Manager reimbursed Emerging Markets Dividend $64,391, which is shown as expense reimbursed by the Manager in the Statements of Operations.
With respect to the contractual expense caps, if during a Fund’s fiscal year the operating expenses of a share class, that at any time during the prior two fiscal years received a waiver and/or reimbursement from the Manager, are less than the expense cap for that share class, the Manager is entitled to be reimbursed by such share class up to the lesser of the following expenses:
| | (a) | | The amount of fees waived and/or expenses reimbursed during those prior two fiscal years under the agreement |
| | (b) | | The amount by which the expense cap for that share class exceeds the operating expenses of the share class for the current fiscal year, provided that: |
| | • | | The Fund, of which the share class is a part, has more than $50 million in assets for the fiscal year; and |
| | • | | The Manager or an affiliate continues to serve as the Fund’s investment adviser or administrator. |
In the event the expense cap for a share class is changed subsequent to a fiscal year in which the Manager becomes entitled to reimbursement for fees waived or reimbursed, the amount available to reimburse the Manager shall be calculated by reference to the expense cap for that share class in effect at the time the Manager became entitled to receive such reimbursement, rather than the subsequently changed expense cap for that share class.
| | | | | | |
| 44 | | BLACKROCK FUNDS | | MARCH 31, 2017 | | |
| | | | |
| Notes to Financial Statements (continued) | | | | |
For the six months ended March 31, 2017, the Manager recouped the following fund level and class specific waivers and/or reimbursements previously recorded by the Funds:
| | | | | | | | | | | | | | | | |
| | | Institutional | | | Service | | Investor A | | Investor B | | Investor C | | Total | |
All-Cap Energy & Resources | | | — | | | $22 | | — | | $5 | | $207 | | $ | 234 | |
Energy & Resources | | $ | 15,529 | | | — | | — | | $3 | | $210 | | $ | 15,742 | |
On March 31, 2017, the fund level and class specific waivers and/or reimbursement subject to possible future recoupment under the expense limitation agreement are as follows:
| | | | | | | | | | | | |
| | | Expires September 30, | |
| | | 2017 | | | 2018 | | | 2019 | |
All-Cap Energy & Resources | | | | | | | | | | | | |
Fund Level | | $ | 12,781 | | | $ | 69,954 | | | $ | 61,809 | |
Institutional | | $ | 44,373 | | | $ | 50,533 | | | $ | 21,370 | |
Service | | $ | 326 | | | $ | 616 | | | $ | 76 | |
Investor A | | $ | 59,543 | | | $ | 69,192 | | | $ | 30,999 | |
Investor B | | $ | 8,807 | | | $ | 5,141 | | | $ | 2,716 | |
Investor C | | $ | 30,844 | | | $ | 43,298 | | | $ | 17,218 | |
Emerging Markets Dividend | | | | | | | | | | | | |
Fund Level | | $ | 216,415 | | | $ | 213,486 | | | $ | 92,434 | |
Institutional | | $ | 1,158 | | | $ | 1,542 | | | $ | 4,898 | |
Investor A | | $ | 3,579 | | | $ | 3,721 | | | $ | 2,795 | |
Investor C | | $ | 1,484 | | | $ | 1,381 | | | $ | 854 | |
Energy & Resources | | | | | | | | | | | | |
Institutional | | | — | | | $ | 27,064 | | | | — | |
Investor A | | $ | 59,302 | | | $ | 93,725 | | | $ | 40,459 | |
Investor B | | $ | 8,068 | | | $ | 7,589 | | | $ | 750 | |
Investor C | | $ | 21,596 | | | $ | 48,528 | | | $ | 16,791 | |
Securities Lending: The U.S. Securities and Exchange Commission (“SEC”) has issued an exemptive order which permits BIM, an affiliate of the Manager, to serve as securities lending agent for the Funds, subject to applicable conditions. As securities lending agent, BIM bears all operational costs directly related to securities lending. The Funds are responsible for expenses in connection with the investment of cash collateral received for securities on loan (the “collateral investment expenses”). The cash collateral is invested in a private investment company managed by the Manager or its affiliates. However, BIM has agreed to cap the collateral investment expenses of the private investment company to an annual rate of 0.04%. The investment adviser to the private investment company will not charge any advisory fees with respect to shares purchased by the Funds. If the private investment company’s weekly liquid assets fall below 30% of its total assets, BIM, as managing member of the private investment company, is permitted at any time, if it determines it to be in the best interests of the private investment company, to impose a liquidity fee of up to 2% of the value of units withdrawn or impose a redemption gate that temporarily suspends the right of withdrawal out of the private investment company. In addition, if the private investment company’s weekly liquid assets fall below 10% of its total assets at the end of any business day, the private investment company will impose a liquidity fee in the default amount of 1% of the amount withdrawn, generally effective as of the next business day, unless BIM determines that a higher (not to exceed 2%) or lower fee level or not imposing a liquidity fee is in the best interests of the private investment company. The shares of the private investment company purchased by the Funds would be subject to any such liquidity fee or redemption gate imposed.
Securities lending income is equal to the total of income earned from the reinvestment of cash collateral, net of fees and other payments to and from borrowers of securities, and less the collateral investment expenses. Each Fund retains a portion of securities lending income and remits a remaining portion to BIM as compensation for its services as securities lending agent. Pursuant to a securities lending agreement, BIM may lend securities only when the difference between the borrower rebate rate and the risk free rate exceeds a certain level (such securities, the “specials only securities”).
Pursuant to such agreement, each Fund retains 80% of securities lending income. In addition, commencing the business day following the date that the aggregate securities lending income earned across certain funds in the Equity-Liquidity Complex in a calendar year exceeds a specified threshold, each Fund, pursuant to the securities lending agreement, will retain for the remainder of the calendar year securities lending income in an amount equal to 85% of securities lending income.
The share of securities lending income earned by each Fund is shown as securities lending income — affiliated — net in the Statements of Operations. For the six months ended March 31, 2017, each paid BIM the following amounts for securities lending agent services:
| | | | |
All-Cap Energy & Resources | | | — | |
Emerging Markets Dividend | | | — | |
Energy & Resources | | $ | 374 | |
| | | | | | |
| | | BLACKROCK FUNDS | | MARCH 31, 2017 | | 45 |
| | | | |
| Notes to Financial Statements (continued) | | | | |
Interfund Lending: In accordance with an exemptive order (the “Order”) from the U.S. Securities and Exchange Commission, Emerging Markets Dividend may participate in a joint lending and borrowing facility for temporary purposes (the “Interfund Lending Program”), subject to compliance with the terms and conditions of the Order, and to the extent permitted by the Fund’s investment policies and restrictions. The Fund is currently permitted to borrow and lend under the Interfund Lending Program.
A lending BlackRock fund may lend in aggregate up to 15% of its net assets, but may not lend more than 5% of its net assets to any one borrowing fund through the Interfund Lending Program. A borrowing BlackRock fund may not borrow through the Interfund Lending Program or from any other source more than 33 1/3% of its total assets (or any lower threshold provided for by the fund’s investment restrictions). If a borrowing BlackRock fund’s total outstanding borrowings exceed 10% of its total assets, each of its outstanding interfund loans will be subject to collateralization of at least 102% of the outstanding principal value of the loan. All interfund loans are for temporary or emergency purposes and the interest rate to be charged will be the average of the highest current overnight repurchase agreement rate available to a lending fund and the bank loan rate, as calculated according to a formula established by the Board.
During the six months ended March 31, 2017, Emerging Markets Dividend did not participate in the Interfund Lending Program.
Officers and Trustees: Certain officers and/or trustees of the Trust are officers and/or directors of BlackRock or its affiliates. The Funds reimburse the Manager for a portion of the compensation paid to the Funds’ Chief Compliance Officer, which is included in Officer and Trustees in the Statements of Operations.
7. Purchases and Sales:
For the six months ended March 31, 2017, purchases and sales of investments, excluding short-term securities, were as follows:
| | | | | | | | | | | | | | | |
| Purchases | | | | | | |
| | | All-Cap
Energy &
Resources | | Emerging
Markets
Dividend | | Energy &
Resources |
Non-U.S. Government Securities | | | $ | 9,734,446 | | | | $ | 4,503,678 | | | | $ | 17,312,522 | |
| | | | | | | | | | | | | | | |
| Sales | | | | | | |
| | | All-Cap
Energy &
Resources | | Emerging
Markets
Dividend | | Energy &
Resources |
Non-U.S. Government Securities | | | $ | 18,543,446 | | | | $ | 2,332,226 | | | | $ | 33,633,948 | |
8. Income Tax Information:
It is the Funds’ policy to comply with the requirements of the Internal Revenue Code of 1986, as amended, applicable to regulated investment companies, and to distribute substantially all of their taxable income to their shareholders. Therefore, no U.S. federal income tax provision is required.
Each Fund files U.S. federal and various state and local tax returns. No income tax returns are currently under examination. The statute of limitations on the U.S. federal tax returns generally remains open for each of the four years ended September 30, 2016. The statutes of limitations on each Fund’s state and local tax returns may remain open for an additional year depending upon the jurisdiction.
Management has analyzed tax laws and regulations and their application to the Funds as of March 31, 2017, inclusive of the open tax return years, and does not believe there are any uncertain tax positions that require recognition of a tax liability in the Funds’ financial statements.
As of September 30, 2016, the Funds had capital loss carryforwards available to offset future realized capital gains through the indicated expiration dates as follows:
| | | | | | | | | | | | | | | |
| Expires September 30, | | All-Cap Energy &
Resources | | Emerging
Markets
Dividend | | Energy &
Resources |
No expiration date1 | | | | $33,929,423 | | | | $ | 1,481,161 | | | | $ | 214,150,968 | |
2018 | | | | 50,343,833 | | | | | — | | | | | — | |
2019 | | | | — | | | | | 18,788 | | | | | — | |
Total | | | | $84,273,256 | | | | $ | 1,499,949 | | | | $ | 214,150,968 | |
| | | | | |
| 1 | | Must be utilized prior to losses subject to expiration. |
| | | | | | |
| 46 | | BLACKROCK FUNDS | | MARCH 31, 2017 | | |
| | | | |
| Notes to Financial Statements (continued) | | | | |
As of March 31, 2017, gross unrealized appreciation and depreciation based on cost for U.S. federal income tax purposes were as follows:
| | | | | | | | | | | | | | | |
| | | All-Cap Energy &
Resources | | Emerging
Markets
Dividend | | Energy &
Resources |
Tax cost | | | | $100,946,594 | | | | $ | 6,355,274 | | | | $ | 257,491,677 | |
| | | | | |
Gross unrealized appreciation | | | | $ 10,699,780 | | | | $ | 970,641 | | | | $ | 28,012,147 | |
Gross unrealized depreciation | | | | (2,813,814 | ) | | | | (63,290 | ) | | | | (31,511,486 | ) |
| | | | | |
Net unrealized appreciation (depreciation) | | | | $ 7,885,966 | | | | $ | 907,351 | | | | $ | (3,499,339 | ) |
| | | | | |
9. Bank Borrowings:
The Trust, on behalf of the Funds, along with certain other funds managed by the Manager and its affiliates (“Participating Funds”), is a party to a 364-day, $2.1 billion credit agreement with a group of lenders. Under this agreement, the Funds may borrow to fund shareholder redemptions. Excluding commitments designated for certain individual funds, the Participating Funds, including the Funds, can borrow up to an aggregate commitment amount of $1.6 billion at any time outstanding, subject to asset coverage and other limitations as specified in the agreement. The credit agreement has the following terms: a fee of 0.12% per annum on unused commitment amounts and interest at a rate equal to the higher of (a) one-month LIBOR (but, in any event, not less than 0.00%) on the date the loan is made plus 0.80% per annum or (b) the Fed Funds rate (but, in any event, not less than 0.00%) in effect from time to time plus 0.80% per annum on amounts borrowed. The agreement expires in April 2017 unless extended or renewed. Participating Funds paid administration, legal and arrangement fees, which, if applicable, are included in miscellaneous expenses in the Statements of Operations. These fees were allocated among such funds based upon portions of the aggregate commitment available to them and relative net assets of Participating Funds. During the six months ended March 31, 2017, the Funds did not borrow under the credit agreement.
10. Principal Risks:
In the normal course of business, certain Funds invest in securities and enter into transactions where risks exist due to fluctuations in the market (market risk) or failure of the issuer to meet all its obligations, including the ability to pay principal and interest when due (issuer credit risk). The value of securities held by the Funds may decline in response to certain events, including those directly involving the issuers of securities owned by the Funds. Investments in the securities of issuers domiciled in countries with emerging capital markets involve certain additional risks that do not generally apply to investments in securities of issuers in more developed capital markets, such as (i) low or nonexistent trading volume, resulting in a lack of liquidity and increased volatility in prices for such securities; (ii) uncertain national policies and social, political and economic instability, increasing the potential for expropriation of assets, confiscatory taxation, high rates of inflation or unfavorable diplomatic developments; and (iii) possible fluctuations in exchange rates, differing legal systems and the existence or possible imposition of exchange controls, custodial restrictions or other foreign or U.S. governmental laws or restrictions applicable to such investments. Changes arising from the general economy, the overall market and local, regional or global political and/or social instability, as well as currency, interest rate and price fluctuations, may also affect the securities’ value.
On October 11, 2016, BlackRock implemented certain changes required by amendments to Rule 2a-7 under the 1940 Act, which governs the operations of U.S. money market funds. The Funds may be exposed to additional risks when reinvesting cash collateral in money market funds that do not seek to maintain a stable NAV per share of $1.00 and which may be subject to redemption gates or liquidity fees under certain circumstances.
Valuation Risk: The market values of equities, such as common stocks and preferred securities or equity related investments, such as futures and options may decline due to general market conditions which are not specifically related to a particular company. They may also decline due to factors which affect a particular industry or industries. A Fund may invest in illiquid investments and may experience difficulty in selling those investments in a timely manner at the price that they believe the investments are worth. Prices may fluctuate widely over short or extended periods in response to company, market or economic news. Markets also tend to move in cycles, with periods of rising and falling prices. This volatility may cause each Fund’s NAV to experience significant increases or decreases over short periods of time. If there is a general decline in the securities and other markets, the NAV of a Fund may lose value, regardless of the individual results of the securities and other instruments in which the Fund invests.
The price a Fund could receive upon the sale of any particular portfolio investment may differ from a Fund’s valuation of the investment, particularly for securities that trade in thin or volatile markets or that are valued using a fair valuation technique or a price provided by an independent pricing service. Changes to significant unobservable inputs and assumptions (i.e., publicly traded company multiples, growth rate, time to exit) due to the lack of observable inputs may significantly impact the resulting fair value and therefore a Fund’s results of operations. As a result, the price received upon the sale of an investment may be less than the value ascribed by a Fund, and a Fund could realize a greater than expected loss or lesser than expected gain upon the sale of the investment. A Fund’s ability to value its investments may also be impacted by technological issues and/or errors by pricing services or other third party service providers.
Counterparty Credit Risk: Similar to issuer credit risk, the Funds may be exposed to counterparty credit risk, or the risk that an entity may fail to or be unable to perform on its commitments related to unsettled or open transactions. The Funds manage counterparty credit risk by entering into transactions only with counterparties that the Manager believes have the financial resources to honor their obligations and by monitoring the financial stability
| | | | | | |
| | | BLACKROCK FUNDS | | MARCH 31, 2017 | | 47 |
| | | | |
| Notes to Financial Statements (continued) | | | | |
of those counterparties. Financial assets, which potentially expose the Funds to market, issuer and counterparty credit risks, consist principally of financial instruments and receivables due from counterparties. The extent of the Funds’ exposure to market, issuer and counterparty credit risks with respect to these financial assets is approximately their value recorded in the Statements of Assets and Liabilities, less any collateral held by the Funds.
A derivative contract may suffer a mark-to-market loss if the value of the contract decreases due to an unfavorable change in the market rates or values of the underlying instrument. Losses can also occur if the counterparty does not perform under the contract.
Concentration Risk: As of period end, All-Cap Energy & Resources and Energy & Resources invested a significant portion of their assets in securities in the energy sector. Changes in economic conditions affecting such sector would have a greater impact on All-Cap Energy & Resources and Energy & Resources and could affect the value, income and/or liquidity of positions in such securities.
Emerging Markets Dividend invests a significant portion of its assets in securities of issuers located in Asia or with significant exposure to Asian issuers or countries. The Asian financial markets have recently experienced volatility and adverse trends due to concerns in several Asian countries regarding monetary policy, government intervention in the markets, rising government debt levels or economic downturns. These events may spread to other countries in Asia and may affect the value and liquidity of certain of the Fund’s investments.
11. Capital Share Transactions:
Transactions in capital shares for each class were as follows:
| | | | | | | | | | | | | | | | | | | | |
| | | Six Months Ended
March 31, 2017 | | | | | | Year Ended
September 30, 2016 | |
| All-Cap Energy & Resources | | Shares | | | Amount | | | | | | Shares | | | Amount | |
Institutional | | | | | | | | | | | | | | | | | | | | |
Shares sold | | | 487,880 | | | | $ 5,518,500 | | | | | | | | 3,161,541 | | | | $ 29,388,657 | |
Shares issued in reinvestment of distributions | | | 39,973 | | | | 476,452 | | | | | | | | 48,497 | | | | 467,508 | |
Shares redeemed | | | (519,764 | ) | | | (5,866,011 | ) | | | | | | | (3,031,450 | ) | | | (31,239,149) | |
| | | | | | | | | | | | |
Net increase (decrease) | | | 8,089 | | | | $ 128,941 | | | | | | | | 178,588 | | | | $ (1,382,984) | |
| | | | | | | | | | | | |
| | | | | | | | | | | | | | | | | | | | |
Service | | | | | | | | | | | | | | | | | | | | |
Shares sold | | | 13,160 | | | | $ 147,137 | | | | | | | | 20,293 | | | | $ 200,118 | |
Shares issued in reinvestment of distributions | | | 1,390 | | | | 16,259 | | | | | | | | 1,066 | | | | 10,079 | |
Shares redeemed | | | (23,861 | ) | | | (257,299 | ) | | | | | | | (54,781 | ) | | | (573,221 | ) |
| | | | | | | | | | | | |
Net decrease | | | (9,311 | ) | | | $ (93,903) | | | | | | | | (33,422 | ) | | | $(363,024) | |
| | | | | | | | | | | | |
| | | | | | | | | | | | | | | | | | | | |
Investor A | | | | | | | | | | | | | | | | | | | | |
Shares sold and automatic conversion of shares | | | 492,499 | | | | $ 5,471,694 | | | | | | | | 2,127,449 | | | | $ 20,597,500 | |
Shares issued in reinvestment of distributions | | | 99,139 | | | | 1,153,057 | | | | | | | | 101,649 | | | | 956,522 | |
Shares redeemed | | | (1,060,966 | ) | | | (11,636,924 | ) | | | | | | | (2,032,198 | ) | | | (20,122,735 | ) |
| | | | | | | | | | | | |
Net increase (decrease) | | | (469,328 | ) | | | $ (5,012,173 | ) | | | | | | | 196,900 | | | | $ 1,431,287 | |
| | | | | | | | | | | | |
| | | | | | | | | | | | | | | | | | | | |
Investor B | | | | | | | | | | | | | | | | | | | | |
Shares redeemed and automatic conversion of shares | | | (31,741 | ) | | | $(333,573) | | | | | | | | (83,559 | ) | | | $(802,774 | ) |
| | | | | | | | | | | | |
Net decrease | | | (31,741 | ) | | | $(333,573) | | | | | | | | (83,559 | ) | | | $(802,774 | ) |
| | | | | | | | | | | | |
| | | | | | | | | | | | | | | | | | | | |
Investor C | | | | | | | | | | | | | | | | | | | | |
Shares sold | | | 227,721 | | | | $ 2,435,868 | | | | | | | | 671,338 | | | | $ 6,177,615 | |
Shares issued in reinvestment of distributions | | | 33,966 | | | | 378,171 | | | | | | | | 29,099 | | | | 261,896 | |
Shares redeemed | | | (526,663 | ) | | | (5,482,524 | ) | | | | | | | (1,166,116 | ) | | | (11,053,045) | |
| | | | | | | | | | | | |
Net decrease | | | (264,976 | ) | | | $(2,668,485) | | | | | | | | (465,679 | ) | | | $ (4,613,534) | |
| | | | | | | | | | | | |
Total Net Decrease | | | (767,267 | ) | | | $(7,979,193) | | | | | | | | (207,172 | ) | | | $ (5,731,029) | |
| | | | | | | | | | | | |
| | | | | | |
| 48 | | BLACKROCK FUNDS | | MARCH 31, 2017 | | |
| | | | |
| Notes to Financial Statements (continued) | | | | |
| | | | | | | | | | | | | | | | | | |
| | | Six Month Ended
March 31, 2017 | | | | | Year Ended
September 30, 2016 | |
| Emerging Markets Dividend | | Shares | | | Amount | | | | | Shares | | | Amount | |
Institutional | | | | | | | | | | | | | | | | | | |
Shares sold | | | 267,640 | | | | $2,160,402 | | | | | | 276,672 | | | | $ 2,034,905 | |
Shares issued in reinvestment of distributions | | | 396 | | | | 3,015 | | | | | | 1,272 | | | | 8,814 | |
Shares redeemed | | | (28,165 | ) | | | (220,122 | ) | | | | | (188,245 | ) | | | (1,178,543) | |
| | | | | | | | | | |
Net increase | | | 239,871 | | | | $1,943,295 | | | | | | 89,699 | | | | $ 865,176 | |
| | | | | | | | | | |
| | | | | | | | | | | | | | | | | | |
Investor A | | | | | | | | | | | | | | | | | | |
Shares sold | | | 135,758 | | | | $1,094,485 | | | | | | 231,030 | | | | $1,694,668 | |
Shares issued in reinvestment of distributions | | | 395 | | | | 3,052 | | | | | | 3,002 | | | | 22,150 | |
Shares redeemed | | | (63,824 | ) | | | (509,578 | ) | | | | | (115,037 | ) | | | (828,195) | |
| | | | | | | | | | |
Net increase | | | 72,329 | | | | $ 587,959 | | | | | | 118,995 | | | | $ 888,623 | |
| | | | | | | | | | |
| | | | | | | | | | | | | | | | | | |
Investor C | | | | | | | | | | | | | | | | | | |
Shares sold | | | 27,987 | | | | $ 221,733 | | | | | | 34,614 | | | | $ 248,252 | |
Shares issued in reinvestment of distributions | | | — | | | | — | | | | | | 371 | | | | 2,694 | |
Shares redeemed | | | (12,455 | ) | | | (92,152 | ) | | | | | (15,507 | ) | | | (110,389) | |
| | | | | | | | | | |
Net increase | | | 15,532 | | | | $ 129,581 | | | | | | 19,478 | | | | $ 140,557 | |
| | | | | | | | | | |
Total Net Increase | | | 327,732 | | | | $2,660,835 | | | | | | 228,172 | | | | $1,894,356 | |
| | | | | | | | | | |
| | | | | | | | | | | | | | | | | | |
| Energy & Resources | | | | | | | | | | | | | | |
Institutional | | | | | | | | | | | | | | | | | | |
Shares sold | | | 512,971 | | | | $ 11,210,017 | | | | | | 796,824 | | | | $ 15,677,703 | |
Shares redeemed | | | (890,761 | ) | | | (19,387,469 | ) | | | | | (769,810 | ) | | | (14,482,256) | |
| | | | | | | | | | |
Net increase (decrease) | | | (377,790 | ) | | | $(8,177,452) | | | | | | 27,014 | | | | $ 1,195,447 | |
| | | | | | | | | | |
| | | | | | | | | | | | | | | | | | |
Investor A | | | | | | | | | | | | | | | | | | |
Shares sold and automatic conversion of shares | | | 1,052,653 | | | | $ 20,365,404 | | | | | | 2,546,938 | | | | $ 41,864,676 | |
Shares redeemed | | | (1,852,082 | ) | | | (35,448,531 | ) | | | | | (2,855,481 | ) | | | (47,770,927) | |
| | | | | | | | | | |
Net decrease | | | (799,429 | ) | | | $(15,083,127) | | | | | | (308,543 | ) | | | $ (5,906,251) | |
| | | | | | | | | | |
| | | | | | | | | | | | | | | | | | |
Investor B | | | | | | | | | | | | | | | | | | |
Shares sold | | | 8 | | | | $ 117 | | | | | | 1,709 | | | | $ 19,361 | |
Shares redeemed and automatic conversion of shares | | | (20,831 | ) | | | (286,866 | ) | | | | | (51,734 | ) | | | (630,169) | |
| | | | | | | | | | |
Net decrease | | | (20,823 | ) | | | $(286,749) | | | | | | (50,025 | ) | | | $(610,808) | |
| | | | | | | | | | |
| | | | | | | | | | | | | | | | | | |
Investor C | | | | | | | | | | | | | | | | | | |
Shares sold | | | 166,940 | | | | $ 2,338,988 | | | | | | 780,257 | | | | $ 8,906,436 | |
Shares redeemed | | | (518,504 | ) | | | (7,007,561 | ) | | | | | (1,131,617 | ) | | | (13,507,531) | |
| | | | | | | | | | |
Net decrease | | | (351,564 | ) | | | $ (4,668,573) | | | | | | (351,360 | ) | | | $ (4,601,095) | |
| | | | | | | | | | |
Total Net Decrease | | | (1,549,606 | ) | | | $ (28,215,901) | | | | | | (682,914 | ) | | | $ (9,922,707) | |
| | | | | | | | | | |
At period ended, shares owned by affiliates of Emerging Markets Dividend were as follows:
| | | | |
Institutional | | Investor A | | Investor C |
78,474 | | 2,000 | | 2,000 |
| | | | | | |
| | | BLACKROCK FUNDS | | MARCH 31, 2017 | | 49 |
| | | | |
| Notes to Financial Statements (concluded) | | | | |
12. Subsequent Events:
Management’s evaluation of the impact of all subsequent events on the Funds’ financial statements was completed through the date the financial statements were issued and the following item was noted:
Effective April 20, 2017, the credit agreement was extended until April 2018 under the same terms.
| | | | | | |
| 50 | | BLACKROCK FUNDS | | MARCH 31, 2017 | | |
| | | | |
| Disclosure of Sub-Advisory Agreement | | | | |
The Board of Trustees (the “Board,” and the members of which are referred to as “Board Members”) of BlackRock Funds (the “Trust”) met in person on February 24, 2017 (the “February 2017 Meeting”) to consider the initial approval of the proposed sub-advisory agreement (the “Sub-Advisory Agreement”) between BlackRock Advisors, LLC (the “Manager”), the Trust’s investment advisor, and BlackRock Asset Management North Asia Limited (the “Sub-Advisor”) with respect to BlackRock Emerging Markets Dividend Fund (the “Fund”), a series of the Trust. The Board was informed that the Sub-Advisory Agreement was substantially the same as the sub-advisory agreement previously approved with respect to certain other portfolios of the Trust.
On the date of the February 2017 Meeting, the Board consisted of thirteen individuals, eleven of whom were not “interested persons” of the Trust or the Fund as defined in the Investment Company Act of 1940, as amended (the “1940 Act”) (the “Independent Board Members”). Pursuant to the 1940 Act, the Board is required to consider the initial approval of the Sub-Advisory Agreement.
The Board previously met in person on April 21, 2016 (the “April 2016 Meeting”) and on May 18-20, 2016 (the “May 2016 Meeting”) to consider the approval of (i) the investment advisory agreement between the Trust, on behalf of the Fund, and the Manager (the “Advisory Agreement”) and (ii) the sub-advisory agreement between the Manager and BlackRock International Limited (“BIL”) with respect to the Fund (the “BIL Sub-Advisory Agreement”). At the May 2016 Meeting, the Board, including the independent board members, approved the continuation of the Advisory Agreement and the BIL Sub-Advisory Agreement, each for a one-year term ending June 30, 2017. A discussion of the basis for the Board’s approval of the Advisory Agreement and the BIL Sub-Advisory Agreement at the May 2016 Meeting is included in the annual shareholder report of the Fund for the period ended September 30, 2016.
At the February 2017 Meeting, the Board reviewed materials relating to its consideration of the Sub-Advisory Agreement. The factors considered by the Board at the February 2017 Meeting in connection with approval of the proposed Sub-Advisory Agreement were substantially the same as the factors considered at the April 2016 Meeting and the May 2016 Meeting with respect to approval of the Advisory Agreement and the BIL Sub-Advisory Agreement.
Following discussion, the Board, including a majority of the Independent Board Members, approved the Sub-Advisory Agreement between the Manager and the Sub-Advisor with respect to the Fund for a two-year term beginning on the effective date of the Sub-Advisory Agreement. Based upon its evaluation of all of the aforementioned factors in their totality, the Board, including a majority of the Independent Board Members, was satisfied that the terms of the Sub-Advisory Agreement were fair and reasonable and in the best interest of the Fund and its shareholders. In arriving at its decision to approve the Sub-Advisory Agreement, the Board did not identify any single factor or group of factors as all-important or controlling, but considered all factors together, and different Board Members may have attributed different weights to the various factors considered. The Independent Board Members were also assisted by the advice of independent legal counsel in making this determination.
| | | | | | |
| | | BLACKROCK FUNDS | | MARCH 31, 2017 | | 51 |
|
| Rodney D. Johnson, Chair of the Board and Trustee |
| Susan J. Carter, Trustee |
| Collette Chilton, Trustee |
| Neil A. Cotty, Trustee |
| Cynthia A. Montgomery, Trustee |
| Joseph P. Platt, Trustee |
| Robert C. Robb, Jr., Trustee |
| Mark Stalnecker, Trustee |
| Kenneth L. Urish, Trustee |
| Claire A. Walton, Trustee |
| Frederick W. Winter, Trustee |
| Barbara G. Novick, Trustee |
| John M. Perlowski, Trustee, President and Chief Executive Officer |
| Thomas Callahan, Vice President |
| Jennifer McGovern, Vice President |
| Neal J. Andrews, Chief Financial Officer |
| Jay M. Fife, Treasurer |
| Charles Park, Chief Compliance Officer |
| Fernanda Piedra, Anti-Money Laundering Compliance Officer |
| Benjamin Archibald, Secretary |
Effective December 31, 2016, David O. Beim and Dr. Matina S. Horner retired as Trustees of the Trust.
| | | | | | |
| | | | |
Investment Adviser and Administrator BlackRock Advisors, LLC Wilmington, DE 19809 | | Accounting Agent and Transfer Agent BNY Mellon Investment Servicing (US) Inc. Wilmington, DE 19809 | | Independent Registered Public Accounting Firm Deloitte & Touche LLP Philadelphia, PA 19103 | | Address of the Trust 100 Bellevue Parkway Wilmington, DE 19809 |
| | | | | | |
Sub-Adviser BlackRock International Limited Edinburgh, EH3 8BL United Kingdom BlackRock Asset Management North Asia Limited1 2 Queen’s Road Central Hong Kong | | Custodian The Bank of New York Mellon New York, NY 10286 | | Distributor BlackRock Investments, LLC New York, NY 10022 | | Legal Counsel Sidley Austin LLP New York, NY 10019 |
| 1 | | For BlackRock Emerging Markets Dividend Fund. |
| | | | | | |
| 52 | | BLACKROCK FUNDS | | MARCH 31, 2017 | | |
Householding
The Funds will mail only one copy of shareholder documents, including prospectuses, annual and semi-annual reports and proxy statements, to shareholders with multiple accounts at the same address. This practice is commonly called “householding” and is intended to reduce expenses and eliminate duplicate mailings of shareholder documents. Mailings of your shareholder documents may be householded indefinitely unless you instruct us otherwise. If you do not want the mailing of these documents to be combined with those for other members of your household, please call the Funds at (800) 441-7762.
Availability of Quarterly Schedule of Investments
The Funds file their complete schedule of portfolio holdings with the SEC for the first and third quarters of each fiscal year on Form N-Q. The Funds’ Forms N-Q are available on the SEC’s website at http://www.sec.gov and may also be reviewed and copied at the SEC’s Public Reference Room in Washington, D.C. Information on the operation of the Public Reference Room or how to access documents on the SEC’s website without charge may be obtained by calling (800) SEC-0330. The Funds’ Forms N-Q may also be obtained upon request and without charge by calling (800) 441-7762.
Availability of Proxy Voting Policies and Procedures
A description of the policies and procedures that the Funds use to determine how to vote proxies relating to portfolio securities is available upon request and without charge (1) by calling (800) 441-7762; (2) at http://www.blackrock.com; and (3) on the SEC’s website at http://www.sec.gov.
Availability of Proxy Voting Record
Information about how the Funds voted proxies relating to securities held in the Funds’ portfolios during the most recent 12-month period ended June 30 is available upon request and without charge (1) at http://www.blackrock.com or by calling (800) 441-7762 and (2) on the SEC’s website at http://www.sec.gov.
BlackRock’s Mutual Fund Family
BlackRock offers a diverse lineup of open-end mutual funds crossing all investment styles and managed by experts in equity, fixed income and tax-exempt investing. Visit http://www.blackrock.com for more information.
Account Information
Call us at (800) 441-7762 from 8:00 AM to 6:00 PM ET on any business day to get information about your account balances, recent transactions and share prices. You can also reach us on the Web at http://www.blackrock.com/funds.
Automatic Investment Plans
Investor Class shareholders who want to invest regularly can arrange to have $50 or more automatically deducted from their checking or savings account and invested in any of the BlackRock funds.
Systematic Withdrawal Plans
Investor Class shareholders can establish a systematic withdrawal plan and receive periodic payments of $50 or more from their BlackRock funds, as long as their account balance is at least $10,000.
Retirement Plans
Shareholders may make investments in conjunction with Traditional, Rollover, Roth, Coverdell, Simple IRAs, SEP IRAs and 403(b) Plans.
| | | | | | |
| | | BLACKROCK FUNDS | | MARCH 31, 2017 | | 53 |
| | | | |
| Additional Information (concluded) | | | | |
|
| BlackRock Privacy Principles |
BlackRock is committed to maintaining the privacy of its current and former fund investors and individual clients (collectively, “Clients”) and to safeguarding their non-public personal information. The following information is provided to help you understand what personal information BlackRock collects, how we protect that information and why in certain cases we share such information with select parties.
If you are located in a jurisdiction where specific laws, rules or regulations require BlackRock to provide you with additional or different privacy-related rights beyond what is set forth below, then BlackRock will comply with those specific laws, rules or regulations.
BlackRock obtains or verifies personal non-public information from and about you from different sources, including the following: (i) information we receive from you or, if applicable, your financial intermediary, on applications, forms or other documents; (ii) information about your transactions with us, our affiliates, or others; (iii) information we receive from a consumer reporting agency; and (iv) from visits to our websites.
BlackRock does not sell or disclose to non-affiliated third parties any non-public personal information about its Clients, except as permitted by law or as is necessary to respond to regulatory requests or to service Client accounts. These non-affiliated third parties are required to protect the confidentiality and security of this information and to use it only for its intended purpose.
We may share information with our affiliates to service your account or to provide you with information about other BlackRock products or services that may be of interest to you. In addition, BlackRock restricts access to non-public personal information about its Clients to those BlackRock employees with a legitimate business need for the information. BlackRock maintains physical, electronic and procedural safeguards that are designed to protect the non-public personal information of its Clients, including procedures relating to the proper storage and disposal of such information.
| | | | | | |
| 54 | | BLACKROCK FUNDS | | MARCH 31, 2017 | | |
This report is intended for current holders. It is not authorized for use as an offer of sale or a solicitation of an offer to buy shares of a Fund unless preceded or accompanied by that Fund’s current prospectus. Past performance results shown in this report should not be considered a representation of future performance. Investment returns and principal value of shares will fluctuate so that shares, when redeemed, may be worth more or less than their original cost. Statements and other information herein are as dated and are subject to change.

| | |
| |
Eq-Allcap-3/17-SAR | |  |
MARCH 31, 2017
| | | | |
SEMI-ANNUAL REPORT (UNAUDITED) | | | | BLACKROCK® |
▶ BlackRock Flexible Equity Fund
▶ BlackRock Mid-Cap Growth Equity Portfolio
▶ BlackRock Advantage Small Cap Growth Fund
| | |
| Not FDIC Insured § May Lose Value § No Bank Guarantee | | |
Dear Shareholder,
In the 12 months ended March 31, 2017, risk assets, such as stocks and high-yield bonds, delivered strong performance, while U.S. Treasuries and other higher-quality assets generated negative returns. Markets showed great resilience during a period with big surprises, including the United Kingdom’s vote to leave the European Union and the outcome of the U.S. presidential election, which brought only brief spikes in equity market volatility. The more rate-sensitive high-quality assets, however, struggled as rising energy prices, modest wage increases and steady U.S. job growth led to expectations of higher inflation and anticipation of interest rate increases by the U.S. Federal Reserve (the “Fed”).
The global reflationary theme — rising nominal growth, wages and inflation — was the dominant driver of asset returns during the period, outweighing significant political upheavals and uncertainty. Reflationary expectations accelerated after the U.S. election and continued into the beginning of 2017, stoked by expectations for an extra boost to U.S. growth via fiscal policy. The primary tension surfacing in markets in 2017 has been between reflationary expectations and the realities of fiscal and monetary policy. Markets have been turning their attention to the Fed’s outlook for additional interest rate hikes, while assessing the probability of Congress passing meaningful fiscal stimulus amid political division and a limited budget.
Although economic momentum is gaining traction, the capacity for rapid global growth is restrained by structural factors, including an aging population, low productivity growth and excess savings, as well as cyclical factors, like the Fed leaning toward higher interest rates and the length of the current expansion. Tempered economic growth and high valuations across most assets have set the stage for muted long-term investment returns going forward.
Equity markets still present opportunities, although the disparity between winners and losers is widening — a dynamic that increases the risk and return potential of active investing. Fixed income investors are also facing challenges as bond markets recalibrate for higher inflation expectations after eight years of deflationary concerns. And in a world where political risk and policy uncertainty abound, there is no lack of potential catalysts for higher volatility.
In this environment, investors need to think globally, extend their scope across a broad array of asset classes and be nimble as market conditions change. We encourage you to talk with your financial advisor and visit blackrock.com for further insight about investing in today’s markets.
Sincerely,

Rob Kapito
President, BlackRock Advisors, LLC

Rob Kapito
President, BlackRock Advisors, LLC
| | | | | | | | |
| Total Returns as of March 31, 2017 | |
| | | 6-month | | | 12-month | |
U.S. large cap equities
(S&P 500® Index)
| | | 10.12 | % | | | 17.17 | % |
U.S. small cap equities
(Russell 2000® Index)
| | | 11.52 | | | | 26.22 | |
International equities
(MSCI Europe, Australasia, Far East Index) | | | 6.48 | | | | 11.67 | |
Emerging market equities (MSCI Emerging Markets Index) | | | 6.80 | | | | 17.21 | |
3-month Treasury bills
(BofA Merrill Lynch 3-Month U.S. Treasury Bill Index) | | | 0.19 | | | | 0.36 | |
U.S. Treasury securities
(BofA Merrill Lynch 10-Year U.S. Treasury Index) | | | (6.08 | ) | | | (3.97 | ) |
U.S. investment grade bonds (Bloomberg Barclays U.S. Aggregate Bond Index) | | | (2.18 | ) | | | 0.44 | |
Tax-exempt municipal bonds (S&P Municipal Bond Index) | | | (1.93 | ) | | | 0.55 | |
U.S. high yield bonds (Bloomberg Barclays U.S. Corporate High Yield 2% Issuer Capped Index) | | | 4.50 | | | | 16.39 | |
|
| Past performance is no guarantee of future results. Index performance is shown for illustrative purposes only. You cannot invest directly in an index. | |
| | | | | | |
| 2 | | THIS PAGE NOT PART OF YOUR FUND REPORT | | | | |
| | | | | | |
| | | 
| | Shareholders can sign up for e-mail notifications of quarterly statements, annual and semi-annual shareholder reports and prospectuses by enrolling in the electronic delivery program. Electronic copies of shareholder reports and prospectuses are also available on BlackRock’s website. TO ENROLL IN ELECTRONIC DELIVERY: Shareholders Who Hold Accounts with Investment Advisors, Banks or Brokerages: Please contact your financial advisor. Please note that not all investment advisors, banks or brokerages may offer this service. Shareholders Who Hold Accounts Directly with BlackRock: 1. Access the BlackRock website at blackrock.com 2. Select “Access Your Account” 3. Next, select “eDelivery” in the “Related Resources” box and follow the sign-up instructions | | |
| | | | | | |
| | | BLACKROCK FUNDS | | MARCH 31, 2017 | | 3 |
| | | | |
| Fund Summary as of March 31, 2017 | | | BlackRock Flexible Equity Fund | |
BlackRock Flexible Equity Fund’s (the “Fund”) investment objective is to seek to achieve long-term total return.
On March 23, 2017, the Board approved a proposal to change the name of BlackRock Flexible Equity Fund to BlackRock Advantage Large Cap Growth Fund. The Board also approved certain changes to the Fund’s investment objective and investment strategies and the liquidation of the Fund’s subsidiary. In addition, Fund management has determined to change the benchmark index against which the Fund compares its performance. These changes are expected to become effective on or about June 12, 2017.
|
| Portfolio Management Commentary |
How did the Fund perform?
| • | | For the six-month period ended March 31, 2017, the Fund outperformed its benchmark, the S&P 500® Index. |
What factors influenced performance?
| • | | At the sector level, financials was the prime contributor to relative performance. Bank holdings, led by Bank of America Corp., strongly outperformed, particularly following the U.S. presidential election, as investors positioned for improving future earnings power driven by higher economic growth, inflation, corporate tax reform and interest rates, as well as a softening of regulations that could lead to accelerating capital returns and potentially lower legal and compliance costs. |
| • | | Consumer finance name SLM Corp. also added value in the sector. Shares outperformed as the “bear case” scenario of government subsidized tuition plans, as proposed by the Clinton campaign, was eliminated with a Trump victory. Moreover, Trump has proposed restoring private sector participation in student financing, which holds the potential to materially expand the market for private student loans, where SLM holds a dominant 50%+ market share. Notably, recent quarterly results suggest that SLM continues to gain share within the private student loan market, leading to near-best-in-class loan growth among mid-sized bank peers, while the investment adviser has not seen any diminution in the company’s credit standards. |
| • | | Information technology (“IT”) was a second source of strength, in particular semiconductors, where Lam Research Corp. was a standout. Lam continues to perform well on the back of strong execution and growing demand for its products, driven by the build-out of 3D NAND capacity, for which the company is a key supplier. The valuation remains low, reflecting ongoing concerns that this may be the peak of the cycle, resulting in strong stock performance while the fundamentals continue to improve. |
| • | | Additional contributions came from stock selection in consumer discretionary, especially hotels, restaurants & leisure and specialty retail. |
| • | | Conversely, the main detractor from performance in the six months was health care, due to weakness within the pharmaceutical and biotechnology segments. |
| • | | Mallinckrodt PLC and Teva Pharmaceutical Industries Ltd. were the largest detractors in pharmaceuticals. Mallinckrodt’s stock performance has been dominated by headlines on U.S. pricing pressures and skepticism around the sustainability of Medicare coverage of the company’s most important product, Achtar. Teva had numerous negative developments that undermined the investment adviser’s conviction in the investment thesis. The generics segment remains challenged by a slowing pace of approvals and broad price pressure, while Teva’s main brand product Copaxone has lost its patent protection and is likely to see generic competition in the coming quarters. |
| • | | Within biotechnology, the position in Gilead Sciences Inc. weighed. Gilead continues to execute well in its HIV business segment, but is facing significant uncertainty in the HCV (Hepatitis C) business following several years of exceptional revenue growth. In the recent quarter, the company reset expectations for its HCV franchise by guiding to a much faster erosion of HCV revenue in 2017. While lower guidance was expected, the magnitude was a surprise and led to share weakness. The investment adviser believes that Gilead’s current guidance may prove conservative and anticipates positive developments in the company’s pipeline, as well as a more aggressive capital allocation strategy. |
Describe recent portfolio activity.
| • | | Due to a combination of portfolio trading activity and market movement during the six-month period, the Fund’s weighting in the materials and IT sectors increased, particularly within chemicals and semiconductors, respectively. Financials exposure also increased. The biggest reductions were in the health care and consumer staples sectors, largely with respect to pharmaceuticals and food products. |
Describe portfolio positioning at period end.
| • | | Relative to the S&P 500® Index, the Fund ended the period with its largest sector overweights in IT, consumer discretionary and materials. Industrials, real estate and consumer staples were the most significant underweights. |
The views expressed reflect the opinions of BlackRock as of the date of this report and are subject to change based on changes in market, economic or other conditions. These views are not intended to be a forecast of future events and are no guarantee of future results.
| | | | | |
| Ten Largest Holdings | | Percent of
Net Assets |
Apple Inc. | | | | 5 | % |
Alphabet, Inc., Class A | | | | 4 | |
JPMorgan Chase & Co. | | | | 4 | |
Microsoft Corp. | | | | 4 | |
Bank of America Corp. | | | | 4 | |
Comcast Corp., Class A | | | | 3 | |
Dow Chemical Co. | | | | 3 | |
Carnival Corp. | | | | 2 | |
U.S. Bancorp | | | | 2 | |
Lowe’s Cos., Inc. | | | | 2 | |
| | | | | |
| Sector Allocation | | Percent of
Net Assets |
Information Technology | | | | 26 | % |
Financials | | | | 16 | |
Consumer Discretionary | | | | 16 | |
Health Care | | | | 15 | |
Consumer Staples | | | | 7 | |
Energy | | | | 7 | |
Industrials | | | | 6 | |
Materials | | | | 5 | |
Other | | | | 2 | |
For Fund compliance purposes, the Fund’s sector classifications refer to one or more of the sector sub-classifications used by one or more widely recognized market indexes or ratings group indexes, and/or as defined by the investment adviser. These definitions may not apply for purposes of this report, which may combine sector sub-classifications for reporting ease.
| | | | | | |
| 4 | | BLACKROCK FUNDS | | MARCH 31, 2017 | | |
| | | | |
| | | | BlackRock Flexible Equity Fund | |
|
| Total Return Based on a $10,000 Investment |
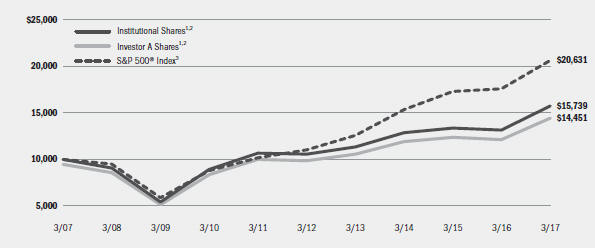
| | 1 | Assuming maximum sales charges, if any, transaction costs and other operating expenses, including investment advisory fees and administration fees, if any. Institutional Shares do not have a sales charge. |
| | 2 | Under normal circumstances, the Fund invests at least 80% of its net assets (plus any borrowings for investment purposes) in equity securities and equity-like securities and instruments with similar economic characteristics. The Fund seeks to invest primarily in securities issued by North American companies. The Fund may invest in companies of any market capitalization size, style, or sector. The Fund’s total return prior to July 31, 2012 are the returns of the Fund when it followed a different investment strategy. |
| | 3 | An unmanaged index that covers 500 leading companies and captures approximately 80% coverage of available market capitalization. |
|
| Performance Summary for the Period Ended March 31, 2017 |
| | | | | | | | | | | | | | | | | | | | | | | | | | | | | | | | | | | |
| | | | | Average Annual Total Returns2,4 |
| | | | | 1 Year | | 5 Years | | 10 Years |
| | | 6-Month
Total Returns | | w/o sales
charge | | w/ sales
charge | | w/o sales
charge | | w/ sales
charge | | w/o sales
charge | | w/ sales
charge |
Institutional | | | | 14.28 | % | | | | 19.62 | % | | | | N/A | | | | | 8.29 | % | | | | N/A | | | | | 4.64 | % | | | | N/A | |
Service | | | | 14.08 | | | | | 19.29 | | | | | N/A | | | | | 7.95 | | | | | N/A | | | | | 4.33 | | | | | N/A | |
Investor A | | | | 14.09 | | | | | 19.22 | | | | | 12.96 | % | | | | 7.92 | | | | | 6.76 | % | | | | 4.31 | | | | | 3.75 | % |
Investor B | | | | 13.66 | | | | | 18.37 | | | | | 13.87 | | | | | 7.12 | | | | | 6.81 | | | | | 3.67 | | | | | 3.67 | |
Investor C | | | | 13.64 | | | | | 18.40 | | | | | 17.40 | | | | | 7.10 | | | | | 7.10 | | | | | 3.51 | | | | | 3.51 | |
Class R | | | | 13.96 | | | | | 18.84 | | | | | N/A | | | | | 7.55 | | | | | N/A | | | | | 4.12 | | | | | N/A | |
S&P 500® Index | | | | 10.12 | | | | | 17.17 | | | | | N/A | | | | | 13.30 | | | | | N/A | | | | | 7.51 | | | | | N/A | |
| | 4 | | Assuming maximum sales charges, if any. Average annual total returns with and without sales charges reflect reductions for distribution and service fees. See “About Fund Performance” on page 10 for a detailed description of share classes, including any related sales charges and fees. |
| | | | N/A—Not applicable as share class and index do not have a sales charge. |
| | | | Past performance is not indicative of future results. |
| | | | Performance results may include adjustments made for financial reporting purposes in accordance with U.S. generally accepted accounting principles. |
| | | | | | | | | | | | | | | | | | | | | | | | | | | | | | | | | | | |
| | | Actual | | Hypothetical6 | | |
| | | Beginning
Account Value
October 1, 2016 | | Ending
Account Value
March 31, 2017 | | Expenses Paid
During the Period5 | | Beginning
Account Value
October 1, 2016 | | Ending
Account Value
March 31, 2017 | | Expenses Paid During the Period5 | | Annualized
Expense
Ratio |
Institutional | | | $ | 1,000.00 | | | | $ | 1,142.80 | | | | $ | 4.90 | | | | $ | 1,000.00 | | | | $ | 1,020.29 | | | | $ | 4.62 | | | | | 0.92 | % |
Service | | | $ | 1,000.00 | | | | $ | 1,140.80 | | | | $ | 6.60 | | | | $ | 1,000.00 | | | | $ | 1,018.70 | | | | $ | 6.22 | | | | | 1.24 | % |
Investor A | | | $ | 1,000.00 | | | | $ | 1,140.90 | | | | $ | 6.60 | | | | $ | 1,000.00 | | | | $ | 1,018.70 | | | | $ | 6.22 | | | | | 1.24 | % |
Investor B | | | $ | 1,000.00 | | | | $ | 1,136.60 | | | | $ | 10.68 | | | | $ | 1,000.00 | | | | $ | 1,014.87 | | | | $ | 10.07 | | | | | 2.01 | % |
Investor C | | | $ | 1,000.00 | | | | $ | 1,136.40 | | | | $ | 10.68 | | | | $ | 1,000.00 | | | | $ | 1,014.87 | | | | $ | 10.07 | | | | | 2.01 | % |
Class R | | | $ | 1,000.00 | | | | $ | 1,139.60 | | | | $ | 8.51 | | | | $ | 1,000.00 | | | | $ | 1,016.91 | | | | $ | 8.02 | | | | | 1.60 | % |
| | 5 | | For each class of the Fund, expenses are equal to the annualized expense ratio for the class, multiplied by the average account value over the period, multiplied by 182/365 (to reflect the one-half year period shown). |
| | 6 | | Hypothetical 5% annual return before expenses is calculated by prorating the number of days in the most recent fiscal half year divided by 365. |
| | | | See “Disclosure of Expenses” on page 11 for further information on how expenses were calculated. |
| | | | | | |
| | | BLACKROCK FUNDS | | MARCH 31, 2017 | | 5 |
| | | | |
| Fund Summary as of March 31, 2017 | | | BlackRock Mid-Cap Growth Equity Portfolio | |
BlackRock Mid-Cap Growth Equity Portfolio’s (the “Fund”) investment objective is long-term capital appreciation.
|
| Portfolio Management Commentary |
How did the Fund perform?
| • | | For the six-month period ended March 31, 2017, the Fund outperformed its benchmark, the Russell Midcap® Growth Index. |
What factors influenced performance?
| • | | In sector terms, consumer discretionary was the prime contributor to relative performance due to strength amongst holdings in internet & direct marketing retail, as well as stock selection and an underweight within specialty retail. Health care and real estate also aided returns. The main detractor from results was industrials, where electrical equipment and aerospace & defense names lagged. Selection in information technology (“IT”) and an overweight to telecommunication services also proved disadvantageous. |
| • | | In stock specifics, Netflix, Inc. was the largest individual contributor. Netflix outperformed as the company solidified its position as the global leader in subscription video on demand. Recently, the company reported strong financial results and issued subscriber guidance that far exceeded expectations, in addition to raising its outlook for the first quarter of 2017. |
| • | | Positions in VCA Inc. and Wix.com Ltd. also added value. Veterinary hospital chain VCA surged on news that it would be acquired by privately-held Mars Group. Wix.com outperformed following better-than-expected fourth-quarter 2016 results and increased market awareness of this best-in-class growth company. The investment adviser likes Wix.com due to its disruptive freemium model, technology leadership and large market opportunity, which are enabling new SMB website creation at a very high growth rate. |
| • | | The largest detractor from relative performance was Acuity Brands Inc. Shares of Acuity Brands sold off as the company’s top-line growth rate slowed from its prior pace of |
| | | 13-14% to 10% in its fiscal first quarter and 5% in its fiscal second quarter due to what its management characterized as a temporary slowing in smaller, short-cycle projects. Gross margin contraction from lower operating leverage further dampened sentiment for the shares. |
| • | | FleetCor Technologies Inc. was an additional detractor. FleetCor’s stock declined in the first half of the reporting period as part of a broader sector rotation from financial technology companies (which do not benefit from lending and, hence, interest income) in favor of banks, which stand to benefit more from potentially lower taxes and higher interest rates under a Trump administration. Elsewhere, zero exposure to strong-performing NVIDIA Corp. was a drag. |
Describe recent portfolio activity.
| • | | Due to a combination of trading activity and market movements during the six-month period, the Fund’s weighting in the real estate sector materially increased, particularly within equity real estate investment trusts. Financials and IT exposure also noticeably increased. The most substantial decrease was in the consumer discretionary sector, especially internet & direct marketing retail and media. The Fund’s weighting in telecommunication services and health care also declined. |
Describe portfolio positioning at period end.
| • | | As of period end, the Fund’s largest sector overweight relative to the Russell Midcap® Growth Index was in IT, while consumer discretionary and health care were the most underweighted sectors. |
The views expressed reflect the opinions of BlackRock as of the date of this report and are subject to change based on changes in market, economic or other conditions. These views are not intended to be a forecast of future events and are no guarantee of future results.
| | | | | |
| Ten Largest Holdings | | Percent of
Net Assets |
Intuitive Surgical, Inc. | | | | 3 | % |
Equinix, Inc. | | | | 3 | |
Uber Technologies, Inc., Series D | | | | 3 | |
Netflix, Inc. | | | | 3 | |
Equifax, Inc. | | | | 3 | |
Domino’s Pizza, Inc. | | | | 2 | |
SBA Communications Corp. | | | | 2 | |
Vail Resorts, Inc. | | | | 2 | |
First Republic Bank | | | | 2 | |
Zendesk, Inc. | | | | 2 | |
| | | | | |
| Sector Allocation | | Percent of
Net Assets |
Information Technology | | | | 35 | % |
Consumer Discretionary | | | | 18 | |
Industrials | | | | 15 | |
Health Care | | | | 10 | |
Financials | | | | 6 | |
Real Estate | | | | 5 | |
Consumer Staples | | | | 4 | |
Energy | | | | 2 | |
Telecommunication Services | | | | 2 | |
Materials | | | | 1 | |
Short-Term Securities | | | | 3 | |
Liabilities in Excess of Other Assets | | | | (1 | ) |
For Fund compliance purposes, the Fund’s sector classifications refer to one or more of the sector sub-classifications used by one or more widely recognized market indexes or ratings group indexes, and/or as defined by the investment adviser. These definitions may not apply for purposes of this report, which may combine sector sub-classifications for reporting ease.
| | | | | | |
| 6 | | BLACKROCK FUNDS | | MARCH 31, 2017 | | |
| | |
| | | BlackRock Mid-Cap Growth Equity Portfolio |
|
| Total Return Based on a $10,000 Investment |
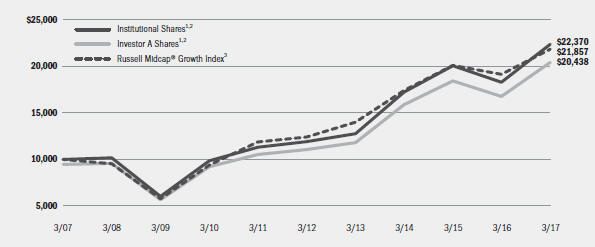
| | 1 | Assuming maximum sales charges, if any, transaction costs and other operating expenses, including investment advisory fees and administration fees, if any. Institutional Shares do not have a sales charge. |
| | 2 | The Fund normally invests at least 80% of its net assets in equity securities issued by U.S. mid-capitalization companies, which Fund management believes have above-average earnings growth potential. |
| | 3 | An unmanaged index that consists of the bottom 800 securities of the Russell 1000® Index with greater-than-average growth orientation as ranked by total market capitalization. Securities in the index generally have higher price-to-book and price-to-earnings ratios, lower dividend yields and higher forecasted growth values. |
|
| Performance Summary for the Period Ended March 31, 2017 |
| | | | | | | | | | | | | | | | | | | | | | | | | | | | | | | | | | | |
| | | | | Average Annual Total Returns4 |
| | | | | 1 Year | | 5 Years | | 10 Years |
| | | 6-Month
Total Returns | | w/o sales
charge | | w/ sales charge | | w/o sales
charge | | w/ sales
charge | | w/o sales
charge | | w/ sales charge |
Institutional | | | | 9.18 | % | | | | 22.17 | % | | | | N/A | | | | | 13.39 | % | | | | N/A | | | | | 8.38 | % | | | | N/A | |
Service | | | | 9.11 | | | | | 22.02 | | | | | N/A | | | | | 12.95 | | | | | N/A | | | | | 8.01 | | | | | N/A | |
Investor A | | | | 9.00 | | | | | 21.84 | | | | | 15.44 | % | | | | 13.04 | | | | | 11.83 | % | | | | 7.99 | | | | | 7.41 | % |
Investor B | | | | 8.53 | | | | | 20.83 | | | | | 16.33 | | | | | 12.17 | | | | | 11.91 | | | | | 7.33 | | | | | 7.33 | |
Investor C | | | | 8.61 | | | | | 20.94 | | | | | 19.94 | | | | | 12.18 | | | | | 12.18 | | | | | 7.18 | | | | | 7.18 | |
Class K | | | | 9.23 | | | | | 22.29 | | | | | N/A | | | | | 13.49 | | | | | N/A | | | | | 8.48 | | | | | N/A | |
Class R | | | | 8.86 | | | | | 21.50 | | | | | N/A | | | | | 12.74 | | | | | N/A | | | | | 7.81 | | | | | N/A | |
Russell Midcap® Growth Index | | | | 7.38 | | | | | 14.07 | | | | | N/A | | | | | 11.95 | | | | | N/A | | | | | 8.13 | | | | | N/A | |
| | 4 | | Assuming maximum sales charges, if any. Average annual total returns with and without sales charges reflect reductions for distribution and service fees. See “About Fund Performance” on page 10 for a detailed description of share classes, including any related sales charges and fees. |
| | | | N/A—Not applicable as share class and index do not have a sales charge. |
| | | | Past performance is not indicative of future results. |
| | | | Performance results may include adjustments made for financial reporting purposes in accordance with U.S. generally accepted accounting principles. |
| | | | | | | | | | | | | | | | | | | | | | | | | | | | | | | | | | | |
| | | Actual | | Hypothetical7 | | |
| | | Beginning
Account Value
October 1, 2016 | | Ending
Account Value
March 31, 2017 | | Expenses Paid
During the Period6 | | Beginning
Account Value
October 1, 2016 | | Ending
Account Value
March 31, 2017 | | Expenses Paid
During the Period6 | | Annualized
Expense
Ratio |
Institutional | | | $ | 1,000.00 | | | | $ | 1,091.80 | | | | $ | 5.77 | | | | $ | 1,000.00 | | | | $ | 1,019.34 | | | | $ | 5.57 | | | | | 1.11 | % |
Service | | | $ | 1,000.00 | | | | $ | 1,091.10 | | | | $ | 6.34 | | | | $ | 1,000.00 | | | | $ | 1,018.80 | | | | $ | 6.12 | | | | | 1.22 | % |
Investor A | | | $ | 1,000.00 | | | | $ | 1,090.00 | | | | $ | 7.22 | | | | $ | 1,000.00 | | | | $ | 1,017.95 | | | | $ | 6.97 | | | | | 1.39 | % |
Investor B | | | $ | 1,000.00 | | | | $ | 1,085.30 | | | | $ | 11.20 | | | | $ | 1,000.00 | | | | $ | 1,014.12 | | | | $ | 10.82 | | | | | 2.16 | % |
Investor C | | | $ | 1,000.00 | | | | $ | 1,086.10 | | | | $ | 11.15 | | | | $ | 1,000.00 | | | | $ | 1,014.17 | | | | $ | 10.77 | | | | | 2.15 | % |
Class K | | | $ | 1,000.00 | | | | $ | 1,092.30 | | | | $ | 5.05 | | | | $ | 1,000.00 | | | | $ | 1,020.04 | | | | $ | 4.87 | | | | | 0.97 | % |
Class R | | | $ | 1,000.00 | | | | $ | 1,088.60 | | | | $ | 8.57 | | | | $ | 1,000.00 | | | | $ | 1,016.66 | | | | $ | 8.27 | | | | | 1.65 | % |
| | 6 | | For each class of the Fund, expenses are equal to the annualized expense ratio for the class, multiplied by the average account value over the period, multiplied by 182/365 (to reflect the one-half year period shown). |
| | 7 | | Hypothetical 5% annual return before expenses is calculated by prorating the number of days in the most recent fiscal half year divided by 365. |
| | | | See “Disclosure of Expenses” on page 11 for further information on how expenses were calculated. |
| | | | | | |
| | | BLACKROCK FUNDS | | MARCH 31, 2017 | | 7 |
| | |
| Fund Summary as of March 31, 2017 | | BlackRock Advantage Small Cap Growth Fund |
BlackRock Advantage Small Cap Growth Fund’s (the “Fund”) investment objective is to seek long-term capital growth.
Effective February 15, 2017, the Fund changed its name from BlackRock Small Cap Growth Equity Portfolio to BlackRock Advantage Small Cap Growth Fund.
On March 23, 2017, the Board of Trustees of the Trust and the Board of Directors of BlackRock Series, Inc. (the “Target Corporation”), approved the reorganization of BlackRock Small Cap Growth Fund II (the “Target Fund”), a series of the Target Trust, with and into BlackRock Advantage Small Cap Growth Fund (the “Acquiring Fund”), with the Acquiring Fund continuing as the surviving fund after the reorganization. The reorganization is subject to shareholder approval by the Target Fund shareholders and certain other conditions.
|
| Portfolio Management Commentary |
How did the Fund perform?
| • | | For the six-month period ended March 31, 2017, the Fund outperformed its benchmark, the Russell 2000® Growth Index. |
What factors influenced performance?
| • | | The Fund’s outperformance relative to the benchmark was attributable largely to stock selection within the financials sector. Strategies that examine executive sentiment in company executive earnings conference calls and fundamentals-based valuation measures both added to performance within financials during the period. In terms of specific holdings, regional banks First Horizon National Corp. and First Midwest Bancorp benefited from expectations for higher profits due to a steeping yield curve. Stock selection within the information technology (“IT”) sector also contributed to performance, with shares of robotic-solutions semiconductor specialist Ultra Clean Holdings, Inc. rising on expectations for increased U.S. manufacturing activity. |
| • | | The Fund’s underweight position in IT companies was the primary negative contributor to relative performance, as the sector generally |
| | | responded positively to expectations of increased domestic economic activity. An underweight in online payment network Blackhawk Network Holdings was the most notable detractor. In addition, a strategy that focuses on common topics during company executive earnings conference calls detracted from performance, as reflationary trends favored certain overall sectors rather than boosting specific stocks across different sectors. |
Describe recent portfolio activity.
| • | | During the six-month period, the Fund’s weightings in the financials, utilities, and consumer staples sectors increased, while the weightings in materials and energy decreased. |
Describe portfolio positioning at period end.
| • | | Relative to the Russell 2000® Growth Index, the Fund’s most significant sector overweights as of period end were industrials, financials, and IT. The most significant underweights were materials and consumer discretionary. |
The views expressed reflect the opinions of BlackRock as of the date of this report and are subject to change based on changes in market, economic or other conditions. These views are not intended to be a forecast of future events and are no guarantee of future results.
| | | | | |
| Ten Largest Holdings | | Percent of
Net Assets |
Cantel Medical Corp. | | | | 2 | % |
Prestige Brands Holdings, Inc. | | | | 2 | |
PS Business Parks, Inc. | | | | 2 | |
Insperity, Inc. | | | | 2 | |
Sanmina Corp. | | | | 2 | |
SYNNEX Corp. | | | | 2 | |
Apogee Enterprises, Inc. | | | | 2 | |
Universal Forest Products, Inc. | | | | 2 | |
Masimo Corp. | | | | 2 | |
Tenneco, Inc. | | | | 2 | |
| | | | | |
| Sector Allocation | | Percent of
Net Assets |
Information Technology | | | | 26 | % |
Health Care | | | | 21 | |
Industrials | | | | 17 | |
Consumer Discretionary | | | | 14 | |
Financials | | | | 6 | |
Real Estate | | | | 6 | |
Materials | | | | 4 | |
Consumer Staples | | | | 3 | |
Utilities | | | | 1 | |
Energy | | | | 1 | |
Short-Term Securities | | | | 1 | |
For Fund compliance purposes, the Fund’s sector classifications refer to one or more of the sector sub-classifications used by one or more widely recognized market indexes or ratings group indexes, and/or as defined by the investment adviser. These definitions may not apply for purposes of this report, which may combine sector sub-classifications for reporting ease.
| | | | | | |
| 8 | | BLACKROCK FUNDS | | MARCH 31, 2017 | | |
| | |
| | | BlackRock Advantage Small Cap Growth Fund |
|
| Total Return Based on a $10,000 Investment |
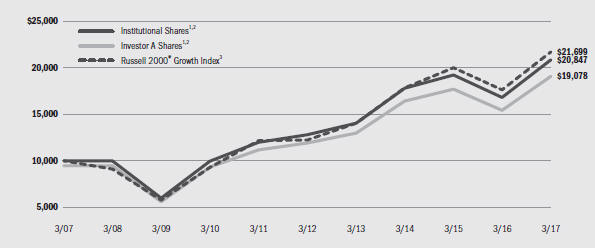
| | 1 | Assuming maximum sales charges, if any, transaction costs and other operating expenses, including investment advisory fees and administration fees, if any. Institutional Shares do not have a sales charge. |
| | 2 | Under normal circumstances, the Fund will invest at least 80% of its net assets (plus any borrowings for investment purposes) in equity securities of small cap companies and at least 80% of its net assets (plus any borrowings for investment purposes) in securities or instruments of issuers located in the United States. |
| | 3 | An unmanaged index that measures performance of the small-cap growth segment of the U.S. equity universe. It includes those Russell 2000® Index companies with higher price-to-value ratios and higher forecasted growth values. |
|
| Performance Summary for the Period Ended March 31, 2017 |
| | | | | | | | | | | | | | | | | | | | | | | | | | | | | | | | | | | |
| | | | | Average Annual Total Returns4 |
| | | | | 1 Year | | 5 Years | | 10 Years |
| | | 6-Month
Total Returns | | w/o sales
charge | | w/ sales
charge | | w/o sales
charge | | w/ sales
charge | | w/o sales
charge | | w/ sales
charge |
Institutional | | | | 10.92 | % | | | | 23.91 | % | | | | N/A | | | | | 10.24 | % | | | | N/A | | | | | 7.62 | % | | | | N/A | |
Service | | | | 10.75 | | | | | 23.56 | | | | | N/A | | | | | 9.92 | | | | | N/A | | | | | 7.33 | | | | | N/A | |
Investor A | | | | 10.71 | | | | | 23.52 | | | | | 17.03 | % | | | | 9.89 | | | | | 8.71 | % | | | | 7.25 | | | | | 6.67 | % |
Investor C | | | | 10.36 | | | | | 22.65 | | | | | 21.65 | | | | | 9.03 | | | | | 9.03 | | | | | 6.35 | | | | | 6.35 | |
Russell 2000® Growth Index | | | | 9.11 | | | | | 23.03 | | | | | N/A | | | | | 12.10 | | | | | N/A | | | | | 8.05 | | | | | N/A | |
| | 4 | | Assuming maximum sales charges, if any. Average annual total returns with and without sales charges reflect reductions for distribution and service fees. See “About Fund Performance” on page 10 for a detailed description of share classes, including any related sales charges and fees. |
| | | | N/A—Not applicable as share class and index do not have a sales charge. |
| | | | Past performance is not indicative of future results. |
| | | | Performance results may include adjustments made for financial reporting purposes in accordance with U.S. generally accepted accounting principles. |
| | | | | | | | | | | | | | | | | | | | | | | | | | | | | | | | | | | |
| | | Actual | | Hypothetical6 | | |
| | | Beginning
Account Value
October 1, 2016 | | Ending
Account Value
March 31, 2017 | | Expenses Paid
During the Period5 | | Beginning
Account Value
October 1, 2016 | | Ending
Account Value
March 31, 2017 | | Expenses Paid
During the Period5 | | Annualized
Expense
Ratio |
Institutional | | | $ | 1,000.00 | | | | $ | 1,109.20 | | | | $ | 3.20 | | | | $ | 1,000.00 | | | | $ | 1,021.83 | | | | $ | 3.07 | | | | | 0.61 | % |
Service | | | $ | 1,000.00 | | | | $ | 1,107.50 | | | | $ | 4.61 | | | | $ | 1,000.00 | | | | $ | 1,020.49 | | | | $ | 4.42 | | | | | 0.88 | % |
Investor A | | | $ | 1,000.00 | | | | $ | 1,107.10 | | | | $ | 4.66 | | | | $ | 1,000.00 | | | | $ | 1,020.44 | | | | $ | 4.47 | | | | | 0.89 | % |
Investor C | | | $ | 1,000.00 | | | | $ | 1,103.60 | | | | $ | 8.58 | | | | $ | 1,000.00 | | | | $ | 1,016.71 | | | | $ | 8.22 | | | | | 1.64 | % |
| | 5 | | For each class of the Fund, expenses are equal to the annualized expense ratio for the class, multiplied by the average account value over the period, multiplied by 182/365 (to reflect the one-half year period shown). |
| | 6 | | Hypothetical 5% annual return before expenses is calculated by prorating the number of days in the most recent fiscal half year divided by 365. |
| | | | See “Disclosure of Expenses” on page 11 for further information on how expenses were calculated. |
| | | | | | |
| | | BLACKROCK FUNDS | | MARCH 31, 2017 | | 9 |
| • | | Institutional and Class K Shares (Class K Shares are available only in BlackRock Mid-Cap Growth Equity Portfolio) are not subject to any sales charge. These shares bear no ongoing distribution or service fees and are available only to certain eligible investors. Prior to BlackRock Mid-Cap Growth Equity Portfolio’s Class K Shares inception date of March 28, 2016, Class K Share performance results are those of Institutional Shares (which have no distribution or service fees) and were restated to reflect Class K Share fees. |
| • | | Service Shares are not subject to any sales charge. These shares are subject to a service fee of 0.25% per year (but no distribution fee) and are only available to certain eligible investors. |
| • | | Investor A Shares are subject to a maximum initial sales charge (front- end load) of 5.25% and a service fee of 0.25% per year (but no distribution fee). Certain redemptions of these shares may be subject to a contingent deferred sales charge (“CDSC”) where no initial sales charge was paid at the time of purchase. These shares are generally available through financial intermediaries. |
| • | | Investor B Shares (for all Funds except BlackRock Advantage Small Cap Growth Fund) are subject to a maximum CDSC of 4.50% declining to 0% after six years. In addition, these shares are subject to a distribution fee of 0.75% per year and a service fee of 0.25% per year. These shares automatically convert to Investor A Shares after approximately eight years. (There is no initial sales charge for automatic share conversions.) All returns for periods greater than eight years reflect this conversion. These shares are only available through exchanges and distribution reinvestments by current holders and for purchase by certain employer-sponsored retirement plans. |
| • | | Investor C Shares are subject to a 1.00% CDSC if redeemed within one year of purchase. In addition, these shares are subject to a distribution |
| | | fee of 0.75% per year and a service fee of 0.25% per year. These shares are generally available through financial intermediaries. |
| • | | Class R Shares (for all Funds except BlackRock Advantage Small Cap Growth Fund) are not subject to any sales charge. These shares are subject to a distribution fee of 0.25% per year and a service fee of 0.25% per year. These shares are available only to certain employer-sponsored retirement plans. Prior to July 30, 2010, Class R performance results of BlackRock Flexible Equity Fund are those of Investor A Shares restated to reflect Class R Share fees. |
Performance information reflects past performance and does not guarantee future results. Current performance may be lower or higher than the performance data quoted. Refer to www.blackrock.com/funds to obtain performance data current to the most recent month end. Performance results do not reflect the deduction of taxes that a shareholder would pay on fund distributions or the redemption of fund shares. Figures shown in each of the performance tables on the previous pages assume reinvestment of all distributions, if any, at net asset value (“NAV”) on the ex-dividend date. Investment return and principal value of shares will fluctuate so that shares, when redeemed, may be worth more or less than their original cost. Distributions paid to each class of shares will vary because of the different levels of service, distribution and transfer agency fees applicable to each class, which are deducted from the income available to be paid to shareholders.
BlackRock Advisors, LLC (the “Manager”), each Fund’s investment adviser, has contractually agreed to waive and/or reimburse a portion of the Funds’ expenses. The Manager is under no obligation to continue waiving and/or reimbursing its fees after the applicable termination date of such agreement. See Note 6 of the Notes to Financial Statements for additional information on waivers and/or reimbursements.
| | | | | | |
| 10 | | BLACKROCK FUNDS | | MARCH 31, 2017 | | |
Shareholders of the Funds may incur the following charges: (a) transactional expenses, such as sales charges; and (b) operating expenses, including investment advisory fees, service and distribution fees, including 12b-1 fees, acquired fund fees and expenses and other fund expenses. The expense examples shown on the previous pages (which are based on a hypothetical investment of $1,000 invested on October 1, 2016 and held through March 31, 2017) are intended to assist shareholders both in calculating expenses based on an investment in each Fund and in comparing these expenses with similar costs of investing in other mutual funds.
The expense examples provide information about actual account values and actual expenses. In order to estimate the expenses a shareholder paid during the period covered by this report, shareholders can divide their account value by $1,000 and then multiply the result by the number corresponding to their Fund and share class under the headings entitled “Expenses Paid During the Period.”
The expense examples also provide information about hypothetical account values and hypothetical expenses based on a Fund’s actual expense ratio and an assumed rate of return of 5% per year before expenses. In order to assist shareholders in comparing the ongoing expenses of investing in these Funds and other funds, compare the 5% hypothetical examples with the 5% hypothetical examples that appear in shareholder reports of other funds.
The expenses shown in the expense examples are intended to highlight shareholders’ ongoing costs only and do not reflect transactional expenses, such as sales charges, if any. Therefore, the hypothetical examples are useful in comparing ongoing expenses only, and will not help shareholders determine the relative total expenses of owning different funds. If these transactional expenses were included, shareholder expenses would have been higher.
|
| Derivative Financial Instruments |
The Funds may invest in various derivative financial instruments. These instruments are used to obtain exposure to a security, commodity, index, market, and/or other asset without owning or taking physical custody of securities, commodities and/or other referenced assets or to manage market, equity, credit, interest rate, foreign currency exchange rate, commodity and/or other risks. Derivative financial instruments may give rise to a form of economic leverage and involve risks, including the imperfect correlation between the value of a derivative financial instrument and the underlying asset, possible default of the counterparty to the
transaction or illiquidity of the instrument. The Funds’ successful use of a derivative financial instrument depends on the investment adviser’s ability to predict pertinent market movements accurately, which cannot be assured. The use of these instruments may result in losses greater than if they had not been used, may limit the amount of appreciation a Fund can realize on an investment and/or may result in lower distributions paid to shareholders. The Funds’ investments in these instruments, if any, are discussed in detail in the Notes to Financial Statements.
| | | | | | |
| | | BLACKROCK FUNDS | | MARCH 31, 2017 | | 11 |
| | | | |
| Consolidated Schedule of Investments March 31, 2017 (Unaudited) | | | BlackRock Flexible Equity Fund | |
| | | (Percentages shown are based on Net Assets) | |
| | | | | | | | |
| Common Stocks | | Shares | | | Value | |
Aerospace & Defense — 0.1% | | | | | | | | |
Huntington Ingalls Industries, Inc. | | | 1,188 | | | $ | 237,885 | |
Airlines — 1.7% | | | | | | | | |
Delta Air Lines, Inc. | | | 151,655 | | | | 6,970,064 | |
Southwest Airlines Co. | | | 9,616 | | | | 516,956 | |
| | | | | | | | |
| | | | | | | | 7,487,020 | |
Auto Components — 2.8% | | | | | | | | |
Goodyear Tire & Rubber Co. | | | 178,719 | | | | 6,433,884 | |
Lear Corp. | | | 42,419 | | | | 6,005,682 | |
| | | | | | | | |
| | | | | | | | 12,439,566 | |
Banks — 12.9% | | | | | | | | |
Bank of America Corp. | | | 654,457 | | | | 15,438,641 | |
Citigroup, Inc. | | | 59,899 | | | | 3,583,158 | |
JPMorgan Chase & Co. | | | 200,008 | | | | 17,568,703 | |
Regions Financial Corp. | | | 169,019 | | | | 2,455,846 | |
SunTrust Banks, Inc. | | | 144,024 | | | | 7,964,527 | |
U.S. Bancorp | | | 200,780 | | | | 10,340,170 | |
| | | | | | | | |
| | | | | | | | 57,351,045 | |
Beverages — 0.9% | | | | | | | | |
Dr. Pepper Snapple Group, Inc. | | | 42,835 | | | | 4,194,403 | |
Biotechnology — 4.2% | | | | | | | | |
Biogen, Inc. (a) | | | 35,371 | | | | 9,671,139 | |
Bioverativ, Inc. | | | 10,558 | | | | 574,989 | |
Gilead Sciences, Inc. | | | 124,472 | | | | 8,454,138 | |
| | | | | | | | |
| | | | | | | | 18,700,266 | |
Building Products — 0.2% | | | | | | | | |
Owens Corning | | | 16,865 | | | | 1,035,005 | |
Capital Markets — 2.0% | | | | | | | | |
Freedom Pay, Inc. (a) | | | 43,051 | | | | — | |
Goldman Sachs Group, Inc. | | | 39,632 | | | | 9,104,263 | |
| | | | | | | | |
| | | | | | | | 9,104,263 | |
Chemicals — 2.5% | | | | | | | | |
Dow Chemical Co. | | | 174,282 | | | | 11,073,878 | |
Communications Equipment — 2.3% | | | | | | | | |
Cisco Systems, Inc. | | | 296,959 | | | | 10,037,214 | |
Construction & Engineering — 0.4% | | | | | | | | |
EMCOR Group, Inc. | | | 25,497 | | | | 1,605,036 | |
Consumer Finance — 1.1% | | | | | | | | |
SLM Corp. (a) | | | 400,655 | | | | 4,847,925 | |
Containers & Packaging — 1.7% | | | | | | | | |
Avery Dennison Corp. | | | 32,545 | | | | 2,623,127 | |
Packaging Corp. of America | | | 52,492 | | | | 4,809,317 | |
| | | | | | | | |
| | | | | | | | 7,432,444 | |
Diversified Telecommunication Services — 0.3% | | | | | | | | |
AT&T Inc. | | | 25,800 | | | | 1,071,990 | |
Verizon Communications, Inc. | | | 9,383 | | | | 457,421 | |
| | | | | | | | |
| | | | | | | | 1,529,411 | |
Electric Utilities — 0.6% | | | | | | | | |
FirstEnergy Corp. | | | 81,408 | | | | 2,590,403 | |
Electronic Equipment, Instruments & Components — 2.0% | | | | | |
CDW Corp. | | | 70,760 | | | | 4,083,560 | |
| | | | | | | | |
| Common Stocks | | Shares | | | Value | |
Electronic Equipment, Instruments & Components (continued) | | | | | |
Flex Ltd. (a) | | | 299,036 | | | $ | 5,023,805 | |
| | | | | | | | |
| | | | | | | | 9,107,365 | |
Food & Staples Retailing — 4.6% | | | | | | | | |
CVS Health Corp. | | | 91,275 | | | | 7,165,088 | |
Walgreens Boots Alliance, Inc. | | | 114,577 | | | | 9,515,620 | |
Wal-Mart Stores, Inc. | | | 52,426 | | | | 3,778,866 | |
| | | | | | | | |
| | | | | | | | 20,459,574 | |
Health Care Providers & Services — 7.1% | | | | | | | | |
Aetna, Inc. | | | 5,644 | | | | 719,892 | |
Anthem, Inc. | | | 11,951 | | | | 1,976,456 | |
Centene Corp. (a) | | | 61,127 | | | | 4,355,910 | |
Cigna Corp. | | | 11,780 | | | | 1,725,652 | |
Humana, Inc. | | | 42,407 | | | | 8,741,779 | |
Laboratory Corp. of America Holdings (a) | | | 24,533 | | | | 3,519,749 | |
McKesson Corp. | | | 11,969 | | | | 1,774,524 | |
UnitedHealth Group, Inc. | | | 54,586 | | | | 8,952,650 | |
| | | | | | | | |
| | | | | | | | 31,766,612 | |
Hotels, Restaurants & Leisure — 2.5% | | | | | | | | |
Carnival Corp. | | | 185,634 | | | | 10,935,699 | |
Household Durables — 1.9% | | | | | | | | |
DR Horton, Inc. | | | 130,157 | | | | 4,335,530 | |
Lennar Corp., Class A | | | 41,090 | | | | 2,103,397 | |
NVR, Inc. (a) | | | 945 | | | | 1,991,002 | |
| | | | | | | | |
| | | | | | | | 8,429,929 | |
Insurance — 0.1% | | | | | | | | |
Prudential Financial, Inc. | | | 2,108 | | | | 224,881 | |
Internet Software & Services — 4.2% | | | | | | | | |
Alphabet, Inc., Class A (a) | | | 22,122 | | | | 18,755,032 | |
IT Services — 2.3% | | | | | | | | |
Amdocs, Ltd. | | | 65,577 | | | | 3,999,541 | |
Cognizant Technology Solutions Corp., Class A (a) | | | 106,800 | | | | 6,356,736 | |
| | | | | | | | |
| | | | | | | | 10,356,277 | |
Life Sciences Tools & Services — 0.0% | | | | | | | | |
Quintiles IMS Holdings, Inc. (a) | | | 2,713 | | | | 218,478 | |
Machinery — 1.8% | | | | | | | | |
Stanley Black & Decker, Inc. | | | 51,981 | | | | 6,906,715 | |
WABCO Holdings, Inc. (a) | | | 9,700 | | | | 1,138,974 | |
| | | | | | | | |
| | | | | | | | 8,045,689 | |
Media — 3.3% | | | | | | | | |
Comcast Corp., Class A | | | 393,532 | | | | 14,792,868 | |
Metals & Mining — 0.9% | | | | | | | | |
Rio Tinto PLC — ADR | | | 102,512 | | | | 4,170,188 | |
Multiline Retail — 0.0% | | | | | | | | |
Kohl’s Corp. | | | 3,971 | | | | 158,085 | |
Multi-Utilities — 0.7% | | | | | | | | |
Ameren Corp. | | | 8,276 | | | | 451,787 | |
Public Service Enterprise Group, Inc. | | | 58,602 | | | | 2,598,999 | |
| | | | | | | | |
| | | | | | | | 3,050,786 | |
| | | | | | | | | | |
| Portfolio Abbreviations |
| ADR | | American Depositary Receipts | | CVR | | Contingent Value Rights | | USD | | U.S. Dollar |
See Notes to Financial Statements.
| | | | | | |
| 12 | | BLACKROCK FUNDS | | MARCH 31, 2017 | | |
| | | | |
| Consolidated Schedule of Investments (continued) | | | BlackRock Flexible Equity Fund | |
| | | | |
| | | | | | | | |
Common Stocks | | | Shares | | | | Value | |
Oil, Gas & Consumable Fuels — 6.5% | | | | | | | | |
Anadarko Petroleum Corp. | | | 22,972 | | | $ | 1,424,264 | |
BP PLC — ADR | | | 138,064 | | | | 4,765,969 | |
Chevron Corp. | | | 86,308 | | | | 9,266,890 | |
Hess Corp. | | | 33,902 | | | | 1,634,415 | |
Marathon Oil Corp. | | | 84,067 | | | | 1,328,259 | |
Statoil ASA — ADR (b) | | | 96,380 | | | | 1,655,808 | |
Suncor Energy, Inc. | | | 142,460 | | | | 4,380,645 | |
TOTAL SA — ADR | | | 59,352 | | | | 2,992,528 | |
Valero Energy Corp. | | | 23,500 | | | | 1,557,815 | |
| | | | | | | | |
| | | | | | | | 29,006,593 | |
Pharmaceuticals — 3.4% | | | | | | | | |
Allergan PLC | | | 11,205 | | | | 2,677,099 | |
Mallinckrodt PLC (a) | | | 58,908 | | | | 2,625,530 | |
Merck & Co., Inc. | | | 65,990 | | | | 4,193,005 | |
Mylan NV (a) | | | 10,704 | | | | 417,349 | |
Pfizer, Inc. | | | 87,228 | | | | 2,984,070 | |
Teva Pharmaceutical Industries Ltd. — ADR | | | 71,362 | | | | 2,290,007 | |
| | | | | | | | |
| | | | | | | | 15,187,060 | |
Professional Services — 0.8% | | | | | | | | |
Robert Half International, Inc. | | | 72,232 | | | | 3,527,089 | |
Road & Rail — 0.9% | | | | | | | | |
Norfolk Southern Corp. | | | 35,913 | | | | 4,021,179 | |
Semiconductors & Semiconductor Equipment — 4.4% | | | | | | | | |
Applied Materials, Inc. | | | 34,372 | | | | 1,337,071 | |
Intel Corp. | | | 176,497 | | | | 6,366,247 | |
Lam Research Corp. | | | 78,720 | | | | 10,104,499 | |
Qorvo, Inc. (a) | | | 26,576 | | | | 1,822,051 | |
| | | | | | | | |
| | | | | | | | 19,629,868 | |
Software — 5.7% | | | | | | | | |
Activision Blizzard, Inc. | | | 129,608 | | | | 6,462,255 | |
| | | | | | | | |
Common Stocks | | | Shares | | | | Value | |
Software (continued) | | | | | | | | |
Dell Technologies, Inc., Class V | | | 24,362 | | | $ | 1,561,117 | |
Microsoft Corp. | | | 265,848 | | | | 17,508,749 | |
| | | | | | | | |
| | | | | | | | 25,532,121 | |
Specialty Retail — 4.9% | | | | | | | | |
Home Depot, Inc. | | | 67,545 | | | | 9,917,632 | |
Lowe’s Cos., Inc. | | | 123,907 | | | | 10,186,394 | |
Urban Outfitters, Inc. (a) | | | 75,936 | | | | 1,804,239 | |
| | | | | | | | |
| | | | | | | | 21,908,265 | |
Technology Hardware, Storage & Peripherals — 5.3% | | | | | | | | |
Apple Inc. | | | 164,368 | | | | 23,613,107 | |
Tobacco — 1.7% | | | | | | | | |
Altria Group, Inc. | | | 105,685 | | | | 7,548,023 | |
Total Common Stocks — 98.7% | | | | | | | 440,110,532 | |
| | | | | | | | |
Total Long-Term Investments (Cost — $366,256,519) — 98.7% | | | | | 440,110,532 | |
Short-Term Securities | | | | | | | | |
BlackRock Liquidity Funds, T-Fund, Institutional Class,
0.60% (c)(d) | | | 6,364,969 | | | | 6,364,969 | |
SL Liquidity Series, LLC, Money Market Series,
1.11% (d)(e) | | | 471,584 | | | | 471,631 | |
Total Short-Term Securities (Cost — $6,836,647) — 1.5% | | | | | | | 6,836,600 | |
Total Investments (Cost — $373,093,166) — 100.2% | | | | | | | 446,947,132 | |
Liabilities in Excess of Other Assets — (0.2)% | | | | | | | (1,033,798 | ) |
| | | | | | | | |
Net Assets — 100.0% | | | | | | $ | 445,913,334 | |
| | | | | | | | |
|
| Notes to Consolidated Schedule of Investments |
| (a) | Non-income producing security. |
| (b) | Security, or a portion of the security, is on loan. |
| (c) | During the six months ended March 31, 2017, investments in issuers considered to be affiliates of the Fund for purposes of Section 2(a)(3) of the Investment Company Act of 1940, as amended, were as follows: |
| | | | | | | | | | | | | | | | | | | | | | | | | | | | |
| Affiliate | | Shares Held at
September 30,
2016 | | | Net Activity | | | Shares Held at
March 31,
2017 | | | Value at
March 31,
2017 | | | Income | | | Net
Realized
Gain
(Loss)1 | | | Change in
Unrealized
Appreciation
(Depreciation) | |
BlackRock Liquidity Funds, T-Fund, Institutional Class | | | 9,739,821 | | | | (3,374,852 | ) | | | 6,364,969 | | | $ | 6,364,969 | | | $ | 15,236 | | | | $ 62 | | | | — | |
SL Liquidity Series, LLC Money Market Series | | | 1,426,572 | | | | (954,988 | ) | | | 471,584 | | | | 471,631 | | | | 1,459 | 2 | | | 100 | | | | $(47 | ) |
Total | | | | | | | | | | | | | | $ | 6,836,600 | | | $ | 16,695 | | | | $162 | | | | $(47 | ) |
| | | | | | | | | | | | | | | | |
| | 1 | | Includes net capital gain distributions. |
| | 2 | | Represents securities lending income earned from the reinvestment of cash collateral from loaned securities, net of fees and collateral investment expenses, and other payments to and from borrowers of securities. |
| (d) | Current yield as of period end. |
| (e) | Security was purchased with the cash collateral from loaned securities. |
See Notes to Financial Statements.
| | | | | | |
| | | BLACKROCK FUNDS | | MARCH 31, 2017 | | 13 |
| | | | |
| Consolidated Schedule of Investments (concluded) | | | BlackRock Flexible Equity Fund | |
| • | | For Fund compliance purposes, the Fund’s industry classifications refer to one or more of the industry sub-classifications used by one or more widely recognized market indexes or rating group indexes, and/or as defined by the investment adviser. These definitions may not apply for purposes of this report, which may combine such industry sub-classifications for reporting ease. |
|
| Fair Value Hierarchy as of Period End |
Various inputs are used in determining the fair value of investments. For information about the Fund’s policy regarding valuation of investments, refer to the Notes to Financial Statements.
The following table summarizes the Fund’s investments categorized in the disclosure hierarchy:
| | | | | | | | | | | | | | | | | | | | |
| | | Level 1 | | Level 2 | | Level 3 | | Total |
Assets: | | | | | | | | | | | | | | | | | | | | |
Investments: | | | | | | | | | | | | | | | | | | | | |
Long-Term Investments: | | | | | | | | | | | | | | | | | | | | |
Common Stocks1 | | | $ | 440,110,532 | | | | | — | | | | | — | | | | $ | 440,110,532 | |
Short-Term Securities | | | | 6,364,969 | | | | | — | | | | | — | | | | | 6,364,969 | |
| | | | | |
Total | | | $ | 446,475,501 | | | | | — | | | | | — | | | | $ | 446,475,501 | |
| | | | | |
Investments Valued at NAV2 | | | | | | | | | | | | | | | | | | | 471,631 | |
| | | | | | | | | | | | | | | | | | | | |
Total Investments | | | | | | | | | | | | | | | | | | $ | 446,947,132 | |
| | | | | | | | | | | | | | | | | | | | |
| | 1 | | See above Schedule of Investments for values in each industry. |
| | 2 | | As of March 31, 2017, certain investments of the Fund were fair valued using NAV per share as no quoted market value is available and therefore have been excluded from the fair value hierarchy. |
During the six months ended March 31, 2017, there were no transfers between levels.
See Notes to Financial Statements.
| | | | | | |
| 14 | | BLACKROCK FUNDS | | MARCH 31, 2017 | | |
| | | | |
| Schedule of Investments March 31, 2017 (Unaudited) | | | BlackRock Mid-Cap Growth Equity Portfolio | |
| | | (Percentages shown are based on Net Assets) | |
| | | | | | | | |
| Common Stocks | | Shares | | | Value | |
Aerospace & Defense — 1.4% | | | | | | | | |
TransDigm Group, Inc. (a) | | | 37,295 | | | $ | 8,210,867 | |
Airlines — 0.8% | | | | | | | | |
Southwest Airlines Co. | | | 87,130 | | | | 4,684,109 | |
Banks — 6.1% | | | | | | | | |
Bank of The Ozarks, Inc. | | | 57,190 | | | | 2,974,452 | |
First Republic Bank | | | 141,698 | | | | 13,292,689 | |
KeyCorp | | | 165,824 | | | | 2,948,351 | |
Signature Bank (a) | | | 14,098 | | | | 2,092,002 | |
SVB Financial Group (a) | | | 67,877 | | | | 12,631,231 | |
Zions Bancorporation | | | 70,283 | | | | 2,951,886 | |
| | | | | | | | |
| | | | | | | | 36,890,611 | |
Beverages — 2.1% | | | | | | | | |
Constellation Brands, Inc., Class A | | | 76,575 | | | | 12,410,510 | |
Biotechnology — 0.9% | | | | | | | | |
Ligand Pharmaceuticals, Inc. (a) | | | 53,294 | | | | 5,640,637 | |
Building Products — 4.7% | | | | | | | | |
AO Smith Corp. | | | 245,529 | | | | 12,561,264 | |
JELD-WEN Holding, Inc. (a) | | | 278,907 | | | | 9,162,095 | |
Masonite International Corp. (a) | | | 85,031 | | | | 6,738,707 | |
| | | | | | | | |
| | | | | | | | 28,462,066 | |
Chemicals — 1.3% | | | | | | | | |
Scotts Miracle-Gro Co., Class A | | | 42,166 | | | | 3,937,883 | |
Sherwin-Williams Co. | | | 11,845 | | | | 3,674,200 | |
| | | | | | | | |
| | | | | | | | 7,612,083 | |
Communications Equipment — 1.2% | | | | | | | | |
CommScope Holding Co, Inc. (a) | | | 169,140 | | | | 7,054,829 | |
Diversified Telecommunication Services — 2.2% | | | | | | | | |
Zayo Group Holdings, Inc. (a) | | | 395,582 | | | | 13,014,648 | |
Electrical Equipment — 2.0% | | | | | | | | |
Acuity Brands, Inc. | | | 59,620 | | | | 12,162,480 | |
Electronic Equipment, Instruments & Components — 3.0% | | | | | |
Flex Ltd. (a) | | | 584,608 | | | | 9,821,414 | |
IPG Photonics Corp. (a) | | | 66,193 | | | | 7,989,495 | |
| | | | | | | | |
| | | | | | | | 17,810,909 | |
Equity Real Estate Investment Trusts (REITs) — 5.2% | | | | | | | | |
Equinix, Inc. | | | 42,787 | | | | 17,130,631 | |
SBA Communications Corp. (a) | | | 120,366 | | | | 14,488,455 | |
| | | | | | | | |
| | | | | | | | 31,619,086 | |
Food Products — 1.8% | | | | | | | | |
Lamb Weston Holdings, Inc. | | | 261,894 | | | | 11,015,262 | |
Health Care Equipment & Supplies — 6.8% | | | | | | | | |
Align Technology, Inc. (a) | | | 96,224 | | | | 11,037,855 | |
DexCom, Inc. (a) | | | 86,803 | | | | 7,354,818 | |
Intuitive Surgical, Inc. (a) | | | 22,368 | | | | 17,144,401 | |
Nevro Corp. (a) | | | 58,034 | | | | 5,437,786 | |
| | | | | | | | |
| | | | | | | | 40,974,860 | |
Health Care Providers & Services — 0.8% | | | | | | | | |
VCA, Inc. (a) | | | 51,967 | | | | 4,754,980 | |
Hotels, Restaurants & Leisure — 7.0% | | | | | | | | |
Chipotle Mexican Grill, Inc. (a)(b) | | | 2,840 | | | | 1,265,277 | |
Domino’s Pizza Enterprises Ltd. | | | 132,396 | | | | 5,877,685 | |
Domino’s Pizza, Inc. | | | 78,792 | | | | 14,521,366 | |
Papa John’s International, Inc. | | | 76,243 | | | | 6,102,490 | |
Vail Resorts, Inc. | | | 75,274 | | | | 14,445,081 | |
| | | | | | | | |
| | | | | | | | 42,211,899 | |
| | | | | | | | |
| Common Stocks | | Shares | | | Value | |
Industrial Conglomerates — 2.1% | | | | | | | | |
Roper Technologies, Inc. | | | 61,215 | | | $ | 12,640,285 | |
Internet & Direct Marketing Retail — 5.4% | | | | | | | | |
Liberty Expedia Holdings, Inc. (a) | | | 134,067 | | | | 6,097,367 | |
Liberty Ventures (a) | | | 244,152 | | | | 10,859,881 | |
Netflix, Inc. (a) | | | 107,629 | | | | 15,908,642 | |
| | | | | | | | |
| | | | | | | | 32,865,890 | |
Internet Software & Services — 7.1% | | | | | | | | |
Alteryx, Inc. (a) | | | 86,222 | | | | 1,347,650 | |
CoStar Group, Inc. (a) | | | 54,842 | | | | 11,364,359 | |
IAC/InterActiveCorp (a) | | | 136,726 | | | | 10,079,441 | |
MercadoLibre, Inc. | | | 27,232 | | | | 5,758,751 | |
Pandora Media, Inc. (a) | | | 293,773 | | | | 3,469,459 | |
Wix.com Ltd. (a) | | | 160,939 | | | | 10,927,758 | |
| | | | | | | | |
| | | | | | | | 42,947,418 | |
IT Services — 8.1% | | | | | | | | |
Black Knight Financial Services, Inc., Class A (a) | | | 74,542 | | | | 2,854,959 | |
Fiserv, Inc. (a) | | | 95,742 | | | | 11,040,010 | |
Global Payments, Inc. | | | 158,742 | | | | 12,807,305 | |
Vantiv, Inc., Class A (a) | | | 186,330 | | | | 11,947,480 | |
Worldpay Group PLC | | | 2,742,767 | | | | 10,140,602 | |
| | | | | | | | |
| | | | | | | | 48,790,356 | |
Machinery — 1.2% | | | | | | | | |
Wabtec Corp. | | | 93,870 | | | | 7,321,860 | |
Media — 3.5% | | | | | | | | |
Live Nation Entertainment, Inc. (a) | | | 278,172 | | | | 8,448,084 | |
Madison Square Garden Co., Class A (a) | | | 63,310 | | | | 12,643,640 | |
| | | | | | | | |
| | | | | | | | 21,091,724 | |
Oil, Gas & Consumable Fuels — 2.3% | | | | | | | | |
Concho Resources, Inc. (a) | | | 22,540 | | | | 2,892,784 | |
Diamondback Energy, Inc. (a) | | | 53,276 | | | | 5,525,520 | |
Parsley Energy, Inc., Class A (a) | | | 162,545 | | | | 5,284,338 | |
| | | | | | | | |
| | | | | | | | 13,702,642 | |
Pharmaceuticals — 1.8% | | | | | | | | |
Zoetis, Inc. | | | 204,759 | | | | 10,927,988 | |
Professional Services — 2.4% | | | | | | | | |
Equifax, Inc. | | | 107,931 | | | | 14,758,485 | |
Semiconductors & Semiconductor Equipment — 2.7% | | | | | |
Inphi Corp. (a) | | | 62,848 | | | | 3,068,239 | |
Silicon Laboratories, Inc. (a) | | | 78,643 | | | | 5,784,193 | |
Teradyne, Inc. | | | 245,646 | | | | 7,639,591 | |
| | | | | | | | |
| | | | | | | | 16,492,023 | |
Software — 9.1% | | | | | | | | |
Activision Blizzard, Inc. | | | 39,373 | | | | 1,963,138 | |
Autodesk, Inc. (a) | | | 99,365 | | | | 8,592,091 | |
PTC, Inc. (a) | | | 210,804 | | | | 11,077,750 | |
Snap, Inc., Class A (a)(b) | | | 190,876 | | | | 4,300,436 | |
Take-Two Interactive Software, Inc. (a) | | | 219,062 | | | | 12,983,805 | |
Ubisoft Entertainment SA (a) | | | 65,894 | | | | 2,810,350 | |
Zendesk, Inc. (a) | | | 468,290 | | | | 13,130,852 | |
| | | | | | | | |
| | | | | | | | 54,858,422 | |
Specialty Retail — 1.7% | | | | | | | | |
Ulta Beauty, Inc. (a) | | | 36,283 | | | | 10,349,000 | |
See Notes to Financial Statements.
| | | | | | |
| | | BLACKROCK FUNDS | | MARCH 31, 2017 | | 15 |
| | | | |
| Schedule of Investments (continued) | | | BlackRock Mid-Cap Growth Equity Portfolio | |
| | | | | | | | |
| Common Stocks | | Shares | | | Value | |
Technology Hardware, Storage & Peripherals — 0.3% | | | | | |
BlackBerry, Ltd. (a) | | | 261,812 | | | $ | 2,029,043 | |
Total Common Stocks — 95.0% | | | | | | | 573,304,972 | |
| | | | | | | | |
| Preferred Stocks | | | | | | |
Internet Software & Services — 2.8% | | | | | | | | |
Uber Technologies, Inc., Series D (Acquired
6/06/14, cost $5,000,911) (a)(c) | | | 322,368 | | | | 16,808,267 | |
Software — 0.6% | | | | | | | | |
Palantir Technologies, Inc., Series I (Acquired
2/07/14, cost $2,811,905) (a)(c) | | | 458,712 | | | | 3,642,173 | |
Total Preferred Stocks — 3.4% | | | | | | | 20,450,440 | |
Total Long-Term Investments (Cost — $445,685,788) — 98.4% | | | | | | | 593,755,412 | |
| | | | | | | | |
| | | | | | | |
| | | | | | | | |
| Short-Term Securities | | Shares | | | Value | |
BlackRock Liquidity Funds, T-Fund, Institutional
Class, 0.60% (d)(e) | | | 12,102,050 | | | $ | 12,102,050 | |
SL Liquidity Series, LLC, Money Market Series,
0.95% (d)(e)(f) | | | 2,602,200 | | | | 2,602,460 | |
| | |
Total Short-Term Securities (Cost — $14,704,718) — 2.4% | | | | | | | 14,704,510 | |
| |
Total Investments (Cost — $460,390,506) — 100.8% | | | $ | 608,459,922 | |
Liabilities in Excess of Other Assets — (0.8)% | | | | (4,859,340 | ) |
| | | | | | | | |
Net Assets — 100.0% | | | $ | 603,600,582 | |
| | | | | | | | |
|
| Notes to Schedule of Investments |
| (a) | Non-income producing security. |
| (b) | Security, or a portion of the security, is on loan. |
| (c) | Restricted security as to resale, excluding 144A securities. The Fund held restricted securities with a current value of $20,450,440, representing 3.4% of its net assets as of period end, and an original cost of $7,812,816. |
| (d) | During the six months ended March 31, 2017, investments in issuers considered to be affiliates of the Fund for purposes of Section 2(a)(3) of the Investment Company Act of 1940, as amended, were as follows: |
| | | | | | | | | | | | | | | | | | | | | | | | | | | | |
| Affiliate | | Shares Held at
September 30,
2016 | | | Net
Activity | | | Shares Held at
March 31,
2017 | | | Value at
March 31,
2017 | | | Income | | | Net
Realized
Loss | | | Change in
Unrealized
Appreciation
(Depreciation) | |
BlackRock Liquidity Funds, T-Fund, Institutional Class | | | 2,658,855 | | | | 9,443,195 | | | | 12,102,050 | | | $ | 12,102,050 | | | $ | 6,677 | | | | — | | | | — | |
SL Liquidity Series, LLC, Money Market Series | | | — | | | | 2,602,200 | | | | 2,602,200 | | | | 2,602,460 | | | | 3,562 | 1 | | | $(14 | ) | | | $(208 | ) |
Total | | | | | | | | | | | | | | $ | 14,704,510 | | | $ | 10,239 | | | | $(14 | ) | | | $(208 | ) |
| | | | | | | | | | | | | | | | |
| | 1 | | Represents securities lending income earned from the reinvestment of cash collateral from loaned securities, net of fees and collateral investment expenses, and other payments to and from borrowers of securities. |
| (e) | Current yield as of period end. |
| (f) | Security was purchased with the cash collateral from loaned securities. |
| • | | For Fund compliance purposes, the Fund’s industry classifications refer to one or more of the industry sub-classifications used by one or more widely recognized market indexes or rating group indexes, and/or as defined by the investment adviser. These definitions may not apply for purposes of this report, which may combine such industry sub-classifications for reporting ease. |
|
| Fair Value Hierarchy as of Period End |
Various inputs are used in determining the fair value of investments. For information about the Fund’s policy regarding valuation of investments, refer to the Notes to Financial Statements.
The following table summarizes the Fund’s investments categorized in the disclosure hierarchy:
| | | | | | | | | | | | | | | | |
| | | Level 1 | | | Level 2 | | | Level 3 | | | Total | |
Assets: | | | | | | | | | | | | | | | | |
Investments: | | | | | | | | | | | | | | | | |
Long-Term Investments: | | | | | | | | | | | | | | | | |
Common Stocks: | | | | | | | | | | | | | | | | |
Aerospace & Defense | | $ | 8,210,867 | | | | — | | | | — | | | $ | 8,210,867 | |
Airlines | | | 4,684,109 | | | | — | | | | — | | | | 4,684,109 | |
Banks | | | 36,890,611 | | | | — | | | | — | | | | 36,890,611 | |
Beverages | | | 12,410,510 | | | | — | | | | — | | | | 12,410,510 | |
Biotechnology | | | 5,640,637 | | | | — | | | | — | | | | 5,640,637 | |
Building Products | | | 28,462,066 | | | | — | | | | — | | | | 28,462,066 | |
Chemicals | | | 7,612,083 | | | | — | | | | — | | | | 7,612,083 | |
See Notes to Financial Statements.
| | | | | | |
| 16 | | BLACKROCK FUNDS | | MARCH 31, 2017 | | |
| | | | |
| Schedule of Investments (continued) | | | BlackRock Mid-Cap Growth Equity Portfolio | |
| | | | | | | | | | | | | | | | |
| | | Level 1 | | | Level 2 | | | Level 3 | | | Total | |
Communications Equipment | | $ | 7,054,829 | | | | — | | | | — | | | $ | 7,054,829 | |
Diversified Telecommunication Services | | | 13,014,648 | | | | — | | | | — | | | | 13,014,648 | |
Electrical Equipment | | | 12,162,480 | | | | — | | | | — | | | | 12,162,480 | |
Electronic Equipment, Instruments & Components | | | 17,810,909 | | | | — | | | | — | | | | 17,810,909 | |
Equity Real Estate Investment Trusts (REITs) | | | 31,619,086 | | | | — | | | | — | | | | 31,619,086 | |
Food Products | | | 11,015,262 | | | | — | | | | — | | | | 11,015,262 | |
Health Care Equipment & Supplies | | | 40,974,860 | | | | — | | | | — | | | | 40,974,860 | |
Health Care Providers & Services | | | 4,754,980 | | | | — | | | | — | | | | 4,754,980 | |
Hotels, Restaurants & Leisure | | | 36,334,214 | | | $ | 5,877,685 | | | | — | | | | 42,211,899 | |
Industrial Conglomerates | | | 12,640,285 | | | | — | | | | — | | | | 12,640,285 | |
Internet & Direct Marketing Retail | | | 32,865,890 | | | | — | | | | — | | | | 32,865,890 | |
Internet Software & Services | | | 42,947,418 | | | | — | | | | — | | | | 42,947,418 | |
IT Services | | | 38,649,754 | | | | 10,140,602 | | | | — | | | | 48,790,356 | |
Machinery | | | 7,321,860 | | | | — | | | | — | | | | 7,321,860 | |
Media | | | 21,091,724 | | | | — | | | | — | | | | 21,091,724 | |
Oil, Gas & Consumable Fuels | | | 13,702,642 | | | | — | | | | — | | | | 13,702,642 | |
Pharmaceuticals | | | 10,927,988 | | | | — | | | | — | | | | 10,927,988 | |
Professional Services | | | 14,758,485 | | | | — | | | | — | | | | 14,758,485 | |
Semiconductors & Semiconductor Equipment | | | 16,492,023 | | | | — | | | | — | | | | 16,492,023 | |
Software | | | 52,048,072 | | | | 2,810,350 | | | | — | | | | 54,858,422 | |
Specialty Retail | | | 10,349,000 | | | | — | | | | — | | | | 10,349,000 | |
Technology Hardware, Storage & Peripherals | | | 2,029,043 | | | | — | | | | — | | | | 2,029,043 | |
Preferred Stocks: | | | | | | | | | | | | | | | | |
Internet Software & Services | | | — | | | | — | | | $ | 16,808,267 | | | | 16,808,267 | |
Software | | | — | | | | — | | | | 3,642,173 | | | | 3,642,173 | |
Short-Term Securities | | | 12,102,050 | | | | — | | | | — | | | | 12,102,050 | |
| | | | |
Subtotal | | $ | 566,578,385 | | | $ | �� 18,828,637 | | | $ | 20,450,440 | | | $ | 605,857,462 | |
| | | | |
Investments Valued at NAV1 | | | | | | | | | | | | | | | 2,602,460 | |
| | | | | | | | | | | | | | | | |
Total Investments | | | | | | | | | | | | | | $ | 608,459,922 | |
| | | | | | | | | | | | | | | | |
| | 1 | | As of March 31, 2017, certain investments of the Fund were fair valued using NAV per share as no quoted market value is available and therefore have been excluded from the fair value hierarchy. |
During the six months ended March 31, 2017, there were no transfers between Level 1 and Level 2.
A reconciliation of Level 3 investments is presented when the Fund had a significant amount of Level 3 investments at the beginning and/or end of the period in relation to net assets. The following table is a reconciliation of Level 3 investments for which significant unobservable inputs were used in determining fair value:
| | | | |
| | | Preferred
Securities | |
Assets: | | | | |
Opening balance, as of September 30, 2016 | | $ | 20,174,639 | |
Transfers into Level 3 | | | — | |
Transfers out of Level 3 | | | — | |
Accrued discounts/premiums | | | — | |
Net realized gain (loss) | | | — | |
Net change in unrealized appreciation (depreciation)1,2 | | | 275,801 | |
Purchases | | | — | |
Sales | | | — | |
| | | | |
Closing Balance, as of March 31, 2017 | | $ | 20,450,440 | |
| | | | |
Net change in unrealized appreciation (depreciation) on investments still held at March 31, 20172 | | $ | 275,801 | |
| | | | |
| | 1 | | Included in the related net change in unrealized appreciation (depreciation) in the Statements of Operations. |
| | 2 | | Any difference between net change in unrealized appreciation (depreciation) and Net change in unrealized appreciation (depreciation) on investments still held at March 31, 2017, is generally due to investments no longer held or categorized as Level 3 at period end. |
See Notes to Financial Statements.
| | | | | | |
| | | BLACKROCK FUNDS | | MARCH 31, 2017 | | 17 |
| | | | |
| Schedule of Investments (concluded) | | | BlackRock Mid-Cap Growth Equity Portfolio | |
The following table summarizes the valuation approaches used and unobservable inputs utilized by the BlackRock Global Valuation Methodologies Committee (the “Global Valuation Committee”) to determine the value of certain of the Fund’s Level 3 investments as of period end.
| | | | | | | | | | | | | | | | | | | | |
| | | Value | | | Valuation Approach | | | Unobservable Inputs | | | Range of
Unobservable Inputs
Utilized | | | Weighted
Average of
Unobservable
Inputs | |
Assets: | | | | | | | | | | | | | | | | | | | | |
Preferred Stocks | | | $20,450,440 | | | | Market | | | | Revenue Multiple1 | | | | 10.75x - 12.75x | | | | 12.39x | |
| | | | | | | | | | | Revenue Growth Rate1 | | | | 133.00% - 187.00% | | | | 177.38 | % |
| | | | | | | | | | | | | | | | | | | | | |
| | 1 | | Increase in unobservable input may result in a significant increase to value, while a decrease in the unobservable input may result in a significant decrease to value. |
See Notes to Financial Statements.
| | | | | | |
| 18 | | BLACKROCK FUNDS | | MARCH 31, 2017 | | |
| | | | |
| Schedule of Investments March 31, 2017 (Unaudited) | | | BlackRock Advantage Small Cap Growth Fund | |
| | | (Percentages shown are based on Net Assets) | |
| | | | | | | | |
| Common Stocks | | Shares | | | Value | |
Aerospace & Defense — 0.8% | | | | | | | | |
DigitalGlobe, Inc. (a) | | | 3,965 | | | $ | 129,854 | |
Engility Holdings, Inc. (a) | | | 62,396 | | | | 1,805,740 | |
HEICO Corp., Class A | | | 36,401 | | | | 2,730,075 | |
Vectrus, Inc. (a) | | | 64,555 | | | | 1,442,804 | |
| | | | | | | | |
| | | | | | | | 6,108,473 | |
Air Freight & Logistics — 1.0% | | | | | | | | |
Hub Group, Inc., Class A (a) | | | 151,377 | | | | 7,023,893 | |
Airlines — 0.8% | | | | | | | | |
Hawaiian Holdings, Inc. (a) | | | 127,407 | | | | 5,918,055 | |
Auto Components — 2.6% | | | | | | | | |
Cooper-Standard Holdings, Inc. (a) | | | 26,668 | | | | 2,958,281 | |
LCI Industries | | | 18,898 | | | | 1,886,020 | |
Lear Corp. | | | 1,590 | | | | 225,112 | |
Tenneco, Inc. (a) | | | 180,940 | | | | 11,294,275 | |
Tower International, Inc. | | | 100,947 | | | | 2,735,664 | |
| | | | | | | | |
| | | | | | | | 19,099,352 | |
Banks — 2.6% | | | | | | | | |
Bank of The Ozarks, Inc. | | | 53,059 | | | | 2,759,599 | |
Central Pacific Financial Corp. | | | 199,391 | | | | 6,089,401 | |
First Merchants Corp | | | 1,896 | | | | 74,551 | |
Home BancShares, Inc. | | | 111,835 | | | | 3,027,373 | |
Wintrust Financial Corp. | | | 97,566 | | | | 6,743,762 | |
| | | | | | | | |
| | | | | | | | 18,694,686 | |
Beverages — 0.4% | | | | | | | | |
Primo Water Corp. (a) | | | 225,041 | | | | 3,056,057 | |
Biotechnology — 7.5% | | | | | | | | |
Acceleron Pharma, Inc. (a) | | | 4,605 | | | | 121,894 | |
Achillion Pharmaceuticals, Inc. (a) | | | 247,176 | | | | 1,040,611 | |
Acorda Therapeutics, Inc. (a) | | | 32,865 | | | | 690,165 | |
Aduro Biotech, Inc. (a) | | | 38,180 | | | | 410,435 | |
Alder Biopharmaceuticals, Inc. (a) | | | 67,386 | | | | 1,401,629 | |
Amicus Therapeutics, Inc. (a) | | | 25,141 | | | | 179,255 | |
AnaptysBio, Inc. (a) | | | 25,921 | | | | 719,308 | |
Applied Genetic Technologies Corp. (a) | | | 78,468 | | | | 541,429 | |
Aptevo Therapeutics, Inc. (a) | | | 26,472 | | | | 54,532 | |
Ardelyx, Inc. (a) | | | 49,969 | | | | 632,108 | |
Arena Pharmaceuticals, Inc. (a) | | | 478,893 | | | | 699,184 | |
aTyr Pharma, Inc. (a) | | | 153,726 | | | | 538,041 | |
BioSpecifics Technologies Corp. (a) | | | 17,396 | | | | 953,301 | |
Bluebird Bio, Inc. (a) | | | 10,071 | | | | 915,454 | |
Blueprint Medicines Corp. (a) | | | 3,514 | | | | 140,525 | |
Cascadian Therapeutics, Inc. (a) | | | 23,269 | | | | 96,334 | |
ChemoCentryx, Inc. (a) | | | 104,382 | | | | 759,901 | |
Clovis Oncology, Inc. (a) | | | 19,419 | | | | 1,236,408 | |
Coherus Biosciences, Inc. (a) | | | 17,695 | | | | 374,249 | |
Concert Pharmaceuticals, Inc. (a) | | | 28,387 | | | | 484,282 | |
Corvus Pharmaceuticals, Inc. (a) | | | 20,360 | | | | 422,877 | |
Cytokinetics, Inc. (a) | | | 84,719 | | | | 1,088,639 | |
CytomX Therapeutics, Inc. (a) | | | 3,925 | | | | 67,785 | |
Emergent Biosolutions, Inc. (a) | | | 49,677 | | | | 1,442,620 | |
Enanta Pharmaceuticals, Inc. (a) | | | 24,043 | | | | 740,524 | |
Enzon Pharmaceuticals, Inc. | | | 493,108 | | | | 115,930 | |
Exact Sciences Corp. (a) | | | 55,641 | | | | 1,314,240 | |
Exelixis, Inc. (a) | | | 145,972 | | | | 3,163,213 | |
FibroGen, Inc. (a) | | | 70,184 | | | | 1,730,036 | |
Five Prime Therapeutics, Inc. (a) | | | 19,799 | | | | 715,734 | |
Genomic Health, Inc. (a) | | | 39,106 | | | | 1,231,448 | |
Halozyme Therapeutics, Inc. (a) | | | 139,822 | | | | 1,812,093 | |
Ignyta, Inc. (a) | | | 55,662 | | | | 478,693 | |
Immune Design Corp. (a) | | | 45,125 | | | | 306,850 | |
Insmed, Inc. (a) | | | 10,614 | | | | 185,851 | |
| | | | | | | | |
| Common Stocks | | Shares | | | Value | |
Biotechnology (continued) | | | | | | | | |
Insys Therapeutics, Inc. (a)(b) | | | 57,235 | | | $ | 601,540 | |
Intellia Therapeutics, Inc. (a) | | | 19,853 | | | | 279,729 | |
Ironwood Pharmaceuticals, Inc. (a) | | | 142,181 | | | | 2,425,608 | |
Kite Pharma, Inc. (a) | | | 23,162 | | | | 1,817,985 | |
Lexicon Pharmaceuticals, Inc. (a)(b) | | | 81,644 | | | | 1,170,775 | |
Ligand Pharmaceuticals, Inc., Class B (a) | | | 8,604 | | | | 910,647 | |
Merrimack Pharmaceuticals, Inc. (a) | | | 158,680 | | | | 488,734 | |
MiMedx Group, Inc. (a)(b) | | | 12,184 | | | | 116,114 | |
Myriad Genetics, Inc. (a) | | | 32,468 | | | | 623,386 | |
Natera, Inc. (a) | | | 24,274 | | | | 215,310 | |
NewLink Genetics Corp. (a) | | | 46,746 | | | | 1,126,579 | |
OncoGenex Pharmaceuticals, Inc. (a) | | | 38,554 | | | | 17,041 | |
Ophthotech Corp. (a) | | | 142,682 | | | | 522,216 | |
Peregrine Pharmaceuticals, Inc. (a) | | | 311,084 | | | | 203,449 | |
Pfenex, Inc. (a) | | | 73,215 | | | | 425,379 | |
Portola Pharmaceuticals, Inc. (a) | | | 18,070 | | | | 708,163 | |
Progenics Pharmaceuticals, Inc. (a) | | | 19,991 | | | | 188,715 | |
Prothena Corp. PLC (a) | | | 14,753 | | | | 823,070 | |
PTC Therapeutics, Inc. (a) | | | 43,618 | | | | 429,201 | |
Puma Biotechnology, Inc. (a) | | | 9,590 | | | | 356,748 | |
Radius Health, Inc. (a) | | | 8,150 | | | | 314,998 | |
Repligen Corp. (a) | | | 48,582 | | | | 1,710,086 | |
Retrophin, Inc. (a) | | | 40,967 | | | | 756,251 | |
Rigel Pharmaceuticals, Inc. (a) | | | 261,905 | | | | 866,906 | |
Sage Therapeutics, Inc. (a) | | | 14,241 | | | | 1,012,108 | |
Sangamo Biosciences, Inc. (a) | | | 147,659 | | | | 767,827 | |
Sarepta Therapeutics, Inc. (a) | | | 19,029 | | | | 563,258 | |
Seres Therapeutics, Inc. (a) | | | 13,467 | | | | 151,773 | |
Spark Therapeutics, Inc. (a) | | | 4,206 | | | | 224,348 | |
Spectrum Pharmaceuticals, Inc. (a) | | | 107,107 | | | | 696,196 | |
Synergy Pharmaceuticals, Inc. (a) | | | 20,069 | | | | 93,521 | |
TESARO, Inc. (a) | | | 18,423 | | | | 2,834,747 | |
Ultragenyx Pharmaceutical, Inc. (a) | | | 21,497 | | | | 1,457,067 | |
United Therapeutics Corp. (a) | | | 1,094 | | | | 148,106 | |
Vanda Pharmaceuticals, Inc. (a) | | | 71,700 | | | | 1,003,800 | |
Verastem, Inc. (a) | | | 72,122 | | | | 149,293 | |
vTv Therapeutics, Inc., Class A (a) | | | 38,077 | | | | 249,404 | |
Xencor, Inc. (a) | | | 58,568 | | | | 1,400,947 | |
ZIOPHARM Oncology, Inc. (a)(b) | | | 80,429 | | | | 509,920 | |
| | | | | | | | |
| | | | | | | | 55,166,523 | |
Building Products — 3.7% | | | | | | | | |
Apogee Enterprises, Inc. | | | 202,161 | | | | 12,050,817 | |
Continental Building Products, Inc. (a) | | | 113,755 | | | | 2,786,997 | |
Universal Forest Products, Inc. | | | 120,691 | | | | 11,892,891 | |
| | | | | | | | |
| | | | | | | | 26,730,705 | |
Capital Markets — 1.5% | | | | | | | | |
Evercore Partners, Inc., Class A | | | 109,818 | | | | 8,554,822 | |
Moelis & Co., Class A | | | 70,489 | | | | 2,713,827 | |
| | | | | | | | |
| | | | | | | | 11,268,649 | |
Chemicals — 2.9% | | | | | | | | |
Chemours Co. | | | 74,431 | | | | 2,865,593 | |
Chemtura Corp. (a) | | | 25,640 | | | | 856,376 | |
Innospec, Inc. | | | 4,847 | | | | 313,843 | |
OMNOVA Solutions, Inc. (a) | | | 95,032 | | | | 940,817 | |
PolyOne Corp. | | | 320,428 | | | | 10,923,391 | |
Sensient Technologies Corp. | | | 17,336 | | | | 1,374,051 | |
Stepan Co. | | | 18,470 | | | | 1,455,621 | |
Trinseo, SA | | | 32,454 | | | | 2,177,663 | |
| | | | | | | | |
| | | | | | | | 20,907,355 | |
Commercial Services & Supplies — 1.7% | | | | | | | | |
ACCO Brands Corp. (a) | | | 14,295 | | | | 187,979 | |
See Notes to Financial Statements.
| | | | | | |
| | | BLACKROCK FUNDS | | MARCH 31, 2017 | | 19 |
| | | | |
| Schedule of Investments (continued) | | | BlackRock Advantage Small Cap Growth Fund | |
| | | | |
| | | | | | | | |
| Common Stocks | | Shares | | | Value | |
Commercial Services & Supplies (continued) | | | | | | | | |
ARC Document Solutions, Inc. (a) | | | 415,601 | | | $ | 1,433,823 | |
Casella Waste Systems, Inc., Class A (a) | | | 30,374 | | | | 428,577 | |
InnerWorkings, Inc. (a) | | | 63,437 | | | | 631,832 | |
Kimball International, Inc., Class B | | | 31,308 | | | | 516,582 | |
Quad/Graphics, Inc. | | | 14,513 | | | | 366,308 | |
Steelcase, Inc., Class A | | | 16,814 | | | | 281,635 | |
Tetra Tech, Inc. | | | 203,952 | | | | 8,331,439 | |
| | | | | | | | |
| | | | | | | | 12,178,175 | |
Communications Equipment — 2.1% | | | | | | | | |
Black Box Corp. | | | 21,485 | | | | 192,291 | |
Calix, Inc. (a) | | | 111,464 | | | | 808,114 | |
Ciena Corp. (a) | | | 109,846 | | | | 2,593,464 | |
InterDigital, Inc. | | | 59,159 | | | | 5,105,422 | |
NETGEAR, Inc. (a) | | | 36,957 | | | | 1,831,219 | |
Ubiquiti Networks, Inc. (a) | | | 91,472 | | | | 4,597,383 | |
| | | | | | | | |
| | | | | | | | 15,127,893 | |
Construction & Engineering — 1.9% | | | | | | | | |
Comfort Systems USA, Inc. | | | 153,709 | | | | 5,633,435 | |
MasTec, Inc. (a) | | | 206,937 | | | | 8,287,827 | |
| | | | | | | | |
| | | | | | | | 13,921,262 | |
Construction Materials — 0.1% | | | | | | | | |
Summit Materials, Inc., Class A (a) | | | 41,729 | | | | 1,031,124 | |
Consumer Finance — 0.4% | | | | | | | | |
Consumer Portfolio Services, Inc. (a) | | | 186,779 | | | | 879,729 | |
Enova International, Inc. (a) | | | 144,146 | | | | 2,140,568 | |
| | | | | | | | |
| | | | | | | | 3,020,297 | |
Diversified Consumer Services — 0.5% | | | | | | | | |
Capella Education Co. | | | 17,117 | | | | 1,455,373 | |
Collectors Universe, Inc. | | | 67,405 | | | | 1,759,270 | |
K12, Inc. (a) | | | 34,934 | | | | 668,986 | |
| | | | | | | | |
| | | | | | | | 3,883,629 | |
Diversified Financial Services — 0.3% | | | | | | | | |
Houlihan Lokey, Inc. | | | 63,749 | | | | 2,196,153 | |
Diversified Telecommunication Services — 0.4% | | | | | | | | |
Cogent Communications Holdings, Inc. | | | 6,438 | | | | 277,156 | |
FairPoint Communications, Inc. (a) | | | 13,211 | | | | 219,303 | |
Windstream Holdings, Inc. | | | 457,675 | | | | 2,494,329 | |
| | | | | | | | |
| | | | | | | | 2,990,788 | |
Electric Utilities — 0.0% | | | | | | | | |
Ormat Technologies, Inc. | | | 4,762 | | | | 271,815 | |
Electrical Equipment — 0.1% | | | | | | | | |
LSI Industries, Inc. | | | 60,086 | | | | 606,268 | |
Electronic Equipment, Instruments & Components — 3.9% | | | | | |
Fabrinet (a) | | | 3,141 | | | | 132,016 | |
Kemet Corp. (a) | | | 149,051 | | | | 1,788,612 | |
PC Connection, Inc. | | | 19,113 | | | | 569,376 | |
PCM, Inc. (a) | | | 5,336 | | | | 149,675 | |
Sanmina Corp. (a) | | | 326,963 | | | | 13,274,698 | |
SYNNEX Corp. | | | 111,222 | | | | 12,450,191 | |
| | | | | | | | |
| | | | | | | | 28,364,568 | |
Energy Equipment & Services — 0.1% | | | | | | | | |
Aspen Aerogels, Inc. (a) | | | 349 | | | | 1,448 | |
McDermott International, Inc. (a) | | | 48,553 | | | | 327,733 | |
Pioneer Energy Services Corp. (a) | | | 70,469 | | | | 281,876 | |
Unit Corp. (a) | | | 16,528 | | | | 399,316 | |
| | | | | | | | |
| | | | | | | | 1,010,373 | |
| | | | | | | | |
| Common Stocks | | Shares | | | Value | |
Equity Real Estate Investment Trusts (REITs) — 4.6% | | | | | | | | |
American Assets Trust, Inc. | | | 16,255 | | | $ | 680,109 | |
Chatham Lodging Trust | | | 90,382 | | | | 1,785,044 | |
CoreSite Realty Corp. | | | 16,804 | | | | 1,513,200 | |
DCT Industrial Trust, Inc. | | | 21,663 | | | | 1,042,424 | |
First Industrial Realty Trust, Inc. | | | 75,985 | | | | 2,023,481 | |
Medical Properties Trust, Inc. | | | 7,811 | | | | 100,684 | |
National Storage Affiliates Trust | | | 107,090 | | | | 2,559,451 | |
PS Business Parks, Inc. | | | 122,661 | | | | 14,076,576 | |
QTS Realty Trust, Inc. | | | 37,530 | | | | 1,829,588 | |
Retail Opportunity Investments Corp. | | | 253,963 | | | | 5,340,842 | |
Ryman Hospitality Properties, Inc. | | | 15,559 | | | | 962,013 | |
Summit Hotel Properties, Inc. | | | 118,563 | | | | 1,894,637 | |
| | | | | | | | |
| | | | | | | | 33,808,049 | |
Food & Staples Retailing — 0.4% | | | | | | | | |
Performance Food Group Co. (a) | | | 68,366 | | | | 1,627,111 | |
SpartanNash Co. | | | 38,980 | | | | 1,363,910 | |
| | | | | | | | |
| | | | | | | | 2,991,021 | |
Food Products — 1.4% | | | | | | | | |
Dean Foods Co. | | | 260,614 | | | | 5,123,671 | |
Fresh Del Monte Produce, Inc. | | | 26,256 | | | | 1,555,143 | |
Sanderson Farms, Inc. | | | 36,255 | | | | 3,764,719 | |
| | | | | | | | |
| | | | | | | | 10,443,533 | |
Gas Utilities — 1.1% | | | | | | | | |
Southwest Gas Holdings, Inc. | | | 93,570 | | | | 7,757,889 | |
Health Care Equipment & Supplies — 6.2% | | | | | | | | |
AngioDynamics, Inc. (a) | | | 28,068 | | | | 486,980 | |
Cantel Medical Corp. | | | 189,503 | | | | 15,179,190 | |
Cardiovascular Systems, Inc. (a) | | | 67,447 | | | | 1,907,064 | |
Cutera, Inc. (a) | | | 40,126 | | | | 830,608 | |
Glaukos Corp. (a) | | | 32,674 | | | | 1,676,176 | |
Inogen, Inc. (a) | | | 37,612 | | | | 2,917,187 | |
Insulet Corp. (a) | | | 14,897 | | | | 641,912 | |
LeMaitre Vascular, Inc. | | | 68,308 | | | | 1,682,426 | |
Masimo Corp. (a) | | | 126,547 | | | | 11,801,773 | |
Nanostring Technologies, Inc. (a) | | | 46,171 | | | | 917,418 | |
Neogen Corp. (a) | | | 18,556 | | | | 1,216,346 | |
NxStage Medical, Inc. (a) | | | 137,888 | | | | 3,699,535 | |
RTI Surgical, Inc. (a) | | | 403,322 | | | | 1,613,288 | |
SeaSpine Holdings Corp. (a) | | | 89,391 | | | | 701,719 | |
Zeltiq Aesthetics, Inc. (a) | | | 3,432 | | | | 190,854 | |
| | | | | | | | |
| | | | | | | | 45,462,476 | |
Health Care Providers & Services — 1.5% | | | | | | | | |
CorVel Corp. (a) | | | 4,339 | | | | 188,746 | |
Cross Country Healthcare, Inc. (a) | | | 42,747 | | | | 613,847 | |
Five Star Quality Care, Inc. (a) | | | 158,552 | | | | 340,887 | |
HealthSouth Corp. | | | 31,911 | | | | 1,366,110 | |
LHC Group, Inc. (a) | | | 11,419 | | | | 615,484 | |
Magellan Health Services, Inc. (a) | | | 14,391 | | | | 993,699 | |
Medpace Holdings, Inc. (a) | | | 24,980 | | | | 745,653 | |
National Research Corp., Class A | | | 16,376 | | | | 322,607 | |
UnitedHealth Group, Inc. | | | 10,086 | | | | 1,654,162 | |
WellCare Health Plans, Inc. (a) | | | 30,511 | | | | 4,277,947 | |
| | | | | | | | |
| | | | | | | | 11,119,142 | |
Health Care Technology — 0.9% | | | | | | | | |
Cotiviti Holdings, Inc. (a) | | | 2,103 | | | | 87,548 | |
Medidata Solutions, Inc. (a) | | | 58,623 | | | | 3,381,961 | |
Vocera Communications, Inc. (a) | | | 126,912 | | | | 3,151,225 | |
| | | | | | | | |
| | | | | | | | 6,620,734 | |
See Notes to Financial Statements.
| | | | | | |
| 20 | | BLACKROCK FUNDS | | MARCH 31, 2017 | | |
| | | | |
| Schedule of Investments (continued) | | | BlackRock Advantage Small Cap Growth Fund | |
| | | | |
| | | | | | | | |
| Common Stocks | | Shares | | | Value | |
Hotels, Restaurants & Leisure — 4.0% | | | | | | | | |
Bloomin’ Brands, Inc. | | | 41,457 | | | $ | 817,947 | |
Bravo Brio Restaurant Group, Inc. (a) | | | 47,330 | | | | 241,383 | |
Caesars Entertainment Corp. (a) | | | 60,869 | | | | 581,299 | |
Carrols Restaurant Group, Inc. (a) | | | 223,721 | | | | 3,165,652 | |
Cheesecake Factory, Inc. | | | 125,792 | | | | 7,970,181 | |
Isle of Capri Casinos, Inc. (a) | | | 19,704 | | | | 519,397 | |
J Alexander’s Holdings, Inc. (a) | | | 110,627 | | | | 1,111,801 | |
Papa John’s International, Inc. | | | 62,459 | | | | 4,999,218 | |
Ruth’s Hospitality Group, Inc. | | | 42,953 | | | | 861,208 | |
Vail Resorts, Inc. | | | 46,444 | | | | 8,912,604 | |
| | | | | | | | |
| | | | | | | | 29,180,690 | |
Household Durables — 1.2% | | | | | | | | |
Century Communities, Inc. (a) | | | 48,081 | | | | 1,221,257 | |
iRobot Corp. (a) | | | 8,546 | | | | 565,232 | |
La-Z-Boy, Inc. | | | 52,888 | | | | 1,427,976 | |
Taylor Morrison Home Corp., Class A (a) | | | 89,381 | | | | 1,905,603 | |
TopBuild Corp. (a) | | | 54,010 | | | | 2,538,470 | |
ZAGG, Inc. (a) | | | 151,359 | | | | 1,089,785 | |
| | | | | | | | |
| | | | | | | | 8,748,323 | |
Household Products — 0.3% | | | | | | | | |
Central Garden & Pet Co. (a) | | | 25,422 | | | | 942,394 | |
Central Garden & Pet Co., Class A (a) | | | 39,797 | | | | 1,381,752 | |
| | | | | | | | |
| | | | | | | | 2,324,146 | |
Industrial Conglomerates — 0.0% | | | | | | | | |
Raven Industries, Inc. | | | 5,193 | | | | 150,857 | |
Insurance — 0.4% | | | | | | | | |
Argo Group International Holdings, Ltd. | | | 35,574 | | | | 2,411,917 | |
James River Group Holdings, Ltd. | | | 10,084 | | | | 432,200 | |
| | | | | | | | |
| | | | | | | | 2,844,117 | |
Internet & Direct Marketing Retail — 0.1% | | | | | | | | |
Overstock.com, Inc. (a) | | | 40,831 | | | | 702,293 | |
Internet Software & Services — 3.2% | | | | | | | | |
Alteryx, Inc. (a)(b) | | | 30,685 | | | | 479,607 | |
Bankrate, Inc. (a) | | | 104,988 | | | | 1,013,134 | |
Box, Inc., Class A (a) | | | 106,867 | | | | 1,743,001 | |
Brightcove, Inc. (a) | | | 10,618 | | | | 94,500 | |
Carbonite, Inc. (a) | | | 60,061 | | | | 1,219,238 | |
Cornerstone OnDemand, Inc. (a) | | | 94,720 | | | | 3,683,661 | |
Five9, Inc. (a) | | | 36,954 | | | | 608,263 | |
j2 Global, Inc. | | | 8,268 | | | | 693,768 | |
Limelight Networks, Inc. (a) | | | 473,316 | | | | 1,221,155 | |
LogMeIn, Inc. | | | 27,914 | | | | 2,721,615 | |
MuleSoft, Inc. (a) | | | 14,426 | | | | 350,985 | |
QuinStreet, Inc. (a) | | | 883,139 | | | | 3,444,242 | |
Shutterstock, Inc. (a) | | | 6,079 | | | | 251,367 | |
Web.com Group, Inc. (a) | | | 93,584 | | | | 1,806,171 | |
Wix.com Ltd. (a) | | | 63,452 | | | | 4,308,391 | |
| | | | | | | | |
| | | | | | | | 23,639,098 | |
IT Services — 2.9% | | | | | | | | |
Acxiom Corp. (a) | | | 35,292 | | | | 1,004,763 | |
Convergys Corp. | | | 242,183 | | | | 5,122,170 | |
CSG Systems International, Inc. | | | 217,275 | | | | 8,215,168 | |
Everi Holdings, Inc. (a) | | | 150,575 | | | | 721,254 | |
Hackett Group, Inc. | | | 184,367 | | | | 3,593,313 | |
Unisys Corp. (a) | | | 199,560 | | | | 2,783,862 | |
| | | | | | | | |
| | | | | | | | 21,440,530 | |
Leisure Products — 0.5% | | | | | | | | |
Brunswick Corp. | | | 56,047 | | | | 3,430,076 | |
MCBC Holdings, Inc. | | | 9,806 | | | | 158,563 | |
| | | | | | | | |
| | | | | | | | 3,588,639 | |
| | | | | | | | |
| Common Stocks | | Shares | | | Value | |
Life Sciences Tools & Services — 1.2% | | | | | | | | |
Cambrex Corp. (a) | | | 38,712 | | | $ | 2,131,096 | |
Enzo Biochem, Inc. (a) | | | 110,892 | | | | 928,166 | |
Harvard Bioscience, Inc. (a) | | | 214,387 | | | | 557,406 | |
INC Research Holdings, Inc., Class A (a) | | | 18,255 | | | | 836,992 | |
PAREXEL International Corp. (a) | | | 30,784 | | | | 1,942,778 | |
PRA Health Sciences, Inc. (a) | | | 30,942 | | | | 2,018,347 | |
| | | | | | | | |
| | | | | | | | 8,414,785 | |
Machinery — 1.9% | | | | | | | | |
Briggs & Stratton Corp. | | | 47,722 | | | | 1,071,359 | |
Commercial Vehicle Group, Inc. | | | 84,577 | | | | 572,586 | |
John Bean Technologies Corp. | | | 10,759 | | | | 946,254 | |
Luxfer Holdings PLC — ADR | | | 53,066 | | | | 645,283 | |
Mueller Water Products, Inc., Class A | | | 549,207 | | | | 6,491,627 | |
Supreme Industries, Inc., Class A | | | 37,171 | | | | 753,084 | |
Watts Water Technologies, Inc., Class A | | | 32,414 | | | | 2,021,013 | |
Woodward, Inc. | | | 20,953 | | | | 1,423,128 | |
| | | | | | | | |
| | | | | | | | 13,924,334 | |
Media — 0.6% | | | | | | | | |
Entercom Communications Corp., Class A (b) | | | 54,557 | | | | 780,165 | |
Harte-Hanks, Inc. (a) | | | 229,292 | | | | 321,009 | |
Meredith Corp. | | | 1,155 | | | | 74,613 | |
MSG Networks, Inc., Class A (a) | | | 22,489 | | | | 525,118 | |
New Media Investment Group, Inc. | | | 5,877 | | | | 83,512 | |
Nexstar Broadcasting Group, Inc. | | | 1,041 | | | | 73,026 | |
Sinclair Broadcast Group, Inc., Class A | | | 56,551 | | | | 2,290,316 | |
| | | | | | | | |
| | | | | | | | 4,147,759 | |
Metals & Mining — 1.3% | | | | | | | | |
Fairmount Santrol Holdings, Inc. (a) | | | 27,227 | | | | 199,574 | |
Ryerson Holding Corp. (a) | | | 14,404 | | | | 181,490 | |
Schnitzer Steel Industries, Inc. — Class A | | | 19,144 | | | | 395,324 | |
Worthington Industries, Inc. | | | 187,317 | | | | 8,446,123 | |
| | | | | | | | |
| | | | | | | | 9,222,511 | |
Multiline Retail — 1.2% | | | | | | | | |
Big Lots, Inc. | | | 182,789 | | | | 8,898,169 | |
Multi-Utilities — 0.0% | | | | | | | | |
NorthWestern Corp. | | | 3,822 | | | | 224,351 | |
Oil, Gas & Consumable Fuels — 0.8% | | | | | | | | |
Bill Barrett Corp. (a) | | | 109,528 | | | | 498,352 | |
Carrizo Oil & Gas, Inc. (a) | | | 62,082 | | | | 1,779,270 | |
Eclipse Resources Corp. (a) | | | 62,169 | | | | 157,909 | |
EP Energy Corp., Class A (a)(b) | | | 118,505 | | | | 562,899 | |
Evolution Petroleum Corp. | | | 107,337 | | | | 858,696 | |
Matador Resources Co. (a) | | | 74,178 | | | | 1,764,695 | |
Northern Oil and Gas, Inc. (a) | | | 19,650 | | | | 51,090 | |
Sanchez Energy Corp. (a) | | | 15,321 | | | | 146,162 | |
| | | | | | | | |
| | | | | | | | 5,819,073 | |
Paper & Forest Products — 0.2% | | | | | | | | |
Louisiana-Pacific Corp. (a) | | | 56,275 | | | | 1,396,746 | |
Verso Corp., Class A (a) | | | 3,719 | | | | 22,314 | |
| | | | | | | | |
| | | | | | | | 1,419,060 | |
Personal Products — 0.0% | | | | | | | | |
Medifast, Inc. | | | 1,529 | | | | 67,842 | |
Natural Health Trends Corp. | | | 5,844 | | | | 168,892 | |
| | | | | | | | |
| | | | | | | | 236,734 | |
Pharmaceuticals — 3.7% | | | | | | | | |
Catalent, Inc. (a) | | | 19,397 | | | | 549,323 | |
Corcept Therapeutics, Inc. (a) | | | 264,318 | | | | 2,896,925 | |
Heska Corp. (a) | | | 11,833 | | | | 1,242,228 | |
See Notes to Financial Statements.
| | | | | | |
| | | BLACKROCK FUNDS | | MARCH 31, 2017 | | 21 |
| | | | |
| Schedule of Investments (continued) | | | BlackRock Advantage Small Cap Growth Fund | |
| | | | |
| | | | | | | | |
| Common Stocks | | Shares | | | Value | |
Pharmaceuticals (continued) | | | | | | | | |
Horizon Pharma PLC (a) | | | 82,709 | | | $ | 1,222,439 | |
Innoviva, Inc. (a) | | | 41,334 | | | | 571,649 | |
Juniper Pharmaceuticals, Inc. (a) | | | 77,998 | | | | 370,491 | |
Prestige Brands Holdings, Inc. (a) | | | 268,113 | | | | 14,896,358 | |
Ra Pharmaceuticals, Inc. (a) | | | 20,773 | | | | 442,257 | |
Sciclone Pharmaceuticals, Inc. (a) | | | 262,048 | | | | 2,568,070 | |
Supernus Pharmaceuticals, Inc. (a) | | | 74,565 | | | | 2,333,884 | |
| | | | | | | | |
| | | | | | | | 27,093,624 | |
Professional Services — 2.5% | | | | | | | | |
Insperity, Inc. | | | 157,526 | | | | 13,964,680 | |
Kforce, Inc. | | | 70,210 | | | | 1,667,488 | |
RPX Corp. (a) | | | 201,061 | | | | 2,412,732 | |
| | | | | | | | |
| | | | | | | | 18,044,900 | |
Real Estate Investment Trusts (REITs) — 0.7% | | | | | | | | |
Ashford Hospitality Prime, Inc. | | | 10,602 | | | | 112,487 | |
Ramco-Gershenson Properties Trust | | | 369,761 | | | | 5,184,049 | |
| | | | | | | | |
| | | | | | | | 5,296,536 | |
Real Estate Management & Development — 0.2% | | | | | | | | |
AV Homes, Inc. (a) | | | 13,371 | | | | 219,953 | |
RE/MAX Holdings, Inc., Class A | | | 11,042 | | | | 656,447 | |
RMR Group, Inc., Class A | | | 8,905 | | | | 440,798 | |
| | | | | | | | |
| | | | | | | | 1,317,198 | |
Road & Rail — 0.2% | | | | | | | | |
ArcBest Corp. | | | 8,768 | | | | 227,968 | |
YRC Worldwide, Inc. (a) | | | 78,350 | | | | 862,633 | |
| | | | | | | | |
| | | | | | | | 1,090,601 | |
Semiconductors & Semiconductor Equipment — 6.3% | | | | | | | | |
Advanced Energy Industries, Inc. (a) | | | 65,395 | | | | 4,483,481 | |
Advanced Micro Devices, Inc. (a) | | | 247,110 | | | | 3,595,450 | |
Alpha & Omega Semiconductor, Ltd. (a) | | | 97,052 | | | | 1,668,324 | |
Amkor Technology, Inc. (a) | | | 147,544 | | | | 1,710,035 | |
Brooks Automation, Inc. | | | 32,965 | | | | 738,416 | |
Cirrus Logic, Inc. (a) | | | 90,055 | | | | 5,465,438 | |
Entegris, Inc. (a) | | | 131,518 | | | | 3,077,521 | |
Microsemi Corp. (a) | | | 81,974 | | | | 4,224,120 | |
Monolithic Power Systems, Inc. | | | 72,360 | | | | 6,664,356 | |
Power Integrations, Inc. | | | 20,481 | | | | 1,346,626 | |
Rudolph Technologies, Inc. (a) | | | 15 | | | | 336 | |
Semtech Corp. (a) | | | 151,492 | | | | 5,120,430 | |
Synaptics, Inc. (a) | | | 81,460 | | | | 4,033,085 | |
Ultra Clean Holdings, Inc. (a) | | | 233,877 | | | | 3,945,505 | |
| | | | | | | | |
| | | | | | | | 46,073,123 | |
Software — 6.8% | | | | | | | | |
A10 Networks, Inc. (a) | | | 493,313 | | | | 4,513,814 | |
Aspen Technology, Inc. (a) | | | 115,783 | | | | 6,821,934 | |
Barracuda Networks, Inc. (a) | | | 44,403 | | | | 1,026,153 | |
CommVault Systems, Inc. (a) | | | 23,977 | | | | 1,218,032 | |
Exa Corp. (a) | | | 37,460 | | | | 475,742 | |
HubSpot, Inc. (a) | | | 19,746 | | | | 1,195,620 | |
Imperva, Inc. (a) | | | 28,518 | | | | 1,170,664 | |
MicroStrategy, Inc., Class A (a) | | | 47,894 | | | | 8,994,493 | |
Mitek Systems, Inc. (a) | | | 63,529 | | | | 422,468 | |
Paylocity Holding Corp. (a) | | | 25,190 | | | | 973,090 | |
Proofpoint, Inc. (a) | | | 128,573 | | | | 9,560,688 | |
RingCentral, Inc., Class A (a) | | | 88,865 | | | | 2,514,880 | |
Silver Spring Networks, Inc. (a) | | | 18,083 | | | | 204,157 | |
Take-Two Interactive Software, Inc. (a) | | | 137,499 | | | | 8,149,566 | |
Varonis Systems, Inc. (a) | | | 54,281 | | | | 1,726,136 | |
Zix Corp. (a) | | | 188,892 | | | | 908,571 | |
| | | | | | | | |
| | | | | | | | 49,876,008 | |
| | | | | | | | |
| Common Stocks | | Shares | | | Value | |
Specialty Retail — 2.5% | | | | | | | | |
Aaron’s, Inc. | | | 26,156 | | | $ | 777,879 | |
Asbury Automotive Group, Inc. (a) | | | 15,796 | | | | 949,340 | |
Big 5 Sporting Goods Corp. | | | 319,129 | | | | 4,818,848 | |
Burlington Stores, Inc. (a) | | | 27,497 | | | | 2,675,183 | |
Children’s Place, Inc. | | | 67,753 | | | | 8,133,748 | |
Haverty Furniture Cos., Inc. | | | 40,190 | | | | 978,626 | |
Sears Hometown and Outlet Stores, Inc. (a) | | | 55,996 | | | | 218,384 | |
| | | | | | | | |
| | | | | | | | 18,552,008 | |
Steel Pipe & Tubes — 0.2% | | | | | | | | |
Atkore International Group, Inc. (a) | | | 51,931 | | | | 1,364,747 | |
Technology Hardware, Storage & Peripherals — 0.1% | | | | | | | | |
Super Micro Computer, Inc. (a) | | | 17,327 | | | | 439,239 | |
Textiles, Apparel & Luxury Goods — 0.6% | | | | | | | | |
Culp, Inc. | | | 123,937 | | | | 3,866,834 | |
Perry Ellis International, Inc. (a) | | | 8,999 | | | | 193,298 | |
| | | | | | | | |
| | | | | | | | 4,060,132 | |
Thrifts & Mortgage Finance — 1.2% | | | | | | | | |
Essent Group, Ltd. (a) | | | 107,394 | | | | 3,884,441 | |
First Defiance Financial Corp. | | | 19,458 | | | | 963,366 | |
Walker & Dunlop, Inc. (a) | | | 96,901 | | | | 4,039,803 | |
| | | | | | | | |
| | | | | | | | 8,887,610 | |
Trading Companies & Distributors — 2.2% | | | | | | | | |
Applied Industrial Technologies, Inc. | | | 147,291 | | | | 9,109,948 | |
GMS, Inc. (a) | | | 79,838 | | | | 2,797,524 | |
MRC Global, Inc. (a) | | | 179,643 | | | | 3,292,856 | |
Neff Corp., Class A (a) | | | 28,183 | | | | 548,159 | |
| | | | | | | | |
| | | | | | | | 15,748,487 | |
Water Utilities — 0.0% | | | | | | | | |
SJW Group | | | 3,848 | | | | 185,551 | |
Total Common Stocks — 98.4% | | | | | | | 719,734,170 | |
| | | | | | | | |
| Preferred Stocks | | | | | | |
Household Durables — 0.0% | | | | | | | | |
AliphCom, Series 6 (Acquired 6/03/14,
cost $749,991) (a)(c) | | | 6,198 | | | | — | |
AliphCom, Series 8 (Acquired 8/31/15,
cost $130,001) (a)(c) | | | 142,746 | | | | 1 | |
| | | | | | | | |
| | | | | | | | 1 | |
Software — 0.7% | | | | | | | | |
Illumio Inc., Series C (Acquired 3/10/15,
cost $750,000) (a)(c) | | | 233,365 | | | | 749,102 | |
MongoDB Series C (Acquired 12/19/13,
cost $1,517,990) (a)(c) | | | 60,511 | | | | 1,374,205 | |
MongoDB Series D (Acquired 12/19/13,
cost $472,222) (a)(c) | | | 18,824 | | | | 427,493 | |
MongoDB Series E (Acquired 12/19/13,
cost $16,682) (a)(c) | | | 665 | | | | 15,102 | |
Palantir Technologies, Inc., Series I (Acquired 2/06/14,
cost $1,999,998) (a)(c) | | | 326,264 | | | | 2,590,536 | |
| | | | | | | | |
| | | | | | | | 5,156,438 | |
Total Preferred Stocks — 0.7% | | | | | | | 5,156,439 | |
| | | | | | | | |
| | | | | | | |
See Notes to Financial Statements.
| | | | | | |
| 22 | | BLACKROCK FUNDS | | MARCH 31, 2017 | | |
| | | | |
| Schedule of Investments (continued) | | | BlackRock Advantage Small Cap Growth Fund | |
| | | | |
| | | | | | | | |
| Rights | | Shares | | | Value | |
Biotechnology — 0.0% | | | | | | | | |
Dyax Corp. — CVR(a) | | | 149,927 | | | $ | $343,333 | |
Pharmaceuticals — 0.0% | | | | | | | | |
Durata Therapeutics, Inc. — CVR(a) | | | 7,330 | | | | — | |
Total Rights — 0.0% | | | | | | | 343,333 | |
Total Long-Term Investments (Cost — $632,696,333) — 99.1% | | | | | | | 725,233,942 | |
| | | | | | | | |
| Short-Term Securities | | | | | | |
BlackRock Liquidity Funds, T-Fund, Institutional
Class, 0.60% (d)(e) | | | 4,244,491 | | | | 4,244,491 | |
SL Liquidity Series, LLC, Money Market Series,
0.95% (e)(f) | | | 3,155,122 | | | | 3,155,437 | |
Total Short-Term Securities (Cost — $7,399,776) — 1.0% | | | | | | | 7,399,928 | |
Total Investments (Cost — $640,096,109) — 100.1% | | | | 732,633,870 | |
Liabilities in Excess of Other Assets — (0.1)% | | | | (836,676 | ) |
| | | | | | | | |
Net Assets — 100.0% | | | | | | $ | 731,797,194 | |
| | | | | | | | |
|
| Notes to Schedule of Investments |
| (a) | Non-income producing security. |
| (b) | Security, or a portion of the security, is on loan. |
| (c) | Restricted security as to resale, excluding 144A securities. The Fund held restricted securities with a current value of $5,156,439, representing 0.7% of its net assets as of period end, and an original cost of $5,636,885. |
| (d) | During the six months ended March 31, 2017, investments in issuers considered to be affiliates of the Fund for purposes of Section 2(a)(3) of the Investment Company Act of 1940, as amended, were as follows: |
| | | | | | | | | | | | | | | | | | | | | | | | | | | | |
| Affiliate | | Shares Held at
September 30,
2016 | | | Net Activity | | | Shares Held at
March 31,
2017 | | | Value at
March 31,
2017 | | | Income | | | Net
Realized
Gain1 | | | Change in
Unrealized
Appreciation
(Depreciation) | |
BlackRock Liquidity Funds, T-Fund, Institutional Class | | | 6,602,499 | | | | (2,358,008 | ) | | | 4,244,491 | | | $ | 4,244,491 | | | $ | 11,480 | | | | $ 40 | | | | $ — | |
SL Liquidity Series, LLC, Money Market Series | | | 6,420,757 | | | | (3,265,635 | ) | | | 3,155,122 | | | | 3,155,437 | | | | 281,926 | 2 | | | 573 | | | | 152 | |
Total | | | | | | | | | | | | | | $ | 7,399,928 | | | $ | 293,406 | | | | $613 | | | | $152 | |
| | | | | | | | | | | | | | | | |
| | 1 | | Includes net capital gain distributions. |
| | 2 | | Represents securities lending income earned from the reinvestment of cash collateral from loaned securities, net of fees and collateral investment expenses, and other payments to and from borrowers of securities. |
| (e) | Current yield as of period end. |
| (f) | Security was purchased with the cash collateral from loaned securities. |
| • | | For Fund compliance purposes, the Fund’s industry classifications refer to one or more of the industry sub-classifications used by one or more widely recognized market indexes or rating group indexes, and/or as defined by the investment adviser. These definitions may not apply for purposes of this report, which may combine such industry sub-classifications for reporting ease. |
|
| Derivative Financial Instruments Outstanding as of Period End |
| | | | | | | | | | | | |
Futures Contracts | | | | | | | | | | |
Contracts Long | | Issue | | Expiration | | Notional
Value | | | Unrealized
Appreciation | |
85 | | Russell 2000 Mini Index | | June 2017 | | | $5,883,700 | | | | $42,563 | |
See Notes to Financial Statements.
| | | | | | |
| | | BLACKROCK FUNDS | | MARCH 31, 2017 | | 23 |
| | | | |
| Schedule of Investments (continued) | | | BlackRock Advantage Small Cap Growth Fund | |
|
| Derivative Financial Instruments Categorized by Risk Exposure |
As of period end, the fair values of derivative financial instruments located in the Statements of Assets and Liabilities was as follows:
| | | | | | | | | | | | | | | | | | | | | | | | | | | | | | |
| | | | | Commodity
Contracts | | | Credit
Contracts | | | Equity
Contracts | | | Foreign Currency
Exchange
Contracts | | | Interest
Rate
Contracts | | | Other
Contracts | | | Total | |
Assets — Derivative Financial Instruments | | | | | | | | | | | | | | | | | | | | | | | | | | | | |
Futures contracts | | Net unrealized appreciation1 | | | — | | | | — | | | | $42,563 | | | | — | | | | — | | | | — | | | $ | 42,563 | |
| | 1 | | Includes cumulative appreciation (depreciation) on futures contracts, if any, as reported in the Schedule of Investments. Only current day’s variation margin is reported within the Statements of Assets and Liabilities. |
For the six months ended March 31, 2017, the effect of derivative financial instruments in the Statements of Operations was as follows:
| | | | | | | | | | | | | | | | | | | | | | | | | | | | |
| | | Commodity
Contracts | | | Credit
Contracts | | | Equity
Contracts | | | Foreign
Currency
Exchange
Contracts | | | Interest Rate
Contracts | | | Other
Contracts | | | Total | |
Net Realized Gain from: | | | | | | | | | | | | | | | | | | | | | | | | | | | | |
Futures contracts | | | — | | | | — | | | $ | 1,232,916 | | | | — | | | | — | | | | — | | | $ | 1,232,916 | |
| | | | | | | | | | | | | | | | | | | | | | | | | | | | |
Net Change in Unrealized Appreciation (Depreciation) on: | | | | | | | | | | | | | | | | | | | | | | | | | | | | |
Futures contracts | | | — | | | | — | | | $ | (72,335 | ) | | | — | | | | — | | | | — | | | $ | (72,335 | ) |
| | |
| Average Quarterly Balances of Outstanding Derivative Financial Instruments | | |
| | | | |
Futures contracts: | | | | |
Average notional value of contracts — long | | $ | 6,673,325 | |
For more information about the Fund’s investment risks regarding derivative financial instruments, refer to the Notes to Financial Statements.
|
| Derivative Financial Instruments — Offsetting as of Period End |
The Fund’s derivative assets and liabilities (by type) were as follows:
| | | | | | | | |
| | | Assets | | | Liabilities | |
Derivative Financial Instruments: | | | | | | | | |
Futures contracts | | $ | 10,188 | | | | — | |
Derivatives not subject to a Master Netting Agreement or similar agreement (“MNA”) | | | (10,188 | ) | | | — | |
Total derivative assets and liabilities subject to an MNA | | | — | | | | — | |
See Notes to Financial Statements.
| | | | | | |
| 24 | | BLACKROCK FUNDS | | MARCH 31, 2017 | | |
| | | | |
| Schedule of Investments (continued) | | | BlackRock Advantage Small Cap Growth Fund | |
|
| Fair Value Hierarchy as of Period End |
Various inputs are used in determining the fair value of investments and derivative financial instruments. For information about the Fund’s policy regarding valuation of investments and derivative financial instruments, refer to the Notes to Financial Statements.
The following tables summarize the Fund’s investments and derivative financial instruments categorized in the disclosure hierarchy:
| | | | | | | | | | | | | | | | |
| | | Level 1 | | | Level 2 | | | Level 3 | | | Total | |
Assets: | | | | | | | | | | | | | | | | |
Investments: | | | | | | | | | | | | | | | | |
Long-Term Investments: | | | | | | | | | | | | | | | | |
Common Stocks: | | | | | | | | | | | | | | | | |
Aerospace & Defense | | $ | 6,108,473 | | | | — | | | | — | | | $ | 6,108,473 | |
Air Freight & Logistics | | | 7,023,893 | | | | — | | | | — | | | | 7,023,893 | |
Airlines | | | 5,918,055 | | | | — | | | | — | | | | 5,918,055 | |
Auto Components | | | 19,099,352 | | | | — | | | | — | | | | 19,099,352 | |
Banks | | | 18,694,686 | | | | — | | | | — | | | | 18,694,686 | |
Beverages | | | 3,056,057 | | | | — | | | | — | | | | 3,056,057 | |
Biotechnology | | | 55,166,523 | | | | — | | | | — | | | | 55,166,523 | |
Building Products | | | 26,730,705 | | | | — | | | | — | | | | 26,730,705 | |
Capital Markets | | | 11,268,649 | | | | — | | | | — | | | | 11,268,649 | |
Chemicals | | | 20,907,355 | | | | — | | | | — | | | | 20,907,355 | |
Commercial Services & Supplies | | | 12,178,175 | | | | — | | | | — | | | | 12,178,175 | |
Communications Equipment | | | 15,127,893 | | | | — | | | | — | | | | 15,127,893 | |
Construction & Engineering | | | 13,921,262 | | | | — | | | | — | | | | 13,921,262 | |
Construction Materials | | | 1,031,124 | | | | — | | | | — | | | | 1,031,124 | |
Consumer Finance | | | 3,020,297 | | | | — | | | | — | | | | 3,020,297 | |
Diversified Consumer Services | | | 3,883,629 | | | | — | | | | — | | | | 3,883,629 | |
Diversified Financial Services | | | 2,196,153 | | | | — | | | | — | | | | 2,196,153 | |
Diversified Telecommunication Services | | | 2,990,788 | | | | — | | | | — | | | | 2,990,788 | |
Electric Utilities | | | 271,815 | | | | — | | | | — | | | | 271,815 | |
Electrical Equipment | | | 606,268 | | | | — | | | | — | | | | 606,268 | |
Electronic Equipment, Instruments & Components | | | 28,364,568 | | | | — | | | | — | | | | 28,364,568 | |
Energy Equipment & Services | | | 1,010,373 | | | | — | | | | — | | | | 1,010,373 | |
Equity Real Estate Investment Trusts (REITs) | | | 33,808,049 | | | | — | | | | — | | | | 33,808,049 | |
Food & Staples Retailing | | | 2,991,021 | | | | — | | | | — | | | | 2,991,021 | |
Food Products | | | 10,443,533 | | | | — | | | | — | | | | 10,443,533 | |
Gas Utilities | | | 7,757,889 | | | | — | | | | — | | | | 7,757,889 | |
Health Care Equipment & Supplies | | | 45,462,476 | | | | — | | | | — | | | | 45,462,476 | |
Health Care Providers & Services | | | 11,119,142 | | | | — | | | | — | | | | 11,119,142 | |
Health Care Technology | | | 6,620,734 | | | | — | | | | — | | | | 6,620,734 | |
Hotels, Restaurants & Leisure | | | 29,180,690 | | | | — | | | | — | | | | 29,180,690 | |
Household Durables | | | 8,748,323 | | | | — | | | | — | | | | 8,748,323 | |
Household Products | | | 2,324,146 | | | | — | | | | — | | | | 2,324,146 | |
Industrial Conglomerates | | | 150,857 | | | | — | | | | — | | | | 150,857 | |
Insurance | | | 2,844,117 | | | | — | | | | — | | | | 2,844,117 | |
Internet & Direct Marketing Retail | | | 702,293 | | | | — | | | | — | | | | 702,293 | |
Internet Software & Services | | | 23,639,098 | | | | — | | | | — | | | | 23,639,098 | |
IT Services | | | 21,440,530 | | | | — | | | | — | | | | 21,440,530 | |
Leisure Products | | | 3,588,639 | | | | — | | | | — | | | | 3,588,639 | |
Life Sciences Tools & Services | | | 8,414,785 | | | | — | | | | — | | | | 8,414,785 | |
Machinery | | | 13,924,334 | | | | — | | | | — | | | | 13,924,334 | |
Media | | | 4,147,759 | | | | — | | | | — | | | | 4,147,759 | |
Metals & Mining | | | 9,222,511 | | | | — | | | | — | | | | 9,222,511 | |
Multiline Retail | | | 8,898,169 | | | | — | | | | — | | | | 8,898,169 | |
Multi-Utilities | | | 224,351 | | | | — | | | | — | | | | 224,351 | |
Oil, Gas & Consumable Fuels | | | 5,819,073 | | | | — | | | | — | | | | 5,819,073 | |
Paper & Forest Products | | | 1,419,060 | | | | — | | | | — | | | | 1,419,060 | |
Personal Products | | | 236,734 | | | | — | | | | — | | | | 236,734 | |
Pharmaceuticals | | | 27,093,624 | | | | — | | | | — | | | | 27,093,624 | |
Professional Services | | | 18,044,900 | | | | — | | | | — | | | | 18,044,900 | |
Real Estate Investment Trusts (REITs) | | | 5,296,536 | | | | — | | | | — | | | | 5,296,536 | |
Real Estate Management & Development | | | 1,317,198 | | | | — | | | | — | | | | 1,317,198 | |
See Notes to Financial Statements.
| | | | | | |
| | | BLACKROCK FUNDS | | MARCH 31, 2017 | | 25 |
| | | | |
| Schedule of Investments (concluded) | | | BlackRock Advantage Small Cap Growth Fund | |
| | | | | | | | | | | | | | | | |
| | | Level 1 | | | Level 2 | | | Level 3 | | | Total | |
Road & Rail | | $ | 1,090,601 | | | | — | | | | — | | | $ | 1,090,601 | |
Semiconductors & Semiconductor Equipment | | | 46,073,123 | | | | — | | | | — | | | | 46,073,123 | |
Software | | | 49,876,008 | | | | — | | | | — | | | | 49,876,008 | |
Specialty Retail | | | 18,552,008 | | | | — | | | | — | | | | 18,552,008 | |
Steel Pipe & Tubes | | | 1,364,747 | | | | — | | | | — | | | | 1,364,747 | |
Technology Hardware, Storage & Peripherals | | | 439,239 | | | | — | | | | — | | | | 439,239 | |
Textiles, Apparel & Luxury Goods | | | 4,060,132 | | | | — | | | | — | | | | 4,060,132 | |
Thrifts & Mortgage Finance | | | 8,887,610 | | | | — | | | | — | | | | 8,887,610 | |
Trading Companies & Distributors | | | 15,748,487 | | | | — | | | | — | | | | 15,748,487 | |
Water Utilities | | | 185,551 | | | | — | | | | — | | | | 185,551 | |
Preferred Stocks: | | | | | | | | | | | | | | | | |
Household Durables | | | — | | | | — | | | $ | 1 | | | | 1 | |
Software | | | — | | | | — | | | | 5,156,438 | | | | 5,156,438 | |
Rights | | | — | | | | — | | | | 343,333 | | | | 343,333 | |
Short-Term Securities | | | 4,244,491 | | | | — | | | | — | | | | 4,244,491 | |
| | | | |
Subtotal | | $ | 723,978,661 | | | | — | | | $ | 5,499,772 | | | $ | 729,135,100 | |
| | | | |
Investments Valued at NAV1 | | | | | | | | | | | | | | | 3,155,437 | |
| | | | | | | | | | | | | | | | |
Total Investments | | | | | | | | | | | | | | $ | 732,633,870 | |
| | | | | | | | | | | | | | | | |
| | | | | | | | | | | | | | | | |
Derivative Financial Instruments2 | | | | | | | | | | | | | | | | |
Assets: | | | | | | | | | | | | | | | | |
Equity contracts | | $ | 42,563 | | | | — | | | | — | | | $ | 42,563 | |
| | 1 | | As of March 31, 2017, certain investments of the Fund were fair valued using NAV per share as no quoted market value is available and therefore have been excluded from the fair value hierarchy. |
| | 2 | | Derivative financial instruments are futures contracts, which are valued at the unrealized appreciation (depreciation) on the instrument. |
During the six months ended March 31, 2017, there were no transfers between levels.
See Notes to Financial Statements.
| | | | | | |
| 26 | | BLACKROCK FUNDS | | MARCH 31, 2017 | | |
| | | | |
| Statements of Assets and Liabilities | | | | |
| | | | | | | | | | | | |
| March 31, 2017 (Unaudited) | | BlackRock
Flexible Equity Fund1 | | | BlackRock
Mid-Cap
Growth Equity
Portfolio | | | BlackRock
Advantage
Small Cap
Growth Fund | |
| | | | | | | | | | | | |
| Assets | | | | | | | | | | | | |
Investments at value — unaffiliated2,3 | | $ | 440,110,532 | | | $ | 593,755,412 | | | $ | 725,233,942 | |
Investments at value — affiliated4 | | | 6,836,600 | | | | 14,704,510 | | | | 7,399,928 | |
Cash | | | 107,540 | | | | — | | | | — | |
Cash pledged for futures contracts | | | — | | | | — | | | | 410,000 | |
Foreign currency at value5 | | | — | | | | 1,645 | | | | — | |
Receivables: | | | | | | | | | | | | |
Investments sold | | | 359,932 | | | | 1,735,686 | | | | 9,004,157 | |
Capital shares sold | | | 55,580 | | | | 1,205,407 | | | | 1,790,547 | |
Dividends — unaffiliated | | | 655,302 | | | | 95,160 | | | | 352,189 | |
Dividends — affiliated | | | 4,088 | | | | 3,422 | | | | 3,068 | |
From the Manager | | | 44,345 | | | | 1,733 | | | | 104,142 | |
Securities lending income — affiliated | | | 138 | | | | 1,806 | | | | 55,194 | |
Variation margin receivable on futures contracts | | | — | | | | — | | | | 10,188 | |
Prepaid expenses | | | 51,411 | | | | 82,151 | | | | 53,054 | |
| | | | |
Total assets | | | 448,225,468 | | | | 611,586,932 | | | | 744,416,409 | |
| | | | |
| | | | | | | | | | | | |
| Liabilities | | | | | | | | | | | | |
Bank overdraft | | | — | | | | — | | | | 15,153 | |
Cash collateral on securities loaned at value | | | 471,702 | | | | 2,602,682 | | | | 3,154,691 | |
Payables: | | | | | | | | | | | | |
Investments purchased | | | 301,881 | | | | 3,030,290 | | | | 8,009,860 | |
Capital shares redeemed | | | 575,408 | | | | 1,187,515 | | | | 504,887 | |
Investment advisory fees | | | 296,591 | | | | 419,399 | | | | 239,156 | |
Transfer agent fees | | | 321,920 | | | | 395,034 | | | | 311,583 | |
Service and distribution fees | | | 130,493 | | | | 135,991 | | | | 65,281 | |
Officer’s and Trustees’ fees | | | 7,439 | | | | 8,199 | | | | 10,310 | |
Other affiliates | | | 30,289 | | | | 70,688 | | | | 87,549 | |
Other accrued expenses | | | 176,411 | | | | 136,552 | | | | 220,745 | |
| | | | |
Total liabilities | | | 2,312,134 | | | | 7,986,350 | | | | 12,619,215 | |
| | | | |
Net Assets | | $ | 445,913,334 | | | $ | 603,600,582 | | | $ | 731,797,194 | |
| | | | |
| | | | | | | | | | | | |
| Net Assets Consist of | | | | | | | | | | | | |
Paid-in capital | | $ | 393,758,118 | | | $ | 441,947,047 | | | $ | 606,363,416 | |
Undistributed (distributions in excess of) net investment income (loss) | | | 699,102 | | | | (5,799,938 | ) | | | 482,144 | |
Accumulated net realized gain (loss) | | | (22,381,485 | ) | | | 19,384,082 | | | | 32,371,310 | |
Net unrealized appreciation (depreciation) | | | 73,837,599 | | | | 148,069,391 | | | | 92,580,324 | |
| | | | |
Net Assets | | $ | 445,913,334 | | | $ | 603,600,582 | | | $ | 731,797,194 | |
| | | | |
1 Consolidated Statement of Assets and Liabilities. | | | | | | | | | | | | |
2 Investments at cost — unaffiliated | | $ | 366,256,519 | | | $ | 445,685,788 | | | $ | 632,696,333 | |
3 Securities loaned at value | | $ | 460,424 | | | $ | 2,575,948 | | | $ | 3,031,333 | |
4 Investments at cost — affiliated | | $ | 6,836,647 | | | $ | 14,704,718 | | | $ | 7,399,776 | |
5 Foreign currency at cost | | | — | | | $ | 1,670 | | | | — | |
See Notes to Financial Statements.
| | | | | | |
| | | BLACKROCK FUNDS | | MARCH 31, 2017 | | 27 |
| | | | |
| Statements of Assets and Liabilities (concluded) | | | | |
| | | | | | | | | | | | |
| March 31, 2017 (Unaudited) | | BlackRock
Flexible
Equity Fund1 | | | BlackRock
Mid-Cap
Growth Equity
Portfolio | | | BlackRock
Advantage
Small Cap
Growth Fund | |
| | | | | | | | | | | | |
| Net Asset Value | | | | | | | | | | | | |
Institutional | | | | | | | | | | | | |
Net assets | | $ | 43,152,127 | | | $ | 122,819,964 | | | $ | 501,609,684 | |
| | | | |
Shares outstanding2 | | | 3,090,756 | | | | 6,294,835 | | | | 25,223,877 | |
| | | | |
Net asset value | | $ | 13.96 | | | $ | 19.51 | | | $ | 19.89 | |
| | | | |
Service | | | | | | | | | | | | |
Net assets | | $ | 134,672 | | | $ | 839,955 | | | $ | 9,470,000 | |
| | | | |
Shares outstanding2 | | | 9,794 | | | | 47,095 | | | | 550,592 | |
| | | | |
Net asset value | | $ | 13.75 | | | $ | 17.84 | | | $ | 17.20 | |
| | | | |
Investor A | | | | | | | | | | | | |
Net assets | | $ | 336,768,540 | | | $ | 413,860,429 | | | $ | 197,544,527 | |
| | | | |
Shares outstanding2 | | | 25,086,211 | | | | 24,247,353 | | | | 12,496,245 | |
| | | | |
Net asset value | | $ | 13.42 | | | $ | 17.07 | | | $ | 15.81 | |
| | | | |
Investor B | | | | | | | | | | | | |
Net assets | | $ | 1,012,537 | | | $ | 506,229 | | | | — | |
| | | | |
Shares outstanding2 | | | 86,340 | | | | 36,804 | | | | — | |
| | | | |
Net asset value | | $ | 11.73 | | | $ | 13.75 | | | | — | |
| | | | |
Investor C | | | | | | | | | | | | |
Net assets | | $ | 62,563,696 | | | $ | 54,890,906 | | | $ | 23,172,983 | |
| | | | |
Shares outstanding2 | | | 5,404,383 | | | | 4,028,099 | | | | 2,365,458 | |
| | | | |
Net asset value | | $ | 11.58 | | | $ | 13.63 | | | $ | 9.80 | |
| | | | |
Class K | | | | | | | | | | | | |
Net assets | | | — | | | $ | 2,340,728 | | | | — | |
| | | | |
Shares outstanding2 | | | — | | | | 119,844 | | | | — | |
| | | | |
Net asset value | | | — | | | $ | 19.53 | | | | — | |
| | | | |
Class R | | | | | | | | | | | | |
Net assets | | $ | 2,281,762 | | | $ | 8,342,371 | | | | — | |
| | | | |
Shares outstanding2 | | | 165,021 | | | | 495,309 | | | | — | |
| | | | |
Net asset value | | $ | 13.83 | | | $ | 16.84 | | | | — | |
| | | | |
| | 1 | | Consolidated Statement of Assets and Liabilities. |
| | 2 | | Unlimited number of shares authorized, $0.001 par value. |
See Notes to Financial Statements.
| | | | | | |
| 28 | | BLACKROCK FUNDS | | MARCH 31, 2017 | | |
| | | | | | | | | | | | |
| Six Months Ended March 31, 2017 (Unaudited) | | BlackRock
Flexible
Equity Fund1 | | | BlackRock
Mid-Cap
Growth Equity Portfolio | | | BlackRock
Advantage
Small Cap
Growth Fund | |
| | | | | | | | | | | | |
| Investment Income | | | | | | | | | | | | |
Dividends — unaffiliated | | $ | 4,164,167 | | | $ | 2,133,332 | 2 | | $ | 2,827,218 | |
Dividends — affiliated | | | 15,236 | | | | 6,677 | | | | 11,480 | |
Securities lending — affiliated — net | | | 1,459 | | | | 3,562 | | | | 281,926 | |
Foreign taxes withheld | | | (38,829 | ) | | | (2,918 | ) | | | — | |
| | | | |
Total income | | | 4,142,033 | | | | 2,140,653 | | | | 3,120,624 | |
| | | | |
| | | | | | | | | | | | |
| Expenses | | | | | | | | | | | | |
Investment advisory | | | 1,747,161 | | | | 2,216,393 | | | | 1,754,040 | |
Service and distribution — class specific | | | 741,358 | | | | 772,260 | | | | 387,999 | |
Transfer agent — class specific | | | 453,863 | | | | 565,114 | | | | 640,743 | |
Administration | | | 92,818 | | | | 117,052 | | | | 151,406 | |
Administration — class specific | | | 43,724 | | | | 55,419 | | | | 72,607 | |
Accounting services | | | 46,404 | | | | 59,009 | | | | 72,750 | |
Professional | | | 79,562 | | | | 43,066 | | | | 39,589 | |
Registration | | | 38,543 | | | | 54,028 | | | | 34,490 | |
Printing | | | 27,421 | | | | 34,656 | | | | 32,815 | |
Custodian | | | 14,853 | | | | 15,831 | | | | 49,262 | |
Officer and Trustees | | | 10,597 | | | | 12,212 | | | | 14,924 | |
Offering | | | — | | | | 39,238 | | | | — | |
Recoupment of past waived and/or reimbursed fees — class specific | | | — | | | | 18,997 | | | | — | |
Miscellaneous | | | 13,082 | | | | 14,221 | | | | 23,396 | |
| | | | |
Total expenses | | | 3,309,386 | | | | 4,017,496 | | | | 3,274,021 | |
Less: | | | | | | | | | | | | |
Fees waived by the Manager | | | (61,205 | ) | | | (1,941 | ) | | | (160,186 | ) |
Administration fees waived — class specific | | | (43,724 | ) | | | (37,592 | ) | | | (48,427 | ) |
Transfer agent fees waived — class specific | | | (34,012 | ) | | | (39,144 | ) | | | (3,292 | ) |
Transfer agent fees reimbursed — class specific | | | (274,400 | ) | | | (23,421 | ) | | | (419,972 | ) |
| | | | |
Total expenses after fees waived and reimbursed | | | 2,896,045 | | | | 3,915,398 | | | | 2,642,144 | |
| | | | |
Net investment income (loss) | | | 1,245,988 | | | | (1,774,745 | ) | | | 478,480 | |
| | | | |
| | | | | | | | | | | | |
| Realized and Unrealized Gain (Loss) | | | | | | | | | | | | |
Net realized gain (loss) from: | | | | | | | | | | | | |
Investments — unaffiliated | | | 18,338,062 | | | | 22,411,535 | | | | 54,343,044 | |
Investments — affiliated | | | 100 | | | | (14 | ) | | | 573 | |
Capital gain distributions received from affiliated investment companies | | | 62 | | | | — | | | | 40 | |
Futures contracts | | | — | | | | — | | | | 1,232,916 | |
Foreign currency transactions | | | — | | | | (3,464 | ) | | | — | |
| | | | |
| | | 18,338,224 | | | | 22,408,057 | | | | 55,576,573 | |
| | | | |
Net change in unrealized appreciation (depreciation) on: | | | | | | | | | | | | |
Investments — unaffiliated | | | 37,802,835 | | | | 28,010,878 | | | | 17,111,970 | |
Investments — affiliated | | | (47 | ) | | | (208 | ) | | | 152 | |
Futures contracts | | | — | | | | — | | | | (72,335 | ) |
Foreign currency translations | | | (3,803 | ) | | | 203 | | | | — | |
| | | | |
| | | 37,798,985 | | | | 28,010,873 | | | | 17,039,787 | |
| | | | |
Net realized and unrealized gain | | | 56,137,209 | | | | 50,418,930 | | | | 72,616,360 | |
| | | | |
Net Increase in Net Assets Resulting from Operations | | $ | 57,383,197 | | | $ | 48,644,185 | | | $ | 73,094,840 | |
| | | | |
| | 1 | | Consolidated Statement of Operations. |
| | 2 | | Includes non-recurring dividends in the amount of $1,220,448. |
See Notes to Financial Statements.
| | | | | | |
| | | BLACKROCK FUNDS | | MARCH 31, 2017 | | 29 |
| | | | |
| Statements of Changes in Net Assets | | | | |
| | | | | | | | | | | | | | | | | | | | | | | | |
| | | BlackRock
Flexible
Equity
Fund1 | | | BlackRock
Mid-Cap
Growth Equity
Portfolio | | | BlackRock
Advantage
Small Cap
Growth Fund | |
| Increase (Decrease) in Net Assets: | | Six Months
Ended
March 31, 2017
(Unaudited) | | | Year Ended
September 30,
2016 | | | Six Months
Ended
March 31, 2017
(Unaudited) | | | Year Ended
September 30,
2016 | | | Six Months Ended March 31, 2017
(Unaudited) | | | Year Ended
September 30,
2016 | |
| | | | | | | | | | | | | | | | | | | | | | | | |
| Operations | | | | | | | | | | | | | | | | | | | | | | | | |
Net investment income (loss) | | $ | 1,245,988 | | | $ | 1,999,174 | | | $ | (1,774,745 | ) | | $ | (5,452,501 | ) | | $ | 478,480 | | | $ | 483,921 | |
Net realized gain (loss) | | | 18,338,224 | | | | (8,830,781 | ) | | | 22,408,057 | | | | (2,806,499 | ) | | | 55,576,573 | | | | (8,223,564 | ) |
Net change in unrealized appreciation (depreciation) | | | 37,798,985 | | | | 47,102,628 | | | | 28,010,873 | | | | 65,463,361 | | | | 17,039,787 | | | | 56,071,332 | |
| | | | | | | | | | | | |
Net increase in net assets resulting from operations | | | 57,383,197 | | | | 40,271,021 | | | | 48,644,185 | | | | 57,204,361 | | | | 73,094,840 | | | | 48,331,689 | |
| | | | | | | | | | | | |
| | | | | | | | | | | | | | | | | | | | | | | | |
| Distributions to Shareholders2 | | | | | | | | | | | | | | | | | | | | | | | | |
From net investment income: | | | | | | | | | | | | | | | | | | | | | | | | |
Institutional | | | (335,280 | ) | | | (232,239 | ) | | | — | | | | — | | | | (249,712 | ) | | | — | |
Service | | | (692 | ) | | | (73 | ) | | | — | | | | — | | | | — | | | | — | |
Investor A | | | (1,858,302 | ) | | | (542,725 | ) | | | — | | | | — | | | | — | | | | — | |
Class R | | | (5,742 | ) | | | — | | | | — | | | | — | | | | — | | | | — | |
From net realized gain: | | | | | | | | | | | | | | | | | | | | | | | | |
Institutional | | | — | | | | (2,674,570 | ) | | | — | | | | (2,009,090 | ) | | | — | | | | (28,615,524 | ) |
Service | | | — | | | | (7,607 | ) | | | — | | | | (37,699 | ) | | | — | | | | (1,202,425 | ) |
Investor A | | | — | | | | (24,921,567 | ) | | | — | | | | (9,310,900 | ) | | | — | | | | (16,862,272 | ) |
Investor B | | | — | | | | (242,080 | ) | | | — | | | | (51,879 | ) | | | — | | | | — | |
Investor C | | | — | | | | (5,636,080 | ) | | | — | | | | (1,450,834 | ) | | | — | | | | (2,736,282 | ) |
Class R | | | — | | | | (103,686 | ) | | | — | | | | (193,731 | ) | | | — | | | | — | |
| | | | | | | | | | | | |
Decrease in net assets resulting from distributions to shareholders | | | (2,200,016 | ) | | | (34,360,627 | ) | | | — | | | | (13,054,133 | ) | | | (249,712 | ) | | | (49,416,503 | ) |
| | | | | | | | | | | | |
| | | | | | | | | | | | | | | | | | | | | | | | |
| Capital Share Transactions | | | | | | | | | | | | | | | | | | | | | | | | |
Net increase (decrease) in net assets derived from capital share transactions | | | (37,273,734 | ) | | | (52,392,296 | ) | | | (2,466,448 | ) | | | 22,037,838 | | | | (117,363,386 | ) | | | (29,420,476 | ) |
| | | | | | | | | | | | |
| | | | | | | | | | | | | | | | | | | | | | | | |
| Net Assets | | | | | | | | | | | | | | | | | | | | | | | | |
Total increase (decrease) in net assets | | | 17,909,447 | | | | (46,481,902 | ) | | | 46,177,737 | | | | 66,188,066 | | | | (44,518,258 | ) | | | (30,505,290 | ) |
Beginning of period | | | 428,003,887 | | | | 474,485,789 | | | | 557,422,845 | | | | 491,234,779 | | | | 776,315,452 | | | | 806,820,742 | |
| | | | | | | | | | | | |
End of period | | $ | 445,913,334 | | | $ | 428,003,887 | | | $ | 603,600,582 | | | $ | 557,422,845 | | | $ | 731,797,194 | | | $ | 776,315,452 | |
| | | | | | | | | | | | |
Undistributed (distributions in excess of) net investment income (loss), end of period | | $ | 699,102 | | | $ | 1,653,130 | | | $ | (5,799,938 | ) | | | (4,025,193 | ) | | $ | 482,144 | | | $ | 253,376 | |
| | | | | | | | | | | | |
| | 1 | | Consolidated Statements of Changes in Net Assets. |
| | 2 | | Distributions for annual periods determined in accordance with U.S. federal income tax regulations. |
See Notes to Financial Statements.
| | | | | | |
| 30 | | BLACKROCK FUNDS | | MARCH 31, 2017 | | |
| | | | |
| Financial Highlights | | | BlackRock Flexible Equity Fund | |
| | | | | | | | | | | | | | | | | | | | | | | | |
| | | Institutional | |
| | | Six Months
Ended
March 31, 2017 | | | Year Ended September 30,1 | |
| | | (Unaudited)1 | | | 2016 | | | 2015 | | | 2014 | | | 2013 | | | 2012 | |
| | | | | | | | | | | | | | | | | | | | | | | | |
| Per Share Operating Performance | | | | | | | | | | | | | | | | | | | | | | | | |
Net asset value, beginning of period | | $ | 12.32 | | | $ | 12.07 | | | $ | 14.51 | | | $ | 14.04 | | | $ | 12.53 | | | $ | 9.81 | |
| | | | |
Net investment income2 | | | 0.06 | | | | 0.10 | | | | 0.06 | | | | 0.29 | | | | 0.19 | | | | 0.10 | |
Net realized and unrealized gain (loss) | | | 1.69 | | | | 1.06 | | | | (0.25 | ) | | | 0.53 | | | | 1.46 | | | | 2.72 | |
| | | | |
Net increase (decrease) from investment operations | | | 1.75 | | | | 1.16 | | | | (0.19 | ) | | | 0.82 | | | | 1.65 | | | | 2.82 | |
| | | | |
Distributions:3 | | | | | | | | | | | | | | | | | | | | | | | | |
From net investment income | | | (0.11 | ) | | | (0.07 | ) | | | (0.41 | ) | | | (0.21 | ) | | | (0.14 | ) | | | (0.10 | ) |
From net realized gain | | | — | | | | (0.84 | ) | | | (1.84 | ) | | | (0.14 | ) | | | — | | | | — | |
| | | | |
Total distributions | | | (0.11 | ) | | | (0.91 | ) | | | (2.25 | ) | | | (0.35 | ) | | | (0.14 | ) | | | (0.10 | ) |
| | | | |
Net asset value, end of period | | $ | 13.96 | | | $ | 12.32 | | | $ | 12.07 | | | $ | 14.51 | | | $ | 14.04 | | | $ | 12.53 | |
| | | | |
| | | | | | | | | | | | | | | | | | | | | | | | |
| Total Return4 | | | | | | | | | | | | | | | | | | | | | | | | |
Based on net asset value | | | 14.28 | %5 | | | 9.75 | % | | | (2.15 | )% | | | 5.76 | % | | | 13.36 | % | | | 28.90 | % |
| | | | |
| | | | | | | | | | | | | | | | | | | | | | | | |
| Ratios to Average Net Assets | | | | | | | | | | | | | | | | | | | | | | | | |
Total expenses | | | 1.15 | %6,7 | | | 1.14 | %7 | | | 1.11 | %7 | | | 1.09 | %7 | | | 1.15 | %7 | | | 1.13 | % |
| | | | |
Total expenses after fees waived, reimbursed and paid indirectly | | | 0.92 | %6,7 | | | 0.92 | %7 | | | 0.92 | %7 | | | 0.96 | %7 | | | 0.97 | %7 | | | 0.97 | % |
| | | | |
Net investment income | | | 0.95 | %6,7 | | | 0.86 | %7 | | | 0.46 | %7 | | | 1.99 | %7 | | | 1.48 | %7 | | | 0.89 | % |
| | | | |
| | | | | | | | | | | | | | | | | | | | | | | | |
| Supplemental Data | | | | | | | | | | | | | | | | | | | | | | | | |
Net assets, end of period (000) | | $ | 43,152 | | | $ | 37,417 | | | $ | 40,870 | | | $ | 53,274 | | | $ | 64,078 | | | $ | 142,963 | |
| | | | |
Portfolio turnover rate | | | 21 | % | | | 36 | % | | | 156 | % | | | 102 | % | | | 119 | % | | | 156 | % |
| | | | |
| | 1 | | Consolidated Financial Highlights. |
| | 2 | | Based on average shares outstanding. |
| | 3 | | Distributions for annual periods determined in accordance with U.S. federal income tax regulations. |
| | 4 | | Where applicable, assumes the reinvestment of distributions. |
| | 5 | | Aggregate total return. |
| | 7 | | Excludes expenses incurred indirectly as a result of investments in underlying funds as follows: |
| | | | | | | | | | | | | | | | | | | | | | | | |
| | | Six Months
Ended
March 31, 2017 | | | Year Ended September 30, | |
| | | (Unaudited) | | | 2016 | | | 2015 | | | 2014 | | | 2013 | | | 2012 | |
Investments in underlying funds | | | — | | | | — | | | | 0.01 | % | | | 0.01 | % | | | 0.03 | % | | | — | |
See Notes to Financial Statements.
| | | | | | |
| | | BLACKROCK FUNDS | | MARCH 31, 2017 | | 31 |
| | | | |
| Financial Highlights (continued) | | | BlackRock Flexible Equity Fund | |
| | | | | | | | | | | | | | | | | | | | | | | | |
| | | Service | |
| | | Six Months
Ended
March 31, 2017 | | | Year Ended September 30,1 | |
| | | (Unaudited)1 | | | 2016 | | | 2015 | | | 2014 | | | 2013 | | | 2012 | |
| | | | | | | | | | | | | | | | | | | | | | | | |
| Per Share Operating Performance | | | | | | | | | | | | | | | | | | | | | | | | |
Net asset value, beginning of period | | $ | 12.12 | | | $ | 11.86 | | | $ | 14.29 | | | $ | 13.81 | | | $ | 12.30 | | | $ | 9.63 | |
| | | | |
Net investment income2 | | | 0.04 | | | | 0.06 | | | | 0.01 | | | | 0.23 | | | | 0.14 | | | | 0.06 | |
Net realized and unrealized gain (loss) | | | 1.66 | | | | 1.05 | | | | (0.24 | ) | | | 0.54 | | | | 1.44 | | | | 2.68 | |
| | | | |
Net increase (decrease) from investment operations | | | 1.70 | | | | 1.11 | | | | (0.23 | ) | | | 0.77 | | | | 1.58 | | | | 2.74 | |
| | | | |
Distributions:3 | | | | | | | | | | | | | | | | | | | | | | | | |
From net investment income | | | (0.07 | ) | | | (0.01 | ) | | | (0.36 | ) | | | (0.15 | ) | | | (0.07 | ) | | | (0.07 | ) |
From net realized gain | | | — | | | | (0.84 | ) | | | (1.84 | ) | | | (0.14 | ) | | | — | | | | — | |
| | | | |
Total distributions | | | (0.07 | ) | | | (0.85 | ) | | | (2.20 | ) | | | (0.29 | ) | | | (0.07 | ) | | | (0.07 | ) |
| | | | |
Net asset value, end of period | | $ | 13.75 | | | $ | 12.12 | | | $ | 11.86 | | | $ | 14.29 | | | $ | 13.81 | | | $ | 12.30 | |
| | | | |
| | | | | | | | | | | | | | | | | | | | | | | | |
| Total Return4 | | | | | | | | | | | | | | | | | | | | | | | | |
Based on net asset value | | | 14.08 | %5 | | | 9.44 | % | | | (2.49 | )% | | | 5.45 | % | | | 13.00 | % | | | 28.58 | % |
| | | | |
| | | | | | | | | | | | | | | | | | | | | | | | |
| Ratios to Average Net Assets | | | | | | | | | | | | | | | | | | | | | | | | |
Total expenses | | | 1.31 | %6,7 | | | 1.26 | %7,8 | | | 1.33 | %7,8 | | | 1.30 | %7 | | | 1.75 | %7,8 | | | 1.95 | % |
| | | | |
Total expenses after fees waived, reimbursed and paid indirectly | | | 1.24 | %6,7 | | | 1.24 | %7 | | | 1.23 | %7 | | | 1.27 | %7 | | | 1.29 | %7 | | | 1.29 | % |
| | | | |
Net investment income | | | 0.64 | %6,7 | | | 0.54 | %7 | | | 0.10 | %7 | | | 1.60 | %7 | | | 1.15 | %7 | | | 0.56 | % |
| | | | |
| | | | | | | | | | | | | | | | | | | | | | | | |
| Supplemental Data | | | | | | | | | | | | | | | | | | | | | | | | |
Net assets, end of period (000) | | $ | 135 | | | $ | 119 | | | $ | 108 | | | $ | 211 | | | $ | 421 | | | $ | 674 | |
| | | | |
Portfolio turnover rate | | | 21 | % | | | 36 | % | | | 156 | % | | | 102 | % | | | 119 | % | | | 156 | % |
| | | | |
| | 1 | | Consolidated Financial Highlights. |
| | 2 | | Based on average shares outstanding. |
| | 3 | | Distributions for annual periods determined in accordance with U.S. federal income tax regulations. |
| | 4 | | Where applicable, assumes the reinvestment of distributions. |
| | 5 | | Aggregate total return. |
| | 7 | | Excludes expenses incurred indirectly as a result of investments in underlying funds as follows: |
��
| | | | | | | | | | | | | | | | | | | | | | | | |
| | | Six Months
Ended
March 31, 2017 | | | Year Ended September 30, | |
| | | (Unaudited) | | | 2016 | | | 2015 | | | 2014 | | | 2013 | | | 2012 | |
Investments in underlying funds | | | — | | | | — | | | | 0.01 | % | | | 0.01 | % | | | 0.03 | % | | | — | |
| | 8 | | Includes recoupment of past waived and/or reimbursed fees. Excluding the recoupment of past waived and/or reimbursed fees, the ratios were as follows: |
| | | | | | | | | | | | | | | | | | | | | | | | |
| | | Six Months
Ended
March 31, 2017 | | | Year Ended September 30, | |
| | | (Unaudited) | | | 2016 | | | 2015 | | | 2014 | | | 2013 | | | 2012 | |
Expense ratios | | | — | | | | 1.21 | % | | | 1.30 | % | | | 1.30 | % | | | 1.73 | % | | | — | |
See Notes to Financial Statements.
| | | | | | |
| 32 | | BLACKROCK FUNDS | | MARCH 31, 2017 | | |
| | | | |
| Financial Highlights (continued) | | | BlackRock Flexible Equity Fund | |
| | | | | | | | | | | | | | | | | | | | | | | | |
| | | Investor A | |
| | | Six Months
Ended
March 31,
2017 | | | Year Ended September 30,1 | |
| | | (Unaudited)1 | | | | 2016 | | | | 2015 | | | | 2014 | | | | 2013 | | | | 2012 | |
| | | | | | | | | | | | | | | | | | | | | | | | |
| Per Share Operating Performance | | | | | | | | | | | | | | | | | | | | | | | | |
Net asset value, beginning of period | | $ | 11.83 | | | $ | 11.61 | | | $ | 14.04 | | | $ | 13.59 | | | $ | 12.14 | | | $ | 9.50 | |
| | | | |
Net investment income2 | | | 0.04 | | | | 0.06 | | | | 0.02 | | | | 0.22 | | | | 0.14 | | | | 0.07 | |
Net realized and unrealized gain (loss) | | | 1.62 | | | | 1.02 | | | | (0.24 | ) | | | 0.54 | | | | 1.41 | | | | 2.63 | |
| | | | |
Net increase (decrease) from investment operations | | | 1.66 | | | | 1.08 | | | | (0.22 | ) | | | 0.76 | | | | 1.55 | | | | 2.70 | |
| | | | |
Distributions:3 | | | | | | | | | | | | | | | | | | | | | | | | |
From net investment income | | | (0.07 | ) | | | (0.02 | ) | | | (0.37 | ) | | | (0.17 | ) | | | (0.10 | ) | | | (0.06 | ) |
From net realized gain | | | — | | | | (0.84 | ) | | | (1.84 | ) | | | (0.14 | ) | | | — | | | | — | |
| | | | |
Total distributions | | | (0.07 | ) | | | (0.86 | ) | | | (2.21 | ) | | | (0.31 | ) | | | (0.10 | ) | | | (0.06 | ) |
| | | | |
Net asset value, end of period | | $ | 13.42 | | | $ | 11.83 | | | $ | 11.61 | | | $ | 14.04 | | | $ | 13.59 | | | $ | 12.14 | |
| | | | |
| | | | | | | | | | | | | | | | | | | | | | | | |
| Total Return4 | | | | | | | | | | | | | | | | | | | | | | | | |
Based on net asset value | | | 14.09 | %5 | | | 9.39 | % | | | (2.46 | )% | | | 5.46 | % | | | 12.92 | % | | | 28.54 | % |
| | | | |
| | | | | | | | | | | | | | | | | | | | | | | | |
| Ratios to Average Net Assets | | | | | | | | | | | | | | | | | | | | | | | | |
Total expenses | | | 1.43 | %6,7 | | | 1.42 | %6 | | | 1.41 | %6 | | | 1.40 | %6 | | | 1.43 | %6 | | | 1.40 | %8 |
| | | | |
Total expenses after fees waived, reimbursed and paid indirectly | | | 1.24 | %6,7 | | | 1.24 | %6 | | | 1.24 | %6 | | | 1.27 | %6 | | | 1.29 | %6 | | | 1.29 | % |
| | | | |
Net investment income | | | 0.64 | %6,7 | | | 0.54 | %6 | | | 0.14 | %6 | | | 1.55 | %6 | | | 1.11 | %6 | | | 0.60 | % |
| | | | |
| | | | | | | | | | | | | | | | | | | | | | | | |
| Supplemental Data | | | | | | | | | | | | | | | | | | | | | | | | |
Net assets, end of period (000) | | $ | 336,769 | | | $ | 323,297 | | | $ | 355,844 | | | $ | 443,630 | | | $ | 512,059 | | | $ | 615,464 | |
| | | | |
Portfolio turnover rate | | | 21 | % | | | 36 | % | | | 156 | % | | | 102 | % | | | 119 | % | | | 156 | % |
| | | | |
| | 1 | | Consolidated Financial Highlights. |
| | 2 | | Based on average shares outstanding. |
| | 3 | | Distributions for annual periods determined in accordance with U.S. federal income tax regulations. |
| | 4 | | Where applicable, excludes the effects of any sales charges and assumes the reinvestment of distributions. |
| | 5 | | Aggregate total return. |
| | 6 | | Excludes expenses incurred indirectly as a result of investments in underlying funds as follows: |
| | | | | | | | | | | | | | | | | | | | | | | | |
| | | Six Months
Ended
March 31,
2017 | | | Year Ended September 30, | |
| | | (Unaudited) | | | 2016 | | | 2015 | | | 2014 | | | 2013 | | | 2012 | |
Investments in underlying funds | | | — | | | | — | | | | 0.01 | % | | | 0.01 | % | | | 0.03 | % | | | — | |
| | 8 | | Includes recoupment of past waived and/or reimbursed fees with no financial impact to the expense ratios. |
See Notes to Financial Statements.
| | | | | | |
| | | BLACKROCK FUNDS | | MARCH 31, 2017 | | 33 |
| | | | |
| Financial Highlights (continued) | | | BlackRock Flexible Equity Fund | |
| | | | | | | | | | | | | | | | | | | | | | | | |
| | | Investor B | |
| | | Six Months
Ended
March 31,
2017 | | | Year Ended September 30,1 | |
| | | (Unaudited)1 | | | 2016 | | | 2015 | | | 2014 | | | 2013 | | | 2012 | |
| | | | | | | | | | | | | | | | | | | | | | | | |
| Per Share Operating Performance | | | | | | | | | | | | | | | | | | | | | | | | |
Net asset value, beginning of period | | $ | 10.32 | | | $ | 10.28 | | | $ | 12.66 | | | $ | 12.26 | | | $ | 10.95 | | | $ | 8.58 | |
| | | | |
Net investment income (loss)2 | | | (0.01 | ) | | | (0.03 | ) | | | (0.08 | ) | | | 0.11 | | | | 0.04 | | | | (0.02 | ) |
Net realized and unrealized gain (loss) | | | 1.42 | | | | 0.91 | | | | (0.20 | ) | | | 0.48 | | | | 1.28 | | | | 2.39 | |
| | | | |
Net increase (decrease) from investment operations | | | 1.41 | | | | 0.88 | | | | (0.28 | ) | | | 0.59 | | | | 1.32 | | | | 2.37 | |
| | | | |
Distributions:3 | | | | | | | | | | | | | | | | | | | | | | | | |
From net investment income | | | — | | | | — | | | | (0.26 | ) | | | (0.05 | ) | | | (0.01 | ) | | | — | |
From net realized gain | | | — | | | | (0.84 | ) | | | (1.84 | ) | | | (0.14 | ) | | | — | | | | — | |
| | | | |
Total distributions | | | — | | | | (0.84 | ) | | | (2.10 | ) | | | (0.19 | ) | | | (0.01 | ) | | | — | |
| | | | |
Net asset value, end of period | | $ | 11.73 | | | $ | 10.32 | | | $ | 10.28 | | | $ | 12.66 | | | $ | 12.26 | | | $ | 10.95 | |
| | | | |
| | | | | | | | | | | | | | | | | | | | | | | | |
| Total Return4 | | | | | | | | | | | | | | | | | | | | | | | | |
Based on net asset value | | | 13.66 | %5 | | | 8.63 | % | | | (3.24 | )% | | | 4.68 | % | | | 12.04 | % | | | 27.62 | % |
| | | | |
| | | | | | | | | | | | | | | | | | | | | | | | |
| Ratios to Average Net Assets | | | | | | | | | | | | | | | | | | | | | | | | |
Total expenses | | | 3.30 | %6,7 | | | 2.74 | %6 | | | 2.52 | %6 | | | 2.41 | %6 | | | 2.42 | %6,8 | | | 2.31 | %8 |
| | | | |
Total expenses after fees waived, reimbursed and paid indirectly | | | 2.01 | %6,7 | | | 2.01 | %6 | | | 2.01 | %6 | | | 2.05 | %6 | | | 2.06 | %6 | | | 2.06 | % |
| | | | |
Net investment income (loss) | | | (0.14 | )%6,7 | | | (0.25 | )%6 | | | (0.68 | )%6 | | | 0.82 | %6 | | | 0.36 | %6 | | | (0.19 | )% |
| | | | |
| | | | | | | | | | | | | | | | | | | | | | | | |
| Supplemental Data | | | | | | | | | | | | | | | | | | | | | | | | |
Net assets, end of period (000) | | $ | 1,013 | | | $ | 1,711 | | | $ | 3,560 | | | $ | 7,122 | | | $ | 11,918 | | | $ | 17,465 | |
| | | | |
Portfolio turnover rate | | | 21 | % | | | 36 | % | | | 156 | % | | | 102 | % | | | 119 | % | | | 156 | % |
| | | | |
| | 1 | | Consolidated Financial Highlights. |
| | 2 | | Based on average shares outstanding. |
| | 3 | | Distributions for annual periods determined in accordance with U.S. federal income tax regulations. |
| | 4 | | Where applicable, excludes the effects of any sales charges and assumes the reinvestment of distributions. |
| | 5 | | Aggregate total return. |
| | 6 | | Excludes expenses incurred indirectly as a result of investments in underlying funds as follows: |
| | | | | | | | | | | | | | | | | | | | | | | | |
| | | Six Months
Ended
March 31,
2017 | | | Year Ended September 30, | |
| | | (Unaudited) | | | 2016 | | | 2015 | | | 2014 | | | 2013 | | | 2012 | |
Investments in underlying funds | | | — | | | | — | | | | 0.01 | % | | | 0.01 | % | | | 0.03 | % | | | — | |
| | 8 | | Includes recoupment of past waived and/or reimbursed fees. Excluding the recoupment of past waived and/or reimbursed fees, the ratios were as follows: |
| | | | | | | | | | | | | | | | | | | | | | | | |
| | | Six Months
Ended
March 31,
2017 | | | Year Ended September 30, | |
| | | (Unaudited) | | | 2016 | | | 2015 | | | 2014 | | | 2013 | | | 2012 | |
Expense ratios | | | — | | | | — | | | | — | | | | — | | | | 2.41 | % | | | 2.30 | % |
See Notes to Financial Statements.
| | | | | | |
| 34 | | BLACKROCK FUNDS | | MARCH 31, 2017 | | |
| | | | |
| Financial Highlights (continued) | | | BlackRock Flexible Equity Fund | |
| | | | | | | | | | | | | | | | | | | | | | | | |
| | | Investor C | |
| | | Six Months
Ended
March 31,
2017 | | | Year Ended September 30,1 | |
| | | (Unaudited)1 | | | 2016 | | | 2015 | | | 2014 | | | 2013 | | | 2012 | |
| | | | | | | | | | | | | | | | | | | | | | | | |
| Per Share Operating Performance | | | | | | | | | | | | | | | | | | | | | | | | |
Net asset value, beginning of period | | $ | 10.19 | | | $ | 10.16 | | | $ | 12.57 | | | $ | 12.20 | | | $ | 10.91 | | | $ | 8.55 | |
| | | | |
Net investment income (loss)2 | | | 0.00 | 3 | | | (0.02 | ) | | | (0.07 | ) | | | 0.10 | | | | 0.04 | | | | (0.02 | ) |
Net realized and unrealized gain (loss) | | | 1.39 | | | | 0.89 | | | | (0.20 | ) | | | 0.48 | | | | 1.27 | | | | 2.38 | |
| | | | |
Net increase (decrease) from investment operations | | | 1.39 | | | | 0.87 | | | | (0.27 | ) | | | 0.58 | | | | 1.31 | | | | 2.36 | |
| | | | |
Distributions:4 | | | | | | | | | | | | | | | | | | | | | | | | |
From net investment income | | | — | | | | — | | | | (0.30 | ) | | | (0.07 | ) | | | (0.02 | ) | | | — | |
From net realized gain | | | — | | | | (0.84 | ) | | | (1.84 | ) | | | (0.14 | ) | | | — | | | | — | |
| | | | |
Total distributions | | | — | | | | (0.84 | ) | | | (2.14 | ) | | | (0.21 | ) | | | (0.02 | ) | | | — | |
| | | | |
Net asset value, end of period | | $ | 11.58 | | | $ | 10.19 | | | $ | 10.16 | | | $ | 12.57 | | | $ | 12.20 | | | $ | 10.91 | |
| | | | |
| | | | | | | | | | | | | | | | | | | | | | | | |
| Total Return5 | | | | | | | | | | | | | | | | | | | | | | | | |
Based on net asset value | | | 13.64 | %6 | | | 8.63 | % | | | (3.26 | )% | | | 4.67 | % | | | 12.01 | % | | | 27.60 | % |
| | | | |
| | | | | | | | | | | | | | | | | | | | | | | | |
| Ratios to Average Net Assets | | | | | | | | | | | | | | | | | | | | | | | | |
Total expenses | | | 2.17 | %7,8 | | | 2.17 | %7 | | | 2.15 | %7 | | | 2.14 | %7 | | | 2.20 | %7 | | | 2.18 | %9 |
| | | | |
Total expenses after fees waived, reimbursed and paid indirectly | | | 2.01 | %7,8 | | | 2.01 | %7 | | | 2.01 | %7 | | | 2.04 | %7 | | | 2.06 | %7 | | | 2.06 | % |
| | | | |
Net investment income (loss) | | | 0.01 | %7,8 | | | (0.23 | )%7 | | | (0.63 | )%7 | | | 0.78 | %7 | | | 0.34 | %7 | | | (0.18 | )% |
| | | | |
| | | | | | | | | | | | | | | | | | | | | | | | |
| Supplemental Data | | | | | | | | | | | | | | | | | | | | | | | | |
Net assets, end of period (000) | | $ | 62,564 | | | $ | 63,586 | | | $ | 72,966 | | | $ | 90,904 | | | $ | 103,097 | | | $ | 115,242 | |
| | | | |
Portfolio turnover rate | | | 21 | % | | | 36 | % | | | 156 | % | | | 102 | % | | | 119 | % | | | 156 | % |
| | | | |
| | 1 | | Consolidated Financial Highlights. |
| | 2 | | Based on average shares outstanding. |
| | 3 | | Amount is less than $0.005 per share. |
| | 4 | | Distributions for annual periods determined in accordance with U.S. federal income tax regulations. |
| | 5 | | Where applicable, excludes the effects of any sales charges and assumes the reinvestment of distributions. |
| | 6 | | Aggregate total return. |
| | 7 | | Excludes expenses incurred indirectly as a result of investments in underlying funds as follows: |
| | | | | | | | | | | | | | | | | | | | | | | | |
| | | Six Months
Ended
March 31,
2017 | | | Year Ended September 30, | |
| | | (Unaudited) | | | 2016 | | | 2015 | | | 2014 | | | 2013 | | | 2012 | |
Investments in underlying funds | | | — | | | | — | | | | 0.01 | % | | | 0.01 | % | | | 0.03 | % | | | — | |
| | 9 | | Includes recoupment of past waived and/or reimbursed fees with no financial impact to the expense ratios. |
See Notes to Financial Statements.
| | | | | | |
| | | BLACKROCK FUNDS | | MARCH 31, 2017 | | 35 |
| | | | |
| Financial Highlights (concluded) | | | BlackRock Flexible Equity Fund | |
| | | | | | | | | | | | | | | | | | | | | | | | |
| | | Class R | |
| | | Six Months
Ended
March 31,
2017 | | | Year Ended September 30,1 | |
| | | (Unaudited)1 | | | 2016 | | | 2015 | | | 2014 | | | 2013 | | | 2012 | |
| | | | | | | | | | | | | | | | | | | | | | | | |
| Per Share Operating Performance | | | | | | | | | | | | | | | | | | | | | | | | |
Net asset value, beginning of period | | $ | 12.17 | | | $ | 11.94 | | | $ | 14.41 | | | $ | 13.94 | | | $ | 12.46 | | | $ | 9.75 | |
| | | | |
Net investment income (loss)2 | | | 0.02 | | | | 0.02 | | | | (0.03 | ) | | | 0.19 | | | | 0.10 | | | | 0.03 | |
Net realized and unrealized gain (loss) | | | 1.68 | | | | 1.05 | | | | (0.25 | ) | | | 0.53 | | | | 1.45 | | | | 2.71 | |
| | | | |
Net increase (decrease) from investment operations | | | 1.70 | | | | 1.07 | | | | (0.28 | ) | | | 0.72 | | | | 1.55 | | | | 2.74 | |
| | | | |
Distributions:3 | | | | | | | | | | | | | | | | | | | | | | | | |
From net investment income | | | (0.04 | ) | | | — | | | | (0.35 | ) | | | (0.11 | ) | | | (0.07 | ) | | | (0.03 | ) |
From net realized gain | | | — | | | | (0.84 | ) | | | (1.84 | ) | | | (0.14 | ) | | | — | | | | — | |
| | | | |
Total distributions | | | (0.04 | ) | | | (0.84 | ) | | | (2.19 | ) | | | (0.25 | ) | | | (0.07 | ) | | | (0.03 | ) |
| | | | |
Net asset value, end of period | | $ | 13.83 | | | $ | 12.17 | | | $ | 11.94 | | | $ | 14.41 | | | $ | 13.94 | | | $ | 12.46 | |
| | | | |
| | | | | | | | | | | | | | | | | | | | | | | | |
| Total Return4 | | | | | | | | | | | | | | | | | | | | | | | | |
Based on net asset value | | | 13.96 | %5 | | | 9.04 | % | | | (2.86 | )% | | | 5.05 | % | | | 12.51 | % | | | 28.13 | % |
| | | | |
| | | | | | | | | | | | | | | | | | | | | | | | |
| Ratios to Average Net Assets | | | | | | | | | | | | | | | | | | | | | | | | |
Total expenses | | | 1.75 | %6,7 | | | 1.74 | %6 | | | 1.69 | %6 | | | 1.68 | %6,8 | | | 1.78 | %6 | | | 1.78 | %8 |
| | | | |
Total expenses after fees waived, reimbursed and paid indirectly | | | 1.60 | %6,7 | | | 1.60 | %6 | | | 1.60 | %6 | | | 1.63 | %6 | | | 1.65 | %6 | | | 1.65 | % |
| | | | |
Net investment income (loss) | | | 0.29 | %6,7 | | | 0.20 | %6 | | | (0.23 | )%6 | | | 1.30 | %6 | | | 0.78 | %6 | | | 0.25 | % |
| | | | |
| | | | | | | | | | | | | | | | | | | | | | | | |
| Supplemental Data | | | | | | | | | | | | | | | | | | | | | | | | |
Net assets, end of period (000) | | $ | 2,282 | | | $ | 1,875 | | | $ | 1,138 | | | $ | 1,446 | | | $ | 1,028 | | | $ | 1,312 | |
| | | | |
Portfolio turnover rate | | | 21 | % | | | 36 | % | | | 156 | % | | | 102 | % | | | 119 | % | | | 156 | % |
| | | | |
| | 1 | | Consolidated Financial Highlights. |
| | 2 | | Based on average shares outstanding. |
| | 3 | | Distributions for annual periods determined in accordance with U.S. federal income tax regulations. |
| | 4 | | Where applicable, assumes the reinvestment of distributions. |
| | 5 | | Aggregate total return. |
| | 6 | | Excludes expenses incurred indirectly as a result of investments in underlying funds as follows: |
| | | | | | | | | | | | | | | | | | | | | | | | |
| | | Six Months
Ended
March 31,
2017 | | | Year Ended September 30, | |
| | | (Unaudited) | | | 2016 | | | 2015 | | | 2014 | | | 2013 | | | 2012 | |
Investments in underlying funds | | | — | | | | — | | | | 0.01 | % | | | 0.01 | % | | | 0.03 | % | | | — | |
| | 8 | | Includes recoupment of past waived and/or reimbursed fees. Excluding the recoupment of past waived and/or reimbursed fees, the ratios were as follows: |
| | | | | | | | | | | | | | | | | | | | | | | | |
| | | Six Months
Ended
March 31,
2017 | | | Year Ended September 30, | |
| | | (Unaudited) | | | 2016 | | | 2015 | | | 2014 | | | 2013 | | | 2012 | |
Expense ratios | | | — | | | | — | | | | — | | | | 1.67 | % | | | — | | | | 1.78 | % |
See Notes to Financial Statements.
| | | | | | |
| 36 | | BLACKROCK FUNDS | | MARCH 31, 2017 | | |
| | |
| Financial Highlights | | BlackRock Mid-Cap Growth Equity Portfolio |
| | | | | | | | | | | | | | | | | | | | | | | | |
| | | Institutional | |
| | | Six Months
Ended
March 31,
2017 | | | Year Ended September 30, | |
| | | (Unaudited) | | | 2016 | | | 2015 | | | 2014 | | | 2013 | | | 2012 | |
| | | | | | | | | | | | | | | | | | | | | | | | |
| Per Share Operating Performance | | | | | | | | | | | | | | | | | | | | | | | | |
Net asset value, beginning of period | | $ | 17.87 | | | $ | 16.42 | | | $ | 17.67 | | | $ | 18.22 | | | $ | 13.58 | | | $ | 11.10 | |
| | | | |
Net investment income (loss)1 | | | (0.04 | )2 | | | (0.12 | ) | | | (0.11 | ) | | | (0.12 | ) | | | 0.05 | | | | 0.04 | |
Net realized and unrealized gain | | | 1.68 | | | | 2.00 | | | | 0.77 | | | | 2.49 | | | | 4.59 | | | | 2.44 | |
| | | | |
Net increase from investment operations | | | 1.64 | | | | 1.88 | | | | 0.66 | | | | 2.37 | | | | 4.64 | | | | 2.48 | |
| | | | |
Distributions from net realized gain3 | | | — | | | | (0.43 | ) | | | (1.91 | ) | | | (2.92 | ) | | | — | | | | — | |
| | | | |
Net asset value, end of period | | $ | 19.51 | | | $ | 17.87 | | | $ | 16.42 | | | $ | 17.67 | | | $ | 18.22 | | | $ | 13.58 | |
| | | | |
| | | | | | | | | | | | | | | | | | | | | | | | |
| Total Return4 | | | | | | | | | | | | | | | | | | | | | | | | |
Based on net asset value | | | 9.18 | %5 | | | 11.60 | % | | | 4.37 | % | | | 14.70 | % | | | 34.17 | % | | | 22.34 | % |
| | | | |
| | | | | | | | | | | | | | | | | | | | | | | | |
| Ratios to Average Net Assets | | | | | | | | | | | | | | | | | | | | | | | | |
Total expenses6 | | | 1.11 | %7 | | | 1.11 | % | | | 1.06 | % | | | 1.11 | % | | | 1.13 | % | | | 1.11 | % |
| | | | |
Total expenses after fees waived, reimbursed and paid indirectly | | | 1.11 | %7 | | | 1.08 | % | | | 1.05 | % | | | 1.10 | % | | | 1.11 | % | | | 1.07 | % |
| | | | |
Net investment income (loss) | | | (0.43 | )%2,7 | | | (0.71 | )% | | | (0.61 | )% | | | (0.68 | )% | | | 0.30 | % | | | 0.27 | % |
| | | | |
| | | | | | | | | | | | | | | | | | | | | | | | |
| Supplemental Data | | | | | | | | | | | | | | | | | | | | | | | | |
Net assets, end of period (000) | | $ | 122,820 | | | $ | 99,759 | | | $ | 84,605 | | | $ | 33,448 | | | $ | 21,485 | | | $ | 18,526 | |
| | | | |
Portfolio turnover rate | | | 42 | % | | | 81 | % | | | 95 | % | | | 123 | % | | | 160 | % | | | 88 | % |
| | | | |
| | 1 | | Based on average shares outstanding. |
| | 2 | | Net investment income per share and the ratio of net investment income to average net assets includes $0.03 per share and 0.44%, respectively, resulting from a special dividend. |
| | 3 | | Distributions for annual periods determined in accordance with U.S. federal income tax regulations. |
| | 4 | | Where applicable, assumes the reinvestment of distributions. |
| | 5 | | Aggregate total return. |
| | 6 | | Includes recoupment of past waived and/or reimbursed fees. Excluding the recoupment of past waived and/or reimbursed fees, the ratios were as follows: |
| | | | | | | | | | | | | | | | | | | | | | | | |
| | | Six Months
Ended
March 31,
2017 | | | Year Ended September 30, | |
| | | (Unaudited) | | | 2016 | | | 2015 | | | 2014 | | | 2013 | | | 2012 | |
Expense ratios | | | 1.09 | % | | | 1.10 | % | | | 1.06 | % | | | 1.08 | % | | | 1.11 | % | | | 1.11 | % |
See Notes to Financial Statements.
| | | | | | |
| | | BLACKROCK FUNDS | | MARCH 31, 2017 | | 37 |
| | | | |
| Financial Highlights (continued) | | | BlackRock Mid-Cap Growth Equity Portfolio | |
| | | | | | | | | | | | | | | | | | | | | | | | |
| | | Service | |
| | | Six Months
Ended
March 31,
2017 | | | Year Ended September 30, | |
| | | (Unaudited) | | | 2016 | | | 2015 | | | 2014 | | | 2013 | | | 2012 | |
| | | | | | | | | | | | | | | | | | | | | | | | |
| Per Share Operating Performance | | | | | | | | | | | | | | | | | | | | | | | | |
Net asset value, beginning of period | | $ | 16.35 | | | $ | 15.00 | | | $ | 16.34 | | | $ | 17.05 | | | $ | 12.77 | | | $ | 10.49 | |
| | | | |
Net investment loss1 | | | (0.04 | )2 | | | (0.13 | ) | | | (0.16 | ) | | | (0.19 | ) | | | (0.02 | ) | | | (0.01 | ) |
Net realized and unrealized gain | | | 1.53 | | | | 1.82 | | | | 0.71 | | | | 2.31 | | | | 4.30 | | | | 2.29 | |
| | | | |
Net increase from investment operations | | | 1.49 | | | | 1.69 | | | | 0.55 | | | | 2.12 | | | | 4.28 | | | | 2.28 | |
| | | | |
Distributions from net realized gain3 | | | — | | | | (0.34 | ) | | | (1.89 | ) | | | (2.83 | ) | | | — | | | | — | |
| | | | |
Net asset value, end of period | | $ | 17.84 | | | $ | 16.35 | | | $ | 15.00 | | | $ | 16.34 | | | $ | 17.05 | | | $ | 12.77 | |
| | | | |
| | | | | | | | | | | | | | | | | | | | | | | | |
| Total Return4 | | | | | | | | | | | | | | | | | | | | | | | | |
Based on net asset value | | | 9.11 | %5 | | | 11.39 | % | | | 3.94 | % | | | 14.11 | % | | | 33.52 | % | | | 21.74 | % |
| | | | |
| | | | | | | | | | | | | | | | | | | | | | | | |
| Ratios to Average Net Assets | | | | | | | | | | | | | | | | | | | | | | | | |
Total expenses | | | 1.23 | %6 | | | 1.26 | %7 | | | 1.50 | %7 | | | 1.58 | %7 | | | 1.67 | %7 | | | 2.29 | % |
| | | | |
Total expenses after fees waived, reimbursed and paid indirectly | | | 1.22 | %6 | | | 1.25 | % | | | 1.48 | % | | | 1.58 | % | | | 1.58 | % | | | 1.58 | % |
| | | | |
Net investment loss | | | (0.46 | )%2,6 | | | (0.88 | )% | | | (1.00 | )% | | | (1.17 | )% | | | (0.15 | )% | | | (0.06 | )% |
| | | | |
| | | | | | | | | | | | | | | | | | | | | | | | |
| Supplemental Data | | | | | | | | | | | | | | | | | | | | | | | | |
Net assets, end of period (000) | | $ | 840 | | | $ | 1,343 | | | $ | 1,384 | | | $ | 3,838 | | | $ | 2,065 | | | $ | 1,865 | |
| | | | |
Portfolio turnover rate | | | 42 | % | | | 81 | % | | | 95 | % | | | 123 | % | | | 160 | % | | | 88 | % |
| | | | |
| | 1 | | Based on average shares outstanding. |
| | 2 | | Net investment income per share and the ratio of net investment income to average net assets includes $0.03 per share and 0.44%, respectively, resulting from a special dividend. |
| | 3 | | Distributions for annual periods determined in accordance with U.S. federal income tax regulations. |
| | 4 | | Where applicable, assumes the reinvestment of distributions. |
| | 5 | | Aggregate total return. |
| | 7 | | Includes recoupment of past waived and/or reimbursed fees. Excluding the recoupment of past waived and/or reimbursed fees, the ratios were as follows: |
| | | | | | | | | | | | | | | | | | | | | | | | |
| | | Six Months
Ended
March 31,
2017 | | | Year Ended September 30, | |
| | | (Unaudited) | | | 2016 | | | 2015 | | | 2014 | | | 2013 | | | 2012 | |
Expense ratios | | | — | | | | 1.24 | % | | | 1.42 | % | | | 1.33 | % | | | 1.51 | % | | | — | |
See Notes to Financial Statements.
| | | | | | |
| 38 | | BLACKROCK FUNDS | | MARCH 31, 2017 | | |
| | | | |
| Financial Highlights (continued) | | | BlackRock Mid-Cap Growth Equity Portfolio | |
| | | | | | | | | | | | | | | | | | | | | | | | |
| | | Investor A | |
| | | Six Months
Ended
March 31,
2017 | | | Year Ended September 30, | |
| | | (Unaudited) | | | 2016 | | | 2015 | | | 2014 | | | 2013 | | | 2012 | |
| | | | | | | | | | | | | | | | | | | | | | | | |
| Per Share Operating Performance | | | | | | | | | | | | | | | | | | | | | | | | |
Net asset value, beginning of period | | $ | 15.66 | | | $ | 14.43 | | | $ | 15.78 | | | $ | 16.56 | | | $ | 12.38 | | | $ | 10.15 | |
| | | | |
Net investment income (loss)1 | | | (0.05 | )2 | | | (0.15 | ) | | | (0.14 | ) | | | (0.16 | ) | | | 0.00 | 3 | | | (0.01 | ) |
Net realized and unrealized gain | | | 1.46 | | | | 1.76 | | | | 0.67 | | | | 2.24 | | | | 4.18 | | | | 2.24 | |
| | | | |
Net increase from investment operations | | | 1.41 | | | | 1.61 | | | | 0.53 | | | | 2.08 | | | | 4.18 | | | | 2.23 | |
| | | | |
Distributions from net realized gain4 | | | — | | | | (0.38 | ) | | | (1.88 | ) | | | (2.86 | ) | | | — | | | | — | |
| | | | |
Net asset value, end of period | | $ | 17.07 | | | $ | 15.66 | | | $ | 14.43 | | | $ | 15.78 | | | $ | 16.56 | | | $ | 12.38 | |
| | | | |
| | | | | | | | | | | | | | | | | | | | | | | | |
| Total Return5 | | | | | | | | | | | | | | | | | | | | | | | | |
Based on net asset value | | | 9.00 | %6 | | | 11.29 | % | | | 4.01 | % | | | 14.38 | % | | | 33.76 | % | | | 21.97 | % |
| | | | |
| | | | | | | | | | | | | | | | | | | | | | | | |
| Ratios to Average Net Assets | | | | | | | | | | | | | | | | | | | | | | | | |
Total expenses | | | 1.43 | %7,8 | | | 1.45 | % | | | 1.43 | %7 | | | 1.48 | % | | | 1.55 | % | | | 1.55 | % |
| | | | |
Total expenses after fees waived, reimbursed and paid indirectly | | | 1.39 | %8 | | | 1.39 | % | | | 1.39 | % | | | 1.39 | % | | | 1.39 | % | | | 1.39 | % |
| | | | |
Net investment income (loss) | | | (0.61 | )%2,8 | | | (1.02 | )% | | | (0.89 | )% | | | (1.01 | )% | | | 0.03 | % | | | (0.06 | )% |
| | | | |
| | | | | | | | | | | | | | | | | | | | | | | | |
| Supplemental Data | | | | | | | | | | | | | | | | | | | | | | | | |
Net assets, end of period (000) | | $ | 413,860 | | | $ | 394,544 | | | $ | 350,962 | | | $ | 315,762 | | | $ | 282,726 | | | $ | 237,748 | |
| | | | |
Portfolio turnover rate | | | 42 | % | | | 81 | % | | | 95 | % | | | 123 | % | | | 160 | % | | | 88 | % |
| | | | |
| | 1 | | Based on average shares outstanding. |
| | 2 | | Net investment income per share and the ratio of net investment income to average net assets includes $0.03 per share and 0.44%, respectively, resulting from a special dividend. |
| | 3 | | Amount is less than $0.005 per share. |
| | 4 | | Distributions for annual periods determined in accordance with U.S. federal income tax regulations. |
| | 5 | | Where applicable, excludes the effects of any sales charges and assumes the reinvestment of distributions. |
| | 6 | | Aggregate total return. |
| | 7 | | Includes recoupment of past waived and/or reimbursed fees. There was no financial impact to the expense ratios for the period ended March 31, 2017 and the year ended September 30, 2015. |
See Notes to Financial Statements.
| | | | | | |
| | | BLACKROCK FUNDS | | MARCH 31, 2017 | | 39 |
| | | | |
| Financial Highlights (continued) | | | BlackRock Mid-Cap Growth Equity Portfolio | |
| | | | | | | | | | | | | | | | | | | | | | | | |
| | | Investor B | |
| | | Six Months
Ended
March 31,
2017 | | | Year Ended September 30, | |
| | | (Unaudited) | | | 2016 | | | 2015 | | | 2014 | | | 2013 | | | 2012 | |
| | | | | | | | | | | | | | | | | | | | | | | | |
| Per Share Operating Performance | | | | | | | | | | | | | | | | | | | | | | | | |
Net asset value, beginning of period | | $ | 12.67 | | | $ | 11.77 | | | $ | 13.22 | | | $ | 14.27 | | | $ | 10.75 | | | $ | 8.88 | |
| | | | |
Net investment loss1 | | | (0.08 | )2 | | | (0.21 | ) | | | (0.21 | ) | | | (0.24 | ) | | | (0.08 | ) | | | (0.09 | ) |
Net realized and unrealized gain | | | 1.16 | | | | 1.42 | | | | 0.55 | | | | 1.90 | | | | 3.60 | | | | 1.96 | |
| | | | |
Net increase from investment operations | | | 1.08 | | | | 1.21 | | | | 0.34 | | | | 1.66 | | | | 3.52 | | | | 1.87 | |
| | | | |
Distributions from net realized gain3 | | | — | | | | (0.31 | ) | | | (1.79 | ) | | | (2.71 | ) | | | — | | | | — | |
| | | | |
Net asset value, end of period | | $ | 13.75 | | | $ | 12.67 | | | $ | 11.77 | | | $ | 13.22 | | | $ | 14.27 | | | $ | 10.75 | |
| | | | |
| | | | | | | | | | | | | | | | | | | | | | | | |
| Total Return4 | | | | | | | | | | | | | | | | | | | | | | | | |
Based on net asset value | | | 8.53 | %5 | | | 10.40 | % | | | 3.23 | % | | | 13.47 | % | | | 32.74 | % | | | 21.06 | % |
| | | | |
| | | | | | | | | | | | | | | | | | | | | | | | |
| Ratios to Average Net Assets | | | | | | | | | | | | | | | | | | | | | | | | |
Total expenses | | | 4.12 | %6 | | | 3.20 | % | | | 2.75 | % | | | 2.66 | % | | | 2.70 | % | | | 2.59 | % |
| | | | |
Total expenses after fees waived, reimbursed and paid indirectly | | | 2.16 | %6 | | | 2.16 | % | | | 2.16 | % | | | 2.16 | % | | | 2.16 | % | | | 2.16 | % |
| | | | |
Net investment loss | | | (1.25 | )%2,6 | | | (1.80 | )% | | | (1.65 | )% | | | (1.79 | )% | | | (0.66 | )% | | | (0.88 | )% |
| | | | |
| | | | | | | | | | | | | | | | | | | | | | | | |
| Supplemental Data | | | | | | | | | | | | | | | | | | | | | | | | |
Net assets, end of period (000) | | $ | 506 | | | $ | 1,178 | | | $ | 2,069 | | | $ | 3,313 | | | $ | 4,330 | | | $ | 5,123 | |
| | | | |
Portfolio turnover rate | | | 42 | % | | | 81 | % | | | 95 | % | | | 123 | % | | | 160 | % | | | 88 | % |
| | | | |
| | 1 | | Based on average shares outstanding. |
| | 2 | | Net investment income per share and the ratio of net investment income to average net assets includes $0.03 per share and 0.45%, respectively, resulting from a special dividend. |
| | 3 | | Distributions for annual periods determined in accordance with U.S. federal income tax regulations. |
| | 4 | | Where applicable, excludes the effects of any sales charges and assumes the reinvestment of distributions. |
| | 5 | | Aggregate total return. |
See Notes to Financial Statements.
| | | | | | |
| 40 | | BLACKROCK FUNDS | | MARCH 31, 2017 | | |
| | | | |
| Financial Highlights (continued) | | | BlackRock Mid-Cap Growth Equity Portfolio | |
| | | | | | | | | | | | | | | | | | | | | | | | |
| | | Investor C | |
| | | Six Months
Ended
March 31,
2017 | | | Year Ended September 30, | |
| | | (Unaudited) | | | | 2016 | | | | 2015 | | | | 2014 | | | | 2013 | | | | 2012 | |
| | | | | | | | | | | | | | | | | | | | | | | | |
| Per Share Operating Performance | | | | | | | | | | | | | | | | | | | | | | | | |
Net asset value, beginning of period | | $ | 12.55 | | | $ | 11.68 | | | $ | 13.16 | | | $ | 14.28 | | | $ | 10.75 | | | $ | 8.89 | |
| | | | |
Net investment loss1 | | | (0.08 | )2 | | | (0.20 | ) | | | (0.21 | ) | | | (0.23 | ) | | | (0.09 | ) | | | (0.08 | ) |
Net realized and unrealized gain | | | 1.16 | | | | 1.41 | | | | 0.55 | | | | 1.88 | | | | 3.62 | | | | 1.94 | |
| | | | |
Net increase from investment operations | | | 1.08 | | | | 1.21 | | | | 0.34 | | | | 1.65 | | | | 3.53 | | | | 1.86 | |
| | | | |
Distributions from net realized gain3 | | | — | | | | (0.34 | ) | | | (1.82 | ) | | | (2.77 | ) | | | — | | | | — | |
| | | | |
Net asset value, end of period | | $ | 13.63 | | | $ | 12.55 | | | $ | 11.68 | | | $ | 13.16 | | | $ | 14.28 | | | $ | 10.75 | |
| | | | |
| | | | | | | | | | | | | | | | | | | | | | | | |
| Total Return4 | | | | | | | | | | | | | | | | | | | | | | | | |
Based on net asset value | | | 8.61 | %5 | | | 10.48 | % | | | 3.23 | % | | | 13.42 | % | | | 32.84 | % | | | 20.92 | % |
| | | | |
| | | | | | | | | | | | | | | | | | | | | | | | |
| Ratios to Average Net Assets | | | | | | | | | | | | | | | | | | | | | | | | |
Total expenses | | | 2.15 | %6,7 | | | 2.14 | %7 | | | 2.16 | %7 | | | 2.17 | %7 | | | 2.23 | %7 | | | 2.31 | % |
| | | | |
Total expenses after fees waived, reimbursed and paid indirectly | | | 2.15 | %6 | | | 2.12 | % | | | 2.16 | % | | | 2.16 | % | | | 2.16 | % | | | 2.16 | % |
| | | | |
Net investment loss | | | (1.21 | )%2,6 | | | (1.75 | )% | | | (1.67 | )% | | | (1.77 | )% | | | (0.75 | )% | | | (0.81 | )% |
| | | | |
| | | | | | | | | | | | | | | | | | | | | | | | |
| Supplemental Data | | | | | | | | | | | | | | | | | | | | | | | | |
Net assets, end of period (000) | | $ | 54,891 | | | $ | 52,723 | | | $ | 44,719 | | | $ | 31,257 | | | $ | 23,959 | | | $ | 18,774 | |
| | | | |
Portfolio turnover rate | | | 42 | % | | | 81 | % | | | 95 | % | | | 123 | % | | | 160 | % | | | 88 | % |
| | | | |
| | 1 | | Based on average shares outstanding. |
| | 2 | | Net investment income per share and the ratio of net investment income to average net assets includes $0.03 per share and 0.44%, respectively, resulting from a special dividend. |
| | 3 | | Distributions for annual periods determined in accordance with U.S. federal income tax regulations. |
| | 4 | | Where applicable, excludes the effects of any sales charges and assumes the reinvestment of distributions. |
| | 5 | | Aggregate total return. |
| | 7 | | Includes recoupment of past waived and/or reimbursed fees. Excluding the recoupment of past waived and/or reimbursed fees, the ratios were as follows: |
| | | | | | | | | | | | | | | | | | | | | | | | |
| | | Six Months Ended March 31, 2017 | | | Year Ended September 30, | |
| | | (Unaudited) | | | 2016 | | | 2015 | | | 2014 | | | 2013 | | | 2012 | |
Expense ratios | | | 2.13 | % | | | 2.13 | % | | | 2.12 | % | | | 2.16 | % | | | 2.23 | % | | | — | |
See Notes to Financial Statements.
| | | | | | |
| | | BLACKROCK FUNDS | | MARCH 31, 2017 | | 41 |
| | | | |
| Financial Highlights (continued) | | | BlackRock Mid-Cap Growth Equity Portfolio | |
| | | | | | | | |
| | | Class K | |
| | | Six Months
Ended
March 31,
2017
(Unaudited) | | | Period
March 28,
20161 to
September 30,
2016 | |
| | | | | | | | |
| Per Share Operating Performance | | | | | | | | |
Net asset value, beginning of period | | $ | 17.88 | | | $ | 15.57 | |
| | | | |
Net investment loss2 | | | (0.07 | )3 | | | (0.05 | ) |
Net realized and unrealized gain | | | 1.72 | | | | 2.36 | |
| | | | |
Net increase from investment operations | | | 1.65 | | | | 2.31 | |
| | | | |
Net asset value, end of period | | $ | 19.53 | | | $ | 17.88 | |
| | | | |
| | | | | | | | |
| Total Return4 | | | | | | | | |
Based on net asset value | | | 9.23 | %5 | | | 14.84 | %5 |
| | | | |
| | | | | | | | |
| Ratios to Average Net Assets | | | | | | | | |
Total expenses | | | 0.97 | %6,7 | | | 0.98 | %7 |
| | | | |
Total expenses after fees waived, reimbursed and paid indirectly | | | 0.97 | %7 | | | 0.97 | %7 |
| | | | |
Net investment loss | | | (0.73 | )%3,7 | | | (0.59 | )%7 |
| | | | |
| | | | | | | | |
| Supplemental Data | | | | | | | | |
Net assets, end of period (000) | | $ | 2,341 | | | $ | 230 | |
| | | | |
Portfolio turnover rate | | | 42 | % | | | 81 | %8 |
| | | | |
| | 1 | | Commencement of operations. |
| | 2 | | Based on average shares outstanding. |
| | 3 | | Net investment income per share and the ratio of net investment income to average net assets includes $0.03 per share and 0.44%, respectively, resulting from a special dividend. |
| | 4 | | Where applicable, assumes the reinvestment of distributions. |
| | 5 | | Aggregate total return. |
| | 6 | | Includes recoupment of past waived and/or reimbursed fees. There was no financial impact to the expense ratios for the period ended March 31, 2017. |
| | 8 | | Portfolio turnover is representative of the Fund for the entire year. |
See Notes to Financial Statements.
| | | | | | |
| 42 | | BLACKROCK FUNDS | | MARCH 31, 2017 | | |
| | | | |
| Financial Highlights (concluded) | | | BlackRock Mid-Cap Growth Equity Portfolio | |
| | | | | | | | | | | | | | | | | | | | | | | | |
| | | Class R | |
| | | Six Months Ended March 31, 2017 | | | Year Ended September 30, | |
| | | (Unaudited) | | | | 2016 | | | | 2015 | | | | 2014 | | | | 2013 | | | | 2012 | |
| | | | | | | | | | | | | | | | | | | | | | | | |
| Per Share Operating Performance | | | | | | | | | | | | | | | | | | | | | | | | |
Net asset value, beginning of period | | $ | 15.47 | | | $ | 14.27 | | | $ | 15.63 | | | $ | 16.44 | | | $ | 12.32 | | | $ | 10.13 | |
| | | | |
Net investment loss1 | | | (0.07 | )2 | | | (0.18 | ) | | | (0.18 | ) | | | (0.20 | ) | | | (0.04 | ) | | | (0.03 | ) |
Net realized and unrealized gain | | | 1.44 | | | | 1.72 | | | | 0.68 | | | | 2.22 | | | | 4.16 | | | | 2.22 | |
| | | | |
Net increase from investment operations | | | 1.37 | | | | 1.54 | | | | 0.50 | | | | 2.02 | | | | 4.12 | | | | 2.19 | |
| | | | |
Distributions from net realized gain3 | | | — | | | | (0.34 | ) | | | (1.86 | ) | | | (2.83 | ) | | | — | | | | — | |
| | | | |
Net asset value, end of period | | $ | 16.84 | | | $ | 15.47 | | | $ | 14.27 | | | $ | 15.63 | | | $ | 16.44 | | | $ | 12.32 | |
| | | | |
| | | | | | | | | | | | | | | | | | | | | | | | |
| Total Return4 | | | | | | | | | | | | | | | | | | | | | | | | |
Based on net asset value | | | 8.86 | %5 | | | 10.94 | % | | | 3.79 | % | | | 14.03 | % | | | 33.44 | % | | | 21.62 | % |
| | | | |
| | | | | | | | | | | | | | | | | | | | | | | | |
| Ratios to Average Net Assets | | | | | | | | | | | | | | | | | | | | | | | | |
Total expenses6 | | | 1.78 | %7 | | | 1.78 | % | | | 1.73 | % | | | 1.74 | %6 | | | 1.74 | % | | | 1.84 | % |
| | | | |
Total expenses after fees waived, reimbursed and paid indirectly | | | 1.65 | %7 | | | 1.65 | % | | | 1.65 | % | | | 1.65 | % | | | 1.65 | % | | | 1.65 | % |
| | | | |
Net investment loss | | | (0.88 | )%2,7 | | | (1.28 | )% | | | (1.15 | )% | | | (1.26 | )% | | | (0.26 | )% | | | (0.28 | )% |
| | | | |
| | | | | | | | | | | | | | | | | | | | | | | | |
| Supplemental Data | | | | | | | | | | | | | | | | | | | | | | | | |
Net assets, end of period (000) | | $ | 8,342 | | | $ | 7,646 | | | $ | 7,495 | | | $ | 7,704 | | | $ | 9,352 | | | $ | 6,663 | |
| | | | |
Portfolio turnover rate | | | 42 | % | | | 81 | % | | | 95 | % | | | 123 | % | | | 160 | % | | | 88 | % |
| | | | |
| | 1 | | Based on average shares outstanding. |
| | 2 | | Net investment income per share and the ratio of net investment income to average net assets includes $0.03 per share and 0.44%, respectively, resulting from a special dividend. |
| | 3 | | Distributions for annual periods determined in accordance with U.S. federal income tax regulations. |
| | 4 | | Where applicable, assumes the reinvestment of distributions. |
| | 5 | | Aggregate total return. |
| | 6 | | Includes recoupment of past waived and/or reimbursed fees with no financial impact to the expense ratios. |
See Notes to Financial Statements.
| | | | | | |
| | | BLACKROCK FUNDS | | MARCH 31, 2017 | | 43 |
| | | | |
| Financial Highlights | | | BlackRock Advantage Small Cap Growth Fund | |
| | | | | | | | | | | | | | | | | | | | | | | | |
| | | Institutional | |
| | | Six Months Ended March 31, 2017 | | | Year Ended September 30, | |
| | | (Unaudited) | | | | 2016 | | | | 2015 | | | | 2014 | | | | 2013 | | | | 2012 | |
| | | | | | | | | | | | | | | | | | | | | | | | |
| Per Share Operating Performance | | | | | | | | | | | | | | | | | | | | | | | | |
Net asset value, beginning of period | | $ | 17.94 | | | $ | 17.82 | | | $ | 22.28 | | | $ | 29.86 | | | $ | 26.67 | | | $ | 20.09 | |
| | | | |
Net investment income (loss)1 | | | 0.02 | | | | 0.03 | | | | 0.02 | | | | (0.06 | ) | | | 0.01 | | | | 0.04 | |
Net realized and unrealized gain | | | 1.94 | | | | 1.11 | | | | 0.49 | | | | 2.58 | | | | 5.90 | | | | 7.14 | |
| | | | |
Net increase from investment operations | | | 1.96 | | | | 1.14 | | | | 0.51 | | | | 2.52 | | | | 5.91 | | | | 7.18 | |
| | | | |
Distributions:2 | | | | | | | | | | | | | | | | | | | | | | | | |
From net investment income | | | (0.01 | ) | | | — | | | | — | | | | — | | | | (0.07 | ) | | | — | |
From net realized gain | | | — | | | | (1.02 | ) | | | (4.97 | ) | | | (10.10 | ) | | | (2.65 | ) | | | (0.60 | ) |
| | | | |
Total distributions | | | (0.01 | ) | | | (1.02 | ) | | | (4.97 | ) | | | (10.10 | ) | | | (2.72 | ) | | | (0.60 | ) |
| | | | |
Net asset value, end of period | | $ | 19.89 | | | $ | 17.94 | | | $ | 17.82 | | | $ | 22.28 | | | $ | 29.86 | | | $ | 26.67 | |
| | | | |
| | | | | | | | | | | | | | | | | | | | | | | | |
| Total Return3 | | | | | | | | | | | | | | | | | | | | | | | | |
Based on net asset value | | | 10.92 | %4 | | | 6.81 | % | | | 2.35 | % | | | 8.90 | % | | | 25.36 | % | | | 36.16 | % |
| | | | |
| | | | | | | | | | | | | | | | | | | | | | | | |
| Ratios to Average Net Assets | | | | | | | | | | | | | | | | | | | | | | | | |
Total expenses | | | 0.77 | %5 | | | 0.86 | % | | | 0.82 | % | | | 0.87 | %6 | | | 0.82 | % | | | 0.82 | % |
| | | | |
Total expenses after fees waived, reimbursed and paid indirectly | | | 0.61 | %5 | | | 0.86 | % | | | 0.82 | % | | | 0.87 | % | | | 0.82 | % | | | 0.82 | % |
| | | | |
Net investment income (loss) | | | 0.25 | %5 | | | 0.20 | % | | | 0.12 | % | | | (0.24 | )% | | | 0.06 | % | | | 0.15 | % |
| | | | |
| | | | | | | | | | | | | | | | | | | | | | | | |
| Supplemental Data | | | | | | | | | | | | | | | | | | | | | | | | |
Net assets, end of period (000) | | $ | 501,610 | | | $ | 490,215 | | | $ | 503,423 | | | $ | 454,928 | | | $ | 862,261 | | | $ | 979,582 | |
| | | | |
Portfolio turnover rate | | | 47 | % | | | 103 | % | | | 137 | % | | | 132 | % | | | 175 | % | | | 147 | % |
| | | | |
| | 1 | | Based on average shares outstanding. |
| | 2 | | Distributions for annual periods determined in accordance with U.S. federal income tax regulations. |
| | 3 | | Where applicable, assumes the reinvestment of distributions. |
| | 4 | | Aggregate total return. |
| | 6 | | Includes recoupment of past waived and/or reimbursed fees with no financial impact to the expense ratios. |
See Notes to Financial Statements.
| | | | | | |
| 44 | | BLACKROCK FUNDS | | MARCH 31, 2017 | | |
| | | | |
| Financial Highlights (continued) | | | BlackRock Advantage Small Cap Growth Fund | |
| | | | | | | | | | | | | | | | | | | | | | | | |
| | | Service | |
| | | Six Months Ended March 31, 2017 | | | Year Ended September 30, | |
| | | (Unaudited) | | | | 2016 | | | | 2015 | | | | 2014 | | | | 2013 | | | | 2012 | |
| | | | | | | | | | | | | | | | | | | | | | | | |
| Per Share Operating Performance | | | | | | | | | | | | | | | | | | | | | | | | |
Net asset value, beginning of period | | $ | 15.53 | | | $ | 15.55 | | | $ | 20.05 | | | $ | 27.81 | | | $ | 25.01 | | | $ | 18.93 | |
| | | | |
Net investment loss1 | | | (0.00 | )2 | | | (0.01 | ) | | | (0.03 | ) | | | (0.12 | ) | | | (0.06 | ) | | | (0.04 | ) |
Net realized and unrealized gain | | | 1.67 | | | | 0.97 | | | | 0.43 | | | | 2.40 | | | | 5.49 | | | | 6.72 | |
| | | | |
Net increase from investment operations | | | 1.67 | | | | 0.96 | | | | 0.40 | | | | 2.28 | | | | 5.43 | | | | 6.68 | |
| | | | |
Distributions from net realized gain3 | | | — | | | | (0.98 | ) | | | (4.90 | ) | | | (10.04 | ) | | | (2.63 | ) | | | (0.60 | ) |
| | | | |
Net asset value, end of period | | $ | 17.20 | | | $ | 15.53 | | | $ | 15.55 | | | $ | 20.05 | | | $ | 27.81 | | | $ | 25.01 | |
| | | | |
| | | | | | | | | | | | | | | | | | | | | | | | |
| Total Return4 | | | | | | | | | | | | | | | | | | | | | | | | |
Based on net asset value | | | 10.75 | %5 | | | 6.57 | % | | | 2.00 | % | | | 8.62 | % | | | 24.96 | % | | | 35.72 | % |
| | | | |
| | | | | | | | | | | | | | | | | | | | | | | | |
| Ratios to Average Net Assets | | | | | | | | | | | | | | | | | | | | | | | | |
Total expenses | | | 1.05 | %6 | | | 1.13 | %7 | | | 1.12 | % | | | 1.12 | % | | | 1.12 | % | | | 1.20 | % |
| | | | |
Total expenses after fees waived, reimbursed and paid indirectly | | | 0.88 | %6 | | | 1.13 | % | | | 1.12 | % | | | 1.12 | % | | | 1.12 | % | | | 1.17 | % |
| | | | |
Net investment loss | | | (0.03 | )%6 | | | (0.07 | )% | | | (0.17 | )% | | | (0.53 | )% | | | (0.25 | )% | | | (0.15 | )% |
| | | | |
| | | | | | | | | | | | | | | | | | | | | | | | |
| Supplemental Data | | | | | | | | | | | | | | | | | | | | | | | | |
Net assets, end of period (000) | | $ | 9,470 | | | $ | 12,054 | | | $ | 19,596 | | | $ | 23,621 | | | $ | 24,792 | | | $ | 29,281 | |
| | | | |
Portfolio turnover rate | | | 47 | % | | | 103 | % | | | 137 | % | | | 132 | % | | | 175 | % | | | 147 | % |
| | | | |
| | 1 | | Based on average shares outstanding. |
| | 2 | | Amount is greater than $(0.005) per share. |
| | 3 | | Distributions for annual periods determined in accordance with U.S. federal income tax regulations. |
| | 4 | | Where applicable, assumes the reinvestment of distributions. |
| | 5 | | Aggregate total return. |
| | 7 | | Includes recoupment of past waived and/or reimbursed fees with no financial impact to the expense ratios. |
See Notes to Financial Statements.
| | | | | | |
| | | BLACKROCK FUNDS | | MARCH 31, 2017 | | 45 |
| | | | |
| Financial Highlights (continued) | | | BlackRock Advantage Small Cap Growth Fund | |
| | | | | | | | | | | | | | | | | | | | | | | | |
| | | Investor A | |
| | | Six Months Ended March 31, 2017 | | | Year Ended September 30, | |
| | | (Unaudited) | | | | 2016 | | | | 2015 | | | | 2014 | | | | 2013 | | | | 2012 | |
| | | | | | | | | | | | | | | | | | | | | | | | |
| Per Share Operating Performance | | | | | | | | | | | | | | | | | | | | | | | | |
Net asset value, beginning of period | | $ | 14.28 | | | $ | 14.38 | | | $ | 18.91 | | | $ | 26.75 | | | $ | 24.17 | | | $ | 18.31 | |
| | | | |
Net investment loss1 | | | (0.00 | )2 | | | (0.01 | ) | | | (0.03 | ) | | | (0.12 | ) | | | (0.06 | ) | | | (0.04 | ) |
Net realized and unrealized gain | | | 1.53 | | | | 0.88 | | | | 0.41 | | | | 2.31 | | | | 5.27 | | | | 6.50 | |
| | | | |
Net increase from investment operations | | | 1.53 | | | | 0.87 | | | | 0.38 | | | | 2.19 | | | | 5.21 | | | | 6.46 | |
| | | | |
Distributions from net realized gain3 | | | — | | | | (0.97 | ) | | | (4.91 | ) | | | (10.03 | ) | | | (2.63 | ) | | | (0.60 | ) |
| | | | |
Net asset value, end of period | | $ | 15.81 | | | $ | 14.28 | | | $ | 14.38 | | | $ | 18.91 | | | $ | 26.75 | | | $ | 24.17 | |
| | | | |
| | | | | | | | | | | | | | | | | | | | | | | | |
| Total Return4 | | | | | | | | | | | | | | | | | | | | | | | | |
Based on net asset value | | | 10.71 | %5 | | | 6.57 | % | | | 2.01 | % | | | 8.60 | % | | | 24.91 | % | | | 35.73 | % |
| | | | |
| | | | | | | | | | | | | | | | | | | | | | | | |
| Ratios to Average Net Assets | | | | | | | | | | | | | | | | | | | | | | | | |
Total expenses | | | 1.09 | %6 | | | 1.14 | % | | | 1.13 | % | | | 1.15 | % | | | 1.14 | % | | | 1.17 | % |
| | | | |
Total expenses after fees waived, reimbursed and paid indirectly | | | 0.89 | %6 | | | 1.14 | % | | | 1.13 | % | | | 1.15 | % | | | 1.14 | % | | | 1.17 | % |
| | | | |
Net investment loss | | | (0.03 | )%6 | | | (0.09 | )% | | | (0.17 | )% | | | (0.56 | )% | | | (0.25 | )% | | | (0.18 | )% |
| | | | |
| | | | | | | | | | | | | | | | | | | | | | | | |
| Supplemental Data | | | | | | | | | | | | | | | | | | | | | | | | |
Net assets, end of period (000) | | $ | 197,545 | | | $ | 250,357 | | | $ | 255,692 | | | $ | 282,684 | | | $ | 332,978 | | | $ | 352,073 | |
| | | | |
Portfolio turnover rate | | | 47 | % | | | 103 | % | | | 137 | % | | | 132 | % | | | 175 | % | | | 147 | % |
| | | | |
| | 1 | | Based on average shares outstanding. |
| | 2 | | Amount is greater than $(0.005) per share. |
| | 3 | | Distributions for annual periods determined in accordance with U.S. federal income tax regulations. |
| | 4 | | Where applicable, excludes the effects of any sales charges and assumes the reinvestment of distributions. |
| | 5 | | Aggregate total return. |
See Notes to Financial Statements.
| | | | | | |
| 46 | | BLACKROCK FUNDS | | MARCH 31, 2017 | | |
| | | | |
| Financial Highlights (concluded) | | | BlackRock Advantage Small Cap Growth Fund | |
| | | | | | | | | | | | | | | | | | | | | | | | |
| | | Investor C | |
| | | Six Months Ended March 31, 2017 | | | Year Ended September 30, | |
| | | (Unaudited) | | | | 2016 | | | | 2015 | | | | 2014 | | | | 2013 | | | | 2012 | |
| | | | | | | | | | | | | | | | | | | | | | | | |
| Per Share Operating Performance | | | | | | | | | | | | | | | | | | | | | | | | |
Net asset value, beginning of period | | $ | 8.88 | | | $ | 9.37 | | | $ | 13.99 | | | $ | 22.23 | | | $ | 20.50 | | | $ | 15.73 | |
| | | | |
Net investment loss1 | | | (0.04 | ) | | | (0.08 | ) | | | (0.10 | ) | | | (0.21 | ) | | | (0.21 | ) | | | (0.19 | ) |
Net realized and unrealized gain | | | 0.96 | | | | 0.56 | | | | 0.30 | | | | 1.89 | | | | 4.38 | | | | 5.56 | |
| | | | |
Net increase from investment operations | | | 0.92 | | | | 0.48 | | | | 0.20 | | | | 1.68 | | | | 4.17 | | | | 5.37 | |
| | | | |
Distributions from net realized gain2 | | | — | | | | (0.97 | ) | | | (4.82 | ) | | | (9.92 | ) | | | (2.44 | ) | | | (0.60 | ) |
| | | | |
Net asset value, end of period | | $ | 9.80 | | | $ | 8.88 | | | $ | 9.37 | | | $ | 13.99 | | | $ | 22.23 | | | $ | 20.50 | |
| | | | |
| | | | | | | | | | | | | | | | | | | | | | | | |
| Total Return3 | | | | | | | | | | | | | | | | | | | | | | | | |
Based on net asset value | | | 10.36 | %4 | | | 5.72 | % | | | 1.19 | % | | | 7.73 | % | | | 23.91 | % | | | 34.63 | % |
| | | | |
| | | | | | | | | | | | | | | | | | | | | | | | |
| Ratios to Average Net Assets | | | | | | | | | | | | | | | | | | | | | | | | |
Total expenses | | | 1.87 | %5 | | | 1.95 | % | | | 1.91 | % | | | 1.93 | % | | | 1.95 | % | | | 1.99 | % |
| | | | |
Total expenses after fees waived, reimbursed and paid indirectly | | | 1.64 | %5 | | | 1.95 | % | | | 1.91 | % | | | 1.93 | % | | | 1.95 | % | | | 1.99 | % |
| | | | |
Net investment loss | | | (0.78 | )%5 | | | (0.90 | )% | | | (0.96 | )% | | | (1.33 | )% | | | (1.06 | )% | | | (0.99 | )% |
| | | | |
| | | | | | | | | | | | | | | | | | | | | | | | |
| Supplemental Data | | | | | | | | | | | | | | | | | | | | | | | | |
Net assets, end of period (000) | | $ | 23,173 | | | $ | 23,689 | | | $ | 28,109 | | | $ | 32,598 | | | $ | 33,193 | | | $ | 28,787 | |
| | | | |
Portfolio turnover rate | | | 47 | % | | | 103 | % | | | 137 | % | | | 132 | % | | | 175 | % | | | 147 | % |
| | | | |
| | 1 | | Based on average shares outstanding. |
| | 2 | | Distributions for annual periods determined in accordance with U.S. federal income tax regulations. |
| | 3 | | Where applicable, excludes the effects of any sales charges and assumes the reinvestment of distributions. |
| | 4 | | Aggregate total return. |
See Notes to Financial Statements.
| | | | | | |
| | | BLACKROCK FUNDS | | MARCH 31, 2017 | | 47 |
| | | | |
| Notes to Financial Statements (Unaudited) | | | | |
1. Organization:
BlackRock FundsSM (the “Trust”) is registered under the Investment Company Act of 1940, as amended (the “1940 Act”), as an open-end management investment company. The Trust is organized as a Massachusetts business trust. The following are referred to herein collectively as the “Funds” or individually, a “Fund”:
| | | | |
| Fund Name | | Herein Referred To As | | Diversification Classification |
BlackRock Flexible Equity Fund | | Flexible Equity | | Diversified |
BlackRock Mid-Cap Growth Equity Portfolio | | Mid-Cap Growth Equity | | Diversified |
BlackRock Advantage Small Cap Growth Fund | | Advantage Small Cap Growth | | Diversified |
Effective February 15, 2017, BlackRock Small Cap Growth Equity Portfolio changed its name to BlackRock Advantage Small Cap Growth Fund.
Each Fund offers multiple classes of shares. All classes of shares have identical voting, dividend, liquidation and other rights and are subject to the same terms and conditions, except that certain classes bear expenses related to the shareholder servicing and distribution of such shares. Institutional, Service and Class K Shares are sold only to certain eligible investors. Class R Shares are available only to certain employer-sponsored retirement plans. Investor A and Investor C Shares are generally available through financial intermediaries. Investor B Shares are available only through exchanges and dividend and capital gain reinvestments by existing shareholders, and for purchase by certain employer-sponsored retirement plans. Each class has exclusive voting rights with respect to matters relating to its shareholder servicing and distribution expenditures (except that Investor B shareholders may vote on material changes to the Investor A distribution and service plan).
| | | | | | |
| Share Class | | Initial Sales Charge | | CDSC | | Conversion Privilege |
Institutional, Service, Class K and Class R Shares | | No | | No | | None |
Investor A Shares | | Yes | | No1 | | None |
Investor B Shares | | No | | Yes | | To Investor A Shares after approximately 8 years |
Investor C Shares | | No | | Yes | | None |
| | 1 | | Investor A Shares may be subject to a contingent deferred sales charge (“CDSC”) for certain redemptions where no initial sales charge was paid at the time of purchase. |
The Funds, together with certain other registered investment companies advised by BlackRock Advisors, LLC (the “Manager”) or its affiliates, are included in a complex of open-end funds referred to as the Equity-Liquidity Complex.
Basis of Consolidation: The accompanying consolidated financial statements of Flexible Equity include the account of BlackRock Flexible Equity Fund Subsidiary, Ltd. (the “Subsidiary”), which is a wholly-owned subsidiary of Flexible Equity and primarily invests in commodity-related instruments. The Subsidiary enables Flexible Equity to hold these commodity-related instruments and satisfy regulated investment company tax requirements. Flexible Equity may invest up to 25% of its total assets in the Subsidiary. As of March 31, 2017, there were no net assets in the Subsidiary. Intercompany accounts and transactions, if any, have been eliminated. The Subsidiary is subject to the same investment policies and restrictions that apply to Flexible Equity, except that the Subsidiary may invest without limitation in commodity-related instruments.
2. Significant Accounting Policies:
The financial statements are prepared in conformity with accounting principles generally accepted in the United States of America (“U.S. GAAP”), which may require management to make estimates and assumptions that affect the reported amounts of assets and liabilities in the financial statements, disclosure of contingent assets and liabilities at the date of the financial statements and the reported amounts of increases and decreases in net assets from operations during the reporting period. Actual results could differ from those estimates. Each Fund is considered an investment company under U.S. GAAP and follows the accounting and reporting guidance applicable to investment companies. Below is a summary of significant accounting policies:
Foreign Currency: Each Fund’s books and records are maintained in U.S. dollars. Purchases and sales of investments are recorded at the rates of exchange prevailing on the respective dates of such transactions. Generally, when the U.S. dollar rises in value against a foreign currency, the investments denominated in that currency will lose value; the opposite effect occurs if the U.S. dollar falls in relative value.
Each Fund does not isolate the portion of the results of operations arising as a result of changes in the exchange rates from the changes in the market prices of investments held or sold for financial reporting purposes. Accordingly, the effects of changes in exchange rates on investments are not segregated in the Statements of Operations from the effects of changes in market prices of those investments, but are included as a component of net realized and unrealized gain (loss) from investments. Each Fund reports realized currency gains (losses) on foreign currency related transactions as components of net realized gain (loss) for financial reporting purposes, whereas such components are generally treated as ordinary income for federal income tax purposes.
Segregation and Collateralization: In cases where a Fund enters into certain investments (e.g., futures contracts), that would be treated as “senior securities” for 1940 Act purposes, a Fund may segregate or designate on its books and records cash or liquid assets having a market value at least
| | | | | | |
| 48 | | BLACKROCK FUNDS | | MARCH 31, 2017 | | |
| | | | |
| Notes to Financial Statements (continued) | | | | |
equal to the amount of its future obligations under such investments. Doing so allows the investment to be excluded from treatment as a “senior security.” Furthermore, if required by an exchange or counterparty agreement, the Funds may be required to deliver/deposit cash and/or securities to/with an exchange, or broker-dealer or custodian as collateral for certain investments or obligations.
Investment Transactions and Investment Income: For financial reporting purposes, investment transactions are recorded on the dates the transactions are entered into (the trade dates). Realized gains and losses on investment transactions are determined on the identified cost basis. Dividend income is recorded on the ex-dividend date. Dividends from foreign securities where the ex-dividend date may have passed are subsequently recorded when the Funds are informed of the ex-dividend date. Under the applicable foreign tax laws, a withholding tax at various rates may be imposed on capital gains, dividends and interest. Upon notification from issuers, some of the dividend income received from a real estate investment trust may be redesignated as a reduction of cost of the related investment and/or realized gain. Income, expenses and realized and unrealized gains and losses are allocated daily to each class based on its relative net assets.
Distributions: Distributions paid by the Funds are recorded on the ex-dividend date. The character and timing of distributions are determined in accordance with U.S. federal income tax regulations, which may differ from U.S. GAAP.
Net income and realized gains from investments held by the Subsidiary are treated as ordinary income for tax purposes. If a net loss is realized by the Subsidiary in any taxable year, the loss will generally not be available to offset Flexible Equity ordinary income and/or capital gains for that year.
Offering Costs: Offering costs are amortized over a 12-month period beginning with the commencement of operations.
Recent Accounting Standards: In April 2015, the Financial Accounting Standards Board issued “Disclosures for Investments in Certain Entities that Calculate Net Asset Value (“NAV”) per Share” which eliminates the requirement to categorize investments within the fair value hierarchy when fair value is based on the NAV per share and no quoted market value is available. As of March 31, 2017, certain investments of the Fund were valued using NAV per share as no quoted market value is available and therefore have been excluded from the fair value hierarchy.
In November 2016, the Financial Accounting Standards Board issued Accounting Standards Update “Restricted Cash” which will require entities to include the total of cash, cash equivalents, restricted cash, and restricted cash equivalents in the beginning and ending cash balances in the Statements of Cash Flows. The guidance will be applied retrospectively and is effective for fiscal years beginning after December 15, 2017, and interim periods within those years. Management is evaluating the impact, if any, of this guidance on the Funds’ presentation in the Statements of Cash Flows.
Indemnifications: In the normal course of business, a Fund enters into contracts that contain a variety of representations that provide general indemnification. A Fund’s maximum exposure under these arrangements is unknown because it involves future potential claims against a Fund, which cannot be predicted with any certainty.
Other: Expenses directly related to a Fund or its classes are charged to that Fund or the applicable class. Other operating expenses shared by several funds, including other funds managed by the Manager, are prorated among those funds on the basis of relative net assets or other appropriate methods. Expenses directly related to the Funds and other shared expenses prorated to the Funds are allocated daily to each class based on its relative net assets or other appropriate methods.
The Funds have an arrangement with their custodian whereby credits are earned on uninvested cash balances, which could be used to reduce custody fees and/or overdraft charges. The Funds may incur charges on certain uninvested cash balances and overdrafts, subject to certain conditions.
3. Investment Valuation and Fair Value Measurements:
Investment Valuation Policies: The Funds’ investments are valued at fair value (also referred to as “market value” within the financial statements) as of the close of trading on the New York Stock Exchange (“NYSE”) (generally 4:00 p.m., Eastern time). U.S. GAAP defines fair value as the price the Funds would receive to sell an asset or pay to transfer a liability in an orderly transaction between market participants at the measurement date. The Funds determine the fair values of their financial instruments using various independent dealers or pricing services under policies approved by the Board of Trustees of the Trust (the “Board”). The BlackRock Global Valuation Methodologies Committee (the “Global Valuation Committee”) is the committee formed by management to develop global pricing policies and procedures and to oversee the pricing function for all financial instruments.
Fair Value Inputs and Methodologies: The following methods and inputs are used to establish the fair value of each Fund’s assets and liabilities:
| | • | | Equity investments traded on a recognized securities exchange are valued at the official closing price each day, if available. For equity investments traded on more than one exchange, the official closing price on the exchange where the stock is primarily traded is used. Equity investments traded on a recognized exchange for which there were no sales on that day may be valued at the last available bid (long positions) or ask (short positions) price. |
| | | | | | |
| | | BLACKROCK FUNDS | | MARCH 31, 2017 | | 49 |
| | | | |
| Notes to Financial Statements (continued) | | | | |
| | • | | Generally, trading in foreign instruments is substantially completed each day at various times prior to the close of trading on the NYSE. Occasionally, events affecting the values of such instruments may occur between the foreign market close and the close of trading on the NYSE that may not be reflected in the computation of the Funds’ net assets. Each business day, the Funds use a pricing service to assist with the valuation of certain foreign exchange-traded equity securities and foreign exchange-traded and over-the-counter (“OTC”) options (the “Systematic Fair Value Price”). Using current market factors, the Systematic Fair Value Price is designed to value such foreign securities and foreign options at fair value as of the close of trading on the NYSE, which follows the close of the local markets. |
| | • | | Investments in open-end U.S. mutual funds are valued at net asset value each business day. |
| | • | | The Funds value their investment in SL Liquidity Series, LLC, Money Market Series (the “Money Market Series”) at fair value, which is ordinarily based upon their pro rata ownership in the underlying fund’s net assets. The Money Market Series seeks current income consistent with maintaining liquidity and preserving capital. Although the Money Market Series is not registered under the 1940 Act, its investments may follow the parameters of investments by a money market fund that is subject to Rule 2a-7 under the 1940 Act. |
| | • | | Futures contracts traded on exchanges are valued at their last sale price. |
| | • | | Securities and other assets and liabilities denominated in foreign currencies are translated into U.S. dollars using exchange rates determined as of the close of trading on the NYSE. Forward foreign currency exchange contracts are valued at the mean between the bid and ask prices and are determined as of the close of trading on the NYSE. Interpolated values are derived when the settlement date of the contract is an interim date for which quotations are not available. |
If events (e.g., a company announcement, market volatility or a natural disaster) occur that are expected to materially affect the value of such investments, or in the event that the application of these methods of valuation results in a price for an investment that is deemed not to be representative of the market value of such investment, or if a price is not available, the investment will be valued by the Global Valuation Committee, or its delegate, in accordance with a policy approved by the Board as reflecting fair value (“Fair Valued Investments”). The fair valuation approaches that may be used by the Global Valuation Committee will include Market approach, Income approach and Cost approach. Valuation techniques such as discounted cash flow, use of market comparables and matrix pricing are types of valuation approaches and typically used in determining fair value. When determining the price for Fair Valued Investments, the Global Valuation Committee, or its delegate, seeks to determine the price that each Fund might reasonably expect to receive or pay from the current sale or purchase of that asset or liability in an arm’s-length transaction. Fair value determinations shall be based upon all available factors that the Global Valuation Committee, or its delegate, deems relevant and consistent with the principles of fair value measurement.
The Global Valuation Committee, or its delegate, employs various methods for calibrating valuation approaches for investments where an active market does not exist, including regular due diligence of each Fund’s pricing vendors, regular reviews of key inputs and assumptions, transactional back-testing or disposition analysis to compare unrealized gains and losses to realized gains and losses, reviews of missing or stale prices and large movements in market values and reviews of any market related activity. The pricing of all Fair Valued Investments is subsequently reported to the Board or a committee thereof on a quarterly basis. As a result of the inherent uncertainty in valuation of these investments, the fair values may differ from the values that would have been used had an active market existed.
For investments in equity or debt issued by privately-held companies or funds (“Private Company” or collectively, the “Private Companies”) and other Fair Valued Investments, the fair valuation approaches that are used by third party pricing services utilize one or a combination of, but not limited to, the following inputs.
| | | | |
| | | Standard Inputs Generally Considered By Third Party Pricing Services |
| | |
Market approach | | (i) | | recent market transactions, including subsequent rounds of financing, in the underlying investment or comparable issuers; |
| | (ii) | | recapitalizations and other transactions across the capital structure; and |
| | | (iii) | | market multiples of comparable issuers. |
| | |
Income approach | | (i) | | future cash flows discounted to present and adjusted as appropriate for liquidity, credit, and/or market risks; |
| | (ii) | | quoted prices for similar investments or assets in active markets; and |
| | | (iii) | | other risk factors, such as interest rates, yield curves, volatilities, prepayment speeds, loss severities, credit risks, recovery rates, liquidation amounts and/or default rates. |
| | | | | | |
| 50 | | BLACKROCK FUNDS | | MARCH 31, 2017 | | |
| | | | |
| Notes to Financial Statements (continued) | | | | |
| | | | |
Cost approach | | (i) | | audited or unaudited financial statements, investor communications and financial or operational metrics issued by the Private Company; |
| | (ii) | | changes in the valuation of relevant indices or publicly traded companies comparable to the Private Company; |
| | (iii) | | relevant news and other public sources; and |
| | | (iv) | | known secondary market transactions in the Private Company’s interests and merger or acquisition activity in companies comparable to the Private Company. |
Investments in series of preferred stock issued by Private Companies are typically valued utilizing Market approach in determining the enterprise value of the company. Such investments often contain rights and preferences that differ from other series of preferred and common stock of the same issuer. Valuation techniques such as an option pricing model (“OPM”), a probability weighted expected return model (“PWERM”) or a hybrid of those techniques are used in allocating enterprise value of the company, as deemed appropriate under the circumstances. The use of OPM and PWERM techniques involve a determination of the exit scenarios of the investment in order to appropriately allocate the enterprise value of the company among the various parts of its capital structure.
The Private Companies are not subject to the public company disclosure, timing, and reporting standards as other investments held by a Fund. Typically, the most recently available information by a Private Company is as of a date that is earlier than the date a Fund is calculating its NAV. This factor may result in a difference between the value of the investment and the price a Fund could receive upon the sale of the investment.
Fair Value Hierarchy: Various inputs are used in determining the fair value of investments and derivative financial instruments. These inputs to valuation techniques are categorized into a fair value hierarchy consisting of three broad levels for financial statement purposes as follows:
| | • | | Level 1 — unadjusted price quotations in active markets/exchanges for identical assets or liabilities that each Fund has the ability to access |
| | • | | Level 2 — other observable inputs (including, but not limited to, quoted prices for similar assets or liabilities in markets that are active, quoted prices for identical or similar assets or liabilities in markets that are not active, inputs other than quoted prices that are observable for the assets or liabilities (such as interest rates, yield curves, volatilities, prepayment speeds, loss severities, credit risks and default rates) or other market-corroborated inputs) |
| | • | | Level 3 — unobservable inputs based on the best information available in the circumstances, to the extent observable inputs are not available (including each Fund’s own assumptions used in determining the fair value of investments and derivative financial instruments) |
The hierarchy gives the highest priority to unadjusted quoted prices in active markets for identical assets or liabilities (Level 1 measurements) and the lowest priority to unobservable inputs (Level 3 measurements). Accordingly, the degree of judgment exercised in determining fair value is greatest for instruments categorized in Level 3. The inputs used to measure fair value may fall into different levels of the fair value hierarchy. In such cases, for disclosure purposes, the fair value hierarchy classification is determined based on the lowest level input that is significant to the fair value measurement in its entirety. Investments classified within Level 3 have significant unobservable inputs used by the Global Valuation Committee in determining the price for Fair Valued Investments. Level 3 investments include equity or debt issued by Private Companies. There may not be a secondary market, and/or there are a limited number of investors. Level 3 investments may also be adjusted to reflect illiquidity and/or non-transferability, with the amount of such discount estimated by the Global Valuation Committee in the absence of market information.
Changes in valuation techniques may result in transfers into or out of an assigned level within the hierarchy. In accordance with each Funds’ policy, transfers between different levels of the fair value hierarchy are deemed to have occurred as of the beginning of the reporting period. The categorization of a value determined for investments and derivative financial instruments is based on the pricing transparency of the investments and derivative financial instruments and is not necessarily an indication of the risks associated with investing in those securities.
4. Securities and Other Investments:
Preferred Stocks: Preferred stock has a preference over common stock in liquidation (and generally in receiving dividends as well) but is subordinated to the liabilities of the issuer in all respects. As a general rule, the market value of preferred stock with a fixed dividend rate and no conversion element varies inversely with interest rates and perceived credit risk, while the market price of convertible preferred stock generally also reflects some element of conversion value. Because preferred stock is junior to debt securities and other obligations of the issuer, deterioration in the credit quality of the issuer will cause greater changes in the value of a preferred stock than in a more senior debt security with similar stated yield characteristics. Unlike interest payments on debt securities, preferred stock dividends are payable only if declared by the issuer’s board of directors. Preferred stock also may be subject to optional or mandatory redemption provisions.
Securities Lending: Certain Funds may lend their securities to approved borrowers, such as brokers, dealers and other financial institutions. The borrower pledges and maintains with the Funds collateral consisting of cash, an irrevocable letter of credit issued by a bank, or securities issued or guaranteed by the U.S. Government. The initial collateral received by each Fund is required to have a value of at least 102% of the current value of the
| | | | | | |
| | | BLACKROCK FUNDS | | MARCH 31, 2017 | | 51 |
| | | | |
| Notes to Financial Statements (continued) | | | | |
loaned securities for securities traded on U.S. exchanges and a value of at least 105% for all other securities. The collateral is maintained thereafter at a value equal to at least 100% of the current market value of the securities on loan. The market value of the loaned securities is determined at the close of each business day of the Fund and any additional required collateral is delivered to the Fund, or excess collateral returned by the Fund, on the next business day. During the term of the loan, the Funds are entitled to all distributions made on or in respect of the loaned securities but does not receive interest income on securities received as collateral. Loans of securities are terminable at any time and the borrower, after notice, is required to return borrowed securities within the standard time period for settlement of securities transactions.
The market value of any securities on loan, all of which were classified as common stocks in the Funds’ Schedules of Investments, and the value of any related collateral are shown separately in the Statements of Assets and Liabilities as a component of investments at value — unaffiliated, and collateral on securities loaned at value, respectively. As of period end, any securities on loan were collateralized by cash and/or U.S. Government obligations. Cash collateral invested by the securities lending agent, BlackRock Investment Management, LLC (“BIM”), if any, is disclosed in the Schedules of Investments.
Securities lending transactions are entered into by the Funds under Master Securities Lending Agreements (each, an “MSLA”), which provide the right, in the event of default (including bankruptcy or insolvency), for the non-defaulting party to liquidate the collateral and calculate a net exposure to the defaulting party or request additional collateral. In the event that a borrower defaults, the Funds, as lender, would offset the market value of the collateral received against the market value of the securities loaned. When the value of the collateral is greater than that of the market value of the securities loaned, the lender is left with a net amount payable to the defaulting party. However, bankruptcy or insolvency laws of a particular jurisdiction may impose restrictions on or prohibitions against such a right of offset in the event of an MSLA counterparty’s bankruptcy or insolvency. Under the MSLA, absent an event of default, the borrower can resell or re-pledge the loaned securities, and a Fund can reinvest cash collateral received in connection with loaned securities. Upon an event of default, the parties’ obligations to return the securities or collateral to the other party are extinguished, and the parties can resell or re-pledge the loaned securities or the collateral received in connection with the loaned securities in order to satisfy the defaulting party’s net payment obligation for all transactions under the MSLA. The defaulting party remains liable for any deficiency.
As of period end, the following table is a summary of the Funds’ securities lending agreements by counterparty which are subject to offset under an MSLA:
| | | | | | | | | | | | |
Flexible Equity | | | | | | | | | | | | |
| Counterparty | | Securities Loaned
at Value | | | Cash Collateral
Received1 | | | Net
Amount | |
Citigroup Global Markets, Inc. | | $ | 460,424 | | | $ | (460,424 | ) | | | — | |
| | | | |
Total | | $ | 460,424 | | | $ | (460,424 | ) | | | — | |
| | | | |
| | | | | | | | | | | | |
| Mid-Cap Growth Equity | | | | | | | | | |
| Counterparty | | Securities Loaned
at Value | | | Cash Collateral
Received1 | | | Net
Amount | |
Merrill Lynch, Pierce, Fenner & Smith, Inc. | | $ | 2,350,960 | | | $ | (2,350,960 | ) | | | — | |
State Street Bank and Trust Co. | | | 224,988 | | | | (224,988 | ) | | | — | |
| | | | |
Total | | $ | 2,575,948 | | | $ | (2,575,948 | ) | | | — | |
| | | | |
| | | | | | | | | | | | |
| Advantage Small Cap Growth | | | | | | | | | |
| Counterparty | | Securities Loaned
at Value | | | Cash Collateral
Received1 | | | Net
Amount2 | |
Barclays Capital, Inc. | | $ | 860,279 | | | $ | (860,279 | ) | | | — | |
BNP Paribas S.A. | | | 70,668 | | | | (70,668 | ) | | | — | |
Credit Suisse Securities (USA) LLC | | | 321,455 | | | | (321,455 | ) | | | — | |
Goldman Sachs & Co. | | | 878,040 | | | | (872,173 | ) | | $ | 5,867 | |
Merrill Lynch, Pierce, Fenner & Smith, Inc. | | | 715,000 | | | | (715,000 | ) | | | — | |
Morgan Stanley | | | 114,360 | | | | (114,360 | ) | | | — | |
SG Americas Securities LLC | | | 17,930 | | | | (17,930 | ) | | | — | |
UBS Securities LLC | | | 53,601 | | | | (53,601 | ) | | | — | |
| | | | |
Total | | $ | 3,031,333 | | | $ | (3,025,466 | ) | | $ | 5,867 | |
| | | | |
| | 1 | | Cash collateral with a value of $471,702, $2,602,682 and $3,154,691 has been received in connection with securities lending agreements for Flexible Equity, Mid-Cap Growth Equity and Advantage Small Cap Growth, respectively. Collateral received in excess of the value of securities loaned from the individual counterparty is not shown for financial reporting purposes in the table above. |
| | 2 | | The market value of the loaned securities is determined as of March 31, 2017. Additional collateral is delivered to the Fund on the next business day in accordance with the MSLA. The net amount would be subject to the borrower default indemnity in the event of default by the counterparty. |
The risks of securities lending include the risk that the borrower may not provide additional collateral when required or may not return the securities when due. To mitigate these risks, the Funds benefit from a borrower default indemnity provided by BIM. BIM’s indemnity allows for full replacement of the securities loaned if the collateral received does not cover the value on the securities loaned in the event of borrower default. Each Fund could
| | | | | | |
| 52 | | BLACKROCK FUNDS | | MARCH 31, 2017 | | |
| | | | |
| Notes to Financial Statements (continued) | | | | |
incur a loss if the value of an investment purchased with cash collateral falls below the market value of loaned securities or if the value of an investment purchased with cash collateral falls below the value of the original cash collateral received.
5. Derivative Financial Instruments:
The Funds engage in various portfolio investment strategies using derivative contracts both to increase the returns of the Funds and/or to manage their exposure to certain risks such as credit risk, equity risk, interest rate risk, foreign currency exchange rate risk, commodity price risk or other risks (e.g., inflation risk). Derivative financial instruments categorized by risk exposure are included in the Schedules of Investments. These contracts may be transacted on an exchange or OTC.
Futures Contracts: Certain Funds invest in long and/or short positions in futures contracts to gain exposure to, or manage exposure to, changes in interest rates (interest rate risk), changes in the value of equity securities (equity risk) or foreign currencies (foreign currency exchange rate risk).
Futures contracts are agreements between the Funds and a counterparty to buy or sell a specific quantity of an underlying instrument at a specified price and on a specified date. Depending on the terms of a contract, it is settled either through physical delivery of the underlying instrument on the settlement date or by payment of a cash amount on the settlement date. Upon entering into a futures contract, the Funds are required to deposit initial margin with the broker in the form of cash or securities in an amount that varies depending on a contract’s size and risk profile. The initial margin deposit must then be maintained at an established level over the life of the contract.
Securities deposited as initial margin are designated in the Schedules of Investments and cash deposited, if any, is shown as cash pledged for futures contracts in the Statements of Assets and Liabilities. Pursuant to the contract, the Funds agree to receive from or pay to the broker an amount of cash equal to the daily fluctuation in market value of the contract (“variation margin”). Variation margin is recorded as unrealized appreciation (depreciation) and, if any, shown as variation margin receivable (or payable) on futures contracts in the Statements of Assets and Liabilities. When the contract is closed, a realized gain or loss is recorded in the Statements of Operations equal to the difference between the value of the contract at the time it was opened and the value at the time it was closed. The use of futures contracts involves the risk of an imperfect correlation in the movements in the price of futures contracts and interest, foreign currency exchange rates or underlying assets.
6. Investment Advisory Agreement and Other Transactions with Affiliates:
The PNC Financial Services Group, Inc. is the largest stockholder and an affiliate of BlackRock, Inc. (“BlackRock”) for 1940 Act purposes.
Investment Advisory: The Trust, on behalf of the Funds, entered into an Investment Advisory Agreement with the Manager, the Funds’ investment adviser, an indirect, wholly-owned subsidiary of BlackRock, to provide investment advisory services. The Manager is responsible for the management of each Fund’s portfolio and provides the personnel, facilities, equipment and certain other services necessary to the operations of each Fund.
For such services, each Fund pays the Manager a monthly fee at an annual rate equal to the following percentages of the average daily value of each Fund’s net assets:
| | | | | |
| | | Flexible Equity
and
Mid-Cap Growth Equity |
| Average Daily Net Assets | | Investment Advisory Fee |
First $1 Billion | | | | 0.800 | % |
$1 Billion - $2 Billion | | | | 0.700 | % |
$2 Billion - $3 Billion | | | | 0.650 | % |
Greater than $3 Billion | | | | 0.625 | % |
| | | | | |
| | | Advantage
Small Cap Growth |
| Average Daily Net Assets | | Investment Advisory Fee |
First $1 Billion | | | | 0.450 | % |
$1 Billion - $3 Billion | | | | 0.420 | % |
$3 Billion - $5 Billion | | | | 0.410 | % |
$5 Billion - $10 Billion | | | | 0.390 | % |
Greater than $10 Billion | | | | 0.380 | % |
| | | | | | |
| | | BLACKROCK FUNDS | | MARCH 31, 2017 | | 53 |
| | | | |
| Notes to Financial Statements (continued) | | | | |
Prior to December 1, 2016, Advantage Small Cap Growth’s paid the Manager a monthly fee at an annual rate equal to the following percentages of the
average daily value of the Fund’s net assets:
| | | | | |
| | | Advantage
Small Cap Growth |
| Average Daily Net Assets | | Investment Advisory Fee |
First $1 Billion | | | | 0.550 | % |
$1 Billion - $2 Billion | | | | 0.500 | % |
$2 Billion - $3 Billion | | | | 0.475 | % |
Greater than $3 Billion | | | | 0.450 | % |
The Manager provides investment management and other services to the Subsidiary. The Manager does not receive separate compensation from the Subsidiary for providing investment management or administrative services. However, Flexible Equity pays the Manager based on the Fund’s net assets, which includes the assets of the Subsidiary.
Service and Distribution Fees: The Trust, on behalf of the Funds, entered into a Distribution Agreement and a Distribution and Service Plan with BlackRock Investments, LLC (“BRIL”), an affiliate of the Manager. Pursuant to the Distribution and Service Plan and in accordance with Rule 12b-1 under the 1940 Act, each Fund pays BRIL ongoing service and distribution fees. The fees are accrued daily and paid monthly at annual rates based upon the average daily net assets of the relevant share class of each Fund as follows:
| | | | | | | | | | | | | | | | | | | | | | | | | |
| | | Service | | Investor A | | Investor B | | Investor C | | Class R |
Distribution Fee | | | | — | | | | | — | | | | | 0.75 | % | | | | 0.75 | % | | | | 0.25 | % |
Service Fee | | | | 0.25 | % | | | | 0.25 | % | | | | 0.25 | % | | | | 0.25 | % | | | | 0.25 | % |
BRIL and broker-dealers, pursuant to sub-agreements with BRIL, provide shareholder servicing and distribution services to the Funds. The ongoing service and/or distribution fee compensates BRIL and each broker-dealer for providing shareholder servicing and/or distribution related services to the shareholders.
For the six months ended March 31, 2017, the following table shows the class specific service and distribution fees borne directly by each share class of each Fund:
| | | | | | | | | | | | | | | | | | | | | | | | | | | | | | |
| | | Service | | Investor A | | Investor B | | Investor C | | Class R | | Total |
Flexible Equity | | | $ | 159 | | | | $ | 413,135 | | | | $ | 6,772 | | | | $ | 316,064 | | | | $ | 5,228 | | | | $ | 741,358 | |
Mid-Cap Growth Equity | | | $ | 1,519 | | | | $ | 486,353 | | | | $ | 4,139 | | | | $ | 261,265 | | | | $ | 18,984 | | | | $ | 772,260 | |
Advantage Small Cap Growth | | | $ | 12,368 | | | | $ | 259,415 | | | | | — | | | | $ | 116,216 | | | | | — | | | | $ | 387,999 | |
Administration: The Trust, on behalf of the Funds, entered into an Administration Agreement with the Manager, an indirect, wholly-owned subsidiary of BlackRock, to provide administrative services. For these services, the Manager receives an administration fee computed daily and payable monthly, based on a percentage of the average daily net assets of each Fund. The administration fee, which is shown as administration in the Statements of Operations, is paid at the annual rates below:
| | | | | |
| Average Daily Net Assets | | Administration Fees |
First $500 Million | | | | 0.0425 | % |
$500 Million - $1 Billion | | | | 0.0400 | % |
$1 Billion - $2 Billion | | | | 0.0375 | % |
$2 Billion - $4 Billion | | | | 0.0350 | % |
$4 Billion - $13 Billion | | | | 0.0325 | % |
Greater than $13 Billion | | | | 0.0300 | % |
In addition, the Manager charges each of the share classes an administration fee, which is shown as administration — class specific in the Statements of Operations, at an annual rate of 0.02% of the average daily net assets of each respective class.
For the six months ended March 31, 2017, the following table shows the class specific administration fees borne directly by each share class of each Fund:
| | | | | | | | | | | | | | | | | | | | | | | | | | | | | | | | | | | | | | | | |
| | | Institutional | | Service | | Investor A | | Investor B | | Investor C | | Class K | | Class R | | Total |
Flexible Equity | | | $ | 3,995 | | | | $ | 13 | | | | $ | 33,051 | | | | $ | 135 | | | | $ | 6,321 | | | | | — | | | | $ | 209 | | | | $ | 43,724 | |
Mid-Cap Growth Equity | | | $ | 10,281 | | | | $ | 122 | | | | $ | 38,908 | | | | $ | 83 | | | | $ | 5,225 | | | | | 41 | | | | $ | 759 | | | | $ | 55,419 | |
Advantage Small Cap Growth | | | $ | 48,540 | | | | $ | 990 | | | | $ | 20,753 | | | | | — | | | | $ | 2,324 | | | | | — | | | | | — | | | | $ | 72,607 | |
The Manager may have, at its discretion, voluntarily waived all or any portion of its administration fees for a Fund or a share class, which are included in administration fees waived — class specific in the Statements of Operations.
| | | | | | |
| 54 | | BLACKROCK FUNDS | | MARCH 31, 2017 | | |
| | | | |
| Notes to Financial Statements (continued) | | | | |
Transfer Agent: Pursuant to written agreements, certain financial intermediaries, some of which may be affiliates, provide the Funds with sub-accounting, recordkeeping, sub-transfer agency and other administrative services with respect to sub-accounts they service. For these services, these entities receive an asset-based fee or an annual fee per shareholder account, which will vary depending on share class and/or net assets. For the six months ended March 31, 2017, the Funds paid the following amounts to affiliates of BlackRock in return for these services, which are included in transfer agent — class specific in the Statements of Operations:
| | | | | | | | | | | | | | | | | | | | |
| | | Institutional | | Investor A | | Service | | Total |
Flexible Equity | | | | — | | | | $ | 85 | | | | | — | | | | $ | 85 | |
Mid-Cap Growth Equity | | | $ | 601 | | | | $ | 876 | | | | | — | | | | $ | 1,477 | |
Advantage Small Cap Growth | | | $ | 99,822 | | | | $ | 4,712 | | | | $ | 258 | | | | $ | 104,792 | |
The Manager maintains a call center that is responsible for providing certain shareholder services to the Funds. Shareholder services include responding to inquiries and processing subscriptions and redemptions based upon instructions from shareholders. For the six months ended March 31, 2017, each Fund reimbursed the Manager the following amounts for costs incurred in running the call center, which are included in transfer agent — class specific in the Statements of Operations:
| | | | | | | | | | | | | | | | | | | | | | | | | | | | | | |
| | | Institutional | | Investor A | | Investor B | | Investor C | | Class R | | Total |
Flexible Equity | | | $ | 765 | | | | $ | 30,540 | | | | $ | 1,335 | | | | $ | 1,372 | | | | | — | | | | $ | 34,012 | |
Mid-Cap Growth Equity | | | $ | 795 | | | | $ | 49,729 | | | | $ | 1,423 | | | | $ | 1,597 | | | | $ | 72 | | | | $ | 53,616 | |
Advantage Small Cap Growth | | | $ | 783 | | | | $ | 4,206 | | | | | — | | | | $ | 676 | | | | | — | | | | $ | 5,665 | |
For the six months ended March 31, 2017, the following table shows the class specific transfer agent fees borne directly by each class of each Fund:
| | | | | | | | | | | | | | | | | | | | | | | | | | | | | | | | | | | |
| | | Institutional | | Service | | Investor A | | Investor B | | Investor C | | Class R | | Total |
Flexible Equity | | | $ | 36,532 | | | | $ | 57 | | | | $ | 342,066 | | | | $ | 9,000 | | | | $ | 63,227 | | | | $ | 2,981 | | | | $ | 453,863 | |
Mid-Cap Growth Equity | | | $ | 65,289 | | | | $ | 83 | | | | $ | 435,781 | | | | $ | 8,933 | | | | $ | 42,685 | | | | $ | 12,318 | | | | $ | 565,114 | |
Advantage Small Cap Growth | | | $ | 382,811 | | | | $ | 8,582 | | | | $ | 221,715 | | | | | — | | | | $ | 27,635 | | | | | — | | | | $ | 640,743 | |
Other Fees: For the six months ended March 31, 2017, affiliates earned underwriting discounts, direct commissions and dealer concessions on sales of each Fund’s Investor A Shares as follows:
| | | | | |
Flexible Equity | | | $ | 2,534 | |
Mid-Cap Growth Equity | | | $ | 18,014 | |
Advantage Small Cap Growth | | | $ | 5,092 | |
For the six months ended March 31, 2017, affiliates received CDSCs as follows:
| | | | | | | | | | |
| | | Investor A | | Investor C |
Flexible Equity | | | $ | 65 | | | | $ | 140 | |
Mid-Cap Growth Equity | | | $ | 8,027 | | | | $ | 6,070 | |
Advantage Small Cap Growth | | | $ | 262 | | | | $ | 588 | |
Expense Limitations, Waivers, Reimbursements and Recoupments: With respect to each Fund, the Manager contractually agreed to waive and/or reimburse fees or expenses in order to limit expenses, excluding interest expense, dividend expense, tax expense, acquired fund fees and expenses, and certain other fund expenses, which constitute extraordinary expenses not incurred in the ordinary course of each Fund’s business (“expense limitation”). The expense limitations as a percentage of average daily net assets are as follows:
| | | | | | | | | | | | | | | | | | | | | | | | | | | | | | | | | | | | | | | | | | | | | | | | | | | | | | | | | | | | | | | | | |
| | |
| | | Flexible
Equity | | | | Mid-Cap
Growth Equity | | | | Advantage
Small Cap
Growth |
| | | | | Contractual1 | | | | Voluntary2 | | | | | | | | Contractual3 | | | | | | | | Contractual3,4 | | |
Institutional | | | | | | | | | 0.97 | % | | | | | | | | | 0.92 | % | | | | | | | | | | | | | | | | | | | 1.11 | % | | | | | | | | | | | | | | | | | | | 0.50 | % | | | | | |
Service | | | | | | | | | 1.29 | % | | | | | | | | | 1.24 | % | | | | | | | | | | | | | | | | | | | 1.58 | % | | | | | | | | | | | | | | | | | | | 0.75 | % | | | | | |
Investor A | | | | | | | | | 1.29 | % | | | | | | | | | 1.24 | % | | | | | | | | | | | | | | | | | | | 1.39 | % | | | | | | | | | | | | | | | | | | | 0.75 | % | | | | | |
Investor B | | | | | | | | | 2.06 | % | | | | | | | | | 2.01 | % | | | | | | | | | | | | | | | | | | | 2.16 | % | | | | | | | | | | | | | | | | | | | — | | | | | | |
Investor C | | | | | | | | | 2.06 | % | | | | | | | | | 2.01 | % | | | | | | | | | | | | | | | | | | | 2.16 | % | | | | | | | | | | | | | | | | | | | 1.50 | % | | | | | |
Class K | | | | | | | | | — | | | | | | | | | | — | | | | | | | | | | | | | | | | | | | | 1.01 | % | | | | | | | | | | | | | | | | | | | — | | | | | | |
Class R | | | | | | | | | 1.65 | %5 | | | | | | | | | 1.60 | % | | | | | | | | | | | | | | | | | | | 1.65 | % | | | | | | | | | | | | | | | | | | | 1.00 | %6 | | | | | |
| | 1 | | The Manager has agreed not to reduce or discontinue this contractual expense limitation prior to February 1, 2018, except for Class R Shares which is prior to February 1, 2027, unless approved by the Board, including a majority of the independent Trustees who are not “interested persons” of the Funds, as defined in the 1940 Act (“Independent Trustees”) or by a vote of a majority of the outstanding voting securities of the Funds. |
| | 2 | | May be reduced or discontinued at any time without notice. |
| | 3 | | The Manager has agreed not to reduce or discontinue this contractual expense limitation prior to February 1, 2018, unless approved by the Board, including a majority of the independent Trustees or by a vote of a majority of the outstanding voting securities of the Fund. |
| | 4 | | Effective December 1, 2016. |
| | 5 | | On February 1 of each year, the waiver agreement will renew automatically for an additional one year so that the agreement will have a perpetual ten year term. |
| | 6 | | There were no shares outstanding as of March 31, 2017. |
| | | | | | |
| | | BLACKROCK FUNDS | | MARCH 31, 2017 | | 55 |
| | | | |
| Notes to Financial Statements (continued) | | | | |
The Manager has agreed not to reduce or discontinue these contractual expense limitation through January 31, 2018, unless approved by the Board, including a majority of the independent trustees who are not “interested persons” of the Funds, as defined in the 1940 Act (“Independent Trustees”) or by a vote of a majority of the outstanding voting securities of the Funds. For the six months ended March 31, 2017, the amounts included in fees waived by the Manager were as follows:
| | | | | |
Flexible Equity | | | $ | 58,347 | |
Mid-Cap Growth Equity | | | $ | 825 | |
Advantage Small Cap Growth | | | $ | 158,015 | |
These amounts waived and/or reimbursed are included in fees waived by the Manager, and shown as administration fees waived — class specific, transfer agent fees waived — class specific and transfer agent fees reimbursed — class specific, respectively, in the Statements of Operations. Class specific expense waivers and/or reimbursements are as follows:
| | | | | | | | | | | | | | | | | | | | | | | | | | | | | | | | | | | |
| Administration Fees Waived | | Institutional | | Service | | Investor A | | Investor B | | Investor C | | Class R | | Total |
Flexible Equity | | | | $3,995 | | | | | $13 | | | | | $33,051 | | | | | $135 | | | | | $6,321 | | | | | $209 | | | | | $43,724 | |
Mid-Cap Growth Equity | | | | $165 | | | | | — | | | | | $36,498 | | | | | $83 | | | | | $87 | | | | | $759 | | | | | $37,592 | |
Advantage Small Cap Growth | | | | $32,616 | | | | | $627 | | | | | $13,622 | | | | | — | | | | | $1,562 | | | | | — | | | | | $48,427 | |
| | | | | | | | | | | | | | | | | | | | | | | | | | | | | | | | | | | |
| Transfer Agent Fees Waived | | Institutional | | Service | | Investor A | | Investor B | | Investor C | | Class R | | Total |
Flexible Equity | | | | $765 | | | | | — | | | | | $30,540 | | | | | $1,335 | | | | | $1,372 | | | | | — | | | | | $34,012 | |
Mid-Cap Growth Equity | | | | $18 | | | | | — | | | | | $37,587 | | | | | $1,423 | | | | | $44 | | | | | $72 | | | | | $39,144 | |
Advantage Small Cap Growth | | | | $441 | | | | | — | | | | | $2,483 | | | | | — | | | | | $368 | | | | | — | | | | | $3,292 | |
| | | | | | | | | | | | | | | | | | | | | | | | | | | | | | | | | | | |
| Transfer Agent Fees Reimbursed | | Institutional | | Service | | Investor A | | Investor B | | Investor C | | Class R | | Total |
Flexible Equity | | | $ | 35,767 | | | | $ | 13 | | | | $ | 196,274 | | | | $ | 7,061 | | | | $ | 34,188 | | | | $ | 1,097 | | | | $ | 274,400 | |
Mid-Cap Growth Equity | | | $ | 850 | | | | | — | | | | $ | 11,301 | | | | $ | 6,604 | | | | $ | 405 | | | | $ | 4,261 | | | | $ | 23,421 | |
Advantage Small Cap Growth | | | $ | 255,083 | | | | $ | 5,569 | | | | $ | 141,318 | | | | | — | | | | $ | 18,002 | | | | | — | | | | $ | 419,972 | |
With respect to the Funds, the Manager voluntarily agreed to waive its investment advisory fees by the amount of investment advisory fees each Fund pays to the Manager indirectly through its investment in affiliated money market funds (the “affiliated money market waiver”). These amounts are included in fees waived by the Manager in the Statements of Operations. The amount of waivers and/or reimbursements of fees and expenses made pursuant to the expense limitation caps, as applicable, will be reduced by the amount of the affiliated money market fund waiver. For the six months
ended March 31, 2017, the amounts waived were as follows:
| | | | | |
Flexible Equity | | | $ | 2,858 | |
Mid-Cap Growth Equity | | | $ | 1,116 | |
Advantage Small Cap Growth | | | $ | 2,171 | |
The Manager voluntarily agreed to waive its investment advisory fee with respect to any portion of each Fund’s assets invested in affiliated equity and fixed-income mutual funds and affiliated exchange-traded funds that have a contractual management fee. Effective January 27, 2017, the waiver became contractual through January 31, 2018. This contractual agreement may be terminated with respect to each Fund upon 90 days’ notice by a majority of independent trustees or by a vote of a majority of the outstanding voting securities of the Funds. For the six months ended March 31, 2017, the Funds did not have contractual waivers.
With respect to the contractual expense caps, if during a Fund’s fiscal year the operating expenses of a share class, that at any time during the prior two fiscal years received a waiver and/or reimbursement from the Manager, are less than the expense cap for that share class, the Manager is entitled to be reimbursed by such share class up to the lesser of the following expenses:
| | (a) | | The amount of fees waived and/or expenses reimbursed during those prior two fiscal years under the agreement. |
| | (b) | | The amount by which the expense cap for that share class exceeds the operating expenses of the share class for the current fiscal year, provided that: |
| | • | | Each Fund, of which the share class is a part, has more than $50 million in assets for the fiscal year; and |
| | • | | The Manager or an affiliate continues to serve as a Fund’s investment adviser or administrator. |
In the event the expense cap for a share class is changed subsequent to a fiscal year in which the Manager becomes entitled to reimbursement for fees waived and/or reimbursed, the amount available to reimburse the Manager shall be calculated by reference to the expense cap for that share class in effect at the time the Manager became entitled to receive such reimbursement, rather than the subsequently changed expense cap for that share class.
| | | | | | |
| 56 | | BLACKROCK FUNDS | | MARCH 31, 2017 | | |
| | | | |
| Notes to Financial Statements (continued) | | | | |
For the six months ended March 31, 2017, the Manager recouped the following Fund level and class specific waivers and/or reimbursements previously recorded by the Fund:
| | | | | | | | | | | | | | | | | | | | | | | | | |
| | | Institutional | | Investor A | | Investor C | | Class K | | Total |
Mid-Cap Growth Equity | | | $ | 12,924 | | | | $ | 181 | | | | $ | 5,888 | | | | $ | 4 | | | | $ | 18,997 | |
On March 31, 2017, the Fund level and class specific waivers and/or reimbursements subject to possible future recoupment under the expense limitation agreement are as follows:
| | | | | | | | | | | | | | | | | | | | | | | | | |
| | | Expiring September 30, |
| | | 2017 | | | | 2018 | | | | 2019 |
Flexible Equity | | | | | | | | | | | | | | | | | | | | | | | | | |
Fund Level | | | | — | | | | | | | | | $ | 56,474 | | | | | | | | | $ | 34,401 | |
Institutional | | | $ | 68,026 | | | | | | | | | $ | 61,259 | | | | | | | | | $ | 36,369 | |
Service | | | $ | 110 | | | | | | | | | | — | | | | | | | | | $ | 11 | |
Investor A | | | $ | 484,806 | | | | | | | | | $ | 387,264 | | | | | | | | | $ | 219,555 | |
Investor B | | | $ | 24,946 | | | | | | | | | $ | 17,299 | | | | | | | | | $ | 5,947 | |
Investor C | | | $ | 72,256 | | | | | | | | | $ | 61,456 | | | | | | | | | $ | 33,800 | |
R Shares | | | $ | 907 | | | | | | | | | $ | 1,231 | | | | | | | | | $ | 1,050 | |
Mid-Cap Growth Equity | | | | | | | | | | | | | | | | | | | | | | | | | |
Fund Level | | | | — | | | | | | | | | $ | 9,225 | | | | | | | | | $ | 825 | |
Institutional | | | | — | | | | | | | | | $ | 5,245 | | | | | | | | | $ | 1,033 | |
Investor A | | | $ | 144,137 | | | | | | | | | $ | 204,830 | | | | | | | | | $ | 85,386 | |
Investor B | | | $ | 16,941 | | | | | | | | | $ | 16,918 | | | | | | | | | $ | 8,110 | |
Investor C | | | | — | | | | | | | | | | — | | | | | | | | | $ | 536 | |
R Shares | | | $ | 5,948 | | | | | | | | | $ | 9,581 | | | | | | | | | $ | 5,092 | |
Advantage Small Cap Growth | | | | | | | | | | | | | | | | | | | | | | | | | |
Fund Level | | | | — | | | | | | | | | | — | | | | | | | | | $ | 158,015 | |
Institutional | | | | — | | | | | | | | | | — | | | | | | | | | $ | 288,140 | |
Service | | | | — | | | | | | | | | | — | | | | | | | | | $ | 6,196 | |
Investor A | | | | — | | | | | | | | | | — | | | | | | | | | $ | 157,423 | |
Investor C | | | | — | | | | | | | | | | — | | | | | | | | | $ | 19,932 | |
Security Lending: The U.S. Securities and Exchange Commission has issued an exemptive order which permits BIM, an affiliate of the Manager, to serve as securities lending agent for the Funds, subject to applicable conditions. As securities lending agent, BIM bears all operational costs directly related to securities lending. The Funds are responsible for expenses in connection with the investment of cash collateral received for securities on loan (the “collateral investment expenses”). The cash collateral is invested in a private investment company managed by the Manager or its affiliates. However, BIM has agreed to cap the collateral investment expenses of the private investment company to an annual rate of 0.04%. The investment adviser to the private investment company will not charge any advisory fees with respect to shares purchased by the Funds. If the private investment company’s weekly liquid assets fall below 30% of its total assets, BIM, as managing member of the private investment company, is permitted at any time, if it determines it to be in the best interests of the private investment company, to impose a liquidity fee of up to 2% of the value of units withdrawn or impose a redemption gate that temporarily suspends the right of withdrawal out of the private investment company. In addition, if the private investment company’s weekly liquid assets fall below 10% of its total assets at the end of any business day, the private investment company will impose a liquidity fee in the default amount of 1% of the amount withdrawn, generally effective as of the next business day, unless BIM determines that a higher (not to exceed 2%) or lower fee level or not imposing a liquidity fee is in the best interests of the private investment company. The shares of the private investment company purchased by the Funds would be subject to any such liquidity fee or redemption gate imposed.
Securities lending income is equal to the total of income earned from the reinvestment of cash collateral, net of fees and other payments to and from borrowers of securities, and less the collateral investment expenses. Each Fund retains a portion of securities lending income and remits a remaining portion to BIM as compensation for its services as securities lending agent. Pursuant to a securities lending agreement, BIM may lend securities only when the difference between the borrower rebate rate and the risk free rate exceeds a certain level (such securities, the “specials only securities”).
Pursuant to such agreement, each Fund retains 80% of securities lending income. In addition, commencing the business day following the date that the aggregate securities lending income earned across certain funds in the Equity-Liquidity Complex in a calendar year exceeds a specified threshold, each Fund, pursuant to the securities lending agreement, will retain for the remainder of the calendar year securities lending income in an amount equal to 85% of securities lending income.
The share of securities lending income earned by each Fund is shown as securities lending income — affiliated — net in the Statements of Operations. For the six months ended March 31, 2017, each Fund paid BIM the following amounts for securities lending agent services:
| | | | |
Flexible Equity | | $ | 370 | |
Mid-Cap Growth Equity | | $ | 891 | |
Advantage Small Cap Growth | | $ | 70,481 | |
| | | | | | |
| | | BLACKROCK FUNDS | | MARCH 31, 2017 | | 57 |
| | | | |
| Notes to Financial Statements (continued) | | | | |
Officers and Trustees: Certain officers and/or trustees of the Trust are officers and/or trustees of BlackRock or its affiliates. The Funds reimburse the Manager for a portion of the compensation paid to the Trust’s Chief Compliance Officer, which is included in Officer and Trustees in the Statements of Operations.
Other Transactions: The Funds may purchase securities from, or sell securities to, an affiliated fund provided the affiliation is due solely to having a common investment adviser, common officers, or common trustees. For the six months ended March 31, 2017, the purchase and sale transactions and any net realized gains (losses) with affiliated funds in compliance with Rule 17a-7 under the 1940 Act were as follows:
| | | | | | | | | | | | | | | | | | | | | | | | | | | | | | | | | | | |
| | | Purchases | | | | | | Sales | | | | | | Realized
Gain |
Flexible Equity | | | $ | 181,597 | | | | | | | | | | | | | | | — | | | | | | | | | | | | | | | — | |
Mid-Cap Growth Equity | | | | — | | | | | | | | | | | | | | $ | 753,258 | | | | | | | | | | | | | | $ | 166,735 | |
7. Purchases and Sales:
For the six months ended March 31, 2017, purchases and sales of investments, excluding short-term securities, were as follows:
| | | | | | | | | | | | | | | | | | | | | | | | | | | | | | | | | | | |
| | | Flexible
Equity | | | | | | Mid-Cap
Growth Equity | | | | | | Advantage Small
Cap Growth |
Purchases | | | $ | 88,967,159 | | | | | | | | | | | | | | $ | 230,381,610 | | | | | | | | | | | | | | $ | 336,392,982 | |
Sales | | | $ | 125,038,477 | | | | | | | | | | | | | | $ | 241,676,320 | | | | | | | | | | | | | | $ | 450,616,461 | |
8. Income Tax Information:
It is the Funds’ policy to comply with the requirements of the Internal Revenue Code of 1986, as amended, applicable to regulated investment companies, and to distribute substantially all of their taxable income to their shareholders. Therefore, no U.S. federal income tax provision is required.
The Funds file U.S. federal and various state and local tax returns. No income tax returns are currently under examination. The statute of limitations on each Fund’s U.S. federal tax returns generally remains open for each of the four years ended September 30, 2016. The statutes of limitations on each Fund’s state and local tax returns may remain open for an additional year depending upon the jurisdiction.
Management has analyzed tax laws and regulations and their application to the Funds as of March 31, 2017, inclusive of the open tax return years, and does not believe that there are any uncertain tax positions that require recognition of a tax liability in the Funds’ financial statements.
As of March 31, 2017, the Funds had capital loss carryforwards available to offset future realized capital gains through the indicated expiration dates as follows:
| | | | | | | | | | | | | | | | | | | | |
| Expires September 30, | | Flexible
Equity | | | | | | Mid-Cap
Growth Equity |
No expiration date1 | | | $ | 8,452,843 | | | | | | | | | | | | | | $ | 2,645,014 | |
2017 | | | $ | 31,346,700 | | | | | | | | | | | | | | | — | |
Total | | | $ | 39,799,543 | | | | | | | | | | | | | | $ | 2,645,014 | |
| | 1 | | Must be utilized prior to losses subject to expiration. |
As of March 31, 2017, gross unrealized appreciation and depreciation based on cost for federal income tax purposes were as follows
| | | | | | | | | | | | | | | | | | | | | | | | | |
| | | Flexible
Equity | | | | Mid-Cap
Growth Equity | | | | Advantage Small
Cap Growth |
Tax cost | | | $ | 373,807,586 | | | | | | | | | $ | 460,769,467 | | | | | | | | | $ | 645,889,409 | |
Gross unrealized appreciation | | | $ | 82,756,586 | | | | | | | | | $ | 148,900,906 | | | | | | | | | $ | 117,386,821 | |
Gross unrealized depreciation | | | | (9,617,040 | ) | | | | | | | | | (1,210,451 | ) | | | | | | | | | (30,642,360 | ) |
Net unrealized appreciation | | | $ | 73,139,546 | | | | | | | | | $ | 147,690,455 | | | | | | | | | $ | 86,744,461 | |
9. Bank Borrowings:
The Trust, on behalf of the Funds, along with certain other funds managed by the Manager and its affiliates (“Participating Funds”), is a party to a 364-day, $2.1 billion credit agreement with a group of lenders. Under this agreement, the Funds may borrow to fund shareholder redemptions. Excluding commitments designated for certain individual funds, the Participating Funds, including the Funds, can borrow up to an aggregate commitment amount of $1.6 billion at any time outstanding, subject to asset coverage and other limitations as specified in the agreement. The credit agreement has the following terms: a fee of 0.12% per annum on unused commitment amounts and interest at a rate equal to the higher of (a) one-month LIBOR (but, in any event, not less than 0.00%) on the date the loan is made plus 0.80% per annum or (b) the Fed Funds rate (but, in any event, not less than 0.00%) in effect from time to time plus 0.80% per annum on amounts borrowed. The agreement expires in April 2017 unless extended or renewed. Participating Funds paid administration, legal and arrangement fees, which, if applicable, are included in miscellaneous expenses in the Statements of
| | | | | | |
| 58 | | BLACKROCK FUNDS | | MARCH 31, 2017 | | |
| | | | |
| Notes to Financial Statements (continued) | | | | |
Operations. These fees were allocated among such funds based upon portions of the aggregate commitment available to them and relative net assets of Participating Funds. During the six months ended March 31, 2017, the Funds did not borrow under the credit agreement.
10. Principal Risks:
In the normal course of business, certain Funds invest in securities and enter into transactions where risks exist due to fluctuations in the market (market risk) or failure of the issuer to meet all its obligations, including the ability to pay principal and interest when due (issuer credit risk). The value of securities held by the Funds may decline in response to certain events, including those directly involving the issuers of securities owned by the Funds. Changes arising from the general economy, the overall market and local, regional or global political and/or social instability, as well as currency, interest rate and price fluctuations, may also affect the securities’ value.
On October 11, 2016, BlackRock implemented certain changes required by amendments to Rule 2a-7 under the 1940 Act, which governs the operations of U.S. money market funds. The Funds may be exposed to additional risks when reinvesting cash collateral in money market funds that do not seek to maintain a stable NAV per share of $1.00 and which may be subject to redemption gates or liquidity fees under certain circumstances.
Valuation Risk: The market values of equities, such as common stocks and preferred securities or equity related investments, such as futures and options, may decline due to general market conditions which are not specifically related to a particular company. They may also decline due to factors which affect a particular industry or industries. A Fund may invest in illiquid investments and may experience difficulty in selling those investments in a timely manner at the price that they believe the investments are worth. Prices may fluctuate widely over short or extended periods in response to company, market or economic news. Markets also tend to move in cycles, with periods of rising and falling prices. This volatility may cause each Fund’s NAV to experience significant increases or decreases over short periods of time. If there is a general decline in the securities and other markets, the NAV of a Fund may lose value, regardless of the individual results of the securities and other instruments in which a Fund invests.
The price a Fund could receive upon the sale of any particular portfolio investment may differ from a Fund’s valuation of the investment, particularly for securities that trade in thin or volatile markets or that are valued using a fair valuation technique or a price provided by an independent pricing service. Changes to significant unobservable inputs and assumptions (i.e., publicly traded company multiples, growth rate, time to exit) due to the lack of observable inputs may significantly impact the resulting fair value and therefore a Fund’s results of operations. As a result, the price received upon the sale of an investment may be less than the value ascribed by a Fund, and a Fund could realize a greater than expected loss or lesser than expected gain upon the sale of the investment. A Fund’s ability to value its investments may also be impacted by technological issues and/or errors by pricing services or other third party service providers.
Counterparty Credit Risk: Similar to issuer credit risk, the Funds may be exposed to counterparty credit risk, or the risk that an entity may fail to or be unable to perform on its commitments related to unsettled or open transactions. The Funds manage counterparty credit risk by entering into transactions only with counterparties that the Manager believes have the financial resources to honor their obligations and by monitoring the financial stability of those counterparties. Financial assets, which potentially expose the Funds to market, issuer and counterparty credit risks, consist principally of financial instruments and receivables due from counterparties. The extent of the Funds’ exposure to market, issuer and counterparty credit risks with respect to these financial assets is approximately their value recorded in the Statements of Assets and Liabilities, less any collateral held by the Funds.
A derivative contract may suffer a mark-to-market loss if the value of the contract decreases due to an unfavorable change in the market rates or values of the underlying instrument. Losses can also occur if the counterparty does not perform under the contract.
With exchange-traded futures, there is less counterparty credit risk to the Funds since the exchange or clearinghouse, as counterparty to such instruments, guarantees against a possible default. The clearinghouse stands between the buyer and the seller of the contract; therefore, credit risk is limited to failure of the clearinghouse. While offset rights may exist under applicable law, a Fund does not have a contractual right of offset against a clearing broker or clearinghouse in the event of a default (including the bankruptcy or insolvency). Additionally, credit risk exists in exchange-traded futures with respect to initial and variation margin that is held in a clearing broker’s customer accounts. While clearing brokers are required to segregate customer margin from their own assets, in the event that a clearing broker becomes insolvent or goes into bankruptcy and at that time there is a shortfall in the aggregate amount of margin held by the clearing broker for all its clients, typically the shortfall would be allocated on a pro rata basis across all the clearing broker’s customers, potentially resulting in losses to the Funds.
Concentration Risk: As of period end, the Funds invested a significant portion of their assets in securities in the information technology sectors. Changes in economic conditions affecting such sectors would have a greater impact on the Funds and could affect the value, income and/or liquidity of positions in such securities.
| | | | | | |
| | | BLACKROCK FUNDS | | MARCH 31, 2017 | | 59 |
| | | | |
| Notes to Financial Statements (continued) | | | | |
11. Capital Share Transactions:
Transactions in capital shares for each class were as follows:
| | | | | | | | | | | | | | | | | | |
| | | Six Months Ended
March 31, 2017 | | | | | Year Ended
September 30, 2016 | |
| Flexible Equity | | Shares | | | Amount | | | | | Shares | | | Amount | |
Institutional | | | | | | | | | | | | | | | | | | |
Shares sold | | | 520,030 | | | $ | 6,964,502 | | | | | | 363,198 | | | $ | 4,355,202 | |
Shares issued in reinvestment of distributions | | | 23,677 | | | | 306,378 | | | | | | 218,409 | | | | 2,642,744 | |
Shares redeemed | | | (489,657 | ) | | | (6,479,513 | ) | | | | | (931,971 | ) | | | (11,253,541 | ) |
| | | | | | | | | | |
Net increase (decrease) | | | 54,050 | | | $ | 791,367 | | | | | | (350,364 | ) | | $ | (4,255,595 | ) |
| | | | | | | | | | |
| | | | | | | | | | | | | | | | | | |
Service | | | | | | | | | | | | | | | | | | |
Shares sold | | | — | | | $ | — | | | | | | 7,721 | | | $ | 87,460 | |
Shares issued in reinvestment of distributions | | | 54 | | | | 692 | | | | | | 644 | | | | 7,680 | |
Shares redeemed | | | (84 | ) | | | (1,110 | ) | | | | | (7,621 | ) | | | (88,886 | ) |
| | | | | | | | | | |
Net increase (decrease) | | | (30 | ) | | $ | (418 | ) | | | | | 744 | | | $ | 6,254 | |
| | | | | | | | | | |
| | | | | | | | | | | | | | | | | | |
Investor A | | | | | | | | | | | | | | | | | | |
Shares sold and automatic conversion of shares | | | 481,620 | | | $ | 6,171,945 | | | | | | 1,046,271 | | | $ | 12,085,182 | |
Shares issued in reinvestment of distributions | | | 145,062 | | | | 1,805,996 | | | | | | 2,139,314 | | | | 24,901,629 | |
Shares redeemed | | | (2,861,834 | ) | | | (36,195,602 | ) | | | | | (6,525,739 | ) | | | (74,538,564 | ) |
| | | | | | | | | | |
Net decrease | | | (2,235,152 | ) | | $ | (28,217,661 | ) | | | | | (3,340,154 | ) | | $ | (37,551,753 | ) |
| | | | | | | | | | |
| | | | | | | | | | | | | | | | | | |
Investor B | | | | | | | | | | | | | | | | | | |
Shares sold | | | 410 | | | $ | 4,215 | | | | | | — | | | | — | |
Shares issued in reinvestment of distributions | | | — | | | | — | | | | | | 23,611 | | | $ | 241,073 | |
Shares redeemed and automatic conversion of shares | | | (79,937 | ) | | | (883,315 | ) | | | | | (204,109 | ) | | | (2,060,960 | ) |
| | | | | | | | | | |
Net decrease | | | (79,527 | ) | | $ | (879,100 | ) | | | | | (180,498 | ) | | $ | (1,819,887 | ) |
| | | | | | | | | | |
| | | | | | | | | | | | | | | | | | |
Investor C | | | | | | | | | | | | | | | | | | |
Shares sold | | | 71,146 | | | $ | 787,196 | | | | | | 211,970 | | | $ | 2,101,407 | |
Shares issued in reinvestment of distributions | | | — | | | | — | | | | | | 543,869 | | | | 5,482,229 | |
Shares redeemed | | | (909,186 | ) | | | (9,894,529 | ) | | | | | (1,696,075 | ) | | | (17,068,336 | ) |
| | | | | | | | | | |
Net decrease | | | (838,040 | ) | | $ | (9,107,333 | ) | | | | | (940,236 | ) | | $ | (9,484,700 | ) |
| | | | | | | | | | |
| | | | | | | | | | | | | | | | | | |
Class R | | | | | | | | | | | | | | | | | | |
Shares sold | | | 18,582 | | | $ | 237,023 | | | | | | 83,244 | | | $ | 991,545 | |
Shares issued in reinvestment of distributions | | | 447 | | | | 5,742 | | | | | | 8,633 | | | | 103,685 | |
Shares redeemed | | | (7,986 | ) | | | (103,354 | ) | | | | | (33,183 | ) | | | (381,845 | ) |
| | | | | | | | | | |
Net increase | | | 11,043 | | | $ | 139,411 | | | | | | 58,694 | | | $ | 713,385 | |
| | | | | | | | | | |
Total Net Decrease | | | (3,087,656 | ) | | $ | (37,273,734 | ) | | | | | (4,751,814 | ) | | $ | (52,392,596 | ) |
| | | | | | | | | | |
| | | | | | |
| 60 | | BLACKROCK FUNDS | | MARCH 31, 2017 | | |
| | | | |
| Notes to Financial Statements (continued) | | | | |
| | | | | | | | | | | | | | | | | | |
| | | Six Months Ended
March 31, 2017 | | | | | Year Ended
September 30, 2016 | |
| Mid-Cap Growth Equity | | Shares | | | Amount | | | | | Shares | | | Amount | |
Institutional | | | | | | | | | | | | | | | | | | |
Shares sold | | | 2,725,886 | | | $ | 50,156,899 | | | | | | 5,361,455 | | | $ | 86,530,654 | |
Shares issued in reinvestment of distributions | | | — | | | | — | | | | | | 106,544 | | | | 1,804,863 | |
Shares redeemed | | | (2,012,053 | ) | | | (36,414,189 | ) | | | | | (5,039,028 | ) | | | (82,328,342 | ) |
| | | | | | | | | | |
Net increase | | | 713,833 | | | $ | 13,742,710 | | | | | | 428,971 | | | $ | 6,007,175 | |
| | | | | | | | | | |
| | | | | | | | | | | | | | | | | | |
Service | | | | | | | | | | | | | | | | | | |
Shares sold | | | 19,747 | | | $ | 331,064 | | | | | | 169,694 | | | $ | 2,431,554 | |
Shares issued in reinvestment of distributions | | | — | | | | — | | | | | | 2,427 | | | | 37,645 | |
Shares redeemed | | | (54,781 | ) | | | (919,828 | ) | | | | | (182,311 | ) | | | (2,530,011 | ) |
| | | | | | | | | | |
Net decrease | | | (35,034 | ) | | $ | (588,764 | ) | | | | | (10,190 | ) | | $ | (60,812 | ) |
| | | | | | | | | | |
| | | | | | | | | | | | | | | | | | |
Investor A | | | | | | | | | | | | | | | | | | |
Shares sold and automatic conversion of shares | | | 2,469,939 | | | $ | 39,912,435 | | | | | | 6,897,144 | | | $ | 98,685,249 | |
Shares issued in reinvestment of distributions | | | — | | | | — | | | | | | 613,791 | | | | 9,127,073 | |
Shares redeemed | | | (3,418,506 | ) | | | (54,735,368 | ) | | | | | (6,635,624 | ) | | | (95,353,822 | ) |
| | | | | | | | | | |
Net increase (decrease) | | | (948,567 | ) | | $ | (14,822,933 | ) | | | | | 875,311 | | | $ | 12,458,500 | |
| | | | | | | | | | |
| | | | | | | | | | | | | | | | | | |
Investor B | | | | | | | | | | | | | | | | | | |
Shares sold | | | 243 | | | $ | 2,986 | | | | | | 5,631 | | | $ | 63,664 | |
Shares issued in reinvestment of distributions | | | — | | | | — | | | | | | 3,865 | | | | 51,523 | |
Shares redeemed and automatic conversion of shares | | | (56,413 | ) | | | (722,674 | ) | | | | | (92,380 | ) | | | (1,086,032 | ) |
| | | | | | | | | | |
Net decrease | | | (56,170 | ) | | $ | (719,688 | ) | | | | | (82,884 | ) | | $ | (970,845 | ) |
| | | | | | | | | | |
| | | | | | | | | | | | | | | | | | |
Investor C | | | | | | | | | | | | | | | | | | |
Shares sold | | | 564,837 | | | $ | 7,139,641 | | | | | | 1,636,167 | | | $ | 19,198,232 | |
Shares issued in reinvestment of distributions | | | — | | | | — | | | | | | 119,139 | | | | 1,428,474 | |
Shares redeemed | | | (738,045 | ) | | | (9,340,622 | ) | | | | | (1,381,928 | ) | | | (15,791,618 | ) |
| | | | | | | | | | |
Net increase (decrease) | | | (173,208 | ) | | $ | (2,200,981 | ) | | | | | 373,378 | | | $ | 4,835,088 | |
| | | | | | | | | | |
| | | | | | | | | | | | | | | | | | |
| | | | | | | | Period March 28, 20161
to September 30, 2016 | |
| | | | | | | | | | | Shares | | | Amount | |
Class K | | | | | | | | | | | | | | | | | | |
Shares sold | | | 107,355 | | | $ | 2,083,102 | | | | | | 12,845 | | | $ | 200,000 | |
Shares issued in reinvestment of distributions | | | — | | | | — | | | | | | — | | | | — | |
Shares redeemed | | | (356 | ) | | | (6,828 | ) | | | | | — | | | | — | |
| | | | | | | | | | |
Net increase | | | 106,999 | | | $ | 2,076,274 | | | | | | 12,845 | | | $ | 200,000 | |
| | | | | | | | | | |
| | | | | | | | | | | | | | | | | | |
1 Commencement of operations. | | | | | | | | | | | | | | | | | | |
| | | | | | | | Year Ended
September 30, 2016 | |
| | | | | | | | | | | Shares | | | Amount | |
Class R | | | | | | | | | | | | | | | | | | |
Shares sold | | | 94,945 | | | $ | 1,515,351 | | | | | | 249,162 | | | $ | 3,569,952 | |
Shares issued in reinvestment of distributions | | | — | | | | — | | | | | | 13,115 | | | | 193,183 | |
Shares redeemed | | | (93,814 | ) | | | (1,468,417 | ) | | | | | (293,428 | ) | | | (4,194,403 | ) |
| | | | | | | | | | |
Net increase (decrease) | | | 1,131 | | | $ | 46,934 | | | | | | (31,151 | ) | | $ | (431,268 | ) |
| | | | | | | | | | |
Total Net Increase (Decrease) | | | (391,016 | ) | | $ | (2,466,448 | ) | | | | | 1,566,280 | | | $ | 22,037,838 | |
| | | | | | | | | | |
| | | | | | |
| | | BLACKROCK FUNDS | | MARCH 31, 2017 | | 61 |
| | | | |
| Notes to Financial Statements (concluded) | | | | |
| | | | | | | | | | | | | | | | | | |
| | | Six Months Ended
March 31, 2017 | | | | | Year Ended
September 30, 2016 | |
| Advantage Small Cap Growth | | Shares | | | Amount | | | | | Shares | | | Amount | |
Institutional | | | | | | | | | | | | | | | | | | |
Shares sold | | | 4,076,887 | | | $ | 77,021,829 | | | | | | 5,879,054 | | | $ | 97,291,572 | |
Shares issued in reinvestment of distributions | | | 12,627 | | | | 240,545 | | | | | | 1,649,489 | | | | 27,645,435 | |
Shares redeemed | | | (6,184,079 | ) | | | (116,318,155 | ) | | | | | (8,463,880 | ) | | | (141,186,636 | ) |
| | | | | | | | | | |
Net decrease | | | (2,094,565 | ) | | $ | (39,055,781 | ) | | | | | (935,337 | ) | | $ | (16,249,629 | ) |
| | | | | | | | | | |
| | | | | | | | | | | | | | | | | | |
Service | | | | | | | | | | | | | | | | | | |
Shares sold | | | 64,700 | | | $ | 1,052,425 | | | | | | 202,350 | | | $ | 2,992,584 | |
Shares issued in reinvestment of distributions | | | — | | | | — | | | | | | 82,697 | | | | 1,202,410 | |
Shares redeemed | | | (290,194 | ) | | | (4,606,925 | ) | | | | | (768,727 | ) | | | (10,948,215 | ) |
| | | | | | | | | | |
Net decrease | | | (225,494 | ) | | $ | (3,554,500 | ) | | | | | (483,680 | ) | | $ | (6,753,221 | ) |
| | | | | | | | | | |
| | | | | | | | | | | | | | | | | | |
Investor A | | | | | | | | | | | | | | | | | | |
Shares sold and automatic conversion of shares | | | 2,506,662 | | | $ | 37,978,748 | | | | | | 3,693,104 | | | $ | 48,774,247 | |
Shares issued in reinvestment of distributions | | | — | | | | — | | | | | | 1,250,710 | | | | 16,709,474 | |
Shares redeemed | | | (7,544,919 | ) | | | (109,965,034 | ) | | | | | (5,189,647 | ) | | | (68,997,597 | ) |
| | | | | | | | | | |
Net decrease | | | (5,038,257 | ) | | $ | (71,986,286 | ) | | | | | (245,833 | ) | | $ | (3,513,876 | ) |
| | | | | | | | | | |
| | | | | | | | | | | | | | | | | | |
Investor C | | | | | | | | | | | | | | | | | | |
Shares sold | | | 190,260 | | | $ | 1,796,250 | | | | | | 314,577 | | | $ | 2,648,740 | |
Shares issued in reinvestment of distributions | | | — | | | | — | | | | | | 321,853 | | | | 2,693,898 | |
Shares redeemed | | | (492,192 | ) | | | (4,563,069 | ) | | | | | (967,408 | ) | | | (8,246,388 | ) |
| | | | | | | | | | |
Net decrease | | | (301,932 | ) | | $ | (2,766,819 | ) | | | | | (330,978 | ) | | $ | (2,903,750 | ) |
| | | | | | | | | | |
Total Net Decrease | | | (7,660,248 | ) | | $ | (117,363,386 | ) | | | | | (1,995,828 | ) | | $ | (29,420,476 | ) |
| | | | | | | | | | |
At March 31, 2017, 12,845 Class K Shares of Mid-Cap Growth Equity were owned by BlackRock HoldCo 2, Inc., an affiliate of the Fund.
12. Subsequent Events:
Management’s evaluation of the impact of all subsequent events on the Funds’ financial statements was completed through the date the financial
statements were issued and the following item was noted:
Effective April 20, 2017, the credit agreement was extended until April 2018 under the same terms.
| | | | | | |
| 62 | | BLACKROCK FUNDS | | MARCH 31, 2017 | | |
Rodney D. Johnson, Chair of the Board and Trustee
Susan J. Carter, Trustee
Collette Chilton, Trustee
Neil A. Cotty, Trustee
Cynthia A. Montgomery, Trustee
Joseph P. Platt, Trustee
Robert C. Robb, Jr., Trustee
Mark Stalnecker, Trustee
Kenneth L. Urish, Trustee
Claire A. Walton, Trustee
Frederick W. Winter, Trustee
Barbara G. Novick, Trustee
John M. Perlowski, Trustee, President and Chief Executive Officer
Thomas Callahan, Vice President
Jennifer McGovern, Vice President
Neal J. Andrews, Chief Financial Officer
Jay M. Fife, Treasurer
Charles Park, Chief Compliance Officer
Fernanda Piedra, Anti-Money Laundering Compliance Officer
Benjamin Archibald, Secretary
Effective December 31, 2016, David O. Beim and and Dr. Matina S. Horner retired as Trustees of the Trust.
| | | | | | |
| | | | |
Investment Adviser and Administrator BlackRock Advisors, LLC Wilmington, DE 19809 | | Accounting Agent and Transfer Agent BNY Mellon Investment Servicing (US) Inc. Wilmington, DE 19809 | | Independent Registered Public Accounting Firm Deloitte & Touche LLP Philadelphia, PA 19103 | | Address of the Trust 100 Bellevue Parkway Wilmington, DE 19809 |
| | | | | | |
Custodian The Bank of New York Mellon New York, NY 10286 | | Distributor BlackRock Investments, LLC New York, NY 10022 | | Legal Counsel Sidley Austin LLP New York, NY 10019 | | |
Householding
The Funds will mail only one copy of shareholder documents, including prospectuses, annual and semi-annual reports and proxy statements, to shareholders with multiple accounts at the same address. This practice is commonly called “householding” and is intended to reduce expenses and eliminate duplicate mailings of shareholder documents. Mailings of your shareholder documents may be householded indefinitely unless you instruct us otherwise. If you do not want the mailing of these documents to be combined with those for other members of your household, please call the Funds at (800) 441-7762.
Availability of Quarterly Schedule of Investments
The Funds file their complete schedule of portfolio holdings with the SEC for the first and third quarters of each fiscal year on Form N-Q. The Funds’ Forms N-Q are available on the SEC’s website at http://www.sec.gov and may also be reviewed and copied at the SEC’s Public Reference Room in Washington, D.C. Information on the operation of the Public Reference Room or how to access documents on the SEC’s website without charge may be obtained by calling (800) SEC-0330. The Funds’ Forms N-Q may also be obtained upon request and without charge by calling (800) 441-7762.
| | | | | | |
| | | BLACKROCK FUNDS | | MARCH 31, 2017 | | 63 |
| | | | |
| Additional Information (concluded) | | | | |
|
| General Information (concluded) |
Availability of Proxy Voting Policies and Procedures
A description of the policies and procedures that the Funds use to determine how to vote proxies relating to portfolio securities is available upon request and without charge (1) by calling (800) 441-7762; (2) at http://www.blackrock.com; and (3) on the SEC’s website at http://www.sec.gov.
Availability of Proxy Voting Record
Information about how the Funds voted proxies relating to securities held in the Funds’ portfolios during the most recent 12-month period ended June 30 is available upon request and without charge (1) at http://www.blackrock.com; or by calling (800) 441-7762 and (2) on the SEC’s website at http://www.sec.gov.
BlackRock’s Mutual Fund Family
BlackRock offers a diverse lineup of open-end mutual funds crossing all investment styles and managed by experts in equity, fixed income and tax-exempt investing. Visit http://www.blackrock.com for more information.
Account Information
Call us at (800) 441-7762 from 8:00 AM to 6:00 PM ET on any business day to get information about your account balances, recent transactions and share prices. You can also reach us on the Web at http://www.blackrock.com/funds.
Automatic Investment Plans
Investor Class shareholders who want to invest regularly can arrange to have $50 or more automatically deducted from their checking or savings account and invested in any of the BlackRock funds.
Systematic Withdrawal Plans
Investor Class shareholders can establish a systematic withdrawal plan and receive periodic payments of $50 or more from their BlackRock funds, as long as their account balance is at least $10,000.
Retirement Plans
Shareholders may make investments in conjunction with Traditional, Rollover, Roth, Coverdell, Simple IRAs, SEP IRAs and 403(b) Plans.
|
| BlackRock Privacy Principles |
BlackRock is committed to maintaining the privacy of its current and former fund investors and individual clients (collectively, “Clients”) and to safeguarding their non-public personal information. The following information is provided to help you understand what personal information BlackRock collects, how we protect that information and why in certain cases we share such information with select parties.
If you are located in a jurisdiction where specific laws, rules or regulations require BlackRock to provide you with additional or different privacy-related rights beyond what is set forth below, then BlackRock will comply with those specific laws, rules or regulations.
BlackRock obtains or verifies personal non-public information from and about you from different sources, including the following: (i) information we receive from you or, if applicable, your financial intermediary, on applications, forms or other documents; (ii) information about your transactions with us, our affiliates, or others; (iii) information we receive from a consumer reporting agency; and (iv) from visits to our websites.
BlackRock does not sell or disclose to non-affiliated third parties any non-public personal information about its Clients, except as permitted by law or as is necessary to respond to regulatory requests or to service Client accounts. These non-affiliated third parties are required to protect the confidentiality and security of this information and to use it only for its intended purpose.
We may share information with our affiliates to service your account or to provide you with information about other BlackRock products or services that may be of interest to you. In addition, BlackRock restricts access to non-public personal information about its Clients to those BlackRock employees with a legitimate business need for the information. BlackRock maintains physical, electronic and procedural safeguards that are designed to protect the non-public personal information of its Clients, including procedures relating to the proper storage and disposal of such information.
| | | | | | |
| 64 | | BLACKROCK FUNDS | | MARCH 31, 2017 | | |
This report is intended for current holders. It is not authorized for use as an offer of sale or a solicitation of an offer to buy shares of a Fund unless preceded or accompanied by such Funds’ current prospectus. Past performance results shown in this report should not be considered a representation of future performance. Investment returns and principal value of shares will fluctuate so that shares, when redeemed, may be worth more or less than their original cost. Statements and other information herein are as dated and are subject to change.

| | |
| |
Eq-Midcap-3/17-SAR | |  |
MARCH 31, 2017
| | | | |
SEMI-ANNUAL REPORT (UNAUDITED) | | | | BLACKROCK® |
BlackRock FundsSM
▶ BlackRock Global Opportunities Portfolio
▶ BlackRock Health Sciences Opportunities Portfolio
▶ BlackRock International Opportunities Portfolio
▶ BlackRock Science & Technology Opportunities Portfolio
▶ BlackRock U.S. Opportunities Portfolio
| | |
| Not FDIC Insured ◾ May Lose Value ◾ No Bank Guarantee | | |
Dear Shareholder,
In the 12 months ended March 31, 2017, risk assets, such as stocks and high-yield bonds, delivered strong performance, while U.S. Treasuries and other higher-quality assets generated negative returns. Markets showed great resilience during a period with big surprises, including the United Kingdom’s vote to leave the European Union and the outcome of the U.S. presidential election, which brought only brief spikes in equity market volatility. The more rate-sensitive high-quality assets, however, struggled as rising energy prices, modest wage increases and steady U.S. job growth led to expectations of higher inflation and anticipation of interest rate increases by the U.S. Federal Reserve (the “Fed”).
The global reflationary theme — rising nominal growth, wages and inflation — was the dominant driver of asset returns during the period, outweighing significant political upheavals and uncertainty. Reflationary expectations accelerated after the U.S. election and continued into the beginning of 2017, stoked by expectations for an extra boost to U.S. growth via fiscal policy. The primary tension surfacing in markets in 2017 has been between reflationary expectations and the realities of fiscal and monetary policy. Markets have been turning their attention to the Fed’s outlook for additional interest rate hikes, while assessing the probability of Congress passing meaningful fiscal stimulus amid political division and a limited budget.
Although economic momentum is gaining traction, the capacity for rapid global growth is restrained by structural factors, including an aging population, low productivity growth and excess savings, as well as cyclical factors, like the Fed leaning toward higher interest rates and the length of the current expansion. Tempered economic growth and high valuations across most assets have set the stage for muted long-term investment returns going forward.
Equity markets still present opportunities, although the disparity between winners and losers is widening — a dynamic that increases the risk and return potential of active investing. Fixed income investors are also facing challenges as bond markets recalibrate for higher inflation expectations after eight years of deflationary concerns. And in a world where political risk and policy uncertainty abound, there is no lack of potential catalysts for higher volatility.
In this environment, investors need to think globally, extend their scope across a broad array of asset classes and be nimble as market conditions change. We encourage you to talk with your financial advisor and visit blackrock.com for further insight about investing in today’s markets.
Sincerely,

Rob Kapito
President, BlackRock Advisors, LLC

Rob Kapito
President, BlackRock Advisors, LLC
| | | | | | | | |
| Total Returns as of March 31, 2017 | |
| | | 6-month | | | 12-month | |
U.S. large cap equities
(S&P 500® Index) | | | 10.12% | | | | 17.17% | |
U.S. small cap equities
(Russell 2000® Index) | | | 11.52 | | | | 26.22 | |
International equities
(MSCI Europe, Australasia,
Far East Index) | | | 6.48 | | | | 11.67 | |
Emerging market
equities (MSCI Emerging
Markets Index) | | | 6.80 | | | | 17.21 | |
3-month Treasury bills
(BofA Merrill Lynch
3-Month U.S. Treasury
Bill Index) | | | 0.19 | | | | 0.36 | |
U.S. Treasury securities
(BofA Merrill Lynch 10-
Year U.S. Treasury Index) | | | (6.08) | | | | (3.97) | |
U.S. investment grade
bonds (Bloomberg Barclays
U.S. Aggregate Bond Index) | | | (2.18) | | | | 0.44 | |
Tax-exempt municipal
bonds (S&P Municipal
Bond Index) | | | (1.93) | | | | 0.55 | |
U.S. high yield bonds
(Bloomberg Barclays U.S.
Corporate High Yield 2%
Issuer Capped Index) | | | 4.50 | | | | 16.39 | |
|
| Past performance is no guarantee of future results. Index performance is shown for illustrative purposes only. You cannot invest directly in an index. | |
| | | | | | |
| 2 | | THIS PAGE NOT PART OF YOUR FUND REPORT | | | | |
| | |

| | Shareholders can sign up for e-mail notifications of quarterly statements, annual and semi-annual shareholder reports and prospectuses by enrolling in the electronic delivery program. Electronic copies of shareholder reports and prospectuses are also available on BlackRock’s website. TO ENROLL IN ELECTRONIC DELIVERY: Shareholders Who Hold Accounts with Investment Advisors, Banks or Brokerages: Please contact your financial advisor. Please note that not all investment advisors, banks or brokerages may offer this service. Shareholders Who Hold Accounts Directly with BlackRock: 1. Access the BlackRock website at blackrock.com 2. Select "Access Your Account" 3. Next, select "eDelivery" in the "Related Resources" box and follow the sign-up instructions |
| | | | | | |
| | | BLACKROCK FUNDS | | MARCH 31, 2017 | | 3 |
| | | | |
| Fund Summary as of March 31, 2017 | | | BlackRock Global Opportunities Portfolio | |
BlackRock Global Opportunities Portfolio’s (the “Fund”) investment objective is to provide long-term capital appreciation.
On March 23, 2017, the Board approved a proposal to change the name of BlackRock Global Opportunities Portfolio to BlackRock Advantage International Fund. The Board also approved certain changes to the Fund’s investment strategies. In addition, Fund management has determined to change the benchmark index against which the Fund compares its performance. These changes are expected to become effective on or about June 12, 2017.
|
| Portfolio Management Commentary |
How did the Fund perform?
| • | | For the six-month period ended March 31, 2017, the Fund underperformed its benchmark, the MSCI All Country World Index (“ACWI”). |
What factors influenced performance?
| • | | Stock selection decisions within the internet & direct marketing retail sub-industry group of the consumer discretionary sector were the largest detractors for the period. Within retail, the Fund’s position in privately held Indian online shopping website operator Jasper Infotech was revalued lower during the period. Negative stock selection within the brewers sub-industry group of the consumer staples sector also weighed on performance, as the Fund’s position in Anheuser-Busch InBev SA/NV declined after reporting earnings that were weaker than expected. |
| • | | Stock selection decisions within the semiconductors sub-industry group of the information technology (“IT”) sector and the diversified banks sub-industry group of the financials sector were the largest contributors to performance for the period. Within IT, wireless handset chip supplier Skyworks Solutions, Inc. drove positive relative returns after reporting |
| | | better-than-expected financial results and providing favorable forward guidance. Within financials, many of the Fund’s positions benefited from investor anticipation of higher interest rates and inflation across the globe, with Indian commercial banking institution Federal Bank Ltd. leading returns. |
Describe recent portfolio activity.
| • | | During the six-month period, the Fund increased its exposure to the financials and IT sectors. These trades were funded by reducing exposure to the consumer staples and consumer discretionary sectors. Regionally, the Fund’s exposure to the emerging markets was increased, and exposure to the Pacific Basin, Europe and North America was reduced. |
Describe portfolio positioning at period end.
| • | | Relative to the MSCI ACWI, the Fund ended the period with its largest overweight positions in the IT, materials, and energy sectors, while its largest underweight positions were in the industrials, consumer staples, and real estate sectors. From a regional perspective, the Fund had its most overweight position in the emerging markets and Europe and was most underweight in the Pacific Basin and North America. |
The views expressed reflect the opinions of BlackRock as of the date of this report and are subject to change based on changes in market, economic or other conditions. These views are not intended to be a forecast of future events and are no guarantee of future results.
| | | | |
| Ten Largest Holdings | | Percent of
Net Assets | |
Alphabet, Inc., Class C | | | 3% | |
Alibaba Group Holding Ltd. — ADR | | | 2 | |
Apple Inc. | | | 2 | |
Uber Technologies, Inc., Series D | | | 2 | |
Wells Fargo & Co. | | | 2 | |
Ping An Insurance Group Co. of China Ltd., H Shares | | | 1 | |
American International Group, Inc. | | | 1 | |
UniCredit SpA | | | 1 | |
Amazon.com, Inc. | | | 1 | |
Mastercard, Inc., Class A | | | 1 | |
| | | | |
| Geographic Allocation | | Percent of
Net Assets | |
United States | | | 50% | |
China | | | 7 | |
United Kingdom | | | 5 | |
Japan | | | 5 | |
India | | | 4 | |
Italy | | | 3 | |
Switzerland | | | 3 | |
France | | | 2 | |
Netherlands | | | 2 | |
South Korea | | | 2 | |
Hong Kong | | | 2 | |
Taiwan | | | 2 | |
Other1 | | | 13 | |
Liabilities in Excess of Other Assets2 | | | — | |
| | 1 | | Includes holdings within countries that are 1% or less of net assets. Please refer to the Schedule of Investments for such countries. |
| | | | | | |
| 4 | | BLACKROCK FUNDS | | MARCH 31, 2017 | | |
| | | | |
| | | | BlackRock Global Opportunities Portfolio | |
|
| Total Return Based on a $10,000 Investment |
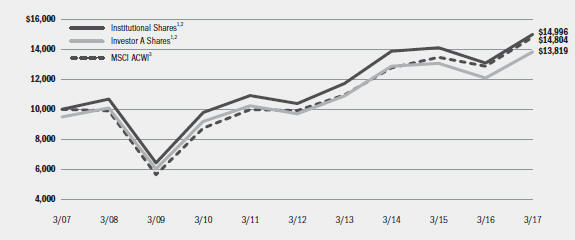
| | 1 | | Assuming maximum sales charges, if any, transaction costs and other operating expenses, including investment advisory fees and administration fees, if any. Institutional Shares do not have a sales charge. |
| | 2 | | Under normal conditions, the Fund will invest at least 75% of its total assets in global equity securities of any market capitalization, selected for their above-average return potential. The Fund may invest up to 25% of its total assets in stocks of issuers in emerging market countries. The Fund may invest up to 25% of its total assets in global fixed-income securities, including corporate bonds, U.S. Government debt securities, non-U.S. Government and supranational debt securities, asset-backed securities, mortgage-backed securities, emerging market debt securities and non-investment grade debt securities (high yield or junk bonds). |
| | 3 | | A free float-adjusted market capitalization weighted index that is designed to measure the equity market performance of developed and emerging markets. The MSCI ACWI consists of 46 country indexes comprising 23 developed and 23 emerging market country indexes. |
| | | | | | | | | | | | | | | | | | | | | | | | | | | | | | | | | | | |
| Performance Summary for the Period Ended March 31, 2017 | |
| | | | | Average Annual Total Returns4 |
| | | | | 1 Year | | 5 Years | | 10 Years |
| | | 6-Month
Total Returns | | w/o sales
charge | | w/ sales
charge | | w/o sales
charge | | w/ sales
charge | | w/o sales
charge | | w/ sales
charge |
Institutional | | | | 6.17 | % | | | | 14.76 | % | | | | N/A | | | | | 7.63 | % | | | | N/A | | | | | 4.14 | % | | | | N/A | |
Investor A | | | | 6.08 | | | | | 14.50 | | | | | 8.49 | % | | | | 7.36 | | | | | 6.21 | % | | | | 3.85 | | | | | 3.29 | % |
Investor C | | | | 5.58 | | | | | 13.52 | | | | | 12.52 | | | | | 6.49 | | | | | 6.49 | | | | | 3.03 | | | | | 3.03 | |
Class R | | | | 5.84 | | | | | 14.01 | | | | | N/A | | | | | 6.95 | | | | | N/A | | | | | 3.41 | | | | | N/A | |
MSCI ACWI | | | | 8.18 | | | | | 15.04 | | | | | N/A | | | | | 8.37 | | | | | N/A | | | | | 4.00 | | | | | N/A | |
| | 4 | | Assuming maximum sales charges, if any. Average annual total returns with and without sales charges reflect reductions for distribution and service fees. See “About Fund Performance” on page 14 for a detailed description of share classes, including any related sales charges and fees. |
| | | | N/A—Not applicable as share class and index do not have a sales charge. |
| | | | Past performance is not indicative of future results. |
| | | | Performance results may include adjustments made for financial reporting purposes in accordance with U.S. generally accepted accounting principles. |
| | | | | | | | | | | | | | |
| Expense Example | | | | | | | | | | | | | | |
| | | Actual | | Hypothetical6 | | |
| | | Beginning
Account Value
October 1, 2016 | | Ending
Account Value
March 31, 2017 | | Expenses Paid
During the Period5 | | Beginning
Account Value
October 1, 2016 | | Ending
Account Value
March 31, 2017 | | Expenses Paid
During the Period5 | | Annualized
Expense
Ratio |
Institutional | | $1,000.00 | | $1,061.70 | | $ 5.43 | | $1,000.00 | | $1,019.59 | | $ 5.32 | | 1.06% |
Investor A | | $1,000.00 | | $1,060.80 | | $ 6.81 | | $1,000.00 | | $1,018.25 | | $ 6.67 | | 1.33% |
Investor C | | $1,000.00 | | $1,055.80 | | $10.94 | | $1,000.00 | | $1,014.22 | | $10.72 | | 2.14% |
Class R | | $1,000.00 | | $1,058.40 | | $ 8.80 | | $1,000.00 | | $1,016.31 | | $ 8.62 | | 1.72% |
| | 5 | | For each class of the Fund, expenses are equal to the annualized expense ratio for the class, multiplied by the average account value over the period, multiplied by 182/365 (to reflect the one-half year period shown). |
| | 6 | | Hypothetical 5% annual return before expenses is calculated by prorating the number of days in the most recent fiscal half year divided by 365. |
| | | | See “Disclosure of Expenses” on page 15 for further information on how expenses were calculated. |
| | | | | | |
| | | BLACKROCK FUNDS | | MARCH 31, 2017 | | 5 |
| | | | |
| Fund Summary as of March 31, 2017 | | | BlackRock Health Sciences Opportunities Portfolio | |
BlackRock Health Sciences Opportunities Portfolio’s (the “Fund”) investment objective is to provide long-term growth of capital.
|
| Portfolio Management Commentary |
How did the Fund perform?
| • | | For the six-month period ended March 31, 2017, the Fund’s Institutional, Service, Investor A and Class K Shares outperformed its benchmark, the Russell 3000® Health Care Index, while Investor B, Investor C and Class R Shares underperformed the benchmark. |
What factors influenced performance?
| • | | The largest positive contribution came from the health care providers & services sub-sector, where the Fund benefited from an overweight in the managed care industry and stock selection in health care services. Selection was led by overweight positions in Quest Diagnostics, Inc. and the home health operator Amedisys, Inc., both of which reported solid financial results. An underweight position in Express Scripts Holding Co. was an additional positive. |
| • | | The Fund also added value in biotechnology. Positive clinical developments boosted several holdings, including Vertex Pharmaceuticals, Inc., AveXis, Inc. and TESARO, Inc. An underweight to Gilead Sciences, Inc., which underperformed on concerns about its falling share of the Hepatitis-C market, also aided relative performance. |
| • | | The Fund’s positioning in the pharmaceuticals sub-sector had the largest adverse impact on relative performance. While the Fund generated gains from several of its specialty pharmaceutical holdings such as Jazz Pharmaceuticals PLC and Allergan PLC, this was offset by an underweight allocation in several stocks with large weightings in the benchmark, such as Johnson & Johnson, Eli Lilly & Co. and Bristol-Myers Squibb Co. Over-weight |
| | | positions in several non-U.S. stocks — including AstraZeneca PLC, Roche Holding AG and Teva Pharmaceutical Industries Ltd. — were an additional negative. |
| • | | Positioning in the medical devices & supplies sub-sector also hampered relative performance, as several holdings in the healthcare equipment industry — including Medtronic PLC, Edwards Lifesciences Corp. and Boston Scientific Corp. — came under selling pressure after Edwards reported mixed financial results. |
Describe recent portfolio activity.
| • | | The Fund increased its weightings in the health care providers & services and biotechnology industries, while it reduced its positions in medical devices & supplies and pharmaceuticals. As always, these allocation shifts were the result of the Fund’s bottom-up investment process and focus on individual company fundamentals. |
Describe portfolio positioning at period end.
| • | | The investment adviser continued to employ a bottom-up, fundamental investment process in an effort to build a diversified portfolio. The Fund’s largest overweight relative to the Russell 3000® Health Care Index was in the healthcare providers & services sub-sector, which was primarily the result of an overweight in the managed care industry. The Fund was also overweight in biotechnology stocks, and it had a slight underweight in the medical devices & supplies sub-sector. The Fund maintained a structural underweight to the pharmaceutical industry given the benchmark’s large allocation to this area. |
The views expressed reflect the opinions of BlackRock as of the date of this report and are subject to change based on changes in market, economic or other conditions. These views are not intended to be a forecast of future events and are no guarantee of future results.
| | | | |
| Ten Largest Holdings | | Percent of
Net Assets | |
UnitedHealth Group, Inc. | | | 7% | |
Medtronic PLC | | | 5 | |
Pfizer, Inc. | | | 4 | |
Celgene Corp. | | | 4 | |
Amgen, Inc. | | | 4 | |
Boston Scientific Corp. | | | 3 | |
Allergan PLC | | | 3 | |
Stryker Corp. | | | 3 | |
Baxter International, Inc. | | | 3 | |
Humana, Inc. | | | 3 | |
| | | | |
| Industry Allocation | | Percent of
Net Assets | |
Health Care Providers & Services | | | 28% | |
Biotechnology | | | 25 | |
Health Care Equipment & Supplies | | | 22 | |
Pharmaceuticals | | | 21 | |
Life Sciences Tools & Services | | | 2 | |
Other Mutual Funds | | | 2 | |
Other Assets Less Liabilities1 | | | — | |
For Fund compliance purposes, the Fund’s industry classifications refer to one or more of the industry sub-classifications used by one or more widely recognized market indexes or ratings group indexes, and/or as defined by the investment adviser. These definitions may not apply for purposes of this report, which may combine such industry sub-classifications for reporting ease.
| | | | | | |
| 6 | | BLACKROCK FUNDS | | MARCH 31, 2017 | | |
| | | | |
| | | | BlackRock Health Sciences Opportunities Portfolio | |
|
| Total Return Based on a $10,000 Investment |
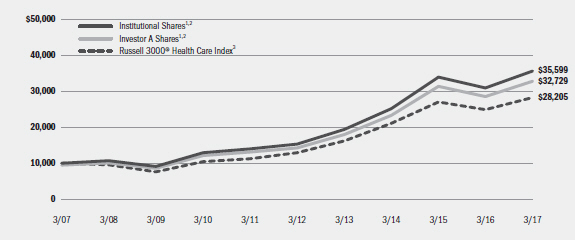
| | 1 | | Assuming maximum sales charges, if any, transaction costs and other operating expenses, including investment advisory fees and administration fees, if any. Institutional Shares do not have a sales charge. |
| | 2 | | Under normal market conditions, the Fund invests at least 80% of its total assets in equity securities, primarily common stock, of companies in health sciences and related industries. |
| | 3 | | An unmanaged index that features companies involved in medical services or health care in the Russell 3000® Index, which includes the largest 3,000 U.S. companies as determined by total market capitalization. |
| | | | | | | | | | | | | | | | | | | | | | | | | | | | | | | | | | | |
| Performance Summary for the Period Ended March 31, 2017 | |
| | | | | Average Annual Total Returns4 |
| | | | | 1 Year | | 5 Years | | 10 Years |
| | | 6-Month
Total Returns | | w/o sales
charge | | w/ sales
charge | | w/o sales
charge | | w/ sales
charge | | w/o sales
charge | | w/ sales
charge |
Institutional | | | | 4.55 | % | | | | 15.25 | % | | | | N/A | | | | | 18.42 | % | | | | N/A | | | | | 13.54 | % | | | | N/A | |
Service | | | | 4.39 | | | | | 14.94 | | | | | N/A | | | | | 18.08 | | | | | N/A | | | | | 13.19 | | | | | N/A | |
Investor A | | | | 4.39 | | | | | 14.92 | | | | | 8.89 | % | | | | 18.09 | | | | | 16.82 | % | | | | 13.20 | | | | | 12.59 | % |
Investor B | | | | 3.91 | | | | | 13.96 | | | | | 9.46 | | | | | 17.14 | | | | | 16.93 | | | | | 12.48 | | | | | 12.48 | |
Investor C | | | | 4.01 | | | | | 14.07 | | | | | 13.07 | | | | | 17.24 | | | | | 17.24 | | | | | 12.38 | | | | | 12.38 | |
Class K | | | | 4.59 | | | | | 15.35 | | | | | N/A | | | | | 18.53 | | | | | N/A | | | | | 13.64 | | | | | N/A | |
Class R | | | | 4.24 | | | | | 14.54 | | | | | N/A | | | | | 17.71 | | | | | N/A | | | | | 12.75 | | | | | N/A | |
Russell 3000® Health Care Index | | | | 4.30 | | | | | 13.25 | | | | | N/A | | | | | 16.95 | | | | | N/A | | | | | 10.93 | | | | | N/A | |
| | 4 | | Assuming maximum sales charges, if any. Average annual total returns with and without sales charges reflect reductions for distribution and service fees. See “About Fund Performance” on page 14 for a detailed description of share classes, including any related sales charges and fees. |
| | | | N/A—Not applicable as share class and index do not have a sales charge. |
| | | | Past performance is not indicative of future results. |
| | | | Performance results may include adjustments made for financial reporting purposes in accordance with U.S. generally accepted accounting principles. |
| | | | | | | | | | | | | | |
| Expense Example | | | | | | | | | | | | | | |
| | | Actual | | Hypothetical6 | | |
| | | Beginning
Account Value
October 1, 2016 | | Ending
Account Value
March 31, 2017 | | Expenses Paid
During the Period5 | | Beginning
Account Value
October 1, 2016 | | Ending
Account Value
March 31, 2017 | | Expenses Paid
During the Period5 | | Annualized
Expense Ratio |
Institutional | | $1,000.00 | | $1,045.50 | | $ 4.58 | | $1,000.00 | | $1,020.39 | | $ 4.52 | | 0.90% |
Service | | $1,000.00 | | $1,043.90 | | $ 5.95 | | $1,000.00 | | $1,019.05 | | $ 5.87 | | 1.17% |
Investor A | | $1,000.00 | | $1,043.90 | | $ 5.95 | | $1,000.00 | | $1,019.05 | | $ 5.87 | | 1.17% |
Investor B | | $1,000.00 | | $1,039.10 | | $10.55 | | $1,000.00 | | $1,014.52 | | $10.42 | | 2.08% |
Investor C | | $1,000.00 | | $1,040.10 | | $ 9.64 | | $1,000.00 | | $1,015.42 | | $ 9.52 | | 1.90% |
Class K | | $1,000.00 | | $1,045.90 | | $ 3.97 | | $1,000.00 | | $1,020.98 | | $ 3.92 | | 0.78% |
Class R | | $1,000.00 | | $1,042.40 | | $ 7.57 | | $1,000.00 | | $1,017.45 | | $ 7.47 | | 1.49% |
| | 5 | | For each class of the Fund, expenses are equal to the annualized expense ratio for the class, multiplied by the average account value over the period, multiplied by 182/ 365 (to reflect the one-half year period shown). The fees and expenses of the underlying funds in which the Fund invests are not included in the Fund’s annualized expense ratio. |
| | 6 | | Hypothetical 5% annual return before expenses is calculated by prorating the number of days in the most recent fiscal half year divided by 365. |
| | | | See “Disclosure of Expenses” on page 15 for further information on how expenses were calculated. |
| | | | | | |
| | | BLACKROCK FUNDS | | MARCH 31, 2017 | | 7 |
| | | | |
| Fund Summary as of March 31, 2017 | | | BlackRock International Opportunities Portfolio | |
BlackRock International Opportunities Portfolio’s (the “Fund”) investment objective is to seek long-term capital appreciation.
On March 23, 2017, the Board approved a proposal to change the name of BlackRock International Opportunities Portfolio to BlackRock International Dividend Fund. The Board also approved certain changes to the Fund’s investment objective and investment strategies. These changes are expected to become effective on or about June 12, 2017.
|
| Portfolio Management Commentary |
How did the Fund perform?
| • | | For the six-month period ended March 31, 2017, the Fund underperformed its benchmark, the MSCI All Country World Index (“ACWI”) ex-U.S. |
What factors influenced performance?
| • | | Stock selection decisions within the internet & direct marketing retail sub-industry group of the consumer discretionary sector were the largest detractors for the period. Within retail, the Fund’s position in privately held Indian online shopping website operator Jasper Infotech was revalued lower during the period. Stock selection decisions in the life & health insurance sub-industry group of the financials sector also weighed on performance, with the Fund’s significant overweight position in Asian insurer AIA Group Ltd. the biggest laggard. |
| • | | The largest contributor to performance was the Fund’s position in the WisdomTree Japan Hedged ETF, which represented a tactical bet on the Japan region. The Fund’s lack of exposure to the water utilities sub-industry group of the utilities sector also had a positive effect on |
| | | performance as utilities stocks underperformed the broader market against a backdrop of rising interest rates. |
Describe recent portfolio activity.
| • | | During the six-month period, the Fund increased its exposure to the information technology (“IT”) and financials sectors. These trades were funded by reducing exposure to the consumer staples and telecommunication services sectors. Regionally, the Fund’s exposure to emerging markets and the Pacific Basin was increased, while exposure to Europe and North America was reduced. |
Describe portfolio positioning at period end.
| • | | Relative to the MSCI ACWI ex-U.S., the Fund ended the period with its largest overweight positions in the IT, financials and energy sectors, while its largest underweight positions were in the utilities, industrials and health care sectors. From a regional perspective, the Fund had overweight positions in Europe, the emerging markets and North America, and was underweight in the Pacific Basin. |
The views expressed reflect the opinions of BlackRock as of the date of this report and are subject to change based on changes in market, economic or other conditions. These views are not intended to be a forecast of future events and are no guarantee of future results.
| | | | | |
| Ten Largest Holdings | | Percent of Net Assets |
WisdomTree Japan Hedged Equity Fund | | | | 3 | % |
Royal Dutch Shell PLC, B Shares | | | | 2 | |
Ping An Insurance Group Co. of China Ltd., H Shares | | | | 2 | |
Nestle SA, Registered Shares | | | | 2 | |
Samsung Electronics Co. Ltd. | | | | 2 | |
AXA SA | | | | 2 | |
Eni SpA | | | | 2 | |
Liberty Global PLC | | | | 2 | |
UBS Group AG, Registered Shares | | | | 2 | |
Alibaba Group Holding Ltd. — ADR | | | | 2 | |
| | | | | |
| Geographic Allocation | | Percent of
Net Assets |
United Kingdom | | | | 12 | % |
China | | | | 9 | |
United States | | | | 8 | |
Japan | | | | 7 | |
France | | | | 7 | |
Netherlands | | | | 7 | |
Switzerland | | | | 6 | |
Italy | | | | 5 | |
India | | | | 5 | |
Germany | | | | 4 | |
Ireland | | | | 3 | |
Canada | | | | 3 | |
South Korea | | | | 3 | |
Taiwan | | | | 2 | |
Hong Kong | | | | 2 | |
Other1 | | | | 16 | |
Other Assets Less Liabilities | | | | 1 | |
| | 1 | | Includes holdings within countries that are 1% or less of net assets. Please refer to the Schedule of Investments for such countries. |
| | | | | | |
| 8 | | BLACKROCK FUNDS | | MARCH 31, 2017 | | |
| | |
| | | BlackRock International Opportunities Portfolio |
|
| Total Return Based on a $10,000 Investment |
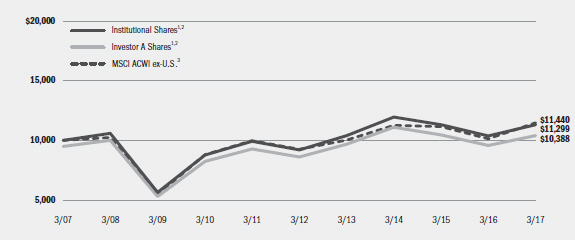
| | 1 | | Assuming maximum sales charges, if any, transaction costs and other operating expenses, including investment advisory fees and administration fees, if any. Institutional Shares do not have a sales charge. |
| | 2 | | Under normal market conditions, the Fund invests at least 80% of its net assets in equity securities issued by foreign companies of any market capitalization. The Fund may invest up to 40% of its net assets in stocks of issuers in emerging market countries. |
| | 3 | | A free float-adjusted market capitalization weighted index designed to measure the combined equity market performance of developed and emerging market countries, excluding the United States. |
| | | | | | | | | | | | | | | | | | | | | | | | | | | | | | | | | | | |
| Performance Summary for the Period Ended March 31, 2017 | |
| | | | | Average Annual Total Returns4 |
| | | | | 1 Year | | 5 Years | | 10 Years |
| | | 6-Month
Total Returns | | w/o sales
charge | | w/ sales
charge | | w/o sales
charge | | w/ sales
charge | | w/o sales
charge | | w/ sales
charge |
Institutional | | | | 1.57 | % | | | | 9.10 | % | | | | N/A | | | | | 4.19 | % | | | | N/A | | | | | 1.23 | % | | | | N/A | |
Service | | | | 1.41 | | | | | 8.78 | | | | | N/A | | | | | 3.82 | | | | | N/A | | | | | 0.86 | | | | | N/A | |
Investor A | | | | 1.40 | | | | | 8.75 | | | | | 3.04 | % | | | | 3.87 | | | | | 2.75 | % | | | | 0.92 | | | | | 0.38 | % |
Investor B | | | | 0.96 | | | | | 7.79 | | | | | 3.29 | | | | | 2.99 | | | | | 2.64 | | | | | 0.28 | | | | | 0.28 | |
Investor C | | | | 1.04 | | | | | 7.96 | | | | | 6.96 | | | | | 3.09 | | | | | 3.09 | | | | | 0.16 | | | | | 0.16 | |
MSCI ACWI ex-U.S | | | | 6.51 | | | | | 13.13 | | | | | N/A | | | | | 4.36 | | | | | N/A | | | | | 1.35 | | | | | N/A | |
| | 4 | | Assuming maximum sales charges, if any. Average annual total returns with and without sales charges reflect reductions for distribution and service fees. See “About Fund Performance” on page 14 for a detailed description of share classes, including any related sales charges and fees. |
| | | | N/A—Not applicable as share class and index do not have a sales charge. |
| | | | Past performance is not indicative of future results. |
| | | | Performance results may include adjustments made for financial reporting purposes in accordance with U.S. generally accepted accounting principles. |
| | | | | | | | | | | | | | |
| Expense Example | | | | | | | | | | | | | | |
| | | Actual | | Hypothetical6 | | |
| | | Beginning
Account Value
October 1, 2016 | | Ending
Account Value
March 31, 2017 | | Expenses Paid
During the Period5 | | Beginning
Account Value
October 1, 2016 | | Ending
Account Value
March 31, 2017 | | Expenses Paid
During the Period5 | | Annualized
Expense Ratio |
Institutional | | $1,000.00 | | $1,015.70 | | $ 5.31 | | $1,000.00 | | $1,019.59 | | $ 5.32 | | 1.06% |
Service | | $1,000.00 | | $1,014.10 | | $ 6.96 | | $1,000.00 | | $1,017.95 | | $ 6.97 | | 1.39% |
Investor A | | $1,000.00 | | $1,014.00 | | $ 6.96 | | $1,000.00 | | $1,017.95 | | $ 6.97 | | 1.39% |
Investor B | | $1,000.00 | | $1,009.60 | | $11.24 | | $1,000.00 | | $1,013.67 | | $11.26 | | 2.25% |
Investor C | | $1,000.00 | | $1,010.40 | | $10.65 | | $1,000.00 | | $1,014.27 | | $10.67 | | 2.13% |
| | 5 | | For each class of the Fund, expenses are equal to the annualized expense ratio for the class, multiplied by the average account value over the period, multiplied by 182/ 365 (to reflect the one-half year period shown). |
| | 6 | | Hypothetical 5% annual return before expenses is calculated by prorating the number of days in the most recent fiscal half year divided by 365. |
| | | | See “Disclosure of Expenses” on page 15 for further information on how expenses were calculated. |
| | | | | | |
| | | BLACKROCK FUNDS | | MARCH 31, 2017 | | 9 |
| | | | |
| Fund Summary as of March 31, 2017 | | | BlackRock Science & Technology Opportunities Portfolio | |
BlackRock Science & Technology Opportunities Portfolio’s (the “Fund”) investment objective is to provide long-term capital appreciation.
|
| Portfolio Management Commentary |
How did the Fund perform?
| • | | For the six-month period ended March 31, 2017, the Fund underformed its benchmark, the MSCI World Information Technology Index. |
What factors influenced performance?
| • | | Stock selection within software & services was the largest detractor for the period. The Fund’s position in mobile application developer DeNA Co. lost value as questions were raised regarding the credibility of some of its platform content. Stock selection decisions within the internet & direct marketing retail group within the consumer discretionary sector also detracted from performance. Within the group, the Fund’s position in privately held Indian online shopping website operator Jasper Infotech was revalued lower during the period. |
| • | | Stock selection within the semiconductors group was the most significant contributor to performance. In particular, the Fund’s underweight position in major benchmark constituent Qualcomm Inc. helped relative returns. Stock selection within the technology hardware & equipment group also contributed positively to performance, with the Fund’s position in commercial laser company Coherent Inc. benefiting from financial results that were better than expected. |
Describe recent portfolio activity.
| • | | During the six-month period, the Fund increased its exposure to the internet retailing industry within consumer discretionary and the semiconductors group, while reducing its exposure to the technology hardware & equipment and software & services groups. From a regional perspective, these trades resulted in increased exposure to emerging markets and reduced exposure to the Pacific Basin and North America. |
Describe portfolio positioning at period end.
| • | | The Fund’s positioning at the end of the period reflected a focus on companies in the software & services industry group, particularly idiosyncratic opportunities within the internet software & services and application software sub-industries. The Fund also had a significant position in steadier, stable cash flow businesses within the semiconductor & semiconductor equipment and technology hardware & equipment industry groups. Regionally, the portfolio was underweight North America and the Pacific Basin relative to the benchmark, and overweight to names in the emerging markets. |
The views expressed reflect the opinions of BlackRock as of the date of this report and are subject to change based on changes in market, economic or other conditions. These views are not intended to be a forecast of future events and are no guarantee of future results.
| | |
| Ten Largest Holdings | | Percent of
Net Assets |
Apple Inc. | | 6% |
Alphabet, Inc., Class A | | 6 |
Microsoft Corp. | | 5 |
Amazon.com, Inc. | | 4 |
Tencent Holdings Ltd. | | 3 |
Facebook, Inc., Class A | | 3 |
Alibaba Group Holding Ltd. — ADR | | 3 |
Visa, Inc., Class A | | 2 |
salesforce.com, Inc. | | 2 |
Mastercard, Inc., Class A | | 2 |
| | |
| Industry Allocation | | Percent of
Net Assets |
Internet Software & Services | | 24% |
Software | | 23 |
Semiconductors & Semiconductor Equipment | | 21 |
Technology Hardware, Storage & Peripherals | | 8 |
IT Services | | 8 |
Internet & Direct Marketing Retail | | 8 |
Electronic Equipment, Instruments & Components | | 3 |
Communications Equipment | | 2 |
Media | | 1 |
Household Durables | | 1 |
Other Mutual Funds | | 1 |
Other Assets Less Liabilities1 | | — |
For Fund compliance purposes, the Fund’s industry classifications refer to one or more of the industry sub-classifications used by one or more widely recognized market indexes or ratings group indexes, and/or as defined by the investment adviser. These definitions may not apply for purposes of this report, which may combine such industry sub-classifications for reporting ease.
| | | | | | |
| 10 | | BLACKROCK FUNDS | | MARCH 31, 2017 | | |
| | | | |
| | | | BlackRock Science & Technology Opportunities Portfolio | |
|
| Total Return Based on a $10,000 Investment |
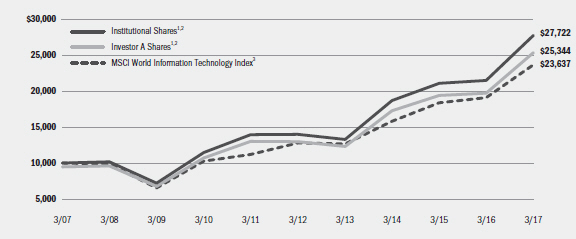
| | 1 | | Assuming maximum sales charges, if any, transaction costs and other operating expenses, including investment advisory fees and administration fees, if any. Institutional Shares do not have a sales charge. |
| | 2 | | Under normal market conditions, the Fund invests at least 80% of its net assets in equity securities issued by U.S. and non-U.S. science and technology companies in all market capitalization ranges, selected for their rapid and sustainable growth potential from the development, advancement and use of science and/or use of technology. The Fund may invest up to 25% of its net assets in emerging market countries. |
| | 3 | | An index that measures the performance of the technology sector in developed equity markets. |
| | | | | | | | | | | | | | | | | | | | | | | | | | | | | | | | | | | |
| Performance Summary for the Period Ended March 31, 2017 | | | | | | | | | | | | | | | | | | | | | | | | | | | | | | | | | | | |
| | | | | Average Annual Total Returns4 |
| | | | | 1 Year | | 5 Years | | 10 Years |
| | | 6-Month
Total Returns | | w/o sales charge | | w/ sales charge | | w/o sales charge | | w/ sales charge | | w/o sales charge | | w/ sales charge |
Institutional | | | | 10.98 | % | | | | 29.15 | % | | | | N/A | | | | | 14.70 | % | | | | N/A | | | | | 10.73 | % | | | | N/A | |
Service | | | | 10.40 | | | | | 28.80 | | | | | N/A | | | | | 14.45 | | | | | N/A | | | | | 10.44 | | | | | N/A | |
Investor A | | | | 10.38 | | | | | 28.71 | | | | | 21.95 | % | | | | 14.35 | | | | | 13.13 | % | | | | 10.34 | | | | | 9.75 | % |
Investor C | | | | 9.98 | | | | | 27.71 | | | | | 26.71 | | | | | 13.39 | | | | | 13.39 | | | | | 9.39 | | | | | 9.39 | |
Class R | | | | 10.31 | | | | | 28.35 | | | | | N/A | | | | | 14.03 | | | | | N/A | | | | | 10.01 | | | | | N/A | |
MSCI World Information Technology Index | | | | 12.49 | | | | | 23.92 | | | | | N/A | | | | | 13.08 | | | | | N/A | | | | | 8.98 | | | | | N/A | |
| | 4 | | Assuming maximum sales charges, if any. Average annual total returns with and without sales charges reflect reductions for distribution and service fees. See “About Fund Performance” on page 14 for a detailed description of share classes, including any related sales charges and fees. |
| | | | N/A—Not applicable as share class and index do not have a sales charge. |
| | | | Past performance is not indicative of future results. |
| | | | Performance results may include adjustments made for financial reporting purposes in accordance with U.S. generally accepted accounting principles. |
| | | | | | | | | | | | | | |
| Expense Example | | | | | | | | | | | | | | |
| | | Actual | | Hypothetical6 | | |
| | | Beginning
Account Value
October 1, 2016 | | Ending
Account Value
March 31, 2017 | | Expenses Paid
During the Period5 | | Beginning
Account Value
October 1, 2016 | | Ending
Account Value
March 31, 2017 | | Expenses Paid
During the Period5 | | Annualized
Expense
Ratio |
Institutional | | $1,000.00 | | $1,109.20 | | $ 6.40 | | $1,000.00 | | $1,018.80 | | $ 6.12 | | 1.22% |
Service | | $1,000.00 | | $1,107.50 | | $ 7.81 | | $1,000.00 | | $1,017.45 | | $ 7.47 | | 1.49% |
Investor A | | $1,000.00 | | $1,107.10 | | $ 8.02 | | $1,000.00 | | $1,017.26 | | $ 7.67 | | 1.53% |
Investor C | | $1,000.00 | | $1,103.60 | | $11.98 | | $1,000.00 | | $1,013.48 | | $11.46 | | 2.29% |
Class R | | $1,000.00 | | $1,103.10 | | $ 9.52 | | $1,000.00 | | $1,015.81 | | $ 9.12 | | 1.82% |
| | 5 | | For each class of the Fund, expenses are equal to the annualized expense ratio for the class, multiplied by the average account value over the period, multiplied by 182/ 365 (to reflect the one-half year period shown). |
| | 6 | | Hypothetical 5% annual return before expenses is calculated by prorating the number of days in the most recent fiscal half year divided by 365. |
| | | | See “Disclosure of Expenses” on page 15 for further information on how expenses were calculated. |
| | | | | | |
| | | BLACKROCK FUNDS | | MARCH 31, 2017 | | 11 |
| | | | |
| Fund Summary as of March 31, 2017 | | | BlackRock U.S. Opportunities Portfolio | |
BlackRock U.S. Opportunities Portfolio’s (the “Fund”) investment objective is to provide long-term capital appreciation.
On March 23, 2017, the Board approved a proposal to change the name of BlackRock U.S. Opportunities Portfolio to BlackRock High Equity Income Fund. The Board also approved certain changes to the Fund’s investment objective and investment strategies. In addition, Fund management has determined to change the benchmark index against which the Fund compares its performance. These changes are expected to become effective on or about June 12, 2017.
|
| Portfolio Management Commentary |
How did the Fund perform?
| • | | For the six-month period ended March 31, 2017, the Fund underperformed the benchmark, the Russell Midcap® Index. |
What factors influenced performance?
| • | | Stock selection within the construction machinery & heavy trucks sub-industry group of the industrials sector was a leading detractor from performance for the period. In addition, stock selection within the textiles, apparel & luxury goods sub-industry group of the consumer discretionary sector was a significant negative contributor. Among industrials, shares of manufacturer Westinghouse Air Brake Technologies Corp. declined after the company reported financial results that were weaker than expected. Among the Fund’s holdings in the consumer discretionary sector, shares of luxury apparel company Sequential Brands Group, Inc. fell after the company reduced its revenue guidance. |
| • | | The Fund’s overweight allocation to the semiconductors & semiconductor equipment sub-industry group of the information technology (“IT”) |
sector was the most significant positive contributor to performance during the period. Stock selection within the property & casualty insurance sub-industry group of the financials sector also contributed positively. Within the group, the Fund’s position in bond insurance provider Assured Guaranty Ltd. benefited from reflationary expectations following the November U.S. election.
Describe recent portfolio activity.
| • | | During the six-month period, the Fund increased its exposures to the materials and IT sectors, while reducing exposures to the consumer staples and real estate sectors. |
Describe portfolio positioning at period end.
| • | | Relative to the Russell Midcap® Index, the Fund ended the period with its largest overweight positions in the IT, materials and energy sectors, while maintaining its largest underweight positions in the real estate, utilities and industrials sectors. |
The views expressed reflect the opinions of BlackRock as of the date of this report and are subject to change based on changes in market, economic or other conditions. These views are not intended to be a forecast of future events and are no guarantee of future results.
| | |
| Ten Largest Holdings | | Percent of
Total Investments1 |
Uber Technologies, Inc., Series D | | 1% |
AdvancePierre Foods Holdings, Inc. | | 1 |
Hartford Financial Services Group, Inc. | | 1 |
BankUnited, Inc. | | 1 |
SVB Financial Group | | 1 |
Pioneer Natural Resources Co. | | 1 |
Diamondback Energy, Inc. | | 1 |
Equinix, Inc. | | 1 |
Quest Diagnostics, Inc. | | 1 |
Concho Resources, Inc. | | 1 |
| | 1 | | Total investments exclude short-term securities. |
| | |
| Sector Allocation | | Percent of
Net Assets |
Information Technology | | 22% |
Consumer Discretionary | | 16 |
Financials | | 11 |
Industrials | | 11 |
Materials | | 9 |
Health Care | | 8 |
Energy | | 8 |
Real Estate | | 6 |
Consumer Staples | | 4 |
Utilities | | 3 |
Short-Term Securities | | 2 |
Telecommunication Services | | 1 |
Liabilities in Excess of Other Assets | | (1) |
For Fund compliance purposes, the Fund’s sector classifications refer to one or more of the sector sub-classifications used by one or more widely recognized market indexes or ratings group indexes, and/or as defined by the investment adviser. These definitions may not apply for purposes of this report, which may combine such sector sub-classifications for reporting ease.
| | | | | | |
| 12 | | BLACKROCK FUNDS | | MARCH 31, 2017 | | |
| | | | |
| | | | BlackRock U.S. Opportunities Portfolio | |
|
| Total Return Based on a $10,000 Investment |
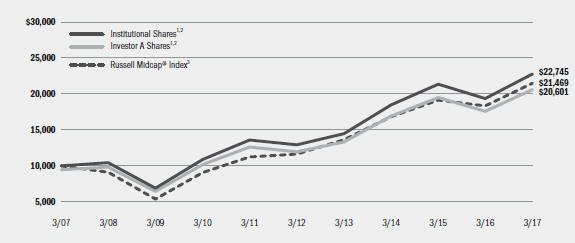
| | 1 | | Assuming maximum sales charges, if any, transaction costs and other operating expenses, including investment advisory fees and administration fees, if any. Institutional Shares do not have a sales charge. |
| | 2 | | Under normal market conditions, the Fund invests at least 80% of its net assets in equity securities issued by U.S. emerging capitalization companies with relatively attractive earnings growth potential and valuation. |
| | 3 | | A market index that measures the performance of the mid-cap segment of the U.S. equities universe. It is a subset of the Russell 1000® Index including approximately 800 of the smallest securities based on a combination of their market cap and current index membership. The Russell Midcap® Index represents approximately 31% of the total market capitalization of the Russell 1000® companies. |
| | | | | | | | | | | | | | | | | | | | | | | | | | | | | | | | | | | |
| Performance Summary for the Period Ended March 31, 2017 | |
| | | | | Average Annual Total Returns4 |
| | | | | 1 Year | | 5 Years | | 10 Years |
| | | 6-Month
Total Returns | | w/o sales
charge | | w/ sales
charge | | w/o sales
charge | | w/ sales
charge | | w/o sales
charge | | w/ sales
charge |
Institutional | | | | 7.68 | % | | | | 17.70 | % | | | | N/A | | | | | 11.96 | % | | | | N/A | | | | | 8.56 | % | | | | N/A | |
Service | | | | 7.51 | | | | | 17.25 | | | | | N/A | | | | | 11.50 | | | | | N/A | | | | | 8.10 | | | | | N/A | |
Investor A | | | | 7.49 | | | | | 17.25 | | | | | 11.10 | % | | | | 11.51 | | | | | 10.31 | % | | | | 8.08 | | | | | 7.49 | % |
Investor B | | | | 7.11 | | | | | 16.42 | | | | | 11.92 | | | | | 10.64 | | | | | 10.40 | | | | | 7.41 | | | | | 7.41 | |
Investor C | | | | 7.15 | | | | | 16.41 | | | | | 15.41 | | | | | 10.68 | | | | | 10.68 | | | | | 7.28 | | | | | 7.28 | |
Russell Midcap® Index | | | | 8.52 | | | | | 17.03 | | | | | N/A | | | | | 13.09 | | | | | N/A | | | | | 7.94 | | | | | N/A | |
| | 4 | | Assuming maximum sales charges, if any. Average annual total returns with and without sales charges reflect reductions for distribution and service fees. See “About Fund Performance” on page 14 for a detailed description of share classes, including any related sales charges and fees. |
| | | | N/A—Not applicable as share class and index do not have a sales charge. |
| | | | Past performance is not indicative of future results. |
| | | | Performance results may include adjustments made for financial reporting purposes in accordance with U.S. generally accepted accounting principles. |
| | | | | | | | | | | | | | |
| Expense Example | | | | | | | | | | | | | | |
| | | Actual | | Hypothetical6 | | |
| | | Beginning
Account Value
October 1, 2016 | | Ending
Account Value
March 31, 2017 | | Expenses Paid
During the Period5 | | Beginning
Account Value
October 1, 2016 | | Ending
Account Value
March 31, 2017 | | Expenses Paid
During the Period5 | | Annualized
Expense
Ratio |
Institutional | | $1,000.00 | | $1,076.80 | | $ 5.22 | | $1,000.00 | | $1,019.84 | | $ 5.07 | | 1.01% |
Service | | $1,000.00 | | $1,075.10 | | $ 6.76 | | $1,000.00 | | $1,018.35 | | $ 6.57 | | 1.31% |
Investor A | | $1,000.00 | | $1,074.90 | | $ 6.76 | | $1,000.00 | | $1,018.35 | | $ 6.57 | | 1.31% |
Investor B | | $1,000.00 | | $1,071.10 | | $10.56 | | $1,000.00 | | $1,014.67 | | $10.27 | | 2.05% |
Investor C | | $1,000.00 | | $1,071.50 | | $10.56 | | $1,000.00 | | $1,014.67 | | $10.27 | | 2.05% |
| | 5 | | For each class of the Fund, expenses are equal to the annualized expense ratio for the class, multiplied by the average account value over the period, multiplied by 182/ 365 (to reflect the one-half year period shown). |
| | 6 | | Hypothetical 5% annual return before expenses is calculated by prorating the number of days in the most recent fiscal half year divided by 365. |
| | | | See “Disclosure of Expenses” on page 15 for further information on how expenses were calculated. |
| | | | | | |
| | | BLACKROCK FUNDS | | MARCH 31, 2017 | | 13 |
| • | | Institutional and Class K Shares (Class K Shares are available only for BlackRock Health Sciences Opportunities Portfolio) are not subject to any sales charge. These shares bear no ongoing distribution or service fees and are available only to certain eligible investors. Prior to BlackRock Health Sciences Opportunities Portfolio’s Class K Shares inception date of June 8, 2016, Class K Share performance results are those of Institutional Shares (which have no distribution or service fees) and were restated to reflect Class K Share fees. |
| • | | Service Shares (for all Funds except BlackRock Global Opportunities Portfolio) are not subject to any sales charge. These shares are subject to a service fee of 0.25% per year (but no distribution fee) and are only available to certain eligible investors. |
| • | | Investor A Shares are subject to a maximum initial sales charge (front-end load) of 5.25% and a service fee of 0.25% per year (but no distribution fee). Certain redemptions of these shares may be subject to a contingent deferred sales charge (“CDSC”) where no initial sales charge was paid at the time of purchase. These shares are generally available through financial intermediaries. |
| • | | Investor B Shares (for all Funds except BlackRock Global Opportunities Portfolio and BlackRock Science & Technology Opportunities Portfolio) are subject to a maximum CDSC of 4.50%, declining to 0% after six years. In addition, these shares are subject to a distribution fee of 0.75% per year and a service fee of 0.25% per year. These shares automatically convert to Investor A Shares after approximately eight years. (There is no initial sales charge for automatic share conversions.) All returns for periods greater than eight years reflect this conversion. These shares are only available through exchanges and distribution reinvestments by current holders and for purchase by certain employer-sponsored retirement plans. |
| • | | Investor C Shares are subject to a 1.00% CDSC if redeemed within one year of purchase. In addition, these shares are subject to a distribution fee of 0.75% per year and a service fee of 0.25% per year. These shares are generally available through financial intermediaries. |
| • | | Class R Shares (for all Funds except BlackRock International Opportunities Portfolio and BlackRock U.S. Opportunities Portfolio) are not subject |
| | to any sales charge. These shares are subject to a distribution fee of 0.25% per year and a service fee of 0.25% per year. These shares are available only to certain employer-sponsored retirement plans. Prior to September 9, 2008, the performance results of Class R Shares of BlackRock Science & Technology Opportunities Portfolio are those of Institutional Shares (which have no distribution or service fees) restated to reflect Class R Share fees. Prior to September 12, 2011, the performance results of Class R Shares of BlackRock Global Opportunities Portfolio and BlackRock Health Sciences Opportunities Portfolio are those of the applicable Fund’s Institutional Shares (which have no distribution or service fees) restated to reflect Class R Share fees. |
Performance information reflects past performance and does not guarantee future results. Current performance may be lower or higher than the performance data quoted. Refer to www.blackrock.com to obtain performance data current to the most recent month end. Performance results do not reflect the deduction of taxes that a shareholder would pay on fund distributions or the redemption of fund shares. Figures shown in the performance tables on the previous pages assume reinvestment of all distributions, if any, at net asset value on the ex-dividend date. Investment return and principal value of shares will fluctuate so that shares, when redeemed, may be worth more or less than their original cost. Distributions paid to each class of shares will vary because of the different levels of service, distribution and transfer agency fees applicable to each class, which are deducted from the income available to be paid to shareholders.
BlackRock Advisors, LLC (the “Manager”), each Fund’s investment adviser, has contractually agreed to waive and/or reimburse a portion of the Funds’ expenses. Without such waiver and/or reimbursement, the Funds’ performance would have been lower. The Manager is under no obligation to continue waiving and/or reimbursing its fees after the applicable termination date of such agreement. See Note 6 of the Notes to Financial Statements for additional information on waivers and/or reimbursements.
| | | | | | |
| 14 | | BLACKROCK FUNDS | | MARCH 31, 2017 | | |
Shareholders of the Funds may incur the following charges: (a) transactional expenses, such as sales charges; and (b) operating expenses, including investment advisory fees, administration fees, service and distribution fees, including 12b-1 fees, acquired fund fees and expenses and other fund expenses. The expense examples on the previous pages (which are based on a hypothetical investment of $1,000 invested on October 1, 2016 and held through March 31, 2017) are intended to assist shareholders both in calculating expenses based on an investment in each Fund and in comparing these expenses with similar costs of investing in other mutual funds.
The expense examples provide information about actual account values and actual expenses. In order to estimate the expenses a shareholder paid during the period covered by this report, shareholders can divide their account value by $1,000 and then multiply the result by the number corresponding to their Fund and share class under the headings entitled “Expenses Paid During the Period.”
The expense examples also provide information about hypothetical account values and hypothetical expenses based on a Fund’s actual expense ratio and an assumed rate of return of 5% per year before expenses. In order to assist shareholders in comparing the ongoing expenses of investing in these Funds and other funds, compare the 5% hypothetical examples with the 5% hypothetical examples that appear in shareholder reports of other funds.
The expenses shown in the expense examples are intended to highlight shareholders’ ongoing costs only and do not reflect transactional expenses, such as sales charges, if any. Therefore, the hypothetical examples are useful in comparing ongoing expenses only, and will not help shareholders determine the relative total expenses of owning different funds. If these transactional expenses were included, shareholder expenses would have been higher.
|
Derivative Financial Instruments |
The Funds may invest in various derivative financial instruments. These instruments are used to obtain exposure to a security, commodity, index, market and/or other asset without owning or taking physical custody of securities, commodities and/or other referenced assets or to manage market, equity, credit, interest rate, foreign currency exchange rate, commodity and/or other risks. Derivative financial instruments may give rise to a form of economic leverage and involve risks, including the imperfect correlation between the value of a derivative financial instrument and the underlying asset, possible default of the counterparty to the transaction
or illiquidity of the instrument. The Funds’ successful use of a derivative financial instrument depends on the investment adviser’s ability to predict pertinent market movements accurately, which cannot be assured. The use of these instruments may result in losses greater than if they had not been used, may limit the amount of appreciation a Fund can realize on an investment and/or may result in lower distributions paid to shareholders. The Funds’ investments in these instruments, if any, are discussed in detail in the Notes to Financial Statements.
| | | | | | |
| | | BLACKROCK FUNDS | | MARCH 31, 2017 | | 15 |
| | | | |
| Schedule of Investments March 31, 2017 (Unaudited) | | | BlackRock Global Opportunities Portfolio | |
| | | (Percentages shown are based on Net Assets) | |
| | | | | | | | |
| Common Stocks | | Shares | | | Value | |
Australia — 0.0% | | | | | | | | |
Ensogo Ltd. (a) | | | 122,284 | | | $ | 1 | |
Belgium — 1.0% | | | | | | | | |
Anheuser-Busch InBev SA | | | 23,768 | | | | 2,604,393 | |
Brazil — 0.5% | | | | | | | | |
Embraer SA — ADR | | | 54,200 | | | | 1,196,736 | |
Canada — 1.2% | | | | | | | | |
Encana Corp. | | | 95,540 | | | | 1,119,309 | |
Potash Corp. of Saskatchewan, Inc. | | | 113,890 | | | | 1,945,241 | |
| | | | | | | | |
| | | | | | | | 3,064,550 | |
China — 7.2% | | | | | | | | |
AIA Group Ltd. | | | 296,300 | | | | 1,870,233 | |
Alibaba Group Holding Ltd. — ADR (a) | | | 51,684 | | | | 5,573,086 | |
Anhui Conch Cement Co. Ltd., H Shares | | | 534,000 | | | | 1,816,158 | |
Baidu, Inc. — ADR (a) | | | 15,990 | | | | 2,758,595 | |
China Construction Bank Corp., H Shares | | | 1,889,000 | | | | 1,521,982 | |
Ping An Insurance Group Co. of China Ltd., H Shares | | | 672,500 | | | | 3,768,995 | |
Weibo Corp. — ADR (a)(b) | | | 19,760 | | | | 1,031,077 | |
| | | | | | | | |
| | | | | | | | 18,340,126 | |
France — 2.5% | | | | | | | | |
AXA SA | | | 86,600 | | | | 2,237,386 | |
Iliad SA | | | 9,630 | | | | 2,150,696 | |
Renault SA | | | 21,150 | | | | 1,837,355 | |
| | | | | | | | |
| | | | | | | | 6,225,437 | |
Germany — 1.3% | | | | | | | | |
KION Group AG | | | 22,640 | | | | 1,477,790 | |
thyssenKrupp AG | | | 73,790 | | | | 1,807,692 | |
| | | | | | | | |
| | | | | | | | 3,285,482 | |
Hong Kong — 1.8% | | | | | | | | |
Melco Crown Entertainment Ltd. — ADR | | | 153,240 | | | | 2,841,070 | |
Weichai Power Co. Ltd., H Shares | | | 1,037,000 | | | | 1,831,807 | |
| | | | | | | | |
| | | | | | | | 4,672,877 | |
India — 3.8% | | | | | | | | |
Bharti Infratel Ltd. | | | 321,613 | | | | 1,614,835 | |
Delta Corp. Ltd. | | | 199,550 | | | | 556,929 | |
Dish TV India Ltd. | | | 559,073 | | | | 925,250 | |
Federal Bank Ltd. | | | 1,341,220 | | | | 1,889,224 | |
HDFC Bank Ltd. | | | 70,598 | | | | 1,595,388 | |
ICICI Bank Ltd. | | | 548,500 | | | | 2,342,955 | |
Srei Infrastructure Finance Ltd. | | | 546,409 | | | | 698,118 | |
| | | | | | | | |
| | | | | | | | 9,622,699 | |
Indonesia — 1.2% | | | | | | | | |
Bank Negara Indonesia Persero Tbk PT | | | 3,193,400 | | | | 1,552,555 | |
Matahari Department Store Tbk PT | | | 1,424,660 | | | | 1,408,805 | |
| | | | | | | | |
| | | | | | | | 2,961,360 | |
| | | | | | | | |
| Common Stocks | | Shares | | | Value | |
Ireland — 1.4% | | | | | | | | |
Green REIT PLC | | | 1,002,800 | | | $ | 1,454,915 | |
Medtronic PLC | | | 25,935 | | | | 2,089,324 | |
| | | | | | | | |
| | | | | | | | 3,544,239 | |
Italy — 2.8% | | | | | | | | |
Azimut Holding SpA | | | 104,780 | | | | 1,819,552 | |
Eni SpA | | | 106,460 | | | | 1,743,106 | |
UniCredit SpA | | | 228,900 | | | | 3,528,577 | |
| | | | | | | | |
| | | | | | | | 7,091,235 | |
Japan — 4.6% | | | | | | | | |
Alps Electric Co. Ltd. | | | 42,000 | | | | 1,190,898 | |
FANUC Corp. | | | 9,000 | | | | 1,852,842 | |
Nintendo Co. Ltd. | | | 6,900 | | | | 1,601,068 | |
Nippon Yusen KK | | | 565,000 | | | | 1,192,839 | |
SMC Corp. | | | 6,400 | | | | 1,897,373 | |
SoftBank Group Corp. | | | 22,400 | | | | 1,588,499 | |
Sumitomo Mitsui Financial Group, Inc. | | | 64,500 | | | | 2,347,721 | |
| | | | | | | | |
| | | | | | | | 11,671,240 | |
Mexico — 0.6% | | | | | | | | |
Fomento Economico Mexicano SAB de CV — ADR | | | 18,432 | | | | 1,631,601 | |
Netherlands — 2.1% | | | | | | | | |
Akzo Nobel NV | | | 9,700 | | | | 803,006 | |
CNH Industrial NV | | | 200,320 | | | | 1,928,103 | |
Euronext NV | | | 27,710 | | | | 1,208,294 | |
Koninklijke Philips NV | | | 46,941 | | | | 1,507,950 | |
| | | | | | | | |
| | | | | | | | 5,447,353 | |
New Zealand — 0.5% | | | | | | | | |
Xero Ltd. (a) | | | 91,270 | | | | 1,265,757 | |
Nigeria — 0.3% | | | | | | | | |
Lekoil Ltd. (a) | | | 2,628,020 | | | | 766,651 | |
Norway — 1.0% | | | | | | | | |
Statoil ASA | | | 139,765 | | | | 2,402,358 | |
Peru — 1.0% | | | | | | | | |
Credicorp Ltd. | | | 15,900 | | | | 2,596,470 | |
Philippines — 0.3% | | | | | | | | |
CEMEX Holdings Philippines, Inc. (a) | | | 5,206,900 | | | | 729,537 | |
Portugal — 0.9% | | | | | | | | |
Galp Energia SGPS SA | | | 157,210 | | | | 2,384,471 | |
South Africa — 1.1% | | | | | | | | |
Naspers Ltd., N Shares | | | 16,569 | | | | 2,855,043 | |
South Korea — 2.0% | | | | | | | | |
Amorepacific Corp. | | | 4,670 | | | | 1,172,277 | |
LG Chem Ltd. | | | 9,430 | | | | 2,479,509 | |
| | | | | | | | | | |
| Portfolio Abbreviations | | | | | | | | |
| ADR | | American Depositary Receipts | | GBP | | British Pound | | RUB | | Russian Ruble |
| AUD | | Australian Dollar | | HKD | | Hong Kong Dollar | | SEK | | Swedish Krona |
| CAD | | Canadian Dollar | | JPY | | Japanese Yen | | SGD | | Singapore Dollar |
| CHF | | Swiss Franc | | NOK | | Norwegian Krone | | USD | | U.S. Dollar |
| CVR | | Contingent Value Rights | | NZD | | New Zealand Dollar | | ZAR | | South African Rand |
| DKK | | Danish Krone | | OTC | | Over-the-counter | | | | |
| EUR | | Euro | | REIT | | Real Estate Investment Trust | | | | |
See Notes to Financial Statements.
| | | | | | |
| 16 | | BLACKROCK FUNDS | | MARCH 31, 2017 | | |
| | | | |
| Schedule of Investments (continued) | | | BlackRock Global Opportunities Portfolio | |
| | | | |
| | | | | | | | |
| Common Stocks | | Shares | | | Value | |
South Korea (continued) | | | | | | | | |
Samsung SDI Co. Ltd. | | | 11,420 | | | $ | 1,409,837 | |
| | | | | | | | |
| | | | | | | | 5,061,623 | |
Spain — 0.7% | | | | | | | | |
Cellnex Telecom SAU (c) | | | 112,356 | | | | 1,850,497 | |
Switzerland — 2.7% | | | | | | | | |
Nestle SA, Registered Shares | | | 35,627 | | | | 2,734,435 | |
UBS Group AG, Registered Shares | | | 149,028 | | | | 2,382,155 | |
Weatherford International PLC (a) | | | 242,520 | | | | 1,612,758 | |
| | | | | | | | |
| | | | | | | | 6,729,348 | |
Taiwan — 1.8% | | | | | | | | |
Catcher Technology Co. Ltd. | | | 248,000 | | | | 2,451,004 | |
Taiwan Semiconductor Manufacturing Co. Ltd. | | | 348,000 | | | | 2,182,180 | |
| | | | | | | | |
| | | | | | | | 4,633,184 | |
Thailand — 0.6% | | | | | | | | |
True Corp. PCL | | | 7,276,800 | | | | 1,439,875 | |
United Kingdom — 5.3% | | | | | | | | |
AstraZeneca PLC | | | 18,745 | | | | 1,152,572 | |
Babcock International Group PLC | | | 111,980 | | | | 1,237,327 | |
Delphi Automotive PLC | | | 23,328 | | | | 1,877,671 | |
GlaxoSmithKline PLC | | | 60,228 | | | | 1,252,315 | |
Imperial Brands PLC | | | 47,460 | | | | 2,300,081 | |
Metro Bank PLC (a) | | | 32,255 | | | | 1,308,118 | |
Nomad Foods, Ltd. (a) | | | 114,100 | | | | 1,306,445 | |
Unilever PLC | | | 60,824 | | | | 3,000,275 | |
| | | | | | | | |
| | | | | | | | 13,434,804 | |
United States — 47.2% | | | | | | | | |
Acuity Brands, Inc. | | | 6,238 | | | | 1,272,552 | |
Adobe Systems, Inc. (a) | | | 20,891 | | | | 2,718,546 | |
Allergan PLC | | | 5,360 | | | | 1,280,611 | |
Alphabet, Inc., Class C (a) | | | 9,567 | | | | 7,936,401 | |
Amazon.com, Inc. (a) | | | 3,649 | | | | 3,234,984 | |
American International Group, Inc. | | | 56,910 | | | | 3,552,891 | |
Amgen, Inc. | | | 8,075 | | | | 1,324,865 | |
Apple Inc. | | | 37,924 | | | | 5,448,162 | |
Assured Guaranty Ltd. | | | 31,794 | | | | 1,179,875 | |
Biogen, Inc. (a) | | | 3,670 | | | | 1,003,451 | |
Boston Scientific Corp. (a) | | | 76,381 | | | | 1,899,595 | |
Calpine Corp. | | | 112,130 | | | | 1,239,037 | |
Celgene Corp. (a) | | | 21,460 | | | | 2,670,268 | |
Centene Corp. (a) | | | 20,660 | | | | 1,472,232 | |
Cigna Corp. | | | 9,240 | | | | 1,353,568 | |
Comcast Corp., Class A | | | 33,508 | | | | 1,259,566 | |
Concho Resources, Inc. (a) | | | 14,148 | | | | 1,815,754 | |
Crown Holdings, Inc. (a) | | | 25,904 | | | | 1,371,617 | |
DaVita, Inc. | | | 28,300 | | | | 1,923,551 | |
Dover Corp. | | | 16,600 | | | | 1,333,810 | |
Duke Energy Corp. | | | 22,940 | | | | 1,881,309 | |
E*TRADE Financial Corp. (a) | | | 52,740 | | | | 1,840,099 | |
Eastman Chemical Co. | | | 21,445 | | | | 1,732,756 | |
Eli Lilly & Co. | | | 23,930 | | | | 2,012,752 | |
EOG Resources, Inc. | | | 27,022 | | | | 2,635,996 | |
Facebook, Inc., Class A (a) | | | 21,299 | | | | 3,025,523 | |
Humana, Inc. | | | 9,440 | | | | 1,945,962 | |
Intercontinental Exchange, Inc. | | | 20,110 | | | | 1,203,986 | |
Johnson Controls International PLC | | | 63,546 | | | | 2,676,558 | |
Kellogg Co. | | | 25,620 | | | | 1,860,268 | |
Kennedy-Wilson Holdings, Inc. | | | 72,432 | | | | 1,607,990 | |
Lam Research Corp. | | | 15,836 | | | | 2,032,709 | |
Lowe’s Cos., Inc. | | | 21,319 | | | | 1,752,635 | |
Mastercard, Inc., Class A | | | 27,956 | | | | 3,144,211 | |
| | | | | | | | |
| Common Stocks | | Shares | | | Value | |
United States (continued) | | | | | | | | |
Merck & Co., Inc. | | | 28,780 | | | $ | 1,828,681 | |
Mondelez International, Inc., Class A | | | 35,986 | | | | 1,550,277 | |
Mosaic Co. | | | 93,738 | | | | 2,735,275 | |
Newell Brands, Inc. | | | 45,190 | | | | 2,131,612 | |
PayPal Holdings, Inc. (a) | | | 60,090 | | | | 2,585,072 | |
Pfizer, Inc. | | | 74,820 | | | | 2,559,592 | |
Pioneer Natural Resources Co. | | | 10,407 | | | | 1,938,096 | |
Platform Specialty Products Corp. (a) | | | 99,484 | | | | 1,295,282 | |
PPL Corp. | | | 34,856 | | | | 1,303,266 | |
RSP Permian, Inc. (a) | | | 28,800 | | | | 1,193,184 | |
salesforce.com, Inc. (a) | | | 29,600 | | | | 2,441,704 | |
ServiceMaster Global Holdings, Inc. (a) | | | 42,074 | | | | 1,756,589 | |
Skyworks Solutions, Inc. | | | 12,810 | | | | 1,255,124 | |
Snap, Inc., Class A (a) | | | 44,367 | | | | 999,588 | |
Starbucks Corp. | | | 32,909 | | | | 1,921,556 | |
Strategic Growth Bancorp (Acquired 3/10/14, cost $1,691,208) (a)(d) | | | 135,840 | | | | 1,359,758 | |
Summit Materials, Inc., Class A | | | 53,230 | | | | 1,315,313 | |
SVB Financial Group (a) | | | 9,340 | | | | 1,738,081 | |
Union Pacific Corp. | | | 15,044 | | | | 1,593,460 | |
UnitedHealth Group, Inc. | | | 8,744 | | | | 1,434,103 | |
VEREIT, Inc. | | | 144,500 | | | | 1,226,805 | |
Walt Disney Co. | | | 21,134 | | | | 2,396,384 | |
Wells Fargo & Co. | | | 68,780 | | | | 3,828,295 | |
WestRock Co. | | | 24,830 | | | | 1,291,905 | |
Wynn Resorts Ltd. | | | 14,600 | | | | 1,673,306 | |
| | | | | | | | |
| | | | | | | | 119,996,398 | |
Total Common Stocks — 97.4% | | | | | | | 247,505,345 | |
| | | | | | | | |
| Preferred Stocks | | | | | | |
India — 0.4% | | | | | | | | |
Jasper Infotech Private Ltd., Series F (Acquired 5/07/14, cost $576,742) (a)(d) | | | 81 | | | | 716,123 | |
Jasper Infotech Private Ltd., Series G (Acquired 10/29/14, cost $227,633) (a)(d) | | | 27 | | | | 252,832 | |
| | | | | | | | |
| | | | | | | | 968,955 | |
United States — 2.0% | | | | | | | | |
Palantir Technologies, Inc., Series I (Acquired 2/07/14, cost $942,242) (a)(d) | | | 153,710 | | | | 1,220,457 | |
Uber Technologies, Inc., Series D (Acquired 6/06/14, cost $1,176,386) (a)(d) | | | 75,832 | | | | 3,953,880 | |
| | | | | | | | |
| | | | | | | | 5,174,337 | |
Total Preferred Stocks — 2.4% | | | | | | | 6,143,292 | |
Total Long-Term Investments (Cost — $214,987,162) — 99.8% | | | | | | | 253,648,637 | |
| | | | | | | | |
| Short-Term Securities | | | | | | |
BlackRock Liquidity Funds, T-Fund, Institutional Class, 0.60% (e)(f) | | | 146,724 | | | | 146,724 | |
SL Liquidity Series, LLC, Money Market Series, 1.11% (e)(f)(g) | | | 1,048,411 | | | | 1,048,515 | |
Total Short-Term Securities (Cost — $1,195,247) — 0.4% | | | | 1,195,239 | |
Total Investments Before Options Written (Cost — $216,182,409) — 100.2% | | | | | | | 254,843,876 | |
See Notes to Financial Statements.
| | | | | | |
| | | BLACKROCK FUNDS | | MARCH 31, 2017 | | 17 |
| | | | |
| Schedule of Investments (continued) | | | BlackRock Global Opportunities Portfolio | |
| | | | | | | | |
| Options Written | | | | | Value | |
(Premiums Received — $ 79,811) — (0.0)% | | | | $ (46,928 | ) |
Total Investments Net of Options Written — 100.2% | | | | 254,796,948 | |
Liabilities in Excess of Other Assets — (0.2)% | | | | | | | (618,784 | ) |
| | | | | | | | |
Net Assets — 100.0% | | | | | | | $254,178,164 | |
| | | | | | | | |
|
| Notes to Schedule of Investments |
| (a) | Non-income producing security. |
| (b) | Security, or a portion of the security, is on loan. |
| (c) | Security exempt from registration pursuant to Rule 144A under the Securities Act of 1933, as amended. These securities may be resold in transactions exempt from registration to qualified institutional investors. |
| (d) | Restricted security as to resale, excluding 144A securities. The Fund held restricted securities with a current value of $7,503,050, representing 2.95% of its net assets as of period end, and an original cost of $4,614,211. |
| (e) | Current yield as of period end. |
| (f) | During the six months ended March 31, 2017, investments in issuers considered to be affiliates of the Fund for purposes of Section 2(a)(3) of the Investment Company Act of 1940, as amended, were as follows: |
| | | | | | | | | | | | | | | | | | | | | | | | | | | | |
| Affiliate | | Shares Held at
September 30,
2016 | | | Net
Activity | | | Shares Held at
March 31,
2017 | | | Value at,
March 31,
2017 | | | Income | | | Net Realized
Gain1 | | | Change in
Unrealized
Appreciation
(Depreciation) | |
BlackRock Liquidity Funds, T-Fund, Institutional Class | | | 2,597,447 | | | | (2,450,723 | ) | | | 146,724 | | | | $ 146,724 | | | | $2,149 | | | | $20 | | | | — | |
SL Liquidity Series, LLC, Money Market Series | | | 2,030 | | | | 1,046,381 | | | | 1,048,411 | | | | 1,048,515 | | | | 2,174 | 2 | | | — | | | | $(8 | ) |
Total | | | | | | | | | | | | | | | $1,195,239 | | | | $4,323 | | | | $20 | | | | $(8 | ) |
| | | | | | | | | | | | | | | | |
| | 1 | | Includes net capital gain distributions. |
| | 2 | | Represents securities lending income earned from the reinvestment of cash collateral from loaned securities, net of fees and collateral investment expenses, and other payments to and from borrowers of securities. |
| (g) | Security was purchased with the cash collateral from loaned securities. |
|
| Derivative Financial Instruments Outstanding as of Period End |
|
| Forward Foreign Currency Exchange Contracts |
| | | | | | | | | | | | | | | | | | | | | | |
Currency
Purchased | | | Currency
Sold | | | Counterparty | | Settlement
Date | | | Unrealized
Appreciation
(Depreciation) | |
| AUD | | | 7,848,200 | | | | USD | | | | 5,751,152 | | | Bank of America N.A. | | | 4/12/17 | | | | $243,611 | |
| AUD | | | 647,600 | | | | USD | | | | 474,575 | | | Northern Trust Corp. | | | 4/12/17 | | | | 20,087 | |
| CAD | | | 4,548,000 | | | | USD | | | | 3,439,724 | | | Citibank N.A. | | | 4/12/17 | | | | (19,192 | ) |
| CAD | | | 200,900 | | | | USD | | | | 151,952 | | | Goldman Sachs International | | | 4/12/17 | | | | (856 | ) |
| CAD | | | 1,168,000 | | | | USD | | | | 889,399 | | | Northern Trust Corp. | | | 4/12/17 | | | | (10,951 | ) |
| CHF | | | 78,100 | | | | USD | | | | 77,773 | | | Goldman Sachs International | | | 4/12/17 | | | | 253 | |
| CHF | | | 3,023,400 | | | | USD | | | | 3,010,552 | | | Goldman Sachs International | | | 4/12/17 | | | | 9,954 | |
| DKK | | | 9,602,500 | | | | USD | | | | 1,376,310 | | | Goldman Sachs International | | | 4/12/17 | | | | 1,463 | |
| EUR | | | 50,816 | | | | USD | | | | 53,968 | | | Bank of America N.A. | | | 4/12/17 | | | | 271 | |
| EUR | | | 65,108 | | | | USD | | | | 68,963 | | | Bank of America N.A. | | | 4/12/17 | | | | 532 | |
| EUR | | | 992,040 | | | | USD | | | | 1,047,773 | | | Bank of America N.A. | | | 4/12/17 | | | | 11,108 | |
| EUR | | | 1,190,755 | | | | USD | | | | 1,266,036 | | | Bank of America N.A. | | | 4/12/17 | | | | 4,949 | |
| EUR | | | 1,885,366 | | | | USD | | | | 2,038,748 | | | Bank of America N.A. | | | 4/12/17 | | | | (26,351 | ) |
| EUR | | | 717,228 | | | | USD | | | | 757,246 | | | Bank of Montreal | | | 4/12/17 | | | | 8,306 | |
| EUR | | | 400,242 | | | | USD | | | | 432,916 | | | Citibank N.A. | | | 4/12/17 | | | | (5,707 | ) |
| EUR | | | 407,056 | | | | USD | | | | 435,403 | | | Citibank N.A. | | | 4/12/17 | | | | (921 | ) |
| EUR | | | 504,773 | | | | USD | | | | 533,308 | | | Commonwealth Bank of Australia | | | 4/12/17 | | | | 5,475 | |
See Notes to Financial Statements.
| | | | | | |
| 18 | | BLACKROCK FUNDS | | MARCH 31, 2017 | | |
| | | | |
| Schedule of Investments (continued) | | | BlackRock Global Opportunities Portfolio | |
| | | | | | | | | | | | | | | | | | | | | | |
Currency Purchased | | | Currency Sold | | | Counterparty | | Settlement
Date | | | Unrealized
Appreciation
(Depreciation) | |
| EUR | | | 55,037 | | | | USD | | | | 59,151 | | | Northern Trust Corp. | | | 4/12/17 | | | $ | (405 | ) |
| EUR | | | 111,587 | | | | USD | | | | 119,263 | | | Northern Trust Corp. | | | 4/12/17 | | | | (158 | ) |
| EUR | | | 370,026 | | | | USD | | | | 396,874 | | | Northern Trust Corp. | | | 4/12/17 | | | | (1,916 | ) |
| EUR | | | 326,704 | | | | USD | | | | 350,695 | | | Royal Bank of Canada | | | 4/12/17 | | | | (1,979 | ) |
| EUR | | | 108,247 | | | | USD | | | | 114,403 | | | Standard Chartered Bank | | | 4/12/17 | | | | 1,137 | |
| EUR | | | 236,453 | | | | USD | | | | 250,702 | | | Standard Chartered Bank | | | 4/12/17 | | | | 1,682 | |
| GBP | | | 49,000 | | | | USD | | | | 59,991 | | | Barclays Bank PLC | | | 4/12/17 | | | | 1,418 | |
| GBP | | | 126,000 | | | | USD | | | | 153,446 | | | Barclays Bank PLC | | | 4/12/17 | | | | 4,463 | |
| GBP | | | 166,000 | | | | USD | | | | 202,280 | | | Barclays Bank PLC | | | 4/12/17 | | | | 5,760 | |
| GBP | | | 1,809,000 | | | | USD | | | | 2,236,705 | | | Barclays Bank PLC | | | 4/12/17 | | | | 30,422 | |
| GBP | | | 33,000 | | | | USD | | | | 40,147 | | | BNP Paribas S.A. | | | 4/12/17 | | | | 1,210 | |
| GBP | | | 97,000 | | | | USD | | | | 121,395 | | | Citibank N.A. | | | 4/12/17 | | | | 170 | |
| GBP | | | 41,000 | | | | USD | | | | 51,032 | | | Goldman Sachs International | | | 4/12/17 | | | | 352 | |
| GBP | | | 2,288,100 | | | | USD | | | | 2,847,821 | | | Goldman Sachs International | | | 4/12/17 | | | | 19,738 | |
| GBP | | | 89,000 | | | | USD | | | | 110,994 | | | Royal Bank of Scotland PLC | | | 4/12/17 | | | | 546 | |
| RUB | | | 70,148,100 | | | | USD | | | | 1,162,547 | | | Citibank N.A. | | | 4/12/17 | | | | 80,365 | |
| SEK | | | 20,536,300 | | | | USD | | | | 2,292,252 | | | Barclays Bank PLC | | | 4/12/17 | | | | 858 | |
| SEK | | | 454,800 | | | | USD | | | | 50,767 | | | Northern Trust Corp. | | | 4/12/17 | | | | 17 | |
| SGD | | | 1,477,000 | | | | USD | | | | 1,033,890 | | | HSBC Bank PLC | | | 4/12/17 | | | | 22,080 | |
| USD | | | 1,037,706 | | | | CHF | | | | 1,050,226 | | | Citibank N.A. | | | 4/12/17 | | | | (11,515 | ) |
| USD | | | 1,047,890 | | | | EUR | | | | 975,051 | | | Citibank N.A. | | | 4/12/17 | | | | 7,143 | |
| USD | | | 193,738 | | | | EUR | | | | 181,900 | | | HSBC Bank PLC | | | 4/12/17 | | | | (418 | ) |
| USD | | | 7,604,593 | | | | EUR | | | | 7,140,000 | | | HSBC Bank PLC | | | 4/12/17 | | | | (16,480 | ) |
| USD | | | 1,145,783 | | | | EUR | | | | 1,084,167 | | | Nomura International PLC | | | 4/12/17 | | | | (11,431 | ) |
| USD | | | 1,948,152 | | | | EUR | | | | 1,852,243 | | | Nomura International PLC | | | 4/12/17 | | | | (28,890 | ) |
| USD | | | 521,988 | | | | EUR | | | | 492,516 | | | Standard Chartered Bank | | | 4/12/17 | | | | (3,712 | ) |
| USD | | | 1,202,676 | | | | GBP | | | | 979,000 | | | Goldman Sachs International | | | 4/12/17 | | | | (24,255 | ) |
| USD | | | 953,212 | | | | GBP | | | | 764,400 | | | Standard Chartered Bank | | | 4/12/17 | | | | (4,771 | ) |
| USD | | | 1,288,853 | | | | JPY | | | | 144,619,900 | | | Royal Bank of Canada | | | 4/12/17 | | | | (10,800 | ) |
| USD | | | 2,134,245 | | | | NOK | | | | 18,096,000 | | | Barclays Bank PLC | | | 4/12/17 | | | | 26,413 | |
| USD | | | 62,308 | | | | NOK | | | | 528,400 | | | Goldman Sachs International | | | 4/12/17 | | | | 760 | |
| USD | | | 1,043,785 | | | | NZD | | | | 1,490,000 | | | Royal Bank of Scotland PLC | | | 4/12/17 | | | | (391 | ) |
| USD | | | 656,437 | | | | ZAR | | | | 9,068,600 | | | Northern Trust Corp. | | | 4/12/17 | | | | (18,103 | ) |
| Total | | | | | | | | | | | | | | | | | | | | $ | 311,341 | |
| | | | | | | | | | | | | | | | | | | | | | |
| | | | | | | | | | | | | | | | | | | | | | | | |
| Exchange-Traded Options Written | | | | | | | | | | | | | | | | | | | | | | | | |
| Description | | Put/
Call | | | Expiration
Date | | | Strike Price | | | Contracts | | | Value | |
Adobe Systems, Inc. | | | Call | | | | 04/21/17 | | | | USD | | | | 132.75 | | | | 52 | | | $ | (4,824 | ) |
Alphabet, Inc., Class C | | | Call | | | | 04/21/17 | | | | USD | | | | 850.00 | | | | 7 | | | | (1,418 | ) |
Lam Research Corp. | | | Call | | | | 04/21/17 | | | | USD | | | | 125.00 | | | | 51 | | | | (28,560 | ) |
Salesforce.com, Inc. | | | Call | | | | 04/21/17 | | | | USD | | | | 85.00 | | | | 92 | | | | (5,382 | ) |
Total | | | | | | | | | | | | | | | | | | | | | | $ | (40,184 | ) |
| | | | | | | | | | | | | | | | | | | | | | | | |
| | | | | | | | | | | | | | | | | | | | | | | | | | | | |
OTC Options Written | | | | | | | | | | | | | | | | | | | | | | | | | | | | |
| Description | | Put/
Call | | | Counterparty | | | Expiration Date | | | Strike Price | | | Contracts | | | Value | |
Metro Bank PLC | | | Call | | | | UBS AG | | | | 4/06/17 | | | | GBP | | | | 36.48 | | | | 3,900 | | | | — | |
Metro Bank PLC | | | Call | | | | UBS AG | | | | 4/11/17 | | | | GBP | | | | 37.24 | | | | 5,500 | | | $ | (1 | ) |
Metro Bank PLC | | | Call | | | | UBS AG | | | | 4/11/17 | | | | GBP | | | | 36.26 | | | | 2,000 | | | | (5 | ) |
Metro Bank PLC | | | Call | | | | UBS AG | | | | 4/19/17 | | | | GBP | | | | 35.93 | | | | 3,140 | | | | (98 | ) |
See Notes to Financial Statements.
| | | | | | |
| | | BLACKROCK FUNDS | | MARCH 31, 2017 | | 19 |
| | | | |
| Schedule of Investments (continued) | | | BlackRock Global Opportunities Portfolio | |
| | | | | | | | | | | | | | | | | | | | | | | | | | | | |
| Description | | Put/
Call | | | Counterparty | | | Expiration
Date | | | Strike Price | | | Contracts | | | Value | |
Metro Bank PLC | | | Call | | | | UBS AG | | | | 4/25/17 | | | | GBP | | | | 36.00 | | | | 2,530 | | | $ | (148 | ) |
Unilever PLC | | | Call | | | | BNP Paribas S.A. | | | | 4/27/17 | | | | GBP | | | | 41.21 | | | | 15,600 | | | | (6,492 | ) |
Total | | | | | | | | | | | | | | | | | | | | | | | | | | $ | (6,744 | ) |
| | | | | | | | | | | | | | | | | | | | | | | | | | | | |
|
| Transactions in Options Written for the Period Ended March 31, 2017 |
| | | | | | | | | | | | | | | | | | | | |
| | | Calls | | | | | | Puts | |
| | | Contracts | | | Premiums
Received | | | | | | Contracts | | | Premiums
Received | |
Outstanding options, beginning of period | | | — | | | | — | | | | | | | | — | | | | — | |
Options written | | | 45,926 | | | $ | 109,889 | | | | | | | | 164 | | | $ | 20,161 | |
Options expired | | | (13,000 | ) | | | (16,213 | ) | | | | | | | (134 | ) | | | (8,544 | ) |
Options closed | | | (54 | ) | | | (13,865 | ) | | | | | | | (30 | ) | | | (11,617 | ) |
| | | | | | | | | | | | |
Outstanding options, end of period | | | 32,872 | | | $ | 79,811 | | | | | | | | — | | | | — | |
| | | | | | | | | | | | |
As of period end, the value of portfolio securities subject to covered call options was $4,396,309.
|
| Derivative Financial Instruments Categorized by Risk Exposure |
As of period end, the fair values of derivative financial instruments located in the Statements of Assets and Liabilities were as follows:
| | | | | | | | | | | | | | | | | | | | | | | | |
| Assets — Derivative Financial Instruments | | Commodity
Contracts | | | Credit
Contracts | | | Equity
Contracts | | | Foreign
Currency
Exchange
Contracts | | | Interest
Rate
Contracts | | Other
Contracts | | Total |
Forward foreign currency exchange contracts | | Unrealized appreciation on forward foreign currency exchange contracts | | | — | | | | — | | | | — | | | | $510,543 | | | — | | — | | $510,543 |
| | | | | | | | | | | | | | | | | | | | | | | | |
Liabilities — Derivative Financial Instruments |
Forward foreign currency exchange contracts | | Unrealized depreciation on forward foreign currency exchange contracts | | | — | | | | — | | | | — | | | | $199,202 | | | — | | — | | $199,202 |
Options written | | Options written at value | | | — | | | | — | | | | $46,928 | | | | — | | | — | | — | | 46,928 |
Total | | | | | — | | | | — | | | | $46,928 | | | | $199,202 | | | — | | — | | $246,130 |
| | | | | |
| |
For the year ended March 31, 2017, the effect of derivative financial instruments in the Statements of Operations was as follows:
| | | | | | | | | | | | | | | | | | | | | | | | | | | | | | | | | | | |
| Net Realized Gain (Loss) from: | | Commodity
Contracts | | Credit
Contracts | | Equity
Contracts | | Foreign Currency
Exchange Contracts | | Interest Rate
Contracts | | Other
Contracts | | Total |
Forward foreign currency exchange contracts | | | | — | | | | | — | | | | | — | | | | $ | (252,159 | ) | | | | — | | | | | — | | | | $ | (252,159 | ) |
Options written | | | | — | | | | | — | | | | $ | 30,281 | | | | | — | | | | | — | | | | | — | | | | | 30,281 | |
Total | | | | — | | | | | — | | | | $ | 30,281 | | | | $ | (252,159 | ) | | | | — | | | | | — | | | | $ | (221,878 | ) |
| | | | | | | | | | | | | | | | | | | | | | | | | | | | | | | | | | | |
Net Change in Unrealized Appreciation (Depreciation) on: | |
Forward foreign currency exchange contracts | | | | — | | | | | — | | | | | — | | | | $ | 343,227 | | | | | — | | | | | — | | | | $ | 343,227 | |
Options written | | | | — | | | | | — | | | | $ | 32,883 | | | | | — | | | | | — | | | | | — | | | | | 32,883 | |
Total | | | | — | | | | | — | | | | $ | 32,883 | | | | $ | 343,227 | | | | | — | | | | | — | | | | $ | 376,110 | |
| | |
|
| Average Quarterly Balances of Outstanding Derivative Financial Instruments |
| | | | |
Forward foreign currency exchange contracts: | | | | |
Average amounts purchased — in USD | | $ | 30,380,285 | |
Average amounts sold — in USD | | $ | 40,701,349 | |
Options: | | | | |
Average value of option contracts written | | $ | 34,900 | |
For more information about the Fund’s investment risks regarding derivative financial instruments, refer to the Notes to Financial Statements.
See Notes to Financial Statements.
| | | | | | |
| 20 | | BLACKROCK FUNDS | | MARCH 31, 2017 | | |
| | | | |
| Schedule of Investments (continued) | | | BlackRock Global Opportunities Portfolio | |
|
| Derivative Financial Instruments — Offsetting as of Period End |
The Fund’s derivative assets and liabilities (by type) were as follows:
| | | | | | | | | | |
| | | Assets | | | | | Liabilities | |
Derivative Financial Instruments: | | | | | | | | | | |
Forward foreign currency exchange contracts | | $ | 510,543 | | | | | $ | 199,202 | |
Options | | | — | | | | | | 46,928 | |
| | | | |
Total derivative assets and liabilities in the Statements of Assets and Liabilities | | $ | 510,543 | | | | | $ | 246,130 | |
| | | | |
Derivatives not subject to a Master Netting Agreement or similar agreement (“MNA”) | | | — | | | | | | (40,184 | ) |
| | | | |
Total derivative assets and liabilities subject to an MNA | | $ | 510,543 | | | | | $ | 205,946 | |
| | | | |
The following tables present the Fund’s derivative assets and liabilities by counterparty net of amounts available for offset under an MNA and net of the related collateral received and pledged by the Fund:
| | | | | | | | | | | | | | | | | | | | | | | | | |
| Counterparty | | Derivative Assets
Subject to an MNA by
Counterparty | | Derivatives Available
for Offset1 | | Non-cash
Collateral
Received | | Cash
Collateral
Received | | Net Amount of
Derivative Assets2 |
Bank of America N.A. | | | $ | 260,471 | | | | $ | (26,351 | ) | | | | — | | | | | — | | | | $ | 234,120 | |
Bank of Montreal | | | | 8,306 | | | | | — | | | | | — | | | | | — | | | | | 8,306 | |
Barclays Bank PLC | | | | 69,334 | | | | | — | | | | | — | | | | | — | | | | | 69,334 | |
BNP Paribas S.A. | | | | 1,210 | | | | | (1,210 | ) | | | | — | | | | | — | | | | | — | |
Citibank N.A. | | | | 87,678 | | | | | (37,335 | ) | | | | — | | | | | — | | | | | 50,343 | |
Commonwealth Bank of Australia | | | | 5,475 | | | | | — | | | | | — | | | | | — | | | | | 5,475 | |
Goldman Sachs International | | | | 32,520 | | | | | (25,111 | ) | | | | — | | | | | — | | | | | 7,409 | |
HSBC Bank PLC | | | | 22,080 | | | | | (16,898 | ) | | | | — | | | | | — | | | | | 5,182 | |
Northern Trust Corp. | | | | 20,104 | | | | | (20,104 | ) | | | | — | | | | | — | | | | | — | |
Royal Bank of Scotland PLC | | | | 546 | | | | | (391 | ) | | | | — | | | | | — | | | | | 155 | |
Standard Chartered Bank | | | | 2,819 | | | | | (2,819 | ) | | | | — | | | | | — | | | | | — | |
| | | | | |
Total | | | $ | 510,543 | | | | $ | (130,219 | ) | | | | — | | | | | — | | | | $ | 380,324 | |
| | | | | |
| | | | | | | | | | | | | | | | | | | | | | | | | |
| Counterparty | | Derivative Liabilities
Subject to an MNA by
Counterparty | | Derivatives Available
for Offset1 | | Non-cash
Collateral
Pledged | | Cash
Collateral
Pledged | | Net Amount of Derivative Liabilities3 |
Bank of America N.A. | | | $ | 26,351 | | | | $ | (26,351 | ) | | | | — | | | | | — | | | | | — | |
BNP Paribas S.A. | | | | 6,492 | | | | | (1,210 | ) | | | | — | | | | | — | | | | $ | 5,282 | |
Citibank N.A. | | | | 37,335 | | | | | (37,335 | ) | | | | — | | | | | — | | | | | — | |
Goldman Sachs International | | | | 25,111 | | | | | (25,111 | ) | | | | — | | | | | — | | | | | — | |
HSBC Bank PLC | | | | 16,898 | | | | | (16,898 | ) | | | | — | | | | | — | | | | | — | |
Nomura International PLC | | | | 40,321 | | | | | — | | | | | — | | | | | — | | | | | 40,321 | |
Northern Trust Corp. | | | | 31,533 | | | | | (20,104 | ) | | | | — | | | | | — | | | | | 11,429 | |
Royal Bank of Canada | | | | 12,779 | | | | | — | | | | | — | | | | | — | | | | | 12,779 | |
Royal Bank of Scotland PLC | | | | 391 | | | | | (391 | ) | | | | — | | | | | — | | | | | — | |
Standard Chartered Bank | | | | 8,483 | | | | | (2,819 | ) | | | | — | | | | | — | | | | | 5,664 | |
UBS AG | | | | 252 | | | | | — | | | | | — | | | | | — | | | | | 252 | |
| | | | | |
Total | | | $ | 205,946 | | | | $ | (130,219 | ) | | | | — | | | | | — | | | | $ | 75,727 | |
| | | | | |
| | 1 | | The amount of derivatives available for offset is limited to the amount of derivative assets and/or liabilities that are subject to an MNA. |
| | 2 | | Net amount represents the net amount receivable from the counterparty in the event of default. |
| | 3 | | Net amount represents the net amount payable due to the counterparty in the event of default. Net amount may be offset further by the options written receivable/payable on the Statements of Assets and Liabilities. |
See Notes to Financial Statements.
| | | | | | |
| | | BLACKROCK FUNDS | | MARCH 31, 2017 | | 21 |
| | | | |
| Schedule of Investments (continued) | | | BlackRock Global Opportunities Portfolio | |
|
| Fair Value Hierarchy as of Period End |
Various inputs are used in determining the fair value of investments and derivative financial instruments. For information about the Fund’s policy regarding valuation of investments and derivative financial instruments, refer to the Notes to Financial Statements.
The following tables summarize the Fund’s investments and derivative financial instruments categorized in the disclosure hierarchy:
| | | | | | | | | | | | | | | | |
| | | Level 1 | | | Level 2 | | | Level 3 | | | Total | |
Assets: | | | | | | | | | | | | | | | | |
Investments: | | | | | | | | | | | | | | | | |
Long-Term Investments: | | | | | | | | | | | | | | | | |
Common Stocks: | | | | | | | | | | | | | | | | |
Australia | | | — | | | | — | | | $ | 1 | | | $ | 1 | |
Belgium | | | — | | | $ | 2,604,393 | | | | — | | | | 2,604,393 | |
Brazil | | $ | 1,196,736 | | | | — | | | | — | | | | 1,196,736 | |
Canada | | | 3,064,550 | | | | — | | | | — | | | | 3,064,550 | |
China | | | 9,362,758 | | | | 8,977,368 | | | | — | | | | 18,340,126 | |
France | | | — | | | | 6,225,437 | | | | — | | | | 6,225,437 | |
Germany | | | — | | | | 3,285,482 | | | | — | | | | 3,285,482 | |
Hong Kong | | | 2,841,070 | | | | 1,831,807 | | | | — | | | | 4,672,877 | |
India | | | — | | | | 8,027,311 | | | | 1,595,388 | | | | 9,622,699 | |
Indonesia | | | — | | | | 2,961,360 | | | | — | | | | 2,961,360 | |
Ireland | | | 3,544,239 | | | | — | | | | — | | | | 3,544,239 | |
Italy | | | — | | | | 7,091,235 | | | | — | | | | 7,091,235 | |
Japan | | | — | | | | 11,671,240 | | | | — | | | | 11,671,240 | |
Mexico | | | 1,631,601 | | | | — | | | | — | | | | 1,631,601 | |
Netherlands | | | — | | | | 5,447,353 | | | | — | | | | 5,447,353 | |
New Zealand | | | — | | | | 1,265,757 | | | | — | | | | 1,265,757 | |
Nigeria | | | — | | | | 766,651 | | | | — | | | | 766,651 | |
Norway | | | — | | | | 2,402,358 | | | | — | | | | 2,402,358 | |
Peru | | | 2,596,470 | | | | — | | | | — | | | | 2,596,470 | |
Philippines | | | 729,537 | | | | — | | | | — | | | | 729,537 | |
Portugal | | | — | | | | 2,384,471 | | | | — | | | | 2,384,471 | |
South Africa | | | — | | | | 2,855,043 | | | | — | | | | 2,855,043 | |
South Korea | | | — | | | | 5,061,623 | | | | — | | | | 5,061,623 | |
Spain | | | — | | | | 1,850,497 | | | | — | | | | 1,850,497 | |
Switzerland | | | 1,612,758 | | | | 5,116,590 | | | | — | | | | 6,729,348 | |
Taiwan | | | — | | | | 4,633,184 | | | | — | | | | 4,633,184 | |
Thailand | | | 1,439,875 | | | | — | | | | — | | | | 1,439,875 | |
United Kingdom | | | 3,184,116 | | | | 10,250,688 | | | | — | | | | 13,434,804 | |
United States | | | 118,636,640 | | | | — | | | | 1,359,758 | | | | 119,996,398 | |
Preferred Stocks: | | | | | | | | | | | | | | | | |
India | | | — | | | | — | | | | 968,955 | | | | 968,955 | |
United States | | | — | | | | — | | | | 5,174,337 | | | | 5,174,337 | |
Short-Term Securities | | | 146,724 | | | | — | | | | — | | | | 146,724 | |
| | | | |
Subtotal | | $ | 149,987,074 | | | $ | 94,709,848 | | | $ | 9,098,439 | | | $ | 253,795,361 | |
| | | | |
Investments Valued at NAV1 | | | | | | | | | | | | | | | 1,048,515 | |
| | | | | | | | | | | | | | | | |
Total Investments | | | | | | | | | | | | | | $ | 254,843,876 | |
| | | | | | | | | | | | | | | | |
| | | | | | | | | | | | | | | | |
Derivative Financial Instruments2 | | | | | | | | | | | | | | | | |
Assets: | | | | | | | | | | | | | | | | |
Foreign currency exchange contracts | | | — | | | $ | 510,543 | | | | — | | | $ | 510,543 | |
Liabilities: | | | | | | | | | | | | | | | | |
Equity contracts | | $ | (35,360 | ) | | | (11,568 | ) | | | — | | | | (46,928 | ) |
Foreign currency exchange contracts | | | — | | | | (199,202 | ) | | | — | | | | (199,202 | ) |
| | | | |
Total | | $ | (35,360 | ) | | $ | 299,773 | | | | — | | | $ | 264,413 | |
| | | | |
1 As of March 31, 2017, certain of the Fund’s investments were fair valued using NAV per share as no quoted market value is available and therefore have been excluded from the fair value hierarchy. | |
2 Derivative financial instruments are forward foreign currency exchange contracts, which are valued at the unrealized appreciation (depreciation) on the instrument. | |
See Notes to Financial Statements.
| | | | | | |
| 22 | | BLACKROCK FUNDS | | MARCH 31, 2017 | | |
| | | | |
| Schedule of Investments (concluded) | | | BlackRock Global Opportunities Portfolio | |
During the six months ended March 31, 2017, there were no transfers between levels.
A reconciliation of Level 3 investments is presented when the Fund had a significant amount of Level 3 investments at the beginning and/or end of the year in relation to net assets. The following table is a reconciliation of Level 3 investments for which significant unobservable inputs were used in determining fair value:
| | | | | | | | | | | | |
| | | Common Stocks | | | Preferred Stocks | | | Total | |
Assets: | | | | | | | | | | | | |
Opening Balance, as of September 30, 2016 | | $ | 1,279,319 | | | $ | 7,955,384 | | | $ | 9,234,703 | |
Transfers into Level 3 | | | 2,099,261 | | | | — | | | | 2,099,261 | |
Transfers out of Level 3 | | | — | | | | — | | | | — | |
Accrued discounts/premiums | | | — | | | | — | | | | — | |
Net realized gain (loss) | | | 223,305 | | | | — | | | | 223,305 | |
Net change in unrealized appreciation (depreciation)1,2 | | | 474,555 | | | | (1,812,092 | ) | | | (1,337,537 | ) |
Purchases | | | — | | | | — | | | | — | |
Sales | | | (1,121,293 | ) | | | — | | | | (1,121,293 | ) |
| | | | |
Closing Balance, as of March 31, 2017 | | $ | 2,955,147 | | | $ | 6,143,292 | | | $ | 9,098,439 | |
| | | | |
Net change in unrealized appreciation (depreciation) on investments still held at March 31, 2017 2 | | $ | 474,555 | | | $ | (1,812,092 | ) | | $ | (1,337,537 | ) |
| | | | |
1 Included in the related net change in unrealized appreciation (depreciation) in the Statements of Operations. 2 Any difference between net change in unrealized appreciation (depreciation) and net change in unrealized appreciation (depreciation) on investments still held at March 31, 2017, is generally due to investments no longer held or categorized as Level 3 at period end. | |
The following table summarizes the valuation approaches used and unobservable inputs utilized by the BlackRock Global Valuation Methodologies Committee to determine the value of certain of the Fund’s Level 3 investments as of period end. The table does not include Level 3 investments with values based upon unadjusted third party pricing information in the amount of $1,595,389.
| | | | | | | | | | | | | | | | |
| | | Value | | | Valuation Approach | | Unobservable Inputs | | Range of
Unobservable Inputs
Utilized | | | Weighted Average of
Unobservable Inputs | |
Assets: | | | | | | | | | | | | | | | | |
Common Stocks | | $ | 1,359,758 | | | Market | | Tangible Book Value Multiple1 | | | 1.80x | | | | — | |
Preferred Stocks3 | | | 6,143,292 | | | Market | | Revenue Growth Rate1 | | | 133.00% - 187.00% | | | | 174.26 | % |
| | | | | | | | Revenue Multiple1 | | | 10.75x - 32.50x | | | | 15.47x | |
| | | | | | | | Time to Exit2 | | | 2-3 years | | | | — | |
| | | | | | | | | Volatility1 | | | 38.00% | | | | — | |
Total | | $ | 7,503,050 | | | | | | | | | | | | | |
| | | | |
1 Increase in unobservable input may result in a significant increase to value, while a decrease in the unobservable input may result in a significant decrease to value. 2 Decrease in unobservable input may result in a significant increase to value, while an increase in the unobservable input may result in a significant decrease to value. 3 For the period ended March 31, 2017, the valuation technique for investments classified as preferred stocks amounting to $968,955 changed to an Option Pricing Model. The investments were previously valued utilizing Probability-Weighted Expected Return Model. The change was due to consideration of liquidation preferences and exit strategy. | |
See Notes to Financial Statements.
| | | | | | |
| | | BLACKROCK FUNDS | | MARCH 31, 2017 | | 23 |
| | | | |
| Schedule of Investments March 31, 2017 (Unaudited) | | | BlackRock Health Sciences Opportunities Portfolio | |
| | | (Percentages shown are based on Net Assets) | |
| | | | | | | | |
| Common Stocks | | Shares | | | Value | |
Biotechnology — 24.7% | | | | | | | | |
AbbVie, Inc. | | | 701,306 | | | $ | 45,697,099 | |
Acceleron Pharma, Inc. (a) | | | 807,600 | | | | 21,377,172 | |
Acerta Pharma BV, Series B (Acquired 5/6/15, cost $17,141,679) (a)(b) | | | 297,971,595 | | | | 25,297,788 | |
Agios Pharmaceuticals, Inc. (a) | | | 174,400 | | | | 10,184,960 | |
Alder Biopharmaceuticals, Inc. (a) | | | 117,794 | | | | 2,450,115 | |
Alkermes PLC (a) | | | 509,200 | | | | 29,788,200 | |
Alnylam Pharmaceuticals, Inc. (a) | | | 255,400 | | | | 13,089,250 | |
Amgen, Inc. | | | 1,297,846 | | | | 212,937,593 | |
Aquinox Pharmaceuticals, Inc. (a) | | | 407,779 | | | | 6,805,832 | |
Audentes Therapeutics, Inc. (a) | | | 182,579 | | | | 3,111,146 | |
Avexis, Inc. (a) | | | 414,156 | | | | 31,488,281 | |
Biogen, Inc. (a) | | | 424,262 | | | | 116,001,716 | |
BioMarin Pharmaceutical, Inc. (a) | | | 290,800 | | | | 25,526,424 | |
Bioverativ, Inc. (a) | | | 212,131 | | | | 11,552,654 | |
Celgene Corp. (a) | | | 1,781,338 | | | | 221,651,887 | |
Galapagos NV (a) | | | 76,400 | | | | 6,584,916 | |
Genomic Health, Inc. (a) | | | 300,800 | | | | 9,472,192 | |
Gilead Sciences, Inc. | | | 1,225,156 | | | | 83,212,596 | |
Global Blood Therapeutics, Inc. (a) | | | 312,637 | | | | 11,520,673 | |
Halozyme Therapeutics, Inc. (a) | | | 893,300 | | | | 11,577,168 | |
Incyte Corp. (a) | | | 373,500 | | | | 49,925,745 | |
Karyopharm Therapeutics, Inc. (a) | | | 118,200 | | | | 1,517,688 | |
Lion Biotechnologies, Inc. (a) | | | 1,140,378 | | | | 8,495,816 | |
Myovant Sciences, Ltd. (a) | | | 535,198 | | | | 6,283,225 | |
Neurocrine Biosciences, Inc. (a) | | | 355,338 | | | | 15,386,135 | |
Otonomy, Inc. (a) | | | 171,200 | | | | 2,097,200 | |
Prothena Corp. PLC (a) | | | 40,664 | | | | 2,268,645 | |
PTC Therapeutics, Inc. (a) | | | 285,000 | | | | 2,804,400 | |
Regeneron Pharmaceuticals, Inc. (a) | | | 165,122 | | | | 63,986,426 | |
REGENXBIO, Inc. (a) | | | 640,313 | | | | 12,358,041 | |
Sage Therapeutics, Inc. (a) | | | 286,697 | | | | 20,375,556 | |
Sarepta Therapeutics, Inc. (a) | | | 680,855 | | | | 20,153,308 | |
Seattle Genetics, Inc. (a) | | | 414,218 | | | | 26,037,743 | |
Spark Therapeutics, Inc. (a) | | | 83,000 | | | | 4,427,220 | |
Syndax Pharmaceuticals, Inc. (a)(c) | | | 956,421 | | | | 13,122,096 | |
TESARO, Inc. (a) | | | 335,474 | | | | 51,619,384 | |
Ultragenyx Pharmaceutical, Inc. (a) | | | 152,100 | | | | 10,309,338 | |
Vertex Pharmaceuticals, Inc. (a) | | | 1,106,570 | | | | 121,003,430 | |
| | | | | | | | |
| | | | | | | | 1,331,499,058 | |
Diversified Consumer Services — 0.4% | | | | | | | | |
Service Corp. International | | | 764,400 | | | | 23,604,672 | |
Health Care Equipment & Supplies — 21.9% | | | | | | | | |
Abbott Laboratories | | | 2,144,300 | | | | 95,228,363 | |
Baxter International, Inc. | | | 2,768,000 | | | | 143,548,480 | |
Becton Dickinson and Co. | | | 392,292 | | | | 71,962,044 | |
Boston Scientific Corp. (a) | | | 6,302,600 | | | | 156,745,662 | |
CR Bard, Inc. | | | 454,560 | | | | 112,976,342 | |
Edwards Lifesciences Corp. (a) | | | 288,900 | | | | 27,176,823 | |
Hologic, Inc. (a) | | | 1,314,900 | | | | 55,948,995 | |
Intuitive Surgical, Inc. (a) | | | 103,500 | | | | 79,329,645 | |
iRhythm Technologies, Inc. (a) | | | 87,995 | | | | 3,308,612 | |
Masimo Corp. (a) | | | 404,400 | | | | 37,714,344 | |
Medtronic PLC | | | 3,087,523 | | | | 248,730,853 | |
Stryker Corp. | | | 1,133,400 | | | | 149,212,110 | |
| | | | | | | | |
| | | | | | | | 1,181,882,273 | |
Health Care Providers & Services — 27.7% | | | | | | | | |
Aetna, Inc. | | | 894,923 | | | | 114,147,429 | |
Amedisys, Inc. (a) | | | 1,004,000 | | | | 51,294,360 | |
AmerisourceBergen Corp. | | | 271,400 | | | | 24,018,900 | |
Anthem, Inc. | | | 681,900 | | | | 112,772,622 | |
Cardinal Health, Inc. | | | 670,280 | | | | 54,661,334 | |
Centene Corp. (a) | | | 718,100 | | | | 51,171,806 | |
Cigna Corp. | | | 813,500 | | | | 119,169,615 | |
| | | | | | | | |
| Common Stocks | | Shares | | | Value | |
Health Care Providers & Services (continued) | | | | | | | | |
DaVita, Inc. (a) | | | 1,182,059 | | | $ | 80,344,550 | |
Express Scripts Holding Co. (a) | | | 336,100 | | | | 22,152,351 | |
HCA Holdings, Inc. (a) | | | 813,648 | | | | 72,406,536 | |
HealthEquity, Inc. (a) | | | 228,700 | | | | 9,708,315 | |
Humana, Inc. | | | 690,400 | | | | 142,319,056 | |
McKesson Corp. | | | 538,000 | | | | 79,763,880 | |
Quest Diagnostics, Inc. | | | 1,002,500 | | | | 98,435,475 | |
Teladoc, Inc. (a)(d) | | | 386,400 | | | | 9,660,000 | |
UnitedHealth Group, Inc. | | | 2,374,353 | | | | 389,417,636 | |
Universal Health Services, Inc., Class B | | | 344,500 | | | | 42,873,025 | |
WellCare Health Plans, Inc. (a) | | | 115,400 | | | | 16,180,234 | |
| | | | | | | | |
| | | | | | | | 1,490,497,124 | |
Life Sciences Tools & Services — 2.0% | | | | | | | | |
Agilent Technologies, Inc. | | | 678,300 | | | | 35,861,721 | |
Thermo Fisher Scientific, Inc. | | | 456,400 | | | | 70,103,040 | |
| | | | | | | | |
| | | | | | | | 105,964,761 | |
Pharmaceuticals — 21.4% | | | | | | | | |
Allergan PLC | | | 654,560 | | | | 156,387,475 | |
AstraZeneca PLC | | | 963,327 | | | | 59,232,000 | |
Bristol-Myers Squibb Co. | | | 1,716,126 | | | | 93,322,932 | |
Chugai Pharmaceutical Co. Ltd. | | | 144,700 | | | | 4,981,049 | |
Dermira, Inc. (a) | | | 406,300 | | | | 13,858,893 | |
Eli Lilly & Co. | | | 1,376,400 | | | | 115,769,004 | |
GlaxoSmithKline PLC | | | 1,215,200 | | | | 25,267,527 | |
Intra-Cellular Therapies, Inc. (a) | | | 249,554 | | | | 4,055,253 | |
Jazz Pharmaceuticals PLC (a) | | | 202,300 | | | | 29,359,799 | |
Johnson & Johnson | | | 1,124,800 | | | | 140,093,840 | |
Merck & Co., Inc. | | | 1,963,100 | | | | 124,735,374 | |
Merck KGaA | | | 477,400 | | | | 54,401,438 | |
Mylan NV (a) | | | 1,171,100 | | | | 45,661,189 | |
Novartis AG — ADR | | | 174,200 | | | | 12,937,834 | |
Pacira Pharmaceuticals, Inc. (a) | | | 92,700 | | | | 4,227,120 | |
Pfizer, Inc. | | | 6,548,437 | | | | 224,022,030 | |
Zoetis, Inc. | | | 839,600 | | | | 44,809,452 | |
| | | | | | | | |
| | | | | | | | 1,153,122,209 | |
Total Common Stocks — 98.1% | | | | | | | 5,286,570,097 | |
| | | | | | | | |
| Preferred Stocks | | | | | | |
Biotechnology — 0.2% | | | | | | | | |
Ovid Therapeutics Inc. (Acquired 8/07/15, cost $9,342,296) (a)(b) | | | 1,499,566 | | | | 10,122,070 | |
Total Preferred Stocks — 0.2% | | | | | | | 10,122,070 | |
| | | | | | | | |
| Rights | | | | | | |
Biotechnology — 0.0% | | | | | | | | |
Dyax Corp. — CVR (a) | | | 1,269,237 | | | | 2,906,553 | |
Total Long-Term Investments (Cost — $3,823,380,987) — 98.3% | | | | | | | 5,299,598,720 | |
See Notes to Financial Statements.
| | | | | | |
| 24 | | BLACKROCK FUNDS | | MARCH 31, 2017 | | |
| | | | |
| Schedule of Investments (continued) | | | BlackRock Health Sciences Opportunities Portfolio | |
| | | | | | | | |
Short-Term Securities | | Shares | | | Value | |
BlackRock Liquidity Funds, T-Fund, Institutional Class, 0.60% (e)(f) | | | 83,196,629 | | | $ | 83,196,629 | |
SL Liquidity Series, LLC, Money Market
Series, 1.11% (e)(f)(g) | | | 2,861,045 | | | | 2,861,331 | |
Total Short-Term Securities (Cost — $86,057,676) — 1.6% | | | | 86,057,960 | |
| | | | | | | | |
| | | | | | Value | |
Total Investments (Cost — $3,909,438,663) — 99.9% | | | $ | 5,385,656,680 | |
Other Assets Less Liabilities — 0.1% | | | | | | | 4,378,095 | |
| | | | | | | | |
Net Assets — 100.0% | | | | | | $ | 5,390,034,775 | |
| | | | | | | | |
|
| Notes to Schedule of Investments |
| (a) | Non-income producing security. |
| (b) | Restricted security as to resale, excluding 144A securities. The Fund held restricted securities with a current value of $35,419,858, representing 0.66% of its net assets as of period end, and an original cost of $26,483,975. |
| (c) | During the six months ended March 31, 2017, investments in issuer that is affiliated person and/or related parties of the Fund, as applicable, were as follows: |
| | | | | | | | | | | | | | | | | | | | | | | | | | | | |
| Affiliated Persons and/or Related Parties | | Shares Held at
September 30,
2016 | | | Shares
Purchased | | | Shares
Sold | | | Shares Held at
March 31,
2017 | | | Value at
March 31,
2017 | | | Realized
Gain | | | Change in
Unrealized
Appreciation
(Depreciation) | |
Syndax Pharmaceuticals, Inc. | | | 288,213 | | | | 668,208 | | | | — | | | | 956,421 | | | | $13,122,096 | | | | — | | | | $(596,289 | ) |
| (d) | Security, or a portion of the security, is on loan. |
| (e) | Current yield as of period end. |
| (f) | During the six months ended March 31, 2017, investments in issuers considered to be affiliates of the Fund for purposes of Section 2(a)(3) of the Investment Company Act of 1940, as amended, were as follows: |
| | | | | | | | | | | | | | | | | | | | | | | | | | | | |
| Affiliate | | Shares Held at
September 30,
2016 | | | Net
Activity | | | Shares Held at
March 31,
2017 | | | Value at
March 31,
2017 | | | Income | | | Net Realized
Gain1 | | | Change in
Unrealized
Appreciation
(Depreciation) | |
BlackRock Liquidity Funds, T-Fund, Institutional Class | | | 132,199,702 | | | | (49,003,073 | ) | | | 83,196,629 | | | | $83,196,629 | | | | $181,136 | | | | $ 526 | | | | — | |
SL Liquidity Series, LLC, Money Market Series | | | 11,591,525 | | | | (8,730,480 | ) | | | 2,861,045 | | | | 2,861,331 | | | | 224,800 | 2 | | | 2,571 | | | | $284 | |
Total | | | | | | | | | | | | | | | $86,057,960 | | | | $405,936 | | | | $3,097 | | | | $284 | |
| | | | | | | | | | | | | | | | |
| | 1 | | Includes net capital gain distributions. |
| | 2 | | Represents securities lending income earned from the reinvestment of cash collateral from loaned securities, net of fees and collateral investment expenses, and other payments to and from borrowers of securities. |
| (g) | Security was purchased with the cash collateral from loaned securities. |
| • | | For Fund compliance purposes, the Fund’s industry classifications refer to one or more of the industry sub-classifications used by one or more widely recognized market indexes or ratings group indexes, and/or as defined by the investment adviser. These definitions may not apply for purposes of this report, which may combine such industry sub-classifications for reporting ease. |
|
| Derivative Financial Instruments Categorized by Risk Exposure |
For the six months ended March 31, 2017, the effect of derivative financial instruments in the Statements of Operations was as follows:
| | | | | | | | | | | | | | | | | | | | | | | | | | | | | | | | | | | |
| Net Realized Gain (Loss) from: | | Commodity
Contracts | | Credit
Contracts | | Equity
Contracts | | Foreign Currency
Exchange Contracts | | Interest Rate
Contracts | | Other
Contracts | | Total |
Forward foreign currency exchange contracts | | | | — | | | | | — | | | | | — | | | | $ | 1,535,695 | | | | | — | | | | | — | | | | $ | 1,535,695 | |
| | | | | | | | | | | | | | | |
| Net Change in Unrealized Appreciation (Depreciation) on: | | | | | | | | | | | | | | |
Forward foreign currency exchange contracts | | | | — | | | | | — | | | | | — | | | | $ | 377,817 | | | | | — | | | | | — | | | | $ | 377,817 | |
|
| Average Quarterly Balances of Outstanding Derivative Financial Instruments |
| | | | |
| Forward foreign currency exchange contracts: | | | |
Average amounts purchased — in USD | | $ | 18,563,411 | |
Average amounts sold — in USD | | $ | 17,729,524 | |
For more information about the Fund’s investment risks regarding derivative financial instruments, refer to the Notes to Financial Statements.
See Notes to Financial Statements.
| | | | | | |
| | | BLACKROCK FUNDS | | MARCH 31, 2017 | | 25 |
| | | | |
| Schedule of Investments (concluded) | | | BlackRock Health Sciences Opportunities Portfolio | |
|
| Fair Value Hierarchy as of Period End |
Various inputs are used in determining the fair value of investments and derivative financial instruments. For information about the Fund’s policy regarding valuation of investments and derivative financial instruments refer to the Notes to Financial Statements.
The following tables summarize the Fund’s investments and derivative financial instruments categorized in the disclosure hierarchy:
| | | | | | | | | | | | | | | | |
| | | Level 1 | | | Level 2 | | | Level 3 | | | Total | |
Assets: | | | | | | | | | | | | | | | | |
Investments: | | | | | | | | | | | | | | | | |
Long-Term Investments: | | | | | | | | | | | | | | | | |
Common Stocks: | | | | | | | | | | | | | | | | |
Biotechnology | | $ | 1,306,201,270 | | | | — | | | $ | 25,297,788 | | | $ | 1,331,499,058 | |
Diversified Consumer Services | | | 23,604,672 | | | | — | | | | — | | | | 23,604,672 | |
Health Care Equipment & Supplies | | | 1,181,882,273 | | | | — | | | | — | | | | 1,181,882,273 | |
Health Care Providers & Services | | | 1,490,497,124 | | | | — | | | | — | | | | 1,490,497,124 | |
Life Sciences Tools & Services | | | 105,964,761 | | | | — | | | | — | | | | 105,964,761 | |
Pharmaceuticals | | | 1,009,240,195 | | | $ | 143,882,014 | | | | — | | | | 1,153,122,209 | |
Preferred Stocks: | | | | | | | | | | | | | | | | |
Biotechnology | | | — | | | | — | | | | 10,122,070 | | | | 10,122,070 | |
Rights: | | | | | | | | | | | | | | | | |
Biotechnology | | | — | | | | — | | | | 2,906,553 | | | | 2,906,553 | |
Short-Term Securities | | | 83,196,629 | | | | — | | | | — | | | | 83,196,629 | |
| | | | |
Subtotal | | $ | 5,200,586,924 | | | $ | 143,882,014 | | | $ | 38,326,411 | | | $ | 5,382,795,349 | |
| | | | |
Investments Valued at NAV1 | | | | | | | | | | | | | | | 2,861,331 | |
| | | | | | | | | | | | | | | | |
Total Investments | | | | | | | | | | | | | | $ | 5,385,656,680 | |
| | | | | | | | | | | | | | | | |
| | 1 | | As of March 31, 2017, certain of the Fund’s investments were fair valued using NAV per share as no quoted market value is available and therefore have been excluded from the fair value hierarchy. |
During the six months ended March 31, 2017, there were no transfers between Level 1 and Level 2.
A reconciliation of Level 3 investments is presented when the Fund had a significant amount of Level 3 investments at the beginning and/or end of the period in relation to net assets. The following table is a reconciliation of Level 3 investments for which significant unobservable inputs were used in determining fair value:
| | | | | | | | | | | | | | | | |
| | | Common Stocks | | | Preferred Stocks | | | Rights | | | Total | |
Assets: | | | | | | | | | | | | | | | | |
Opening Balance, as of September 30, 2016 | | $ | 25,327,586 | | | $ | 9,342,296 | | | $ | 1,408,853 | | | $ | 36,078,735 | |
Transfers into Level 3 | | | — | | | | — | | | | — | | | | — | |
Transfers out of Level 3 | | | — | | | | — | | | | — | | | | — | |
Net realized gain (loss) | | | — | | | | — | | | | — | | | | — | |
Net change in unrealized appreciation (depreciation)1,2 | | | (29,798 | ) | | | 779,774 | | | | 1,497,700 | | | | 2,247,676 | |
Purchases | | | — | | | | — | | | | — | | | | — | |
Sales | | | — | | | | — | | | | — | | | | — | |
| | | | |
Closing Balance, as of March 31, 2017 | | $ | 25,297,788 | | | $ | 10,122,070 | | | $ | 2,906,553 | | | $ | 38,326,411 | |
| | | | |
Net change in unrealized appreciation (depreciation) on investments still held at March 31, 20172 | | $ | (29,798 | ) | | $ | 779,774 | | | $ | 1,497,700 | | | $ | 2,247,676 | |
| | | | |
| | 1 | | Certain Level 3 investments were re-classified between Common Stocks and Preferred Stocks. |
| | 2 | | Any difference between net change in unrealized appreciation (depreciation) and net change in unrealized appreciation (depreciation) on investments still held at March 31, 2017, is generally due to investments no longer held or categorized as Level 3 at period end. |
See Notes to Financial Statements.
| | | | | | |
| 26 | | BLACKROCK FUNDS | | MARCH 31, 2017 | | |
| | | | |
| Schedule of Investments March 31, 2017 (Unaudited) | | | BlackRock International Opportunities Portfolio | |
| | | (Percentages shown are based on Net Assets) | |
| | | | | | | | |
| Common Stocks | | Shares | | | Value | |
Australia — 1.0% | | | | | | | | |
Commonwealth Bank of Australia | | | 110,100 | | | $ | 7,219,816 | |
Belgium — 1.0% | | | | | | | | |
Anheuser-Busch InBev SA | | | 62,629 | | | | 6,862,610 | |
Brazil — 0.5% | | | | | | | | |
Embraer, S.A. | | | 593,600 | | | | 3,289,772 | |
Canada — 3.2% | | | | | | | | |
Canadian Pacific Railway Ltd. | | | 49,900 | | | | 7,330,124 | |
Encana Corp. | | | 559,600 | | | | 6,556,054 | |
Potash Corp. of Saskatchewan, Inc. | | | 487,479 | | | | 8,328,400 | |
| | | | | | | | |
| | | | | | | | 22,214,578 | |
China — 8.8% | | | | | | | | |
AIA Group Ltd. | | | 1,100,300 | | | | 6,945,047 | |
Alibaba Group Holding Ltd. — ADR (a) | | | 100,258 | | | | 10,810,820 | |
Anhui Conch Cement Co. Ltd., H Shares | | | 1,015,500 | | | | 3,453,761 | |
China Construction Bank Corp., H Shares | | | 11,148,000 | | | | 8,982,030 | |
China Unicom Hong Kong Ltd. | | | 5,668,000 | | | | 7,612,823 | |
Ping An Insurance Group Co. of China Ltd., H Shares | | | 2,508,000 | | | | 14,055,969 | |
Tencent Holdings Ltd. | | | 315,600 | | | | 9,092,285 | |
| | | | | | | | |
| | | | | | | | 60,952,735 | |
France — 7.0% | | | | | | | | |
AXA SA | | | 463,400 | | | | 11,972,341 | |
BNP Paribas SA | | | 119,987 | | | | 7,984,447 | |
Dassault Aviation SA | | | 5,401 | | | | 6,859,126 | |
Renault SA | | | 121,520 | | | | 10,556,753 | |
Sanofi | | | 59,100 | | | | 5,342,378 | |
Société Générale SA | | | 117,750 | | | | 5,965,861 | |
| | | | | | | | |
| | | | | | | | 48,680,906 | |
Germany — 4.5% | | | | | | | | |
Continental AG | | | 20,208 | | | | 4,430,623 | |
Innogy SE (a) | | | 107,072 | | | | 4,035,290 | |
KION Group AG | | | 68,390 | | | | 4,464,048 | |
SAP SE | | | 95,400 | | | | 9,359,530 | |
thyssenKrupp AG | | | 263,500 | | | | 6,455,168 | |
Wacker Chemie AG | | | 24,400 | | | | 2,515,579 | |
| | | | | | | | |
| | | | | | | | 31,260,238 | |
Hong Kong — 2.0% | | | | | | | | |
Melco Crown Entertainment Ltd. — ADR | | | 433,300 | | | | 8,033,382 | |
Weichai Power Co. Ltd., H Shares | | | 3,158,000 | | | | 5,578,444 | |
| | | | | | | | |
| | | | | | | | 13,611,826 | |
India — 3.8% | | | | | | | | |
Bharti Infratel Ltd. | | | 1,198,079 | | | | 6,015,615 | |
Dish TV India Ltd. | | | 1,541,088 | | | | 2,550,458 | |
Federal Bank Ltd. | | | 2,804,300 | | | | 3,950,098 | |
HDFC Bank Ltd. | | | 335,955 | | | | 7,591,978 | |
ICICI Bank Ltd. | | | 1,510,800 | | | | 6,453,484 | |
| | | | | | | | |
| | | | | | | | 26,561,633 | |
Indonesia — 1.0% | | | | | | | | |
Bank Negara Indonesia Persero Tbk PT | | | 8,630,100 | | | | 4,195,749 | |
Matahari Department Store Tbk PT | | | 2,880,771 | | | | 2,848,712 | |
| | | | | | | | |
| | | | | | | | 7,044,461 | |
Ireland — 3.3% | | | | | | | | |
Green REIT PLC | | | 3,722,555 | | | | 5,400,878 | |
Ryanair Holdings PLC — ADR (a) | | | 82,114 | | | | 6,813,820 | |
Shire PLC — ADR | | | 60,300 | | | | 10,506,069 | |
| | | | | | | | |
| | | | | | | | 22,720,767 | |
Italy — 5.3% | | | | | | | | |
Azimut Holding SpA | | | 355,400 | | | | 6,171,682 | |
| | | | | | | | |
| Common Stocks | | Shares | | | Value | |
Italy (continued) | | | | | | | | |
Buzzi Unicem SpA | | | 191,500 | | | $ | 4,895,040 | |
Eni SpA | | | 716,800 | | | | 11,736,411 | |
Telecom Italia SpA (a) | | | 4,879,000 | | | | 4,392,021 | |
UniCredit SpA | | | 627,000 | | | | 9,665,435 | |
| | | | | | | | |
| | | | | | | | 36,860,589 | |
Japan — 7.3% | | | | | | | | |
Don Quijote Holdings Co. Ltd. | | | 120,000 | | | | 4,176,764 | |
FANUC Corp. | | | 26,300 | | | | 5,414,416 | |
Mitsubishi Estate Co. Ltd. | | | 349,000 | | | | 6,361,108 | |
Nintendo Co. Ltd. | | | 34,200 | | | | 7,935,730 | |
ORIX Corp. | | | 388,100 | | | | 5,760,389 | |
SMC Corp. | | | 22,400 | | | | 6,640,807 | |
Sumitomo Mitsui Financial Group, Inc. | | | 267,400 | | | | 9,733,031 | |
Toyota Motor Corp. | | | 86,700 | | | | 4,705,889 | |
| | | | | | | | |
| | | | | | | | 50,728,134 | |
Mexico — 1.2% | | | | | | | | |
Fomento Economico Mexicano SAB de CV — ADR | | | 92,200 | | | | 8,161,544 | |
Netherlands — 6.6% | | | | | | | | |
Aalberts Industries NV | | | 117,905 | | | | 4,394,998 | |
Akzo Nobel NV | | | 26,200 | | | | 2,168,943 | |
ASML Holding NV | | | 64,220 | | | | 8,521,564 | |
CNH Industrial NV | | | 602,810 | | | | 5,802,114 | |
Euronext NV | | | 96,000 | | | | 4,186,079 | |
Koninklijke Philips NV | | | 158,200 | | | | 5,082,076 | |
Royal Dutch Shell PLC, B Shares | | | 572,516 | | | | 15,738,100 | |
| | | | | | | | |
| | | | | | | | 45,893,874 | |
New Zealand — 0.8% | | | | | | | | |
Xero Ltd. (a) | | | 413,800 | | | | 5,738,689 | |
Nigeria — 0.5% | | | | | | | | |
Lekoil Ltd. (a) | | | 11,614,700 | | | | 3,388,265 | |
Norway — 1.3% | | | | | | | | |
Statoil ASA | | | 524,700 | | | | 9,018,834 | |
Peru — 1.1% | | | | | | | | |
Credicorp Ltd. | | | 46,000 | | | | 7,511,800 | |
Philippines — 0.2% | | | | | | | | |
CEMEX Holdings Philippines, Inc. (a) | | | 12,614,000 | | | | 1,767,343 | |
Portugal — 1.5% | | | | | | | | |
Galp Energia SGPS SA | | | 667,200 | | | | 10,119,705 | |
Singapore — 1.0% | | | | | | | | |
Oversea-Chinese Banking Corp. Ltd. | | | 1,036,200 | | | | 7,197,459 | |
South Africa — 1.4% | | | | | | | | |
Naspers Ltd., N Shares | | | 56,997 | | | | 9,821,285 | |
South Korea — 2.9% | | | | | | | | |
LG Chem Ltd. | | | 29,800 | | | | 7,835,565 | |
Samsung Electronics Co. Ltd. | | | 6,900 | | | | 12,698,866 | |
| | | | | | | | |
| | | | | | | | 20,534,431 | |
Spain — 0.6% | | | | | | | | |
Cellnex Telecom SAU (b) | | | 235,014 | | | | 3,870,666 | |
Sweden — 1.1% | | | | | | | | |
Hexagon AB, B Shares | | | 192,764 | | | | 7,736,535 | |
Switzerland — 5.5% | | | | | | | | |
Nestle SA, Registered Shares | | | 175,800 | | | | 13,492,961 | |
Novartis AG, Registered Shares | | | 91,100 | | | | 6,764,864 | |
Roche Holding AG | | | 28,714 | | | | 7,343,138 | |
UBS Group AG, Registered Shares | | | 682,900 | | | | 10,915,892 | |
| | | | | | | | |
| | | | | | | | 38,516,855 | |
See Notes to Financial Statements.
| | | | | | |
| | | BLACKROCK FUNDS | | MARCH 31, 2017 | | 27 |
| | | | |
| Schedule of Investments (continued) | | | BlackRock International Opportunities Portfolio | |
| | | | |
| | | | | | | | |
| Common Stocks | | Shares | | | Value | |
Taiwan — 2.4% | | | | | | | | |
Catcher Technology Co. Ltd. | | | 722,000 | | | $ | 7,135,585 | |
Taiwan Semiconductor Manufacturing Co. Ltd. | | | 1,534,000 | | | | 9,619,151 | |
| | | | | | | | |
| | | | | | | | 16,754,736 | |
Thailand — 0.7% | | | | | | | | |
True Corp. PCL | | | 24,598,900 | | | | 4,867,433 | |
United Kingdom — 12.1% | | | | | | | | |
AstraZeneca PLC | | | 49,800 | | | | 3,062,048 | |
BAE Systems PLC | | | 580,000 | | | | 4,667,943 | |
Diageo PLC | | | 179,200 | | | | 5,131,417 | |
GlaxoSmithKline PLC | | | 185,900 | | | | 3,865,399 | |
Imperial Brands PLC | | | 182,200 | | | | 8,830,061 | |
Kennedy Wilson Europe Real Estate PLC | | | 312,798 | | | | 3,701,531 | |
Liberty Global PLC (a) | | | 314,100 | | | | 11,266,767 | |
Metro Bank PLC (a) | | | 92,453 | | | | 3,749,477 | |
Nomad Foods, Ltd. (a) | | | 260,143 | | | | 2,978,637 | |
Reckitt Benckiser Group PLC | | | 72,800 | | | | 6,646,020 | |
Rio Tinto PLC | | | 232,000 | | | | 9,342,082 | |
Sophos Group PLC (b) | | | 1,484,100 | | | | 5,050,198 | |
Unilever PLC | | | 156,300 | | | | 7,709,834 | |
Worldpay Group PLC (b) | | | 2,225,500 | | | | 8,228,154 | |
| | | | | | | | |
| | | | | | | | 84,229,568 | |
United States — 3.3% | | | | | | | | |
Pfizer, Inc. | | | 236,600 | | | | 8,094,086 | |
Samsonite International SA | | | 2,480,100 | | | | 9,034,753 | |
Wynn Resorts Ltd. | | | 52,600 | | | | 6,028,486 | |
| | | | | | | | |
| | | | | | | | 23,157,325 | |
Total Common Stocks — 92.9% | | | | | | | 646,294,412 | |
| | | | | | | | |
| Exchange-Traded Funds | | | | | | |
United States — 3.1% | | | | | | | | |
WisdomTree Japan Hedged Equity Fund | | | 428,010 | | | | 21,665,866 | |
Total Exchange-Traded Funds — 3.1% | | | | | | | 21,665,866 | |
| | | | | | | | |
| Preferred Stocks | | Shares | | | Value | |
China — 0.6% | | | | | | | | |
Xiaoju Kuaizhi Inc., Series A-17 (Acquired 7/28/15, cost $2,770,046) (a)(c) | | | 101,000 | | | $ | 3,861,230 | |
India — 1.3% | | | | | | | | |
Jasper Infotech Private Ltd., Series F (Acquired 5/07/14, cost $5,332,969) (a)(c) | | | 749 | | | | 6,621,928 | |
Jasper Infotech Private Ltd., Series G (Acquired 10/29/14, cost $2,090,847) (a)(c) | | | 248 | | | | 2,322,309 | |
| | | | | | | | |
| | | | | | | | 8,944,237 | |
Total Preferred Stocks — 1.9% | | | | | | | 12,805,467 | |
Total Long-Term Investments (Cost — $607,427,982) — 97.9% | | | | | | $ | 680,765,745 | |
| | | | | | | | |
| Short-Term Securities | | | | | | |
BlackRock Liquidity Funds, T-Fund, Institutional Class, 0.60% (d)(e) | | | 8,552,082 | | | | 8,552,082 | |
Total Short-Term Securities (Cost — $8,552,082) — 1.2% | | | | 8,552,082 | |
Total Investments Before Options Written (Cost — $615,980,064) — 99.1% | | | | | | | 689,317,827 | |
| | | | | | | | |
| Options Written | | | | | | |
(Premiums Received — $54,398) — (0.0)% | | | | | | | (707 | ) |
Total Investments Net of Options Written — 99.1% | | | | 689,317,120 | |
Other Assets Less Liabilities — 0.9% | | | | | | | 6,383,583 | |
| | | | | | | | |
Net Assets — 100.0% | | | | | | $ | 695,700,703 | |
| | | | | | | | |
|
| Notes to Schedule of Investments |
| (a) | Non-income producing security. |
| (b) | Security exempt from registration pursuant to Rule 144A under the Securities Act of 1933, as amended. These securities may be resold in transactions exempt from registration to qualified institutional investors. |
| (c) | Restricted security as to resale, excluding 144A securities. The Fund held restricted securities with a current value of $12,805,467, representing 1.84% of its net assets as of period end, and an original cost of $10,193,862. |
| (d) | During the six months ended March 31, 2017, investments in issuers considered to be affiliates of the Fund for purposes of Section 2(a)(3) of the Investment Company Act of 1940, as amended, were as follows: |
| | | | | | | | | | | | | | | | | | | | | | | | | | | | |
| Affiliate | | Shares Held at
September 30,
2016 | | | Net Activity | | | Shares Held at
March 31, 2017 | | | Value at March 31, 2017 | | | Income | | | Net Realized
Gain1 | | | Change in Unrelized Appreciation (Depreciation) | |
BlackRock Liquidity Funds, T-Fund, Institutional Class | | | 25,833,103 | | | | (17,281,021 | ) | | | 8,552,082 | | | | $8,552,082 | | | $ | 13,999 | | | | $ 6 | | | | — | |
SL Liquidity Series, LLC, Money Market Series | | | — | | | | — | | | | — | | | | — | | | | 1,637 | 2 | | | 1,923 | | | | — | |
Total | | | | | | | | | | | | | | | $8,552,082 | | | $ | 15,636 | | | | $1,929 | | | | — | |
| | | | | | | | | | | | | | | | |
| | 1 | | Includes net capital gain distributions. |
| | 2 | | Represents securities lending income earned from the reinvestment of cash collateral from loaned securities, net of fees and collateral investment expenses, and other payments to and from borrowers of securities. |
| (e) | Current yield as of period end. |
See Notes to Financial Statements.
| | | | | | |
| 28 | | BLACKROCK FUNDS | | MARCH 31, 2017 | | |
| | | | |
| Schedule of Investments (continued) | | | BlackRock International Opportunities Portfolio | |
|
| Derivative Financial Instruments Outstanding as of Period End |
|
| Forward Foreign Currency Exchange Contracts |
| | | | | | | | | | | | | | | | | | | | |
Currency Purchased | | | | | Currency Sold | | | | | Counterparty | | Settlement
Date | | | Unrealized Appreciation (Depreciation) | |
| AUD | | | 176,439 | | | USD | | | 129,503 | | | Northern Trust Corp. | | | 4/12/17 | | | $ | 5,268 | |
| AUD | | | 39,211,561 | | | USD | | | 28,780,109 | | | Northern Trust Corp. | | | 4/12/17 | | | | 1,171,220 | |
| CAD | | | 2,842,000 | | | USD | | | 2,149,973 | | | Bank of America N.A. | | | 4/12/17 | | | | (12,517 | ) |
| CAD | | | 3,134,000 | | | USD | | | 2,392,753 | | | Citibank N.A. | | | 4/12/17 | | | | (35,685 | ) |
| CAD | | | 1,400,000 | | | USD | | | 1,065,995 | | | Commonwealth Bank of Australia | | | 4/12/17 | | | | (13,061 | ) |
| CAD | | | 16,808,000 | | | USD | | | 12,638,877 | | | Commonwealth Bank of Australia | | | 4/12/17 | | | | 2,348 | |
| DKK | | | 57,771,000 | | | USD | | | 8,253,182 | | | Bank of America N.A. | | | 4/12/17 | | | | 35,840 | |
| EUR | | | 337,246 | | | USD | | | 358,455 | | | Bank of America N.A. | | | 4/12/17 | | | | 1,513 | |
| EUR | | | 3,439,570 | | | USD | | | 3,719,393 | | | Bank of America N.A. | | | 4/12/17 | | | | (48,075 | ) |
| EUR | | | 355,368 | | | USD | | | 378,774 | | | Barclays Bank PLC | | | 4/12/17 | | | | 537 | |
| EUR | | | 223,007 | | | USD | | | 242,812 | | | BNP Paribas S.A. | | | 4/12/17 | | | | (4,779 | ) |
| EUR | | | 8,518,045 | | | USD | | | 9,033,515 | | | BNP Paribas S.A. | | | 4/12/17 | | | | 58,452 | |
| EUR | | | 1,543,379 | | | USD | | | 1,636,239 | | | Citibank N.A. | | | 4/12/17 | | | | 11,128 | |
| EUR | | | 2,736,563 | | | USD | | | 2,927,137 | | | Citibank N.A. | | | 4/12/17 | | | | (6,192 | ) |
| EUR | | | 202,347 | | | USD | | | 215,818 | | | Commonwealth Bank of Australia | | | 4/12/17 | | | | 163 | |
| EUR | | | 1,456,445 | | | USD | | | 1,548,552 | | | Commonwealth Bank of Australia | | | 4/12/17 | | | | 6,024 | |
| EUR | | | 1,593,948 | | | USD | | | 1,688,112 | | | Commonwealth Bank of Australia | | | 4/12/17 | | | | 13,232 | |
| EUR | | | 2,423,146 | | | USD | | | 2,594,736 | | | Commonwealth Bank of Australia | | | 4/12/17 | | | | (8,326 | ) |
| EUR | | | 150,276 | | | USD | | | 161,508 | | | Northern Trust Corp. | | | 4/12/17 | | | | (1,107 | ) |
| EUR | | | 548,587 | | | USD | | | 581,878 | | | Northern Trust Corp. | | | 4/12/17 | | | | 3,671 | |
| EUR | | | 3,195,042 | | | USD | | | 3,426,862 | | | Northern Trust Corp. | | | 4/12/17 | | | | (16,547 | ) |
| EUR | | | 4,245,669 | | | USD | | | 4,503,318 | | | Northern Trust Corp. | | | 4/12/17 | | | | 28,412 | |
| EUR | | | 3,840,658 | | | USD | | | 4,122,693 | | | Royal Bank of Canada | | | 4/12/17 | | | | (23,263 | ) |
| EUR | | | 571,138 | | | USD | | | 611,429 | | | Standard Chartered Bank | | | 4/12/17 | | | | (1,810 | ) |
| GBP | | | 5,004,000 | | | USD | | | 6,136,260 | | | Barclays Bank PLC | | | 4/12/17 | | | | 134,998 | |
| GBP | | | 204,000 | | | USD | | | 255,117 | | | Citibank N.A. | | | 4/12/17 | | | | 546 | |
| GBP | | | 738,000 | | | USD | | | 897,803 | | | Citibank N.A. | | | 4/12/17 | | | | 27,095 | |
| GBP | | | 642,000 | | | USD | | | 780,791 | | | Royal Bank of Scotland PLC | | | 4/12/17 | | | | 23,795 | |
| GBP | | | 6,894,000 | | | USD | | | 8,524,810 | | | Standard Chartered Bank | | | 4/12/17 | | | | 115,089 | |
| GBP | | | 2,349,000 | | | USD | | | 2,856,180 | | | UBS AG | | | 4/12/17 | | | | 87,702 | |
| JPY | | | 4,498,982,000 | | | USD | | | 38,934,046 | | | Barclays Bank PLC | | | 4/12/17 | | | | 1,496,865 | |
| JPY | | | 86,994,060 | | | USD | | | 761,258 | | | Nomura International PLC | | | 4/12/17 | | | | 20,530 | |
| RUB | | | 219,232,600 | | | USD | | | 3,633,288 | | | Citibank N.A. | | | 4/12/17 | | | | 251,163 | |
| SEK | | | 7,145,684 | | | USD | | | 803,214 | | | Australia and New Zealand Banking Group Ltd. | | | 4/12/17 | | | | (5,318 | ) |
| SEK | | | 53,132,000 | | | USD | | | 5,900,350 | | | Barclays Bank PLC | | | 4/12/17 | | | | 32,438 | |
| SEK | | | 3,497,273 | | | USD | | | 388,637 | | | Citibank N.A. | | | 4/12/17 | | | | 1,873 | |
| SGD | | | 8,894,000 | | | USD | | | 6,194,469 | | | Standard Chartered Bank | | | 4/12/17 | | | | 164,229 | |
| USD | | | 2,505,025 | | | AUD | | | 3,266,400 | | | Northern Trust Corp. | | | 4/12/17 | | | | 10,021 | |
| USD | | | 756,743 | | | EUR | | | 703,028 | | | Australia and New Zealand Banking Group Ltd. | | | 4/12/17 | | | | 6,347 | |
| USD | | | 1,068,411 | | | EUR | | | 991,012 | | | Bank of America N.A. | | | 4/12/17 | | | | 10,627 | |
| USD | | | 1,420,097 | | | EUR | | | 1,330,331 | | | Bank of America N.A. | | | 4/12/17 | | | | 133 | |
| USD | | | 50,080,219 | | | EUR | | | 47,175,000 | | | Barclays Bank PLC | | | 4/12/17 | | | | (273,297 | ) |
| USD | | | 1,286,793 | | | EUR | | | 1,198,528 | | | Citibank N.A. | | | 4/12/17 | | | | 7,512 | |
| USD | | | 1,405,935 | | | EUR | | | 1,317,541 | | | Citibank N.A. | | | 4/12/17 | | | | (378 | ) |
| USD | | | 1,977,171 | | | EUR | | | 1,827,947 | | | Citibank N.A. | | | 4/12/17 | | | | 26,063 | |
See Notes to Financial Statements.
| | | | | | |
| | | BLACKROCK FUNDS | | MARCH 31, 2017 | | 29 |
| | | | |
| Schedule of Investments (continued) | | | BlackRock International Opportunities Portfolio | |
| | | | | | | | | | | | | | | | | | | | | | |
Currency Purchased | | | | | Currency Sold | | | | | | Counterparty | | Settlement
Date | | | Unrealized Appreciation (Depreciation) | |
| USD | | | 5,336,450 | | | | EUR | | | | 5,073,636 | | | Nomura International PLC | | | 4/12/17 | | | $ | (79,033 | ) |
| USD | | | 357,867 | | | | EUR | | | | 331,759 | | | Northern Trust Corp. | | | 4/12/17 | | | | 3,755 | |
| USD | | | 845,724 | | | | EUR | | | | 797,973 | | | Standard Chartered Bank | | | 4/12/17 | | | | (6,014 | ) |
| USD | | | 3,707,637 | | | | GBP | | | | 2,963,800 | | | Barclays Bank PLC | | | 4/12/17 | | | | (6,742 | ) |
| USD | | | 627,186 | | | | GBP | | | | 506,000 | | | BNP Paribas S.A. | | | 4/12/17 | | | | (6,958 | ) |
| USD | | | 212,467 | | | | GBP | | | | 174,000 | | | Citibank N.A. | | | 4/12/17 | | | | (5,598 | ) |
| USD | | | 367,750 | | | | GBP | | | | 296,000 | | | Citibank N.A. | | | 4/12/17 | | | | (3,212 | ) |
| USD | | | 2,073,637 | | | | GBP | | | | 1,688,000 | | | Northern Trust Corp. | | | 4/12/17 | | | | (41,848 | ) |
| USD | | | 25,819,169 | | | | GBP | | | | 21,186,000 | | | Royal Bank of Scotland PLC | | | 4/12/17 | | | | (732,166 | ) |
| USD | | | 3,203,473 | | | | JPY | | | | 363,081,631 | | | Bank of America N.A. | | | 4/12/17 | | | | (59,425 | ) |
| USD | | | 3,342,541 | | | | JPY | | | | 382,446,900 | | | Northern Trust Corp. | | | 4/12/17 | | | | (94,387 | ) |
| USD | | | 437,719 | | | | NOK | | | | 3,738,930 | | | Barclays Bank PLC | | | 4/12/17 | | | | 2,206 | |
| USD | | | 5,946,211 | | | | NOK | | | | 50,774,070 | | | Citibank N.A. | | | 4/12/17 | | | | 32,019 | |
| USD | | | 4,431,360 | | | | NZD | | | | 6,336,000 | | | Westpac Banking Corp. | | | 4/12/17 | | | | (8,843 | ) |
| USD | | | 429,675 | | | | SEK | | | | 3,785,002 | | | Barclays Bank PLC | | | 4/12/17 | | | | 7,037 | |
| USD | | | 484,139 | | | | SEK | | | | 4,266,240 | | | Barclays Bank PLC | | | 4/12/17 | | | | 7,765 | |
| USD | | | 3,424,873 | | | | SGD | | | | 4,841,000 | | | Standard Chartered Bank | | | 4/12/17 | | | | (36,163 | ) |
| USD | | | 3,600,580 | | | | SGD | | | | 5,076,000 | | | Standard Chartered Bank | | | 4/12/17 | | | | (28,468 | ) |
| Total | | | | | | | | | | | | | | | | | | | | $ | 2,248,404 | |
| | | | | | | | | | | | | | | | | | | | | | |
| | | | | | | | | | | | | | | | | | | | | | | | | | |
| Description | | Put/
Call | | | Counterparty | | Expiration
Date | | | Strike Price | | | Contracts | | | Value | |
Metro Bank PLC | | | Call | | | UBS AG | | | 4/06/17 | | | | GBP | | | | 36.48 | | | | 11,100 | | | | — | |
Metro Bank PLC | | | Call | | | UBS AG | | | 4/11/17 | | | | GBP | | | | 37.24 | | | | 15,500 | | | $ | (4 | ) |
Metro Bank PLC | | | Call | | | UBS AG | | | 4/11/17 | | | | GBP | | | | 36.26 | | | | 5,700 | | | | (14 | ) |
Metro Bank PLC | | | Call | | | UBS AG | | | 4/19/17 | | | | GBP | | | | 35.93 | | | | 8,807 | | | | (274 | ) |
Metro Bank PLC | | | Call | | | UBS AG | | | 4/25/17 | | | | GBP | | | | 36.00 | | | | 7,097 | | | | (415 | ) |
Total | | | | | | | | | | | | | | | | | | | | | | | | $ | (707 | ) |
| | | | | | | | | | | | | | | | | | | | | | | | | | |
|
| Transactions in Options Written for the Period Ended March 31, 2017 |
| | | | | | | | | | | | | | | | |
| | | | | | Calls | |
| | | | | | Contracts | | | | | | Premiums Received | |
Outstanding options, beginning of period | | | | | | | — | | | | | | | | — | |
Options written | | | | | | | 85,304 | | | | | | | | $100,669 | |
Options expired | | | | | | | (37,100 | ) | | | | | | | (46,271 | ) |
| | | | |
Outstanding options, end of period | | | | | | | 48,204 | | | | | | | | $ 54,398 | |
| | | | |
As of period end, the value of portfolio securities subject to covered call options was $2,709,269.
See Notes to Financial Statements.
| | | | | | |
| 30 | | BLACKROCK FUNDS | | MARCH 31, 2017 | | |
| | | | |
| Schedule of Investments (continued) | | | BlackRock International Opportunities Portfolio | |
|
| Derivative Financial Instruments Categorized by Risk Exposure |
As of period end, the fair values of derivative financial instruments located in the Statements of Assets and Liabilities were as follows:
| | | | | | | | | | | | | | | | | | | | | | | | | | | | | | |
| Assets — Derivative Financial Instruments | | Commodity
Contracts | | | Credit
Contracts | | | Equity
Contracts | | | Foreign
Currency
Exchange
Contracts | | | Interest
Rate
Contracts | | | Other Contracts | | | Total | |
Forward foreign currency exchange contracts | | Unrealized appreciation on forward foreign currency exchange contracts | | | — | | | | — | | | | — | | | $ | 3,807,616 | | | | — | | | | — | | | $ | 3,807,616 | |
| | | | | | | | | | | | | | | | | | | | | | | | | | | | | | |
Liabilities — Derivative Financial Instruments | | | | | | | | | | | | | | | | | | | | | | | | | | | | |
Forward foreign currency exchange contracts | | Unrealized depreciation on forward foreign currency exchange contracts | | | — | | | | — | | | | — | | | $ | 1,559,212 | | | | — | | | | — | | | $ | 1,559,212 | |
Options written | | Options written at value | | | — | | | | — | | | | $707 | | | | — | | | | — | | | | — | | | | 707 | |
Total | | | | | — | | | | — | | | | $707 | | | $ | 1,559,212 | | | | — | | | | — | | | $ | 1,559,919 | |
| | | | | | |
| | | | | | | | | | | | | | | | | | | | | | | | | | | | | | |
For the six months ended March 31, 2017, the effect of derivative financial instruments in the Statements of Operations was as follows:
| | | | | | | | | | | | | | | | | | | | | | | | | | | | | | | | | | | |
| Net Realized Gain (Loss) from: | | Commodity
Contracts | | Credit
Contracts | | Equity
Contracts | | Foreign Currency
Exchange Contracts | | Interest Rate
Contracts | | Other
Contracts | | Total |
Forward foreign currency exchange contracts | | — | | — | | | | | | | | $ | (1,956,966 | ) | | — | | — | | | $ | (1,956,966 | ) |
Options written | | — | | — | | | $ | 46,271 | | | | | — | | | — | | — | | | | 46,271 | |
Total | | — | | — | | | $ | 46,271 | | | | $ | (1,956,966 | ) | | — | | — | | | $ | (1,910,695 | ) |
| | | | | | | | | | | | | | | | | | | | | | | | | | | | | | | | | | | |
| | | Commodity
Contracts | | Credit
Contracts | | Equity
Contracts | | Foreign Currency
Exchange Contracts | | Interest Rate
Contracts | | Other
Contracts | | Total |
Net Change in Unrealized Appreciation (Depreciation) on: | | | | | | | | | | | | | | | | | | | | | | | | | | |
Forward foreign currency exchange contracts | | — | | | | — | | | | | — | | | | | $2,714,339 | | | — | | — | | | | $2,714,339 | |
Options written | | — | | | | — | | | | $ | 53,691 | | | | | — | | | — | | — | | | | 53,691 | |
Total | | — | | | | — | | | | $ | 53,691 | | | | | $2,714,339 | | | — | | — | | | | $2,768,030 | |
|
| Average Quarterly Balances of Outstanding Derivative Financial Instruments |
| | | | |
Futures contracts: | | | | |
Average amounts purchased — in USD | | $ | 171,672,195 | |
Average amounts sold — in USD | | $ | 196,308,336 | |
Options: | | | | |
Average value of option contracts written | | $ | 354 | |
For more information about the Fund’s investment risks regarding derivative financial instruments, refer to the Notes to Financial Statements.
|
| Derivative Financial Instruments – Offsetting as of Period End |
The Fund’s derivative assets and liabilities (by type) were as follows:
| | | | | | | | |
| | | Assets | | | Liabilities | |
Derivative Financial Instruments: | | | | | | | | |
Forward foreign currency exchange contracts | | $ | 3,807,616 | | | $ | 1,559,212 | |
Options | | | — | | | | 707 | |
Total derivative assets and liabilities in the Statements of Assets and Liabilities | | $ | 3,807,616 | | | $ | 1,559,919 | |
Total derivative assets and liabilities subject to an MNA | | $ | 3,807,616 | | | $ | 1,559,919 | |
See Notes to Financial Statements.
| | | | | | |
| | | BLACKROCK FUNDS | | MARCH 31, 2017 | | 31 |
| | | | |
| Schedule of Investments (continued) | | | BlackRock International Opportunities Portfolio | |
The following tables present the Fund’s derivative assets and liabilities by counterparty net of amounts available for offset under an MNA and net of the related collateral received and pledged by the Fund:
| | | | | | | | | | | | | | | | | | | | | | | | | | | | | | |
| | | | | | | | | | | | | |
| Counterparty | | | | Derivative Assets
Subject to an MNA by
Counterparty | | Derivatives Available
for Offset1 | | Non-cash Collateral Received | | Cash Collateral Received | | Net Amount of
Derivative Assets2,4 |
Australia and New Zealand Banking Group Ltd. | | | | | | | | $ | 6,347 | | | | $ | (5,318 | ) | | | | — | | | | | — | | | | $ | 1,029 | |
Bank of America N.A. | | | | | | | | | 48,113 | | | | | (48,113 | ) | | | | — | | | | | — | | | | | — | |
Barclays Bank PLC | | | | | | | | | 1,681,846 | | | | | (280,039 | ) | | | | — | | | | | — | | | | | 1,401,807 | |
BNP Paribas S.A. | | | | | | | | | 58,452 | | | | | (11,737 | ) | | | | — | | | | | — | | | | | 46,715 | |
Citibank N.A. | | | | | | | | | 357,399 | | | | | (51,065 | ) | | | | — | | | | | — | | | | | 306,334 | |
Commonwealth Bank of Australia | | | | | | | | | 21,767 | | | | | (21,387 | ) | | | | — | | | | | — | | | | | 380 | |
Nomura International PLC | | | | | | | | | 20,530 | | | | | (20,530 | ) | | | | — | | | | | — | | | | | — | |
Northern Trust Corp. | | | | | | | | | 1,222,347 | | | | | (153,889 | ) | | | | — | | | | | — | | | | | 1,068,458 | |
Royal Bank of Scotland PLC | | | | | | | | | 23,795 | | | | | (23,795 | ) | | | | — | | | | | — | | | | | — | |
Standard Chartered Bank | | | | | | | | | 279,318 | | | | | (72,455 | ) | | | | — | | | | | — | | | | | 206,863 | |
UBS AG | | | | | | | | | 87,702 | | | | | (707 | ) | | | | — | | | | | — | | | | | 86,995 | |
| | | | | |
Total | | | | | | | | $ | 3,807,616 | | | | $ | (689,035 | ) | | | | — | | | | | — | | | | $ | 3,118,581 | |
| | | | | |
| | | | | | | | | | | | | | | | | | | | | | | | | | | | | | |
| Counterparty | | | | Derivative Liabilities
Subject to an MNA by
Counterparty | | Derivatives Available
for Offset1 | | Non-cash
Collateral
Pledged | | Cash
Collateral
Pledged | | Net Amount of
Derivative Liabilities3,4 |
Australia and New Zealand Banking Group Ltd. | | | | | | | | $ | 5,318 | | | | $ | (5,318 | ) | | | | — | | | | | — | | | | | — | |
Bank of America N.A. | | | | | | | | | 120,017 | | | | | (48,113 | ) | | | | — | | | | | — | | | | | $ 71,904 | |
Barclays Bank PLC | | | | | | | | | 280,039 | | | | | (280,039 | ) | | | | — | | | | | — | | | | | — | |
BNP Paribas S.A. | | | | | | | | | 11,737 | | | | | (11,737 | ) | | | | — | | | | | — | | | | | — | |
Citibank N.A. | | | | | | | | | 51,065 | | | | | (51,065 | ) | | | | — | | | | | — | | | | | — | |
Commonwealth Bank of Australia | | | | | | | | | 21,387 | | | | | (21,387 | ) | | | | — | | | | | — | | | | | — | |
Nomura International PLC | | | | | | | | | 79,033 | | | | | (20,530 | ) | | | | — | | | | | — | | | | | 58,503 | |
Northern Trust Corp. | | | | | | | | | 153,889 | | | | | (153,889 | ) | | | | — | | | | | — | | | | | — | |
Royal Bank of Canada | | | | | | | | | 23,263 | | | | | — | | | | | — | | | | | — | | | | | 23,263 | |
Royal Bank of Scotland PLC | | | | | | | | | 732,166 | | | | | (23,795 | ) | | | | — | | | | | — | | | | | 708,371 | |
Standard Chartered Bank | | | | | | | | | 72,455 | | | | | (72,455 | ) | | | | — | | | | | — | | | | | — | |
UBS AG | | | | | | | | | 707 | | | | | (707 | ) | | | | — | | | | | — | | | | | — | |
Westpac Banking Corp. | | | | | | | | | 8,843 | | | | | — | | | | | — | | | | | — | | | | | 8,843 | |
| | | | | |
Total | | | | | | | | $ | 1,559,919 | | | | $ | (689,035 | ) | | | | — | | | | | — | | | | | $870,884 | |
| | | | | |
| | 1 | | The amount of derivatives available for offset is limited to the amount of derivative assets and/or liabilities that are subject to an MNA. |
| | 2 | | Net amount represents the net amount receivable from the counterparty in the event of default. |
| | 3 | | Net amount represents the net amount payable due to the counterparty in the event of default. Net amount may be offset further by the options written receivable/payable on the Statements of Assets and Liabilities. |
| | 4 | | Net amount may also include forward foreign currency exchange contracts that are not required to be collateralized. |
|
| Fair Value Hierarchy as of Period End |
Various inputs are used in determining the fair value of investments and derivative financial instruments. For information about the Fund’s policy regarding valuation of investments and derivative financial instruments, refer to the Notes to Financial Statements.
The following tables summarize the Fund’s investments and derivative financial instruments categorized in the disclosure hierarchy:
| | | | | | | | | | | | | | | | |
| | | Level 1 | | | Level 2 | | | Level 3 | | | Total | |
Assets: | | | | | | | | | | | | | | | | |
Investments: | | | | | | | | | | | | | | | | |
Long-Term Investments: | | | | | | | | | | | | | | | | |
Common Stocks: | | | | | | | | | | | | | | | | |
Australia | | | — | | | $ | 7,219,816 | | | | — | | | $ | 7,219,816 | |
Belgium | | | — | | | | 6,862,610 | | | | — | | | | 6,862,610 | |
Brazil | | $ | 3,289,772 | | | | — | | | | — | | | | 3,289,772 | |
Canada | | | 22,214,578 | | | | — | | | | — | | | | 22,214,578 | |
China | | | 10,810,820 | | | | 50,141,915 | | | | — | | | | 60,952,735 | |
France | | | — | | | | 48,680,906 | | | | — | | | | 48,680,906 | |
Germany | | | — | | | | 31,260,238 | | | | — | | | | 31,260,238 | |
Hong Kong | | | 8,033,382 | | | | 5,578,444 | | | | — | | | | 13,611,826 | |
India | | | — | | | | 18,969,655 | | | $ | 7,591,978 | | | | 26,561,633 | |
Indonesia | | | — | | | | 7,044,461 | | | | — | | | | 7,044,461 | |
See Notes to Financial Statements.
| | | | | | |
| 32 | | BLACKROCK FUNDS | | MARCH 31, 2017 | | |
| | | | |
| Schedule of Investments (continued) | | | BlackRock International Opportunities Portfolio | |
| | | | | | | | | | | | | | | | |
| | | Level 1 | | | Level 2 | | | Level 3 | | | Total | |
Ireland | | $ | 22,720,767 | | | | — | | | | — | | | $ | 22,720,767 | |
Italy | | | — | | | $ | 36,860,589 | | | | — | | | | 36,860,589 | |
Japan | | | — | | | | 50,728,134 | | | | — | | | | 50,728,134 | |
Mexico | | | 8,161,544 | | | | — | | | | — | | | | 8,161,544 | |
Netherlands | | | — | | | | 45,893,874 | | | | — | | | | 45,893,874 | |
New Zealand | | | — | | | | 5,738,689 | | | | — | | | | 5,738,689 | |
Nigeria | | | — | | | | 3,388,265 | | | | — | | | | 3,388,265 | |
Norway | | | — | | | | 9,018,834 | | | | — | | | | 9,018,834 | |
Peru | | | 7,511,800 | | | | — | | | | — | | | | 7,511,800 | |
Philippines | | | 1,767,343 | | | | — | | | | — | | | | 1,767,343 | |
Portugal | | | — | | | | 10,119,705 | | | | — | | | | 10,119,705 | |
Singapore | | | — | | | | 7,197,459 | | | | — | | | | 7,197,459 | |
South Africa | | | — | | | | 9,821,285 | | | | — | | | | 9,821,285 | |
South Korea | | | — | | | | 20,534,431 | | | | — | | | | 20,534,431 | |
Spain | | | — | | | | 3,870,666 | | | | — | | | | 3,870,666 | |
Sweden | | | — | | | | 7,736,535 | | | | — | | | | 7,736,535 | |
Switzerland | | | — | | | | 38,516,855 | | | | — | | | | 38,516,855 | |
Taiwan | | | — | | | | 16,754,736 | | | | — | | | | 16,754,736 | |
Thailand | | | 4,867,433 | | | | — | | | | — | | | | 4,867,433 | |
United Kingdom | | | 22,997,133 | | | | 61,232,435 | | | | — | | | | 84,229,568 | |
United States | | | 14,122,572 | | | | 9,034,753 | | | | — | | | | 23,157,325 | |
Exchange-Traded Funds | | | 21,665,866 | | | | — | | | | — | | | | 21,665,866 | |
Preferred Stocks: | | | | | | | | | | | | | | | | |
China | | | — | | | | — | | | $ | 3,861,230 | | | | 3,861,230 | |
India | | | — | | | | — | | | | 8,944,237 | | | | 8,944,237 | |
Short-Term Securities | | | 8,552,082 | | | | — | | | | — | | | | 8,552,082 | |
| | | | |
Total | | $ | 156,715,092 | | | $ | 512,205,290 | | | $ | 20,397,445 | | | $ | 689,317,827 | |
| | | | |
| | | | | | | | | | | | | | | | |
Derivative Financial Instruments1 | | | | | | | | | | | | | | | | |
Assets: | | | | | | | | | | | | | | | | |
Foreign currency exchange contracts | | | — | | | $ | 3,807,616 | | | | — | | | $ | 3,807,616 | |
Liabilities: | | | | | | | | | | | | | | | | |
Equity contracts | | | — | | | | (707 | ) | | | — | | | | (707 | ) |
Foreign currency exchange contracts | | | — | | | | (1,559,212 | ) | | | — | | | | (1,559,212 | ) |
Total | | | — | | | $ | 2,247,697 | | | | — | | | $ | 2,247,697 | |
| | | | |
| 1 | Derivative financial instruments are forward foreign currency exchange contracts and options written. Forward foreign currency exchange contracts are valued at the unrealized appreciation (depreciation) on the instrument and options written are shown at value. |
Transfers between Level 1 and Level 2 were as follows:
| | | | | | | | | | | | | | | | |
| | | Transfers Into Level 11 | | | Transfers Out of Level 12 | | | Transfers Into Level 22 | | | Transfers Out of Level 21 | |
Assets: | | | | | | | | | | | | | | | | |
Long-Term Investments: | | | | | | | | | | | | | | | | |
Nigeria | | | — | | | $ | (3,274,313 | ) | | $ | 3,274,313 | | | | — | |
United Kingdom | | $ | 9,185,548 | | | | — | | | | — | | | $ | (9,185,548 | ) |
| | | | |
Total | | $ | 9,185,548 | | | $ | (3,274,313 | ) | | $ | 3,274,313 | | | $ | (9,185,548 | ) |
| | | | |
| 1 | Systematic Fair Value Prices were not utilized at period end for these investments. |
| 2 | External pricing service used to reflect any significant market movements between the time the Fund valued such foreign securities and the earlier closing of foreign markets. |
See Notes to Financial Statements.
| | | | | | |
| | | BLACKROCK FUNDS | | MARCH 31, 2017 | | 33 |
| | | | |
| Schedule of Investments (concluded) | | | BlackRock International Opportunities Portfolio | |
A reconciliation of Level 3 investments is presented when the Fund had a significant amount of Level 3 investments at the beginning and/or end of the period in relation to net assets. The following table is a reconciliation of Level 3 investments for which significant unobservable inputs were used in determining fair value:
| | | | | | | | | | | | |
| | | Common Stocks | | | Preferred Stocks | | | Total | |
Assets: | | | | | | | | | | | | |
Opening Balance, as of September 30, 2016 | | | — | | | | $ 29,608,987 | | | | $ 29,608,987 | |
Transfers into Level 31 | | | $ 9,617,945 | | | | — | | | | 9,617,945 | |
Transfers out of Level 3 | | | | | | | — | | | | — | |
Accrued discounts/premiums | | | — | | | | — | | | | — | |
Net realized gain (loss) | | | 828,593 | | | | — | | | | 828,593 | |
Net change in unrealized appreciation (depreciation)2,3 | | | 1,820,469 | | | | (16,803,520 | ) | | | (14,983,051 | ) |
Purchases | | | — | | | | — | | | | — | |
Sales | | | (4,675,029 | ) | | | — | | | | (4,675,029 | ) |
| | | | |
Closing Balance, as of March 31, 2017 | | | $ 7,591,978 | | | | $ 12,805,467 | | | | $ 20,397,445 | |
| | | | |
Net change in unrealized appreciation (depreciation) on investments still held at March 31, 2017 2 | | | $ 1,820,469 | | | | $(16,803,520 | ) | | | $(14,983,051 | ) |
| | | | |
| | 1 | | As of September 30, 2016, the Fund used observable inputs in determining the value of certain investments. As of March 31, 2017, the Fund used significant unobservable inputs in determining the value of the same investments. As a result, investments at beginning of period value were transferred from Level 2 to Level 3 in the disclosure hierarchy. |
| | 2 | | Included in the related net change in unrealized appreciation (depreciation) in the Statements of Operations. |
| | 3 | | Any difference between net change in unrealized appreciation (depreciation) and net change in unrealized appreciation (depreciation) on investments still held at March 31, 2017, is generally due to investments no longer held or categorized as Level 3 at period end. |
The following table summarizes the valuation approaches used and unobservable inputs utilized by the BlackRock Global Valuation Methodologies Committee to determine the value of certain of the Fund’s Level 3 investments as of period end. The table does not include Level 3 investments with values based upon unadjusted third party pricing information in the amount of $7,591,978.
| | | | | | | | | | | | | | | | | | |
| | | Value | | | Valuation Approach | | Unobservable Inputs | | | Range of Unobservable Inputs Utilized | | | Weighted Average of
Unobservable Inputs | |
Assets: | | | | | | | | | | | | | | | | | | |
Preferred Stocks3 | | $ | 12,805,467 | | | Market | | | Revenue Growth Rate1 | | | | 348.00% | | | | — | |
| | | | | | | | | Revenue Multiple1 | | | | 4.50x - 32.50x | | | | 24.06x | |
| | | | | | | | | Time to Exit2 | | | | 2-3 years | | | | — | |
| | | | | | | | | | Volatility1 | | | | 38.00% | | | | — | |
Total | | $ | 12,805,467 | | | | | | | | | | | | | | | |
| | | | |
| | 1 | | Increase in unobservable input may result in a significant increase to value, while a decrease in the unobservable input may result in a significant decrease to value. |
| | 2 | | Decrease in unobservable input may result in a significant increase to value, while an increase in the unobservable input may result in a significant decrease to value. |
| | 3 | | For the period ended March 31, 2017, the valuation technique for investments classified as preferred stocks amounting to $8,944,237 changed to an Option Pricing Model. The investments were previously valued utilizing Probability-Weighted Expected Return Model. The change was due to consideration of liquidation preferences and exit strategy. |
See Notes to Financial Statements.
| | | | | | |
| 34 | | BLACKROCK FUNDS | | MARCH 31, 2017 | | |
| | | | |
| Schedule of Investments March 31, 2017 (Unaudited) | | | BlackRock Science & Technology Opportunities Portfolio | |
| | | (Percentages shown are based on Net Assets) | |
| | | | | | | | |
| Common Stocks | | Shares | | | Value | |
Communications Equipment — 1.7% | | | | | | | | |
Advanced Ceramic X Corp. | | | 72,000 | | | $ | 707,364 | |
Finisar Corp. (a) | | | 65,700 | | | | 1,796,238 | |
Quantenna Communications, Inc. (a) | | | 80,717 | | | | 1,681,335 | |
Viavi Solutions, Inc. (a) | | | 192,700 | | | | 2,065,744 | |
| | | | | | | | |
| | | | | | | | 6,250,681 | |
Electronic Equipment, Instruments & Components — 2.8% | |
Coherent, Inc. (a) | | | 14,500 | | | | 2,981,780 | |
Flex Ltd. (a) | | | 132,700 | | | | 2,229,360 | |
Largan Precision Co. Ltd. | | | 17,000 | | | | 2,677,499 | |
Samsung SDI Co. Ltd. | | | 19,200 | | | | 2,370,304 | |
| | | | | | | | |
| | | | | | | | 10,258,943 | |
Household Durables — 0.8% | | | | | | | | |
Sony Corp. | | | 88,500 | | | | 2,986,737 | |
Internet & Direct Marketing Retail — 7.4% | | | | | | | | |
Amazon.com, Inc. (a) | | | 18,000 | | | | 15,957,720 | |
Ensogo Ltd. (a) | | | 94,425 | | | | — | |
Expedia, Inc. | | | 16,200 | | | | 2,043,955 | |
JD.com, Inc. — ADR (a) | | | 66,700 | | | | 2,075,037 | |
Netflix, Inc. (a) | | | 27,790 | | | | 4,107,640 | |
Priceline Group, Inc. (a) | | | 1,600 | | | | 2,847,952 | |
| | | | | | | | |
| | | | | | | | 27,032,304 | |
Internet Software & Services — 21.7% | | | | | | | | |
58.com, Inc. — ADR (a) | | | 39,300 | | | | 1,390,827 | |
Alibaba Group Holding Ltd. — ADR (a) | | | 94,600 | | | | 10,200,718 | |
Alphabet, Inc., Class A (a) | | | 26,183 | | | | 22,197,947 | |
Alteryx, Inc. (a) | | | 38,371 | | | | 599,739 | |
Baidu, Inc. — ADR (a) | | | 7,300 | | | | 1,259,396 | |
Coupa Software, Inc. (a)(b) | | | 38,053 | | | | 966,546 | |
Facebook, Inc., Class A (a) | | | 85,300 | | | | 12,116,865 | |
Five9, Inc. (a) | | | 106,900 | | | | 1,759,574 | |
LogMeIn, Inc. | | | 19,300 | | | | 1,881,750 | |
MercadoLibre, Inc. | | | 14,600 | | | | 3,087,462 | |
Momo, Inc. — ADR (a) | | | 51,200 | | | | 1,744,384 | |
Shopify, Inc., Class A (a) | | | 43,400 | | | | 2,955,106 | |
Takeaway.com Holding BV (a) | | | 39,500 | | | | 1,326,949 | |
Tencent Holdings Ltd. | | | 441,000 | | | | 12,704,999 | |
Twilio, Inc., Class A (a)(b) | | | 49,100 | | | | 1,417,517 | |
Wix.com Ltd. (a) | | | 27,500 | | | | 1,867,250 | |
Yandex NV (a) | | | 88,000 | | | | 1,929,840 | |
| | | | | | | | |
| | | | | | | | 79,406,869 | |
IT Services — 8.0% | | | | | | | | |
Computer Sciences Corp. | | | 39,000 | | | | 2,691,390 | |
Fidelity National Information Services, Inc. | | | 27,638 | | | | 2,200,537 | |
InterXion Holding NV (a) | | | 63,100 | | | | 2,496,236 | |
Mastercard, Inc., Class A | | | 62,800 | | | | 7,063,116 | |
PayPal Holdings, Inc. (a) | | | 67,000 | | | | 2,882,340 | |
Square, Inc., Class A (a) | | | 212,200 | | | | 3,666,816 | |
Visa, Inc., Class A | | | 92,100 | | | | 8,184,927 | |
| | | | | | | | |
| | | | | | | | 29,185,362 | |
Media — 1.1% | | | | | | | | |
Naspers Ltd., N Shares | | | 24,338 | | | | 4,193,737 | |
Semiconductors & Semiconductor Equipment — 21.0% | | | | | |
Advanced Micro Devices, Inc. (a) | | | 244,400 | | | | 3,556,020 | |
Advanced Semiconductor Engineering, Inc. | | | 1,602,643 | | | | 2,053,033 | |
ams AG | | | 30,600 | | | | 1,653,022 | |
Analog Devices, Inc. | | | 20,200 | | | | 1,655,390 | |
Applied Materials, Inc. | | | 120,200 | | | | 4,675,780 | |
ASML Holding NV | | | 50,700 | | | | 6,727,551 | |
| | | | | | | | |
| Common Stocks | | Shares | | | Value | |
Semiconductors & Semiconductor Equipment (continued) | | | | | |
Broadcom Ltd. | | | 27,921 | | | $ | 6,113,582 | |
Cirrus Logic, Inc. (a) | | | 25,600 | | | | 1,553,664 | |
Dialog Semiconductor PLC (a) | | | 47,000 | | | | 2,397,322 | |
Lam Research Corp. | | | 36,100 | | | | 4,633,796 | |
Maxim Integrated Products, Inc. | | | 36,500 | | | | 1,641,040 | |
Megachips Corp. (a) | | | 82,400 | | | | 2,258,968 | |
Mellanox Technologies Ltd. (a) | | | 37,000 | | | | 1,885,150 | |
Micron Technology, Inc. (a) | | | 100,300 | | | | 2,898,670 | |
Monolithic Power Systems, Inc. | | | 15,100 | | | | 1,390,710 | |
NVIDIA Corp. | | | 38,100 | | | | 4,150,233 | |
NXP Semiconductors NV (a) | | | 40,065 | | | | 4,146,727 | |
ON Semiconductor Corp. (a) | | | 173,400 | | | | 2,685,966 | |
Silicon Laboratories, Inc. (a) | | | 23,200 | | | | 1,706,360 | |
Skyworks Solutions, Inc. | | | 28,200 | | | | 2,763,036 | |
SOITEC (a) | | | 72,510 | | | | 3,069,570 | |
STMicroelectronics NV | | | 238,200 | | | | 3,665,341 | |
Taiwan Semiconductor Manufacturing Co. Ltd. | | | 772,000 | | | | 4,840,929 | |
Tower Semiconductor, Ltd. (a) | | | 90,700 | | | | 2,090,635 | |
Ulvac, Inc. | | | 57,200 | | | | 2,673,560 | |
| | | | | | | | |
| | | | | | | | 76,886,055 | |
Software — 22.1% | | | | | | | | |
Activision Blizzard, Inc. | | | 101,900 | | | | 5,080,734 | |
Adobe Systems, Inc. (a) | | | 39,700 | | | | 5,166,161 | |
Altium Ltd. | | | 161,700 | | | | 938,672 | |
Autodesk, Inc. (a) | | | 45,800 | | | | 3,960,326 | |
Blackline, Inc. (a) | | | 37,470 | | | | 1,115,107 | |
Electronic Arts, Inc. (a) | | | 43,300 | | | | 3,876,216 | |
ESI Group (a) | | | 22,500 | | | | 1,209,515 | |
Gridsum Holding, Inc. — ADR (a) | | | 127,351 | | | | 1,692,495 | |
Guidewire Software, Inc. (a) | | | 29,000 | | | | 1,633,570 | |
HubSpot, Inc. (a) | | | 36,500 | | | | 2,210,075 | |
Intuit, Inc. | | | 15,400 | | | | 1,786,246 | |
Linx SA | | | 277,100 | | | | 1,469,322 | |
Microsoft Corp. | | | 296,100 | | | | 19,501,146 | |
Nintendo Co. Ltd. | | | 22,700 | | | | 5,267,283 | |
Oracle Corp. | | | 61,600 | | | | 2,747,976 | |
Proofpoint, Inc. (a) | | | 32,410 | | | | 2,410,008 | |
PTC, Inc. (a) | | | 40,900 | | | | 2,149,295 | |
salesforce.com, Inc. (a) | | | 88,200 | | | | 7,275,618 | |
Snap, Inc., Class A (a) | | | 117,261 | | | | 2,641,890 | |
Symantec Corp. | | | 63,900 | | | | 1,960,452 | |
Take-Two Interactive Software, Inc. (a) | | | 56,300 | | | | 3,336,901 | |
Xero Ltd. (a) | | | 116,960 | | | | 1,622,032 | |
Zendesk, Inc. (a) | | | 65,800 | | | | 1,845,032 | |
| | | | | | | | |
| | | | | | | | 80,896,072 | |
Technology Hardware, Storage & Peripherals — 8.4% | | | | | |
Apple Inc. | | | 158,159 | | | | 22,721,122 | |
Catcher Technology Co. Ltd. | | | 360,000 | | | | 3,557,910 | |
Samsung Electronics Co. Ltd. | | | 2,400 | | | | 4,416,997 | |
| | | | | | | | |
| | | | | | | | 30,696,029 | |
Total Common Stocks — 95.0% | | | | | | | 347,792,789 | |
| | | | | | | | |
| | | | | | | |
See Notes to Financial Statements.
| | | | | | |
| | | BLACKROCK FUNDS | | MARCH 31, 2017 | | 35 |
| | | | |
| Schedule of Investments (continued) | | | BlackRock Science & Technology Opportunities Portfolio | |
| | | | |
| | | | | | | | |
| Preferred Stocks | | Shares | | | Value | |
Internet & Direct Marketing Retail — 0.5% | | | | | | | | |
Jasper Infotech Private Ltd., Series F (Acquired 5/07/14, cost $1,018,150) (a)(c) | | | 143 | | | $ | 1,264,267 | |
Jasper Infotech Private Ltd., Series G (Acquired 10/29/14, cost $396,249) (a)(c) | | | 47 | | | | 440,115 | |
| | | | | | | | |
| | | | | | | | 1,704,382 | |
Internet Software & Services — 2.5% | | | | | | | | |
Uber Technologies, Inc., Series D (Acquired 6/06/14, cost $2,000,004) (a)(c) | | | 128,924 | | | | 6,722,097 | |
Xiaoju Kuaizhi Inc., Series A-17 (Acquired 7/28/15, cost $1,080,592) (a)(c) | | | 39,400 | | | | 1,506,262 | |
Zuora, Inc. (Acquired 1/16/15, cost $1,006,815) (a)(c) | | | 265,000 | | | | 940,750 | |
| | | | | | | | |
| | | | | | | | 9,169,109 | |
Software — 1.1% | | | | | | | | |
Illumio, Inc., Series C (Acquired 3/11/15,
cost $499,995) (a)(c) | | | 155,575 | | | | 499,396 | |
MongoDB, Series C (Acquired 12/19/13,
cost $1,512,773) (a)(c) | | | 60,303 | | | | 1,369,481 | |
MongoDB, Series D (Acquired 12/19/13,
cost $470,592) (a)(c) | | | 18,759 | | | | 426,017 | |
MongoDB, Series E (Acquired 12/19/13,
cost $16,632) (a)(c) | | | 663 | | | | 15,057 | |
Palantir Technologies, Inc., Series I (Acquired 2/07/14, cost $1,500,011) (a)(c) | | | 244,700 | | | | 1,942,918 | |
| | | | | | | | |
| | | | | | | | 4,252,869 | |
Total Preferred Stocks — 4.1% | | | | | | | 15,126,360 | |
Total Long-Term Investments (Cost — $228,069,603) — 99.1% | | | | | | | 362,919,149 | |
| | | | | | | | |
| Short-Term Securities | | Shares | | | Value | |
BlackRock Liquidity Funds, T-Fund, Institutional Class, 0.60% (d)(e) | | | 1,353,865 | | | $ | 1,353,865 | |
SL Liquidity Series, LLC, Money Market
Series, 1.11% (d)(e)(f) | | | 1,231,370 | | | | 1,231,493 | |
Total Short-Term Securities (Cost — $2,585,340) — 0.7% | | | | 2,585,358 | |
| | | | | | | | |
Total Investments Before Options Written (Cost — $230,654,943) — 99.8% | | | | | 365,504,507 | |
| | | | | | | | |
| Options Written | | | | | | |
(Premiums Received — $404,356) — (0.2)% | | | | | | | (546,625 | ) |
Total Investments Net of Options Written — 99.6% | | | | 364,957,882 | |
Other Assets Less Liabilities — 0.4% | | | | | | | 1,336,775 | |
| | | | | | | | |
Net Assets — 100.0% | | | | | | $ | 366,294,657 | |
| | | | | | | | |
|
| Notes to Schedule of Investments |
| (a) | Non-income producing security. |
| (b) | Security, or a portion of the security, is on loan. |
| (c) | Restricted security as to resale, excluding 144A securities. The Fund held restricted securities with a current value of $15,126,360, representing 4.13% of its net assets as of period end, and an original cost $9,501,812. |
| (d) | During the six months ended March 31, 2017, investments in issuers considered to be affiliates of the Fund for purposes of Section 2(a)(3) of the Investment Company Act of 1940, as amended, were as follows: |
| | | | | | | | | | | | | | | | | | | | | | | | | | | | |
| Affiliate | | Shares Held at
September 30,
2016 | | | Net Activity | | | Shares Held at
March 31,
2017 | | | Value at
March 31,
2017 | | | Income | | | Net Realized
Gain1 | | | Change in
Unrealized
Appreciation
(Depreciation) | |
BlackRock Liquidity Funds, T-Fund, Institutional Class | | | 1,579,591 | | | | (225,726 | ) | | | 1,353,865 | | | | $1,353,865 | | | | $ 5,576 | | | | $ 9 | | | | — | |
SL Liquidity Series, LLC, Money Market Series | | | 2,454,786 | | | | (1,223,416 | ) | | | 1,231,370 | | | | 1,231,493 | | | | 52,958 | 2 | | | 270 | | | | $18 | |
Total | | | | | | | | | | | | | | | $2,585,358 | | | | $58,534 | | | | $279 | | | | $18 | |
| | | | | | | | | | | | | | | | |
| | 1 | | Includes net capital gain distributions. |
| | 2 | | Represents securities lending income earned from the reinvestment of cash collateral from loaned securities, net of fees and collateral investment expenses, and other payments to and from borrowers of securities. |
| (e) | Current yield as of period end. |
| (f) | Security was purchased with the cash collateral from loaned securities. |
| • | | For Fund compliance purposes, the Fund’s industry classifications refer to one or more of the industry sub-classifications used by one or more widely recognized market indexes or ratings group indexes, and/or as defined by the investment adviser. These definitions may not apply for purposes of this report, which may combine such industry sub-classifications for reporting ease. |
See Notes to Financial Statements.
| | | | | | |
| 36 | | BLACKROCK FUNDS | | MARCH 31, 2017 | | |
| | | | |
| Schedule of Investments (continued) | | | BlackRock Science & Technology Opportunities Portfolio | |
|
| Derivative Financial Instruments Outstanding as of Period End |
|
| Forward Foreign Currency Exchange Contracts |
| | | | | | | | | | | | | | | | | | | | | | |
Currency Purchased | | | Currency
Sold | | | Counterparty | | Settlement
Date | | | Unrealized
Appreciation
(Depreciation) | |
| GBP | | | 1,053,000 | | | | USD | | | | 1,298,612 | | | Bank of New York Mellon | | | 4/12/17 | | | $ | 21,059 | |
| SEK | | | 16,625,500 | | | | USD | | | | 1,855,464 | | | Barclays Bank PLC | | | 4/12/17 | | | | 961 | |
| SEK | | | 12,957,894 | | | | USD | | | | 1,434,411 | | | Citibank N.A. | | | 4/12/17 | | | | 12,484 | |
| USD | | | 189,506 | | | | GBP | | | | 151,000 | | | Barclays Bank PLC | | | 4/12/17 | | | | 266 | |
| USD | | | 1,725,732 | | | | GBP | | | | 1,361,000 | | | Goldman Sachs International | | | 4/12/17 | | | | 20,060 | |
| USD | | | 71,271 | | | | GBP | | | | 57,000 | | | Goldman Sachs International PLC | | | 4/12/17 | | | | (165 | ) |
| USD | | | 11,191,065 | | | | HKD | | | | 86,732,400 | | | Morgan Stanley & Co. International PLC | | | 4/12/17 | | | | 27,502 | |
| USD | | | 1,643,012 | | | | NZD | | | | 2,346,000 | | | Morgan Stanley & Co. International PLC | | | 4/12/17 | | | | (1,040 | ) |
| USD | | | 1,297,273 | | | | SEK | | | | 11,600,385 | | | Morgan Stanley & Co. International PLC | | | 4/12/17 | | | | 1,958 | |
| USD | | | 3,566,120 | | | | ZAR | | | | 49,286,100 | | | Northern Trust Corp. | | | 4/12/17 | | | | (99,874 | ) |
| Total | | | | | | | | | | | | | | | | | | | | $ | (16,789 | ) |
| | | | | | | | | | | | | | | | | | | | | | |
|
| |
| Exchange-Traded Options Written |
| | | | | | | | | | | | | | | | | | |
| Description | | Put/ Call | | Expiration
Date | | | Strike Price | | Contracts | | | Value | |
Electronic Arts, Inc. | | Call | | | 04/07/17 | | | USD | | 86.50 | | | 49 | | | $ | (15,631 | ) |
Momo, Inc. | | Call | | | 04/07/17 | | | USD | | 33.50 | | | 90 | | | | (12,150 | ) |
Applied Materials, Inc. | | Call | | | 04/13/17 | | | USD | | 37.50 | | | 234 | | | | (37,206 | ) |
PayPal Holdings, Inc. | | Call | | | 04/13/17 | | | USD | | 43.00 | | | 8 | | | | (432 | ) |
Skyworks Solutions, Inc. | | Call | | | 04/13/17 | | | USD | | 101.00 | | | 98 | | | | (6,370 | ) |
Coherent, Inc. | | Call | | | 04/20/17 | | | USD | | 194.00 | | | 50 | | | | (65,471 | ) |
Applied Materials, Inc. | | Call | | | 04/21/17 | | | USD | | 35.00 | | | 84 | | | | (33,600 | ) |
Intuit, Inc. | | Call | | | 04/21/17 | | | USD | | 125.00 | | | 53 | | | | (530 | ) |
Momo, Inc. | | Call | | | 04/21/17 | | | USD | | 35.00 | | | 90 | | | | (12,150 | ) |
PayPal Holdings, Inc. | | Call | | | 04/21/17 | | | USD | | 43.00 | | | 7 | | | | (532 | ) |
Proofpoint, Inc. | | Call | | | 04/21/17 | | | USD | | 85.00 | | | 49 | | | | (2,940 | ) |
Snap, Inc., Class A | | Call | | | 04/21/17 | | | USD | | 22.00 | | | 51 | | | | (7,267 | ) |
Yandex N.V. | | Call | | | 04/21/17 | | | USD | | 24.00 | | | 173 | | | | (3,893 | ) |
Mercadolibre, Inc. | | Call | | | 04/24/17 | | | USD | | 199.00 | | | 27 | | | | (38,697 | ) |
Mercadolibre, Inc. | | Call | | | 04/24/17 | | | USD | | 215.25 | | | 24 | | | | (9,092 | ) |
Amazon.com, Inc. | | Call | | | 04/28/17 | | | USD | | 855.00 | | | 35 | | | | (156,100 | ) |
Electronic Arts, Inc. | | Call | | | 04/28/17 | | | USD | | 89.50 | | | 37 | | | | (7,474 | ) |
PayPal Holdings, Inc. | | Call | | | 04/28/17 | | | USD | | 42.50 | | | 200 | | | | (27,300 | ) |
Snap, Inc., Class A | | Call | | | 04/28/17 | | | USD | | 23.50 | | | 205 | | | | (22,550 | ) |
PayPal Holdings, Inc. | | Call | | | 05/05/17 | | | USD | | 43.50 | | | 19 | | | | (1,966 | ) |
Snap, Inc., Class A | | Call | | | 05/05/17 | | | USD | | 27.00 | | | 77 | | | | (4,042 | ) |
Baidu, Inc. | | Call | | | 05/19/17 | | | USD | | 180.00 | | | 26 | | | | (8,450 | ) |
Monolithic Power Systems, Inc. | | Call | | | 05/19/17 | | | USD | | 95.00 | | | 52 | | | | (11,960 | ) |
Proofpoint, Inc. | | Call | | | 05/19/17 | | | USD | | 85.00 | | | 64 | | | | (5,600 | ) |
Snap, Inc. | | Call | | | 05/19/17 | | | USD | | 25.00 | | | 77 | | | | (10,010 | ) |
Yandex N.V. | | Call | | | 05/19/17 | | | USD | | 25.00 | | | 174 | | | | (5,220 | ) |
Total | | | | | | | | | | | | | | | | $ | (506,633 | ) |
| | | | | | | | | | | | | | | | | | |
See Notes to Financial Statements.
| | | | | | |
| | | BLACKROCK FUNDS | | MARCH 31, 2017 | | 37 |
| | | | |
| Schedule of Investments (continued) | | | BlackRock Science & Technology Opportunities Portfolio | |
| | | | | | | | | | | | | | | | | | | | | | |
| OTC Options Written | | | | | | | | | | | | | | | | | | |
| Description | | Put/
Call | | | Counterparty | | Expiration
Date | | | Strike Price | | | Contracts | | Value |
Xero Ltd. | | | Call | | | UBS AG | | | 4/12/17 | | | | NZD | | | | 19.19 | | | 3,000 | | $(1,379) |
Altium Ltd. | | | Call | | | UBS AG | | | 4/18/17 | | | | AUD | | | | 7.52 | | | 30,500 | | (5,508) |
Altium Ltd. | | | Call | | | Citibank N.A. | | | 4/19/17 | | | | AUD | | | | 7.65 | | | 26,000 | | (3,393) |
BlackLine, Inc. | | | Call | | | Barclays Bank PLC | | | 4/28/17 | | | | USD | | | | 28.19 | | | 13,100 | | (25,586) |
Xero Ltd. | | | Call | | | UBS AG | | | 5/09/17 | | | | NZD | | | | 18.73 | | | 5,000 | | (4,126) |
Total | | | | | | | | | | | | | | | | | | | | | | $(39,992) |
| | | | | | | | | | | | | | | | | | | | | | |
|
| Transactions in Options Written for the Period Ended March 31, 2017 |
| | | | | | | | | | | | | | | | | | | | |
| | | Calls | | | | | | Puts | |
| | | | |
| | | Contracts | | | Premiums
Received | | | | | | Contracts | | | Premiums
Received | |
| | | | | | | | | | | | |
Outstanding options, beginning of period | | | 147,249 | | | $ | 123,673 | | | | | | | | 644 | | | $ | 45,729 | |
Options written | | | 332,230 | | | | 1,860,022 | | | | | | | | 3,642 | | | | 69,825 | |
Options exercised | | | (25 | ) | | | (4,694) | | | | | | | | (146 | ) | | | (18,101 | ) |
Options expired | | | (143,307 | ) | | | (158,228) | | | | | | | | (3,945 | ) | | | (70,591 | ) |
Options closed | | | (256,494 | ) | | | (1,416,417) | | | | | | | | (195 | ) | | | (26,862 | ) |
| | | | | | | | | | | | |
Outstanding options, end of period | | | 79,653 | | | $ | 404,356 | | | | | | | | — | | | | — | |
| | | | | | | | | | | | |
As of period end, the value of portfolio securities subject to covered call options was $14,692,585.
|
| Derivative Financial Instruments Categorized by Risk Exposure |
As of period end, the fair values of derivative financial instruments located in the Statements of Assets and Liabilities were as follows:
| | | | | | | | | | | | | | | | | | | | | | |
| Assets — Derivative Financial Instruments | | Commodity
Contracts | | Credit
Contracts | | Equity
Contracts | | | Foreign
Currency
Exchange
Contracts | | | Interest
Rate
Contracts | | Other
Contracts | | Total | |
Forward foreign currency exchange contracts | | Unrealized appreciation on forward foreign currency exchange contracts | | — | | — | | | — | | | $ | 84,290 | | | — | | — | | $ | 84,290 | |
| | | | | | | | | | | | | | | | | | | | | | |
| Liabilities — Derivative Financial Instruments | | | | | | | | | | | | | | | |
Forward foreign currency exchange contracts | | Unrealized depreciation on forward foreign currency exchange contracts | | — | | — | | | — | | | $ | 101,079 | | | — | | — | | $ | 101,079 | |
Options written | | Options written at value | | — | | — | | $ | 546,625 | | | | — | | | — | | — | | | 546,625 | |
| | | | | |
Total | | | | — | | — | | $ | 546,625 | | | $ | 101,079 | | | — | | — | | $ | 647,704 | |
| | | | | |
For the six months ended March 31, 2017, the effect of derivative financial instruments in the Statements of Operations was as follows:
| | | | | | | | | | | | | | | | | | | | | | | | | | | | |
| Net Realized Gain (Loss) from: | | Commodity
Contracts | | | Credit
Contracts | | | Equity
Contracts | | | Foreign Currency
Exchange Contracts | | | Interest Rate
Contracts | | | Other
Contracts | | | Total | |
Forward foreign currency exchange contracts | | | — | | | | — | | | | | | | | $(530,662) | | | | — | | | | — | | | | $ (530,662 | ) |
Options purchased1 | | | — | | | | — | | | | $ 30,232 | | | | — | | | | — | | | | — | | | | 30,232 | |
Options written | | | — | | | | — | | | | (533,104 | ) | | | — | | | | — | | | | — | | | | (533,104 | ) |
| | | | |
Total | | | — | | | | — | | | | $(502,872 | ) | | | $(530,662) | | | | — | | | | — | | | | $(1,033,534 | ) |
| | | | |
| | |
1 Options purchased are included in the net realized gain (loss) from investments. | | | | | | | | | |
| | | | | | | | | | | | | | | | | | | | | | | | | | | | | |
| | | | | | | | | | | | | | | | | | | | | | | | | | | | |
| Net Change in Unrealized Appreciation (Depreciation) on: | | | | | | | | | | | | | | | | | | | | | |
Forward foreign currency exchange contracts | | | — | | | | — | | | | — | | | | $342,694 | | | | — | | | | — | | | | $342,694 | |
Options written | | | — | | | | — | | | | $(74,052 | ) | | | — | | | | — | | | | — | | | | (74,052 | ) |
| | | | |
Total | | | — | | | | — | | | | $(74,052 | ) | | | $342,694 | | | | — | | | | — | | | | $268,642 | |
| | | | |
See Notes to Financial Statements.
| | | | | | |
| 38 | | BLACKROCK FUNDS | | MARCH 31, 2017 | | |
| | | | |
| Schedule of Investments (continued) | | | BlackRock Science & Technology Opportunities Portfolio | |
|
| Average Quarterly Balances of Outstanding Derivative Financial Instruments |
| | | | |
Forward foreign currency exchange contracts: | | | | |
Average amounts purchased — in USD | | $ | 19,667,369 | |
Average amounts sold — in USD | | $ | 4,348,742 | |
Options: | | | | |
Average value of option contracts written | | $ | 451,238 | |
| | |
|
| Derivative Financial Instruments — Offsetting as of Period End |
The Fund’s derivative assets and liabilities (by type) were as follows:
| | | | | | | | | | | | |
| | | Assets | | | | | | Liabilities | |
Derivative Financial Instruments: | | | | | | | | | | | | |
Forward foreign currency exchange contracts | | $ | 84,290 | | | | | | | $ | 101,079 | |
Options | | | — | | | | | | | | 546,625 | |
| | | | |
Total derivative assets and liabilities in the Statements of Assets and Liabilities | | $ | 84,290 | | | | | | | $ | 647,704 | |
| | | | |
Derivatives not subject to a Master Netting Agreement or similar agreement (“MNA”) | | | — | | | | | | | | (506,633 | ) |
| | | | |
Total derivative assets and liabilities subject to an MNA | | $ | 84,290 | | | | | | | $ | 141,071 | |
| | | | |
The following tables present the Fund’s derivative assets and liabilities by counterparty net of amounts for offset under an MNA and net of the related collateral received and pledged by the Fund:
| | | | | | | | | | | | | | | | | | | | | | | | | |
| Counterparty | | Derivative Assets
Subject to an MNA by
Counterparty | | Derivative Available
for Offset1 | | Non-cash
Collateral
Received | | Cash
Collateral
Received | | Net Amount of
Derivative Assets2 |
Bank of New York Mellon | | | $ | 21,059 | | | | | — | | | | | — | | | | | — | | | | $ | 21,059 | |
Barclays Bank PLC | | | | 1,227 | | | | $ | (1,227 | ) | | | | — | | | | | — | | | | | — | |
Citibank N.A. | | | | 12,484 | | | | | (3,393 | ) | | | | — | | | | | — | | | | | 9,091 | |
Goldman Sachs International | | | | 20,060 | | | | | — | | | | | — | | | | | — | | | | | 20,060 | |
Morgan Stanley & Co. International PLC | | | | 29,460 | | | | | (1,040 | ) | | | | — | | | | | — | | | | | 28,420 | |
| | | | | |
Total | | | $ | 84,290 | | | | $ | (5,660 | ) | | | | — | | | | | — | | | | $ | 78,630 | |
| | | | | |
| | | | | | | | | | | | | | | | | | | | | | | | | |
| Counterparty | | Derivative Liabilities
Subject to an MNA by
Counterparty | | Derivative Available
for Offset1 | | Non-cash
Collateral
Pledged | | Cash
Collateral
Pledged | | Net Amount of
Derivative Liabilities3 |
Barclays Bank PLC | | | $ | 25,586 | | | | $ | (1,227 | ) | | | | — | | | | | — | | | | $ | 24,359 | |
Citibank N.A. | | | | 3,393 | | | | | (3,393 | ) | | | | — | | | | | — | | | | | — | |
Goldman Sachs International PLC | | | | 165 | | | | | — | | | | | — | | | | | — | | | | | 165 | |
Morgan Stanley & Co. International PLC | | | | 1,040 | | | | | (1,040 | ) | | | | — | | | | | — | | | | | — | |
Northern Trust Corp. | | | | 99,874 | | | | | — | | | | | — | | | | | — | | | | | 99,874 | |
UBS AG | | | | 11,013 | | | | | — | | | | | — | | | | $ | (200 | ) | | | | 10,813 | |
| | | | | |
Total | | | $ | 141,071 | | | | $ | (5,660 | ) | | | | — | | | | $ | (200 | ) | | | $ | 135,211 | |
| | | | | |
| | 1 | | The amount of derivatives available for offset is limited to the amount of derivative assets and/or liabilities that are subject to an MNA. |
| | 2 | | Net amount represents the net amount receivable from the counterparty in the event of default. |
| | 3 | | Net amount represents the net amount payable due to the counterparty in the event of default. Net amount may be offset further by the options written receivable/payable on the Statements of Assets and Liabilities. |
See Notes to Financial Statements.
| | | | | | |
| | | BLACKROCK FUNDS | | MARCH 31, 2017 | | 39 |
| | |
| Schedule of Investments (continued) | | BlackRock Science & Technology Opportunities Portfolio |
|
| Fair Value Hierarchy as of Period End |
Various inputs are used in determining the fair value of investments and derivative financial instruments. For information about the Fund’s policy regarding valuation of investments and derivative financial instruments, refer to the Notes to Financial Statements.
The following tables summarize the Fund’s investments and derivative financial instruments categorized in the disclosure hierarchy:
| | | | | | | | | | | | | | | | |
| | | Level 1 | | | Level 2 | | | Level 3 | | | Total | |
Assets: | | | | | | | | | | | | | | | | |
Investments: | | | | | | | | | | | | | | | | |
Long-Term Investments: | | | | | | | | | | | | | | | | |
Common Stocks: | | | | | | | | | | | | | | | | |
Communications Equipment | | $ | 5,543,317 | | | $ | 707,364 | | | | — | | | $ | 6,250,681 | |
Electronic Equipment, Instruments & Components | | | 5,211,140 | | | | 5,047,803 | | | | — | | | | 10,258,943 | |
Household Durables | | | — | | | | 2,986,737 | | | | — | | | | 2,986,737 | |
Internet & Direct Marketing Retail | | | 27,032,304 | | | | — | | | | — | | | | 27,032,304 | |
Internet Software & Services | | | 66,701,870 | | | | 12,704,999 | | | | — | | | | 79,406,869 | |
IT Services | | | 29,185,362 | | | | — | | | | — | | | | 29,185,362 | |
Media | | | — | | | | 4,193,737 | | | | — | | | | 4,193,737 | |
Semiconductors & Semiconductor Equipment | | | 47,546,759 | | | | 29,339,296 | | | | — | | | | 76,886,055 | |
Software | | | 73,068,085 | | | | 7,827,987 | | | | — | | | | 80,896,072 | |
Technology Hardware, Storage & Peripherals | | | 22,721,122 | | | | 7,974,907 | | | | — | | | | 30,696,029 | |
Preferred Stocks: | | | | | | | | | | | | | | | | |
Internet & Direct Marketing Retail | | | — | | | | — | | | $ | 1,704,382 | | | | 1,704,382 | |
Internet Software & Services | | | — | | | | — | | | | 9,169,109 | | | | 9,169,109 | |
Software | | | — | | | | — | | | | 4,252,869 | | | | 4,252,869 | |
Short-Term Securities | | | 1,353,865 | | | | — | | | | — | | | | 1,353,865 | |
| | | | |
Subtotal | | $ | 278,363,824 | | | $ | 70,782,830 | | | $ | 15,126,360 | | | $ | 364,273,014 | |
| | | | |
Investments Valued at NAV1 | | | | | | | | | | | | | | | 1,231,493 | |
| | | | | | | | | | | | | | | | |
Total Investments | | | | | | | | | | | | | | $ | 365,504,507 | |
| | | | | | | | | | | | | | | | |
| | | | | | | | | | | | | | | | |
Derivative Financial Instruments2 | | | | | | | | | | | | | | | | |
Assets: | | | | | | | | | | | | | | | | |
Foreign currency exchange contracts | | | — | | | $ | 84,290 | | | | — | | | $ | 84,290 | |
Liabilities: | | | | | | | | | | | | | | | | |
Equity contracts | | $ | (381,413 | ) | | | (165,212 | ) | | | — | | | | (546,625 | ) |
Foreign currency exchange contracts | | | — | | | | (101,079 | ) | | | — | | | | (101,079 | ) |
| | | | | |
Total | | $ | (381,413 | ) | | $ | (182,001 | ) | | | — | | | $ | (563,414 | ) |
| | | | |
| | 1 | | As of March 31, 2017, certain of the Fund’s investments were fair valued using NAV per share as no quoted market value is available and therefore have been excluded from the fair value hierarchy. |
| | 2 | | Derivative financial instruments are forward foreign currency exchange contracts and options written. Forward foreign currency exchange contracts are valued at the unrealized appreciation (depreciation) on the instrument and options written are shown at value. |
During the six months ended March 31, 2017, there were no transfers between Level 1 and Level 2.
See Notes to Financial Statements.
| | | | | | |
| 40 | | BLACKROCK FUNDS | | MARCH 31, 2017 | | |
| | |
| Schedule of Investments (concluded) | | BlackRock Science & Technology Opportunities Portfolio |
A reconciliation of Level 3 investments is presented when the Fund had a significant amount of Level 3 investments at the beginning and/or end of the period relation to net assets. The following table is a reconciliation of Level 3 investments for which significant unobservable inputs were used in determining fair value:
| | | | | | | | | | | | |
| | | Common
Stocks | | | Preferred
Stocks | | | Total | |
| Assets: | | | | | | | | | | | | |
Opening Balance, as of September 30, 2016 | | $ | 46,974 | | | $ | 18,053,994 | | | $ | 18,100,968 | |
Transfers into Level 3 | | | | | | | — | | | | — | |
Transfers out of Level 3 | | | — | | | | — | | | | — | |
Accrued discounts/premiums | | | — | | | | — | | | | — | |
Net realized gain (loss) | | | — | | | | — | | | | — | |
Net change in unrealized appreciation (depreciation)1,2 | | | (46,974 | ) | | | (2,927,634 | ) | | | (2,974,608 | ) |
Purchases | | | — | | | | — | | | | — | |
Sales | | | — | | | | — | | | | — | |
| | | | |
Closing Balance, as of March 31, 2017 | | | — | | | $ | 15,126,360 | | | $ | 15,126,360 | |
| | | | |
Net change in unrealized appreciation (depreciation) on investments still held at March 31, 20172 | | $ | (46,974 | ) | | $ | (2,927,634 | ) | | $ | (2,974,608 | ) |
| | | | |
| | 1 | Included in the related net change in unrealized appreciation (depreciation) in the Statements of Operations. |
| | 2 | Any difference between net change in unrealized appreciation (depreciation) and net change in unrealized appreciation (depreciation) on investments still held at March 31, 2017, is generally due to investments no longer held or categorized as Level 3 at period end. |
The following table summarizes the valuation approaches and unobservable inputs utilized by the BlackRock Global Valuation Methodologies Committee to determine the value of certain of the Fund’s Level 3 investments as of period end.
| | | | | | | | | | | | | | | | | | |
| | | Value | | | Valuation Approach | | Unobservable Inputs | | | Range of
Unobservable Inputs
Utilized | | | Weighted Average of
Unobservable Inputs | |
| Assets: | | | | | | | | | | | | | | | | | | |
Preferred Stocks3 | | $ | 15,126,360 | | | Market | | | Discount Rate2 | | | | 25.00% | | | | — | |
| | | | | | | | | Revenue Growth Rate1 | | | | 23.00% - 83.00% | | | | 62.48 | % |
| | | | | | | | | Revenue Growth Rate1 | | | | 133.00% - 348.00% | | | | 201.91 | % |
| | | | | | | | | Revenue Multiple1 | | | | 4.50x - 12.75x | | | | 10.17x | |
| | | | | | | | | Revenue Multiple1 | | | | 13.25x - 35.25x | | | | 30.63x | |
| | | | | | | | | Scenario Probability1 | | | | 5% - 55% | | | | 28.37 | % |
| | | | | | | | | Time to Exit2 | | | | 1-3 years | | | | — | |
| | | | | | | | | | Volatility1 | | | | 38.00% | | | | — | |
| | 1 | Increase in unobservable input may result in a significant increase to value, while a decrease in the unobservable input may result in a significant decrease to value. |
| | 2 | Decrease in unobservable input may result in a significant increase to value, while an increase in the unobservable input may result in a significant decrease to value. |
| | 3 | For the period ended March 31, 2017, the valuation technique for investments classified as preferred stocks amounting to $1,704,382 changed to an Option Pricing Model. The investments were previously valued utilizing Probability-Weighted Expected Return Model. The change was due to consideration of liquidation preferences and exit strategy. |
See Notes to Financial Statements.
| | | | | | |
| | | BLACKROCK FUNDS | | MARCH 31, 2017 | | 41 |
| | | | |
| Schedule of Investments March 31, 2017 (Unaudited) | | | BlackRock U.S. Opportunities Portfolio | |
| | | (Percentages shown are based on Net Assets) | |
| | | | | | | | |
| Common Stocks | | Shares | | | Value | |
Aerospace & Defense — 0.5% | | | | | | | | |
Triumph Group, Inc. | | | 247,200 | | | $ | 6,365,400 | |
Airlines — 0.8% | | | | | | | | |
Southwest Airlines Co. | | | 187,700 | | | | 10,090,752 | |
Auto Components — 1.9% | | | | | | | | |
Delphi Automotive PLC | | | 162,570 | | | | 13,085,259 | |
Lear Corp. | | | 73,747 | | | | 10,441,100 | |
| | | | | | | | |
| | | | | | | | 23,526,359 | |
Automobiles — 0.4% | | | | | | | | |
Tesla Motors, Inc. (a) | | | 15,410 | | | | 4,288,603 | |
Banks — 6.1% | | | | | | | | |
Ameris Bancorp | | | 178,000 | | | | 8,205,800 | |
BankUnited, Inc. | | | 418,079 | | | | 15,598,527 | |
KeyCorp | | | 561,400 | | | | 9,981,692 | |
Strategic Growth Bancorp (Acquired 3/10/14,
cost $7,599,729) (a)(b) | | | 610,420 | | | | 6,110,304 | |
SVB Financial Group (a) | | | 79,300 | | | | 14,756,937 | |
Texas Capital Bancshares, Inc. (a) | | | 106,700 | | | | 8,904,115 | |
Western Alliance Bancorp (a) | | | 241,100 | | | | 11,835,599 | |
| | | | | | | | |
| | | | | | | | 75,392,974 | |
Beverages — 1.4% | | | | | | | | |
Constellation Brands, Inc., Class A | | | 63,200 | | | | 10,242,824 | |
Monster Beverage Corp. (a) | | | 149,100 | | | | 6,883,947 | |
| | | | | | | | |
| | | | | | | | 17,126,771 | |
Biotechnology — 0.4% | | | | | | | | |
Acerta Pharma BV, Series B (Acquired 5/6/15,
cost $1,815,300) (a)(b) | | | 31,555,035 | | | | 2,679,022 | |
Sarepta Therapeutics, Inc. (a) | | | 83,840 | | | | 2,481,664 | |
| | | | | | | | |
| | | | | | | | 5,160,686 | |
Building Products — 1.5% | | | | | | | | |
JELD-WEN Holding, Inc. (a) | | | 258,918 | | | | 8,505,456 | |
Johnson Controls International PLC | | | 233,400 | | | | 9,830,808 | |
| | | | | | | | |
| | | | | | | | 18,336,264 | |
Capital Markets — 2.5% | | | | | | | | |
E*TRADE Financial Corp. (a) | | | 252,100 | | | | 8,795,769 | |
Hamilton Lane, Inc. (a) | | | 494,481 | | | | 9,231,960 | |
Intercontinental Exchange, Inc. | | | 220,500 | | | | 13,201,335 | |
| | | | | | | | |
| | | | | | | | 31,229,064 | |
Chemicals — 5.0% | | | | | | | | |
Axalta Coating Systems, Ltd. (a) | | | 344,000 | | | | 11,076,800 | |
Eastman Chemical Co. | | | 159,018 | | | | 12,848,654 | |
FMC Corp. | | | 100,400 | | | | 6,986,836 | |
Mosaic Co. | | | 340,600 | | | | 9,938,708 | |
Platform Specialty Products Corp. (a) | | | 964,300 | | | | 12,555,186 | |
Potash Corp. of Saskatchewan, Inc. | �� | | 496,900 | | | | 8,487,052 | |
| | | | | | | | |
| | | | | | | | 61,893,236 | |
Commercial Services & Supplies — 0.5% | | | | | | | | |
Advanced Disposal Services, Inc. (a) | | | 275,530 | | | | 6,226,978 | |
Communications Equipment — 1.9% | | | | | | | | |
Finisar Corp. (a) | | | 290,400 | | | | 7,939,536 | |
Juniper Networks, Inc. | | | 283,100 | | | | 7,878,673 | |
Quantenna Communications, Inc. (a) | | | 345,371 | | | | 7,194,078 | |
| | | | | | | | |
| | | | | | | | 23,012,287 | |
Construction & Engineering — 0.5% | | | | | | | | |
KBR, Inc. | | | 423,400 | | | | 6,363,702 | |
Construction Materials — 1.1% | | | | | | | | |
Summit Materials, Inc., Class A | | | 256,700 | | | | 6,343,057 | |
| | | | | | | | |
| Common Stocks | | Shares | | | Value | |
Construction Materials (continued) | | | | | | | | |
Vulcan Materials Co. | | | 57,200 | | | $ | 6,891,456 | |
| | | | | | | | |
| | | | | | | | 13,234,513 | |
Containers & Packaging — 1.6% | | | | | | | | |
Crown Holdings, Inc. (a) | | | 208,239 | | | | 11,026,255 | |
WestRock Co. | | | 159,000 | | | | 8,272,770 | |
| | | | | | | | |
| | | | | | | | 19,299,025 | |
Diversified Telecommunication Services — 0.7% | | | | | | | | |
CenturyLink, Inc. | | | 356,100 | | | | 8,393,277 | |
Electric Utilities — 1.7% | | | | | | | | |
PPL Corp. | | | 264,008 | | | | 9,871,259 | |
Xcel Energy, Inc. | | | 243,453 | | | | 10,821,486 | |
| | | | | | | | |
| | | | | | | | 20,692,745 | |
Electrical Equipment — 0.7% | | | | | | | | |
Rockwell Automation, Inc. | | | 57,800 | | | | 9,000,038 | |
Electronic Equipment, Instruments & Components — 2.5% | | | | | |
Amphenol Corp., Class A (a) | | | 157,081 | | | | 11,179,455 | |
Flex Ltd. (a) | | | 485,800 | | | | 8,161,440 | |
Universal Display Corp. | | | 138,813 | | | | 11,951,799 | |
| | | | | | | | |
| | | | | | | | 31,292,694 | |
Energy Equipment & Services — 1.5% | | | | | | | | |
Keane Group, Inc. (a)(c) | | | 427,880 | | | | 6,118,684 | |
U.S. Silica Holdings, Inc. | | | 82,400 | | | | 3,954,376 | |
Weatherford International PLC (a) | | | 1,210,400 | | | | 8,049,160 | |
| | | | | | | | |
| | | | | | | | 18,122,220 | |
Equity Real Estate Investment Trusts (REITs) — 5.8% | | | | | |
Equinix, Inc. | | | 35,400 | | | | 14,173,098 | |
Equity Residential | | | 97,350 | | | | 6,057,117 | |
Physicians Realty Trust | | | 624,483 | | | | 12,408,477 | |
SBA Communications Corp. (a) | | | 78,677 | | | | 9,470,350 | |
STAG Industrial, Inc. | | | 396,735 | | | | 9,926,310 | |
VEREIT, Inc. | | | 1,427,993 | | | | 12,123,661 | |
Weyerhaeuser Co. | | | 213,585 | | | | 7,257,618 | |
| | | | | | | | |
| | | | | | | | 71,416,631 | |
Food Products — 2.9% | | | | | | | | |
AdvancePierre Foods Holdings, Inc. | | | 550,270 | | | | 17,151,916 | |
Kellogg Co. | | | 125,000 | | | | 9,076,250 | |
Pinnacle Foods, Inc. | | | 167,002 | | | | 9,664,406 | |
| | | | | | | | |
| | | | | | | | 35,892,572 | |
Health Care Equipment & Supplies — 2.7% | | | | | | | | |
Boston Scientific Corp. (a) | | | 384,920 | | | | 9,572,960 | |
CR Bard, Inc. | | | 38,400 | | | | 9,543,936 | |
Hologic, Inc. (a) | | | 176,400 | | | | 7,505,820 | |
Intuitive Surgical, Inc. (a) | | | 8,750 | | | | 6,706,613 | |
| | | | | | | | |
| | | | | | | | 33,329,329 | |
Health Care Providers & Services — 4.0% | | | | | | | | |
Amedisys, Inc. (a) | | | 129,000 | | | | 6,590,610 | |
Centene Corp. (a) | | | 86,800 | | | | 6,185,368 | |
Cigna Corp. | | | 47,158 | | | | 6,908,175 | |
DaVita, Inc. (a) | | | 90,800 | | | | 6,171,676 | |
Humana, Inc. | | | 44,782 | | | | 9,231,362 | |
Quest Diagnostics, Inc. | | | 141,200 | | | | 13,864,428 | |
| | | | | | | | |
| | | | | | | | 48,951,619 | |
Hotels, Restaurants & Leisure — 4.5% | | | | | | | | |
Marriott International, Inc., Class A | | | 85,200 | | | | 8,024,136 | |
MGM Resorts International | | | 257,900 | | | | 7,066,460 | |
Panera Bread Co., Class A (a) | | | 34,100 | | | | 8,929,767 | |
See Notes to Financial Statements.
| | | | | | |
| 42 | | BLACKROCK FUNDS | | MARCH 31, 2017 | | |
| | | | |
| Schedule of Investments (continued) | | | BlackRock U.S. Opportunities Portfolio | |
| | | | |
| | | | | | | | |
| Common Stocks | | Shares | | | Value | |
Hotels, Restaurants & Leisure (continued) | | | | | | | | |
Penn National Gaming, Inc. (a) | | | 523,800 | | | $ | 9,653,634 | |
Wingstop, Inc. (a) | | | 393,553 | | | | 11,129,679 | |
Wynn Resorts Ltd. | | | 92,100 | | | | 10,555,581 | |
| | | | | | | | |
| | | | | | | | 55,359,257 | |
Household Durables — 2.3% | | | | | | | | |
DR Horton, Inc. | | | 252,280 | | | | 8,403,447 | |
Newell Brands, Inc. | | | 229,313 | | | | 10,816,694 | |
Whirlpool Corp. | | | 53,600 | | | | 9,183,288 | |
| | | | | | | | |
| | | | | | | | 28,403,429 | |
Independent Power and Renewable Electricity Producers — 0.9% | | | | | |
Dynegy, Inc. (a) | | | 1,366,700 | | | | 10,742,262 | |
Industrial Conglomerates — 1.0% | | | | | | | | |
Roper Technologies, Inc. | | | 59,325 | | | | 12,250,019 | |
Insurance — 2.6% | | | | | | | | |
Assured Guaranty Ltd. | | | 227,631 | | | | 8,447,386 | |
Athene Holding Ltd., Class A (a) | | | 142,332 | | | | 7,115,177 | |
Hartford Financial Services Group, Inc. | | | 334,380 | | | | 16,073,647 | |
| | | | | | | | |
| | | | | | | | 31,636,210 | |
Internet Software & Services — 1.2% | | | | | | | | |
Alteryx, Inc. (a)(c) | | | 142,848 | | | | 2,232,714 | |
Coupa Software, Inc. (a)(c) | | | 133,389 | | | | 3,388,081 | |
Wix.com Ltd. (a) | | | 134,200 | | | | 9,112,180 | |
| | | | | | | | |
| | | | | | | | 14,732,975 | |
IT Services — 0.7% | | | | | | | | |
Fidelity National Information Services, Inc. | | | 115,485 | | | | 9,194,916 | |
Machinery — 3.4% | | | | | | | | |
Dover Corp. | | | 131,600 | | | | 10,574,060 | |
Snap-on, Inc. | | | 51,243 | | | | 8,643,157 | |
Stanley Black & Decker, Inc. | | | 99,655 | | | | 13,241,160 | |
Wabtec Corp. | | | 116,095 | | | | 9,055,410 | |
| | | | | | | | |
| | | | | | | | 41,513,787 | |
Marine — 0.3% | | | | | | | | |
Diana Shipping, Inc. (a)(c) | | | 851,582 | | | | 3,934,309 | |
Media — 1.4% | | | | | | | | |
Nexstar Broadcasting Group, Inc. | | | 181,188 | | | | 12,710,338 | |
Videocon d2h Ltd. — ADR (a) | | | 435,222 | | | | 5,005,053 | |
| | | | | | | | |
| | | | | | | | 17,715,391 | |
Metals & Mining — 1.0% | | | | | | | | |
Alcoa Corp. | | | 181,900 | | | | 6,257,360 | |
United States Steel Corp. | | | 191,500 | | | | 6,474,615 | |
| | | | | | | | |
| | | | | | | | 12,731,975 | |
Multiline Retail — 1.5% | | | | | | | | |
Dollar General Corp. | | | 145,700 | | | | 10,159,661 | |
Ollie’s Bargain Outlet Holdings, Inc. (a) | | | 229,600 | | | | 7,691,600 | |
| | | | | | | | |
| | | | | | | | 17,851,261 | |
Multi-Utilities — 0.8% | | | | | | | | |
Public Service Enterprise Group, Inc. | | | 211,200 | | | | 9,366,720 | |
Oil, Gas & Consumable Fuels — 6.2% | | | | | | | | |
Cabot Oil & Gas Corp. | | | 393,900 | | | | 9,418,149 | |
Concho Resources, Inc. (a) | | | 103,362 | | | | 13,265,479 | |
Diamondback Energy, Inc. (a) | | | 137,500 | | | | 14,260,813 | |
Energen Corp. (a) | | | 241,900 | | | | 13,169,036 | |
Pioneer Natural Resources Co. | | | 78,300 | | | | 14,581,809 | |
RSP Permian, Inc. (a) | | | 278,900 | | | | 11,554,827 | |
| | | | | | | | |
| | | | | | | | 76,250,113 | |
| | | | | | | | |
| Common Stocks | | Shares | | | Value | |
Pharmaceuticals — 0.9% | | | | | | | | |
Jazz Pharmaceuticals PLC (a) | | | 40,300 | | | $ | 5,848,739 | |
Zoetis, Inc. | | | 97,400 | | | | 5,198,238 | |
| | | | | | | | |
| | | | | | | | 11,046,977 | |
Professional Services — 0.5% | | | | | | | | |
Equifax, Inc. | | | 48,240 | | | | 6,596,338 | |
Real Estate Management & Development — 0.5% | | | | | |
Kennedy-Wilson Holdings, Inc. | | | 284,915 | | | | 6,325,113 | |
Semiconductors & Semiconductor Equipment — 7.4% | | | | | |
Advanced Micro Devices, Inc. (a) | | | 808,000 | | | | 11,756,400 | |
Broadcom Ltd. | | | 44,041 | | | | 9,643,217 | |
Cirrus Logic, Inc. (a) | | | 78,100 | | | | 4,739,889 | |
Lam Research Corp. | | | 102,200 | | | | 13,118,392 | |
Maxim Integrated Products, Inc. | | | 156,900 | | | | 7,054,224 | |
Mellanox Technologies Ltd. (a) | | | 128,500 | | | | 6,547,075 | |
NXP Semiconductors NV (a) | | | 93,051 | | | | 9,630,779 | |
Silicon Laboratories, Inc. (a) | | | 157,600 | | | | 11,591,480 | |
Skyworks Solutions, Inc. | | | 96,400 | | | | 9,445,272 | |
Tower Semiconductor, Ltd. (a) | | | 350,100 | | | | 8,069,805 | |
| | | | | | | | |
| | | | | | | | 91,596,533 | |
Software — 5.1% | | | | | | | | |
Autodesk, Inc. (a) | | | 127,600 | | | | 11,033,572 | |
Blackline, Inc. (a) | | | 153,353 | | | | 4,563,785 | |
Electronic Arts, Inc. (a) | | | 139,900 | | | | 12,523,848 | |
HubSpot, Inc. (a) | | | 133,000 | | | | 8,053,150 | |
PTC, Inc. (a) | | | 129,300 | | | | 6,794,715 | |
Snap, Inc., Class A (a)(c) | | | 215,647 | | | | 4,858,527 | |
Splunk, Inc. (a) | | | 86,300 | | | | 5,375,627 | |
Take-Two Interactive Software, Inc. (a) | | | 151,900 | | | | 9,003,113 | |
| | | | | | | | |
| | | | | | | | 62,206,337 | |
Specialty Retail — 3.3% | | | | | | | | |
AutoZone, Inc. (a) | | | 9,500 | | | | 6,868,975 | |
Best Buy Co., Inc. | | | 133,194 | | | | 6,546,485 | |
Camping World Holdings, Inc., Class A | | | 291,744 | | | | 9,405,827 | |
Ross Stores, Inc. | | | 188,390 | | | | 12,409,249 | |
Urban Outfitters, Inc. (a) | | | 225,200 | | | | 5,350,752 | |
| | | | | | | | |
| | | | | | | | 40,581,288 | |
Textiles, Apparel & Luxury Goods — 0.7% | | | | | | | | |
Sequential Brands Group, Inc. (a)(d) | | | 2,321,200 | | | | 9,029,468 | |
Trading Companies & Distributors — 0.4% | | | | | | | | |
Foundation Building Materials, Inc. (a) | | | 283,360 | | | | 4,525,259 | |
Transportation Infrastructure — 0.9% | | | | | | | | |
Macquarie Infrastructure Corp. | | | 135,068 | | | | 10,883,779 | |
Total Common Stocks — 96.1% | | | | | | | 1,183,111,455 | |
| | | | | | | | |
See Notes to Financial Statements.
| | | | | | |
| | | BLACKROCK FUNDS | | MARCH 31, 2017 | | 43 |
| | | | |
| Schedule of Investments (continued) | | | BlackRock U.S. Opportunities Portfolio | |
| | | | | | | | |
| Preferred Stocks | | Shares | | | Value | |
Internet Software & Services — 1.7% | | | | | | | | |
Uber Technologies, Inc., Series D (Acquired 6/06/14,
cost $5,217,971) (a)(b) | | | 336,360 | | | $ | 17,537,810 | |
Zuora, Inc. (Acquired 1/16/15, cost $3,742,311) (a)(b) | | | 985,000 | | | | 3,496,750 | |
| | | | | | | | |
| | | | | | | | 21,034,560 | |
Software — 1.2% | | | | | | | | |
MongoDB, Series C (Acquired 12/19/13,
cost $7,974,599) (a)(b) | | | 317,888 | | | | 7,219,237 | |
MongoDB, Series D (Acquired 12/19/13,
cost $2,480,798) (a)(b) | | | 98,891 | | | | 2,245,815 | |
MongoDB, Series E (Acquired 12/19/13,
cost $87,676) (a)(b) | | | 3,495 | | | | 79,371 | |
Palantir Technologies, Inc., Series I (Acquired 2/07/14, cost $4,300,011) (a)(b) | | | 701,470 | | | | 5,569,672 | |
| | | | | | | | |
| | | | | | | | 15,114,095 | |
Total Preferred Stocks — 2.9% | | | | | | | 36,148,655 | |
Total Long-Term Investments (Cost — $959,880,346) — 99.0% | | | | | | | 1,219,260,110 | |
| | | | | | | | |
| Short-Term Securities | | Shares | | | Value | |
BlackRock Liquidity Funds, T-Fund, Institutional
Class, 0.60% (e)(f) | | | 14,500,405 | | | $ | 14,500,405 | |
SL Liquidity Series, LLC, Money Market Series,
1.11% (e)(f)(g) | | | 6,890,362 | | | | 6,891,051 | |
Total Short-Term Securities (Cost — $21,391,832) — 1.8% | | | | 21,391,456 | |
Total Investments (Cost — $981,272,178) — 100.8% | | | | | | | 1,240,651,566 | |
Liabilities in Excess of Other Assets — (0.8)% | | | | | | | (9,300,967 | ) |
| | | | | | | | |
Net Assets — 100.0% | | | | | | $ | 1,231,350,599 | |
| | | | | | | | |
|
| Notes to Schedule of Investments |
| (a) | Non-income producing security. |
| (b) | Restricted security as to resale, excluding 144A securities. The Fund held restricted securities with a current value of $44,937,981, representing 3.65% of its net assets as of period end, and an original cost of $33,218,395. |
| (c) | Security, or a portion of the security, is on loan. |
| (d) | During the six months ended March 31, 2017, investments in issuer that is affiliated person and/or related parties of the Fund, as applicable, were as follows: |
| | | | | | | | | | | | | | | | | | | | | | | | | | | | |
| Affiliated Persons and/or Related Parties1 | | Shares Held at
September 30, 2016 | | | Shares
Purchased | | | Shares
Sold | | | Shares Held at
March 31, 2017 | | | Value at
March 31, 2017 | | | Realized
Gain | | | Change in
Unrealized
Appreciation
(Depreciation) | |
Sequential Brands Group, Inc. | | | 2,321,200 | | | | — | | | | — | | | | 2,321,200 | | | $ | 9,029,468 | | | | — | | | $ | (5,803,000 | ) |
| | 1 | | No longer an affiliated company as of report date. |
| (e) | During the six months ended March 31, 2017, investments in issuers considered to be affiliates of the Fund for purposes of Section 2(a)(3) of the Investment Company Act of 1940, as amended, were as follows: |
| | | | | | | | | | | | | | | | | | | | | | | | | | | | |
| Affiliate | | Shares Held at
September 30,
2016 | | | Net Activity | | | Shares Held at
March 31,
2017 | | | Value at
March 31,
2017 | | | Income | | | Net Realized
Gain1 | | | Change in
Unrealized
Appreciation
(Depreciation) | |
BlackRock Liquidity Funds, T-Fund, Institutional Class | | | 37,581,914 | | | | (23,081,509 | ) | | | 14,500,405 | | | $ | 14,500,405 | | | $ | 24,660 | | | | $ 47 | | | | — | |
SL Liquidity Series, LLC, Money Market Series | | | 3,097,601 | | | | 3,792,761 | | | | 6,890,362 | | | | 6,891,051 | | | | 141,757 | 2 | | | 586 | | | | $(377 | ) |
Total | | | | | | | | | | | | | | $ | 21,391,456 | | | $ | 166,417 | | | | $633 | | | | $(377 | ) |
| | | | | | | | | | | | | | | | |
| | 1 | | Includes net capital gain distributions. |
| | 2 | | Represents securities lending income earned from the reinvestment of cash collateral from loaned securities, net of fees and collateral investment expenses, and other payments to and from borrowers of securities. |
| (f) | Current yield as of period end. |
| (g) | Security was purchased with the cash collateral from loaned securities. |
| • | | For Fund compliance purposes, the Fund’s industry classifications refer to one or more of the industry sub-classifications used by one or more widely recognized market indexes or ratings group indexes, and/or as defined by the investment adviser. These definitions may not apply for purposes of this report, which may combine such industry sub-classifications for reporting ease. |
See Notes to Financial Statements.
| | | | | | |
| 44 | | BLACKROCK FUNDS | | MARCH 31, 2017 | | |
| | | | |
| Schedule of Investments (continued) | | | BlackRock U.S. Opportunities Portfolio | |
|
| Fair Value Hierarchy as of Period End |
Various inputs are used in determining the fair value of investments. For information about the Fund’s policy regarding valuation of investments, refer to the Notes to Financial Statements.
The following table summarizes the Fund’s investments categorized in the disclosure hierarchy:
| | | | | | | | | | | | | | | | |
| | | Level 1 | | | Level 2 | | | Level 3 | | | Total | |
Assets: | | | | | | | | | | | | | | | | |
Investments: | | | | | | | | | | | | | | | | |
Long-Term Investments: | | | | | | | | | | | | | | | | |
Common Stocks: | | | | | | | | | | | | | | | | |
Aerospace & Defense | | $ | 6,365,400 | | | | — | | | | — | | | $ | 6,365,400 | |
Airlines | | | 10,090,752 | | | | — | | | | — | | | | 10,090,752 | |
Auto Components | | | 23,526,359 | | | | — | | | | — | | | | 23,526,359 | |
Automobiles | | | 4,288,603 | | | | — | | | | — | | | | 4,288,603 | |
Banks | | | 69,282,670 | | | | — | | | $ | 6,110,304 | | | | 75,392,974 | |
Beverages | | | 17,126,771 | | | | — | | | | — | | | | 17,126,771 | |
Biotechnology | | | 2,481,664 | | | | — | | | | 2,679,022 | | | | 5,160,686 | |
Building Products | | | 18,336,264 | | | | — | | | | — | | | | 18,336,264 | |
Capital Markets | | | 31,229,064 | | | | — | | | | — | | | | 31,229,064 | |
Chemicals | | | 61,893,236 | | | | — | | | | — | | | | 61,893,236 | |
Commercial Services & Supplies | | | 6,226,978 | | | | — | | | | — | | | | 6,226,978 | |
Communications Equipment | | | 23,012,287 | | | | — | | | | — | | | | 23,012,287 | |
Construction & Engineering | | | 6,363,702 | | | | — | | | | — | | | | 6,363,702 | |
Construction Materials | | | 13,234,513 | | | | — | | | | — | | | | 13,234,513 | |
Containers & Packaging | | | 19,299,025 | | | | — | | | | — | | | | 19,299,025 | |
Diversified Telecommunication Services | | | 8,393,277 | | | | — | | | | — | | | | 8,393,277 | |
Electric Utilities | | | 20,692,745 | | | | — | | | | — | | | | 20,692,745 | |
Electrical Equipment | | | 9,000,038 | | | | — | | | | — | | | | 9,000,038 | |
Electronic Equipment, Instruments & Components | | | 31,292,694 | | | | — | | | | — | | | | 31,292,694 | |
Energy Equipment & Services | | | 18,122,220 | | | | — | | | | — | | | | 18,122,220 | |
Equity Real Estate Investment Trusts (REITs) | | | 71,416,631 | | | | — | | | | — | | | | 71,416,631 | |
Food Products | | | 35,892,572 | | | | — | | | | — | | | | 35,892,572 | |
Health Care Equipment & Supplies | | | 33,329,329 | | | | — | | | | — | | | | 33,329,329 | |
Health Care Providers & Services | | | 48,951,619 | | | | — | | | | — | | | | 48,951,619 | |
Hotels, Restaurants & Leisure | | | 55,359,257 | | | | — | | | | — | | | | 55,359,257 | |
Household Durables | | | 28,403,429 | | | | — | | | | — | | | | 28,403,429 | |
Independent Power and Renewable Electricity Producers | | | 10,742,262 | | | | — | | | | — | | | | 10,742,262 | |
Industrial Conglomerates | | | 12,250,019 | | | | — | | | | — | | | | 12,250,019 | |
Insurance | | | 31,636,210 | | | | — | | | | — | | | | 31,636,210 | |
Internet Software & Services | | | 14,732,975 | | | | — | | | | — | | | | 14,732,975 | |
IT Services | | | 9,194,916 | | | | — | | | | — | | | | 9,194,916 | |
Machinery | | | 41,513,787 | | | | — | | | | — | | | | 41,513,787 | |
Marine | | | 3,934,309 | | | | — | | | | — | | | | 3,934,309 | |
Media | | | 17,715,391 | | | | — | | | | — | | | | 17,715,391 | |
Metals & Mining | | | 12,731,975 | | | | — | | | | — | | | | 12,731,975 | |
Multiline Retail | | | 17,851,261 | | | | — | | | | — | | | | 17,851,261 | |
Multi-Utilities | | | 9,366,720 | | | | — | | | | — | | | | 9,366,720 | |
Oil, Gas & Consumable Fuels | | | 76,250,113 | | | | — | | | | — | | | | 76,250,113 | |
Pharmaceuticals | | | 11,046,977 | | | | — | | | | — | | | | 11,046,977 | |
Professional Services | | | 6,596,338 | | | | — | | | | — | | | | 6,596,338 | |
Real Estate Management & Development | | | 6,325,113 | | | | — | | | | — | | | | 6,325,113 | |
Semiconductors & Semiconductor Equipment | | | 91,596,533 | | | | — | | | | — | | | | 91,596,533 | |
Software | | | 62,206,337 | | | | — | | | | — | | | | 62,206,337 | |
Specialty Retail | | | 40,581,288 | | | | — | | | | — | | | | 40,581,288 | |
Textiles, Apparel & Luxury Goods | | | 9,029,468 | | | | — | | | | — | | | | 9,029,468 | |
Trading Companies & Distributors | | | 4,525,259 | | | | — | | | | — | | | | 4,525,259 | |
Transportation Infrastructure | | | 10,883,779 | | | | — | | | | — | | | | 10,883,779 | |
See Notes to Financial Statements.
| | | | | | |
| | | BLACKROCK FUNDS | | MARCH 31, 2017 | | 45 |
| | |
| Schedule of Investments (concluded) | | BlackRock U.S. Opportunities Portfolio |
| | | | | | | | | | | | | | | | |
| | | Level 1 | | | Level 2 | | | Level 3 | | | Total | |
Preferred Stocks: | | | | | | | | | | | | | | | | |
Internet Software & Services | | | — | | | | — | | | $ | 21,034,560 | | | $ | 21,034,560 | |
Software | | | — | | | | — | | | | 15,114,095 | | | | 15,114,095 | |
Short-Term Securities | | $ | 14,500,405 | | | | — | | | | — | | | | 14,500,405 | |
| | | | |
Subtotal | | $ | 1,188,822,534 | | | | — | | | $ | 44,937,981 | | | $ | 1,233,760,515 | |
| | | | |
Investments Valued at NAV1 | | | | | | | | | | | | | | | 6,891,051 | |
| | | | | | | | | | | | | | | | |
Total Investments | | | | | | | | | | | | | | $ | 1,240,651,566 | |
| | | | | | | | | | | | | | | | |
During the six months ended March 31, 2017, there were no transfers between levels.
A reconciliation of Level 3 investments is presented when the Fund had a significant amount of Level 3 investments at the beginning and/or end of the year in relation to net assets. The following table is a reconciliation of Level 3 investments for which significant unobservable inputs were used in determining fair value:
| | | | | | | | | | | | | | | |
| | | Common
Stocks | | Preferred
Stocks | | Total |
| Assets: | | | | | | | | | | | | | | | |
Opening Balance, as of September 30, 2016 | | | $ | 8,157,645 | | | | $ | 35,157,191 | | | | $ | 43,314,836 | |
Transfers into Level 3 | | | | — | | | | | — | | | | | — | |
Transfers out of Level 3 | | | | — | | | | | — | | | | | — | |
Accrued discounts/premiums | | | | — | | | | | — | | | | | — | |
Net realized gain (loss) | | | | — | | | | | — | | | | | — | |
Net change in unrealized appreciation (depreciation)1,2 | | | | 631,681 | | | | | 991,464 | | | | | 1,623,145 | |
Purchases | | | | — | | | | | — | | | | | — | |
Sales | | | | — | | | | | — | | | | | — | |
| | | | | |
Closing Balance, as of March 31, 2017 | | | $ | 8,789,326 | | | | $ | 36,148,655 | | | | $ | 44,937,981 | |
| | | | | |
Net change in unrealized appreciation (depreciation) on investments still held at March 31, 2017 2 | | | $ | 631,681 | | | | $ | 991,464 | | | | $ | 1,623,145 | |
| | | | | |
| | 1 | | Included in the related net change in unrealized appreciation (depreciation) in the Statements of Operations. |
| | 2 | | Any difference between net change in unrealized appreciation (depreciation) and net change in unrealized appreciation (depreciation) on investments still held at March 31, 2017, is generally due to investments no longer held or categorized as Level 3 at period end. |
The following table summarizes the valuation approaches used and unobservable inputs utilized by the BlackRock Global Valuation Methodologies Committee to determine the value of certain of the Fund’s Level 3 investments as of period end.
| | | | | | | | | | | | | | | | |
| | | Value | | | Valuation Approach | | Unobservable
Inputs | | Range of
Unobservable Inputs
Utilized | | | Weighted Average of
Unobservable Inputs | |
| Assets: | | | | | | | | | | | | | | | | |
Common Stocks | | $ | 8,789,326 | | | Market | | Tangible Book Value Multiple1 | | | 1.80x | | | | — | |
| | | | | | Income | | Discount Rate2 | | | 1.68% | | | | — | |
| | | | | | | | Time to Exit2 | | | 1-2 years | | | | — | |
Preferred Stocks | | | 36,148,655 | | | Market | | Discount Rate2 | | | 25.00% | | | | — | |
| | | | | | | | Revenue Growth Rate1 | | | 23.00% - 83.00% | | | | 66.91 | % |
| | | | | | | | Revenue Growth Rate1 | | | 133.00% - 187.00% | | | | 173.98 | % |
| | | | | | | | Revenue Multiple1 | | | 5.00x - 12.75x | | | | 10.23x | |
| | | | | | | | Exit Scenario Probability1 | | | 5% - 50% | | | | — | |
| | | | | | | | Time to Exit2 | | | 1-3 years | | | | — | |
| | | | |
Total | | $ | 44,937,981 | | | | | | | | | | | | | |
| | | | |
| | 1 | | Increase in unobservable input may result in a significant increase to value, while a decrease in the unobservable input may result in a significant decrease to value. |
| | 2 | | Decrease in unobservable input may result in a significant increase to value, while an increase in the unobservable input may result in a significant decrease to value. |
See Notes to Financial Statements.
| | | | | | |
| 46 | | BLACKROCK FUNDS | | MARCH 31, 2017 | | |
| | | | |
| Statements of Assets and Liabilities | | | | |
| | | | | | | | | | | | | | | | | | | | |
| March 31, 2017 (Unaudited) | | BlackRock
Global
Opportunities
Portfolio | | | BlackRock
Health
Sciences
Opportunities
Portfolio | | | BlackRock
International
Opportunities
Portfolio | | | BlackRock
Science
& Technology
Opportunities
Portfolio | | | BlackRock
U.S.
Opportunities
Portfolio | |
| | | | | | | | | | | | | | | | | | | | |
| Assets | | | | | | | | | | | | | | | | | | | | |
Investments at value — unaffiliated1,2 | | $ | 253,648,637 | | | $ | 5,286,476,624 | | | $ | 680,765,745 | | | $ | 362,919,149 | | | $ | 1,219,260,110 | |
Investments at value — affiliated3 | | | 1,195,239 | | | | 99,180,056 | | | | 8,552,082 | | | | 2,585,358 | | | | 21,391,456 | |
Cash | | | 2,624 | | | | 3,062 | | | | — | | | | 807 | | | | — | |
Cash pledged as collateral for OTC derivatives | | | — | | | | | | | | — | | | | 200 | | | | — | |
Foreign currency at value4 | | | 35,953 | | | | 565,036 | | | | 172,645 | | | | 2,171,827 | | | | — | |
Receivables: | | | | | | | | | | | | | | | | | | | | |
Investments sold | | | 375,996 | | | | 31,078,597 | | | | 2,680,616 | | | | 130,617 | | | | — | |
Securities lending income — affiliated | | | 2,075 | | | | 4,334 | | | | — | | | | 7,991 | | | | 13,007 | |
Capital shares sold | | | 238,860 | | | | 10,292,252 | | | | 462,683 | | | | 1,354,368 | | | | 1,307,609 | |
Dividends — affiliated | | | 308 | | | | 26,158 | | | | 1,388 | | | | 1,201 | | | | 4,796 | |
Dividends — unaffiliated | | | 490,168 | | | | 5,317,516 | | | | 3,250,020 | | | | 221,168 | | | | 1,054,668 | |
From the Manager | | | 23,642 | | | | — | | | | 52,166 | | | | — | | | | 140,413 | |
Unrealized appreciation on forward foreign currency exchange contracts | | | 510,543 | | | | — | | | | 3,807,616 | | | | 84,290 | | | | — | |
Deferred offering costs | | | — | | | | 4,985 | | | | — | | | | — | | | | — | |
Prepaid expenses | | | 38,407 | | | | 125,921 | | | | 43,122 | | | | 63,234 | | | | 63,914 | |
| | | | |
Total assets | | | 256,562,452 | | | | 5,433,074,541 | | | | 699,788,083 | | | | 369,540,210 | | | | 1,243,235,973 | |
| | | | |
| | | | | | | | | | | | | | | | | | | | |
| Liabilities | | | | | | | | | | | | | | | | | | | | |
Cash collateral on securities loaned at value | | | 1,048,523 | | | | 2,858,476 | | | | — | | | | 1,231,205 | | | | 6,891,626 | |
Options written at value5 | | | 46,928 | | | | — | | | | 707 | | | | 546,625 | | | | — | |
Payables: | | | | | | | | | | | | | | | | | | | | |
Investments purchased | | | — | | | | 12,829,790 | | | | — | | | | — | | | | — | |
Capital shares redeemed | | | 538,201 | | | | 19,682,074 | | | | 1,198,896 | | | | 542,405 | | | | 2,854,848 | |
Deferred foreign capital gain tax | | | 17,884 | | | | — | | | | — | | | | — | | | | — | |
Investment advisory fees | | | 185,174 | | | | 3,144,857 | | | | 529,984 | | | | 283,598 | | | | 959,783 | |
Offering costs | | | — | | | | 20,414 | | | | — | | | | — | | | | — | |
Officer’s and Trustees’ fees | | | 5,714 | | | | 56,317 | | | | 11,786 | | | | 5,840 | | | | 15,733 | |
Options written | | | — | | | | — | | | | — | | | | 26,512 | | | | — | |
Other accrued expenses | | | 260,382 | | | | 2,637,284 | | | | 594,052 | | | | 376,334 | | | | 837,137 | |
Other affiliates | | | 11,916 | | | | 360,559 | | | | 59,366 | | | | 31,698 | | | | 112,731 | |
Service and distribution fees | | | 70,364 | | | | 1,449,995 | | | | 133,377 | | | | 100,257 | | | | 213,516 | |
Unrealized depreciation on forward foreign currency exchange contracts | | | 199,202 | | | | — | | | | 1,559,212 | | | | 101,079 | | | | — | |
| | | | |
Total liabilities | | | 2,384,288 | | | | 43,039,766 | | | | 4,087,380 | | | | 3,245,553 | | | | 11,885,374 | |
| | | | |
Net Assets | | $ | 254,178,164 | | | $ | 5,390,034,775 | | | $ | 695,700,703 | | | $ | 366,294,657 | | | $ | 1,231,350,599 | |
| | | | |
| | | | | | | | | | | | | | | | | | | | |
| Net Assets Consist of | | | | | | | | | | | | | | | | | | | | |
Paid-in capital | | $ | 294,432,185 | | | $ | 3,912,974,614 | | | $ | 641,330,762 | | | $ | 228,296,818 | | | $ | 860,962,543 | |
Accumulated (distributions in excess of) net investment income (loss) | | | (1,909,901 | ) | | | (2,715,157 | ) | | | (3,726,762 | ) | | | (3,223,621 | ) | | | (5,610,273 | ) |
Accumulated net realized gain (loss) | | | (77,329,526 | ) | | | 3,580,658 | | | | (17,508,868 | ) | | | 6,503,915 | | | | 116,618,941 | |
Net unrealized appreciation/(depreciation) | | | 38,985,406 | | | | 1,476,194,660 | | | | 75,605,571 | | | | 134,717,545 | | | | 259,379,388 | |
| | | | |
Net Assets | | $ | 254,178,164 | | | $ | 5,390,034,775 | | | $ | 695,700,703 | | | $ | 366,294,657 | | | $ | 1,231,350,599 | |
| | | | |
| | | | | | | | | | | | | | | | | | | | |
1 Investments at cost — unaffiliated | | $ | 214,987,162 | | | $ | 3,810,573,355 | | | $ | 607,427,982 | | | $ | 228,069,603 | | | $ | 959,880,346 | |
2 Securities loaned at value | | $ | 1,020,745 | | | $ | 2,775,000 | | | | — | | | $ | 1,207,787 | | | $ | 6,770,237 | |
3 Investments at cost — affiliated | | $ | 1,195,247 | | | $ | 98,865,308 | | | $ | 8,552,082 | | | $ | 2,585,340 | | | $ | 21,391,832 | |
4 Foreign currency at cost | | $ | 35,768 | | | $ | 567,137 | | | $ | 171,849 | | | $ | 2,148,057 | | | | — | |
5 Premiums received | | $ | 79,811 | | | | — | | | $ | 54,398 | | | $ | 404,356 | | | | — | |
See Notes to Financial Statements.
| | | | | | |
| | | BLACKROCK FUNDS | | MARCH 31, 2017 | | 47 |
| | | | |
| Statements of Assets and Liabilities (concluded) | | | | |
| | | | | | | | | | | | | | | | | | | | |
| March 31, 2017 (Unaudited) | | BlackRock
Global
Opportunities
Portfolio | | | BlackRock
Health
Sciences
Opportunities
Portfolio | | | BlackRock
International
Opportunities
Portfolio | | | BlackRock
Science
& Technology
Opportunities
Portfolio | | | BlackRock
U.S.
Opportunities
Portfolio | |
| | | | | | | | | | | | | | | | | | | | |
| NetAssetValue | | | | | | | | | | | | | | | | | | | | |
Institutional | | | | | | | | | | | | | | | | | | | | |
Net assets | | $ | 58,004,459 | | | $ | 1,811,031,555 | | | $ | 286,397,136 | | | $ | 96,757,067 | | | $ | 723,623,646 | |
| | | | |
Shares outstanding1 | | | 3,843,052 | | | | 35,243,339 | | | | 8,790,161 | | | | 4,611,051 | | | | 18,856,479 | |
| | | | |
Net asset value | | $ | 15.09 | | | $ | 51.39 | | | $ | 32.58 | | | $ | 20.98 | | | $ | 38.38 | |
| | | | |
Service | | | | | | | | | | | | | | | | | | | | |
Net assets | | | — | | | $ | 29,751,099 | | | $ | 9,792,874 | | | $ | 2,330,705 | | | $ | 21,696,144 | |
| | | | |
Shares outstanding1 | | | — | | | | 603,246 | | | | 314,279 | | | | 116,392 | | | | 600,614 | |
| | | | |
Net asset value | | | — | | | $ | 49.32 | | | $ | 31.16 | | | $ | 20.02 | | | $ | 36.12 | |
| | | | |
Investor A | | | | | | | | | | | | | | | | | | | | |
Net assets | | $ | 147,565,793 | | | $ | 2,362,920,870 | | | $ | 335,881,070 | | | $ | 189,892,784 | | | $ | 326,652,882 | |
| | | | |
Shares outstanding1 | | | 9,864,969 | | | | 48,085,728 | | | | 10,929,767 | | | | 9,676,463 | | | | 9,366,431 | |
| | | | |
Net asset value | | $ | 14.96 | | | $ | 49.14 | | | $ | 30.73 | | | $ | 19.62 | | | $ | 34.87 | |
| | | | |
Investor B | | | | | | | | | | | | | | | | | | | | |
Net assets | | | — | | | $ | 2,686,887 | | | $ | 302,395 | | | | — | | | $ | 1,775,784 | |
| | | | |
Shares outstanding1 | | | — | | | | 59,885 | | | | 10,584 | | | | — | | | | 63,328 | |
| | | | |
Net asset value | | | — | | | $ | 44.87 | | | $ | 28.57 | | | | — | | | $ | 28.04 | |
| | | | |
Investor C | | | | | | | | | | | | | | | | | | | | |
Net assets | | $ | 40,670,247 | | | $ | 1,005,118,287 | | | $ | 63,327,228 | | | $ | 69,263,851 | | | $ | 157,602,143 | |
| | | | |
Shares outstanding1 | | | 2,816,565 | | | | 22,969,537 | | | | 2,293,009 | | | | 4,064,629 | | | | 5,619,389 | |
| | | | |
Net asset value | | $ | 14.44 | | | $ | 43.76 | | | $ | 27.62 | | | $ | 17.04 | | | $ | 28.05 | |
| | | | |
Class K | | | | | | | | | | | | | | | | | | | | |
Net assets | | | — | | | $ | 3,582,251 | | | | — | | | | — | | | | — | |
| | | | |
Shares outstanding1 | | | — | | | | 69,647 | | | | — | | | | — | | | | — | |
| | | | |
Net asset value | | | — | | | $ | 51.43 | | | | — | | | | — | | | | — | |
| | | | |
Class R | | | | | | | | | | | | | | | | | | | | |
Net assets | | $ | 7,937,665 | | | $ | 174,943,826 | | | | — | | | $ | 8,050,250 | | | | — | |
| | | | |
Shares outstanding1 | | | 532,120 | | | | 3,619,997 | | | | — | | | | 405,397 | | | | — | |
| | | | |
Net asset value | | $ | 14.92 | | | $ | 48.33 | | | | — | | | $ | 19.86 | | | | — | |
| | | | |
| | 1 | | Unlimited number of shares authorized, $0.001 par value. |
See Notes to Financial Statements.
| | | | | | |
| 48 | | BLACKROCK FUNDS | | MARCH 31, 2017 | | |
| | | | | | | | | | | | | | | | | | | | |
| Six Months Ended March 31, 2017 (Unaudited) | | BlackRock
Global
Opportunities
Portfolio | | | BlackRock
Health
Sciences
Opportunities
Portfolio | | | BlackRock
International
Opportunities
Portfolio | | | BlackRock
Science &
Technology
Opportunities
Portfolio | | | BlackRock
U.S.
Opportunities
Portfolio | |
| | | | | | | | | | | | | | | | | | | | |
| Investment Income | | | | | | | | | | | | | | | | | | | | |
Dividends — unaffiliated | | $ | 2,257,883 | | | $ | 30,286,597 | | | $ | 7,622,710 | | | $ | 930,588 | | | $ | 2,087,419 | |
Dividends — affiliated | | | 2,149 | | | | 181,136 | | | | 13,999 | | | | 5,576 | | | | 24,660 | |
Interest — unaffiliated | | | 379 | | | | — | | | | — | | | | 11 | | | | 4 | |
Securities lending — affiliated — net | | | 2,174 | | | | 224,800 | | | | 1,637 | | | | 52,958 | | | | 141,757 | |
Foreign taxes withheld | | | (95,431 | ) | | | (110,235 | ) | | | (519,868 | ) | | | (27,564 | ) | | | (7,454 | ) |
| | | | |
Total income | | | 2,167,154 | | | | 30,582,298 | | | | 7,118,478 | | | | 961,569 | | | | 2,246,386 | |
| | | | |
| | | | | | | | | | | | | | | | | | | | |
| Expenses | | | | | | | | | | | | | | | | | | | | |
Investment advisory | | | 1,127,766 | | | | 17,854,598 | | | | 3,669,836 | | | | 1,499,838 | | | | 5,748,672 | |
Service and distribution — class specific | | | 410,605 | | | | 8,662,960 | | | | 804,424 | | | | 555,556 | | | | 1,293,596 | |
Transfer agent — class specific | | | 181,342 | | | | 3,471,331 | | | | 579,499 | | | | 339,384 | | | | 942,257 | |
Administration | | | 53,255 | | | | 942,593 | | | | 153,027 | | | | 70,826 | | | | 247,838 | |
Administration — class specific | | | 25,089 | | | | 522,976 | | | | 73,513 | | | | 33,335 | | | | 122,340 | |
Accounting services | | | 34,052 | | | | 544,107 | | | | 93,512 | | | | 44,386 | | | | 110,811 | |
Professional | | | 46,762 | | | | 83,529 | | | | 46,347 | | | | 40,819 | | | | 42,120 | |
Registration | | | 31,979 | | | | 109,180 | | | | 38,207 | | | | 39,059 | | | | 41,260 | |
Custodian | | | 23,514 | | | | 105,970 | | | | 49,427 | | | | 18,839 | | | | 29,841 | |
Printing | | | 13,792 | | | | 89,405 | | | | 31,339 | | | | 13,812 | | | | 35,509 | |
Offering | | | — | | | | 29,234 | | | | — | | | | — | | | | — | |
Officer and Trustees | | | 8,293 | | | | 77,997 | | | | 15,015 | | | | 9,116 | | | | 21,550 | |
Miscellaneous | | | 18,511 | | | | 51,782 | | | | 24,192 | | | | 20,008 | | | | 37,185 | |
Recoupment of past waived and/or reimbursed fees — class specific | | | 38 | | | | — | | | | 296 | | | | 9,348 | | | | 60 | |
| | | | |
Total expenses | | | 1,974,998 | | | | 32,545,662 | | | | 5,578,634 | | | | 2,694,326 | | | | 8,673,039 | |
Less: | | | | | | | | | | | | | | | | | | | | |
Fees waived by the Manager | | | (31,649 | ) | | | (38,461 | ) | | | (369,878 | ) | | | (1,090 | ) | | | (143,278 | ) |
Administration fees waived — class specific | | | (24,922 | ) | | | — | | | | (71,872 | ) | | | (5,818 | ) | | | (122,297 | ) |
Transfer agent fees waived — class specific | | | (4,816 | ) | | | — | | | | (9,527 | ) | | | (724 | ) | | | (11,803 | ) |
Transfer agent fees reimbursed — class specific | | | (137,795 | ) | | | — | | | | (265,030 | ) | | | (432 | ) | | | (806,245 | ) |
| | | | |
Total expenses | | | 1,775,816 | | | | 32,507,201 | | | | 4,862,327 | | | | 2,686,262 | | | | 7,589,416 | |
| | | | |
Net investment income (loss) | | | 391,338 | | | | (1,924,903 | ) | | | 2,256,151 | | | | (1,724,693 | ) | | | (5,343,030 | ) |
| | | | |
| | | | | | | | | | | | | | | | | | | | |
| Realized and Unrealized Gain (Loss) | | | | | | | | | | | | | | | | | | | | |
Net realized gain (loss) from: | | | | | | | | | | | | | | | | | | | | |
Investments — unaffiliated | | | 13,666,377 | | | | 62,375,792 | | | | 7,602,732 | | | | 10,769,822 | | | | 118,784,283 | |
Investments — affiliated | | | — | | | | 2,571 | | | | 1,923 | | | | 270 | | | | 586 | |
Capital gain distributions received from affiliated investment companies | | | 20 | | | | 526 | | | | 6 | | | | 9 | | | | 47 | |
Options written | | | 30,281 | | | | — | | | | 46,271 | | | | (533,104 | ) | | | — | |
Forward foreign currency exchange contracts | | | (252,159 | ) | | | 1,535,695 | | | | (1,956,966 | ) | | | (530,662 | ) | | | — | |
Foreign currency transactions | | | (36,219 | ) | | | (23,383 | ) | | | (484,739 | ) | | | 4,833 | | | | 810 | |
| | | | |
| | | 13,408,300 | | | | 63,891,201 | | | | 5,209,227 | | | | 9,711,168 | | | | 118,785,726 | |
| | | | |
Net change in unrealized appreciation (depreciation) on: | | | | | | | | | | | | | | | | | | | | |
Investments — unaffiliated1 | | | 412,479 | | | | 145,204,373 | | | | (4,176,030 | ) | | | 26,051,472 | | | | (19,306,063 | ) |
Investments — affiliated | | | (8 | ) | | | (596,005 | ) | | | — | | | | 18 | | | | (5,803,377 | ) |
Options written | | | 32,883 | | | | — | | | | 53,691 | | | | (74,052 | ) | | | — | |
Forward foreign currency exchange contracts | | | 343,227 | | | | 377,817 | | | | 2,714,339 | | | | 342,694 | | | | — | |
Foreign currency translations | | | 202 | | | | 25,250 | | | | (33,823 | ) | | | 26,950 | | | | — | |
| | | | |
| | | 788,783 | | | | 145,011,435 | | | | (1,441,823 | ) | | | 26,347,082 | | | | (25,109,440 | ) |
| | | | |
Net realized and unrealized gain | | | 14,197,083 | | | | 208,902,636 | | | | 3,767,404 | | | | 36,058,250 | | | | 93,676,286 | |
| | | | |
Net Increase in Net Assets Resulting from Operations | | $ | 14,588,421 | | | $ | 206,977,733 | | | $ | 6,023,555 | | | $ | 34,333,557 | | | $ | 88,333,256 | |
| | | | |
| 1 | | Net of ($17,884) foreign capital gain tax for BlackRock Global Opportunities Portfolio |
See Notes to Financial Statements.
| | | | | | |
| | | BLACKROCK FUNDS | | MARCH 31, 2017 | | 49 |
| | | | |
| Statements of Changes in Net Assets | | | | |
| | | | | | | | | | | | | | | | |
| | | BlackRock
Global Opportunities
Portfolio | | | BlackRock
Health Sciences
Opportunities
Portfolio | |
| Increase (Decrease) in Net Assets: | | Six Months
Ended
March 31, 2017
(Unaudited) | | | Year Ended
September 30,
2016 | | | Six Months
Ended March 31, 2017 (Unaudited) | | | Year Ended
September 30,
2016 | |
| | | | | | | | | | | | | | | | |
| Operations | | | | | | | | | | | | | | | | |
Net investment income (loss) | | $ | 391,338 | | | $ | 961,272 | | | $ | (1,924,903 | ) | | $ | (6,361,958 | ) |
Net realized gain (loss) | | | 13,408,300 | | | | (187,924 | ) | | | 63,891,201 | | | | 194,132,675 | |
Net change in unrealized appreciation (depreciation) | | | 788,783 | | | | 19,875,191 | | | | 145,011,435 | | | | 211,536,058 | |
| | | | | | | | |
Net increase in net assets resulting from operations | | | 14,588,421 | | | | 20,648,539 | | | | 206,977,733 | | | | 399,306,775 | |
| | | | | | | | |
| | | | | | | | | | | | | | | | |
| Distributions to Shareholders1 | | | | | | | | | | | | | | | | |
From net investment income: | | | | | | | | | | | | | | | | |
Institutional | | | (1,054,891 | ) | | | (619,605 | ) | | | — | | | | (22,298,254 | ) |
Service | | | — | | | | — | | | | — | | | | (478,881 | ) |
Investor A | | | (2,580,871 | ) | | | (899,321 | ) | | | — | | | | (37,514,609 | ) |
Investor B | | | — | | | | — | | | | — | | | | (29,351 | ) |
Investor C | | | (407,243 | ) | | | (16,130 | ) | | | — | | | | (11,253,614 | ) |
Class R | | | (106,996 | ) | | | (2,834 | ) | | | — | | | | (1,841,924 | ) |
From net realized gain: | | | | | | | | | | | | | | | | |
Institutional | | | — | | | | — | | | | (33,661,485 | ) | | | (156,511,804 | ) |
Service | | | — | | | | — | | | | (712,180 | ) | | | (3,892,637 | ) |
Investor A | | | — | | | | — | | | | (57,658,830 | ) | | | (304,226,033 | ) |
Investor B | | | — | | | | — | | | | (108,850 | ) | | | (1,169,065 | ) |
Investor C | | | — | | | | — | | | | (26,756,248 | ) | | | (138,472,716 | ) |
Class K | | | — | | | | — | | | | (52,299 | ) | | | — | |
Class R | | | — | | | | — | | | | (3,876,937 | ) | | | (16,680,004 | ) |
| | | | | | | | |
Decrease in net assets resulting from distributions to shareholders | | | (4,150,001 | ) | | | (1,537,890 | ) | | | (122,826,829 | ) | | | (694,368,892 | ) |
| | | | | | | | |
| | | | | | | | | | | | | | | | |
| Capital Share Transactions | | | | | | | | | | | | | | | | |
Net increase (decrease) in net assets derived from capital share transactions | | | (14,197,723 | ) | | | (33,305,733 | ) | | | (283,529,356 | ) | | | 183,180,276 | |
| | | | | | | | |
| | | | | | | | | | | | | | | | |
| Net Assets | | | | | | | | | | | | | | | | |
Total decrease in net assets | | | (3,759,303 | ) | | | (14,195,084 | ) | | | (199,378,452 | ) | | | (111,881,841 | ) |
Beginning of period | | | 257,937,467 | | | | 272,132,551 | | | | 5,589,413,227 | | | | 5,701,295,068 | |
| | | | | | | | |
End of period | | $ | 254,178,164 | | | $ | 257,937,467 | | | $ | 5,390,034,775 | | | $ | 5,589,413,227 | |
| | | | | | | | |
Undistributed (distributions in excess of) net investment income (loss), end of period | | $ | (1,909,901 | ) | | $ | 1,848,762 | | | $ | (2,715,157 | ) | | $ | (790,254 | ) |
| | | | | | | | |
| 1 | Distributions for annual periods determined in accordance with U.S. federal income tax regulations. |
See Notes to Financial Statements.
| | | | | | |
| 50 | | BLACKROCK FUNDS | | MARCH 31, 2017 | | |
| | | | |
| Statements of Changes in Net Assets (concluded) | | | | |
| | | | | | | | | | | | | | | | | | | | | | | | |
| | | BlackRock
International
Opportunities
Portfolio | | | BlackRock
Science &
Technology
Opportunities
Portfolio | | | BlackRock
U.S. Opportunities
Portfolio | |
| Increase (Decrease) in Net Assets: | | Six Months
Ended
March 31, 2017
(Unaudited) | | | Year Ended
September 30,
2016 | | | Six Months
Ended
March 31, 2017
(Unaudited) | | | Year Ended
September 30,
2016 | | | Six Months
Ended March 31, 2017 (Unaudited) | | | Year Ended
September 30,
2016 | |
| | | | | | | | | | | | | | | | | | | | | | | | |
| Operations | | | | | | | | | | | | | | | | | | | | | | | | |
Net investment income (loss) | | $ | 2,256,151 | | | $ | 7,664,088 | | | $ | (1,724,693 | ) | | $ | (2,545,994 | ) | | $ | (5,343,030 | ) | | $ | 5,069,479 | |
Net realized gain (loss) | | | 5,209,227 | | | | 16,357,683 | | | | 9,711,168 | | | | 8,027,532 | | | | 118,785,726 | | | | 86,456,826 | |
Net change in unrealized appreciation (depreciation) | | | (1,441,823 | ) | | | 38,313,387 | | | | 26,347,082 | | | | 51,974,406 | | | | (25,109,440 | ) | | | 7,884,409 | |
| | | | | | | | | | | | |
Net increase (decrease) in net assets resulting from operations | | | 6,023,555 | | | | 62,335,158 | | | | 34,333,557 | | | | 57,455,944 | | | | 88,333,256 | | | | 99,410,714 | |
| | | | | | | | | | | | |
| | | | | | | | | | | | | | | | | | | | | | | | |
| Distributions to Shareholders1 | | | | | | | | | | | | | | | | | | | | | | | | |
From net investment income: | | | | | | | | | | | | | | | | | | | | | | | | |
Institutional | | | (13,567,444 | ) | | | (830,904 | ) | | | — | | | | — | | | | (4,121,145 | ) | | | — | |
Service | | | (458,746 | ) | | | — | | | | — | | | | — | | | | (28,155 | ) | | | — | |
Investor A | | | (15,878,274 | ) | | | — | | | | — | | | | — | | | | (643,713 | ) | | | — | |
Investor B | | | (7,012 | ) | | | — | | | | — | | | | — | | | | — | | | | — | |
Investor C | | | (2,588,535 | ) | | | — | | | | — | | | | — | | | | — | | | | — | |
From net realized gain: | | | | | | | | | | | | | | | | | | | | | | | | |
Institutional | | | — | | | | — | | | | (844,835 | ) | | | — | | | | (35,192,157 | ) | | | (58,975,801 | ) |
Service | | | — | | | | — | | | | (25,487 | ) | | | — | | | | (1,287,453 | ) | | | (2,251,232 | ) |
Investor A | | | — | | | | — | | | | (2,022,529 | ) | | | — | | | | (20,897,013 | ) | | | (33,477,630 | ) |
Investor B | | | — | | | | — | | | | — | | | | — | | | | (219,183 | ) | | | (648,243 | ) |
Investor C | | | — | | | | — | | | | (804,376 | ) | | | — | | | | (11,456,443 | ) | | | (19,472,522 | ) |
Class R | | | — | | | | — | | | | (70,281 | ) | | | — | | | | — | | | | — | |
| | | | | | | | | | | | |
Decrease in net assets resulting from distributions to shareholders | | | (32,500,011 | ) | | | (830,904 | ) | | | (3,767,508 | ) | | | — | | | | (73,845,262 | ) | | | (114,825,428 | ) |
| | | | | | | | | | | | |
| | | | | | | | | | | | | | | | | | | | | | | | |
| Capital Share Transactions | | | | | | | | | | | | | | | | | | | | | | | | |
Net increase (decrease) in net assets derived from capital share transactions | | | (72,278,020 | ) | | | (224,401,652 | ) | | | 11,548,235 | | | | 19,892,326 | | | | (48,804,914 | ) | | | (124,502,959 | ) |
| | | | | | | | | | | | |
| | | | | | | | | | | | | | | | | | | | | | | | |
| Net Assets | | | | | | | | | | | | | | | | | | | | | | | | |
Total increase (decrease) in net assets | | | (98,754,476 | ) | | | (162,897,398 | ) | | | 42,114,284 | | | | 77,348,270 | | | | (34,316,920 | ) | | | (139,917,673 | ) |
Beginning of period | | | 794,455,179 | | | | 957,352,577 | | | | 324,180,373 | | | | 246,832,103 | | | | 1,265,667,519 | | | | 1,405,585,192 | |
| | | | | | | | | | | | |
End of period | | $ | 695,700,703 | | | $ | 794,455,179 | | | $ | 366,294,657 | | | $ | 324,180,373 | | | $ | 1,231,350,599 | | | $ | 1,265,667,519 | |
| | | | | | | | | | | | |
Undistributed (distributions in excess of) net investment income (loss), end of period | | $ | (3,726,762 | ) | | $ | 26,517,098 | | | $ | (3,223,621 | ) | | $ | (1,498,928 | ) | | $ | (5,610,273 | ) | | $ | 4,525,770 | |
| | | | | | | | | | | | |
| 1 | Distributions for annual periods determined in accordance with U.S. federal income tax regulations. |
See Notes to Financial Statements.
| | | | | | |
| | | BLACKROCK FUNDS | | MARCH 31, 2017 | | 51 |
| | | | |
| Financial Highlights | | | BlackRock Global Opportunities Portfolio | |
| | | | | | | | | | | | | | | | | | | | | | | | |
| | | Institutional | |
| | | Six Months Ended March 31, 2017 (Unaudited) | | | Year Ended September 30, | |
| | | | 2016 | | | 2015 | | | 2014 | | | 2013 | | | 2012 | |
| | | | | | | | | | | | | | | | | | | | | | | | |
| Per Share Operating Performance | | | | | | | | | | | | | | | | | | | | | | | | |
Net asset value, beginning of period | | $ | 14.50 | | | $ | 13.34 | | | $ | 14.19 | | | $ | 13.42 | | | $ | 11.11 | | | $ | 9.32 | |
| | | | |
Net investment income1 | | | 0.05 | | | | 0.09 | | | | 0.09 | | | | 0.12 | | | | 0.10 | | | | 0.14 | |
Net realized and unrealized gain (loss) | | | 0.83 | | | | 1.18 | | | | (0.69 | ) | | | 0.65 | | | | 2.36 | | | | 1.67 | |
| | | | |
Net increase (decrease) from investment operations | | | 0.88 | | | | 1.27 | | | | (0.60 | ) | | | 0.77 | | | | 2.46 | | | | 1.81 | |
| | | | |
Distributions from net investment income2 | | | (0.29 | ) | | | (0.11 | ) | | | (0.25 | ) | | | — | | | | (0.15 | ) | | | (0.02 | ) |
| | | | |
Net asset value, end of period | | $ | 15.09 | | | $ | 14.50 | | | $ | 13.34 | | | $ | 14.19 | | | $ | 13.42 | | | $ | 11.11 | |
| | | | |
| | | | | | | | | | | | | | | | | | | | | | | | |
| Total Return3 | | | | | | | | | | | | | | | | | | | | | | | | |
Based on net asset value | | | 6.17 | %4 | | | 9.60 | % | | | (4.28 | )% | | | 5.74 | % | | | 22.40 | % | | | 19.45 | % |
| | | | |
| | | | | | | | | | | | | | | | | | | | | | | | |
| Ratios to Average Net Assets | | | | | | | | | | | | | | | | | | | | | | | | |
Total expenses | | | 1.22 | %5 | | | 1.21 | % | | | 1.21 | % | | | 1.20 | % | | | 1.22 | % | | | 1.25 | % |
| | | | |
Total expenses after fees waived and/or reimbursed and paid indirectly | | | 1.06 | %5 | | | 1.06 | % | | | 1.06 | % | | | 1.06 | % | | | 1.06 | % | | | 1.06 | % |
| | | | |
Net investment income | | | 0.64 | %5 | | | 0.68 | % | | | 0.62 | % | | | 0.82 | % | | | 0.83 | % | | | 1.35 | % |
| | | | |
| | | | | | | | | | | | | | | | | | | | | | | | |
| Supplemental Data | | | | | | | | | | | | | | | | | | | | | | | | |
Net assets, end of period (000) | | $ | 58,004 | | | $ | 52,490 | | | $ | 57,826 | | | $ | 61,601 | | | $ | 63,182 | | | $ | 54,448 | |
| | | | |
Portfolio turnover rate | | | 48 | % | | | 67 | % | | | 64 | % | | | 99 | % | | | 149 | % | | | 122 | % |
| | | | |
| | 1 | | Based on average shares outstanding. |
| | 2 | | Distributions for annual periods determined in accordance with U.S. federal income tax regulations. |
| | 3 | | Where applicable, assumes the reinvestment of distributions. |
| | 4 | | Aggregate total return. |
See Notes to Financial Statements.
| | | | | | |
| 52 | | BLACKROCK FUNDS | | MARCH 31, 2017 | | |
| | | | |
| Financial Highlights (continued) | | | BlackRock Global Opportunities Portfolio | |
| | | | | | | | | | | | | | | | | | | | | | | | |
| | | Investor A | |
| | | Six Months Ended March 31, 2017 (Unaudited) | | | Year Ended September 30, | |
| | | | 2016 | | | 2015 | | | 2014 | | | 2013 | | | 2012 | |
| | | | | | | | | | | | | | | | | | | | | | | | |
| Per Share Operating Performance | | | | | | | | | | | | | | | | | | | | | | | | |
Net asset value, beginning of period | | $ | 14.35 | | | $ | 13.20 | | | $ | 14.04 | | | $ | 13.32 | | | $ | 11.02 | | | $ | 9.26 | |
| | | | |
Net investment income1 | | | 0.03 | | | | 0.06 | | | | 0.05 | | | | 0.08 | | | | 0.07 | | | | 0.11 | |
Net realized and unrealized gain (loss) | | | 0.83 | | | | 1.16 | | | | (0.68 | ) | | | 0.64 | | | | 2.35 | | | | 1.66 | |
| | | | |
Net increase (decrease) from investment operations | | | 0.86 | | | | 1.22 | | | | (0.63 | ) | | | 0.72 | | | | 2.42 | | | | 1.77 | |
| | | | |
Distributions from net investment income2 | | | (0.25 | ) | | | (0.07 | ) | | | (0.21 | ) | | | — | | | | (0.12 | ) | | | (0.01 | ) |
| | | | |
Net asset value, end of period | | $ | 14.96 | | | $ | 14.35 | | | $ | 13.20 | | | $ | 14.04 | | | $ | 13.32 | | | $ | 11.02 | |
| | | | |
| | | | | | | | | | | | | | | | | | | | | | | | |
| Total Return3 | | | | | | | | | | | | | | | | | | | | | | | | |
Based on net asset value | | | 6.08 | %4 | | | 9.30 | % | | | (4.55 | )% | | | 5.41 | % | | | 22.14 | % | | | 19.16 | % |
| | | | |
| | | | | | | | | | | | | | | | | | | | | | | | |
| Ratios to Average Net Assets | | | | | | | | | | | | | | | | | | | | | | | | |
Total expenses | | | 1.50 | %5 | | | 1.49 | % | | | 1.48 | % | | | 1.46 | % | | | 1.48 | % | | | 1.52 | % |
| | | | |
Total expenses after fees waived and/or reimbursed and paid indirectly | | | 1.33 | %5 | | | 1.33 | % | | | 1.33 | % | | | 1.33 | % | | | 1.33 | % | | | 1.33 | % |
| | | | |
Net investment income | | | 0.40 | %5 | | | 0.46 | % | | | 0.35 | % | | | 0.56 | % | | | 0.56 | % | | | 1.06 | % |
| | | | |
| | | | | | | | | | | | | | | | | | | | | | | | |
| Supplemental Data | | | | | | | | | | | | | | | | | | | | | | | | |
Net assets, end of period (000) | | $ | 147,566 | | | $ | 153,886 | | | $ | 163,932 | | | $ | 191,653 | | | $ | 202,343 | | | $ | 195,961 | |
| | | | |
Portfolio turnover rate | | | 48 | % | | | 67 | % | | | 64 | % | | | 99 | % | | | 149 | % | | | 122 | % |
| | | | |
| | 1 | | Based on average shares outstanding. |
| | 2 | | Distributions for annual periods determined in accordance with U.S. federal income tax regulations. |
| | 3 | | Where applicable, excludes the effects of any sales charges and assumes the reinvestment of distributions. |
| | 4 | | Aggregate total return. |
See Notes to Financial Statements.
| | | | | | |
| | | BLACKROCK FUNDS | | MARCH 31, 2017 | | 53 |
| | | | |
| Financial Highlights (continued) | | | BlackRock Global Opportunities Portfolio | |
| | | | | | | | | | | | | | | | | | | | | | | | |
| | | Investor C | |
| | | Six Months
Ended
March 31,
2017 (Unaudited) | | | Year Ended September 30, | |
| | | | 2016 | | | 2015 | | | 2014 | | | 2013 | | | 2012 | |
| | | | | | | | | | | | | | | | | | | | | | | | |
| Per Share Operating Performance | | | | | | | | | | | | | | | | | | | | | | | | |
Net asset value, beginning of period | | $ | 13.81 | | | $ | 12.74 | | | $ | 13.54 | | | $ | 12.94 | | | $ | 10.71 | | | $ | 9.06 | |
| | | | |
Net investment income (loss)1 | | | (0.03 | ) | | | (0.05 | ) | | | (0.06 | ) | | | (0.03 | ) | | | (0.03 | ) | | | 0.03 | |
Net realized and unrealized gain (loss) | | | 0.79 | | | | 1.12 | | | | (0.66 | ) | | | 0.63 | | | | 2.28 | | | | 1.62 | |
| | | | |
Net increase (decrease) from investment operations | | | 0.76 | | | | 1.07 | | | | (0.72 | ) | | | 0.60 | | | | 2.25 | | | | 1.65 | |
| | | | |
Distributions from net investment income2 | | | (0.13 | ) | | | (0.00 | )3 | | | (0.08 | ) | | | — | | | | (0.02 | ) | | | — | |
| | | | |
Net asset value, end of period | | $ | 14.44 | | | $ | 13.81 | | | $ | 12.74 | | | $ | 13.54 | | | $ | 12.94 | | | $ | 10.71 | |
| | | | |
| | | | | | | | | | | | | | | | | | | | | | | | |
| Total Return4 | | | | | | | | | | | | | | | | | | | | | | | | |
Based on net asset value | | | 5.58 | %5 | | | 8.44 | % | | | (5.32 | )% | | | 4.64 | % | | | 21.07 | % | | | 18.21 | % |
| | | | |
| | | | | | | | | | | | | | | | | | | | | | | | |
| Ratios to Average Net Assets | | | | | | | | | | | | | | | | | | | | | | | | |
Total expenses | | | 2.27 | %6,7 | | | 2.27 | %6 | | | 2.27 | % | | | 2.24 | % | | | 2.28 | % | | | 2.32 | % |
| | | | |
Total expenses after fees waived and/or reimbursed and paid indirectly | | | 2.14 | %7 | | | 2.14 | % | | | 2.14 | % | | | 2.14 | % | | | 2.14 | % | | | 2.14 | % |
| | | | |
Net investment income (loss) | | | (0.40 | )%7 | | | (0.35 | )% | | | (0.47 | )% | | | (0.25 | )% | | | (0.25 | )% | | | 0.26 | % |
| | | | |
| | | | | | | | | | | | | | | | | | | | | | | | |
| Supplemental Data | | | | | | | | | | | | | | | | | | | | | | | | |
Net assets, end of period (000) | | $ | 40,670 | | | $ | 43,218 | | | $ | 42,066 | | | $ | 51,845 | | | $ | 55,494 | | | $ | 54,332 | |
| | | | |
Portfolio turnover rate | | | 48 | % | | | 67 | % | | | 64 | % | | | 99 | % | | | 149 | % | | | 122 | % |
| | | | |
| | 1 | | Based on average shares outstanding. |
| | 2 | | Distributions for annual periods determined in accordance with U.S. federal income tax regulations. |
| | 3 | | Amount is greater than $(0.005) per share. |
| | 4 | | Where applicable, excludes the effects of any sales charges and assumes the reinvestment of distributions. |
| | 5 | | Aggregate total return. |
| | 6 | | Includes recoupment of past waived and/or reimbursed fees with no financial impact to the expense ratio. |
See Notes to Financial Statements.
| | | | | | |
| 54 | | BLACKROCK FUNDS | | MARCH 31, 2017 | | |
| | | | |
| Financial Highlights (concluded) | | | BlackRock Global Opportunities Portfolio | |
| | | | | | | | | | | | | | | | | | | | | | | | |
| | | Class R | |
| | | Six Months
Ended
March 31,
2017 (Unaudited) | | | Year Ended September 30, | |
| | | | 2016 | | | 2015 | | | 2014 | | | 2013 | | | 2012 | |
| | | | | | | | | | | | | | | | | | | | | | | | |
| Per Share Operating Performance | | | | | | | | | | | | | | | | | | | | | | | | |
Net asset value, beginning of period | | $ | 14.29 | | | $ | 13.12 | | | $ | 13.94 | | | $ | 13.28 | | | $ | 10.99 | | | $ | 9.26 | |
| | | | |
Net investment income (loss)1 | | | 0.00 | 2 | | | 0.01 | | | | (0.01 | ) | | | 0.02 | | | | 0.02 | | | | 0.08 | |
Net realized and unrealized gain (loss) | | | 0.82 | | | | 1.16 | | | | (0.68 | ) | | | 0.64 | | | | 2.35 | | | | 1.65 | |
| | | | |
Net increase (decrease) from investment operations | | | 0.82 | | | | 1.17 | | | | (0.69 | ) | | | 0.66 | | | | 2.37 | | | | 1.73 | |
| | | | |
Distributions from net investment income3 | | | (0.19 | ) | | | (0.00 | )4 | | | (0.13 | ) | | | — | | | | (0.08 | ) | | | (0.00 | )4 |
| | | | |
Net asset value, end of period | | $ | 14.92 | | | $ | 14.29 | | | $ | 13.12 | | | $ | 13.94 | | | $ | 13.28 | | | $ | 10.99 | |
| | | | |
| | | | | | | | | | | | | | | | | | | | | | | | |
| Total Return5 | | | | | | | | | | | | | | | | | | | | | | | | |
Based on net asset value | | | 5.84 | %6 | | | 8.96 | % | | | (4.95 | )% | | | 4.97 | % | | | 21.71 | % | | | 18.72 | % |
| | | | |
| | | | | | | | | | | | | | | | | | | | | | | | |
| Ratios to Average Net Assets | | | | | | | | | | | | | | | | | | | | | | | | |
Total expenses | | | 1.82 | %7,8 | | | 1.83 | %7 | | | 1.81 | %7 | | | 1.81 | %7 | | | 1.81 | %9 | | | 1.80 | %9 |
| | | | |
Total expenses after fees waived and/or reimbursed and paid indirectly | | | 1.72 | %8 | | | 1.72 | % | | | 1.72 | % | | | 1.72 | % | | | 1.72 | % | | | 1.65 | % |
| | | | |
Net investment income (loss) | | | 0.02 | %8 | | | 0.08 | % | | | (0.07 | )% | | | 0.17 | % | | | 0.18 | % | | | 0.74 | % |
| | | | |
| | | | | | | | | | | | | | | | | | | | | | | | |
| Supplemental Data | | | | | | | | | | | | | | | | | | | | | | | | |
Net assets, end of period (000) | | $ | 7,938 | | | $ | 8,343 | | | $ | 8,308 | | | $ | 12,483 | | | $ | 14,371 | | | $ | 14,704 | |
| | | | |
Portfolio turnover rate | | | 48 | % | | | 67 | % | | | 64 | % | | | 99 | % | | | 149 | % | | | 122 | % |
| | | | |
| | 1 | | Based on average shares outstanding. |
| | 2 | | Amount is less than $0.005 per share. |
| | 3 | | Distributions for annual periods determined in accordance with U.S. federal income tax regulations. |
| | 4 | | Amount is greater than $(0.005) per share. |
| | 5 | | Where applicable, assumes the reinvestment of distributions. |
| | 6 | | Aggregate total return. |
| | 7 | | Includes recoupment of past waived and/or reimbursed fees with no financial impact to the expense ratio. |
| | 9 | | Includes recoupment of past waived and/or reimbursed fees. Excluding the recoupment of past waived and/or reimbursed fees for the years ended September 30, 2013 and September 30, 2012, the ratio would have been 1.80% and 1.79%, respectively. |
See Notes to Financial Statements.
| | | | | | |
| | | BLACKROCK FUNDS | | MARCH 31, 2017 | | 55 |
| | | | |
| Financial Highlights | | | BlackRock Health Sciences Opportunities Portfolio | |
| | | | | | | | | | | | | | | | | | | | | | | | |
| | | Institutional | |
| | | Six Months
Ended
March 31,
2017 (Unaudited) | | | Year Ended September 30, | |
| | | | 2016 | | | 2015 | | | 2014 | | | 2013 | | | 2012 | |
| | | | | | | | | | | | | | | | | | | | | | | | |
| Per Share Operating Performance | | | | | | | | | | | | | | | | | | | | | | | | |
Net asset value, beginning of period | | $ | 50.30 | | | $ | 52.51 | | | $ | 50.07 | | | $ | 43.24 | | | $ | 34.62 | | | $ | 28.77 | |
| | | | |
Net investment income1 | | | 0.07 | | | | 0.13 | | | | 0.05 | | | | 0.09 | | | | 0.20 | | | | 0.15 | |
Net realized and unrealized gain | | | 2.10 | | | | 3.87 | | | | 5.96 | | | | 10.94 | | | | 10.82 | | | | 7.26 | |
| | | | |
Net increase from investment operations | | | 2.17 | | | | 4.00 | | | | 6.01 | | | | 11.03 | | | | 11.02 | | | | 7.41 | |
| | | | |
Distributions:2 | | | | | | | | | | | | | | | | | | | | | | | | |
From net investment income | | | — | | | | (0.77 | ) | | | (0.15 | ) | | | (0.15 | ) | | | (0.18 | ) | | | — | |
From net realized gain | | | (1.08 | ) | | | (5.44 | ) | | | (3.42 | ) | | | (4.05 | ) | | | (2.22 | ) | | | (1.56 | ) |
| | | | |
Total distributions | | | (1.08 | ) | | | (6.21 | ) | | | (3.57 | ) | | | (4.20 | ) | | | (2.40 | ) | | | (1.56 | ) |
| | | | |
Net asset value, end of period | | $ | 51.39 | | | $ | 50.30 | | | $ | 52.51 | | | $ | 50.07 | | | $ | 43.24 | | | $ | 34.62 | |
| | | | |
| | | | | | | | | | | | | | | | | | | | | | | | |
| Total Return3 | | | | | | | | | | | | | | | | | | | | | | | | |
Based on net asset value | | | 4.55 | %4 | | | 7.99 | % | | | 12.25 | % | | | 27.74 | % | | | 34.07 | % | | | 27.06 | % |
| | | | |
| | | | | | | | | | | | | | | | | | | | | | | | |
| Ratios to Average Net Assets | | | | | | | | | | | | | | | | | | | | | | | | |
Total expenses | | | 0.90 | %5 | | | 0.90 | %6 | | | 0.88 | % | | | 0.91 | % | | | 0.94 | % | | | 0.98 | % |
| | | | |
Total expenses after fees waived and/or reimbursed and paid indirectly | | | 0.90 | %5 | | | 0.90 | %6 | | | 0.88 | % | | | 0.91 | % | | | 0.94 | % | | | 0.98 | % |
| | | | |
Net investment income | | | 0.29 | %5 | | | 0.25 | %6 | | | 0.09 | % | | | 0.20 | % | | | 0.54 | % | | | 0.47 | % |
| | | | |
| | | | | | | | | | | | | | | | | | | | | | | | |
| Supplemental Data | | | | | | | | | | | | | | | | | | | | | | | | |
Net assets, end of period (000) | | $ | 1,811,032 | | | $ | 1,544,880 | | | $ | 1,513,269 | | | $ | 1,141,938 | | | $ | 748,148 | | | $ | 473,193 | |
| | | | |
Portfolio turnover rate | | | 21 | % | | | 50 | % | | | 50 | % | | | 57 | % | | | 94 | % | | | 135 | % |
| | | | |
| | 1 | | Based on average shares outstanding. |
| | 2 | | Distributions for annual periods determined in accordance with U.S. federal income tax regulations. |
| | 3 | | Where applicable, assumes the reinvestment of distributions. |
| | 4 | | Aggregate total return. |
| | 6 | | Ratios do not include expenses incurred indirectly as a result of investments in underlying funds of approximately 0.01%. |
See Notes to Financial Statements.
| | | | | | |
| 56 | | BLACKROCK FUNDS | | MARCH 31, 2017 | | |
| | | | |
| Financial Highlights (continued) | | | BlackRock Health Sciences Opportunities Portfolio | |
| | | | | | | | | | | | | | | | | | | | | | | | |
| | | Service | |
| | | Six Months
Ended
March 31,
2017 (Unaudited) | | | Year Ended September 30, | |
| | | | 2016 | | | 2015 | | | 2014 | | | 2013 | | | 2012 | |
| | | | | | | | | | | | | | | | | | | | | | | | |
| Per Share Operating Performance | | | | | | | | | | | | | | | | | | | | | | | | |
Net asset value, beginning of period | | $ | 48.39 | | | $ | 50.77 | | | $ | 48.51 | | | $ | 42.02 | | | $ | 33.72 | | | $ | 28.05 | |
| | | | |
Net investment income (loss)1 | | | 0.00 | 2 | | | (0.01 | ) | | | (0.10 | ) | | | (0.04 | ) | | | 0.09 | | | | 0.05 | |
Net realized and unrealized gain | | | 2.01 | | | | 3.74 | | | | 5.79 | | | | 10.61 | | | | 10.53 | | | | 7.10 | |
| | | | |
Net increase from investment operations | | | 2.01 | | | | 3.73 | | | | 5.69 | | | | 10.57 | | | | 10.62 | | | | 7.15 | |
| | | | |
Distributions:3 | | | | | | | | | | | | | | | | | | | | | | | | |
From net investment income | | | — | | | | (0.67 | ) | | | (0.01 | ) | | | (0.03 | ) | | | (0.10 | ) | | | — | |
From net realized gain | | | (1.08 | ) | | | (5.44 | ) | | | (3.42 | ) | | | (4.05 | ) | | | (2.22 | ) | | | (1.48 | ) |
| | | | |
Total distributions | | | (1.08 | ) | | | (6.11 | ) | | | (3.43 | ) | | | (4.08 | ) | | | (2.32 | ) | | | (1.48 | ) |
| | | | |
Net asset value, end of period | | $ | 49.32 | | | $ | 48.39 | | | $ | 50.77 | | | $ | 48.51 | | | $ | 42.02 | | | $ | 33.72 | |
| | | | |
| | | | | | | | | | | | | | | | | | | | | | | | |
| Total Return4 | | | | | | | | | | | | | | | | | | | | | | | | |
Based on net asset value | | | 4.39 | %5 | | | 7.69 | % | | | 11.95 | % | | | 27.36 | % | | | 33.68 | % | | | 26.73 | % |
| | | | |
| | | | | | | | | | | | | | | | | | | | | | | | |
| Ratios to Average Net Assets | | | | | | | | | | | | | | | | | | | | | | | | |
Total expenses | | | 1.17 | %6 | | | 1.17 | %7 | | | 1.16 | % | | | 1.21 | % | | | 1.23 | % | | | 1.28 | % |
| | | | |
Total expenses after fees waived and/or reimbursed and paid indirectly | | | 1.17 | %6 | | | 1.17 | %7 | | | 1.15 | % | | | 1.20 | % | | | 1.23 | % | | | 1.28 | % |
| | | | |
Net investment income (loss) | | | 0.00 | %6,8 | | | (0.03 | )%7 | | | (0.19 | )% | | | (0.08 | )% | | | 0.25 | % | | | 0.18 | % |
| | | | |
| | | | | | | | | | | | | | | | | | | | | | | | |
| Supplemental Data | | | | | | | | | | | | | | | | | | | | | | | | |
Net assets, end of period (000) | | $ | 29,751 | | | $ | 31,917 | | | $ | 35,583 | | | $ | 30,139 | | | $ | 23,035 | | | $ | 14,921 | |
| | | | |
Portfolio turnover rate | | | 21 | % | | | 50 | % | | | 50 | % | | | 57 | % | | | 94 | % | | | 135 | % |
| | | | |
| | 1 | | Based on average shares outstanding. |
| | 2 | | Amount is less than $0.005 per share. |
| | 3 | | Distributions for annual periods determined in accordance with U.S. federal income tax regulations. |
| | 4 | | Where applicable, assumes the reinvestment of distributions. |
| | 5 | | Aggregate total return. |
| | 7 | | Ratios do not include expenses incurred indirectly as a result of investments in underlying funds of approximately 0.01%. |
See Notes to Financial Statements.
| | | | | | |
| | | BLACKROCK FUNDS | | MARCH 31, 2017 | | 57 |
| | | | |
| Financial Highlights (continued) | | | BlackRock Health Sciences Opportunities Portfolio | |
| | | | | | | | | | | | | | | | | | | | | | | | |
| | | Investor A | |
| | | Six Months
Ended
March 31,
2017 (Unaudited) | | | Year Ended September 30, | |
| | | | 2016 | | | 2015 | | | 2014 | | | 2013 | | | 2012 | |
| | | | | | | | | | | | | | | | | | | | | | | | |
| Per Share Operating Performance | | | | | | | | | | | | | | | | | | | | | | | | |
Net asset value, beginning of period | | $ | 48.22 | | | $ | 50.61 | | | $ | 48.38 | | | $ | 41.92 | | | $ | 33.64 | | | $ | 28.00 | |
| | | | |
Net investment income (loss)1 | | | (0.00 | )2 | | | (0.01 | ) | | | (0.10 | ) | | | (0.03 | ) | | | 0.09 | | | | 0.05 | |
Net realized and unrealized gain | | | 2.00 | | | | 3.73 | | | | 5.77 | | | | 10.57 | | | | 10.51 | | | | 7.07 | |
| | | | |
Net increase from investment operations | | | 2.00 | | | | 3.72 | | | | 5.67 | | | | 10.54 | | | | 10.60 | | | | 7.12 | |
| | | | |
Distributions:3 | | | | | | | | | | | | | | | | | | | | | | | | |
From net investment income | | | — | | | | (0.67 | ) | | | (0.02 | ) | | | (0.03 | ) | | | (0.10 | ) | | | — | |
From net realized gain | | | (1.08 | ) | | | (5.44 | ) | | | (3.42 | ) | | | (4.05 | ) | | | (2.22 | ) | | | (1.48 | ) |
| | | | |
Total distributions | | | (1.08 | ) | | | (6.11 | ) | | | (3.44 | ) | | | (4.08 | ) | | | (2.32 | ) | | | (1.48 | ) |
| | | | |
Net asset value, end of period | | $ | 49.14 | | | $ | 48.22 | | | $ | 50.61 | | | $ | 48.38 | | | $ | 41.92 | | | $ | 33.64 | |
| | | | |
| | | | | | | | | | | | | | | | | | | | | | | | |
| Total Return4 | | | | | | | | | | | | | | | | | | | | | | | | |
Based on net asset value | | | 4.39 | %5 | | | 7.70 | % | | | 11.94 | % | | | 27.37 | % | | | 33.73 | % | | | 26.68 | % |
| | | | |
| | | | | | | | | | | | | | | | | | | | | | | | |
| Ratios to Average Net Assets | | | | | | | | | | | | | | | | | | | | | | | | |
Total expenses | | | 1.17 | %6 | | | 1.18 | %7 | | | 1.16 | % | | | 1.19 | % | | | 1.22 | % | | | 1.29 | % |
| | | | |
Total expenses after fees waived and/or reimbursed and paid indirectly | | | 1.17 | %6 | | | 1.18 | %7 | | | 1.15 | % | | | 1.19 | % | | | 1.21 | % | | | 1.28 | % |
| | | | |
Net investment income (loss) | | | (0.01 | )%6 | | | (0.03 | )%7 | | | (0.19 | )% | | | (0.07 | )% | | | 0.26 | % | | | 0.17 | % |
| | | | |
| | | | | | | | | | | | | | | | | | | | | | | | |
| Supplemental Data | | | | | | | | | | | | | | | | | | | | | | | | |
Net assets, end of period (000) | | $ | 2,362,921 | | | $ | 2,701,948 | | | $ | 2,827,428 | | | $ | 2,051,816 | | | $ | 1,641,026 | | | $ | 1,018,429 | |
| | | | |
Portfolio turnover rate | | | 21 | % | | | 50 | % | | | 50 | % | | | 57 | % | | | 94 | % | | | 135 | % |
| | | | |
| | 1 | | Based on average shares outstanding. |
| | 2 | | Amount is greater than $(0.005) per share. |
| | 3 | | Distributions for annual periods determined in accordance with U.S. federal income tax regulations. |
| | 4 | | Where applicable, excludes the effects of any sales charges and assumes the reinvestment of distributions. |
| | 5 | | Aggregate total return. |
| | 7 | | Ratios do not include expenses incurred indirectly as a result of investments in underlying funds of approximately 0.01%. |
See Notes to Financial Statements.
| | | | | | |
| 58 | | BLACKROCK FUNDS | | MARCH 31, 2017 | | |
| | | | |
| Financial Highlights (continued) | | | BlackRock Health Sciences Opportunities Portfolio | |
| | | | | | | | | | | | | | | | | | | | | | | | |
| | | Investor B | |
| | | Six Months
Ended
March 31,
2017 (Unaudited) | | | Year Ended September 30, | |
| | | | 2016 | | | 2015 | | | 2014 | | | 2013 | | | 2012 | |
| | | | | | | | | | | | | | | | | | | | | | | | |
| Per Share Operating Performance | | | | | | | | | | | | | | | | | | | | | | | | |
Net asset value, beginning of period | | $ | 44.33 | | | $ | 46.82 | | | $ | 44.84 | | | $ | 38.99 | | | $ | 31.46 | | | $ | 26.26 | |
| | | | |
Net investment loss1 | | | (0.20 | ) | | | (0.37 | ) | | | (0.48 | ) | | | (0.34 | ) | | | (0.17 | ) | | | (0.17 | ) |
Net realized and unrealized gain | | | 1.82 | | | | 3.46 | | | | 5.37 | | | | 9.83 | | | | 9.79 | | | | 6.63 | |
| | | | |
Net increase from investment operations | | | 1.62 | | | | 3.09 | | | | 4.89 | | | | 9.49 | | | | 9.62 | | | | 6.46 | |
| | | | |
Distributions:2 | | | | | | | | | | | | | | | | | | | | | | | | |
From net investment income | | | — | | | | (0.14 | ) | | | — | | | | — | | | | — | | | | — | |
From net realized gain | | | (1.08 | ) | | | (5.44 | ) | | | (2.91 | ) | | | (3.64 | ) | | | (2.09 | ) | | | (1.26 | ) |
| | | | |
Total distributions | | | (1.08 | ) | | | (5.58 | ) | | | (2.91 | ) | | | (3.64 | ) | | | (2.09 | ) | | | (1.26 | ) |
| | | | |
Net asset value, end of period | | $ | 44.87 | | | $ | 44.33 | | | $ | 46.82 | | | $ | 44.84 | | | $ | 38.99 | | | $ | 31.46 | |
| | | | |
| | | | | | | | | | | | | | | | | | | | | | | | |
| Total Return3 | | | | | | | | | | | | | | | | | | | | | | | | |
Based on net asset value | | | 3.91 | %4 | | | 6.85 | % | | | 11.06 | % | | | 26.40 | % | | | 32.63 | % | | | 25.70 | % |
| | | | |
| | | | | | | | | | | | | | | | | | | | | | | | |
| Ratios to Average Net Assets | | | | | | | | | | | | | | | | | | | | | | | | |
Total expenses | | | 2.09 | %5 | | | 1.98 | %6 | | | 1.95 | % | | | 1.98 | % | | | 2.02 | % | | | 2.07 | % |
| | | | |
Total expenses after fees waived and/or reimbursed and paid indirectly | | | 2.08 | %5 | | | 1.98 | %6 | | | 1.95 | % | | | 1.98 | % | | | 2.02 | % | | | 2.07 | % |
| | | | |
Net investment loss | | | (0.96 | )%5 | | | (0.85 | )%6 | | | (0.98 | )% | | | (0.85 | )% | | | (0.51 | )% | | | (0.59 | )% |
| | | | |
| | | | | | | | | | | | | | | | | | | | | | | | |
| Supplemental Data | | | | | | | | | | | | | | | | | | | | | | | | |
Net assets, end of period (000) | | $ | 2,687 | | | $ | 5,482 | | | $ | 11,016 | | | $ | 23,321 | | | $ | 39,048 | | | $ | 40,452 | |
| | | | |
Portfolio turnover rate | | | 21 | % | | | 50 | % | | | 50 | % | | | 57 | % | | | 94 | % | | | 135 | % |
| | | | |
| | 1 | | Based on average shares outstanding. |
| | 2 | | Distributions for annual periods determined in accordance with U.S. federal income tax regulations. |
| | 3 | | Where applicable, excludes the effects of any sales charges and assumes the reinvestment of distributions. |
| | 4 | | Aggregate total return. |
| | 6 | | Ratios do not include expenses incurred indirectly as a result of investments in underlying funds of approximately 0.01%. |
See Notes to Financial Statements.
| | | | | | |
| | | BLACKROCK FUNDS | | MARCH 31, 2017 | | 59 |
| | | | |
| Financial Highlights (continued) | | | BlackRock Health Sciences Opportunities Portfolio | |
| | | | | | | | | | | | | | | | | | | | | | | | |
| | | Investor C | |
| | | Six Months
Ended
March 31,
2017 (Unaudited) | | | Year Ended September 30, | |
| | | | 2016 | | | 2015 | | | 2014 | | | 2013 | | | 2012 | |
| | | | | | | | | | | | | | | | | | | | | | | | |
| Per Share Operating Performance | | | | | | | | | | | | | | | | | | | | | | | | |
Net asset value, beginning of period | | $ | 43.22 | | | $ | 46.05 | | | $ | 44.36 | | | $ | 38.77 | | | $ | 31.34 | | | $ | 26.18 | |
| | | | |
Net investment loss1 | | | (0.15 | ) | | | (0.32 | ) | | | (0.45 | ) | | | (0.32 | ) | | | (0.16 | ) | | | (0.16 | ) |
Net realized and unrealized gain | | | 1.77 | | | | 3.37 | | | | 5.31 | | | | 9.74 | | | | 9.74 | | | | 6.62 | |
| | | | |
Net increase from investment operations | | | 1.62 | | | | 3.05 | | | | 4.86 | | | | 9.42 | | | | 9.58 | | | | 6.46 | |
| | | | |
Distributions:2 | | | | | | | | | | | | | | | | | | | | | | | | |
From net investment income | | | — | | | | (0.44 | ) | | | — | | | | — | | | | (0.00 | )3 | | | — | |
From net realized gain | | | (1.08 | ) | | | (5.44 | ) | | | (3.17 | ) | | | (3.83 | ) | | | (2.15 | ) | | | (1.30 | ) |
| | | | |
Total distributions | | | (1.08 | ) | | | (5.88 | ) | | | (3.17 | ) | | | (3.83 | ) | | | (2.15 | ) | | | (1.30 | ) |
| | | | |
Net asset value, end of period | | $ | 43.76 | | | $ | 43.22 | | | $ | 46.05 | | | $ | 44.36 | | | $ | 38.77 | | | $ | 31.34 | |
| | | | |
| | | | | | | | | | | | | | | | | | | | | | | | |
| Total Return4 | | | | | | | | | | | | | | | | | | | | | | | | |
Based on net asset value | | | 4.01 | %5 | | | 6.92 | % | | | 11.14 | % | | | 26.46 | % | | | 32.71 | % | | | 25.80 | % |
| | | | |
| | | | | | | | | | | | | | | | | | | | | | | | |
| Ratios to Average Net Assets | | | | | | | | | | | | | | | | | | | | | | | | |
Total expenses | | | 1.90 | %6 | | | 1.90 | %7 | | | 1.88 | % | | | 1.91 | % | | | 1.95 | % | | | 2.01 | % |
| | | | |
Total expenses after fees waived and/or reimbursed and paid indirectly | | | 1.90 | %6 | | | 1.90 | %7 | | | 1.87 | % | | | 1.91 | % | | | 1.95 | % | | | 2.01 | % |
| | | | |
Net investment loss | | | (0.74 | )%6 | | | (0.75 | )%7 | | | (0.90 | )% | | | (0.80 | )% | | | (0.48 | )% | | | (0.55 | )% |
| | | | |
| | | | | | | | | | | | | | | | | | | | | | | | |
| Supplemental Data | | | | | | | | | | | | | | | | | | | | | | | | |
Net assets, end of period (000) | | $ | 1,005,118 | | | $ | 1,130,051 | | | $ | 1,167,437 | | | $ | 822,928 | | | $ | 596,123 | | | $ | 384,910 | |
| | | | |
Portfolio turnover rate | | | 21 | % | | | 50 | % | | | 50 | % | | | 57 | % | | | 94 | % | | | 135 | % |
| | | | |
| | 1 | | Based on average shares outstanding. |
| | 2 | | Distributions for annual periods determined in accordance with U.S. federal income tax regulations. |
| | 3 | | Amount is greater than $(0.005) per share. |
| | 4 | | Where applicable, excludes the effects of any sales charges and assumes the reinvestment of distributions. |
| | 5 | | Aggregate total return. |
| | 7 | | Ratios do not include expenses incurred indirectly as a result of investments in underlying funds of approximately 0.01%. |
See Notes to Financial Statements.
| | | | | | |
| 60 | | BLACKROCK FUNDS | | MARCH 31, 2017 | | |
| | | | |
| Financial Highlights (continued) | | | BlackRock Health Sciences Opportunities Portfolio | |
| | | | | | | | |
| | | Class K | |
| | | Six Months
Ended March 31, 2017
(Unaudited) | | | Period June 8, 20161
to September 30,
2016 | |
| | | | | | | | |
| Per Share Operating Performance | | | | | | | | |
Net asset value, beginning of period | | $ | 50.32 | | | $ | 49.82 | |
| | | | |
Net investment income2 | | | 0.10 | | | | 0.09 | |
Net realized and unrealized gain | | | 2.09 | | | | 0.41 | |
| | | | |
Net increase from investment operations | | | 2.19 | | | | 0.50 | |
| | | | |
Distributions from net realized gain3 | | | (1.08 | ) | | | — | |
| | | | |
Net asset value, end of period | | $ | 51.43 | | | $ | 50.32 | |
| | | | |
| | | | | | | | |
| Total Return4 | | | | | | | | |
Based on net asset value | | | 4.59 | %5 | | | 1.00 | %5 |
| | | | |
| | | | | | | | |
| Ratios to Average Net Assets | | | | | | | | |
Total expenses | | | 0.78 | %6 | | | 0.82 | %6,7 |
| | | | |
Total expenses after fees waived and/or reimbursed | | | 0.78 | %6 | | | 0.82 | %6,7 |
| | | | |
Net investment income | | | 0.41 | %6 | | | 0.54 | %6,7 |
| | | | |
| | | | | | | | |
| Supplemental Data | | | | | | | | |
Net assets, end of period (000) | | $ | 3,582 | | | $ | 2,495 | |
| | | | |
Portfolio turnover rate | | | 21 | % | | | 50 | %8 |
| | | | |
| | 1 | | Commencement of operations. |
| | 2 | | Based on average shares outstanding. |
| | 3 | | Distributions for annual periods determined in accordance with U.S. federal income tax regulations. |
| | 4 | | Where applicable, assumes the reinvestment of distributions. |
| | 5 | | Aggregate total return. |
| | 7 | | Ratios do not include expenses incurred indirectly as a result of investments in underlying funds of approximately 0.01%. |
| | 8 | | Portfolio turnover is representative of the Fund for the entire year. |
See Notes to Financial Statements.
| | | | | | |
| | | BLACKROCK FUNDS | | MARCH 31, 2017 | | 61 |
| | | | |
| Financial Highlights (concluded) | | | BlackRock Health Sciences Opportunities Portfolio | |
| | | | | | | | | | | | | | | | | | | | | | | | |
| | | Class R | |
| | | Six Months
Ended
March 31,
2017 (Unaudited) | | | Year Ended September 30, | |
| | | | 2016 | | | 2015 | | | 2014 | | | 2013 | | | 2012 | |
| | | | | | | | | | | | | | | | | | | | | | | | |
| Per Share Operating Performance | | | | | | | | | | | | | | | | | | | | | | | | |
Net asset value, beginning of period | | $ | 47.51 | | | $ | 50.04 | | | $ | 47.94 | | | $ | 41.62 | | | $ | 33.46 | | | $ | 28.00 | |
| | | | |
Net investment loss1 | | | (0.07 | ) | | | (0.17 | ) | | | (0.26 | ) | | | (0.17 | ) | | | (0.03 | ) | | | (0.07 | ) |
Net realized and unrealized gain | | | 1.97 | | | | 3.68 | | | | 5.72 | | | | 10.52 | | | | 10.43 | | | | 7.05 | |
| | | | |
Net increase from investment operations | | | 1.90 | | | | 3.51 | | | | 5.46 | | | | 10.35 | | | | 10.40 | | | | 6.98 | |
| | | | |
Distributions:2 | | | | | | | | | | | | | | | | | | | | | | | | |
From net investment income | | | — | | | | (0.60 | ) | | | — | | | | — | | | | (0.02 | ) | | | — | |
From net realized gain | | | (1.08 | ) | | | (5.44 | ) | | | (3.36 | ) | | | (4.03 | ) | | | (2.22 | ) | | | (1.52 | ) |
| | | | |
Total distributions | | | (1.08 | ) | | | (6.04 | ) | | | (3.36 | ) | | | (4.03 | ) | | | (2.24 | ) | | | (1.52 | ) |
| | | | |
Net asset value, end of period | | $ | 48.33 | | | $ | 47.51 | | | $ | 50.04 | | | $ | 47.94 | | | $ | 41.62 | | | $ | 33.46 | |
| | | | |
| | | | | | | | | | | | | | | | | | | | | | | | |
| Total Return3 | | | | | | | | | | | | | | | | | | | | | | | | |
Based on net asset value | | | 4.24 | %4 | | | 7.33 | % | | | 11.59 | % | | | 27.05 | % | | | 33.21 | % | | | 26.17 | % |
| | | | |
| | | | | | | | | | | | | | | | | | | | | | | | |
| Ratios to Average Net Assets | | | | | | | | | | | | | | | | | | | | | | | | |
Total expenses | | | 1.49 | %5 | | | 1.51 | %6 | | | 1.46 | % | | | 1.49 | % | | | 1.55 | %7 | | | 1.70 | % |
| | | | |
Total expenses after fees waived and/or reimbursed and paid indirectly | | | 1.49 | %5 | | | 1.51 | %6 | | | 1.45 | % | | | 1.49 | % | | | 1.55 | % | | | 1.68 | % |
| | | | |
Net investment loss | | | (0.32 | )%5 | | | (0.35 | )%6 | | | (0.48 | )% | | | (0.38 | )% | | | (0.09 | )% | | | (0.24 | )% |
| | | | |
| | | | | | | | | | | | | | | | | | | | | | | | |
| Supplemental Data | | | | | | | | | | | | | | | | | | | | | | | | |
Net assets, end of period (000) | | $ | 174,944 | | | $ | 172,640 | | | $ | 146,562 | | | $ | 74,611 | | | $ | 31,319 | | | $ | 14,613 | |
| | | | |
Portfolio turnover rate | | | 21 | % | | | 50 | % | | | 50 | % | | | 57 | % | | | 94 | % | | | 135 | % |
| | | | |
| | 1 | | Based on average shares outstanding. |
| | 2 | | Distributions for annual periods determined in accordance with U.S. federal income tax regulations. |
| | 3 | | Where applicable, assumes the reinvestment of distributions. |
| | 4 | | Aggregate total return. |
| | 6 | | Ratios do not include expenses incurred indirectly as a result of investments in underlying funds of approximately 0.01%. |
| | 7 | | Includes recoupment of past waived and/or reimbursed fees. Excluding the recoupment of past waived and/or reimbursed fees for the year ended September 30, 2013 the ratio would have been 1.54%. |
See Notes to Financial Statements.
| | | | | | |
| 62 | | BLACKROCK FUNDS | | MARCH 31, 2017 | | |
| | | | |
| Financial Highlights | | | BlackRock International Opportunities Portfolio | |
| | | | | | | | | | | | | | | | | | | | | | | | |
| | | Institutional | |
| | | Six Months
Ended
March 31,
2017 (Unaudited) | | | Year Ended September 30, | |
| | | | 2016 | | | 2015 | | | 2014 | | | 2013 | | | 2012 | |
| | | | | | | | | | | | | | | | | | | | | | | | |
| Per Share Operating Performance | | | | | | | | | | | | | | | | | | | | | | | | |
Net asset value, beginning of period | | $ | 33.58 | | | $ | 31.10 | | | $ | 38.51 | | | $ | 38.58 | | | $ | 32.82 | | | $ | 28.37 | |
| | | | |
Net investment income1 | | | 0.14 | | | | 0.36 | | | | 0.27 | | | | 0.48 | | | | 0.48 | | | | 0.56 | |
Net realized and unrealized gain (loss) | | | 0.33 | | | | 2.18 | | | | (3.05 | ) | | | (0.38 | ) | | | 5.84 | | | | 4.49 | |
| | | | |
Net increase (decrease) from investment operations | | | 0.47 | | | | 2.54 | | | | (2.78 | ) | | | 0.10 | | | | 6.32 | | | | 5.05 | |
| | | | |
Distributions:2 | | | | | | | | | | | | | | | | | | | | | | | | |
From net investment income | | | (1.47 | ) | | | (0.06 | ) | | | (0.92 | ) | | | (0.07 | ) | | | (0.56 | ) | | | (0.60 | ) |
From net realized gain | | | — | | | | — | | | | (3.71 | ) | | | (0.10 | ) | | | — | | | | — | |
| | | | |
Total distributions | | | (1.47 | ) | | | (0.06 | ) | | | (4.63 | ) | | | (0.17 | ) | | | (0.56 | ) | | | (0.60 | ) |
| | | | |
Net asset value, end of period | | $ | 32.58 | | | $ | 33.58 | | | $ | 31.10 | | | $ | 38.51 | | | $ | 38.58 | | | $ | 32.82 | |
| | | | |
| | | | | | | | | | | | | | | | | | | | | | | | |
| Total Return3 | | | | | | | | | | | | | | | | | | | | | | | | |
Based on net asset value | | | 1.57 | %4 | | | 8.20 | % | | | (7.60 | )% | | | 0.25 | % | | | 19.50 | % | | | 18.08 | % |
| | | | |
| | | | | | | | | | | | | | | | | | | | | | | | |
| Ratios to Average Net Assets | | | | | | | | | | | | | | | | | | | | | | | | |
Total expenses | | | 1.26 | %5,6 | | | 1.26 | %5,7 | | | 1.27 | % | | | 1.22 | % | | | 1.23 | % | | | 1.29 | % |
| | | | |
Total expenses after fees waived and/or reimbursed and paid indirectly | | | 1.06 | %6 | | | 1.06 | %7 | | | 1.14 | % | | | 1.19 | % | | | 1.23 | % | | | 1.29 | % |
| | | | |
Net investment income | | | 0.89 | %6 | | | 1.15 | %7 | | | 0.77 | % | | | 1.19 | % | | | 1.34 | % | | | 1.83 | % |
| | | | |
| | | | | | | | | | | | | | | | | | | | | | | | |
| Supplemental Data | | | | | | | | | | | | | | | | | | | | | | | | |
Net assets, end of period (000) | | $ | 286,397 | | | $ | 353,512 | | | $ | 424,099 | | | $ | 730,062 | | | $ | 775,659 | | | $ | 798,205 | |
| | | | |
Portfolio turnover rate | | | 42 | % | | | 47 | % | | | 66 | % | | | 138 | % | | | 157 | % | | | 99 | % |
| | | | |
| | 1 | | Based on average shares outstanding. |
| | 2 | | Distributions for annual periods determined in accordance with U.S. federal income tax regulations. |
| | 3 | | Where applicable, assumes the reinvestment of distributions. |
| | 4 | | Aggregate total return. |
| | 5 | | Includes recoupment of past waived and/or reimbursed fees with no financial impact to the expense ratio. |
| | 7 | | Ratios do not include expenses incurred indirectly as a result of investments in underlying funds of approximately 0.01%. |
See Notes to Financial Statements.
| | | | | | |
| | | BLACKROCK FUNDS | | MARCH 31, 2017 | | 63 |
| | | | |
| Financial Highlights (continued) | | | BlackRock International Opportunities Portfolio | |
| | | | | | | | | | | | | | | | | | | | | | | | |
| | | Service | |
| | | Six Months
Ended
March 31,
2017 (Unaudited) | | | Year Ended September 30, | |
| | | | 2016 | | | 2015 | | | 2014 | | | 2013 | | | 2012 | |
| | | | | | | | | | | | | | | | | | | | | | | | |
| Per Share Operating Performance | | | | | | | | | | | | | | | | | | | | | | | | |
Net asset value, beginning of period | | $ | 32.05 | | | $ | 29.72 | | | $ | 37.01 | | | $ | 37.16 | | | $ | 31.62 | | | $ | 27.34 | |
| | | | |
Net investment income1 | | | 0.08 | | | | 0.23 | | | | 0.17 | | | | 0.34 | | | | 0.26 | | | | 0.39 | |
Net realized and unrealized gain (loss) | | | 0.33 | | | | 2.10 | | | | (2.93 | ) | | | (0.34 | ) | | | 5.67 | | | | 4.33 | |
| | | | |
Net increase (decrease) from investment operations | | | 0.41 | | | | 2.33 | | | | (2.76 | ) | | | 0.00 | | | | 5.93 | | | | 4.72 | |
| | | | |
Distributions:2 | | | | | | | | | | | | | | | | | | | | | | | | |
From net investment income | | | (1.30 | ) | | | — | | | | (0.82 | ) | | | (0.05 | ) | | | (0.39 | ) | | | (0.44 | ) |
From net realized gain | | | — | | | | — | | | | (3.71 | ) | | | (0.10 | ) | | | — | | | | — | |
| | | | |
Total distributions | | | (1.30 | ) | | | — | | | | (4.53 | ) | | | (0.15 | ) | | | (0.39 | ) | | | (0.44 | ) |
| | | | |
Net asset value, end of period | | $ | 31.16 | | | $ | 32.05 | | | $ | 29.72 | | | $ | 37.01 | | | $ | 37.16 | | | $ | 31.62 | |
| | | | |
| | | | | | | | | | | | | | | | | | | | | | | | |
| Total Return3 | | | | | | | | | | | | | | | | | | | | | | | | |
Based on net asset value | | | 1.41 | %4 | | | 7.84 | % | | | (7.86 | )% | | | (0.03 | )% | | | 18.93 | % | | | 17.48 | % |
| | | | |
| | | | | | | | | | | | | | | | | | | | | | | | |
| Ratios to Average Net Assets | | | | | | | | | | | | | | | | | | | | | | | | |
Total expenses | | | 1.50 | %5,6 | | | 1.54 | %7,8 | | | 1.53 | %5 | | | 1.51 | %5 | | | 1.71 | %8 | | | 1.90 | %5 |
| | | | |
Total expenses after fees waived and/or reimbursed and paid indirectly | | | 1.39 | %6 | | | 1.38 | %7 | | | 1.42 | % | | | 1.48 | % | | | 1.71 | % | | | 1.80 | % |
| | | | |
Net investment income | | | 0.54 | %6 | | | 0.76 | %7 | | | 0.51 | % | | | 0.87 | % | | | 0.76 | % | | | 1.31 | % |
| | | | |
| | | | | | | | | | | | | | | | | | | | | | | | |
| Supplemental Data | | | | | | | | | | | | | | | | | | | | | | | | |
Net assets, end of period (000) | | $ | 9,793 | | | $ | 12,706 | | | $ | 19,269 | | | $ | 30,049 | | | $ | 40,885 | | | $ | 47,598 | |
| | | | |
Portfolio turnover rate | | | 42 | % | | | 47 | % | | | 66 | % | | | 138 | % | | | 157 | % | | | 99 | % |
| | | | |
| | 1 | | Based on average shares outstanding. |
| | 2 | | Distributions for annual periods determined in accordance with U.S. federal income tax regulations. |
| | 3 | | Where applicable, assumes the reinvestment of distributions. |
| | 4 | | Aggregate total return. |
| | 5 | | Includes recoupment of past waived and/or reimbursed fees with no financial impact to the expense ratio. |
| | 7 | | Ratios do not include expenses incurred indirectly as a result of investments in underlying funds of approximately 0.01%. |
| | 8 | | Includes recoupment of past waived and/or reimbursed fees. Excluding the recoupment of past waived and/or reimbursed fees for the years ended September 30, 2016 and September 30, 2013, the ratio would have been 1.53% and 1.60%, respectively. |
See Notes to Financial Statements.
| | | | | | |
| 64 | | BLACKROCK FUNDS | | MARCH 31, 2017 | | |
| | | | |
| Financial Highlights (continued) | | | BlackRock International Opportunities Portfolio | |
| | | | | | | | | | | | | | | | | | | | | | | | |
| | | Investor A | |
| | | Six Months
Ended
March 31,
2017 (Unaudited) | | | Year Ended September 30, | |
| | | | 2016 | | | 2015 | | | 2014 | | | 2013 | | | 2012 | |
| | | | | | | | | | | | | | | | | | | | | | | | |
| Per Share Operating Performance | | | | | | | | | | | | | | | | | | | | | | | | |
Net asset value, beginning of period | | $ | 31.68 | | | $ | 29.38 | | | $ | 36.64 | | | $ | 36.80 | | | $ | 31.33 | | | $ | 27.10 | |
| | | | |
Net investment income1 | | | 0.08 | | | | 0.24 | | | | 0.15 | | | | 0.33 | | | | 0.35 | | | | 0.45 | |
Net realized and unrealized gain (loss) | | | 0.32 | | | | 2.06 | | | | (2.88 | ) | | | (0.34 | ) | | | 5.59 | | | | 4.30 | |
| | | | |
Net increase (decrease) from investment operations | | | 0.40 | | | | 2.30 | | | | (2.73 | ) | | | (0.01 | ) | | | 5.94 | | | | 4.75 | |
| | | | |
Distributions:2 | | | | | | | | | | | | | | | | | | | | | | | | |
From net investment income | | | (1.35 | ) | | | — | | | | (0.82 | )�� | | | (0.05 | ) | | | (0.47 | ) | | | (0.52 | ) |
From net realized gain | | | — | | | | — | | | | (3.71 | ) | | | (0.10 | ) | | | — | | | | — | |
| | | | |
Total distributions | | | (1.35 | ) | | | — | | | | (4.53 | ) | | | (0.15 | ) | | | (0.47 | ) | | | (0.52 | ) |
| | | | |
Net asset value, end of period | | $ | 30.73 | | | $ | 31.68 | | | $ | 29.38 | | | $ | 36.64 | | | $ | 36.80 | | | $ | 31.33 | |
| | | | |
| | | | | | | | | | | | | | | | | | | | | | | | |
| Total Return3 | | | | | | | | | | | | | | | | | | | | | | | | |
Based on net asset value | | | 1.40 | %4 | | | 7.83 | % | | | (7.87 | )% | | | (0.06 | )% | | | 19.16 | % | | | 17.74 | % |
| | | | |
| | | | | | | | | | | | | | | | | | | | | | | | |
| Ratios to Average Net Assets | | | | | | | | | | | | | | | | | | | | | | | | |
Total expenses | | | 1.58 | %5,6 | | | 1.57 | %5,7 | | | 1.58 | %5 | | | 1.53 | % | | | 1.52 | % | | | 1.57 | % |
| | | | |
Total expenses after fees waived and/or reimbursed and paid indirectly | | | 1.39 | %6 | | | 1.39 | %7 | | | 1.46 | % | | | 1.50 | % | | | 1.52 | % | | | 1.57 | % |
| | | | |
Net investment income | | | 0.55 | %6 | | | 0.81 | %7 | | | 0.44 | % | | | 0.86 | % | | | 1.02 | % | | | 1.52 | % |
| | | | |
| | | | | | | | | | | | | | | | | | | | | | | | |
| Supplemental Data | | | | | | | | | | | | | | | | | | | | | | | | |
Net assets, end of period (000) | | $ | 335,881 | | | $ | 350,855 | | | $ | 415,805 | | | $ | 662,683 | | | $ | 753,074 | | | $ | 692,445 | |
| | | | |
Portfolio turnover rate | | | 42 | % | | | 47 | % | | | 66 | % | | | 138 | % | | | 157 | % | | | 99 | % |
| | | | |
| | 1 | | Based on average shares outstanding. |
| | 2 | | Distributions for annual periods determined in accordance with U.S. federal income tax regulations. |
| | 3 | | Where applicable, excludes the effects of any sales charges and assumes the reinvestment of distributions. |
| | 4 | | Aggregate total return. |
| | 5 | | Includes recoupment of past waived and/or reimbursed fees with no financial impact to the expense ratios for the years ended September 30, 2015, September 30, 2016 and the period ended March 31, 2017. |
| | 7 | | Ratios do not include expenses incurred indirectly as a result of investments in underlying funds of approximately 0.01%. |
See Notes to Financial Statements.
| | | | | | |
| | | BLACKROCK FUNDS | | MARCH 31, 2017 | | 65 |
| | | | |
| Financial Highlights (continued) | | | BlackRock International Opportunities Portfolio | |
| | | | | | | | | | | | | | | | | | | | | | | | |
| | | Investor B | |
| | | Six Months
Ended
March 31,
2017 (Unaudited) | | | Year Ended September 30, | |
| | | | 2016 | | | 2015 | | | 2014 | | | 2013 | | | 2012 | |
| | | | | | | | | | | | | | | | | | | | | | | | |
| Per Share Operating Performance | | | | | | | | | | | | | | | | | | | | | | | | |
Net asset value, beginning of period | | $ | 28.72 | | | $ | 26.87 | | | $ | 33.89 | | | $ | 34.27 | | | $ | 29.15 | | | $ | 25.18 | |
| | | | |
Net investment income (loss)1 | | | (0.05 | ) | | | (0.05 | ) | | | (0.12 | ) | | | (0.04 | ) | | | 0.02 | | | | 0.16 | |
Net realized and unrealized gain (loss) | | | 0.31 | | | | 1.90 | | | | (2.64 | ) | | | (0.24 | ) | | | 5.25 | | | | 4.03 | |
| | | | |
Net increase (decrease) from investment operations | | | 0.26 | | | | 1.85 | | | | (2.76 | ) | | | (0.28 | ) | | | 5.27 | | | | 4.19 | |
| | | | |
Distributions:2 | | | | | | | | | | | | | | | | | | | | | | | | |
From net investment income | | | (0.41 | ) | | | — | | | | (0.55 | ) | | | — | | | | (0.15 | ) | | | (0.22 | ) |
From net realized gain | | | — | | | | — | | | | (3.71 | ) | | | (0.10 | ) | | | — | | | | — | |
| | | | |
Total distributions | | | (0.41 | ) | | | — | | | | (4.26 | ) | | | (0.10 | ) | | | (0.15 | ) | | | (0.22 | ) |
| | | | |
Net asset value, end of period | | $ | 28.57 | | | $ | 28.72 | | | $ | 26.87 | | | $ | 33.89 | | | $ | 34.27 | | | $ | 29.15 | |
| | | | |
| | | | | | | | | | | | | | | | | | | | | | | | |
| Total Return3 | | | | | | | | | | | | | | | | | | | | | | | | |
Based on net asset value | | | 0.96 | %4 | | | 6.88 | % | | | (8.65 | )% | | | (0.84 | )% | | | 18.15 | % | | | 16.72 | % |
| | | | |
| | | | | | | | | | | | | | | | | | | | | | | | |
| Ratios to Average Net Assets | | | | | | | | | | | | | | | | | | | | | | | | |
Total expenses | | | 2.72 | %5,6 | | | 2.58 | %7,8 | | | 2.48 | % | | | 2.39 | % | | | 2.40 | % | | | 2.41 | % |
| | | | |
Total expenses after fees waived and/or reimbursed and paid indirectly | | | 2.25 | %6 | | | 2.26 | %7 | | | 2.31 | % | | | 2.29 | % | | | 2.40 | % | | | 2.41 | % |
| | | | |
Net investment income (loss) | | | (0.37 | )%6 | | | (0.17 | )%7 | | | (0.38 | )% | | | (0.12 | )% | | | 0.06 | % | | | 0.60 | % |
| | | | |
| | | | | | | | | | | | | | | | | | | | | | | | |
| Supplemental Data | | | | | | | | | | | | | | | | | | | | | | | | |
Net assets, end of period (000) | | $ | 302 | | | $ | 751 | | | $ | 1,845 | | | $ | 3,058 | | | $ | 6,507 | | | $ | 10,813 | |
| | | | |
Portfolio turnover rate | | | 42 | % | | | 47 | % | | | 66 | % | | | 138 | % | | | 157 | % | | | 99 | % |
| | | | |
| | 1 | | Based on average shares outstanding. |
| | 2 | | Distributions for annual periods determined in accordance with U.S. federal income tax regulations. |
| | 3 | | Where applicable, excludes the effects of any sales charges and assumes the reinvestment of distributions. |
| | 4 | | Aggregate total return. |
| | 5 | | Includes recoupment of past waived and/or reimbursed fees with no financial impact to the expense ratio. |
| | 7 | | Ratios do not include expenses incurred indirectly as a result of investments in underlying funds of approximately 0.01%. |
| | 8 | | Includes recoupment of past waived and/or reimbursed fees. Excluding the recoupment of past waived and/or reimbursed fees for the year ended September 30, 2016 the ratio would have been 2.57%. |
See Notes to Financial Statements.
| | | | | | |
| 66 | | BLACKROCK FUNDS | | MARCH 31, 2017 | | |
| | | | |
| Financial Highlights (concluded) | | | BlackRock International Opportunities Portfolio | |
| | | | | | | | | | | | | | | | | | | | | | | | |
| | | Investor C | |
| | | Six Months
Ended
March 31,
2017 (Unaudited) | | | Year Ended September 30, | |
| | | | 2016 | | | 2015 | | | 2014 | | | 2013 | | | 2012 | |
| | | | | | | | | | | | | | | | | | | | | | | | |
| Per Share Operating Performance | | | | | | | | | | | | | | | | | | | | | | | | |
Net asset value, beginning of period | | $ | 28.39 | | | $ | 26.52 | | | $ | 33.56 | | | $ | 33.93 | | | $ | 28.91 | | | $ | 24.98 | |
| | | | |
Net investment income (loss)1 | | | (0.03 | ) | | | 0.02 | | | | (0.07 | ) | | | 0.04 | | | | 0.07 | | | | 0.20 | |
Net realized and unrealized gain (loss) | | | 0.29 | | | | 1.85 | | | | (2.63 | ) | | | (0.31 | ) | | | 5.17 | | | | 3.98 | |
| | | | |
Net increase (decrease) from investment operations | | | 0.26 | | | | 1.87 | | | | (2.70 | ) | | | (0.27 | ) | | | 5.24 | | | | 4.18 | |
| | | | |
Distributions:2 | | | | | | | | | | | | | | | | | | | | | | | | |
From net investment income | | | (1.03 | ) | | | — | | | | (0.63 | ) | | | — | | | | (0.22 | ) | | | (0.25 | ) |
From net realized gain | | | — | | | | — | | | | (3.71 | ) | | | (0.10 | ) | | | — | | | | — | |
| | | | |
Total distributions | | | (1.03 | ) | | | — | | | | (4.34 | ) | | | (0.10 | ) | | | (0.22 | ) | | | (0.25 | ) |
| | | | |
Net asset value, end of period | | $ | 27.62 | | | $ | 28.39 | | | $ | 26.52 | | | $ | 33.56 | | | $ | 33.93 | | | $ | 28.91 | |
| | | | |
| | | | | | | | | | | | | | | | | | | | | | | | |
| Total Return3 | | | | | | | | | | | | | | | | | | | | | | | | |
Based on net asset value | | | 1.04 | %4 | | | 7.05 | % | | | (8.56 | )% | | | (0.82 | )% | | | 18.25 | % | | | 16.83 | % |
| | | | |
| | | | | | | | | | | | | | | | | | | | | | | | |
| Ratios to Average Net Assets | | | | | | | | | | | | | | | | | | | | | | | | |
Total expenses | | | 2.35 | %5,6 | | | 2.35 | %5,7 | | | 2.32 | % | | | 2.27 | % | | | 2.30 | % | | | 2.34 | % |
| | | | |
Total expenses after fees waived and/or reimbursed and paid indirectly | | | 2.13 | %6 | | | 2.13 | %7 | | | 2.20 | % | | | 2.23 | % | | | 2.30 | % | | | 2.34 | % |
| | | | |
Net investment income (loss) | | | (0.21 | )%6 | | | 0.07 | %7 | | | (0.24 | )% | | | 0.11 | % | | | 0.24 | % | | | 0.73 | % |
| | | | |
| | | | | | | | | | | | | | | | | | | | | | | | |
| Supplemental Data | | | | | | | | | | | | | | | | | | | | | | | | |
Net assets, end of period (000) | | $ | 63,327 | | | $ | 76,630 | | | $ | 96,334 | | | $ | 134,821 | | | $ | 148,136 | | | $ | 148,910 | |
| | | | |
Portfolio turnover rate | | | 42 | % | | | 47 | % | | | 66 | % | | | 138 | % | | | 157 | % | | | 99 | % |
| | | | |
| | 1 | | Based on average shares outstanding. |
| | 2 | | Distributions for annual periods determined in accordance with U.S. federal income tax regulations. |
| | 3 | | Where applicable, excludes the effects of any sales charges and assumes the reinvestment of distributions. |
| | 4 | | Aggregate total return. |
| | 5 | | Includes recoupment of past waived and/or reimbursed fees with no financial impact to the expense ratio. |
| | 7 | | Ratios do not include expenses incurred indirectly as a result of investments in underlying funds of approximately 0.01%. |
See Notes to Financial Statements.
| | | | | | |
| | | BLACKROCK FUNDS | | MARCH 31, 2017 | | 67 |
| | | | |
| Financial Highlights | | | BlackRock Science & Technology Opportunities Portfolio | |
| | | | | | | | | | | | | | | | | | | | | | | | |
| | | Institutional | |
| | | Six Months
Ended
March 31,
2017 (Unaudited) | | | Year Ended September 30, | |
| | | | 2016 | | | 2015 | | | 2014 | | | 2013 | | | 2012 | |
| | | | | | | | | | | | | | | | | | | | | | | | |
| Per Share Operating Performance | | | | | | | | | | | | | | | | | | | | | | | | |
Net asset value, beginning of period | | $ | 19.18 | | | $ | 15.61 | | | $ | 14.37 | | | $ | 12.27 | | | $ | 10.01 | | | $ | 8.61 | |
| | | | |
Net investment loss1 | | | (0.06 | ) | | | (0.08 | ) | | | (0.09 | ) | | | (0.10 | ) | | | (0.03 | ) | | | (0.06 | ) |
Net realized and unrealized gain | | | 2.06 | | | | 3.65 | | | | 1.33 | | | | 2.20 | | | | 2.29 | | | | 1.46 | |
| | | | |
Net increase from investment operations | | | 2.00 | | | | 3.57 | | | | 1.24 | | | | 2.10 | | | | 2.26 | | | | 1.40 | |
| | | | |
Distributions from net realized gain | | | (0.20 | ) | | | — | | | | — | | | | — | | | | — | | | | — | |
| | | | |
Net asset value, end of period | | $ | 20.98 | | | $ | 19.18 | | | $ | 15.61 | | | $ | 14.37 | | | $ | 12.27 | | | $ | 10.01 | |
| | | | |
| | | | | | | | | | | | | | | | | | | | | | | | |
| Total Return2 | | | | | | | | | | | | | | | | | | | | | | | | |
Based on net asset value | | | 10.98 | %3 | | | 22.87 | % | | | 8.63 | % | | | 17.11 | % | | | 22.58 | % | | | 16.26 | % |
| | | | |
| | | | | | | | | | | | | | | | | | | | | | | | |
| Ratios to Average Net Assets | | | | | | | | | | | | | | | | | | | | | | | | |
Total expenses | | | 1.24 | %4 | | | 1.27 | % | | | 1.31 | %5 | | | 1.36 | % | | | 1.50 | %6 | | | 1.45 | %6 |
| | | | |
Total expenses after fees waived and/or reimbursed and paid indirectly | | | 1.22 | %4 | | | 1.23 | % | | | 1.27 | % | | | 1.29 | % | | | 1.36 | % | | | 1.39 | % |
| | | | |
Net investment loss | | | (0.65 | )%4 | | | (0.49 | )% | | | (0.58 | )% | | | (0.74 | )% | | | (0.34 | )% | | | (0.63 | )% |
| | | | |
| | | | | | | | | | | | | | | | | | | | | | | | |
| Supplemental Data | | | | | | | | | | | | | | | | | | | | | | | | |
Net assets, end of period (000) | | $ | 96,757 | | | $ | 78,179 | | | $ | 57,306 | | | $ | 53,922 | | | $ | 36,218 | | | $ | 34,022 | |
| | | | |
Portfolio turnover rate | | | 31 | % | | | 84 | % | | | 78 | % | | | 99 | % | | | 86 | % | | | 320 | % |
| | | | |
| | 1 | | Based on average shares outstanding. |
| | 2 | | Where applicable, assumes the reinvestment of distributions. |
| | 3 | | Aggregate total return. |
| | 5 | | Includes recoupment of past waived and/or reimbursed fees with no financial impact to the expense ratio. |
| | 6 | | Includes recoupment of past waived and/or reimbursed fees. Excluding the recoupment of past waived and/or reimbursed fees for the years ended September 30, 2013 and September 30, 2012, the ratio would have been 1.49% and 1.44%, respectively. |
See Notes to Financial Statements.
| | | | | | |
| 68 | | BLACKROCK FUNDS | | MARCH 31, 2017 | | |
| | | | |
| Financial Highlights (continued) | | | BlackRock Science & Technology Opportunities Portfolio | |
| | | | | | | | | | | | | | | | | | | | | | | | |
| | | Service | |
| | | Six Months
Ended
March 31,
2017 (Unaudited) | | | Year Ended September 30, | |
| | | | 2016 | | | 2015 | | | 2014 | | | 2013 | | | 2012 | |
| | | | | | | | | | | | | | | | | | | | | | | | |
| Per Share Operating Performance | | | | | | | | | | | | | | | | | | | | | | | | |
Net asset value, beginning of period | | $ | 18.34 | | | $ | 14.96 | | | $ | 13.80 | | | $ | 11.81 | | | $ | 9.66 | | | $ | 8.32 | |
| | | | |
Net investment loss1 | | | (0.08 | ) | | | (0.12 | ) | | | (0.12 | ) | | | (0.13 | ) | | | (0.05 | ) | | | (0.08 | ) |
Net realized and unrealized gain | | | 1.96 | | | | 3.50 | | | | 1.28 | | | | 2.12 | | | | 2.20 | | | | 1.42 | |
| | | | |
Net increase from investment operations | | | 1.88 | | | | 3.38 | | | | 1.16 | | | | 1.99 | | | | 2.15 | | | | 1.34 | |
| | | | |
Distributions from net realized gain | | | (0.20 | ) | | | — | | | | — | | | | — | | | | — | | | | — | |
| | | | |
Net asset value, end of period | | $ | 20.02 | | | $ | 18.34 | | | $ | 14.96 | | | $ | 13.80 | | | $ | 11.81 | | | $ | 9.66 | |
| | | | |
| | | | | | | | | | | | | | | | | | | | | | | | |
| Total Return2 | | | | | | | | | | | | | | | | | | | | | | | | |
Based on net asset value | | | 10.40 | %3 | | | 22.59 | % | | | 8.41 | % | | | 16.85 | % | | | 22.26 | % | | | 16.11 | % |
| | | | |
| | | | | | | | | | | | | | | | | | | | | | | | |
| Ratios to Average Net Assets | | | | | | | | | | | | | | | | | | | | | | | | |
Total expenses | | | 1.49 | %4 | | | 1.49 | % | | | 1.48 | %5 | | | 1.50 | % | | | 1.56 | %6 | | | 1.57 | %5 |
| | | | |
Total expenses after fees waived and/or reimbursed and paid indirectly | | | 1.49 | %4 | | | 1.49 | % | | | 1.48 | % | | | 1.46 | % | | | 1.56 | % | | | 1.57 | % |
| | | | |
Net investment loss | | | (0.91 | )%4 | | | (0.74 | )% | | | (0.77 | )% | | | (0.93 | )% | | | (0.54 | )% | | | (0.81 | )% |
| | | | |
| | | | | | | | | | | | | | | | | | | | | | | | |
| Supplemental Data | | | | | | | | | | | | | | | | | | | | | | | | |
Net assets, end of period (000) | | $ | 2,331 | | | $ | 2,583 | | | $ | 1,527 | | | $ | 1,297 | | | $ | 869 | | | $ | 944 | |
| | | | |
Portfolio turnover rate | | | 31 | % | | | 84 | % | | | 78 | % | | | 99 | % | | | 86 | % | | | 320 | % |
| | | | |
| | 1 | | Based on average shares outstanding. |
| | 2 | | Where applicable, assumes the reinvestment of distributions. |
| | 3 | | Aggregate total return. |
| | 5 | | Includes recoupment of past waived and/or reimbursed fees. Excluding the recoupment of past waived and/or reimbursed fees for the years ended September 30, 2015 and September 30, 2012, the ratio would have been 1.45% and 1.56%, respectively. |
| | 6 | | Includes recoupment of past waived and/or reimbursed fees with no financial impact to the expense ratio. |
See Notes to Financial Statements.
| | | | | | |
| | | BLACKROCK FUNDS | | MARCH 31, 2017 | | 69 |
| | | | |
| Financial Highlights (continued) | | | BlackRock Science & Technology Opportunities Portfolio | |
| | | | | | | | | | | | | | | | | | | | | | | | |
| | | Investor A | |
| | | Six Months
Ended
March 31,
2017 (Unaudited) | | | Year Ended September 30, | |
| | | | 2016 | | | 2015 | | | 2014 | | | 2013 | | | 2012 | |
| | | | | | | | | | | | | | | | | | | | | | | | |
| Per Share Operating Performance | | | | | | | | | | | | | | | | | | | | | | | | |
Net asset value, beginning of period | | $ | 17.98 | | | $ | 14.68 | | | $ | 13.55 | | | $ | 11.61 | | | $ | 9.51 | | | $ | 8.21 | |
| | | | |
Net investment loss1 | | | (0.09 | ) | | | (0.13 | ) | | | (0.13 | ) | | | (0.14 | ) | | | (0.06 | ) | | | (0.09 | ) |
Net realized and unrealized gain | | | 1.93 | | | | 3.43 | | | | 1.26 | | | | 2.08 | | | | 2.16 | | | | 1.39 | |
| | | | |
Net increase from investment operations | | | 1.84 | | | | 3.30 | | | | 1.13 | | | | 1.94 | | | | 2.10 | | | | 1.30 | |
| | | | |
Distributions from net realized gain | | | (0.20 | ) | | | — | | | | — | | | | — | | | | — | | | | — | |
| | | | |
Net asset value, end of period | | $ | 19.62 | | | $ | 17.98 | | | $ | 14.68 | | | $ | 13.55 | | | $ | 11.61 | | | $ | 9.51 | |
| | | | |
| | | | | | | | | | | | | | | | | | | | | | | | |
| Total Return2 | | | | | | | | | | | | | | | | | | | | | | | | |
Based on net asset value | | | 10.38 | %3 | | | 22.48 | % | | | 8.34 | % | | | 16.71 | % | | | 22.08 | % | | | 15.84 | % |
| | | | |
| | | | | | | | | | | | | | | | | | | | | | | | |
| Ratios to Average Net Assets | | | | | | | | | | | | | | | | | | | | | | | | |
Total expenses | | | 1.53 | %4,5 | | | 1.56 | %4 | | | 1.60 | %4 | | | 1.64 | %4 | | | 1.72 | %6 | | | 1.72 | %4 |
| | | | |
Total expenses after fees waived and/or reimbursed and paid indirectly | | | 1.53 | %5 | | | 1.55 | % | | | 1.59 | % | | | 1.61 | % | | | 1.70 | % | | | 1.71 | % |
| | | | |
Net investment loss | | | (0.96 | )%5 | | | (0.81 | )% | | | (0.90 | )% | | | (1.07 | )% | | | (0.67 | )% | | | (0.95 | )% |
| | | | |
| | | | | | | | | | | | | | | | | | | | | | | | |
| Supplemental Data | | | | | | | | | | | | | | | | | | | | | | | | |
Net assets, end of period (000) | | $ | 189,893 | | | $ | 180,658 | | | $ | 140,951 | | | $ | 118,814 | | | $ | 97,437 | | | $ | 106,466 | |
| | | | |
Portfolio turnover rate | | | 31 | % | | | 84 | % | | | 78 | % | | | 99 | % | | | 86 | % | | | 320 | % |
| | | | |
| | 1 | | Based on average shares outstanding. |
| | 2 | | Where applicable, excludes the effects of any sales charges and assumes the reinvestment of distributions. |
| | 3 | | Aggregate total return. |
| | 4 | | Includes recoupment of past waived and/or reimbursed fees. Excluding the recoupment of past waived and/or reimbursed fees, the ratios were as follows: |
| | | | | | | | | | | | | | | | | | | | |
| | | Six Months
Ended
March 31, 2017 (Unaudited) | | | Year Ended September 30, | |
| | | | 2016 | | | 2015 | | | 2014 | | | 2012 | |
Expense ratios | | | 1.52% | | | | 1.55 | % | | | 1.57 | % | | | 1.63 | % | | | 1.70 | % |
| | 6 | | Includes recoupment of past waived and/or reimbursed fees with no financial impact to the expense ratio. |
See Notes to Financial Statements.
| | | | | | |
| 70 | | BLACKROCK FUNDS | | MARCH 31, 2017 | | |
| | | | |
| Financial Highlights (continued) | | | BlackRock Science & Technology Opportunities Portfolio | |
| | | | | | | | | | | | | | | | | | | | | | | | |
| | | Investor C | |
| | | Six Months
Ended
March 31,
2017 (Unaudited) | | | Year Ended September 30, | |
| | | | 2016 | | | 2015 | | | 2014 | | | 2013 | | | 2012 | |
| | | | | | | | | | | | | | | | | | | | | | | | |
| Per Share Operating Performance | | | | | | | | | | | | | | | | | | | | | | | | |
Net asset value, beginning of period | | $ | 15.70 | | | $ | 12.92 | | | $ | 12.03 | | | $ | 10.39 | | | $ | 8.58 | | | $ | 7.47 | |
| | | | |
Net investment loss1 | | | (0.14 | ) | | | (0.22 | ) | | | (0.23 | ) | | | (0.22 | ) | | | (0.14 | ) | | | (0.15 | ) |
Net realized and unrealized gain | | | 1.68 | | | | 3.00 | | | | 1.12 | | | | 1.86 | | | | 1.95 | | | | 1.26 | |
| | | | |
Net increase from investment operations | | | 1.54 | | | | 2.78 | | | | 0.89 | | | | 1.64 | | | | 1.81 | | | | 1.11 | |
| | | | |
Distributions from net realized gain | | | (0.20 | ) | | | — | | | | — | | | | — | | | | — | | | | — | |
| | | | |
Net asset value, end of period | | $ | 17.04 | | | $ | 15.70 | | | $ | 12.92 | | | $ | 12.03 | | | $ | 10.39 | | | $ | 8.58 | |
| | | | |
| | | | | | | | | | | | | | | | | | | | | | | | |
| Total Return2 | | | | | | | | | | | | | | | | | | | | | | | | |
Based on net asset value | | | 9.98 | %3 | | | 21.52 | % | | | 7.40 | % | | | 15.78 | % | | | 21.10 | % | | | 14.86 | % |
| | | | |
| | | | | | | | | | | | | | | | | | | | | | | | |
| Ratios to Average Net Assets | | | | | | | | | | | | | | | | | | | | | | | | |
Total expenses | | | 2.30 | %4,5 | | | 2.35 | %4 | | | 2.40 | %6 | | | 2.46 | %6 | | | 2.58 | %4 | | | 2.60 | %6 |
| | | | |
Total expenses after fees waived and/or reimbursed and paid indirectly | | | 2.29 | %5 | | | 2.35 | % | | | 2.40 | % | | | 2.44 | % | | | 2.57 | % | | | 2.60 | % |
| | | | |
Net investment loss | | | (1.72 | )%5 | | | (1.61 | )% | | | (1.71 | )% | | | (1.90 | )% | | | (1.56 | )% | | | (1.84 | )% |
| | | | |
| | | | | | | | | | | | | | | | | | | | | | | | |
| Supplemental Data | | | | | | | | | | | | | | | | | | | | | | | | |
Net assets, end of period (000) | | $ | 69,264 | | | $ | 56,707 | | | $ | 41,989 | | | $ | 32,194 | | | $ | 28,234 | | | $ | 26,543 | |
| | | | |
Portfolio turnover rate | | | 31 | % | | | 84 | % | | | 78 | % | | | 99 | % | | | 86 | % | | | 320 | % |
| | | | |
| | 1 | | Based on average shares outstanding. |
| | 2 | | Where applicable, excludes the effects of any sales charges and assumes the reinvestment of distributions. |
| | 3 | | Aggregate total return. |
| | 4 | | Includes recoupment of past waived and/or reimbursed fees with no financial impact to the expense ratio. |
| | 6 | | Includes recoupment of past waived and/or reimbursed fees. Excluding the recoupment of past waived and/or reimbursed fees, the ratios were as follows: |
| | | | | | | | | | | | |
| | | Year Ended September 30, | |
| | | 2015 | | | 2014 | | | 2012 | |
Expense ratios | | | 2.39 | % | | | 2.45 | % | | | 2.59 | % |
See Notes to Financial Statements.
| | | | | | |
| | | BLACKROCK FUNDS | | MARCH 31, 2017 | | 71 |
| | | | |
| Financial Highlights (concluded) | | | BlackRock Science & Technology Opportunities Portfolio | |
| | | | | | | | | | | | | | | | | | | | | | | | |
| | | Class R | |
| | | Six Months
Ended
March 31,
2017 (Unaudited) | | | Year Ended September 30, | |
| | | | 2016 | | | 2015 | | | 2014 | | | 2013 | | | 2012 | |
| | | | | | | | | | | | | | | | | | | | | | | | |
| Per Share Operating Performance | | | | | | | | | | | | | | | | | | | | | | | | |
Net asset value, beginning of period | | $ | 18.21 | | | $ | 14.92 | | | $ | 13.81 | | | $ | 11.86 | | | $ | 9.74 | | | $ | 8.43 | |
| | | | |
Net investment loss1 | | | (0.11 | ) | | | (0.17 | ) | | | (0.18 | ) | | | (0.18 | ) | | | (0.09 | ) | | | (0.12 | ) |
Net realized and unrealized gain | | | 1.96 | | | | 3.46 | | | | 1.29 | | | | 2.13 | | | | 2.21 | | | | 1.43 | |
| | | | |
Net increase from investment operations | | | 1.85 | | | | 3.29 | | | | 1.11 | | | | 1.95 | | | | 2.12 | | | | 1.31 | |
| | | | |
Distributions from net realized gain | | | (0.20 | ) | | | — | | | | — | | | | — | | | | — | | | | — | |
| | | | |
Net asset value, end of period | | $ | 19.86 | | | $ | 18.21 | | | $ | 14.92 | | | $ | 13.81 | | | $ | 11.86 | | | $ | 9.74 | |
| | | | |
| | | | | | | | | | | | | | | | | | | | | | | | |
| Total Return2 | | | | | | | | | | | | | | | | | | | | | | | | |
Based on net asset value | | | 10.31 | %3 | | | 22.05 | % | | | 8.04 | % | | | 16.44 | % | | | 21.77 | % | | | 15.54 | % |
| | | | |
| | | | | | | | | | | | | | | | | | | | | | | | |
| Ratios to Average Net Assets | | | | | | | | | | | | | | | | | | | | | | | | |
Total expenses | | | 1.82 | %4,5 | | | 1.85 | %4 | | | 1.86 | %4 | | | 1.91 | %4 | | | 1.97 | %6 | | | 2.00 | %4 |
| | | | |
Total expenses after fees waived and/or reimbursed and paid indirectly | | | 1.82 | %5 | | | 1.83 | % | | | 1.85 | % | | | 1.89 | % | | | 1.93 | % | | | 1.99 | % |
| | | | |
Net investment loss | | | (1.24 | )%5 | | | (1.09 | )% | | | (1.16 | )% | | | (1.35 | )% | | | (0.92 | )% | | | (1.23 | )% |
| | | | |
| | | | | | | | | | | | | | | | | | | | | | | | |
| Supplemental Data | | | | | | | | | | | | | | | | | | | | | | | | |
Net assets, end of period (000) | | $ | 8,050 | | | $ | 6,054 | | | $ | 5,060 | | | $ | 4,195 | | | $ | 4,555 | | | $ | 4,329 | |
| | | | |
Portfolio turnover rate | | | 31 | % | | | 84 | % | | | 78 | % | | | 99 | % | | | 86 | % | | | 320 | % |
| | | | |
| | 1 | | Based on average shares outstanding. |
| | 2 | | Where applicable, assumes the reinvestment of distributions. |
| | 3 | | Aggregate total return. |
| | 4 | | Includes recoupment of past waived and/or reimbursed fees. Excluding the recoupment of past waived and/or reimbursed fees, the ratios were as follows: |
| | | | | | | | | | | | | | | | | | | | |
| | | Six Months Ended March 31, 2017 (Unaudited) | | | Year Ended September 30, | |
| | | | 2016 | | | 2015 | | | 2014 | | | 2012 | |
Expense ratios | | | 1.81 | % | | | 1.84 | % | | | 1.83 | % | | | 1.89 | % | | | 1.99 | % |
| | 6 | | Includes recoupment of past waived and/or reimbursed fees with no financial impact to the expense ratio. |
See Notes to Financial Statements.
| | | | | | |
| 72 | | BLACKROCK FUNDS | | MARCH 31, 2017 | | |
| | | | |
| Financial Highlights | | | BlackRock U.S. Opportunities Portfolio | |
| | | | | | | | | | | | | | | | | | | | | | | | |
| | | Institutional | |
| | | Six Months
Ended
March 31,
2017 (Unaudited) | | | Year Ended September 30, | |
| | | | 2016 | | | 2015 | | | 2014 | | | 2013 | | | 2012 | |
| | | | | | | | | | | | | | | | | | | | | | | | |
| Per Share Operating Performance | | | | | | | | | | | | | | | | | | | | | | | | |
Net asset value, beginning of period | | $ | 37.84 | | | $ | 37.71 | | | $ | 42.91 | | | $ | 45.82 | | | $ | 36.42 | | | $ | 33.86 | |
| | | | |
Net investment income (loss)1 | | | (0.13 | ) | | | 0.24 | | | | 0.09 | | | | (0.07 | ) | | | 0.11 | | | | 0.19 | |
Net realized and unrealized gain | | | 2.89 | | | | 2.81 | | | | 0.89 | | | | 6.49 | | | | 10.41 | | | | 6.31 | |
| | | | |
Net increase from investment operations | | | 2.76 | | | | 3.05 | | | | 0.98 | | | | 6.42 | | | | 10.52 | | | | 6.50 | |
| | | | |
Distributions:2 | | | | | | | | | | | | | | | | | | | | | | | | |
From net investment income | | | (0.23 | ) | | | — | | | | — | | | | — | | | | (0.33 | ) | | | — | |
From net realized gains | | | (1.99 | ) | | | (2.92 | ) | | | (6.18 | ) | | | (9.33 | ) | | | (0.79 | ) | | | (3.94 | ) |
| | | | |
Total distributions | | | (2.22 | ) | | | (2.92 | ) | | | (6.18 | ) | | | (9.33 | ) | | | (1.12 | ) | | | (3.94 | ) |
| | | | |
Net asset value, end of period | | $ | 38.38 | | | $ | 37.84 | | | $ | 37.71 | | | $ | 42.91 | | | $ | 45.82 | | | $ | 36.42 | |
| | | | |
| | | | | | | | | | | | | | | | | | | | | | | | |
| Total Return3 | | | | | | | | | | | | | | | | | | | | | | | | |
Based on net asset value | | | 7.68 | %4 | | | 8.64 | % | | | 2.21 | % | | | 16.28 | % | | | 29.79 | % | | | 20.40 | % |
| | | | |
| | | | | | | | | | | | | | | | | | | | | | | | |
| Ratios to Average Net Assets | | | | | | | | | | | | | | | | | | | | | | | | |
Total expenses | | | 1.21 | %5 | | | 1.19 | %6 | | | 1.33 | % | | | 1.34 | %7 | | | 1.37 | % | | | 1.30 | % |
| | | | |
Total expenses after fees waived and/or reimbursed and paid indirectly | | | 1.01 | %5 | | | 0.91 | %6 | | | 0.91 | % | | | 0.94 | % | | | 1.01 | % | | | 1.03 | % |
| | | | |
Net investment income (loss) | | | (0.69 | )%5 | | | 0.67 | %6 | | | 0.22 | % | | | (0.17 | )% | | | 0.28 | % | | | 0.52 | % |
| | | | |
| | | | | | | | | | | | | | | | | | | | | | | | |
| Supplemental Data | | | | | | | | | | | | | | | | | | | | | | | | |
Net assets, end of period (000) | | $ | 723,624 | | | $ | 686,845 | | | $ | 768,068 | | | $ | 732,297 | | | $ | 676,540 | | | $ | 1,294,928 | |
| | | | |
Portfolio turnover rate | | | 46 | % | | | 72 | % | | | 64 | % | | | 66 | % | | | 82 | % | | | 106 | % |
| | | | |
| | 1 | | Based on average shares outstanding. |
| | 2 | | Distributions for annual periods determined in accordance with U.S. federal income tax regulations. |
| | 3 | | Where applicable, assumes the reinvestment of distributions. |
| | 4 | | Aggregate total return. |
| | 6 | | Ratios do not include expenses incurred indirectly as a result of investments in underlying funds of approximately 0.01%. |
| | 7 | | Includes recoupment of past waived and/or reimbursed fees with no financial impact to the expense ratio. |
See Notes to Financial Statements.
| | | | | | |
| | | BLACKROCK FUNDS | | MARCH 31, 2017 | | 73 |
| | | | |
| Financial Highlights (continued) | | | BlackRock U.S. Opportunities Portfolio | |
| | | | | | | | | | | | | | | | | | | | | | | | |
| | | Service | |
| | | Six Months
Ended
March 31,
2017 (Unaudited) | | | Year Ended September 30, | |
| | | | 2016 | | | 2015 | | | 2014 | | | 2013 | | | 2012 | |
| | | | | | | | | | | | | | | | | | | | | | | | |
| Per Share Operating Performance | | | | | | | | | | | | | | | | | | | | | | | | |
Net asset value, beginning of period | | $ | 35.61 | | | $ | 35.80 | | | $ | 40.51 | | | $ | 43.72 | | | $ | 34.71 | | | $ | 32.44 | |
| | | | |
Net investment income (loss)1 | | | (0.16 | ) | | | 0.09 | | | | (0.11 | ) | | | (0.23 | ) | | | (0.09 | ) | | | 0.02 | |
Net realized and unrealized gain | | | 2.70 | | | | 2.64 | | | | 0.89 | | | | 6.16 | | | | 9.98 | | | | 6.03 | |
| | | | |
Net increase from investment operations | | | 2.54 | | | | 2.73 | | | | 0.78 | | | | 5.93 | | | | 9.89 | | | | 6.05 | |
| | | | |
Distributions:2 | | | | | | | | | | | | | | | | | | | | | | | | |
From net investment income | | | (0.04 | ) | | | — | | | | — | | | | — | | | | (0.09 | ) | | | — | |
From net realized gains | | | (1.99 | ) | | | (2.92 | ) | | | (5.49 | ) | | | (9.14 | ) | | | (0.79 | ) | | | (3.78 | ) |
| | | | |
Total distributions | | | (2.03 | ) | | | (2.92 | ) | | | (5.49 | ) | | | (9.14 | ) | | | (0.88 | ) | | | (3.78 | ) |
| | | | |
Net asset value, end of period | | $ | 36.12 | | | $ | 35.61 | | | $ | 35.80 | | | $ | 40.51 | | | $ | 43.72 | | | $ | 34.71 | |
| | | | |
| | | | | | | | | | | | | | | | | | | | | | | | |
| Total Return3 | | | | | | | | | | | | | | | | | | | | | | | | |
Based on net asset value | | | 7.51 | %4 | | | 8.18 | % | | | 1.80 | % | | | 15.82 | % | | | 29.26 | % | | | 19.80 | % |
| | | | |
| | | | | | | | | | | | | | | | | | | | | | | | |
| Ratios to Average Net Assets | | | | | | | | | | | | | | | | | | | | | | | | |
Total expenses | | | 1.37 | %5,6 | | | 1.43 | %7,8 | | | 1.68 | %7 | | | 1.59 | %9 | | | 1.61 | % | | | 1.62 | % |
| | | | |
Total expenses after fees waived and/or reimbursed and paid indirectly | | | 1.31 | %6 | | | 1.31 | %8 | | | 1.31 | % | | | 1.34 | % | | | 1.45 | % | | | 1.51 | % |
| | | | |
Net investment income (loss) | | | (0.91 | )%6 | | | 0.27 | %8 | | | (0.28 | )% | | | (0.57 | )% | | | (0.22 | )% | | | 0.05 | % |
| | | | |
| | | | | | | | | | | | | | | | | | | | | | | | |
| Supplemental Data | | | | | | | | | | | | | | | | | | | | | | | | |
Net assets, end of period (000) | | $ | 21,696 | | | $ | 24,305 | | | $ | 27,489 | | | $ | 140,498 | | | $ | 155,414 | | | $ | 159,939 | |
| | | | |
Portfolio turnover rate | | | 46 | % | | | 72 | % | | | 64 | % | | | 66 | % | | | 82 | % | | | 106 | % |
| | | | |
| | 1 | | Based on average shares outstanding. |
| | 2 | | Distributions for annual periods determined in accordance with U.S. federal income tax regulations. |
| | 3 | | Where applicable, assumes the reinvestment of distributions. |
| | 4 | | Aggregate total return. |
| | 5 | | Includes recoupment of past waived and/or reimbursed fees with no financial impact to the expense ratio. |
| | 7 | | Includes recoupment of past waived and/or reimbursed fees. Excluding the recoupment of past waived and/or reimbursed fees for the years ended September 30, 2016 and September 30, 2015, the ratio would have been 1.30% and 1.67%, respectively. |
| | 8 | | Ratios do not include expenses incurred indirectly as a result of investments in underlying funds of approximately 0.01%. |
| | 9 | | Includes recoupment of past waived and/or reimbursed fees with no financial impact to the expense ratio. |
See Notes to Financial Statements.
| | | | | | |
| 74 | | BLACKROCK FUNDS | | MARCH 31, 2017 | | |
| | | | |
| Financial Highlights (continued) | | | BlackRock U.S. Opportunities Portfolio | |
| | | | | | | | | | | | | | | | | | | | | | | | |
| | | Investor A | |
| | | Six Months
Ended
March 31,
2017 (Unaudited) | | | Year Ended September 30, | |
| | | | 2016 | | | 2015 | | | 2014 | | | 2013 | | | 2012 | |
| | | | | | | | | | | | | | | | | | | | | | | | |
| Per Share Operating Performance | | | | | | | | | | | | | | | | | | | | | | | | |
Net asset value, beginning of period | | $ | 34.47 | | | $ | 34.74 | | | $ | 39.96 | | | $ | 43.23 | | | $ | 34.30 | | | $ | 32.08 | |
| | | | |
Net investment income (loss)1 | | | (0.15 | ) | | | 0.09 | | | | (0.07 | ) | | | (0.23 | ) | | | (0.09 | ) | | | 0.01 | |
Net realized and unrealized gain | | | 2.60 | | | | 2.56 | | | | 0.85 | | | | 6.09 | | | | 9.86 | | | | 5.97 | |
| | | | |
Net increase from investment operations | | | 2.45 | | | | 2.65 | | | | 0.78 | | | | 5.86 | | | | 9.77 | | | | 5.98 | |
| | | | |
Distributions:2 | | | | | | | | | | | | | | | | | | | | | | | | |
From net investment income | | | (0.06 | ) | | | — | | | | — | | | | — | | | | (0.05 | ) | | | — | |
From net realized gains | | | (1.99 | ) | | | (2.92 | ) | | | (6.00 | ) | | | (9.13 | ) | | | (0.79 | ) | | | (3.76 | ) |
| | | | |
Total distributions | | | (2.05 | ) | | | (2.92 | ) | | | (6.00 | ) | | | (9.13 | ) | | | (0.84 | ) | | | (3.76 | ) |
| | | | |
Net asset value, end of period | | $ | 34.87 | | | $ | 34.47 | | | $ | 34.74 | | | $ | 39.96 | | | $ | 43.23 | | | $ | 34.30 | |
| | | | |
| | | | | | | | | | | | | | | | | | | | | | | | |
| Total Return3 | | | | | | | | | | | | | | | | | | | | | | | | |
Based on net asset value | | | 7.49 | %4 | | | 8.20 | % | | | 1.82 | % | | | 15.83 | % | | | 29.19 | % | | | 19.82 | % |
| | | | |
| | | | | | | | | | | | | | | | | | | | | | | | |
| Ratios to Average Net Assets | | | | | | | | | | | | | | | | | | | | | | | | |
Total expenses | | | 1.47 | %5 | | | 1.47 | %6 | | | 1.60 | %7 | | | 1.61 | %7 | | | 1.63 | %8 | | | 1.62 | %8 |
| | | | |
Total expenses after fees waived and/or reimbursed and paid indirectly | | | 1.31 | %5 | | | 1.31 | %6 | | | 1.31 | % | | | 1.34 | % | | | 1.47 | % | | | 1.51 | % |
| | | | |
Net investment income (loss) | | | (0.86 | )%5 | | | 0.27 | %6 | | | (0.18 | )% | | | (0.58 | )% | | | (0.23 | )% | | | 0.03 | % |
| | | | |
| | | | | | | | | | | | | | | | | | | | | | | | |
| Supplemental Data | | | | | | | | | | | | | | | | | | | | | | | | |
Net assets, end of period (000) | | $ | 326,653 | | | $ | 377,271 | | | $ | 404,123 | | | $ | 423,779 | | | $ | 512,224 | | | $ | 610,343 | |
| | | | |
Portfolio turnover rate | | | 46 | % | | | 72 | % | | | 64 | % | | | 66 | % | | | 82 | % | | | 106 | % |
| | | | |
| | 1 | | Based on average shares outstanding. |
| | 2 | | Distributions for annual periods determined in accordance with U.S. federal income tax regulations. |
| | 3 | | Where applicable, excludes the effects of any sales charges and assumes the reinvestment of distributions. |
| | 4 | | Aggregate total return. |
| | 6 | | Ratios do not include expenses incurred indirectly as a result of investments in underlying funds of approximately 0.01%. |
| | 7 | | Includes recoupment of past waived and/or reimbursed fees. Excluding the recoupment of past waived and/or reimbursed fees for the years ended September 30, 2015 and September 30, 2014, the ratio would have been 1.59% and 1.60%, respectively. |
| | 8 | | Includes recoupment of past waived and/or reimbursed fees with no financial impact to the expense ratio. |
See Notes to Financial Statements.
| | | | | | |
| | | BLACKROCK FUNDS | | MARCH 31, 2017 | | 75 |
| | | | |
| Financial Highlights (continued) | | | BlackRock U.S. Opportunities Portfolio | |
| | | | | | | | | | | | | | | | | | | | | | | | |
| | | Investor B | |
| | | Six Months
Ended
March 31,
2017 (Unaudited) | | | Year Ended September 30, | |
| | | | 2016 | | | 2015 | | | 2014 | | | 2013 | | | 2012 | |
| | | | | | | | | | | | | | | | | | | | | | | | |
| Per Share Operating Performance | | | | | | | | | | | | | | | | | | | | | | | | |
Net asset value, beginning of period | | $ | 28.15 | | | $ | 29.10 | | | $ | 34.37 | | | $ | 38.39 | | | $ | 30.72 | | | $ | 29.11 | |
| | | | |
Net investment loss1 | | | (0.19 | ) | | | (0.13 | ) | | | (0.32 | ) | | | (0.48 | ) | | | (0.35 | ) | | | (0.23 | ) |
Net realized and unrealized gain | | | 2.07 | | | | 2.10 | | | | 0.75 | | | | 5.31 | | | | 8.79 | | | | 5.39 | |
| | | | |
Net increase from investment operations | | | 1.88 | | | | 1.97 | | | | 0.43 | | | | 4.83 | | | | 8.44 | | | | 5.16 | |
| | | | |
Distributions from net realized gains2 | | | (1.99 | ) | | | (2.92 | ) | | | (5.70 | ) | | | (8.85 | ) | | | (0.77 | ) | | | (3.55 | ) |
| | | | |
Net asset value, end of period | | $ | 28.04 | | | $ | 28.15 | | | $ | 29.10 | | | $ | 34.37 | | | $ | 38.39 | | | $ | 30.72 | |
| | | | |
| | | | | | | | | | | | | | | | | | | | | | | | |
| Total Return3 | | | | | | | | | | | | | | | | | | | | | | | | |
Based on net asset value | | | 7.11 | %4 | | | 7.38 | % | | | 1.01 | % | | | 14.90 | % | | | 28.19 | % | | | 18.87 | % |
| | | | |
| | | | | | | | | | | | | | | | | | | | | | | | |
| Ratios to Average Net Assets | | | | | | | | | | | | | | | | | | | | | | | | |
Total expenses | | | 2.26 | %5 | | | 2.26 | %6,7 | | | 2.38 | %8 | | | 2.39 | %8 | | | 2.43 | %8 | | | 2.42 | %6 |
| | | | |
Total expenses after fees waived and/or reimbursed and paid indirectly | | | 2.05 | %5 | | | 2.05 | %7 | | | 2.10 | % | | | 2.14 | % | | | 2.26 | % | | | 2.30 | % |
| | | | |
Net investment loss | | | (1.40 | )%5 | | | (0.49 | )%7 | | | (1.00 | )% | | | (1.37 | )% | | | (1.04 | )% | | | (0.74 | )% |
| | | | |
| | | | | | | | | | | | | | | | | | | | | | | | |
| Supplemental Data | | | | | | | | | | | | | | | | | | | | | | | | |
Net assets, end of period (000) | | $ | 1,776 | | | $ | 3,997 | | | $ | 7,145 | | | $ | 10,935 | | | $ | 13,107 | | | $ | 12,833 | |
| | | | |
Portfolio turnover rate | | | 46 | % | | | 72 | % | | | 64 | % | | | 66 | % | | | 82 | % | | | 106 | % |
| | | | |
| | 1 | | Based on average shares outstanding. |
| | 2 | | Distributions for annual periods determined in accordance with U.S. federal income tax regulations. |
| | 3 | | Where applicable, excludes the effects of any sales charges and assumes the reinvestment of distributions. |
| | 4 | | Aggregate total return. |
| | 6 | | Includes recoupment of past waived and/or reimbursed fees with no financial impact to the expense ratio. |
| | 7 | | Ratios do not include expenses incurred indirectly as a result of investments in underlying funds of approximately 0.01%. |
| | 8 | | Includes recoupment of past waived and/or reimbursed fees. Excluding the recoupment of past waived and/or reimbursed fees, the ratios were as follows: |
| | | | | | | | | | | | |
| | | Year Ended September 30, | |
| | | 2015 | | | 2014 | | | 2013 | |
Expense ratios | | | 2.37 | % | | | 2.37 | % | | | 2.42 | % |
See Notes to Financial Statements.
| | | | | | |
| 76 | | BLACKROCK FUNDS | | MARCH 31, 2017 | | |
| | | | |
| Financial Highlights (concluded) | | | BlackRock U.S. Opportunities Portfolio | |
| | | | | | | | | | | | | | | | | | | | | | | | |
| | | Investor C | |
| | | Six Months
Ended
March 31,
2017 (Unaudited) | | | Year Ended September 30, | |
| | | | 2016 | | | 2015 | | | 2014 | | | 2013 | | | 2012 | |
| | | | | | | | | | | | | | | | | | | | | | | | |
| Per Share Operating Performance | | | | | | | | | | | | | | | | | | | | | | | | |
Net asset value, beginning of period | | $ | 28.15 | | | $ | 29.10 | | | $ | 34.43 | | | $ | 38.44 | | | $ | 30.75 | | | $ | 29.11 | |
| | | | |
Net investment loss1 | | | (0.23 | ) | | | (0.13 | ) | | | (0.30 | ) | | | (0.46 | ) | | | (0.33 | ) | | | (0.21 | ) |
Net realized and unrealized gain | | | 2.12 | | | | 2.10 | | | | 0.74 | | | | 5.32 | | | | 8.79 | | | | 5.39 | |
| | | | |
Net increase from investment operations | | | 1.89 | | | | 1.97 | | | | 0.44 | | | | 4.86 | | | | 8.46 | | | | 5.18 | |
| | | | |
Distributions from net realized gains2 | | | (1.99 | ) | | | (2.92 | ) | | | (5.77 | ) | | | (8.87 | ) | | | (0.77 | ) | | | (3.54 | ) |
| | | | |
Net asset value, end of period | | $ | 28.05 | | | $ | 28.15 | | | $ | 29.10 | | | $ | 34.43 | | | $ | 38.44 | | | $ | 30.75 | |
| | | | |
| | | | | | | | | | | | | | | | | | | | | | | | |
| Total Return3 | | | | | | | | | | | | | | | | | | | | | | | | |
Based on net asset value | | | 7.15 | %4 | | | 7.38 | % | | | 1.03 | % | | | 14.97 | % | | | 28.22 | % | | | 18.94 | % |
| | | | |
| | | | | | | | | | | | | | | | | | | | | | | | |
| Ratios to Average Net Assets | | | | | | | | | | | | | | | | | | | | | | | | |
Total expenses | | | 2.20 | %5 | | | 2.20 | %6,7 | | | 2.32 | %6 | | | 2.33 | %8 | | | 2.38 | % | | | 2.35 | % |
| | | | |
Total expenses after fees waived and/or reimbursed and paid indirectly | | | 2.05 | %5 | | | 2.05 | %7 | | | 2.06 | % | | | 2.09 | % | | | 2.22 | % | | | 2.25 | % |
| | | | |
Net investment loss | | | (1.66 | )%5 | | | (0.47 | )%7 | | | (0.93 | )% | | | (1.32 | )% | | | (0.98 | )% | | | (0.69 | )% |
| | | | |
| | | | | | | | | | | | | | | | | | | | | | | | |
| Supplemental Data | | | | | | | | | | | | | | | | | | | | | | | | |
Net assets, end of period (000) | | $ | 157,602 | | | $ | 173,249 | | | $ | 198,760 | | | $ | 211,493 | | | $ | 212,162 | | | $ | 226,350 | |
| | | | |
Portfolio turnover rate | | | 46 | % | | | 72 | % | | | 64 | % | | | 66 | % | | | 82 | % | | | 106 | % |
| | | | |
| | 1 | | Based on average shares outstanding. |
| | 2 | | Distributions for annual periods determined in accordance with U.S. federal income tax regulations. |
| | 3 | | Where applicable, excludes the effects of any sales charges and assumes the reinvestment of distributions. |
| | 4 | | Aggregate total return. |
| | 6 | | Includes recoupment of past waived and/or reimbursed fees with no financial impact to the expense ratio. |
| | 7 | | Ratios do not include expenses incurred indirectly as a result of investments in underlying funds of approximately 0.01%. |
| | 8 | | Includes recoupment of past waived and/or reimbursed fees. Excluding the recoupment of past waived and/or reimbursed fees for the year ended September 30, 2014, the ratio would have been 2.32%. |
See Notes to Financial Statements.
| | | | | | |
| | | BLACKROCK FUNDS | | MARCH 31, 2017 | | 77 |
| | | | |
| Notes to Financial Statements (Unaudited) | | | | |
1. Organization:
BlackRock FundsSM (the “Trust”) is registered under the Investment Company Act of 1940, as amended (the “1940 Act”), as an open-end management investment company. The Trust is organized as a Massachusetts business trust. The following are referred to herein collectively as the “Funds” or individually, a “Fund”:
| | | | |
| Fund Name | | Herein Referred To As | | Diversification Classification |
BlackRock Global Opportunities Portfolio | | Global Opportunities | | Diversified |
BlackRock Health Sciences Opportunities Portfolio | | Health Sciences Opportunities | | Non-diversified |
BlackRock International Opportunities Portfolio | | International Opportunities | | Diversified |
BlackRock Science & Technology Opportunities Portfolio | | Science & Technology Opportunities | | Diversified |
BlackRock U.S. Opportunities Portfolio | | U.S. Opportunities | | Diversified |
Each Fund offers multiple classes of shares. All classes of shares have identical voting, dividend, liquidation and other rights and are subject to the same terms and conditions, except that certain classes bear expenses related to shareholder servicing and distribution of such shares. Institutional, Service and Class K Shares are sold only to certain eligible investors. Investor B Shares are available only through exchanges, dividend and capital gain reinvestments by existing shareholders, and for purchase by certain employer-sponsored retirement plans. Investor A and Investor C Shares are generally available through financial intermediaries. Class R Shares are available only to certain employer-sponsored retirement plans.
| | | | | | | | | | | | | | | |
| Share Class | | Initial Sales Charge | | CDSC | | Conversion Privilege |
| Institutional, Service, Class K and Class R Shares | | | | No | | | | | No | | | None |
Investor A Shares | | | | Yes | | | | | No | 1 | | None |
Investor B Shares | | | | No | | | | | Yes | | | To Investor A Shares after approximately 8 years |
Investor C Shares | | | | No | | | | | Yes | | | None |
| | 1 | | Investor A Shares may be subject to a contingent deferred sales charge (“CDSC”) for certain redemptions where no initial sales charge was paid at the time of purchase. |
The Funds, together with certain other registered investment companies advised by BlackRock Advisors, LLC (the “Manager”) or its affiliates, are included in a complex of open-end funds referred to as the Equity-Liquidity Complex.
2. Significant Accounting Policies:
The financial statements are prepared in conformity with accounting principles generally accepted in the United States of America (“U.S. GAAP”), which may require management to make estimates and assumptions that affect the reported amounts of assets and liabilities in the financial statements, disclosure of contingent assets and liabilities at the date of the financial statements and the reported amounts of increases and decreases in net assets from operations during the reporting period. Actual results could differ from those estimates. Each Fund is considered an investment company under U.S. GAAP and follows the accounting and reporting guidance applicable to investment companies. Below is a summary of significant accounting policies:
Foreign Currency: Each Fund’s books and records are maintained in U.S. dollars. Purchases and sales of investments are recorded at the rates of exchange prevailing on the respective dates of such transactions. Generally, when the U.S. dollar rises in value against a foreign currency, the investments denominated in that currency will lose value; the opposite effect occurs if the U.S. dollar falls in relative value.
Each Fund does not isolate the portion of the results of operations arising as a result of changes in the exchange rates from the changes in the market prices of investments held or sold for financial reporting purposes. Accordingly, the effects of changes in exchange rates on investments are not segregated in the Statements of Operations from the effects of changes in market prices of those investments, but are included as a component of net realized and unrealized gain (loss) from investments. Each Fund reports realized currency gains (losses) on foreign currency related transactions as components of net realized gain (loss) for financial reporting purposes, whereas such components are generally treated as ordinary income for U.S. federal income tax purposes.
Segregation and Collateralization: In cases where a Fund enters into certain investments (e.g., forward foreign currency exchange contracts and options written) that would be treated as “senior securities” for 1940 Act purposes, a Fund may segregate or designate on its books and records cash or liquid assets having a market value at least equal to the amount of its future obligations under such investments. Doing so allows the investment to be excluded from treatment as a “senior security.” Furthermore, if required by an exchange or counterparty agreement, the Funds may be required to deliver/deposit cash and/or securities to/with an exchange, or broker-dealer or custodian as collateral for certain investments or obligations.
Investment Transactions and Investment Income: For financial reporting purposes, investment transactions are recorded on the dates the transactions are entered into (the trade dates). Realized gains and losses on investment transactions are determined on the identified cost basis. Dividend income is recorded on the ex-dividend date. Dividends from foreign securities where the ex-dividend date may have passed are subsequently recorded when the Funds are informed of the ex-dividend date. Under the applicable foreign tax laws, a withholding tax at various rates may be imposed on capital gains, dividends and interest. Upon notification from issuers, some of the dividend income received from a real estate investment trust may be redesignated as a reduction of cost of the related investment and/or realized gain. Interest income, including amortization and accretion of premiums and
| | | | | | |
| 78 | | BLACKROCK FUNDS | | MARCH 31, 2017 | | |
| | | | |
| Notes to Financial Statements (continued) | | | | |
discounts on debt securities, is recognized on the accrual basis. Income, expenses and realized and unrealized gains and losses are allocated daily to each class based on its relative net assets.
Distributions: Distributions paid by the Funds are recorded on the ex-dividend dates. Distributions of capital gains are recorded on the ex-dividend date and made at least annually. The character and timing of distributions are determined in accordance with U.S. federal income tax regulations, which may differ from U.S. GAAP.
Offering Costs: Offering costs are amortized over a 12-month period beginning with the commencement of operations.
Recent Accounting Standard: In April 2015, the Financial Accounting Standards Board issued “Disclosures for Investments in Certain Entities that Calculate Net Asset Value (“NAV”) per Share” which eliminates the requirement to categorize investments within the fair value hierarchy when fair value is based on the NAV per share and no quoted market value is available. As of March 31, 2017, certain investments of the Fund were valued using NAV per share as no quoted market value is available and therefore have been excluded from the fair value hierarchy.
Indemnifications: In the normal course of business, a Fund enters into contracts that contain a variety of representations that provide general indemnification. A Fund’s maximum exposure under these arrangements is unknown because it involves future potential claims against a Fund, which cannot be predicted with any certainty.
Other: Expenses directly related to a Fund or its classes are charged to that Fund or the applicable class. Other operating expenses shared by several funds, including other funds managed by the Manager, are prorated among those funds on the basis of relative net assets or other appropriate methods. Expenses directly related to the Funds and other shared expenses prorated to the Funds are allocated daily to each class based on their relative net assets or other appropriate methods.
The Funds have an arrangement with their custodian whereby credits are earned on uninvested cash balances, which could be used to reduce custody fees and/or overdraft charges. The Funds may incur charges on certain uninvested cash balances and overdrafts, subject to certain conditions.
3. Investment Valuation and Fair Value Measurements:
Investment Valuation Policies: The Funds’ investments are valued at fair value (also referred to as “market value” within the financial statements) as of the close of trading on the New York Stock Exchange (“NYSE”) (generally 4:00 p.m., Eastern time). U.S. GAAP defines fair value as the price the Funds would receive to sell an asset or pay to transfer a liability in an orderly transaction between market participants at the measurement date. The Funds determine the fair values of their financial instruments using various independent dealers or pricing services under policies approved by the Board of Trustees of the Trust (the “Board”). The BlackRock Global Valuation Methodologies Committee (the “Global Valuation Committee”) is the committee formed by management to develop global pricing policies and procedures and to oversee the pricing function for all financial instruments.
Fair Value Inputs and Methodologies: The following methods and inputs are used to establish the fair value of each Fund’s assets and liabilities:
| • | | Equity investments traded on a recognized securities exchange are valued at the official closing price each day, if available. For equity investments traded on more than one exchange, the official closing price on the exchange where the stock is primarily traded is used. Equity investments traded on a recognized exchange for which there were no sales on that day may be valued at the last available bid (long positions) or ask (short positions) price. |
Generally, trading in foreign instruments is substantially completed each day at various times prior to the close of trading on the NYSE. Occasionally, events affecting the values of such instruments may occur between the foreign market close and the close of trading on the NYSE that may not be reflected in the computation of the Funds’ net assets. Each business day, the Funds use a pricing service to assist with the valuation of certain foreign exchange-traded equity securities and foreign exchange-traded and over-the-counter (“OTC”) options (the “Systematic Fair Value Price”). Using current market factors, the Systematic Fair Value Price is designed to value such foreign securities and foreign options at fair value as of the close of trading on the NYSE, which follows the close of the local markets.
| • | | Investments in open-end U.S. mutual funds are valued at NAV each business day. |
| • | | The Funds value their investment in SL Liquidity Series, LLC, Money Market Series (the “Money Market Series”) at fair value, which is ordinarily based upon their pro rata ownership in the underlying fund’s net assets. The Money Market Series seeks current income consistent with maintaining liquidity and preserving capital. Although the Money Market Series is not registered under the 1940 Act, its investments may follow the parameters of investments by a money market fund that is subject to Rule 2a-7 under the 1940 Act. |
| • | | Futures contracts traded on exchanges are valued at their last sale price. |
| • | | Securities and other assets and liabilities denominated in foreign currencies are translated into U.S. dollars using exchange rates determined as of the close of trading on the NYSE. Forward foreign currency exchange contracts are valued at the mean between the bid and ask prices and are determined as of the close of trading on the NYSE. Interpolated values are derived when the settlement date of the contract is an interim date for which quotations are not available. |
| | | | | | |
| | | BLACKROCK FUNDS | | MARCH 31, 2017 | | 79 |
| | | | |
| Notes to Financial Statements (continued) | | | | |
| • | | Exchange-traded options are valued at the mean between the last bid and ask prices at the close of the options market in which the options trade. An exchange-traded option for which there is no mean price is valued at the last bid (long positions) or ask (short positions) price. If no bid or ask price is available, the prior day’s price will be used, unless it is determined that the prior day’s price no longer reflects the fair value of the option. OTC options are valued by an independent pricing service using a mathematical model, which incorporates a number of market data factors, such as the trades and prices of the underlying instruments. |
If events (e.g., a company announcement, market volatility or a natural disaster) occur that are expected to materially affect the value of such investments, or in the event that the application of these methods of valuation results in a price for an investment that is deemed not to be representative of the market value of such investment, or if a price is not available, the investment will be valued by the Global Valuation Committee, or its delegate, in accordance with a policy approved by the Board as reflecting fair value (“Fair Valued Investments”). The fair valuation approaches that may be used by the Global Valuation Committee will include Market approach, Income approach and Cost approach. Valuation techniques such as discounted cash flow, use of market comparables and matrix pricing are types of valuation approaches and typically used in determining fair value. When determining the price for Fair Valued Investments, the Global Valuation Committee, or its delegate, seeks to determine the price that each Fund might reasonably expect to receive or pay from the current sale or purchase of that asset or liability in an arm’s-length transaction. Fair value determinations shall be based upon all available factors that the Global Valuation Committee, or its delegate, deems relevant and consistent with the principles of fair value measurement.
The Global Valuation Committee, or its delegate, employs various methods for calibrating valuation approaches for investments where an active market does not exist, including regular due diligence of each Fund’s pricing vendors, regular reviews of key inputs and assumptions, transactional back-testing or disposition analysis to compare unrealized gains and losses to realized gains and losses, reviews of missing or stale prices and large movements in market values and reviews of any market related activity. The pricing of all Fair Valued Investments is subsequently reported to the Board or a committee thereof on a quarterly basis. As a result of the inherent uncertainty in valuation of these investments, the fair values may differ from the values that would have been used had an active market existed.
For investments in equity or debt issued by privately-held companies or funds (“Private Company” or collectively, the “Private Companies”) and other Fair Valued Investments, the fair valuation approaches that are used by third party pricing services utilize one or a combination of, but not limited to, the following inputs.
| | | | |
| | Standard Inputs Generally Considered By Third Party Pricing Services |
| Market approach | | (i) | | recent market transactions, including subsequent rounds of financing, in the underlying investment or comparable issuers; |
| | (ii) | | recapitalizations and other transactions across the capital structure; and |
| | (iii) | | market multiples of comparable issuers. |
| Income approach | | (i) | | future cash flows discounted to present and adjusted as appropriate for liquidity, credit and/or market risks; |
| | (ii) | | quoted prices for similar investments or assets in active markets; and |
| | (iii) | | other risk factors, such as interest rates, yield curves, volatilities, prepayment speeds, loss severities, credit risks, recovery rates, liquidation amounts and/or default rates. |
| Cost approach | | (i) | | audited or unaudited financial statements, investor communications and financial or operational metrics issued by the Private Company; |
| | (ii) | | changes in the valuation of relevant indices or publicly traded companies comparable to the Private Company; |
| | (iii) | | relevant news and other public sources; and |
| | | (iv) | | known secondary market transactions in the Private Company’s interests and merger or acquisition activity in companies comparable to the Private Company. |
Investments in series of preferred stock issued by Private Companies are typically valued utilizing Market approach in determining the enterprise value of the company. Such investments often contain rights and preferences that differ from other series of preferred and common stock of the same issuer. Valuation techniques such as an option pricing model (“OPM”), a probability weighted expected return model (“PWERM”) or a hybrid of those techniques are used in allocating enterprise value of the company, as deemed appropriate under the circumstances. The use of OPM and PWERM techniques involve a determination of the exit scenarios of the investment in order to appropriately allocate the enterprise value of the company among the various parts of its capital structure.
The Private Companies are not subject to the public company disclosure, timing, and reporting standards as other investments held by a Fund. Typically, the most recently available information by a Private Company is as of a date that is earlier than the date a Fund is calculating its NAV. This factor may result in a difference between the value of the investment and the price a Fund could receive upon the sale of the investment.
| | | | | | |
| 80 | | BLACKROCK FUNDS | | MARCH 31, 2017 | | |
| | | | |
| Notes to Financial Statements (continued) | | | | |
Fair Value Hierarchy: Various inputs are used in determining the fair value of investments and derivative financial instruments. These inputs to valuation techniques are categorized into a fair value hierarchy consisting of three broad levels for financial statement purposes as follows:
| • | | Level 1 — unadjusted price quotations in active markets/exchanges for identical assets or liabilities that each Fund has the ability to access |
| • | | Level 2 — other observable inputs (including, but not limited to, quoted prices for similar assets or liabilities in markets that are active, quoted prices for identical or similar assets or liabilities in markets that are not active, inputs other than quoted prices that are observable for the assets or liabilities (such as interest rates, yield curves, volatilities, prepayment speeds, loss severities, credit risks and default rates) or other
market–corroborated inputs) |
| • | | Level 3 — unobservable inputs based on the best information available in the circumstances, to the extent observable inputs are not available (including each Fund’s own assumptions used in determining the fair value of investments and derivative financial instruments) |
The hierarchy gives the highest priority to unadjusted quoted prices in active markets for identical assets or liabilities (Level 1 measurements) and the lowest priority to unobservable inputs (Level 3 measurements). Accordingly, the degree of judgment exercised in determining fair value is greatest for instruments categorized in Level 3. The inputs used to measure fair value may fall into different levels of the fair value hierarchy. In such cases, for disclosure purposes, the fair value hierarchy classification is determined based on the lowest level input that is significant to the fair value measurement in its entirety. Investments classified within Level 3 have significant unobservable inputs used by the Global Valuation Committee in determining the price for Fair Valued Investments. Level 3 investments include equity or debt issued by Private Companies. There may not be a secondary market, and/or there are a limited number of investors. Level 3 investments may also be adjusted to reflect illiquidity and/or non-transferability, with the amount of such discount estimated by the Global Valuation Committee in the absence of market information.
Changes in valuation techniques may result in transfers into or out of an assigned level within the hierarchy. In accordance with each Fund’s policy, transfers between different levels of the fair value hierarchy are deemed to have occurred as of the beginning of the reporting period. The categorization of a value determined for investments and derivative financial instruments is based on the pricing transparency of the investments and derivative financial instruments and is not necessarily an indication of the risks associated with investing in those securities.
4. Securities and Other Investments:
Preferred Stocks: Preferred stock has a preference over common stock in liquidation (and generally in receiving dividends as well), but is subordinated to the liabilities of the issuer in all respects. As a general rule, the market value of preferred stock with a fixed dividend rate and no conversion element varies inversely with interest rates and perceived credit risk, while the market price of convertible preferred stock generally also reflects some element of conversion value. Because preferred stock is junior to debt securities and other obligations of the issuer, deterioration in the credit quality of the issuer will cause greater changes in the value of a preferred stock than in a more senior debt security with similar stated yield characteristics. Unlike interest payments on debt securities, preferred stock dividends are payable only if declared by the issuer’s board of directors. Preferred stock also may be subject to optional or mandatory redemption provisions.
Securities Lending: Certain Funds may lend their securities to approved borrowers, such as brokers, dealers and other financial institutions. The borrower pledges and maintains with the Funds collateral consisting of cash, an irrevocable letter of credit issued by a bank, or securities issued or guaranteed by the U.S. Government. The initial collateral received by each Fund is required to have a value of at least 102% of the current value of the loaned securities for securities traded on U.S. exchanges and a value of at least 105% for all other securities. The collateral is maintained thereafter at a value equal to at least 100% of the current market value of the securities on loan. The market value of the loaned securities is determined at the close of each business day of the Fund and any additional required collateral is delivered to the Fund, or excess collateral returned by the Fund, on the next business day. During the term of the loan, the Funds are entitled to all distributions made on or in respect of the loaned securities but does not receive interest income on securities received as collateral. Loans of securities are terminable at any time and the borrower, after notice, is required to return borrowed securities within the standard time period for settlement of securities transactions.
The market value of any securities on loan, all of which were classified as common stocks in the Funds’ Schedules of Investments, and the value of any related collateral are shown separately in the Statements of Assets and Liabilities as a component of investments at value — unaffiliated, and collateral on securities loaned at value, respectively. As of period end, any securities on loan were collateralized by cash and/or U.S. Government obligations. Cash collateral invested by the securities lending agent, BlackRock Investment Management, LLC (“BIM”), if any, is disclosed in the Schedules of Investments.
Securities lending transactions are entered into by the Funds under Master Securities Lending Agreements (each, an “MSLA”), which provide the right, in the event of default (including bankruptcy or insolvency), for the non-defaulting party to liquidate the collateral and calculate a net exposure to the defaulting party or request additional collateral. In the event that a borrower defaults, the Funds, as lender, would offset the market value of the collateral received against the market value of the securities loaned. When the value of the collateral is greater than that of the market value of the securities loaned, the lender is left with a net amount payable to the defaulting party. However, bankruptcy or insolvency laws of a particular jurisdiction may impose restrictions on or prohibitions against such a right of offset in the event of an MSLA counterparty’s bankruptcy or insolvency. Under the MSLA,
| | | | | | |
| | | BLACKROCK FUNDS | | MARCH 31, 2017 | | 81 |
| | | | |
| Notes to Financial Statements (continued) | | | | |
absent an event of default, the borrower can resell or re-pledge the loaned securities, and a Fund can reinvest cash collateral received in connection with loaned securities. Upon an event of default, the parties’ obligations to return the securities or collateral to the other party are extinguished, and the parties can resell or re-pledge the loaned securities or the collateral received in connection with the loaned securities in order to satisfy the defaulting party’s net payment obligation for all transactions under the MSLA. The defaulting party remains liable for any deficiency.
As of period end, the following tables are a summary of the Funds’ securities lending agreements by counterparty which are subject to offset under an MSLA:
| | | | | | | | | | | | | | | | | | | | |
| Global Opportunities | | | | | | | | |
| Counterparty | | | | Securities Loaned
at Value | | Cash Collateral
Received1 | | Net
Amount |
Goldman Sachs & Co. | | | | | | | | | $1,020,745 | | | | | $(1,020,745) | | | | | — | |
| | | | | |
Total | | | | | | | | | $1,020,745 | | | | | $(1,020,745) | | | | | — | |
| | | | | |
| | | | | | | | | | | | | | | | | | | | |
| Health Sciences Opportunities | | | | | | | | |
| Counterparty | | | | Securities Loaned
at Value | | Cash Collateral
Received1 | | Net
Amount |
Morgan Stanley | | | | | | | | | $2,775,000 | | | | | $(2,775,000) | | | | | — | |
| | | | | |
Total | | | | | | | | | $2,775,000 | | | | | $(2,775,000) | | | | | — | |
| | | | | |
| | | | | | | | | | | | | | | | | | | | |
| Science & Technology Opportunities | | | | | | | | |
| Counterparty | | | | Securities Loaned
at Value | | Cash Collateral
Received1 | | Net
Amount |
Barclays Capital, Inc. | | | | | | | | | $ 470,581 | | | | | $ (470,581) | | | | | — | |
Goldman Sachs & Co. | | | | | | | | | 737,206 | | | | | (737,206) | | | | | — | |
| | | | | |
Total | | | | | | | | | $1,207,787 | | | | | $(1,207,787) | | | | | — | |
| | | | | |
| | | | | | | | | | | | | | | | | | | | |
| U.S. Opportunities | | | | | | | | |
| Counterparty | | | | Securities Loaned
at Value | | Cash Collateral
Received1 | | Net
Amount2 |
BNP Paribas S.A | | | | | | | | | $1,368,510 | | | | | $(1,368,510) | | | | | — | |
Credit Suisse Securities (USA) LLC | | | | | | | | | 109,220 | | | | | (109,220) | | | | | — | |
Deutsche Bank Securities Inc. | | | | | | | | | 3,704 | | | | | (3,704) | | | | | — | |
Goldman Sachs & Co. | | | | | | | | | 2,915,062 | | | | | (2,915,035) | | | | | $27 | |
Merrill Lynch, Pierce, Fenner & Smith, Inc. | | | | | | | | | 1,430,430 | | | | | (1,430,430) | | | | | — | |
Morgan Stanley | | | | | | | | | 470,871 | | | | | (470,871) | | | | | — | |
National Financial Services LLC | | | | | | | | | 190,500 | | | | | (190,500) | | | | | — | |
State Street Bank and Trust Co. | | | | | | | | | 281,940 | | | | | (281,940) | | | | | — | |
| | | | | |
Total | | | | | | | | | $6,770,237 | | | | | $(6,770,210) | | | | | $27 | |
| | | | | |
| | 1 | | Cash collateral with a value of $1,048,523, $2,858,476, $1,231,205 and $6,891,626 has been received in connection with securities lending agreements for Global Opportunities, Health Sciences Opportunities, Science & Technology Opportunities and U.S. Opportunities, respectively. Collateral received in excess of the value of securities loaned from the individual counterparty is not shown for financial reporting purposes in the tables above. |
| | 2 | | The market value of the loaned securities is determined as of March 31, 2017. Additional collateral is delivered to the Fund on the next business day in accordance with the MSLA. The net amount would be subject to the borrower default indemnity in the event of default by the counterparty. |
The risks of securities lending include the risk that the borrower may not provide additional collateral when required or may not return the securities when due. To mitigate these risks, the Funds benefit from a borrower default indemnity provided by BIM. BIM’s indemnity allows for full replacement of the securities loaned if the collateral received does not cover the value on the securities loaned in the event of borrower default. Each Fund could incur a loss if the value of an investment purchased with cash collateral falls below the market value of loaned securities or if the value of an investment purchased with cash collateral falls below the value of the original cash collateral received.
| | | | | | |
| 82 | | BLACKROCK FUNDS | | MARCH 31, 2017 | | |
| | | | |
| Notes to Financial Statements (continued) | | | | |
5. Derivative Financial Instruments:
The Funds engage in various portfolio investment strategies using derivative contracts both to increase the returns of the Funds and/or to manage their exposure to certain risks such as equity risk or foreign currency exchange rate risk. Derivative financial instruments categorized by risk exposure are included in the Schedules of Investments. These contracts may be transacted on an exchange or OTC.
Forward Foreign Currency Exchange Contracts: Certain Funds enter into forward foreign currency exchange contracts to gain or reduce exposure to foreign currencies (foreign currency exchange rate risk).
A forward foreign currency exchange contract is an agreement between two parties to buy and sell a currency at a set exchange rate on a specified date. These contracts help to manage the overall exposure to the currencies in which some of the investments held by the Funds are denominated and in some cases, may be used to obtain exposure to a particular market.
The contract is marked to market daily and the change in market value is recorded as unrealized appreciation (depreciation) in the Statements of Assets and Liabilities. When a contract is closed, a realized gain or loss is recorded in the Statements of Operations equal to the difference between the value at the time it was opened and the value at the time it was closed. Non-deliverable forward foreign currency exchange contracts are settled with the counterparty in cash without the delivery of foreign currency. The use of forward foreign currency exchange contracts involves the risk that the value of a forward foreign currency exchange contract changes unfavorably due to movements in the value of the referenced foreign currencies.
Options: Certain Funds purchase and write call and put options to increase or decrease their exposure to the risks of underlying instruments, including equity risk, interest rate risk and/or commodity price risk and/or, in the case of options written, to generate gains from options premiums.
A call option gives the purchaser (holder) of the option the right (but not the obligation) to buy, and obligates the seller (writer) to sell (when the option is exercised) the underlying instrument at the exercise or strike price at any time or at a specified time during the option period. A put option gives the holder the right to sell and obligates the writer to buy the underlying instrument at the exercise or strike price at any time or at a specified time during the option period.
Premiums paid on options purchased and premiums received on options written, as well as the daily fluctuation in market value, are included in investments at value — unaffiliated and options written at value, respectively, in the Statements of Assets and Liabilities. When an instrument is purchased or sold through the exercise of an option, the premium is offset against the cost or proceeds of the underlying instrument. When an option expires, a realized gain or loss is recorded in the Statements of Operations to the extent of the premiums received or paid. When an option is closed or sold, a gain or loss is recorded in the Statements of Operations to the extent the cost of the closing transaction exceeds the premiums received or paid. When the Funds write a call option, such option is typically “covered,” meaning that they hold the underlying instrument subject to being called by the option counterparty. When the Funds write a put option, such option is covered by cash in an amount sufficient to cover the obligation.
In purchasing and writing options, the Funds bear the risk of an unfavorable change in the value of the underlying instrument or the risk that they may not be able to enter into a closing transaction due to an illiquid market. Exercise of a written option could result in the Funds purchasing or selling a security when it otherwise would not, or at a price different from the current market value.
Master Netting Arrangements: In order to define their contractual rights and to secure rights that will help them mitigate their counterparty risk, the Funds may enter into an International Swaps and Derivatives Association, Inc. Master Agreement (“ISDA Master Agreement”) or similar agreement with their counterparties. An ISDA Master Agreement is a bilateral agreement between each Fund and a counterparty that governs certain OTC derivatives and typically contains, among other things, collateral posting terms and netting provisions in the event of a default and/or termination event. Under an ISDA Master Agreement, each Fund may, under certain circumstances, offset with the counterparty certain derivative financial instruments’ payables and/or receivables with collateral held and/or posted and create one single net payment. The provisions of the ISDA Master Agreement typically permit a single net payment in the event of default including the bankruptcy or insolvency of the counterparty. Bankruptcy or insolvency laws of a particular jurisdiction may restrict or prohibit the right of offset in bankruptcy, insolvency or other events. In addition, certain ISDA Master Agreements allow counterparties to terminate derivative contracts prior to maturity in the event the Funds’ net assets decline by a stated percentage or the Funds fail to meet the terms of their ISDA Master Agreements. The result would cause the Funds to accelerate payment of any net liability owed to the counterparty.
Collateral Requirements: For derivatives traded under an ISDA Master Agreement, the collateral requirements are typically calculated by netting the mark-to-market amount for each transaction under such agreement and comparing that amount to the value of any collateral currently pledged by the Fund and the counterparty.
Cash collateral that has been pledged to cover obligations of the Funds and cash collateral received from the counterparty, if any, is reported separately on the Statements of Assets and Liabilities as cash pledged as collateral and cash received as collateral, respectively. Non-cash collateral pledged by the Funds, if any, is noted in the Schedules of Investments. Generally, the amount of collateral due from or to a counterparty is subject to a certain minimum transfer amount threshold before a transfer is required, which is determined at the close of business of the Funds. Any additional required
| | | | | | |
| | | BLACKROCK FUNDS | | MARCH 31, 2017 | | 83 |
| | | | |
| Notes to Financial Statements (continued) | | | | |
collateral is delivered to/pledged by the Funds on the next business day. Typically, the counterparty is not permitted to sell, re-pledge or use cash and non-cash collateral it receives. A Fund generally agrees not to use non-cash collateral that it receives but may, absent default or certain other circumstances defined in the underlying ISDA Master Agreement, be permitted to use cash collateral received. In such cases, interest may be paid pursuant to the collateral arrangement with the counterparty. To the extent amounts due to the Funds from their counterparties are not fully collateralized, they bear the risk of loss from counterparty non-performance. Likewise, to the extent the Funds have delivered collateral to a counterparty and stand ready to perform under the terms of their agreement with such counterparty, they bear the risk of loss from a counterparty in the amount of the value of the collateral in the event the counterparty fails to return such collateral. Based on the terms of agreements, collateral may not be required for all derivative contacts.
For financial reporting purposes, the Funds do not offset derivative assets and derivative liabilities that are subject to netting arrangements, if any, in the Statements of Assets and Liabilities.
6. Investment Advisory Agreement and Other Transactions with Affiliates:
The PNC Financial Services Group, Inc. is the largest stockholder and an affiliate of BlackRock, Inc. (“BlackRock”) for 1940 Act purposes.
Investment Advisory: The Trust, on behalf of the Funds, entered into an Investment Advisory Agreement with the Manager, the Funds’ investment adviser, an indirect, wholly-owned subsidiary of BlackRock, to provide investment advisory services. The Manager is responsible for the management of each Fund’s portfolio and provides the personnel, facilities, equipment and certain other services necessary to the operations of each Fund.
For such services, each Fund pays the Manager a monthly fee, which is determined by calculating a percentage of each Fund’s average daily net assets at the following annual rates:
| | | | | | | | | | |
| | | Global
Opportunities | | Health Sciences
Opportunities | | International
Opportunities | | Science & Technology
Opportunities | | U.S. Opportunities |
| Average Daily Net Assets | | Investment Advisory Fees |
First $1 Billion | | 0.900% | | 0.750% | | 1.000% | | 0.900% | | 0.950% |
$1 Billion - $2 Billion | | 0.850% | | 0.700% | | 0.950% | | 0.850% | | 0.900% |
$2 Billion - $3 Billion | | 0.800% | | 0.675% | | 0.900% | | 0.800% | | 0.875% |
Greater than $3 Billion | | 0.750% | | 0.650% | | 0.850% | | 0.750% | | 0.850% |
With respect to International Opportunities, the Manager entered into a separate sub-advisory agreement with BlackRock International Limited (“BIL”), an affiliate of the Manager. The Manager pays BIL, for services it provides, a monthly fee that is a percentage of the investment advisory fees paid by the Fund to the Manager.
Service and Distribution Fees: The Trust, on behalf of the Funds, entered into a Distribution Agreement and a Distribution and Service Plan with BlackRock Investments, LLC (“BRIL”), an affiliate of the Manager. Pursuant to the Distribution and Service Plan and in accordance with Rule 12b-1 under the 1940 Act, each Fund pays BRIL ongoing service and distribution fees. The fees are accrued daily and paid monthly at annual rates based upon the average daily net assets of the relevant share class of each Fund as follows:
| | | | | | | | | | | | | | | | | | | | |
| | | Service | | | Investor A | | | Investor B | | | Investor C | | | Class R | |
Service Fee | | | 0.25 | % | | | 0.25 | % | | | 0.25 | % | | | 0.25 | % | | | 0.25 | % |
Distribution Fee | | | — | | | | — | | | | 0.75 | % | | | 0.75 | % | | | 0.25 | % |
BRIL and broker-dealers, pursuant to sub-agreements with BRIL, provide shareholder servicing and distribution services to the Funds. The ongoing service and/or distribution fee compensates BRIL and each broker-dealer for providing shareholder servicing and/or distribution related services to the shareholders.
For the six months ended March 31, 2017, the following table shows the class specific service and distribution fees borne directly by each share class of each Fund:
| | | | | | | | | | | | | | | | | | | | | | | | |
| | | Service | | | Investor A | | | Investor B | | | Investor C | | | Class R | | | Total | |
Global Opportunities | | | — | | | $ | 184,982 | | | | — | | | $ | 205,763 | | | $ | 19,860 | | | $ | 410,605 | |
Health Sciences Opportunities | | $ | 37,136 | | | $ | 3,075,632 | | | $ | 19,605 | | | $ | 5,115,203 | | | $ | 415,384 | | | $ | 8,662,960 | |
International Opportunities | | $ | 13,588 | | | $ | 447,590 | | | $ | 2,359 | | | $ | 340,887 | | | | — | | | $ | 804,424 | |
Science & Technology Opportunities | | $ | 3,081 | | | $ | 225,766 | | | | — | | | $ | 309,549 | | | $ | 17,160 | | | $ | 555,556 | |
U.S. Opportunities | | $ | 28,275 | | | $ | 442,041 | | | $ | 13,944 | | | $ | 809,336 | | | | — | | | $ | 1,293,596 | |
| | | | | | |
| 84 | | BLACKROCK FUNDS | | MARCH 31, 2017 | | |
| | | | |
| Notes to Financial Statements (continued) | | | | |
Administration: The Trust, on behalf of the Funds, entered into an Administration Agreement with the Manager, an indirect, wholly-owned subsidiary of BlackRock, to provide administrative services. For these services, the Manager receives an administration fee computed daily and payable monthly, based on a percentage of the average daily net assets of each Fund. The administration fee, which is shown as administration in the Statements of Operations, is paid at the annual rates below.
| | |
| Average Daily Net Assets | | Administration Fee |
First $500 Million | | 0.0425% |
$500 Million - $1 Billion | | 0.0400% |
$1 Billion - $2 Billion | | 0.0375% |
$2 Billion - $4 Billion | | 0.0350% |
$4 Billion - $13 Billion | | 0.0325% |
Greater than $13 Billion | | 0.0300% |
In addition, the Manager charges each of the share classes an administration fee, which is shown as administration — class specific in the Statements of Operations, at an annual rate of 0.02% of the average daily net assets of each respective class.
For the six months ended March 31, 2017, the following table shows the class specific administration fees borne directly by each class of each Fund:
| | | | | | | | | | | | | | | | | | | | | | | | | | | | | | | | | | | | | | | | |
| | | | | | | Share Classes | | | | | | | | |
| | | Institutional | | Service | | Investor A | | Investor B | | Investor C | | Class K | | Class R | | Total |
Global Opportunities | | | $ | 5,381 | | | | | — | | | | $ | 14,799 | | | | | — | | | | $ | 4,115 | | | | | — | | | | $ | 794 | | | | $ | 25,089 | |
Health Sciences Opportunities | | | $ | 154,400 | | | | $ | 2,971 | | | | $ | 246,051 | | | | $ | 392 | | | | $ | 102,304 | | | | $ | 243 | | | | $ | 16,615 | | | | $ | 522,976 | |
International Opportunities | | | $ | 29,754 | | | | $ | 1,087 | | | | $ | 35,807 | | | | $ | 47 | | | | $ | 6,818 | | | | | — | | | | | — | | | | $ | 73,513 | |
Science & Technology Opportunities | | | $ | 8,149 | | | | $ | 247 | | | | $ | 18,061 | | | | | — | | | | $ | 6,191 | | | | | — | | | | $ | 687 | | | | $ | 33,335 | |
U.S. Opportunities | | | $ | 68,249 | | | | $ | 2,262 | | | | $ | 35,363 | | | | $ | 279 | | | | $ | 16,187 | | | | | — | | | | | — | | | | $ | 122,340 | |
The Manager may have, at its discretion, voluntarily waived all or any portion of its administration fees for a Fund or a share class, which are included in administration fees waived — class specific in the Statements of Operations.
Transfer Agent: Pursuant to written agreements, certain financial intermediaries, some of which may be affiliates, provide the Funds with sub-accounting, recordkeeping, sub-transfer agency and other administrative services with respect to sub-accounts they service. For these services, these entities receive an asset-based fee or an annual fee per shareholder account, which will vary depending on share class and/or net assets. For the six months ended March 31, 2017, the Funds paid the following amounts to affiliates of BlackRock in return for these services, which are included in transfer agent — class specific in the Statements of Operations:
| | | | | | | | | | | | | | | | | | | | |
| | | Institutional | | Service | | Investor A | | Total |
Global Opportunities | | | | — | | | | | — | | | | $ | 36 | | | | $ | 36 | |
Health Sciences Opportunities | | | $ | 510 | | | | | — | | | | $ | 321 | | | | $ | 831 | |
International Opportunities | | | $ | 37,856 | | | | $ | 279 | | | | $ | 1,409 | | | | $ | 39,544 | |
Science & Technology Opportunities | | | | — | | | | | — | | | | $ | 1,710 | | | | $ | 1,710 | |
U.S. Opportunities | | | $ | 3,150 | | | | $ | 57 | | | | $ | 3,328 | | | | $ | 6,535 | |
The Manager maintains a call center that is responsible for providing certain shareholder services to the Funds. Shareholder services include responding to inquiries and processing subscriptions and redemptions based upon instructions from shareholders. For the six months ended March 31, 2017, each Fund reimbursed the Manager the following amounts for costs incurred in running the call center, which are included in transfer agent — class specific in the Statements of Operations:
| | | | | | | | | | | | | | | | | | | | | | | | | | | | | | | | | | | | | | | | |
| | | Institutional | | Service | | Investor A | | Investor B | | Investor C | | Class K | | Class R | | Total |
Global Opportunities | | | $ | 1,155 | | | | | — | | | | $ | 3,101 | | | | | — | | | | $ | 617 | | | | | — | | | | $ | 2 | | | | $ | 4,875 | |
Health Sciences Opportunities | | | $ | 6,070 | | | | $ | 142 | | | | $ | 37,584 | | | | $ | 803 | | | | $ | 11,279 | | | | $ | 2 | | | | $ | 637 | | | | $ | 56,517 | |
International Opportunities | | | $ | 1,134 | | | | | — | | | | $ | 6,890 | | | | $ | 138 | | | | $ | 1,522 | | | | | — | | | | | — | | | | $ | 9,684 | |
Science & Technology Opportunities | | | $ | 2,895 | | | | $ | 17 | | | | $ | 4,969 | | | | | — | | | | $ | 1,661 | | | | | — | | | | $ | 15 | | | | $ | 9,557 | |
U.S. Opportunities | | | | — | | | | | — | | | | $ | 9,311 | | | | $ | 186 | | | | $ | 2,306 | | | | | — | | | | | — | | | | $ | 11,803 | |
| | | | | | |
| | | BLACKROCK FUNDS | | MARCH 31, 2017 | | 85 |
| | | | |
| Notes to Financial Statements (continued) | | | | |
For the six months ended March 31, 2017, the following table shows the class specific transfer agent fees borne directly by each class of each Fund:
| | | | | | | | | | | | | | | | | | | | | | | | | | | | | | | | | | | | | | | | |
| | | Institutional | | Service | | Investor A | | Investor B | | Investor C | | Class K | | Class R | | Total |
Global Opportunities | | | $ | 32,391 | | | | | — | | | | $ | 105,625 | | | | | — | | | | $ | 34,452 | | | | | — | | | | $ | 8,874 | | | | $ | 181,342 | |
Health Sciences Opportunities | | | $ | 901,562 | | | | $ | 20,392 | | | | $ | 1,753,869 | | | | $ | 5,935 | | | | $ | 614,938 | | | | $ | 7 | | | | $ | 174,628 | | | | $ | 3,471,331 | |
International Opportunities | | | $ | 179,550 | | | | $ | 6,112 | | | | $ | 326,936 | | | | $ | 1,376 | | | | $ | 65,525 | | | | | — | | | | | — | | | | $ | 579,499 | |
Science & Technology Opportunities | | | $ | 69,149 | | | | $ | 1,977 | | | | $ | 186,733 | | | | | — | | | | $ | 72,841 | | | | | — | | | | $ | 8,684 | | | | $ | 339,384 | |
U.S. Opportunities | | | $ | 523,431 | | | | $ | 7,957 | | | | $ | 292,543 | | | | $ | 2,901 | | | | $ | 115,425 | | | | | — | | | | | — | | | | $ | 942,257 | |
Other Fees: For the six months ended March 31, 2017, affiliates earned underwriting discounts, direct commissions and dealer concessions on sales of each Fund’s Investor A Shares as follows:
| | | | |
Global Opportunities | | $ | 734 | |
Health Sciences Opportunities | | $ | 79,398 | |
International Opportunities | | $ | 3,256 | |
Science & Technology Opportunities | | $ | 14,552 | |
U.S. Opportunities | | $ | 12,842 | |
For the six months ended March 31, 2017, affiliates received CDSCs as follows:
| | | | | | | | | | | | | | | |
| | | Investor A | | Investor B | | Investor C |
Global Opportunities | | | $ | 305 | | | | | — | | | | $ | 231 | |
Health Sciences Opportunities | | | $ | 24,661 | | | | $ | 50 | | | | $ | 55,933 | |
International Opportunities | | | $ | 3,388 | | | | | — | | | | $ | 1,492 | |
Science & Technology Opportunities | | | $ | 353 | | | | | — | | | | $ | 5,603 | |
U.S. Opportunities | | | $ | 10,612 | | | | | — | | | | $ | 3,172 | |
Expense Limitations, Waivers, Reimbursements and Recoupments: With respect to each Fund, the Manager contractually agreed to waive and/or reimburse fees or expenses in order to limit expenses, excluding interest expense, dividend expense, tax expense, acquired fund fees and expenses, and certain other fund expenses, which constitute extraordinary expenses not incurred in the ordinary course of each Fund’s business (“expense limitation”). The expense limitations as a percentage of average daily net assets are as follows:
| | | | | | | | | | | | | | | | |
| | | Global
Opportunities | | Health Sciences
Opportunities | | International
Opportunities | | Science & Technology
Opportunities | | U.S.
Opportunities |
Institutional | | 1.06% | | N/A | | 1.06% | | 1.23% | | 1.01%1 |
Service | | 1.70%2 | | N/A | | 1.39% | | 1.55% | | 1.31% |
Investor A | | 1.33% | | N/A | | 1.39% | | 1.55% | | 1.31% |
Investor B | | N/A | | N/A | | 2.26% | | N/A | | 2.05% |
Investor C | | 2.14% | | N/A | | 2.13% | | 2.39% | | 2.05% |
Class R | | 1.72% | | N/A | | 1.95%2 | | 1.84% | | 1.56%2 |
| 1 | | Prior to October 1, 2016, the expense limitation as a percentage of average daily net assets for U.S. Opportunities Institutional Shares was 0.91%. |
| 2 | | There were no shares outstanding as of March 31, 2017. |
In addition, the Manager has contractually agreed to waive 0.10% of International Opportunities’ investment advisory fee through January 31, 2018. For the six months ended March 31, 2017, the Manager waived $366,984, which is included in Fees waived by the Manager in the Statements of Operations.
The Manager has agreed not to reduce or discontinue these contractual expense limitation through January 31, 2018, unless approved by the Board, including a majority of the independent trustees who are not “interested persons” of the Funds, as defined in the 1940 Act (“Independent Trustees”) or by a vote of a majority of the outstanding voting securities of the Funds. For the six months ended March 31, 2017, the amounts included in fees waived by the Manager were as follows:
| | | | |
Global Opportunities | | $ | 30,748 | |
U.S. Opportunities | | $ | 139,307 | |
These amounts waived and/or reimbursed are included in fees waived by the Manager, and shown as administration fees waived — class specific,
transfer agent fees waived — class specific, and transfer agent fees reimbursed — class specific, respectively, in the Statements of Operations. Class
| | | | | | |
| 86 | | BLACKROCK FUNDS | | MARCH 31, 2017 | | |
| | | | |
| Notes to Financial Statements (continued) | | | | |
specific expense waivers and reimbursements are as follows:
| | | | | | | | | | | | | | | | | | | | | | | | | | | | | | | | | | | |
| Administration Fees Waived | | Institutional | | Service | | Investor A | | Investor B | | Investor C | | Class R | | Total |
Global Opportunities | | | $ | 5,381 | | | | | — | | | | $ | 14,716 | | | | | — | | | | $ | 4,044 | | | | $ | 781 | | | | $ | 24,922 | |
International Opportunities | | | $ | 29,170 | | | | $ | 735 | | | | $ | 35,230 | | | | $ | 46 | | | | $ | 6,691 | | | | | — | | | | $ | 71,872 | |
Science & Technology Opportunities | | | $ | 5,512 | | | | | — | | | | $ | 296 | | | | | — | | | | | — | | | | $ | 10 | | | | $ | 5,818 | |
U.S. Opportunities | | | $ | 68,249 | | | | $ | 2,222 | | | | $ | 35,363 | | | | $ | 276 | | | | $ | 16,187 | | | | | — | | | | $ | 122,297 | |
| | | | | | | | | | | | | | | | | | | | | | | | | | | | | | | | | | | |
| | | | | | | | | | | | | | | | | | | | | | | | | | | | | | |
| Transfer Agent Fees Waived | | Institutional | | Investor A | | Investor B | | Investor C | | Class R | | Total |
Global Opportunities | | | $ | 1,154 | | | | $ | 3,056 | | | | | — | | | | $ | 604 | | | | $ | 2 | | | | $ | 4,816 | |
International Opportunities | | | $ | 1,127 | | | | $ | 6,770 | | | | $ | 137 | | | | $ | 1,493 | | | | | — | | | | $ | 9,527 | |
Science & Technology Opportunities | | | $ | 602 | | | | $ | 122 | | | | | — | | | | | — | | | | | — | | | | $ | 724 | |
U.S. Opportunities | | | | — | | | | $ | 9,311 | | | | $ | 186 | | | | $ | 2,306 | | | | | — | | | | $ | 11,803 | |
| | | | | | | | | | | | | | | | | | | | | | | | | | | | | | |
| | | | | | | | | | | | | | | | | | | | | | | | | | | | | | | | | | | |
| Transfer Agent Fees Reimbursed | | Institutional | | Service | | Investor A | | Investor B | | Investor C | | Class R | | Total |
Global Opportunities | | | $ | 30,819 | | | | | — | | | | $ | 86,920 | | | | | — | | | | $ | 17,569 | | | | $ | 2,487 | | | | $ | 137,795 | |
International Opportunities | | | $ | 122,666 | | | | $ | 210 | | | | $ | 112,647 | | | | $ | 699 | | | | $ | 28,808 | | | | | — | | | | $ | 265,030 | |
Science & Technology Opportunities | | | $ | 204 | | | | | — | | | | $ | 212 | | | | | — | | | | | — | | | | $ | 16 | | | | $ | 432 | |
U.S. Opportunities | | | $ | 523,431 | | | | $ | 2,434 | | | | $ | 195,390 | | | | $ | 2,177 | | | | $ | 82,813 | | | | | — | | | | $ | 806,245 | |
With respect to the Funds, the Manager voluntarily agreed to waive its investment advisory fees by the amount of investment advisory fees each Fund pays to the Manager indirectly through its investment in affiliated money market funds (the “affiliated money market fund waiver”). These amounts are included in fees waived by the Manager in the Statements of Operations. The amount of waivers and/or reimbursements of fees and expenses made pursuant to the expense limitation caps, as applicable, will be reduced by the amount of the affiliated money market fund waiver. For the six months ended March 31, 2017, the amounts waived were as follows:
| | | | |
Global Opportunities | | $ | 901 | |
Health Sciences Opportunities | | $ | 38,461 | |
International Opportunities | | $ | 2,894 | |
Science & Technology Opportunities | | $ | 1,090 | |
U.S. Opportunities | | $ | 3,971 | |
The Manager voluntarily agreed to waive its investment advisory fee with respect to any portion of each Fund’s assets invested in affiliated equity and fixed-income mutual funds and affiliated exchange-traded funds that have a contractual management fee. Effective January 27, 2017, the waiver became contractual through January 31, 2018. The contractual agreement may be terminated with respect to each Fund upon 90 days’ notice by a majority of Independent Trustees or by a vote of a majority of the outstanding voting securities of the Funds. For the six months ended March 31, 2017, the Funds did not have contractual waivers.
With respect to the contractual expense caps, if during a Fund’s fiscal year the operating expenses of a share class, that at any time during the prior two fiscal years received a waiver and/or reimbursement from the Manager, are less than the expense cap for that share class, the Manager is entitled to be reimbursed by such share class up to the lesser of the following expenses:
(a) The amount of fees waived and/or expenses reimbursed during those prior two fiscal years under the agreement.
(b) The amount by which the expense cap for that share class exceeds the operating expenses of the share class for the current fiscal year, provided that:
• Each Fund, of which the share class is a part, has more than $50 million in assets for the fiscal year; and
• The Manager or an affiliate continues to serve as a Fund’s investment adviser or administrator.
In the event the expense cap for a share class is changed subsequent to a fiscal year in which the Manager becomes entitled to reimbursement for fees waived and/or reimbursed, the amount available to reimburse the Manager shall be calculated by reference to the expense cap for that share class in effect at the time the Manager became entitled to receive such reimbursement, rather than the subsequently changed expense cap for that share class.
For the six months ended March 31, 2017, the Manager recouped the following class specific waivers and/or reimbursements previously recorded by the Funds:
| | | | | | | | | | | | | | | | | | | | | | | | | | | | | | | | | | | | | | | | |
| | | Institutional | | Service | | Investor A | | Investor B | | Investor C | | Class R | | Total | | |
Global Opportunities | | | | — | | | | | — | | | | | — | | | | | — | | | | $ | 18 | | | | $ | 20 | | | | $ | 38 | | | | | | |
International Opportunities | | | $ | 26 | | | | $ | 14 | | | | $ | 225 | | | | $ | 2 | | | | $ | 29 | | | | | — | | | | $ | 296 | | | | | | |
Science & Technology Opportunities | | | | — | | | | | — | | | | $ | 8,723 | | | | | — | | | | $ | 326 | | | | $ | 299 | | | | $ | 9,348 | | | | | | |
U.S. Opportunities | | | | — | | | | $ | 60 | | | | | — | | | | | — | | | | | — | | | | | — | | | | $ | 60 | | | | | | |
| | | | | | |
| | | BLACKROCK FUNDS | | MARCH 31, 2017 | | 87 |
| | | | |
| Notes to Financial Statements (continued) | | | | |
On March 31, 2017, the fund level and class specific waivers and/or reimbursements subject to possible future recoupment under the expense limitation agreement are as follows:
| | | | | | | | | | | | |
| | | Expiring September 30, | |
| | | 2017 | | | 2018 | | | 2019 | |
Global Opportunities | | | | | | | | | | | | |
Fund Level | | $ | 32,249 | | | $ | 38,936 | | | $ | 30,748 | |
Institutional | | $ | 87,544 | | | $ | 76,843 | | | $ | 37,354 | |
Investor A | | $ | 264,785 | | | $ | 233,499 | | | $ | 104,692 | |
Investor C | | $ | 57,171 | | | $ | 50,471 | | | $ | 22,217 | |
Class R | | $ | 8,810 | | | $ | 7,900 | | | $ | 3,270 | |
International Opportunities | | | | | | | | | | | | |
Institutional | | $ | 170,082 | | | $ | 358,708 | | | $ | 152,963 | |
Service | | | — | | | $ | 8,126 | | | $ | 945 | |
Investor A | | $ | 85,565 | | | $ | 287,721 | | | $ | 154,647 | |
Investor B | | $ | 1,549 | | | $ | 2,920 | | | $ | 882 | |
Investor C | | $ | 26,687 | | | $ | 103,731 | | | $ | 36,992 | |
Science & Technology Opportunities | | | | | | | | | | | | |
Institutional | | $ | 22,593 | | | $ | 29,087 | | | $ | 6,318 | |
Investor A | | | — | | | $ | 17,448 | | | $ | 630 | |
Class R | | | — | | | $ | 483 | | | $ | 26 | |
U.S. Opportunities | | | | | | | | | | | | |
Fund Level | | $ | 4,049,480 | | | $ | 1,534,805 | | | $ | 139,307 | |
Institutional | | $ | 1,423,563 | | | $ | 1,181,301 | | | $ | 591,680 | |
Service | | $ | 54,407 | | | | — | | | $ | 4,656 | |
Investor A | | $ | 121,700 | | | $ | 150,272 | | | $ | 240,064 | |
Investor B | | $ | 2,373 | | | $ | 5,207 | | | $ | 2,639 | |
Investor C | | $ | 4,426 | | | $ | 58,264 | | | $ | 101,306 | |
Securities Lending: The U.S. Securities and Exchange Commission has issued an exemptive order which permits BIM, an affiliate of the Manager, to serve as securities lending agent for the Funds, subject to applicable conditions. As securities lending agent, BIM bears all operational costs directly related to securities lending. The Funds are responsible for expenses in connection with the investment of cash collateral received for securities on loan (the “collateral investment expenses”). The cash collateral is invested in a private investment company managed by the Manager or its affiliates. However, BIM has agreed to cap the collateral investment expenses of the private investment company to an annual rate of 0.04%. The investment adviser to the private investment company will not charge any advisory fees with respect to shares purchased by the Funds. If the private investment company’s weekly liquid assets fall below 30% of its total assets, BIM, as managing member of the private investment company, is permitted at any time, if it determines it to be in the best interests of the private investment company, to impose a liquidity fee of up to 2% of the value of units withdrawn or impose a redemption gate that temporarily suspends the right of withdrawal out of the private investment company. In addition, if the private investment company’s weekly liquid assets fall below 10% of its total assets at the end of any business day, the private investment company will impose a liquidity fee in the default amount of 1% of the amount withdrawn, generally effective as of the next business day, unless BIM determines that a higher (not to exceed 2%) or lower fee level or not imposing a liquidity fee is in the best interests of the private investment company. The shares of the private investment company purchased by the Funds would be subject to any such liquidity fee or redemption gate imposed.
Securities lending income is equal to the total of income earned from the reinvestment of cash collateral, net of fees and other payments to and from borrowers of securities, and less the collateral investment expenses. Each Fund retains a portion of securities lending income and remits a remaining portion to BIM as compensation for its services as securities lending agent. Pursuant to a securities lending agreement, BIM may lend securities only when the difference between the borrower rebate rate and the risk free rate exceeds a certain level (such securities, the “specials only securities”).
Pursuant to such agreement, each Fund retains 80% of securities lending income. In addition, commencing the business day following the date that the aggregate securities lending income earned across certain funds in the Equity-Liquidity Complex in a calendar year exceeds a specified threshold, each Fund, pursuant to the securities lending agreement, will retain for the remainder of the calendar year securities lending income in an amount equal to 85% of securities lending income.
The share of securities lending income earned by each Fund is shown as securities lending income — affiliated — net in the Statements of Operations. For the six months ended March 31, 2017, each Fund paid BIM the following amounts for securities lending agent services:
| | | | |
Global Opportunities | | $ | 543 | |
Health Sciences Opportunities | | $ | 56,200 | |
International Opportunities | | $ | 409 | |
Science & Technology Opportunities | | $ | 13,240 | |
U.S. Opportunities | | $ | 35,439 | |
| | | | | | |
| 88 | | BLACKROCK FUNDS | | MARCH 31, 2017 | | |
| | | | |
| Notes to Financial Statements (continued) | | | | |
Interfund Lending: In accordance with an exemptive order (the “Order”) from the U.S. Securities and Exchange Commission, Global Opportunities may participate in a joint lending and borrowing facility for temporary purposes (the “Interfund Lending Program”), subject to compliance with the terms and conditions of the Order, and to the extent permitted by Global Opportunities’ investment policies and restrictions. Global Opportunities is currently permitted to borrow under the Interfund Lending Program.
A lending BlackRock fund may lend in aggregate up to 15% of its net assets, but may not lend more than 5% of its net assets to any one borrowing fund through the Interfund Lending Program. A borrowing BlackRock Fund may not borrow through the Interfund Lending Program or from any other source more than 33 1/3% of its total assets (or any lower threshold provided for by the fund’s investment restrictions). If a borrowing BlackRock fund’s total outstanding borrowings exceed 10% of its total assets, each of its outstanding interfund loans will be subject to collateralization of at least 102% of the outstanding principal value of the loan. All interfund loans are for temporary or emergency purposes and the interest rate to be charged will be the average of the highest current overnight repurchase agreement rate available to a lending fund and the bank loan rate, as calculated according to a formula established by the Board.
During the period ended March 31, 2017, Global Opportunities did not participate in the Interfund Lending Program.
Officers and Trustees: Certain officers and/or trustees of the Trust are officers and/or directors of BlackRock or its affiliates. The Funds reimburse the Manager for a portion of the compensation paid to the Trust’s Chief Compliance Officer, which is included in Officer and Trustees in the Statements of Operations.
Other Transactions: The Funds may purchase securities from, or sell securities to, an affiliated fund provided the affiliation is due solely to having a common investment adviser, common officers, or common trustees. For the six months ended March 31, 2017, the purchase and sale transactions and any net realized gain (loss) with affiliated funds in compliance with Rule 17a-7 under the 1940 Act were as follows:
| | | | | | | | | | | | | | | |
| | | Purchases | | Sales | | Net Realized
Loss |
Health Sciences Opportunities | | | $ | 6,712,368 | | | | | — | | | | | — | |
International Opportunities | | | | — | | | | $ | 5,013,153 | | | | $ | (469,634 | ) |
Science & Technology Opportunities | | | $ | 69,226 | | | | $ | 69,224 | | | | $ | (2 | ) |
U.S. Opportunities | | | $ | 3,422,844 | | | | | — | | | | | — | |
7. Purchases and Sales:
For the six months ended March 31, 2017, purchases and sales of investments, excluding short-term securities, were as follows:
| | | | | | | | | | | | | | | | | | | | | | | | | |
| | | Global
Opportunities | | Health
Sciences
Opportunities | | International
Opportunities | | Science &
Technology
Opportunities | | U.S.
Opportunities |
Purchases | | | $ | 120,120,656 | | | | $ | 1,050,309,142 | | | | $ | 305,087,588 | | | | $ | 111,017,517 | | | | $ | 560,076,037 | |
Sales | | | $ | 136,873,817 | | | | $ | 1,370,532,952 | | | | $ | 385,354,211 | | | | $ | 102,411,106 | | | | $ | 682,315,532 | |
8. Income Tax Information:
It is the Funds’ policy to comply with the requirements of the Internal Revenue Code of 1986, as amended, applicable to regulated investment companies, and to distribute substantially all of their taxable income to their shareholders. Therefore, no U.S. federal income tax provision is required.
Each Fund files U.S. federal and various state and local tax returns. No income tax returns are currently under examination. The statute of limitations on each Fund’s U.S. federal tax returns generally remains open for each of the four years ended September 30, 2016. The statutes of limitations on each Fund’s state and local tax returns may remain open for an additional year depending upon the jurisdiction.
Management has analyzed tax laws and regulations and their application to the Funds as of March 31, 2017, inclusive of the open tax return years, and does not believe that there are any uncertain tax positions that require recognition of a tax liability in the Funds’ financial statements.
As of period end, the Funds had capital loss carryforwards available to offset future realized capital gains through the indicated expiration dates as follows:
| | | | | | | | | | |
| Expires September 30, | | Global
Opportunities | | International
Opportunities |
No expiration date1 | | | $ | 10,482,485 | | | | $ | 22,310,905 | |
2017 | | | | 69,386,507 | | | | | — | |
2018 | | | | 9,946,168 | | | | | — | |
2019 | | | | — | | | | | — | |
| | | | | |
Total | | | $ | 89,815,160 | | | | $ | 22,310,905 | |
| | | | | |
| | 1 | | Must be utilized prior to losses subject to expiration. |
| | | | | | |
| | | BLACKROCK FUNDS | | MARCH 31, 2017 | | 89 |
| | | | |
| Notes to Financial Statements (continued) | | | | |
During the period ended March 31, 2017, Science & Technology Opportunities utilized capital loss carryforwards of $4,325,634.
As of March 31, 2017, gross unrealized appreciation and depreciation based on cost for U.S. federal income tax purposes were as follows:
| | | | | | | | | | | | | | | | | | | | |
| | | Global
Opportunities | | | Health
Sciences
Opportunities | | | International
Opportunities | | | Science &
Technology
Opportunities | | | U.S.
Opportunities | |
Tax cost | | $ | 218,577,574 | | | $ | 3,929,364,384 | | | $ | 619,831,123 | | | $ | 231,776,290 | | | $ | 983,438,941 | |
| | | | |
Gross unrealized appreciation | | $ | 41,772,886 | | | $ | 1,507,988,347 | | | $ | 86,612,445 | | | $ | 135,311,296 | | | $ | 281,125,584 | |
Gross unrealized depreciation | | | (5,506,584 | ) | | | (51,696,051 | ) | | | (17,125,741 | ) | | | (1,583,079 | ) | | | (23,912,959 | ) |
| | | | |
Net unrealized appreciation | | $ | 36,266,302 | | | $ | 1,456,292,296 | | | $ | 69,486,704 | | | $ | 133,728,217 | | | $ | 257,212,625 | |
| | | | |
9. Bank Borrowings:
The Trust, on behalf of the Funds, along with certain other funds managed by the Manager and its affiliates (“Participating Funds”), is a party to a 364-day, $2.1 billion credit agreement with a group of lenders. Under this agreement, the Funds may borrow to fund shareholder redemptions. Excluding commitments designated for certain individual funds, the Participating Funds, including the Funds, can borrow up to an aggregate commitment amount of $1.6 billion at any time outstanding, subject to asset coverage and other limitations as specified in the agreement. The credit agreement has the following terms: a fee of 0.12% per annum on unused commitment amounts and interest at a rate equal to the higher of (a) one-month LIBOR (but, in any event, not less than 0.00%) on the date the loan is made plus 0.80% per annum or (b) the Fed Funds rate (but, in any event, not less than 0.00%) in effect from time to time plus 0.80% per annum on amounts borrowed. The agreement expires in April 2017 unless extended or renewed. Participating Funds paid administration, legal and arrangement fees, which, if applicable, are included in miscellaneous expenses in the Statements of Operations. These fees were allocated among such funds based upon portions of the aggregate commitment available to them and relative net assets of Participating Funds. During the six months ended March 31, 2017, the Funds did not borrow under the credit agreement.
10. Principal Risks:
In the normal course of business, certain Funds invest in securities and enter into transactions where risks exist due to fluctuations in the market (market risk) or failure of the issuer to meet all its obligations, including the ability to pay principal and interest when due (issuer credit risk). The value of securities held by the Funds may decline in response to certain events, including those directly involving the issuers of securities owned by the Funds. Changes arising from the general economy, the overall market and local, regional or global political and/or social instability, as well as currency, interest rate and price fluctuations, may also affect the securities’ value.
On October 11, 2016, BlackRock implemented certain changes required by amendments to Rule 2a-7 under the 1940 Act, which governs the operations of U.S. money market funds. The Funds may be exposed to additional risks when reinvesting cash collateral in money market funds that do not seek to maintain a stable NAV per share of $1.00 and which may be subject to redemption gates or liquidity fees under certain circumstances.
Valuation Risk: The market values of equities, such as common stocks and preferred securities or equity related investments, such as futures and options, may decline due to general market conditions which are not specifically related to a particular company. They may also decline due to factors which affect a particular industry or industries. A Fund may invest in illiquid investments and may experience difficulty in selling those investments in a timely manner at the price that they believe the investments are worth. Prices may fluctuate widely over short or extended periods in response to company, market or economic news. Markets also tend to move in cycles, with periods of rising and falling prices. This volatility may cause each Fund’s NAV to experience significant increases or decreases over short periods of time. If there is a general decline in the securities and other markets, the NAV of a Fund may lose value, regardless of the individual results of the securities and other instruments in which a Fund invests.
The price a Fund could receive upon the sale of any particular portfolio investment may differ from a Fund’s valuation of the investment, particularly for securities that trade in thin or volatile markets or that are valued using a fair valuation technique or a price provided by an independent pricing service. Changes to significant unobservable inputs and assumptions (i.e., publicly traded company multiples, growth rate, time to exit) due to the lack of observable inputs may significantly impact the resulting fair value and therefore a Fund’s results of operations. As a result, the price received upon the sale of an investment may be less than the value ascribed by a Fund, and a Fund could realize a greater than expected loss or lesser than expected gain upon the sale of the investment. A Fund’s ability to value its investments may also be impacted by technological issues and/or errors by pricing services or other third party service providers.
Counterparty Credit Risk: Similar to issuer credit risk, the Funds may be exposed to counterparty credit risk, or the risk that an entity may fail to or be unable to perform on its commitments related to unsettled or open transactions. The Funds manage counterparty credit risk by entering into transactions only with counterparties that the Manager believes have the financial resources to honor their obligations and by monitoring the financial stability of those counterparties. Financial assets, which potentially expose the Funds to market, issuer and counterparty credit risks, consist principally of financial instruments and receivables due from counterparties. The extent of the Funds’ exposure to market, issuer and counterparty credit risks with respect to these financial assets is approximately their value recorded in the Statements of Assets and Liabilities, less any collateral held by the Funds.
| | | | | | |
| 90 | | BLACKROCK FUNDS | | MARCH 31, 2017 | | |
| | | | |
| Notes to Financial Statements (continued) | | | | |
A derivative contract may suffer a mark-to-market loss if the value of the contract decreases due to an unfavorable change in the market rates or values of the underlying instrument. Losses can also occur if the counterparty does not perform under the contract.
A Fund’s risk of loss from counterparty credit risk on OTC derivatives is generally limited to the aggregate unrealized gain less the value of any collateral held by such Fund.
For OTC options purchased, each Fund bears the risk of loss in the amount of the premiums paid plus the positive change in market values net of any collateral held by the Funds should the counterparty fail to perform under the contracts. Options written by the Funds do not typically give rise to counterparty credit risk, as options written generally obligate the Funds, and not the counterparty, to perform. The Funds may be exposed to counterparty credit risk with respect to options written to the extent the Funds deposit collateral with its counterparty to a written option.
With exchange-traded options purchased and futures and centrally cleared swaps, there is less counterparty credit risk to the Funds since the exchange or clearinghouse, as counterparty to such instruments, guarantees against a possible default. The clearinghouse stands between the buyer and the seller of the contract; therefore, credit risk is limited to failure of the clearinghouse. While offset rights may exist under applicable law, a Fund does not have a contractual right of offset against a clearing broker or clearinghouse in the event of a default (including the bankruptcy or insolvency). Additionally, credit risk exists in exchange-traded futures and centrally cleared swaps with respect to initial and variation margin that is held in a clearing broker’s customer accounts. While clearing brokers are required to segregate customer margin from their own assets, in the event that a clearing broker becomes insolvent or goes into bankruptcy and at that time there is a shortfall in the aggregate amount of margin held by the clearing broker for all its clients, typically the shortfall would be allocated on a pro rata basis across all the clearing broker’s customers, potentially resulting in losses to the Funds.
Concentration Risk: International Opportunities invests a significant portion of its assets in securities of issuers located in Europe or with significant exposure to European issuers or countries. The European financial markets have recently experienced volatility and adverse trends due to concerns about economic downturns in, or rising government debt levels of, several European countries. These events may spread to other countries in Europe and may affect the value and liquidity of certain of International Opportunities’ investments.
The United Kingdom voted on June 23, 2016 to withdraw from the European Union, which may introduce significant new uncertainties and instability in the financial markets across Europe.
As of period end, Health Sciences Opportunities invested a significant portion of its assets in securities in the health care sector. Changes in economic conditions affecting such sector would have a greater impact on Health Sciences Opportunities and could affect the value, income and/or liquidity of positions in such securities.
As of period end, Science & Technology Opportunities invested a significant portion of its assets in securities in the information technology sector. Changes in economic conditions affecting such sector would have a greater impact on the Fund and could affect the value, income and/or liquidity of positions in such securities.
Global Opportunities and International Opportunities invest a substantial amount of their assets in issuers located in a single country or a limited number of countries. When the Funds concentrate their investments in this manner, it assumes the risk that economic, political and social conditions in those countries may have a significant impact on their investment performance. Foreign issuers may not be subject to the same uniform accounting, auditing and financial reporting standards and practices as used in the United States. Foreign securities markets may also be less liquid, more volatile, and less subject to governmental supervision not typically associated with investing in U.S. securities. Investment percentages in specific countries are presented in the Schedule of Investments.
As of period end, the Funds listed below had the following industry classifications:
| | | | | | | | | | |
| Industry | | Global
Opportunities | | International
Opportunities |
Banks | | | | 10 | % | | | | 13 | % |
Internet Software & Services | | | | 10 | | | | | — | |
Oil, Gas & Consumable Fuels | | | | 6 | | | | | 8 | |
Insurance | | | | 5 | | | | | 5 | |
Pharmaceuticals | | | | — | | | | | 5 | |
Machinery | | | | — | | | | | 5 | |
Other1 | | | | 69 | | | | | 64 | |
| 1 | All other industries held were each less than 5% of long-term investments. |
| | | | | | |
| | | BLACKROCK FUNDS | | MARCH 31, 2017 | | 91 |
| | | | |
| Notes to Financial Statements (continued) | | | | |
11. Capital Share Transactions:
Transactions in capital shares for each class were as follows:
| | | | | | | | | | | | | | | | | | | | |
| | | Six Months Ended
March 31, 2017 | | | | | | Year Ended
September 30, 2016 | |
| Global Opportunities | | Shares | | | Amount | | | | | | Shares | | | Amount | |
Institutional | | | | | | | | | | | | | | | | | | | | |
Shares sold | | | 574,859 | | | $ | 8,331,467 | | | | | | | | 1,774,461 | | | $ | 24,951,516 | |
Shares issued in reinvestment of distributions | | | 60,007 | | | | 859,836 | | | | | | | | 37,297 | | | | 508,272 | |
Shares redeemed | | | (411,605 | ) | | | (5,979,508 | ) | | | | | | | (2,526,204 | ) | | | (33,803,142 | ) |
| | | | | | | | | | | | |
Net increase (decrease) | | | 223,261 | | | $ | 3,211,795 | | | | | | | | (714,446 | ) | | $ | (8,343,354 | ) |
| | | | | | | | | | | | |
| | | | | | | | | | | | | | | | | | | | |
Investor A | | | | | | | | | | | | | | | | | | | | |
Shares sold | | | 295,443 | | | $ | 4,203,859 | | | | | | | | 784,530 | | | $ | 10,772,178 | |
Shares issued in reinvestment of distributions | | | 151,798 | | | | 2,157,115 | | | | | | | | 56,431 | | | | 763,292 | |
Shares redeemed | | | (1,303,480 | ) | | | (18,695,769 | ) | | | | | | | (2,538,452 | ) | | | (34,098,010 | ) |
| | | | | | | | | | | | |
Net decrease | | | (856,239 | ) | | $ | (12,334,795 | ) | | | | | | | (1,697,491 | ) | | $ | (22,562,540 | ) |
| | | | | | | | | | | | |
| | | | | | | | | | | | | | | | | | | | |
Investor C | | | | | | | | | | | | | | | | | | | | |
Shares sold | | | 51,354 | | | $ | 714,225 | | | | | | | | 930,206 | | | $ | 12,443,352 | |
Shares issued in reinvestment of distributions | | | 25,759 | | | | 354,183 | | | | | | | | 1,052 | | | | 14,004 | |
Shares redeemed | | | (391,063 | ) | | | (5,405,899 | ) | | | | | | | (1,103,666 | ) | | | (14,182,431 | ) |
| | | | | | | | | | | | |
Net decrease | | | (313,950 | ) | | $ | (4,337,491 | ) | | | | | | | (172,408 | ) | | $ | (1,725,075 | ) |
| | | | | | | | | | | | |
| | | | | | | | | | | | | | | | | | | | |
Class R | | | | | | | | | | | | | | | | | | | | |
Shares sold | | | 44,129 | | | $ | 629,987 | | | | | | | | 125,598 | | | $ | 1,693,101 | |
Shares issued in reinvestment of distributions | | | 7,540 | | | | 106,995 | | | | | | | | 206 | | | | 2,834 | |
Shares redeemed | | | (103,542 | ) | | | (1,474,214 | ) | | | | | | | (174,838 | ) | | | (2,370,699 | ) |
| | | | | | | | | | | | |
Net decrease | | | (51,873 | ) | | $ | (737,232 | ) | | | | | | | (49,034 | ) | | $ | (674,764 | ) |
| | | | | | | | | | | | |
Total Net Decrease | | | (998,801 | ) | | $ | (14,197,723 | ) | | | | | | | (2,633,379 | ) | | $ | (33,305,733 | ) |
| | | | | | | | | | | | |
| | | | | | | | | | | | | | | | | | | | |
| Health Sciences Opportunities | | | | | | | | | | | | | | | |
Institutional | | | | | | | | | | | | | | | | | | | | |
Shares sold | | | 10,783,714 | | | $ | 536,707,229 | | | | | | | | 10,409,064 | | | $ | 515,659,485 | |
Shares issued in reinvestment of distributions | | | 684,494 | | | | 31,752,432 | | | | | | | | 3,460,085 | | | | 168,713,067 | |
Shares redeemed | | | (6,936,109 | ) | | | (334,865,154 | ) | | | | | | | (11,974,460 | ) | | | (582,408,474 | ) |
| | | | | | | | | | | | |
Net increase | | | 4,532,099 | | | $ | 233,594,507 | | | | | | | | 1,894,689 | | | $ | 101,964,078 | |
| | | | | | | | | | | | |
| | | | | | | | | | | | | | | | | | | | |
Service | | | | | | | | | | | | | | | | | | | | |
Shares sold | | | 100,135 | | | $ | 4,713,026 | | | | | | | | 168,130 | | | $ | 8,021,439 | |
Shares issued in reinvestment of distributions | | | 15,907 | | | | 708,985 | | | | | | | | 92,877 | | | | 4,366,134 | |
Shares redeemed | | | (172,393 | ) | | | (8,011,399 | ) | | | | | | | (302,327 | ) | | | (14,194,664 | ) |
| | | | | | | | | | | | |
Net decrease | | | (56,351 | ) | | $ | (2,589,388 | ) | | | | | | | (41,320 | ) | | $ | (1,807,091 | ) |
| | | | | | | | | | | | |
| | | | | | |
| 92 | | BLACKROCK FUNDS | | MARCH 31, 2017 | | |
| | | | |
| Notes to Financial Statements (continued) | | | | |
| | | | | | | | | | | | | | | | | | | | |
| | | Six Months Ended
March 31, 2017 | | | | | | Year Ended
September 30, 2016 | |
| Health Sciences Opportunities (concluded) | | Shares | | | Amount | | | | | | Shares | | | Amount | |
Investor A | | | | | | | | | | | | | | | | | | | | |
Shares sold and automatic conversion of shares | | | 5,518,567 | | | $ | 257,970,860 | | | | | | | | 13,451,648 | | | $ | 640,242,358 | |
Shares issued in reinvestment of distributions | | | 1,278,066 | | | | 56,742,656 | | | | | | | | 7,184,973 | | | | 336,614,955 | |
Shares redeemed | | | (14,745,399 | ) | | | (694,067,821 | ) | | | | | | | (20,463,909 | ) | | | (960,462,633 | ) |
| | | | | | | | | | | | |
Net increase (decrease) | | | (7,948,766 | ) | | $ | (379,354,305 | ) | | | | | | | 172,712 | | | $ | 16,394,680 | |
| | | | | | | | | | | | |
| | | | | | | | | | | | | | | | | | | | |
Investor B | | | | | | | | | | | | | | | | | | | | |
Shares sold | | | 256 | | | $ | 11,411 | | | | | | | | 3,333 | | | $ | 137,848 | |
Shares issued in reinvestment of distributions | | | 2,604 | | | | 105,937 | | | | | | | | 26,864 | | | | 1,164,249 | |
Shares redeemed and automatic conversion of shares | | | (66,653 | ) | | | (2,874,320 | ) | | | | | | | (141,775 | ) | | | (6,129,880 | ) |
| | | | | | | | | | | | |
Net decrease | | | (63,793 | ) | | $ | (2,756,972 | ) | | | | | | | (111,578 | ) | | $ | (4,827,783 | ) |
| | | | | | | | | | | | |
| | | | | | | | | | | | | | | | | | | | |
Investor C | | | | | | | | | | | | | | | | | | | | |
Shares sold | | | 1,228,857 | | | $ | 51,131,915 | | | | | | | | 3,508,502 | | | $ | 151,092,039 | |
Shares issued in reinvestment of distributions | | | 654,654 | | | | 25,940,541 | | | | | | | | 3,425,363 | | | | 144,652,080 | |
Shares redeemed | | | (5,061,187 | ) | | | (209,869,168 | ) | | | | | | | (6,137,068 | ) | | | (259,623,241 | ) |
| | | | | | | | | | | | |
Net increase (decrease) | | | (3,177,676 | ) | | $ | (132,796,712 | ) | | | | | | | 796,797 | | | $ | 36,120,878 | |
| | | | | | | | | | | | |
| | | | | | | | | | | | | | | | | | | | |
| | | | | | | | | | | | Period
June 8, 20161
to September 30, 2016 | |
| | | | | | | | | | | | Shares | | | Amount | |
Class K | | | | | | | | | | | | | | | | | | | | |
Shares sold | | | 35,625 | | | $ | 1,802,805 | | | | | | | | 49,724 | | | $ | 2,455,371 | |
Reinvestments | | | 1,033 | | | | 47,957 | | | | | | | | — | | | | — | |
Shares redeemed | | | (16,594 | ) | | | (813,929 | ) | | | | | | | (141 | ) | | | (7,000 | ) |
| | | | | | | | | | | | |
Net increase | | | 20,064 | | | $ | 1,036,833 | | | | | | | | 49,583 | | | $ | 2,448,371 | |
| | | | | | | | | | | | |
| | | | | | | | | | | | | | | | | | | | |
Class R | | | | | | | | | | | | | | | | | | | | |
Shares sold | | | 495,395 | | | $ | 22,749,993 | | | | | | | | 1,164,846 | | | $ | 54,434,719 | |
Shares issued in reinvestment of distributions | | | 88,594 | | | | 3,875,250 | | | | | | | | 399,395 | | | | 18,488,028 | |
Shares redeemed | | | (597,429 | ) | | | (27,288,562 | ) | | | | | | | (859,575 | ) | | | (40,035,604 | ) |
| | | | | | | | | | | | |
Net increase | | | (13,440 | ) | | $ | (663,319 | ) | | | | | | | 704,666 | | | $ | 32,887,143 | |
| | | | | | | | | | | | |
Total Net Increase | | | (6,707,863 | ) | | $ | (283,529,356 | ) | | | | | | | 3,465,549 | | | $ | 183,180,276 | |
| | | | | | | | | | | | |
| 1 | Commencement of operations. |
At March 31, 2017, $4,014 Class K Shares of the Fund were owned by BlackRock HoldCo 2, Inc., an affiliate of the Fund.
| | | | | | |
| | | BLACKROCK FUNDS | | MARCH 31, 2017 | | 93 |
| | | | |
| Notes to Financial Statements (continued) | | | | |
| | | | | | | | | | | | | | | | | | | | |
| | | Six Months Ended
March 31, 2017 | | | | | | Year Ended
September 30, 2016 | |
| International Opportunities | | Shares | | | Amount | | | | | | Shares | | | Amount | |
Institutional | | | | | | | | | | | | | | | | | | | | |
Shares sold | | | 1,365,482 | | | $ | 43,757,894 | | | | | | | | 1,517,793 | | | $ | 47,903,850 | |
Shares issued in reinvestment of distributions | | | 414,862 | | | | 13,039,041 | | | | | | | | 25,343 | | | | 794,003 | |
Shares redeemed | | | (3,517,850 | ) | | | (111,367,524 | ) | | | | | | | (4,651,539 | ) | | | (147,673,616 | ) |
| | | | | | | | | | | | |
Net decrease | | | (1,737,506 | ) | | $ | (54,570,589 | ) | | | | | | | (3,108,403 | ) | | $ | (98,975,763 | ) |
| | | | | | | | | | | | |
| | | | | | | | | | | | | | | | | | | | |
Service | | | | | | | | | | | | | | | | | | | | |
Shares sold | | | 17,001 | | | $ | 519,293 | | | | | | | | 116,258 | | | $ | 3,489,055 | |
Shares issued in reinvestment of distributions | | | 15,050 | | | | 452,692 | | | | | | | | — | | | | — | |
Shares redeemed | | | (114,217 | ) | | | (3,489,879 | ) | | | | | | | (368,118 | ) | | | (11,045,403 | ) |
| | | | | | | | | | | | |
Net decrease | | | (82,166 | ) | | $ | (2,517,894 | ) | | | | | | | (251,860 | ) | | $ | (7,556,348 | ) |
| | | | | | | | | | | | |
| | | | | | | | | | | | | | | | | | | | |
Investor A | | | | | | | | | | | | | | | | | | | | |
Shares sold and automatic conversion of shares | | | 3,070,373 | | | $ | 93,480,699 | | | | | | | | 1,759,445 | | | $ | 52,545,850 | |
Shares issued in reinvestment of distributions | | | 527,637 | | | | 15,654,710 | | | | | | | | — | | | | — | |
Shares redeemed | | | (3,743,447 | ) | | | (112,851,760 | ) | | | | | | | (4,837,920 | ) | | | (144,261,732 | ) |
| | | | | | | | | | | | |
Net decrease | | | (145,437 | ) | | $ | (3,716,351 | ) | | | | | | | (3,078,475 | ) | | $ | (91,715,882 | ) |
| | | | | | | | | | | | |
| | | | | | | | | | | | | | | | | | | | |
Investor B | | | | | | | | | | | | | | | | | | | | |
Shares sold | | | — | | | | — | | | | | | | | 2,526 | | | $ | 68,546 | |
Shares issued in reinvestment of distributions | | | 244 | | | $ | 6,762 | | | | | | | | — | | | | — | |
Shares redeemed and automatic conversion of shares | | | (15,805 | ) | | | (440,221 | ) | | | | | | | (45,044 | ) | | | (1,220,954 | ) |
| | | | | | | | | | | | |
Net decrease | | | (15,561 | ) | | $ | (433,459 | ) | | | | | | | (42,518 | ) | | $ | (1,152,408 | ) |
| | | | | | | | | | | | |
| | | | | | | | | | | | | | | | | | | | |
Investor C | | | | | | | | | | | | | | | | | | | | |
Shares sold | | | 66,298 | | | $ | 1,808,338 | | | | | | | | 221,267 | | | $ | 6,006,866 | |
Shares issued in reinvestment of distributions | | | 92,481 | | | | 2,470,420 | | | | | | | | — | | | | — | |
Shares redeemed | | | (565,069 | ) | | | (15,318,485 | ) | | | | | | | (1,154,017 | ) | | | (31,008,117 | ) |
| | | | | | | | | | | | |
Net decrease | | | (406,290 | ) | | $ | (11,039,727 | ) | | | | | | | (932,750 | ) | | $ | (25,001,251 | ) |
| | | | | | | | | | | | |
Total Net Decrease | | | (2,386,960 | ) | | $ | (72,278,020 | ) | | | | | | | (7,414,006 | ) | | $ | (224,401,652 | ) |
| | | | | | | | | | | | |
| | | | | | |
| 94 | | BLACKROCK FUNDS | | MARCH 31, 2017 | | |
| | | | |
| Notes to Financial Statements (continued) | | | | |
| | | | | | | | | | | | | | | | | | | | |
| | | Six Months Ended
March 31, 2017 | | | | | | Year Ended
September 30, 2016 | |
| Science & Technology Opportunities | | Shares | | | Amount | | | | | | Shares | | | Amount | |
Institutional | | | | | | | | | | | | | | | | | | | | |
Shares sold | | | 1,468,075 | | | $ | 29,005,350 | | | | | | | | 1,691,882 | | | $ | 28,286,689 | |
Shares issued in reinvestment of dividends | | | 40,186 | | | | 746,125 | | | | | | | | — | | | | — | |
Shares redeemed | | | (973,688 | ) | | | (18,866,515 | ) | | | | | | | (1,286,095 | ) | | | (21,239,030 | ) |
| | | | | | | | | | | | |
Net increase | | | 534,573 | | | $ | 10,884,960 | | | | | | | | 405,787 | | | $ | 7,047,659 | |
| | | | | | | | | | | | |
| | | | | | | | | | | | | | | | | | | | |
Service | | | | | | | | | | | | | | | | | | | | |
Shares sold | | | 42,443 | | | $ | 766,046 | | | | | | | | 63,987 | | | $ | 1,059,634 | |
Shares issued in reinvestment of dividends | | | 1,409 | | | | 24,987 | | | | | | | | — | | | | — | |
Shares redeemed | | | (68,342 | ) | | | (1,235,127 | ) | | | | | | | (25,130 | ) | | | (400,754 | ) |
| | | | | | | | | | | | |
Net increase (decrease) | | | (24,490 | ) | | $ | (444,094 | ) | | | | | | | 38,857 | | | $ | 658,880 | |
| | | | | | | | | | | | |
| | | | | | | | | | | | | | | | | | | | |
Investor A | | | | | | | | | | | | | | | | | | | | |
Shares sold | | | 1,465,247 | | | $ | 26,769,836 | | | | | | | | 3,361,251 | | | $ | 52,792,793 | |
Shares issued in reinvestment of dividends | | | 107,738 | | | | 1,871,519 | | | | | | | | — | | | | — | |
Shares redeemed | | | (1,946,289 | ) | | | (35,595,061 | ) | | | | | | | (2,914,017 | ) | | | (45,703,198 | ) |
| | | | | | | | | | | | |
Net increase (decrease) | | | (373,304 | ) | | $ | (6,953,706 | ) | | | | | | | 447,234 | | | $ | 7,089,595 | |
| | | | | | | | | | | | |
| | | | | | | | | | | | | | | | | | | | |
Investor C | | | | | | | | | | | | | | | | | | | | |
Shares sold | | | 917,861 | | | $ | 14,164,612 | | | | | | | | 1,225,231 | | | $ | 16,959,431 | |
Shares issued in reinvestment of dividends | | | 50,864 | | | | 769,460 | | | | | | | | — | | | | — | |
Shares redeemed | | | (516,788 | ) | | | (8,163,053 | ) | | | | | | | (862,262 | ) | | | (11,708,703 | ) |
| | | | | | | | | | | | |
Net increase | | | 451,937 | | | $ | 6,771,019 | | | | | | | | 362,969 | | | $ | 5,250,728 | |
| | | | | | | | | | | | |
| | | | | | | | | | | | | | | | | | | | |
Class R | | | | | | | | | | | | | | | | | | | | |
Shares sold | | | 118,775 | | | $ | 2,137,320 | | | | | | | | — | | | | — | |
Shares reinvestments | | | 3,992 | | | | 70,281 | | | | | | | | 269,563 | | | $ | 4,246,788 | |
Shares redeemed | | | (49,728 | ) | | | (917,545 | ) | | | | | | | (276,421 | ) | | | (4,401,324 | ) |
| | | | | | | | | | | | |
Net increase (decrease) | | | 73,039 | | | $ | 1,290,056 | | | | | | | | (6,858 | ) | | $ | (154,536 | ) |
| | | | | | | | | | | | |
Total Net Increase | | | 661,755 | | | $ | 11,548,235 | | | | | | | | 1,247,989 | | | $ | 19,892,326 | |
| | | | | | | | | | | | |
| | | | | | |
| | | BLACKROCK FUNDS | | MARCH 31, 2017 | | 95 |
| | | | |
| Notes to Financial Statements (concluded) | | | | |
| | | | | | | | | | | | | | | | | | | | |
| | | Six Months Ended
March 31, 2017 | | | | | | Year Ended
September 30, 2016 | |
| U.S. Opportunities | | Shares | | | Amount | | | | | | Shares | | | Amount | |
Institutional | | | | | | | | | | | | | | | | | | | | |
Shares sold | | | 2,414,609 | | | $ | 90,495,041 | | | | | | | �� | 3,372,135 | | | $ | 121,029,823 | |
Shares issued in reinvestment of distributions | | | 1,067,586 | | | | 38,430,094 | | | | | | | | 1,609,282 | | | | 56,823,678 | |
Shares redeemed | | | (2,777,809 | ) | | | (103,222,653 | ) | | | | | | | (7,195,271 | ) | | | (256,302,009 | ) |
| | | | | | | | | | | | |
Net increase (decrease) | | | 704,386 | | | $ | 25,702,482 | | | | | | | | (2,213,854 | ) | | $ | (78,448,508 | ) |
| | | | | | | | | | | | |
| | | | | | | | | | | | | | | | | | | | |
Service | | | | | | | | | | | | | | | | | | | | |
Shares sold | | | 25,589 | | | $ | 893,432 | | | | | | | | 70,011 | | | $ | 2,468,788 | |
Shares issued in reinvestment of distributions | | | 38,729 | | | | 1,313,672 | | | | | | | | 67,293 | | | | 2,243,536 | |
Shares redeemed | | | (146,237 | ) | | | (5,099,424 | ) | | | | | | | (222,718 | ) | | | (7,485,137 | ) |
| | | | | | | | | | | | |
Net decrease | | | (81,919 | ) | | $ | (2,892,320 | ) | | | | | | | (85,414 | ) | | $ | (2,772,813 | ) |
| | | | | | | | | | | | |
| | | | | | | | | | | | | | | | | | | | |
Investor A | | | | | | | | | | | | | | | | | | | | |
Shares sold and automatic conversion of shares | | | 948,608 | | | $ | 32,105,870 | | | | | | | | 2,146,223 | | | $ | 63,194,419 | |
Shares issued in reinvestment of distributions | | | 650,731 | | | | 21,298,686 | | | | | | | | 812,533 | | | | 33,052,964 | |
Shares redeemed | | | (3,178,794 | ) | | | (107,851,543 | ) | | | | | | | (3,645,563 | ) | | | (118,424,151 | ) |
| | | | | | | | | | | | |
Net decrease | | | (1,579,455 | ) | | $ | (54,446,987 | ) | | | | | | | (686,807 | ) | | $ | (22,176,768 | ) |
| | | | | | | | | | | | |
| | | | | | | | | | | | | | | | | | | | |
Investor B | | | | | | | | | | | | | | | | | | | | |
Shares sold | | | 10 | | | $ | 293 | | | | | | | | 771 | | | $ | 20,367 | |
Shares issued in reinvestment of distributions | | | 8,218 | | | | 216,878 | | | | | | | | 24,145 | | | | 640,076 | |
Shares redeemed and automatic conversion of shares | | | (86,880 | ) | | | (2,385,439 | ) | | | | | | | (128,494 | ) | | | (3,476,581 | ) |
| | | | | | | | | | | | |
Net decrease | | | (78,652 | ) | | $ | (2,168,268 | ) | | | | | | | (103,578 | ) | | $ | (2,816,138 | ) |
| | | | | | | | | | | | |
| | | | | | | | | | | | | | | | | | | | |
Investor C | | | | | | | | | | | | | | | | | | | | |
Shares sold | | | 212,329 | | | $ | 5,778,719 | | | | | | | | 705,922 | | | $ | 11,223,898 | |
Shares issued in reinvestment of distributions | | | 423,482 | | | | 11,174,266 | | | | | | | | 426,884 | | | | 18,958,816 | |
Shares redeemed | | | (1,169,983 | ) | | | (31,952,806 | ) | | | | | | | (1,808,383 | ) | | | (48,471,446 | ) |
| | | | | | | | | | | | |
Net increase (decrease) | | | (534,172 | ) | | $ | (14,999,821 | ) | | | | | | | (675,577 | ) | | $ | (18,288,732 | ) |
| | | | | | | | | | | | |
Total Net Increase (Decrease) | | | (1,569,812 | ) | | $ | (48,804,914 | ) | | | | | | | (3,765,230 | ) | | $ | (124,502,959 | ) |
| | | | | | | | | | | | |
12. Subsequent Events:
Management’s evaluation of the impact of all subsequent events on the Funds’ financial statements was completed through the date the financial statements were issued and the following item was noted:
Effective April 20, 2017, the credit agreement was extended until April 2018 under the same terms.
| | | | | | |
| 96 | | BLACKROCK FUNDS | | MARCH 31, 2017 | | |
Rodney D. Johnson, Chair of the Board and Trustee
Susan J. Carter, Trustee
Collette Chilton, Trustee
Neil A. Cotty, Trustee
Cynthia A. Montgomery, Trustee
Joseph P. Platt, Trustee
Robert C. Robb, Jr., Trustee
Mark Stalnecker, Trustee
Kenneth L. Urish, Trustee
Claire A. Walton, Trustee
Frederick W. Winter, Trustee
Barbara G. Novick, Trustee
John M. Perlowski, Trustee, President and Chief Executive Officer
Thomas Callahan, Vice President
Jennifer McGovern, Vice President
Neal J. Andrews, Chief Financial Officer
Jay M. Fife, Treasurer
Charles Park, Chief Compliance Officer
Fernanda Piedra, Anti-Money Laundering Compliance Officer
Benjamin Archibald, Secretary
Effective December 31, 2016, David O. Beim and Dr. Matina S. Horner retired as Trustees of the Trust.
| | | | | | |
| | | | |
Investment Advisor and Administrator BlackRock Advisors, LLC Wilmington, DE 19809 | | Sub-Adviser1 BlackRock International Limited Edinburgh, United Kingdom EH3 8BL | | Accounting Agent and Transfer Agent BNY Mellon Investment Servicing (US) Inc. Wilmington, DE 19809 | | Custodian The Bank of New York Mellon New York, NY 10286 |
| | | | | | |
Distributor BlackRock Investments, LLC New York, NY 10022 | | Legal Counsel Sidley Austin LLP New York, NY 10019 | | Independent Registered Public Accounting Firm Deloitte & Touche LLP Philadelphia, PA 19103 | | Address of the Trust 100 Bellevue Parkway Wilmington, DE 19809 |
| 1 | BlackRock International Opportunities Portfolio |
| | | | | | |
| | | BLACKROCK FUNDS | | MARCH 31, 2017 | | 97 |
Householding
The Funds will mail only one copy of shareholder documents, including prospectuses, annual and semi-annual reports and proxy statements, to shareholders with multiple accounts at the same address. This practice is commonly called “householding” and is intended to reduce expenses and eliminate duplicate mailings of shareholder documents. Mailings of your shareholder documents may be householded indefinitely unless you instruct us otherwise. If you do not want the mailing of these documents to be combined with those for other members of your household, please call the Funds at (800) 441-7762.
Availability of Quarterly Schedule of Investments
The Funds file their complete schedule of portfolio holdings with the SEC for the first and third quarters of each fiscal year on Form N-Q. The Funds’ Forms N-Q are available on the SEC’s website at http://www.sec.gov and may also be reviewed and copied at the SEC’s Public Reference Room in Washington, D.C. Information on the operations of the Public Reference Room or how to access documents on the SEC’s website without charge may be obtained by calling (800) SEC-0330. The Funds’ Forms N-Q may also be obtained upon request and without charge by calling (800) 441-7762.
Availability of Proxy Voting Policies and Procedures
A description of the policies and procedures that the Funds use to determine how to vote proxies relating to portfolio securities is available upon request and without charge (1) by calling (800) 441-7762; (2) at http://www.blackrock.com; and (3) on the SEC’s website at http://www.sec.gov.
Availability of Proxy Voting Record
Information about how the Funds voted proxies relating to securities held in the Funds’ portfolios during the most recent 12-month period ended June 30 is available upon request and without charge (1) at http://www.blackrock.com or by calling (800) 441-7762 and (2) on the SEC’s website at http://www.sec.gov.
BlackRock’s Mutual Fund Family
BlackRock offers a diverse lineup of open-end mutual funds crossing all investment styles and managed by experts in equity, fixed-income and tax-exempt investing. Visit http://www.blackrock.com for more information.
| | | | | | |
| 98 | | BLACKROCK FUNDS | | MARCH 31, 2017 | | |
| | | | |
| Additional Information (concluded) | | | | |
Account Information
Call us at (800) 441-7762 from 8:00 AM to 6:00 PM ET on any business day to get information about your account balances, recent transactions and share prices. You can also reach us on the Web at http://www.blackrock.com.
Automatic Investment Plans
Investor Class shareholders who want to invest regularly can arrange to have $50 or more automatically deducted from their checking or savings account and invested in any of the BlackRock funds.
Systematic Withdrawal Plans
Investor Class shareholders can establish a systematic withdrawal plan and receive periodic payments of $50 or more from their BlackRock funds, as long as their account balance is at least $10,000.
Retirement Plans
Shareholders may make investments in conjunction with Traditional, Rollover, Roth, Coverdell, Simple IRAs, SEP IRAs and 403(b) Plans.
|
| BlackRock Privacy Principles |
BlackRock is committed to maintaining the privacy of its current and former fund investors and individual clients (collectively, “Clients”) and to safeguarding their non-public personal information. The following information is provided to help you understand what personal information BlackRock collects, how we protect that information and why in certain cases we share such information with select parties.
If you are located in a jurisdiction where specific laws, rules or regulations require BlackRock to provide you with additional or different privacy-related rights beyond what is set forth below, then BlackRock will comply with those specific laws, rules or regulations.
BlackRock obtains or verifies personal non-public information from and about you from different sources, including the following: (i) information we receive from you or, if applicable, your financial intermediary, on applications, forms or other documents; (ii) information about your transactions with us, our affiliates, or others; (iii) information we receive from a consumer reporting agency; and (iv) from visits to our websites.
BlackRock does not sell or disclose to non-affiliated third parties any non-public personal information about its Clients, except as permitted by law or as is necessary to respond to regulatory requests or to service Client accounts. These non-affiliated third parties are required to protect the confidentiality and security of this information and to use it only for its intended purpose.
We may share information with our affiliates to service your account or to provide you with information about other BlackRock products or services that may be of interest to you. In addition, BlackRock restricts access to non-public personal information about its Clients to those BlackRock employees with a legitimate business need for the information. BlackRock maintains physical, electronic and procedural safeguards that are designed to protect the non-public personal information of its Clients, including procedures relating to the proper storage and disposal of such information.
| | | | | | |
| | | BLACKROCK FUNDS | | MARCH 31, 2017 | | 99 |
| | | | |
| Disclosure of Sub-Advisory Agreement | | | | |
The Board of Trustees (the “Board,” and the members of which are referred to as “Board Members”) of BlackRock Funds (the “Trust”) met in person on February 24, 2017 (the “February 2017 Meeting”) to consider the initial approval of the proposed sub-advisory agreement (the “Sub-Advisory Agreement”) between BlackRock Advisors, LLC (the “Manager”), the Trust’s investment advisor, and BlackRock International Limited (the “Sub-Advisor”) with respect to BlackRock International Opportunities Portfolio (the “Fund”), a series of the Trust. The Board was informed that the Sub-Advisory Agreement was substantially the same as the sub-advisory agreement previously approved with respect to certain other portfolios of the Trust.
On the date of the February 2017 Meeting, the Board consisted of thirteen individuals, eleven of whom were not “interested persons” of the Trust or the Fund as defined in the Investment Company Act of 1940, as amended (the “1940 Act”) (the “Independent Board Members”). Pursuant to the 1940 Act, the Board is required to consider the initial approval of the Sub-Advisory Agreement.
The Board previously met in person on April 21, 2016 (the “April 2016 Meeting”) and on May 18-20, 2016 (the “May 2016 Meeting”) to consider the approval of the investment advisory agreement (the “Advisory Agreement”) between the Trust, on behalf of the Fund, and the Manager. At the May 2016 Meeting, the Board, including the independent board members, approved the continuation of the Advisory Agreement for a one-year term ending June 30, 2017. A discussion of the basis for the Board’s approval of the Advisory Agreement at the May 2016 Meeting is included in the annual shareholder report of the Fund for the period ended September 30, 2016.
At the February 2017 Meeting, the Board reviewed materials relating to its consideration of the Sub-Advisory Agreement. The factors considered by the Board at the February 2017 Meeting in connection with approval of the proposed Sub-Advisory Agreement were substantially the same as the factors considered at the April 2016 Meeting and the May 2016 Meeting with respect to approval of the Advisory Agreement.
Following discussion, the Board, including a majority of the Independent Board Members, approved the Sub-Advisory Agreement between the Manager and the Sub-Advisor with respect to the Fund for a two-year term beginning on the effective date of the Sub-Advisory Agreement. Based upon its evaluation of all of the aforementioned factors in their totality, the Board, including a majority of the Independent Board Members, was satisfied that the terms of the Sub-Advisory Agreement were fair and reasonable and in the best interest of the Fund and its shareholders. In arriving at its decision to approve the Sub-Advisory Agreement, the Board did not identify any single factor or group of factors as all-important or controlling, but considered all factors together, and different Board Members may have attributed different weights to the various factors considered. The Independent Board Members were also assisted by the advice of independent legal counsel in making this determination.
| | | | | | |
| 100 | | BLACKROCK FUNDS | | MARCH 31, 2017 | | |
This report is intended for current holders. It is not authorized for use as an offer of sale or a solicitation of an offer to buy shares of a Fund unless preceded or accompanied by that Fund’s current prospectus. Past performance results shown in this report should not be considered a representation of future performance. Investment returns and principal value of shares will fluctuate so that shares, when redeemed, may be worth more or less than their original cost. Statements and other information herein are as dated and are subject to change.

| | |
| |
Eq-Opps-3/17-SAR | |  |
MARCH 31, 2017
| | | | |
SEMI-ANNUAL REPORT (UNAUDITED) | | | | BLACKROCK® |
| | | | |
| | BlackRock Tactical Opportunities Fund | | of BlackRock FundsSM |
| | |
| Not FDIC Insured ◾ May Lose Value ◾ No Bank Guarantee | | |
Dear Shareholder,
In the 12 months ended March 31, 2017, risk assets, such as stocks and high-yield bonds, delivered strong performance, while U.S. Treasuries and other higher-quality assets generated negative returns. Markets showed great resilience during a period with big surprises, including the United Kingdom’s vote to leave the European Union and the outcome of the U.S. presidential election, which brought only brief spikes in equity market volatility. The more rate-sensitive high-quality assets, however, struggled as rising energy prices, modest wage increases and steady U.S. job growth led to expectations of higher inflation and anticipation of interest rate increases by the U.S. Federal Reserve (the “Fed”).
The global reflationary theme — rising nominal growth, wages and inflation — was the dominant driver of asset returns during the period, outweighing significant political upheavals and uncertainty. Reflationary expectations accelerated after the U.S. election and continued into the beginning of 2017, stoked by expectations for an extra boost to U.S. growth via fiscal policy. The primary tension surfacing in markets in 2017 has been between reflationary expectations and the realities of fiscal and monetary policy. Markets have been turning their attention to the Fed’s outlook for additional interest rate hikes, while assessing the probability of Congress passing meaningful fiscal stimulus amid political division and a limited budget.
Although economic momentum is gaining traction, the capacity for rapid global growth is restrained by structural factors, including an aging population, low productivity growth and excess savings, as well as cyclical factors, like the Fed leaning toward higher interest rates and the length of the current expansion. Tempered economic growth and high valuations across most assets have set the stage for muted long-term investment returns going forward.
Equity markets still present opportunities, although the disparity between winners and losers is widening — a dynamic that increases the risk and return potential of active investing. Fixed income investors are also facing challenges as bond markets recalibrate for higher inflation expectations after eight years of deflationary concerns. And in a world where political risk and policy uncertainty abound, there is no lack of potential catalysts for higher volatility.
In this environment, investors need to think globally, extend their scope across a broad array of asset classes and be nimble as market conditions change. We encourage you to talk with your financial advisor and visit blackrock.com for further insight about investing in today’s markets.
Sincerely,

Rob Kapito
President, BlackRock Advisors, LLC

Rob Kapito
President, BlackRock Advisors, LLC
| | | | | | | | |
| Total Returns as of March 31, 2017 | |
| | | 6-month | | | 12-month | |
U.S. large cap equities
(S&P 500® Index) | | | 10.12 | % | | | 17.17 | % |
U.S. small cap equities
(Russell 2000® Index) | | | 11.52 | | | | 26.22 | |
International equities
(MSCI Europe, Australasia,
Far East Index) | | | 6.48 | | | | 11.67 | |
Emerging market equities
(MSCI Emerging Markets Index) | | | 6.80 | | | | 17.21 | |
3-month Treasury bills
(BofA Merrill Lynch
3-Month U.S. Treasury
Bill Index) | | | 0.19 | | | | 0.36 | |
U.S. Treasury securities
(BofA Merrill Lynch
10- Year U.S. Treasury
Index) | | | (6.08 | ) | | | (3.97 | ) |
U.S. investment-grade
bonds (Bloomberg Barclays
U.S. Aggregate Bond Index) | | | (2.18 | ) | | | 0.44 | |
Tax-exempt municipal bonds
(S&P Municipal Bond Index) | | | (1.93 | ) | | | 0.55 | |
U.S. high yield bonds
(Bloomberg Barclays U.S.
Corporate High Yield 2%
Issuer Capped Index) | | | 4.50 | | | | 16.39 | |
|
| Past performance is no guarantee of future results. Index performance is shown for illustrative purposes only. You cannot invest directly in an index. | |
| | | | | | |
| 2 | | THIS PAGE NOT PART OF YOUR FUND REPORT | | | | |
| | |

| | Shareholders can sign up for e-mail notifications of quarterly statements, annual and semi-annual shareholder reports and prospectuses by enrolling in the electronic delivery program. Electronic copies of shareholder reports and prospectuses are also available on BlackRock’s website. TO ENROLL IN ELECTRONIC DELIVERY: Shareholders Who Hold Accounts with Investment Advisors, Banks or Brokerages: Please contact your financial advisor. Please note that not all investment advisors, banks or brokerages may offer this service. Shareholders Who Hold Accounts Directly with BlackRock: 1. Access the BlackRock website at blackrock.com 2. Select "Access Your Account" 3. Next, select "eDelivery" in the "Related Resources" box and follow the sign-up instructions |
| | | | | | |
| | | BLACKROCK TACTICAL OPPORTUNITIES FUND | | MARCH 31, 2017 | | 3 |
| | | | |
| Fund Summary as of March 31, 2017 | | | | |
BlackRock Tactical Opportunities Fund’s (the “Fund”) investment objective is to seek total return.
|
| Portfolio Management Commentary |
How did the Fund perform?
| • | | For the six-month period ended March 31, 2017, the Fund outperformed its reference benchmark (75% Bloomberg Barclays U.S. 1-3 Year Treasury Bond Index/25% MSCI All Country World Index (“ACWI”), except for its Investor B and Investor C Shares, which underperformed the reference benchmark. The Fund also outperformed its cash benchmark, the BofA Merrill Lynch 3-Month U.S. Treasury Bill Index for the same six-month period. |
What factors influenced performance?
| • | | Positive performance was primarily driven by a preference for stocks over bonds, as growth and inflation dynamics improved and the shift toward monetary policy normalization continued. Within equities, gains were concentrated in peripheral Europe on the back of broad-based strength in economic data and receding concerns about the impact of Italy’s constitutional referendum. A cautious view on Mexican bonds also added value, as inflation rose over the period and the Bank of Mexico increased the benchmark overnight rate. In terms of currencies, a long euro position benefited performance as the European Central Bank (“ECB”) adopted a more upbeat tone in response to solid growth data. |
| • | | A short position in U.S. equities was the main drag on performance, as domestic stocks advanced on positive economic momentum and in anticipation of lower taxes, reduced regulation and increased infrastructure spending under the Trump administration. Additionally, a negative view on U.K. bonds dampened performance as the Bank of England maintained its supportive stance despite upbeat economic releases. |
Describe recent portfolio activity.
| • | | From a broad asset allocation perspective, the Fund reduced equity exposure on the back of a rally in risk assets and used the move higher in global bond yields to take profits on short fixed income positioning. The Fund held a significant short position in fixed income in advance of the U.S. election, and began to reduce this short in late 2016 following a |
| | | sharp rise in bond yields. Rates continued to move modestly higher into the start of 2017, allowing the Fund to capture profits before rates began trending lower in March. Within equities, the Fund increased exposure to Europe as growth data remained solid despite ongoing political uncertainty. In terms of fixed income positioning, the Fund added to a trade favoring Australia and Canada relative to Europe and the U.K., based on diverging economic and monetary policies. Finally, the Fund introduced a long position in the euro against the Canadian dollar given a view that European short-term bond yields are pricing in an overly stimulative monetary policy path. |
| • | | Derivatives including futures, swaps and foreign currency transactions are used by the Fund as a means to manage risk and/or take outright views on interest rates, credit risk and/or currencies. During the period, the use of derivatives had a net negative impact on performance. Additionally, the Fund held a higher allocation to cash as a means of reducing overall portfolio volatility. The cash position did not have a material impact on performance. |
Describe portfolio positioning at period end.
| • | | The Fund ended the period with reduced directional exposure to both equities and fixed income, as market pricing had become more aligned with the investment adviser’s assessment of fair value. Within equities, the Fund favored exposure to Europe over the United States on the view that the underlying trends in the European economy were positive, and that a benign outcome in the French election could result in a more optimistic tone in European markets. The Fund remained cautiously positioned on domestic equities in anticipation of further policy tightening. Within fixed income, the Fund was underweight European and U.K. interest rates. The Fund was also tilted toward Australian and Canadian bonds as softer growth and inflation dynamics appeared to leave room for central bank accommodation in those economies. In terms of currencies, the Fund held a long position in the euro against the Canadian dollar on the view that the ECB will tighten its policy stance in response to positive economic data. |
The views expressed reflect the opinions of BlackRock as of the date of this report and are subject to change based on changes in market, economic or other conditions. These views are not intended to be a forecast of future events and are no guarantee of future results.
| | |
| Ten Largest Holdings | | Percent of
Total Investments1 |
U.S. Treasury Notes | | 35% |
Cisco Systems, Inc. | | 2 |
Apple Inc. | | 2 |
AGL Energy Ltd. | | 2 |
Lear Corp. | | 1 |
Coca-Cola Co. | | 1 |
Expeditors International of Washington, Inc. | | 1 |
Colgate-Palmolive Co. | | 1 |
Johnson & Johnson | | 1 |
Microsoft Corp. | | 1 |
| | 1 | | Total investments exclude short-term securities. |
| | |
| Portfolio Composition | | Percent of
Total Investments1 |
Common Stocks | | 65% |
U.S. Treasury Obligations | | 35 |
| | 1 | | Total investments exclude short-term securities. |
| | | | | | |
| 4 | | BLACKROCK TACTICAL OPPORTUNITIES FUND | | MARCH 31, 2017 | | |
|
| Total Return Based on a $10,000 Investment |
| | |
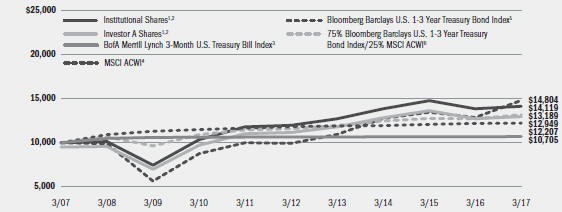 | | 1 Assuming maximum sales charges, if any, transaction costs and other operating expenses, including investment advisory fees and administration fees, if any. Institutional Shares do not have a sales charge. 2 The Fund uses an asset allocation strategy, investing varying percentages of its portfolio in three major categories: stocks, bonds and money market instruments. The Fund’s total returns from May 15, 2012 through January 28, 2016 are the returns of the Fund when it followed a different investment strategy by investing a significant portion of its assets in other investment companies and directly in securities. The Fund’s total returns prior to May 15, 2012 are |
| | | | the returns of the Fund when it followed different investment strategies under the name BlackRock Asset Allocation Portfolio. |
| | 3 | | An unmanaged index that tracks 3-month U.S. Treasury securities. |
| | 4 | | A free float-adjusted market capitalization weighted index that is designed to measure the equity market performance of developed and emerging markets. The MSCI ACWI consists of 46 country indexes comprising of 23 developed and 23 emerging market country indexes. |
| | 5 | | A sub-index of the Bloomberg Barclays U.S. Treasury Index, which measures U.S. dollar-denominated, fixed-rate, nominal debt issued by the U.S. Treasury and includes a maturity constraint of at least one year and up to, but not including, three years until final maturity. |
| | 6 | | A customized weighted index comprised of 75% Bloomberg Barclays U.S. 1-3 Year Treasury Bond Index and 25% MSCI ACWI. |
| | | | | | | | | | | | | | | | | | | | | | | | | | | | | | | | | | | |
| Performance Summary for the Period Ended March 31, 2017 | |
| | | | | Average Annual Total Returns2,7 |
| | | | | 1 Year | | 5 Years | | 10 Years |
| | | 6-Month
Total Returns | | w/o sales
charge | | w/sales
charge | | w/o sales
charge | | w/sales
charge | | w/o sales
charge | | w/sales
charge |
Institutional | | | | 2.34 | % | | | | 2.04 | % | | | | N/A | | | | | 3.35 | % | | | | N/A | | | | | 3.51 | % | | | | N/A | |
Service | | | | 2.17 | | | | | 1.79 | | | | | N/A | | | | | 3.02 | | | | | N/A | | | | | 3.21 | | | | | N/A | |
Investor A | | | | 2.17 | | | | | 1.72 | | | | | (3.63 | )% | | | | 3.03 | | | | | 1.92 | % | | | | 3.17 | | | | | 2.62 | % |
Investor B | | | | 1.68 | | | | | 0.76 | | | | | (3.75 | ) | | | | 2.04 | | | | | 1.72 | | | | | 2.47 | | | | | 2.47 | |
Investor C | | | | 1.79 | | | | | 0.94 | | | | | (0.06 | ) | | | | 2.32 | | | | | 2.32 | | | | | 2.45 | | | | | 2.45 | |
Class K | | | | 2.30 | | | | | 2.03 | | | | | N/A | | | | | 3.37 | | | | | N/A | | | | | 3.52 | | | | | N/A | |
Bloomberg Barclays U.S. 1-3 Year Treasury Bond Index | | | | (0.19 | ) | | | | 0.24 | | | | | N/A | | | | | 0.64 | | | | | N/A | | | | | 2.01 | | | | | N/A | |
BofA Merrill Lynch 3-Month U.S. Treasury Bill Index | | | | 0.19 | | | | | 0.36 | | | | | N/A | | | | | 0.14 | | | | | N/A | | | | | 0.68 | | | | | N/A | |
75% Bloomberg Barclays U.S. 1-3 Year Treasury Bond Index/25% MSCI ACWI | | | | 1.87 | | | | | 3.79 | | | | | N/A | | | | | 2.64 | | | | | N/A | | | | | 2.81 | | | | | N/A | |
MSCI ACWI | | | | 8.18 | | | | | 15.04 | | | | | N/A | | | | | 8.37 | | | | | N/A | | | | | 4.00 | | | | | N/A | |
| | 7 | | Assuming maximum sales charges, if any. Average annual total returns with and without sales charges reflect reductions for distribution and service fees. See “About Fund Performance” on page 6 for a detailed description of share classes, including any related sales charges and fees. |
| | | N/A—Not applicable as share class and index do not have a sales charge. |
| | | Past performance is not indicative of future results. |
| | | Performance results may include adjustments made for financial reporting purposes in accordance with U.S. generally accepted accounting principles. |
| | | | | | | | | | | | | | |
| Expense Example |
| | | Actual | | Hypothetical9 | | |
| | | Beginning
Account Value
October 1, 2016 | | Ending
Account Value
March 31, 2017 | | Expenses Paid
During the Period8 | | Beginning
Account Value
October 1, 2016 | | Ending
Account Value
March 31, 2017 | | Expenses Paid
During the Period8 | | Annualized
Expense
Ratio |
Institutional | | $1,000.00 | | $1,023.40 | | $ 4.49 | | $1,000.00 | | $1,020.49 | | $ 4.48 | | 0.89% |
Service | | $1,000.00 | | $1,021.70 | | $ 5.90 | | $1,000.00 | | $1,019.10 | | $ 5.89 | | 1.17% |
Investor A | | $1,000.00 | | $1,021.70 | | $ 6.15 | | $1,000.00 | | $1,018.85 | | $ 6.14 | | 1.22% |
Investor B | | $1,000.00 | | $1,016.80 | | $10.76 | | $1,000.00 | | $1,014.26 | | $10.75 | | 2.14% |
Investor C | | $1,000.00 | | $1,017.90 | | $ 9.56 | | $1,000.00 | | $1,015.46 | | $ 9.55 | | 1.90% |
Class K | | $1,000.00 | | $1,023.00 | | $ 3.88 | | $1,000.00 | | $1,021.09 | | $ 3.88 | | 0.77% |
| | 8 | | For each class of the Fund, expenses are equal to the annualized expense ratio for the class, multiplied by the average account value over the period, multiplied by 182/ 365 (to reflect the one-half year period shown). The fees and expenses of the underlying funds in which the Fund invests are not included in the Fund’s annualized expense ratio. |
| | 9 | | Hypothetical 5% annual return before expenses is calculated by prorating the number of days in the most recent fiscal half year divided by 365. |
| | | See “Disclosure of Expenses” on page 7 for further information on how expenses were calculated. |
| | | | | | |
| | | BLACKROCK TACTICAL OPPORTUNITIES FUND | | MARCH 31, 2017 | | 5 |
| • | | Institutional and Class K Shares are not subject to any sales charge. These shares bear no ongoing distribution or service fees and are available only to certain eligible investors. Prior to August 1, 2016 (commencement of operations), Class K Shares performance results are those of Institutional Shares, restated to reflect Class K Shares fees. |
| • | | Service Shares are not subject to any sales charge. These shares are subject to a service fee of 0.25% per year (but no distribution fee) and are only available to certain eligible investors. |
| • | | Investor A Shares are subject to a maximum initial sales charge (front-end load) of 5.25% and a service fee of 0.25% per year (but no distribution fee). Certain redemptions of these shares may be subject to a contingent deferred sales charge (“CDSC”) where no initial sales charge was paid at the time of purchase. These shares are generally available through financial intermediaries. |
| • | | Investor B Shares are subject to a maximum CDSC of 4.50%, declining to 0% after six years. In addition, these shares are subject to a distribution fee of 0.75% per year and a service fee of 0.25% per year. These shares automatically convert to Investor A Shares after approximately eight years. (There is no initial sales charge for automatic share conversions.) All returns for periods greater than eight years reflect this conversion. These shares are only available through exchanges and distribution reinvestments by current holders and for purchase by certain employer- sponsored retirement plans. |
| • | | Investor C Shares are subject to a 1.00% CDSC if redeemed within one year of purchase. In addition, these shares are subject to a distribution fee of 0.75% per year and a service fee of 0.25% per year. These shares are generally available through financial intermediaries. |
Performance information reflects past performance and does not guarantee future results. Current performance may be lower or higher than the performance data quoted. Refer to www.blackrock.com/funds to obtain performance data current to the most recent month end. Performance results do not reflect the deduction of taxes that a shareholder would pay on fund distributions or the redemption of fund shares. Figures shown in the performance table on the previous page assume reinvestment of all distributions, if any, at net asset value (“NAV”) on the ex-dividend date. Investment return and principal value of shares will fluctuate so that shares, when redeemed, may be worth more or less than their original cost. Distributions paid to each class of shares will vary because of the different levels of service, distribution and transfer agency fees applicable to each class, which are deducted from the income available to be paid to shareholders.
BlackRock Advisors, LLC (the “Manager”), the Fund’s investment adviser, has contractually agreed to waive and/or reimburse a portion of the Fund’s expenses. Without such waiver and/or reimbursement, the Fund’s performance would have been lower. The Manager is under no obligation to continue waiving and/or reimbursing its fees after the applicable termination date of such agreement. See Note 6 of the Notes to Financial Statements for additional information on waivers and/or reimbursements.
| | | | | | |
| 6 | | BLACKROCK TACTICAL OPPORTUNITIES FUND | | MARCH 31, 2017 | | |
Shareholders of the Fund may incur the following charges: (a) transactional expenses, such as sales charges; and (b) operating expenses, including investment advisory fees, administration fees, service and distribution fees, including 12b-1 fees, acquired fund fees and expenses and other fund expenses. The expense example on the previous page (which is based on a hypothetical investment of $1,000 invested on October 1, 2016 and held through March 31, 2017), is intended to assist shareholders both in calculating expenses based on an investment in the Fund and in comparing these expenses with similar costs of investing in other mutual funds.
The expense example provides information about actual account values and actual expenses. In order to estimate the expenses a shareholder paid during the period covered by this report, shareholders can divide their account value by $1,000 and then multiply the result by the number corresponding to their share class under the heading entitled “Expenses Paid During the Period.”
The expense example also provides information about hypothetical account values and hypothetical expenses based on the Fund’s actual expense ratio and an assumed rate of return of 5% per year before expenses. In order to assist shareholders in comparing the ongoing expenses of investing in the Fund and other funds, compare the 5% hypothetical example with the 5% hypothetical examples that appear in shareholder reports of other funds.
The expenses shown in the expense example are intended to highlight shareholders’ ongoing costs only and do not reflect transactional expenses, such as sales charges, if any. Therefore, the hypothetical example is useful in comparing ongoing expenses only, and will not help shareholders determine the relative total expenses of owning different funds. If these transactional expenses were included, shareholder expenses would have been higher.
| | | | |
| Derivative Financial Instruments | | | | |
The Fund may invest in various derivative financial instruments.
These instruments are used to obtain exposure to a security, commodity, index, market, and/or other asset without owning or taking physical custody of securities, commodities and/or other referenced assets or to manage market, equity, credit, interest rate, foreign currency exchange rate, commodity and/or other risks. Derivative financial instruments may give rise to a form of economic leverage and involve risks, including the imperfect correlation between the value of a derivative financial instrument and the underlying asset, possible default of the counterparty to
the transaction or illiquidity of the instrument. The Fund’s successful use of a derivative financial instrument depends on the investment adviser’s ability to predict pertinent market movements accurately, which cannot be assured. The use of these instruments may result in losses greater than if they had not been used, may limit the amount of appreciation the Fund can realize on an investment and/or may result in lower distributions paid to shareholders. The Fund’s investments in these instruments, if any, are discussed in detail in the Notes to Financial Statements.
| | | | | | |
| | | BLACKROCK TACTICAL OPPORTUNITIES FUND | | MARCH 31, 2017 | | 7 |
| | | | |
| Schedule of Investments March 31, 2017 (Unaudited) | | | (Percentages shown are based on Net Assets) | |
| | | | |
| | | | | | | | | | | | |
| Asset-Backed Securities — 0.0% | | | | | Par (000) | | | Value | |
Knollwood CDO Ltd., Series 2004-1A, Class C,
4.21%, 1/10/39 (a)(b) | | | USD | | | | 149 | | | | $ 1 | |
| | | | | | | | | | | | |
| Common Stocks | | | | | Shares | | | | |
Aerospace & Defense — 0.0% | | | | | | | | | | | | |
Boeing Co. | | | | | | | 651 | | | | 115,136 | |
Air Freight & Logistics — 0.7% | | | | | | | | | | | | |
Deutsche Post AG | | | | | | | 349 | | | | 11,944 | |
Expeditors International of Washington, Inc. | | | | | | | 70,506 | | | | 3,982,884 | |
| | | | | | | | | | | | |
| | | | | | | | | | | | 3,994,828 | |
Airlines — 0.3% | | | | | | | | | | | | |
Delta Air Lines, Inc. | | | | | | | 5,395 | | | | 247,954 | |
Deutsche Lufthansa AG | | | | | | | 21,354 | | | | 346,424 | |
Singapore Airlines Ltd. | | | | | | | 115,200 | | | | 829,256 | |
United Continental Holdings, Inc. (c) | | | | | | | 3,375 | | | | 238,410 | |
| | | | | | | | | | | �� | |
| | | | | | | | | | | | 1,662,044 | |
Auto Components — 2.4% | | | | | | | | | | | | |
Aisin Seiki Co. Ltd. | | | | | | | 13,400 | | | | 659,979 | |
Autoliv, Inc. | | | | | | | 4,949 | | | | 506,085 | |
BorgWarner, Inc. | | | | | | | 24,571 | | | | 1,026,822 | |
Bridgestone Corp. | | | | | | | 1,700 | | | | 69,008 | |
Continental AG | | | | | | | 2,089 | | | | 458,015 | |
Delphi Automotive PLC (c) | | | | | | | 3,686 | | | | 296,686 | |
GKN PLC | | | | | | | 226,403 | | | | 1,031,210 | |
Goodyear Tire & Rubber Co. | | | | | | | 16,939 | | | | 609,804 | |
Koito Manufacturing Co. Ltd. | | | | | | | 4,600 | | | | 239,745 | |
Lear Corp. | | | | | | | 31,566 | | | | 4,469,114 | |
Magna International, Inc. | | | | | | | 33,087 | | | | 1,427,878 | |
NOK Corp. | | | | | | | 29,900 | | | | 698,388 | |
Sumitomo Electric Industries Ltd. | | | | | | | 35,700 | | | | 593,455 | |
Sumitomo Rubber Industries Ltd. | | | | | | | 10,500 | | | | 179,152 | |
Toyoda Gosei Co. Ltd. | | | | | | | 16,600 | | | | 423,385 | |
Valeo SA | | | | | | | 6,400 | | | | 425,740 | |
| | | | | | | | | | | | |
| | | | | | | | | | | | 13,114,466 | |
Automobiles — 0.2% | | | | | | | | | | | | |
Peugeot SA (c) | | | | | | | 49,255 | | | | 989,905 | |
Banks — 4.2% | | | | | | | | | | | | |
Banco Bilbao Vizcaya Argentaria SA | | | | | | | 12,780 | | | | 99,207 | |
Banco Santander SA | | | | | | | 93,212 | | | | 570,581 | |
Bank Hapoalim BM | | | | | | | 8,606 | | | | 52,447 | |
| | | | | | | | |
| Common Stocks | | Shares | | | Value | |
Banks (continued) | | | | | | | | |
Bank Leumi Le-Israel BM (c) | | | 11,641 | | | $ | 51,392 | |
Bank of America Corp. | | | 82,715 | | | | 1,951,247 | |
Bank of East Asia Ltd. | | | 9,800 | | | | 40,546 | |
Bank of Nova Scotia | | | 23,678 | | | | 1,385,230 | |
Barclays PLC | | | 127,315 | | | | 359,382 | |
BNP Paribas SA | | | 10,591 | | | | 704,770 | |
BOC Hong Kong Holdings Ltd. | | | 30,000 | | | | 122,620 | |
Citigroup, Inc. | | | 23,032 | | | | 1,377,774 | |
Commonwealth Bank of Australia | | | 16,908 | | | | 1,108,743 | |
Danske Bank A/S | | | 2,427 | | | | 82,751 | |
DBS Group Holdings Ltd. | | | 14,300 | | | | 198,082 | |
DNB ASA | | | 14,419 | | | | 228,953 | |
Erste Group Bank AG | | | 5,953 | | | | 193,841 | |
Hang Seng Bank Ltd. | | | 6,200 | | | | 125,776 | |
HSBC Holdings PLC | | | 227,368 | | | | 1,854,602 | |
ING Groep NV | | | 50,342 | | | | 760,382 | |
Intesa Sanpaolo SpA | | | 35,032 | | | | 95,291 | |
Japan Post Bank Co. Ltd. | | | 19,000 | | | | 235,902 | |
JPMorgan Chase & Co. | | | 34,704 | | | | 3,048,399 | |
KBC Group NV | | | 255 | | | | 16,905 | |
Mitsubishi UFJ Financial Group, Inc. | | | 120,200 | | | | 757,160 | |
Mizrahi Tefahot Bank Ltd. | | | 1,130 | | | | 19,153 | |
Mizuho Financial Group, Inc. | | | 330,500 | | | | 606,658 | |
Nordea Bank AB | | | 1,255 | | | | 14,318 | |
Oversea-Chinese Banking Corp. Ltd. | | | 25,200 | | | | 175,040 | |
Resona Holdings, Inc. | | | 14,000 | | | | 75,262 | |
Royal Bank of Canada | | | 6,158 | | | | 448,659 | |
Royal Bank of Scotland Group PLC (c) | | | 19,601 | | | | 59,435 | |
Société Générale SA | | | 4,050 | | | | 205,195 | |
Standard Chartered PLC (c) | | | 19,557 | | | | 187,061 | |
Sumitomo Mitsui Financial Group, Inc. | | | 16,300 | | | | 593,300 | |
Sumitomo Mitsui Trust Holdings, Inc. | | | 2,300 | | | | 79,699 | |
SunTrust Banks, Inc. | | | 3,696 | | | | 204,389 | |
Toronto-Dominion Bank | | | 7,982 | | | | 399,805 | |
U.S. Bancorp | | | 13,571 | | | | 698,907 | |
United Overseas Bank Ltd. | | | 10,600 | | | | 167,430 | |
Wells Fargo & Co. | | | 41,078 | | | | 2,286,401 | |
Westpac Banking Corp. | | | 37,679 | | | | 1,007,248 | |
| | | | | | | | |
| | | | | | | | 22,649,943 | |
| | | | | | | | | | |
| Portfolio Abbreviations |
| AUD | | Australian Dollar | | JIBAR | | Johannesburg Interbank Agreed Rate | | OTC | | Over-the-counter |
| BRL | | Brazilian Real | | JPY | | Japanese Yen | | PLN | | Polish Zloty |
| BZDIOVER | | Overnight Brazil CETIP — Interbank Rate | | KLIBOR | | Kuala Lumpur Interbank Offered Rate | | PRIBOR | | Prague Interbank Offered Rate |
| CAD | | Canadian Dollar | | KRW | | South Korean Won | | REIT | | Real Estate Investment Trust |
| CDO | | Collateralized Debt Obligation | | LIBOR | | London Interbank Offered Rate | | S&P | | Standard & Poor’s |
| CHF | | Swiss Franc | | MIBOR | | Moscow Interbank Offer Rate | | SEK | | Swedish Krona |
| CNY | | Chinese Yuan | | MXIBTIIE | | Mexico Interbank TIIE 28-Day | | SGD | | Singapore Dollar |
| CZK | | Czech Koruna | | MXN | | Mexican Peso | | STIBOR | | Stockholm Interbank Offered Rate |
| EUR | | Euro | | MYR | | Malaysian Ringgit | | THB | | Thai Baht |
| EURIBOR | | Euro Interbank Offered Rate | | NOK | | Norwegian Krone | | USD | | U.S. Dollar |
| GBP | | British Pound | | NZD | | New Zealand Dollar | | ZAR | | South African Rand |
| INR | | Indian Rupee | | | | | | | | |
See Notes to Financial Statements.
| | | | | | |
| 8 | | BLACKROCK TACTICAL OPPORTUNITIES FUND | | MARCH 31, 2017 | | |
| | | | |
| Schedule of Investments (continued) | | | | |
| | | | |
| | | | | | | | |
| Common Stocks | | Shares | | | Value | |
Beverages — 1.4% | | | | | |
Coca-Cola Co. | | | 104,537 | | | $ | 4,436,550 | |
Kirin Holdings Co. Ltd. | | | 4,600 | | | | 87,015 | |
PepsiCo, Inc. | | | 25,541 | | | | 2,857,016 | |
| | | | | | | | |
| | | | | | | | 7,380,581 | |
Biotechnology — 0.7% | | | | | | | | |
AbbVie, Inc. | | | 17,029 | | | | 1,109,610 | |
Actelion Ltd. | | | 115 | | | | 32,447 | |
Amgen, Inc. | | | 9,538 | | | | 1,564,900 | |
Biogen, Inc. (c) | | | 403 | | | | 110,188 | |
Celgene Corp. (c) | | | 4,046 | | | | 503,444 | |
Gilead Sciences, Inc. | | | 8,089 | | | | 549,405 | |
| | | | | | | | |
| | | | | | | | 3,869,994 | |
Building Products — 0.5% | | | | | | | | |
Asahi Glass Co. Ltd. | | | 28,000 | | | | 227,180 | |
Geberit AG | | | 5,337 | | | | 2,299,772 | |
Johnson Controls International PLC | | | 6,412 | | | | 270,073 | |
| | | | | | | | |
| | | | | | | | 2,797,025 | |
Capital Markets — 1.0% | | | | | | | | |
Ameriprise Financial, Inc. | | | 2,442 | | | | 316,679 | |
Brookfield Asset Management, Inc., Class A | | | 27,310 | | | | 994,977 | |
Charles Schwab Corp. | | | 8,749 | | | | 357,047 | |
Credit Suisse Group AG | | | 20,336 | | | | 302,572 | |
Daiwa Securities Group, Inc. | | | 1,000 | | | | 6,101 | |
E*TRADE Financial Corp. (c) | | | 5,822 | | | | 203,130 | |
Goldman Sachs Group, Inc. | | | 1,568 | | | | 360,201 | |
Intercontinental Exchange, Inc. | | | 234 | | | | 14,010 | |
MSCI, Inc. | | | 1,482 | | | | 144,036 | |
Nomura Holdings, Inc. | | | 8,600 | | | | 53,237 | |
Northern Trust Corp. | | | 2,140 | | | | 185,281 | |
S&P Global, Inc. | | | 2,757 | | | | 360,450 | |
State Street Corp. | | | 4,609 | | | | 366,922 | |
TD Ameritrade Holding Corp. | | | 1,183 | | | | 45,971 | |
Thomson Reuters Corp. | | | 17,261 | | | | 746,460 | |
UBS Group AG, Registered Shares | | | 59,843 | | | | 956,567 | |
| | | | | | | | |
| | | | | | | | 5,413,641 | |
Chemicals — 2.4% | | | | | | | | |
Ashland Global Holdings, Inc. | | | 21,904 | | | | 2,711,934 | |
Axalta Coating Systems Ltd. (c) | | | 14,589 | | | | 469,766 | |
Celanese Corp., Class A | | | 21,223 | | | | 1,906,887 | |
Croda International PLC | | | 3,962 | | | | 176,968 | |
Dow Chemical Co. | | | 16,974 | | | | 1,078,528 | |
E.I. du Pont de Nemours & Co. | | | 15,427 | | | | 1,239,251 | |
FMC Corp. | | | 8,565 | | | | 596,038 | |
Frutarom Industries Ltd. | | | 306 | | | | 17,102 | |
International Flavors & Fragrances, Inc. | | | 4,939 | | | | 654,566 | |
LyondellBasell Industries NV, Class A | | | 8,683 | | | | 791,803 | |
Methanex Corp. | | | 5,396 | | | | 252,829 | |
Mitsubishi Chemical Holdings Corp. | | | 71,600 | | | | 555,897 | |
Mitsui Chemicals, Inc. | | | 18,000 | | | | 89,177 | |
Monsanto Co. | | | 2,620 | | | | 296,584 | |
Mosaic Co. | | | 4,214 | | | | 122,965 | |
Praxair, Inc. | | | 12,659 | | | | 1,501,357 | |
Shin-Etsu Chemical Co. Ltd. | | | 1,000 | | | | 86,919 | |
Sumitomo Chemical Co. Ltd. | | | 75,000 | | | | 420,083 | |
Syngenta AG, Registered Shares | | | 743 | | | | 328,139 | |
Teijin Ltd. | | | 2,400 | | | | 45,318 | |
| | | | | | | | |
| | | | | | | | 13,342,111 | |
Communications Equipment — 1.0% | | | | | | | | |
Cisco Systems, Inc. | | | 157,736 | | | | 5,331,477 | |
| | | | | | | | |
| Common Stocks | | Shares | | | Value | |
Construction & Engineering — 0.1% | | | | | | | | |
HOCHTIEF AG | | �� | 4,358 | | | $ | 720,196 | |
Construction Materials — 0.0% | | | | | | | | |
LafargeHolcim Ltd. | | | 3,653 | | | | 215,525 | |
Consumer Finance — 0.3% | | | | | | | | |
American Express Co. | | | 13,743 | | | | 1,087,209 | |
Navient Corp. | | | 30,589 | | | | 451,494 | |
| | | | | | | | |
| | | | | | | | 1,538,703 | |
Containers & Packaging — 0.3% | | | | | | | | |
Avery Dennison Corp. | | | 1,950 | | | | 157,170 | |
Ball Corp. | | | 2,764 | | | | 205,255 | |
Crown Holdings, Inc. (c) | | | 14,625 | | | | 774,394 | |
Sealed Air Corp. | | | 8,078 | | | | 352,039 | |
| | | | | | | | |
| | | | | | | | 1,488,858 | |
Distributors — 0.0% | | | | | | | | |
Jardine Cycle & Carriage Ltd. | | | 800 | | | | 25,058 | |
Diversified Financial Services — 0.4% | | | | | | | | |
Berkshire Hathaway, Inc., Class B (c) | | | 7,991 | | | | 1,331,940 | |
EXOR NV | | | 1,004 | | | | 51,915 | |
Hong Kong Exchanges and Clearing Ltd. | | | 9,300 | | | | 234,676 | |
ORIX Corp. | | | 28,600 | | | | 424,497 | |
Singapore Exchange Ltd. | | | 6,500 | | | | 35,779 | |
| | | | | | | | |
| | | | | | | | 2,078,807 | |
Diversified Telecommunication Services — 1.2% | | | | | | | | |
AT&T Inc. | | | 50,571 | | | | 2,101,225 | |
Bezeq The Israeli Telecommunication Corp. Ltd. | | | 16,720 | | | | 30,028 | |
CenturyLink, Inc. | | | 12,667 | | | | 298,561 | |
Deutsche Telekom AG, Registered Shares | | | 29,095 | | | | 509,823 | |
Frontier Communications Corp. | | | 19,711 | | | | 42,182 | |
HKT Trust & HKT Ltd. (d) | | | 30,000 | | | | 38,680 | |
Nippon Telegraph & Telephone Corp. | | | 25,900 | | | | 1,107,311 | |
Orange SA | | | 32,137 | | | | 498,947 | |
Singapore Telecommunications Ltd. | | | 66,500 | | | | 186,355 | |
Spark New Zealand Ltd. | | | 14,704 | | | | 36,044 | |
TDC A/S | | | 13,244 | | | | 68,210 | |
Telefonica SA | | | 55,429 | | | | 620,437 | |
Telenor ASA | | | 11,046 | | | | 183,755 | |
Telstra Corp. Ltd. | | | 76,080 | | | | 270,720 | |
Verizon Communications, Inc. | | | 16,108 | | | | 785,265 | |
| | | | | | | | |
| | | | | | | | 6,777,543 | |
Electric Utilities — 0.4% | | | | | | | | |
Cheung Kong Infrastructure Holdings Ltd. | | | 6,000 | | | | 47,119 | |
Chubu Electric Power Co., Inc. | | | 5,200 | | | | 69,851 | |
Chugoku Electric Power Co., Inc. | | | 2,200 | | | | 24,408 | |
CLP Holdings Ltd. | | | 13,500 | | | | 141,324 | |
Contact Energy Ltd. | | | 5,743 | | | | 20,364 | |
EDP — Energias de Portugal SA | | | 18,609 | | | | 62,920 | |
Electricite de France SA | | | 18,172 | | | | 152,689 | |
Endesa SA | | | 2,552 | | | | 59,895 | |
Enel SpA (c) | | | 147,985 | | | | 696,340 | |
Exelon Corp. | | | 1,660 | | | | 59,727 | |
Hokuriku Electric Power Co. | | | 1,400 | | | | 13,619 | |
Iberdrola SA | | | 44,283 | | | | 316,398 | |
Kansai Electric Power Co., Inc. | | | 5,600 | | | | 68,906 | |
Kyushu Electric Power Co., Inc. | | | 3,400 | | | | 36,332 | |
Mighty River Power Ltd. | | | 5,498 | | | | 12,140 | |
Power Assets Holdings Ltd. | | | 11,500 | | | | 99,197 | |
Tohoku Electric Power Co., Inc. | | | 3,600 | | | | 48,902 | |
Tokyo Electric Power Co. Holdings, Inc. (c) | | | 11,500 | | | | 45,078 | |
| | | | | | | | |
| | | | | | | | 1,975,209 | |
See Notes to Financial Statements.
| | | | | | |
| | | BLACKROCK TACTICAL OPPORTUNITIES FUND | | MARCH 31, 2017 | | 9 |
| | | | |
| Schedule of Investments (continued) | | | | |
| | | | |
| | | | | | | | |
| Common Stocks | | Shares | | | Value | |
Electrical Equipment — 0.1% | | | | | | | | |
Eaton Corp PLC | | | 5,258 | | | $ | 389,881 | |
Mabuchi Motor Co. Ltd. | | | 2,000 | | | | 112,898 | |
Mitsubishi Electric Corp. | | | 2,100 | | | | 30,257 | |
Vestas Wind Systems A/S | | | 1,025 | | | | 83,374 | |
| | | | | | | | |
| | | | | | | | 616,410 | |
Electronic Equipment, Instruments & Components — 0.7% | | | | | |
Alps Electric Co. Ltd. | | | 3,000 | | | | 85,064 | |
Amphenol Corp., Class A | | | 764 | | | | 54,374 | |
Corning, Inc. | | | 4,183 | | | | 112,941 | |
Flex Ltd. (c) | | | 121,160 | | | | 2,035,488 | |
Hitachi Ltd. | | | 40,000 | | | | 217,190 | |
Hoya Corp. | | | 3,600 | | | | 173,919 | |
Murata Manufacturing Co. Ltd. | | | 2,600 | | | | 370,410 | |
TDK Corp. | | | 8,800 | | | | 558,756 | |
TE Connectivity Ltd | | | 1,891 | | | | 140,974 | |
| | | | | | | | |
| | | | | | | | 3,749,116 | |
Energy Equipment & Services — 0.7% | | | | | | | | |
Baker Hughes, Inc. | | | 922 | | | | 55,154 | |
National Oilwell Varco, Inc. | | | 9,302 | | | | 372,917 | |
Schlumberger Ltd. | | | 17,157 | | | | 1,339,962 | |
TechnipFMC PLC (c) | | | 1,031 | | | | 33,507 | |
Tenaris SA | | | 107,622 | | | | 1,861,044 | |
| | | | | | | | |
| | | | | | | | 3,662,584 | |
Equity Real Estate Investment Trusts (REITs) — 0.7% | | | | | | | | |
American Tower Corp. | | | 23,562 | | | | 2,863,725 | |
Ascendas Real Estate Investment Trust | | | 19,100 | | | | 34,395 | |
Brixmor Property Group, Inc. | | | 2,310 | | | | 49,573 | |
CapitaLand Commercial Trust | | | 16,600 | | | | 18,329 | |
CapitaLand Mall Trust | | | 19,900 | | | | 28,018 | |
Equity Residential | | | 2,169 | | | | 134,955 | |
Host Hotels & Resorts, Inc. | | | 9,908 | | | | 184,883 | |
Land Securities Group PLC | | | 6,354 | | | | 84,389 | |
Link REIT | | | 18,000 | | | | 126,158 | |
Nippon Prologis REIT, Inc. | | | 13 | | | | 28,180 | |
Public Storage | | | 731 | | | | 160,023 | |
Segro PLC | | | 7,995 | | | | 45,710 | |
Simon Property Group, Inc. | | | 1,458 | | | | 250,820 | |
Suntec Real Estate Investment Trust | | | 19,100 | | | | 24,450 | |
| | | | | | | | |
| | | | | | | | 4,033,608 | |
Food & Staples Retailing — 0.4% | | | | | | | | |
CVS Health Corp. | | | 693 | | | | 54,401 | |
Jean Coutu Group PJC, Inc., Class A | | | 653 | | | | 10,277 | |
Walgreens Boots Alliance, Inc. | | | 5,467 | | | | 454,034 | |
Wal-Mart Stores, Inc. | | | 17,859 | | | | 1,287,277 | |
Wesfarmers Ltd. | | | 3,119 | | | | 107,381 | |
| | | | | | | | |
| | | | | | | | 1,913,370 | |
Food Products — 1.4% | | | | | | | | |
Ajinomoto Co., Inc. | | | 2,400 | | | | 47,488 | |
Archer-Daniels-Midland Co. | | | 8,473 | | | | 390,097 | |
Chocoladefabriken Lindt & Spruengli AG | | | 8 | | | | 45,330 | |
Ingredion, Inc. | | | 7,974 | | | | 960,309 | |
Kellogg Co. | | | 2,570 | | | | 186,608 | |
Marine Harvest ASA | | | 34,735 | | | | 529,861 | |
Mead Johnson Nutrition Co. | | | 6,333 | | | | 564,144 | |
MEIJI Holdings Co. Ltd. | | | 3,400 | | | | 283,711 | |
Mondelez International, Inc., Class A | | | 39,466 | | | | 1,700,195 | |
Nestle SA, Registered Shares | | | 21,915 | | | | 1,682,015 | |
NH Foods Ltd. | | | 7,000 | | | | 188,052 | |
Orkla ASA | | | 9,016 | | | | 80,766 | |
Unilever NV CVA | | | 312 | | | | 15,500 | |
Wilmar International Ltd. | | | 259,900 | | | | 655,862 | |
| | | | | | | | |
| Common Stocks | | Shares | | | Value | |
Food Products (continued) | | | | | | | | |
Yamazaki Baking Co. Ltd. | | | 18,200 | | | $ | 374,731 | |
| | | | | | | | |
| | | | | | | | 7,704,669 | |
Gas Utilities — 0.1% | | | | | | | | |
Gas Natural SDG SA | | | 2,814 | | | | 61,553 | |
Hong Kong & China Gas Co. Ltd. | | | 61,500 | | | | 123,043 | |
Osaka Gas Co. Ltd. | | | 15,000 | | | | 57,195 | |
Toho Gas Co. Ltd. | | | 3,000 | | | | 21,278 | |
Tokyo Gas Co. Ltd. | | | 16,000 | | | | 73,074 | |
| | | | | | | | |
| | | | | | | | 336,143 | |
Health Care Equipment & Supplies — 0.5% | | | | | | | | |
Baxter International, Inc. | | | 14,722 | | | | 763,483 | |
Becton Dickinson and Co. | | | 132 | | | | 24,214 | |
Danaher Corp. | | | 1,184 | | | | 101,268 | |
Medtronic PLC | | | 2,522 | | | | 203,172 | |
Zimmer Biomet Holdings, Inc. | | | 13,229 | | | | 1,615,393 | |
| | | | | | | | |
| | | | | | | | 2,707,530 | |
Health Care Providers & Services — 0.8% | | | | | | | | |
Aetna, Inc. | | | 2,816 | | | | 359,181 | |
AmerisourceBergen Corp. | | | 5,291 | | | | 468,253 | |
Anthem, Inc. | | | 2,114 | | | | 349,613 | |
Centene Corp. (c) | | | 1,372 | | | | 97,769 | |
Express Scripts Holding Co. (c) | | | 14,557 | | | | 959,452 | |
HCA Holdings, Inc. (c) | | | 2,943 | | | | 261,898 | |
McKesson Corp. | | | 2,958 | | | | 438,553 | |
Ryman Healthcare Ltd. | | | 3,010 | | | | 17,737 | |
UnitedHealth Group, Inc. | | | 8,509 | | | | 1,395,561 | |
| | | | | | | | |
| | | | | | | | 4,348,017 | |
Hotels, Restaurants & Leisure — 0.6% | | | | | | | | |
Carnival Corp. | | | 6,159 | | | | 362,827 | |
Galaxy Entertainment Group Ltd. | | | 19,000 | | | | 104,066 | |
InterContinental Hotels Group PLC | | | 10,495 | | | | 514,033 | |
McDonald’s Corp. | | | 5,571 | | | | 722,057 | |
Melco Crown Entertainment Ltd. — ADR | | | 1,527 | | | | 28,311 | |
MGM China Holdings Ltd. | | | 7,600 | | | | 15,848 | |
Oriental Land Co. Ltd. | | | 5,700 | | | | 327,665 | |
Paddy Power Betfair PLC | | | 7,426 | | | | 798,560 | |
Sands China Ltd. | | | 19,600 | | | | 90,858 | |
Yum! Brands, Inc. | | | 8,119 | | | | 518,804 | |
| | | | | | | | |
| | | | | | | | 3,483,029 | |
Household Durables — 0.3% | | | | | | | | |
Electrolux AB, Class B | | | 6,311 | | | | 175,205 | |
Panasonic Corp. | | | 24,500 | | | | 277,272 | |
Sekisui Chemical Co. Ltd. | | | 2,200 | | | | 37,088 | |
Sony Corp. | | | 16,800 | | | | 566,974 | |
Whirlpool Corp. | | | 4,198 | | | | 719,243 | |
| | | | | | | | |
| | | | | | | | 1,775,782 | |
Household Products — 1.3% | | | | | | | | |
Colgate-Palmolive Co. | | | 51,821 | | | | 3,792,779 | |
Lion Corp. | | | 1,000 | | | | 18,022 | |
Procter & Gamble Co. | | | 34,597 | | | | 3,108,540 | |
| | | | | | | | |
| | | | | | | | 6,919,341 | |
Independent Power and Renewable Electricity Producers — 0.3% | | | | | |
AES Corp. | | | 163,431 | | | | 1,827,159 | |
Electric Power Development Co. Ltd. | | | 1,100 | | | | 25,849 | |
Meridian Energy Ltd. | | | 10,143 | | | | 19,904 | |
| | | | | | | | |
| | | | | | | | 1,872,912 | |
Industrial Conglomerates — 0.7% | | | | | | | | |
CK Hutchison Holdings Ltd. | | | 138,500 | | | | 1,705,203 | |
See Notes to Financial Statements.
| | | | | | |
| 10 | | BLACKROCK TACTICAL OPPORTUNITIES FUND | | MARCH 31, 2017 | | |
| | | | |
| Schedule of Investments (continued) | | | | |
| | | | |
| | | | | | | | |
| Common Stocks | | Shares | | | Value | |
Industrial Conglomerates (continued) | | | | | | | | |
General Electric Co. | | | 65,656 | | | $ | 1,956,549 | |
Siemens AG, Registered Shares (c) | | | 124 | | | | 16,985 | |
| | | | | | | | |
| | | | | | | | 3,678,737 | |
Insurance — 2.4% | | | | | | | | |
Aegon NV | | | 3,184 | | | | 16,219 | |
AIA Group Ltd. | | | 96,400 | | | | 608,473 | |
Allianz SE, Registered Shares | | | 7,778 | | | | 1,442,406 | |
American International Group, Inc. | | | 9,675 | | | | 604,010 | |
Aon PLC | | | 11,653 | | | | 1,383,095 | |
Assicurazioni Generali SpA | | | 4,719 | | | | 74,873 | |
AXA SA | | | 24,433 | | | | 631,248 | |
Dai-ichi Life Insurance Co. Ltd. | | | 6,100 | | | | 109,186 | |
Fairfax Financial Holdings Ltd. | | | 201 | | | | 91,473 | |
Hannover Rueck SE | | | 2,718 | | | | 313,201 | |
Japan Post Holdings Co. Ltd. | | | 15,400 | | | | 193,657 | |
Legal & General Group PLC | | | 6,689 | | | | 20,712 | |
Lincoln National Corp. | | | 218 | | | | 14,268 | |
Manulife Financial Corp. | | | 4,375 | | | | 77,607 | |
Mapfre SA | | | 704,300 | | | | 2,412,307 | |
Marsh & McLennan Cos., Inc. | | | 3,032 | | | | 224,034 | |
Medibank Pvt. Ltd. | | | 10,106 | | | | 21,767 | |
MS&AD Insurance Group Holdings, Inc. | | | 5,400 | | | | 172,479 | |
Muenchener Rueckversicherungs-Gesellschaft
AG in Muenchen | | | 4,429 | | | | 866,990 | |
NN Group NV | | | 12,742 | | | | 413,825 | |
Prudential PLC | | | 20,532 | | | | 433,703 | |
Sampo Oyj, Class A | | | 12,368 | | | | 586,873 | |
Sompo Holdings, Inc. | | | 3,500 | | | | 128,585 | |
Sun Life Financial, Inc. | | | 20,166 | | | | 736,369 | |
Suncorp Group Ltd. | | | 32,929 | | | | 332,303 | |
Swiss Re AG | | | 7,454 | | | | 669,489 | |
Tokio Marine Holdings, Inc. | | | 7,000 | | | | 295,851 | |
Travelers Cos., Inc. | | | 2,234 | | | | 269,286 | |
Zurich Insurance Group AG | | | 394 | | | | 105,143 | |
| | | | | | | | |
| | | | | | | | 13,249,432 | |
Internet & Direct Marketing Retail — 0.4% | | | | | | | | |
Amazon.com, Inc. (c) | | | 2,307 | | | | 2,045,248 | |
Expedia, Inc. | | | 125 | | | | 15,771 | |
| | | | | | | | |
| | | | | | | | 2,061,019 | |
Internet Software & Services — 0.8% | | | | | | | | |
Alphabet, Inc., Class A (c) | | | 1,945 | | | | 1,648,971 | |
Alphabet, Inc., Class C (c) | | | 863 | | | | 715,910 | |
eBay, Inc. (c) | | | 10,689 | | | | 358,830 | |
Facebook, Inc., Class A (c) | | | 9,877 | | | | 1,403,028 | |
MercadoLibre, Inc. | | | 1,615 | | | | 341,524 | |
| | | | | | | | |
| | | | | | | | 4,468,263 | |
IT Services — 2.4% | | | | | | | | |
Accenture PLC, Class A | | | 16,994 | | | | 2,037,241 | |
CGI Group, Inc., Class A (c) | | | 47,112 | | | | 2,257,380 | |
Computer Sciences Corp. (c) | | | 2,610 | | | | 180,116 | |
First Data Corp., Class A (c) | | | 2,287 | | | | 35,449 | |
Fujitsu Ltd. | | | 40,000 | | | | 245,535 | |
International Business Machines Corp. | | | 15,754 | | | | 2,743,402 | |
Mastercard, Inc., Class A | | | 25,618 | | | | 2,881,256 | |
NTT Data Corp. | | | 4,900 | | | | 232,684 | |
PayPal Holdings, Inc. (c) | | | 3,457 | | | | 148,720 | |
Visa, Inc., Class A | | | 11,453 | | | | 1,017,828 | |
Western Union Co. | | | 66,001 | | | | 1,343,120 | |
| | | | | | | | |
| | | | | | | | 13,122,731 | |
Leisure Products — 0.0% | | | | | | | | |
Bandai NamCo. Holdings, Inc. | | | 500 | | | | 14,988 | |
| | | | | | | | |
| Common Stocks | | Shares | | | Value | |
Leisure Products (continued) | | | | | | | | |
Shimano, Inc. | | | 600 | | | $ | 87,881 | |
| | | | | | | | |
| | | | | | | | 102,869 | |
Life Sciences Tools & Services — 0.1% | | | | | | | | |
Lonza Group AG | | | 1,671 | | | | 315,854 | |
Thermo Fisher Scientific, Inc. | | | 2,682 | | | | 411,955 | |
| | | | | | | | |
| | | | | | | | 727,809 | |
Machinery — 2.1% | | | | | | | | |
AGCO Corp. | | | 27,805 | | | | 1,673,305 | |
Amada Holdings Co. Ltd. | | | 12,300 | | | | 140,798 | |
ANDRITZ AG | | | 6,157 | | | | 307,932 | |
Atlas Copco AB, Class A | | | 1,129 | | | | 39,796 | |
Atlas Copco AB, Class B | | | 3,132 | | | | 99,490 | |
Caterpillar, Inc. | | | 12,173 | | | | 1,129,167 | |
CNH Industrial NV | | | 115,483 | | | | 1,111,537 | |
FANUC Corp. | | | 1,900 | | | | 391,156 | |
Flowserve Corp. | | | 466 | | | | 22,564 | |
Fortive Corp. | | | 7,002 | | | | 421,660 | |
IHI Corp. | | | 50,000 | | | | 158,160 | |
Illinois Tool Works, Inc. | | | 1,523 | | | | 201,752 | |
JTEKT Corp. | | | 17,700 | | | | 275,358 | |
Makita Corp. | | | 23,000 | | | | 806,651 | |
Metso OYJ | | | 17,695 | | | | 535,475 | |
NGK Insulators Ltd. | | | 7,700 | | | | 174,686 | |
NSK Ltd. | | | 7,300 | | | | 104,575 | |
Pentair PLC | | | 3,018 | | | | 189,470 | |
Schindler Holding AG | | | 161 | | | | 30,546 | |
Schindler Holding AG Participation Certificates | | | 910 | | | | 176,027 | |
Stanley Black & Decker, Inc. | | | 7,294 | | | | 969,154 | |
WABCO Holdings, Inc. (c) | | | 10,365 | | | | 1,217,058 | |
Weir Group PLC | | | 6,708 | | | | 161,362 | |
Xylem, Inc. | | | 21,222 | | | | 1,065,769 | |
| | | | | | | | |
| | | | | | | | 11,403,448 | |
Marine — 0.2% | | | | | | | | |
AP Moeller — Maersk A/S, Class A | | | 30 | | | | 48,348 | |
AP Moller — Maersk A/S, Class B | | | 110 | | | | 182,197 | |
Mitsui OSK Lines Ltd. | | | 76,000 | | | | 238,842 | |
Nippon Yusen KK (c) | | | 207,000 | | | | 437,022 | |
| | | | | | | | |
| | | | | | | | 906,409 | |
Media — 1.8% | | | | | | | | |
CBS Corp. | | | 1,481 | | | | 102,722 | |
Comcast Corp., Class A | | | 1,486 | | | | 55,859 | |
Discovery Communications, Inc., Class A (c) | | | 37,095 | | | | 1,079,094 | |
Hakuhodo DY Holdings, Inc. | | | 8,600 | | | | 102,297 | |
Interpublic Group of Cos., Inc. | | | 26,621 | | | | 654,078 | |
Lagardere SCA | | | 9,076 | | | | 266,974 | |
Liberty Global PLC, Class A (c) | | | 58,329 | | | | 2,092,261 | |
Omnicom Group, Inc. | | | 12,976 | | | | 1,118,661 | |
REA Group Ltd. | | | 4,007 | | | | 181,710 | |
Schibsted ASA, Class A | | | 919 | | | | 23,657 | |
Sky PLC | | | 26,939 | | | | 329,458 | |
Time Warner, Inc. | | | 15,467 | | | | 1,511,281 | |
Toho Co. Ltd. | | | 2,100 | | | | 55,739 | |
Twenty-First Century Fox, Inc., Class A | | | 11,495 | | | | 372,323 | |
Viacom, Inc., Class B | | | 390 | | | | 18,182 | |
Walt Disney Co. | | | 14,380 | | | | 1,630,548 | |
| | | | | | | | |
| | | | | | | | 9,594,844 | |
Metals & Mining — 0.6% | | | | | | | | |
Anglo American PLC (c) | | | 14,022 | | | | 214,242 | |
BHP Billiton Ltd. | | | 885 | | | | 16,095 | |
BHP Billiton PLC | | | 52,225 | | | | 805,512 | |
See Notes to Financial Statements.
| | | | | | |
| | | BLACKROCK TACTICAL OPPORTUNITIES FUND | | MARCH 31, 2017 | | 11 |
| | | | |
| Schedule of Investments (continued) | | | | |
| | | | |
| | | | | | | | |
| Common Stocks | | Shares | | | Value | |
Metals & Mining (continued) | | | | | | | | |
Eldorado Gold Corp. | | | 98,808 | | | $ | 338,065 | |
First Quantum Minerals Ltd. | | | 21,369 | | | | 227,051 | |
Fortescue Metals Group Ltd. | | | 29,021 | | | | 138,232 | |
Franco-Nevada Corp. | | | 2,763 | | | | 181,007 | |
Glencore PLC (c) | | | 119,015 | | | | 466,960 | |
Kobe Steel Ltd. (c) | | | 6,300 | | | | 57,648 | |
Newmont Mining Corp. | | | 2,136 | | | | 70,403 | |
Norsk Hydro ASA | | | 60,417 | | | | 352,094 | |
Rio Tinto PLC | | | 350 | | | | 14,094 | |
Teck Resources Ltd., Class B | | | 11,370 | | | | 248,629 | |
voestalpine AG | | | 1,682 | | | | 66,151 | |
Yamana Gold, Inc. | | | 33,272 | | | | 91,821 | |
| | | | | | | | |
| | | | | | | | 3,288,004 | |
Mortgage Real Estate Investment Trusts (REITs) — 0.0% | | | | | |
Annaly Capital Management, Inc. | | | 8,177 | | | | 90,846 | |
Multiline Retail — 0.0% | | | | | | | | |
Macy’s, Inc. | | | 3,723 | | | | 110,350 | |
Nordstrom, Inc. | | | 267 | | | | 12,434 | |
| | | | | | | | |
| | | | | | | | 122,784 | |
Multi-Utilities — 1.4% | | | | | | | | |
AGL Energy Ltd. | | | 224,363 | | | | 4,519,365 | |
E.ON SE | | | 95,529 | | | | 759,468 | |
RWE AG (c) | | | 12,816 | | | | 212,387 | |
Sempra Energy | | | 21,502 | | | | 2,375,971 | |
| | | | | | | | |
| | | | | | | | 7,867,191 | |
Oil, Gas & Consumable Fuels — 2.5% | | | | | | | | |
Anadarko Petroleum Corp. | | | 1,668 | | | | 103,416 | |
BP PLC | | | 172,696 | | | | 994,056 | |
Canadian Natural Resources Ltd. | | | 5,496 | | | | 179,942 | |
Chevron Corp. | | | 7,588 | | | | 814,724 | |
ConocoPhillips | | | 10,737 | | | | 535,454 | |
Devon Energy Corp. | | | 6,364 | | | | 265,506 | |
Enbridge, Inc. | | | 4,009 | | | | 167,945 | |
Eni SpA | | | 20,415 | | | | 334,262 | |
Exxon Mobil Corp. | | | 35,149 | | | | 2,882,569 | |
Idemitsu Kosan Co. Ltd. | | | 17,500 | | | | 609,162 | |
JX Holdings, Inc. | | | 270,650 | | | | 1,332,558 | |
Longview Energy Co. (Acquired 8/13/04, cost $48,000) (e) | | | 3,200 | | | | 5,152 | |
Matador Resources Co. | | | 939 | | | | 22,339 | |
Newfield Exploration Co. (c) | | | 2,440 | | | | 90,060 | |
OMV AG | | | 25,605 | | | | 1,009,078 | |
Repsol SA | | | 30,921 | | | | 479,058 | |
Royal Dutch Shell PLC, B Shares | | | 27,207 | | | | 747,903 | |
Royal Dutch Shell PLC, Class A | | | 33,349 | | | | 879,020 | |
Showa Shell Sekiyu KK | | | 57,100 | | | | 579,484 | |
Statoil ASA | | | 30,264 | | | | 520,194 | |
TOTAL SA | | | 19,727 | | | | 997,467 | |
TransCanada Corp. | | | 1,768 | | | | 81,590 | |
Valero Energy Corp. | | | 2,569 | | | | 170,299 | |
| | | | | | | | |
| | | | | | | | 13,801,238 | |
Paper & Forest Products — 0.5% | | | | | | | | |
Mondi PLC | | | 8,486 | | | | 205,033 | |
Norbord, Inc. | | | 6,130 | | | | 173,356 | |
Stora Enso OYJ, Class R | | | 114,133 | | | | 1,349,536 | |
UPM-Kymmene OYJ | | | 50,323 | | | | 1,181,541 | |
| | | | | | | | |
| | | | | | | | 2,909,466 | |
Personal Products — 0.0% | | | | | | | | |
Coty, Inc., Class A | | | 2,573 | | | | 46,648 | |
Kao Corp. | | | 500 | | | | 27,458 | |
| | | | | | | | |
| | | | | | | | 74,106 | |
| | | | | | | | |
| Common Stocks | | Shares | | | Value | |
Pharmaceuticals — 3.8% | | | | | | | | |
Allergan PLC | | | 1,272 | | | $ | 303,906 | |
Astellas Pharma, Inc. | | | 31,700 | | | | 418,089 | |
AstraZeneca PLC | | | 8,694 | | | | 534,567 | |
Bayer AG, Registered Shares | | | 9,860 | | | | 1,136,009 | |
Bristol-Myers Squibb Co. | | | 11,398 | | | | 619,823 | |
Daiichi Sankyo Co. Ltd. | | | 6,500 | | | | 146,647 | |
Eli Lilly & Co. | | | 535 | | | | 44,999 | |
GlaxoSmithKline PLC | | | 143,089 | | | | 2,975,234 | |
Johnson & Johnson | | | 27,281 | | | | 3,397,849 | |
Merck & Co., Inc. | | | 33,230 | | | | 2,111,434 | |
Merck KGaA | | | 9,435 | | | | 1,075,152 | |
Mitsubishi Tanabe Pharma Corp. | | | 7,000 | | | | 146,153 | |
Novartis AG, Registered Shares | | | 20,551 | | | | 1,526,067 | |
Novo Nordisk A/S, Class B | | | 16,590 | | | | 569,683 | |
Pfizer, Inc. | | | 59,395 | | | | 2,031,903 | |
Roche Holding AG | | | 6,506 | | | | 1,663,803 | |
Sanofi | | | 13,558 | | | | 1,225,583 | |
Shionogi & Co. Ltd. | | | 3,200 | | | | 165,656 | |
Shire PLC | | | 6,045 | | | | 352,224 | |
Taro Pharmaceutical Industries Ltd. (c) | | | 115 | | | | 13,411 | |
Teva Pharmaceutical Industries Ltd. — ADR | | | 7,326 | | | | 235,091 | |
Valeant Pharmaceuticals International, Inc. (c) | | | 567 | | | | 6,263 | |
| | | | | | | | |
| | | | | | | | 20,699,546 | |
Professional Services — 1.0% | | | | | | | | |
Experian PLC | | | 71,292 | | | | 1,454,442 | |
IHS Markit Ltd. (c) | | | 26,193 | | | | 1,098,796 | |
ManpowerGroup, Inc. | | | 21,979 | | | | 2,254,386 | |
Nielsen Holdings PLC | | | 5,642 | | | | 233,071 | |
SEEK Ltd. | | | 14,218 | | | | 172,862 | |
| | | | | | | | |
| | | | | | | | 5,213,557 | |
Real Estate Management & Development — 0.3% | | | | | | | | |
Azrieli Group Ltd. | | | 339 | | | | 18,014 | |
CapitaLand Ltd. | | | 20,000 | | | | 51,912 | |
Cheung Kong Property Holdings Ltd. | | | 21,500 | | | | 145,035 | |
City Developments Ltd. | | | 3,300 | | | | 24,049 | |
Daito Trust Construction Co. Ltd. | | | 300 | | | | 41,249 | |
Daiwa House Industry Co. Ltd. | | | 1,800 | | | | 51,739 | |
Global Logistic Properties Ltd. | | | 21,400 | | | | 42,526 | |
Hang Lung Group Ltd. | | | 7,000 | | | | 29,858 | |
Hang Lung Properties Ltd. | | | 18,000 | | | | 46,794 | |
Henderson Land Development Co. Ltd. | | | 9,200 | | | | 57,046 | |
Hongkong Land Holdings Ltd. | | | 9,400 | | | | 71,534 | |
Hysan Development Co. Ltd. | | | 5,000 | | | | 22,684 | |
Kerry Properties Ltd. | | | 5,500 | | | | 19,078 | |
Mitsubishi Estate Co. Ltd. | | | 8,000 | | | | 145,813 | |
Mitsui Fudosan Co. Ltd. | | | 2,000 | | | | 42,704 | |
New World Development Co. Ltd. | | | 44,000 | | | | 54,216 | |
Sino Land Co. Ltd. | | | 26,000 | | | | 45,595 | |
Sun Hung Kai Properties Ltd. | | | 12,000 | | | | 176,403 | |
Swire Pacific Ltd., Class A | | | 4,500 | | | | 44,979 | |
Swire Properties Ltd. | | | 9,400 | | | | 30,127 | |
Swiss Prime Site AG | | | 574 | | | | 50,540 | |
UOL Group Ltd. | | | 3,900 | | | | 19,428 | |
Wharf Holdings Ltd. | | | 11,000 | | | | 94,534 | |
Wheelock & Co. Ltd. | | | 7,000 | | | | 55,372 | |
| | | | | | | | |
| | | | | | | | 1,381,229 | |
Road & Rail — 0.1% | | | | | | | | |
Central Japan Railway Co. | | | 3,200 | | | | 522,688 | |
Semiconductors & Semiconductor Equipment — 1.9% | | | | | | | | |
Applied Materials, Inc. | | | 8,808 | | | | 342,631 | |
Broadcom Ltd. | | | 8,050 | | | | 1,762,628 | |
Intel Corp. | | | 15,872 | | | | 572,503 | |
See Notes to Financial Statements.
| | | | | | |
| 12 | | BLACKROCK TACTICAL OPPORTUNITIES FUND | | MARCH 31, 2017 | | |
| | | | |
| Schedule of Investments (continued) | | | | |
| | | | |
| | | | | | | | |
| Common Stocks | | Shares | | | Value | |
Semiconductors & Semiconductor Equipment (continued) | | | | | |
Lam Research Corp. | | | 192 | | | $ | 24,645 | |
Marvell Technology Group Ltd. | | | 862 | | | | 13,154 | |
Maxim Integrated Products, Inc. | | | 8,473 | | | | 380,946 | |
Microchip Technology, Inc. | | | 8,638 | | | | 637,312 | |
Micron Technology, Inc. (c) | | | 8,991 | | | | 259,840 | |
NVIDIA Corp. | | | 2,066 | | | | 225,049 | |
NXP Semiconductors NV (c) | | | 8,860 | | | | 917,010 | |
Qorvo, Inc. (c) | | | 271 | | | | 18,580 | |
QUALCOMM, Inc. | | | 22,612 | | | | 1,296,572 | |
Rohm Co. Ltd. | | | 3,200 | | | | 213,040 | |
Skyworks Solutions, Inc. | | | 2,008 | | | | 196,744 | |
STMicroelectronics NV | | | 14,613 | | | | 224,860 | |
Texas Instruments, Inc. | | | 34,784 | | | | 2,802,199 | |
Xilinx, Inc. | | | 4,654 | | | | 269,420 | |
| | | | | | | | |
| | | | | | | | 10,157,133 | |
Software — 0.7% | | | | | | | | |
Check Point Software Technologies Ltd. (c) | | | 1,053 | | | | 108,101 | |
Microsoft Corp. | | | 49,894 | | | | 3,286,019 | |
VMware, Inc., Class A (c) | | | 4,160 | | | | 383,302 | |
| | | | | | | | |
| | | | | | | | 3,777,422 | |
Specialty Retail — 0.5% | | | | | | | | |
Foot Locker, Inc. | | | 356 | | | | 26,632 | |
Home Depot, Inc. | | | 7,128 | | | | 1,046,604 | |
Kingfisher PLC | | | 18,081 | | | | 73,980 | |
Shimamura Co. Ltd. | | | 700 | | | | 92,795 | |
Tiffany & Co. | | | 14,226 | | | | 1,355,738 | |
| | | | | | | | |
| | | | | | | | 2,595,749 | |
Technology Hardware, Storage & Peripherals — 1.0% | | | | | | | | |
Apple Inc. | | | 34,726 | | | | 4,988,737 | |
Hewlett Packard Enterprise Co. | | | 4,652 | | | | 110,252 | |
HP, Inc. | | | 10,694 | | | | 191,209 | |
| | | | | | | | |
| | | | | | | | 5,290,198 | |
Textiles, Apparel & Luxury Goods — 0.0% | | | | | | | | |
NIKE, Inc., Class B | | | 750 | | | | 41,797 | |
Swatch Group AG | | | 396 | | | | 27,576 | |
Swatch Group AG | | | 246 | | | | 88,075 | |
| | | | | | | | |
| | | | | | | | 157,448 | |
Tobacco — 0.7% | | | | | | | | |
British American Tobacco PLC | | | 8,352 | | | | 554,121 | |
Japan Tobacco, Inc. | | | 3,200 | | | | 104,152 | |
Philip Morris International, Inc. | | | 27,067 | | | | 3,055,864 | |
| | | | | | | | |
| | | | | | | | 3,714,137 | |
Trading Companies & Distributors — 0.8% | | | | | | | | |
AerCap Holdings NV (c) | | | 22,499 | | | | 1,034,279 | |
Brenntag AG | | | 1,194 | | | | 66,920 | |
Finning International, Inc. | | | 11,708 | | | | 218,691 | |
ITOCHU Corp. | | | 5,400 | | | | 76,876 | |
Mitsubishi Corp. | | | 19,600 | | | | 424,783 | |
Mitsui & Co. Ltd. | | | 23,400 | | | | 339,815 | |
Sumitomo Corp. | | | 75,600 | | | | 1,019,909 | |
Toyota Tsusho Corp. | | | 39,700 | | | | 1,205,001 | |
| | | | | | | | |
| | | | | | | | 4,386,274 | |
Transportation Infrastructure — 0.0% | | | | | | | | |
Auckland International Airport Ltd. | | | 7,562 | | | | 35,807 | |
| | | | | | | | | | | | |
| Common Stocks | | | | | Shares | | | Value | |
Wireless Telecommunication Services — 0.0% | | | | | | | | | |
Millicom International Cellular SA | | | | | | | 527 | | | $ | 29,386 | |
NTT DOCOMO, Inc. | | | | | | | 10,100 | | | | 235,858 | |
StarHub Ltd. | | | | | | | 4,900 | | | | 10,088 | |
| | | | | | | | | | | | |
| | | | | | | | | | | | 275,332 | |
Total Common Stocks — 52.1% | | | | | | | | | | | 284,279,277 | |
| | | | | | | | | | | | |
| Other Interests (f) | | | | | Beneficial
Interest
(000) | | | | |
Capital Markets — 0.0% | | | | | | | | | | | | |
Lehman Brothers Holdings Capital
Trust VII (c)(g) | | | USD | | | | 110 | | | | — | |
Lehman Brothers Holdings, Inc. (c)(g) | | | | | | | 190 | | | | — | |
Total Other Interests — 0.0% | | | | | | | | | | | — | |
| | | | | | | | | | | | |
| Preferred Stocks | | | | | Shares | | | | |
Auto Components — 0.2% | | | | | | | | | | | | |
Schaeffler AG, Preference Shares | | | | | | | 55,193 | | | | 969,572 | |
Automobiles — 0.0% | | | | | | | | | | | | |
Volkswagen AG, Preference Shares, 0.20% | | | | | | | 2,184 | | | | 318,386 | |
Total Preferred Stocks — 0.2% | | | | | | | | | | | 1,287,958 | |
| | | | | | | | | | | | |
| U.S. Treasury Obligations | | | | | Par (000) | | | | |
U.S. Treasury Notes: | | | | | | | | | | | | |
1.50%, 3/31/19 | | | USD | | | | 34,908 | | | | 35,072,508 | |
3.63%, 8/15/19-2/15/20 | | | | | | | 112,241 | | | | 118,616,359 | |
Total U.S. Treasury Obligations — 28.2% | | | | | | | | | | | 153,688,867 | |
Total Long-Term Investments (Cost — $422,477,257) — 80.5% | | | | | | | | 439,256,103 | |
| | | | | | | | | | | | |
| Short-Term Securities | | | | | Shares | | | | |
Money Market Funds — 4.2% | | | | | | | | | | | | |
BlackRock Liquidity Funds, T-Fund, Institutional Class, 0.60% (h)(i) | | | | | | | 22,849,522 | | | | 22,849,522 | |
SL Liquidity Series, LLC, Money Market Series, 1.11% (i)(j) | | | | | | | 18,595 | | | | 18,597 | |
Total Short-Term Securities (Cost — $22,868,121) — 4.2% | | | | 22,868,119 | |
Total Investments (Cost — $445,345,378) — 84.7% | | | | | | | | | | | 462,124,222 | |
Other Assets Less Liabilities — 15.3% | | | | | | | | | | | 83,262,748 | |
| | | | | | | | | | | | |
Net Assets — 100.0% | | | | | | | | | | $ | 545,386,970 | |
| | | | | | | | | | | | |
See Notes to Financial Statements.
| | | | | | |
| | | BLACKROCK TACTICAL OPPORTUNITIES FUND | | MARCH 31, 2017 | | 13 |
| | | | |
| Schedule of Investments (continued) | | | | |
|
| Notes to Schedule of Investments |
| (a) | Security exempt from registration pursuant to Rule 144A under the Securities Act of 1933, as amended. These securities may be resold in transactions exempt from registration to qualified institutional investors. |
| (b) | Variable rate security. Rate as of period end. |
| (c) | Non-income producing security. |
| (d) | A security contractually bound to one or more other securities to form a single saleable unit which cannot be sold separately. |
| (e) | Restricted security as to resale, excluding 144A securities. As of period end, the Fund held restricted securities with a current value of $5,152 and an original cost of $48,000 which was 0.0% of its net assets. |
| (f) | Other interests represent beneficial interests in liquidation trusts and other reorganization or private entities. |
| (g) | Issuer filed for bankruptcy and/or is in default. |
| (h) | During the period ended March 31, 2017, investments in issuers considered to be affiliates of the Fund for purposes of Section 2(a)(3) of the Investment Company Act of 1940, as amended, were as follows: |
| | | | | | | | | | | | | | | | | | | | | | | | | | | | |
| Affiliate | | Shares Held at
September 30,
2016 | | | Net Activity | | | Shares Held at March 31,
2017 | | | Value
at March 31,
2017 | | | Income | | | Realized
Gain1 | | | Change in
Unrealized
Appreciation
(Depreciation) | |
BlackRock Liquidity Funds, T-Fund, Institutional Class | | | 27,181,016 | | | | (4,331,494) | | | | 22,849,522 | | | $ | 22,849,522 | | | $ | 55,092 | | | $ | 336 | | | | — | |
SL Liquidity Series, LLC, Money Market Series | | | — | | | | 18,595 | | | | 18,595 | | | | 18,597 | | | | 1,356 | 2 | | | 23 | | | | $ | (2) |
Total | | | | | | | | | | | | | | | $22,868,119 | | | $ | 56,448 | | | $ | 359 | | �� | | $ | (2) |
| 1 | Includes net capital gain distributions. |
| 2 | Represents securities lending income earned from the reinvestment of cash collateral from loaned securities, net of fees and collateral investment expenses, and other payments to and from borrowers of securities. |
| (i) | Current yield as of period end. |
| (j) | Security was purchased with the cash collateral from loaned securities. |
| • | | For Fund compliance purposes, the Fund’s industry classifications refer to any one or more of the industry sub-classifications used by one or more widely recognized market indexes or ratings group indexes, and/or as defined by the investment advisor. These definitions may not apply for purposes of this report, which may combine such industry sub-classifications for reporting ease. |
|
| Derivative Financial Instruments Outstanding as of Period End |
| | | | | | | | | | | | | | | | | | |
| Futures Contracts | | | | | | | | | | | | |
Contracts
Long
(Short) | | Issue | | Expiration | | | Notional
Value | | | Unrealized
Appreciation
(Depreciation) | |
| (609) | | Amsterdam Exchanges Index | | | April 2017 | | | | USD | | | | 66,943,353 | | | | $ (745,557 | ) |
| 1,349 | | CAC 40 10 Euro Index | | | April 2017 | | | | USD | | | | 73,618,058 | | | | 1,951,974 | |
| (360) | | IBEX 35 Index | | | April 2017 | | | | USD | | | | 39,990,271 | | | | (1,896,566 | ) |
| (2,779) | | OMX Nordic Exchange | | | April 2017 | | | | USD | | | | 49,070,913 | | | | (920,632 | ) |
| (431) | | ASX SPI 200 Index | | | June 2017 | | | | USD | | | | 48,141,321 | | | | (877,909 | ) |
| 527 | | Australian Government Bonds (10 Year) | | | June 2017 | | | | USD | | | | 61,922,665 | | | | 964,341 | |
| 1,263 | | Canadian Government Bonds (10 Year) | | | June 2017 | | | | USD | | | | 130,417,084 | | | | 975,776 | |
| (9) | | DAX Index | | | June 2017 | | | | USD | | | | 2,959,459 | | | | (77,290 | ) |
| 29 | | DAX Index | | | June 2017 | | | | USD | | | | 9,536,034 | | | | 251,107 | |
| (1,610) | | E-Mini S&P 500 Index | | | June 2017 | | | | USD | | | | 189,915,600 | | | | 1,005,960 | |
| 108 | | Euro-BTP Italian Government Bond | | | June 2017 | | | | USD | | | | 15,057,415 | | | | 176,429 | |
| (7) | | Euro-Bund | | | June 2017 | | | | USD | | | | 1,205,423 | | | | (10,834 | ) |
| (79) | | Euro-Buxl | | | June 2017 | | | | USD | | | | 14,205,808 | | | | (114,691 | ) |
| 679 | | FTSE 100 Index | | | June 2017 | | | | USD | | | | 61,893,920 | | | | (84,047 | ) |
| 226 | | FTSE/MIB Index | | | June 2017 | | | | USD | | | | 24,171,233 | | | | 910,950 | |
| (903) | | Long Gilt British | | | June 2017 | | | | USD | | | | 144,339,673 | | | | (1,662,623 | ) |
| (51) | | S&P/Toronto Stock Exchange 60 Index | | | June 2017 | | | | USD | | | | 6,995,842 | | | | (1,038 | ) |
| (45) | | TOPIX Index | | | June 2017 | | | | USD | | | | 6,113,581 | | | | 113,171 | |
| (646) | | U.S. Treasury Notes (10 Year) | | | June 2017 | | | | USD | | | | 80,467,375 | | | | (772,043 | ) |
| Total | | | | | | | | | | | | | | | | | $ (813,522 | ) |
See Notes to Financial Statements.
| | | | | | |
| 14 | | BLACKROCK TACTICAL OPPORTUNITIES FUND | | MARCH 31, 2017 | | |
| | | | |
| Schedule of Investments (continued) | | | | |
| | | | | | | | | | | | | | | | | | |
| Forward Foreign Exchange Contracts | | | | | | | | |
Currency
Purchased | | | | | Currency
Sold | | | | | Counterparty | | Settlement Date | | Unrealized Appreciation
(Depreciation) | |
| AUD | | | 2,847,000 | | | USD | | | 2,179,122 | | | BNP Paribas S.A. | | 6/21/17 | | $ | (7,352 | ) |
| AUD | | | 1,135,000 | | | USD | | | 867,962 | | | Citibank N.A. | | 6/21/17 | | | (2,152 | ) |
| EUR | | | 3,493,000 | | | USD | | | 3,781,724 | | | Citibank N.A. | | 6/21/17 | | | (40,458 | ) |
| EUR | | | 19,418,000 | | | USD | | | 20,577,896 | | | Citibank N.A. | | 6/21/17 | | | 220,248 | |
| JPY | | | 73,674,000 | | | USD | | | 665,471 | | | Citibank N.A. | | 6/21/17 | | | (1,511 | ) |
| KRW | | | 143,952,000 | | | USD | | | 128,540 | | | Citibank N.A. | | 6/21/17 | | | 310 | |
| MXN | | | 25,308,000 | | | USD | | | 1,301,733 | | | BNP Paribas S.A. | | 6/21/17 | | | 32,896 | |
| MYR | | | 1,424,000 | | | USD | | | 318,127 | | | Citibank N.A. | | 6/21/17 | | | 2,671 | |
| NOK | | | 9,850,000 | | | USD | | | 1,161,214 | | | Citibank N.A. | | 6/21/17 | | | (13,025 | ) |
| SEK | | | 7,464,000 | | | USD | | | 839,081 | | | Citibank N.A. | | 6/21/17 | | | (2,696 | ) |
| USD | | | 3,437,106 | | | AUD | | | 4,512,000 | | | Citibank N.A. | | 6/21/17 | | | (4,773 | ) |
| USD | | | 23,952,419 | | | AUD | | | 31,822,000 | | | Citibank N.A. | | 6/21/17 | | | (322,287 | ) |
| USD | | | 608,886 | | | BRL | | | 1,946,000 | | | Citibank N.A. | | 6/21/17 | | | (998 | ) |
| USD | | | 2,552,974 | | | BRL | | | 8,241,000 | | | Citibank N.A. | | 6/21/17 | | | (29,786 | ) |
| USD | | | 1,573,637 | | | CAD | | | 2,096,000 | | | BNP Paribas S.A. | | 6/21/17 | | | (4,314 | ) |
| USD | | | 1,499,069 | | | CAD | | | 1,992,000 | | | Citibank N.A. | | 6/21/17 | | | (587 | ) |
| USD | | | 2,721,614 | | | CAD | | | 3,629,000 | | | Citibank N.A. | | 6/21/17 | | | (10,440 | ) |
| USD | | | 31,127,994 | | | CAD | | | 41,874,000 | | | Citibank N.A. | | 6/21/17 | | | (396,402 | ) |
| USD | | | 924,276 | | | CHF | | | 913,000 | | | Citibank N.A. | | 6/21/17 | | | 8,168 | |
| USD | | | 9,494,797 | | | CHF | | | 9,576,000 | | | Citibank N.A. | | 6/21/17 | | | (113,809 | ) |
| USD | | | 189,009 | | | CZK | | | 4,703,000 | | | BNP Paribas S.A. | | 6/21/17 | | | 1,274 | |
| USD | | | 203,465 | | | CZK | | | 5,170,000 | | | BNP Paribas S.A. | | 6/21/17 | | | (2,912 | ) |
| USD | | | 691,850 | | | CZK | | | 17,427,000 | | | BNP Paribas S.A. | | 6/21/17 | | | (3,800 | ) |
| USD | | | 1,639,083 | | | EUR | | | 1,523,000 | | | BNP Paribas S.A. | | 6/21/17 | | | 7,835 | |
| USD | | | 1,541,928 | | | EUR | | | 1,437,000 | | | Citibank N.A. | | 6/21/17 | | | 2,793 | |
| USD | | | 959,603 | | | GBP | | | 775,000 | | | BNP Paribas S.A. | | 6/21/17 | | | (13,370 | ) |
| USD | | | 945,350 | | | GBP | | | 754,000 | | | Citibank N.A. | | 6/21/17 | | | (1,258 | ) |
| USD | | | 17,675,786 | | | GBP | | | 14,515,000 | | | Citibank N.A. | | 6/21/17 | | | (547,041 | ) |
| USD | | | 1,581,197 | | | INR | | | 104,340,000 | | | BNP Paribas S.A. | | 6/21/17 | | | (7,701 | ) |
| USD | | | 35,929 | | | INR | | | 2,425,000 | | | Citibank N.A. | | 6/21/17 | | | (1,000 | ) |
| USD | | | 982,591 | | | INR | | | 64,851,000 | | | Citibank N.A. | | 6/21/17 | | | (4,965 | ) |
| USD | | | 38,318,174 | | | JPY | | | 4,373,667,000 | | | Citibank N.A. | | 6/21/17 | | | (1,097,904 | ) |
| USD | | | 284,497 | | | KRW | | | 328,688,000 | | | Citibank N.A. | | 6/21/17 | | | (9,708 | ) |
| USD | | | 49,332 | | | MXN | | | 981,000 | | | Citibank N.A. | | 6/21/17 | | | (2,402 | ) |
| USD | | | 1,663,454 | | | MXN | | | 31,921,000 | | | Citibank N.A. | | 6/21/17 | | | (19,914 | ) |
| USD | | | 235,965 | | | MYR | | | 1,055,000 | | | Citibank N.A. | | 6/21/17 | | | (1,705 | ) |
| USD | | | 3,236,401 | | | NOK | | | 27,498,000 | | | Citibank N.A. | | 6/21/17 | | | 31,030 | |
| USD | | | 217,948 | | | NZD | | | 316,000 | | | Citibank N.A. | | 6/21/17 | | | (3,099 | ) |
| USD | | | 407,956 | | | PLN | | | 1,615,000 | | | BNP Paribas S.A. | | 6/21/17 | | | 992 | |
| USD | | | 1,013,563 | | | PLN | | | 4,140,000 | | | BNP Paribas S.A. | | 6/21/17 | | | (29,676 | ) |
| USD | | | 628,880 | | | SEK | | | 5,542,000 | | | BNP Paribas S.A. | | 6/21/17 | | | 7,866 | |
| USD | | | 313,835 | | | SEK | | | 2,760,000 | | | Citibank N.A. | | 6/21/17 | | | 4,561 | |
| USD | | | 5,318,465 | | | SEK | | | 47,836,000 | | | Citibank N.A. | | 6/21/17 | | | (41,840 | ) |
| USD | | | 679,460 | | | SGD | | | 951,000 | | | Citibank N.A. | | 6/21/17 | | | (818 | ) |
| USD | | | 1,900,502 | | | SGD | | | 2,694,000 | | | Citibank N.A. | | 6/21/17 | | | (26,596 | ) |
| USD | | | 448,673 | | | ZAR | | | 5,877,000 | | | Citibank N.A. | | 6/21/17 | | | 16,908 | |
| ZAR | | | 1,775,000 | | | USD | | | 133,236 | | | Citibank N.A. | | 6/21/17 | | | (2,832 | ) |
See Notes to Financial Statements.
| | | | | | |
| | | BLACKROCK TACTICAL OPPORTUNITIES FUND | | MARCH 31, 2017 | | 15 |
| | | | |
| Schedule of Investments (continued) | | | | |
| | | | | | | | | | | | | | | | | | | | | | | | | | |
Currency
Purchased | | | | | Currency
Sold | | | | | | Counterparty | | Settlement
Date | | | | | | Unrealized
Appreciation
(Depreciation) | |
| ZAR | | | 5,492,000 | | | | USD | | | | 435,201 | | | Citibank N.A. | | | 6/21/17 | | | | | | | | $ (31,721) | |
| Total | | | | | | | | | | | | | | | | | | | | | | | | | $(2,463,300) | |
| | | | | | | | | | | | | | | | | | |
| | | | |
| Centrally Cleared Interest Rate Swaps | | | | | | | | | | | |
Fixed Rate | | Floating Rate | | Effective
Date | | Expiration
Date | | Notional Amount (000) | | | Unrealized
Appreciation
(Depreciation) | |
| 7.55%1 | | 28-day MXIBTIIE | | 9/20/172 | | 9/14/22 | | | MXN | | | | 8,068,523 | | | | $(5,477,447 | ) |
| 7.55%1 | | 28-day MXIBTIIE | | 9/20/172 | | 9/14/22 | | | MXN | | | | 600,000 | | | | (413,218 | ) |
| 2.28%3 | | 3-month LIBOR | | 9/20/172 | | 9/19/22 | | | USD | | | | 69,439 | | | | 324,195 | |
| 2.76%3 | | 6-month Australian Bank Bill Rate | | 9/20/172 | | 9/20/22 | | | AUD | | | | 147,588 | | | | 656,793 | |
| 1.60%3 | | 3-month Canadian Bankers Acceptances | | 9/20/172 | | 9/20/22 | | | CAD | | | | 74,035 | | | | 48,509 | |
| 1.60%3 | | 3-month Canadian Bankers Acceptances | | 9/20/172 | | 9/20/22 | | | CAD | | | | 38,000 | | | | 31,744 | |
| 1.74%3 | | 3-month Canadian Bankers Acceptances | | 9/20/172 | | 9/20/22 | | | CAD | | | | 35,000 | | | | 202,645 | |
| 1.78%3 | | 3-month Canadian Bankers Acceptances | | 9/20/172 | | 9/20/22 | | | CAD | | | | 30,000 | | | | 214,232 | |
| 1.51%3 | | 3-month Canadian Bankers Acceptances | | 9/20/172 | | 9/20/22 | | | CAD | | | | 24,000 | | | | (57,783 | ) |
| 0.36%3 | | 6-month EURIBOR | | 9/20/172 | | 9/20/22 | | | EUR | | | | 148,000 | | | | 610,552 | |
| 0.41%3 | | 6-month EURIBOR | | 9/20/172 | | 9/20/22 | | | EUR | | | | 53,000 | | | | 369,084 | |
| 0.40%3 | | 6-month EURIBOR | | 9/20/172 | | 9/20/22 | | | EUR | | | | 40,000 | | | | 257,137 | |
| 0.34%3 | | 6-month EURIBOR | | 9/20/172 | | 9/20/22 | | | EUR | | | | 30,000 | | | | 92,434 | |
| 0.90%1 | | 6-month GBP LIBOR | | 9/20/172 | | 9/20/22 | | | GBP | | | | 355,599 | | | | 604,615 | |
| 0.92%1 | | 6-month GBP LIBOR | | 9/20/172 | | 9/20/22 | | | GBP | | | | 23,215 | | | | 10,804 | |
| 0.54%1 | | 3-month STIBOR | | 9/20/172 | | 9/20/22 | | | SEK | | | | 286,304 | | | | (73,153 | ) |
Total | | | | | | | | | | | | | | | | | $(2,598,857 | ) |
| | 1 | | The Fund pays the fixed rate and receives the floating rate. |
| | 3 | | The Fund pays the floating rate and receives the fixed rate. |
| | | | | | | | | | | | | | | | | | | | | | | | | | |
| | | | |
| OTC Interest Rate Swaps | | | | | | | | | | | | |
Fixed
Rate | | Floating Rate | | Counterparty | | Effective
Date | | Expiration
Date | | Notional Amount (000) | | | Value | | | Premiums
Paid
(Received) | | | Unrealized
Appreciation
(Depreciation) | |
| 11.59%1 | | 1-day BZDIOVER | | Credit Suisse International | | N/A | | 1/02/20 | | BRL | | | 128,971 | | | | $1,968,010 | | | | — | | | | $1,968,010 | |
| 9.91%1 | | 1-day BZDIOVER | | Credit Suisse International | | N/A | | 1/02/20 | | BRL | | | 41,960 | | | | 76,204 | | | | — | | | | 76,204 | |
| 9.73%1 | | 1-day BZDIOVER | | Credit Suisse International | | N/A | | 1/02/20 | | BRL | | | 39,983 | | | | 17,081 | | | | — | | | | 17,081 | |
| 9.55%1 | | 1-day BZDIOVER | | Deutsche Bank AG | | N/A | | 1/02/20 | | BRL | | | 39,997 | | | | (24,300 | ) | | | — | | | | (24,300 | ) |
| 11.53%1 | | 1-day BZDIOVER | | Société Générale | | N/A | | 1/02/20 | | BRL | | | 107,237 | | | | 1,572,400 | | | | — | | | | 1,572,400 | |
See Notes to Financial Statements.
| | | | | | |
| 16 | | BLACKROCK TACTICAL OPPORTUNITIES FUND | | MARCH 31, 2017 | | |
| | | | |
| Schedule of Investments (continued) | | | | |
| | | | | | | | | | | | | | | | | | | | | | | | | | | | | | | | | | | | |
Fixed
Rate | | Floating Rate | | | Counterparty | | | Effective
Date | | | Expiration
Date | | | Notional Amount (000) | | | Value | | | Premiums
Paid
(Received) | | | Unrealized
Appreciation
(Depreciation) | |
9.63%1
| | | 1-day BZDIOVER | | |
| Société
Générale |
| | | N/A | | | | 1/02/20 | | | | BRL | | | | 40,929 | | | | $ (4,475 | ) | | | — | | | | $ (4,475 | ) |
9.73%1
| | | 1-day BZDIOVER | | |
| Société
Générale |
| | | N/A | | | | 1/02/20 | | | | BRL | | | | 38,936 | | | | 30,476 | | | | — | | | | 30,476 | |
4.03%2
| |
| 7-day China Fixing
Repo Rates |
| |
| Goldman Sachs
Bank USA |
| | | 9/20/173 | | | | 9/20/22 | | | | CNY | | | | 136,000 | | | | (26,241 | ) | | | — | | | | (26,241 | ) |
1.09%1
| | | 6-month PRIBOR | | | | Citibank N.A. | | | | 9/20/173 | | | | 9/20/22 | | | | CZK | | | | 1,261,000 | | | | 798,305 | | | | — | | | | 798,305 | |
0.93%1
| | | 6-month PRIBOR | | |
| Goldman Sachs
Bank USA |
| | | 9/20/173 | | | | 9/20/22 | | | | CZK | | | | 1,291,000 | | | | 404,925 | | | | — | | | | 404,925 | |
1.04%1
| | | 6-month PRIBOR | | |
| JPMorgan Chase
Bank N.A. |
| | | 9/20/173 | | | | 9/20/22 | | | | CZK | | | | 1,234,000 | | | | 660,301 | | | | — | | | | 660,301 | |
0.96%1
| | | 6-month PRIBOR | | |
| JPMorgan Chase
Bank N.A. |
| | | 9/20/173 | | | | 9/20/22 | | | | CZK | | | | 364,000 | | | | 137,708 | | | | — | | | | 137,708 | |
6.80%1
| | | 1-day MIBOR | | | | Citibank N.A. | | | | 9/20/173 | | | | 9/20/22 | | | | INR | | | | 7,813,460 | | | | 913,890 | | | | — | | | | 913,890 | |
6.81%1
| | | 1-day MIBOR | | | | Citibank N.A. | | | | 9/20/173 | | | | 9/20/22 | | | | INR | | | | 5,565,310 | | | | 677,254 | | | | — | | | | 677,254 | |
6.80%1
| | | 1-day MIBOR | | |
| Goldman Sachs
Bank USA |
| | | 9/20/173 | | | | 9/20/22 | | | | INR | | | | 5,689,000 | | | | 674,373 | | | | — | | | | 674,373 | |
1.82%1
| |
| 3-month KRW
Certificate of
Deposit |
| | | Citibank N.A. | | | | 9/20/173 | | | | 9/20/22 | | | | KRW | | | | 54,972,310 | | | | 77,683 | | | | — | | | | 77,683 | |
4.26%2
| | | 3-month KLIBOR | | |
| Bank of
America N.A. |
| | | 9/20/173 | | | | 9/20/22 | | | | MYR | | | | 183,000 | | | | (93,670 | ) | | | — | | | | (93,670 | ) |
4.21%2
| | | 3-month KLIBOR | | |
| Bank of
America N.A. |
| | | 9/20/173 | | | | 9/20/22 | | | | MYR | | | | 114,000 | | | | (1,214 | ) | | | — | | | | (1,214 | ) |
2.27%1
| |
| 6-month Thailand
Fixing Rate |
| |
| Bank of
America N.A. |
| | | 9/20/173 | | | | 9/20/22 | | | | THB | | | | 620,500 | | | | (13,024 | ) | | | — | | | | (13,024 | ) |
2.44%1
| |
| 6-month Thailand
Fixing Rate |
| | | Citibank N.A. | | | | 9/20/173 | | | | 9/20/22 | | | | THB | | | | 752,000 | | | | 153,791 | | | | — | | | | 153,791 | |
2.32%1
| |
| 6-month Thailand
Fixing Rate |
| | | Citibank N.A. | | | | 9/20/173 | | | | 9/20/22 | | | | THB | | | | 700,000 | | | | 33,141 | | | | — | | | | 33,141 | |
2.28%1
| |
| 6-month Thailand
Fixing Rate |
| |
| Goldman Sachs
Bank USA |
| | | 9/20/173 | | | | 9/20/22 | | | | THB | | | | 620,500 | | | | (8,783 | ) | | | — | | | | (8,783 | ) |
2.33%1
| |
| 6-month Thailand
Fixing Rate |
| |
| Goldman Sachs
Bank USA |
| | | 9/20/173 | | | | 9/20/22 | | | | THB | | | | 500,000 | | | | 28,797 | | | | — | | | | 28,797 | |
7.79%2
| | | 3-month JIBAR | | |
| Barclays Bank
PLC |
| | | 9/20/173 | | | | 9/20/22 | | | | ZAR | | | | 362,000 | | | | (7,101 | ) | | | — | | | | (7,101 | ) |
7.79%2
| | | 3-month JIBAR | | |
| JPMorgan Chase
Bank N.A. |
| | | 9/20/173 | | | | 9/20/22 | | | | ZAR | | | | 456,000 | | | | (8,945 | ) | | | — | | | | (8,945 | ) |
| Total | | | | | | | | | | | | | | | | | | | | | | | | | | | $8,036,586 | | | | — | | | | $8,036,586 | |
| | 1 | | The Fund pays the floating rate and receives the fixed rate. |
| | 2 | | The Fund pays the fixed rate and receives the floating rate. |
See Notes to Financial Statements.
| | | | | | |
| | | BLACKROCK TACTICAL OPPORTUNITIES FUND | | MARCH 31, 2017 | | 17 |
| | | | |
| Schedule of Investments (continued) | | | | |
|
| Derivative Financial Instruments Categorized by Risk Exposure |
As of period end, the fair values of derivative financial instruments located in the Statement of Assets and Liabilities were as follows:
| | | | | | | | | | | | | | | | | | | | | | | | |
| Assets — Derivative Financial Instruments | | Commodity
Contracts | | Credit
Contracts | | Equity
Contracts | | | Foreign
Currency
Exchange
Contracts | | | Interest
Rate
Contracts | | | Other
Contracts | | Total | |
Futures contracts | | Net unrealized appreciation1 | | — | | — | | $ | 4,233,162 | | | | — | | | $ | 2,116,546 | | | — | | $ | 6,349,708 | |
Forward foreign currency exchange contracts | | Unrealized appreciation on forward foreign currency exchange contracts | | — | | — | | | — | | | $ | 337,552 | | | | — | | | — | | | 337,552 | |
Swaps — centrally cleared | | Net unrealized appreciation1 | | — | | — | | | — | | | | — | | | | 3,422,744 | | | — | | | 3,422,744 | |
Swaps — OTC | | Unrealized appreciation on OTC swaps | | — | | — | | | — | | | | — | | | | 8,224,339 | | | — | | | 8,224,339 | |
Total | | | | — | | — | | $ | 4,233,162 | | | $ | 337,552 | | | $ | 13,763,629 | | | — | | $ | 18,334,343 | |
| | | | | | | | | | | | | | | | | | | | | | | | |
| Liabilities — Derivative Financial Instruments | | | | | | | | | | | | | | | | | | |
Futures contracts | | Net unrealized depreciation1 | | — | | — | | $ | 4,603,039 | | | | — | | | $ | 2,560,191 | | | — | | $ | 7,163,230 | |
Forward foreign currency exchange contracts | | Unrealized depreciation on forward foreign currency exchange contracts | | — | | — | | | — | | | $ | 2,800,852 | | | | — | | | — | | | 2,800,852 | |
Swaps — centrally cleared | | Net unrealized depreciation1 | | — | | — | | | — | | | | — | | | | 6,021,601 | | | — | | | 6,021,601 | |
Swaps — OTC | | Unrealized depreciation on OTC swaps | | — | | — | | | — | | | | — | | | | 187,753 | | | — | | | 187,753 | |
Total | | | | — | | — | | $ | 4,603,039 | | | $ | 2,800,852 | | | $ | 8,769,545 | | | — | | $ | 16,173,436 | |
| | 1 | | Includes cumulative appreciation (depreciation) on futures contracts and centrally cleared swaps, if any, as reported in the Schedule of Investments. Only current day’s variation margin is reported within the Statement of Assets and Liabilities. |
For the six months ended March 31, 2017, the effect of derivative financial instruments in the Statement of Operations was as follows:
| | | | | | | | | | | | | | | | | | | | | | |
| Net Realized Gain (Loss) from: | | Commodity
Contracts | | Credit
Contracts | | Equity
Contracts | | | Foreign
Currency
Exchange
Contracts | | | Interest
Rate
Contracts | | | Other
Contracts | | Total | |
Futures contracts | | — | | — | | $ | (20,967,040 | ) | | $ | (1,500,348 | ) | | $ | 11,688,239 | | | — | | $ | (10,779,149 | ) |
Forward foreign currency exchange contracts | | — | | — | | | — | | | | 2,544,213 | | | | — | | | — | | | 2,544,213 | |
Swaps | | — | | — | | | — | | | | — | | | | 1,413,549 | | | — | | | 1,413,549 | |
Total | | — | | — | | $ | (20,967,040 | ) | | $ | 1,043,865 | | | $ | 13,101,788 | | | — | | $ | (6,821,387 | ) |
| | | | | | | | | | | | | | | | | | | | | | |
Net Change in Unrealized Appreciation (Depreciation) on: | | | | | | | | | | | | | | | | | | |
Futures contracts | | — | | — | | $ | 3,416,029 | | | $ | 2,843,615 | | | $ | (1,499,892 | ) | | — | | $ | 4,759,752 | |
Forward foreign currency exchange contracts | | — | | — | | | — | | | | (2,584,574 | ) | | | — | | | — | | | (2,584,574 | ) |
Swaps | | — | | — | | | — | | | | — | | | | 3,860,718 | | | — | | | 3,860,718 | |
Total | | — | | — | | $ | 3,416,029 | | | $ | 259,041 | | | $ | 2,360,826 | | | — | | $ | 6,035,896 | |
| | |
| Average Quarterly Balances of Outstanding Derivative Financial Instruments |
| | | | |
Futures contracts: | | | | |
Average notional value of contracts — long | | $ | 351,689,476 | |
Average notional value of contracts — short | | $ | 665,366,937 | |
Forward foreign currency exchange contracts: | | | | |
Average amounts purchased — in USD | | $ | 149,781,523 | |
Average amounts sold — in USD | | $ | 32,855,346 | |
Interest rate swaps: | | | | |
Average notional value — pays fixed rate | | $ | 1,102,878,853 | |
Average notional value — receives fixed rate | | $ | 1,256,274,321 | |
For more information about the Fund’s investment risks regarding derivative financial instruments, refer to the Notes to Financial Statements.
See Notes to Financial Statements.
| | | | | | |
| 18 | | BLACKROCK TACTICAL OPPORTUNITIES FUND | | MARCH 31, 2017 | | |
| | | | |
| Schedule of Investments (continued) | | | | |
|
| Derivative Financial Instruments — Offsetting as of Period End |
The Fund’s derivative assets and liabilities (by type) were as follows:
| | | | | | | | | | | | |
| | | Assets | | | | Liabilities |
Derivative Financial Instruments: | | | | | | | | | | | | |
Futures contracts | | | $ | 3,806,439 | | | | | | $ | 705,998 | |
Forward foreign currency exchange contracts | | | | 337,552 | | | | | | | 2,800,852 | |
Swaps — centrally cleared | | | | — | | | | | | | 1,180,803 | |
Swaps — OTC1 | | | | 8,224,339 | | | | | | | 187,753 | |
| | | | | |
Total derivative assets and liabilities in the Statement of Assets and Liabilities | | | $ | 12,368,330 | | | | | | $ | 4,875,406 | |
Derivatives not subject to a Master Netting Agreement or similar agreement (“MNA”) | | | | (3,806,439 | ) | | | | | | (1,886,801 | ) |
| | | | | |
Total derivative assets and liabilities subject to an MNA | | | $ | 8,561,891 | | | | | | $ | 2,988,605 | |
| | | | | |
| | 1 | Includes unrealized appreciation (depreciation) on OTC swaps and swap premiums paid/received in the Statement of Assets and Liabilities. |
The following tables present the Fund’s derivative assets and liabilities by counterparty net of amounts available for offset under an MNA and net of the related collateral received and pledged by the Fund.
| | | | | | | | | | | | | | | | | | | | | | | | | | | | |
| Counterparty | | Derivative Assets
Subject to an MNA by
Counterparty | | Derivatives Available
for Offset1 | | | Non-cash
Collateral
Received | | Cash
Collateral
Received2 | | | Net Amount of
Derivative Assets3
| |
BNP Paribas S.A. | | | $ 50,863 | | | | | | $ (50,863 | ) | | | | | | — | | | — | | | | — | | | | | |
Citibank N.A. | | | 2,940,753 | | | | | | (2,731,727 | ) | | | | | | — | | | $ (209,026 | ) | | | — | | | | | |
Credit Suisse International | | | 2,061,295 | | | | | | — | | | | | | | — | | | (1,620,000 | ) | | | $ 441,295 | | | | | |
Goldman Sachs Bank USA | | | 1,108,095 | | | | | | (35,024 | ) | | | | | | — | | | (670,000 | ) | | | 403,071 | | | | | |
JPMorgan Chase Bank N.A. | | | 798,009 | | | | | | (8,945 | ) | | | | | | — | | | (380,000 | ) | | | 409,064 | | | | | |
Société Générale | | | 1,602,876 | | | | | | (4,475 | ) | | | | | | — | | | (1,370,000 | ) | | | 228,401 | | | | | |
| | | | |
Total | | | $8,561,891 | | | | | | $(2,831,034) | | | | | | | — | | | $(4,249,026) | | | | $1,481,831 | | | | | |
| | | | |
| | | | | | | | | | | | | | | | | | | | | | | | | | | | |
| Counterparty | | Derivative Liabilities
Subject to an MNA by
Counterparty | | Derivatives Available
for Offset1 | | | Non-cash
Collateral
Pledged | | Cash
Collateral
Pledged | | | Net Amount of
Derivative Liabilities4 | |
Bank of America N.A. | | | $ 107,908 | | | | | | — | | | | | | | — | | | — | | | | $107,908 | | | | | |
Barclays Bank PLC | | | 7,101 | | | | | | — | | | | | | | — | | | — | | | | 7,101 | | | | | |
BNP Paribas S.A. | | | 69,125 | | | | | | $ (50,863 | ) | | | | | | — | | | — | | | | 18,262 | | | | | |
Citibank N.A. | | | 2,731,727 | | | | | | (2,731,727 | ) | | | | | | — | | | — | | | | — | | | | | |
Deutsche Bank AG | | | 24,300 | | | | | | — | | | | | | | — | | | — | | | | 24,300 | | | | | |
Goldman Sachs Bank USA | | | 35,024 | | | | | | (35,024 | ) | | | | | | — | | | — | | | | — | | | | | |
JPMorgan Chase Bank N.A. | | | 8,945 | | | | | | (8,945 | ) | | | | | | — | | | — | | | | — | | | | | |
Société Générale | | | 4,475 | | | | | | (4,475 | ) | | | | | | — | | | — | | | | — | | | | | |
| | | | |
Total | | | $2,988,605 | | | | | | $(2,831,034) | | | | | | | — | | | — | | | | $157,571 | | | | | |
| | | | |
| | 1 | The amount of derivatives available for offset is limited to the amount of assets and/or liabilities that are subject to an MNA. |
| | 2 | Excess of collateral received from the individual counterparty is not shown for financial reporting purposes. |
| | 3 | Net amount represents the net amount receivable from the counterparty in the event of default. |
| | 4 | Net amount represents the net amount payable due to the counterparty in the event of default. |
See Notes to Financial Statements.
| | | | | | |
| | | BLACKROCK TACTICAL OPPORTUNITIES FUND | | MARCH 31, 2017 | | 19 |
| | | | |
| Schedule of Investments (continued) | | | | |
|
| Fair Value Hierarchy as of Period End |
Various inputs are used in determining the fair value of investments and derivative financial instruments. For information about the Fund’s policy regarding valuation of investments and derivative financial instruments, refer to the Notes to Financial Statements.
The following tables summarize the Fund’s investments and derivative financial instruments categorized in the disclosure hierarchy:
| | | | | | | | | | | | | | | | |
| | | Level 1 | | | Level 2 | | | Level 3 | | | Total | |
Assets: | | | | | | | | | | | | | | | | |
Investments: | | | | | | | | | | | | | | | | |
Long-Term Investments: | | | | | | | | | | | | | | | | |
Asset-Backed Securities | | | — | | | $ | 1 | | | | — | | | $ | 1 | |
Common Stocks: | | | | | | | | | | | | | | | | |
Aerospace & Defense | | $ | 115,136 | | | | — | | | | — | | | | 115,136 | |
Air Freight & Logistics | | | 3,982,884 | | | | 11,944 | | | | — | | | | 3,994,828 | |
Airlines | | | 486,364 | | | | 1,175,680 | | | | — | | | | 1,662,044 | |
Auto Components | | | 8,336,389 | | | | 4,778,077 | | | | — | | | | 13,114,466 | |
Automobiles | | | — | | | | 989,905 | | | | — | | | | 989,905 | |
Banks | | | 11,800,811 | | | | 10,849,132 | | | | — | | | | 22,649,943 | |
Beverages | | | 7,293,566 | | | | 87,015 | | | | — | | | | 7,380,581 | |
Biotechnology | | | 3,837,547 | | | | 32,447 | | | | — | | | | 3,869,994 | |
Building Products | | | 270,073 | | | | 2,526,952 | | | | — | | | | 2,797,025 | |
Capital Markets | | | 4,095,164 | | | | 1,318,477 | | | | — | | | | 5,413,641 | |
Chemicals | | | 11,622,508 | | | | 1,719,603 | | | | — | | | | 13,342,111 | |
Communications Equipment | | | 5,331,477 | | | | — | | | | — | | | | 5,331,477 | |
Construction & Engineering | | | — | | | | 720,196 | | | | — | | | | 720,196 | |
Construction Materials | | | — | | | | 215,525 | | | | — | | | | 215,525 | |
Consumer Finance | | | 1,538,703 | | | | — | | | | — | | | | 1,538,703 | |
Containers & Packaging | | | 1,488,858 | | | | — | | | | — | | | | 1,488,858 | |
Distributors | | | — | | | | 25,058 | | | | — | | | | 25,058 | |
Diversified Financial Services | | | 1,331,940 | | | | 746,867 | | | | — | | | | 2,078,807 | |
Diversified Telecommunication Services | | | 3,265,913 | | | | 3,511,630 | | | | — | | | | 6,777,543 | |
Electric Utilities | | | 71,867 | | | | 1,903,342 | | | | — | | | | 1,975,209 | |
Electrical Equipment | | | 389,881 | | | | 226,529 | | | | — | | | | 616,410 | |
Electronic Equipment, Instruments & Components | | | 2,343,777 | | | | 1,405,339 | | | | — | | | | 3,749,116 | |
Energy Equipment & Services | | | 1,801,540 | | | | 1,861,044 | | | | — | | | | 3,662,584 | |
Equity Real Estate Investment Trusts (REITs) | | | 3,643,979 | | | | 389,629 | | | | — | | | | 4,033,608 | |
Food & Staples Retailing | | | 1,805,989 | | | | 107,381 | | | | — | | | | 1,913,370 | |
Food Products | | | 3,816,853 | | | | 3,887,816 | | | | — | | | | 7,704,669 | |
Gas Utilities | | | — | | | | 336,143 | | | | — | | | | 336,143 | |
Health Care Equipment & Supplies | | | 2,707,530 | | | | — | | | | — | | | | 2,707,530 | |
Health Care Providers & Services | | | 4,330,280 | | | | 17,737 | | | | — | | | | 4,348,017 | |
Hotels, Restaurants & Leisure | | | 1,631,999 | | | | 1,851,030 | | | | — | | | | 3,483,029 | |
Household Durables | | | 719,243 | | | | 1,056,539 | | | | — | | | | 1,775,782 | |
Household Products | | | 6,901,319 | | | | 18,022 | | | | — | | | | 6,919,341 | |
Independent Power and Renewable Electricity Producers | | | 1,827,159 | | | | 45,753 | | | | — | | | | 1,872,912 | |
Industrial Conglomerates | | | 1,956,549 | | | | 1,722,188 | | | | — | | | | 3,678,737 | |
Insurance | | | 3,400,142 | | | | 9,849,290 | | | | — | | | | 13,249,432 | |
Internet & Direct Marketing Retail | | | 2,061,019 | | | | — | | | | — | | | | 2,061,019 | |
Internet Software & Services | | | 4,468,263 | | | | — | | | | — | | | | 4,468,263 | |
IT Services | | | 12,644,512 | | | | 478,219 | | | | — | | | | 13,122,731 | |
Leisure Products | | | — | | | | 102,869 | | | | — | | | | 102,869 | |
Life Sciences Tools & Services | | | 411,955 | | | | 315,854 | | | | — | | | | 727,809 | |
Machinery | | | 6,889,899 | | | | 4,513,549 | | | | — | | | | 11,403,448 | |
Marine | | | — | | | | 906,409 | | | | — | | | | 906,409 | |
Media | | | 8,635,009 | | | | 959,835 | | | | — | | | | 9,594,844 | |
Metals & Mining | | | 1,156,976 | | | | 2,131,028 | | | | — | | | | 3,288,004 | |
Mortgage Real Estate Investment Trusts (REITs) | | | 90,846 | | | | — | | | | — | | | | 90,846 | |
Multiline Retail | | | 122,784 | | | | — | | | | — | | | | 122,784 | |
Multi-Utilities | | | 2,375,971 | | | | 5,491,220 | | | | — | | | | 7,867,191 | |
Oil, Gas & Consumable Fuels | | | 5,291,505 | | | | 8,504,581 | | | $ | 5,152 | | | | 13,801,238 | |
See Notes to Financial Statements.
| | | | | | |
| 20 | | BLACKROCK TACTICAL OPPORTUNITIES FUND | | MARCH 31, 2017 | | |
| | | | |
| Schedule of Investments (concluded) | | | | |
| | | | | | | | | | | | | | | | |
| | | Level 1 | | | Level 2 | | | Level 3 | | | Total | |
Paper & Forest Products | | $ | 173,356 | | | $ | 2,736,110 | | | | — | | | $ | 2,909,466 | |
Personal Products | | | 46,648 | | | | 27,458 | | | | — | | | | 74,106 | |
Pharmaceuticals | | | 8,764,679 | | | | 11,934,867 | | | | — | | | | 20,699,546 | |
Professional Services | | | 3,586,253 | | | | 1,627,304 | | | | — | | | | 5,213,557 | |
Real Estate Management & Development | | | 71,534 | | | | 1,309,695 | | | | — | | | | 1,381,229 | |
Road & Rail | | | — | | | | 522,688 | | | | — | | | | 522,688 | |
Semiconductors & Semiconductor Equipment | | | 9,719,233 | | | | 437,900 | | | | — | | | | 10,157,133 | |
Software | | | 3,777,422 | | | | — | | | | — | | | | 3,777,422 | |
Specialty Retail | | | 2,428,974 | | | | 166,775 | | | | — | | | | 2,595,749 | |
Technology Hardware, Storage & Peripherals | | | 5,290,198 | | | | — | | | | — | | | | 5,290,198 | |
Textiles, Apparel & Luxury Goods | | | 41,797 | | | | 115,651 | | | | — | | | | 157,448 | |
Tobacco | | | 3,055,864 | | | | 658,273 | | | | — | | | | 3,714,137 | |
Trading Companies & Distributors | | | 1,252,970 | | | | 3,133,304 | | | | — | | | | 4,386,274 | |
Transportation Infrastructure | | | — | | | | 35,807 | | | | — | | | | 35,807 | |
Wireless Telecommunication Services | | | — | | | | 275,332 | | | | — | | | | 275,332 | |
Other Interests1 | | | — | | | | — | | | | — | | | | — | |
Preferred Securities1 | | | — | | | | 1,287,958 | | | | — | | | | 1,287,958 | |
U.S. Treasury Obligations | | | — | | | | 153,688,867 | | | | — | | | | 153,688,867 | |
Short-Term Securities: | | | | | | | | | | | | | | | | |
Money Market Funds | | | 22,849,522 | | | | — | | | | — | | | | 22,849,522 | |
| | | | |
Subtotal | | $ | 207,352,629 | | | $ | 254,747,844 | | | $ | 5,152 | | | $ | 462,105,625 | |
| | | | |
Investments Valued at NAV2 | | | | | | | | | | | | | | | 18,597 | |
| | | | | | | | | | | | | | | | |
Total Investments | | | | | | | | | | | | | | $ | 462,124,222 | |
| | | | | | | | | | | | | | | | |
| | 1 | See above Schedule of Investments for values in each industry. |
| | 2 | As of March 31, 2017, certain of the Fund’s investments were fair valued using NAV per share as no quoted market value is available and therefore have been excluded from the fair value hierarchy. |
| | | | | | | | | | | | | | | | |
Derivative Financial Instruments3 | | | | | | | | | | | | | | | | |
Assets: | | | | | | | | | | | | | | | | |
Equity contracts | | $ | 4,233,162 | | | | — | | | | — | | | $ | 4,233,162 | |
Foreign currency exchange contracts | | | — | | | $ | 337,552 | | | | — | | | | 337,552 | |
Interest rate contracts | | | 2,116,546 | | | | 11,647,083 | | | | — | | | | 13,763,629 | |
Liabilities: | | | | | | | | | | | | | | | | |
Equity contracts | | | (4,603,039 | ) | | | — | | | | — | | | | (4,603,039 | ) |
Foreign currency exchange contracts | | | — | | | | (2,800,852 | ) | | | — | | | | (2,800,852 | ) |
Interest rate contracts | | | (2,560,191 | ) | | | (6,209,354 | ) | | | — | | | | (8,769,545 | ) |
| | | | |
Total | | $ | (813,522 | ) | | $ | 2,974,429 | | | | — | | | $ | 2,160,907 | |
| | | | |
| | 3 | Derivative financial instruments are swaps, futures contracts and forward foreign currency exchange contracts. Swaps, futures contracts and forward foreign currency exchange contracts are valued at the unrealized appreciation (depreciation) on the instrument. |
During the six months ended March 31, 2017, there were no transfers between levels.
See Notes to Financial Statements.
| | | | | | |
| | | BLACKROCK TACTICAL OPPORTUNITIES FUND | | MARCH 31, 2017 | | 21 |
| | | | |
| Statement of Assets and Liabilities | | | | |
| | | | |
| March 31, 2017 (Unaudited) | | | |
| | | | |
| Assets | | | | |
Investments at value — unaffiliated (cost — $422,477,257) | | $ | 439,256,103 | |
Investments at value — affiliated (cost — $22,868,121) | | | 22,868,119 | |
Cash | | | 42,390 | |
Cash pledged: | | | | |
Futures contracts | | | 36,795,749 | |
Centrally cleared swaps | | | 11,589,000 | |
Foreign currency at value (cost — $32,206,946) | | | 32,482,351 | |
Receivables: | | | | |
Investments sold | | | 12,583 | |
Securities lending income — affiliated | | | 480 | |
Capital shares sold | | | 59,335 | |
Dividends — affiliated | | | 5,142 | |
Dividends — unaffiliated | | | 700,419 | |
Interest | | | 508,660 | |
From the Manager | | | 2,731 | |
Variation margin on futures contracts | | | 3,806,439 | |
Unrealized appreciation on: | | | | |
Forward foreign currency exchange contracts | | | 337,552 | |
OTC swaps | | | 8,224,339 | |
Prepaid expenses | | | 63,228 | |
Other assets | | | 3,734 | |
| | | | |
Total assets | | | 556,758,354 | |
| | | | |
| | | | |
| Liabilities | | | | |
Cash received as collateral for OTC derivatives | | | 4,580,000 | |
Collateral on securities loaned at value | | | 18,575 | |
Payables: | | | | |
Capital shares redeemed | | | 683,916 | |
Investment advisory fees | | | 259,223 | |
Officer’s and Trustees’ fees | | | 9,379 | |
Other accrued expenses | | | 707,489 | |
Other affiliates | | | 141,541 | |
Service and distribution fees | | | 95,855 | |
Variation margin on futures contracts | | | 705,998 | |
Variation margin on centrally cleared swaps | | | 1,180,803 | |
Unrealized depreciation on: | | | | |
Forward foreign currency exchange contracts | | | 2,800,852 | |
OTC swaps | | | 187,753 | |
| | | | |
Total liabilities | | | 11,371,384 | |
| | | | |
Net Assets | | $ | 545,386,970 | |
| | | | |
| | | | |
| Net Assets Consist of | | | | |
Paid-in capital | | $ | 576,866,028 | |
Distributions in excess of net investment income | | | (422,757 | ) |
Accumulated net realized loss | | | (50,271,178 | ) |
Net unrealized appreciation (depreciation) | | | 19,214,877 | |
| | | | |
Net Assets | | $ | 545,386,970 | |
| | | | |
| | | | |
| Net Asset Value | | | | |
Institutional — Based on net assets of $204,670,683 and 15,172,128 shares outstanding, unlimited number of shares authorized, $0.001 par value | | $ | 13.49 | |
| | | | |
Service — Based on net assets of $1,702,201 and 126,779 shares outstanding, unlimited number of shares authorized, $0.001 par value | | $ | 13.43 | |
| | | | |
Investor A — Based on net assets of $249,949,561 and 18,615,398 shares outstanding, unlimited number of shares authorized, $0.001 par value | | $ | 13.43 | |
| | | | |
Investor B — Based on net assets of $612,746 and 45,912 shares outstanding, unlimited number of shares authorized, $0.001 par value | | $ | 13.35 | |
| | | | |
Investor C — Based on net assets of $46,138,897 and 3,521,366 shares outstanding, unlimited number of shares authorized, $0.001 par value | | $ | 13.10 | |
| | | | |
Class K — Based on net assets of $42,312,882 and 3,140,522 shares outstanding, unlimited number of shares authorized, $0.001 par value | | $ | 13.47 | |
| | | | |
See Notes to Financial Statements.
| | | | | | |
| 22 | | BLACKROCK TACTICAL OPPORTUNITIES FUND | | MARCH 31, 2017 | | |
| | | | |
| Six Months Ended March 31, 2017 (Unaudited) | | | |
| | | | |
| Investment Income | | | | |
Interest | | $ | 941,110 | |
Dividends — unaffiliated | | | 2,909,607 | |
Dividends — affiliated | | | 55,092 | |
Securities lending — affiliated — net | | | 1,356 | |
Foreign taxes withheld | | | (106,336 | ) |
| | | | |
Total income | | | 3,800,829 | |
| | | | |
| | | | |
| Expenses | | | | |
Investment advisory | | | 1,593,752 | |
Service and distribution — class specific | | | 588,142 | |
Transfer agent — class specific | | | 471,229 | |
Administration | | | 122,142 | |
Administration — class specific | | | 58,053 | |
Professional | | | 117,502 | |
Custodian | | | 89,438 | |
Accounting services | | | 76,413 | |
Printing | | | 52,800 | |
Registration | | | 43,476 | |
Offering | | | 29,680 | |
Officer and Trustees | | | 12,909 | |
Miscellaneous | | | 63,217 | |
Recoupment of past waived and/or reimbursed fees — class specific | | | 4,018 | |
| | | | |
Total expenses | | | 3,322,771 | |
Less: | | | | |
Fees waived by the Manager | | | (16,838 | ) |
Administration fees waived — class specific | | | (23,512 | ) |
Transfer agent fees waived — class specific | | | (2,455 | ) |
Transfer agent fees reimbursed — class specific | | | (17,774 | ) |
| | | | |
Total expenses after fees waived and/or reimbursed | | | 3,262,192 | |
| | | | |
Net investment income | | | 538,637 | |
| | | | |
| | | | |
| Realized and Unrealized Gain (Loss) | | | | |
Net realized gain (loss) from: | | | | |
Investments — unaffiliated | | | 6,482,057 | |
Investments — affiliated | | | 23 | |
Capital gain distributions received from affiliated investment companies | | | 336 | |
Foreign currency transactions | | | (1,461,330 | ) |
Forward foreign currency exchange contracts | | | 2,544,213 | |
Futures contracts | | | (10,779,149 | ) |
Swaps | | | 1,413,549 | |
| | | | |
| | | (1,800,301 | ) |
| | | | |
Net change in unrealized appreciation (depreciation) on: | | | | |
Investments — unaffiliated | | | 7,428,901 | |
Investments — affiliated | | | (2 | ) |
Foreign currency translations | | | 1,240,139 | |
Forward foreign currency exchange contracts | | | (2,584,574 | ) |
Futures contracts | | | 4,759,752 | |
Swaps | | | 3,860,718 | |
| | | | |
| | | 14,704,934 | |
| | | | |
Net realized and unrealized gain | | | 12,904,633 | |
| | | | |
Net Increase in Net Assets Resulting from Operations | | $ | 13,443,270 | |
| | | | |
See Notes to Financial Statements.
| | | | | | |
| | | BLACKROCK TACTICAL OPPORTUNITIES FUND | | MARCH 31, 2017 | | 23 |
| | | | |
| Statements of Changes in Net Assets | | | | |
| | | | | | | | |
| Decrease in Net Assets: | | Six Months
Ended
March 31, 2017
(Unaudited) | | | Year Ended
September 30,
2016 | |
| | | | | | | | |
| Operations | | | | | | | | |
Net investment income | | $ | 538,637 | | | $ | 1,468,193 | |
Net realized gain (loss) | | | (1,800,301 | ) | | | (37,597,340 | ) |
Net change in unrealized appreciation (depreciation) | | | 14,704,934 | | | | 30,181,125 | |
| | | | |
Net increase (decrease) in net assets resulting from operations | | | 13,443,270 | | | | (5,948,022 | ) |
| | | | |
| | | | | | | | |
| Distributions to Shareholders1 | | | | | | | | |
From net investment income: | | | | | | | | |
Institutional | | | (3,834,174 | ) | | | (9,784,450 | ) |
Service | | | (25,177 | ) | | | (59,935 | ) |
Investor A | | | (3,675,643 | ) | | | (10,156,296 | ) |
Investor B | | | — | | | | (51,740 | ) |
Investor C | | | (315,743 | ) | | | (1,747,687 | ) |
Class K | | | (899,292 | ) | | | — | |
From net realized gain: | | | | | | | | |
Institutional | | | — | | | | (3,667,024 | ) |
Service | | | — | | | | (24,526 | ) |
Investor A | | | — | | | | (4,156,638 | ) |
Investor B | | | — | | | | (42,170 | ) |
Investor C | | | — | | | | (903,384 | ) |
| | | | |
Decrease in net assets resulting from distributions to shareholders | | | (8,750,029 | ) | | | (30,593,850 | ) |
| | | | |
| | | | | | | | |
| Capital Share Transactions | | | | | | | | |
Net decrease in net assets derived from capital share transactions | | | (60,148,125 | ) | | | (7,533,255 | ) |
| | | | |
| | | | | | | | |
| Net Assets | | | | | | | | |
Total decrease in net assets | | | (55,454,884 | ) | | | (44,075,127 | ) |
Beginning of period | | | 600,841,854 | | | | 644,916,981 | |
| | | | |
End of period | | $ | 545,386,970 | | | $ | 600,841,854 | |
| | | | |
Undistributed (distributions in excess of) net investment income, end of period | | $ | (422,757 | ) | | $ | 7,788,635 | |
| | | | |
| 1 | | Distributions for annual periods determined in accordance with U.S. federal income tax regulations. |
See Notes to Financial Statements.
| | | | | | |
| 24 | | BLACKROCK TACTICAL OPPORTUNITIES FUND | | MARCH 31, 2017 | | |
| | | | | | | | | | | | | | | | | | | | | | | | |
| | | Institutional | |
| | | Six Months
Ended
March 31,
2017 (Unaudited) | | | Year Ended September 30, | |
| | | | 2016 | | | 2015 | | | 2014 | | | 2013 | | | 2012 | |
| | | | | | | | | | | | | | | | | | | | | | | | |
| Per Share Operating Performance | | | | | | | | | | | | | | | | | | | | | | | | |
Net asset value, beginning of period | | $ | 13.41 | | | $ | 14.20 | | | $ | 15.52 | | | $ | 15.95 | | | $ | 15.37 | | | $ | 14.03 | |
| | | | |
Net investment income1 | | | 0.03 | | | | 0.07 | | | | 0.06 | | | | 0.04 | | | | 0.19 | | | | 0.23 | |
Net realized and unrealized gain (loss) | | | 0.28 | | | | (0.16 | ) | | | (0.23 | ) | | | 1.04 | | | | 1.19 | | | | 1.68 | |
| | | | |
Net increase (decrease) from investment operations | | | 0.31 | | | | (0.09 | ) | | | (0.17 | ) | | | 1.08 | | | | 1.38 | | | | 1.91 | |
| | | | |
Distributions:2 | | | | | | | | | | | | | | | | | | | | | | | | |
From net investment income | | | (0.23 | ) | | | (0.51 | ) | | | (0.35 | ) | | | (0.20 | ) | | | (0.22 | ) | | | (0.26 | ) |
From net realized gain | | | — | | | | (0.19 | ) | | | (0.80 | ) | | | (1.31 | ) | | | (0.58 | ) | | | (0.31 | ) |
| | | | |
Total distributions | | | (0.23 | ) | | | (0.70 | ) | | | (1.15 | ) | | | (1.51 | ) | | | (0.80 | ) | | | (0.57 | ) |
| | | | |
Net asset value, end of period | | $ | 13.49 | | | $ | 13.41 | | | $ | 14.20 | | | $ | 15.52 | | | $ | 15.95 | | | $ | 15.37 | |
| | | | |
| | | | | | | | | | | | | | | | | | | | | | | | |
| Total Return3 | | | | | | | | | | | | | | | | | | | | | | | | |
Based on net asset value | | | 2.34 | %4 | | | (0.71 | )% | | | (1.27 | )% | | | 7.02 | % | | | 9.35 | % | | | 13.89 | % |
| | | | |
| | | | | | | | | | | | | | | | | | | | | | | | |
| Ratios to Average Net Assets | | | | | | | | | | | | | | | | | | | | | | | | |
Total expenses5 | | | 0.93 | %6 | | | 0.91 | % | | | 0.84 | %7 | | | 0.85 | %7 | | | 0.91 | %7 | | | 0.95 | %7 |
| | | | |
Total expenses after fees waived and/or reimbursed and paid indirectly5 | | | 0.89 | %6 | | | 0.87 | % | | | 0.81 | % | | | 0.82 | % | | | 0.87 | % | | | 0.90 | % |
| | | | |
Total expenses after fees waived and/or reimbursed and paid indirectly and excluding interest expense5 | | | 0.89 | %6 | | | 0.87 | % | | | 0.81 | % | | | 0.82 | % | | | 0.87 | % | | | 0.89 | % |
| | | | |
Net investment income5 | | | 0.41 | %6 | | | 0.49 | % | | | 0.40 | % | | | 0.28 | % | | | 1.22 | % | | | 1.59 | % |
| | | | |
| | | | | | | | | | | | | | | | | | | | | | | | |
| Supplemental Data | | | | | | | | | | | | | | | | | | | | | | | | |
Net assets, end of period (000) | | $ | 204,671 | | | $ | 271,623 | | | $ | 265,521 | | | $ | 342,794 | | | $ | 132,007 | | | $ | 59,041 | |
| | | | |
Portfolio turnover rate | | | 129 | % | | | 359 | %8 | | | 295 | %8 | | | 181 | %8 | | | 192 | %8 | | | 324 | %8 |
| | | | |
| | 1 | | Based on average shares outstanding. |
| | 2 | | Distributions for annual periods determined in accordance with U.S. federal income tax regulations. |
| | 3 | | Where applicable, assumes the reinvestment of distributions. |
| | 4 | | Aggregate total return. |
| | 5 | | Excludes expenses incurred indirectly as a result of investments in underlying funds as follows: |
| | | | | | | | | | | | | | | | | | | | | | | | |
| | | Six Months
Ended
March 31, | | | Year Ended September 30, | |
| | | 2017
(Unaudited) | | | 2016 | | | 2015 | | | 2014 | | | 2013 | | | 2012 | |
Investments in underlying funds | | | 0.01 | % | | | 0.05 | % | | | 0.08 | % | | | 0.11 | % | | | 0.10 | % | | | 0.05 | % |
| | 7 | | Includes recoupment of past waived and/or reimbursed fees. Excluding the recoupment of past waived and/or reimbursed fees, the ratios were as follows: |
| | | | | | | | | | | | | | | | | | | | | | | | |
| | | Six Months
Ended
March 31, 2017
(Unaudited) | | | Year Ended September 30, | |
| | | | 2016 | | | 2015 | | | 2014 | | | 2013 | | | 2012 | |
Expense ratios | | | — | | | | — | | | | 0.84 | % | | | 0.85 | % | | | 0.89 | % | | | 0.91 | % |
| | 8 | | Includes mortgage dollar roll transactions (“MDRs”). Additional information regarding portfolio turnover rate is as follows: |
| | | | | | | | | | | | | | | | | | | | | | | | |
| | | Six Months
Ended
March 31, | | | Year Ended September 30, | |
| | | 2017
(Unaudited) | | | 2016 | | | 2015 | | | 2014 | | | 2013 | | | 2012 | |
Portfolio turnover rate (excluding MDRs) | | | — | | | | 359 | % | | | 295 | % | | | 181 | % | | | 192 | % | | | 254 | % |
See Notes to Financial Statements.
| | | | | | |
| | | BLACKROCK TACTICAL OPPORTUNITIES FUND | | MARCH 31, 2017 | | 25 |
| | | | |
| Financial Highlights (continued) | | | | |
| | | | | | | | | | | | | | | | | | | | | | | | |
| | | Service | |
| | Six Months
Ended
March 31,
2017 (Unaudited) | | | Year Ended September 30, | |
| | | | 2016 | | | 2015 | | | 2014 | | | 2013 | | | 2012 | |
| | | | | | | | | | | | | | | | | | | | | | | | |
| Per Share Operating Performance | | | | | | | | | | | | | | | | | | | | | | | | |
Net asset value, beginning of period | | $ | 13.34 | | | $ | 14.12 | | | $ | 15.44 | | | $ | 15.90 | | | $ | 15.31 | | | $ | 13.99 | |
| | | | |
Net investment income (loss)1 | | | 0.01 | | | | 0.02 | | | | 0.01 | | | | (0.01 | ) | | | 0.15 | | | | 0.19 | |
Net realized and unrealized gain (loss) | | | 0.28 | | | | (0.14 | ) | | | (0.23 | ) | | | 1.02 | | | | 1.19 | | | | 1.67 | |
| | | | |
Net increase (decrease) from investment operations | | | 0.29 | | | | (0.12 | ) | | | (0.22 | ) | | | 1.01 | | | | 1.34 | | | | 1.86 | |
| | | | |
Distributions:2 | | | | | | | | | | | | | | | | | | | | | | | | |
From net investment income | | | (0.20 | ) | | | (0.47 | ) | | | (0.30 | ) | | | (0.16 | ) | | | (0.17 | ) | | | (0.23 | ) |
From net realized gain | | | — | | | | (0.19 | ) | | | (0.80 | ) | | | (1.31 | ) | | | (0.58 | ) | | | (0.31 | ) |
| | | | |
Total distributions | | | (0.20 | ) | | | (0.66 | ) | | | (1.10 | ) | | | (1.47 | ) | | | (0.75 | ) | | | (0.54 | ) |
| | | | |
Net asset value, end of period | | $ | 13.43 | | | $ | 13.34 | | | $ | 14.12 | | | $ | 15.44 | | | $ | 15.90 | | | $ | 15.31 | |
| | | | |
| | | | | | | | | | | | | | | | | | | | | | | | |
| Total Return3 | | | | | | | | | | | | | | | | | | | | | | | | |
Based on net asset value | | | 2.17 | %4 | | | (0.95 | )% | | | (1.58 | )% | | | 6.57 | % | | | 9.06 | % | | | 13.53 | % |
| | | | |
| | | | | | | | | | | | | | | | | | | | | | | | |
| Ratios to Average Net Assets | | | | | | | | | | | | | | | | | | | | | | | | |
Total expenses5 | | | 1.24 | %6,7 | | | 1.24 | %6 | | | 1.21 | %6 | | | 1.21 | %6 | | | 1.24 | %6 | | | 1.27 | % |
| | | | |
Total expenses after fees waived and/or reimbursed and paid indirectly5 | | | 1.17 | %7 | | | 1.17 | % | | | 1.17 | % | | | 1.17 | % | | | 1.17 | % | | | 1.18 | % |
| | | | |
Total expenses after fees waived and/or reimbursed and paid indirectly and excluding interest expense5 | | | 1.17 | %7 | | | 1.17 | % | | | 1.17 | % | | | 1.17 | % | | | 1.17 | % | | | 1.17 | % |
| | | | |
Net investment income (loss)5 | | | 0.15 | %7 | | | 0.17 | % | | | 0.05 | % | | | (0.04 | )% | | | 0.95 | % | | | 1.30 | % |
| | | | |
| | | | | | | | | | | | | | | | | | | | | | | | |
| Supplemental Data | | | | | | | | | | | | | | | | | | | | | | | | |
Net assets, end of period (000) | | $ | 1,702 | | | $ | 1,667 | | | $ | 1,703 | | | $ | 1,703 | | | $ | 1,774 | | | $ | 1,915 | |
| | | | |
Portfolio turnover rate | | | 129 | % | | | 359 | %8 | | | 295 | %8 | | | 181 | %8 | | | 192 | %8 | | | 324 | %8 |
| | | | |
| | 1 | | Based on average shares outstanding. |
| | 2 | | Distributions for annual periods determined in accordance with U.S. federal income tax regulations. |
| | 3 | | Where applicable, assumes the reinvestment of distributions. |
| | 4 | | Aggregate total return. |
| | 5 | | Excludes expenses incurred indirectly as a result of investments in underlying funds as follows: |
| | | | | | | | | | | | | | | | | | | | | | | | |
| | | Six Months
Ended
March 31,
2017 (Unaudited) | | Year Ended September 30, | |
| | | | 2016 | | | 2015 | | | 2014 | | | 2013 | | | 2012 | |
Investments in underlying funds | | 0.01% | | | 0.05 | % | | | 0.08 | % | | | 0.11 | % | | | 0.10 | % | | | 0.05 | % |
| | 6 | | Includes recoupment of past waived and/or reimbursed fees. Excluding the recoupment of past waived and/or reimbursed fees, the ratios were as follows: |
| | | | | | | | | | | | | | | | | | | | | | | | |
| | | Six Months
Ended
March 31, 2017 (Unaudited) | | Year Ended September 30, | |
| | | | 2016 | | | 2015 | | | 2014 | | | 2013 | | | 2012 | |
Expense ratios | | — | | | 1.23 | % | | | 1.17 | % | | | 1.17 | % | | | 1.23 | % | | | — | |
| | 8 | | Includes mortgage dollar roll transactions (“MDRs”). Additional information regarding portfolio turnover rate is as follows: |
| | | | | | | | | | | | | | | | | | | | | | | | |
| | | Six Months
Ended
March 31,
2017 (Unaudited) | | Year Ended September 30, | |
| | | | 2016 | | | 2015 | | | 2014 | | | 2013 | | | 2012 | |
Portfolio turnover rate (excluding MDRs) | | — | | | 359 | % | | | 295 | % | | | 181 | % | | | 192 | % | | | 254 | % |
See Notes to Financial Statements.
| | | | | | |
| 26 | | BLACKROCK TACTICAL OPPORTUNITIES FUND | | MARCH 31, 2017 | | |
| | | | |
| Financial Highlights (continued) | | | | |
| | | | | | | | | | | | | | | | | | | | | | | | |
| | | Investor A | |
| | | Six Months
Ended
March 31, | | | Year Ended September 30, | |
| | | 2017 (Unaudited) | | | 2016 | | | 2015 | | | 2014 | | | 2013 | | | 2012 | |
| | | | | | | | | | | | | | | | | | | | | | | | |
| Per Share Operating Performance | | | | | | | | | | | | | | | | | | | | | | | | |
Net asset value, beginning of period | | $ | 13.33 | | | $ | 14.12 | | | $ | 15.43 | | | $ | 15.89 | | | $ | 15.30 | | | $ | 13.98 | |
| | | | |
Net investment income (loss)1 | | | 0.01 | | | | 0.02 | | | | 0.02 | | | | (0.00 | )2 | | | 0.15 | | | | 0.19 | |
Net realized and unrealized gain (loss) | | | 0.28 | | | | (0.15 | ) | | | (0.22 | ) | | | 1.01 | | | | 1.19 | | | | 1.66 | |
| | | | |
Net increase (decrease) from investment operations | | | 0.29 | | | | (0.13 | ) | | | (0.20 | ) | | | 1.01 | | | | 1.34 | | | | 1.85 | |
| | | | |
Distributions:3 | | | | | | | | | | | | | | | | | | | | | | | | |
From net investment income | | | (0.19 | ) | | | (0.47 | ) | | | (0.31 | ) | | | (0.16 | ) | | | (0.17 | ) | | | (0.22 | ) |
From net realized gain | | | — | | | | (0.19 | ) | | | (0.80 | ) | | | (1.31 | ) | | | (0.58 | ) | | | (0.31 | ) |
| | | | |
Total distributions | | | (0.19 | ) | | | (0.66 | ) | | | (1.11 | ) | | | (1.47 | ) | | | (0.75 | ) | | | (0.53 | ) |
| | | | |
Net asset value, end of period | | $ | 13.43 | | | $ | 13.33 | | | $ | 14.12 | | | $ | 15.43 | | | $ | 15.89 | | | $ | 15.30 | |
| | | | |
| | | | | | | | | | | | | | | | | | | | | | | | |
| Total Return4 | | | | | | | | | | | | | | | | | | | | | | | | |
Based on net asset value | | | 2.17 | %5 | | | (1.02 | )% | | | (1.48 | )% | | | 6.58 | % | | | 9.09 | % | | | 13.51 | % |
| | | | |
| | | | | | | | | | | | | | | | | | | | | | | | |
| Ratios to Average Net Assets | | | | | | | | | | | | | | | | | | | | | | | | |
Total expenses6 | | | 1.23 | %7 | | | 1.21 | % | | | 1.14 | % | | | 1.16 | %8 | | | 1.18 | % | | | 1.23 | % |
| | | | |
Total expenses after fees waived and/or reimbursed and paid indirectly6 | | | 1.22 | %7 | | | 1.18 | % | | | 1.11 | % | | | 1.13 | % | | | 1.14 | % | | | 1.20 | % |
| | | | |
Total expenses after fees waived and/or reimbursed and paid indirectly and excluding interest expense6 | | | 1.22 | %7 | | | 1.18 | % | | | 1.11 | % | | | 1.13 | % | | | 1.14 | % | | | 1.19 | % |
| | | | |
Net investment income (loss)6 | | | 0.09 | %7 | | | 0.15 | % | | | 0.11 | % | | | (0.00 | )% | | | 0.98 | % | | | 1.28 | % |
| | | | |
| | | | | | | | | | | | | | | | | | | | | | | | |
| Supplemental Data | | | | | | | | | | | | | | | | | | | | | | | | |
Net assets, end of period (000) | | $ | 249,950 | | | $ | 271,941 | | | $ | 308,570 | | | $ | 350,131 | | | $ | 374,715 | | | $ | 390,209 | |
| | | | |
Portfolio turnover rate | | | 129 | % | | | 359 | %9 | | | 295 | %9 | | | 181 | %9 | | | 192 | %9 | | | 324 | %9 |
| | | | |
| | 1 | | Based on average shares outstanding. |
| | 2 | | Amount is greater than $(0.005) per share. |
| | 3 | | Distributions for annual periods determined in accordance with U.S. federal income tax regulations. |
| | 4 | | Where applicable, excludes the effects of any sales charges and assumes the reinvestment of distributions. |
| | 5 | | Aggregate total return. |
| | 6 | | Excludes expenses incurred indirectly as a result of investments in underlying funds as follows: |
| | | | | | | | | | | | | | | | | | | | | | | | |
| | | Six Months
Ended March 31, | | Year Ended September 30, | |
| | | 2017 (Unaudited) | | 2016 | | | 2015 | | | 2014 | | | 2013 | | | 2012 | |
Investments in underlying funds | | 0.01% | | | 0.05 | % | | | 0.08 | % | | | 0.11 | % | | | 0.10 | % | | | 0.05 | % |
| | 8 | | Includes recoupment of past waived and/or reimbursed fees. Excluding the recoupment of past waived and/or reimbursed fees, the ratios were as follows: |
| | | | | | | | | | | | | | | | | | | | | | | | |
| | | | |
| | | Six Months
Ended
March 31, 2017 (Unaudited) | | | Year Ended September 30, | |
| | | | 2016 | | | 2015 | | | 2014 | | | 2013 | | | 2012 | |
Expense ratios | | | 1.23 | % | | | — | | | | — | | | | 1.15 | % | | | — | | | | — | |
| | 9 | | Includes mortgage dollar roll transactions (“MDRs”). Additional information regarding portfolio turnover rate is as follows: |
| | | | | | | | | | | | | | | | | | | | | | | | |
| | | Six Months
Ended
March 31, | | Year Ended September 30, | |
| | | 2017 (Unaudited) | | 2016 | | | 2015 | | | 2014 | | | 2013 | | | 2012 | |
Portfolio turnover rate (excluding MDRs) | | — | | | 359 | % | | | 295 | % | | | 181 | % | | | 192 | % | | | 254 | % |
See Notes to Financial Statements.
| | | | | | |
| | | BLACKROCK TACTICAL OPPORTUNITIES FUND | | MARCH 31, 2017 | | 27 |
| | | | |
| Financial Highlights (continued) | | | | |
| | | | | | | | | | | | | | | | | | | | | | | | |
| | | Investor B | |
| | | Six Months
Ended
March 31, | | | Year Ended September 30, | |
| | | 2017 (Unaudited) | | | 2016 | | | 2015 | | | 2014 | | | 2013 | | | 2012 | |
| | | | | | | | | | | | | | | | | | | | | | | | |
| Per Share Operating Performance | | | | | | | | | | | | | | | | | | | | | | | | |
Net asset value, beginning of period | | $ | 13.13 | | | $ | 13.81 | | | $ | 15.12 | | | $ | 15.69 | | | $ | 15.10 | | | $ | 13.83 | |
| | | | |
Net investment income (loss)1 | | | (0.06 | ) | | | (0.12 | ) | | | (0.14 | ) | | | (0.15 | ) | | | 0.01 | | | | 0.06 | |
Net realized and unrealized gain (loss) | | | 0.28 | | | | (0.13 | ) | | | (0.22 | ) | | | 1.00 | | | | 1.16 | | | | 1.65 | |
| | | | |
Net increase (decrease) from investment operations | | | 0.22 | | | | (0.25 | ) | | | (0.36 | ) | | | 0.85 | | | | 1.17 | | | | 1.71 | |
| | | | |
Distributions:2 | | | | | | | | | | | | | | | | | | | | | | | | |
From net investment income | | | — | | | | (0.24 | ) | | | (0.15 | ) | | | (0.11 | ) | | | (0.01 | ) | | | (0.13 | ) |
From net realized gain | | | — | | | | (0.19 | ) | | | (0.80 | ) | | | (1.31 | ) | | | (0.57 | ) | | | (0.31 | ) |
| | | | |
Total distributions | | | — | | | | (0.43 | ) | | | (0.95 | ) | | | (1.42 | ) | | | (0.58 | ) | | | (0.44 | ) |
| | | | |
Net asset value, end of period | | $ | 13.35 | | | $ | 13.13 | | | $ | 13.81 | | | $ | 15.12 | | | $ | 15.69 | | | $ | 15.10 | |
| | | | |
| | | | | | | | | | | | | | | | | | | | | | | | |
| Total Return3 | | | | | | | | | | | | | | | | | | | | | | | | |
Based on net asset value | | | 1.68 | %4 | | | (1.93 | )% | | | (2.54 | )% | | | 5.56 | % | | | 8.04 | % | | | 12.60 | % |
| | | | |
| | | | | | | | | | | | | | | | | | | | | | | | |
| Ratios to Average Net Assets | | | | | | | | | | | | | | | | | | | | | | | | |
Total expenses5 | | | 3.75 | %6 | | | 2.68 | % | | | 2.27 | %7 | | | 2.16 | %7 | | | 2.10 | % | | | 2.08 | % |
| | | | |
Total expenses after fees waived and/or reimbursed and paid indirectly5 | | | 2.14 | %6 | | | 2.14 | % | | | 2.14 | % | | | 2.13 | % | | | 2.06 | % | | | 2.06 | % |
| | | | |
Total expenses after fees waived and/or reimbursed and paid indirectly and excluding interest expense5 | | | 2.14 | %6 | | | 2.14 | % | | | 2.14 | % | | | 2.13 | % | | | 2.06 | % | | | 2.05 | % |
| | | | |
Net investment income (loss)5 | | | (0.87 | %)6 | | | (0.89 | %) | | | (0.95 | )% | | | (0.98 | )% | | | 0.08 | % | | | 0.45 | % |
| | | | |
| | | | | | | | | | | | | | | | | | | | | | | | |
| Supplemental Data | | | | | | | | | | | | | | | | | | | | | | | | |
Net assets, end of period (000) | | $ | 613 | | | $ | 1,360 | | | $ | 3,395 | | | $ | 6,861 | | | $ | 12,730 | | | $ | 19,077 | |
| | | | |
Portfolio turnover rate | | | 129 | % | | | 359 | %8 | | | 295 | %8 | | | 181 | %8 | | | 192 | %8 | | | 324 | %8 |
| | | | |
| | 1 | | Based on average shares outstanding. |
| | 2 | | Distributions for annual periods determined in accordance with U.S. federal income tax regulations. |
| | 3 | | Where applicable, excludes the effects of any sales charges and assumes the reinvestment of distributions. |
| | 4 | | Aggregate total return. |
| | 5 | | Excludes expenses incurred indirectly as a result of investments in underlying funds as follows: |
| | | | | | | | | | | | | | | | | | | | | | | | |
| | | Six Months
Ended March 31, | | Year Ended September 30, | |
| | | 2017 (Unaudited) | | 2016 | | | 2015 | | | 2014 | | | 2013 | | | 2012 | |
Investments in underlying funds | | 0.01% | | | 0.05 | % | | | 0.08 | % | | | 0.11 | % | | | 0.10 | % | | | 0.05 | % |
| | 7 | | Includes recoupment of past waived and/or reimbursed fees. Excluding the recoupment of past waived and/or reimbursed fees, the ratios were as follows: |
| | | | | | | | | | | | | | | | | | | | | | | | |
| | | Six Months
Ended
March 31, 2017 (Unaudited) | | Year Ended September 30, | |
| | | | 2016 | | | 2015 | | | 2014 | | | 2013 | | | 2012 | |
Expense ratios | | — | | | — | | | | 2.26 | % | | | 2.15 | % | | | — | | | | — | |
| | 8 | | Includes mortgage dollar roll transactions (“MDRs”). Additional information regarding portfolio turnover rate is as follows: |
| | | | | | | | | | | | | | | | | | | | | | | | |
| | | Six Months
Ended
March 31, | | Year Ended September 30, | |
| | | 2017 (Unaudited) | | 2016 | | | 2015 | | | 2014 | | | 2013 | | | 2012 | |
Portfolio turnover rate (excluding MDRs) | | — | | | 359 | % | | | 295 | % | | | 181 | % | | | 192 | % | | | 254 | % |
See Notes to Financial Statements.
| | | | | | |
| 28 | | BLACKROCK TACTICAL OPPORTUNITIES FUND | | MARCH 31, 2017 | | |
| | | | |
| Financial Highlights (continued) | | | | |
| | | | | | | | | | | | | | | | | | | | | | | | |
| | | Investor C | |
| | | Six Months
Ended
March 31,
2017 (Unaudited) | | | Year Ended September 30, | |
| | | | 2016 | | | 2015 | | | 2014 | | | 2013 | | | 2012 | |
| | | | | | | | | | | | | | | | | | | | | | | | |
| Per Share Operating Performance | | | | | | | | | | | | | | | | | | | | | | | | |
Net asset value, beginning of period | | $ | 12.95 | | | $ | 13.73 | | | $ | 15.06 | | | $ | 15.60 | | | $ | 15.02 | | | $ | 13.76 | |
| | | | |
Net investment income (loss)1 | | | (0.04 | ) | | | (0.07 | ) | | | (0.08 | ) | | | (0.10 | ) | | | 0.04 | | | | 0.08 | |
Net realized and unrealized gain (loss) | | | 0.27 | | | | (0.15 | ) | | | (0.22 | ) | | | 1.00 | | | | 1.17 | | | | 1.64 | |
| | | | �� |
Net increase (decrease) from investment operations | | | 0.23 | | | | (0.22 | ) | | | (0.30 | ) | | | 0.90 | | | | 1.21 | | | | 1.72 | |
| | | | |
Distributions:2 | | | | | | | | | | | | | | | | | | | | | | | | |
From net investment income | | | (0.08 | ) | | | (0.37 | ) | | | (0.23 | ) | | | (0.13 | ) | | | (0.05 | ) | | | (0.15 | ) |
From net realized gain | | | — | | | | (0.19 | ) | | | (0.80 | ) | | | (1.31 | ) | | | (0.58 | ) | | | (0.31 | ) |
| | | | |
Total distributions | | | (0.08 | ) | | | (0.56 | ) | | | (1.03 | ) | | | (1.44 | ) | | | (0.63 | ) | | | (0.46 | ) |
| | | | |
Net asset value, end of period | | $ | 13.10 | | | $ | 12.95 | | | $ | 13.73 | | | $ | 15.06 | | | $ | 15.60 | | | $ | 15.02 | |
| | | | |
| | | | | | | | | | | | | | | | | | | | | | | | |
| Total Return3 | | | | | | | | | | | | | | | | | | | | | | | | |
Based on net asset value | | | 1.79 | %4 | | | (1.70 | )% | | | (2.20 | )% | | | 5.91 | % | | | 8.29 | % | | | 12.75 | % |
| | | | |
| | | | | | | | | | | | | | | | | | | | | | | | |
| Ratios to Average Net Assets | | | | | | | | | | | | | | | | | | | | | | | | |
Total expenses5 | | | 1.91 | %6 | | | 1.90 | % | | | 1.82 | % | | | 1.84 | %7 | | | 1.88 | % | | | 1.93 | % |
| | | | |
Total expenses after fees waived and/or reimbursed and paid indirectly5 | | | 1.90 | %6 | | | 1.87 | % | | | 1.79 | % | | | 1.81 | % | | | 1.83 | % | | | 1.90 | % |
| | | | |
Total expenses after fees waived and/or reimbursed and paid indirectly and excluding interest expense5 | | | 1.90 | %6 | | | 1.87 | % | | | 1.79 | % | | | 1.81 | % | | | 1.83 | % | | | 1.90 | % |
| | | | |
Net investment income (loss)5 | | | (0.59 | %)6 | | | (0.54 | %) | | | (0.57 | )% | | | (0.68 | )% | | | 0.28 | % | | | 0.58 | % |
| | | | |
| | | | | | | | | | | | | | | | | | | | | | | | |
| Supplemental Data | | | | | | | | | | | | | | | | | | | | | | | | |
Net assets, end of period (000) | | $ | 46,139 | | | $ | 54,050 | | | $ | 65,728 | | | $ | 74,467 | | | $ | 81,850 | | | $ | 86,947 | |
| | | | |
Portfolio turnover rate | | | 129 | % | | | 359 | %8 | | | 295 | %8 | | | 181 | %8 | | | 192 | %8 | | | 324 | %8 |
| | | | |
| | 1 | | Based on average shares outstanding. |
| | 2 | | Distributions for annual periods determined in accordance with U.S. federal income tax regulations. |
| | 3 | | Where applicable, excludes the effects of any sales charges and assumes the reinvestment of distributions. |
| | 4 | | Aggregate total return. |
| | 5 | | Excludes expenses incurred indirectly as a result of investments in underlying funds as follows: |
| | | | | | | | | | | | | | | | | | | | | | | | |
| | | Six Months
Ended
March 31, | | Year Ended September 30, | |
| | | 2017 (Unaudited) | | 2016 | | | 2015 | | | 2014 | | | 2013 | | | 2012 | |
Investments in underlying funds | | 0.01% | | | 0.05 | % | | | 0.08 | % | | | 0.11 | % | | | 0.10 | % | | | 0.05 | % |
| | 7 | | Includes recoupment of past waived and/or reimbursed fees. Excluding the recoupment of past waived and/or reimbursed fees for the year ended September 30, 2014, the ratio would have been 1.83%. |
| | 8 | | Includes mortgage dollar roll transactions (“MDRs”). Additional information regarding portfolio turnover rate is as follows: |
| | | | | | | | | | | | | | | | | | | | | | | | |
| | | Six Months
Ended March 31, | | Year Ended September 30, | |
| | | 2017 (Unaudited) | | 2016 | | | 2015 | | | 2014 | | | 2013 | | | 2012 | |
Portfolio turnover rate (excluding MDRs) | | — | | | 359 | % | | | 295 | % | | | 181 | % | | | 192 | % | | | 254 | % |
See Notes to Financial Statements.
| | | | | | |
| | | BLACKROCK TACTICAL OPPORTUNITIES FUND | | MARCH 31, 2017 | | 29 |
| | | | |
| Financial Highlights (concluded) | | | | |
| | | | | | | | |
| | | Class K | |
| | | Six Months
Ended
March 31,
2017
(Unaudited) | | | Period
August 1, 20161 to
September 30, 2016 | |
| | | | | | | | |
| Per Share Operating Performance | | | | | | | | |
Net asset value, beginning of period | | $ | 13.42 | | | $ | 13.41 | |
| | | | |
Net investment income2 | | | 0.04 | | | | 0.03 | |
Net realized and unrealized gain (loss) | | | 0.27 | | | | (0.02 | ) |
| | | | |
Net increase from investment operations | | | 0.31 | | | | 0.01 | |
| | | | |
Distributions from net investment income | | | (0.26 | ) | | | — | |
| | | | |
Net asset value, end of period | | $ | 13.47 | | | $ | 13.42 | |
| | | | |
| | | | | | | | |
| Total Return3 | | | | | | | | |
Based on net asset value | | | 2.30 | %4 | | | 0.07 | %4 |
| | | | |
| | | | | | | | |
| Ratios to Average Net Assets | | | | | | | | |
Total expenses5,6 | | | 0.78 | %7 | | | 0.78 | % |
| | | | |
Total expenses excluding recoupment of past waived fees5,6 | | | 0.77 | % | | | 0.75 | % |
| | | | |
Total expenses after fees waived and/or reimbursed5,6 | | | 0.77 | % | | | 0.75 | % |
| | | | |
Net investment income5,6 | | | 0.58 | % | | | 1.20 | % |
| | | | |
| | | | | | | | |
| Supplemental Data | | | | | | | | |
Net assets, end of period (000) | | $ | 42,313 | | | $ | 200 | |
| | | | |
Portfolio turnover rate | | | 129 | % | | | 359 | %8,9 |
| | | | |
| | 1 | | Commencement of operations. |
| | 2 | | Based on average shares outstanding. |
| | 3 | | Where applicable, assumes the reinvestment of distributions. |
| | 4 | | Aggregate total return. |
| | 5 | | Excludes expenses incurred indirectly as a result of investments in underlying funds as follows: |
| | | | |
| | | Six Months
Ended
March 31,
2017
(Unaudited) | | Period
August 1, 20161 to
September 30, 2016 |
Investments in underlying funds | | 0.01% | | 0.05% |
| | 7 | | Includes recoupment of past waived fees with no financial impact to the expense ratio. |
| | 8 | | Includes mortgage dollar roll transactions (“MDRs”). Additional information regarding portfolio turnover rate is as follows: |
| | | | |
| | | Six Months
Ended
March 31,
2017
(Unaudited) | | Period August 1, 20161 to
September 30, 2016 |
Portfolio turnover rate (excluding MDRs) | | — | | 359% |
| | 9 | | Portfolio turnover rate is representative of the Fund for the entire year. |
See Notes to Financial Statements.
| | | | | | |
| 30 | | BLACKROCK TACTICAL OPPORTUNITIES FUND | | MARCH 31, 2017 | | |
| | | | |
| Notes to Financial Statements (Unaudited) | | | | |
1. Organization:
BlackRock FundsSM (the “Trust”) is registered under the Investment Company Act of 1940, as amended (the “1940 Act”), as an open-end management investment company. The Trust is organized as a Massachusetts business trust. BlackRock Tactical Opportunities Fund (formally known as BlackRock Managed Volatility Portfolio) (the “Fund”) is a series of the Trust. The Fund is classified as diversified.
The Fund offers multiple classes of shares. All classes of shares have identical voting, dividend, liquidation and other rights and are subject to the same terms and conditions, except that certain classes bear expenses related to the shareholder servicing and distribution of such shares. Institutional, Service and Class K Shares are sold only to certain eligible investors. Investor A and Investor C Shares are generally available through financial intermediaries. Investor B Shares are available only through exchanges and dividend and capital gain reinvestments by existing shareholders, and for purchase by certain employer-sponsored retirement plans. Each class has exclusive voting rights with respect to matters relating to its shareholder servicing and distribution expenditures (except that Investor B shareholders may vote on material changes to the Investor A distribution and service plan).
| | | | | | |
| Share Class | | Initial Sales Charge | | CDSC | | Conversion Privilege |
Institutional, Service and Class K Shares | | No | | No | | None |
Investor A Shares | | Yes | | No1 | | None |
Investor B Shares | | No | | Yes | | To Investor A Shares after approximately 8 years |
Investor C Shares | | No | | Yes | | None |
1 Investor A Shares may be subject to a contingent deferred sales charge (“CDSC”) for certain redemptions where no initial sales charge was paid at the time of purchase.
The Fund, together with certain other registered investment companies advised by BlackRock Advisors, LLC (the “Manager”) or its affiliates, is included in a complex of open-end funds referred to as the Equity-Liquidity Complex.
2. Significant Accounting Policies:
The financial statements are prepared in conformity with accounting principles generally accepted in the United States of America (“U.S. GAAP”), which may require management to make estimates and assumptions that affect the reported amounts of assets and liabilities in the financial statements, disclosure of contingent assets and liabilities at the date of the financial statements and the reported amounts of increases and decreases in net assets from operations during the reporting period. Actual results could differ from those estimates. The Fund is considered an investment company under U.S. GAAP and follows the accounting and reporting guidance applicable to investment companies. Below is a summary of significant accounting policies:
Foreign Currency: The Fund’s books and records are maintained in U.S. dollars. Purchases and sales of investments are recorded at the rates of exchange prevailing on the respective dates of such transactions. Generally, when the U.S. dollar rises in value against a foreign currency, the investments denominated in that currency will lose value; the opposite effect occurs if the U.S. dollar falls in relative value.
The Fund does not isolate the portion of the results of operations arising as a result of changes in the exchange rates from the changes in the market prices of investments held or sold for financial reporting purposes. Accordingly, the effects of changes in exchange rates on investments are not segregated in the Statement of Operations from the effects of changes in market prices of those investments, but are included as a component of net realized and unrealized gain (loss) from investments. The Fund reports realized currency gains (losses) on foreign currency related transactions as components of net realized gain (loss) for financial reporting purposes, whereas such components are generally treated as ordinary income for U.S. federal income tax purposes.
Defensive Positions: Investment policies may vary for temporary defensive purposes during periods in which the investment adviser believes that conditions in the securities markets or other economic, financial or political conditions warrant. Under such conditions, the Fund may invest up to 100% of its total assets in U.S. Government securities, certificates of deposit, repurchase agreements that involve purchases of debt securities, bankers’ acceptances and other bank obligations, commercial paper, money market funds and/or other debt securities, or may hold its assets in cash. The investment adviser applies this defensive posture as applicable and is consistent with the Fund’s investment policies.
Segregation and Collateralization: In cases where the Fund enters into certain investments (e.g., futures contracts, forward foreign currency exchange contracts and swaps) that would be treated as “senior securities” for 1940 Act purposes, the Fund may segregate or designate on its books and records cash or liquid assets having a market value at least equal to the amount of its future obligations under such investments. Doing so allows the investment to be excluded from treatment as a “senior security.” Furthermore, if required by an exchange or counterparty agreement, the Fund may be required to deliver/deposit cash and/or securities to/with an exchange, or broker-dealer or custodian as collateral for certain investments or obligations.
Investment Transactions and Investment Income: For financial reporting purposes, investment transactions are recorded on the dates the transactions are entered into (the trade dates). Realized gains and losses on investment transactions are determined on the identified cost basis. Dividend income is recorded on the ex-dividend date. Dividends from foreign securities where the ex-dividend date may have passed are subsequently recorded when
| | | | | | |
| | | BLACKROCK TACTICAL OPPORTUNITIES FUND | | MARCH 31, 2017 | | 31 |
| | | | |
| Notes to Financial Statements (continued) | | | | |
the Fund is informed of the ex-dividend date. Under the applicable foreign tax laws, a withholding tax at various rates may be imposed on capital gains, dividends and interest. Upon notification from issuers, some of the dividend income received from a real estate investment trust may be redesignated as a reduction of cost of the related investment and/or realized gain. Interest income, including amortization and accretion of premiums and discounts on debt securities, is recognized on the accrual basis. Income, expenses and realized and unrealized gains and losses are allocated daily to each class based on its relative net assets.
Distributions: Distributions paid by the Fund are recorded on the ex-dividend date. The character and timing of distributions are determined in accordance with U.S. federal income tax regulations, which may differ from U.S. GAAP.
Recent Accounting Standards: In April 2015, the Financial Accounting Standards Board issued “Disclosures for Investments in Certain Entities that Calculate Net Asset Value (“NAV”) per Share” which eliminates the requirement to categorize investments within the fair value hierarchy when fair value is based on the NAV per share and no quoted market value is available. As of March 31, 2017, certain investments of the Fund were valued using NAV per share as no quoted market value was available and therefore have been excluded from the fair value hierarchy.
In November 2016, the Financial Accounting Standards Board issued Accounting Standards Update “Restricted Cash” which will require entities to include the total of cash, cash equivalents, restricted cash, and restricted cash equivalents in the beginning and ending cash balances in the Statement of Cash Flows. The guidance will be applied retrospectively and is effective for fiscal years beginning after December 15, 2017, and interim periods within those years. Management is evaluating the impact, if any, of this guidance on the Fund’s presentation in the Statement of Cash Flows.
In March 2017, the Financial Accounting Standards Board issued Accounting Standards Update “Premium Amortization of Purchased Callable Debt Securities” which amends the amortization period for certain purchased callable debt securities. Under the new guidance, premium amortization of purchased callable debt securities that have explicit, non-contingent call features and are callable at fixed prices will be amortized to the earliest call date. The guidance will be on a modified applied retrospective basis and is effective for fiscal years, and their interim periods, beginning after December 15, 2018. Management is currently evaluating the impact of this guidance to the Fund.
Offering Costs: Offering costs are amortized over a 12-month period beginning with the commencement of operations.
Indemnifications: In the normal course of business, the Fund enters into contracts that contain a variety of representations that provide general indemnification. The Fund’s maximum exposure under these arrangements is unknown because it involves future potential claims against the Fund, which cannot be predicted with any certainty.
Other: Expenses directly related to the Fund or its classes are charged to the Fund or the applicable class. Other operating expenses shared by several funds, including other funds managed by the Manager, are prorated among those funds on the basis of relative net assets or other appropriate methods. Expenses directly related to the Fund and other shared expenses prorated to the Fund are allocated daily to each class based on its relative net assets or other appropriate methods.
The Fund has an arrangement with its custodian whereby credits are earned on uninvested cash balances, which could be used to reduce custody fees and/or overdraft charges. The Fund may incur charges on certain uninvested cash balances and overdrafts, subject to certain conditions.
3. Investment Valuation and Fair Value Measurements:
Investment Valuation Policies: The Fund’s investments are valued at fair value (also referred to as “market value” within the financial statements) as of the close of trading on the New York Stock Exchange (“NYSE”) (generally 4:00 p.m., Eastern time). U.S. GAAP defines fair value as the price the Fund would receive to sell an asset or pay to transfer a liability in an orderly transaction between market participants at the measurement date. The Fund determines the fair values of its financial instruments using various independent dealers or pricing services under policies approved by the Board of Trustees of the Trust (the “Board”). The BlackRock Global Valuation Methodologies Committee (the “Global Valuation Committee”) is the committee formed by management to develop global pricing policies and procedures and to oversee the pricing function for all financial instruments.
Fair Value Inputs and Methodologies: The following methods and inputs are used to establish the fair value of the Fund’s assets and liabilities:
| • | | Equity investments traded on a recognized securities exchange are valued at the official closing price each day, if available. For equity investments traded on more than one exchange, the official closing price on the exchange where the stock is primarily traded is used. Equity investments traded on a recognized exchange for which there were no sales on that day may be valued at the last available bid (long positions) or ask (short positions) price. |
| | | | | | |
| 32 | | BLACKROCK TACTICAL OPPORTUNITIES FUND | | MARCH 31, 2017 | | |
| | | | |
| Notes to Financial Statements (continued) | | | | |
| • | | Fixed-income securities for which market quotations are readily available are generally valued using the last available bid prices or current market quotations provided by independent dealers or third party pricing services. Floating rate loan interests are valued at the mean of the bid prices from one or more independent brokers or dealers as obtained from a third party pricing service. Pricing services generally value fixed-income securities assuming orderly transactions of an institutional round lot size, but the Fund may hold or transact in such securities in smaller, odd lot sizes. Odd lots often trade at lower prices than institutional round lots. The pricing services may use matrix pricing or valuation models that utilize certain inputs and assumptions to derive values, including transaction data (e.g., recent representative bids and offers), credit quality information, perceived market movements, news, and other relevant information. Certain fixed-income securities, including asset-backed and mortgage related securities may be valued based on valuation models that consider the estimated cash flows of each tranche of the entity, establish a benchmark yield and develop an estimated tranche specific spread to the benchmark yield based on the unique attributes of the tranche. The amortized cost method of valuation may be used with respect to debt obligations with sixty days or less remaining to maturity unless the Manager determines such method does not represent fair value. |
| • | | Generally, trading in foreign instruments is substantially completed each day at various times prior to the close of trading on the NYSE. Occasionally, events affecting the values of such instruments may occur between the foreign market close and the close of trading on the NYSE that may not be reflected in the computation of the Fund’s net assets. Each business day, the Fund uses a pricing service to assist with the valuation of certain foreign exchange-traded equity securities and foreign exchange-traded over-the-counter (“OTC”) options (the “Systematic Fair Value Price”). Using current market factors, the Systematic Fair Value Price is designed to value such foreign securities and foreign options at fair value as of the close of trading on the NYSE, which follows the close of the local markets. |
| • | | Investments in open-end U.S. mutual funds are valued at NAV each business day. |
| • | | The Fund values its investment in SL Liquidity Series, LLC, Money Market Series (the “Money Market Series”) at fair value, which is ordinarily based upon its pro rata ownership in the underlying fund’s net assets. The Money Market Series seeks current income consistent with maintaining liquidity and preserving capital. Although the Money Market Series is not registered under the 1940 Act, its investments may follow the parameters of investments by a money market fund that is subject to Rule 2a-7 under the 1940 Act. |
| • | | Futures contracts traded on exchanges are valued at their last sale price. |
| • | | Securities and other assets and liabilities denominated in foreign currencies are translated into U.S. dollars using exchange rates determined as of the close of trading on the NYSE. Forward foreign currency exchange contracts are valued at the mean between the bid and ask prices and are determined as of the close of trading on the NYSE. Interpolated values are derived when the settlement date of the contract is an interim date for which quotations are not available. |
| • | | Swap agreements are valued utilizing quotes received daily by the Fund’s pricing service or through brokers, which are derived using daily swap curves and models that incorporate a number of market data factors, such as discounted cash flows, trades and values of the underlying reference instruments. |
If events (e.g., a company announcement, market volatility or a natural disaster) occur that are expected to materially affect the value of such investments, or in the event that the application of these methods of valuation results in a price for an investment that is deemed not to be representative of the market value of such investment, or if a price is not available, the investment will be valued by the Global Valuation Committee, or its delegate, in accordance with a policy approved by the Board as reflecting fair value (“Fair Valued Investments”). The fair valuation approaches that may be used by the Global Valuation Committee will include Market approach, Income approach and Cost approach. Valuation techniques such as discounted cash flow, use of market comparables and matrix pricing are types of valuation approaches and typically used in determining fair value. When determining the price for Fair Valued Investments, the Global Valuation Committee, or its delegate, seeks to determine the price that the Fund might reasonably expect to receive or pay from the current sale or purchase of that asset or liability in an arm’s-length transaction. Fair value determinations shall be based upon all available factors that the Global Valuation Committee, or its delegate, deems relevant and consistent with the principles of fair value measurement.
The Global Valuation Committee, or its delegate, employs various methods for calibrating valuation approaches for investments where an active market does not exist, including regular due diligence of the Fund’s pricing vendors, regular reviews of key inputs and assumptions, transactional back-testing or disposition analysis to compare unrealized gains and losses to realized gains and losses, reviews of missing or stale prices and large movements in market values and reviews of any market related activity. The pricing of all Fair Valued Investments is subsequently reported to the Board or a committee thereof on a quarterly basis. As a result of the inherent uncertainty in valuation of these investments, the fair values may differ from the values that would have been used had an active market existed.
| | | | | | |
| | | BLACKROCK TACTICAL OPPORTUNITIES FUND | | MARCH 31, 2017 | | 33 |
| | | | |
| Notes to Financial Statements (continued) | | | | |
For investments in equity or debt issued by privately-held companies or funds (“Private Company” or collectively, the “Private Companies”) and other Fair Valued Investments, the fair valuation approaches that are used by third party pricing services utilize one or a combination of, but not limited to, the following inputs.
| | | | | | |
| | | | Standard Inputs Generally Considered By Third Party Pricing Services |
| | |
| Market approach | | | (i | ) | | recent market transactions, including subsequent rounds of financing, in the underlying investment or comparable issuers; |
| | | (ii | ) | | recapitalizations and other transactions across the capital structure; and |
| | | | (iii | ) | | market multiples of comparable issuers. |
| | |
| Income approach | | | (i | ) | | future cash flows discounted to present and adjusted as appropriate for liquidity, credit, and/or market risks; |
| | | (ii | ) | | quoted prices for similar investments or assets in active markets; and |
| | | | (iii | ) | | other risk factors, such as interest rates, yield curves, volatilities, prepayment speeds, loss severities, credit risks, recovery rates, liquidation amounts and/or default rates. |
| | |
| Cost approach | | | (i | ) | | audited or unaudited financial statements, investor communications and financial or operational metrics issued by the Private Company; |
| | | (ii | ) | | changes in the valuation of relevant indices or publicly traded companies comparable to the Private Company; |
| | | (iii | ) | | relevant news and other public sources; and |
| | | | (iv | ) | | known secondary market transactions in the Private Company’s interests and merger or acquisition activity in companies comparable to the Private Company. |
Investments in series of preferred stock issued by Private Companies are typically valued utilizing Market approach in determining the enterprise value of the company. Such investments often contain rights and preferences that differ from other series of preferred and common stock of the same issuer. Valuation techniques such as an option pricing model (“OPM”), a probability weighted expected return model (“PWERM”) or a hybrid of those techniques are used in allocating enterprise value of the company, as deemed appropriate under the circumstances. The use of OPM and PWERM techniques involve a determination of the exit scenarios of the investment in order to appropriately allocate the enterprise value of the company among the various parts of its capital structure.
The Private Companies are not subject to the public company disclosure, timing, and reporting standards as other investments held by the Fund. Typically, the most recently available information by a Private Company is as of a date that is earlier than the date the Fund is calculating its NAV. This factor may result in a difference between the value of the investment and the price the Fund could receive upon the sale of the investment.
Fair Value Hierarchy: Various inputs are used in determining the fair value of investments and derivative financial instruments. These inputs to valuation techniques are categorized into a fair value hierarchy consisting of three broad levels for financial statement purposes as follows:
| | • | | Level 1 — unadjusted price quotations in active markets/exchanges for identical assets or liabilities that the Fund has the ability to access |
| | • | | Level 2 — other observable inputs (including, but not limited to, quoted prices for similar assets or liabilities in markets that are active, quoted prices for identical or similar assets or liabilities in markets that are not active, inputs other than quoted prices that are observable for the assets or liabilities (such as interest rates, yield curves, volatilities, prepayment speeds, loss severities, credit risks and default rates) or other market-corroborated inputs) |
| | • | | Level 3 — unobservable inputs based on the best information available in the circumstances, to the extent observable inputs are not available (including the Fund’s own assumptions used in determining the fair value of investments and derivative financial instruments) |
The hierarchy gives the highest priority to unadjusted quoted prices in active markets for identical assets or liabilities (Level 1 measurements) and the lowest priority to unobservable inputs (Level 3 measurements). Accordingly, the degree of judgment exercised in determining fair value is greatest for instruments categorized in Level 3. The inputs used to measure fair value may fall into different levels of the fair value hierarchy. In such cases, for disclosure purposes, the fair value hierarchy classification is determined based on the lowest level input that is significant to the fair value measurement in its entirety. Investments classified within Level 3 have significant unobservable inputs used by the Global Valuation Committee in determining the price for Fair Valued Investments. Level 3 investments include equity or debt issued by Private Companies. There may not be a secondary market, and/or there are a limited number of investors. Level 3 investments may also be adjusted to reflect illiquidity and/or non-transferability, with the amount of such discount estimated by the Global Valuation Committee in the absence of market information.
| | | | | | |
| 34 | | BLACKROCK TACTICAL OPPORTUNITIES FUND | | MARCH 31, 2017 | | |
| | | | |
| Notes to Financial Statements (continued) | | | | |
Changes in valuation techniques may result in transfers into or out of an assigned level within the hierarchy. In accordance with the Fund’s policy, transfers between different levels of the fair value hierarchy are deemed to have occurred as of the beginning of the reporting period. The categorization of a value determined for investments and derivative financial instruments is based on the pricing transparency of the investments and derivative financial instruments and is not necessarily an indication of the risks associated with investing in those securities.
As of March 31, 2017, certain investments of the Fund were valued using NAV per share as no quoted market value is available and therefore have been excluded from the fair value hierarchy.
4. Securities and Other Investments:
Asset-Backed and Mortgage-Backed Securities: Asset-backed securities are generally issued as pass-through certificates or as debt instruments. Asset-backed securities issued as pass-through certificates represent undivided fractional ownership interests in an underlying pool of assets. Asset-backed securities issued as debt instruments, which are also known as collateralized obligations, are typically issued as the debt of a special purpose entity organized solely for the purpose of owning such assets and issuing such debt. Asset-backed securities are often backed by a pool of assets representing the obligations of a number of different parties. The yield characteristics of certain asset-backed securities may differ from traditional debt securities. One such major difference is that all or a principal part of the obligations may be prepaid at any time because the underlying assets (i.e., loans) may be prepaid at any time. As a result, a decrease in interest rates in the market may result in increases in the level of prepayments as borrowers, particularly mortgagors, refinance and repay their loans. An increased prepayment rate with respect to an asset-backed security will have the effect of shortening the maturity of the security. In addition, the Fund may subsequently have to reinvest the proceeds at lower interest rates. If the Fund has purchased such an asset-backed security at a premium, a faster than anticipated prepayment rate could result in a loss of principal to the extent of the premium paid.
For mortgage pass-through securities (the “Mortgage Assets”), there are a number of important differences among the agencies and instrumentalities of the U.S. Government that issue mortgage-related securities and among the securities that they issue. For example, mortgage-related securities guaranteed by Ginnie Mae are guaranteed as to the timely payment of principal and interest by Ginnie Mae and such guarantee is backed by the full faith and credit of the United States. However, mortgage-related securities issued by Freddie Mac and Fannie Mae, including Freddie Mac and Fannie Mae guaranteed mortgage pass-through certificates, which are solely the obligations of Freddie Mac and Fannie Mae, are not backed by or entitled to the full faith and credit of the United States, but are supported by the right of the issuer to borrow from the U.S. Treasury.
Non-agency mortgage-backed securities are securities issued by non-governmental issuers and have no direct or indirect government guarantees of payment and are subject to various risks. Non-agency mortgage loans are obligations of the borrowers thereunder only and are not typically insured or guaranteed by any other person or entity. The ability of a borrower to repay a loan is dependent upon the income or assets of the borrower. A number of factors, including a general economic downturn, acts of God, terrorism, social unrest and civil disturbances, may impair a borrower’s ability to repay its loans.
Collateralized Debt Obligations: Collateralized debt obligations (“CDOs”), including collateralized bond obligations (“CBOs”) and collateralized loan obligations (“CLOs”), are types of asset-backed securities. A CDO is an entity that is backed by a diversified pool of debt securities (CBOs) or syndicated bank loans (CLOs). The cash flows of the CDO can be split into multiple segments, called “tranches,” which will vary in risk profile and yield. The riskiest segment is the subordinated or “equity” tranche. This tranche bears the greatest risk of defaults from the underlying assets in the CDO and serves to protect the other, more senior, tranches from default in all but the most severe circumstances. Since it is shielded from defaults by the more junior tranches, a “senior” tranche will typically have higher credit ratings and lower yields than their underlying securities, and often receive investment grade ratings from one or more of the nationally recognized rating agencies. Despite the protection from the more junior tranches, senior tranches can experience substantial losses due to actual defaults, increased sensitivity to future defaults and the disappearance of one or more protecting tranches as a result of changes in the credit profile of the underlying pool of assets.
Preferred Stocks: Preferred stock has a preference over common stock in liquidation (and generally in receiving dividends as well), but is subordinated to the liabilities of the issuer in all respects. As a general rule, the market value of preferred stock with a fixed dividend rate and no conversion element varies inversely with interest rates and perceived credit risk, while the market price of convertible preferred stock generally also reflects some element of conversion value. Because preferred stock is junior to debt securities and other obligations of the issuer, deterioration in the credit quality of the issuer will cause greater changes in the value of a preferred stock than in a more senior debt security with similar stated yield characteristics. Unlike interest payments on debt securities, preferred stock dividends are payable only if declared by the issuer’s board of directors. Preferred stock also may be subject to optional or mandatory redemption provisions.
Securities Lending: The Fund may lend its securities to approved borrowers, such as brokers, dealers and other financial institutions. The borrower pledges and maintains with the Fund collateral consisting of cash, an irrevocable letter of credit issued by a bank, or securities issued or guaranteed by the U.S. Government. The initial collateral received by the Fund is required to have a value of at least 102% of the current value of the loaned securities for securities traded on U.S. exchanges and a value of at least 105% for all other securities. The collateral is maintained thereafter, at a value equal
| | | | | | |
| | | BLACKROCK TACTICAL OPPORTUNITIES FUND | | MARCH 31, 2017 | | 35 |
| | | | |
| Notes to Financial Statements (continued) | | | | |
to at least 100% of the current market value of the securities on loan. The market value of the loaned securities is determined at the close of each business day of the Fund and any additional required collateral is delivered to the Fund, or excess collateral returned by the Fund, on the next business day. During the term of the loan, the Fund is entitled to all distributions made on or in respect of the loaned securities but does not receive interest income on securities received as collateral. Loans of securities are terminable at any time and the borrower, after notice, is required to return borrowed securities within the standard time period for settlement of securities transactions.
The market value of any securities on loan, all of which were classified as common stocks and rights in the Fund’s Schedule of Investments, and the value of any related collateral are shown separately in the Statement of Assets and Liabilities as a component of investments at value — unaffiliated, and collateral on securities loaned at value, respectively. As of period end, any securities on loan were collateralized by cash and/or U.S. Government obligations. Cash collateral invested by the securities lending agent, BlackRock Investment Management, LLC (“BIM”), if any, is disclosed in the Schedule of Investments.
Securities lending transactions are entered into by the Fund under Master Securities Lending Agreements (each, an “MSLA”) which provide the right, in the event of default (including bankruptcy or insolvency), for the non-defaulting party to liquidate the collateral and calculate a net exposure to the defaulting party or request additional collateral. In the event that a borrower defaults, the Fund, as lender, would offset the market value of the collateral received against the market value of the securities loaned. When the value of the collateral is greater than that of the market value of the securities loaned, the lender is left with a net amount payable to the defaulting party. However, bankruptcy or insolvency laws of a particular jurisdiction may impose restrictions on or prohibitions against such a right of offset in the event of an MSLA counterparty’s bankruptcy or insolvency. Under the MSLA, absent an event of default, the borrower can resell or re-pledge the loaned securities, and the Fund can reinvest cash collateral received in connection with loaned securities. Upon an event of default, the parties’ obligations to return the securities or collateral to the other party are extinguished, and the parties can resell or re-pledge the loaned securities or the collateral received in connection with the loaned securities in order to satisfy the defaulting party’s net payment obligation for all transactions under the MSLA. The defaulting party remains liable for any deficiency.
As of period end, the following table is a summary of the Fund’s securities lending agreements by counterparty which are subject to offset under an MSLA:
| | | | | | | | |
| Counterparty | | | | Securities Loaned at Value1 | | Cash Collateral Received2 | | Net Amount |
BNP Paribas S.A. | | | | — | | — | | — |
Merrill Lynch, Pierce, Fenner & Smith, Inc. | | | | $5,734 | | $(5,734) | | — |
Total | | | | $5,734 | | $(5,734) | | — |
| | 1 | | Securities loaned with a value of $5,734 have been sold and are pending settlement as of March 31, 2017. |
| | 2 | | Cash collateral with a value of $18,575 has been received in connection with securities lending agreements. Collateral received in excess of the value of securities loaned from the individual counterparty is not shown for financial reporting purposes in the table above. |
The risks of securities lending include the risk that the borrower may not provide additional collateral when required or may not return the securities when due. To mitigate these risks, the Fund benefits from a borrower default indemnity provided by BIM. BIM’s indemnity allows for full replacement of the securities loaned if the collateral received does not cover the value on the securities loaned in the event of borrower default. The Fund could incur a loss if the value of an investment purchased with cash collateral falls below the market value of loaned securities or if the value of an investment purchased with cash collateral falls below the value of the original cash collateral received.
5. Derivative Financial Instruments:
The Fund engages in various portfolio investment strategies using derivative contracts both to increase the returns of the Fund and/or to manage its exposure to certain risks such as credit risk, equity risk, interest rate risk, foreign currency exchange rate risk, commodity price risk or other risks (e.g., inflation risk). Derivative financial instruments categorized by risk exposure are included in the Schedule of Investments. These contracts may be transacted on an exchange or OTC.
Futures Contracts: The Fund invests in long and/or short positions in futures and options on futures contracts to gain exposure to, or manage exposure to, changes in interest rates (interest rate risk), changes in the value of equity securities (equity risk) or foreign currencies (foreign currency exchange rate risk).
Futures contracts are agreements between the Fund and a counterparty to buy or sell a specific quantity of an underlying instrument at a specified price and on a specified date. Depending on the terms of a contract, it is settled either through physical delivery of the underlying instrument on the settlement date or by payment of a cash amount on the settlement date. Upon entering into a futures contract, the Fund is required to deposit initial margin with the broker in the form of cash or securities in an amount that varies depending on a contract’s size and risk profile. The initial margin deposit must then be maintained at an established level over the life of the contract.
| | | | | | |
| 36 | | BLACKROCK TACTICAL OPPORTUNITIES FUND | | MARCH 31, 2017 | | |
| | | | |
| Notes to Financial Statements (continued) | | | | |
Securities deposited as initial margin are designated in the Schedule of Investments and cash deposited, if any, is shown as cash pledged for futures contracts in the Statement of Assets and Liabilities. Pursuant to the contract, the Fund agrees to receive from or pay to the broker an amount of cash equal to the daily fluctuation in market value of the contract (“variation margin”). Variation margin is recorded as unrealized appreciation (depreciation) and, if any, shown as variation margin receivable (or payable) on futures contracts in the Statement of Assets and Liabilities. When the contract is closed, a realized gain or loss is recorded in the Statement of Operations equal to the difference between the value of the contract at the time it was opened and the value at the time it was closed. The use of futures contracts involves the risk of an imperfect correlation in the movements in the price of futures contracts and interest, foreign currency exchange rates or underlying assets.
Forward Foreign Currency Exchange Contracts: The Fund enters into forward foreign currency exchange contracts to gain or reduce exposure to foreign currencies (foreign currency exchange rate risk).
A forward foreign currency exchange contract is an agreement between two parties to buy and sell a currency at a set exchange rate on a specified date. These contracts help to manage the overall exposure to the currencies in which some of the investments held by the Fund are denominated and in some cases, may be used to obtain exposure to a particular market.
The contract is marked to market daily and the change in market value is recorded as unrealized appreciation (depreciation) in the Statement of Assets and Liabilities. When a contract is closed, a realized gain or loss is recorded in the Statement of Operations equal to the difference between the value at the time it was opened and the value at the time it was closed. Non-deliverable forward foreign currency exchange contracts are settled with the counterparty in cash without the delivery of foreign currency. The use of forward foreign currency exchange contracts involves the risk that the value of a forward foreign currency exchange contract changes unfavorably due to movements in the value of the referenced foreign currencies.
Swaps: The Fund enters into swap contracts to manage exposure to issuers, markets and securities. Such contracts are agreements between the Fund and a counterparty to make periodic net payments on a specified notional amount or a net payment upon termination. Swap agreements are privately negotiated in the OTC market and may be entered into as a bilateral contract (“OTC swaps”) or centrally cleared (“centrally cleared swaps”).
For OTC swaps, any upfront premiums paid and any upfront fees received are shown as swap premiums paid and swap premiums received, respectively, in the Statement of Assets and Liabilities and amortized over the term of the contract. The daily fluctuation in market value is recorded as unrealized appreciation (depreciation) on OTC Swaps in the Statement of Assets and Liabilities. Payments received or paid are recorded in the Statement of Operations as realized gains or losses, respectively. When an OTC swap is terminated, a realized gain or loss is recorded in the Statement of Operations equal to the difference between the proceeds from (or cost of) the closing transaction and the Fund’s basis in the contract, if any. Generally, the basis of the contract is the premium received or paid.
In a centrally cleared swap, immediately following execution of the swap contract, the swap contract is novated to a central counterparty (the “CCP”) and the Fund’s counterparty on the swap agreement becomes the CCP. The Fund is required to interface with the CCP through the broker. Upon entering into a centrally cleared swap, the Fund is required to deposit initial margin with the broker in the form of cash or securities in an amount that varies depending on the size and risk profile of the particular swap. Securities deposited as initial margin are designated in the Schedule of Investments and cash deposited is shown as cash pledged for centrally cleared swaps in the Statement of Assets and Liabilities. Pursuant to the contract, the Fund agrees to receive from or pay to the broker an amount of cash equal to the daily fluctuation in market value of the contract (“variation margin”). Variation margin is recorded as unrealized appreciation (depreciation) and shown as variation margin receivable (or payable) on centrally cleared swaps in the Statement of Assets and Liabilities. Payments received from (paid to) the counterparty, including at termination, are recorded as realized gains (losses) in the Statement of Operations.
| • | | Interest rate swaps — The Fund enters into interest rate swaps to gain or reduce exposure to interest rates or to manage duration, the yield curve or interest rate (interest rate risk). |
Interest rate swaps are agreements in which one party pays a stream of interest payments, either fixed or floating, in exchange for another party’s stream of interest payments, either fixed or floating, on the same notional amount for a specified period of time. In more complex interest rate swaps, the notional principal amount may decline (or amortize) over time.
| • | | Forward swaps — The Fund enters into forward interest rate swaps and forward total return swaps. In a forward swap, the Fund and the counterparty agree to make periodic net payments beginning on a specified date or a net payment at termination. |
Swap transactions involve, to varying degrees, elements of interest rate, credit and market risk in excess of the amounts recognized in the Statement of Assets and Liabilities. Such risks involve the possibility that there will be no liquid market for these agreements, that the counterparty to the agreements may default on its obligation to perform or disagree as to the meaning of the contractual terms in the agreements, and that there may be unfavorable changes in interest rates and/or market values associated with these transactions.
| | | | | | |
| | | BLACKROCK TACTICAL OPPORTUNITIES FUND | | MARCH 31, 2017 | | 37 |
| | | | |
| Notes to Financial Statements (continued) | | | | |
Master Netting Arrangements: In order to define its contractual rights and to secure rights that will help it mitigate its counterparty risk, the Fund may enter into an International Swaps and Derivatives Association, Inc. Master Agreement (“ISDA Master Agreement”) or similar agreement with its counterparties. An ISDA Master Agreement is a bilateral agreement between the Fund and a counterparty that governs certain OTC derivatives and typically contains, among other things, collateral posting terms and netting provisions in the event of a default and/or termination event. Under an ISDA Master Agreement, the Fund may, under certain circumstances, offset with the counterparty certain derivative financial instruments’ payables and/or receivables with collateral held and/or posted and create one single net payment. The provisions of the ISDA Master Agreement typically permit a single net payment in the event of default including the bankruptcy or insolvency of the counterparty. Bankruptcy or insolvency laws of a particular jurisdiction may restrict or prohibit the right of offset in bankruptcy, insolvency or other events. In addition, certain ISDA Master Agreements allow counterparties to terminate derivative contracts prior to maturity in the event the Fund’s net assets decline by a stated percentage or the Fund fails to meet the terms of its ISDA Master Agreements. The result would cause the Fund to accelerate payment of any net liability owed to the counterparty.
Collateral Requirements: For derivatives traded under an ISDA Master Agreement, the collateral requirements are typically calculated by netting the mark-to-market amount for each transaction under such agreement and comparing that amount to the value of any collateral currently pledged by the Fund and the counterparty.
Cash collateral that has been pledged to cover obligations of the Fund and cash collateral received from the counterparty, if any, is reported separately on the Statement of Assets and Liabilities as cash pledged as collateral and cash received as collateral, respectively. Non-cash collateral pledged by the Fund, if any, is noted in the Schedule of Investments. Generally, the amount of collateral due from or to a counterparty is subject to a certain minimum transfer amount threshold before a transfer is required, which is determined at the close of business of the Fund. Any additional required collateral is delivered to/pledged by the Fund on the next business day. Typically, the counterparty is not permitted to sell, re-pledge or use cash and non-cash collateral it receives. The Fund generally agrees not to use non-cash collateral that it receives but may, absent default or certain other circumstances defined in the underlying ISDA Master Agreement, be permitted to use cash collateral received. In such cases, interest may be paid pursuant to the collateral arrangement with the counterparty. To the extent amounts due to the Fund from its counterparties are not fully collateralized, it bears the risk of loss from counterparty non-performance. Likewise, to the extent the Fund has delivered collateral to a counterparty and stands ready to perform under the terms of its agreement with such counterparty, it bears the risk of loss from a counterparty in the amount of the value of the collateral in the event the counterparty fails to return such collateral. Based on the terms of agreements, collateral may not be required for all derivative contracts.
For financial reporting purposes, the Fund does not offset derivative assets and derivative liabilities that are subject to netting arrangements, if any, in the Statement of Assets and Liabilities.
6. Investment Advisory Agreement and Other Transactions with Affiliates:
The PNC Financial Services Group, Inc. is the largest stockholder and an affiliate of BlackRock, Inc. (“BlackRock”) for 1940 Act purposes.
Investment Advisory: The Trust, on behalf of the Fund, entered into an Investment Advisory Agreement with the Manager, the Fund’s investment adviser, an indirect, wholly-owned subsidiary of BlackRock, to provide investment advisory services. The Manager is responsible for the management of the Fund’s portfolio and provides the personnel, facilities, equipment and certain other services necessary to the operations of the Fund.
For such services, the Fund pays the Manager a monthly fee at an annual rate equal to the following percentages of the average daily value of the Fund’s net assets:
| | |
| Average Daily Net Assets | | Investment Advisory Fee |
First $1 Billion | | 0.550% |
$1 Billion - $2 Billion | | 0.500% |
$2 Billion - $3 Billion | | 0.475% |
Greater than $3 Billion | | 0.450% |
The Manager entered into a sub-advisory agreement with BlackRock International Limited (“BIL”), BlackRock Asset Management North Asia Limited (“BNA”) and BlackRock (Singapore) Limited (“BRS”), each an affiliate of the Manager. The Manager pays each of BIL, BNA and BRS, for services it provides, a monthly fee that is a percentage of the investment advisory fees paid by the Fund to the Manager.
Service and Distribution Fees: The Trust, on behalf of the Fund, entered into a Distribution Agreement and a Distribution and Service Plan with BlackRock Investments, LLC (“BRIL”), an affiliate of the Manager. Pursuant to the Distribution and Service Plan and in accordance with Rule 12b-1
| | | | | | |
| 38 | | BLACKROCK TACTICAL OPPORTUNITIES FUND | | MARCH 31, 2017 | | |
| | | | |
| Notes to Financial Statements (continued) | | | | |
under the 1940 Act, the Fund pays BRIL ongoing service and distribution fees. The fees are accrued daily and paid monthly at annual rates based upon the average daily net assets of the relevant share class of the Fund as follows:
| | | | | | | | | | | | | | | | | | | | |
| | | Service | | Investor A | | Investor B | | Investor C |
Distribution Fee | | | | — | | | | | — | | | | | 0.75 | % | | | | 0.75 | % |
Service Fee | | | | 0.25 | % | | | | 0.25 | % | | | | 0.25 | % | | | | 0.25 | % |
BRIL and broker-dealers, pursuant to sub-agreements with BRIL, provide shareholder servicing and distribution services to the Fund. The ongoing service and/or distribution fee compensates BRIL and each broker-dealer for providing shareholder servicing and distribution related services to the shareholders.
For the six months ended March 31, 2017, the following table shows the class specific service and distribution fees borne directly by each share class of the Fund:
| | | | | | | | |
| Service | | Investor A | | Investor B | | Investor C | | Total |
$2,124 | | $328,714 | | $ 4,847 | | $252,457 | | $ 588,142 |
Administration: The Trust, on behalf of the Fund, entered into an Administration Agreement with the Manager, an indirect, wholly-owned subsidiary of BlackRock, to provide administrative services. For these services, the Manager receives an administration fee computed daily and payable monthly, based on a percentage of the average daily net assets of the Fund. The administration fee, which is shown as administration in the Statement of Operations, is paid at the annual rates below:
| | |
| Average Daily Net Assets | | Administration Fee |
First $500 Million | | 0.0425% |
$500 Million - $1 Billion | | 0.0400% |
$1 Billion - $2 Billion | | 0.0375% |
$2 Billion - $4 Billion | | 0.0350% |
$4 Billion - $13 Billion | | 0.0325% |
Greater than $13 Billion | | 0.0300% |
In addition, the Manager charges each of the share classes an administration fee, which is shown as administration — class specific in the Statement of Operations, at an annual rate of 0.02% of the average daily net assets of each respective class.
For the six months ended March 31, 2017, the Fund paid the following to the Manager in return for these services, which are included in the administration and administration — class specific in the Statement of Operations:
| | | | | | | | | | | | |
| Institutional | | Service | | Investor A | | Investor B | | Investor C | | Class K | | Total |
$ 23,063 | | $ 170 | | $ 26,297 | | $ 97 | | $ 5,049 | | $ 3,377 | | $ 58,053 |
The Manager may have, at its discretion, voluntarily waived all or any portion of its administration fees for the Fund or a share class, which are included in administration fees waived and administration fees waived — class specific in the Statement of Operations.
Transfer Agent: Pursuant to written agreements, certain financial intermediaries, some of which may be affiliates, provide the Fund with sub-accounting, recordkeeping, sub-transfer agency and other administrative services with respect to sub-accounts they service. For these services, these entities receive an asset-based fee or an annual fee per shareholder account, which will vary depending on share class and/or net assets. For the six months ended March 31, 2017, the Fund paid the following amounts to affiliates of BlackRock in return for these services, which are included in transfer agent — class specific in the Statement of Operations:
| | | | | | |
| Institutional | | Service | | Investor A | | Total |
$ 91,221 | | $ 1,225 | | $ 3,839 | | $ 96,285 |
The Manager maintains a call center that is responsible for providing certain shareholder services to the Fund. Shareholder services include responding to inquiries and processing subscriptions and redemptions based upon instructions from shareholders. For the six months ended March 31, 2017, the Fund reimbursed the Manager the following amounts for costs incurred in running the call center, which are included in transfer agent — class specific in the Statement of Operations:
| | | | | | | | | | |
| Institutional | | Service | | Investor A | | Investor B | | Investor C | | Total |
$ 736 | | $ 63 | | $ 36,156 | | $ 1,477 | | $ 1,696 | | $ 40,128 |
| | | | | | |
| | | BLACKROCK TACTICAL OPPORTUNITIES FUND | | MARCH 31, 2017 | | 39 |
| | | | |
| Notes to Financial Statements (continued) | | | | |
For the six months ended March 31, 2017, the following table shows the class specific transfer agent fees borne directly by each class of the Fund:
| | | | | | | | | | |
| Institutional | | Service | | Investor A | | Investor B | | Investor C | | Total |
$ 169,983 | | $ 1,785 | | $ 257,891 | | $ 9,525 | | $ 32,045 | | $ 471,229 |
Other Fees: For the six months ended March 31, 2017, affiliates earned underwriting discounts, direct commissions and dealer concessions on sales of the Fund’s Investor A Shares of $2,032.
For the six months ended March 31, 2017, affiliates received CDSCs as follows:
| | | | |
| Investor A | | Investor C | | Total |
$ 27 | | $ 882 | | $ 909 |
Expense Limitations, Waivers, Reimbursements and Recoupments: The Manager contractually agreed to waive and/or reimburse fees or expenses in order to limit expenses, excluding interest expense, dividend expense, tax expense, acquired fund fees and expenses, and certain other fund expenses, which constitute extraordinary expenses not incurred in the ordinary course of the Fund’s business (“expense limitations”). The expense limitations as a percentage of average daily net assets are as follows:
| | | | | | | | | | |
| Institutional | | Service | | Investor A | | Investor B | | Investor C | | Class K |
0.89% | | 1.17% | | 1.37% | | 2.14% | | 2.14% | | 0.84% |
The Manager has agreed not to reduce or discontinue this contractual expense limitation through February 1, 2018 unless approved by the Board, including a majority of the independent trustees, who are not “interested persons” of the Trust as defined in the 1940 Act (“Independent Trustees”), or by a vote of a majority of the outstanding voting securities of the Fund. For the six months ended March 31, 2017, the Manager waived $5,375 of investment advisory fees, which is included in fees waived by Manager in the Statement of Operations.
These amounts waived and/or reimbursed are included in fees waived by the Manager, and shown as administration fees waived — class specific, transfer agent fees waived — class specific, transfer agent fees reimbursed — class specific, respectively, in the Statement of Operations. Class specific expense waivers and /or reimbursements are as follows:
| | | | | | | | | | |
| | | Institutional | | Service | | Investor A | | Investor B | | Total |
Administration Fees Waived | | $22,798 | | $170 | | $447 | | $ 97 | | $23,512 |
Transfer Agent Fees Waived | | $ 609 | | $ 64 | | $306 | | $1,476 | | $ 2,455 |
Transfer Agent Fees Reimbursed | | $11,298 | | $299 | | — | | $6,177 | | $17,774 |
The Manager voluntarily agreed to waive its investment advisory fees by the amount of investment advisory fees the Fund pays to the Manager indirectly through its investment in affiliated money market funds (the “affiliated money market fund waiver”). This amount is included in fees waived by the Manager in the Statement of Operations. The amount of waivers and/or reimbursements of fees and expenses made pursuant to the expense limitation caps, as applicable, will be reduced by the amount of the affiliated money market fund waiver. This amount is included in fees waived by the Manager in the Statement of Operations. For the six months ended March 31, 2017, the amount waived was $11,463.
The Manager voluntarily agreed to waive its investment advisory fee with respect to any portion of the Fund’s assets invested in affiliated equity and fixed-income mutual funds and affiliated exchange-traded funds that have a contractual management fee. Effective January 27, 2017, the waiver became contractual through January 31, 2018. This contractual agreement may be terminated upon 90 days’ notice by a majority of the Independent Trustees or by a vote of a majority of the outstanding voting securities of the Fund. This amount is included in fees waived by the Manager in the Statement of Operations.
With respect to the contractual expense caps, if during the Fund’s fiscal year the operating expenses of a share class, that at any time during the prior two fiscal years received a waiver and/or reimbursement from the Manager, are less than the expense cap for that share class, the Manager is entitled to be reimbursed by such share class up to the lesser of the following expenses:
(a) The amount of fees waived and/or expenses reimbursed during those prior two fiscal years under the agreement.
(b) The amount by which the expense cap for that share class exceeds the operating expenses of the share class for the current fiscal year, provided that:
| | • | | The Fund, of which the share class is a part, has more than $50 million in assets for the fiscal year; and |
| | • | | The Manager or an affiliate continues to serve as the Fund’s investment adviser or administrator. |
| | | | | | |
| 40 | | BLACKROCK TACTICAL OPPORTUNITIES FUND | | MARCH 31, 2017 | | |
| | | | |
| Notes to Financial Statements (continued) | | | | |
In the event the expense cap for a share class is changed subsequent to a fiscal year in which the Manager becomes entitled to reimbursement for fees waived and/or reimbursed, the amount available to reimburse the Manager shall be calculated by reference to the expense cap for that share class in effect at the time the Manager became entitled to receive such reimbursement, rather than the subsequently changed expense cap for that share class.
For the six months ended March 31, 2017, the Manager recouped the following fund level and class specific waivers and/or reimbursements previously recorded of $4,016 and $2 for Investor A Shares and Class K Shares, respectively.
On March 31, 2017, the fund level and class specific waivers and/or reimbursements subject to possible future recoupment under the expense limitation agreement are as follows:
| | | | | | | | | | | | | | |
| | | Expires September 30, | | | |
| | | 2018 | | | 2018 | | | 2019 | | | |
Fund Level | | | — | | | $ | 26,209 | | | | — | | | |
Institutional | | | — | | | $ | 60,494 | | | $ | 43,705 | | | |
Service | | $ | 162 | | | $ | 749 | | | $ | 532 | | | |
Investor A | | | — | | | | — | | | $ | 753 | | | |
Investor B | | $ | 5,466 | | | $ | 12,294 | | | $ | 7,750 | | | |
Securities Lending: The U.S. Securities and Exchange Commission has issued an exemptive order which permits BIM, an affiliate of the Manager, to serve as securities lending agent for the Fund, subject to applicable conditions. As securities lending agent, BIM bears all operational costs directly related to securities lending. The Fund is responsible for expenses in connection with the investment of cash collateral received for securities on loan (the “collateral investment expenses”). The cash collateral is invested in a private investment company managed by the Manager or its affiliates. However, BIM has agreed to cap the collateral investment expenses of the private investment company to an annual rate of 0.04%. The investment adviser to the private investment company will not charge any advisory fees with respect to shares purchased by the Fund. If the private investment company’s weekly liquid assets fall below 30% of its total assets, BIM, as managing member of the private investment company, is permitted at any time, if it determines it to be in the best interests of the private investment company, to impose a liquidity fee of up to 2% of the value of units withdrawn or impose a redemption gate that temporarily suspends the right of withdrawal out of the private investment company. In addition, if the private investment company’s weekly liquid assets fall below 10% of its total assets at the end of any business day, the private investment company will impose a liquidity fee in the default amount of 1% of the amount withdrawn, generally effective as of the next business day, unless BIM determines that a higher (not to exceed 2%) or lower fee level or not imposing a liquidity fee is in the best interests of the private investment company. The shares of the private investment company purchased by the Fund would be subject to any such liquidity fee or redemption gate imposed.
Securities lending income is equal to the total of income earned from the reinvestment of cash collateral, net of fees and other payments to and from borrowers of securities, and less the collateral investment expenses. The Fund retains a portion of securities lending income and remits a remaining portion to BIM as compensation for its services as securities lending agent. Pursuant to a securities lending agreement, BIM may lend securities only when the difference between the borrower rebate rate and the risk free rate exceeds a certain level (such securities, the “specials only securities”).
Pursuant to such agreement, the Fund retains 80% of securities lending income. In addition, commencing the business day following the date that the aggregate securities lending income earned across certain funds in the Equity-Liquidity Complex in a calendar year exceeds a specified threshold, the Fund, pursuant to the securities lending agreement, will retain for the remainder of the calendar year securities lending income in an amount equal to 85% of securities lending income.
The share of securities lending income earned by the Fund is shown as securities lending income — affiliated — net in the Statement of Operations. For the six months ended March 31, 2017, the Fund paid BIM $339 for securities lending agent services.
Interfund Lending: In accordance with an exemptive order (the “Order”) from the U.S. Securities and Exchange Commission, the Fund may participate in a joint lending and borrowing facility for temporary purposes (the “Interfund Lending Program”), subject to compliance with the terms and conditions of the Order, and to the extent permitted by the Fund’s investment policies and restrictions. The Fund is currently permitted to borrow under the Interfund Lending Program.
A lending BlackRock fund may lend in aggregate up to 15% of its net assets, but may not lend more than 5% of its net assets to any one borrowing fund through the Interfund Lending Program. A borrowing BlackRock fund may not borrow through the Interfund Lending Program or from any other source more than 33 1/3% of its total assets (or any lower threshold provided for by the fund’s investment restrictions). If a borrowing BlackRock fund’s total outstanding borrowings exceed 10% of its total assets, each of its outstanding interfund loans will be subject to collateralization of at least 102% of the outstanding principal value of the loan. All interfund loans are for temporary or emergency purposes and the interest rate to be charged will be the average of the highest current overnight repurchase agreement rate available to a lending fund and the bank loan rate, as calculated according to a formula established by the Board.
| | | | | | |
| | | BLACKROCK TACTICAL OPPORTUNITIES FUND | | MARCH 31, 2017 | | 41 |
| | | | |
| Notes to Financial Statements (continued) | | | | |
During the period ended March 31, 2017, the Fund did not participate in the Interfund Lending Program.
Officers and Trustees: Certain officers and/or trustees of the Trust are officers and/or directors of BlackRock or its affiliates. The Fund reimburses the Manager for a portion of the compensation paid to the Fund’s Chief Compliance Officer, which is included in Officer and Trustees in the Statement of Operations.
7. Purchases and Sales:
For the six months ended March 31, 2017, purchases and sales of investments, including paydowns and excluding short-term securities were as follows:
| | | | |
| | | Purchases | | Sales |
Non-U.S. Government Securities | | $565,945,010 | | $564,200,899 |
U.S. Government Securities | | $ 25,100,628 | | $ 50,895,301 |
8. Income Tax Information:
It is the Fund’s policy to comply with the requirements of the Internal Revenue Code of 1986, as amended, applicable to regulated investment companies, and to distribute substantially all of its taxable income to its shareholders. Therefore, no U.S. federal income tax provision is required.
The Fund files U.S. federal and various state and local tax returns. No income tax returns are currently under examination. The statute of limitations on the Fund’s U.S. federal tax returns generally remains open for each of the four years ended September 30, 2016. The statutes of limitations on the Fund’s state and local tax returns may remain open for an additional year depending upon the jurisdiction.
Management has analyzed tax laws and regulations and their application to the Fund as of March 31, 2017, inclusive of the open tax return years, and does not believe there are any uncertain tax positions that require recognition of a tax liability in the Fund’s financial statements.
As of period end, gross unrealized appreciation and depreciation based on cost for federal income tax purposes were as follows:
| | | | |
Tax cost | | $ | 447,088,795 | |
| | | | |
Gross unrealized appreciation | | $ | 17,726,081 | |
Gross unrealized depreciation | | | (2,690,654 | ) |
| | | | |
Net unrealized appreciation | | $ | 15,035,427 | |
| | | | |
9. Bank Borrowings:
The Trust, on behalf of the Fund, along with certain other funds managed by the Manager and its affiliates (“Participating Funds”), is a party to a 364-day, $2.1 billion credit agreement with a group of lenders. Under this agreement, the Fund may borrow to fund shareholder redemptions. Excluding commitments designated for certain individual funds, the Participating Funds, including the Fund, can borrow up to an aggregate commitment amount of $1.6 billion at any time outstanding, subject to asset coverage and other limitations as specified in the agreement. The credit agreement has the following terms: a fee of 0.12% per annum on unused commitment amounts and interest at a rate equal to the higher of (a) one-month LIBOR (but, in any event, not less than 0.00%) on the date the loan is made plus 0.80% per annum or (b) the Fed Funds rate (but, in any event, not less than 0.00%) in effect from time to time plus 0.80% per annum on amounts borrowed. The agreement expires in April 2017 unless extended or renewed. Participating Funds paid administration, legal and arrangement fees, which, if applicable, are included in miscellaneous expenses in the Statement of Operations. These fees were allocated among such funds based upon portions of the aggregate commitment available to them and relative net assets of Participating Funds. During the six months ended March 31, 2017, the Fund did not borrow under the credit agreement.
10. Principal Risks:
In the normal course of business, the Fund invests in securities and enters into transactions where risks exist due to fluctuations in the market (market risk) or failure of the issuer of a security to meet all its obligations, including the ability to pay principal and interest when due (issuer credit risk). The value of securities held by the Fund may decline in response to certain events, including those directly involving the issuers of securities owned by the Fund. Changes arising from the general economy, the overall market and local, regional or global political and/or social instability, as well as currency, interest rate and price fluctuations, may also affect the securities’ value.
The Fund may be exposed to prepayment risk, which is the risk that borrowers may exercise their option to prepay principal earlier than scheduled during periods of declining interest rates, which would force the Fund to reinvest in lower yielding securities. The Fund may also be exposed to reinvestment risk, which is the risk that income from the Fund’s portfolio will decline if the Fund invests the proceeds from matured, traded or called fixed-income securities at market interest rates that are below the Fund portfolio’s current earnings rate.
| | | | | | |
| 42 | | BLACKROCK TACTICAL OPPORTUNITIES FUND | | MARCH 31, 2017 | | |
| | | | |
| Notes to Financial Statements (continued) | | | | |
On October 11, 2016, BlackRock implemented certain changes required by amendments to Rule 2a-7 under the 1940 Act, which governs the operations of U.S. money market funds. The Fund may be exposed to additional risks when reinvesting cash collateral in money market funds that do not seek to maintain a stable NAV per share of $1.00 and which may be subject to redemption gates or liquidity fees under certain circumstances.
Valuation Risk: The market values of equities, such as common stocks and preferred securities or equity related investments, such as futures and options, may decline due to general market conditions which are not specifically related to a particular company. They may also decline due to factors which affect a particular industry or industries. The Fund may invest in illiquid investments and may experience difficulty in selling those investments in a timely manner at the price that it believes the investments are worth. Prices may fluctuate widely over short or extended periods in response to company, market or economic news. Markets also tend to move in cycles, with periods of rising and falling prices. This volatility may cause the Fund’s NAV to experience significant increases or decreases over short periods of time. If there is a general decline in the securities and other markets, the NAV of the Fund may lose value, regardless of the individual results of the securities and other instruments in which the Fund invests.
The price the Fund could receive upon the sale of any particular portfolio investment may differ from the Fund’s valuation of the investment, particularly for securities that trade in thin or volatile markets or that are valued using a fair valuation technique or a price provided by an independent pricing service. Changes to significant unobservable inputs and assumptions (i.e., publicly traded company multiples, growth rate, time to exit) due to the lack of observable inputs may significantly impact the resulting fair value and therefore the Fund’s results of operations. As a result, the price received upon the sale of an investment may be less than the value ascribed by the Fund, and the Fund could realize a greater than expected loss or lesser than expected gain upon the sale of the investment. The Fund’s ability to value its investments may also be impacted by technological issues and/or errors by pricing services or other third party service providers.
Counterparty Credit Risk: Similar to issuer credit risk, the Fund may be exposed to counterparty credit risk, or the risk that an entity may fail to or be unable to perform on its commitments related to unsettled or open transactions. The Fund manages counterparty credit risk by entering into transactions only with counterparties that the Manager believes have the financial resources to honor their obligations and by monitoring the financial stability of those counterparties. Financial assets, which potentially expose the Fund to market, issuer and counterparty credit risks, consist principally of financial instruments and receivables due from counterparties. The extent of the Fund’s exposure to market, issuer and counterparty credit risks with respect to these financial assets is approximately their value recorded in the Statement of Assets and Liabilities, less any collateral held by the Fund.
A derivative contract may suffer a mark-to-market loss if the value of the contract decreases due to an unfavorable change in the market rates or values of the underlying instrument. Losses can also occur if the counterparty does not perform under the contract.
The Fund’s risk of loss from counterparty credit risk on OTC derivatives is generally limited to the aggregate unrealized gain less the value of any collateral held by the Fund.
With futures and centrally cleared swaps, there is less counterparty credit risk to the Fund since the exchange or clearinghouse, as counterparty to such instruments, guarantees against a possible default. The clearinghouse stands between the buyer and the seller of the contract; therefore, credit risk is limited to failure of the clearinghouse. While offset rights may exist under applicable law, the Fund does not have a contractual right of offset against a clearing broker or clearinghouse in the event of a default (including the bankruptcy or insolvency). Additionally, credit risk exists in exchange-traded futures and centrally cleared swaps with respect to initial and variation margin that is held in a clearing broker’s customer accounts. While clearing brokers are required to segregate customer margin from their own assets, in the event that a clearing broker becomes insolvent or goes into bankruptcy and at that time there is a shortfall in the aggregate amount of margin held by the clearing broker for all its clients, typically the shortfall would be allocated on a pro rata basis across all the clearing broker’s customers, potentially resulting in losses to the Fund.
Concentration Risk: The Fund invests a significant portion of its assets in fixed income securities and/or uses derivatives tied to the fixed income markets. Changes in market interest rates or economic conditions may affect the value and/or liquidity of such investments. Interest rate risk is the risk that prices of bonds and other fixed income securities will increase as interest rates fall and decrease as interest rates rise. The Fund may be subject to a greater risk of rising interest rates due to the current period of historically low rates.
| | | | | | |
| | | BLACKROCK TACTICAL OPPORTUNITIES FUND | | MARCH 31, 2017 | | 43 |
| | | | |
| Notes to Financial Statements (concluded) | | | | |
11. Capital Share Transactions:
Transactions in capital shares for each class were as follows:
| | | | | | | | | | | | | | | | | | | | |
| | | Six Months Ended
March 31, 2017 | | | | | | Year Ended
September 30, 2016 | |
| | | Shares | | | Amount | | | | | | Shares | | | Amount | |
Institutional | | | | | | | | | | | | | | | | | | | | |
Shares sold | | | 772,819 | | | $ | 10,504,447 | | | | | | | | 6,574,785 | | | $ | 89,821,957 | |
Shares issued in reinvestment of distributions | | | 219,270 | | | | 2,949,181 | | | | | | | | 756,129 | | | | 10,366,529 | |
Shares redeemed | | | (6,070,504 | ) | | | (82,826,583 | ) | | | | | | | (5,776,564 | ) | | | (78,914,738 | ) |
| | | | | | | | | | | | |
Net increase (decrease) | | | (5,078,415 | ) | | $ | (69,372,955 | ) | | | | | | | 1,554,350 | | | $ | 21,273,748 | |
| | | | | | | | | | | | |
| | | | | | | | | | | | | | | | | | | | |
Service | | | | | | | | | | | | | | | | | | | | |
Shares sold | | | 6,784 | | | $ | 91,994 | | | | | | | | 18,749 | | | $ | 262,862 | |
Shares issued in reinvestment of distributions | | | 1,797 | | | | 24,054 | | | | | | | | 5,934 | | | | 81,064 | |
Shares redeemed | | | (6,785 | ) | | | (91,815 | ) | | | | | | | (20,297 | ) | | | (273,378 | ) |
| | | | | | | | | | | | |
Net increase | | | 1,796 | | | $ | 24,233 | | | | | | | | 4,386 | | | $ | 70,548 | |
| | | | | | | | | | | | |
| | | | | | | | | | | | | | | | | | | | |
Investor A | | | | | | | | | | | | | | | | | | | | |
Shares sold and automatic conversion of shares | | | 237,185 | | | $ | 3,191,408 | | | | | | | | 1,179,094 | | | $ | 16,363,960 | |
Shares issued in reinvestment of distributions | | | 267,828 | | | | 3,588,860 | | | | | | | | 1,025,562 | | | | 13,998,929 | |
Shares redeemed | | | (2,289,910 | ) | | | (30,862,907 | ) | | | | | | | (3,661,982 | ) | | | (49,609,320 | ) |
| | | | | | | | | | | | |
Net decrease | | | (1,784,897 | ) | | $ | (24,082,639 | ) | | | | | | | (1,457,326 | ) | | $ | (19,246,431 | ) |
| | | | | | | | | | | | |
| | | | | | | | | | | | | | | | | | | | |
Investor B | | | | | | | | | | | | | | | | | | | | |
Shares sold | | | 40 | | | $ | 540 | | | | | | | | 1,745 | | | $ | 24,147 | |
Shares issued in reinvestment of distributions | | | — | | | | — | | | | | | | | 6,698 | | | | 90,756 | |
Shares redeemed and automatic conversion of shares | | | (57,774 | ) | | | (770,377 | ) | | | | | | | (150,578 | ) | | | (1,999,485 | ) |
| | | | | | | | | | | | |
Net decrease | | | (57,734 | ) | | $ | (769,837 | ) | | | | | | | (142,135 | ) | | $ | (1,884,582 | ) |
| | | | | | | | | | | | |
| | | | | | | | | | | | | | | | | | | | |
Investor C | | | | | | | | | | | | | | | | | | | | |
Shares sold | | | 108,356 | | | $ | 1,422,607 | | | | | | | | 472,147 | | | $ | 6,363,257 | |
Shares issued in reinvestment of distributions | | | 22,737 | | | | 297,273 | | | | | | | | 188,815 | | | | 2,518,794 | |
Shares redeemed | | | (783,019 | ) | | | (10,273,960 | ) | | | | | | | (1,274,552 | ) | | | (16,828,589 | ) |
| | | | | | | | | | | | |
Net decrease | | | (651,926 | ) | | $ | (8,554,080 | ) | | | | | | | (613,590 | ) | | $ | (7,946,538 | ) |
| | | | | | | | | | | | |
| | | | | | | | | | | | | | | | | | | | |
| | | | | | | | | Period August 1, 20161 to
September 30, 2016 | |
| | | | | | | | | | | | Shares | | | Amount | |
Class K | | | | | | | | | | | | | | | | | | | | |
Shares sold | | | 3,481,812 | | | $ | 47,457,100 | | | | | | | | 14,914 | | | $ | 200,000 | |
Shares issued in reinvestment of distributions | | | 66,676 | | | | 895,456 | | | | | | | | — | | | | — | |
Shares redeemed | | | (422,880 | ) | | | (5,745,403 | ) | | | | | | | — | | | | — | |
| | | | | | | | | | | | |
Net increase | | | 3,125,608 | | | $ | 42,607,153 | | | | | | | | 14,914 | | | $ | 200,000 | |
| | | | | | | | | | | | |
Total Net Decrease | | | (4,445,568 | ) | | $ | (60,148,125 | ) | | | | | | | (639,401 | ) | | $ | (7,533,255 | ) |
| | | | | | | | | | | | |
| | 1 | | Commencement of operations. |
At March 31, 2017, 14,914 Class K Shares of the Fund were owned by BlackRock HoldCo2, Inc., an affiliate of the Fund.
12. Subsequent Events:
Management’s evaluation of the impact of all subsequent events on the Fund’s financial statements was completed through the date the financial statements were issued and the following item(s) were noted:
Effective April 20, 2017, the credit agreement was extended until April 2018 under the same terms.
| | | | | | |
| 44 | | BLACKROCK TACTICAL OPPORTUNITIES FUND | | MARCH 31, 2017 | | |
Rodney D. Johnson, Chair of the Board and Trustee
Susan J. Carter, Trustee
Collette Chilton, Trustee
Neil A. Cotty, Trustee
Cynthia A. Montgomery, Trustee
Joseph P. Platt, Trustee
Robert C. Robb, Jr., Trustee
Mark Stalnecker, Trustee
Kenneth L. Urish, Trustee
Claire A. Walton, Trustee
Frederick W. Winter, Trustee
John M. Perlowski, Trustee, President and Chief Executive Officer
Barbara G. Novick, Trustee
Thomas Callahan, Vice President
Jennifer McGovern, Vice President
Neal J. Andrews, Chief Financial Officer
Jay M. Fife, Treasurer
Charles Park, Chief Compliance Officer
Fernanda Piedra, Anti-Money Laundering Compliance Officer
Benjamin Archibald, Secretary
Effective December 31, 2016, David O. Beim and Dr. Matina S. Horner retired as Trustees of the Trust.
| | | | | | |
| | | | |
Investment Adviser and Administrator BlackRock Advisors, LLC Wilmington, DE 19809 | | Sub-Advisors BlackRock International Limited Edinburgh, EH3 8BL, United Kingdom | | Custodian The Bank of New York Mellon New York, NY 10286 | | Distributor BlackRock Investments, LLC New York, NY 10022 |
| | | | | | |
| | BlackRock Asset Management | | | | |
| Legal Counsel | | North Asia Limited | | Independent Registered Public | | Address of the Trust |
| Sidley Austin LLP | | Hong Kong | | Accounting Firm | | 100 Bellevue Parkway |
| New York, NY 10019 | | | | Deloitte & Touche LLP | | Wilmington, DE 19809 |
| | BlackRock (Singapore) Limited | | Philadelphia, PA 19103 | | |
| Accounting Agent and | | 079912 Singapore | | | | |
| Transfer Agent | | | | | | |
| BNY Mellon Investment | | | | | | |
| Servicing (US) Inc. | | | | | | |
| Wilmington, DE 19809 | | | | | | |
| | | | | | |
| | | BLACKROCK TACTICAL OPPORTUNITIES FUND | | MARCH 31, 2017 | | 45 |
Householding
The Fund will mail only one copy of shareholder documents, including prospectuses, annual and semi-annual reports and proxy statements, to shareholders with multiple accounts at the same address. This practice is commonly called “householding” and is intended to reduce expenses and eliminate duplicate mailings of shareholder documents. Mailings of your shareholder documents may be householded indefinitely unless you instruct us otherwise. If you do not want the mailing of these documents to be combined with those for other members of your household, please call the Fund at (800) 441-7762.
Availability of Quarterly Schedule of Investments
The Fund files its complete schedule of portfolio holdings with the SEC for the first and third quarters of each fiscal year on Form N-Q. The Fund’s Forms N-Q are available on the SEC’s website at http://www.sec.gov and may also be reviewed and copied at the SEC’s Public Reference Room in Washington, D.C. Information on how to access documents on the SEC’s website without charge may be obtained by calling (800) SEC-0330. The Fund’s Forms N-Q may also be obtained upon request and without charge by calling (800) 441-7762.
Availability of Proxy Voting Policies and Procedures
A description of the policies and procedures that the Fund uses to determine how to vote proxies relating to portfolio securities is available upon request and without charge (1) by calling (800) 441-7762; (2) at http://www.blackrock.com; and (3) on the SEC’s website at http://www.sec.gov.
Availability of Proxy Voting Record
Information about how the Fund voted proxies relating to securities held in the Fund’s portfolio during the most recent 12-month period ended June 30 is available upon request and without charge (1) at http://www.blackrock.com or by calling (800) 441-7762 and (2) on the SEC’s website at http://www.sec.gov.
Account Information
Call us at (800) 441-7762 from 8:00 AM to 6:00 PM EST on any business day to get information about your account balances, recent transactions and share prices. You can also reach us on the Web at http://www.blackrock.com/funds.
Automatic Investment Plans
Investor Class shareholders who want to invest regularly can arrange to have $50 or more automatically deducted from their checking or savings account and invested in any of the BlackRock funds.
Systematic Withdrawal Plans
Investor Class shareholders can establish a systematic withdrawal plan and receive periodic payments of $50 or more from their BlackRock funds, as long as their account balance is at least $10,000.
Retirement Plans
Shareholders may make investments in conjunction with Traditional, Rollover, Roth, Coverdell, Simple IRAs, SEP IRAs and 403(b) Plans.
| | | | | | |
| 46 | | BLACKROCK TACTICAL OPPORTUNITIES FUND | | MARCH 31, 2017 | | |
| | | | |
| Additional Information (concluded) | | | | |
|
| BlackRock Privacy Principles |
BlackRock is committed to maintaining the privacy of its current and former fund investors and individual clients (collectively, “Clients”) and to safeguarding their non-public personal information. The following information is provided to help you understand what personal information BlackRock collects, how we protect that information and why in certain cases we share such information with select parties.
If you are located in a jurisdiction where specific laws, rules or regulations require BlackRock to provide you with additional or different privacy-related rights beyond what is set forth below, then BlackRock will comply with those specific laws, rules or regulations.
BlackRock obtains or verifies personal non-public information from and about you from different sources, including the following: (i) information we receive from you or, if applicable, your financial intermediary, on applications, forms or other documents; (ii) information about your transactions with us, our affiliates, or others; (iii) information we receive from a consumer reporting agency; and (iv) from visits to our websites.
BlackRock does not sell or disclose to non-affiliated third parties any non-public personal information about its Clients, except as permitted by law or as is necessary to respond to regulatory requests or to service Client accounts. These non-affiliated third parties are required to protect the confidentiality and security of this information and to use it only for its intended purpose.
We may share information with our affiliates to service your account or to provide you with information about other BlackRock products or services that may be of interest to you. In addition, BlackRock restricts access to non-public personal information about its Clients to those BlackRock employees with a legitimate business need for the information. BlackRock maintains physical, electronic and procedural safeguards that are designed to protect the non-public personal information of its Clients, including procedures relating to the proper storage and disposal of such information.
| | | | | | |
| | | BLACKROCK TACTICAL OPPORTUNITIES FUND | | MARCH 31, 2017 | | 47 |
This report is intended for current holders. It is not authorized for use as an offer of sale or a solicitation of an offer to buy shares of the Fund unless preceded or accompanied by the Fund’s current prospectus. Past performance results shown in this report should not be considered a representation of future performance. Investment returns and principal value of shares will fluctuate so that shares, when redeemed, may be worth more or less than their original cost. Statements and other information herein are as dated and are subject to change.

| | |
| |
TO-3/17-SAR | |  |
| | |
| Item 2 – | | Code of Ethics – Not Applicable to this semi-annual report |
| |
| Item 3 – | | Audit Committee Financial Expert – Not Applicable to this semi-annual report |
| |
| Item 4 – | | Principal Accountant Fees and Services – Not Applicable to this semi-annual report |
| |
| Item 5 – | | Audit Committee of Listed Registrants – Not Applicable |
| |
| Item 6 – | | Investments |
| | (a) The registrant’s Schedule of Investments is included as part of the Report to Stockholders filed under Item 1 of this Form. |
| | (b) Not Applicable due to no such divestments during the semi-annual period covered since the previous Form N-CSR filing. |
| |
| Item 7 – | | Disclosure of Proxy Voting Policies and Procedures for Closed-End Management Investment Companies – Not Applicable |
| |
| Item 8 – | | Portfolio Managers of Closed-End Management Investment Companies – Not Applicable |
| |
| Item 9 – | | Purchases of Equity Securities by Closed-End Management Investment Company and Affiliated Purchasers – Not Applicable |
| |
| Item 10 – | | Submission of Matters to a Vote of Security Holders –There have been no material changes to these procedures. |
| |
| Item 11 – | | Controls and Procedures |
| |
| | (a) – The registrant’s principal executive and principal financial officers, or persons performing similar functions, have concluded that the registrant’s disclosure controls and procedures (as defined in Rule 30a-3(c) under the Investment Company Act of 1940, as amended (the “1940 Act”)) are effective as of a date within 90 days of the filing of this report based on the evaluation of these controls and procedures required by Rule 30a-3(b) under the 1940 Act and Rule 15d-15(b) under the Securities Exchange Act of 1934, as amended. |
| |
| | (b) – There were no changes in the registrant’s internal control over financial reporting (as defined in Rule 30a-3(d) under the 1940 Act) that occurred during the second fiscal quarter of the period covered by this report that have materially affected, or are reasonably likely to materially affect, the registrant’s internal control over financial reporting. |
| |
| Item 12 – | | Exhibits attached hereto |
| |
| | (a)(1) – Code of Ethics – Not Applicable to this semi-annual report |
| |
| | (a)(2) – Certifications – Attached hereto |
| |
| | (a)(3) – Not Applicable |
| |
| | (b) – Certifications – Attached hereto |
2
Pursuant to the requirements of the Securities Exchange Act of 1934 and the Investment Company Act of 1940, the registrant has duly caused this report to be signed on its behalf by the undersigned, thereunto duly authorized.
BlackRock Funds
| | | | |
| By: | | /s/ John M. Perlowski | | |
| | John M. Perlowski | | |
| | Chief Executive Officer (principal executive officer) of |
| | BlackRock Funds | | |
Date: June 2, 2017
Pursuant to the requirements of the Securities Exchange Act of 1934 and the Investment Company Act of 1940, this report has been signed below by the following persons on behalf of the registrant and in the capacities and on the dates indicated.
| | | | |
| By: | | /s/ John M. Perlowski | | |
| | John M. Perlowski | | |
| | Chief Executive Officer (principal executive officer) of |
| | BlackRock Funds | | |
Date: June 2, 2017
| | | | |
| By: | | /s/ Neal J. Andrews | | |
| | Neal J. Andrews | | |
| | Chief Financial Officer (principal financial officer) of |
| | BlackRock Funds | | |
Date: June 2, 2017
3