UNITED STATES
SECURITIES AND EXCHANGE COMMISSION
Washington, D.C. 20549
FORM N-CSR
CERTIFIED SHAREHOLDER REPORT OF REGISTERED MANAGEMENT INVESTMENT
COMPANIES
Investment Company Act file number: 811-05742
Name of Fund: BlackRock Funds
BlackRock Total Emerging Markets Fund
Fund Address: 100 Bellevue Parkway, Wilmington, DE 19809
Name and address of agent for service: John M. Perlowski, Chief Executive Officer, BlackRock Funds, 55 East 52nd
Street, New York, NY 10055
Registrant’s telephone number, including area code: (800) 441-7762
Date of fiscal year end: 10/31/2017
Date of reporting period: 04/30/2017
Item 1 – Report to Stockholders
APRIL 30, 2017
| | | | |
SEMI-ANNUAL REPORT (UNAUDITED) | | | |  |
BlackRock Total Emerging Markets Fund | of BlackRock FundsSM
|
| Not FDIC Insured • May Lose Value • No Bank Guarantee |
Dear Shareholder,
In the 12 months ended April 30, 2017, risk assets, such as stocks and high-yield bonds, delivered strong performance. These markets showed great resilience during a period with big surprises, including the United Kingdom’s vote to leave the European Union and the outcome of the U.S. presidential election, which brought only brief spikes in equity market volatility. However, high-quality assets with more interest rate sensitivity struggled. U.S. Treasuries posted negative returns as rising energy prices, modest wage increases and steady job growth led to expectations of higher inflation and anticipation of interest rate increases by the U.S. Federal Reserve (the “Fed”).
The global reflationary theme — rising nominal growth, wages and inflation — was the dominant driver of asset returns during the period, outweighing significant political upheavals and uncertainty. Reflationary expectations accelerated after the U.S. election and continued into the beginning of 2017, stoked by expectations that the new presidential administration’s policies would provide an extra boost to U.S. growth. More recently, however, growing skepticism about the likelihood of significant near-term U.S. tax reform and infrastructure spending has tempered enthusiasm around the reflation trade. Nonetheless, markets have remained generally positive thus far in 2017 and continue to exhibit low levels of volatility by historical standards. Although political uncertainty persisted, benign credit conditions and expectations for economic growth have kept markets fairly tranquil. The period ended with a global risk asset rally following centrist Emmanuel Macron’s win in the first round of the French presidential election and better-than-expected U.S. and European corporate earnings.
Although economic momentum is gaining traction, the capacity for rapid global growth is restrained by structural factors, including an aging population, low productivity growth and excess savings, as well as cyclical factors, like the Fed moving toward the normalization of monetary policy and the length of the current expansion. Tempered economic growth and high valuations across most assets have set the stage for muted returns going forward.
Equity markets still present opportunities, although the disparity between winners and losers is widening — a dynamic that increases both the risk and return potential of active investing. Fixed income investors are also facing challenges as many sectors are exhibiting higher valuations while rates remain at historically low levels.
In this environment, investors need to think globally, extend their scope across a broad array of asset classes, and be nimble as market conditions change. We encourage you to talk with your financial advisor and visit blackrock.com for further insight about investing in today’s markets.
Sincerely,

Rob Kapito
President, BlackRock Advisors, LLC

Rob Kapito
President, BlackRock Advisors, LLC
| | | | | | | | |
| Total Returns as of April 30, 2017 | |
| | | 6-month | | | 12-month | |
U.S. large cap equities
(S&P 500® Index) | | | 13.32 | % | | | 17.92 | % |
U.S. small cap equities
(Russell 2000® Index) | | | 18.37 | | | | 25.63 | |
International equities
(MSCI Europe, Australasia,
Far East Index) | | | 11.47 | | | | 11.29 | |
Emerging market equities
(MSCI Emerging Markets Index) | | | 8.88 | | | | 19.13 | |
3-month Treasury bills
(BofA Merrill Lynch 3-Month
U.S. Treasury Bill Index) | | | 0.23 | | | | 0.40 | |
U.S. Treasury securities
(BofA Merrill Lynch
10-Year U.S. Treasury
Index) | | | (3.13 | ) | | | (2.68 | ) |
U.S. investment grade bonds
(Bloomberg Barclays U.S.
Aggregate Bond Index) | | | (0.67 | ) | | | 0.83 | |
Tax-exempt municipal
bonds (S&P Municipal
Bond Index) | | | (0.41 | ) | | | 0.57 | |
U.S. high yield bonds
(Bloomberg Barclays U.S. Corporate High Yield 2% Issuer
Capped Index) | | | 5.30 | | | | 13.29 | |
| Past performance is no guarantee of future results. Index performance is shown for illustrative purposes only. You cannot invest directly in an index. | |
| | | | | | |
| | | | | | | |
| 2 | | THIS PAGE NOT PART OF YOUR FUND REPORT | | | | |

| | | | | | |
| | | | | | | |
| | BLACKROCK TOTAL EMERGING MARKETS FUND | | APRIL 30, 2017 | | 3 |
| | |
| Fund Summary as of April 30, 2017 | | |
BlackRock Total Emerging Markets Fund’s (the “Fund”) investment objective is to seek total return.
| | |
| Portfolio Management Commentary | | |
How did the Fund perform?
| • | | For the six-month period ended April 30, 2017, the Fund underperformed its custom blended benchmark, MSCI Emerging Markets Index (60%) (“MSCI EM” or the “equity benchmark”)/JPMorgan Emerging Markets Bond Index Plus (40%) (“EMBI+” or the “fixed income benchmark”). |
What factors influenced performance?
| • | | The Fund’s positioning in its fixed income portfolio detracted from relative performance. The U.S. election results raised expectations for fiscal stimulus, which in turn prompted investors to factor in tighter monetary policy by the Fed. In this environment, the types of higher-quality, hard currency bonds that the Fund favored generally underperformed. At the same time, the Fund was adversely affected by its underweights in higher-yielding countries such as Turkey and Brazil. Positions in developed-market corporate bonds with exposure to the emerging markets also lagged due to the general weakness in the developed fixed income markets. |
| • | | On the equity side, the Fund’s various relative value strategies contributed positively. Overweight positions in Russia and Poland added value, led by investments in the energy companies Lukoil PJSC and Polski Koncern Naftowy Orlen SA. The Fund’s investments in both companies reflected their favorable valuations in relation to their top-line sales. |
| • | | Relative value currency strategies in Turkey, the Philippines and Singapore also contributed, as political risk in these countries moderated. Positions in local currency bonds were a further positive, as the search for yield provided a favorable backdrop for the category in general, and for Mexico, Chile and Colombia in particular. |
| • | | The Fund uses total return swaps (a simple form of derivatives) to gain exposure to certain emerging equity markets. Over the period, the majority of the gains and losses on equities were earned via the use of total return swaps. The Fund also uses forward interest rates swaps to achieve exposure to local currency bonds and local currencies. Since derivatives require less cash to achieve sufficient exposure than investing in the underlying instruments, the Fund also held a significant weighting in cash. The cash position had no material impact on performance, given that the Fund achieved its desired exposure through the use of derivatives. |
Describe recent portfolio activity.
| • | | As the reflationary theme continued to evolve, the investment adviser sought to allocate to market segments where it identified value. Within the equity allocation, the Fund increased its weightings in Brazil and China while reducing its positions in Taiwan and Poland. These changes were motivated by the increasingly attractive relative valuations and favorable political reform prospects in Brazil and China. At the fixed-income level, the Fund continued to invest in local currency bonds to capture the above-average yields in that segment. In the latter half of the period, the Fund increased its weighting in this area by adding to local currency debt in Indonesia. |
Describe portfolio positioning at period end.
| • | | On the equity side, the Fund had overweights in the Brazilian consumer staples and Russian materials sectors, as well as broader overweight positions in China and Turkey. The Fund held a long duration (above-benchmark interest rate sensitivity) through its allocations to local currency bonds and developed market bonds with exposure to the emerging markets. |
The views expressed reflect the opinions of BlackRock as of the date of this report and are subject to change based on changes in market, economic or other conditions. These views are not intended to be a forecast of future events and are no guarantee of future results.
| | | | | | |
| | | | | | | |
| 4 | | BLACKROCK TOTAL EMERGING MARKETS FUND | | APRIL 30, 2017 | | |
| | |
| Total Return Based on a $10,000 Investment | | |
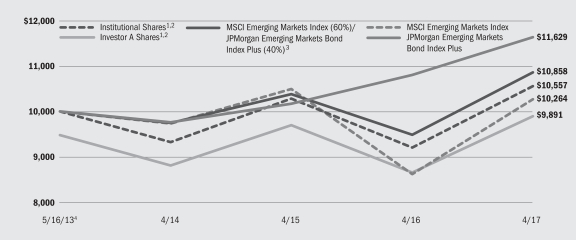
| | 1 | | Assuming maximum sales charges, if any, transaction costs and other operating expenses, including investment advisory fees. Institutional Shares do not have a sales charge. |
| | 2 | | Under normal circumstances, the Fund seeks to invest at least 80% of its net assets plus any borrowings for investment purposes in equity and debt instruments and related derivative instruments issued by, or tied economically to, companies or other issuers located in emerging markets. |
| | 3 | | A customized weighted index comprised of the returns of the MSCI Emerging Markets Index (60%) and the JPMorgan Emerging Markets Bond Index Plus (40%). The MSCI Emerging Markets Index is a free float-adjusted market capitalization index that is designed to measure equity market performance of emerging markets and consists of the following 23 emerging market country indices: Brazil, Chile, China, Colombia, Czech Republic, Egypt, Greece, Hungary, India, Indonesia, Korea, Malaysia, Mexico, Peru, Philippines, Poland, Qatar, Russia, South Africa, Taiwan, Thailand, Turkey and United Arab Emirates. JPMorgan Emerging Markets Bond Index Plus is a market capitalization-weighted index that tracks returns for actively traded external debt instruments in emerging markets. |
| | 4 | | Commencement of operations. |
| | | | | | | | | | | | | | | | | | | | |
| Performance Summary for the Period Ended April 30, 2017 | | | | | | | | | | | | | |
| | | | | | Average Annual Total Returns5 | |
| | | | | | 1 Year | | | Since Inception6 | |
| | | 6-Month
Total Returns | | | w/o sales
charge | | | w/sales
charge | | | w/o sales
charge | | | w/sales
charge | |
Institutional | | | 5.54 | % | | | 14.75 | % | | | N/A | | | | 1.38 | % | | | N/A | |
Investor A | | | 5.36 | | | | 14.35 | | | | 8.34 | % | | | 1.09 | | | | (0.28 | )% |
Investor C | | | 4.92 | | | | 13.54 | | | | 12.54 | | | | 0.36 | | | | 0.36 | |
MSCI Emerging Markets Index (60%)/JPMorgan Emerging Markets Bond Index Plus (40%) | | | 6.28 | | | | 14.50 | | | | N/A | | | | 2.10 | | | | N/A | |
MSCI Emerging Markets Index | | | 8.88 | | | | 19.13 | | | | N/A | | | | 0.66 | | | | N/A | |
JPMorgan Emerging Markets Bond Index Plus | | | 2.43 | | | | 7.70 | | | | N/A | | | | 3.89 | | | | N/A | |
| | 5 | | Assuming maximum sales charges, if any. Average annual total returns with and without sales charges reflect reductions for distribution and service fees. See “About Fund Performance” on page 7 for a detailed description of share classes, including any related sales charges and fees. |
| | 6 | | The Fund commenced operations on May 16, 2013. |
| | | | N/A — Not applicable as share class and index do not have a sales charge. |
| | | | Past performance is not indicative of future results. |
Performance results may include adjustments made for financial reporting purposes in accordance with U.S. generally accepted accounting principles.
| | | | | | | | | | | | | | | | | | | | | | | | | | | | |
| Expense Example | | | | | | | | | | | | | | | | | | | |
| | | Actual | | | Hypothetical8 | | | | |
| | | Beginning
Account Value
November 1, 2016 | | | Ending
Account Value
April 30, 2017 | | | Expenses Paid
During the Period7 | | | Beginning
Account Value
November 1, 2016 | | | Ending
Account Value
April 30, 2017 | | | Expenses Paid
During the Period7 | | | Annualized
Expense Ratio | |
Institutional | | $ | 1,000.00 | | | $ | 1,055.40 | | | $ | 4.33 | | | $ | 1,000.00 | | | $ | 1,020.58 | | | $ | 4.26 | | | | 0.85 | % |
Investor A | | $ | 1,000.00 | | | $ | 1,053.60 | | | $ | 5.60 | | | $ | 1,000.00 | | | $ | 1,019.34 | | | $ | 5.51 | | | | 1.10 | % |
Investor C | | $ | 1,000.00 | | | $ | 1,049.20 | | | $ | 9.40 | | | $ | 1,000.00 | | | $ | 1,015.62 | | | $ | 9.25 | | | | 1.85 | % |
| | 7 | | For each class of the Fund, expenses are equal to the annualized net expense ratio for the class, multiplied by the average account value over the period, multiplied by 181/365 (to reflect the one-half year period shown). |
| | 8 | | Hypothetical 5% annual return before expenses is calculated by prorating the number of days in the most recent fiscal half year divided by 365. |
| | | | See “Disclosure of Expenses” on Page 7 for further information on how expenses were calculated. |
| | | | | | |
| | | | | | | |
| | BLACKROCK TOTAL EMERGING MARKETS FUND | | APRIL 30, 2017 | | 5 |
| | |
| Portfolio Information as of April 30, 2017 | | |
| | | | |
| Portfolio Composition | | Percent of
Total Investments | |
Foreign Government Obligations | | | 47 | % |
Short-Term Securities | | | 43 | |
Foreign Agency Obligations | | | 5 | |
Corporate Bonds | | | 5 | |
| | | | | | | | | | | | |
| | | Percentage of Total investments1 | |
| Geographic Allocation | | Long | | | Short | | | Total | |
China | | | 12 | % | | | — | | | | 12 | % |
Mexico | | | 6 | | | | 1 | % | | | 7 | |
Brazil | | | 7 | | | | — | | | | 7 | |
South Korea | | | 6 | | | | — | | | | 6 | |
Indonesia | | | 6 | | | | — | | | | 6 | |
Hong Kong | | | 6 | | | | — | | | | 6 | |
United States | | | 5 | | | | — | | | | 5 | |
South Africa | | | 5 | | | | — | | | | 5 | |
Turkey | | | 4 | | | | — | | | | 4 | |
Taiwan | | | 4 | | | | — | | | | 4 | |
Lithuania | | | 4 | | | | — | | | | 4 | |
Philippines | | | 4 | | | | — | | | | 4 | |
Hungary | | | 4 | | | | — | | | | 4 | |
Russia | | | 4 | | | | — | | | | 4 | |
Columbia | | | 3 | | | | — | | | | 3 | |
Chile | | | 2 | | | | — | | | | 2 | |
Poland | | | 2 | | | | — | | | | 2 | |
Other2 | | | 15 | | | | — | | | | 15 | |
| | | | | | | | | | | | |
Total | | | 99 | % | | | 1 | % | | | 100 | % |
| | | | | | | | | | | | |
| | 1 | | Total investments include the gross notional values of long and short equity securities of the underlying derivative contracts utilized by the Fund and exclude short-term securities. |
| | 2 | | Includes holdings within countries representing 1% or less of long-term investments. Please refer to the Consolidated Schedule of Investments for such countries. |
|
| Derivative Financial Instruments |
The Fund may invest in various derivative financial instruments. These instruments are used to obtain exposure to a security, commodity, index, market, and/or other asset without owning or taking physical custody of securities, commodities and/or other referenced assets or to manage market, equity, credit, interest rate, foreign currency exchange rate, commodity and/or other risks. Derivative financial instruments may give rise to a form of economic leverage and involve risks, including the imperfect correlation between the value of a derivative financial instrument and the underlying asset, possible default of the counterparty to the
transaction or illiquidity of the instrument. The Fund’s successful use of a derivative financial instrument depends on the investment adviser’s ability to predict pertinent market movements accurately, which cannot be assured. The use of these instruments may result in losses greater than if they had not been used, may limit the amount of appreciation the Fund can realize on an investment and/or may result in lower distributions paid to shareholders. The Fund’s investments in these instruments, if any, are discussed in detail in the Notes to Financial Statements.
| | | | | | |
| | | | | | | |
| 6 | | BLACKROCK TOTAL EMERGING MARKETS FUND | | APRIL 30, 2017 | | |
| • | | Institutional Shares are not subject to any sales charge. These shares bear no ongoing distribution or service fees and are available only to certain eligible investors. |
| • | | Investor A Shares are subject to a maximum initial sales charge (front-end load) of 5.25% and a service fee of 0.25% per year (but no distribution fee). Certain redemptions of these shares may be subject to a contingent deferred sales charge (“CDSC”) where no initial sales charge was paid at the time of purchase. These shares are generally available through financial intermediaries. |
| • | | Investor C Shares are subject to a 1.00% CDSC if redeemed within one year of purchase. In addition, these shares are subject to a distribution fee of 0.75% per year and a service fee of 0.25% per year. These shares are generally available through financial intermediaries. |
Performance information reflects past performance and does not guarantee future results. Current performance may be lower or higher than the performance data quoted. Refer to www.blackrock.com/funds to obtain performance data current to the most recent month end. Performance
results do not reflect the deduction of taxes that a shareholder would pay on fund distributions or the redemption of fund shares. Figures shown in the performance tables on the previous page assume reinvestment of all distributions, if any, at net asset value (“NAV”) on the ex-dividend date. Investment return and principal value of shares will fluctuate so that shares, when redeemed, may be worth more or less than their original cost. Distributions paid to each class of shares will vary because of the different levels of service, distribution and transfer agency fees applicable to each class, which are deducted from the income available to be paid to shareholders.
BlackRock Advisors, LLC (the “Manager”), the Fund’s investment adviser, has contractually agreed to waive and/or reimburse a portion of the Fund’s expenses. Without such waiver and/or reimbursement, the Fund’s performance would have been lower. The Manager is under no obligation to continue waiving and/or reimbursing its fees after the applicable termination date of such agreement. See Note 6 of the Notes to Consolidated Financial Statements for additional information on waivers and/or reimbursements.
Shareholders of the Fund may incur the following charges:
(a) transactional expenses, such as sales charges; and (b) operating expenses, including investment advisory fees, service and distribution fees, including 12b-1 fees, acquired fund fees and expenses, and other fund expenses. The expense example on the previous page (which is based on a hypothetical investment of $1,000 invested on November 1, 2016 and held through April 30, 2017) is intended to assist shareholders both in calculating expenses based on an investment in the Fund and in comparing these expenses with similar costs of investing in other mutual funds.
The expense example provides information about actual account values and actual expenses. In order to estimate the expenses a shareholder paid during the period covered by this report, shareholders can divide their account value by $1,000 and then multiply the result by the number corresponding to their share class under the heading entitled “Expenses Paid During the Period.”
The expense example also provides information about hypothetical account values and hypothetical expenses based on the Fund’s actual expense ratio and an assumed rate of return of 5% per year before expenses. In order to assist shareholders in comparing the ongoing expenses of investing in the Fund and other funds, compare the 5% hypothetical examples with the 5% hypothetical examples that appear in shareholder reports of other funds.
The expenses shown in the expense example are intended to highlight shareholders’ ongoing costs only and do not reflect any transactional expenses, such as sales charges, if any. Therefore, the hypothetical examples are useful in comparing ongoing expenses only, and will not help shareholders determine the relative total expenses of owning different funds. If these transactional expenses were included, shareholder expenses would have been higher.
| | | | | | |
| | | | | | | |
| | BLACKROCK TOTAL EMERGING MARKETS FUND | | APRIL 30, 2017 | | 7 |
| | |
Consolidated Schedule of Investments April 30, 2017 (Unaudited) | | (Percentages shown are based on Net Assets) |
| | | | | | | | | | | | |
| Corporate Bonds | | | | | Par (000) | | | Value | |
| United States — 4.9% | | | | | | | | | |
3M Co., 3.13%, 9/19/46 | | | USD | | | | 400 | | | $ | 352,938 | |
Amazon.com, Inc., 4.80%, 12/05/34 | | | | | | | 100 | | | | 111,939 | |
Apple, Inc.: | | | | | | | | | | | | |
4.50%, 2/23/36 | | | | | | | 100 | | | | 109,734 | |
3.85%, 5/04/43 | | | | | | | 400 | | | | 388,459 | |
3.45%, 2/09/45 | | | | | | | 100 | | | | 91,019 | |
4.38%, 5/13/45 | | | | | | | 200 | | | | 208,697 | |
4.65%, 2/23/46 | | | | | | | 200 | | | | 217,922 | |
3.85%, 8/04/46 | | | | | | | 100 | | | | 96,909 | |
4.25%, 2/09/47 | | | | | | | 100 | | | | 103,148 | |
Bristol-Myers Squibb Co.: | | | | | | | | | | | | |
6.13%, 5/01/38 | | | | | | | 200 | | | | 255,569 | |
4.50%, 3/01/44 | | | | | | | 100 | | | | 107,403 | |
Charming Light Investments Ltd.,
3.75%, 9/03/19 | | | | | | | 200 | | | | 204,130 | |
Cisco Systems, Inc., 5.90%, 2/15/39 | | | | | | | 300 | | | | 386,923 | |
Eli Lilly & Co., 3.70%, 3/01/45 | | | | | | | 300 | | | | 291,062 | |
Estee Lauder Cos., Inc., 4.38%, 6/15/45 | | | | | | | 300 | | | | 313,448 | |
Exxon Mobil Corp.: | | | | | | | | | | | | |
3.57%, 3/06/45 | | | | | | | 150 | | | | 143,347 | |
4.11%, 3/01/46 | | | | | | | 300 | | | | 313,521 | |
General Electric Capital Corp.,
6.15%, 8/07/37 | | | | | | | 100 | | | | 130,524 | |
General Electric Co.: | | | | | | | | | | | | |
5.88%, 1/14/38 | | | | | | | 500 | | | | 638,476 | |
6.88%, 1/10/39 | | | | | | | 340 | | | | 485,059 | |
Goldman Sachs Group, Inc.: | | | | | | | | | | | | |
6.13%, 2/15/33 | | | | | | | 100 | | | | 122,222 | |
6.25%, 2/01/41 | | | | | | | 200 | | | | 252,353 | |
4.80%, 7/08/44 | | | | | | | 100 | | | | 107,350 | |
HSBC Holdings PLC: | | | | | | | | | | | | |
6.50%, 5/02/36 | | | | | | | 150 | | | | 184,499 | |
6.50%, 9/15/37 | | | | | | | 100 | | | | 124,312 | |
6.80%, 6/01/38 | | | | | | | 100 | | | | 128,490 | |
6.10%, 1/14/42 | | | | | | | 300 | | | | 381,257 | |
Intel Corp.: | | | | | | | | | | | | |
4.80%, 10/01/41 | | | | | | | 200 | | | | 222,929 | |
4.25%, 12/15/42 | | | | | | | 100 | | | | 103,630 | |
4.10%, 5/19/46 | | | | | | | 100 | | | | 101,069 | |
International Business Machines Corp.: | | | | | | | | | | | | |
5.88%, 11/29/32 | | | | | | | 50 | | | | 64,277 | |
5.60%, 11/30/39 | | | | | | | 75 | | | | 92,449 | |
4.70%, 2/19/46 | | | | | | | 100 | | | | 110,518 | |
Johnson & Johnson: | | | | | | | | | | | | |
4.38%, 12/05/33 | | | | | | | 300 | | | | 332,960 | |
5.95%, 8/15/37 | | | | | | | 150 | | | | 198,081 | |
4.50%, 9/01/40 | | | | | | | 200 | | | | 221,505 | |
3.70%, 3/01/46 | | | | | | | 100 | | | | 98,933 | |
Merck & Co., Inc.: | | | | | | | | | | | | |
3.60%, 9/15/42 | | | | | | | 100 | | | | 94,389 | |
4.15%, 5/18/43 | | | | | | | 150 | | | | 155,238 | |
| | | | | | | | | | | | |
| Corporate Bonds | | | | | Par (000) | | | Value | |
| United States (continued) | | | | | | | | | |
Merck & Co., Inc. (continued): | | | | | | | | | | | | |
3.70%, 2/10/45 | | | USD | | | | 100 | | | $ | 96,633 | |
Microsoft Corp.: | | | | | | | | | | | | |
3.50%, 2/12/35 | | | | | | | 75 | | | | 73,452 | |
3.45%, 8/08/36 | | | | | | | 100 | | | | 96,121 | |
4.10%, 2/06/37 | | | | | | | 400 | | | | 416,128 | |
4.50%, 10/01/40 | | | | | | | 150 | | | | 164,169 | |
3.50%, 11/15/42 | | | | | | | 100 | | | | 93,993 | |
4.88%, 12/15/43 | | | | | | | 100 | | | | 113,503 | |
4.45%, 11/03/45 | | | | | | | 125 | | | | 133,480 | |
3.70%, 8/08/46 | | | | | | | 400 | | | | 381,406 | |
4.25%, 2/06/47 | | | | | | | 300 | | | | 312,182 | |
Morgan Stanley, 6.38%, 7/24/42 | | | | | | | 400 | | | | 518,083 | |
NIKE, Inc.: | | | | | | | | | | | | |
3.88%, 11/01/45 | | | | | | | 75 | | | | 74,171 | |
3.38%, 11/01/46 | | | | | | | 100 | | | | 89,749 | |
Oracle Corp.: | | | | | | | | | | | | |
3.90%, 5/15/35 | | | | | | | 100 | | | | 100,323 | |
6.50%, 4/15/38 | | | | | | | 200 | | | | 267,175 | |
6.13%, 7/08/39 | | | | | | | 250 | | | | 321,110 | |
5.38%, 7/15/40 | | | | | | | 100 | | | | 118,100 | |
4.13%, 5/15/45 | | | | | | | 500 | | | | 497,804 | |
PepsiCo, Inc.: | | | | | | | | | | | | |
4.00%, 3/05/42 | | | | | | | 100 | | | | 100,644 | |
4.25%, 10/22/44 | | | | | | | 100 | | | | 103,557 | |
4.60%, 7/17/45 | | | | | | | 100 | | | | 108,809 | |
3.45%, 10/06/46 | | | | | | | 100 | | | | 91,047 | |
Pfizer, Inc.: | | | | | | | | | | | | |
7.20%, 3/15/39 | | | | | | | 300 | | | | 430,674 | |
4.40%, 5/15/44 | | | | | | | 125 | | | | 131,227 | |
Procter & Gamble Co.: | | | | | | | | | | | | |
5.50%, 2/01/34 | | | | | | | 300 | | | | 380,996 | |
5.55%, 3/05/37 | | | | | | | 24 | | | | 31,643 | |
Visa, Inc.: | | | | | | | | | | | | |
4.15%, 12/14/35 | | | | | | | 100 | | | | 105,872 | |
4.30%, 12/14/45 | | | | | | | 100 | | | | 107,028 | |
Wal-Mart Stores, Inc.: | | | | | | | | | | | | |
5.25%, 9/01/35 | | | | | | | 300 | | | | 360,003 | |
6.50%, 8/15/37 | | | | | | | 600 | | | | 809,506 | |
5.63%, 4/01/40 | | | | | | | 75 | | | | 93,162 | |
5.00%, 10/25/40 | | | | | | | 100 | | | | 115,607 | |
4.00%, 4/11/43 | | | | | | | 100 | | | | 101,224 | |
| Total Corporate Bonds — 4.9% | | | | | | | | | | | 14,985,269 | |
| | | | | | | | | | | | |
| | | | | | | | | | | | | |
| Foreign Agency Obligations | | | | | | | | | |
| Australia — 0.1% | |
CNOOC Curtis Funding No. 1 Pty Ltd., 4.50%, 10/03/23 | | | | | | | 200 | | | | 212,913 | |
| | | | | | | | | | |
| ADR | | American Depositary Receipts | | IDR | | Indonesian Rupiah | | PHP | | Philippine Peso |
| AUD | | Australian Dollar | | INR | | Indian Rupee | | PLN | | Polish Zloty |
| BRL | | Brazilian Real | | JPY | | Japanese Yen | | RON | | Romanian New Leu |
| CAD | | Canadian Dollar | | KLIBOR | | Kuala Lumpur Interbank Offered Rate | | RUB | | Russian Ruble |
| CHF | | Swiss Franc | | KRW | | South Korean Won | | SEK | | Swedish Krona |
| CLP | | Chilean Peso | | LIBOR | | London Interbank Offered Rate | | SGD | | Singapore Dollar |
| COP | | Columbian Peso | | MXN | | Mexican Peso | | THB | | Thai Baht |
| EUR | | Euro | | MYR | | Malaysian Ringgit | | TRY | | Turkish Lira |
| GBP | | British Pound | | NOK | | Norwegian Krone | | TWD | | Taiwan Dollar |
| GDR | | Global Depository Receipt | | NVDR | | Non-Voting Depository Receipts | | USD | | U.S. Dollar |
| HIBOR | | Hong Kong Interbank Offered Rate | | NZD | | New Zealand Dollar | | WIBOR | | Warsaw InterBank Offered Rate |
| HUF | | Hungarian Forint | | OTC | | Over-the-Counter | | ZAR | | South African Rand |
See Notes to Consolidated Financial Statements.
| | | | | | |
| | | | | | | |
| 8 | | BLACKROCK TOTAL EMERGING MARKETS FUND | | APRIL 30, 2017 | | |
| | |
Consolidated Schedule of Investments (continued) | | |
| | | | | | | | | | | | |
| Foreign Agency Obligations | | | | | Par (000) | | | Value | |
| British Virgin Islands — 1.4% | |
1MDB Global Investments Ltd., 4.40%, 3/09/23 | | | USD | | | | 1,000 | | | $ | 937,502 | |
China Great Wall International Holdings III Ltd., 2.63%, 10/27/21 | | | | | | | 200 | | | | 194,255 | |
Minmetals Bounteous Finance BVI Ltd., 4.75%, 7/30/25 | | | | | | | 200 | | | | 212,058 | |
Sinochem Overseas Capital Co. Ltd.: | | | | | | | | | | | | |
3.25%, 4/29/19 | | | | | | | 200 | | | | 203,055 | |
4.50%, 11/12/20 | | | | | | | 100 | | | | 105,504 | |
Sinopec Group Overseas Development 2012 Ltd.: | | | | | | | | | | | | |
3.90%, 5/17/22 | | | | | | | 200 | | | | 208,374 | |
4.88%, 5/17/42 | | | | | | | 200 | | | | 217,291 | |
Sinopec Group Overseas Development 2013 Ltd., 4.38%, 10/17/23 | | | | | | | 200 | | | | 212,686 | |
Sinopec Group Overseas Development 2014 Ltd., 2.75%, 4/10/19 | | | | | | | 200 | | | | 201,776 | |
Sinopec Group Overseas Development 2015 Ltd., 2.50%, 4/28/20 | | | | | | | 200 | | | | 199,534 | |
Sinopec Group Overseas Development 2016 Ltd.: | | | | | | | | | | | | |
2.13%, 5/03/19 | | | | | | | 200 | | | | 199,220 | |
2.00%, 9/29/21 | | | | | | | 600 | | | | 579,785 | |
3.50%, 5/03/26 | | | | | | | 200 | | | | 197,539 | |
SPIC 2016 US Dollar Bond Co. Ltd., 3.00%, 12/06/21 | | | | | | | 200 | | | | 201,543 | |
State Grid Overseas Investment 2013 Ltd., 3.13%, 5/22/23 | | | | | | | 200 | | | | 201,836 | |
State Grid Overseas Investment 2014 Ltd.: | | | | | | | | | | | | |
2.75%, 5/07/19 | | | | | | | 200 | | | | 202,272 | |
4.13%, 5/07/24 | | | | | | | 200 | | | | 211,684 | |
State Grid Overseas Investment 2016 Ltd., 2.88%, 5/18/26 | | | | | | | 200 | | | | 191,955 | |
| | | | | | | | | | | | |
| | | | | | | | | | | | 4,677,869 | |
| Cayman Islands — 0.4% | | | | | | | | | |
Amber Circle Funding Ltd., 3.25%, 12/04/22 | | | | | | | 200 | | | | 202,743 | |
Avi Funding Co. Ltd., 3.80%, 9/16/25 | | | | | | | 400 | | | | 410,840 | |
Lamar Funding Ltd., 3.96%, 5/07/25 | | | | | | | 400 | | | | 382,000 | |
Three Gorges Finance I Cayman Islands Ltd., 3.70%, 6/10/25 | | | | | | | 200 | | | | 204,204 | |
| | | | | | | | | | | | |
| | | | | | | | | | | | 1,199,787 | |
| Chile — 0.8% | |
Banco del Estado de Chile, 4.13%, 10/07/20 | | | | | | | 100 | | | | 105,757 | |
Corp. Nacional del Cobre de Chile: | | | | | | | | | | | | |
3.00%, 7/17/22 | | | | | | | 400 | | | | 403,069 | |
4.50%, 8/13/23 | | | | | | | 400 | | | | 429,587 | |
4.50%, 9/16/25 | | | | | | | 400 | | | | 421,999 | |
6.15%, 10/24/36 | | | | | | | 400 | | | | 468,260 | |
4.25%, 7/17/42 | | | | | | | 200 | | | | 185,702 | |
5.63%, 10/18/43 | | | | | | | 200 | | | | 223,339 | |
Empresa Nacional del Petroleo, 4.38%, 10/30/24 | | | | | | | 200 | | | | 207,708 | |
| | | | | | | | | | | | |
| | | | | | | | | | | | 2,445,421 | |
| Hungary — 0.1% | | | | | | | | | |
Magyar Export-Import Bank Zrt, 4.00%, 1/30/20 | | | | | | | 200 | | | | 205,184 | |
MFB Magyar Fejlesztesi Bank Zrt, 6.25%, 10/21/20 | | | | | | | 200 | | | | 220,038 | |
| | | | | | | | | | | | |
| | | | | | | | | | | | 425,222 | |
| Indonesia — 0.2% | | | | | | | | | |
Pertamina Persero PT, 6.00%, 5/03/42 | | | | | | | 200 | | | | 212,513 | |
| | | | | | | | | | | | |
| Foreign Agency Obligations | | | | | Par (000) | | | Value | |
| Indonesia (continued) | | | | | | | | | |
Perusahaan Penerbit SBSN Indonesia III, 4.35%, 9/10/24 | | | USD | | | | 400 | | | $ | 416,000 | |
| | | | | | | | | | | | |
| | | | | | | | | | | | 628,513 | |
| Kazakhstan — 0.3% | | | | | | | | | |
Development Bank of Kazakhstan JSC, 4.13%, 12/10/22 | | | | | | | 200 | | | | 198,790 | |
KazMunayGas National Co. JSC: | | | | | | | | | | | | |
7.00%, 5/05/20 | | | | | | | 350 | | | | 384,221 | |
6.38%, 4/09/21 | | | | | | | 200 | | | | 219,557 | |
| | | | | | | | | | | | |
| | | | | | | | | | | | 802,568 | |
| Malaysia — 1.0% | | | | | | | | | |
Malaysia Sovereign Sukuk Bhd, 4.24%, 4/22/45 | | | | | | | 200 | | | | 208,270 | |
Malaysia Sukuk Global Bhd, 3.18%, 4/27/26 | | | | | | | 250 | | | | 249,720 | |
Petroliam Nasional Bhd, 7.63%, 10/15/26 | | | | | | | 300 | | | | 401,882 | |
Petronas Capital Ltd.: | | | | | | | | | | | | |
5.25%, 8/12/19 | | | | | | | 100 | | | | 106,365 | |
3.13%, 3/18/22 | | | | | | | 300 | | | | 303,860 | |
7.88%, 5/22/22 | | | | | | | 350 | | | | 431,073 | |
3.50%, 3/18/25 | | | | | | | 400 | | | | 407,820 | |
4.50%, 3/18/45 | | | | | | | 200 | | | | 210,218 | |
Petronas Global Sukuk Ltd., 2.71%, 3/18/20 | | | | | | | 800 | | | | 805,014 | |
| | | | | | | | | | | | |
| | | | | | | | | | | | 3,124,222 | |
| Mexico — 0.3% | |
Petroleos Mexicanos: | | | | | | | | | | | | |
3.50%, 7/23/20 | | | | | | | 300 | | | | 304,110 | |
6.88%, 8/04/26 | | | | | | | 200 | | | | 223,500 | |
6.75%, 9/21/47 | | | | | | | 300 | | | | 304,890 | |
| | | | | | | | | | | | |
| | | | | | | | | | | | 832,500 | |
| Netherlands — 0.1% | |
Kazakhstan Temir Zholy Finance BV,
6.95%, 7/10/42 | | | | | | | 200 | | | | 210,759 | |
| Panama — 0.1% | |
Aeropuerto Internacional de Tocumen SA,
5.63%, 5/18/36 | | | | | | | 200 | | | | 208,500 | |
| Peru — 0.1% | |
Corp. Financiera de Desarrollo SA,
4.75%, 7/15/25 | | | | | | | 200 | | | | 214,460 | |
| Philippines — 0.1% | |
Power Sector Assets & Liabilities Management Corp.: | | | | | | | | | | | | |
7.25%, 5/27/19 | | | | | | | 200 | | | | 221,520 | |
7.39%, 12/02/24 | | | | | | | 100 | | | | 128,228 | |
| | | | | | | | | | | | |
| | | | | | | | | | | | 349,748 | |
| South Africa — 0.2% | |
Eskom Holdings SOC Ltd.: | | | | | | | | | | | | |
6.75%, 8/06/23 | | | | | | | 200 | | | | 205,540 | |
7.13%, 2/11/25 | | | | | | | 200 | | | | 205,697 | |
Transnet SOC Ltd., 4.00%, 7/26/22 | | | | | | | 200 | | | | 194,616 | |
| | | | | | | | | | | | |
| | | | | | | | | | | | 605,853 | |
| Total Foreign Agency Obligations — 5.2% | | | | | | | | | | | 15,938,335 | |
| | | | | | | | | | | | |
| | | | | | | | | | | | | |
| | | |
| Foreign Government Obligations | | | | | | | | | |
Argentine Republic Government International Bond: | | | | | | | | | | | | |
6.25%, 4/22/19 | | | | | | | 300 | | | | 318,300 | |
6.88%, 4/22/21 | | | | | | | 600 | | | | 656,400 | |
7.50%, 4/22/26 | | | | | | | 750 | | | | 821,625 | |
See Notes to Consolidated Financial Statements.
| | | | | | |
| | | | | | | |
| | BLACKROCK TOTAL EMERGING MARKETS FUND | | APRIL 30, 2017 | | 9 |
| | |
Consolidated Schedule of Investments (continued) | | |
| | | | | | | | | | | | |
| Foreign Government Obligations | | | | | Par (000) | | | Value | |
Argentine Republic Government International Bond (continued): | | | | | | | | | | | | |
6.63%, 7/06/28 | | | USD | | | | 150 | | | $ | 153,450 | |
8.28%, 12/31/33 | | | | | | | 484 | | | | 540,538 | |
7.13%, 7/06/36 | | | | | | | 350 | | | | 354,200 | |
2.50%, 12/31/38 | | | | | | | 700 | | | | 465,500 | |
7.63%, 4/22/46 | | | | | | | 300 | | | | 319,350 | |
Bonos del Banco Central de Chile en UF CPI-Linked, 3.00%, 3/01/22 | | | CLP | | | | 2,230,565 | | | | 3,702,344 | |
Chile Government International Bond: | | | | | | | | | | | | |
3.13%, 3/27/25 | | | USD | | | | 724 | | | | 738,480 | |
3.13%, 1/21/26 | | | | | | | 200 | | | | 204,000 | |
China Development Bank Corp.: | | | | | | | | | | | | |
2.50%, 10/09/20 | | | | | | | 200 | | | | 199,629 | |
2.63%, 1/24/22 | | | | | | | 400 | | | | 398,187 | |
3.00%, 6/01/26 | | | | | | | 200 | | | | 195,254 | |
Colombia Government International Bond: | | | | | | | | | | | | |
7.38%, 3/18/19 | | | | | | | 400 | | | | 440,000 | |
11.75%, 2/25/20 | | | | | | | 300 | | | | 376,050 | |
4.38%, 7/12/21 | | | | | | | 750 | | | | 796,500 | |
2.63%, 3/15/23 | | | | | | | 200 | | | | 193,600 | |
4.00%, 2/26/24 | | | | | | | 1,000 | | | | 1,033,500 | |
8.13%, 5/21/24 | | | | | | | 650 | | | | 827,775 | |
4.50%, 1/28/26 | | | | | | | 600 | | | | 639,000 | |
3.88%, 4/25/27 | | | | | | | 400 | | | | 403,200 | |
7.38%, 9/18/37 | | | | | | | 700 | | | | 900,200 | |
6.13%, 1/18/41 | | | | | | | 900 | | | | 1,035,000 | |
5.63%, 2/26/44 | | | | | | | 1,000 | | | | 1,092,500 | |
5.00%, 6/15/45 | | | | | | | 2,000 | | | | 2,020,000 | |
Export-Import Bank of China: | | | | | | | | | | | | |
2.00%, 4/26/21 | | | | | | | 200 | | | | 195,253 | |
3.63%, 7/31/24 | | | | | | | 200 | | | | 207,365 | |
Export-Import Bank of Malaysia Bhd,
2.48%, 10/20/21 | | | | | | | 200 | | | | 197,175 | |
Hungary Government International Bond: | | | | | | | | | | | | |
4.00%, 3/25/19 | | | | | | | 1,200 | | | | 1,245,000 | |
6.25%, 1/29/20 | | | | | | | 400 | | | | 438,555 | |
6.38%, 3/29/21 | | | | | | | 1,850 | | | | 2,090,500 | |
5.38%, 2/21/23 | | | | | | | 1,200 | | | | 1,331,520 | |
5.75%, 11/22/23 | | | | | | | 2,100 | | | | 2,388,750 | |
5.38%, 3/25/24 | | | | | | | 1,378 | | | | 1,545,979 | |
7.63%, 3/29/41 | | | | | | | 800 | | | | 1,182,192 | |
Indonesia Government International Bond: | | | | | | | | | | | | |
4.88%, 5/05/21 | | | | | | | 2,000 | | | | 2,149,790 | |
3.75%, 4/25/22 | | | | | | | 1,000 | | | | 1,026,533 | |
5.88%, 1/15/24 | | | | | | | 2,000 | | | | 2,279,356 | |
4.75%, 1/08/26 | | | | | | | 2,000 | | | | 2,142,598 | |
7.00%, 5/15/27 | | | IDR | | | | 64,300,000 | | | | 4,809,596 | |
8.50%, 10/12/35 | | | USD | | | | 300 | | | | 429,926 | |
5.25%, 1/17/42 | | | | | | | 2,000 | | | | 2,155,330 | |
6.75%, 1/15/44 | | | | | | | 1,500 | | | | 1,924,849 | |
5.95%, 1/08/46 | | | | | | | 200 | | | | 235,623 | |
Inflation Linked Korea Treasury Bond,
1.13%, 6/10/23 | | | KRW | | | | 3,351,648 | | | | 2,978,613 | |
Kazakhstan Government International Bond: | | | | | | | | | | | | |
3.88%, 10/14/24 | | | USD | | | | 200 | | | | 202,509 | |
5.13%, 7/21/25 | | | | | | | 400 | | | | 436,544 | |
4.88%, 10/14/44 | | | | | | | 400 | | | | 396,349 | |
6.50%, 7/21/45 | | | | | | | 200 | | | | 237,828 | |
Lithuania Government International Bond: | | | | | | | | | | | | |
7.38%, 2/11/20 | | | | | | | 3,550 | | | | 4,039,304 | |
6.13%, 3/09/21 | | | | | | | 4,497 | | | | 5,081,070 | |
6.63%, 2/01/22 | | | | | | | 3,000 | | | | 3,525,840 | |
Mexico Government International Bond: | | | | | | | | | | | | |
5.13%, 1/15/20 | | | | | | | 500 | | | | 541,500 | |
3.50%, 1/21/21 | | | | | | | 250 | | | | 259,750 | |
3.63%, 3/15/22 | | | | | | | 1,300 | | | | 1,340,300 | |
| | | | | | | | | | | | |
| Foreign Government Obligations | | | | | Par (000) | | | Value | |
Mexico Government International Bond (continued): | | | | | | | | | | | | |
4.00%, 10/02/23 | | | USD | | | | 1,950 | | | $ | 2,024,197 | |
3.60%, 1/30/25 | | | | | | | 1,800 | | | | 1,807,200 | |
4.13%, 1/21/26 | | | | | | | 1,000 | | | | 1,036,500 | |
7.50%, 4/08/33 | | | | | | | 200 | | | | 265,500 | |
6.75%, 9/27/34 | | | | | | | 430 | | | | 540,304 | |
6.05%, 1/11/40 | | | | | | | 1,150 | | | | 1,332,275 | |
4.75%, 3/08/44 | | | | | | | 1,660 | | | | 1,637,590 | |
5.55%, 1/21/45 | | | | | | | 850 | | | | 935,000 | |
4.60%, 1/23/46 | | | | | | | 600 | | | | 580,500 | |
5.75%, 10/12/49 | | | | | | | 1,500 | | | | 1,526,250 | |
Mexican Udibonos CPI-Linked,
4.50%, 12/04/25 | | | MXN | | | | 42,203 | | | | 2,456,941 | |
Oman Government International Bond: | | | | | | | | | | | | |
3.63%, 6/15/21 | | | USD | | | | 600 | | | | 607,606 | |
4.75%, 6/15/26 | | | | | | | 800 | | | | 804,337 | |
6.50%, 3/08/47 | | | | | | | 400 | | | | 430,878 | |
Panama Government International Bond: | | | | | | | | | | | | |
5.20%, 1/30/20 | | | | | | | 600 | | | | 648,000 | |
4.00%, 9/22/24 | | | | | | | 200 | | | | 209,800 | |
3.75%, 3/16/25 | | | | | | | 1,000 | | | | 1,030,000 | |
7.13%, 1/29/26 | | | | | | | 950 | | | | 1,206,500 | |
8.88%, 9/30/27 | | | | | | | 400 | | | | 570,000 | |
3.88%, 3/17/28 | | | | | | | 1,000 | | | | 1,031,200 | |
9.38%, 4/01/29 | | | | | | | 380 | | | | 564,300 | |
6.70%, 1/26/36 | | | | | | | 700 | | | | 904,750 | |
4.30%, 4/29/53 | | | | | | | 200 | | | | 197,000 | |
Peruvian Government International Bond: | | | | | | | | | | | | |
7.35%, 7/21/25 | | | | | | | 850 | | | | 1,108,400 | |
4.13%, 8/25/27 | | | | | | | 850 | | | | 922,675 | |
8.75%, 11/21/33 | | | | | | | 430 | | | | 657,900 | |
6.55%, 3/14/37 | | | | | | | 600 | | | | 786,000 | |
5.63%, 11/18/50 | | | | | | | 1,450 | | | | 1,758,125 | |
Philippine Government International Bond: | | | | | | | | | | | | |
8.38%, 6/17/19 | | | | | | | 550 | | | | 626,450 | |
6.50%, 1/20/20 | | | | | | | 300 | | | | 335,449 | |
4.00%, 1/15/21 | | | | | | | 800 | | | | 852,017 | |
4.20%, 1/21/24 | | | | | | | 800 | | | | 871,593 | |
10.63%, 3/16/25 | | | | | | | 200 | | | | 305,699 | |
5.50%, 3/30/26 | | | | | | | 800 | | | | 949,801 | |
9.50%, 2/02/30 | | | | | | | 1,000 | | | | 1,588,063 | |
7.75%, 1/14/31 | | | | | | | 1,225 | | | | 1,750,259 | |
6.38%, 1/15/32 | | | | | | | 400 | | | | 518,365 | |
6.38%, 10/23/34 | | | | | | | 1,060 | | | | 1,413,858 | |
5.00%, 1/13/37 | | | | | | | 600 | | | | 703,111 | |
3.95%, 1/20/40 | | | | | | | 600 | | | | 618,041 | |
3.70%, 3/01/41 | | | | | | | 800 | | | | 796,964 | |
3.70%, 2/02/42 | | | | | | | 400 | | | | 397,627 | |
Poland Government International Bond: | | | | | | | | | | | | |
6.38%, 7/15/19 | | | | | | | 1,077 | | | | 1,180,931 | |
5.13%, 4/21/21 | | | | | | | 1,650 | | | | 1,812,459 | |
5.00%, 3/23/22 | | | | | | | 2,068 | | | | 2,274,076 | |
3.00%, 3/17/23 | | | | | | | 1,250 | | | | 1,251,800 | |
4.00%, 1/22/24 | | | | | | | 1,150 | | | | 1,213,825 | |
3.25%, 4/06/26 | | | | | | | 1,050 | | | | 1,046,535 | |
Republic of South Africa Government International Bond: | | | | | | | | | | | | |
6.88%, 5/27/19 | | | | | | | 520 | | | | 562,921 | |
5.50%, 3/09/20 | | | | | | | 700 | | | | 742,986 | |
5.88%, 5/30/22 | | | | | | | 100 | | | | 108,896 | |
4.67%, 1/17/24 | | | | | | | 640 | | | | 646,812 | |
5.88%, 9/16/25 | | | | | | | 1,200 | | | | 1,296,000 | |
4.88%, 4/14/26 | | | | | | | 800 | | | | 806,486 | |
4.30%, 10/12/28 | | | | | | | 200 | | | | 188,629 | |
6.25%, 3/08/41 | | | | | | | 150 | | | | 165,621 | |
5.38%, 7/24/44 | | | | | | | 400 | | | | 398,920 | |
See Notes to Consolidated Financial Statements.
| | | | | | |
| | | | | | | |
| 10 | | BLACKROCK TOTAL EMERGING MARKETS FUND | | APRIL 30, 2017 | | |
| | |
Consolidated Schedule of Investments (continued) | | |
| | | | | | | | | | | | |
| Foreign Government Obligations | | | | | Par (000) | | | Value | |
Romanian Government International Bond: | | | | | | | | | | | | |
6.75%, 2/07/22 | | | USD | | | | 1,860 | | | $ | 2,157,228 | |
4.38%, 8/22/23 | | | | | | | 1,600 | | | | 1,693,114 | |
4.88%, 1/22/24 | | | | | | | 1,200 | | | | 1,305,523 | |
6.13%, 1/22/44 | | | | | | | 856 | | | | 1,062,065 | |
South Africa Government Bond — CPI Linked,
5.50%, 12/7/23 | | | ZAR | | | | 35,420 | | | | 3,163,325 | |
Turkey Government International Bond: | | | | | | | | | | | | |
7.00%, 3/11/19 | | | USD | | | | 177 | | | | 189,390 | |
7.00%, 6/05/20 | | | | | | | 200 | | | | 220,060 | |
5.13%, 3/25/22 | | | | | | | 200 | | | | 207,117 | |
6.25%, 9/26/22 | | | | | | | 900 | | | | 977,951 | |
3.25%, 3/23/23 | | | | | | | 200 | | | | 187,600 | |
7.38%, 2/05/25 | | | | | | | 400 | | | | 464,044 | |
4.25%, 4/14/26 | | | | | | | 200 | | | | 189,993 | |
4.88%, 10/09/26 | | | | | | | 300 | | | | 297,000 | |
11.88%, 1/15/30 | | | | | | | 300 | | | | 478,330 | |
8.00%, 2/14/34 | | | | | | | 250 | | | | 312,490 | |
6.88%, 3/17/36 | | | | | | | 600 | | | | 679,950 | |
7.25%, 3/05/38 | | | | | | | 200 | | | | 236,670 | |
6.75%, 5/30/40 | | | | | | | 200 | | | | 225,204 | |
6.00%, 1/14/41 | | | | | | | 400 | | | | 414,640 | |
4.88%, 4/16/43 | | | | | | | 200 | | | | 180,750 | |
6.63%, 2/17/45 | | | | | | | 400 | | | | 448,278 | |
Uruguay Government International Bond: | | | | | | | | | | | | |
4.50%, 8/14/24 | | | | | | | 200 | | | | 214,300 | |
4.38%, 10/27/27 | | | | | | | 190 | | | | 199,500 | |
7.88%, 1/15/33 | | | | | | | 200 | | | | 265,180 | |
7.63%, 3/21/36 | | | | | | | 100 | | | | 131,625 | |
4.13%, 11/20/45 | | | | | | | 200 | | | | 179,300 | |
5.10%, 6/18/50 | | | | | | | 600 | | | | 597,000 | |
| | | | | | | | | | | | |
| Foreign Government Obligations | | | | | Par (000) | | | Value | |
Venezuela Government International Bond: | | | | | | | | | | | | |
7.00%, 12/01/18 | | | USD | | | | 400 | | | $ | 281,480 | |
7.75%, 10/13/19 | | | | | | | 830 | | | | 499,411 | |
6.00%, 12/09/20 | | | | | | | 645 | | | | 333,272 | |
12.75%, 8/23/22 | | | | | | | 1,132 | | | | 696,520 | |
9.00%, 5/07/23 | | | | | | | 500 | | | | 248,850 | |
8.25%, 10/13/24 | | | | | | | 755 | | | | 358,700 | |
7.65%, 4/21/25 | | | | | | | 490 | | | | 226,233 | |
11.75%, 10/21/26 | | | | | | | 1,116 | | | | 645,829 | |
9.25%, 9/15/27 | | | | | | | 1,530 | | | | 816,714 | |
9.25%, 5/07/28 | | | | | | | 550 | | | | 262,185 | |
11.95%, 8/05/31 | | | | | | | 1,515 | | | | 874,912 | |
9.38%, 1/13/34 | | | | | | | 350 | | | | 169,855 | |
7.00%, 3/31/38 | | | | | | | 550 | | | | 248,435 | |
| Total Foreign Government Obligations — 46.1% | | | | 141,184,024 | |
Total Long-Term Investments
(Cost — $171,981,875) — 56.2% | | | | | | | | | | | 172,107,628 | |
| | | | | | | | | | | | |
| | | | | | | | | | | | | |
| Short-Term Securities | | | | | Shares | | | | |
BlackRock Liquidity Funds, T-Fund, Institutional Class, 0.64% (a)(b) | | | | | | | 130,172,254 | | | | 130,172,254 | |
Total Short-Term Securities
(Cost — $130,172,254) — 42.5% | | | | | | | | | | | 130,172,254 | |
Total Investments (Cost — $302,154,129) — 98.7% | | | | | | | | 302,279,882 | |
Other Assets Less Liabilities — 1.3% | | | | | | | | | | | 3,931,656 | |
| | | | | | | | | | | | |
Net Assets — 100.0% | | | | | | | | | | $ | 306,211,538 | |
| | | | | | | | | | | | |
|
| Notes to Consolidated Financial Statements |
| (a) | | During the six months ended April 30, 2017, investments in issuers considered to be an affiliate of the Fund for purposes of Section 2(a)(3) of the Investment Company Act of 1940, as amended, were as follows: |
| | | | | | | | | | | | | | | | | | | | | | | | | | | | |
| Affiliate | | Shares Held
at October 31,
2016 | | | Net
Activity | | | Shares Held
at April 30,
2017 | | | Value at
April 30,
2017 | | | Income | | | Net
Realized
Gain1 | | | Change in
Unrealized
Appreciation
(Depreciation) | |
BlackRock Liquidity Funds, T-Fund, Institutional Class | | | 94,106,229 | | | | 36,066,025 | | | | 130,172,254 | | | $ | 130,172,254 | | | $ | 193,002 | | | $ | 349 | | | | — | |
| | | | | | | | | | | | | | | | |
1 Includes net capital gain distributions. |
| (b) | | Current yield as of period end. |
|
| Derivative Financial Instruments Outstanding as of Period End |
Futures Contracts
| | | | | | | | | | | | | | | | | | |
Contracts
Long | | Issue | | Expiration | | | Notional
Value | | | Unrealized
Appreciation | | | | |
| 748 | | SGX Nifty 50 Index | | | May 2017 | | | $ | 13,963,664 | | | $ | 79,104 | | | | | |
| 122 | | Mini MSCI Emerging Markets Index | | | June 2017 | | | $ | 5,971,900 | | | | 1,816 | | | | | |
| Total | | | | | | | | | | | | $ | 80,920 | | | | | |
| | | | | | | | | | | | | | |
See Notes to Consolidated Financial Statements.
| | | | | | |
| | | | | | | |
| | BLACKROCK TOTAL EMERGING MARKETS FUND | | APRIL 30, 2017 | | 11 |
| | |
Consolidated Schedule of Investments (continued) | | |
| | | | | | | | | | | | | | | | | | | | | | | | | | | | |
| Forward Foreign Currency Exchange Contracts | | | | | | | | | | | | |
Currency
Purchased | | | Currency
Sold | | | Counterparty | | Settlement
Date | | | Unrealized
Appreciation
(Depreciation) | | | | | | | |
| AUD | | | 270,000 | | | USD | | | 201,127 | | | Citibank N.A. | | | 6/14/17 | | | $ | 895 | | | | | | | | | |
| CAD | | | 342,000 | | | USD | | | 250,688 | | | Citibank N.A. | | | 6/14/17 | | | | 8 | | | | | | | | | |
| COP | | | 21,730,000,000 | | | USD | | | 7,226,472 | | | Deutsche Bank AG | | | 6/16/17 | | | | 110,820 | | | | | | | | | |
| COP | | | 4,405,260,000 | | | USD | | | 1,458,473 | | | HSBC Bank USA N.A. | | | 6/14/17 | | | | 29,413 | | | | | | | | | |
| EUR | | | 118,484 | | | CHF | | | 127,000 | | | Citibank N.A. | | | 6/14/17 | | | | 1,366 | | | | | | | | | |
| EUR | | | 309,396 | | | CHF | | | 332,000 | | | Citibank N.A. | | | 6/14/17 | | | | 3,199 | | | | | | | | | |
| EUR | | | 775,139 | | | CHF | | | 829,000 | | | Citibank N.A. | | | 6/14/17 | | | | 10,805 | | | | | | | | | |
| EUR | | | 1,118,676 | | | CHF | | | 1,194,000 | | | Citibank N.A. | | | 6/14/17 | | | | 18,020 | | | | | | | | | |
| EUR | | | 1,515,279 | | | CHF | | | 1,626,000 | | | Citibank N.A. | | | 6/14/17 | | | | 15,649 | | | | | | | | | |
| EUR | | | 162,648 | | | CHF | | | 174,000 | | | HSBC Bank USA N.A. | | | 6/14/17 | | | | 2,216 | | | | | | | | | |
| EUR | | | 3,447,294 | | | CHF | | | 3,694,000 | | | HSBC Bank USA N.A. | | | 6/14/17 | | | | 40,829 | | | | | | | | | |
| EUR | | | 474,685 | | | CHF | | | 507,000 | | | JPMorgan Chase Bank N.A. | | | 6/14/17 | | | | 7,290 | | | | | | | | | |
| EUR | | | 166,844 | | | HUF | | | 51,761,000 | | | Citibank N.A. | | | 6/14/17 | | | | 1,848 | | | | | | | | | |
| EUR | | | 287,874 | | | HUF | | | 89,785,000 | | | Citibank N.A. | | | 6/14/17 | | | | 1,531 | | | | | | | | | |
| EUR | | | 329,003 | | | HUF | | | 102,688,000 | | | Citibank N.A. | | | 6/14/17 | | | | 1,487 | | | | | | | | | |
| EUR | | | 329,628 | | | HUF | | | 102,425,000 | | | Citibank N.A. | | | 6/14/17 | | | | 3,085 | | | | | | | | | |
| EUR | | | 336,550 | | | HUF | | | 105,279,000 | | | Citibank N.A. | | | 6/14/17 | | | | 701 | | | | | | | | | |
| EUR | | | 493,667 | | | HUF | | | 154,030,000 | | | Citibank N.A. | | | 6/14/17 | | | | 2,414 | | | | | | | | | |
| EUR | | | 661,708 | | | HUF | | | 206,353,000 | | | Citibank N.A. | | | 6/14/17 | | | | 3,611 | | | | | | | | | |
| EUR | | | 68 | | | HUF | | | 21,000 | | | HSBC Bank USA N.A. | | | 6/14/17 | | | | 1 | | | | | | | | | |
| EUR | | | 319,502 | | | HUF | | | 99,284,000 | | | UBS AG | | | 6/14/17 | | | | 2,971 | | | | | | | | | |
| EUR | | | 338,015 | | | HUF | | | 105,815,000 | | | UBS AG | | | 6/14/17 | | | | 433 | | | | | | | | | |
| EUR | | | 833,350 | | | HUF | | | 257,245,000 | | | UBS AG | | | 6/14/17 | | | | 13,722 | | | | | | | | | |
| EUR | | | 1,311 | | | NOK | | | 12,000 | | | BNP Paribas S.A. | | | 6/14/17 | | | | 33 | | | | | | | | | |
| EUR | | | 2,404 | | | NOK | | | 22,000 | | | BNP Paribas S.A. | | | 6/14/17 | | | | 60 | | | | | | | | | |
| EUR | | | 176,158 | | | NOK | | | 1,642,000 | | | Citibank N.A. | | | 6/14/17 | | | | 951 | | | | | | | | | |
| EUR | | | 278,388 | | | NOK | | | 2,601,000 | | | Citibank N.A. | | | 6/14/17 | | | | 793 | | | | | | | | | |
| EUR | | | 336,648 | | | NOK | | | 3,116,000 | | | Citibank N.A. | | | 6/14/17 | | | | 4,377 | | | | | | | | | |
| EUR | | | 4,524,826 | | | NOK | | | 40,611,000 | | | HSBC Bank USA N.A. | | | 6/14/17 | | | | 206,883 | | | | | | | | | |
| EUR | | | 168,179 | | | NOK | | | 1,529,000 | | | UBS AG | | | 6/14/17 | | | | 5,409 | | | | | | | | | |
| EUR | | | 270,699 | | | RON | | | 1,229,000 | | | Citibank N.A. | | | 6/14/17 | | | | 283 | | | | | | | | | |
| EUR | | | 1,547 | | | RON | | | 7,000 | | | Deutsche Bank AG | | | 6/14/17 | | | | 8 | | | | | | | | | |
| EUR | | | 204,804 | | | RON | | | 929,000 | | | Deutsche Bank AG | | | 6/14/17 | | | | 414 | | | | | | | | | |
| EUR | | | 99,736 | | | RON | | | 452,000 | | | HSBC Bank USA N.A. | | | 6/14/17 | | | | 299 | | | | | | | | | |
| EUR | | | 3,125 | | | SEK | | | 30,000 | | | Citibank N.A. | | | 6/14/17 | | | | 17 | | | | | | | | | |
| EUR | | | 30,654 | | | SEK | | | 293,000 | | | Citibank N.A. | | | 6/14/17 | | | | 309 | | | | | | | | | |
| EUR | | | 369,739 | | | SEK | | | 3,565,000 | | | Citibank N.A. | | | 6/14/17 | | | | 233 | | | | | | | | | |
| EUR | | | 1,232,805 | | | SEK | | | 11,785,000 | | | Citibank N.A. | | | 6/14/17 | | | | 12,275 | | | | | | | | | |
| EUR | | | 191,496 | | | SEK | | | 1,818,000 | | | Deutsche Bank AG | | | 6/14/17 | | | | 3,333 | | | | | | | | | |
| EUR | | | 40,785 | | | SEK | | | 389,000 | | | HSBC Bank USA N.A. | | | 6/14/17 | | | | 506 | | | | | | | | | |
| EUR | | | 87,000 | | | USD | | | 92,986 | | | BNP Paribas S.A. | | | 6/14/17 | | | | 1,980 | | | | | | | | | |
| EUR | | | 129,000 | | | USD | | | 137,894 | | | BNP Paribas S.A. | | | 6/14/17 | | | | 2,918 | | | | | | | | | |
| EUR | | | 1,070 | | | USD | | | 1,137 | | | Citibank N.A. | | | 6/14/17 | | | | 31 | | | | | | | | | |
| EUR | | | 9,000 | | | USD | | | 9,618 | | | Citibank N.A. | | | 6/14/17 | | | | 206 | | | | | | | | | |
| EUR | | | 103,000 | | | USD | | | 109,286 | | | Citibank N.A. | | | 6/14/17 | | | | 3,145 | | | | | | | | | |
| EUR | | | 349,000 | | | USD | | | 373,489 | | | Citibank N.A. | | | 6/14/17 | | | | 7,466 | | | | | | | | | |
| EUR | | | 370,000 | | | USD | | | 402,738 | | | Citibank N.A. | | | 6/14/17 | | | | 1,140 | | | | | | | | | |
| EUR | | | 468,000 | | | USD | | | 501,280 | | | Citibank N.A. | | | 6/14/17 | | | | 9,571 | | | | | | | | | |
| EUR | | | 562,000 | | | USD | | | 606,196 | | | Citibank N.A. | | | 6/14/17 | | | | 7,262 | | | | | | | | | |
| EUR | | | 731,000 | | | USD | | | 796,096 | | | Citibank N.A. | | | 6/14/17 | | | | 1,837 | | | | | | | | | |
| EUR | | | 158,000 | | | USD | | | 170,093 | | | Deutsche Bank AG | | | 6/14/17 | | | | 2,374 | | | | | | | | | |
| EUR | | | 1,484,000 | | | USD | | | 1,573,565 | | | Deutsche Bank AG | | | 6/14/17 | | | | 46,313 | | | | | | | | | |
| EUR | | | 673,000 | | | USD | | | 725,147 | | | HSBC Bank USA N.A. | | | 6/14/17 | | | | 9,475 | | | | | | | | | |
| EUR | | | 71,000 | | | USD | | | 75,566 | | | UBS AG | | | 6/14/17 | | | | 1,935 | | | | | | | | | |
| EUR | | | 115,000 | | | USD | | | 124,528 | | | UBS AG | | | 6/14/17 | | | | 1,002 | | | | | | | | | |
| EUR | | | 129,000 | | | USD | | | 139,893 | | | UBS AG | | | 6/14/17 | | | | 919 | | | | | | | | | |
| EUR | | | 789,000 | | | USD | | | 836,884 | | | UBS AG | | | 6/14/17 | | | | 24,358 | | | | | | | | | |
| EUR | | | 2,507,000 | | | USD | | | 2,708,197 | | | UBS AG | | | 6/14/17 | | | | 28,350 | | | | | | | | | |
| GBP | | | 19,000 | | | USD | | | 24,406 | | | Citibank N.A. | | | 6/14/17 | | | | 231 | | | | | | | | | |
| GBP | | | 255,000 | | | USD | | | 329,522 | | | Citibank N.A. | | | 6/14/17 | | | | 1,142 | | | | | | | | | |
| GBP | | | 499,000 | | | USD | | | 633,071 | | | Citibank N.A. | | | 6/14/17 | | | | 13,992 | | | | | | | | | |
| GBP | | | 589,000 | | | USD | | | 719,676 | | | Citibank N.A. | | | 6/14/17 | | | | 44,091 | | | | | | | | | |
| GBP | | | 128,000 | | | USD | | | 159,767 | | | UBS AG | | | 6/14/17 | | | | 6,213 | | | | | | | | | |
| IDR | | | 29,653,587,000 | | | USD | | | 2,202,108 | | | HSBC Bank USA N.A. | | | 6/14/17 | | | | 13,737 | | | | | | | | | |
See Notes to Consolidated Financial Statements.
| | | | | | |
| | | | | | | |
| 12 | | BLACKROCK TOTAL EMERGING MARKETS FUND | | APRIL 30, 2017 | | |
| | |
Consolidated Schedule of Investments (continued) | | |
| | | | | | | | | | | | | | | | | | | | | | | | | | | | |
| Forward Foreign Currency Exchange Contracts (continued) | | | | | | | | | | | | |
Currency
Purchased | | | Currency
Sold | | | Counterparty | | Settlement
Date | | | Unrealized
Appreciation
(Depreciation) | | | | | | | |
| IDR | | | 12,888,000 | | | USD | | | 963 | | | JPMorgan Chase Bank N.A. | | | 6/14/17 | | | | — | | | | | | | | | |
| IDR | | | 2,399,678,000 | | | USD | | | 179,094 | | | JPMorgan Chase Bank N.A. | | | 6/14/17 | | | $ | 221 | | | | | | | | | |
| INR | | | 47,669,000 | | | USD | | | 721,340 | | | BNP Paribas S.A. | | | 6/14/17 | | | | 16,883 | | | | | | | | | |
| INR | | | 11,589,000 | | | USD | | | 178,216 | | | JPMorgan Chase Bank N.A. | | | 6/14/17 | | | | 1,257 | | | | | | | | | |
| INR | | | 11,877,000 | | | USD | | | 180,727 | | | JPMorgan Chase Bank N.A. | | | 6/14/17 | | | | 3,206 | | | | | | | | | |
| INR | | | 11,931,000 | | | USD | | | 181,110 | | | JPMorgan Chase Bank N.A. | | | 6/14/17 | | | | 3,658 | | | | | | | | | |
| INR | | | 23,630,000 | | | USD | | | 360,681 | | | JPMorgan Chase Bank N.A. | | | 6/14/17 | | | | 5,263 | | | | | | | | | |
| INR | | | 41,175,000 | | | USD | | | 629,780 | | | JPMorgan Chase Bank N.A. | | | 6/14/17 | | | | 7,874 | | | | | | | | | |
| INR | | | 46,795,000 | | | USD | | | 722,201 | | | JPMorgan Chase Bank N.A. | | | 6/14/17 | | | | 2,487 | | | | | | | | | |
| INR | | | 48,610,000 | | | USD | | | 721,003 | | | JPMorgan Chase Bank N.A. | | | 6/14/17 | | | | 31,793 | | | | | | | | | |
| INR | | | 52,421,000 | | | USD | | | 794,619 | | | JPMorgan Chase Bank N.A. | | | 6/14/17 | | | | 17,195 | | | | | | | | | |
| INR | | | 59,091,000 | | | USD | | | 904,085 | | | JPMorgan Chase Bank N.A. | | | 6/14/17 | | | | 11,023 | | | | | | | | | |
| INR | | | 60,609,000 | | | USD | | | 901,249 | | | JPMorgan Chase Bank N.A. | | | 6/14/17 | | | | 37,368 | | | | | | | | | |
| INR | | | 72,154,000 | | | USD | | | 1,082,499 | | | JPMorgan Chase Bank N.A. | | | 6/14/17 | | | | 34,908 | | | | | | | | | |
| INR | | | 134,500,000 | | | USD | | | 2,063,042 | | | Standard Chartered Bank | | | 7/07/17 | | | | 14,732 | | | | | | | | | |
| INR | | | 766,998,500 | | | USD | | | 11,600,098 | | | Standard Chartered Bank | | | 7/07/17 | | | | 248,597 | | | | | | | | | |
| JPY | | | 4,700,000 | | | USD | | | 41,026 | | | BNP Paribas S.A. | | | 6/14/17 | | | | 1,206 | | | | | | | | | |
| JPY | | | 30,277,000 | | | USD | | | 265,272 | | | BNP Paribas S.A. | | | 6/14/17 | | | | 6,784 | | | | | | | | | |
| JPY | | | 40,656,000 | | | USD | | | 353,487 | | | Bank of America N.A. | | | 6/14/17 | | | | 11,829 | | | | | | | | | |
| JPY | | | 39,612,000 | | | USD | | | 352,428 | | | Deutsche Bank AG | | | 6/14/17 | | | | 3,508 | | | | | | | | | |
| KRW | | | 495,669,000 | | | USD | | | 433,586 | | | BNP Paribas S.A. | | | 6/14/17 | | | | 2,259 | | | | | | | | | |
| KRW | | | 11,235,000 | | | USD | | | 9,697 | | | JPMorgan Chase Bank N.A. | | | 6/14/17 | | | | 182 | | | | | | | | | |
| KRW | | | 67,646,000 | | | USD | | | 59,257 | | | JPMorgan Chase Bank N.A. | | | 6/14/17 | | | | 225 | | | | | | | | | |
| KRW | | | 912,430,000 | | | USD | | | 794,281 | | | JPMorgan Chase Bank N.A. | | | 6/14/17 | | | | 8,025 | | | | | | | | | |
| KRW | | | 1,164,759,000 | | | USD | | | 1,008,711 | | | JPMorgan Chase Bank N.A. | | | 6/14/17 | | | | 15,469 | | | | | | | | | |
| MXN | | | 1,087,000 | | | USD | | | 56,611 | | | BNP Paribas S.A. | | | 6/14/17 | | | | 727 | | | | | | | | | |
| MXN | | | 2,168,000 | | | USD | | | 109,068 | | | BNP Paribas S.A. | | | 6/14/17 | | | | 5,293 | | | | | | | | | |
| MXN | | | 2,220,000 | | | USD | | | 116,769 | | | Citibank N.A. | | | 6/14/17 | | | | 334 | | | | | | | | | |
| MXN | | | 2,501,000 | | | USD | | | 126,940 | | | Citibank N.A. | | | 6/14/17 | | | | 4,985 | | | | | | | | | |
| MXN | | | 8,002,000 | | | USD | | | 417,303 | | | HSBC Bank USA N.A. | | | 6/14/17 | | | | 4,795 | | | | | | | | | |
| MXN | | | 2,766,000 | | | USD | | | 144,327 | | | JPMorgan Chase Bank N.A. | | | 6/14/17 | | | | 1,577 | | | | | | | | | |
| MYR | | | 309,000 | | | USD | | | 69,407 | | | JPMorgan Chase Bank N.A. | | | 6/14/17 | | | | 1,849 | | | | | | | | | |
| MYR | | | 309,000 | | | USD | | | 70,291 | | | JPMorgan Chase Bank N.A. | | | 6/14/17 | | | | 965 | | | | | | | | | |
| MYR | | | 432,000 | | | USD | | | 96,601 | | | JPMorgan Chase Bank N.A. | | | 6/14/17 | | | | 3,020 | | | | | | | | | |
| MYR | | | 596,000 | | | USD | | | 132,887 | | | JPMorgan Chase Bank N.A. | | | 6/14/17 | | | | 4,552 | | | | | | | | | |
| NZD | | | 330,000 | | | USD | | | 226,263 | | | Citibank N.A. | | | 6/14/17 | | | | 68 | | | | | | | | | |
| PLN | | | 413,000 | | | EUR | | | 96,747 | | | Citibank N.A. | | | 6/14/17 | | | | 815 | | | | | | | | | |
| PLN | | | 548,000 | | | EUR | | | 128,838 | | | Citibank N.A. | | | 6/14/17 | | | | 571 | | | | | | | | | |
| PLN | | | 612,000 | | | EUR | | | 143,703 | | | Citibank N.A. | | | 6/14/17 | | | | 836 | | | | | | | | | |
| PLN | | | 671,000 | | | EUR | | | 158,069 | | | Citibank N.A. | | | 6/14/17 | | | | 359 | | | | | | | | | |
| PLN | | | 3,302,000 | | | EUR | | | 762,974 | | | Citibank N.A. | | | 6/14/17 | | | | 18,011 | | | | | | | | | |
| PLN | | | 725,000 | | | EUR | | | 171,071 | | | Deutsche Bank AG | | | 6/14/17 | | | | 80 | | | | | | | | | |
| PLN | | | 1,391,000 | | | EUR | | | 320,479 | | | Deutsche Bank AG | | | 6/14/17 | | | | 8,604 | | | | | | | | | |
| PLN | | | 2,412,000 | | | EUR | | | 568,651 | | | Deutsche Bank AG | | | 6/14/17 | | | | 796 | | | | | | | | | |
| PLN | | | 41,000 | | | EUR | | | 9,674 | | | HSBC Bank USA N.A. | | | 6/14/17 | | | | 5 | | | | | | | | | |
| PLN | | | 1,369,000 | | | EUR | | | 319,692 | | | UBS AG | | | 6/14/17 | | | | 3,794 | | | | | | | | | |
| RON | | | 2,000 | | | EUR | | | 438 | | | BNP Paribas S.A. | | | 6/14/17 | | | | 2 | | | | | | | | | |
| RON | | | 4,000 | | | EUR | | | 875 | | | BNP Paribas S.A. | | | 6/14/17 | | | | 6 | | | | | | | | | |
| RON | | | 7,668,000 | | | EUR | | | 1,684,867 | | | UBS AG | | | 6/14/17 | | | | 2,690 | | | | | | | | | |
| SGD | | | 165,000 | | | USD | | | 118,032 | | | Deutsche Bank AG | | | 6/14/17 | | | | 117 | | | | | | | | | |
| SGD | | | 3,814,000 | | | USD | | | 2,702,927 | | | HSBC Bank USA N.A. | | | 6/14/17 | | | | 28,106 | | | | | | | | | |
| SGD | | | 4,000 | | | USD | | | 2,864 | | | JPMorgan Chase Bank N.A. | | | 6/14/17 | | | | — | | | | | | | | | |
| SGD | | | 32,000 | | | USD | | | 22,808 | | | UBS AG | | | 6/14/17 | | | | 106 | | | | | | | | | |
| THB | | | 5,245,000 | | | USD | | | 151,318 | | | BNP Paribas S.A. | | | 6/14/17 | | | | 274 | | | | | | | | | |
| THB | | | 105,195,000 | | | USD | | | 2,995,131 | | | HSBC Bank USA N.A. | | | 6/14/17 | | | | 45,231 | | | | | | | | | |
| TRY | | | 20,000 | | | USD | | | 5,204 | | | BNP Paribas S.A. | | | 6/14/17 | | | | 358 | | | | | | | | | |
| TRY | | | 385,000 | | | USD | | | 104,273 | | | BNP Paribas S.A. | | | 6/14/17 | | | | 2,795 | | | | | | | | | |
| TRY | | | 1,952,000 | | | USD | | | 534,944 | | | Citibank N.A. | | | 6/14/17 | | | | 7,904 | | | | | | | | | |
| TRY | | | 1,224,000 | | | USD | | | 331,750 | | | Credit Suisse International | | | 6/14/17 | | | | 8,642 | | | | | | | | | |
| TRY | | | 33,000 | | | USD | | | 8,877 | | | Deutsche Bank AG | | | 6/14/17 | | | | 300 | | | | | | | | | |
| TRY | | | 1,231,000 | | | USD | | | 338,427 | | | Deutsche Bank AG | | | 6/14/17 | | | | 3,912 | | | | | | | | | |
| TRY | | | 856,000 | | | USD | | | 226,671 | | | UBS AG | | | 6/14/17 | | | | 11,381 | | | | | | | | | |
| TWD | | | 71,295,000 | | | USD | | | 2,314,397 | | | HSBC Bank USA N.A. | | | 6/14/17 | | | | 49,587 | | | | | | | | | |
| TWD | | | 1,038,000 | | | USD | | | 34,304 | | | JPMorgan Chase Bank N.A. | | | 6/14/17 | | | | 114 | | | | | | | | | |
See Notes to Consolidated Financial Statements.
| | | | | | |
| | | | | | | |
| | BLACKROCK TOTAL EMERGING MARKETS FUND | | APRIL 30, 2017 | | 13 |
| | |
Consolidated Schedule of Investments (continued) | | |
| | | | | | | | | | | | | | | | | | | | | | | | | | | | |
| Forward Foreign Currency Exchange Contracts (continued) | | | | | | | | | | | | |
Currency
Purchased | | | Currency
Sold | | | Counterparty | | Settlement
Date | | | Unrealized
Appreciation
(Depreciation) | | | | | | | |
| TWD | | | 1,079,000 | | | USD | | | 35,342 | | | JPMorgan Chase Bank N.A. | | | 6/14/17 | | | $ | 435 | | | | | | | | | |
| TWD | | | 1,274,000 | | | USD | | | 42,070 | | | JPMorgan Chase Bank N.A. | | | 6/14/17 | | | | 173 | | | | | | | | | |
| TWD | | | 1,978,000 | | | USD | | | 65,259 | | | JPMorgan Chase Bank N.A. | | | 6/14/17 | | | | 327 | | | | | | | | | |
| TWD | | | 2,601,000 | | | USD | | | 84,311 | | | JPMorgan Chase Bank N.A. | | | 6/14/17 | | | | 1,932 | | | | | | | | | |
| TWD | | | 6,878,000 | | | USD | | | 226,541 | | | JPMorgan Chase Bank N.A. | | | 6/14/17 | | | | 1,519 | | | | | | | | | |
| USD | | | 14,337 | | | AUD | | | 19,000 | | | BNP Paribas S.A. | | | 6/14/17 | | | | 121 | | | | | | | | | |
| USD | | | 70,310 | | | AUD | | | 92,000 | | | Citibank N.A. | | | 6/14/17 | | | | 1,473 | | | | | | | | | |
| USD | | | 931,655 | | | AUD | | | 1,239,000 | | | Citibank N.A. | | | 6/14/17 | | | | 4,599 | | | | | | | | | |
| USD | | | 1,033,578 | | | AUD | | | 1,365,000 | | | Deutsche Bank AG | | | 6/14/17 | | | | 12,245 | | | | | | | | | |
| USD | | | 80,983 | | | AUD | | | 108,000 | | | UBS AG | | | 6/14/17 | | | | 175 | | | | | | | | | |
| USD | | | 13,430 | | | BRL | | | 42,000 | | | JPMorgan Chase Bank N.A. | | | 6/14/17 | | | | 331 | | | | | | | | | |
| USD | | | 42,857 | | | BRL | | | 135,000 | | | JPMorgan Chase Bank N.A. | | | 6/14/17 | | | | 754 | | | | | | | | | |
| USD | | | 122,551 | | | BRL | | | 389,000 | | | JPMorgan Chase Bank N.A. | | | 6/14/17 | | | | 1,230 | | | | | | | | | |
| USD | | | 436,959 | | | BRL | | | 1,388,000 | | | JPMorgan Chase Bank N.A. | | | 6/14/17 | | | | 4,073 | | | | | | | | | |
| USD | | | 71,201 | | | CAD | | | 96,000 | | | Citibank N.A. | | | 6/14/17 | | | | 830 | | | | | | | | | |
| USD | | | 4,496 | | | CAD | | | 6,000 | | | Deutsche Bank AG | | | 6/14/17 | | | | 98 | | | | | | | | | |
| USD | | | 424,216 | | | CAD | | | 568,000 | | | Deutsche Bank AG | | | 6/14/17 | | | | 7,854 | | | | | | | | | |
| USD | | | 561,128 | | | CAD | | | 758,000 | | | Deutsche Bank AG | | | 6/14/17 | | | | 5,490 | | | | | | | | | |
| USD | | | 1,072,148 | | | CAD | | | 1,446,000 | | | Deutsche Bank AG | | | 6/14/17 | | | | 12,185 | | | | | | | | | |
| USD | | | 574,302 | | | CAD | | | 763,000 | | | UBS AG | | | 6/14/17 | | | | 14,999 | | | | | | | | | |
| USD | | | 686,243 | | | CAD | | | 921,000 | | | UBS AG | | | 6/14/17 | | | | 11,121 | | | | | | | | | |
| USD | | | 235,551 | | | CLP | | | 153,565,000 | | | BNP Paribas S.A. | | | 6/14/17 | | | | 5,923 | | | | | | | | | |
| USD | | | 324,485 | | | CLP | | | 216,740,000 | | | BNP Paribas S.A. | | | 6/14/17 | | | | 390 | | | | | | | | | |
| USD | | | 3,430,385 | | | CLP | | | 2,278,805,000 | | | HSBC Bank USA N.A. | | | 6/14/17 | | | | 22,850 | | | | | | | | | |
| USD | | | 286,793 | | | CLP | | | 189,530,000 | | | JPMorgan Chase Bank N.A. | | | 6/14/17 | | | | 3,386 | | | | | | | | | |
| USD | | | 652,070 | | | CLP | | | 435,126,000 | | | JPMorgan Chase Bank N.A. | | | 6/14/17 | | | | 1,418 | | | | | | | | | |
| USD | | | 181,458 | | | COP | | | 532,398,000 | | | JPMorgan Chase Bank N.A. | | | 6/14/17 | | | | 1,639 | | | | | | | | | |
| USD | | | 356,652 | | | COP | | | 1,042,138,000 | | | JPMorgan Chase Bank N.A. | | | 6/14/17 | | | | 4,668 | | | | | | | | | |
| USD | | | 357,485 | | | COP | | | 1,051,186,000 | | | JPMorgan Chase Bank N.A. | | | 6/14/17 | | | | 2,445 | | | | | | | | | |
| USD | | | 1,167 | | | IDR | | | 15,609,000 | | | JPMorgan Chase Bank N.A. | | | 6/14/17 | | | | — | | | | | | | | | |
| USD | | | 622,686 | | | IDR | | | 8,312,856,000 | | | JPMorgan Chase Bank N.A. | | | 6/14/17 | | | | 1,513 | | | | | | | | | |
| USD | | | 732,163 | | | IDR | | | 9,800,000,000 | | | Citibank N.A. | | | 6/16/17 | | | | 22 | | | | | | | | | |
| USD | | | 556 | | | KRW | | | 621,000 | | | JPMorgan Chase Bank N.A. | | | 6/14/17 | | | | 10 | | | | | | | | | |
| USD | | | 60,725 | | | KRW | | | 68,558,000 | | | JPMorgan Chase Bank N.A. | | | 6/14/17 | | | | 441 | | | | | | | | | |
| USD | | | 440,035 | | | KRW | | | 495,655,000 | | | JPMorgan Chase Bank N.A. | | | 6/14/17 | | | | 4,202 | | | | | | | | | |
| USD | | | 803,940 | | | KRW | | | 913,517,000 | | | JPMorgan Chase Bank N.A. | | | 6/14/17 | | | | 679 | | | | | | | | | |
| USD | | | 2,284,436 | | | CLP | | | 1,481,000,000 | | | Bank of America N.A. | | | 6/16/17 | | | | 70,078 | | | | | | | | | |
| USD | | | 667,648 | | | CLP | | | 440,000,000 | | | Barclays Bank PLC | | | 6/16/17 | | | | 9,770 | | | | | | | | | |
| USD | | | 341,328 | | | CLP | | | 222,000,000 | | | JPMorgan Chase Bank N.A. | | | 6/16/17 | | | | 9,399 | | | | | | | | | |
| USD | | | 536,537 | | | CLP | | | 355,000,000 | | | JPMorgan Chase Bank N.A. | | | 6/16/17 | | | | 5,749 | | | | | | | | | |
| USD | | | 7,405,640 | | | COP | | | 21,730,000,000 | | | Bank of America N.A. | | | 6/16/17 | | | | 68,349 | | | | | | | | | |
| USD | | | 2,103 | | | NZD | | | 3,000 | | | BNP Paribas S.A. | | | 6/14/17 | | | | 46 | | | | | | | | | |
| USD | | | 900,552 | | | NZD | | | 1,306,000 | | | BNP Paribas S.A. | | | 6/14/17 | | | | 4,829 | | | | | | | | | |
| USD | | | 906,788 | | | NZD | | | 1,322,000 | | | Citibank N.A. | | | 6/14/17 | | | | 91 | | | | | | | | | |
| USD | | | 358,449 | | | NZD | | | 521,000 | | | Deutsche Bank AG | | | 6/14/17 | | | | 1,119 | | | | | | | | | |
| USD | | | 361,088 | | | NZD | | | 524,000 | | | Deutsche Bank AG | | | 6/14/17 | | | | 1,701 | | | | | | | | | |
| USD | | | 719,585 | | | NZD | | | 1,028,000 | | | Deutsche Bank AG | | | 6/14/17 | | | | 14,528 | | | | | | | | | |
| USD | | | 720,653 | | | NZD | | | 1,022,000 | | | JPMorgan Chase Bank N.A. | | | 6/14/17 | | | | 19,712 | | | | | | | | | |
| USD | | | 1,792,959 | | | NZD | | | 2,588,000 | | | JPMorgan Chase Bank N.A. | | | 6/14/17 | | | | 17,972 | | | | | | | | | |
| USD | | | 2,949,013 | | | NZD | | | 4,235,000 | | | JPMorgan Chase Bank N.A. | | | 6/14/17 | | | | 44,427 | | | | | | | | | |
| USD | | | 726,684 | | | NZD | | | 1,040,000 | | | UBS AG | | | 6/14/17 | | | | 13,398 | | | | | | | | | |
| USD | | | 1,084,334 | | | NZD | | | 1,541,000 | | | UBS AG | | | 6/14/17 | | | | 27,435 | | | | | | | | | |
| USD | | | 539,638 | | | PHP | | | 26,847,000 | | | JPMorgan Chase Bank N.A. | | | 6/14/17 | | | | 6,451 | | | | | | | | | |
| USD | | | 28,648 | | | SGD | | | 40,000 | | | BNP Paribas S.A. | | | 6/14/17 | | | | 6 | | | | | | | | | |
| USD | | | 168,003 | | | SGD | | | 234,000 | | | HSBC Bank USA N.A. | | | 6/14/17 | | | | 446 | | | | | | | | | |
| USD | | | 46,834 | | | THB | | | 1,614,000 | | | BNP Paribas S.A. | | | 6/14/17 | | | | 186 | | | | | | | | | |
| USD | | | 104,933 | | | THB | | | 3,615,000 | | | Citibank N.A. | | | 6/14/17 | | | | 452 | | | | | | | | | |
| USD | | | 19,975 | | | THB | | | 687,000 | | | Deutsche Bank AG | | | 6/14/17 | | | | 119 | | | | | | | | | |
| USD | | | 24,122 | | | THB | | | 830,000 | | | JPMorgan Chase Bank N.A. | | | 6/14/17 | | | | 134 | | | | | | | | | |
| USD | | | 36,153 | | | ZAR | | | 474,000 | | | Citibank N.A. | | | 6/14/17 | | | | 939 | | | | | | | | | |
| USD | | | 610,800 | | | ZAR | | | 8,015,000 | | | Citibank N.A. | | | 6/14/17 | | | | 15,351 | | | | | | | | | |
| USD | | | 164,482 | | | ZAR | | | 2,166,000 | | | HSBC Bank USA N.A. | | | 6/14/17 | | | | 3,566 | | | | | | | | | |
| USD | | | 323,315 | | | ZAR | | | 4,303,000 | | | HSBC Bank USA N.A. | | | 6/14/17 | | | | 3,637 | | | | | | | | | |
| ZAR | | | 1,915,000 | | | USD | | | 142,087 | | | Bank of America N.A. | | | 6/14/17 | | | | 182 | | | | | | | | | |
See Notes to Consolidated Financial Statements.
| | | | | | |
| | | | | | | |
| 14 | | BLACKROCK TOTAL EMERGING MARKETS FUND | | APRIL 30, 2017 | | |
| | |
Consolidated Schedule of Investments (continued) | | |
| | | | | | | | | | | | | | | | | | | | | | | | | | | | |
| Forward Foreign Currency Exchange Contracts (continued) | | | | | | | | | | | | |
Currency
Purchased | | | Currency
Sold | | | Counterparty | | Settlement
Date | | | Unrealized
Appreciation
(Depreciation) | | | | | | | |
| ZAR | | | 304,000 | | | USD | | | 22,483 | | | Deutsche Bank AG | | | 6/14/17 | | | $ | 101 | | | | | | | | | |
| ZAR | | | 509,000 | | | USD | | | 37,790 | | | Deutsche Bank AG | | | 6/14/17 | | | | 24 | | | | | | | | | |
| USD | | | 1,738,169 | | | KRW | | | 1,965,000,000 | | | Bank of America N.A. | | | 6/16/17 | | | | 10,301 | | | | | | | | | |
| USD | | | 396,361 | | | KRW | | | 450,000,000 | | | Barclays Bank PLC | | | 6/16/17 | | | | 666 | | | | | | | | | |
| USD | | | 2,536 | | | MXN | | | 48,000 | | | JPMorgan Chase Bank N.A. | | | 6/14/17 | | | | 4 | | | | | | | | | |
| USD | | | 337,175 | | | MXN | | | 6,297,000 | | | JPMorgan Chase Bank N.A. | | | 6/14/17 | | | | 5,014 | | | | | | | | | |
| USD | | | 117,052 | | | MXN | | | 2,200,000 | | | JPMorgan Chase Bank N.A. | | | 6/16/17 | | | | 1,041 | | | | | | | | | |
| USD | | | 2,297,763 | | | ZAR | | | 30,255,000 | | | Deutsche Bank AG | | | 6/19/17 | | | | 51,956 | | | | | | | | | |
| | | | | | | | | | | | | | | | | | | | |
| | | | | | | | | | | | | | | | | | | 1,988,427 | | | | | | | | | |
| | | | | | | | | | | | | | | | | | | | |
| | | | | | | | |
| AUD | | | 5,539,000 | | | USD | | | 4,205,801 | | | Bank of America N.A. | | | 6/14/17 | | | | (61,361 | ) | | | | | | | | |
| AUD | | | 347,000 | | | USD | | | 260,892 | | | Citibank N.A. | | | 6/14/17 | | | | (1,256 | ) | | | | | | | | |
| AUD | | | 1,449,000 | | | USD | | | 1,085,723 | | | Citibank N.A. | | | 6/14/17 | | | | (1,539 | ) | | | | | | | | |
| AUD | | | 730,000 | | | USD | | | 557,032 | | | Credit Suisse International | | | 6/14/17 | | | | (10,824 | ) | | | | | | | | |
| AUD | | | 178,000 | | | USD | | | 134,213 | | | Deutsche Bank AG | | | 6/14/17 | | | | (1,028 | ) | | | | | | | | |
| AUD | | | 949,000 | | | USD | | | 712,798 | | | Deutsche Bank AG | | | 6/14/17 | | | | (2,728 | ) | | | | | | | | |
| AUD | | | 2,262,000 | | | USD | | | 1,707,301 | | | JPMorgan Chase Bank N.A. | | | 6/14/17 | | | | (14,807 | ) | | | | | | | | |
| AUD | | | 1,336,000 | | | USD | | | 1,030,956 | | | UBS AG | | | 6/14/17 | | | | (31,322 | ) | | | | | | | | |
| BRL | | | 205,000 | | | USD | | | 64,411 | | | JPMorgan Chase Bank N.A. | | | 6/14/17 | | | | (476 | ) | | | | | | | | |
| BRL | | | 434,000 | | | USD | | | 137,233 | | | JPMorgan Chase Bank N.A. | | | 6/14/17 | | | | (1,879 | ) | | | | | | | | |
| BRL | | | 1,719,000 | | | USD | | | 541,854 | | | BNP Paribas S.A. | | | 6/14/17 | | | | (5,737 | ) | | | | | | | | |
| BRL | | | 9,528,000 | | | USD | | | 2,978,524 | | | HSBC Bank USA N.A. | | | 6/14/17 | | | | (6,959 | ) | | | | | | | | |
| CAD | | | 19,000 | | | USD | | | 14,148 | | | BNP Paribas S.A. | | | 6/14/17 | | | | (220 | ) | | | | | | | | |
| CAD | | | 303,000 | | | USD | | | 228,268 | | | BNP Paribas S.A. | | | 6/14/17 | | | | (6,159 | ) | | | | | | | | |
| CAD | | | 2,112,000 | | | USD | | | 1,584,539 | | | Citibank N.A. | | | 6/14/17 | | | | (36,377 | ) | | | | | | | | |
| CAD | | | 726,000 | | | USD | | | 544,114 | | | Deutsche Bank AG | | | 6/14/17 | | | | (11,934 | ) | | | | | | | | |
| CAD | | | 1,833,000 | | | USD | | | 1,366,277 | | | Deutsche Bank AG | | | 6/14/17 | | | | (22,631 | ) | | | | | | | | |
| CAD | | | 1,623,000 | | | USD | | | 1,218,296 | | | JPMorgan Chase Bank N.A. | | | 6/14/17 | | | | (28,586 | ) | | | | | | | | |
| CAD | | | 589,000 | | | USD | | | 442,642 | | | UBS AG | | | 6/14/17 | | | | (10,887 | ) | | | | | | | | |
| CAD | | | 686,000 | | | USD | | | 513,660 | | | UBS AG | | | 6/14/17 | | | | (10,801 | ) | | | | | | | | |
| CHF | | | 44,000 | | | EUR | | | 41,069 | | | BNP Paribas S.A. | | | 6/14/17 | | | | (494 | ) | | | | | | | | |
| CHF | | | 375,000 | | | EUR | | | 347,046 | | | Citibank N.A. | | | 6/14/17 | | | | (969 | ) | | | | | | | | |
| CHF | | | 384,000 | | | EUR | | | 359,785 | | | Citibank N.A. | | | 6/14/17 | | | | (5,806 | ) | | | | | | | | |
| CHF | | | 411,000 | | | EUR | | | 385,311 | | | Citibank N.A. | | | 6/14/17 | | | | (6,464 | ) | | | | | | | | |
| CHF | | | 930,000 | | | EUR | | | 870,547 | | | Citibank N.A. | | | 6/14/17 | | | | (13,180 | ) | | | | | | | | |
| CHF | | | 735,000 | | | EUR | | | 678,586 | | | HSBC Bank USA N.A. | | | 6/14/17 | | | | (127 | ) | | | | | | | | |
| CHF | | | 78,000 | | | EUR | | | 72,612 | | | UBS AG | | | 6/14/17 | | | | (667 | ) | | | | | | | | |
| CHF | | | 469,000 | | | EUR | | | 439,015 | | | UBS AG | | | 6/14/17 | | | | (6,643 | ) | | | | | | | | |
| CHF | | | 1,052,000 | | | EUR | | | 984,866 | | | UBS AG | | | 6/14/17 | | | | (15,038 | ) | | | | | | | | |
| CLP | | | 41,337,000 | | | USD | | | 63,606 | | | JPMorgan Chase Bank N.A. | | | 6/14/17 | | | | (1,794 | ) | | | | | | | | |
| CLP | | | 73,451,000 | | | USD | | | 113,108 | | | JPMorgan Chase Bank N.A. | | | 6/14/17 | | | | (3,275 | ) | | | | | | | | |
| COP | | | 783,000 | | | USD | | | 272 | | | BNP Paribas S.A. | | | 6/14/17 | | | | (7 | ) | | | | | | | | |
| COP | | | 569,000 | | | USD | | | 195 | | | JPMorgan Chase Bank N.A. | | | 6/14/17 | | | | (3 | ) | | | | | | | | |
| COP | | | 2,136,000 | | | USD | | | 746 | | | JPMorgan Chase Bank N.A. | | | 6/14/17 | | | | (25 | ) | | | | | | | | |
| EUR | | | 346,100 | | | CHF | | | 375,000 | | | Citibank N.A. | | | 6/14/17 | | | | (64 | ) | | | | | | | | |
| EUR | | | 389,507 | | | HUF | | | 122,202,851 | | | Citibank N.A. | | | 6/14/17 | | | | (436 | ) | | | | | | | | |
| EUR | | | 615,856 | | | HUF | | | 193,571,149 | | | Citibank N.A. | | | 6/14/17 | | | | (1,922 | ) | | | | | | | | |
| EUR | | | 85,389 | | | PLN | | | 372,000 | | | BNP Paribas S.A. | | | 6/14/17 | | | | (2,648 | ) | | | | | | | | |
| EUR | | | 408,088 | | | PLN | | | 1,782,000 | | | Citibank N.A. | | | 6/14/17 | | | | (13,724 | ) | | | | | | | | |
| EUR | | | 1,413 | | | PLN | | | 6,000 | | | Deutsche Bank AG | | | 6/14/17 | | | | (3 | ) | | | | | | | | |
| EUR | | | 15,324 | | | PLN | | | 65,000 | | | HSBC Bank USA N.A. | | | 6/14/17 | | | | (22 | ) | | | | | | | | |
| EUR | | | 275,338 | | | PLN | | | 1,198,000 | | | UBS AG | | | 6/14/17 | | | | (8,147 | ) | | | | | | | | |
| EUR | | | 141,916 | | | RON | | | 645,000 | | | Citibank N.A. | | | 6/14/17 | | | | (16 | ) | | | | | | | | |
| EUR | | | 165,393 | | | RON | | | 756,000 | | | Citibank N.A. | | | 6/14/17 | | | | (1,052 | ) | | | | | | | | |
| EUR | | | 167,458 | | | RON | | | 763,000 | | | Citibank N.A. | | | 6/14/17 | | | | (480 | ) | | | | | | | | |
| EUR | | | 167,990 | | | RON | | | 764,000 | | | Citibank N.A. | | | 6/14/17 | | | | (138 | ) | | | | | | | | |
| EUR | | | 167,078 | | | RON | | | 763,000 | | | HSBC Bank USA N.A. | | | 6/14/17 | | | | (894 | ) | | | | | | | | |
| EUR | | | 1,255,000 | | | USD | | | 1,370,036 | | | Citibank N.A. | | | 6/14/17 | | | | (125 | ) | | | | | | | | |
| EUR | | | 1,520,000 | | | USD | | | 1,665,236 | | | Citibank N.A. | | | 6/14/17 | | | | (6,061 | ) | | | | | | | | |
| EUR | | | 1,814,000 | | | USD | | | 1,980,168 | | | Citibank N.A. | | | 6/14/17 | | | | (74 | ) | | | | | | | | |
| EUR | | | 273,000 | | | USD | | | 298,159 | | | Deutsche Bank AG | | | 6/14/17 | | | | (163 | ) | | | | | | | | |
| HUF | | | 118,000 | | | EUR | | | 378 | | | BNP Paribas S.A. | | | 6/14/17 | | | | (1 | ) | | | | | | | | |
| HUF | | | 1,421,735,000 | | | EUR | | | 4,590,833 | | | Citibank N.A. | | | 6/14/17 | | | | (59,575 | ) | | | | | | | | |
| HUF | | | 106,862,000 | | | EUR | | | 341,875 | | | Deutsche Bank AG | | | 6/14/17 | | | | (1,000 | ) | | | | | | | | |
See Notes to Consolidated Financial Statements.
| | | | | | |
| | | | | | | |
| | BLACKROCK TOTAL EMERGING MARKETS FUND | | APRIL 30, 2017 | | 15 |
| | |
Consolidated Schedule of Investments (continued) | | |
| | | | | | | | | | | | | | | | | | | | | | | | | | | | |
| Forward Foreign Currency Exchange Contracts (continued) | | | | | | | | | | | | |
Currency
Purchased | | | Currency
Sold | | | Counterparty | | Settlement
Date | | | Unrealized
Appreciation
(Depreciation) | | | | | | | |
| HUF | | | 52,702,000 | | | EUR | | | 168,859 | | | JPMorgan Chase Bank N.A. | | | 6/14/17 | | | $ | (770 | ) | | | | | | | | |
| HUF | | | 52,090,000 | | | EUR | | | 167,333 | | | UBS AG | | | 6/14/17 | | | | (1,235 | ) | | | | | | | | |
| IDR | | | 2,208,347,000 | | | USD | | | 165,730 | | | JPMorgan Chase Bank N.A. | | | 6/14/17 | | | | (712 | ) | | | | | | | | |
| JPY | | | 5,612,000 | | | USD | | | 51,614 | | | Citibank N.A. | | | 6/14/17 | | | | (1,187 | ) | | | | | | | | |
| JPY | | | 6,436,000 | | | USD | | | 58,033 | | | Citibank N.A. | | | 6/14/17 | | | | (202 | ) | | | | | | | | |
| JPY | | | 22,479,000 | | | USD | | | 202,685 | | | Citibank N.A. | | | 6/14/17 | | | | (699 | ) | | | | | | | | |
| JPY | | | 25,651,000 | | | USD | | | 231,988 | | | Citibank N.A. | | | 6/14/17 | | | | (1,499 | ) | | | | | | | | |
| JPY | | | 59,090,000 | | | USD | | | 534,268 | | | Citibank N.A. | | | 6/14/17 | | | | (3,311 | ) | | | | | | | | |
| JPY | | | 15,003,000 | | | USD | | | 138,024 | | | Deutsche Bank AG | | | 6/14/17 | | | | (3,214 | ) | | | | | | | | |
| JPY | | | 87,523,000 | | | USD | | | 792,135 | | | Deutsche Bank AG | | | 6/14/17 | | | | (5,692 | ) | | | | | | | | |
| JPY | | | 97,098,000 | | | USD | | | 874,273 | | | Deutsche Bank AG | | | 6/14/17 | | | | (1,794 | ) | | | | | | | | |
| JPY | | | 46,083,000 | | | USD | | | 416,259 | | | HSBC Bank USA N.A. | | | 6/14/17 | | | | (2,178 | ) | | | | | | | | |
| JPY | | | 13,215,000 | | | USD | | | 120,917 | | | JPMorgan Chase Bank N.A. | | | 6/14/17 | | | | (2,173 | ) | | | | | | | | |
| JPY | | | 37,772,000 | | | USD | | | 342,297 | | | UBS AG | | | 6/14/17 | | | | (2,895 | ) | | | | | | | | |
| KRW | | | 32,278,000 | | | USD | | | 28,902 | | | JPMorgan Chase Bank N.A. | | | 6/14/17 | | | | (520 | ) | | | | | | | | |
| KRW | | | 57,241,000 | | | USD | | | 51,424 | | | JPMorgan Chase Bank N.A. | | | 6/14/17 | | | | (1,092 | ) | | | | | | | | |
| KRW | | | 248,416,000 | | | USD | | | 222,657 | | | JPMorgan Chase Bank N.A. | | | 6/14/17 | | | | (4,223 | ) | | | | | | | | |
| KRW | | | 673,882,000 | | | USD | | | 608,197 | | | JPMorgan Chase Bank N.A. | | | 6/14/17 | | | | (15,648 | ) | | | | | | | | |
| MXN | | | 2,206,214 | | | USD | | | 116,504 | | | Bank of America N.A. | | | 6/14/17 | | | | (128 | ) | | | | | | | | |
| MXN | | | 2,233,000 | | | USD | | | 119,467 | | | Deutsche Bank AG | | | 6/14/17 | | | | (1,678 | ) | | | | | | | | |
| MXN | | | 4,516,000 | | | USD | | | 238,369 | | | Deutsche Bank AG | | | 6/14/17 | | | | (153 | ) | | | | | | | | |
| MXN | | | 4,580,786 | | | USD | | | 241,854 | | | Deutsche Bank AG | | | 6/14/17 | | | | (221 | ) | | | | | | | | |
| MXN | | | 7,936,000 | | | USD | | | 419,966 | | | Deutsche Bank AG | | | 6/14/17 | | | | (1,349 | ) | | | | | | | | |
| MXN | | | 3,506,000 | | | USD | | | 185,798 | | | JPMorgan Chase Bank N.A. | | | 6/14/17 | | | | (860 | ) | | | | | | | | |
| NOK | | | 12,000 | | | EUR | | | 1,301 | | | Citibank N.A. | | | 6/14/17 | | | | (21 | ) | | | | | | | | |
| NOK | | | 21,000 | | | EUR | | | 2,274 | | | Citibank N.A. | | | 6/14/17 | | | | (35 | ) | | | | | | | | |
| NOK | | | 46,000 | | | EUR | | | 5,031 | | | Citibank N.A. | | | 6/14/17 | | | | (131 | ) | | | | | | | | |
| NOK | | | 2,598,000 | | | EUR | | | 278,142 | | | Citibank N.A. | | | 6/14/17 | | | | (874 | ) | | | | | | | | |
| NOK | | | 11,000 | | | EUR | | | 1,205 | | | Deutsche Bank AG | | | 6/14/17 | | | | (34 | ) | | | | | | | | |
| NOK | | | 3,000 | | | EUR | | | 326 | | | HSBC Bank USA N.A. | | | 6/14/17 | | | | (7 | ) | | | | | | | | |
| NZD | | | 1,273,000 | | | USD | | | 884,531 | | | Citibank N.A. | | | 6/14/17 | | | | (11,441 | ) | | | | | | | | |
| NZD | | | 1,000 | | | USD | | | 697 | | | Deutsche Bank AG | | | 6/14/17 | | | | (11 | ) | | | | | | | | |
| NZD | | | 3,000 | | | USD | | | 2,107 | | | Deutsche Bank AG | | | 6/14/17 | | | | (50 | ) | | | | | | | | |
| NZD | | | 1,288,000 | | | USD | | | 905,155 | | | Deutsche Bank AG | | | 6/14/17 | | | | (21,777 | ) | | | | | | | | |
| NZD | | | 7,000 | | | USD | | | 4,906 | | | JPMorgan Chase Bank N.A. | | | 6/14/17 | | | | (105 | ) | | | | | | | | |
| NZD | | | 15,000 | | | USD | | | 10,401 | | | UBS AG | | | 6/14/17 | | | | (113 | ) | | | | | | | | |
| PHP | | | 123,000 | | | USD | | | 2,471 | | | JPMorgan Chase Bank N.A. | | | 6/14/17 | | | | (28 | ) | | | | | | | | |
| PLN | | | 911,000 | | | EUR | | | 215,107 | | | Citibank N.A. | | | 6/14/17 | | | | (60 | ) | | | | | | | | |
| RUB | | | 14,000 | | | USD | | | 246 | | | JPMorgan Chase Bank N.A. | | | 6/14/17 | | | | (3 | ) | | | | | | | | |
| RUB | | | 8,143,000 | | | USD | | | 143,312 | | | JPMorgan Chase Bank N.A. | | | 6/14/17 | | | | (1,590 | ) | | | | | | | | |
| RUB | | | 14,456,000 | | | USD | | | 253,725 | | | JPMorgan Chase Bank N.A. | | | 6/14/17 | | | | (2,131 | ) | | | | | | | | |
| RUB | | | 22,765,000 | | | USD | | | 403,706 | | | JPMorgan Chase Bank N.A. | | | 6/14/17 | | | | (7,501 | ) | | | | | | | | |
| SEK | | | 14,000 | | | EUR | | | 1,475 | | | BNP Paribas S.A. | | | 6/14/17 | | | | (26 | ) | | | | | | | | |
| SEK | | | 35,000 | | | EUR | | | 3,690 | | | BNP Paribas S.A. | | | 6/14/17 | | | | (67 | ) | | | | | | | | |
| SEK | | | 3,397,000 | | | EUR | | | 355,893 | | | BNP Paribas S.A. | | | 6/14/17 | | | | (4,127 | ) | | | | | | | | |
| SEK | | | 2,645,000 | | | EUR | | | 276,362 | | | Citibank N.A. | | | 6/14/17 | | | | (2,399 | ) | | | | | | | | |
| SEK | | | 3,457,000 | | | EUR | | | 358,630 | | | Citibank N.A. | | | 6/14/17 | | | | (327 | ) | | | | | | | | |
| SEK | | | 3,539,000 | | | EUR | | | 368,413 | | | Citibank N.A. | | | 6/14/17 | | | | (1,727 | ) | | | | | | | | |
| SEK | | | 5,217,000 | | | EUR | | | 544,799 | | | Citibank N.A. | | | 6/14/17 | | | | (4,407 | ) | | | | | | | | |
| SEK | | | 5,356,000 | | | EUR | | | 560,605 | | | Citibank N.A. | | | 6/14/17 | | | | (5,933 | ) | | | | | | | | |
| SEK | | | 20,513,000 | | | EUR | | | 2,156,069 | | | Citibank N.A. | | | 6/14/17 | | | | (32,550 | ) | | | | | | | | |
| SEK | | | 4,987,000 | | | EUR | | | 518,513 | | | Credit Suisse International | | | 6/14/17 | | | | (1,738 | ) | | | | | | | | |
| SEK | | | 3,122,000 | | | EUR | | | 328,492 | | | HSBC Bank USA N.A. | | | 6/14/17 | | | | (5,332 | ) | | | | | | | | |
| SEK | | | 23,000 | | | EUR | | | 2,400 | | | UBS AG | | | 6/14/17 | | | | (17 | ) | | | | | | | | |
| SEK | | | 730,000 | | | EUR | | | 76,239 | | | UBS AG | | | 6/14/17 | | | | (624 | ) | | | | | | | | |
| SEK | | | 1,703,000 | | | EUR | | | 179,089 | | | UBS AG | | | 6/14/17 | | | | (2,802 | ) | | | | | | | | |
| SEK | | | 2,995,000 | | | EUR | | | 313,437 | | | UBS AG | | | 6/14/17 | | | | (3,268 | ) | | | | | | | | |
| SEK | | | 4,864,000 | | | EUR | | | 509,155 | | | UBS AG | | | 6/14/17 | | | | (5,439 | ) | | | | | | | | |
| SGD | | | 56,000 | | | USD | | | 40,190 | | | BNP Paribas S.A. | | | 6/14/17 | | | | (91 | ) | | | | | | | | |
| SGD | | | 138,000 | | | USD | | | 99,027 | | | Deutsche Bank AG | | | 6/14/17 | | | | (211 | ) | | | | | | | | |
| SGD | | | 60,000 | | | USD | | | 42,986 | | | JPMorgan Chase Bank N.A. | | | 6/14/17 | | | | (23 | ) | | | | | | | | |
| THB | | | 745,000 | | | USD | | | 21,691 | | | JPMorgan Chase Bank N.A. | | | 6/14/17 | | | | (159 | ) | | | | | | | | |
| THB | | | 372,000 | | | USD | | | 10,762 | | | UBS AG | | | 6/14/17 | | | | (11 | ) | | | | | | | | |
| TWD | | | 1,845,000 | | | USD | | | 61,304 | | | JPMorgan Chase Bank N.A. | | | 6/14/17 | | | | (128 | ) | | | | | | | | |
See Notes to Consolidated Financial Statements.
| | | | | | |
| | | | | | | |
| 16 | | BLACKROCK TOTAL EMERGING MARKETS FUND | | APRIL 30, 2017 | | |
| | |
Consolidated Schedule of Investments (continued) | | |
| | | | | | | | | | | | | | | | | | | | | | | | | | | | |
| Forward Foreign Currency Exchange Contracts (continued) | | | | | | | | | | | | |
Currency
Purchased | | | Currency
Sold | | | Counterparty | | Settlement
Date | | | Unrealized
Appreciation
(Depreciation) | | | | | | | |
| USD | | | 202,508 | | | AUD | | | 271,000 | | | Citibank N.A. | | | 6/14/17 | | | $ | (262 | ) | | | | | | | | |
| USD | | | 482,630 | | | BRL | | | 1,549,000 | | | JPMorgan Chase Bank N.A. | | | 6/14/17 | | | | (468 | ) | | | | | | | | |
| USD | | | 251,741 | | | CAD | | | 344,000 | | | Citibank N.A. | | | 6/14/17 | | | | (422 | ) | | | | | | | | |
| USD | | | 681,492 | | | CLP | | | 458,276,000 | | | JPMorgan Chase Bank N.A. | | | 6/14/17 | | | | (3,776 | ) | | | | | | | | |
| USD | | | 358,984 | | | COP | | | 1,091,670,000 | | | JPMorgan Chase Bank N.A. | | | 6/14/17 | | | | (9,730 | ) | | | | | | | | |
| USD | | | 360,846 | | | COP | | | 1,070,395,000 | | | JPMorgan Chase Bank N.A. | | | 6/14/17 | | | | (683 | ) | | | | | | | | |
| USD | | | 720,021 | | | COP | | | 2,188,865,000 | | | JPMorgan Chase Bank N.A. | | | 6/14/17 | | | | (19,273 | ) | | | | | | | | |
| USD | | | 720,359 | | | COP | | | 2,180,526,000 | | | JPMorgan Chase Bank N.A. | | | 6/14/17 | | | | (16,119 | ) | | | | | | | | |
| USD | | | 403,717 | | | EUR | | | 370,000 | | | Citibank N.A. | | | 6/14/17 | | | | (161 | ) | | | | | | | | |
| USD | | | 996,673 | | | EUR | | | 932,000 | | | Citibank N.A. | | | 6/14/17 | | | | (20,663 | ) | | | | | | | | |
| USD | | | 3,887,925 | | | EUR | | | 3,660,309 | | | Citibank N.A. | | | 6/14/17 | | | | (107,530 | ) | | | | | | | | |
| USD | | | 4,495,767 | | | EUR | | | 4,194,000 | | | Citibank N.A. | | | 6/14/17 | | | | (82,246 | ) | | | | | | | | |
| USD | | | 40,379 | | | EUR | | | 38,000 | | | Credit Suisse International | | | 6/14/17 | | | | (1,101 | ) | | | | | | | | |
| USD | | | 122,988 | | | EUR | | | 115,000 | | | Deutsche Bank AG | | | 6/14/17 | | | | (2,542 | ) | | | | | | | | |
| USD | | | 275,171 | | | EUR | | | 255,000 | | | Deutsche Bank AG | | | 6/14/17 | | | | (3,178 | ) | | | | | | | | |
| USD | | | 585,263 | | | EUR | | | 546,000 | | | Deutsche Bank AG | | | 6/14/17 | | | | (10,730 | ) | | | | | | | | |
| USD | | | 1,083,239 | | | EUR | | | 1,017,000 | | | Deutsche Bank AG | | | 6/14/17 | | | | (26,880 | ) | | | | | | | | |
| USD | | | 142,207 | | | EUR | | | 132,000 | | | JPMorgan Chase Bank N.A. | | | 6/14/17 | | | | (1,879 | ) | | | | | | | | |
| USD | | | 223,698 | | | GBP | | | 184,000 | | | BNP Paribas S.A. | | | 6/14/17 | | | | (14,898 | ) | | | | | | | | |
| USD | | | 310,205 | | | GBP | | | 249,000 | | | BNP Paribas S.A. | | | 6/14/17 | | | | (12,678 | ) | | | | | | | | |
| USD | | | 53,919 | | | GBP | | | 44,000 | | | Citibank N.A. | | | 6/14/17 | | | | (3,136 | ) | | | | | | | | |
| USD | | | 328,971 | | | GBP | | | 254,000 | | | Citibank N.A. | | | 6/14/17 | | | | (396 | ) | | | | | | | | |
| USD | | | 339,505 | | | GBP | | | 272,000 | | | Deutsche Bank AG | | | 6/14/17 | | | | (13,203 | ) | | | | | | | | |
| USD | | | 287,800 | | | GBP | | | 231,000 | | | HSBC Bank USA N.A. | | | 6/14/17 | | | | (11,742 | ) | | | | | | | | |
| USD | | | 6,412 | | | GBP | | | 5,000 | | | JPMorgan Chase Bank N.A. | | | 6/14/17 | | | | (71 | ) | | | | | | | | |
| USD | | | 305,286 | | | GBP | | | 242,000 | | | JPMorgan Chase Bank N.A. | | | 6/14/17 | | | | (8,520 | ) | | | | | | | | |
| USD | | | 11,201 | | | GBP | | | 9,000 | | | UBS AG | | | 6/14/17 | | | | (469 | ) | | | | | | | | |
| USD | | | 341,382 | | | IDR | | | 4,571,106,000 | | | JPMorgan Chase Bank N.A. | | | 6/14/17 | | | | (191 | ) | | | | | | | | |
| USD | | | 366,792 | | | IDR | | | 4,959,028,000 | | | JPMorgan Chase Bank N.A. | | | 6/14/17 | | | | (3,768 | ) | | | | | | | | |
| USD | | | 4,244,229 | | | IDR | | | 57,000,000,000 | | | Deutsche Bank AG | | | 6/16/17 | | | | (14,138 | ) | | | | | | | | |
| USD | | | 901,323 | | | INR | | | 58,568,000 | | | BNP Paribas S.A. | | | 6/14/17 | | | | (5,686 | ) | | | | | | | | |
| USD | | | 1,584,615 | | | INR | | | 106,605,000 | | | BNP Paribas S.A. | | | 6/14/17 | | | | (66,315 | ) | | | | | | | | |
| USD | | | 646 | | | INR | | | 42,000 | | | JPMorgan Chase Bank N.A. | | | 6/14/17 | | | | (4 | ) | | | | | | | | |
| USD | | | 359,992 | | | INR | | | 23,438,000 | | | JPMorgan Chase Bank N.A. | | | 6/14/17 | | | | (2,979 | ) | | | | | | | | |
| USD | | | 362,689 | | | INR | | | 23,573,000 | | | JPMorgan Chase Bank N.A. | | | 6/14/17 | | | | (2,372 | ) | | | | | | | | |
| USD | | | 276 | | | JPY | | | 31,000 | | | BNP Paribas S.A. | | | 6/14/17 | | | | (2 | ) | | | | | | | | |
| USD | | | 201,176 | | | JPY | | | 22,390,000 | | | Citibank N.A. | | | 6/14/17 | | | | (10 | ) | | | | | | | | |
| USD | | | 1,478,039 | | | JPY | | | 167,895,000 | | | Deutsche Bank AG | | | 6/14/17 | | | | (30,590 | ) | | | | | | | | |
| USD | | | 62,696 | | | JPY | | | 6,994,000 | | | JPMorgan Chase Bank N.A. | | | 6/14/17 | | | | (149 | ) | | | | | | | | |
| USD | | | 2,698,227 | | | JPY | | | 304,781,000 | | | JPMorgan Chase Bank N.A. | | | 6/14/17 | | | | (40,398 | ) | | | | | | | | |
| USD | | | 645,340 | | | KRW | | | 738,656,000 | | | BNP Paribas S.A. | | | 6/14/17 | | | | (4,165 | ) | | | | | | | | |
| USD | | | 5,528,135 | | | KRW | | | 6,355,973,000 | | | HSBC Bank USA N.A. | | | 6/14/17 | | | | (60,713 | ) | | | | | | | | |
| USD | | | 257,587 | | | KRW | | | 293,587,000 | | | JPMorgan Chase Bank N.A. | | | 6/14/17 | | | | (566 | ) | | | | | | | | |
| USD | | | 346,666 | | | KRW | | | 400,000,000 | | | JPMorgan Chase Bank N.A. | | | 6/16/17 | | | | (5,063 | ) | | | | | | | | |
| USD | | | 523,931 | | | KRW | | | 600,000,000 | | | JPMorgan Chase Bank N.A. | | | 6/16/17 | | | | (3,663 | ) | | | | | | | | |
| USD | | | 263,487 | | | MXN | | | 5,000,000 | | | Citibank N.A. | | | 6/16/17 | | | | (175 | ) | | | | | | | | |
| USD | | | 1,715,815 | | | MXN | | | 33,900,000 | | | Deutsche Bank AG | | | 6/16/17 | | | | (71,807 | ) | | | | | | | | |
| USD | | | 299,147 | | | MXN | | | 5,690,000 | | | JPMorgan Chase Bank N.A. | | | 6/16/17 | | | | (899 | ) | | | | | | | | |
| USD | | | 92,380 | | | MYR | | | 411,000 | | | BNP Paribas S.A. | | | 6/14/17 | | | | (2,398 | ) | | | | | | | | |
| USD | | | 30,139 | | | MYR | | | 134,000 | | | JPMorgan Chase Bank N.A. | | | 6/14/17 | | | | (761 | ) | | | | | | | | |
| USD | | | 98,004 | | | MYR | | | 432,000 | | | JPMorgan Chase Bank N.A. | | | 6/14/17 | | | | (1,617 | ) | | | | | | | | |
| USD | | | 181,818 | | | MYR | | | 808,000 | | | JPMorgan Chase Bank N.A. | | | 6/14/17 | | | | (4,509 | ) | | | | | | | | |
| USD | | | 226,985 | | | NZD | | | 331,000 | | | Citibank N.A. | | | 6/14/17 | | | | (32 | ) | | | | | | | | |
| USD | | | 873 | | | PHP | | | 44,000 | | | JPMorgan Chase Bank N.A. | | | 6/14/17 | | | | (1 | ) | | | | | | | | |
| USD | | | 181,559 | | | PHP | | | 9,156,000 | | | JPMorgan Chase Bank N.A. | | | 6/14/17 | | | | (281 | ) | | | | | | | | |
| USD | | | 358,887 | | | PHP | | | 18,122,000 | | | JPMorgan Chase Bank N.A. | | | 6/14/17 | | | | (1,019 | ) | | | | | | | | |
| USD | | | 360,611 | | | PHP | | | 18,310,000 | | | JPMorgan Chase Bank N.A. | | | 6/14/17 | | | | (3,030 | ) | | | | | | | | |
| USD | | | 361,999 | | | PHP | | | 18,252,000 | | | JPMorgan Chase Bank N.A. | | | 6/14/17 | | | | (489 | ) | | | | | | | | |
| USD | | | 540,118 | | | PHP | | | 27,519,000 | | | JPMorgan Chase Bank N.A. | | | 6/14/17 | | | | (6,415 | ) | | | | | | | | |
| USD | | | 718,731 | | | PHP | | | 36,242,000 | | | JPMorgan Chase Bank N.A. | | | 6/14/17 | | | | (1,043 | ) | | | | | | | | |
| USD | | | 271,054 | | | RUB | | | 15,800,000 | | | JPMorgan Chase Bank N.A. | | | 6/14/17 | | | | (3,932 | ) | | | | | | | | |
| USD | | | 361,308 | | | RUB | | | 21,216,000 | | | JPMorgan Chase Bank N.A. | | | 6/14/17 | | | | (7,938 | ) | | | | | | | | |
| USD | | | 94,706 | | | SGD | | | 134,000 | | | BNP Paribas S.A. | | | 6/14/17 | | | | (1,245 | ) | | | | | | | | |
| USD | | | 254,889 | | | TRY | | | 950,000 | | | BNP Paribas S.A. | | | 6/14/17 | | | | (9,305 | ) | | | | | | | | |
See Notes to Consolidated Financial Statements.
| | | | | | |
| | | | | | | |
| | BLACKROCK TOTAL EMERGING MARKETS FUND | | APRIL 30, 2017 | | 17 |
| | |
Consolidated Schedule of Investments (continued) | | |
| | | | | | | | | | | | | | | | | | | | | | | | | | | | |
| Forward Foreign Currency Exchange Contracts (concluded) | | | | | | | | | | | | |
Currency
Purchased | | | Currency
Sold | | | Counterparty | | Settlement
Date | | | Unrealized
Appreciation
(Depreciation) | | | | | | | |
| USD | | | 70,816 | | | TRY | | | 273,000 | | | Bank of America N.A. | | | 6/14/17 | | | $ | (5,105 | ) | | | | | | | | |
| USD | | | 165,580 | | | TRY | | | 625,000 | | | Citibank N.A. | | | 6/14/17 | | | | (8,231 | ) | | | | | | | | |
| USD | | | 1,511,718 | | | PHP | | | 76,886,000 | | | BNP Paribas S.A. | | | 6/14/17 | | | | (15,253 | ) | | | | | | | | |
| USD | | | 129,562 | | | TRY | | | 486,000 | | | Deutsche Bank AG | | | 6/14/17 | | | | (5,594 | ) | | | | | | | | |
| USD | | | 202,453 | | | TRY | | | 754,000 | | | Deutsche Bank AG | | | 6/14/17 | | | | (7,233 | ) | | | | | | | | |
| USD | | | 404,204 | | | TWD | | | 12,230,000 | | | JPMorgan Chase Bank N.A. | | | 6/14/17 | | | | (1,316 | ) | | | | | | | | |
| USD | | | 108,537 | | | THB | | | 3,839,000 | | | BNP Paribas S.A. | | | 6/14/17 | | | | (2,418 | ) | | | | | | | | |
| USD | | | 64,904 | | | ZAR | | | 905,000 | | | BNP Paribas S.A. | | | 6/14/17 | | | | (2,330 | ) | | | | | | | | |
| USD | | | 288,984 | | | ZAR | | | 3,991,000 | | | Citibank N.A. | | | 6/14/17 | | | | (7,515 | ) | | | | | | | | |
| USD | | | 363,301 | | | ZAR | | | 5,065,000 | | | Citibank N.A. | | | 6/14/17 | | | | (12,987 | ) | | | | | | | | |
| USD | | | 405,946 | | | ZAR | | | 5,555,000 | | | Citibank N.A. | | | 6/14/17 | | | | (6,746 | ) | | | | | | | | |
| USD | | | 451,076 | | | ZAR | | | 6,313,000 | | | Citibank N.A. | | | 6/14/17 | | | | (17,928 | ) | | | | | | | | |
| USD | | | 717,170 | | | ZAR | | | 10,000,000 | | | Citibank N.A. | | | 6/19/17 | | | | (25,123 | ) | | | | | | | | |
| USD | | | 22,265 | | | ZAR | | | 300,000 | | | JPMorgan Chase Bank N.A. | | | 6/19/17 | | | | (3 | ) | | | | | | | | |
| USD | | | 215,233 | | | ZAR | | | 2,900,000 | | | JPMorgan Chase Bank N.A. | | | 6/19/17 | | | | (32 | ) | | | | | | | | |
| ZAR | | | 432,000 | | | USD | | | 32,323 | | | BNP Paribas S.A. | | | 6/14/17 | | | | (229 | ) | | | | | | | | |
| ZAR | | | 3,331,538 | | | USD | | | 250,110 | | | Bank of America N.A. | | | 6/14/17 | | | | (2,604 | ) | | | | | | | | |
| ZAR | | | 784,000 | | | USD | | | 59,194 | | | Citibank N.A. | | | 6/14/17 | | | | (949 | ) | | | | | | | | |
| ZAR | | | 4,683,000 | | | USD | | | 362,984 | | | Citibank N.A. | | | 6/14/17 | | | | (15,075 | ) | | | | | | | | |
| ZAR | | | 3,324,000 | | | USD | | | 250,819 | | | JPMorgan Chase Bank N.A. | | | 6/14/17 | | | | (3,873 | ) | | | | | | | | |
| ZAR | | | 5,113,462 | | | USD | | | 383,948 | | | JPMorgan Chase Bank N.A. | | | 6/14/17 | | | | (4,060 | ) | | | | | | | | |
| | | | | | | | | | | | | | | | | | | | |
| | | | | | | | | | | | | | | | | | | | (1,464,327 | ) | | | | | | | | |
Net Unrealized Appreciation | | | | | | | | | | | | $ | 524,100 | | | | | | | | | |
| | | | | | | | | | | | | | | | | | | | |
| | | | | | | | | | | | | | | | | | | | | | | | | | | | |
| Centrally Cleared Interest Rate Swaps | | | | |
Fixed
Rate | | | Floating
Rate | | Effective
Date | | | Expiration
Date | | | Notional
Amount
(000) | | | Unrealized
Appreciation | | | | |
| | 7.12 | %1 | | 28 Day Mexican Interbank Rate | | | 9/20/17 | 2 | | | 9/14/22 | | | | MXN | | | | 8,450 | | | $ | 3,186 | | | | | |
| | 7.55 | %1 | | 28 Day Mexican Interbank Rate | | | 9/20/17 | 2 | | | 9/14/22 | | | | MXN | | | | 70,000 | | | | 37,751 | | | | | |
| | 2.40 | %1 | | 6-Month PLN WIBOR | | | 9/20/17 | 2 | | | 9/20/22 | | | | PLN | | | | 4,820 | | | | 6,756 | | | | | |
| | 2.64 | %1 | | 6-Month PLN WIBOR | | | 9/20/17 | 2 | | | 9/20/22 | | | | PLN | | | | 4,200 | | | | 6,149 | | | | | |
| | Total | | | | | | | | | | | | | | | | | | | | | $ | 53,842 | | | | | |
| | | | | | | | | | | | | | | | | | | | | | | | |
| | 1 Fund pays the floating rate and receives the fixed rate. | |
| | 2 Forward swap. | |
| | | | | | | | | | | | | | | | | | | | | | | | | | | | | | | | |
| OTC Interest Rate Swaps | |
| Fixed Rate | | | Floating
Rate | | Counterparty | | Effective
Date | | | Expiration
Date | | | Notional
Amount
(000) | | | Value | | | Premiums
Paid
(Received) | | | Unrealized
Appreciation
(Depreciation) | |
| | 1.03 | %1 | | 3-Month TWD Secondary Bank Rate | | JPMorgan Chase Bank N.A. | | | 9/20/17 | 2 | | | 9/20/22 | | | TWD | | | 39,160 | | | $ | (29 | ) | | | — | | | $ | (29 | ) |
| | 1.21 | %1 | | 3-Month TWD Secondary Bank Rate | | BNP Paribas S.A. | | | 9/20/17 | 2 | | | 9/20/22 | | | TWD | | | 30,000 | | | | 8,576 | | | | — | | | | 8,576 | |
| | 1.26 | %1 | | 3-Month TWD Secondary Bank Rate | | Bank of America N.A. | | | 9/20/17 | 2 | | | 9/20/22 | | | TWD | | | 145,000 | | | | 52,921 | | | | — | | | | 52,921 | |
| | 1.67 | %1 | | 3-Month KRW Certificate of Deposit Rate | | Deutsche Bank AG | | | 9/20/17 | 2 | | | 9/20/22 | | | KRW | | | 929,130 | | | | (3,777 | ) | | | — | | | | (3,777 | ) |
| | 1.83 | %1 | | 3-Month KRW Certificate of Deposit Rate | | Citibank N.A. | | | 9/20/17 | 2 | | | 9/20/22 | | | KRW | | | 3,200,000 | | | | 8,750 | | | | — | | | | 8,750 | |
| | 2.11 | %1 | | 6-Month THB Fixing Rate | | JPMorgan Chase Bank N.A. | | | 9/20/17 | 2 | | | 9/20/22 | | | THB | | | 30,520 | | | | (3,241 | ) | | | — | | | | (3,241 | ) |
| | 2.19 | %1 | | 6-Month THB Fixing Rate | | Goldman Sachs Bank USA | | | 9/20/17 | 2 | | | 9/20/22 | | | THB | | | 20,700 | | | | (83 | ) | | | — | | | | (83 | ) |
| | 2.27 | %1 | | 6-Month THB Fixing Rate | | Bank of America N.A. | | | 9/20/17 | 2 | | | 9/20/22 | | | THB | | | 36,020 | | | | 3,782 | | | | — | | | | 3,782 | |
| | 2.32 | %1 | | 6-Month THB Fixing Rate | | BNP Paribas S.A. | | | 9/20/17 | 2 | | | 9/20/22 | | | THB | | | 19,160 | | | | 3,513 | | | | — | | | | 3,513 | |
| | 2.32 | %1 | | 6-Month THB Fixing Rate | | Citibank N.A. | | | 9/20/17 | 2 | | | 9/20/22 | | | THB | | | 145,840 | | | | 26,242 | | | | — | | | | 26,242 | |
| | 2.66 | %1 | | 6-Month PLN WIBOR | | JPMorgan Chase Bank N.A. | | | 9/20/17 | 2 | | | 9/20/22 | | | PLN | | | 20,000 | | | | 33,546 | | | | — | | | | 33,546 | |
| | 3.44 | %1 | | 1-Day CLP Interbank Rate | | JPMorgan Chase Bank N.A. | | | 9/20/17 | 2 | | | 9/20/22 | | | CLP | | | 469,910 | | | | (2,613 | ) | | | — | | | | (2,613 | ) |
| | 3.80 | %1 | | 1-Day CLP Interbank Rate | | JPMorgan Chase Bank N.A. | | | 9/20/17 | 2 | | | 9/20/22 | | | CLP | | | 1,800,000 | | | | 34,662 | | | | — | | | | 34,662 | |
| | 3.81 | %1 | | 1-Day CLP Interbank Rate | | Citibank N.A. | | | 9/20/17 | 2 | | | 9/20/22 | | | CLP | | | 200,000 | | | | 3,989 | | | | — | | | | 3,989 | |
| | 4.02 | %1 | | 3-Month KLIBOR | | JPMorgan Chase Bank N.A. | | | 9/20/17 | 2 | | | 9/20/22 | | | MYR | | | 4,460 | | | | 3,722 | | | | — | | | | 3,722 | |
| | 4.17 | %1 | | 3-Month KLIBOR | | Bank of America N.A. | | | 9/20/17 | 2 | | | 9/20/22 | | | MYR | | | 2,840 | | | | 6,834 | | | | — | | | | 6,834 | |
| | 4.17 | %1 | | 3-Month KLIBOR | | JPMorgan Chase Bank N.A. | | | 9/20/17 | 2 | | | 9/20/22 | | | MYR | | | 4,890 | | | | 11,640 | | | | — | | | | 11,640 | |
See Notes to Consolidated Financial Statements.
| | | | | | |
| | | | | | | |
| 18 | | BLACKROCK TOTAL EMERGING MARKETS FUND | | APRIL 30, 2017 | | |
| | |
Consolidated Schedule of Investments (continued) | | |
| | | | | | | | | | | | | | | | | | | | | | | | | | | | | | | | | | |
| OTC Interest Rate Swaps (continued) | |
| Fixed Rate | | | Floating
Rate | | Counterparty | | Effective
Date | | | Expiration
Date | | | Notional
Amount
(000) | | | Value | | | Premiums
Paid
(Received) | | | Unrealized
Appreciation
(Depreciation) | |
| | 4.26 | %1 | | 3-Month KLIBOR | | Bank of America N.A. | | | 9/20/17 | 2 | | | 9/20/22 | | | | MYR | | | | 22,000 | | | $ | 72,776 | | | | — | | | $ | 72,776 | |
| | 7.77 | %1 | | 3-Month Johannesburg Interbank Agreed Rate | | Barclays Bank PLC | | | 9/20/17 | 2 | | | 9/20/22 | | | | ZAR | | | | 6,080 | | | | 3,533 | | | | — | | | | 3,533 | |
| | 7.98 | %1 | | 3-Month Johannesburg Interbank Agreed Rate | | JPMorgan Chase Bank N.A. | | | 9/20/17 | 2 | | | 9/20/22 | | | | ZAR | | | | 7,800 | | | | 9,591 | | | | — | | | | 9,591 | |
| | 7.76 | %1 | | 3-Month Johannesburg Interbank Agreed Rate | | JPMorgan Chase Bank N.A. | | | 9/20/17 | 2 | | | 9/20/22 | | | | ZAR | | | | 45,000 | | | | 25,602 | | | | — | | | | 25,602 | |
| | Total | | | | | | | | | | | | | | | | | | | | | | | $ | 299,936 | | | | — | | | $ | 299,936 | |
| | | | | | | | | | | | | | | | | | | | | | | | | | |
| | 1 Fund pays the floating rate and receives the fixed rate. | | | | | | | | | | | | | | | | | |
| | 2 Forward swap. | | | | | | | | | | | | | | | | | |
| | | | | | | | | | | | | | | | | | |
| OTC Total Return Swaps1 | | | | | | | | | | | | | | |
| Reference Entity | | Counterparty | | Expiration
Dates | | | Net
Notional | | | Unrealized
Appreciation | | | Net
Value of
Reference
Entities | |
Equity Securities | | Goldman Sachs Bank USA | | | 5/24/17 – 11/27/18 | | | $ | 75,897,124 | | | $ | 8,663,097 | 2 | | $ | 83,503,600 | |
Long/Short: | | UBS AG | | | 8/24/17 | | | $ | 72,288,116 | | | | 9,475,241 | 3 | | | 80,637,139 | |
Total | | | | | | | | | | | | $ | 18,138,338 | | | $ | 164,140,739 | |
| | | | | | | | | | | | | | |
1 The Fund receives or pays the total return on a portfolio of long and short positions underlying the total return swap. In addition, the Fund pays or receives a variable rate of interest, based on a specified benchmark, plus or minus a spread in a range of 20-1,000 basis points. The benchmark and spread are determined based upon the country and/or currency of the individual underlying positions. The following are the specified benchmarks used in determining the variable rate of interest: Garban Intercapital Federal Funds Rate Open Taiwan Interbank Money Center TAIBOR 1 Week Intercontinental Exchange LIBOR: USD 1 Month; USD Spot Next; USD 1 Week GBP 1 Week; GBP Overnight Hong Kong HIBOR Fixing 2 Week JPY Spot Next | |
2 Amount includes $1,056,621 of net dividends and financing fees. | |
3 Amount includes $1,126,218 of net dividends and financing fees. | |
See Notes to Consolidated Financial Statements.
| | | | | | |
| | | | | | | |
| | BLACKROCK TOTAL EMERGING MARKETS FUND | | APRIL 30, 2017 | | 19 |
| | |
Consolidated Schedule of Investments (continued) | | |
| | | | | | | | |
The following table represents the individual long and short positions and related
values of the equity securities underlying the total return swap with Goldman
Sachs Bank USA as of April 30, 2017, expiration dates 5/24/17 – 11/27/18: | |
| | | Shares | | | Value | |
| Reference Entity — Long | |
| Brazil | |
Banco do Estado do Rio Grande do Sul, Preference Shares | | | 15,900 | | | $ | 71,183 | |
Cia de Saneamento Basico do Estado de Sao Paulo — ADR | | | 80,077 | | | | 736,708 | |
Cia Energetica de Sao Paulo, Preference ‘B’ Shares | | | 38,600 | | | | 220,116 | |
Companhia de Saneamento Basico do Estado de Sao Paulo | | | 40,100 | | | | 369,789 | |
Engie Brasil Energia SA | | | 14,336 | | | | 153,565 | |
Fleury SA | | | 74,700 | | | | 1,236,037 | |
Hypermarcas SA | | | 158,000 | | | | 1,496,347 | |
Itau Unibanco Holding SA, Preference Shares | | | 43,297 | | | | 535,543 | |
Itau Unibanco Holding SA, Preference Shares — ADR | | | 264,035 | | | | 3,247,631 | |
M Dias Branco SA | | | 29,000 | | | | 445,226 | |
Marfrig Global Foods SA | | | 12,500 | | | | 28,434 | |
Smiles SA | | | 21,900 | | | | 476,356 | |
Telefonica Brasil SA, Preference Shares | | | 16,000 | | | | 238,383 | |
| | | | | | | | |
| | | | | | | | 9,255,318 | |
| Chile | |
Empresa Nacional de Electricidad SA — ADR | | | 64,768 | | | | 1,488,369 | |
| China | |
Alibaba Group Holding Ltd. — ADR | | | 13,891 | | | | 1,604,410 | |
Aluminum Corp. of China Ltd., Class H | | | 104,000 | | | | 51,114 | |
Beijing Capital International Airport Co. Ltd., Class H | | | 208,000 | | | | 293,433 | |
BYD Electronic International Co., Ltd. | | | 36,000 | | | | 54,946 | |
China Agri-Industries Holdings Ltd. | | | 126,000 | | | | 62,324 | |
China Biologic Products, Inc. | | | 26,693 | | | | 3,149,774 | |
China Communications Services Corp. Ltd., Class H | | | 1,040,000 | | | | 591,836 | |
China Lesso Group Holdings Ltd. | | | 80,000 | | | | 63,693 | |
China Petroleum & Chemical Corp., Class H | | | 816,000 | | | | 662,636 | |
China Petroleum & Chemical Corp. — ADR | | | 40,656 | | | | 3,308,179 | |
Longfor Properties Co. Ltd. | | | 329,000 | | | | 569,278 | |
Lonking Holdings Ltd. | | | 181,000 | | | | 50,398 | |
Metallurgical Corp. of China Ltd. | | | 103,000 | | | | 38,063 | |
NetEase, Inc. — ADR | | | 15,546 | | | | 4,125,753 | |
People’s Insurance Co. Group of China Ltd., Class H | | | 631,000 | | | | 260,023 | |
Ping An Insurance Group Co. of China Ltd., Class H | | | 426,500 | | | | 2,397,891 | |
Shanghai Pharmaceuticals Holding Co. Ltd., Class H | | | 120,800 | | | | 319,509 | |
Sino-Ocean Land Holdings Ltd. | | | 523,000 | | | | 255,128 | |
Sinopec Shanghai Petrochemical Co. Ltd., — ADR | | | 2,735 | | | | 153,105 | |
Sinopec Shanghai Petrochemical Co. Ltd., Class H | | | 318,000 | | | | 177,694 | |
Sohu.com, Inc. | | | 32,926 | | | | 1,277,529 | |
Tencent Holdings Ltd. | | | 58,500 | | | | 1,832,999 | |
Tianneng Power International Ltd. | | | 186,000 | | | | 162,723 | |
Weichai Power Co. Ltd., Class H | | | 375,000 | | | | 607,632 | |
YY, Inc. — ADR | | | 3,424 | | | | 167,673 | |
Zhejiang Expressway Co. Ltd., Class H | | | 206,000 | | | | 256,261 | |
Zijin Mining Group Co. Ltd., Class H | | | 290,000 | | | | 102,918 | |
| | | | | | | | |
| | | | | | | | 22,596,922 | |
| Hong Kong | |
Belle International Holdings Ltd. | | | 492,000 | | | | 333,341 | |
China Jinmao Holdings Group Ltd. | | | 208,000 | | | | 67,278 | |
China Mobile Ltd. | | | 129,500 | | | | 1,378,737 | |
China Resources Cement Holdings Ltd. | | | 572,000 | | | | 312,743 | |
China Resources Land Ltd. | | | 354,222 | | | | 981,558 | |
ENN Energy Holdings Ltd. | | | 10,000 | | | | 54,209 | |
Geely Automobile Holdings Ltd. | | | 60,000 | | | | 80,841 | |
Haier Electronics Group Co. Ltd. | | | 191,000 | | | | 442,894 | |
KWG Property Holding Ltd. | | | 509,500 | | | | 384,881 | |
Nine Dragons Paper Holdings Ltd. | | | 963,000 | | | | 1,038,560 | |
Shenzhen Investment Ltd. | | | 932,000 | | | | 422,358 | |
| | | | | | | | |
| | | Shares | | | Value | |
| Reference Entity — Long (continued) | |
| Hong Kong (continued) | |
Shimao Property Holdings Ltd. | | | 250,500 | | | $ | 402,058 | |
Yuexiu Property Co. Ltd. | | | 2,960,000 | | | | 501,769 | |
| | | | | | | | |
| | | | | | | | 6,401,227 | |
| Hungary | |
MOL Hungarian Oil & Gas PLC | | | 703 | | | | 52,885 | |
Richter Gedeon Nyrt | | | 1,613 | | | | 39,061 | |
| | | | | | | | |
| | | | | | | | 91,946 | |
| Indonesia | |
Adaro Energy Tbk PT | | | 690,100 | | | | 91,768 | |
Bank Central Asia Tbk PT | | | 49,000 | | | | 65,167 | |
Matahari Department Store Tbk PT | | | 586,700 | | | | 641,093 | |
Telekomunikasi Indonesia Persero Tbk PT | | | 1,600,600 | | | | 528,016 | |
Telekomunikasi Indonesia Persero Tbk PT — ADR | | | 110,172 | | | | 3,608,133 | |
United Tractors Tbk PT | | | 54,800 | | | | 110,489 | |
| | | | | | | | |
| | | | | | | | 5,044,666 | |
| Malaysia | |
Astro Malaysia Holdings Bhd | | | 421,600 | | | | 262,225 | |
Petronas Dagangan Bhd | | | 9,000 | | | | 49,883 | |
| | | | | | | | |
| | | | | | | | 312,108 | |
| Mexico | |
America Movil SAB de CV, Series L | | | 1,311,432 | | | | 1,008,030 | |
Cemex SAB de CV | | | 556,552 | | | | 512,051 | |
Grupo Bimbo SAB de CV, Series A | | | 420,112 | | | | 1,028,340 | |
Industrias Penoles SAB de CV | | | 71,730 | | | | 1,745,693 | |
| | | | | | | | |
| | | | | | | | 4,294,114 | |
| Netherlands | |
Yandex NV, Class A | | | 131,404 | | | | 3,582,073 | |
| Philippines | |
Ayala Land, Inc. | | | 131,700 | | | | 93,069 | |
Metropolitan Bank & Trust Co. | | | 4 | | | | 7 | |
| | | | | | | | |
| | | | | | | | 93,076 | |
| Qatar | |
Barwa Real Estate Co. | | | 33,076 | | | | 309,172 | |
Ezdan Holding Group QSC | | | 5,409 | | | | 22,728 | |
Industries Qatar QSC | | | 2,663 | | | | 76,265 | |
Ooredoo QSC | | | 658 | | | | 18,757 | |
| | | | | | | | |
| | | | | | | | 426,922 | |
| Russia | |
Aeroflot — Russian Airlines OJSC | | | 157,027 | | | | 488,359 | |
Alrosa PJSC | | | 570,500 | | | | 992,424 | |
Magnitogorsk Iron & Steel Works OJSC | | | 513,400 | | | | 306,642 | |
Magnitogorsk Iron & Steel Works OJSC — GDR | | | 2,470 | | | | 19,019 | |
Mail.ru Group Ltd. — GDR | | | 13,188 | | | | 347,504 | |
MegaFon PJSC — GDR | | | 48,654 | | | | 520,111 | |
Mobile TeleSystems PJSC — ADR | | | 20,138 | | | | 207,824 | |
Polymetal International PLC | | | 16,777 | | | | 220,526 | |
Sberbank of Russia PJSC | | | 24,990 | | | | 72,849 | |
Sberbank of Russia PJSC — ADR | | | 16,681 | | | | 198,868 | |
Severstal PJSC | | | 1,950 | | | | 26,648 | |
Tatneft PJSC | | | 7,982 | | | | 52,993 | |
Uralkali PJSC — GDR | | | 761 | | | | 10,022 | |
| | | | | | | | |
| | | | | | | | 3,463,789 | |
| South Africa | |
AngloGold Ashanti Ltd. | | | 2,505 | | | | 28,687 | |
AVI Ltd. | | | 8,717 | | | | 63,755 | |
Barloworld Ltd. | | | 21,353 | | | | 192,411 | |
Bid Corp. Ltd. | | | 5,043 | | | | 106,836 | |
Bidvest Group Ltd. | | | 7,065 | | | | 84,328 | |
Clicks Group Ltd. | | | 14,870 | | | | 149,447 | |
Gold Fields Ltd. — ADR | | | 62,898 | | | | 204,418 | |
See Notes to Consolidated Financial Statements.
| | | | | | |
| | | | | | | |
| 20 | | BLACKROCK TOTAL EMERGING MARKETS FUND | | APRIL 30, 2017 | | |
| | |
Consolidated Schedule of Investments (continued) | | |
| | | | | | | | |
| | | Shares | | | Value | |
| Reference Entity — Long (continued) | |
| South Africa (continued) | |
Growthpoint Properties Ltd. | | | 48,944 | | | $ | 93,801 | |
Harmony Gold Mining Co. Ltd. — ADR | | | 300,936 | | | | 656,040 | |
Hyprop Investments Ltd. | | | 29,791 | | | | 275,177 | |
Investec Ltd. | | | 40,570 | | | | 304,424 | |
Kumba Iron Ore Ltd. | | | 1,236 | | | | 16,069 | |
Massmart Holdings Ltd. | | | 1,081 | | | | 10,453 | |
Mondi Ltd. | | | 11,493 | | | | 297,993 | |
Nedbank Group Ltd. | | | 1,964 | | | | 33,113 | |
Netcare Ltd. | | | 38,995 | | | | 77,378 | |
Sanlam Ltd. | | | 54,346 | | | | 288,604 | |
Sappi Ltd. | | | 30,830 | | | | 228,956 | |
Sibanye Gold Ltd. | | | 28,112 | | | | 56,490 | |
Tsogo Sun Holdings Ltd. | | | 148,005 | | | | 278,822 | |
| | | | | | | | |
| | | | | | | | 3,447,202 | |
| South Korea | |
Hanwha Corp. | | | 347 | | | | 12,173 | |
Hyundai Development Co-Engineering & Construction | | | 19,566 | | | | 767,956 | |
Hyundai Engineering & Construction Co. Ltd. | | | 1,786 | | | | 76,077 | |
Korea Electric Power Corp. | | | 2,474 | | | | 98,614 | |
Korea Investment Holdings Co. Ltd. | | | 261 | | | | 11,759 | |
KT Corp. | | | 2,188 | | | | 61,907 | |
KT Corp. — ADR | | | 227,308 | | | | 3,771,040 | |
LG Electronics, Inc. | | | 35,065 | | | | 2,128,572 | |
LG International Corp. | | | 14,614 | | | | 417,126 | |
LG Uplus Corp. | | | 17,554 | | | | 223,049 | |
Lotte Shopping Co. Ltd. | | | 142 | | | | 32,747 | |
Poongsan Corp. | | | 8,506 | | | | 291,568 | |
Posco Daewoo Corp. | | | 4,203 | | | | 88,561 | |
S&T Motiv Co. Ltd. | | | 714 | | | | 28,231 | |
Samsung Card Co. Ltd. | | | 3,524 | | | | 123,563 | |
Samsung Electronics Co. Ltd. | | | 1,547 | | | | 3,032,781 | |
Samsung Securities Co. Ltd. | | | 7,878 | | | | 239,197 | |
Shinhan Financial Group Co. Ltd. | | | 1,524 | | | | 63,629 | |
| | | | | | | | |
| | | | | | | | 11,468,550 | |
| Taiwan | |
AU Optronics Corp. | | | 2,521,000 | | | | 1,047,745 | |
AU Optronics Corp. — ADR | | | 235,245 | | | | 950,390 | |
Chailease Holding Co. Ltd. | | | 89,000 | | | | 226,746 | |
CTBC Financial Holding Co. Ltd. | | | 1,863,760 | | | | 1,163,853 | |
Hon Hai Precision Industry Co. Ltd. | | | 259,761 | | | | 850,240 | |
Innolux Corp. | | | 2,475,000 | | | | 1,155,185 | |
Lite-On Technology Corp. | | | 296,623 | | | | 517,415 | |
Taiwan Semiconductor Manufacturing Co. Ltd. | | | 71,000 | | | | 457,374 | |
Yuanta Financial Holding Co. Ltd. | | | 389,093 | | | | 166,364 | |
| | | | | | | | |
| | | | | | | | 6,535,312 | |
| Thailand | |
Bangchak Corp. PCL | | | 168,600 | | | | 155,976 | |
PTT Global Chemical PCL, Foreign Registered Shares | | | 138,500 | | | | 300,303 | |
Siam Cement PCL, Foreign Registered Shares | | | 8,000 | | | | 123,913 | |
Thai Oil PCL — NVDR | | | 418,300 | | | | 943,261 | |
Thanachart Capital PCL | | | 466,000 | | | | 636,557 | |
| | | | | | | | |
| | | | | | | | 2,160,010 | |
| Turkey | |
Arcelik AS | | | 112,412 | | | | 749,443 | |
Ford Otomotiv Sanayi | | | 40,195 | | | | 446,753 | |
Turkiye Is Bankasi, Class C | | | 1,073,719 | | | | 2,119,021 | |
| | | | | | | | |
| | | | | | | | 3,315,217 | |
| United Arab Emirates | |
Emaar Properties PJSC | | | 43,983 | | | | 85,891 | |
| United Kingdom | |
Anglo American PLC | | | 2,288 | | | | 32,801 | |
| | | | | | | | |
| | | Shares | | | Value | |
| Reference Entity — Long (continued) | |
| United States | |
Genpact Ltd. | | | 47,592 | | | $ | 1,162,197 | |
Nexteer Automotive Group Ltd. | | | 203,000 | | | | 316,098 | |
| | | | | | | | |
| | | | | | | | 1,478,295 | |
| Total Reference Entity — Long | | | | | | | 85,573,808 | |
| | | | | | | | |
| Reference Entity — Short | | | | | | |
| Brazil | |
Itausa — Investimentos Itau SA | | | (91 | ) | | | (282 | ) |
| China | |
China Shanshui Cement Group Ltd. | | | (763,000 | ) | | | (42,180 | ) |
| Mexico | |
Grupo Financiero Inbursa SAB de C.V. | | | (120,106 | ) | | | (202,822 | ) |
Infraestructura Energetica Nova SAB de C.V. | | | (197,000 | ) | | | (920,263 | ) |
Mexichem SAB de C.V. | | | (330,368 | ) | | | (904,661 | ) |
| | | | | | | | |
| | | | | (2,027,746 | ) |
Total Reference Entity — Short | | | | (2,070,208 | ) |
| Net Value of Reference Entity — Goldman Sachs Bank USA | | | | 83,503,600 | |
The following table represents the individual long and short positions and related values of the equity securities underlying the total return swap with UBS AG, as of April 30, 2017, expiration date 8/24/17:
| | | | | | | | |
| | | Shares | | | Value | |
| Reference Entity — Long | | | | | | |
| Brazil | |
Banco Bradesco SA, Preference Shares | | | 146,400 | | | | 1,541,004 | |
Banco do Estado do Rio Grande do Sul, Preference Shares | | | 8,300 | | | | 37,159 | |
Braskem SA, Preference A Shares | | | 6,200 | | | | 66,687 | |
Cia Brasileira de Distribuicao Grupo Pao de Acucar, Preference Shares | | | 6,500 | | | | 146,934 | |
Cia Energetica de Sao Paulo, Preference ‘B’ Shares | | | 40,200 | | | | 229,240 | |
Cia Paranaense de Energia, Preference ‘B’ Shares | | | 2,900 | | | | 26,651 | |
Companhia de Saneamento Basico do Estado de Sao Paulo | | | 23,600 | | | | 217,631 | |
CPFL Energia SA | | | 8,300 | | | | 67,989 | |
Eletropaulo Metropolitana Eletricidade de Sao Paulo SA, Preference Shares | | | 230,078 | | | | 1,090,207 | |
Engie Brasil Energia SA | | | 55,558 | | | | 595,130 | |
Fleury SA | | | 102,500 | | | | 1,696,035 | |
Hypermarcas SA | | | 235,900 | | | | 2,234,103 | |
Itau Unibanco Holding SA, Preference Shares | | | 237,744 | | | | 2,940,669 | |
JBS SA | | | 46,700 | | | | 151,103 | |
M Dias Branco SA | | | 52,700 | | | | 809,083 | |
Magazine Luiza SA | | | 5,400 | | | | 379,032 | |
Marfrig Global Foods SA | | | 257,724 | | | | 586,244 | |
Smiles SA | | | 24,700 | | | | 537,259 | |
Telefonica Brasil SA, Preference Shares | | | 1,400 | | | | 20,859 | |
Tim Participacoes SA | | | 34,600 | | | | 111,843 | |
| | | | | | | | |
| | | | | | | | 13,484,862 | |
| Chile | |
Empresa Nacional de Electricidad SA | | | 472,909 | | | | 361,977 | |
| China | |
Aluminum Corp. of China Ltd., Class H | | | 22,000 | | | | 10,813 | |
Beijing Capital International Airport Co. Ltd., Class H | | | 34,000 | | | | 47,965 | |
BYD Electronic International Co. Ltd. | | | 932,000 | | | | 1,422,504 | |
China Agri-Industries Holdings Ltd. | | | 361,000 | | | | 178,562 | |
China Communications Services Corp. Ltd., Class H | | | 1,388,000 | | | | 789,873 | |
China Lesso Group Holdings Ltd. | | | 91,000 | | | | 72,452 | |
China Merchants Bank Co., Class H | | | 218,500 | | | | 566,136 | |
China Minsheng Banking Corp. Ltd., Class H | | | 219,000 | | | | 215,465 | |
See Notes to Consolidated Financial Statements.
| | | | | | |
| | | | | | | |
| | BLACKROCK TOTAL EMERGING MARKETS FUND | | APRIL 30, 2017 | | 21 |
| | |
Consolidated Schedule of Investments (continued) | | |
| | | | | | | | |
| | | Shares | | | Value | |
| Reference Entity — Long (continued) | | | | | | |
| China (continued) | |
China Petroleum & Chemical Corp., Class H | | | 638,000 | | | $ | 518,090 | |
China Vanke Co. Ltd., Class H | | | 400,400 | | | | 1,014,614 | |
CNOOC Ltd. | | | 717,000 | | | | 836,450 | |
Jiangsu Expressway Co. Ltd., Class H | | | 254,000 | | | | 374,802 | |
Jiangxi Copper Co. Ltd., Class H | | | 125,000 | | | | 194,721 | |
Longfor Properties Co. Ltd. | | | 214,500 | | | | 371,155 | |
Lonking Holdings Ltd. | | | 1,155,000 | | | | 321,601 | |
Metallurgical Corp. of China Ltd. | | | 1,111,000 | | | | 410,565 | |
People’s Insurance Co. Group of China Ltd., Class H | | | 755,000 | | | | 311,121 | |
Ping An Insurance Group Co. of China Ltd., Class H | | | 45,000 | | | | 253,001 | |
Shanghai Pharmaceuticals Holding Co. Ltd., Class H | | | 312,700 | | | | 827,073 | |
Sino-Ocean Land Holdings Ltd. | | | 418,000 | | | | 203,907 | |
Sinopec Engineering Group Co. Ltd., Class H | | | 160,000 | | | | 156,345 | |
Sinopec Shanghai Petrochemical Co. Ltd., Class H | | | 1,524,000 | | | | 851,589 | |
Tencent Holdings Ltd. | | | 55,400 | | | | 1,735,866 | |
Tianjin Capital Environmental Protection Group Co. Ltd. | | | 38,000 | | | | 25,808 | |
Tianneng Power International Ltd. | | | 520,000 | | | | 454,925 | |
Weichai Power Co. Ltd., Class H | | | 784,000 | | | | 1,270,356 | |
Zhejiang Expressway Co. Ltd., Class H | | | 344,000 | | | | 427,931 | |
Zhongsheng Group Holdings Ltd. | | | 21,000 | | | | 29,607 | |
Zijin Mining Group Co. Ltd., Class H | | | 78,000 | | | | 27,681 | |
| | | | | | | | |
| | | | | | | | 13,920,978 | |
| Colombia | |
Almacenes Exito SA | | | 763 | | | | 3,952 | |
Cementos Argos SA | | | 1,951 | | | | 7,892 | |
Corp. Financiera Colombiana SA | | | 212 | | | | 2,035 | |
Ecopetrol SA | | | 26,107 | | | | 12,068 | |
Grupo Argos SA | | | 1,923 | | | | 13,334 | |
Grupo de Inversiones Suramericana SA | | | 1,587 | | | | 20,984 | |
Interconexion Electrica SA | | | 4,360 | | | | 17,280 | |
| | | | | | | | |
| | | | | | | | 77,545 | |
| Greece | |
Alpha Bank AE | | | 680 | | | | 1,449 | |
Eurobank Ergasias SA | | | 617 | | | | 497 | |
FF Group | | | 218 | | | | 4,637 | |
Hellenic Telecommunications Organization SA | | | 2,017 | | | | 19,589 | |
JUMBO SA | | | 476 | | | | 7,513 | |
National Bank of Greece SA | | | 844 | | | | 263 | |
OPAP SA | | | 1,808 | | | | 17,917 | |
Piraeus Bank SA | | | 145 | | | | 31 | |
Titan Cement Co. SA | | | 329 | | | | 8,597 | |
| | | | | | | | |
| | | | | | | | 60,493 | |
| Hong Kong | |
Bank of Communications Co. Ltd. | | | 686 | | | | — | |
Belle International Holdings Ltd. | | | 786,000 | | | | 532,532 | |
China Jinmao Holdings Group Ltd. | | | 296,000 | | | | 95,741 | |
China Mobile Ltd. | | | 90,500 | | | | 963,519 | |
China Resources Cement Holdings Ltd. | | | 1,540,000 | | | | 842,000 | |
China Resources Land Ltd. | | | 218,000 | | | | 604,084 | |
ENN Energy Holdings Ltd. | | | 36,000 | | | | 195,152 | |
Geely Automobile Holdings Ltd. | | | 1,240,000 | | | | 1,670,720 | |
Haier Electronics Group Co. Ltd. | | | 723,000 | | | | 1,676,503 | |
KWG Property Holding Ltd. | | | 2,159,500 | | | | 1,631,307 | |
Nine Dragons Paper Holdings Ltd. | | | 424,000 | | | | 457,269 | |
Shenzhen Investment Ltd. | | | 928,000 | | | | 420,545 | |
Shimao Property Holdings Ltd. | | | 287,000 | | | | 460,642 | |
Yuexiu Property Co. Ltd. | | | 2,834,000 | | | | 480,410 | |
| | | | | | | | |
| | | | | | | | 10,030,424 | |
| Hungary | |
MOL Hungarian Oil & Gas PLC | | | 7,535 | | | | 566,838 | |
Richter Gedeon Nyrt | | | 41,360 | | | | 1,001,584 | |
| | | | | | | | |
| | | | | | | | 1,568,422 | |
| | | | | | | | |
| | | Shares | | | Value | |
| Reference Entity — Long (continued) | | | | | | |
| Indonesia | |
Adaro Energy Tbk PT | | | 685,600 | | | $ | 91,170 | |
Bank Central Asia Tbk PT | | | 185,200 | | | | 246,305 | |
Bank Rakyat Indonesia Persero Tbk PT | | | 20,300 | | | | 19,608 | |
Matahari Department Store Tbk PT | | | 1,312,600 | | | | 1,434,290 | |
Telekomunikasi Indonesia Persero Tbk PT | | | 2,543,400 | | | | 839,033 | |
United Tractors Tbk PT | | | 149,300 | | | | 301,022 | |
| | | | | | | | |
| | | | | | | | 2,931,428 | |
| Jersey | |
Highland Gold Mining Ltd. | | | 5,541 | | | | 10,372 | |
| Malaysia | |
Astro Malaysia Holdings Bhd | | | 247,600 | | | | 154,001 | |
Petronas Chemicals Group Bhd | | | 399,900 | | | | 672,488 | |
Petronas Dagangan Bhd | | | 34,600 | | | | 191,771 | |
| | | | | | | | |
| | | | | | | | 1,018,260 | |
| Philippines | |
Alliance Global Group, Inc. | | | 378,800 | | | | 112,212 | |
Ayala Corp. | | | 1,040 | | | | 18,033 | |
Ayala Land, Inc. | | | 17,400 | | | | 12,296 | |
| | | | | | | | |
| | | | | | | | 142,541 | |
| Qatar | |
Ezdan Holding Group QSC | | | 6,957 | | | | 29,232 | |
Industries Qatar QSC | | | 2,334 | | | | 66,843 | |
Ooredoo QSC | | | 3,094 | | | | 88,199 | |
| | | | | | | | |
| | | | | | | | 184,274 | |
| Republic of Korea | |
Seoul Semiconductor Co. Ltd. | | | 647 | | | | 10,680 | |
| Russia | |
Aeroflot — Russian Airlines OJSC | | | 136,936 | | | | 425,875 | |
Alrosa PJSC | | | 681,500 | | | | 1,185,516 | |
Lukoil PJSC — ADR | | | 17,087 | | | | 848,141 | |
Magnitogorsk Iron & Steel Works OJSC | | | 597,300 | | | | 356,754 | |
Magnitogorsk Iron & Steel Works OJSC, — GDR | | | 11,395 | | | | 87,741 | |
Mail.ru Group Ltd. — GDR | | | 27,908 | | | | 735,376 | |
MegaFon PJSC — GDR | | | 58,993 | | | | 630,635 | |
Polymetal International PLC | | | 256,067 | | | | 3,365,885 | |
Sberbank of Russia PJSC | | | 1,330 | | | | 3,877 | |
Severstal PJSC | | | 6,520 | | | | 89,101 | |
Sistema PJSC FC — GDR | | | 58,175 | | | | 489,252 | |
Tatneft PAO — ADR | | | 4,235 | | | | 165,761 | |
Tatneft PJSC | | | 48,900 | | | | 324,651 | |
Uralkali PJSC — GDR | | | 4,371 | | | | 57,566 | |
| | | | | | | | |
| | | | | | | | 8,766,131 | |
| South Africa | |
Anglo American Platinum Ltd. | | | 4,448 | | | | 109,837 | |
AngloGold Ashanti Ltd. | | | 9,720 | | | | 111,313 | |
AVI Ltd. | | | 18,226 | | | | 133,302 | |
Barloworld Ltd. | | | 23,374 | | | | 210,622 | |
Bid Corp. Ltd. | | | 1,489 | | | | 31,544 | |
Clicks Group Ltd. | | | 22,716 | | | | 228,301 | |
Gold Fields Ltd. | | | 33,966 | | | | 111,324 | |
Growthpoint Properties Ltd. | | | 59,461 | | | | 113,957 | |
Harmony Gold Mining Co. Ltd. | | | 7,258 | | | | 15,716 | |
Investec Ltd. | | | 22,571 | | | | 169,365 | |
Kumba Iron Ore Ltd. | | | 11,507 | | | | 149,597 | |
Massmart Holdings Ltd. | | | 4,655 | | | | 45,015 | |
Mondi Ltd. | | | 52,692 | | | | 1,366,209 | |
Nedbank Group Ltd. | | | 7,606 | | | | 128,236 | |
Netcare Ltd. | | | 121,762 | | | | 241,613 | |
Sanlam Ltd. | | | 34,711 | | | | 184,332 | |
Sappi Ltd. | | | 104,332 | | | | 774,813 | |
Sibanye Gold Ltd. | | | 4,095 | | | | 8,229 | |
Tsogo Sun Holdings Ltd. | | | 65,969 | | | | 124,277 | |
| | | | | | | | |
| | | | | | | | 4,257,602 | |
See Notes to Consolidated Financial Statements.
| | | | | | |
| | | | | | | |
| 22 | | BLACKROCK TOTAL EMERGING MARKETS FUND | | APRIL 30, 2017 | | |
| | |
Consolidated Schedule of Investments (continued) | | |
| | | | | | | | |
| | | Shares | | | Value | |
| Reference Entity — Long (continued) | | | | | | |
| South Korea | |
Able C&C Co. Ltd. | | | 1,075 | | | $ | 27,619 | |
Cheil Worldwide, Inc. | | | 1,486 | | | | 24,082 | |
Green Cross Corp. | | | 184 | | | | 26,494 | |
Hanwha Corp. | | | 3,272 | | | | 114,789 | |
Hyundai Development Co-Engineering & Construction | | | 13,619 | | | | 534,539 | |
Hyundai Engineering & Construction Co. Ltd. | | | 6,669 | | | | 284,074 | |
KB Financial Group, Inc. | | | 1,895 | | | | 83,299 | |
Korea Electric Power Corp. | | | 7,810 | | | | 311,309 | |
Korea Investment Holdings Co. Ltd. | | | 2,523 | | | | 113,666 | |
KT Corp. | | | 3,713 | | | | 105,055 | |
LG Electronics, Inc. | | | 13,497 | | | | 807,270 | |
LG International Corp. | | | 13,563 | | | | 387,127 | |
LG Uplus Corp. | | | 6,371 | | | | 80,953 | |
Lotte Shopping Co. Ltd. | | | 656 | | | | 151,282 | |
LS Corp. | | | 626 | | | | 35,820 | |
Poongsan Corp. | | | 21,252 | | | | 728,474 | |
Posco Daewoo Corp. | | | 15,058 | | | | 317,287 | |
Posco ICT Co. Ltd. | | | 1 | | | | 6 | |
S&T Motiv Co. Ltd. | | | 935 | | | | 36,969 | |
Samsung Card Co. Ltd. | | | 2,923 | | | | 102,490 | |
Samsung Electronics Co. Ltd. | | | 1,105 | | | | 2,166,272 | |
Samsung Securities Co. Ltd. | | | 1,276 | | | | 38,743 | |
Shinhan Financial Group Co. Ltd. | | | 15,634 | | | | 652,741 | |
SK Telecom Co. Ltd. | | | 703 | | | | 148,393 | |
| | | | | | | | |
| | | | | | | | 7,278,753 | |
| Taiwan | |
AU Optronics Corp. | | | 461,000 | | | | 191,595 | |
Compal Electronics, Inc. | | | 962,000 | | | | 643,989 | |
CTBC Financial Holding Co. Ltd. | | | 1,760,800 | | | | 1,099,559 | |
Hon Hai Precision Industry Co. Ltd. | | | 386,761 | | | | 1,265,931 | |
Hon Hai Precision Industry Co. Ltd. — GDR | | | 50,344 | | | | 335,794 | |
Innolux Corp. | | | 1,250,311 | | | | 583,572 | |
Lite-On Technology Corp. | | | 530,892 | | | | 926,063 | |
Novatek Microelectronics Corp. | | | 63,000 | | | | 242,099 | |
Taiwan Semiconductor Manufacturing Co. Ltd. | | | 357,000 | | | | 2,299,756 | |
| | | | | | | | |
| | | | | | | | 7,588,358 | |
| | | | | | | | |
| | | Shares | | | Value | |
| Reference Entity — Long (continued) | | | | | | |
| Thailand | |
Glow Energy PCL, Foreign Registered Shares | | | 64,200 | | | $ | 152,194 | |
PTT Global Chemical PCL, Foreign Registered Shares | | | 328,300 | | | | 711,839 | |
Siam Cement PCL, Foreign Registered Shares | | | 8,500 | | | | 131,658 | |
Thai Oil PCL — NVDR | | | 403,700 | | | | 910,338 | |
Thanachart Capital PCL | | | 711,000 | | | | 971,227 | |
| | | | | | | | |
| | | | | | | | 2,877,256 | |
| Turkey | |
Arcelik AS | | | 287,564 | | | | 1,917,170 | |
Eregli Demir ve Celik Fabrikalari TAS | | | 658,138 | | | | 1,205,580 | |
Ford Otomotiv Sanayi | | | 29,072 | | | | 323,125 | |
Tekfen Holding | | | 33,870 | | | | 87,297 | |
Turkiye Is Bankasi, Class C | | | 832,149 | | | | 1,642,275 | |
Vestel Elektronik Sanayi ve Ticaret | | | 218,605 | | | | 448,194 | |
| | | | | | | | |
| | | | | | | | 5,623,641 | |
| United Arab Emirates | |
Emaar Properties PJSC | | | 11,503 | | | | 22,463 | |
| United Kingdom | |
Anglo American PLC | | | 15,046 | | | | 215,700 | |
| United States | |
Nexteer Automotive Group Ltd. | | | 133,000 | | | | 207,099 | |
| Total Reference Entity — Long | | | | | | | 80,639,259 | |
| | | | | | | | |
| | | | | | | | | |
| Reference Entity — Short | | | | | | |
| Brazil | | | | | | |
Cielo SA | | | (1 | ) | | | (7 | ) |
Itausa — Investimentos Itau SA | | | (785 | ) | | | (841 | ) |
| | | | | | | | |
| | | | | | | | (848 | ) |
| China | |
China Shanshui Cement Group Ltd. | | | (23,000 | ) | | | (1,272 | ) |
| Total Reference Entity — Short | | | | | | | (2,120 | ) |
| Net Value of Reference Entity — UBS AG | | | $ | 80,637,139 | |
|
| Derivative Financial Instruments Categorized by Risk Exposure |
As of period end, the fair values of derivative financial instruments located in the Consolidated Statement of Assets and Liabilities were as follows:
| | | | | | | | | | | | | | | | | | | | | | | | | | | | | | | | | | |
| Assets — Derivative Financial Instruments | | Commodity
Contracts | | | Credit
Contracts | | | Equity
Contracts | | | Foreign
Currency
Exchange
Contracts | | | Interest
Rate
Contracts | | | Other
Contracts | | | Total | | | | |
Futures contracts | | Net unrealized appreciation1 | | | — | | | | — | | | $ | 80,920 | | | | — | | | | — | | | | — | | | $ | 80,920 | | | | | |
Forward foreign currency exchange contracts | | Unrealized appreciation on forward foreign currency exchange contracts | | | — | | | | — | | | | — | | | $ | 1,988,427 | | | | — | | | | — | | | | 1,988,427 | | | | | |
Swaps — centrally cleared | | Net unrealized appreciation1 | | | — | | | | — | | | | — | | | | — | | | $ | 53,842 | | | | — | | | | 53,842 | | | | | |
Swaps — OTC | | Unrealized appreciation on OTC swaps | | | — | | | | — | | | | 18,138,338 | | | | — | | | | 309,679 | | | | — | | | | 18,448,017 | | | | | |
| | | | | | |
Total | | | | | — | | | | — | | | $ | 18,219,258 | | | $ | 1,988,427 | | | $ | 363,521 | | | | — | | | $ | 20,571,206 | | | | | |
| | | | | | |
| | | | | | | | | | | | | | | | | | | | | | | | | | | | | | | | | | |
| Liabilities — Derivative Financial Instruments | | | | | | | |
Forward foreign currency exchange contracts | | Unrealized depreciation on forward foreign currency exchange contracts | | | — | | | | — | | | | — | | | $ | 1,464,327 | | | | — | | | | — | | | $ | 1,464,327 | | | | | |
Swaps — OTC | | Unrealized depreciation on OTC swaps | | | — | | | | — | | | | — | | | | — | | | $ | 9,743 | | | | — | | | | 9,743 | | | | | |
| | | | | | |
Total | | | | | — | | | | — | | | | — | | | $ | 1,464,327 | | | $ | 9,743 | | | | — | | | $ | 1,474,070 | | | | | |
| | | | | | |
1 Includes cumulative appreciation (depreciation) on futures contracts and centrally cleared swaps, if any, as reported in the Consolidated Schedule of Investments. Only current day’s variation margin is reported within the Consolidated Statement of Assets and Liabilities. | | | | | |
See Notes to Consolidated Financial Statements.
| | | | | | |
| | | | | | | |
| | BLACKROCK TOTAL EMERGING MARKETS FUND | | APRIL 30, 2017 | | 23 |
| | |
Consolidated Schedule of Investments (continued) | | |
For the six months ended April 30, 2017, the effect of derivative financial instruments in the Consolidated Statement of Operations was as follows:
| | | | | | | | | | | | | | | | | | | | | | | | | | | | | | | | |
| Net Realized Gain (Loss) from: | | Commodity
Contracts | | | Credit
Contracts | | | Equity
Contracts | | | Foreign
Currency
Exchange
Contracts | | | Interest
Rate
Contracts | | | Other
Contracts | | | Total | | | | |
Futures contracts | | | — | | | | — | | | $ | (428,165 | ) | | | — | | | | — | | | | — | | | $ | (428,165 | ) | | | | |
Forward foreign currency exchange contracts | | | — | | | | — | | | | — | | | $ | (622,784 | ) | | | — | | | | — | | | | (622,784 | ) | | | | |
Swaps | | | — | | | | — | | | | 1,491,412 | | | | — | | | $ | (513,670 | ) | | | — | | | | 977,742 | | | | | |
| | | | |
Total | | | — | | | | — | | | $ | 1,063,247 | | | $ | (622,784 | ) | | $ | (513,670 | ) | | | — | | | $ | (73,207 | ) | | | | |
| | | | |
| | | | | | | | | | | | | | | | | | | | | | | | | | | | | | | | |
| Net Change in Unrealized Appreciation (Depreciation) on: | | | | | | | | | | |
Futures contracts | | | — | | | | — | | | $ | 303,459 | | | | — | | | | — | | | | — | | | $ | 303,459 | | | | | |
Forward foreign currency exchange contracts | | | — | | | | — | | | | — | | | $ | 1,613,021 | | | | — | | | | — | | | | 1,613,021 | | | | | |
Swaps | | | — | | | | — | | | | 9,222,800 | | | | — | | | $ | 558,242 | | | | — | | | | 9,781,042 | | | | | |
| | | | |
Total | | | — | | | | — | | | $ | 9,526,259 | | | $ | 1,613,021 | | | $ | 558,242 | | | | — | | | $ | 11,697,522 | | | | | |
| | | | |
| | |
| Average Quarterly Balances of Outstanding Derivative Financial Instruments | | |
| | | | |
| Futures contracts: | | | | |
Average notional value of contracts — long | | $ | 14,804,646 | |
Average notional value of contracts — short | | $ | 25,892,695 | 1 |
| Forward foreign currency exchange contracts: | | | | |
Average amounts purchased — in USD | | $ | 123,776,227 | |
Average amounts sold — in USD | | $ | 120,935,887 | |
| Interest rate swaps: | | | | |
Average notional value — receives fixed rate | | $ | 42,497,225 | |
| Total return swaps: | | | | |
Average notional value | | $ | 123,073,693 | |
1 Actual amounts for the period are shown due to limited outstanding derivative financial instruments as of each quarter end. | | | | |
For more information about the Fund’s investment risks regarding derivative financial instruments, refer to the Notes to Consolidated Financial Statements.
| | |
| Derivative Financial Instruments — Offsetting as of Period End | | |
The Fund’s derivative assets and liabilities (by type) were as follows:
| | | | | | | | |
| | | Assets | | | Liabilities | |
Derivative Financial Instruments: | | | | | | | | |
Futures contracts | | $ | 1,827 | | | $ | 38,896 | |
Forward foreign currency exchange contracts | | | 1,988,427 | | | | 1,464,327 | |
Swaps — Centrally cleared | | | 15,058 | | | | — | |
Swaps — OTC1 | | | 18,448,017 | | | | 9,743 | |
| | | | |
Total derivative assets and liabilities in the Consolidated Statement of Assets and Liabilities | | $ | 20,453,329 | | | $ | 1,512,966 | |
| | | | |
Derivatives not subject to a Master Netting Agreement or similar agreement (“MNA”) | | | (16,885 | ) | | | (38,896 | ) |
| | | | |
Total derivative assets and liabilities subject to an MNA | | $ | 20,436,444 | | | $ | 1,474,070 | |
| | | | |
1 Includes unrealized appreciation (depreciation) on OTC swaps in the Consolidated Statement of Assets and Liabilities. | |
See Notes to Consolidated Financial Statements.
| | | | | | |
| | | | | | | |
| 24 | | BLACKROCK TOTAL EMERGING MARKETS FUND | | APRIL 30, 2017 | | |
| | |
Consolidated Schedule of Investments (concluded) | | |
The following table presents the Fund’s derivative assets and liabilities by counterparty net of amounts available for offset under an MNA and net of the related collateral received and pledged by the Fund:
| | | | | | | | | | | | | | | | | | | | | | | | |
| Counterparty | | Derivative Assets
Subject to an MNA
by Counterparty | | | Derivatives Available
for Offset1 | | | Non-cash
Collateral
Received | | | Cash
Collateral
Received2 | | | Net Amount of
Derivative Assets3,4 | | | | |
Bank of America N.A. | | $ | 297,052 | | | $ | (69,198 | ) | | | — | | | | — | | | $ | 227,854 | | | | | |
Barclays Bank PLC | | | 13,969 | | | | — | | | | — | | | | — | | | | 13,969 | | | | | |
BNP Paribas S.A. | | | 65,168 | | | | (65,168 | ) | | | — | | | | — | | | | — | | | | | |
Citibank N.A. | | | 270,592 | | | | (270,592 | ) | | | — | | | | — | | | | — | | | | | |
Credit Suisse International | | | 8,642 | | | | (8,642 | ) | | | — | | | | — | | | | — | | | | | |
Deutsche Bank AG | | | 287,999 | | | | (265,343 | ) | | | — | | | | — | | | | 22,656 | | | | | |
Goldman Sachs Bank USA | | | 8,663,097 | | | | (83 | ) | | | — | | | $ | (7,900,000 | ) | | | 763,014 | | | | | |
HSBC Bank USA N.A. | | | 461,582 | | | | (87,974 | ) | | | — | | | | — | | | | 373,608 | | | | | |
JPMorgan Chase Bank N.A. | | | 459,362 | | | | (255,284 | ) | | | — | | | | — | | | | 204,078 | | | | | |
Standard Chartered Bank | | | 263,329 | | | | — | | | | — | | | | (263,329 | ) | | | — | | | | | |
UBS AG | | | 9,645,652 | | | | (100,378 | ) | | | — | | | | (9,337,241 | ) | | | 208,033 | | | | | |
| | | | |
Total | | $ | 20,436,444 | | | $ | (1,122,662 | ) | | | — | | | $ | (17,500,570 | ) | | $ | 1,813,212 | | | | | |
| | | | |
| | | | | | | | | | | | | | | | | | | | | | | | |
| Counterparty | | Derivative Liabilities
Subject to an MNA
by Counterparty | | | Derivatives Available
for Offset2 | | | Non-cash
Collateral
Pledged | | | Cash
Collateral
Pledged | | | Net Amount of
Derivative Liabilities4 | | | | |
Bank of America N.A. | | $ | 69,198 | | | $ | (69,198 | ) | | | — | | | | — | | | | — | | | | | |
BNP Paribas S.A. | | | 156,499 | | | | (65,168 | ) | | | — | | | | — | | | $ | 91,331 | | | | | |
Citibank N.A. | | | 525,648 | | | | (270,592 | ) | | | — | | | $ | (60,000 | ) | | | 195,056 | | | | | |
Credit Suisse International | | | 13,663 | | | | (8,642 | ) | | | — | | | | — | | | | 5,021 | | | | | |
Deutsche Bank AG | | | 265,343 | | | | (265,343 | ) | | | — | | | | — | | | | — | | | | | |
Goldman Sachs Bank USA | | | 83 | | | | (83 | ) | | | — | | | | — | | | | — | | | | | |
HSBC Bank USA N.A. | | | 87,974 | | | | (87,974 | ) | | | — | | | | — | | | | — | | | | | |
JPMorgan Chase Bank N.A. | | | 255,284 | | | | (255,284 | ) | | | — | | | | — | | | | — | | | | | |
UBS AG | | | 100,378 | | | | (100,378 | ) | | | — | | | | — | | | | — | | | | | |
| | | | |
Total | | $ | 1,474,070 | | | $ | (1,122,662 | ) | | | — | | | $ | (60,000 | ) | | $ | 291,408 | | | | | |
| | | | |
1 The amount of derivatives available for offset is limited to the amount of derivative assets and/or liabilities that are subject to an MNA. | |
2 Excess of collateral received from the individual counterparties is not shown for financial reporting purposes. | |
3 Net amount represents the net amount receivable from the counterparty in the event of default. | |
4 Net amount may also include forward foreign currency exchange contracts that are not required to be collateralized. | |
5 Net amount represents the net amount payable due to the counterparty in the event of default. | |
| | |
| Fair Value Hierarchy as of Period End | | |
Various inputs are used in determining the fair value of investments and derivative financial instruments. For information about the Fund’s policy regarding valuation of investments and derivative financial instruments, refer to the Notes to Consolidated Financial Statements.
The following tables summarize the Fund’s investments and derivative financial instruments categorized in the disclosure hierarchy:
| | | | | | | | | | | | | | | | |
| | | Level 1 | | | Level 2 | | | Level 3 | | | Total | |
Assets: | | | | | | | | | | | | | | | | |
| Investments: | | | | | | | | | | | | | | | | |
Corporate Bonds | | | — | | | $ | 14,985,269 | | | | — | | | $ | 14,985,269 | |
Foreign Agency Obligations | | | — | | | | 15,938,335 | | | | — | | | | 15,938,335 | |
Foreign Government Obligations | | | — | | | | 141,184,024 | | | | — | | | | 141,184,024 | |
Short-Term Securities | | $ | 130,172,254 | | | | — | | | | — | | | | 130,172,254 | |
| | | | |
Total | | $ | 130,172,254 | | | $ | 172,107,628 | | | | — | | | $ | 302,279,882 | |
| | | | |
| | | | | | | | | | | | | | | | |
| Derivative Financial Instruments 1 | | | | | | | | | | | | |
Assets: | | | | | | | | | | | | | | | | |
Equity contracts | | $ | 80,920 | | | $ | 18,138,338 | | | | — | | | $ | 18,219,258 | |
Foreign currency exchange contracts | | | — | | | | 1,988,427 | | | | — | | | | 1,988,427 | |
Interest rate contracts | | | — | | | | 363,521 | | | | — | | | | 363,521 | |
Liabilities: | | | | | | | | | | | | | | | | |
Foreign currency exchange contracts | | | — | | | | (1,464,327 | ) | | | — | | | | (1,464,327 | ) |
Interest rate contracts | | | — | | | | (9,743 | ) | | | — | | | | (9,743 | ) |
| | | | |
Total | | $ | 80,920 | | | $ | 19,016,216 | | | | — | | | $ | 19,097,136 | |
| | | | |
1 Derivative financial instruments are swaps, futures contracts and forward foreign currency exchange contracts. Swaps, futures contracts and forward foreign currency exchange contracts are valued at the unrealized appreciation (depreciation) on the instrument. | |
During the six months ended April 30, 2017, there were no transfers between levels.
See Notes to Consolidated Financial Statements.
| | | | | | |
| | | | | | | |
| | BLACKROCK TOTAL EMERGING MARKETS FUND | | APRIL 30, 2017 | | 25 |
| | |
| Consolidated Statement of Assets and Liabilities | | |
| | | | |
| April 30, 2017 (Unaudited) | | | |
| | | | |
| Assets | |
Investments at value — unaffiliated (cost — $171,981,875) | | $ | 172,107,628 | |
Investments at value — affiliated (cost — $130,172,254) | | | 130,172,254 | |
Cash | | | 454,654 | |
| Cash pledged: | | | | |
Futures contracts | | | 499,480 | |
Centrally cleared swaps | | | 230,134 | |
Collateral — OTC derivatives | | | 60,000 | |
Foreign currency at value (cost — $86,390) | | | 89,523 | |
| Receivables: | | | | |
Interest — unaffiliated | | | 2,024,775 | |
Capital shares sold | | | 1,688,262 | |
Dividends — affiliated | | | 56,398 | |
Variation margin on centrally cleared swaps | | | 15,058 | |
Variation margin on futures contracts | | | 1,827 | |
| Unrealized appreciation on: | | | | |
OTC swaps | | | 18,448,017 | |
Forward foreign currency exchange contracts | | | 1,988,427 | |
Prepaid expenses | | | 57,263 | |
| | | | |
Total assets | | | 327,893,700 | |
| | | | |
| | | | |
| Liabilities | |
Cash received as collateral for OTC derivatives | | | 17,527,241 | |
| Payables: | | | | |
Investments purchased | | | 1,590,600 | |
Capital shares redeemed | | | 701,932 | |
Investment advisory fees | | | 159,196 | |
Variation margin on futures contracts | | | 38,896 | |
Service and distribution fees | | | 11,412 | |
Administration fees | | | 10,109 | |
Officer’s and Directors’ fees | | | 1,677 | |
Other accrued expenses | | | 167,029 | |
| Unrealized depreciation on: | | | | |
Forward foreign currency exchange contracts | | | 1,464,327 | |
OTC swaps | | | 9,743 | |
| | | | |
Total liabilities | | | 21,682,162 | |
| | | | |
Net Assets | | $ | 306,211,538 | |
| | | | |
| | | | |
| Net Assets Consist of | |
Paid-in capital | | $ | 300,520,312 | |
Undistributed net investment income | | | 2,236,307 | |
Accumulated net realized loss | | | (15,772,692 | ) |
Net unrealized appreciation (depreciation) | | | 19,227,611 | |
| | | | |
Net Assets | | $ | 306,211,538 | |
| | | | |
| | | | |
| Net Asset Value | |
Institutional — Based on net assets of $265,649,083 and 26,525,062 shares outstanding, unlimited number of shares authorized, $0.001 par value | | $ | 10.02 | |
| | | | |
Investor A — Based on net assets of $35,187,079 and 3,531,471 shares outstanding, unlimited number of shares authorized, $0.001 par value | | $ | 9.96 | |
| | | | |
Investor C — Based on net assets of $5,375,376 and 542,814 shares outstanding, unlimited number of shares authorized, $0.001 par value | | $ | 9.90 | |
| | | | |
| | | | | | |
| See Notes to Consolidated Financial Statements. | | | | |
| | | | | | | |
| 26 | | BLACKROCK TOTAL EMERGING MARKETS FUND | | APRIL 30, 2017 | | |
| | |
| Consolidated Statement of Operations | | |
| | | | |
| Six Months Ended April 30, 2017 | |
| | | | |
| Investment Income | |
Interest — unaffiliated | | $ | 3,120,200 | |
Dividends — affiliated | | | 193,002 | |
Foreign taxes withheld | | | (33,816 | ) |
| | | | |
Total investment income | | | 3,279,386 | |
| | | | |
| | | | |
| Expenses | |
Investment advisory | | | 852,479 | |
Professional | | | 66,518 | |
Transfer agent — class specific | | | 61,994 | |
Service and distribution — class specific | | | 59,434 | |
Administration | | | 48,307 | |
Accounting services | | | 35,849 | |
Registration | | | 32,976 | |
Administration — class specific | | | 22,733 | |
Printing | | | 19,680 | |
Custodian | | | 13,629 | |
Officer and Directors | | | 7,652 | |
Miscellaneous | | | 31,996 | |
| | | | |
Total expenses | | | 1,253,247 | |
| Less: | |
Fees waived by the Manager | | | (142,774 | ) |
Administration fees waived — class specific | | | (22,733 | ) |
Transfer agent fees waived and/or reimbursed — class specific | | | (61,555 | ) |
| | | | |
Total expenses after fees waived and/or reimbursed | | | 1,026,185 | |
| | | | |
Net investment income | | | 2,253,201 | |
| | | | |
| | | | |
| Realized and Unrealized Gain (Loss) | |
| Net realized gain (loss) from: | |
Investments — unaffiliated | | | (4,899,438 | ) |
Futures contracts | | | (428,165 | ) |
Foreign currency transactions | | | (6,290 | ) |
Forward foreign currency exchange contracts | | | (622,784 | ) |
Capital gain distributions from investment companies — affiliated | | | 349 | |
Swaps | | | 977,742 | |
| | | �� | |
| | | (4,978,586 | ) |
| | | | |
| Net change in unrealized appreciation (depreciation) on: | |
Investments — unaffiliated | | | 1,603,399 | |
Futures contracts | | | 303,459 | |
Forward foreign currency exchange contracts | | | 1,613,021 | |
Foreign currency translations | | | 7,900 | |
Swaps | | | 9,781,042 | |
| | | | |
| | | 13,308,821 | |
| | | | |
Net realized and unrealized gain | | | 8,330,235 | |
| | | | |
Net Increase in Net Assets Resulting from Operations | | $ | 10,583,436 | |
| | | | |
| | | | | | |
| See Notes to Consolidated Financial Statements. | | | | |
| | | | | | | |
| | BLACKROCK TOTAL EMERGING MARKETS FUND | | APRIL 30, 2017 | | 27 |
| | |
| Consolidated Statements of Changes in Net Assets | | |
| | | | | | | | | | | | |
| Increase (Decrease) in Net Assets: | | Six Months Ended April 30,
2017 (Unaudited) | | | Year Ended October 31,
2016 | | | | |
| | | | | | | | | | | | |
| Operations | | | | | |
Net investment income | | $ | 2,253,201 | | | $ | 1,906,676 | | | | | |
Net realized loss | | | (4,978,586 | ) | | | (4,540,165 | ) | | | | |
Net change in unrealized appreciation (depreciation) | | | 13,308,821 | | | | 9,582,458 | | | | | |
| | | | |
Net increase in net assets resulting from operations | | | 10,583,436 | | | | 6,948,969 | | | | | |
| | | | |
| | | | | | | | | | | | |
| Distributions to Shareholders1 | | | | | |
| From net investment income: | | | | | |
Institutional | | | (1,586,891 | ) | | | (656,002 | ) | | | | |
Investor A | | | (397,802 | ) | | | (19,525 | ) | | | | |
Investor C | | | (15,325 | ) | | | — | | | | | |
From net realized gain: | | | | | |
Institutional | | | (1,690,194 | ) | | | — | | | | | |
Investor A | | | (462,291 | ) | | | — | | | | | |
Investor C | | | (31,321 | ) | | | — | | | | | |
| | | | |
Net decrease in net assets resulting from operations | | | (4,183,824 | ) | | | (675,527 | ) | | | | |
| | | | |
| | | | | | | | | | | | |
| Capital Share Transactions | | | | | |
Net increase in net assets derived from capital share transactions | | | 54,537,496 | | | | 181,949,074 | | | | | |
| | | | |
| | | | | | | | | | | | |
| Net Assets | | | | | |
Total increase in net assets | | | 60,937,108 | | | | 188,222,516 | | | | | |
Beginning of period | | | 245,274,430 | | | | 57,051,914 | | | | | |
| | | | |
End of period | | $ | 306,211,538 | | | $ | 245,274,430 | | | | | |
| | | | |
Undistributed net investment income, end of period | | $ | 2,236,307 | | | $ | 1,983,124 | | | | | |
| | | | |
1 Distributions for annual periods determined in accordance with U.S. federal income tax regulations. | | | | | | | | | | | | |
| | | | | | |
| See Notes to Consolidated Financial Statements. | | | | |
| | | | | | | |
| 28 | | BLACKROCK TOTAL EMERGING MARKETS FUND | | APRIL 30, 2017 | | |
| | |
| Consolidated Financial Highlights | | |
| | | | | | | | | | | | | | | | | | | | | | | | |
| | | Institutional | | | | |
| | | Six Months Ended
April 30,
2017
(Unaudited) | | | Year Ended October 31, | | | Period
May 16, 20131
to October 31,
2013 | | | | |
| | | | 2016 | | | 2015 | | | 2014 | | | |
| | | | | | | | | | | | | | | | | | | | | | | | |
| Per Share Operating Performance | | | | | | | | | | | | | | | | | | | | | | | | |
Net asset value, beginning of period | | $ | 9.72 | | | $ | 8.70 | | | $ | 9.84 | | | $ | 9.53 | | | $ | 10.00 | | | | | |
| | | | |
Net investment income2 | | | 0.10 | | | | 0.17 | | | | 0.11 | | | | 0.05 | | | | 0.05 | | | | | |
Net realized and unrealized gain (loss) | | | 0.41 | | | | 0.95 | | | | (1.19 | ) | | | 0.34 | | | | (0.52 | ) | | | | |
| | | | |
Net increase (decrease) from investment operations | | | 0.51 | | | | 1.12 | | | | (1.08 | ) | | | 0.39 | | | | (0.47 | ) | | | | |
| | | | |
| Distributions:3 | | | | | | | | | | | | | | | | | | | | |
From net investment income | | | (0.10 | ) | | | (0.10 | ) | | | (0.06 | ) | | | (0.08 | ) | | | — | | | | | |
From net realized gain | | | (0.11 | ) | | | — | | | | — | | | | — | | | | — | | | | | |
| | | | |
Total distributions | | | (0.21 | ) | | | (0.10 | ) | | | (0.06 | ) | | | (0.08 | ) | | | — | | | | | |
| | | | |
Net asset value, end of period | | $ | 10.02 | | | $ | 9.72 | | | $ | 8.70 | | | $ | 9.84 | | | $ | 9.53 | | | | | |
| | | | |
| | | | | | | | | | | | | | | | | | | | | | | | |
| Total Return4 | | | | | |
Based on net asset value | | | 5.54% | 5 | | | 13.16% | | | | (10.97)% | | | | 4.18% | | | | (4.70)% | 5 | | | | |
| | | | |
| | | | | | | | | | | | | | | | | | | | | | | | |
| Ratios to Average Net Assets6 | | | | | |
Total expenses | | | 1.04% | 7 | | | 1.44% | | | | 1.74% | | | | 2.01% | | | | 1.92% | 7,8 | | | | |
| | | | |
Total expenses after fees waived and/or reimbursed and/or paid indirectly | | | 0.85% | 7 | | | 1.04% | | | | 1.40% | | | | 1.40% | | | | 1.40% | 7 | | | | |
| | | | |
Net investment income | | | 2.03% | 7 | | | 1.88% | | | | 1.14% | | | | 0.56% | | | | 1.08% | 7 | | | | |
| | | | |
| | | | | | | | | | | | | | | | | | | | | | | | |
| Supplemental Data | | | | | |
Net assets, end of period (000) | | $ | 265,649 | | | $ | 205,782 | | | $ | 54,526 | | | $ | 51,671 | | | $ | 48,532 | | | | | |
| | | | |
Portfolio turnover rate9 | | | 90% | | | | 22% | | | | 34% | | | | 37% | | | | 12% | | | | | |
| | | | |
| | 1 | | Commencement of operations. |
| | 2 | | Based on average shares outstanding. |
| | 3 | | Distributions for annual periods determined in accordance with U.S. federal income tax regulations. |
| | 4 | | Where applicable, assumes the reinvestment of distributions. |
| | 5 | | Aggregate total return. |
| | 6 | | Ratios do not include expenses incurred indirectly as a result of investments in underlying funds of approximately 0.07% for the six months ended April 30, 2017, 0.08% for the year ended October 31, 2016, 0.11% for the year ended October 31, 2015 and 0.12% for the year ended October 31, 2014 and period ended October 31, 2013. |
| | 8 | | Organization costs were not annualized in the calculation of the expense ratios. If these expenses were annualized, the total expenses would have been 1.97%. |
| | 9 | | Excludes investments underlying the total return swaps. |
| | | | | | |
| See Notes to Consolidated Financial Statements. | | | | |
| | | | | | | |
| | BLACKROCK TOTAL EMERGING MARKETS FUND | | APRIL 30, 2017 | | 29 |
| | |
| Consolidated Financial Highlights (continued) | | |
| | | | | | | | | | | | | | | | | | | | | | | | |
| | | Investor A | | | | |
| | | Six Months Ended
April 30,
2017
(Unaudited) | | | Year Ended October 31, | | | Period
May 16, 20131
to October 31,
2013 | | | | |
| | | 2016 | | | 2015 | | | 2014 | | | |
| | | | | | | | | | | | | | | | | | | | | | | | |
| Per Share Operating Performance | | | | | |
Net asset value, beginning of period | | $ | 9.67 | | | $ | 8.67 | | | $ | 9.81 | | | $ | 9.52 | | | $ | 10.00 | | | | | |
| | | | |
Net investment income2 | | | 0.08 | | | | 0.16 | | | | 0.10 | | | | 0.02 | | | | 0.04 | | | | | |
Net realized and unrealized gain (loss) | | | 0.42 | | | | 0.93 | | | | (1.19 | ) | | | 0.35 | | | | (0.52 | ) | | | | |
| | | | |
Net increase (decrease) from investment operations | | | 0.50 | | | | 1.09 | | | | (1.09 | ) | | | 0.37 | | | | (0.48 | ) | | | | |
| | | | |
| Distributions:3 | | | | | | | | | | | | | | | | | | | | |
From net investment income | | | (0.10 | ) | | | (0.09 | ) | | | (0.05 | ) | | | (0.08 | ) | | | — | | | | | |
From net realized gain | | | (0.11 | ) | | | — | | | | — | | | | — | | | | — | | | | | |
| | | | |
Total distributions | | | (0.21 | ) | | | (0.09 | ) | | | (0.05 | ) | | | (0.08 | ) | | | — | | | | | |
| | | | |
Net asset value, end of period | | $ | 9.96 | | | $ | 9.67 | | | $ | 8.67 | | | $ | 9.81 | | | $ | 9.52 | | | | | |
| | | | |
| | | | | | | | | | | | | | | | | | | | | | | | |
| Total Return4 | | | | | |
Based on net asset value | | | 5.36% | 5 | | | 12.74% | | | | (11.15)% | | | | 3.90% | | | | (4.80)% | 5 | | | | |
| | | | |
| | | | | | | | | | | | | | | | | | | | | | | | |
| Ratios to Average Net Assets6 | | | | | |
Total expenses | | | 1.36% | 7 | | | 1.56% | | | | 2.15% | | | | 2.54% | | | | 2.63% | 7,8 | | | | |
| | | | |
Total expenses after fees waived and/or reimbursed and/or paid indirectly | | | 1.10% | 7 | | | 1.17% | | | | 1.65% | | | | 1.65% | | | | 1.65% | 7 | | | | |
| | | | |
Net investment income | | | 1.79% | 7 | | | 1.65% | | | | 1.02% | | | | 0.23% | | | | 0.82% | 7 | | | | |
| | | | |
| | | | | | | | | | | | | | | | | | | | | | | | |
| Supplemental Data | | | | | |
Net assets, end of period (000) | | $ | 35,187 | | | $ | 37,058 | | | $ | 1,628 | | | $ | 698 | | | $ | 71 | | | | | |
| | | | |
Portfolio turnover rate9 | | | 90% | | | | 22% | | | | 34% | | | | 37% | | | | 12% | | | | | |
| | | | |
| | 1 | | Commencement of operations. |
| | 2 | | Based on average shares outstanding. |
| | 3 | | Distributions for annual periods determined in accordance with U.S. federal income tax regulations. |
| | 4 | | Where applicable, excludes the effects of any sales charges and assumes the reinvestment of distributions. |
| | 5 | | Aggregate total return. |
| | 6 | | Ratios do not include expenses incurred indirectly as a result of investments in underlying funds of approximately 0.07% for the six months ended April 30, 2017, 0.08% for the year ended October 31, 2016, 0.11% for the year ended October 31, 2015 and 0.12% for the year ended October 31, 2014 and period ended October 31, 2013. |
| | 8 | | Organization costs were not annualized in the calculation of the expense ratios. If these expenses were annualized, the total expenses would have been 2.66%. |
| | 9 | | Excludes investments underlying the total return swaps. |
| | | | | | |
| See Notes to Consolidated Financial Statements. | | | | |
| | | | | | | |
| 30 | | BLACKROCK TOTAL EMERGING MARKETS FUND | | APRIL 30, 2017 | | |
| | |
| Consolidated Financial Highlights (concluded) | | |
| | | | | | | | | | | | | | | | | | | | | | | | |
| | | Investor C | | | | |
| | | Six Months Ended
April 30,
2017
(Unaudited) | | | Year Ended October 31, | | | Period
May 16, 20131
to October 31,
2013 | | | | |
| | | 2016 | | | 2015 | | | 2014 | | | |
| | | | | | | | | | | | | | | | | | | | | | | | |
| Per Share Operating Performance | | | | | |
Net asset value, beginning of period | | $ | 9.61 | | | $ | 8.58 | | | $ | 9.73 | | | $ | 9.49 | | | $ | 10.00 | | | | | |
| | | | |
Net investment income (loss) 2 | | | 0.05 | | | | 0.08 | | | | (0.01 | ) | | | (0.05 | ) | | | 0.00 | 3 | | | | |
Net realized and unrealized gain (loss) | | | 0.40 | | | | 0.95 | | | | (1.14 | ) | | | 0.34 | | | | (0.51 | ) | | | | |
| | | | |
Net increase (decrease) from investment operations | | | 0.45 | | | | 1.03 | | | | (1.15 | ) | | | 0.29 | | | | (0.51 | ) | | | | |
| | | | |
| Distributions:4 | | | | | | | | | | | | | | | | | | | | |
From net investment income | | | (0.05 | ) | | | — | | | | — | | | | (0.05 | ) | | | — | | | | | |
From net realized gain | | | (0.11 | ) | | | — | | | | — | | | | — | | | | — | | | | | |
| | | | |
Total distributions | | | (0.16 | ) | | | — | | | | — | | | | (0.05 | ) | | | — | | | | | |
| | | | |
Net asset value, end of period | | $ | 9.90 | | | $ | 9.61 | | | $ | 8.58 | | | $ | 9.73 | | | $ | 9.49 | | | | | |
| | | | |
| | | | | | | | | | | | | | | | | | | | | | | | |
| Total Return5 | | | | | |
Based on net asset value | | | 4.92% | 6 | | | 12.01% | | | | (11.82)% | | | | 3.14% | | | | (5.10)% | 6 | | | | |
| | | | |
| | | | | | | | | | | | | | | | | | | | | | | | |
| Ratios to Average Net Assets7 | | | | | |
Total expenses | | | 2.08% | 8 | | | 2.61% | | | | 2.91% | | | | 3.25% | | | | 3.43% | 8,9 | | | | |
| | | | |
Total expenses after fees waived and/or reimbursed and/or paid indirectly | | | 1.85% | 8 | | | 2.10% | | | | 2.40% | | | | 2.40% | | | | 2.40% | 8 | | | | |
| | | | |
Net investment income (loss) | | | 1.03% | 8 | | | 0.88% | | | | (0.10)% | | | | (0.57)% | | | | 0.06% | 8 | | | | |
| | | | |
| | | | | | | | | | | | | | | | | | | | | | | | |
| Supplemental Data | | | | | |
Net assets, end of period (000) | | $ | 5,375 | | | $ | 2,435 | | | $ | 898 | | | $ | 2,290 | | | $ | 71 | | | | | |
| | | | |
Portfolio turnover rate10 | | | 90% | | | | 22% | | | | 34% | | | | 37% | | | | 12% | | | | | |
| | | | |
| | 1 | | Commencement of operations. |
| | 2 | | Based on average shares outstanding. |
| | 3 | | Amount is less than $0.005 per share. |
| | 4 | | Distributions for annual periods determined in accordance with U.S. federal income tax regulations. |
| | 5 | | Where applicable, excludes the effects of any sales charges and assumes the reinvestment of distributions. |
| | 6 | | Aggregate total return. |
| | 7 | | Ratios do not include expenses incurred indirectly as a result of investments in underlying funds of approximately 0.07% for the six months ended April 30, 2017, 0.08% for the year ended October 31, 2016, 0.11% for the year ended October 31, 2015 and 0.12% for the year ended October 31, 2014 and period ended October 31, 2013. |
| | 9 | | Organization costs were not annualized in the calculation of the expense ratios. If these expenses were annualized, the total expenses would have been 3.47%. |
| | 10 | | Excludes investments underlying the total return swaps. |
| | | | | | |
| See Notes to Consolidated Financial Statements. | | | | |
| | | | | | | |
| | BLACKROCK TOTAL EMERGING MARKETS FUND | | APRIL 30, 2017 | | 31 |
| | |
| Notes to Consolidated Financial Statements (Unaudited) | | |
1. Organization:
BlackRock FundsSM (the “Trust”) is registered under the Investment Company Act of 1940, as amended (the “1940 Act”), as an open-end management investment company. The Trust is organized as a Massachusetts business trust. BlackRock Total Emerging Markets Fund (the “Fund”) is a series of the Trust. The Fund is classified as diversified under the 1940 Act.
The Fund offers multiple classes of shares. All classes of shares have identical voting, dividend, liquidation and other rights and are subject to the same terms and conditions, except that certain classes bear expenses related to the shareholder servicing and distribution of such shares. Institutional Shares are sold only to certain eligible investors. Investor A and Investor C Shares are generally available through financial intermediaries. Each class has exclusive voting rights with respect to matters relating to its shareholder servicing and distribution expenditures.
| | | | | | | | | | | | |
| Share Class | | Initial Sales Charge | | | CDSC | | | Conversion Privilege | |
Institutional Shares | | | No | | | | No | | | | None | |
Investor A Shares | | | Yes | | | | No | 1 | | | None | |
Investor C Shares | | | No | | | | Yes | | | | None | |
| | 1 | | Investor A Shares may be subject to a Contingent Deferred Sales Charge (“CDSC”) for certain redemptions where no initial sales charge was paid at the time of purchase. |
The Fund, together with certain other registered investment companies advised by BlackRock Advisors, LLC (the “Manager”) or its affiliates, is included in a complex of open-end funds referred to as the Equity-Liquidity Complex.
Basis of Consolidation: The accompanying consolidated financial statements of the Fund include the accounts of BlackRock Cayman Emerging Market Allocation Fund, Ltd. (the “Subsidiary”), which is a wholly-owned subsidiary of the Fund and primarily invests in commodity-related instruments. The Subsidiary enables the Fund to hold these commodity-related instruments and satisfy regulated investment company tax requirements. The Fund may invest up to 25% of its total assets in the Subsidiary. The net assets of the Subsidiary as of period end were $12,366, which is 0.0% of the Fund’s consolidated net assets. Intercompany accounts and transactions, if any, have been eliminated. The Subsidiary is subject to the same investment policies and restrictions that apply to the Fund, except that the Subsidiary may invest without limitation in commodity-related instruments.
2. Significant Accounting Policies:
The consolidated financial statements are prepared in conformity with accounting principles generally accepted in the United States of America (“U.S. GAAP”), which may require management to make estimates and assumptions that affect the reported amounts of assets and liabilities in the financial statements, disclosure of contingent assets and liabilities at the date of the financial statements and the reported amounts of increases and decreases in net assets from operations during the reporting period. Actual results could differ from those estimates. The Fund is considered an investment company under U.S. GAAP and follows the accounting and reporting guidance applicable to investment companies. Below is a summary of significant accounting policies:
Investment Transactions and Investment Income: For financial reporting purposes, investment transactions are recorded on the dates the transactions are entered into (the trade dates). Realized gains and losses on investment transactions are determined on the identified cost basis. Interest income, including amortization and accretion of premiums and discounts on debt securities, is recognized on the accrual basis. Income, expenses and realized and unrealized gains and losses are allocated daily to each class based on its relative net assets.
Foreign Currency: The Fund’s books and records are maintained in U.S. dollars. Purchases and sales of investments are recorded at the rates of exchange prevailing on the respective dates of such transactions. Generally, when the U.S. dollar rises in value against a foreign currency, the investments denominated in that currency will lose value; the opposite effect occurs if the U.S. dollar falls in relative value.
The Fund does not isolate the portion of the results of operations arising as a result of changes in the exchange rates from the changes in the market prices of investments held or sold for financial reporting purposes. Accordingly, the effects of changes in exchange rates on investments are not segregated in the Consolidated Statement of Operations from the effects of changes in market prices of those investments, but are included as a component of net realized and unrealized gain (loss) from investments. The Fund reports realized currency gains (losses) on foreign currency related transactions as components of net realized gain (loss) for financial reporting purposes, whereas such components are generally treated as ordinary income for federal income tax purposes.
Segregation and Collateralization: In cases where the Fund enters into certain investments (e.g., futures contracts, forward foreign currency exchange contracts and swaps) that would be treated as “senior securities” for 1940 Act purposes, the Fund may segregate or designate on its books and records cash or liquid assets having a market value at least equal to the amount of its future obligations under such investments. Doing so allows the investment to be excluded from treatment as a “senior security.” Furthermore, if required by an exchange or counterparty agreement, the Fund may be required to deliver/deposit cash and/or securities to/with an exchange, or broker-dealer or custodian as collateral for certain investments or obligations.
Distributions: Distributions paid by the Fund are recorded on the ex-dividend date. Distributions of capital gains are recorded on the ex-dividend date and made at least annually. The character and timing of distributions are determined in accordance with U.S. federal income tax regulations, which may differ from U.S. GAAP.
| | | | | | |
| | | | | | | |
| 32 | | BLACKROCK TOTAL EMERGING MARKETS FUND | | APRIL 30, 2017 | | |
| | | | |
| Notes to Consolidated Financial Statements (continued) | | |
Net income and realized gains from investments held by the Subsidiary are treated as ordinary income for tax purposes. If a net loss is realized by the Subsidiary in any taxable year, the loss will generally not be available to offset the Fund’s ordinary income and/or capital gains for that year.
Recent Accounting Standards: In November 2016, the Financial Accounting Standards Board issued Accounting Standards Update “Restricted Cash” which will require entities to include the total of cash, cash equivalents, restricted cash, and restricted cash equivalents in the beginning and ending cash balances in the Statements of Cash Flows. The guidance will be applied retrospectively and is effective for fiscal years beginning after December 15, 2017, and interim periods within those years. Management is evaluating the impact, if any, of this guidance on the Fund’s presentation in the Statements of Cash Flows.
In March 2017, the Financial Accounting Standards Board issued Accounting Standards Update “Premium Amortization of Purchased Callable Debt Securities” which amends the amortization period for certain purchased callable debt securities. Under the new guidance, premium amortization of purchased callable debt securities that have explicit, non-contingent call features and are callable at fixed prices will be amortized to the earliest call date. The guidance will be applied on a modified retrospective basis and is effective for fiscal years, and their interim periods, beginning after December 15, 2018. Management is currently evaluating the impact of this guidance to the Fund.
SEC Reporting Modernization: The Securities and Exchange Commission (“SEC”) adopted new rules and forms and amended other rules to enhance the reporting and disclosure of information by registered investment companies. As part of these changes, the SEC amended Regulation S-X to standardize and enhance disclosures in investment company financial statements. The compliance date for implementing the new or amended rules is August 1, 2017.
Indemnifications: In the normal course of business, the Fund enters into contracts that contain a variety of representations that provide general indemnification. The Fund’s maximum exposure under these arrangements is unknown because it involves future potential claims against the Fund, which cannot be predicted with any certainty.
Other: Expenses directly related to the Fund or its classes are charged to the Fund or the applicable class. Other operating expenses shared by several funds, including other funds managed by the Manager, are prorated among those funds on the basis of relative net assets or other appropriate methods. Expenses directly related to the Fund and other shared expenses prorated to the Fund are allocated daily to each class based on its relative net assets or other appropriate methods.
Through May 31, 2016, the Fund had an arrangement with its custodian whereby credits were earned on uninvested cash balances, which could be used to reduce custody fees and/or overdraft charges. Credits previously earned have been utilized until December 31, 2016. Under current arrangements effective June 1, 2016, the Fund no longer earns credits on uninvested cash, and may incur charges on uninvested cash balances and overdrafts, subject to certain conditions.
3. Investment Valuation and Fair Value Measurements:
Investment Valuation Policies: The Fund’s investments are valued at fair value (also referred to as “market value” within the financial statements) as of the close of trading on the New York Stock Exchange (“NYSE”) (generally 4:00 p.m., Eastern time) (or if the reporting date falls on a day the NYSE is closed, investments are valued at fair value as of the period end). U.S. GAAP defines fair value as the price the Fund would receive to sell an asset or pay to transfer a liability in an orderly transaction between market participants at the measurement date. The Fund determines the fair values of its financial instruments using various independent dealers or pricing services under policies approved by the Board of Trustees of the Trust (the “Board”). The BlackRock Global Valuation Methodologies Committee (the “Global Valuation Committee”) is the committee formed by management to develop global pricing policies and procedures and to oversee the pricing function for all financial instruments.
Fair Value Inputs and Methodologies: The following methods and inputs are used to establish the fair value of the Fund’s assets and liabilities:
| • | | Equity investments traded on a recognized securities exchange are valued at the official closing price each day, if available. For equity investments traded on more than one exchange, the official closing price on the exchange where the stock is primarily traded is used. Equity investments traded on a recognized exchange for which there were no sales on that day may be valued at the last available bid (long positions) or ask (short positions) price. |
| • | | Fixed-income securities for which market quotations are readily available are generally valued using the last available bid prices or current market quotations provided by independent dealers or third party pricing services. Floating rate loan interests are valued at the mean of the bid prices from one or more independent brokers or dealers as obtained from a third party pricing service. Pricing services generally value fixed-income securities assuming orderly transactions of an institutional round lot size, but the Fund may hold or transact in such securities in smaller, odd lot sizes. Odd lots often trade at lower prices than institutional round lots. The pricing services may use matrix pricing or valuation models that utilize certain inputs and assumptions to derive values, including transaction data (e.g., recent representative bids and offers), credit quality information, perceived market movements, news, and other relevant information. Certain fixed-income securities, including asset-backed and mortgage related securities may be valued based on valuation models that consider the estimated cash flows of each tranche of the entity, establish a benchmark yield and develop an estimated tranche specific spread to the benchmark yield based on the unique attributes of the tranche. The amortized cost method of valuation may |
| | | | | | |
| | | | | | | |
| | BLACKROCK TOTAL EMERGING MARKETS FUND | | APRIL 30, 2017 | | 33 |
| | |
| Notes to Consolidated Financial Statements (continued) | | |
| | be used with respect to debt obligations with sixty days or less remaining to maturity unless the Manager determines such method does not represent fair value. |
Generally, trading in foreign instruments is substantially completed each day at various times prior to the close of trading on the NYSE. Occasionally, events affecting the values of such instruments may occur between the foreign market close and the close of trading on the NYSE that may not be reflected in the computation of the Fund’s net assets. Each business day, the Fund uses a pricing service to assist with the valuation of certain foreign exchange-traded equity securities and foreign exchange-traded and over-the-counter (“OTC”) options (the “Systematic Fair Value Price”). Using current market factors, the Systematic Fair Value Price is designed to value such foreign securities and foreign options at fair value as of the close of trading on the NYSE, which follows the close of the local markets.
| • | | Investments in open-end U.S. mutual funds are valued at net asset value (“NAV”) each business day. |
| • | | Futures contracts traded on exchanges are valued at their last sale price. |
| • | | Securities and other assets and liabilities denominated in foreign currencies are translated into U.S. dollars using exchange rates determined as of the close of trading on the NYSE. Forward foreign currency exchange contracts are valued at the mean between the bid and ask prices and are determined as of the close of trading on the NYSE. Interpolated values are derived when the settlement date of the contract is an interim date for which quotations are not available. |
| • | | Swap agreements are valued utilizing quotes received daily by the Fund’s pricing service or through brokers, which are derived using daily swap curves and models that incorporate a number of market data factors, such as discounted cash flows, trades and values of the underlying reference instruments. |
If events (e.g., a company announcement, market volatility or a natural disaster) occur that are expected to materially affect the value of such investments, or in the event that the application of these methods of valuation results in a price for an investment that is deemed not to be representative of the market value of such investment, or if a price is not available, the investment will be valued by the Global Valuation Committee, or its delegate, in accordance with a policy approved by the Board as reflecting fair value (“Fair Valued Investments”). The fair valuation approaches that may be used by the Global Valuation Committee will include Market approach, Income approach and Cost approach. Valuation techniques such as discounted cash flow, use of market comparables and matrix pricing are types of valuation approaches and typically used in determining fair value. When determining the price for Fair Valued Investments, the Global Valuation Committee, or its delegate, seeks to determine the price that the Fund might reasonably expect to receive or pay from the current sale or purchase of that asset or liability in an arm’s-length transaction. Fair value determinations shall be based upon all available factors that the Global Valuation Committee, or its delegate, deems relevant and consistent with the principles of fair value measurement. The pricing of all Fair Valued Investments is subsequently reported to the Board or a committee thereof on a quarterly basis.
Fair Value Hierarchy: Various inputs are used in determining the fair value of investments and derivative financial instruments. These inputs to valuation techniques are categorized into a fair value hierarchy consisting of three broad levels for financial statement purposes as follows:
| • | | Level 1 — unadjusted price quotations in active markets/exchanges for identical assets or liabilities that the Fund has the ability to access |
| • | | Level 2 — other observable inputs (including, but not limited to, quoted prices for similar assets or liabilities in markets that are active, quoted prices for identical or similar assets or liabilities in markets that are not active, inputs other than quoted prices that are observable for the assets or liabilities (such as interest rates, yield curves, volatilities, prepayment speeds, loss severities, credit risks and default rates) or other market–corroborated inputs) |
| • | | Level 3 — unobservable inputs based on the best information available in the circumstances, to the extent observable inputs are not available (including the Fund’s own assumptions used in determining the fair value of investments and derivative financial instruments) |
The hierarchy gives the highest priority to unadjusted quoted prices in active markets for identical assets or liabilities (Level 1 measurements) and the lowest priority to unobservable inputs (Level 3 measurements). Accordingly, the degree of judgment exercised in determining fair value is greatest for instruments categorized in Level 3. The inputs used to measure fair value may fall into different levels of the fair value hierarchy. In such cases, for disclosure purposes, the fair value hierarchy classification is determined based on the lowest level input that is significant to the fair value measurement in its entirety. Investments classified within Level 3 have significant unobservable inputs used by the Global Valuation Committee in determining the price for Fair Valued Investments. Level 3 investments include equity or debt issued by privately held companies or funds. There may not be a secondary market, and/or there are a limited number of investors. Level 3 investments may also be adjusted to reflect illiquidity and/or non-transferability, with the amount of such discount estimated by the Global Valuation Committee in the absence of market information.
Changes in valuation techniques may result in transfers into or out of an assigned level within the hierarchy. In accordance with the Fund’s policy, transfers between different levels of the fair value hierarchy are deemed to have occurred as of the beginning of the reporting period. The categorization of a value determined for investments and derivative financial instruments is based on the pricing transparency of the investments and derivative financial instruments and is not necessarily an indication of the risks associated with investing in those securities.
| | | | | | |
| | | | | | | |
| 34 | | BLACKROCK TOTAL EMERGING MARKETS FUND | | APRIL 30, 2017 | | |
| | | | |
| Notes to Consolidated Financial Statements (continued) | | |
4. Securities and Other Investments:
Inflation-Indexed Bonds: Inflation-indexed bonds (other than municipal inflation-indexed and certain corporate inflation-indexed bonds) are fixed-income securities whose principal value is periodically adjusted according to the rate of inflation. If the index measuring inflation rises or falls, the principal value of inflation-indexed bonds (other than municipal inflation-indexed and certain corporate inflation-indexed bonds) will be adjusted upward or downward, and consequently the interest payable on these securities (calculated with respect to a larger or smaller principal amount) will be increased or reduced, respectively. Any upward or downward adjustment in the principal amount of an inflation-indexed bond will be included as interest income in the Consolidated Statement of Operations, even though investors do not receive their principal until maturity. Repayment of the original bond principal upon maturity (as adjusted for inflation) is guaranteed in the case of U.S. Treasury inflation-indexed bonds. For bonds that do not provide a similar guarantee, the adjusted principal value of the bond repaid at maturity may be less than the original principal. With regard to municipal inflation-indexed bonds and certain corporate inflation-indexed bonds, the inflation adjustment is typically reflected in the semi-annual coupon payment. As a result, the principal value of municipal inflation-indexed bonds and such corporate inflation-indexed bonds does not adjust according to the rate of inflation.
5. Derivative Financial Instruments:
The Fund engages in various portfolio investment strategies using derivative contracts both to increase the returns of the Fund and/or to manage its exposure to certain risks such as credit risk, equity risk, interest rate risk, foreign currency exchange rate risk, commodity price risk or other risks (e.g., inflation risk). Derivative financial instruments categorized by risk exposure are included in the Consolidated Schedule of Investments. These contracts may be transacted on an exchange or OTC.
Futures Contracts: The Fund invests in long and/or short positions in futures and options on futures contracts to gain exposure to, or manage exposure to, changes in interest rates (interest rate risk), changes in the value of equity securities (equity risk) or foreign currencies (foreign currency exchange rate risk).
Futures contracts are agreements between the Fund and a counterparty to buy or sell a specific quantity of an underlying instrument at a specified price and on a specified date. Depending on the terms of a contract, it is settled either through physical delivery of the underlying instrument on the settlement date or by payment of a cash amount on the settlement date. Upon entering into a futures contract, the Fund is required to deposit initial margin with the broker in the form of cash or securities in an amount that varies depending on a contract’s size and risk profile. The initial margin deposit must then be maintained at an established level over the life of the contract.
Securities deposited as initial margin are designated in the Consolidated Schedule of Investments and cash deposited, if any, is shown as cash pledged for futures contracts in the Consolidated Statement of Assets and Liabilities. Pursuant to the contract, the Fund agrees to receive from or pay to the broker an amount of cash equal to the daily fluctuation in market value of the contract (“variation margin”). Variation margin is recorded as unrealized appreciation (depreciation) and, if any, shown as variation margin receivable (or payable) on futures contracts in the Consolidated Statement of Assets and Liabilities. When the contract is closed, a realized gain or loss is recorded in the Consolidated Statement of Operations equal to the difference between the value of the contract at the time it was opened and the value at the time it was closed. The use of futures contracts involves the risk of an imperfect correlation in the movements in the price of futures contracts and interest, foreign currency exchange rates or underlying assets.
Forward Foreign Currency Exchange Contracts: The Fund enters into forward foreign currency exchange contracts to gain or reduce exposure to foreign currencies (foreign currency exchange rate risk).
A forward foreign currency exchange contract is an agreement between two parties to buy and sell a currency at a set exchange rate on a specified date. These contracts help to manage the overall exposure to the currencies in which some of the investments held by the Fund are denominated and in some cases, may be used to obtain exposure to a particular market.
The contract is marked to market daily and the change in market value is recorded as unrealized appreciation (depreciation) in the Consolidated Statement of Assets and Liabilities. When a contract is closed, a realized gain or loss is recorded in the Consolidated Statement of Operations equal to the difference between the value at the time it was opened and the value at the time it was closed. Non-deliverable forward foreign currency exchange contracts are settled with the counterparty in cash without the delivery of foreign currency. The use of forward foreign currency exchange contracts involves the risk that the value of a forward foreign currency exchange contract changes unfavorably due to movements in the value of the referenced foreign currencies.
Swaps: The Fund enters into swap contracts to manage exposure to issuers, markets and securities. Such contracts are agreements between the Fund and a counterparty to make periodic net payments on a specified notional amount or a net payment upon termination.
Swap agreements are privately negotiated in the OTC market and may be entered into as a bilateral contract (“OTC swaps”) or centrally cleared (“centrally cleared swaps”).
For OTC swaps, any upfront premiums paid and any upfront fees received are shown as swap premiums paid and swap premiums received, respectively, in the Consolidated Statement of Assets and Liabilities and amortized over the term of the contract. The daily fluctuation in market value is recorded as unrealized appreciation (depreciation) on OTC Swaps in the Consolidated Statement of Assets and Liabilities. Payments received or paid are recorded in the Consolidated Statement of Operations as realized gains or losses, respectively. When an OTC swap is terminated, a realized gain or loss is recorded in
| | | | | | |
| | | | | | | |
| | BLACKROCK TOTAL EMERGING MARKETS FUND | | APRIL 30, 2017 | | 35 |
| | |
| Notes to Consolidated Financial Statements (continued) | | |
the Consolidated Statement of Operations equal to the difference between the proceeds from (or cost of) the closing transaction and the Fund’s basis in the contract, if any. Generally, the basis of the contract is the premium received or paid.
In a centrally cleared swap, immediately following execution of the swap contract, the swap contract is novated to a central counterparty (the “CCP”) and the Fund’s counterparty on the swap agreement becomes the CCP. The Fund is required to interface with the CCP through the broker. Upon entering into a centrally cleared swap, the Fund is required to deposit initial margin with the broker in the form of cash or securities in an amount that varies depending on the size and risk profile of the particular swap. Securities deposited as initial margin are designated in the Consolidated Schedule of Investments and cash deposited is shown as cash pledged for centrally cleared swaps in the Consolidated Statement of Assets and Liabilities. Pursuant to the contract, the Fund agrees to receive from or pay to the broker an amount of cash equal to the daily fluctuation in market value of the contract (“variation margin”). Variation margin is recorded as unrealized appreciation (depreciation) and shown as variation margin receivable (or payable) on centrally cleared swaps in the Consolidated Statement of Assets and Liabilities. Payments received from (paid to) the counterparty, including at termination, are recorded as realized gains (losses) in the Consolidated Statement of Operations.
| • | | Total return swaps — The Fund enters into total return swaps to obtain exposure to a portfolio of long and short securities without owning such securities. |
Under the terms of a contract, the swap is designed to function as a portfolio of direct investments in long and short equity positions. This means that the Fund has the ability to trade in and out of these long and short positions within the swap and will receive the economic benefits and risks equivalent to direct investment in these positions, subject to certain adjustments due to events related to the counterparty. Benefits and risks include capital appreciation (depreciation), corporate actions and dividends received and paid, all of which are reflected in the swap’s market value. The market value also includes interest charges and credits (“financing fees”) related to the notional values of the long and short positions and cash balances within the swap. These interest charges and credits are based on a specified benchmark rate plus or minus a specified spread determined based upon the country and/or currency of the positions in the portfolio.
Positions within the swap and financing fees are reset periodically. During a reset, any unrealized appreciation (depreciation) on positions and accrued financing fees become available for cash settlement between the Fund and the counterparty. The amounts that are available for cash settlement are recorded as realized gains or losses in the Consolidated Statement of Operations. Cash settlement in and out of the swap may occur at a reset date or any other date, at the discretion of the Fund and the counterparty, over the life of the agreement. Certain swaps have no stated expiration and can be terminated by either party at any time.
| • | | Interest rate swaps — The Fund enters into interest rate swaps to gain or reduce exposure to interest rates or to manage duration, the yield curve or interest rate (interest rate risk). |
Interest rate swaps are agreements in which one party pays a stream of interest payments, either fixed or floating, in exchange for another party’s stream of interest payments, either fixed or floating, on the same notional amount for a specified period of time. In more complex interest rate swaps, the notional principal amount may decline (or amortize) over time.
| • | | Forward swaps — The Fund enters into forward interest rate swaps and forward total return swaps. In a forward swap, the Fund and the counterparty agree to make periodic net payments beginning on a specified date or a net payment at termination. |
Swap transactions involve, to varying degrees, elements of interest rate, credit and market risk in excess of the amounts recognized in the Consolidated Statement of Assets and Liabilities. Such risks involve the possibility that there will be no liquid market for these agreements, that the counterparty to the agreements may default on its obligation to perform or disagree as to the meaning of the contractual terms in the agreements, and that there may be unfavorable changes in interest rates and/or market values associated with these transactions.
Master Netting Arrangements: In order to define its contractual rights and to secure rights that will help it mitigate its counterparty risk, the Fund may enter into an International Swaps and Derivatives Association, Inc. Master Agreement (“ISDA Master Agreement”) or similar agreement with its counterparties. An ISDA Master Agreement is a bilateral agreement between the Fund and a counterparty that governs certain OTC derivatives and typically contains, among other things, collateral posting terms and netting provisions in the event of a default and/or termination event. Under an ISDA Master Agreement, the Fund may, under certain circumstances, offset with the counterparty certain derivative financial instruments’ payables and/or receivables with collateral held and/or posted and create one single net payment. The provisions of the ISDA Master Agreement typically permit a single net payment in the event of default including the bankruptcy or insolvency of the counterparty. Bankruptcy or insolvency laws of a particular jurisdiction may restrict or prohibit the right of offset in bankruptcy, insolvency or other events. In addition, certain ISDA Master Agreements allow counterparties to terminate derivative contracts prior to maturity in the event the Fund’s net assets decline by a stated percentage or the Fund fails to meet the terms of its ISDA Master Agreements. The result would cause the Fund to accelerate payment of any net liability owed to the counterparty.
Collateral Requirements: For derivatives traded under an ISDA Master Agreement, the collateral requirements are typically calculated by netting the mark-to-market amount for each transaction under such agreement and comparing that amount to the value of any collateral currently pledged by the Fund and the counterparty.
| | | | | | |
| | | | | | | |
| 36 | | BLACKROCK TOTAL EMERGING MARKETS FUND | | APRIL 30, 2017 | | |
| | | | |
| Notes to Consolidated Financial Statements (continued) | | |
Cash collateral that has been pledged to cover obligations of the Fund and cash collateral received from the counterparty, if any, is reported separately on the Consolidated Statement of Assets and Liabilities as cash pledged as collateral and cash received as collateral, respectively. Non-cash collateral pledged by the Fund, if any, is noted in the Consolidated Schedule of Investments. Generally, the amount of collateral due from or to a counterparty is subject to a certain minimum transfer amount threshold before a transfer is required, which is determined at the close of business of the Fund. Any additional required collateral is delivered to/pledged by the Fund on the next business day. Typically, the counterparty is not permitted to sell, re-pledge or use cash and non-cash collateral it receives. The Fund generally agrees not to use non-cash collateral that it receives but may, absent default or certain other circumstances defined in the underlying ISDA Master Agreement, be permitted to use cash collateral received. In such cases, interest may be paid pursuant to the collateral arrangement with the counterparty. To the extent amounts due to the Fund from its counterparties are not fully collateralized, it bears the risk of loss from counterparty non-performance. Likewise, to the extent the Fund has delivered collateral to a counterparty and stands ready to perform under the terms of its agreement with such counterparty, it bears the risk of loss from a counterparty in the amount of the value of the collateral in the event the counterparty fails to return such collateral. Based on the terms of agreements, collateral may not be required for all derivative contracts.
For financial reporting purposes, the Fund does not offset derivative assets and derivative liabilities that are subject to netting arrangements, if any, in the Consolidated Statement of Assets and Liabilities.
6. Investment Advisory Agreement and Other Transactions with Affiliates:
The PNC Financial Services Group, Inc. is the largest stockholder and an affiliate of BlackRock, Inc. (“BlackRock”) for 1940 Act purposes.
Investment Advisory: The Trust, on behalf of the Fund, entered into an Investment Advisory Agreement with the Manager, the Fund’s investment adviser, an indirect, wholly-owned subsidiary of BlackRock, to provide investment advisory services. The Manager is responsible for the management of the Fund’s portfolio and provides the personnel, facilities, equipment and certain other services necessary to the operations of the Fund.
For such services, the Fund pays the Manager a monthly fee at an annual rate equal to the following percentages of the average daily value of the Fund’s net assets as follows:
| | | | |
| Average Daily Net Assets | | Investment Advisory Fee | |
First $1 Billion | | | 0.75% | |
$1 Billion — $3 Billion | | | 0.71% | |
$3 Billion — $5 Billion | | | 0.68% | |
$5 Billion — $10 Billion | | | 0.65% | |
Greater than $10 Billion | | | 0.64% | |
The Manager provides investment management and other services to the Subsidiary. The Manager does not receive separate compensation from the Subsidiary for providing investment management or administrative services. However, the Fund pays the Manager based on the Fund’s net assets, which includes the assets of the Subsidiary.
With respect to the Fund, the Manager entered into separate sub-advisory agreements with BlackRock International Limited, BlackRock Asset Management North Asia Limited and BlackRock (Singapore) Limited (collectively, the “Sub-Advisers”), each an affiliate of the Manager. The Manager pays the Sub-Advisers for services they provide a monthly fee that is a percentage of the investment advisory fees paid by the Fund to the Manager.
Service and Distribution Fees: The Trust, on behalf of the Fund, entered into a Distribution Agreement and a Distribution and Service Plan with BlackRock Investments, LLC (“BRIL”), an affiliate of the Manager. Pursuant to the Distribution and Service Plan and in accordance with Rule 12b-1 under the 1940 Act, the Fund pays BRIL ongoing service and distribution fees. The fees are accrued daily and paid monthly at annual rates based upon the average daily net assets of the relevant share class of the Fund as follows:
| | | | | | | | |
| | | Investor A | | | Investor C | |
Service Fee | | | 0.25% | | | | 0.25% | |
Distribution Fee | | | — | | | | 0.75% | |
BRIL and broker-dealers, pursuant to sub-agreements with BRIL, provide shareholder servicing and distribution services to the Fund. The ongoing service and/or distribution fee compensates BRIL and each broker-dealer for providing shareholder servicing and/or distribution related services to the shareholders.
For the six months ended April 30, 2017, the following table shows the class specific service and distribution fees borne directly by each share class of the Fund:
| | | | |
| Investor A | | Investor C | | Total |
$41,739 | | $17,695 | | $59,434 |
| | | | | | |
| | | | | | | |
| | BLACKROCK TOTAL EMERGING MARKETS FUND | | APRIL 30, 2017 | | 37 |
| | |
| Notes to Consolidated Financial Statements (continued) | | |
Administration: The Trust, on behalf of the Fund, entered into an Administration Agreement with the Manager, an indirect, wholly-owned subsidiary of BlackRock, to provide administrative services. For these services, the Manager receives an administration fee computed daily and payable monthly, based on a percentage of the average daily net assets of the Fund. The administration fee, which is shown as administration in the Consolidated Statement of Operations, is paid at the annual rates below.
| | | | |
| Average Daily Net Assets | | Administration Fee | |
First $500 Million | | | 0.0425% | |
$500 Million — $1 Billion | | | 0.0400% | |
$1 Billion — $2 Billion | | | 0.0375% | |
$2 Billion — $4 Billion | | | 0.0350% | |
$4 Billion — $13 Billion | | | 0.0325% | |
Greater than $13 Billion | | | 0.0300% | |
In addition, the Manager charges each of the share classes an administration fee, which is shown as administration — class specific in the Consolidated Statement of Operations, at an annual rate of 0.02% of the average daily net assets of each respective class.
For the six months ended April 30, 2017, the following table shows the class specific administration fees borne directly by each share class of the Fund:
| | | | | | |
| Institutional | | Investor A | | Investor C | | Total |
$19,015 | | $3,361 | | $357 | | $22,733 |
Transfer Agent: Pursuant to written agreements, certain financial intermediaries, some of which may be affiliates, provide the Fund with sub-accounting, recordkeeping, sub-transfer agency and other administrative services with respect to sub-accounts they service. For these services, these entities receive an asset-based fee or an annual fee per shareholder account, which will vary depending on share class and/or net assets.
The Manager maintains a call center that is responsible for providing certain shareholder services to the Fund. Shareholder services include responding to inquiries and processing subscriptions and redemptions based upon instructions from shareholders. For the six months ended April 30, 2017, the Fund reimbursed the Manager the following amounts for costs incurred in running the call center, which are included in transfer agent — class specific in the Consolidated Statement of Operations:
| | | | | | |
| Institutional | | Investor A | | Investor C | | Total |
$109 | | $99 | | $21 | | $229 |
For the six months ended April 30, 2017, the following table shows the class specific transfer agent fees borne directly by each class of the Fund:
| | | | | | |
| Institutional | | Investor A | | Investor C | | Total |
$41,610 | | $18,578 | | $1,806 | | $61,994 |
Other Fees: For the six months ended April 30, 2017, affiliates earned underwriting discounts, direct commissions and dealer concessions on sales of the Fund’s Investor A Shares, which totaled $2,494.
For the six months ended April 30, 2017, affiliates received CDSCs as follows:
| | | | |
Investor A | | $ | 1,442 | |
Investor C | | $ | 1,263 | |
Expense Limitations, Waivers, Reimbursements and Recoupments: With respect to the Fund, the Manager voluntarily agreed to waive its investment advisory fees by the amount of investment advisory fees the Fund pays to the Manager indirectly through its investment in affiliated money market funds (the “affiliated money market fund waiver”). This amount is included in fees waived by the Manager in the Consolidated Statement of Operations. The amount of waivers of fees and expenses made pursuant to the expense limitation caps, as applicable, will be reduced by the amount of the affiliated money market fund waiver. For the six months ended April 30, 2017, the Manager waived $29,273.
The Manager voluntarily agreed to waive its investment advisory fee with respect to any portion of the Fund’s assets invested in affiliated equity and fixed-income mutual funds or affiliated exchange-traded funds that have a contractual management fee. Effective February 28, 2017, the waiver became contractual through February 28, 2018. The contractual agreement may be terminated upon 90 days’ notice by a majority of the non-interested trustees of the Trust or by a vote of a majority of the outstanding voting securities of the Fund. For the six months ended April 30, 2017, there were no fees waived by the Manager.
| | | | | | |
| | | | | | | |
| 38 | | BLACKROCK TOTAL EMERGING MARKETS FUND | | APRIL 30, 2017 | | |
| | | | |
| Notes to Consolidated Financial Statements (continued) | | |
With respect to the Fund, the Manager contractually agreed to waive and/or reimburse fees or expenses in order to limit expenses, excluding interest expense, dividend expense, tax expense, acquired fund fees and expenses, and certain other fund expenses, which constitute extraordinary expenses not incurred in the ordinary course of the Fund’s business (“expense limitation”). The expense limitations as a percentage of average daily net assets are as follows:
| | | | |
| Share Class | | Expense Limitation | |
Institutional | | | 0.85% | |
Investor A | | | 1.10% | |
Investor C | | | 1.85% | |
The Manager has agreed not to reduce or discontinue these contractual expense limitations prior to March 1, 2018, unless approved by the Board, including a majority of the trustees who are not “interested persons” of the Fund, as defined in the 1940 Act (“Independent Trustees”) or by a vote of a majority of the outstanding voting securities of the Fund. For the six months ended April 30, 2017, the Manager waived $113,501, which is included in fees waived by the Manager in the Consolidated Statement of Operations.
These amounts waived and/or reimbursed are included in fees waived and/or reimbursed by the Manager, and shown as administration fees waived — class specific and transfer agent fees waived and/or reimbursed — class specific, respectively, in the Consolidated Statement of Operations.
For the six months ended April 30, 2017, class specific expense waivers and/or reimbursements are as follows:
| | | | | | | | | | | | | | | | |
| | | Institutional | | | Investor A | | | Investor C | | | Total | |
Administration Fees Waived — Class Specific | | $ | 19,015 | | | $ | 3,361 | | | $ | 357 | | | $ | 22,733 | |
Transfer Agent Fees Waived and/or Reimbursed — Class Specific | | $ | 41,611 | | | $ | 18,307 | | | $ | 1,637 | | | $ | 61,555 | |
With respect to the contractual expense caps, if during the Fund’s fiscal year the operating expenses of a share class, that at any time during the prior two fiscal years received a waiver and/or reimbursement from the Manager, are less than the expense cap for that share class, the Manager is entitled to be reimbursed by such share class up to the lesser of the following expenses:
| | (a) | The amount of fees waived and/or expenses reimbursed during those prior two fiscal years under the agreement. |
| | (b) | The amount by which the expense cap for that share class exceeds the operating expenses of the share class for the current fiscal year, provided that: |
| | • | | The Fund, of which the share class is a part, has more than $50 million in assets for the fiscal year; and |
| | • | | The Manager or an affiliate continues to serve as the Fund’s investment adviser or administrator. |
In the event the expense cap for a share class is changed subsequent to a fiscal year in which the Manager becomes entitled to reimbursement for fees waived and/or reimbursed, the amount available to reimburse the Manager shall be calculated by reference to the expense cap for that share class in effect at the time the Manager became entitled to receive such reimbursement, rather than the subsequently changed expense cap for that share class.
On April 30, 2017, the fund level and class specific waivers and/or reimbursements subject to possible future recoupment under the expense limitation agreement are as follows:
| | | | | | | | | | | | |
| | | Expiring October 31, | |
| | | 2017 | | | 2018 | | | 2019 | |
Fund Level | | $ | 133,450 | | | $ | 210,256 | | | $ | 113,501 | |
Institutional | | $ | 16,945 | | | $ | 28,971 | | | $ | 60,626 | |
Investor A | | $ | 2,541 | | | $ | 5,571 | | | $ | 21,668 | |
Investor C | | $ | 3,337 | | | $ | 1,577 | | | $ | 1,994 | |
| | | | | | | | | | | | |
| Total | | $ | 156,273 | | | $ | 246,375 | | | $ | 197,789 | |
| | | | | | | | | | | | |
Interfund Lending: In accordance with an exemptive order (the “Order”) from the U.S. Securities and Exchange Commission, the Fund may participate in a joint lending and borrowing facility for temporary purposes (the “Interfund Lending Program”), subject to compliance with the terms and conditions of the Order, and to the extent permitted by the Fund’s investment policies and restrictions. The Fund is currently permitted to borrow and lend under the Interfund Lending Program.
A lending BlackRock fund may lend in aggregate up to 15% of its net assets, but may not lend more than 5% of its net assets to any one borrowing fund through the Interfund Lending Program. A borrowing BlackRock fund may not borrow through the Interfund Lending Program or from any other source more than 33 1/3% of its total assets (or any lower threshold provided for by the fund’s investment restrictions). If a borrowing BlackRock fund’s total outstanding borrowings exceed 10% of its total assets, each of its outstanding interfund loans will be subject to collateralization of at least 102% of the outstanding principal value of the loan. All interfund loans are for temporary or emergency purposes and the interest rate to be charged will be the average of the highest current overnight repurchase agreement rate available to a lending fund and the bank loan rate, as calculated according to a formula established by the Board.
| | | | | | |
| | | | | | | |
| | BLACKROCK TOTAL EMERGING MARKETS FUND | | APRIL 30, 2017 | | 39 |
| | |
| Notes to Consolidated Financial Statements (continued) | | |
During the period ended April 30, 2017, the Fund did not participate in the Interfund Lending Program.
Officers and Trustees: Certain officers and/or trustees of the Trust are officers and/or directors of BlackRock or its affiliates. The Fund reimburses the Manager for a portion of the compensation paid to the Trust’s Chief Compliance Officer, which is included in Officer and Trustees in the Consolidated Statement of Operations.
Other Transactions: The Fund may purchase securities from, or sell securities to, an affiliated fund provided the affiliation is due solely to having a common investment adviser, common officers, or common trustees. For the six months ended April 30, 2017, the purchase and sale transactions and any net realized gains (losses) with an affiliated fund in compliance with Rule 17a-7 under the 1940 Act were as follows:
| | | | |
| Purchases | | Sales | | Net Realized Gain (Loss) |
| $1,797,828 | | — | | — |
7. Purchase and Sales:
For the six months ended April 30, 2017, purchases and sales of investments, excluding short-term securities, were $147,822,531 and $126,414,923, respectively.
8. Income Tax Information:
It is the Fund’s policy to comply with the requirements of the Internal Revenue Code of 1986, as amended, applicable to regulated investment companies, and to distribute substantially all of its taxable income to its shareholders. Therefore, no U.S. federal income tax provision is required.
The Fund files U.S. federal and various state and local tax returns. No income tax returns are currently under examination. The statute of limitations on the Fund’s U.S. federal tax returns generally remains open for each of the three years ended October 31, 2016 and the period ended October 31, 2013. The statutes of limitations on the Fund’s state and local tax returns may remain open for an additional year depending upon the jurisdiction.
Management has analyzed tax laws and regulations and their application to the Fund as of April 30, 2017, inclusive of the open tax return years, and does not believe that there are any uncertain tax positions that require recognition of a tax liability in the Fund’s financial statements.
As of April 30, 2017, gross unrealized appreciation and depreciation based on cost for U.S. federal income tax purposes were as follows:
| | | | |
Tax cost | | $ | 302,154,129 | |
| | | | |
Gross unrealized appreciation | | $ | 1,561,975 | |
Gross unrealized depreciation | | | (1,436,222 | ) |
| | | | |
Net unrealized appreciation | | $ | 125,753 | |
| | | | |
9. Bank Borrowings:
The Trust, on behalf of the Fund, along with certain other funds managed by the Manager and its affiliates (“Participating Funds”), is a party to a 364-day, $2.1 billion credit agreement with a group of lenders. Under this agreement, the Fund may borrow to fund shareholder redemptions. Excluding commitments designated for certain individual funds, the Participating Funds, including the Fund, can borrow up to an aggregate commitment amount of $1.6 billion at any time outstanding, subject to asset coverage and other limitations as specified in the agreement. The credit agreement has the following terms: a fee of 0.12% per annum on unused commitment amounts and interest at a rate equal to the higher of (a) one-month LIBOR (but, in any event, not less than 0.00%) on the date the loan is made plus 0.80% per annum or (b) the Fed Funds rate (but, in any event, not less than 0.00%) in effect from time to time plus 0.80% per annum on amounts borrowed. The agreement expires in April 2018 unless extended or renewed. Participating Funds paid administration, legal and arrangement fees, which, if applicable, are included in miscellaneous expenses in the Consolidated Statement of Operations. These fees were allocated among such funds based upon portions of the aggregate commitment available to them and relative net assets of Participating Funds. During the six months ended April 30, 2017, the Fund did not borrow under the credit agreement.
10. Principal Risks:
In the normal course of business, the Fund invests in securities and enters into transactions where risks exist due to fluctuations in the market (market risk) or failure of the issuer to meet all its obligations, including the ability to pay principal and interest when due (issuer credit risk). The value of securities held by the Fund may decline in response to certain events, including those directly involving the issuers of securities owned by the Fund. Investments in the securities of issuers domiciled in countries with emerging capital markets involve certain additional risks that do not generally apply to investments in securities of issuers in more developed capital markets, such as (i) low or nonexistent trading volume, resulting in a lack of liquidity and increased volatility in prices for such securities; (ii) uncertain national policies and social, political and economic instability, increasing the potential for expropriation of assets, confiscatory taxation, high rates of inflation or unfavorable diplomatic developments; and (iii) possible fluctuations in exchange rates, differing legal systems and the existence or possible imposition of exchange controls, custodial restrictions or other foreign or U.S. governmental laws or restrictions
| | | | | | |
| | | | | | | |
| 40 | | BLACKROCK TOTAL EMERGING MARKETS FUND | | APRIL 30, 2017 | | |
| | | | |
| Notes to Consolidated Financial Statements (continued) | | |
applicable to such investments. Changes arising from the general economy, the overall market and local, regional or global political and/or social instability, as well as currency, interest rate and price fluctuations, may also affect the securities’ value.
The Fund may be exposed to prepayment risk, which is the risk that borrowers may exercise their option to prepay principal earlier than scheduled during periods of declining interest rates, which would force the Fund to reinvest in lower yielding securities. The Fund may also be exposed to reinvestment risk, which is the risk that income from the Fund’s portfolio will decline if the Fund invests the proceeds from matured, traded or called fixed-income securities at market interest rates that are below the Fund portfolio’s current earnings rate.
Counterparty Credit Risk: Similar to issuer credit risk, the Fund may be exposed to counterparty credit risk, or the risk that an entity may fail to or be unable to perform on its commitments related to unsettled or open transactions. The Fund manages counterparty credit risk by entering into transactions only with counterparties that the Manager believes have the financial resources to honor their obligations and by monitoring the financial stability of those counterparties. Financial assets, which potentially expose the Fund to market, issuer and counterparty credit risks, consist principally of financial instruments and receivables due from counterparties. The extent of the Fund’s exposure to market, issuer and counterparty credit risks with respect to these financial assets is approximately their value recorded in the Consolidated Statement of Assets and Liabilities, less any collateral held by the Fund.
A derivative contract may suffer a mark-to-market loss if the value of the contract decreases due to an unfavorable change in the market rates or values of the underlying instrument. Losses can also occur if the counterparty does not perform under the contract.
The Fund’s risk of loss from counterparty credit risk on OTC derivatives is generally limited to the aggregate unrealized gain less the value of any collateral held by the Fund.
With exchange-traded futures and centrally cleared swaps, there is less counterparty credit risk to the Fund since the exchange or clearinghouse, as counterparty to such instruments, guarantees against a possible default. The clearinghouse stands between the buyer and the seller of the contract; therefore, credit risk is limited to failure of the clearinghouse. While offset rights may exist under applicable law, the Fund does not have a contractual right of offset against a clearing broker or clearinghouse in the event of a default (including the bankruptcy or insolvency). Additionally, credit risk exists in exchange-traded futures and centrally cleared swaps with respect to initial and variation margin that is held in a clearing broker’s customer accounts. While clearing brokers are required to segregate customer margin from their own assets, in the event that a clearing broker becomes insolvent or goes into bankruptcy and at that time there is a shortfall in the aggregate amount of margin held by the clearing broker for all its clients, typically the shortfall would be allocated on a pro rata basis across all the clearing broker’s customers, potentially resulting in losses to the Fund.
Concentration Risk: The Fund invests a significant portion of its assets in fixed-income securities and/or uses derivatives tied to the fixed-income markets. Changes in market interest rates or economic conditions may affect the value and/or liquidity of such investments. Interest rate risk is the risk that prices of bonds and other fixed-income securities will increase as interest rates fall and decrease as interest rates rise. The Fund may be subject to a greater risk of rising interest rates due to the current period of historically low rates.
The Fund invests a significant portion of its assets in securities of issuers located in Asia or with significant exposure to Asian issuers or countries. The Asian financial markets have recently experienced volatility and adverse trends due to concerns in several Asian countries regarding monetary policy, government intervention in the markets, rising government debt levels or economic downturns. These events may spread to other countries in Asia and may affect the value and liquidity of certain of the Fund’s investments.
11. Capital Share Transactions:
Transactions in capital shares for each class were as follows:
| | | | | | | | | | | | | | | | | | | | |
| | | Six Months Ended
April 30, 2017 | | | | | | Year Ended
October 31, 2016 | |
| | | Shares | | | Amount | | | | | | Shares | | | Amount | |
| Institutional | | | | | | | | | | | | | | | | | | | | |
Shares sold | | | 21,718,091 | | | $ | 210,528,189 | | | | | | | | 17,601,762 | | | $ | 170,230,928 | |
Shares issued in reinvestment of distributions | | | 341,953 | | | | 3,104,931 | | | | | | | | 11,611 | | | | 94,865 | |
Shares redeemed | | | (16,711,330 | ) | | | (159,655,186 | ) | | | | | | | (2,702,991 | ) | | | (25,346,455 | ) |
| | | | | | | | | | | | |
Net increase | | | 5,348,714 | | | $ | 53,977,934 | | | | | | | | 14,910,382 | | | $ | 144,979,338 | |
| | | | | | | | | | | | |
| | | | | | | | | | | | | | | | | | | | |
| Investor A | | | | | | | | | | | | | | | | | | | | |
Shares sold | | | 3,073,261 | | | $ | 29,239,845 | | | | | | | | 3,955,756 | | | $ | 38,383,771 | |
Shares issued in reinvestment of distributions | | | 94,382 | | | | 854,159 | | | | | | | | 2,369 | | | | 19,304 | |
Shares redeemed | | | (3,467,908 | ) | | | (32,282,642 | ) | | | | | | | (314,279 | ) | | | (2,904,739 | ) |
| | | | | | | | | | | | |
Net increase (decrease) | | | (300,265 | ) | | $ | (2,188,638 | ) | | | | | | | 3,643,846 | | | $ | 35,498,336 | |
| | | | | | | | | | | | |
| | | | | | | | | | | | | | | | | | | | |
| | | | | | |
| | | | | | | |
| | BLACKROCK TOTAL EMERGING MARKETS FUND | | APRIL 30, 2017 | | 41 |
| | |
| Notes to Financial Statements (concluded) | | |
| | | | | | | | | | | | | | | | | | | | |
| | | Six Months Ended
April 30, 2017 | | | | | | Year Ended
October 31, 2016 | |
| | | Shares | | | Amount | | | | | | Shares | | | Amount | |
| Investor C | | | | | | | | | | | | | | | | | | | | |
Shares sold | | | 333,465 | | | $ | 3,167,551 | | | | | | | | 216,450 | | | $ | 2,053,600 | |
Shares issued in reinvestment of distributions | | | 5,171 | | | | 46,646 | | | | | | | | — | | | | — | |
Shares redeemed | | | (49,284 | ) | | | (465,997 | ) | | | | | | | (67,612 | ) | | | (582,200 | ) |
| | | | | | | | | | | | |
Net increase | | | 289,352 | | | $ | 2,748,200 | | | | | | | | 148,838 | | | $ | 1,471,400 | |
| | | | | | | | | | | | |
Total Net Increase | | | 5,337,801 | | | $ | 54,537,496 | | | | | | | | 18,703,066 | | | $ | 181,949,074 | |
| | | | | | | | | | | | |
12. Subsequent Events:
Management has evaluated the impact of all subsequent events on the Fund through the date the financial statements were issued and has determined that there were no subsequent events requiring adjustment or additional disclosure in the financial statements.
| | | | | | |
| | | | | | | |
| 42 | | BLACKROCK TOTAL EMERGING MARKETS FUND | | APRIL 30, 2017 | | |
Rodney D. Johnson, Chair of the Board and Trustee
Susan J. Carter, Trustee
Collette Chilton, Trustee
Neil A. Cotty, Trustee
Cynthia A. Montgomery, Trustee
Joseph P. Platt, Trustee
Robert C. Robb, Jr., Trustee
Mark Stalnecker, Trustee
Kenneth L. Urish, Trustee
Claire A. Walton, Trustee
Frederick W. Winter, Trustee
Barbara G. Novick, Trustee
John M. Perlowski, Trustee, President and Chief Executive Officer
Thomas Callahan, Vice President
Jennifer McGovern, Vice President
Neal J. Andrews, Chief Financial Officer
Jay M. Fife, Treasurer
Charles Park, Chief Compliance Officer
Fernanda Piedra, Anti-Money Laundering Compliance Officer
Benjamin Archibald, Secretary
Effective December 31, 2016, David O. Beim and Dr. Matina S. Horner retired as Trustees of the Trust.
| | | | | | |
| | | | |
Investment Adviser and Administrator BlackRock Advisors, LLC Wilmington, DE 19809 | | Sub-Advisers BlackRock International Limited Edinburgh, EH3 8BL United Kingdom BlackRock Asset Management North Asia Limited Hong Kong, China BlackRock (Singapore) Limited 079912 Singapore | | Transfer Agent BNY Mellon Investment Servicing (US) Inc. Wilmington, DE 19809 | | Distributor BlackRock Investments, LLC New York, NY 10022 |
Accounting Agent and Custodian State Street Bank and Trust Company Boston, MA 02111 | | | Independent Registered Public Accounting Firm Deloitte & Touche LLP Boston, MA 02116 | | Legal Counsel Sidley Austin LLP New York, NY 10019 |
| | | |
| | | | | | Address of the Trust 100 Bellevue Parkway Wilmington, DE 19809 |
| | | | | | |
| | | | | | | |
| | BLACKROCK TOTAL EMERGING MARKETS FUND | | APRIL 30, 2017 | | 43 |
Householding
The Fund will mail only one copy of shareholder documents, including prospectuses, annual and semi-annual reports and proxy statements, to shareholders with multiple accounts at the same address. This practice is commonly called “householding” and is intended to reduce expenses and eliminate duplicate mailings of shareholder documents. Mailings of your shareholder documents may be householded indefinitely unless you instruct us otherwise. If you do not want the mailing of these documents to be combined with those for other members of your household, please call the Fund at (800) 441-7762.
Availability of Quarterly Schedule of Investments
The Fund files its complete schedule of portfolio holdings with the SEC for the first and third quarters of each fiscal year on Form N-Q. The Fund’s Forms N-Q are available on the SEC’s website at http://www.sec.gov and may also be reviewed and copied at the SEC’s Public Reference Room in Washington, D.C. Information on the operation of the Public Reference Room or how to access documents on the SEC’s website without charge may be obtained by calling (800) SEC-0330. The Fund’s Forms N-Q may also be obtained upon request and without charge by calling (800) 441-7762.
Availability of Proxy Voting Policies and Procedures
A description of the policies and procedures that the Fund uses to determine how to vote proxies relating to portfolio securities is available upon request and without charge (1) by calling (800) 441-7762; (2) at http://www.blackrock.com; and (3) on the SEC’s website at http://www.sec.gov.
Availability of Proxy Voting Record
Information about how the Fund voted proxies relating to securities held in the Fund’s portfolios during the most recent 12-month period ended June 30 is available upon request and without charge (1) at http://www.blackrock.com; or by calling (800) 441-7762 and (2) on the SEC’s website at http://www.sec.gov.
BlackRock’s Mutual Fund Family
BlackRock offers a diverse lineup of open-end mutual funds crossing all investment styles and managed by experts in equity, fixed-income and tax-exempt investing. Visit http://www.blackrock.com for more information.
Account Information
Call us at (800) 441-7762 from 8:00 AM to 6:00 PM ET on any business day to get information about your account balances, recent transactions and share prices. You can also reach us on the Web at http://www.blackrock.com/funds.
Automatic Investment Plans
Investor Class shareholders who want to invest regularly can arrange to have $50 or more automatically deducted from their checking or savings account and invested in any of the BlackRock funds.
Systematic Withdrawal Plans
Investor Class shareholders can establish a systematic withdrawal plan and receive periodic payments of $50 or more from their BlackRock funds, as long as their account balance is at least $10,000.
Retirement Plans
Shareholders may make investments in conjunction with Traditional, Rollover, Roth, Coverdell, Simple IRAs, SEP IRAs and 403(b) Plans.
| | | | | | |
| | | | | | | |
| 44 | | BLACKROCK TOTAL EMERGING MARKETS FUND | | APRIL 30, 2017 | | |
| | |
| Additional Information (concluded) | | |
| | |
| BlackRock Privacy Principles | | |
BlackRock is committed to maintaining the privacy of its current and former fund investors and individual clients (collectively, “Clients”) and to safeguarding their non-public personal information. The following information is provided to help you understand what personal information BlackRock collects, how we protect that information and why in certain cases we share such information with select parties.
If you are located in a jurisdiction where specific laws, rules or regulations require BlackRock to provide you with additional or different privacy-related rights beyond what is set forth below, then BlackRock will comply with those specific laws, rules or regulations.
BlackRock obtains or verifies personal non-public information from and about you from different sources, including the following: (i) information we receive from you or, if applicable, your financial intermediary, on applications, forms or other documents; (ii) information about your transactions with us, our affiliates, or others; (iii) information we receive from a consumer reporting agency; and (iv) from visits to our websites.
BlackRock does not sell or disclose to non-affiliated third parties any non-public personal information about its Clients, except as permitted by law or as is necessary to respond to regulatory requests or to service Client accounts. These non-affiliated third parties are required to protect the confidentiality and security of this information and to use it only for its intended purpose.
We may share information with our affiliates to service your account or to provide you with information about other BlackRock products or services that may be of interest to you. In addition, BlackRock restricts access to non-public personal information about its Clients to those BlackRock employees with a legitimate business need for the information. BlackRock maintains physical, electronic and procedural safeguards that are designed to protect the non-public personal information of its Clients, including procedures relating to the proper storage and disposal of such information.
| | | | | | |
| | | | | | | |
| | BLACKROCK TOTAL EMERGING MARKETS FUND | | APRIL 30, 2017 | | 45 |
The report is intended for current holders. It is not authorized for use as an offer of sale or a solicitation of an offer to buy shares of the Fund unless preceded or accompanied by the Fund’s current prospectus. Past performance results shown in this report should not be considered a representation of future performance. Investment returns and principal value of shares will fluctuate so that shares, when redeemed, may be worth more or less than their original cost. Statements and other information herein are as dated and are subject to change.

| | |
| EMAP-4/17-SAR | |  |
| Item 2 – | Code of Ethics – Not Applicable to this semi-annual report |
| Item 3 – | Audit Committee Financial Expert – Not Applicable to this semi-annual report |
| Item 4 – | Principal Accountant Fees and Services – Not Applicable to this semi-annual report |
| Item 5 – | Audit Committee of Listed Registrants – Not Applicable |
(a) The registrant’s Schedule of Investments is included as part of the Report to Stockholders filed under Item 1 of this Form.
(b) Not Applicable due to no such divestments during the semi-annual period covered since the previous Form N-CSR filing.
| Item 7 – | Disclosure of Proxy Voting Policies and Procedures for Closed-End Management Investment Companies – Not Applicable |
| Item 8 – | Portfolio Managers of Closed-End Management Investment Companies – Not Applicable |
| Item 9 – | Purchases of Equity Securities by Closed-End Management Investment Company and Affiliated Purchasers – Not Applicable |
| Item 10 – | Submission of Matters to a Vote of Security Holders –There have been no material changes to these procedures. |
| Item 11 – | Controls and Procedures |
(a) – The registrant’s principal executive and principal financial officers, or persons performing similar functions, have concluded that the registrant’s disclosure controls and procedures (as defined in Rule 30a-3(c) under the Investment Company Act of 1940, as amended (the “1940 Act”)) are effective as of a date within 90 days of the filing of this report based on the evaluation of these controls and procedures required by Rule 30a-3(b) under the 1940 Act and Rule 15d-15(b) under the Securities Exchange Act of 1934, as amended.
(b) – There were no changes in the registrant’s internal control over financial reporting (as defined in Rule 30a-3(d) under the 1940 Act) that occurred during the second fiscal quarter of the period covered by this report that have materially affected, or are reasonably likely to materially affect, the registrant’s internal control over financial reporting.
| Item 12 – | Exhibits attached hereto |
(a)(1) – Code of Ethics – Not Applicable to this semi-annual report
(a)(2) – Certifications – Attached hereto
(a)(3) – Not Applicable
(b) – Certifications – Attached hereto
2
Pursuant to the requirements of the Securities Exchange Act of 1934 and the Investment Company Act of 1940, the registrant has duly caused this report to be signed on its behalf by the undersigned, thereunto duly authorized.
BlackRock Funds
| | | | | | |
| By: | | /s/ John M. Perlowski | | | | |
| | John M. Perlowski | | | | |
| | Chief Executive Officer (principal executive officer) of | | |
| | BlackRock Funds | | |
Date: July 5, 2017
Pursuant to the requirements of the Securities Exchange Act of 1934 and the Investment Company Act of 1940, this report has been signed below by the following persons on behalf of the registrant and in the capacities and on the dates indicated.
| | | | | | |
| By: | | /s/ John M. Perlowski | | | | |
| | John M. Perlowski | | | | |
| | Chief Executive Officer (principal executive officer) of | | |
| | BlackRock Funds | | |
Date: July 5, 2017
| | | | | | |
| By: | | /s/ Neal J. Andrews | | | | |
| | Neal J. Andrews | | | | |
| | Chief Financial Officer (principal financial officer) of BlackRock Funds | | |
Date: July 5, 2017
3