UNITED STATES
SECURITIES AND EXCHANGE COMMISSION
Washington, D.C. 20549
FORM N-CSR
CERTIFIED SHAREHOLDER REPORT OF REGISTERED MANAGEMENT INVESTMENT COMPANIES
Investment Company Act file number: 811-05742
Name of Fund: BlackRock Funds
BlackRock Multi-Manager Alternative Strategies Fund
Fund Address: 100 Bellevue Parkway, Wilmington, DE 19809
Name and address of agent for service: John M. Perlowski, Chief Executive Officer, BlackRock Funds, 55 East 52nd Street, New York, NY 10055
Registrant’s telephone number, including area code: (800) 441-7762
Date of fiscal year end: 08/31/2017
Date of reporting period: 02/28/2017
Item 1 – Report to Stockholders
FEBRUARY 28, 2017
| | | | |
SEMI-ANNUAL REPORT (UNAUDITED) | | | | BLACKROCK® |
| | | | |
| | BlackRock Multi-Manager Alternative Strategies Fund | | of BlackRock FundsSM |
| | |
| Not FDIC Insured ◾ May Lose Value ◾ No Bank Guarantee | | |
Dear Shareholder,
Risk assets, such as stocks and high yield bonds, enjoyed strong performance in the 12 months ended February 28, 2017. It was a different story for higher-quality assets such as U.S. Treasuries, which generated muted returns after struggling in the latter part of 2016 as reflationary expectations in the United States helped drive a pick-up in global growth and investors braced for higher interest rates.
Markets showed great resilience during the period. Big surprises such as the United Kingdom’s vote to leave the European Union and the outcome of the U.S. presidential election brought spikes in equity market volatility, but they were ultimately short-lived. Instead, investors used the sell-offs to seize upon buying opportunities, allowing markets to quickly rebound. We believe this reinforces the case for taking the long view rather than reacting to short-term market noise.
The global reflationary theme – rising nominal growth, wages and inflation – was the dominant driver of asset returns during the period, outweighing significant political upheavals and uncertainty. This trend accelerated after the U.S. election and continued into the beginning of 2017, stoked by expectations for an extra boost to U.S. growth via fiscal policy.
Although economic momentum is gaining traction, the capacity for rapid global growth is restrained by structural factors including an aging population, low productivity growth and excess savings. A tempered economic growth trend and high valuations across most assets have set the stage for muted investment returns going forward.
Equity markets still have room to move, although the disparity between winners and losers is widening, making selectivity increasingly important. Fixed income investors are also facing challenges as bond markets recalibrate to accommodate rising rates and higher inflation expectations. And in a world where political risk and policy uncertainty abound, there is no lack of potential catalysts for higher volatility.
In this environment, investors need to think globally, extend their scope across a broad array of asset classes and be nimble as market conditions change. We encourage you to talk with your financial advisor and visit blackrock.com for further insight about investing in today’s markets.
Sincerely,

Rob Kapito
President, BlackRock Advisors, LLC

Rob Kapito
President, BlackRock Advisors, LLC
| | | | | | | | |
| Total Returns as of February 28, 2017 | |
| | | 6-month | | | 12-month | |
U.S. large cap equities
(S&P 500® Index) | | | 10.01 | % | | | 24.98 | % |
U.S. small cap equities
(Russell 2000® Index) | | | 12.61 | | | | 36.11 | |
International equities
(MSCI Europe, Australasia, Far East Index) | | | 4.90 | | | | 15.75 | |
Emerging market equities (MSCI Emerging Markets Index) | | | 5.51 | | | | 29.46 | |
3-month Treasury bill
(BofA Merrill Lynch 3-Month U.S. Treasury Bill Index) | | | 0.22 | | | | 0.39 | |
U.S. Treasury securities
(BofA Merrill Lynch 10- Year U.S. Treasury Index) | | | (6.17 | ) | | | (4.09 | ) |
U.S. investment grade bonds (Bloomberg Barclays U.S. Aggregate Bond Index) | | | (2.19 | ) | | | 1.42 | |
Tax-exempt municipal bonds (S&P Municipal Bond Index) | | | (2.51 | ) | | | 0.76 | |
U.S. high yield bonds
(Bloomberg Barclays U.S. Corporate High Yield 2% Issuer Capped Index) | | | 5.43 | | | | 21.83 | |
|
| Past performance is no guarantee of future results. Index performance is shown for illustrative purposes only. You cannot invest directly in an index. | |
| | | | | | |
| 2 | | THIS PAGE NOT PART OF YOUR FUND REPORT | | | | |
| | |

| | Shareholders can sign up for e-mail notifications of quarterly statements, annual and semi-annual shareholder reports and prospectuses by enrolling in the electronic delivery program. Electronic copies of shareholder reports and prospectuses are also available on BlackRock’s website. TO ENROLL IN ELECTRONIC DELIVERY: Shareholders Who Hold Accounts with Investment Advisors, Banks or Brokerages: Please contact your financial advisor. Please note that not all investment advisors, banks or brokerages may offer this service. Shareholders Who Hold Accounts Directly with BlackRock: 1. Access the BlackRock website at blackrock.com 2. Select “Access Your Account” 3. Next, select “eDelivery” in the “Related Resources” box and follow the sign-up instructions |
| | | | | | |
| | | BLACKROCK MULTI-MANAGER ALTERNATIVE STRATEGIES FUND | | FEBRUARY 28, 2017 | | 3 |
| | | | |
| Fund Summary as of February 28, 2017 | | | | |
BlackRock Multi-Manager Alternative Strategies Fund’s (the “Fund”) investment objective is to seek total return.
|
| Portfolio Management Commentary |
How did the Fund perform?
| • | | For the six-month period ended February 28, 2017, the Fund outperformed its benchmark, the BofA Merrill Lynch 3-Month U.S. Treasury Bill Index. |
Underlying Fund Strategies
The Fund seeks to achieve its investment objective by allocating to multiple affiliated and unaffiliated investment managers (“Sub-Advisers”) that employ a variety of alternative investment strategies. Each of the Sub-Advisers generally provides day-to-day management for a portion of the Fund’s assets.
Within the Fund’s positioning, underlying investment strategies are diversified across various asset classes, including equity, fixed income, commodities, foreign exchange, and assets associated with market volatility. However, notwithstanding their categorization for financial reporting purposes, many of the positions held provided exposure to multiple types of underlying strategies. These strategies include:
| | • | | Relative Value Strategies seek to profit from mispricing of financial instruments relative to each other or historical norms. These strategies utilize quantitative and qualitative analysis to identify securities or spreads between securities that deviate from their theoretical fair value and/or historical norms. |
| | • | | Event Driven Strategies concentrate on companies that are subject to corporate events such as mergers, acquisitions, restructurings, spin-offs, shareholder activism, or other special situations that alter a company’s financial structure or operating strategy. The intended goal of event driven strategies is to profit when the price of a security changes to reflect more accurately the likelihood and potential impact of the occurrence, or non-occurrence, of the extraordinary event. This can be done by taking a long position in a security or other financial instrument that is believed to be underpriced or a short position in a security or other financial instrument that is believed to be overpriced. |
| | • | | Fundamental Long/Short Strategies involve buying or selling securities believed to be overpriced or underpriced relative to their potential value. Investment strategies within the fundamental long/short discipline include long and short equity or credit-based strategies that emphasize a fundamental valuation framework and equity active value strategies where an active role is taken to enhance corporate value. |
| | • | | Directional Trading Strategies seek to profit from changes in macro-level exposures, such as interest rates, currencies, equities and |
| | | commodities. This strategy may involve analyzing fundamental macroeconomic inputs, as well as technical information such as price, to identify investment opportunities across a broad array of asset classes and geographies. These strategies may also include model-driven trading strategies that use technical or fundamental inputs in order to make a trading decision across a portfolio of major global asset classes including fixed income, foreign exchange, equities and commodities. Trading decisions are made systematically using a rules based investment approach. |
What factors influenced performance?
| • | | With the exception of one Sub-Adviser, all strategies and Sub-Advisers generated positive contributions over the six-month period. The strongest performing strategy was fundamental long/short credit, followed by the tactical sleeve (where the portfolio management team makes co-investments alongside the Fund’s hedge fund managers), relative value and long/short equity. |
| • | | The lone negative contribution over the period came from one Sub-Adviser in the directional trading/global macro strategy, which experienced a small loss in absolute terms that did not detract materially from the Fund’s overall performance. |
Describe recent portfolio activity.
| • | | The Fund did not implement any changes to its Sub-Advisers during the six-month period. In addition, the Fund’s strategy weightings remained essentially unchanged with the exception of a slight reduction in long/ short equity exposure. |
| • | | The Fund, through its underlying Sub-Advisers, held derivatives during the period, primarily involving the Fund’s global macro, long/short credit, and long/short equity strategies. The Fund’s use of derivatives had a modest negative impact on performance. The Fund maintained a position in cash and cash equivalents as collateral against the Fund’s exposure to derivatives including, but not limited to, total return swaps, interest rate swaps, credit default swaps and futures. The Fund’s cash balance did not have a material impact on performance. |
Describe portfolio positioning at period end.
| • | | At the end of the period, the Fund had the following approximate exposures to fund strategies: 33% long/short credit; 23% long/short equity; 6% event driven; 15% directional trading; 15% relative value; and 8% tactical. |
The views expressed reflect the opinions of BlackRock as of the date of this report and are subject to change based on changes in market, economic or other conditions. These views are not intended to be a forecast of future events and are no guarantee of future results.
| | | | | | |
| 4 | | BLACKROCK MULTI-MANAGER ALTERNATIVE STRATEGIES FUND | | FEBRUARY 28, 2017 | | |
|
| Total Return Based on a $10,000 Investment |
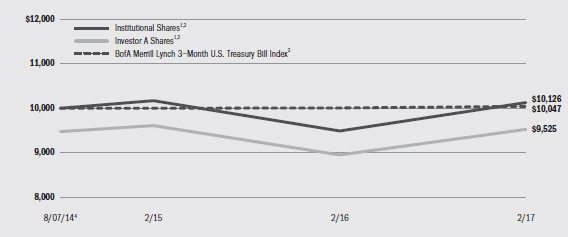
| | 1 | | Assuming maximum sales charges, if any, transaction costs and other operating expenses, including investment advisory and administration fees. Institutional Shares do not have a sales charge. |
| | 2 | | The Fund allocates assets to multiple affiliated and unaffiliated investment managers that employ a variety of alternative investment strategies. |
| | 3 | | An unmanaged index that tracks 3-month U.S. Treasury securities. |
| | 4 | | Commencement of operations. |
|
| Performance Summary for the Period Ended February 28, 2017 |
| | | | | | | | | | | | | | | | | | | | | | | | | |
| | | | | Average Annual Total Returns5 |
| | | | | 1 Year | | Since Inception6 |
| | | 6-Month
Total Returns | | w/o sales
charge | | w/sales
charge | | w/o sales
charge | | w/sales
charge |
Institutional | | | | 3.24 | % | | | | 6.67 | % | | | | N/A | | | | | 0.49 | % | | | | N/A | |
Investor A | | | | 3.12 | | | | | 6.44 | | | | | 0.85 | % | | | | 0.21 | | | | | (1.88 | )% |
Investor C | | | | 2.78 | | | | | 5.55 | | | | | 4.55 | | | | | (0.54 | ) | | | | (0.54 | ) |
BofA Merrill Lynch 3-Month U.S. Treasury Bill Index | | | | 0.22 | | | | | 0.39 | | | | | N/A | | | | | 0.18 | | | | | N/A | |
| | 5 | | Assuming maximum sales charges, if any. Average annual total returns with and without sales charges reflect reductions for distribution and service fees. See “About Fund Performance” on page 7 for a detailed description of share classes, including any related sales charges and fees. |
| | 6 | | The Fund commenced operations on August 7, 2014. |
| | | | N/A—Not applicable as share class and index do not have a sales charge. |
| | | | Past performance is not indicative of future results. |
| | | | Performance results may include adjustments made for financial reporting purposes in accordance with U.S. generally accepted accounting principles. |
| | | | | | | | | | | | | | | | | | |
| Expense Example |
| | | Actual | | Hypothetical9 |
| | | | | | | Expenses Paid During the Period | | | | Including Interest
Expense, Dividend Expense and Broker Fees and Expenses on Short Sales | | Excluding Interest
Expense, Dividend Expense and Broker Fees and Expenses on Short Sales |
| | | Beginning
Account Value September 1, 2016 | | Ending
Account Value February 28, 2017 | | Including Interest
Expense, Dividend
Expense and Broker Fees and Expenses on Short Sales7 | | Excluding Interest
Expense, Dividend
Expense and Broker Fees and Expenses on Short Sales8 | | Beginning
Account Value September 1, 2016 | | Ending
Account Value February 28, 2017 | | Expenses Paid During the Period7 | | Ending
Account Value February 28, 2017 | | Expenses Paid During the Period8 |
Institutional | | $1,000.00 | | $1,032.40 | | $11.91 | | $ 9.36 | | $1,000.00 | | $1,013.01 | | $11.80 | | $1,015.51 | | $ 9.29 |
Investor A | | $1,000.00 | | $1,031.20 | | $13.16 | | $10.60 | | $1,000.00 | | $1,011.77 | | $13.03 | | $1,014.29 | | $10.51 |
Investor C | | $1,000.00 | | $1,027.80 | | $16.90 | | $14.36 | | $1,000.00 | | $1,008.06 | | $16.73 | | $1,010.56 | | $14.24 |
| | 7 | | For each class of the Fund, expenses are equal to the annualized expense ratio for the class (2.37% for Institutional, 2.62% for Investor A, and 3.37% for Investor C), multiplied by the average account value over the period, multiplied by 181/365 (to reflect the one-half year shown). The fees and expenses of the underlying funds in which the Fund invests are not included in the Fund’s annualized expense ratio. |
| | 8 | | For each class of the Fund, expenses are equal to the annualized expense ratio for the class (1.86% for Institutional, 2.11% for Investor A, and 2.86% for Investor C), multiplied by the average account value over the period, multiplied by 181/365 (to reflect the one-half year shown). The fees and expenses of the underlying funds in which the Fund invests are not included in the Fund’s annualized expense ratio. |
| | 9 | | Hypothetical 5% annual return before expenses is calculated by prorating the number of days in the most recent fiscal half year divided by 365. See “Disclosure of Expenses” on page 7 for further information on how expenses were calculated. |
| | | | | | |
| | | BLACKROCK MULTI-MANAGER ALTERNATIVE STRATEGIES FUND | | FEBRUARY 28, 2017 | | 5 |
|
| Fund Information as of February 28, 2017 |
| | |
| Ten Largest Long-Term Investments | | Percent of
Total Investments1 |
| | | | |
BlackRock Event Driven Equity Fund | | | 10 | % |
Ligado Networks LLC (FKA New LightSquared LLC), Junior Loan | | | 4 | |
Bear Stearns ALT-A Trust, Series 2005-10, Class 11A1 | | | 4 | |
Boussard & Gavaudan Holding Ltd. | | | 3 | |
New LightSquared LLC, Loan | | | 3 | |
Octagon Investment Partners XVII Ltd., Series 2013-1A, Class E | | | 3 | |
Bear Stearns Asset-Backed Securities I Trust, Series 2006-HE1, Class 2M3 | | | 2 | |
FREMF Mortgage Trust, Series 2014-KS02, Class B | | | 2 | |
GreenPoint Mortgage Funding Trust, Series 2007-AR1, Class 3A2 | | | 2 | |
Bear Stearns ALT-A Trust, Series 2006-4, Class 23A4 | | | 2 | |
| | |
| Portfolio Composition | | Percent of
Total Investments1 |
| | | | |
Common Stocks | | | 28 | % |
Investment Companies | | | 15 | |
Corporate Bonds | | | 13 | |
Asset-Backed Securities | | | 12 | |
Non-Agency Mortgage-Backed Securities | | | 11 | |
Floating Rate Loan Interests | | | 10 | |
U.S. Government Sponsored Agency Securities | | | 5 | |
Preferred Securities | | | 3 | |
Warrants | | | 2 | |
Foreign Government Obligations | | | 1 | |
Other2 | | | — | |
| 1 | | Total investments exclude short-term securities, options purchased, options written and investments sold short. |
| 2 | | Includes taxable municipal bonds, which is less than 1%. |
| | |
| Ten Largest Investments Sold Short | | Percent of
Investments Sold Short |
| | | | |
SunTrust Banks, Inc. | | | 5 | % |
Zions Bancorporation | | | 4 | |
International Business Machines Corp. | | | 3 | |
Corning, Inc. | | | 3 | |
Kraft Heinz Co. | | | 3 | |
Electronic Arts, Inc. | | | 3 | |
Centennial Resource Development, Inc., Class A | | | 3 | |
Infosys Ltd. - ADR | | | 2 | |
Activision Blizzard, Inc. | | | 2 | |
Kindred Healthcare, Inc. | | | 2 | |
| | |
| Sector Allocation — Investments Sold Short | | Percent of
Investments Sold Short |
| | | | |
Information Technology | | | 22 | % |
Energy | | | 17 | |
Financials | | | 14 | |
Consumer Staples | | | 10 | |
Consumer Discretionary | | | 9 | |
Health Care | | | 7 | |
Industrials | | | 5 | |
Investment Companies | | | 4 | |
Utilities | | | 3 | |
U.S. Treasury Obligations | | | 3 | |
Materials | | | 3 | |
Real Estate | | | 2 | |
Telecommunication Services | | | 1 | |
For Fund compliance purposes, the Fund’s sector classifications refer to one or more of the sector sub-classifications used by one or more widely recognized market indexes or ratings group indexes, and/or as defined by the investment adviser. These definitions may not apply for purposes of this report, which may combine such sector sub-classifications for reporting ease.
| | | | | | |
| 6 | | BLACKROCK MULTI-MANAGER ALTERNATIVE STRATEGIES FUND | | FEBRUARY 28, 2017 | | |
| • | | Institutional Shares are not subject to any sales charge. These shares bear no ongoing distribution or service fees and are available only to certain eligible investors. |
| • | | Investor A Shares are subject to a maximum initial sales charge (front-end load) of 5.25% and a service fee of 0.25% per year (but no distribution fee). Certain redemptions of these shares may be subject to a contingent deferred sales charge (“CDSC”) where no initial sales charge was paid at the time of purchase. These shares are generally available through financial intermediaries. |
| • | | Investor C Shares are subject to a 1.00% CDSC if redeemed within one year of purchase. In addition, these shares are subject to a distribution fee of 0.75% per year and a service fee of 0.25% per year. These shares are generally available through financial intermediaries. |
Performance information reflects past performance and does not guarantee future results. Current performance may be lower or higher than the performance data quoted. Refer to www.blackrock.com/funds to obtain performance data current to the most recent month end. Performance
results do not reflect the deduction of taxes that a shareholder would pay on fund distributions or the redemption of fund shares. Figures shown in the performance table on the previous pages assume reinvestment of all distributions, if any, at net asset value (“NAV”) on the ex-dividend date. Investment return and principal value of shares will fluctuate so that shares, when redeemed, may be worth more or less than their original cost. Distributions paid to each class of shares will vary because of the different levels of service, distribution and transfer agency fees applicable to each class, which are deducted from the income available to be paid to shareholders.
BlackRock Advisors, LLC (the “Manager”), the Fund’s investment adviser, has contractually agreed to waive and/or reimburse a portion of the Fund’s expenses. Without such waiver and/or reimbursement, the Fund’s performance would have been lower. The Manager is under no obligation to continue waiving and/or reimbursing its fees after the applicable termination date of such agreement. See Note 6 of the Notes to Consolidated Financial Statements for additional information on waivers and/or reimbursements.
Shareholders of the Fund may incur the following charges: (a) transactional expenses, such as sales charges; and (b) operating expenses, including investment advisory fees, administration fees, service and distribution fees, including 12b-1 fees, acquired fund fees and expenses and other fund expenses. The expense example shown on the previous pages (which is based on a hypothetical investment of $1,000 invested on September 1, 2016 and held through February 28, 2017) is intended to assist shareholders both in calculating expenses based on an investment in the Fund and in comparing these expenses with similar costs of investing in other mutual funds.
The expense example provides information about actual account values and actual expenses. In order to estimate the expenses a shareholder paid during the period covered by this report, shareholders can divide their account value by $1,000 and then multiply the result by the number corresponding to their share class under the heading entitled “Expenses Paid During the Period.”
The expense example also provides information about hypothetical account values and hypothetical expenses based on the Fund’s actual expense ratio and an assumed rate of return of 5% per year before expenses. In order to assist shareholders in comparing the ongoing expenses of investing in the Fund and other funds, compare the 5% hypothetical example with the 5% hypothetical example that appear in shareholder reports of other funds.
The expenses shown in the expense example are intended to highlight shareholders’ ongoing costs only and do not reflect any transactional expenses, such as sales charges, if any. Therefore, the hypothetical example is useful in comparing ongoing expenses only, and will not help shareholders determine the relative total expenses of owning different funds. If these transactional expenses were included, shareholder expenses would have been higher.
|
| Derivative Financial Instruments |
The Fund may invest in various derivative financial instruments. These instruments are used to obtain exposure to a security, commodity, index, market and/or other asset without owning or taking physical custody of securities, commodities and/or other referenced assets or to manage market, equity, credit, interest rate, foreign currency exchange rate, commodity and/or other risks. Derivative financial instruments may give rise to a form of economic leverage and involve risks, including the imperfect correlation between the value of a derivative financial instrument and the underlying asset, possible default of the counterparty to the transac-
tion or illiquidity of the instrument. The Fund’s successful use of a derivative financial instrument depends on the investment adviser’s ability to predict pertinent market movements accurately, which cannot be assured. The use of these instruments may result in losses greater than if they had not been used, may limit the amount of appreciation the Fund can realize on an investment and/or may result in lower distributions paid to shareholders. The Fund’s investments in these instruments, if any, are discussed in detail in the Notes to Consolidated Financial Statements.
| | | | | | |
| | | BLACKROCK MULTI-MANAGER ALTERNATIVE STRATEGIES FUND | | FEBRUARY 28, 2017 | | 7 |
| | | | |
| Consolidated Schedule of Investments February 28, 2017 (Unaudited) | | | (Percentages shown are based on Net Assets) | |
| | | | |
| | | | | | | | | | |
| Asset-Backed Securities | | | | Par
(000) | | | Value | |
AMSR Trust, Series 2016-SFR1, Class E, 3.92%, 11/17/18 (a)(b) | | USD | | | 487 | | | $ | 491,196 | |
BCMSC Trust, Series 1999-A, Class A2, 5.80%, 3/15/29 (b) | | | | | 101 | | | | 102,416 | |
Bear Stearns Asset-Backed Securities I Trust, Series 2006-HE1, Class 2M3, 1.23%, 2/25/36 (b) | | | | | 1,776 | | | | 1,541,526 | |
BlueMountain CLO Ltd., Series 2012-1A, Class E, 6.53%, 7/20/23 (a)(b) | | | | | 1,000 | | | | 1,006,438 | |
Colony American Homes, Series 2014-2A, Class E, 3.98%, 7/17/31 (a)(b) | | | | | 360 | | | | 360,022 | |
Conn’s Receivables Funding LLC, Series 2016-B, Class A, 3.73%, 10/15/18 (a) | | | | | 115 | | | | 115,534 | |
CountryPlace Manufactured Housing Contract Trust, Series 2007-1, Class A4, 5.85%, 7/15/37 (a)(b) | | | | | 664 | | | | 688,540 | |
GSAMP Trust, Series 2004-NC2, Class M1, 1.83%, 10/25/34 (b) | | | | | 52 | | | | 47,588 | |
HSI Asset Securitization Corp. Trust, Series 2006-HE2, Class 2A4, 0.99%, 12/25/36 (b) | | | | | 499 | | | | 214,940 | |
National Collegiate Student Loan Trust, Series 2005-3W, Class A51, 1.06%, 10/25/33 (a)(b) | | | | | 75 | | | | 67,926 | |
Octagon Investment Partners XVII Ltd., Series 2013-1A, Class E, 5.54%, 10/25/25 (a)(b) | | | | | 2,000 | | | | 1,882,690 | |
Specialty Underwriting & Residential Finance Trust, Series 2007-AB1, Class A2D, 1.12%, 3/25/37 (b) | | | | | 377 | | | | 205,485 | |
VOLT XXIX LLC, Series 2014-NP10, Class A1,
3.38%, 10/25/54 (a)(c) | | | | | 1,239 | | | | 1,239,442 | |
Total Asset-Backed Securities — 7.7% | | | | | | | | | 7,963,743 | |
| | | | | | | | | | |
| Common Stocks | | | | Shares | | | | |
Automobiles — 0.0% | | | | | | | | | | |
Toyota Motor Corp. — ADR | | | | | 125 | | | | 14,144 | |
Banks — 0.1% | | | | | | | | | | |
Bank of Kyoto Ltd. | | | | | 6,186 | | | | 50,396 | |
Beverages — 0.9% | | | | | | | | | | |
Anheuser-Busch InBev SA | | | | | 1,473 | | | | 161,127 | |
Coca-Cola Co. | | | | | 354 | | | | 14,854 | |
Heineken NV | | | | | 1,743 | | | | 143,950 | |
Molson Coors Brewing Co., Class B (d) | | | | | 6,453 | | | | 647,817 | |
| | | | | | | | | | |
| | | | | | | | | | 967,748 | |
Biotechnology — 0.0% | | | | | | | | | | |
Actelion Ltd. — ADR | | | | | 200 | | | | 13,473 | |
| | | | | | | | |
| Common Stocks | | Shares | | | Value | |
Capital Markets — 0.5% | | | | | | | | |
Avista Healthcare Public Acquisition Corp. (e) | | | 7,000 | | | $ | 71,400 | |
Boulevard Acquisition Corp. II (e) | | | 6,100 | | | | 62,830 | |
Boulevard Acquisition Corp. II, Class A (e) | | | 13,881 | | | | 138,949 | |
Capitol Acquisition Corp. III (e) | | | 6,800 | | | | 70,720 | |
Double Eagle Acquisition Corp. (e) | | | 6,989 | | | | 72,546 | |
Double Eagle Acquisition Corp., Class A (e) | | | 12 | | | | 120 | |
GP Investments Acquisition Corp. (e) | | | 7,100 | | | | 71,000 | |
| | | | | | | | |
| | | | | | | | 487,565 | |
Chemicals — 0.4% | | | | | | | | |
Albemarle Corp. | | | 1,950 | | | | 197,945 | |
BASF SE | | | 2,575 | | | | 239,562 | |
Monsanto Co. | | | 200 | | | | 22,766 | |
| | | | | | | | |
| | | | | | | | 460,273 | |
Commercial Services & Supplies — 0.1% | | | | | | | | |
ISS A/S | | | 1,842 | | | | 71,675 | |
Construction & Engineering — 0.1% | | | | | | | | |
Skanska AB, Class B | | | 4,556 | | | | 108,438 | |
Diversified Financial Services — 0.2% | | | | | | | | |
Deutsche Boerse AG | | | 2,407 | | | | 204,301 | |
Diversified Telecommunication Services — 0.9% | | | | | | | | |
SFR Group SA (e) | | | 769 | | | | 22,419 | |
Verizon Communications, Inc. (d) | | | 17,561 | | | | 871,552 | |
| | | | | | | | |
| | | | | | | | 893,971 | |
Electric Utilities — 0.6% | | | | | | | | |
Centrais Eletricas Brasileiras SA — ADR (e) | | | 3,517 | | | | 27,257 | |
Vistra Energy Corp. (e) | | | 38,616 | | | | 624,035 | |
| | | | | | | | |
| | | | | | | | 651,292 | |
Electrical Equipment — 0.7% | | | | | | | | |
Prysmian SpA | | | 5,951 | | | | 151,483 | |
Rockwell Automation, Inc. (d) | | | 3,807 | | | | 575,238 | |
| | | | | | | | |
| | | | | | | | 726,721 | |
Energy Equipment & Services — 0.7% | | | | | | | | |
Halliburton Co. (d) | | | 14,128 | | | | 755,283 | |
Food & Staples Retailing — 0.0% | | | | | | | | |
Rite Aid Corp. (e) | | | 2,600 | | | | 15,600 | |
Food Products — 0.3% | | | | | | | | |
Mead Johnson Nutrition Co. | | | 3,208 | | | | 281,630 | |
WhiteWave Foods Co. (e) | | | 234 | | | | 12,889 | |
| | | | | | | | |
| | | | | | | | 294,519 | |
Health Care Equipment & Supplies — 0.0% | | | | | | | | |
Alere, Inc. (e) | | | 700 | | | | 26,810 | |
Terumo Corp. | | | 40 | | | | 1,387 | |
| | | | | | | | |
| | | | | | | | 28,197 | |
| | | | | | | | | | |
| Portfolio Abbreviations | | | | | | |
| ADR | | American Depositary Receipts | | ETN | | Exchange-Traded Note | | MSCI | | Morgan Stanley Capital International |
| ASX | | Australia Stock Exchange | | EUR | | Euro | | NOK | | Norwegian Krone |
| AUD | | Australian Dollar | | EURIBOR | | Euro Interbank Offered Rate | | NZD | | New Zealand Dollar |
| CAD | | Canadian Dollar | | FKA | | Formerly Known As | | OTC | | Over-the-counter |
| CBOT | | Chicago Board of Trade | | FTSE | | Financial Times Stock Exchange | | S&P | | Standard & Poor’s |
| CHF | | Swiss Franc | | GBP | | British Pound | | SEK | | Swedish Krona |
| CLO | | Collateralized Loan Obligation | | JPY | | Japanese Yen | | SPDR | | Standard & Poor’s Depositary Receipts |
| DKK | | Danish Krone | | LIBOR | | London Interbank Offered Rate | | TOPIX | | Tokyo Stock Price Index |
| ETF | | Exchange-Traded Fund | | MIB | | Milano Italia Borsa | | USD | | U.S. Dollar |
See Notes to Consolidated Financial Statements.
| | | | | | |
| 8 | | BLACKROCK MULTI-MANAGER ALTERNATIVE STRATEGIES FUND | | FEBRUARY 28, 2017 | | |
| | | | |
| Consolidated Schedule of Investments (continued) | | | | |
| | | | |
| | | | | | | | |
| Common Stocks | | Shares | | | Value | |
Hotels, Restaurants & Leisure — 0.1% | | | | | | | | |
Carnival PLC — ADR | | | 1,322 | | | $ | 72,644 | |
Rezidor Hotel Group AB | | | 6,579 | | | | 25,170 | |
| | | | | | | | |
| | | | | | | | 97,814 | |
Household Durables — 0.2% | | | | | | | | |
JM AB | | | 658 | | | | 20,654 | |
William Lyon Homes (d)(e) | | | 2,100 | | | | 194,208 | |
| | | | | | | | |
| | | | | | | | 214,862 | |
Household Products — 0.0% | | | | | | | | |
Central Garden & Pet Co., Class A (e) | | | 427 | | | | 13,643 | |
Insurance — 0.2% | | | | | | | | |
Crawford & Co., Class A | | | 16,120 | | | | 143,307 | |
Power Corp of Canada | | | 422 | | | | 9,818 | |
| | | | | | | | |
| | | | | | | | 153,125 | |
Internet & Direct Marketing Retail — 0.3% | | | | | | | | |
Ctrip.com International Ltd — ADR (e) | | | 7,590 | | | | 360,070 | |
Internet Software & Services — 1.1% | | | | | | | | |
Alphabet, Inc. Class C (d)(e) | | | 557 | | | | 458,528 | |
Alphabet, Inc., Class A (d)(e) | | | 474 | | | | 400,497 | |
United Internet AG | | | 3,829 | | | | 157,613 | |
Yahoo!, Inc. (d)(e) | | | 1,610 | | | | 73,513 | |
| | | | | | | | |
| | | | | | | | 1,090,151 | |
IT Services — 0.6% | | | | | | | | |
Cognizant Technology Solutions Corp., Class A (e) | | | 10,495 | | | | 622,035 | |
Media — 0.9% | | | | | | | | |
CBS Corp., Class A | | | 350 | | | | 23,422 | |
Comcast Corp., Class A (f) | | | 18,126 | | | | 678,275 | |
Liberty Broadband Corp., Class A (e) | | | 1,067 | | | | 89,905 | |
Liberty Global PLC (e) | | | 220 | | | | 7,854 | |
Liberty Global PLC LiLAC, Class C (e) | | | 2,167 | | | | 53,287 | |
Liberty Media Group LLC, Class A (e) | | | 952 | | | | 28,665 | |
Liberty SiriusXM Group, Class A (e) | | | 209 | | | | 8,220 | |
Naspers Ltd. — ADR | | | 943 | | | | 15,211 | |
Time Warner, Inc. | | | 141 | | | | 13,848 | |
Twenty-First Century Fox, Inc., Class B | | | 1,403 | | | | 41,178 | |
| | | | | | | | |
| | | | | | | | 959,865 | |
Metals & Mining — 0.6% | | | | | | | | |
BHP Billiton PLC — ADR | | | 16,248 | | | | 527,897 | |
Vale SA — ADR | | | 13,043 | | | | 134,995 | |
| | | | | | | | |
| | | | | | | | 662,892 | |
Multi-Utilities — 0.1% | | | | | | | | |
Black Hills Corp. (e) | | | 1,001 | | | | 71,511 | |
Oil, Gas & Consumable Fuels — 3.4% | | | | | | | | |
Anadarko Petroleum Corp. | | | 10,688 | | | | 690,979 | |
Arch Coal, Inc. (e) | | | 3,230 | | | | 232,108 | |
Concho Resources, Inc. (e) | | | 4,849 | | | | 642,250 | |
Devon Energy Corp. | | | 9,045 | | | | 392,191 | |
Hess Corp. | | | 269 | | | | 13,837 | |
Kinder Morgan, Inc. | | | 19,860 | | | | 423,217 | |
Magnum Hunter Resources Corp. (e) | | | 17,000 | | | | 191,250 | |
Midstates Petroleum Co., Inc. (e) | | | 11,761 | | | | 234,397 | |
Petroleo Brasileiro SA — ADR (e) | | | 1,363 | | | | 13,739 | |
Pioneer Natural Resources Co. | | | 2,608 | | | | 485,010 | |
Royal Dutch Shell PLC, Class A — ADR | | | 1,555 | | | | 80,689 | |
SandRidge Energy, Inc. (e) | | | 1,744 | | | | 32,705 | |
Tex Energy LLC | | | 38,616 | | | | 52,131 | |
| | | | | | | | |
| | | | | | | | 3,484,503 | |
| | | | | | | | |
| Common Stocks | | Shares | | | Value | |
Personal Products — 0.2% | | | | | | | | |
Edgewell Personal Care Co. (e) | | | 1,957 | | | $ | 144,505 | |
Herbalife Ltd. (e) | | | 40 | | | | 2,260 | |
Unilever PLC — ADR | | | 1,044 | | | | 49,569 | |
| | | | | | | | |
| | | | | | | | 196,334 | |
Pharmaceuticals — 0.2% | | | | | | | | |
Horizon Pharma PLC (e) | | | 2,078 | | | | 33,352 | |
Novartis AG | | | 2,081 | | | | 162,509 | |
| | | | | | | | |
| | | | | | | | 195,861 | |
Professional Services — 0.8% | | | | | | | | |
Nielsen Holdings PLC | | | 18,253 | | | | 809,703 | |
Road & Rail — 0.2% | | | | | | | | |
CSX Corp. | | | 3,953 | | | | 191,958 | |
Semiconductors & Semiconductor Equipment — 0.3% | | | | | |
Intel Corp. | | | 7,555 | | | | 273,491 | |
NXP Semiconductors NV (e) | | | 131 | | | | 13,468 | |
SunPower Corp. (e) | | | 2,119 | | | | 18,562 | |
| | | | | | | | |
| | | | | | | | 305,521 | |
Software — 0.7% | | | | | | | | |
Microsoft Corp. | | | 7,508 | | | | 480,362 | |
Symantec Corp. | | | 9,962 | | | | 284,614 | |
| | | | | | | | |
| | | | | | | | 764,976 | |
Specialty Retail — 0.4% | | | | | | | | |
Cabela’s, Inc. (e) | | | 480 | | | | 22,483 | |
Lowe’s Cos, Inc. | | | 5,567 | | | | 414,018 | |
| | | | | | | | |
| | | | | | | | 436,501 | |
Technology Hardware, Storage & Peripherals — 1.0% | | | | | |
Dell Technologies, Inc., Class V (e) | | | 1,768 | | | | 112,250 | |
HP, Inc. | | | 53,894 | | | | 936,139 | |
| | | | | | | | |
| | | | | | | | 1,048,389 | |
Textiles, Apparel & Luxury Goods — 0.3% | | | | | | | | |
Christian Dior SE | | | 104 | | | | 22,050 | |
Moncler SpA | | | 4,222 | | | | 80,663 | |
Pandora A/S | | | 961 | | | | 109,387 | |
Under Armour, Inc., Class C (e) | | | 3,320 | | | | 61,619 | |
| | | | | | | | |
| | | | | | | | 273,719 | |
Tobacco — 0.4% | | | | | | | | |
Reynolds American, Inc. | | | 7,349 | | | | 452,478 | |
Wireless Telecommunication Services — 0.0% | | | | | | | | |
NII Holdings, Inc. (e) | | | 20,453 | | | | 40,906 | |
Total Common Stocks — 17.5% | | | | | | | 18,190,413 | |
| | | | | | | | |
| Corporate Bonds | | Par (000) | | | | |
Automobiles — 0.1% | | | | | | | | |
Tesla, Inc., 1.25%, 3/01/21 (d)(g) | | USD | 98 | | | | 92,365 | |
Banks — 0.2% | | | | | | | | |
Intesa Sanpaolo SpA, 5.71%, 1/15/26 (a) | | | 200 | | | | 193,121 | |
Biotechnology — 0.1% | | | | | | | | |
ImmunoGen, Inc., 4.50%, 7/01/21 (a)(d)(g) | | | 100 | | | | 93,875 | |
Chemicals — 0.1% | | | | | | | | |
Hexion, Inc., 10.38%, 2/01/22 (a) | | | 78 | | | | 80,340 | |
See Notes to Consolidated Financial Statements.
| | | | | | |
| | | BLACKROCK MULTI-MANAGER ALTERNATIVE STRATEGIES FUND | | FEBRUARY 28, 2017 | | 9 |
| | | | |
| Consolidated Schedule of Investments (continued) | | | | |
| | | | |
| | | | | | | | | | |
| Corporate Bonds | | | | Par (000) | | | Value | |
Communications Equipment — 0.6% | | | | | | | | | | |
Ciena Corp., 3.75%, 10/15/18 (a)(d)(g) | | USD | | | 244 | | | $ | 345,260 | |
Viavi Solutions, Inc., 1.00%, 3/01/24 (a) | | | | | 235 | | | | 237,729 | |
| | | | | | | | | | |
| | | | | | | | | | 582,989 | |
Diversified Financial Services — 0.4% | | | | | | | | | | |
Algeco Scotsman Global Finance PLC, 8.50%, 10/15/18 (a) | | | | | 244 | | | | 237,290 | |
Bayer Capital Corp. BV, 5.63%, 11/22/19 (a)(g) | | EUR | | | 200 | | | | 238,958 | |
| | | | | | | | | | |
| | | | | | | | | | 476,248 | |
Diversified Telecommunication Services — 0.4% | | | | | | | | | | |
Telefonica Participaciones SAU, 4.90%, 9/25/17 (a)(g) | | | | | 300 | | | | 297,480 | |
Telemar Norte Leste SA, 5.50%, 10/23/20 (e)(h) | | USD | | | 390 | | | | 126,750 | |
| | | | | | | | | | |
| | | | | | | | | | 424,230 | |
Electronic Equipment, Instruments & Components — 0.0% | | | | | |
OSI Systems, Inc., 1.25%, 9/01/22 (a)(g) | | | | | 55 | | | | 53,556 | |
Energy Equipment & Services — 0.2% | | | | | | | | | | |
Transocean, Inc., 5.80%, 10/15/22 | | | | | 200 | | | | 187,000 | |
Equity Real Estate Investment Trusts (REITs) — 0.2% | | | | | | | | | | |
Colony Starwood Homes, 3.50%, 1/15/22 (a)(d)(g) | | | | | 170 | | | | 176,481 | |
Hotels, Restaurants & Leisure — 0.6% | | | | | | | | | | |
Caesars Entertainment Operating Co, Inc.: | | | | | | | | | | |
11.25%, 6/01/17 (e)(h) | | | | | 74 | | | | 80,990 | |
9.00%, 2/15/20 (e)(h) | | | | | 198 | | | | 222,160 | |
Caesars Entertainment Resort Properties LLC/Caesars Entertainment Resort Properties, 11.00%, 10/01/21 | | | | | 292 | | | | 319,375 | |
| | | | | | | | | | |
| | | | | | | | | | 622,525 | |
Independent Power and Renewable Electricity Producers — 0.2% | | | | | |
GenOn Energy, Inc., 9.50%, 10/15/18 | | | | | 301 | | | | 228,007 | |
Internet & Direct Marketing Retail — 0.4% | | | | | | | | | | |
Ctrip.com International Ltd., 1.25%, 10/15/18 (g) | | | | | 175 | | | | 224,328 | |
Vipshop Holdings Ltd., 1.50%, 3/15/19 (g) | | | | | 176 | | | | 176,880 | |
| | | | | | | | | | |
| | | | | | | | | | 401,208 | |
Internet Software & Services — 0.3% | | | | | | | | | | |
SINA Corp., 1.00%, 12/01/18 (d)(g) | | | | | 137 | | | | 135,973 | |
Yahoo!, Inc., 0.00%, 12/01/18 (d)(g)(i) | | | | | 141 | | | | 145,406 | |
| | | | | | | | | | |
| | | | | | | | | | 281,379 | |
Media — 0.3% | | | | | | | | | | |
DISH Network Corp., 3.38%, 8/15/26 (a)(d)(g) | | | | | 133 | | | | 160,099 | |
Liberty Media Corp.-Liberty Formula One,
1.00%, 1/30/23 (a)(d)(g) | | | | | 162 | | | | 168,683 | |
| | | | | | | | | | |
| | | | | | | | | | 328,782 | |
Metals & Mining — 0.7% | | | | | | | | | | |
Freeport-McMoRan, Inc., 5.45%, 3/15/43 | | | | | 205 | | | | 175,275 | |
Teck Resources Ltd.: | | | | | | | | | | |
6.13%, 10/01/35 | | | | | 350 | | | | 362,250 | |
6.25%, 7/15/41 | | | | | 106 | | | | 109,975 | |
5.20%, 3/01/42 | | | | | 112 | | | | 106,084 | |
| | | | | | | | | | |
| | | | | | | | | | 753,584 | |
Oil, Gas & Consumable Fuels — 2.9% | | | | | | | | | | |
Berry Petroleum Co. LLC, 6.38%, 9/15/22 (e)(h) | | | | | 400 | | | | 244,000 | |
BreitBurn Energy Partners LP/BreitBurn Finance Corp., 7.88%, 4/15/22 (e)(h) | | | | | 350 | | | | 250,250 | |
Calumet Specialty Products Partners LP/Calumet Finance Corp., 6.50%, 4/15/21 | | | | | 243 | | | | 210,871 | |
| | | | | | | | | | |
| Corporate Bonds | | | | Par (000) | | | Value | |
Oil, Gas & Consumable Fuels (continued) | | | | | | | | | | |
Chesapeake Energy Corp., 5.50%, 9/15/26 (a)(d)(g) | | USD | | | 96 | | | $ | 94,440 | |
Continental Resources, Inc., 4.90%, 6/01/44 | | | | | 400 | | | | 351,000 | |
Golar LNG Ltd., 2.75%, 2/15/22 (a)(g) | | | | | 163 | | | | 164,528 | |
NGPL PipeCo LLC, 7.77%, 12/15/37 (a) | | | | | 513 | | | | 580,973 | |
Northern Oil and Gas, Inc., 8.00%, 6/01/20 | | | | | 449 | | | | 410,835 | |
Transocean Proteus Ltd., 6.25%, 12/01/24 (a) | | | | | 337 | | | | 348,475 | |
Vanguard Natural Resources LLC/VNR Finance Corp., 7.88%, 4/01/20 (e)(h) | | | | | 274 | | | | 192,143 | |
Williams Cos., Inc., 7.50%, 1/15/31 | | | | | 170 | | | | 199,963 | |
| | | | | | | | | | |
| | | | | | | | | | 3,047,478 | |
Pharmaceuticals — 0.1% | | | | | | | | | | |
Innoviva, Inc., 2.13%, 1/15/23 (g) | | | | | 80 | | | | 69,050 | |
Wireless Telecommunication Services — 0.1% | | | | | | | | | | |
America Movil BV, 5.50%, 9/17/18 (g) | | EUR | | | 100 | | | | 88,063 | |
Total Corporate Bonds — 7.9% | | | | | | | | | 8,180,281 | |
| | | | | | | | | | |
| Floating Rate Loan Interests (b) | | | | | | | | |
Diversified Telecommunication Services — 4.4% | | | | | | | | | | |
Ligado Networks LLC (FKA New LightSquared LLC), Junior Loan, 13.50%, 12/07/20 (e) | | USD | | | 3,090 | | | | 2,429,582 | |
New LightSquared LLC, Loan, 9.75%, 6/15/20 (e) | | | | | 2,201 | | | | 2,152,654 | |
| | | | | | | | | | |
| | | | | | | | | | 4,582,236 | |
Hotels, Restaurants & Leisure — 0.2% | | | | | | | | | | |
Caesars Entertainment Operating Co., Inc. (FKA Harrah’s Operating Co., Inc.), Term Loan B, 6.75%, 10/31/17 | | | | | 243 | | | | 276,868 | |
Oil, Gas & Consumable Fuels — 0.8% | | | | | | | | | | |
Arch Coal, Inc., Term Loan, 9.00%, 10/05/21 | | | | | 86 | | | | 86,948 | |
Peabody Energy Corp., Revolving Term Loan, 0.00%, 9/24/18 | | | | | 724 | | | | 729,134 | |
| | | | | | | | | | |
| | | | | | | | | | 816,082 | |
Specialty Retail — 0.4% | | | | | | | | | | |
Toys ‘R’ Us-Delaware, Inc., Term B-4 Loan, 9.75%, 4/24/20 | | | | | 494 | | | | 414,149 | |
Thrifts & Mortgage Finance — 0.2% | | | | | | | | | | |
Walter Investment Management Corp., Tranche B Term Loan, 4.75%, 12/18/20 | | | | | 200 | | | | 189,472 | |
Total Floating Rate Loan Interests — 6.0% | | | | | | | | | 6,278,807 | |
| | | | | | | | | | |
| Foreign Government Obligations | | | | | | | | |
Canada — 0.3% | | | | | | | | | | |
Canadian Government Bond, 1.75%, 9/01/19 | | CAD | | | 359 | | | | 276,715 | |
Greece — 0.4% | | | | | | | | | | |
Hellenic Republic Government Bond, 4.75%, 4/17/19 | | EUR | | | 400 | | | | 397,419 | |
Total Foreign Government Obligations — 0.7% | | | | | | | | | 674,134 | |
| | | | | | | | | | |
| Investment Companies | | | | Shares | | | | |
Adams Diversified Equity Fund, Inc. | | | | | 3,985 | | | | 54,276 | |
Blackrock Event Driven Equity Fund, Institutional Class (j) | | | | | 701,369 | | | | 6,354,405 | |
Boussard & Gavaudan Holding Ltd. (e) | | | | | 117,500 | | | | 2,253,080 | |
See Notes to Consolidated Financial Statements.
| | | | | | |
| 10 | | BLACKROCK MULTI-MANAGER ALTERNATIVE STRATEGIES FUND | | FEBRUARY 28, 2017 | | |
| | | | |
| Consolidated Schedule of Investments (continued) | | | | |
| | | | |
| | | | | | | | | | |
| Investment Companies | | | | Shares | | | Value | |
ETRACS Monthly Pay 2xLeveraged Closed-End Fund ETN | | | | | 4,226 | | | $ | 75,645 | |
iPath S&P 500 VIX Mid-Term Futures ETN (e)(k) | | | | | 3,834 | | | | 112,260 | |
iPath S&P 500 VIX Short-Term Futures ETN (e)(k) | | | | | 6,210 | | | | 114,388 | |
Liberty All Star Equity Fund | | | | | 10,899 | | | | 59,291 | |
Pershing Square Holdings Ltd. (e) | | | | | 2,402 | | | | 36,823 | |
SPDR S&P 500 ETF Trust | | | | | 1,997 | | | | 472,231 | |
Swiss Helvetia Fund, Inc. | | | | | 3,252 | | | �� | 35,837 | |
Turkish Investment Fund, Inc. | | | | | 1,801 | | | | 13,147 | |
VanEck Vectors Gold Miners ETF | | | | | 7,311 | | | | 167,056 | |
VelocityShares Daily Inverse VIX Short-Term ETN (e)(k) | | | 1,317 | | | | 83,366 | |
Total Investment Companies — 9.5% | | | | | | | | | 9,831,805 | |
| | | | | | | | | | |
| Non-Agency Mortgage-Backed Securities | | | | Par (000) | | | | |
Collateralized Mortgage Obligations — 5.4% | | | | | | | | | | |
Bear Stearns ALT-A Trust: | | | | | | | | | | |
Series 2005-10, Class 11A1, 1.27%, 1/25/36 (b) | | USD | | | 2,648 | | | | 2,358,585 | |
Series 2006-4, Class 23A4, 3.17%, 8/25/36 (b) | | | | | 2,117 | | | | 1,332,950 | |
Countrywide Alternative Loan Trust, Series 2005-79CB, Class A1, 1.33%, 1/25/36 (b) | | | | | 130 | | | | 83,040 | |
GreenPoint Mortgage Funding Trust, Series 2007-AR1, Class 3A2, 0.93%, 2/25/37 (b) | | | | | 1,591 | | | | 1,440,967 | |
Lehman XS Trust Series, Series 2007-12N, Class 1A2, 0.92%, 7/25/47 (b) | | | | | — | (o) | | | 8 | |
Structured Asset Mortgage Investments II Trust, Series 2007-AR1, Class 2A1, 0.95%, 1/25/37 (b) | | | | | 308 | | | | 251,091 | |
Washington Mutual Mortgage Pass-Through Certificates Trust, Series 2006-7, Class A1B, 0.85%, 9/25/36 (b) | | | | | 361 | | | | 157,821 | |
| | | | | | | | | | |
| | | | | | | | | | 5,624,462 | |
Commercial Mortgage-Backed Securities — 1.7% | | | | | |
FREMF Mortgage Trust, Series 2014-KS02, Class B, 5.49%, 8/25/23 (a)(b) | | | | | 1,463 | | | | 1,456,259 | |
JPMorgan Chase Commercial Mortgage Securities Trust, Series 2014-BXH, Class E,
4.52%, 4/15/27 (a)(b) | | | | | 360 | | | | 353,292 | |
| | | | | | | | | | |
| | | | | | | | | | 1,809,551 | |
Total Non-Agency Mortgage-Backed Securities — 7.1% | | | | 7,434,013 | |
| | | | | | | | | | |
| Other Interests (l) | | | | Beneficial
Interest
(000) | | | | |
Electric Utilities — 0.0% | | | | | | | | | | |
Vistra Energy Corp. (e) | | | | | 1,200 | | | | 12 | |
| | | | | | | | | | |
| Preferred Securities | | | | | | | | |
| Capital Trusts | | | | Par (000) | | | | |
Banks — 0.3% | | | | | | | | | | |
HSH Nordbank AG, 7.25% (m) | | | | | 994 | | | | 263,808 | |
| | | | | | | | | | |
| Preferred Securities | | | | Par (000) | | | Value | |
Semiconductors & Semiconductor Equipment — 0.2% | | | | | |
Intel Corp., 2.95%, 12/15/35 (d)(g) | | USD | | | 172 | | | $ | 233,275 | |
Total Capital Trusts — 0.5% | | | | | | | | | 497,083 | |
| | | | | | | | | | |
| Preferred Stocks | | | | Shares | | | | |
Aerospace & Defense — 0.4% | | | | | | | | | | |
Chemicals — 0.1% | | | | | | | | | | |
Rayonier Advanced Materials, Inc., 8.00%, 8/15/19 (d)(g) | | | | | 1,614 | | | | 163,337 | |
Diversified Financial Services — 0.1% | | | | | | | | | | |
Mandatory Exchangeable Trust, 5.75%, 6/03/19 (a)(d)(g) | | | | | 1,150 | | | | 142,427 | |
Multi-Utilities — 0.2% | | | | | | | | | | |
Dominion Resources, Inc., 6.75%, 8/15/19 (g) | | | | | 3,916 | | | | 199,324 | |
Oil, Gas & Consumable Fuels — 0.1% | | | | | | | | | | |
WPX Energy, Inc., 6.25%, 7/31/18 (d)(g) | | | | | 2,408 | | | | 139,206 | |
Pharmaceuticals — 0.4% | | | | | | | | | | |
Allergan PLC, 5.50%, 3/01/18 (g) | | | | | 450 | | | | 386,001 | |
Semiconductors & Semiconductor Equipment — 0.0% | | | | | | | | | | |
SunEdison, Inc., 6.75% (d)(g)(m) | | | | | 250 | | | | 623 | |
Thrifts & Mortgage Finance — 0.2% | | | | | | | | | | |
Fannie Mae, 8.25% (m) | | | | | 27,000 | | | | 222,750 | |
Total Preferred Stocks — 1.5% | | | | | | | | | 1,626,916 | |
Total Preferred Securities — 2.0% | | | | | | | | | 2,123,999 | |
| | | | | | | | | | |
| Taxable Municipal Bonds — 0.2% | | | | Par (000) | | | | |
Puerto Rico Commonwealth Aqueduct & Sewer Authority, 5.75%, 7/01/37 | | USD | | | 305 | | | | 235,695 | |
| | | | | | | | | | |
| U.S. Government Sponsored Agency Securities | | | | |
Interest Only Collateralized Mortgage Obligations — 2.8% | | | | | |
Fannie Mae: | | | | | | | | | | |
Series 1997-85, Class M, 6.50%, 12/25/27 | | | | | 682 | | | | 100,766 | |
Series 2001-61, Class SH, 7.12%, 11/18/31 (b) | | | | | 129 | | | | 30,215 | |
Series 2006-115, Class EI, 5.86%, 12/25/36 (b) | | | | | 559 | | | | 104,050 | |
Series 2006-126, Class CS, 5.92%, 1/25/37 (b) | | | | | 556 | | | | 106,666 | |
Series 2007-77, Class SK, 5.09%, 8/25/37 (b) | | | | | 523 | | | | 84,193 | |
Series 2007-88, Class VI, 5.76%, 9/25/37 (b) | | | | | 465 | | | | 80,045 | |
Series 2008-87, Class AS, 6.87%, 7/25/33 (b) | | | | | 209 | | | | 43,638 | |
Series 2011-129, Class S, 4.72%, 3/25/37 (b) | | | | | 597 | | | | 37,513 | |
Series 2015-42, Class AI, 1.93%, 6/25/55 (b) | | | | | 1,248 | | | | 73,510 | |
Series 2015-66, Class AS, 5.47%, 9/25/45 (b) | | | | | 533 | | | | 90,545 | |
Series 345, Class 15, 6.00%, 3/25/34 (b) | | | | | 636 | | | | 141,128 | |
See Notes to Consolidated Financial Statements.
| | | | | | |
| | | BLACKROCK MULTI-MANAGER ALTERNATIVE STRATEGIES FUND | | FEBRUARY 28, 2017 | | 11 |
| | | | |
| Consolidated Schedule of Investments (continued) | | | | |
| | | | |
| | | | | | | | | | |
| U.S. Government Sponsored Agency Securities | | Par
(000) | | | Value | |
Interest Only Collateralized Mortgage Obligations (continued) | |
Freddie Mac: | | | | | | | | | | |
Series 2416, Class SV, 6.98%, 5/15/31 (b) | | USD | | | 419 | | | $ | 75,906 | |
Series 303, Class 110, 3.74%, 1/15/43 (b) | | | | | 479 | | | | 90,186 | |
Series 3031, Class BI, 5.92%, 8/15/35 (b) | | | | | 486 | | | | 104,009 | |
Series 4413, Class WI, 1.78%, 10/15/41 (b) | | | | | 1,001 | | | | 60,037 | |
Ginnie Mae: | | | | | | | | | | |
Series 2003-52, Class SE, 5.83%, 6/16/33 (b) | | | | | 476 | | | | 86,497 | |
Series 2004-46, Class S, 6.32%, 6/20/34 (b) | | | | | 400 | | | | 94,636 | |
Series 2005-69, Class SY, 5.97%, 11/20/33 (b) | | | | | 210 | | | | 38,309 | |
Series 2012-16, Class NI, 6.00%, 5/20/39 | | | | | 371 | | | | 80,959 | |
Series 2013-44, Class IB, 5.00%, 5/16/42 | | | | | 421 | | | | 102,115 | |
Series 2014-183, Class IM, 5.00%, 6/20/35 | | | | | 557 | | | | 137,898 | |
Series 2014-2, Class TI, 5.50%, 1/20/44 | | | | | 452 | | | | 89,909 | |
Series 2015-102, Class IT, 0.10%, 7/16/41 (b) | | | | | 18,892 | | | | 80,320 | |
Series 2015-80, Class IH, 0.99%, 5/20/44 (b) | | | | | 2,708 | | | | 97,486 | |
Series 2015-84, Class IO, 3.50%, 5/16/42 | | | | | 684 | | | | 132,313 | |
Series 2015-95, Class KI, 6.00%, 2/20/43 | | | | | 388 | | | | 95,768 | |
Series 2016-12, Class KI, 5.00%, 9/20/38 | | | | | 251 | | | | 64,662 | |
Series 2016-69, Class WI, 4.50%, 5/20/46 | | | | | 1,041 | | | | 228,842 | |
Series 2016-75, Class SA, 5.22%, 5/20/40 (b) | | | | | 765 | | | | 113,538 | |
Series 2016-80, Class CI, 5.00%, 4/20/39 | | | | | 450 | | | | 43,081 | |
Series 2016-H07, Class NI, 2.27%, 2/20/66 (b) | | | | | 589 | | | | 70,698 | |
Series 2016-H11, Class EI, 2.11%, 4/20/66 (b) | | | | | 603 | | | | 74,581 | |
Series 2016-H15, Class AI, 2.49%, 7/20/66 (b) | | | | | 805 | | | | 106,634 | |
| | | | | | | | | | |
| | | | | | | | | | 2,960,653 | |
Total U.S. Government Sponsored Agency Securities — 2.8% | | | | 2,960,653 | |
| | | | | | | | | | |
| Warrants | | | | Shares | | | | |
Aerospace & Defense — 0.0% | | | | | | | | | | |
Tempus Applied Solutions Holdings, Inc. (Issued 2/01/13, exercisable 2/04/13, 1 Share for 1 Warrant, Expires 7/31/20, Strike Price $11.50) | | | | | 14,552 | | | | 29 | |
Banks — 0.8% | | | | | | | | | | |
Associated Banc-Corp. (Issued/exercisable 12/01/11, 1 Share for 1 Warrant, Expires 11/21/18, Strike Price $19.77) | | | | | 11,891 | | | | 77,291 | |
SunTrust Banks, Inc. (Issued/exercisable 11/14/08, 1 Share for 1 Warrant, Expires 11/14/18, Strike Price $44.15) | | | | | 20,654 | | | | 340,791 | |
TCF Financial Corp. (Issued/exercisable 11/14/08, 1 Share for 1 Warrant, Expires 11/14/18, Strike Price $16.93) | | | | | 33,018 | | | | 70,989 | |
| | | | | | | | |
| Warrants | | Shares | | | Value | |
Banks (continued) | | | | | | | | |
Zions Bancorporation (Issued/exercisable 5/20/10, 1.018 Shares for 1 Warrant, Expires 5/22/20, Strike Price $35.89) | | | 25,255 | | | $ | 342,205 | |
| | | | | | | | |
| | | | | | | | 831,276 | |
Chemicals — 0.0% | | | | | | | | |
AgroFresh Solutions, Inc. (Issued 3/31/14,exercisable 4/07/14, 1 Share for 1 Warrant, Expires 2/19/19, Strike Price $11.50) | | | 64,356 | | | | 11,584 | |
Electronic Equipment, Instruments & Components — 0.0% | | | | | | | | |
Applied DNA Sciences, Inc. (Issued/exercisable 11/14/14, 1 Share for 1 Warrant, Expires 11/14/19, Strike Price $3.50) | | | 5,521 | | | | 2,098 | |
Food Products — 0.0% | | | | | | | | |
Hostess Brands, Inc. (Issued 10/16/15,exercisable 10/16/16, 0.5 Shares for 1 Warrant, Expires 11/04/21, Strike Price $11.50) | | | 6,700 | | | | 17,554 | |
Health Care Equipment & Supplies — 0.0% | | | | | | | | |
DarioHealth Corp. (Issued 3/2/16, exercisable 3/4/16, 1 Share for 1 Warrant, Expires 3/8/21, Strike Price $5.63) | | | 4,065 | | | | 2,724 | |
Hotels, Restaurants & Leisure — 0.2% | | | | | | | | |
Del Taco Restaurants, Inc. (Issued/exercisable 1/03/14, 1 Share for 1 Warrant, Expires 6/30/20, Strike Price $11.50) | | | 49,398 | | | | 177,833 | |
Machinery — 0.1% | | | | | | | | |
Blue Bird Corp. (Issued/exercisable 3/10/14, 0.5 Shares for 1 Warrant, Expires 2/24/20, Strike Price $11.50) | | | 29,441 | | | | 82,435 | |
Media — 0.0% | | | | | | | | |
Hemisphere Media Group, Inc. (Issued/exercisable 8/19/11, 0.5 Shares for 1 Warrant, Expires 4/04/18, Strike Price $12.00) | | | 25,346 | | | | 8,871 | |
Metals & Mining — 0.0% | | | | | | | | |
Franco-Nevada Corp. (Issued/exercisable 6/16/09, 1 Share for 1 Warrant, Expires 6/16/17, Strike Price CAD 75.00) | | | 2,212 | | | | 20,901 | |
New Gold, Inc. (Issued/exercisable 6/28/07, 1 Share for 1 Warrant, Expires 6/28/17, Strike Price CAD 15.00) | | | 13,128 | | | | 148 | |
Timmins Gold Corp. (Issued/exercisable 11/30/16, 1 Share for 1 Warrant, Expires 5/30/18, Strike Price CAD 0.70) | | | 14,096 | | | | 1,167 | |
| | | | | | | | |
| | | | | | | | 22,216 | |
Oil, Gas & Consumable Fuels — 0.4% | | | | | | | | |
Centennial Resource Development, Inc., Class A (Issued/exercisable 10/12/16, 1 Share for 1 Warrant, Expires 10/11/21, Strike Price $11.50) | | | 54,988 | | | | 393,164 | |
Kinder Morgan, Inc. (Issued/exercisable 2/15/12, 1 Share for 1 Warrant, Expires 5/25/17, Strike Price $40.00) | | | 70,053 | | | | 217 | |
| | | | | | | | |
| | | | | | | | 393,381 | |
See Notes to Consolidated Financial Statements.
| | | | | | |
| 12 | | BLACKROCK MULTI-MANAGER ALTERNATIVE STRATEGIES FUND | | FEBRUARY 28, 2017 | | |
| | | | |
| Consolidated Schedule of Investments (continued) | | | | |
| | | | |
| | | | | | | | |
| Warrants | | Shares | | | Value | |
Pharmaceuticals — 0.0% | | | | | | | | |
EyeGate Pharmaceuticals, Inc. (Issued/exercisable 7/31/15, 1 Share for 1 Warrant, Expires 7/31/20, Strike Price $10.62) | | | 46,688 | | | $ | 14,006 | |
Kitov Pharmaceuticals Holdings Ltd. — ADR (Issued/exercisable 11/20/15, 1 Share for 1 Warrant, Expires 11/20/20, Strike Price $4.13) | | | 10,533 | | | | 5,161 | |
Sonoma Pharmaceuticals, Inc. (Issued/exercisable 1/16/15, 1 Share for 1 Warrant, Expires 1/21/20, Strike Price $6.50) | | | 2,826 | | | | 1,413 | |
| | | | | | | | |
| | | | | | | | 20,580 | |
Semiconductors & Semiconductor Equipment — 0.0% | | | | | |
Sunworks, Inc. (Issued/exercisable 3/03/15, 1 Share for 1 Warrant, Expires 3/09/20, Strike Price $4.15) | | | 23,197 | | | | 7,841 | |
Software — 0.0% | | | | | | | | |
RMG Networks Holding Corp. (Issued/exercisable 5/18/11, 1 Share for 1 Warrant, Expires 4/08/18, Strike Price $11.50) | | | 12,715 | | | | 25 | |
Technology Hardware, Storage & Peripherals — 0.0% | | | | | |
Eastman Kodak Co. (Issued/exercisable 10/29/13, 1 Share for 1 Warrant, Expires 9/03/18, Strike Price $16.12) | | | 7,216 | | | | 11,906 | |
Total Warrants — 1.5% | | | | | | | 1,590,353 | |
Total Long-Term Investments (Cost — $62,105,260) — 62.9% | | | | | | | 65,463,908 | |
| | | | | | | | |
| Short-Term Securities | | | | | | |
Money Market Funds — 29.1% | | | | | | | | |
BlackRock Liquidity Funds, T-Fund, Institutional Class, 0.42% (j)(n) | | | 30,322,128 | | | | 30,322,128 | |
Total Short-Term Securities (Cost — $30,322,128) — 29.1% | | | | | | | 30,322,128 | |
| | | | | | | | |
| Options Purchased | | | | | | |
(Cost — $711,357) — 0.6% | | | | | | | 578,147 | |
Total Investments Before Options Written and Investments Sold Short (Cost — $93,138,745) — 92.6% | | | | | | | 96,364,183 | |
| | | | | | | | |
| Options Written | | | | | | |
(Premiums Received — $237,279) — (0.2)% | | | | | | | (237,009 | ) |
| | | | | | | | |
| Investments Sold Short | | | | | | |
Common Stocks | | | | | | | | |
Aerospace & Defense — (0.5)% | | | | | | | | |
Arconic, Inc. | | | 9,229 | | | | (265,703 | ) |
United Technologies Corp. | | | 2,492 | | | | (280,475 | ) |
| | | | | | | | |
| | | | | | | | (546,178 | ) |
| | | | | | | | |
| Common Stocks | | Shares | | | Value | |
Automobiles — (0.4)% | | | | | | | | |
Honda Motor Co. Ltd. — ADR | | | 445 | | | $ | (13,782 | ) |
Tesla, Inc. | | | 164 | | | | (40,998 | ) |
Toyota Motor Corp. — ADR | | | 2,928 | | | | (331,303 | ) |
| | | | | | | | |
| | | | | | | | (386,083 | ) |
Banks — (2.3)% | | | | | | | | |
Associated Banc-Corp. | | | 6,823 | | | | (175,692 | ) |
SunTrust Banks, Inc. | | | 16,225 | | | | (965,225 | ) |
TCF Financial Corp. | | | 22,486 | | | | (391,256 | ) |
Zions Bancorporation | | | 19,736 | | | | (886,146 | ) |
| | | | | | | | |
| | | | | | | | (2,418,319 | ) |
Beverages — (0.1)% | | | | | | | | |
Dr Pepper Snapple Group, Inc. | | | 76 | | | | (7,101 | ) |
Heineken Holding NV | | | 1,736 | | | | (131,932 | ) |
PepsiCo, Inc. | | | 67 | | | | (7,395 | ) |
| | | | | | | | |
| | | | | | | | (146,428 | ) |
Biotechnology — (0.1)% | | | | | | | | |
ImmunoGen, Inc. | | | 16,472 | | | | (56,005 | ) |
Capital Markets — (0.1)% | | | | | | | | |
Deutsche Bank AG | | | 4,545 | | | | (89,491 | ) |
Chemicals — (0.2)% | | | | | | | | |
AgroFresh Solutions, Inc. | | | 3,654 | | | | (9,902 | ) |
Air Products & Chemicals, Inc. | | | 25 | | | | (3,512 | ) |
Platform Specialty Products Corp. | | | 253 | | | | (3,337 | ) |
Rayonier Advanced Materials, Inc. | | | 10,169 | | | | (134,841 | ) |
| | | | | | | | |
| | | | | | | | (151,592 | ) |
Communications Equipment — (0.3)% | | | | | | | | |
Ciena Corp. | | | 9,046 | | | | (238,272 | ) |
Viavi Solutions, Inc. | | | 10,666 | | | | (106,873 | ) |
| | | | | | | | |
| | | | | | | | (345,145 | ) |
Diversified Telecommunication Services — (0.3)% | | | | | | | | |
Koninklijke KPN NV | | | 24,133 | | | | (68,199 | ) |
Telefonica SA | | | 21,101 | | | | (214,807 | ) |
Telefonica SA — ADR | | | 2,563 | | | | (25,963 | ) |
| | | | | | | | |
| | | | | | | | (308,969 | ) |
Electric Utilities — (0.0)% | | | | | | | | |
Centrais Eletricas Brasileiras SA — ADR | | | 3,519 | | | | (23,155 | ) |
Electronic Equipment, Instruments & Components — (1.1)% | | | | | |
Amphenol Corp., Class A | | | 5,774 | | | | (399,619 | ) |
Corning, Inc. | | | 26,158 | | | | (722,219 | ) |
OSI Systems, Inc. | | | 226 | | | | (17,045 | ) |
| | | | | | | | |
| | | | | | | | (1,138,883 | ) |
Energy Equipment & Services — (0.9)% | | | | | | | | |
Baker Hughes, Inc. | | | 4,030 | | | | (242,928 | ) |
National Oilwell Varco, Inc. | | | 8,922 | | | | (360,627 | ) |
Schlumberger Ltd. | | | 4,453 | | | | (357,843 | ) |
Transocean Ltd. | | | 800 | | | | (11,056 | ) |
| | | | | | | | |
| | | | | | | | (972,454 | ) |
Equity Real Estate Investment Trusts (REITs) — (0.5)% | | | | | | | | |
Colony Starwood Homes | | | 2,313 | | | | (76,098 | ) |
Digital Realty Trust, Inc. | | | 3,851 | | | | (415,908 | ) |
| | | | | | | | |
| | | | | | | | (492,006 | ) |
See Notes to Consolidated Financial Statements.
| | | | | | |
| | | BLACKROCK MULTI-MANAGER ALTERNATIVE STRATEGIES FUND | | FEBRUARY 28, 2017 | | 13 |
| | | | |
| Consolidated Schedule of Investments (continued) | | | | |
| | | | |
| | | | | | | | |
| Common Stocks | | Shares | | | Value | |
Food Products — (1.5)% | �� | | | | | | | |
General Mills, Inc. | | | 7,116 | | | $ | (429,593 | ) |
Hormel Foods Corp | | | 12,089 | | | | (426,137 | ) |
Hostess Brands, Inc. | | | 2,500 | | | | (38,075 | ) |
Kraft Heinz Co. | | | 7,499 | | | | (686,233 | ) |
Mondelez International, Inc., Class A | | | 143 | | | | (6,281 | ) |
Nomad Foods Ltd. | | | 208 | | | | (2,238 | ) |
| | | | | | | | |
| | | | | | | | (1,588,557 | ) |
Hotels, Restaurants & Leisure — (0.7)% | | | | | | | | |
Carnival Corp. | | | 1,324 | | | | (74,078 | ) |
Chipotle Mexican Grill, Inc. | | | 17 | | | | (7,119 | ) |
Ctrip.com International Ltd. — ADR | | | 3,582 | | | | (169,930 | ) |
Del Taco Restaurants, Inc. | | | 34,125 | | | | (423,491 | ) |
Restaurant Brands International, Inc. | | | 244 | | | | (13,347 | ) |
| | | | | | | | |
| | | | | | | | (687,965 | ) |
Household Durables — (0.1)% | | | | | | | | |
William Lyon Homes, Class A | | | 7,767 | | | | (143,146 | ) |
Household Products — (0.0)% | | | | | | | | |
Central Garden & Pet Co. | | | 427 | | | | (14,411 | ) |
Industrial Conglomerates — (0.2)% | | | | | | | | |
General Electric Co. | | | 6,532 | | | | (194,719 | ) |
Insurance — (0.2)% | | | | | | | | |
Crawford & Co., Class B | | | 16,036 | | | | (173,510 | ) |
Power Financial Corp. | | | 376 | | | | (9,752 | ) |
| | | | | | | | |
| | | | | | | | (183,262 | ) |
Internet & Direct Marketing Retail — (0.0)% | | | | | | | | |
Vipshop Holdings Ltd. — ADR | | | 2,170 | | | | (28,232 | ) |
Internet Software & Services — (0.2)% | | | | | | | | |
Alibaba Group Holding Ltd. — ADR | | | 1,987 | | | | (204,462 | ) |
SINA Corp. | | | 163 | | | | (11,333 | ) |
Tencent Holdings Ltd. — ADR | | | 848 | | | | (22,523 | ) |
| | | | | | | | |
| | | | | | | | (238,318 | ) |
IT Services — (1.2)% | | | | | | | | |
Infosys Ltd. — ADR | | | 34,150 | | | | (517,031 | ) |
International Business Machines Corp. | | | 4,043 | | | | (727,012 | ) |
| | | | | | | | |
| | | | | | | | (1,244,043 | ) |
Machinery — (0.2)% | | | | | | | | |
Blue Bird Corp. | | | 12,959 | | | | (220,303 | ) |
Media — (0.5)% | | | | | | | | |
Altice NV, Class A | | | 2,197 | | | | (46,388 | ) |
CBS Corp. | | | 349 | | | | (23,006 | ) |
DISH Network Corp., Class A | | | 1,655 | | | | (102,610 | ) |
Hemisphere Media Group, Inc. | | | 3,906 | | | | (45,310 | ) |
Liberty Broadband Corp., Class C | | | 1,056 | | | | (90,753 | ) |
Liberty Global PLC LiLAC, Class A | | | 2,140 | | | | (52,323 | ) |
Liberty Media Group LLC, Class C | | | 3,817 | | | | (117,182 | ) |
Liberty SiriusXM Group, Class C | | | 206 | | | | (8,020 | ) |
Twenty-First Century Fox, Inc., Class A | | | 1,403 | | | | (41,978 | ) |
| | | | | | | | |
| | | | | | | | (527,570 | ) |
Metals & Mining — (0.3)% | | | | | | | | |
BHP Billiton PLC — ADR | | | 1,600 | | | | (60,512 | ) |
Franco-Nevada Corp. | | | 1,205 | | | | (77,669 | ) |
Vale SA — ADR | | | 12,556 | | | | (123,677 | ) |
| | | | | | | | |
| | | | | | | | (261,858 | ) |
| | | | | | | | |
| Common Stocks | | Shares | | | Value | |
Multi-Utilities — (0.2)% | | | | | | | | |
Black Hills Corp | | | 974 | | | $ | (63,193 | ) |
Dominion Resources, Inc. | | | 1,673 | | | | (129,892 | ) |
| | | | | | | | |
| | | | | | | | (193,085 | ) |
Oil, Gas & Consumable Fuels — (2.1)% | | | | | | | | |
Anadarko Petroleum Corp. | | | 211 | | | | (13,641 | ) |
Apache Corp. | | | 3,564 | | | | (187,431 | ) |
Centennial Resource Development, Inc., Class A | | | 28,857 | | | | (542,800 | ) |
Chesapeake Energy Corp. | | | 8,905 | | | | (48,532 | ) |
Chevron Corp. | | | 1,680 | | | | (189,000 | ) |
EOG Resources, Inc. | | | 2,605 | | | | (252,659 | ) |
Exxon Mobil Corp. | | | 1,010 | | | | (82,133 | ) |
Golar LNG Ltd. | | | 2,584 | | | | (70,569 | ) |
Marathon Oil Corp. | | | 10,558 | | | | (168,928 | ) |
Noble Energy, Inc. | | | 544 | | | | (19,807 | ) |
Occidental Petroleum Corp. | | | 6,125 | | | | (401,494 | ) |
Petroleo Brasileiro SA — ADR | | | 1,363 | | | | (12,799 | ) |
Royal Dutch Shell PLC, Class B — ADR | | | 1,514 | | | | (83,270 | ) |
WPX Energy, Inc. | | | 9,638 | | | | (124,330 | ) |
| | | | | | | | |
| | | | | | | | (2,197,393 | ) |
Personal Products — (0.1)% | | | | | | | | |
Unilever NV, NY Shares | | | 1,044 | | | | (49,413 | ) |
Pharmaceuticals — (0.5)% | | | | | | | | |
Allergan PLC | | | 1,205 | | | | (295,008 | ) |
Bayer AG | | | 1,633 | | | | (179,741 | ) |
Valeant Pharmaceuticals International, Inc. | | | 135 | | | | (1,941 | ) |
| | | | | | | | |
| | | | | | | | (476,690 | ) |
Real Estate Management & Development — (0.0)% | | | | | | | | |
Howard Hughes Corp. | | | 23 | | | | (2,677 | ) |
Road & Rail — (0.1)% | | | | | | | | |
Union Pacific Corp. | | | 1,225 | | | | (132,227 | ) |
Semiconductors & Semiconductor Equipment — (0.2)% | | | | | | | | |
Intel Corp. | | | 4,665 | | | | (168,873 | ) |
NVIDIA Corp. | | | 498 | | | | (50,537 | ) |
| | | | | | | | |
| | | | | | | | (219,410 | ) |
Software — (1.4)% | | | | | | | | |
Activision Blizzard, Inc. | | | 11,127 | | | | (502,162 | ) |
Electronic Arts, Inc. | | | 6,511 | | | | (563,203 | ) |
Workday, Inc., Class A | | | 4,698 | | | | (389,605 | ) |
| | | | | | | | |
| | | | | | | | (1,454,970 | ) |
Technology Hardware, Storage & Peripherals — (0.0)% | | | | | | | | |
Eastman Kodak Co. | | | 885 | | | | (12,700 | ) |
Textiles, Apparel & Luxury Goods — (0.1)% | | | | | | | | |
LVMH Moet Hennessy Louis Vuitton SE | | | 108 | | | | (21,695 | ) |
Under Armour, Inc., Class A | | | 2,887 | | | | (59,530 | ) |
| | | | | | | | |
| | | | | | | | (81,225 | ) |
Thrifts & Mortgage Finance — (0.0)% | | | | | | | | |
Federal National Mortgage Association | | | 721 | | | | (2,125 | ) |
Tobacco — (0.2)% | | | | | | | | |
British American Tobacco PLC — ADR | | | 3,864 | | | | (246,678 | ) |
Total Common Stocks — (16.8)% | | | | | | | (17,475,685 | ) |
| | | | | | | | |
| | | | | | | |
See Notes to Consolidated Financial Statements.
| | | | | | |
| 14 | | BLACKROCK MULTI-MANAGER ALTERNATIVE STRATEGIES FUND | | FEBRUARY 28, 2017 | | |
| | | | |
| Consolidated Schedule of Investments (continued) | | | | |
| | | | |
| | | | | | | | | | |
| Corporate Bonds | | | | Par
(000) | | | Value | |
Banks — (0.3)% | | | | | | | | | | |
Canadian Western Bank, 3.46%, 12/17/24 (b) | | CAD | | | 359 | | | $ | (278,094 | ) |
Health Care Providers & Services — (0.5)% | | | | | | | | | | |
CHS/Community Health Systems, Inc.: | | | | | | | | | | |
8.00%, 11/15/19 | | USD | | | 28 | | | | (27,370 | ) |
5.13%, 8/01/21 | | | | | 78 | | | | (76,635 | ) |
Kindred Healthcare, Inc., 8.75%, 1/15/23 | | | | | 500 | | | | (485,625 | ) |
| | | | | | | | | | |
| | | | | | | | | | (589,630 | ) |
Independent Power and Renewable Electricity Producers — (0.4)% | | | | | |
GenOn Energy, Inc., 9.88%, 10/15/20 | | | | | 301 | | | | (221,235 | ) |
NRG Energy, Inc., 6.63%, 1/15/27 (a) | | | | | 250 | | | | (245,625 | ) |
| | | | | | | | | | |
| | | | | | | | | | (466,860 | ) |
Metals & Mining — (0.2)% | | | | | | | | | | |
Freeport-McMoRan, Inc., 3.55%, 3/01/22 | | | | | 205 | | | | (190,394 | ) |
Oil, Gas & Consumable Fuels — (0.4)% | | | | | | | | | | |
Continental Resources, Inc., 4.50%, 4/15/23 | | | | | 400 | | | | (392,000 | ) |
Pharmaceuticals — (0.4)% | | | | | | | | | | |
Horizon Pharma Financing, Inc., 6.63%, 5/01/23 | | | | | 200 | | | | (194,900 | ) |
Horizon Pharma Investment Ltd., 2.50%, 3/15/22 (g) | | | | | 200 | | | | (187,375 | ) |
| | | | | | | | | | |
| | | | | | | | | | (382,275 | ) |
Total Corporate Bonds — (2.2)% | | | | | | | | | (2,299,253 | ) |
| | | | | | | | | | |
| | | | | | | | | |
| | | | | | | | | | | | |
| Investment Companies | | | | | Shares | | | Value | |
Direxion Daily Gold Miners Index Bull 3X Shares | | | | | | | 5,000 | | | $ | (47,400 | ) |
iShares Edge MSCI Min Vol USA ETF (j) | | | | | | | 1,016 | | | | (48,636 | ) |
iShares MSCI Emerging Markets ETF (j) | | | | | | | 9,400 | | | | (357,106 | ) |
iShares MSCI Switzerland Capped ETF (j) | | | | | | | 1,105 | | | | (34,299 | ) |
iShares MSCI Turkey ETF (j) | | | | | | | 378 | | | | (13,283 | ) |
SPDR Bloomberg Barclays High Yield Bond ETF | | | | | | | 7,630 | | | | (283,989 | ) |
SPDR EURO STOXX 50 ETF | | | | | | | 4,014 | | | | (137,239 | ) |
VanEck Vectors Junior Gold Miners ETF | | | | | | | 747 | | | | (27,587 | ) |
Total Investment Companies — (0.9)% | | | | | | | | | | | (949,539 | ) |
| | | | | | | | | | | | |
| | | | | | | | | | |
| U.S. Treasury Obligations | | | | | Par
(000) | | | | |
U.S. Treasury Bonds, 2.88%, 11/15/46 | | | USD | | | | 318 | | | | (311,924 | ) |
U.S. Treasury Notes, 2.25%, 2/15/27 | | | | | | | 352 | | | | (348,307 | ) |
Total U.S. Treasury Obligations — (0.7)% | | | | | | | | | | | (660,231 | ) |
Total Investments Sold Short
(Proceeds — $20,361,710) — (20.6)% | | | | | | | | | | | (21,384,708 | ) |
Total Investments Net of Options Written and Investments Sold Short — 71.8% | | | | | | | | | | | 74,742,466 | |
Other Assets Less Liabilities — 28.2% | | | | | | | | | | | 29,324,249 | |
| | | | | | | | | | | | |
Net Assets — 100.0% | | | | | | | | | | $ | 104,066,715 | |
| | | | | | | | | | | | |
|
| Notes to Consolidated Schedule of Investments |
| (a) | Security exempt from registration pursuant to Rule 144A under the Securities Act of 1933, as amended. These securities may be resold in transactions exempt from registration to qualified institutional investors. |
| (b) | Variable rate security. Rate as of period end. |
| (c) | Step-up bond that pays an initial coupon rate for the first period and then a higher coupon rate for the following periods. Rate as of period end. |
| (d) | All or a portion of security has been pledged as collateral in connection with short sales. |
| (e) | Non-income producing security. |
| (f) | All or a portion of security has been pledged and/or segregated as collateral in connection with outstanding exchange-traded options written. |
| (h) | Issuer filed for bankruptcy and/or is in default. |
| (j) | During the six months ended February 28, 2017, investments in issuers considered to be affiliates of the Fund for purposes of Section 2(a)(3) of the Investment Company Act of 1940, as amended, were as follows: |
| | | | | | | | | | | | | | | | | | | | | | | | | | | | | | | | |
| Affiliate | | Shares Held at
August 31,
2016 | | | Shares
Purchased | | | Shares
Sold | | | Shares Held at
February 28,
2017 | | | Value at
February 28,
2017 | | | Income | | | Net Realized
Gain (Loss)
Capital Gains1 | | | Change in
Unrealized
Appreciation
(Depreciation) | |
BlackRock Event Driven Equity Fund, Institutional Class | | | 584,112 | | | | 117,257 | | | | — | | | | 701,369 | | | $ | 6,354,405 | | | | — | | | $ | 57,529 | | | $ | 211,475 | |
BlackRock Liquidity Funds, T-Fund, Institutional Class | | | 29,519,401 | | | | 802,727 | 2 | | | — | | | | 30,322,128 | | | | 30,322,128 | | | $ | 43,010 | | | | 143 | | | | — | |
iShares 20+ Year Treasury Bond ETF | | | — | | | | 3,988 | | | | (3,988 | ) | | | — | | | | — | | | | 262 | | | | 3,379 | | | | — | |
iShares Edge MSCI Min Vol USA ETF | | | — | | | | 6,200 | | | | (6,200 | ) | | | — | | | | — | | | | 1,510 | | | | (5,025 | ) | | | — | |
iShares Edge MSCI USA Momentum Factor ETF | | | — | | | | 484 | | | | (484 | ) | | | — | | | | — | | | | — | | | | 871 | | | | — | |
iShares MSCI Emerging Markets ETF | | | — | | | | 900 | | | | (900 | ) | | | — | | | | — | | | | — | | | | 555 | | | | — | |
iShares U.S. Preferred Stock ETF | | | 299 | | | | — | | | | (299 | ) | | | — | | | | — | | | | 270 | | | | (781 | ) | | | 2 | |
Total | | | | | | | | | | | | | | | | | | $ | 36,676,533 | | | $ | 45,052 | | | $ | 56,671 | | | $ | 211,477 | |
| | | | | | | | | | | | | | | | | | | | |
See Notes to Consolidated Financial Statements.
| | | | | | |
| | | BLACKROCK MULTI-MANAGER ALTERNATIVE STRATEGIES FUND | | FEBRUARY 28, 2017 | | 15 |
| | | | |
| Consolidated Schedule of Investments (continued) | | | | |
| | | | | | | | | | | | | | | | | | | | | | | | | | | | | | | | |
| Affiliate Investments Sold Short | | Shares Held at
August 31,
2016 | | | Shares
Purchased | | | Shares
Sold | | | Shares Held at
February 28,
2017 | | | Value at
February 28,
2017 | | | Expense | | | Net
Realized
Gain (Loss)1 | | | Change in
Unrealized
Appreciation
(Depreciation) | |
iShares 20+ Year Treasury Bond ETF | | | — | | | | 1,312 | | | | (1,312 | ) | | | — | | | | — | | | | — | | | $ | (2,414 | ) | | | — | |
iShares China Large-Cap ETF | | | — | | | | 8,582 | | | | (8,582 | ) | | | — | | | | — | | | $ | (207 | ) | | | 6,640 | | | | — | |
iShares Edge MSCI Min Vol USA ETF | | | (9,316 | ) | | | 8,300 | | | | — | | | | (1,016 | ) | | $ | (48,636 | ) | | | (2,586 | ) | | | 14,300 | | | $ | (897 | ) |
iShares iBoxx $ High Yield Corporate Bond ETF | | | (6,600 | ) | | | 6,600 | | | | — | | | | — | | | | — | | | | (8,767 | ) | | | (20,629 | ) | | | 26,476 | |
iShares MSCI Emerging Markets ETF | | | — | | | | 1,500 | | | | (10,900 | ) | | | (9,400 | ) | | | (357,106 | ) | | | (119 | ) | | | 740 | | | | (8,010 | ) |
iShares MSCI Switzerland Capped ETF | | | — | | | | 160 | | | | (1,265 | ) | | | (1,105 | ) | | | (34,299 | ) | | | (23 | ) | | | (375 | ) | | | (2,588 | ) |
iShares Turkey ETF | | | — | | | | 6 | | | | (384 | ) | | | (378 | ) | | | (13,283 | ) | | | — | | | | (12 | ) | | | (346 | ) |
Total | | | | | | | | | | | | | | | | | | $ | (453,324 | ) | | $ | (11,702 | ) | | $ | (1,750 | ) | | $ | 14,635 | |
| | | | | | | | | | | | | | | | | | | | |
| | 1 | | Includes net capital gain distributions. |
| | 2 | | Represents net shares purchased. |
| (k) | All or a portion of security is held by a wholly-owned subsidiary. See Note 1 of the Notes to Consolidated Financial Statements for details on the wholly-owned subsidiary. |
| (l) | Other interests represent beneficial interests in liquidation trusts and other reorganization or private entities. |
| (m) | Perpetual security with no stated maturity date. |
| (n) | Current yield as of period end. |
| (o) | Amount is less than USD 500. |
| • | | For Fund compliance purposes, the Fund’s industry classifications refer to one or more of the industry sub-classifications used by one or more widely recognized market indexes or ratings group indexes, and/or as defined by the investment adviser. These definitions may not apply for purposes of this report, which may combine such industry sub-classifications for reporting ease. |
|
| Derivative Financial Instruments Outstanding as of Period End |
| | | | | | | | | | | | | | |
| Futures Contracts | | | | | | | | | | |
Contracts Long (Short) | | Issue | | Expiration | | Notional Value | | | Unrealized
Appreciation
(Depreciation) | |
| 1 | | Amsterdam Exchanges Index | | March 2017 | | USD | | | 104,944 | | | $ | 116 | |
| (19) | | ASX SPI 200 Index | | March 2017 | | USD | | | 2,070,016 | | | | (4,147 | ) |
| (31) | | Australian Government Bonds (10 Year) | | March 2017 | | USD | | | 3,048,113 | | | | (13,494 | ) |
| (34) | | Australian Government Bonds (3 Year) | | March 2017 | | USD | | | 2,909,742 | | | | (1,619 | ) |
| (8) | | CAC 40 10 Euro Index | | March 2017 | | USD | | | 411,725 | | | | 4,306 | |
| 12 | | DAX Index | | March 2017 | | USD | | | 3,765,216 | | | | 35,486 | |
| 29 | | E-mini Dow ($5) - CBOT | | March 2017 | | USD | | | 3,017,015 | | | | 140,863 | |
| 23 | | Euro STOXX 50 Index | | March 2017 | | USD | | | 809,933 | | | | (1,710 | ) |
| (53) | | Euro-Bobl | | March 2017 | | USD | | | 7,564,851 | | | | (109,159 | ) |
| (53) | | Euro-Bund | | March 2017 | | USD | | | 9,323,414 | | | | (137,900 | ) |
| (134) | | Euro-Schatz | | March 2017 | | USD | | | 15,990,338 | | | | (60,011 | ) |
| (3) | | FTSE/MIB Index | | March 2017 | | USD | | | 300,690 | | | | 2,669 | |
| 2 | | Hang Seng Index | | March 2017 | | USD | | | 305,839 | | | | (3,595 | ) |
| 11 | | NASDAQ 100 E-Mini Index | | March 2017 | | USD | | | 1,173,095 | | | | 24,536 | |
| (8) | | Nikkei 225 Index | | March 2017 | | USD | | | 1,362,232 | | | | 8,879 | |
| 23 | | OMX Nordic Exchange | | March 2017 | | USD | | | 397,428 | | | | (37 | ) |
| (4) | | Russell 2000 Mini Index | | March 2017 | | USD | | | 277,000 | | | | 2,638 | |
| 2 | | S&P 500 E-Mini | | March 2017 | | USD | | | 236,280 | | | | (396 | ) |
| 10 | | S&P/Toronto Stock Exchange 60 Index | | March 2017 | | USD | | | 1,364,403 | | | | (2,260 | ) |
| (4) | | SGX MSCI Singapore Index | | March 2017 | | USD | | | 98,287 | | | | 597 | |
| 7 | | TOPIX Index | | March 2017 | | USD | | | 955,806 | | | | 572 | |
| (4) | | 30 Day Fed Fund | | April 2017 | | USD | | | 1,654,216 | | | | 582 | |
| (2) | | 3-month Euro Swiss Franc Interest Rate | | June 2017 | | USD | | | 501,967 | | | | (150 | ) |
| (1) | | 3-month EuroYen | | June 2017 | | USD | | | 222,395 | | | | (22 | ) |
| (11) | | ASX 90 Day Bank Accepted Bills | | June 2017 | | USD | | | 8,397,063 | | | | (171 | ) |
| (10) | | Canadian Bankers Acceptance | | June 2017 | | USD | | | 1,864,083 | | | | (472 | ) |
| (41) | | Canadian Government Bonds (10 Year) | | June 2017 | | USD | | | 4,239,836 | | | | (28,303 | ) |
| 33 | | Long Gilt British | | June 2017 | | USD | | | 5,209,816 | | | | 69,109 | |
| 16 | | U.S. Treasury Bonds (30 Year) | | June 2017 | | USD | | | 2,426,500 | | | | 10,980 | |
| (115) | | U.S. Treasury Notes (2 Year) | | June 2017 | | USD | | | 24,886,719 | | | | (12,232 | ) |
| (14) | | U.S. Treasury Notes (5 Year) | | June 2017 | | USD | | | 1,647,844 | | | | (1,074 | ) |
| 121 | | U.S. Treasury Notes (10 Year) | | June 2017 | | USD | | | 15,073,953 | | | | 38,345 | |
See Notes to Consolidated Financial Statements.
| | | | | | |
| 16 | | BLACKROCK MULTI-MANAGER ALTERNATIVE STRATEGIES FUND | | FEBRUARY 28, 2017 | | |
| | | | |
| Consolidated Schedule of Investments (continued) | | | | |
| | | | | | | | | | | | | | | | | | |
Contracts Long (Short) | | Issue | | Expiration | | | Notional Value | | | Unrealized
Appreciation
(Depreciation) | |
| (18) | | 3-month EURIBOR | | | December 2017 | | | | USD | | | | 4,779,936 | | | $ | (691 | ) |
| (136) | | Euro Dollar | | | December 2017 | | | | USD | | | | 33,469,600 | | | | (5,378 | ) |
| (23) | | Three Month Sterling | | | December 2017 | | | | USD | | | | 3,552,814 | | | | (2,765 | ) |
Total | | | | | | | | | | | | | | | | $ | (45,908 | ) |
| | | | | | | | | | | | | | | | | | |
| | | | | | | | | | | | | | | | | | | | | | | | |
| Forward Foreign Currency Exchange Contracts | | | | | | |
Currency Purchased | | | | | | Currency Sold | | | Counterparty | | Settlement
Date | | | Unrealized
Appreciation
(Depreciation) | |
| USD | | | 262,008 | | | | | | | CAD | | | 345,000 | | | J.P. Morgan Securities LLC | | | 3/09/17 | | | $ | 2,241 | |
| AUD | | | 712 | | | | | | | USD | | | 512 | | | JPMorgan Chase Bank N.A. | | | 3/15/17 | | | | 33 | |
| AUD | | | 2,455 | | | | | | | USD | | | 1,859 | | | JPMorgan Chase Bank N.A. | | | 3/15/17 | | | | 22 | |
| AUD | | | 7,768 | | | | | | | USD | | | 5,653 | | | JPMorgan Chase Bank N.A. | | | 3/15/17 | | | | 300 | |
| AUD | | | 13,082 | | | | | | | USD | | | 9,877 | | | JPMorgan Chase Bank N.A. | | | 3/15/17 | | | | 149 | |
| AUD | | | 29,628 | | | | | | | USD | | | 22,576 | | | JPMorgan Chase Bank N.A. | | | 3/15/17 | | | | 132 | |
| AUD | | | 45,500 | | | | | | | USD | | | 34,747 | | | JPMorgan Chase Bank N.A. | | | 3/15/17 | | | | 126 | |
| AUD | | | 59,625 | | | | | | | USD | | | 45,032 | | | JPMorgan Chase Bank N.A. | | | 3/15/17 | | | | 666 | |
| AUD | | | 71,297 | | | | | | | USD | | | 54,826 | | | JPMorgan Chase Bank N.A. | | | 3/15/17 | | | | (183 | ) |
| AUD | | | 72,804 | | | | | | | USD | | | 55,704 | | | JPMorgan Chase Bank N.A. | | | 3/15/17 | | | | 94 | |
| AUD | | | 104,629 | | | | | | | USD | | | 78,910 | | | JPMorgan Chase Bank N.A. | | | 3/15/17 | | | | 1,280 | |
| AUD | | | 108,048 | | | | | | | USD | | | 82,329 | | | JPMorgan Chase Bank N.A. | | | 3/15/17 | | | | 481 | |
| AUD | | | 120,020 | | | | | | | USD | | | 90,932 | | | JPMorgan Chase Bank N.A. | | | 3/15/17 | | | | 1,053 | |
| AUD | | | 201,962 | | | | | | | USD | | | 147,668 | | | JPMorgan Chase Bank N.A. | | | 3/15/17 | | | | 7,120 | |
| AUD | | | 219,326 | | | | | | | USD | | | 168,174 | | | JPMorgan Chase Bank N.A. | | | 3/15/17 | | | | (78 | ) |
| AUD | | | 277,345 | | | | | | | USD | | | 212,568 | | | JPMorgan Chase Bank N.A. | | | 3/15/17 | | | | (5 | ) |
| AUD | | | 412,018 | | | | | | | USD | | | 296,254 | | | JPMorgan Chase Bank N.A. | | | 3/15/17 | | | | 19,525 | |
| AUD | | | 520,733 | | | | | | | USD | | | 378,978 | | | JPMorgan Chase Bank N.A. | | | 3/15/17 | | | | 20,122 | |
| AUD | | | 908,682 | | | | | | | USD | | | 666,249 | | | JPMorgan Chase Bank N.A. | | | 3/15/17 | | | | 30,182 | |
| CAD | | | 4,613 | | | | | | | USD | | | 3,475 | | | JPMorgan Chase Bank N.A. | | | 3/15/17 | | | | (2 | ) |
| CAD | | | 25,754 | | | | | | | USD | | | 18,993 | | | JPMorgan Chase Bank N.A. | | | 3/15/17 | | | | 399 | |
| CAD | | | 27,230 | | | | | | | USD | | | 20,267 | | | JPMorgan Chase Bank N.A. | | | 3/15/17 | | | | 237 | |
| CAD | | | 33,384 | | | | | | | USD | | | 25,539 | | | JPMorgan Chase Bank N.A. | | | 3/15/17 | | | | (401 | ) |
| CAD | | | 34,032 | | | | | | | USD | | | 25,967 | | | JPMorgan Chase Bank N.A. | | | 3/15/17 | | | | (342 | ) |
| CAD | | | 59,486 | | | | | | | USD | | | 45,408 | | | JPMorgan Chase Bank N.A. | | | 3/15/17 | | | | (616 | ) |
| CAD | | | 68,663 | | | | | | | USD | | | 51,728 | | | JPMorgan Chase Bank N.A. | | | 3/15/17 | | | | (26 | ) |
| CAD | | | 70,059 | | | | | | | USD | | | 53,246 | | | JPMorgan Chase Bank N.A. | | | 3/15/17 | | | | (492 | ) |
| CAD | | | 70,191 | | | | | | | USD | | | 53,616 | | | JPMorgan Chase Bank N.A. | | | 3/15/17 | | | | (763 | ) |
| CAD | | | 76,190 | | | | | | | USD | | | 58,277 | | | JPMorgan Chase Bank N.A. | | | 3/15/17 | | | | (907 | ) |
| CAD | | | 84,648 | | | | | | | USD | | | 64,560 | | | JPMorgan Chase Bank N.A. | | | 3/15/17 | | | | (822 | ) |
| CAD | | | 99,499 | | | | | | | USD | | | 76,291 | | | JPMorgan Chase Bank N.A. | | | 3/15/17 | | | | (1,370 | ) |
| CAD | | | 100,725 | | | | | | | USD | | | 77,231 | | | JPMorgan Chase Bank N.A. | | | 3/15/17 | | | | (1,386 | ) |
| CAD | | | 119,673 | | | | | | | USD | | | 91,851 | | | JPMorgan Chase Bank N.A. | | | 3/15/17 | | | | (1,739 | ) |
| CAD | | | 121,765 | | | | | | | USD | | | 93,493 | | | JPMorgan Chase Bank N.A. | | | 3/15/17 | | | | (1,806 | ) |
| CAD | | | 129,627 | | | | | | | USD | | | 99,586 | | | JPMorgan Chase Bank N.A. | | | 3/15/17 | | | | (1,979 | ) |
| CAD | | | 141,393 | | | | | | | USD | | | 108,149 | | | JPMorgan Chase Bank N.A. | | | 3/15/17 | | | | (1,683 | ) |
| CAD | | | 149,712 | | | | | | | USD | | | 112,729 | | | JPMorgan Chase Bank N.A. | | | 3/15/17 | | | | 2 | |
| CAD | | | 151,087 | | | | | | | USD | | | 114,945 | | | JPMorgan Chase Bank N.A. | | | 3/15/17 | | | | (1,179 | ) |
| CAD | | | 151,449 | | | | | | | USD | | | 116,284 | | | JPMorgan Chase Bank N.A. | | | 3/15/17 | | | | (2,246 | ) |
See Notes to Consolidated Financial Statements.
| | | | | | |
| | | BLACKROCK MULTI-MANAGER ALTERNATIVE STRATEGIES FUND | | FEBRUARY 28, 2017 | | 17 |
| | | | |
| Consolidated Schedule of Investments (continued) | | | | |
| | | | | | | | | | | | | | | | | | | | | | | | |
Currency Purchased | | | | | | Currency Sold | | | Counterparty | | Settlement
Date | | | Unrealized
Appreciation
(Depreciation) | |
| CAD | | | 163,721 | | | | | | | USD | | | 125,247 | | | JPMorgan Chase Bank N.A. | | | 3/15/17 | | | $ | (1,968 | ) |
| CAD | | | 172,190 | | | | | | | USD | | | 128,962 | | | JPMorgan Chase Bank N.A. | | | 3/15/17 | | | | 694 | |
| CAD | | | 210,939 | | | | | | | USD | | | 162,053 | | | JPMorgan Chase Bank N.A. | | | 3/15/17 | | | | (3,220 | ) |
| CAD | | | 217,710 | | | | | | | USD | | | 165,921 | | | JPMorgan Chase Bank N.A. | | | 3/15/17 | | | | (1,988 | ) |
| CAD | | | 218,249 | | | | | | | USD | | | 165,565 | | | JPMorgan Chase Bank N.A. | | | 3/15/17 | | | | (1,227 | ) |
| CAD | | | 227,493 | | | | | | | USD | | | 173,507 | | | JPMorgan Chase Bank N.A. | | | 3/15/17 | | | | (2,209 | ) |
| CAD | | | 245,570 | | | | | | | USD | | | 186,827 | | | JPMorgan Chase Bank N.A. | | | 3/15/17 | | | | (1,917 | ) |
| CAD | | | 258,213 | | | | | | | USD | | | 190,426 | | | JPMorgan Chase Bank N.A. | | | 3/15/17 | | | | 4,005 | |
| CAD | | | 341,840 | | | | | | | USD | | | 255,224 | | | JPMorgan Chase Bank N.A. | | | 3/15/17 | | | | 2,176 | |
| CAD | | | 358,141 | | | | | | | USD | | | 267,989 | | | JPMorgan Chase Bank N.A. | | | 3/15/17 | | | | 1,685 | |
| CAD | | | 369,928 | | | | | | | USD | | | 275,330 | | | JPMorgan Chase Bank N.A. | | | 3/15/17 | | | | 3,220 | |
| CAD | | | 435,535 | | | | | | | USD | | | 332,321 | | | JPMorgan Chase Bank N.A. | | | 3/15/17 | | | | (4,371 | ) |
| CAD | | | 444,478 | | | | | | | USD | | | 338,280 | | | JPMorgan Chase Bank N.A. | | | 3/15/17 | | | | (3,595 | ) |
| CAD | | | 474,063 | | | | | | | USD | | | 360,293 | | | JPMorgan Chase Bank N.A. | | | 3/15/17 | | | | (3,331 | ) |
| CAD | | | 541,675 | | | | | | | USD | | | 402,450 | | | JPMorgan Chase Bank N.A. | | | 3/15/17 | | | | 5,422 | |
| CAD | | | 583,368 | | | | | | | USD | | | 444,052 | | | JPMorgan Chase Bank N.A. | | | 3/15/17 | | | | (4,786 | ) |
| CAD | | | 775,744 | | | | | | | USD | | | 588,483 | | | JPMorgan Chase Bank N.A. | | | 3/15/17 | | | | (4,360 | ) |
| CAD | | | 870,415 | | | | | | | USD | | | 662,867 | | | JPMorgan Chase Bank N.A. | | | 3/15/17 | | | | (7,458 | ) |
| CAD | | | 948,581 | | | | | | | USD | | | 724,981 | | | JPMorgan Chase Bank N.A. | | | 3/15/17 | | | | (10,715 | ) |
| CAD | | | 1,005,336 | | | | | | | USD | | | 747,658 | | | JPMorgan Chase Bank N.A. | | | 3/15/17 | | | | 9,343 | |
| CAD | | | 1,171,050 | | | | | | | USD | | | 882,218 | | | JPMorgan Chase Bank N.A. | | | 3/15/17 | | | | (436 | ) |
| CAD | | | 1,314,426 | | | | | | | USD | | | 990,000 | | | JPMorgan Chase Bank N.A. | | | 3/15/17 | | | | (259 | ) |
| CAD | | | 2,230,355 | | | | | | | USD | | | 1,703,669 | | | JPMorgan Chase Bank N.A. | | | 3/15/17 | | | | (24,248 | ) |
| EUR | | | 7,069 | | | | | | | USD | | | 7,371 | | | JPMorgan Chase Bank N.A. | | | 3/15/17 | | | | 124 | |
| EUR | | | 7,387 | | | | | | | USD | | | 7,796 | | | JPMorgan Chase Bank N.A. | | | 3/15/17 | | | | 36 | |
| EUR | | | 38,068 | | | | | | | USD | | | 39,948 | | | JPMorgan Chase Bank N.A. | | | 3/15/17 | | | | 411 | |
| EUR | | | 51,105 | | | | | | | USD | | | 54,111 | | | JPMorgan Chase Bank N.A. | | | 3/15/17 | | | | 70 | |
| EUR | | | 75,106 | | | | | | | USD | | | 80,906 | | | JPMorgan Chase Bank N.A. | | | 3/15/17 | | | | (1,279 | ) |
| EUR | | | 76,686 | | | | | | | USD | | | 79,948 | | | JPMorgan Chase Bank N.A. | | | 3/15/17 | | | | 1,354 | |
| EUR | | | 81,418 | | | | | | | USD | | | 87,643 | | | JPMorgan Chase Bank N.A. | | | 3/15/17 | | | | (1,325 | ) |
| EUR | | | 109,581 | | | | | | | USD | | | 114,624 | | | JPMorgan Chase Bank N.A. | | | 3/15/17 | | | | 1,552 | |
| EUR | | | 118,049 | | | | | | | USD | | | 125,333 | | | JPMorgan Chase Bank N.A. | | | 3/15/17 | | | | (178 | ) |
| EUR | | | 122,844 | | | | | | | USD | | | 131,040 | | | JPMorgan Chase Bank N.A. | | | 3/15/17 | | | | (802 | ) |
| EUR | | | 141,978 | | | | | | | USD | | | 149,834 | | | JPMorgan Chase Bank N.A. | | | 3/15/17 | | | | 690 | |
| EUR | | | 152,858 | | | | | | | USD | | | 163,056 | | | JPMorgan Chase Bank N.A. | | | 3/15/17 | | | | (998 | ) |
| EUR | | | 160,756 | | | | | | | USD | | | 171,558 | | | JPMorgan Chase Bank N.A. | | | 3/15/17 | | | | (1,125 | ) |
| EUR | | | 194,801 | | | | | | | USD | | | 209,424 | | | JPMorgan Chase Bank N.A. | | | 3/15/17 | | | | (2,898 | ) |
| EUR | | | 216,493 | | | | | | | USD | | | 230,129 | | | JPMorgan Chase Bank N.A. | | | 3/15/17 | | | | (605 | ) |
| EUR | | | 235,199 | | | | | | | USD | | | 250,749 | | | JPMorgan Chase Bank N.A. | | | 3/15/17 | | | | (1,393 | ) |
| EUR | | | 266,804 | | | | | | | USD | | | 282,884 | | | JPMorgan Chase Bank N.A. | | | 3/15/17 | | | | (20 | ) |
| EUR | | | 278,595 | | | | | | | USD | | | 298,439 | | | JPMorgan Chase Bank N.A. | | | 3/15/17 | | | | (3,074 | ) |
| EUR | | | 302,237 | | | | | | | USD | | | 321,274 | | | JPMorgan Chase Bank N.A. | | | 3/15/17 | | | | (845 | ) |
| EUR | | | 350,789 | | | | | | | USD | | | 377,104 | | | JPMorgan Chase Bank N.A. | | | 3/15/17 | | | | (5,200 | ) |
| EUR | | | 352,575 | | | | | | | USD | | | 373,313 | | | JPMorgan Chase Bank N.A. | | | 3/15/17 | | | | 485 | |
| EUR | | | 399,395 | | | | | | | USD | | | 422,880 | | | JPMorgan Chase Bank N.A. | | | 3/15/17 | | | | 555 | |
| EUR | | | 441,448 | | | | | | | USD | | | 468,685 | | | JPMorgan Chase Bank N.A. | | | 3/15/17 | | | | (665 | ) |
| EUR | | | 488,423 | | | | | | | USD | | | 512,546 | | | JPMorgan Chase Bank N.A. | | | 3/15/17 | | | | 5,277 | |
| EUR | | | 527,926 | | | | | | | USD | | | 559,743 | | | JPMorgan Chase Bank N.A. | | | 3/15/17 | | | | (40 | ) |
See Notes to Consolidated Financial Statements.
| | | | | | |
| 18 | | BLACKROCK MULTI-MANAGER ALTERNATIVE STRATEGIES FUND | | FEBRUARY 28, 2017 | | |
| | | | |
| Consolidated Schedule of Investments (continued) | | | | |
| | | | | | | | | | | | | | | | | | | | | | | | |
Currency Purchased | | | | | | Currency Sold | | | Counterparty | | Settlement
Date | | | Unrealized
Appreciation
(Depreciation) | |
| EUR | | | 594,000 | | | | | | | USD | | | 636,303 | | | JPMorgan Chase Bank N.A. | | | 3/15/17 | | | $ | (6,549 | ) |
| EUR | | | 716,418 | | | | | | | USD | | | 749,391 | | | JPMorgan Chase Bank N.A. | | | 3/15/17 | | | | 10,150 | |
| EUR | | | 723,132 | | | | | | | USD | | | 774,639 | | | JPMorgan Chase Bank N.A. | | | 3/15/17 | | | | (7,980 | ) |
| EUR | | | 1,594,360 | | | | | | | USD | | | 1,662,452 | | | JPMorgan Chase Bank N.A. | | | 3/15/17 | | | | 27,876 | |
| GBP | | | 5,685 | | | | | | | USD | | | 7,101 | | | JPMorgan Chase Bank N.A. | | | 3/15/17 | | | | (44 | ) |
| GBP | | | 11,162 | | | | | | | USD | | | 13,657 | | | JPMorgan Chase Bank N.A. | | | 3/15/17 | | | | 199 | |
| GBP | | | 24,358 | | | | | | | USD | | | 30,379 | | | JPMorgan Chase Bank N.A. | | | 3/15/17 | | | | (141 | ) |
| GBP | | | 32,327 | | | | | | | USD | | | 40,567 | | | JPMorgan Chase Bank N.A. | | | 3/15/17 | | | | (438 | ) |
| GBP | | | 35,994 | | | | | | | USD | | | 45,327 | | | JPMorgan Chase Bank N.A. | | | 3/15/17 | | | | (646 | ) |
| GBP | | | 44,308 | | | | | | | USD | | | 55,303 | | | JPMorgan Chase Bank N.A. | | | 3/15/17 | | | | (301 | ) |
| GBP | | | 49,185 | | | | | | | USD | | | 61,455 | | | JPMorgan Chase Bank N.A. | | | 3/15/17 | | | | (398 | ) |
| GBP | | | 51,960 | | | | | | | USD | | | 64,751 | | | JPMorgan Chase Bank N.A. | | | 3/15/17 | | | | (249 | ) |
| GBP | | | 52,251 | | | | | | | USD | | | 65,267 | | | JPMorgan Chase Bank N.A. | | | 3/15/17 | | | | (404 | ) |
| GBP | | | 56,370 | | | | | | | USD | | | 70,693 | | | JPMorgan Chase Bank N.A. | | | 3/15/17 | | | | (717 | ) |
| GBP | | | 68,988 | | | | | | | USD | | | 84,859 | | | JPMorgan Chase Bank N.A. | | | 3/15/17 | | | | 781 | |
| GBP | | | 73,170 | | | | | | | USD | | | 89,263 | | | JPMorgan Chase Bank N.A. | | | 3/15/17 | | | | 1,568 | |
| GBP | | | 99,034 | | | | | | | USD | | | 124,198 | | | JPMorgan Chase Bank N.A. | | | 3/15/17 | | | | (1,260 | ) |
| GBP | | | 138,991 | | | | | | | USD | | | 173,664 | | | JPMorgan Chase Bank N.A. | | | 3/15/17 | | | | (1,125 | ) |
| GBP | | | 153,602 | | | | | | | USD | | | 192,032 | | | JPMorgan Chase Bank N.A. | | | 3/15/17 | | | | (1,356 | ) |
| GBP | | | 158,927 | | | | | | | USD | | | 195,638 | | | JPMorgan Chase Bank N.A. | | | 3/15/17 | | | | 1,649 | |
| GBP | | | 175,863 | | | | | | | USD | | | 220,692 | | | JPMorgan Chase Bank N.A. | | | 3/15/17 | | | | (2,381 | ) |
| GBP | | | 211,375 | | | | | | | USD | | | 256,661 | | | JPMorgan Chase Bank N.A. | | | 3/15/17 | | | | 5,733 | |
| GBP | | | 239,293 | | | | | | | USD | | | 294,568 | | | JPMorgan Chase Bank N.A. | | | 3/15/17 | | | | 2,483 | |
| GBP | | | 454,361 | | | | | | | USD | | | 557,756 | | | JPMorgan Chase Bank N.A. | | | 3/15/17 | | | | 6,274 | |
| GBP | | | 454,986 | | | | | | | USD | | | 553,147 | | | JPMorgan Chase Bank N.A. | | | 3/15/17 | | | | 11,658 | |
| GBP | | | 457,126 | | | | | | | USD | | | 569,371 | | | JPMorgan Chase Bank N.A. | | | 3/15/17 | | | | (1,909 | ) |
| GBP | | | 598,442 | | | | | | | USD | | | 738,415 | | | JPMorgan Chase Bank N.A. | | | 3/15/17 | | | | 4,473 | |
| GBP | | | 641,315 | | | | | | | USD | | | 784,650 | | | JPMorgan Chase Bank N.A. | | | 3/15/17 | | | | 11,458 | |
| GBP | | | 736,600 | | | | | | | USD | | | 911,796 | | | JPMorgan Chase Bank N.A. | | | 3/15/17 | | | | 2,596 | |
| GBP | | | 990,000 | | | | | | | USD | | | 1,225,743 | | | JPMorgan Chase Bank N.A. | | | 3/15/17 | | | | 3,212 | |
| JPY | | | 285,744 | | | | | | | USD | | | 2,452 | | | JPMorgan Chase Bank N.A. | | | 3/15/17 | | | | 93 | |
| JPY | | | 1,183,454 | | | | | | | USD | | | 10,452 | | | JPMorgan Chase Bank N.A. | | | 3/15/17 | | | | 90 | |
| JPY | | | 1,720,549 | | | | | | | USD | | | 15,176 | | | JPMorgan Chase Bank N.A. | | | 3/15/17 | | | | 149 | |
| JPY | | | 2,033,687 | | | | | | | USD | | | 17,781 | | | JPMorgan Chase Bank N.A. | | | 3/15/17 | | | | 334 | |
| JPY | | | 5,233,182 | | | | | | | USD | | | 45,878 | | | JPMorgan Chase Bank N.A. | | | 3/15/17 | | | | 736 | |
| JPY | | | 9,957,931 | | | | | | | USD | | | 87,925 | | | JPMorgan Chase Bank N.A. | | | 3/15/17 | | | | 774 | |
| JPY | | | 10,088,370 | | | | | | | USD | | | 89,538 | | | JPMorgan Chase Bank N.A. | | | 3/15/17 | | | | 323 | |
| JPY | | | 12,820,316 | | | | | | | USD | | | 112,037 | | | JPMorgan Chase Bank N.A. | | | 3/15/17 | | | | 2,158 | |
| JPY | | | 12,911,869 | | | | | | | USD | | | 114,596 | | | JPMorgan Chase Bank N.A. | | | 3/15/17 | | | | 415 | |
| JPY | | | 14,544,158 | | | | | | | USD | | | 127,334 | | | JPMorgan Chase Bank N.A. | | | 3/15/17 | | | | 2,216 | |
| JPY | | | 15,251,240 | | | | | | | USD | | | 133,704 | | | JPMorgan Chase Bank N.A. | | | 3/15/17 | | | | 2,145 | |
| JPY | | | 20,165,990 | | | | | | | USD | | | 175,496 | | | JPMorgan Chase Bank N.A. | | | 3/15/17 | | | | 4,130 | |
| JPY | | | 20,588,687 | | | | | | | USD | | | 183,487 | | | JPMorgan Chase Bank N.A. | | | 3/15/17 | | | | (96 | ) |
| JPY | | | 23,039,339 | | | | | | | USD | | | 197,985 | | | JPMorgan Chase Bank N.A. | | | 3/15/17 | | | | 7,236 | |
| JPY | | | 24,426,990 | | | | | | | USD | | | 215,727 | | | JPMorgan Chase Bank N.A. | | | 3/15/17 | | | | 1,854 | |
| JPY | | | 24,716,169 | | | | | | | USD | | | 209,686 | | | JPMorgan Chase Bank N.A. | | | 3/15/17 | | | | 10,471 | |
| JPY | | | 24,992,708 | | | | | | | USD | | | 220,449 | | | JPMorgan Chase Bank N.A. | | | 3/15/17 | | | | 2,171 | |
| JPY | | | 25,364,935 | | | | | | | USD | | | 217,750 | | | JPMorgan Chase Bank N.A. | | | 3/15/17 | | | | 8,185 | |
See Notes to Consolidated Financial Statements.
| | | | | | |
| | | BLACKROCK MULTI-MANAGER ALTERNATIVE STRATEGIES FUND | | FEBRUARY 28, 2017 | | 19 |
| | | | |
| Consolidated Schedule of Investments (continued) | | | | |
| | | | | | | | | | | | | | | | | | | | | | | | |
Currency Purchased | | | | | | Currency Sold | | | Counterparty | | Settlement
Date | | | Unrealized
Appreciation
(Depreciation) | |
| JPY | | | 28,536,686 | | | | | | | USD | | | 242,960 | | | JPMorgan Chase Bank N.A. | | | 3/15/17 | | | $ | 11,227 | |
| JPY | | | 30,781,518 | | | | | | | USD | | | 270,842 | | | JPMorgan Chase Bank N.A. | | | 3/15/17 | | | | 3,341 | |
| JPY | | | 38,416,317 | | | | | | | USD | | | 334,321 | | | JPMorgan Chase Bank N.A. | | | 3/15/17 | | | | 7,868 | |
| JPY | | | 40,380,470 | | | | | | | USD | | | 353,320 | | | JPMorgan Chase Bank N.A. | | | 3/15/17 | | | | 6,365 | |
| JPY | | | 41,991,070 | | | | | | | USD | | | 374,226 | | | JPMorgan Chase Bank N.A. | | | 3/15/17 | | | | (195 | ) |
| JPY | | | 47,165,871 | | | | | | | USD | | | 409,901 | | | JPMorgan Chase Bank N.A. | | | 3/15/17 | | | | 10,224 | |
| JPY | | | 50,319,153 | | | | | | | USD | | | 442,523 | | | JPMorgan Chase Bank N.A. | | | 3/15/17 | | | | 5,690 | |
| JPY | | | 63,807,700 | | | | | | | USD | | | 558,637 | | | JPMorgan Chase Bank N.A. | | | 3/15/17 | | | | 9,724 | |
| JPY | | | 68,348,847 | | | | | | | USD | | | 593,999 | | | JPMorgan Chase Bank N.A. | | | 3/15/17 | | | | 14,811 | |
| JPY | | | 78,167,421 | | | | | | | USD | | | 686,731 | | | JPMorgan Chase Bank N.A. | | | 3/15/17 | | | | 9,537 | |
| JPY | | | 79,408,067 | | | | | | | USD | | | 693,692 | | | JPMorgan Chase Bank N.A. | | | 3/15/17 | | | | 13,627 | |
| JPY | | | 85,692,122 | | | | | | | USD | | | 726,993 | | | JPMorgan Chase Bank N.A. | | | 3/15/17 | | | | 36,301 | |
| JPY | | | 398,623,435 | | | | | | | USD | | | 3,482,291 | | | JPMorgan Chase Bank N.A. | | | 3/15/17 | | | | 68,407 | |
| NOK | | | 29,536 | | | | | | | USD | | | 3,531 | | | JPMorgan Chase Bank N.A. | | | 3/15/17 | | | | (8 | ) |
| NOK | | | 38,030 | | | | | | | USD | | | 4,574 | | | JPMorgan Chase Bank N.A. | | | 3/15/17 | | | | (37 | ) |
| NOK | | | 49,683 | | | | | | | USD | | | 5,960 | | | JPMorgan Chase Bank N.A. | | | 3/15/17 | | | | (33 | ) |
| NOK | | | 54,599 | | | | | | | USD | | | 6,524 | | | JPMorgan Chase Bank N.A. | | | 3/15/17 | | | | (11 | ) |
| NOK | | | 79,072 | | | | | | | USD | | | 9,465 | | | JPMorgan Chase Bank N.A. | | | 3/15/17 | | | | (32 | ) |
| NOK | | | 86,631 | | | | | | | USD | | | 10,461 | | | JPMorgan Chase Bank N.A. | | | 3/15/17 | | | | (127 | ) |
| NOK | | | 109,556 | | | | | | | USD | | | 13,353 | | | JPMorgan Chase Bank N.A. | | | 3/15/17 | | | | (283 | ) |
| NOK | | | 115,686 | | | | | | | USD | | | 13,823 | | | JPMorgan Chase Bank N.A. | | | 3/15/17 | | | | (22 | ) |
| NOK | | | 127,430 | | | | | | | USD | | | 15,378 | | | JPMorgan Chase Bank N.A. | | | 3/15/17 | | | | (176 | ) |
| NOK | | | 135,235 | | | | | | | USD | | | 16,159 | | | JPMorgan Chase Bank N.A. | | | 3/15/17 | | | | (26 | ) |
| NOK | | | 161,076 | | | | | | | USD | | | 19,348 | | | JPMorgan Chase Bank N.A. | | | 3/15/17 | | | | (132 | ) |
| NOK | | | 178,893 | | | | | | | USD | | | 21,588 | | | JPMorgan Chase Bank N.A. | | | 3/15/17 | | | | (247 | ) |
| NOK | | | 318,681 | | | | | | | USD | | | 37,796 | | | JPMorgan Chase Bank N.A. | | | 3/15/17 | | | | 222 | |
| NOK | | | 342,635 | | | | | | | USD | | | 41,078 | | | JPMorgan Chase Bank N.A. | | | 3/15/17 | | | | (203 | ) |
| NOK | | | 419,626 | | | | | | | USD | | | 50,348 | | | JPMorgan Chase Bank N.A. | | | 3/15/17 | | | | (288 | ) |
| NOK | | | 449,038 | | | | | | | USD | | | 53,506 | | | JPMorgan Chase Bank N.A. | | | 3/15/17 | | | | 63 | |
| NOK | | | 535,380 | | | | | | | USD | | | 63,970 | | | JPMorgan Chase Bank N.A. | | | 3/15/17 | | | | (101 | ) |
| NOK | | | 602,101 | | | | | | | USD | | | 72,709 | | | JPMorgan Chase Bank N.A. | | | 3/15/17 | | | | (880 | ) |
| NOK | | | 648,564 | | | | | | | USD | | | 77,633 | | | JPMorgan Chase Bank N.A. | | | 3/15/17 | | | | (261 | ) |
| NOK | | | 671,861 | | | | | | | USD | | | 80,803 | | | JPMorgan Chase Bank N.A. | | | 3/15/17 | | | | (652 | ) |
| NOK | | | 727,439 | | | | | | | USD | | | 86,975 | | | JPMorgan Chase Bank N.A. | | | 3/15/17 | | | | (194 | ) |
| NOK | | | 756,341 | | | | | | | USD | | | 86,857 | | | JPMorgan Chase Bank N.A. | | | 3/15/17 | | | | 3,372 | |
| NOK | | | 890,883 | | | | | | | USD | | | 106,645 | | | JPMorgan Chase Bank N.A. | | | 3/15/17 | | | | (365 | ) |
| NOK | | | 908,138 | | | | | | | USD | | | 108,947 | | | JPMorgan Chase Bank N.A. | | | 3/15/17 | | | | (609 | ) |
| NOK | | | 1,006,960 | | | | | | | USD | | | 120,953 | | | JPMorgan Chase Bank N.A. | | | 3/15/17 | | | | (826 | ) |
| NOK | | | 1,168,422 | | | | | | | USD | | | 140,291 | | | JPMorgan Chase Bank N.A. | | | 3/15/17 | | | | (902 | ) |
| NOK | | | 1,545,197 | | | | | | | USD | | | 178,200 | | | JPMorgan Chase Bank N.A. | | | 3/15/17 | | | | 6,137 | |
| NOK | | | 2,049,377 | | | | | | | USD | | | 241,104 | | | JPMorgan Chase Bank N.A. | | | 3/15/17 | | | | 3,380 | |
| NOK | | | 3,820,349 | | | | | | | USD | | | 440,582 | | | JPMorgan Chase Bank N.A. | | | 3/15/17 | | | | 15,172 | |
| NOK | | | 6,717,116 | | | | | | | USD | | | 778,921 | | | JPMorgan Chase Bank N.A. | | | 3/15/17 | | | | 22,408 | |
| NOK | | | 6,781,542 | | | | | | | USD | | | 780,239 | | | JPMorgan Chase Bank N.A. | | | 3/15/17 | | | | 28,776 | |
| NOK | | | 6,825,088 | | | | | | | USD | | | 784,598 | | | JPMorgan Chase Bank N.A. | | | 3/15/17 | | | | 29,612 | |
| NOK | | | 11,720,871 | | | | | | | USD | | | 1,384,669 | | | JPMorgan Chase Bank N.A. | | | 3/15/17 | | | | 13,590 | |
| NZD | | | 1,147 | | | | | | | USD | | | 830 | | | JPMorgan Chase Bank N.A. | | | 3/15/17 | | | | (5 | ) |
| NZD | | | 2,154 | | | | | | | USD | | | 1,545 | | | JPMorgan Chase Bank N.A. | | | 3/15/17 | | | | 6 | |
See Notes to Consolidated Financial Statements.
| | | | | | |
| 20 | | BLACKROCK MULTI-MANAGER ALTERNATIVE STRATEGIES FUND | | FEBRUARY 28, 2017 | | |
| | | | |
| Consolidated Schedule of Investments (continued) | | | | |
| | | | | | | | | | | | | | | | | | | | | | | | |
Currency Purchased | | | | | | Currency Sold | | | Counterparty | | Settlement
Date | | | Unrealized
Appreciation
(Depreciation) | |
| NZD | | | 3,541 | | | | | | | USD | | | 2,460 | | | JPMorgan Chase Bank N.A. | | | 3/15/17 | | | $ | 89 | |
| NZD | | | 4,777 | | | | | | | USD | | | 3,448 | | | JPMorgan Chase Bank N.A. | | | 3/15/17 | | | | (9 | ) |
| NZD | | | 5,462 | | | | | | | USD | | | 3,773 | | | JPMorgan Chase Bank N.A. | | | 3/15/17 | | | | 160 | |
| NZD | | | 6,180 | | | | | | | USD | | | 4,269 | | | JPMorgan Chase Bank N.A. | | | 3/15/17 | | | | 181 | |
| NZD | | | 7,368 | | | | | | | USD | | | 5,318 | | | JPMorgan Chase Bank N.A. | | | 3/15/17 | | | | (13 | ) |
| NZD | | | 9,801 | | | | | | | USD | | | 7,138 | | | JPMorgan Chase Bank N.A. | | | 3/15/17 | | | | (82 | ) |
| NZD | | | 10,063 | | | | | | | USD | | | 7,358 | | | JPMorgan Chase Bank N.A. | | | 3/15/17 | | | | (113 | ) |
| NZD | | | 14,767 | | | | | | | USD | | | 10,765 | | | JPMorgan Chase Bank N.A. | | | 3/15/17 | | | | (133 | ) |
| NZD | | | 15,606 | | | | | | | USD | | | 11,380 | | | JPMorgan Chase Bank N.A. | | | 3/15/17 | | | | (144 | ) |
| NZD | | | 21,123 | | | | | | | USD | | | 15,139 | | | JPMorgan Chase Bank N.A. | | | 3/15/17 | | | | 69 | |
| NZD | | | 26,846 | | | | | | | USD | | | 19,277 | | | JPMorgan Chase Bank N.A. | | | 3/15/17 | | | | 51 | |
| NZD | | | 34,875 | | | | | | | USD | | | 25,060 | | | JPMorgan Chase Bank N.A. | | | 3/15/17 | | | | 48 | |
| NZD | | | 41,688 | | | | | | | USD | | | 30,398 | | | JPMorgan Chase Bank N.A. | | | 3/15/17 | | | | (385 | ) |
| NZD | | | 44,662 | | | | | | | USD | | | 32,010 | | | JPMorgan Chase Bank N.A. | | | 3/15/17 | | | | 145 | |
| NZD | | | 49,647 | | | | | | | USD | | | 36,067 | | | JPMorgan Chase Bank N.A. | | | 3/15/17 | | | | (323 | ) |
| NZD | | | 53,489 | | | | | | | USD | | | 36,873 | | | JPMorgan Chase Bank N.A. | | | 3/15/17 | | | | 1,636 | |
| NZD | | | 71,859 | | | | | | | USD | | | 52,313 | | | JPMorgan Chase Bank N.A. | | | 3/15/17 | | | | (577 | ) |
| NZD | | | 74,209 | | | | | | | USD | | | 53,821 | | | JPMorgan Chase Bank N.A. | | | 3/15/17 | | | | (394 | ) |
| NZD | | | 94,483 | | | | | | | USD | | | 67,843 | | | JPMorgan Chase Bank N.A. | | | 3/15/17 | | | | 181 | |
| NZD | | | 107,939 | | | | | | | USD | | | 78,684 | | | JPMorgan Chase Bank N.A. | | | 3/15/17 | | | | (973 | ) |
| NZD | | | 120,730 | | | | | | | USD | | | 88,275 | | | JPMorgan Chase Bank N.A. | | | 3/15/17 | | | | (1,355 | ) |
| NZD | | | 135,750 | | | | | | | USD | | | 98,869 | | | JPMorgan Chase Bank N.A. | | | 3/15/17 | | | | (1,136 | ) |
| NZD | | | 161,364 | | | | | | | USD | | | 115,953 | | | JPMorgan Chase Bank N.A. | | | 3/15/17 | | | | 222 | |
| NZD | | | 829,174 | | | | | | | USD | | | 579,452 | | | JPMorgan Chase Bank N.A. | | | 3/15/17 | | | | 17,516 | |
| NZD | | | 1,579,632 | | | | | | | USD | | | 1,137,366 | | | JPMorgan Chase Bank N.A. | | | 3/15/17 | | | | (103 | ) |
| SEK | | | 2,840 | | | | | | | USD | | | 314 | | | JPMorgan Chase Bank N.A. | | | 3/15/17 | | | | 1 | |
| SEK | | | 23,877 | | | | | | | USD | | | 2,679 | | | JPMorgan Chase Bank N.A. | | | 3/15/17 | | | | (32 | ) |
| SEK | | | 31,728 | | | | | | | USD | | | 3,532 | | | JPMorgan Chase Bank N.A. | | | 3/15/17 | | | | (14 | ) |
| SEK | | | 48,519 | | | | | | | USD | | | 5,454 | | | JPMorgan Chase Bank N.A. | | | 3/15/17 | | | | (74 | ) |
| SEK | | | 58,706 | | | | | | | USD | | | 6,645 | | | JPMorgan Chase Bank N.A. | | | 3/15/17 | | | | (135 | ) |
| SEK | | | 120,328 | | | | | | | USD | | | 13,512 | | | JPMorgan Chase Bank N.A. | | | 3/15/17 | | | | (171 | ) |
| SEK | | | 121,044 | | | | | | | USD | | | 13,412 | | | JPMorgan Chase Bank N.A. | | | 3/15/17 | | | | 9 | |
| SEK | | | 122,374 | | | | | | | USD | | | 13,531 | | | JPMorgan Chase Bank N.A. | | | 3/15/17 | | | | 38 | |
| SEK | | | 167,190 | | | | | | | USD | | | 18,792 | | | JPMorgan Chase Bank N.A. | | | 3/15/17 | | | | (255 | ) |
| SEK | | | 187,475 | | | | | | | USD | | | 20,729 | | | JPMorgan Chase Bank N.A. | | | 3/15/17 | | | | 58 | |
| SEK | | | 205,980 | | | | | | | USD | | | 23,284 | | | JPMorgan Chase Bank N.A. | | | 3/15/17 | | | | (445 | ) |
| SEK | | | 257,109 | | | | | | | USD | | | 28,893 | | | JPMorgan Chase Bank N.A. | | | 3/15/17 | | | | (386 | ) |
| SEK | | | 260,654 | | | | | | | USD | | | 29,214 | | | JPMorgan Chase Bank N.A. | | | 3/15/17 | | | | (313 | ) |
| SEK | | | 263,098 | | | | | | | USD | | | 29,398 | | | JPMorgan Chase Bank N.A. | | | 3/15/17 | | | | (227 | ) |
| SEK | | | 321,394 | | | | | | | USD | | | 36,217 | | | JPMorgan Chase Bank N.A. | | | 3/15/17 | | | | (582 | ) |
| SEK | | | 412,447 | | | | | | | USD | | | 46,398 | | | JPMorgan Chase Bank N.A. | | | 3/15/17 | | | | (667 | ) |
| SEK | | | 429,790 | | | | | | | USD | | | 47,914 | | | JPMorgan Chase Bank N.A. | | | 3/15/17 | | | | (260 | ) |
| SEK | | | 445,747 | | | | | | | USD | | | 47,767 | | | JPMorgan Chase Bank N.A. | | | 3/15/17 | | | | 1,656 | |
| SEK | | | 446,654 | | | | | | | USD | | | 50,157 | | | JPMorgan Chase Bank N.A. | | | 3/15/17 | | | | (634 | ) |
| SEK | | | 460,994 | | | | | | | USD | | | 52,304 | | | JPMorgan Chase Bank N.A. | | | 3/15/17 | | | | (1,191 | ) |
| SEK | | | 561,071 | | | | | | | USD | | | 64,341 | | | JPMorgan Chase Bank N.A. | | | 3/15/17 | | | | (2,131 | ) |
| SEK | | | 642,148 | | | | | | | USD | | | 71,482 | | | JPMorgan Chase Bank N.A. | | | 3/15/17 | | | | (283 | ) |
| SEK | | | 715,573 | | | | | | | USD | | | 79,289 | | | JPMorgan Chase Bank N.A. | | | 3/15/17 | | | | 52 | |
See Notes to Consolidated Financial Statements.
| | | | | | |
| | | BLACKROCK MULTI-MANAGER ALTERNATIVE STRATEGIES FUND | | FEBRUARY 28, 2017 | | 21 |
| | | | |
| Consolidated Schedule of Investments (continued) | | | | |
| | | | | | | | | | | | | | | | | | | | | | | | |
Currency Purchased | | | | | | Currency Sold | | | Counterparty | | Settlement
Date | | | Unrealized
Appreciation
(Depreciation) | |
| SEK | | | 745,520 | | | | | | | USD | | | 84,586 | | | JPMorgan Chase Bank N.A. | | | 3/15/17 | | | $ | (1,924 | ) |
| SEK | | | 881,047 | | | | | | | USD | | | 97,333 | | | JPMorgan Chase Bank N.A. | | | 3/15/17 | | | | 355 | |
| SEK | | | 1,783,704 | | | | | | | USD | | | 200,153 | | | JPMorgan Chase Bank N.A. | | | 3/15/17 | | | | (2,381 | ) |
| USD | | | 75 | | | | | | | AUD | | | 100 | | | JPMorgan Chase Bank N.A. | | | 3/15/17 | | | | (2 | ) |
| USD | | | 3,747 | | | | | | | AUD | | | 5,196 | | | JPMorgan Chase Bank N.A. | | | 3/15/17 | | | | (235 | ) |
| USD | | | 3,886 | | | | | | | AUD | | | 5,089 | | | JPMorgan Chase Bank N.A. | | | 3/15/17 | | | | (15 | ) |
| USD | | | 3,990 | | | | | | | AUD | | | 5,567 | | | JPMorgan Chase Bank N.A. | | | 3/15/17 | | | | (277 | ) |
| USD | | | 6,044 | | | | | | | AUD | | | 8,433 | | | JPMorgan Chase Bank N.A. | | | 3/15/17 | | | | (419 | ) |
| USD | | | 14,063 | | | | | | | AUD | | | 18,320 | | | JPMorgan Chase Bank N.A. | | | 3/15/17 | | | | 22 | |
| USD | | | 15,412 | | | | | | | AUD | | | 20,099 | | | JPMorgan Chase Bank N.A. | | | 3/15/17 | | | | 8 | |
| USD | | | 15,882 | | | | | | | AUD | | | 20,842 | | | JPMorgan Chase Bank N.A. | | | 3/15/17 | | | | (92 | ) |
| USD | | | 16,096 | | | | | | | AUD | | | 20,992 | | | JPMorgan Chase Bank N.A. | | | 3/15/17 | | | | 8 | |
| USD | | | 17,150 | | | | | | | AUD | | | 22,731 | | | JPMorgan Chase Bank N.A. | | | 3/15/17 | | | | (271 | ) |
| USD | | | 17,774 | | | | | | | AUD | | | 23,043 | | | JPMorgan Chase Bank N.A. | | | 3/15/17 | | | | 114 | |
| USD | | | 21,376 | | | | | | | AUD | | | 27,928 | | | JPMorgan Chase Bank N.A. | | | 3/15/17 | | | | (29 | ) |
| USD | | | 26,035 | | | | | | | AUD | | | 33,836 | | | JPMorgan Chase Bank N.A. | | | 3/15/17 | | | | 103 | |
| USD | | | 30,747 | | | | | | | AUD | | | 39,863 | | | JPMorgan Chase Bank N.A. | | | 3/15/17 | | | | 196 | |
| USD | | | 32,945 | | | | | | | AUD | | | 43,612 | | | JPMorgan Chase Bank N.A. | | | 3/15/17 | | | | (480 | ) |
| USD | | | 38,711 | | | | | | | AUD | | | 51,629 | | | JPMorgan Chase Bank N.A. | | | 3/15/17 | | | | (859 | ) |
| USD | | | 39,381 | | | | | | | AUD | | | 51,333 | | | JPMorgan Chase Bank N.A. | | | 3/15/17 | | | | 39 | |
| USD | | | 60,253 | | | | | | | AUD | | | 78,397 | | | JPMorgan Chase Bank N.A. | | | 3/15/17 | | | | 168 | |
| USD | | | 63,724 | | | | | | | AUD | | | 83,112 | | | JPMorgan Chase Bank N.A. | | | 3/15/17 | | | | 25 | |
| USD | | | 65,891 | | | | | | | AUD | | | 87,226 | | | JPMorgan Chase Bank N.A. | | | 3/15/17 | | | | (961 | ) |
| USD | | | 78,488 | | | | | | | AUD | | | 102,547 | | | JPMorgan Chase Bank N.A. | | | 3/15/17 | | | | (106 | ) |
| USD | | | 79,133 | | | | | | | AUD | | | 103,199 | | | JPMorgan Chase Bank N.A. | | | 3/15/17 | | | | 39 | |
| USD | | | 86,551 | | | | | | | AUD | | | 115,545 | | | JPMorgan Chase Bank N.A. | | | 3/15/17 | | | | (2,005 | ) |
| USD | | | 103,391 | | | | | | | AUD | | | 134,524 | | | JPMorgan Chase Bank N.A. | | | 3/15/17 | | | | 289 | |
| USD | | | 112,078 | | | | | | | AUD | | | 147,085 | | | JPMorgan Chase Bank N.A. | | | 3/15/17 | | | | (651 | ) |
| USD | | | 118,744 | | | | | | | AUD | | | 157,908 | | | JPMorgan Chase Bank N.A. | | | 3/15/17 | | | | (2,280 | ) |
| USD | | | 129,194 | | | | | | | AUD | | | 168,402 | | | JPMorgan Chase Bank N.A. | | | 3/15/17 | | | | 127 | |
| USD | | | 132,313 | | | | | | | AUD | | | 172,557 | | | JPMorgan Chase Bank N.A. | | | 3/15/17 | | | | 62 | |
| USD | | | 142,950 | | | | | | | AUD | | | 185,782 | | | JPMorgan Chase Bank N.A. | | | 3/15/17 | | | | 563 | |
| USD | | | 159,409 | | | | | | | AUD | | | 207,664 | | | JPMorgan Chase Bank N.A. | | | 3/15/17 | | | | 251 | |
| USD | | | 162,569 | | | | | | | AUD | | | 210,758 | | | JPMorgan Chase Bank N.A. | | | 3/15/17 | | | | 1,040 | |
| USD | | | 170,248 | | | | | | | AUD | | | 226,209 | | | JPMorgan Chase Bank N.A. | | | 3/15/17 | | | | (3,123 | ) |
| USD | | | 170,416 | | | | | | | AUD | | | 225,871 | | | JPMorgan Chase Bank N.A. | | | 3/15/17 | | | | (2,696 | ) |
| USD | | | 291,108 | | | | | | | AUD | | | 385,938 | | | JPMorgan Chase Bank N.A. | | | 3/15/17 | | | | (4,682 | ) |
| USD | | | 307,749 | | | | | | | AUD | | | 411,735 | | | JPMorgan Chase Bank N.A. | | | 3/15/17 | | �� | | (7,813 | ) |
| USD | | | 361,779 | | | | | | | AUD | | | 478,278 | | | JPMorgan Chase Bank N.A. | | | 3/15/17 | | | | (4,782 | ) |
| USD | | | 444,047 | | | | | | | AUD | | | 594,000 | | | JPMorgan Chase Bank N.A. | | | 3/15/17 | | | | (11,206 | ) |
| USD | | | 772,311 | | | | | | | AUD | | | 1,052,768 | | | JPMorgan Chase Bank N.A. | | | 3/15/17 | | | | (34,551 | ) |
| USD | | | 957 | | | | | | | CAD | | | 1,255 | | | JPMorgan Chase Bank N.A. | | | 3/15/17 | | | | 12 | |
| USD | | | 2,867 | | | | | | | CAD | | | 3,810 | | | JPMorgan Chase Bank N.A. | | | 3/15/17 | | | | (2 | ) |
| USD | | | 3,153 | | | | | | | CAD | | | 4,191 | | | JPMorgan Chase Bank N.A. | | | 3/15/17 | | | | (2 | ) |
| USD | | | 14,686 | | | | | | | CAD | | | 19,276 | | | JPMorgan Chase Bank N.A. | | | 3/15/17 | | | | 172 | |
| USD | | | 35,814 | | | | | | | CAD | | | 47,831 | | | JPMorgan Chase Bank N.A. | | | 3/15/17 | | | | (202 | ) |
| USD | | | 54,020 | | | | | | | CAD | | | 70,593 | | | JPMorgan Chase Bank N.A. | | | 3/15/17 | | | | 865 | |
| USD | | | 70,849 | | | | | | | CAD | | | 92,585 | | | JPMorgan Chase Bank N.A. | | | 3/15/17 | | | | 1,134 | |
See Notes to Consolidated Financial Statements.
| | | | | | |
| 22 | | BLACKROCK MULTI-MANAGER ALTERNATIVE STRATEGIES FUND | | FEBRUARY 28, 2017 | | |
| | | | |
| Consolidated Schedule of Investments (continued) | | | | |
| | | | | | | | | | | | | | | | | | | | | | | | |
Currency Purchased | | | | | | Currency Sold | | | Counterparty | | Settlement
Date | | | Unrealized
Appreciation
(Depreciation) | |
| USD | | | 71,879 | | | | | | | CAD | | | 93,937 | | | JPMorgan Chase Bank N.A. | | | 3/15/17 | | | $ | 1,146 | |
| USD | | | 109,962 | | | | | | | CAD | | | 145,446 | | | JPMorgan Chase Bank N.A. | | | 3/15/17 | | | | 443 | |
| USD | | | 113,016 | | | | | | | CAD | | | 148,242 | | | JPMorgan Chase Bank N.A. | | | 3/15/17 | | | | 1,392 | |
| USD | | | 133,709 | | | | | | | CAD | | | 175,202 | | | JPMorgan Chase Bank N.A. | | | 3/15/17 | | | | 1,784 | |
| USD | | | 156,995 | | | | | | | CAD | | | 205,928 | | | JPMorgan Chase Bank N.A. | | | 3/15/17 | | | | 1,934 | |
| USD | | | 207,847 | | | | | | | CAD | | | 272,418 | | | JPMorgan Chase Bank N.A. | | | 3/15/17 | | | | 2,720 | |
| USD | | | 238,916 | | | | | | | CAD | | | 313,578 | | | JPMorgan Chase Bank N.A. | | | 3/15/17 | | | | 2,797 | |
| USD | | | 267,580 | | | | | | | CAD | | | 350,618 | | | JPMorgan Chase Bank N.A. | | | 3/15/17 | | | | 3,571 | |
| USD | | | 285,820 | | | | | | | CAD | | | 373,598 | | | JPMorgan Chase Bank N.A. | | | 3/15/17 | | | | 4,507 | |
| USD | | | 397,198 | | | | | | | CAD | | | 523,609 | | | JPMorgan Chase Bank N.A. | | | 3/15/17 | | | | 2,923 | |
| USD | | | 456,149 | | | | | | | CAD | | | 596,132 | | | JPMorgan Chase Bank N.A. | | | 3/15/17 | | | | 7,271 | |
| USD | | | 563,254 | | | | | | | CAD | | | 749,996 | | | JPMorgan Chase Bank N.A. | | | 3/15/17 | | | | (1,481 | ) |
| USD | | | 564,022 | | | | | | | CAD | | | 747,195 | | | JPMorgan Chase Bank N.A. | | | 3/15/17 | | | | 1,396 | |
| USD | | | 591,133 | | | | | | | CAD | | | 785,692 | | | JPMorgan Chase Bank N.A. | | | 3/15/17 | | | | (480 | ) |
| USD | | | 635,700 | | | | | | | CAD | | | 848,996 | | | JPMorgan Chase Bank N.A. | | | 3/15/17 | | | | (3,580 | ) |
| USD | | | 638,877 | | | | | | | CAD | | | 852,936 | | | JPMorgan Chase Bank N.A. | | | 3/15/17 | | | | (3,370 | ) |
| USD | | | 650,010 | | | | | | | CAD | | | 863,927 | | | JPMorgan Chase Bank N.A. | | | 3/15/17 | | | | (513 | ) |
| USD | | | 3,305 | | | | | | | EUR | | | 3,079 | | | JPMorgan Chase Bank N.A. | | | 3/15/17 | | | | 40 | |
| USD | | | 5,224 | | | | | | | EUR | | | 5,000 | | | JPMorgan Chase Bank N.A. | | | 3/15/17 | | | | (77 | ) |
| USD | | | 5,434 | | | | | | | EUR | | | 5,153 | | | JPMorgan Chase Bank N.A. | | | 3/15/17 | | | | (29 | ) |
| USD | | | 8,486 | | | | | | | EUR | | | 7,936 | | | JPMorgan Chase Bank N.A. | | | 3/15/17 | | | | 73 | |
| USD | | | 10,431 | | | | | | | EUR | | | 10,000 | | | JPMorgan Chase Bank N.A. | | | 3/15/17 | | | | (171 | ) |
| USD | | | 15,604 | | | | | | | EUR | | | 14,726 | | | JPMorgan Chase Bank N.A. | | | 3/15/17 | | | | (8 | ) |
| USD | | | 15,799 | | | | | | | EUR | | | 15,084 | | | JPMorgan Chase Bank N.A. | | | 3/15/17 | | | | (193 | ) |
| USD | | | 25,006 | | | | | | | EUR | | | 23,902 | | | JPMorgan Chase Bank N.A. | | | 3/15/17 | | | | (335 | ) |
| USD | | | 27,330 | | | | | | | EUR | | | 25,874 | | | JPMorgan Chase Bank N.A. | | | 3/15/17 | | | | (101 | ) |
| USD | | | 38,381 | | | | | | | EUR | | | 35,922 | | | JPMorgan Chase Bank N.A. | | | 3/15/17 | | | | 297 | |
| USD | | | 60,189 | | | | | | | EUR | | | 56,161 | | | JPMorgan Chase Bank N.A. | | | 3/15/17 | | | | 647 | |
| USD | | | 60,635 | | | | | | | EUR | | | 56,171 | | | JPMorgan Chase Bank N.A. | | | 3/15/17 | | | | 1,083 | |
| USD | | | 80,568 | | | | | | | EUR | | | 74,941 | | | JPMorgan Chase Bank N.A. | | | 3/15/17 | | | | 1,116 | |
| USD | | | 98,218 | | | | | | | EUR | | | 93,882 | | | JPMorgan Chase Bank N.A. | | | 3/15/17 | | | | (1,315 | ) |
| USD | | | 105,355 | | | | | | | EUR | | | 99,472 | | | JPMorgan Chase Bank N.A. | | | 3/15/17 | | | | (104 | ) |
| USD | | | 120,104 | | | | | | | EUR | | | 112,408 | | | JPMorgan Chase Bank N.A. | | | 3/15/17 | | | | 930 | |
| USD | | | 128,085 | | | | | | | EUR | | | 119,033 | | | JPMorgan Chase Bank N.A. | | | 3/15/17 | | | | 1,887 | |
| USD | | | 133,806 | | | | | | | EUR | | | 127,547 | | | JPMorgan Chase Bank N.A. | | | 3/15/17 | | | | (1,418 | ) |
| USD | | | 136,156 | | | | | | | EUR | | | 126,343 | | | JPMorgan Chase Bank N.A. | | | 3/15/17 | | | | 2,209 | |
| USD | | | 148,224 | | | | | | | EUR | | | 139,549 | | | JPMorgan Chase Bank N.A. | | | 3/15/17 | | | | 275 | |
| USD | | | 151,947 | | | | | | | EUR | | | 145,250 | | | JPMorgan Chase Bank N.A. | | | 3/15/17 | | | | (2,046 | ) |
| USD | | | 187,526 | | | | | | | EUR | | | 174,977 | | | JPMorgan Chase Bank N.A. | | | 3/15/17 | | | | 2,017 | |
| USD | | | 227,507 | | | | | | | EUR | | | 210,745 | | | JPMorgan Chase Bank N.A. | | | 3/15/17 | | | | 4,076 | |
| USD | | | 241,368 | | | | | | | EUR | | | 224,310 | | | JPMorgan Chase Bank N.A. | | | 3/15/17 | | | | 3,557 | |
| USD | | | 265,253 | | | | | | | EUR | | | 246,113 | | | JPMorgan Chase Bank N.A. | | | 3/15/17 | | | | 4,326 | |
| USD | | | 272,069 | | | | | | | EUR | | | 252,040 | | | JPMorgan Chase Bank N.A. | | | 3/15/17 | | | | 4,859 | |
| USD | | | 318,501 | | | | | | | EUR | | | 301,987 | | | JPMorgan Chase Bank N.A. | | | 3/15/17 | | | | (1,663 | ) |
| USD | | | 333,617 | | | | | | | EUR | | | 314,988 | | | JPMorgan Chase Bank N.A. | | | 3/15/17 | | | | (331 | ) |
| USD | | | 437,541 | | | | | | | EUR | | | 411,757 | | | JPMorgan Chase Bank N.A. | | | 3/15/17 | | | | 1,000 | |
| USD | | | 449,948 | | | | | | | EUR | | | 426,111 | | | JPMorgan Chase Bank N.A. | | | 3/15/17 | | | | (1,812 | ) |
| USD | | | 484,548 | | | | | | | EUR | | | 448,849 | | | JPMorgan Chase Bank N.A. | | | 3/15/17 | | | | 8,682 | |
See Notes to Consolidated Financial Statements.
| | | | | | |
| | | BLACKROCK MULTI-MANAGER ALTERNATIVE STRATEGIES FUND | | FEBRUARY 28, 2017 | | 23 |
| | | | |
| Consolidated Schedule of Investments (continued) | | | | |
| | | | | | | | | | | | | | | | | | | | | | | | |
Currency Purchased | | | | | | Currency Sold | | | Counterparty | | Settlement
Date | | | Unrealized
Appreciation
(Depreciation) | |
| USD | | | 487,979 | | | | | | | EUR | | | 452,808 | | | JPMorgan Chase Bank N.A. | | | 3/15/17 | | | $ | 7,915 | |
| USD | | | 516,228 | | | | | | | EUR | | | 483,366 | | | JPMorgan Chase Bank N.A. | | | 3/15/17 | | | | 3,767 | |
| USD | | | 528,219 | | | | | | | EUR | | | 501,960 | | | JPMorgan Chase Bank N.A. | | | 3/15/17 | | | | (3,955 | ) |
| USD | | | 559,322 | | | | | | | EUR | | | 527,575 | | | JPMorgan Chase Bank N.A. | | | 3/15/17 | | | | (9 | ) |
| USD | | | 718,395 | | | | | | | EUR | | | 672,856 | | | JPMorgan Chase Bank N.A. | | | 3/15/17 | | | | 5,038 | |
| USD | | | 737,335 | | | | | | | EUR | | | 693,825 | | | JPMorgan Chase Bank N.A. | | | 3/15/17 | | | | 1,747 | |
| USD | | | 1,696,363 | | | | | | | EUR | | | 1,616,606 | | | JPMorgan Chase Bank N.A. | | | 3/15/17 | | | | (17,551 | ) |
| USD | | | 1,851,398 | | | | | | | EUR | | | 1,731,638 | | | JPMorgan Chase Bank N.A. | | | 3/15/17 | | | | 15,529 | |
| USD | | | 4,160,812 | | | | | | | EUR | | | 3,891,664 | | | JPMorgan Chase Bank N.A. | | | 3/15/17 | | | | 34,899 | |
| USD | | | 326 | | | | | | | GBP | | | 261 | | | JPMorgan Chase Bank N.A. | | | 3/15/17 | | | | 2 | |
| USD | | | 3,522 | | | | | | | GBP | | | 2,815 | | | JPMorgan Chase Bank N.A. | | | 3/15/17 | | | | 28 | |
| USD | | | 4,236 | | | | | | | GBP | | | 3,365 | | | JPMorgan Chase Bank N.A. | | | 3/15/17 | | | | 59 | |
| USD | | | 5,659 | | | | | | | GBP | | | 4,592 | | | JPMorgan Chase Bank N.A. | | | 3/15/17 | | | | (42 | ) |
| USD | | | 8,824 | | | | | | | GBP | | | 7,198 | | | JPMorgan Chase Bank N.A. | | | 3/15/17 | | | | (112 | ) |
| USD | | | 13,067 | | | | | | | GBP | | | 10,451 | | | JPMorgan Chase Bank N.A. | | | 3/15/17 | | | | 94 | |
| USD | | | 13,677 | | | | | | | GBP | | | 11,027 | | | JPMorgan Chase Bank N.A. | | | 3/15/17 | | | | (12 | ) |
| USD | | | 16,934 | | | | | | | GBP | | | 13,533 | | | JPMorgan Chase Bank N.A. | | | 3/15/17 | | | | 135 | |
| USD | | | 21,856 | | | | | | | GBP | | | 17,510 | | | JPMorgan Chase Bank N.A. | | | 3/15/17 | | | | 120 | |
| USD | | | 22,221 | | | | | | | GBP | | | 17,637 | | | JPMorgan Chase Bank N.A. | | | 3/15/17 | | | | 327 | |
| USD | | | 22,975 | | | | | | | GBP | | | 18,487 | | | JPMorgan Chase Bank N.A. | | | 3/15/17 | | | | 26 | |
| USD | | | 32,281 | | | | | | | GBP | | | 26,259 | | | JPMorgan Chase Bank N.A. | | | 3/15/17 | | | | (316 | ) |
| USD | | | 34,433 | | | | | | | GBP | | | 27,668 | | | JPMorgan Chase Bank N.A. | | | 3/15/17 | | | | 87 | |
| USD | | | 38,735 | | | | | | | GBP | | | 30,880 | | | JPMorgan Chase Bank N.A. | | | 3/15/17 | | | | 402 | |
| USD | | | 42,414 | | | | | | | GBP | | | 34,004 | | | JPMorgan Chase Bank N.A. | | | 3/15/17 | | | | 202 | |
| USD | | | 47,269 | | | | | | | GBP | | | 38,111 | | | JPMorgan Chase Bank N.A. | | | 3/15/17 | | | | (41 | ) |
| USD | | | 49,744 | | | | | | | GBP | | | 39,852 | | | JPMorgan Chase Bank N.A. | | | 3/15/17 | | | | 273 | |
| USD | | | 52,149 | | | | | | | GBP | | | 41,910 | | | JPMorgan Chase Bank N.A. | | | 3/15/17 | | | | 123 | |
| USD | | | 52,902 | | | | | | | GBP | | | 42,431 | | | JPMorgan Chase Bank N.A. | | | 3/15/17 | | | | 230 | |
| USD | | | 56,792 | | | | | | | GBP | | | 45,321 | | | JPMorgan Chase Bank N.A. | | | 3/15/17 | | | | 532 | |
| USD | | | 64,043 | | | | | | | GBP | | | 51,469 | | | JPMorgan Chase Bank N.A. | | | 3/15/17 | | | | 151 | |
| USD | | | 64,206 | | | | | | | GBP | | | 51,005 | | | JPMorgan Chase Bank N.A. | | | 3/15/17 | | | | 890 | |
| USD | | | 75,025 | | | | | | | GBP | | | 60,128 | | | JPMorgan Chase Bank N.A. | | | 3/15/17 | | | | 384 | |
| USD | | | 76,773 | | | | | | | GBP | | | 61,550 | | | JPMorgan Chase Bank N.A. | | | 3/15/17 | | | | 366 | |
| USD | | | 87,917 | | | | | | | GBP | | | 70,246 | | | JPMorgan Chase Bank N.A. | | | 3/15/17 | | | | 716 | |
| USD | | | 92,005 | | | | | | | GBP | | | 73,347 | | | JPMorgan Chase Bank N.A. | | | 3/15/17 | | | | 954 | |
| USD | | | 96,260 | | | | | | | GBP | | | 77,348 | | | JPMorgan Chase Bank N.A. | | | 3/15/17 | | | | 243 | |
| USD | | | 103,118 | | | | | | | GBP | | | 82,643 | | | JPMorgan Chase Bank N.A. | | | 3/15/17 | | | | 528 | |
| USD | | | 103,302 | | | | | | | GBP | | | 81,104 | | | JPMorgan Chase Bank N.A. | | | 3/15/17 | | | | 2,622 | |
| USD | | | 112,104 | | | | | | | GBP | | | 88,977 | | | JPMorgan Chase Bank N.A. | | | 3/15/17 | | | | 1,650 | |
| USD | | | 117,680 | | | | | | | GBP | | | 94,946 | | | JPMorgan Chase Bank N.A. | | | 3/15/17 | | | | (183 | ) |
| USD | | | 137,539 | | | | | | | GBP | | | 107,984 | | | JPMorgan Chase Bank N.A. | | | 3/15/17 | | | | 3,491 | |
| USD | | | 138,101 | | | | | | | GBP | | | 109,030 | | | JPMorgan Chase Bank N.A. | | | 3/15/17 | | | | 2,754 | |
| USD | | | 180,065 | | | | | | | GBP | | | 146,084 | | | JPMorgan Chase Bank N.A. | | | 3/15/17 | | | | (1,279 | ) |
| USD | | | 225,924 | | | | | | | GBP | | | 179,243 | | | JPMorgan Chase Bank N.A. | | | 3/15/17 | | | | 3,418 | |
| USD | | | 255,877 | | | | | | | GBP | | | 206,629 | | | JPMorgan Chase Bank N.A. | | | 3/15/17 | | | | (626 | ) |
| USD | | | 283,996 | | | | | | | GBP | | | 228,305 | | | JPMorgan Chase Bank N.A. | | | 3/15/17 | | | | 585 | |
| USD | | | 285,563 | | | | | | | GBP | | | 234,437 | | | JPMorgan Chase Bank N.A. | | | 3/15/17 | | | | (5,459 | ) |
| USD | | | 305,986 | | | | | | | GBP | | | 240,784 | | | JPMorgan Chase Bank N.A. | | | 3/15/17 | | | | 7,084 | |
See Notes to Consolidated Financial Statements.
| | | | | | |
| 24 | | BLACKROCK MULTI-MANAGER ALTERNATIVE STRATEGIES FUND | | FEBRUARY 28, 2017 | | |
| | | | |
| Consolidated Schedule of Investments (continued) | | | | |
| | | | | | | | | | | | | | | | | | | | | | | | |
Currency Purchased | | | | | | Currency Sold | | | Counterparty | | Settlement
Date | | | Unrealized
Appreciation
(Depreciation) | |
| USD | | | 317,203 | | | | | | | GBP | | | 254,000 | | | JPMorgan Chase Bank N.A. | | | 3/15/17 | | | $ | 1,895 | |
| USD | | | 325,814 | | | | | | | GBP | | | 260,004 | | | JPMorgan Chase Bank N.A. | | | 3/15/17 | | | | 3,053 | |
| USD | | | 354,860 | | | | | | | GBP | | | 282,909 | | | JPMorgan Chase Bank N.A. | | | 3/15/17 | | | | 3,666 | |
| USD | | | 529,799 | | | | | | | GBP | | | 428,591 | | | JPMorgan Chase Bank N.A. | | | 3/15/17 | | | | (2,240 | ) |
| USD | | | 730,450 | | | | | | | GBP | | | 594,000 | | | JPMorgan Chase Bank N.A. | | | 3/15/17 | | | | (6,923 | ) |
| USD | | | 812,826 | | | | | | | GBP | | | 660,488 | | | JPMorgan Chase Bank N.A. | | | 3/15/17 | | | | (7,083 | ) |
| USD | | | 1,031,106 | | | | | | | GBP | | | 838,615 | | | JPMorgan Chase Bank N.A. | | | 3/15/17 | | | | (9,925 | ) |
| USD | | | 1,057,472 | | | | | | | GBP | | | 832,137 | | | JPMorgan Chase Bank N.A. | | | 3/15/17 | | | | 24,483 | |
| USD | | | 1,163,121 | | | | | | | GBP | | | 948,838 | | | JPMorgan Chase Bank N.A. | | | 3/15/17 | | | | (14,737 | ) |
| USD | | | 4,681 | | | | | | | JPY | | | 529,462 | | | JPMorgan Chase Bank N.A. | | | 3/15/17 | | | | (36 | ) |
| USD | | | 16,464 | | | | | | | JPY | | | 1,926,652 | | | JPMorgan Chase Bank N.A. | | | 3/15/17 | | | | (698 | ) |
| USD | | | 33,662 | | | | | | | JPY | | | 3,961,611 | | | JPMorgan Chase Bank N.A. | | | 3/15/17 | | | | (1,626 | ) |
| USD | | | 42,222 | | | | | | | JPY | | | 4,907,455 | | | JPMorgan Chase Bank N.A. | | | 3/15/17 | | | | (1,490 | ) |
| USD | | | 46,057 | | | | | | | JPY | | | 5,381,374 | | | JPMorgan Chase Bank N.A. | | | 3/15/17 | | | | (1,877 | ) |
| USD | | | 46,371 | | | | | | | JPY | | | 5,267,796 | | | JPMorgan Chase Bank N.A. | | | 3/15/17 | | | | (552 | ) |
| USD | | | 48,919 | | | | | | | JPY | | | 5,539,630 | | | JPMorgan Chase Bank N.A. | | | 3/15/17 | | | | (425 | ) |
| USD | | | 53,489 | | | | | | | JPY | | | 6,029,388 | | | JPMorgan Chase Bank N.A. | | | 3/15/17 | | | | (217 | ) |
| USD | | | 59,939 | | | | | | | JPY | | | 7,030,202 | | | JPMorgan Chase Bank N.A. | | | 3/15/17 | | | | (2,682 | ) |
| USD | | | 61,634 | | | | | | | JPY | | | 7,036,361 | | | JPMorgan Chase Bank N.A. | | | 3/15/17 | | | | (1,042 | ) |
| USD | | | 83,312 | | | | | | | JPY | | | 9,464,454 | | | JPMorgan Chase Bank N.A. | | | 3/15/17 | | | | (991 | ) |
| USD | | | 104,546 | | | | | | | JPY | | | 11,838,998 | | | JPMorgan Chase Bank N.A. | | | 3/15/17 | | | | (909 | ) |
| USD | | | 110,689 | | | | | | | JPY | | | 12,953,304 | | | JPMorgan Chase Bank N.A. | | | 3/15/17 | | | | (4,691 | ) |
| USD | | | 117,394 | | | | | | | JPY | | | 13,278,562 | | | JPMorgan Chase Bank N.A. | | | 3/15/17 | | | | (883 | ) |
| USD | | | 122,063 | | | | | | | JPY | | | 13,642,068 | | | JPMorgan Chase Bank N.A. | | | 3/15/17 | | | | 547 | |
| USD | | | 133,247 | | | | | | | JPY | | | 15,212,045 | | | JPMorgan Chase Bank N.A. | | | 3/15/17 | | | | (2,253 | ) |
| USD | | | 137,571 | | | | | | | JPY | | | 15,957,259 | | | JPMorgan Chase Bank N.A. | | | 3/15/17 | | | | (4,567 | ) |
| USD | | | 137,849 | | | | | | | JPY | | | 15,550,142 | | | JPMorgan Chase Bank N.A. | | | 3/15/17 | | | | (662 | ) |
| USD | | | 149,400 | | | | | | | JPY | | | 17,582,687 | | | JPMorgan Chase Bank N.A. | | | 3/15/17 | | | | (7,216 | ) |
| USD | | | 161,956 | | | | | | | JPY | | | 18,223,150 | | | JPMorgan Chase Bank N.A. | | | 3/15/17 | | | | (364 | ) |
| USD | | | 169,684 | | | | | | | JPY | | | 19,232,601 | | | JPMorgan Chase Bank N.A. | | | 3/15/17 | | | | (1,629 | ) |
| USD | | | 176,556 | | | | | | | JPY | | | 20,426,169 | | | JPMorgan Chase Bank N.A. | | | 3/15/17 | | | | (5,388 | ) |
| USD | | | 265,329 | | | | | | | JPY | | | 30,117,641 | | | JPMorgan Chase Bank N.A. | | | 3/15/17 | | | | (2,941 | ) |
| USD | | | 282,459 | | | | | | | JPY | | | 32,688,819 | | | JPMorgan Chase Bank N.A. | | | 3/15/17 | | | | (8,713 | ) |
| USD | | | 300,409 | | | | | | | JPY | | | 35,100,027 | | | JPMorgan Chase Bank N.A. | | | 3/15/17 | | | | (12,241 | ) |
| USD | | | 349,752 | | | | | | | JPY | | | 41,037,198 | | | JPMorgan Chase Bank N.A. | | | 3/15/17 | | | | (15,783 | ) |
| USD | | | 393,701 | | | | | | | JPY | | | 44,557,614 | | | JPMorgan Chase Bank N.A. | | | 3/15/17 | | | | (3,192 | ) |
| USD | | | 403,586 | | | | | | | JPY | | | 45,432,311 | | | JPMorgan Chase Bank N.A. | | | 3/15/17 | | | | (1,098 | ) |
| USD | | | 412,053 | | | | | | | JPY | | | 46,207,073 | | | JPMorgan Chase Bank N.A. | | | 3/15/17 | | | | 468 | |
| USD | | | 433,285 | | | | | | | JPY | | | 48,425,202 | | | JPMorgan Chase Bank N.A. | | | 3/15/17 | | | | 1,943 | |
| USD | | | 433,380 | | | | | | | JPY | | | 48,414,707 | | | JPMorgan Chase Bank N.A. | | | 3/15/17 | | | | 2,131 | |
| USD | | | 539,595 | | | | | | | JPY | | | 61,554,342 | | | JPMorgan Chase Bank N.A. | | | 3/15/17 | | | | (8,694 | ) |
| USD | | | 581,704 | | | | | | | JPY | | | 68,210,928 | | | JPMorgan Chase Bank N.A. | | | 3/15/17 | | | | (25,878 | ) |
| USD | | | 583,782 | | | | | | | JPY | | | 66,168,129 | | | JPMorgan Chase Bank N.A. | | | 3/15/17 | | | | (5,604 | ) |
| USD | | | 590,879 | | | | | | | JPY | | | 66,839,423 | | | JPMorgan Chase Bank N.A. | | | 3/15/17 | | | | (4,487 | ) |
| USD | | | 704,980 | | | | | | | JPY | | | 80,278,782 | | | JPMorgan Chase Bank N.A. | | | 3/15/17 | | | | (10,095 | ) |
| USD | | | 108 | | | | | | | NOK | | | 905 | | | JPMorgan Chase Bank N.A. | | | 3/15/17 | | | | — | |
| USD | | | 126 | | | | | | | NOK | | | 1,091 | | | JPMorgan Chase Bank N.A. | | | 3/15/17 | | | | (4 | ) |
| USD | | | 126 | | | | | | | NOK | | | 1,091 | | | JPMorgan Chase Bank N.A. | | | 3/15/17 | | | | (4 | ) |
See Notes to Consolidated Financial Statements.
| | | | | | |
| | | BLACKROCK MULTI-MANAGER ALTERNATIVE STRATEGIES FUND | | FEBRUARY 28, 2017 | | 25 |
| | | | |
| Consolidated Schedule of Investments (continued) | | | | |
| | | | | | | | | | | | | | | | | | | | | | | | |
Currency Purchased | | | | | | Currency Sold | | | Counterparty | | Settlement
Date | | | Unrealized
Appreciation
(Depreciation) | |
| USD | | | 126 | | | | | | | NOK | | | 1,091 | | | JPMorgan Chase Bank N.A. | | | 3/15/17 | | | $ | (4 | ) |
| USD | | | 143 | | | | | | | NOK | | | 1,240 | | | JPMorgan Chase Bank N.A. | | | 3/15/17 | | | | (5 | ) |
| USD | | | 4,964 | | | | | | | NOK | | | 41,316 | | | JPMorgan Chase Bank N.A. | | | 3/15/17 | | | | 35 | |
| USD | | | 15,464 | | | | | | | NOK | | | 129,670 | | | JPMorgan Chase Bank N.A. | | | 3/15/17 | | | | (5 | ) |
| USD | | | 19,771 | | | | | | | NOK | | | 165,094 | | | JPMorgan Chase Bank N.A. | | | 3/15/17 | | | | 76 | |
| USD | | | 21,994 | | | | | | | NOK | | | 182,747 | | | JPMorgan Chase Bank N.A. | | | 3/15/17 | | | | 193 | |
| USD | | | 24,661 | | | | | | | NOK | | | 205,275 | | | JPMorgan Chase Bank N.A. | | | 3/15/17 | | | | 172 | |
| USD | | | 29,749 | | | | | | | NOK | | | 248,452 | | | JPMorgan Chase Bank N.A. | | | 3/15/17 | | | | 109 | |
| USD | | | 41,793 | | | | | | | NOK | | | 343,358 | | | JPMorgan Chase Bank N.A. | | | 3/15/17 | | | | 831 | |
| USD | | | 49,489 | | | | | | | NOK | | | 413,887 | | | JPMorgan Chase Bank N.A. | | | 3/15/17 | | | | 114 | |
| USD | | | 59,877 | | | | | | | NOK | | | 494,272 | | | JPMorgan Chase Bank N.A. | | | 3/15/17 | | | | 912 | |
| USD | | | 61,421 | | | | | | | NOK | | | 510,689 | | | JPMorgan Chase Bank N.A. | | | 3/15/17 | | | | 497 | |
| USD | | | 65,417 | | | | | | | NOK | | | 540,337 | | | JPMorgan Chase Bank N.A. | | | 3/15/17 | | | | 957 | |
| USD | | | 67,148 | | | | | | | NOK | | | 576,318 | | | JPMorgan Chase Bank N.A. | | | 3/15/17 | | | | (1,605 | ) |
| USD | | | 71,584 | | | | | | | NOK | | | 600,306 | | | JPMorgan Chase Bank N.A. | | | 3/15/17 | | | | (30 | ) |
| USD | | | 72,333 | | | | | | | NOK | | | 603,254 | | | JPMorgan Chase Bank N.A. | | | 3/15/17 | | | | 367 | |
| USD | | | 178,074 | | | | | | | NOK | | | 1,543,282 | | | JPMorgan Chase Bank N.A. | | | 3/15/17 | | | | (6,034 | ) |
| USD | | | 178,074 | | | | | | | NOK | | | 1,543,389 | | | JPMorgan Chase Bank N.A. | | | 3/15/17 | | | | (6,047 | ) |
| USD | | | 178,074 | | | | | | | NOK | | | 1,543,676 | | | JPMorgan Chase Bank N.A. | | | 3/15/17 | | | | (6,081 | ) |
| USD | | | 202,992 | | | | | | | NOK | | | 1,759,218 | | | JPMorgan Chase Bank N.A. | | | 3/15/17 | | | | (6,877 | ) |
| USD | | | 426 | | | | | | | NZD | | | 591 | | | JPMorgan Chase Bank N.A. | | | 3/15/17 | | | | 1 | |
| USD | | | 844 | | | | | | | NZD | | | 1,224 | | | JPMorgan Chase Bank N.A. | | | 3/15/17 | | | | (37 | ) |
| USD | | | 7,394 | | | | | | | NZD | | | 10,287 | | | JPMorgan Chase Bank N.A. | | | 3/15/17 | | | | (12 | ) |
| USD | | | 8,941 | | | | | | | NZD | | | 12,874 | | | JPMorgan Chase Bank N.A. | | | 3/15/17 | | | | (327 | ) |
| USD | | | 14,130 | | | | | | | NZD | | | 19,346 | | | JPMorgan Chase Bank N.A. | | | 3/15/17 | | | | 202 | |
| USD | | | 21,762 | | | | | | | NZD | | | 30,316 | | | JPMorgan Chase Bank N.A. | | | 3/15/17 | | | | (64 | ) |
| USD | | | 35,665 | | | | | | | NZD | | | 49,232 | | | JPMorgan Chase Bank N.A. | | | 3/15/17 | | | | 220 | |
| USD | | | 37,508 | | | | | | | NZD | | | 51,777 | | | JPMorgan Chase Bank N.A. | | | 3/15/17 | | | | 231 | |
| USD | | | 44,159 | | | | | | | NZD | | | 61,503 | | | JPMorgan Chase Bank N.A. | | | 3/15/17 | | | | (121 | ) |
| USD | | | 45,072 | | | | | | | NZD | | | 62,232 | | | JPMorgan Chase Bank N.A. | | | 3/15/17 | | | | 267 | |
| USD | | | 47,155 | | | | | | | NZD | | | 65,901 | | | JPMorgan Chase Bank N.A. | | | 3/15/17 | | | | (290 | ) |
| USD | | | 61,813 | | | | | | | NZD | | | 86,080 | | | JPMorgan Chase Bank N.A. | | | 3/15/17 | | | | (160 | ) |
| USD | | | 69,534 | | | | | | | NZD | | | 96,751 | | | JPMorgan Chase Bank N.A. | | | 3/15/17 | | | | (122 | ) |
| USD | | | 70,123 | | | | | | | NZD | | | 97,714 | | | JPMorgan Chase Bank N.A. | | | 3/15/17 | | | | (226 | ) |
| USD | | | 88,118 | | | | | | | NZD | | | 121,897 | | | JPMorgan Chase Bank N.A. | | | 3/15/17 | | | | 358 | |
| USD | | | 91,733 | | | | | | | NZD | | | 132,237 | | | JPMorgan Chase Bank N.A. | | | 3/15/17 | | | | (3,472 | ) |
| USD | | | 113,619 | | | | | | | NZD | | | 157,378 | | | JPMorgan Chase Bank N.A. | | | 3/15/17 | | | | 314 | |
| USD | | | 123,980 | | | | | | | NZD | | | 172,479 | | | JPMorgan Chase Bank N.A. | | | 3/15/17 | | | | (197 | ) |
| USD | | | 337,545 | | | | | | | NZD | | | 477,237 | | | JPMorgan Chase Bank N.A. | | | 3/15/17 | | | | (6,044 | ) |
| USD | | | 537,606 | | | | | | | NZD | | | 764,036 | | | JPMorgan Chase Bank N.A. | | | 3/15/17 | | | | (12,465 | ) |
| USD | | | 651,182 | | | | | | | NZD | | | 929,662 | | | JPMorgan Chase Bank N.A. | | | 3/15/17 | | | | (18,132 | ) |
| USD | | | 676,127 | | | | | | | NZD | | | 941,196 | | | JPMorgan Chase Bank N.A. | | | 3/15/17 | | | | (1,491 | ) |
| USD | | | 108 | | | | | | | SEK | | | 987 | | | JPMorgan Chase Bank N.A. | | | 3/15/17 | | | | (1 | ) |
| USD | | | 337 | | | | | | | SEK | | | 3,084 | | | JPMorgan Chase Bank N.A. | | | 3/15/17 | | | | (5 | ) |
| USD | | | 3,495 | | | | | | | SEK | | | 30,581 | | | JPMorgan Chase Bank N.A. | | | 3/15/17 | | | | 105 | |
| USD | | | 4,003 | | | | | | | SEK | | | 35,027 | | | JPMorgan Chase Bank N.A. | | | 3/15/17 | | | | 120 | |
| USD | | | 4,182 | | | | | | | SEK | | | 36,825 | | | JPMorgan Chase Bank N.A. | | | 3/15/17 | | | | 99 | |
| USD | | | 4,441 | | | | | | | SEK | | | 39,543 | | | JPMorgan Chase Bank N.A. | | | 3/15/17 | | | | 57 | |
See Notes to Consolidated Financial Statements.
| | | | | | |
| 26 | | BLACKROCK MULTI-MANAGER ALTERNATIVE STRATEGIES FUND | | FEBRUARY 28, 2017 | | |
| | | | |
| Consolidated Schedule of Investments (continued) | | | | |
| | | | | | | | | | | | | | | | | | | | | | | | | | |
Currency Purchased | | | | | | Currency Sold | | | Counterparty | | Settlement
Date | | | Unrealized
Appreciation
(Depreciation) | |
| USD | | | 6,899 | | | | | | | | SEK | | | | 60,851 | | | JPMorgan Chase Bank N.A. | | | 3/15/17 | | | $ | 152 | |
| USD | | | 7,390 | | | | | | | | SEK | | | | 65,220 | | | JPMorgan Chase Bank N.A. | | | 3/15/17 | | | | 158 | |
| USD | | | 12,683 | | | | | | | | SEK | | | | 111,940 | | | JPMorgan Chase Bank N.A. | | | 3/15/17 | | | | 272 | |
| USD | | | 16,730 | | | | | | | | SEK | | | | 152,523 | | | JPMorgan Chase Bank N.A. | | | 3/15/17 | | | | (181 | ) |
| USD | | | 21,518 | | | | | | | | SEK | | | | 189,152 | | | JPMorgan Chase Bank N.A. | | | 3/15/17 | | | | 545 | |
| USD | | | 22,419 | | | | | | | | SEK | | | | 209,209 | | | JPMorgan Chase Bank N.A. | | | 3/15/17 | | | | (778 | ) |
| USD | | | 23,966 | | | | | | | | SEK | | | | 213,376 | | | JPMorgan Chase Bank N.A. | | | 3/15/17 | | | | 308 | |
| USD | | | 24,761 | | | | | | | | SEK | | | | 219,059 | | | JPMorgan Chase Bank N.A. | | | 3/15/17 | | | | 473 | |
| USD | | | 35,842 | | | | | | | | SEK | | | | 317,499 | | | JPMorgan Chase Bank N.A. | | | 3/15/17 | | | | 638 | |
| USD | | | 45,047 | | | | | | | | SEK | | | | 398,523 | | | JPMorgan Chase Bank N.A. | | | 3/15/17 | | | | 860 | |
| USD | | | 72,398 | | | | | | | | SEK | | | | 633,465 | | | JPMorgan Chase Bank N.A. | | | 3/15/17 | | | | 2,161 | |
| USD | | | 85,510 | | | | | | | | SEK | | | | 782,631 | | | JPMorgan Chase Bank N.A. | | | 3/15/17 | | | | (1,266 | ) |
| USD | | | 87,282 | | | | | | | | SEK | | | | 769,899 | | | JPMorgan Chase Bank N.A. | | | 3/15/17 | | | | 1,918 | |
| USD | | | 95,273 | | | | | | | | SEK | | | | 838,867 | | | JPMorgan Chase Bank N.A. | | | 3/15/17 | | | | 2,262 | |
| USD | | | 116,888 | | | | | | | | SEK | | | | 1,049,284 | | | JPMorgan Chase Bank N.A. | | | 3/15/17 | | | | 547 | |
| USD | | | 304,410 | | | | | | | | SEK | | | | 2,720,768 | | | JPMorgan Chase Bank N.A. | | | 3/15/17 | | | | 2,739 | |
| USD | | | 402,271 | | | | | | | | SEK | | | | 3,677,131 | | | JPMorgan Chase Bank N.A. | | | 3/15/17 | | | | (5,439 | ) |
| USD | | | 448,839 | | | | | | | | SEK | | | | 3,975,161 | | | JPMorgan Chase Bank N.A. | | | 3/15/17 | | | | 8,084 | |
| USD | | | 592,927 | | | | | | | | SEK | | | | 5,401,801 | | | JPMorgan Chase Bank N.A. | | | 3/15/17 | | | | (6,010 | ) |
| USD | | | 870,587 | | | | | | | | SEK | | | | 8,032,896 | | | JPMorgan Chase Bank N.A. | | | 3/15/17 | | | | (20,078 | ) |
| USD | | | 3,390,959 | | | | | | | | SEK | | | | 30,914,162 | | | JPMorgan Chase Bank N.A. | | | 3/15/17 | | | | (36,717 | ) |
| DKK | | | 705,635 | | | | | | | | USD | | | | 100,611 | | | JPMorgan Chase Bank N.A. | | | 3/16/17 | | | | 38 | |
| USD | | | 39,616 | | | | | | | | CHF | | | | 39,669 | | | JPMorgan Chase Bank N.A. | | | 3/16/17 | | | | 78 | |
| USD | | | 80,008 | | | | | | | | CHF | | | | 79,878 | | | JPMorgan Chase Bank N.A. | | | 3/16/17 | | | | 394 | |
| USD | | | 80,082 | | | | | | | | CHF | | | | 79,878 | | | JPMorgan Chase Bank N.A. | | | 3/16/17 | | | | 469 | |
| USD | | | 303,627 | | | | | | | | DKK | | | | 2,123,291 | | | JPMorgan Chase Bank N.A. | | | 3/16/17 | | | | 769 | |
| USD | | | 4,155 | | | | | | | | EUR | | | | 3,920 | | | JPMorgan Chase Bank N.A. | | | 3/16/17 | | | | (1 | ) |
| USD | | | 10,581 | | | | | | | | EUR | | | | 10,018 | | | JPMorgan Chase Bank N.A. | | | 3/16/17 | | | | (40 | ) |
| USD | | | 16,803 | | | | | | | | EUR | | | | 15,854 | | | JPMorgan Chase Bank N.A. | | | 3/16/17 | | | | (6 | ) |
| USD | | | 29,044 | | | | | | | | EUR | | | | 27,447 | | | JPMorgan Chase Bank N.A. | | | 3/16/17 | | | | (57 | ) |
| USD | | | 59,341 | | | | | | | | EUR | | | | 56,183 | | | JPMorgan Chase Bank N.A. | | | 3/16/17 | | | | (226 | ) |
| USD | | | 147,862 | | | | | | | | EUR | | | | 139,248 | | | JPMorgan Chase Bank N.A. | | | 3/16/17 | | | | 225 | |
| USD | | | 798,523 | | | | | | | | EUR | | | | 751,030 | | | JPMorgan Chase Bank N.A. | | | 3/16/17 | | | | 2,247 | |
| USD | | | 4,706 | | | | | | | | GBP | | | | 3,787 | | | JPMorgan Chase Bank N.A. | | | 3/16/17 | | | | 5 | |
| USD | | | 6,119 | | | | | | | | GBP | | | | 4,874 | | | JPMorgan Chase Bank N.A. | | | 3/16/17 | | | | 69 | |
| USD | | | 712 | | | | | | | | NOK | | | | 5,952 | | | JPMorgan Chase Bank N.A. | | | 3/16/17 | | | | 2 | |
| USD | | | 20,990 | | | | | | | | SEK | | | | 188,389 | | | JPMorgan Chase Bank N.A. | | | 3/16/17 | | | | 101 | |
| USD | | | 21,544 | | | | | | | | SEK | | | | 194,799 | | | JPMorgan Chase Bank N.A. | | | 3/16/17 | | | | (56 | ) |
| USD | | | 82,711 | | | | | | | | SEK | | | | 736,303 | | | JPMorgan Chase Bank N.A. | | | 3/16/17 | | | | 1,068 | |
| USD | | | 409,700 | | | | | | | | EUR | | | | 386,500 | | | J.P. Morgan Securities LLC | | | 3/17/17 | | | | (105 | ) |
| USD | | | 2,237,721 | | | | | | | | EUR | | | | 2,123,800 | | | Bank of America N.A. | | | 4/06/17 | | | | (16,281 | ) |
| USD | | | 21,554 | | | | | | | | EUR | | | | 20,000 | | | Bank of America N.A. | | | 4/25/17 | | | | 310 | |
Total | | | | | | | | | | | | | | | | | | | | | $ | 211,759 | |
| | | | | | | | | | | | | | | | | | | | | | | | | | |
| | | | | | | | | | | | | | | | | | |
| Exchange-Traded Options Purchased | | | | | | | | | | | | | | | |
| Description | | Put/
Call | | | Expiration Date | | Strike Price | | | Contracts | | Value | |
Arconic, Inc. | | | Call | | | 3/17/17 | | USD | | | 30.00 | | | 8 | | $ | 428 | |
See Notes to Consolidated Financial Statements.
| | | | | | |
| | | BLACKROCK MULTI-MANAGER ALTERNATIVE STRATEGIES FUND | | FEBRUARY 28, 2017 | | 27 |
| | | | |
| Consolidated Schedule of Investments (continued) | | | | |
| | | | | | | | | | | | | | | | | | | | | | | | | | | | | | |
| Description | | Put/
Call | | Expiration Date | | Strike Price | | Contracts | | Value |
Arconic, Inc. | | | | Call | | | 3/17/17 | | | | USD | | | | | 29.00 | | | | | 7 | | | | $ | 634 | |
Citigroup, Inc. | | | | Call | | | 3/17/17 | | | | USD | | | | | 57.00 | | | | | 68 | | | | | 1,904 | |
iPath S&P 500 VIX Short Term Futures TM ETN1 | | | | Call | | | 3/17/17 | | | | USD | | | | | 27.00 | | | | | 58 | | | | | 464 | |
iShares Edge MSCI Min Vol USA ETF | | | | Call | | | 3/17/17 | | | | USD | | | | | 48.00 | | | | | 120 | | | | | 3,900 | |
iShares MSCI Emerging Markets Index ETF | | | | Call | | | 3/17/17 | | | | USD | | | | | 34.00 | | | | | 61 | | | | | 23,790 | |
Kraft Heinz Co. | | | | Call | | | 3/17/17 | | | | USD | | | | | 95.00 | | | | | 37 | | | | | 1,110 | |
William Lyon Home, Class A | | | | Call | | | 3/17/17 | | | | USD | | | | | 20.00 | | | | | 6 | | | | | 75 | |
Arconic, Inc. | | | | Call | | | 4/21/17 | | | | USD | | | | | 30.00 | | | | | 17 | | | | | 2,227 | |
Arconic, Inc. | | | | Call | | | 4/21/17 | | | | USD | | | | | 31.00 | | | | | 17 | | | | | 1,675 | |
Deutsche Bank AG | | | | Call | | | 4/21/17 | | | | USD | | | | | 18.00 | | | | | 83 | | | | | 17,803 | |
Rogers Corp. | | | | Call | | | 4/21/17 | | | | CHF | | | | | 240.00 | | | | | 11 | | | | | 9,069 | |
Telefonica SA - ADR | | | | Call | | | 4/21/17 | | | | USD | | | | | 10.00 | | | | | 72 | | | | | 2,520 | |
Transocean Ltd. | | | | Call | | | 5/19/17 | | | | USD | | | | | 17.00 | | | | | 67 | | | | | 1,474 | |
Allergan PLC | | | | Call | | | 6/16/17 | | | | USD | | | | | 295.00 | | | | | 10 | | | | | 1,390 | |
Telefonica SA - ADR | | | | Call | | | 6/16/17 | | | | USD | | | | | 10.00 | | | | | 2 | | | | | 105 | |
Arconic, Inc. | | | | Call | | | 7/21/17 | | | | USD | | | | | 31.00 | | | | | 3 | | | | | 643 | |
Centennial Resource Development, Inc. | | | | Call | | | 7/21/17 | | | | USD | | | | | 20.00 | | | | | 2 | | | | | 230 | |
General Mills, Inc. | | | | Call | | | 7/21/17 | | | | USD | | | | | 70.00 | | | | | 73 | | | | | 2,482 | |
General Mills, Inc. | | | | Call | | | 7/21/17 | | | | USD | | | | | 55.00 | | | | | 61 | | | | | 38,125 | |
Comcast Corp. | | | | Call | | | 9/15/17 | | | | USD | | | | | 42.50 | | | | | 124 | | | | | 6,386 | |
Comcast Corp. | | | | Call | | | 9/15/17 | | | | USD | | | | | 32.50 | | | | | 102 | | | | | 56,610 | |
Telefonica SA - ADR | | | | Call | | | 9/15/17 | | | | USD | | | | | 10.00 | | | | | 18 | | | | | 1,305 | |
3M Co. | | | | Call | | | 1/19/18 | | | | USD | | | | | 210.00 | | | | | 51 | | | | | 14,994 | |
3M Co. | | | | Call | | | 1/19/18 | | | | USD | | | | | 160.00 | | | | | 33 | | | | | 100,897 | |
Linn Energy LLC | | | | Call | | | 1/19/18 | | | | USD | | | | | 3.00 | | | | | 49 | | | | | 245 | |
Mondelez International, Inc., Class A | | | | Call | | | 1/19/18 | | | | USD | | | | | 30.00 | | | | | 23 | | | | | 32,085 | |
Mondelez International, Inc., Class A | | | | Call | | | 1/19/18 | | | | USD | | | | | 55.00 | | | | | 14 | | | | | 1,204 | |
SPDR DJ Euro STOXX 50 ETF | | | | Call | | | 1/19/18 | | | | USD | | | | | 32.00 | | | | | 109 | | | | | 35,970 | |
Walt Disney Co. | | | | Call | | | 1/19/18 | | | | USD | | | | | 90.00 | | | | | 21 | | | | | 46,883 | |
Walt Disney Co. | | | | Call | | | 1/19/18 | | | | USD | | | | | 140.00 | | | | | 17 | | | | | 995 | |
Arconic, Inc. | | | | Put | | | 3/17/17 | | | | USD | | | | | 28.00 | | | | | 3 | | | | | 191 | |
DAX Performance-Index | | | | Put | | | 3/17/17 | | | | EUR | | | | | 11,500.00 | | | | | 14 | | | | | 3,589 | |
DAX Performance-Index | | | | Put | | | 3/17/17 | | | | EUR | | | | | 11,400.00 | | | | | 3 | | | | | 769 | |
DISH Network Corp. | | | | Put | | | 3/17/17 | | | | USD | | | | | 30.00 | | | | | 36 | | | | | 540 | |
FTSE 100 Index | | | | Put | | | 3/17/17 | | | | GBP | | | | | 7,250.00 | | | | | 6 | | | | | 3,741 | |
FTSE 100 Index | | | | Put | | | 3/17/17 | | | | INR | | | | | 7,000.00 | | | | | 2 | | | | | 285 | |
Glencore PLC | | | | Put | | | 3/17/17 | | | | GBP | | | | | 3.10 | | | | | 61 | | | | | 2,649 | |
iPath S&P 500 VIX Short-Term Futures ETN1 | | | | Put | | | 3/17/17 | | | | USD | | | | | 28.00 | | | | | 73 | | | | | 70,810 | |
iShares iBoxx $ High Yield Corporate Bond ETF | | | | Put | | | 3/17/17 | | | | USD | | | | | 86.00 | | | | | 96 | | | | | 768 | |
iShares MSCI Emerging Markets Index ETF | | | | Put | | | 3/17/17 | | | | USD | | | | | 34.00 | | | | | 61 | | | | | 183 | |
Lanxess AG | | | | Put | | | 3/17/17 | | | | EUR | | | | | 64.00 | | | | | 45 | | | | | 7,556 | |
SINA Corp. | | | | Put | | | 3/17/17 | | | | USD | | | | | 60.00 | | | | | 25 | | | | | 75 | |
SunPower Corp. | | | | Put | | | 3/17/17 | | | | USD | | | | | 7.00 | | | | | 85 | | | | | 553 | |
S&P 500 Index | | | | Put | | | 3/31/17 | | | | USD | | | | | 2,290.00 | | | | | 3 | | | | | 3,165 | |
Advanced Micro Devices, Inc. | | | | Put | | | 4/21/17 | | | | USD | | | | | 4.00 | | | | | 100 | | | | | 200 | |
Infosys Ltd. - ADR | | | | Put | | | 4/21/17 | | | | USD | | | | | 14.00 | | | | | 156 | | | | | 3,900 | |
NASDAQ-100 | | | | Put | | | 4/21/17 | | | | USD | | | | | 5,130.00 | | | | | 1 | | | | | 3,730 | |
S&P 500 Index | | | | Put | | | 4/21/17 | | | | USD | | | | | 2,225.00 | | | | | 2 | | | | | 1,980 | |
SPDR S&P 500 ETF Trust | | | | Put | | | 4/21/17 | | | | USD | | | | | 229.00 | | | | | 114 | | | | | 21,489 | |
S&P 500 Index | | | | Put | | | 5/19/17 | | | | USD | | | | | 2,275.00 | | | | | 2 | | | | | 6,110 | |
SunTrust Banks, Inc. | | | | Put | | | 7/21/17 | | | | USD | | | | | 60.00 | | | | | 15 | | | | | 5,850 | |
iPath S&P 500 VIX Short-Term Futures ETN1 | | | | Put | | | 9/15/17 | | | | USD | | | | | 12.00 | | | | | 74 | | | | | 6,142 | |
SPDR DJ Euro STOXX 50 ETF | | | | Put | | | 1/19/18 | | | | USD | | | | | 31.00 | | | | | 109 | | | | | 16,350 | |
Total | | | | | | | | | | | | | | | | | | | | | | | | | | $568,247 | |
| | | | | | | | | | | | | | | | | | | | | | | | | | | | |
| | 1 | | All or a portion of security is held by a wholly-owned subsidiary. See Note 1 of the Notes to Consolidated Financial Statements for details on the wholly-owned subsidiary. |
See Notes to Consolidated Financial Statements.
| | | | | | |
| 28 | | BLACKROCK MULTI-MANAGER ALTERNATIVE STRATEGIES FUND | | FEBRUARY 28, 2017 | | |
| | | | |
| Consolidated Schedule of Investments (continued) | | | | |
| | | | | | | | | | | | | | | | | | | | | | | | | | | | |
| OTC Options Purchased | | | | | | | | | | | | | | | | | | | | | |
| Description | | Put/
Call | | | Counterparty | | | Expiration
Date | | | Strike Price | | | Contracts | | | Value | |
AmphenolCorp. | | | Put | | | | UBS Securities LLC | | | | 07/21/17 | | | | USD | | | | 70.00 | | | | 30 | | | $ | 9,900 | |
| | | | | | | | | | | | | | | | | | | | | | | | |
| Exchange-Traded Options Written | | | | | | | | | | | | | | | | | | |
| Description | | Put/
Call | | | Expiration
Date | | | Strike Price | | | Contracts | | | Value | |
Centennial Resource Development, Inc. | | | Call | | | | 4/21/17 | | | | USD | | | | 15.00 | | | | 10 | | | $ | (4,300 | ) |
VMware, Inc. | | | Call | | | | 4/21/17 | | | | USD | | | | 87.50 | | | | 6 | | | | (2,370 | ) |
VMware, Inc. | | | Call | | | | 4/21/17 | | | | USD | | | | 77.50 | | | | 11 | | | | (14,630 | ) |
General Mills, Inc. | | | Call | | | | 7/21/17 | | | | USD | | | | 62.50 | | | | 124 | | | | (22,196 | ) |
Comcast Corp. | | | Call | | | | 9/15/17 | | | | USD | | | | 37.50 | | | | 206 | | | | (44,290 | ) |
3M Co. | | | Call | | | | 1/19/18 | | | | USD | | | | 180.00 | | | | 62 | | | | (92,690 | ) |
Mondelez International, Inc., Class A | | | Call | | | | 1/19/18 | | | | USD | | | | 42.00 | | | | 35 | | | | (18,200 | ) |
Walt Disney Co. | | | Call | | | | 1/19/18 | | | | USD | | | | 110.00 | | | | 35 | | | | (28,438 | ) |
Centennial Resource Development, Inc. | | | Put | | | | 4/21/17 | | | | USD | | | | 12.50 | | | | 10 | | | | (300 | ) |
S&P 500 Index | | | Put | | | | 4/21/17 | | | | USD | | | | 2,090.00 | | | | 2 | | | | (760 | ) |
SPDR S&P 500 ETF Trust | | | Put | | | | 4/21/17 | | | | USD | | | | 219.00 | | | | 114 | | | | (8,835 | ) |
Total | | | | | | | | | | | | | | | | | | | | | | $ | (237,009 | ) |
| | | | | | | | | | | | | | | | | | | | | | | | |
| | | | | | | | | | | | | | | | | | | | |
| Centrally Cleared Credit Default Swaps - Buy Protection | | | | | | | | | | | | | | | |
Index | | Pay Fixed Rate | | | Expiration Date | | | Notional Amount (000) | | | Unrealized Depreciation | |
CDX.NA.IG Series 22 Version 1 | | | 1.00% | | | | 6/20/19 | | | | USD | | | | 1,300 | | | $ | (13,971 | ) |
CDX.NA.IG Series 23 Version 1 | | | 1.00% | | | | 12/20/19 | | | | USD | | | | 10,000 | | | | (94,268 | ) |
CDX.NA.IG Series 25 Version 1 | | | 1.00% | | | | 12/20/20 | | | | USD | | | | 2,000 | | | | (39,139 | ) |
Total | | | | | | | | | | | | | | | | | | $ | (147,378 | ) |
| | | | | | | | | | | | | | | | | | | | |
| | | | | | | | | | | | | | | | | | | | |
| | | | | | | | | | | | | | | | | | | | |
| Centrally Cleared Interest Rate Swaps | | | | | | | | | | | | | | | |
Fixed Rate | | Floating Rate | | | Expiration
Date | | | Notional
Amount (000) | | | Unrealized
Depreciation | |
1.76%1 | | | 3-month LIBOR | | | | 3/12/20 | | | | USD | | | | 3,000 | | | $ | (21,323 | ) |
2.02%1 | | | 3-month LIBOR | | | | 3/12/22 | | | | USD | | | | 2,000 | | | | (18,638 | ) |
2.33%1 | | | 3-month LIBOR | | | | 7/30/25 | | | | USD | | | | 450 | | | | (3,527 | ) |
Total | | | | | | | | | | | | | | | | | | $ | (43,488 | ) |
| | | | | | | | | | | | | | | | | | | | |
1 Fund pays the fixed rate and receives the floating rate.
| | | | | | | | | | | | | | | | | | | | | | | | | | | | |
| OTC Credit Default Swaps - Buy Protection | | | | | | | | | | | | | | | | | |
| Issuer | | Pay
Fixed
Rate | | | Counterparty | | Expiration
Date | | | Notional
Amount
(000) | | | Value | | | Premiums
Paid
(Received) | | | Unrealized
Appreciation
(Depreciation) | |
Rallye SA | | | 5.00 | % | | Barclays Bank PLC | | | 12/20/17 | | | EUR | | | 24 | | | $ | (956 | ) | | $ | 1,013 | | | $ | (1,969 | ) |
Telefonica SA | | | 1.00 | % | | Barclays Bank PLC | | | 9/20/19 | | | EUR | | | 400 | | | | (6,172 | ) | | | 159 | | | | (6,331 | ) |
Windstream Corp. | | | 5.00 | % | | Morgan Stanley & Co. International PLC | | | 9/20/19 | | | USD | | | 550 | | | | (46,502 | ) | | | (30,408 | ) | | | (16,094 | ) |
Telefonica SA | | | 1.00 | % | | Barclays Bank PLC | | | 12/20/19 | | | EUR | | | 378 | | | | (6,736 | ) | | | 1,168 | | | | (7,904 | ) |
Rallye SA | | | 5.00 | % | | JPMorgan Chase Bank N.A. | | | 6/20/20 | | | EUR | | | 225 | | | | 563 | | | | (18,529 | ) | | | 19,092 | |
Windstream Corp. | | | 5.00 | % | | Bank of America N.A. | | | 6/20/20 | | | USD | | | 100 | | | | (7,088 | ) | | | (1,038 | ) | | | (6,050 | ) |
Federative Republic of Brazil | | | 1.00 | % | | Barclays Bank PLC | | | 6/20/20 | | | USD | | | 150 | | | | 2,099 | | | | 8,906 | | | | (6,807 | ) |
Federative Republic of Brazil | | | 1.00 | % | | JPMorgan Chase Bank N.A. | | | 6/20/20 | | | USD | | | 150 | | | | 2,088 | | | | 9,199 | | | | (7,111 | ) |
ArcelorMittal | | | 1.00 | % | | Barclays Bank PLC | | | 12/20/20 | | | EUR | | | 108 | | | | 1,971 | | | | 15,235 | | | | (13,264 | ) |
See Notes to Consolidated Financial Statements.
| | | | | | |
| | | BLACKROCK MULTI-MANAGER ALTERNATIVE STRATEGIES FUND | | FEBRUARY 28, 2017 | | 29 |
| | | | |
| Consolidated Schedule of Investments (continued) | | | | |
| | | | | | | | | | | | | | | | | | | | | | | | | | | | | | |
| Issuer | | Pay
Fixed
Rate | | | Counterparty | | Expiration
Date | | | Notional
Amount (000) | | | Value | | | Premiums
Paid
(Received) | | | Unrealized
Appreciation
(Depreciation) | |
Neiman Marcus Group, Inc. | | | 5.00 | % | | Barclays Bank PLC | | | 12/20/20 | | | | USD | | | | 28 | | | $ | 3,113 | | | $ | 283 | | | $ | 2,830 | |
Neiman Marcus Group, Inc. | | | 5.00 | % | | Morgan Stanley & Co. International PLC | | | 12/20/20 | | | | USD | | | | 38 | | | | 4,227 | | | | 395 | | | | 3,832 | |
Telecom Italia SpA | | | 1.00 | % | | JPMorgan Chase Bank N.A. | | | 6/20/21 | | | | EUR | | | | 229 | | | | 9,763 | | | | 12,194 | | | | (2,431 | ) |
ITOCHU Corp. | | | 1.00 | % | | Barclays Bank PLC | | | 6/20/21 | | | | JPY | | | | 10,000 | | | | (2,805 | ) | | | (1,853 | ) | | | (952 | ) |
iStar, Inc. | | | 5.00 | % | | JPMorgan Chase Bank N.A. | | | 6/20/21 | | | | USD | | | | 160 | | | | (7,677 | ) | | | (1,014 | ) | | | (6,663 | ) |
Stena Line Sweden AB | | | 5.00 | % | | J.P. Morgan Securities LLC | | | 12/20/21 | | | | EUR | | | | 200 | | | | 7,162 | | | | 23,002 | | | | (15,840 | ) |
R. R. Donnelley & Sons Co. | | | 5.00 | % | | JPMorgan Chase Bank N.A. | | | 12/20/21 | | | | USD | | | | 51 | | | | (3,436 | ) | | | (2,239 | ) | | | (1,197 | ) |
Total | | | | | | | | | | | | | | | | | | | | $ | (50,386 | ) | | $ | 16,473 | | | $ | (66,859 | ) |
| | | | | | | | | | | | | | | | | | | | | | |
| | | | | | | | | | | | | | | | | | | | | | | | | | | | | | | | |
| OTC Credit Default Swaps - Sell Protection | | | | | | | | | | | | | | | | | | | | | | | | | |
| Issuer | | Receive
Fixed
Rate | | | Counterparty | | Expiration
Date | | Credit
Rating1 | | | Notional
Amount
(000)2 | | | Value | | | Premiums
Received | | | Unrealized
Depreciation | |
Caterpillar, Inc. | | | 0.62% | | | Morgan Stanley & Co. LLC | | 12/20/21 | | | A | | | | USD | | | | 200 | | | $ | (4,463 | ) | | | $(3,474) | | | | $(989) | |
| | 1 | | Using S&P’s rating of the issuer. |
| | 2 | | The maximum potential amount the Fund may pay should a negative credit event take place as defined under the terms of the agreement. |
| | | | | | | | | | | | | | | | | | | | | | | | | | | | | | | | | | |
| OTC Total Return Swaps | | | | | | | | | | | | | | | | |
| Reference Entity | | Floating Rate | | Counterparty | | Expiration
Date | | Notional
Amount (000)/
Contract Amount | | Value | | Premiums
Paid
(Received) | | Unrealized
Appreciation
(Depreciation) |
Nortel Networks Ltd. | | 3-month LIBOR plus 1.50%1 | | Deutsche Bank AG | | | | 5/15/17 | | | | | USD | | | | | 1,200 | | | | $ | 5,467 | | | | | — | | | | $ | 5,467 | |
Nortel Networks Ltd. | | 3-month LIBOR plus 1.50%1 | | Deutsche Bank AG | | | | 5/15/17 | | | | | USD | | | | | 2,500 | | | | | 25,572 | | | | | — | | | | | 25,572 | |
Euro STOXX 600 Gross Index | | 6-month EURIBOR2 | | Morgan Stanley & Co. International PLC | | | | 12/31/49 | | | | | EUR | | | | | 5,993 | 3 | | | | (26,016 | ) | | | | — | | | | | (26,016 | ) |
FTSE 350 Mining Index | | 6-month GBP LIBOR2 | | Morgan Stanley & Co. International PLC | | | | 12/31/49 | | | | | GBP | | | | | 1 | 3 | | | | 99 | | | | | — | | | | | 99 | |
Total | | | | | | | | | | | | | | | | | | | | | | $ | 5,122 | | | | | — | | | | $ | 5,122 | |
| | | | | | | | | | | | | | | | | | | | | | | | |
1 Fund receives the total return of the reference entity and pays the floating rate.
2 Fund pays the total return of the reference entity and receives the floating rate.
3 Contract amount shown.
| | | | | | | | | | | | | | | | |
| Reference Entity1 | | Counterparty | | Expiration Dates | | Net Notional
Amount | | | Unrealized
Appreciation | | | Net Value of
Reference
Entities | |
Equity Securities Long/Short | | Morgan Stanley & Co. International PLC | | 5/09/18-2/20/19 | | USD | 535,273 | | | | $20,5192 | | | | $550,214 | |
| | 1 | The Fund receives or pays the total return on a portfolio of long and short positions underlying the total return swap. In addition, the Fund pays or receives a variable rate of interest, based on a specified benchmark, plus or minus a spread in a range of 20-829 basis points. The benchmark and spread are determined based upon the country and/or currency of the individual underlying positions. The Overnight Bank Funding Rate is the specified benchmarks used in determining the variable rate of interest. |
| | 2 | Amount includes $5,578 of net dividends and financing fees. |
The following table represents the individual long and short positions and related values of equity securities underlying the total return swap with Morgan Stanley & Co. International PLC, as of period end, expiration dates 5/09/18-2/20/19:
| | | | | | | | |
| | | Shares | | | Value | |
| Reference Entity — Long | | | | | | | | |
Bayer AG | | | 1,089 | | | $ | 119,864 | |
British Land Co. PLC | | | 21,930 | | | | 167,956 | |
Coca-Cola European Partners PLC | | | 4,313 | | | | 149,618 | |
Imperial Brands PLC | | | 5,217 | | | | 245,591 | |
Lloyds Banking Group PLC | | | 160,916 | | | | 137,183 | |
Micro Focus International PLC | | | 6,282 | | | | 170,249 | |
Renault SA | | | 3,387 | | | | 300,639 | |
RPC Group PLC | | | 3,483 | | | | 39,434 | |
South32 Ltd. | | | 57,120 | | | | 108,103 | |
| | | | | | | | |
| | | Shares | | | Value | |
Teleperformance | | | 738 | | | $ | 81,697 | |
UNITE Group PLC | | | 30,671 | | | | 237,863 | |
Vinci SA | | | 3,253 | | | | 234,524 | |
Yahoo!, Inc. | | | 3,192 | | | | 145,747 | |
Total Reference Entity — Long | | | | | | $ | 2,138,468 | |
| | | | | | | | |
| | |
See Notes to Consolidated Financial Statements.
| | | | | | |
| 30 | | BLACKROCK MULTI-MANAGER ALTERNATIVE STRATEGIES FUND | | FEBRUARY 28, 2017 | | |
| | | | |
| Consolidated Schedule of Investments (continued) | | | | |
| | | | | | | | |
| | | Shares | | | Value | |
| Reference Entity — Short | | | | | | | | |
Alfa Laval AB | | | (2,301 | ) | | $ | (41,565 | ) |
Alibaba Group Holding Ltd. - ADR | | | (825 | ) | | | (84,892 | ) |
Bayerische Motoren Werke AG | | | (423 | ) | | | (37,772 | ) |
BHP Billiton PLC - ADR | | | (12,622 | ) | | | (477,364 | ) |
Centrica PLC | | | (15,022 | ) | | | (42,317 | ) |
CRH PLC | | | (1,147 | ) | | | (38,731 | ) |
Eiffage SA | | | (2,092 | ) | | | (149,411 | ) |
Fiat Chrysler Automobiles NV | | | (3,749 | ) | | | (40,999 | ) |
Fraport AG Frankfurt Airport Services Worldwide | | | (656 | ) | | | (41,040 | ) |
Glencore PLC | | | (9,911 | ) | | | (39,511 | ) |
JM AB | | | (4,103 | ) | | | (128,788 | ) |
Klepierre | | | (1,036 | ) | | | (38,478 | ) |
| | | | | | | | |
| | | Shares | | | Value | |
LANXESS AG | | | (557 | ) | | $ | (37,794 | ) |
LVMH Moet Hennessy Louis Vuitton SA | | | (582 | ) | | | (116,914 | ) |
Marine Harvest ASA | | | (2,314 | ) | | | (40,418 | ) |
Marks & Spencer Group PLC | | | (10,081 | ) | | | (41,850 | ) |
METRO AG | | | (1,287 | ) | | | (39,885 | ) |
SSE PLC | | | (5,552 | ) | | | (106,078 | ) |
Swedish Match AB | | | (677 | ) | | | (21,062 | ) |
Yahoo Japan Corp. | | | (5,037 | ) | | | (23,385 | ) |
Total Reference Entity — Short | | | | | | | (1,588,254 | ) |
Net Value of Reference Entity — Morgan Stanley & Co. International PLC | | | | | | $ | 550,214 | |
|
| Transactions in Options Written for the Period Ended February 28, 2017 |
| | | | | | | | | | | | | | | | | | | | |
| | | Calls | | | | | | Puts | |
| | | | |
| | | Contracts | | | Premiums
Received | | | | | | Contracts | | | Premiums
Received | |
| | | | | | | | | | | | |
Outstanding options, beginning of period | | | 185 | | | $ | 39,990 | | | | | | | | 148 | | | $ | 19,924 | |
Options written | | | 582 | | | | 249,808 | | | | | | | | 934 | | | | 87,760 | |
Options exercised. | | | (149 | ) | | | (38,794 | ) | | | | | | | — | | | | — | |
Options expired. | | | (38 | ) | | | (2,446 | ) | | | | | | | (174 | ) | | | (24,998 | ) |
Options closed | | | (91 | ) | | | (28,778 | ) | | | | | | | (782 | ) | | | (65,187 | ) |
| | | | | | | | | | | | |
Outstanding options, end of period | | | 489 | | | $ | 219,780 | | | | | | | | 126 | | | $ | 17,499 | |
| | | | | | | | | | | | |
As of period end, the value of portfolio securities subject to covered call options written was $11,488.
|
| Derivative Financial Instruments Categorized by Risk Exposure |
As of period end, the fair values of derivative financial instruments located in the Consolidated Statement of Assets and Liabilities were as follows:
| | | | | | | | | | | | | | | | | | | | | | | | | | | | | | |
| Assets - Derivative Financial Instruments | | Commodity
Contracts | | | Credit
Contracts | | | Equity
Contracts | | | Foreign
Currency
Exchange
Contracts | | | Interest
Rate
Contracts | | | Other
Contracts | | | Total | |
Futures contracts | | Net unrealized appreciation1 | | | — | | | | — | | | $ | 220,662 | | | | — | | | $ | 119,016 | | | | — | | | $ | 339,678 | |
Forward foreign currency exchange contracts | | Unrealized appreciation on forward foreign currency exchange contracts | | | — | | | | — | | | | — | | | $ | 840,061 | | | | — | | | | — | | | | 840,061 | |
Options purchased | | Investments at value — unaffiliated2 Unrealized appreciation on OTC swaps; | | | — | | | | — | | | | 578,147 | | | | — | | | | — | | | | — | | | | 578,147 | |
Swaps - OTC | | Swap premiums paid | | | — | | | $ | 97,308 | | | | 20,618 | | | | — | | | | 31,039 | | | | — | | | | 148,965 | |
| | | |
Total | | | | | — | | | $ | 97,308 | | | $ | 819,427 | | | $ | 840,061 | | | $ | 150,055 | | | | — | | | $ | 1,906,851 | |
| | | | | | |
| | | | | | | | | | | | | | | | | | | | | | | | | | | | | | |
| Liabilities - Derivative Financial Instruments | | | | | | | | | | | | | | | | | | | |
Futures contracts | | Net unrealized depreciation1 | | | — | | | | — | | | $ | 12,145 | | | | — | | | $ | 373,441 | | | | — | | | $ | 385,586 | |
Forward foreign currency exchange contracts | | Unrealized depreciation on forward foreign currency exchange contracts | | | — | | | | — | | | | — | | | $ | 628,302 | | | | — | | | | — | | | | 628,302 | |
Options written | | Options written, at value | | | — | | | | — | | | | 237,009 | | | | — | | | | — | | | | — | | | | 237,009 | |
Swaps - centrally cleared | | Net unrealized depreciation1 Unrealized depreciation on OTC swaps; | | | — | | | $ | 147,378 | | | | — | | | | — | | | | 43,488 | | | | — | | | | 190,866 | |
Swaps - OTC | | Swap premiums received | | | — | | | | 152,157 | | | | 26,016 | | | | — | | | | — | | | | — | | | | 178,173 | |
| | | |
Total | | | | | — | | | $ | 299,535 | | | $ | 275,170 | | | $ | 628,302 | | | $ | 416,929 | | | | — | | | $ | 1,619,936 | |
| | | | | | |
| | 1 | | Includes cumulative appreciation (depreciation) on futures contracts and centrally cleared swaps, if any, as reported in the Consolidated Schedule of Investments. Only current day’s variation margin is reported within the Consolidated Statement of Assets and Liabilities. |
| | 2 | | Includes options purchased at value as reported in the Consolidated Schedule of Investments. |
See Notes to Consolidated Financial Statements.
| | | | | | |
| | | BLACKROCK MULTI-MANAGER ALTERNATIVE STRATEGIES FUND | | FEBRUARY 28, 2017 | | 31 |
| | | | |
| Consolidated Schedule of Investments (continued) | | | | |
For the six months ended February 28, 2017, the effect of derivative financial instruments in the Consolidated Statement of Operations was as follows:
| | | | | | | | | | | | | | | | | | | | | | | | | | | | |
| Net Realized Gain (Loss) from: | | Commodity Contracts | | | Credit
Contracts | | | Equity
Contracts | | | Foreign
Currency
Exchange
Contracts | | | Interest
Rate
Contracts | | | Other
Contracts | | | Total | |
Futures contracts | | | — | | | | — | | | $ | 241,182 | | | | — | | | $ | (616,061 | ) | | | — | | | $ | (374,879 | ) |
Forward foreign currency exchange contracts | | | — | | | | — | | | | | | | $ | 768,071 | | | | — | | | | — | | | | 768,071 | |
Options purchased1 | | | — | | | | — | | | | (365,848 | ) | | | — | | | | — | | | | — | | | | (365,848 | ) |
Options written | | | — | | | | — | | | | 90,272 | | | | — | | | | — | | | | — | | | | 90,272 | |
Swaps | | | — | | | $ | (98,722 | ) | | | (175,088 | ) | | | — | | | | 259,465 | | | | — | | | | (14,345 | ) |
| | | | |
Total | | | — | | | $ | (98,722 | ) | | $ | (209,482 | ) | | $ | 768,071 | | | $ | (356,596 | ) | | | — | | | $ | 103,271 | |
| | | | |
| | 1 | | Options purchased are included in the net realized gain (loss) from investments. |
| | | | | | | | | | | | | | | | | | | | | | | | | | | | |
| Net Change in Unrealized Appreciation (Depreciation) on: | | Commodity
Contracts | | | Credit
Contracts | | | Equity
Contracts | | | Foreign
Currency
Exchange
Contracts | | | Interest
Rate
Contracts | | | Other
Contracts | | | Total | |
Futures contracts | | | — | | | | — | | | $ | 238,797 | | | | — | | | $ | (309,740 | ) | | | — | | | $ | (70,943 | ) |
Forward foreign currency exchange contracts | | | — | | | | — | | | | — | | | $ | (213,979 | ) | | | — | | | | — | | | | (213,979 | ) |
Options purchased1 | | | — | | | | — | | | | (50,354 | ) | | | — | | | | — | | | | — | | | | (50,354 | ) |
Options written | | | — | | | | — | | | | (20,816 | ) | | | — | | | | — | | | | — | | | | (20,816 | ) |
Swaps | | | — | | | $ | (198,362 | ) | | | (98,991 | ) | | | — | | | | 212,868 | | | | — | | | | (84,485 | ) |
| | | | |
Total | | | — | | | $ | (198,362 | ) | | $ | 68,636 | | | $ | (213,979 | ) | | $ | (96,872 | ) | | | — | | | $ | (440,577 | ) |
| | | | |
| | 1 | | Options purchased are included in net change in unrealized appreciation (depreciation) on investments. |
|
| Average Quarterly Balances of Outstanding Derivative Financial Instruments |
| | | | |
Futures contracts: | | | | |
Average notional value of contracts - long | | $ | 35,925,137 | |
Average notional value of contracts - short | | $ | 116,750,714 | |
Forward foreign currency exchange contracts: | | | | |
Average amounts purchased - in USD | | $ | 56,417,113 | |
Average amounts sold - in USD | | $ | 48,785,050 | |
Options: | | | | |
Average value of option contracts purchased | | $ | 520,303 | |
Average value of option contracts written | | $ | 128,965 | |
Credit default swaps: | | | | |
Average notional value - buy protection | | $ | 17,123,136 | |
Average notional value - sell protection. | | $ | 200,000 | |
Interest rate swaps: | | | | |
Average notional value - pays fixed rate | | $ | 5,450,000 | |
Total return swaps: | | | | |
Average notional value | | $ | 5,286,424 | |
For more information about the Fund’s investment risks regarding derivative financial instruments, refer to the Notes to Consolidated Financial Statements.
|
| Derivative Financial Instruments – Offsetting as of Period End |
The Fund’s derivative assets and liabilities (by type) were as follows:
| | | | | | | | | | | | |
| | | Assets | | | | | | Liabilities | |
Derivative Financial Instruments: | | | | | | | | | | | | |
Futures contracts | | $ | 426,840 | | | | | | | $ | 461,506 | |
Forward foreign currency exchange contracts | | | 840,061 | | | | | | | | 628,302 | |
Options | | | 578,147 | 1 | | | | | | | 237,009 | |
Swaps — centrally cleared | | | 15,236 | | | | | | | | — | |
Swaps — OTC2 | | | 148,965 | | | | | | | | 178,173 | |
| | | | |
Total derivative assets and liabilities in the Consolidated Statement of Assets and Liabilities | | $ | 2,009,249 | | | | | | | $ | 1,504,990 | |
Derivatives not subject to a Master Netting Agreement or similaragreement (“MNA��) | | | (1,010,323 | ) | | | | | | | (698,515 | ) |
| | | | |
Total derivative assets and liabilities subject to an MNA | | $ | 998,926 | | | | | | | $ | 806,475 | |
| | | | |
| | 1 | | Includes options purchased at value which is included in Investments at value — unaffiliated in the Consolidated Statement of Assets and Liabilities and reported in the Consolidated Schedule of Investments. |
| | 2 | | Includes unrealized appreciation (depreciation) on OTC swaps and swap premiums paid/received in the Consolidated Statement of Assets and Liabilities. |
See Notes to Consolidated Financial Statements.
| | | | | | |
| 32 | | BLACKROCK MULTI-MANAGER ALTERNATIVE STRATEGIES FUND | | FEBRUARY 28, 2017 | | |
| | | | |
| Consolidated Schedule of Investments (continued) | | | | |
The following tables present the Fund’s derivative assets and liabilities by counterparty net of amounts available for offset under an MNA and net of the related collateral received and pledged by the Fund:
| | | | | | | | | | | | | | | | | | | | | | | | | | | | | | |
| Counterparty | | | | Derivative Assets Subject to an MNA by Counterparty | | Derivatives Available for Offset1 | | Non-cash Collateral Received | | Cash Collateral Received | | Net Amount of Derivative Assets2,3 |
Bank of America N.A. | | | | | | | | $ | 20,829 | | | | $ | (20,829 | ) | | | | — | | | | | — | | | | | — | |
Barclays Bank PLC | | | | | | | | | 29,594 | | | | | (29,594 | ) | | | | — | | | | | — | | | | | — | |
Deutsche Bank AG | | | | | | | | | 31,039 | | | | | — | | | | | — | | | | | — | | | | $ | 31,039 | |
J.P. Morgan Securities LLC | | | | | | | | | 25,243 | | | | | (15,945 | ) | | | | — | | | | | — | | | | | 9,298 | |
JPMorgan Chase Bank N.A. | | | | | | | | | 877,995 | | | | | (651,100 | ) | | | | — | | | | | — | | | | | 226,895 | |
Morgan Stanley & Co. International PLC | | | | | | | | | 4,326 | | | | | (4,326 | ) | | | | | | | | | | | | | | — | |
UBS Securities LLC | | | | | | | | | 9,900 | | | | | — | | | | | — | | | | | — | | | | | 9,900 | |
| | | | | |
Total | | | | | | | | $ | 998,926 | | | | $ | (721,794 | ) | | | | — | | | | | — | | | | $ | 277,132 | |
| | | | | |
| | | | | | | | | | | | | |
| Counterparty | | | | Derivative Liabilities Subject to an MNA by Counterparty | | Derivatives Available for Offset1 | | Non-cash Collateral Pledged | | Cash Collateral Pledged4 | | Net Amount of Derivative Liabilities5 |
Bank of America N.A. | | | | | | | | $ | 23,369 | | | | $ | (20,829 | ) | | | | — | | | | $ | (2,540 | ) | | | | — | |
Barclays Bank PLC | | | | | | | | | 39,080 | | | | | (29,594 | ) | | | | — | | | | | — | | | | $ | 9,486 | |
J.P. Morgan Securities LLC | | | | | | | | | 15,945 | | | | | (15,945 | ) | | | | — | | | | | — | | | | | — | |
JPMorgan Chase Bank N.A. | | | | | | | | | 651,100 | | | | | (651,100 | ) | | | | — | | | | | — | | | | | — | |
Morgan Stanley & Co. LLC | | | | | | | | | 4,463 | | | | | — | | | | | — | | | | | — | | | | | 4,463 | |
Morgan Stanley & Co. International PLC | | | | | | | | | 72,518 | | | | | (4,326 | ) | | | | — | | | | | — | | | | | 68,192 | |
| | | | | |
Total | | | | | | | | $ | 806,475 | | | | $ | (721,794 | ) | | | | — | | | | $ | (2,540 | ) | | | $ | 82,141 | |
| | | | | |
| | 1 | The amount of derivatives available for offset is limited to the amount of derivative assets and/or liabilities that are subject to an MNA. |
| | 2 | Net amount represents the net amount receivable from the counterparty in the event of default. |
| | 3 | Net amount may also include forward foreign currency exchange contracts that are not required to be collateralized. |
| | 4 | Excess of collateral pledged to the individual counterparty is not shown for financial reporting purposes. |
| | 5 | Net amount represents the net amount payable due to the counterparty in the event of default. Net amount may be offset further by the options written receivable on the Consolidated Statement of Assets and Liabilities. |
|
| Fair Value Hierarchy as of Period End |
Various inputs are used in determining the fair value of investments and derivative financial instruments. For information about the Fund’s policy regarding valuation of investments and derivative financial instruments, refer to the Notes to Consolidated Financial Statements.
The following tables summarize the Fund’s investments and derivative financial instruments categorized in the disclosure hierarchy:
| | | | | | | | | | | | | | | | |
| | | Level 1 | | | Level 2 | | | Level 3 | | | Total | |
Assets: | | | | | | | | | | | | | | | | |
Investments: | | | | | | | | | | | | | | | | |
Long-Term Investments: | | | | | | | | | | | | | | | | |
Asset-Backed Securities | | | — | | | $ | 7,963,743 | | | | — | | | $ | 7,963,743 | |
Common Stocks1 | | $ | 16,405,498 | | | | 1,732,784 | | | $ | 52,131 | | | | 18,190,413 | |
Corporate Bonds1 | | | — | | | | 8,180,281 | | | | — | | | | 8,180,281 | |
Floating Rate Loan Interests1 | | | — | | | | 6,278,807 | | | | — | | | | 6,278,807 | |
Foreign Government Obligations | | | — | | | | 674,134 | | | | — | | | | 674,134 | |
Investment Companies | | | 9,831,805 | | | | — | | | | — | | | | 9,831,805 | |
Non-Agency Mortgage-Backed Securities | | | — | | | | 7,434,013 | | | | — | | | | 7,434,013 | |
Other Interests. | | | — | | | | — | | | | 12 | | | | 12 | |
Preferred Securities1 | | | 1,483,866 | | | | 640,133 | | | | — | | | | 2,123,999 | |
Taxable Municipal Bonds | | | — | | | | 235,695 | | | | — | | | | 235,695 | |
U.S. Government Sponsored Agency Securities | | | — | | | | 2,960,653 | | | | — | | | | 2,960,653 | |
Warrants1 | | | 1,510,439 | | | | 79,914 | | | | — | | | | 1,590,353 | |
Short-Term Securities | | | 30,322,128 | | | | — | | | | — | | | | 30,322,128 | |
Options Purchased: | | | | | | | | | | | | | | | | |
Equity Contracts | | | 568,002 | | | | 10,145 | | | | — | | | | 578,147 | |
Liabilities: | | | | | | | | | | | | | | | | |
Investments Sold Short1 | | | (17,762,462 | ) | | | (3,622,246 | ) | | | — | | | | (21,384,708 | ) |
| | | | |
Total | | $ | 42,359,276 | | | $ | 32,568,056 | | | $ | 52,143 | | | $ | 74,979,475 | |
| | | | |
1 See above Consolidated Schedule of Investments for values in each industry.
See Notes to Consolidated Financial Statements.
| | | | | | |
| | | BLACKROCK MULTI-MANAGER ALTERNATIVE STRATEGIES FUND | | FEBRUARY 28, 2017 | | 33 |
| | | | |
| Consolidated Schedule of Investments (concluded) | | | | |
| | | | | | | | | | | | | | | | |
| | | Level 1 | | | Level 2 | | | Level 3 | | | Total | |
Derivative Financial Instruments1 | | | | | | | | | | | | | | | | |
Assets: | | | | | | | | | | | | | | | | |
Credit contracts | | | — | | | $ | 25,754 | | | | — | | | $ | 25,754 | |
Equity contracts | | $ | 220,662 | | | | 20,618 | | | | — | | | | 241,280 | |
Foreign currency exchange contracts | | | — | | | | 840,061 | | | | — | | | | 840,061 | |
Interest rate contracts | | | 119,016 | | | | 31,039 | | | | — | | | | 150,055 | |
Liabilities: | | | | | | | | | | | | | | | | |
Credit contracts | | | — | | | | (240,980 | ) | | | — | | | | (240,980 | ) |
Equity contracts | | | (249,154 | ) | | | (26,016 | ) | | | — | | | | (275,170 | ) |
Foreign currency exchange contracts | | | — | | | | (628,302 | ) | | | — | | | | (628,302 | ) |
Interest rate contracts | | | (373,441 | ) | | | (43,488 | ) | | | — | | | | (416,929 | ) |
Total | | $ | (282,917 | ) | | $ | (21,314 | ) | | | — | | | $ | (304,231 | ) |
| | | | |
| | 1 | | Derivative financial instruments are swaps, futures contracts, forward foreign currency exchange contracts and options written. Swaps, futures contracts and forward foreign currency exchange contracts are valued at the unrealized appreciation (depreciation) on the instrument and options written are shown at value. |
Transfers between Level 1 and Level 2 were as follows:
| | | | | | | | | | | | | | | | |
| | | Transfers Into Level 11 | | | Transfers Out of Level 1 | | | Transfers Into Level 2 | | | Transfers Out of Level 21 | |
Assets: | | | | | | | | | | | | | | | | |
Long-Term Investments: | | | | | | | | | | | | | | | | |
Investments Companies | | $ | 2,365,728 | | | | — | | | | — | | | $ | 2,365,728 | |
| | 1 | | Systematic Fair Value Prices were not utilized at period end for these investments. |
The Fund’s investments that are categorized as Level 3 were valued utilizing third party pricing information without adjustment. Such valuations are based on unobservable inputs. A significant change in third party information could result in a significantly lower or higher value of such Level 3 investments.
See Notes to Consolidated Financial Statements.
| | | | | | |
| 34 | | BLACKROCK MULTI-MANAGER ALTERNATIVE STRATEGIES FUND | | FEBRUARY 28, 2017 | | |
| | | | |
| Consolidated Statement of Assets and Liabilities | | | | |
| | | | |
| February 28, 2017 (Unaudited) | | | |
| | | | |
Assets | | | | |
Investments at value — unaffiliated (cost — $56,761,304) | | $ | 59,687,650 | |
Investments at value — affiliated (cost — $36,377,441) | | | 36,676,533 | |
Cash | | | 498,638 | |
Cash held for investments sold short | | | 21,755,812 | |
Due from broker | | | 1,172,506 | |
Cash pledged: | | | | |
Collateral — options written. | | | 784,000 | |
Collateral — OTC derivatives | | | 1,415,961 | |
Futures contracts | | | 2,420,318 | |
Centrally cleared swaps | | | 311,552 | |
Foreign currency at value — (cost — $1,198,068) | | | 1,184,437 | |
Receivables: | | | | |
Investments sold | | | 3,673,998 | |
Options written | | | 2,397 | |
Capital shares sold | | | 9,769 | |
Dividends — affiliated | | | 9,435 | |
Dividends — unaffiliated | | | 27,681 | |
Interest — unaffiliated | | | 243,427 | |
From the Manager | | | 63,629 | |
Variation margin on futures contracts | | | 426,840 | |
Variation margin on centrally cleared swaps | | | 15,236 | |
Swap premiums paid | | | 71,554 | |
Unrealized appreciation on: | | | | |
Forward foreign currency exchange contracts | | | 840,061 | |
OTC — Swaps | | | 77,411 | |
Prepaid expenses | | | 18,539 | |
| | | | |
Total assets. | | | 131,387,384 | |
| | | | |
| | | | |
Liabilities | | | | |
Investments sold short at value — unaffiliated (proceeds — $19,922,915) | | | 20,931,384 | |
Investments sold short at value — affiliated (proceeds — $438,795) | | | 453,324 | |
Due to broker | | | 623,173 | |
Options written at value (premiums received — $237,279) | | | 237,009 | |
Payables: | | | | |
Investments purchased | | | 3,081,525 | |
Swaps | | | 66,664 | |
Capital shares redeemed | | | 9,984 | |
Dividends on short sales | | | 31,105 | |
Interest expense | | | 41,343 | |
Investment advisory fees | | | 135,647 | |
Officer’s and Trustees’ fees | | | 2,241 | |
Other accrued expenses | | | 98,938 | |
Other affiliates | | | 67 | |
Professional fees | | | 339,320 | |
Service and distribution fees | | | 964 | |
Variation margin on futures contracts | | | 461,506 | |
Swap premiums received | | | 58,555 | |
Unrealized depreciation on: | | | | |
Forward foreign currency exchange contracts | | | 628,302 | |
OTC — Swaps | | | 119,618 | |
| | | | |
Total liabilities | | | 27,320,669 | |
| | | | |
Net Assets | | $ | 104,066,715 | |
| | | | |
| | | | |
Net Assets Consist of | | | | |
Paid-in capital | | | 105,950,545 | |
Distributions in excess of net investment income | | | (1,338,392 | ) |
Accumulated net realized loss | | | (2,663,954 | ) |
Net unrealized appreciation (depreciation) | | | 2,118,516 | |
| | | | |
Net Assets | | $ | 104,066,715 | |
| | | | |
See Notes to Consolidated Financial Statements.
| | | | | | |
| | | BLACKROCK MULTI-MANAGER ALTERNATIVE STRATEGIES FUND | | FEBRUARY 28, 2017 | | 35 |
| | | | |
| Consolidated Statement of Assets and Liabilities (concluded) | | | | |
| | | | |
| February 28, 2017 (Unaudited) | | | |
| | | | |
| Net Asset Value | | | | |
Institutional | | | | |
Net assets | | $ | 100,188,584 | |
| | | | |
Shares outstanding1 | | | 10,219,496 | |
| | | | |
Net asset value | | $ | 9.80 | |
| | | | |
Investor A | | | | |
Net assets | | $ | 3,495,317 | |
| | | | |
Shares outstanding1 | | | 357,976 | |
| | | | |
Net asset value | | $ | 9.76 | |
| | | | |
Investor C | | | | |
Net assets | | $ | 382,814 | |
| | | | |
Shares outstanding1 | | | 39,335 | |
| | | | |
Net asset value | | $ | 9.73 | |
| | | | |
| | 1 | | Unlimited number of shares authorized, $0.001 par value. |
See Notes to Consolidated Financial Statements.
| | | | | | |
| 36 | | BLACKROCK MULTI-MANAGER ALTERNATIVE STRATEGIES FUND | | FEBRUARY 28, 2017 | | |
| | | | |
| Consolidated Statement of Operations | | | | |
| | | | |
| Six Months Ended February 28, 2017 (Unaudited) | | | |
| | | | |
Investment Income | | | | |
Interest — unaffiliated | | $ | 1,496,084 | |
Dividends — unaffiliated | | | 175,007 | |
Dividends — affiliated | | | 45,052 | |
Foreign taxes withheld | | | (765 | ) |
| | | | |
Total investment income | | | 1,715,378 | |
| | | | |
| | | | |
Expenses | | | | |
Investment advisory | | | 928,133 | |
Accounting services | | | 141,736 | |
Professional | | | 82,928 | |
Custodian | | | 26,509 | |
Administration | | | 25,758 | |
Registration | | | 23,229 | |
Printing. | | | 19,958 | |
Officer and Trustees | | | 6,840 | |
Service and distribution — class specific | | | 6,541 | |
Transfer agent — class specific | | | 6,499 | |
Miscellaneous | | | 17,515 | |
Recoupment of past waived fees — class specific | | | 55 | |
| | | | |
Total expenses excluding interest expense, dividend expense and broker fees and expenses on short sales | | | 1,285,701 | |
Dividend expense — unaffiliated | | | 165,239 | |
Dividend expense — affiliated | | | 11,702 | |
Interest expense | | | 42,907 | |
Broker fees and expenses on short sales | | | 40,104 | |
| | | | |
Total expenses | | | 1,545,653 | |
Less: | | | | |
Expenses reimbursed by the Manager | | | (234,689 | ) |
Fees waived by the Manager | | | (52,442 | ) |
Administration fees waived | | | (25,758 | ) |
Transfer agent fees reimbursed — class specific | | | (6,312 | ) |
Transfer agent fees waived — class specific | | | (149 | ) |
| | | | |
Total expenses after fees waived and reimbursed | | | 1,226,303 | |
| | | | |
Net investment income. | | | 489,075 | |
| | | | |
| | | | |
Realized and Unrealized Gain (Loss) | | | | |
Net realized gain (loss) from: | | | | |
Investments — unaffiliated | | | 1,586,824 | |
Investments — affiliated | | | (1,001 | ) |
Capital gain distributions from investment companies — affiliated | | | 57,672 | |
Foreign currency transactions | | | 100,549 | |
Forward foreign currency exchange contracts | | | 768,071 | |
Futures contracts | | | (374,879 | ) |
Options written | | | 90,272 | |
Short sales — unaffiliated | | | (1,061,363 | ) |
Short sales — affiliated | | | (1,750 | ) |
Swaps | | | (14,345 | ) |
| | | | |
| | | 1,150,050 | |
| | | | |
Net change in unrealized appreciation (depreciation) on: | | | | |
Investments — unaffiliated | | | 2,216,704 | |
Investments — affiliated | | | 211,477 | |
Foreign currency translations | | | (39,665 | ) |
Forward foreign currency exchange contracts | | | (213,979 | ) |
Futures contracts | | | (70,943 | ) |
Options written | | | (20,816 | ) |
Short sales — unaffiliated | | | (285,914 | ) |
Short sales — affiliated | | | 14,635 | |
Swaps | | | (84,485 | ) |
| | | | |
| | | 1,727,014 | |
| | | | |
Net realized and unrealized gain | | | 2,877,064 | |
| | | | |
Net Increase in Net Assets Resulting from Operations | | $ | 3,366,139 | |
| | | | |
See Notes to Consolidated Financial Statements.
| | | | | | |
| | | BLACKROCK MULTI-MANAGER ALTERNATIVE STRATEGIES FUND | | FEBRUARY 28, 2017 | | 37 |
| | | | |
| Consolidated Statements of Changes in Net Assets | | | | |
| | | | | | | | |
| Increase (Decrease) in Net Assets: | | Six Months Ended February 28, 2017 (Unaudited) | | | Year Ended August 31, 2016 | |
| | | | | | | | |
Operations | | | | | | | | |
Net investment income | | $ | 489,075 | | | $ | 709,909 | |
Net realized gain (loss) | | | 1,150,050 | | | | (4,061,721 | ) |
Net change in unrealized appreciation (depreciation) | | | 1,727,014 | | | | 2,578,533 | |
| | | | |
Net increase (decrease) in net assets resulting from operations | | | 3,366,139 | | | | (773,279 | ) |
| | | | |
| | | | | | | | |
Distributions to Shareholders1 | | | | | | | | |
From net investment income: | | | | | | | | |
Institutional | | | (1,749,091 | ) | | | (448,142 | ) |
Investor A | | | (49,510 | ) | | | (11,881 | ) |
Investor C | | | (1,419 | ) | | | — | |
| | | | |
Decrease in net assets resulting from distributions to shareholders | | | (1,800,020 | ) | | | (460,023 | ) |
| | | | |
| | | | | | | | |
Capital Share Transactions | | | | | | | | |
Net increase (decrease) in net assets derived from capital share transactions | | | (406,147 | ) | | | 1,246,856 | |
| | | | |
| | | | | | | | |
Net Assets | | | | | | | | |
Total increase in net assets | | | 1,159,972 | | | | 13,554 | |
Beginning of period | | | 102,906,743 | | | | 102,893,189 | |
| | | | |
End of period | | $ | 104,066,715 | | | $ | 102,906,743 | |
| | | | |
Distributions in excess of net investment income, end of period | | $ | (1,338,392 | ) | | $ | (27,447 | ) |
| | | | |
| | 1 | | Distributions for annual periods determined in accordance with federal income tax regulations. |
See Notes to Consolidated Financial Statements.
| | | | | | |
| 38 | | BLACKROCK MULTI-MANAGER ALTERNATIVE STRATEGIES FUND | | FEBRUARY 28, 2017 | | |
| | | | | | | | | | | | | | | | |
| | | Institutional | |
| | | Six Months
Ended
February 28,
20171 | | | Year Ended August 31, | | | Period
August 7,
20142 to
August 31, | |
| | | (Unaudited) | | | 20161 | | | 20151 | | | 2014 | |
| | | | | | | | | | | | | | | | |
Per Share Operating Performance | | | | | | | | | | | | | | | | |
Net asset value, beginning of period | | $ | 9.66 | | | $ | 9.77 | | | $ | 10.06 | | | $ | 10.00 | |
| | | | |
Net investment income (loss)3 | | | 0.05 | | | | 0.07 | | | | 0.01 | | | | (0.01 | ) |
Net realized and unrealized gain (loss) | | | 0.26 | | | | (0.14 | ) | | | (0.19 | ) | | | 0.07 | |
| | | | |
Net increase (decrease) from investment operations | | | 0.31 | | | | (0.07 | ) | | | (0.18 | ) | | | 0.06 | |
| | | | |
Distributions:4 | | | | | | | | | | | | | | | | |
From net investment income | | | (0.17 | ) | | | (0.04 | ) | | | (0.09 | ) | | | — | |
From net realized gain | | | — | | | | — | | | | (0.02 | ) | | | — | |
| | | | |
Total distributions | | | (0.17 | ) | | | (0.04 | ) | | | (0.11 | ) | | | — | |
| | | | |
Net asset value, end of period | | $ | 9.80 | | | $ | 9.66 | | | $ | 9.77 | | | $ | 10.06 | |
| | | | |
| | | | | | | | | | | | | | | | |
Total Return5 | | | | | | | | | | | | | | | | |
Based on net asset value | | | 3.24 | %6 | | | (0.68 | )% | | | (1.84 | )% | | | 0.60 | %6 |
| | | | |
| | | | | | | | | | | | | | | | |
Ratios to Average Net Assets7 | | | | | | | | | | | | | | | | |
Total expenses | | | 2.98 | %8,9 | | | 3.29 | %9 | | | 3.33 | % | | | 3.97 | %8,10 |
| | | | |
Total expenses after fees waived and reimbursed | | | 2.37 | %8 | | | 2.27 | % | | | 2.33 | % | | | 2.43 | %8 |
| | | | |
Total expenses after fees waived and reimbursed and excluding interest expense, dividend expense and broker fees and expenses on short sales | | | 1.86 | %8 | | | 1.72 | % | | | 2.03 | % | | | 2.35 | %8 |
| | | | |
Net investment income (loss) | | | 0.96 | %8 | | | 0.72 | % | | | 0.14 | % | | | (1.22 | )%8 |
| | | | |
| | | | | | | | | | | | | | | | |
Supplemental Data | | | | | | | | | | | | | | | | |
Net assets, end of period (000) | | $ | 100,189 | | | $ | 99,092 | | | $ | 101,167 | | | $ | 100,549 | |
| | | | |
Portfolio turnover rate. | | | 86 | % | | | 234 | % | | | 190 | % | | | 5 | % |
| | | | |
| | 1 | | Consolidated Financial Highlights. |
| | 2 | | Commencement of operations. |
| | 3 | | Based on average shares outstanding. |
| | 4 | | Distributions for annual periods determined in accordance with federal income tax regulations. |
| | 5 | | Where applicable, assumes the reinvestment of distributions. |
| | 6 | | Aggregate total return. |
| | 7 | | Excludes expenses incurred indirectly as a result of investments in underlying funds as follows: |
| | | | | | | | | | | | | | | | |
| | | Six Months
Ended
February 28,
20171 | | | Year Ended August 31, | | | Period
August 7,
20142 to August 31, | |
| | | (Unaudited) | | | 20161 | | | 20151 | | | 2014 | |
| | | | | | | | | | | | | | | | |
Investments in underlying funds | | | 0.17 | % | | | 0.29 | % | | | 0.35 | % | | | 0.41 | %8 |
| | 9 | | Includes recoupment of past waived and/or reimbursed fees with no financial impact to the expense ratio. |
| | 10 | | Organization costs and audit expenses were not annualized in the calculation of the expense ratios. If these expenses were annualized, the total expenses would have been 7.04%. |
See Notes to Consolidated Financial Statements.
| | | | | | |
| | | BLACKROCK MULTI-MANAGER ALTERNATIVE STRATEGIES FUND | | FEBRUARY 28, 2017 | | 39 |
| | | | |
| Financial Highlights (continued) | | | | |
| | | | | | | | | | | | | | | | |
| | | Investor A | |
| | | Six Months
Ended
February 28,
20171 | | | Year Ended August 31, | | | Period
August 7,
20142 to
August 31, | |
| | | (Unaudited) | | | 20161 | | | 20151 | | | 2014 | |
| | | | | | | | | | | | | | | | |
Per Share Operating Performance | | | | | | | | | | | | | | | | |
Net asset value, beginning of period | | $ | 9.61 | | | $ | 9.74 | | | $ | 10.06 | | | $ | 10.00 | |
| | | | |
Net investment income (loss)3 | | | 0.03 | | | | 0.01 | | | | 0.03 | | | | (0.01 | ) |
Net realized and unrealized gain (loss) | | | 0.27 | | | | (0.10 | ) | | | (0.24 | ) | | | 0.07 | |
| | | | |
Net increase (decrease) from investment operations | | | 0.30 | | | | (0.09 | ) | | | (0.21 | ) | | | 0.06 | |
| | | | |
Distributions:4 | | | | | | | | | | | | | | | | |
From net investment income | | | (0.15 | ) | | | (0.04 | ) | | | (0.09 | ) | | | — | |
From net realized gain | | | — | | | | — | | | | (0.02 | ) | | | — | |
| | | | |
Total distributions | | | (0.15 | ) | | | (0.04 | ) | | | (0.11 | ) | | | — | |
| | | | |
Net asset value, end of period | | $ | 9.76 | | | $ | 9.61 | | | $ | 9.74 | | | $ | 10.06 | |
| | | | |
| | | | | | | | | | | | | | | | |
Total Return5 | | | | | | | | | | | | | | | | |
Based on net asset value | | | 3.12 | %6 | | | (0.96 | )% | | | (2.15 | )% | | | 0.60 | %6 |
| | | | |
| | | | | | | | | | | | | | | | |
Ratios to Average Net Assets7 | | | | | | | | | | | | | | | | |
Total expenses | | | 3.39 | %8 | | | 3.77 | % | | | 3.96 | % | | | 4.47 | %8,9 |
| | | | |
Total expenses after fees waived and reimbursed | | | 2.62 | %8 | | | 2.62 | % | | | 2.45 | % | | | 2.69 | %8 |
| | | | |
Total expenses after fees waived and reimbursed and excluding interest expense, dividend expense and broker fees and expenses on short sales | | | 2.11 | %8 | | | 2.01 | % | | | 2.10 | % | | | 2.60 | %8 |
| | | | |
Net investment income (loss) | | | 0.67 | %8 | | | 0.14 | % | | | 0.30 | % | | | (1.48 | )%8 |
| | | | |
| | | | | | | | | | | | | | | | |
Supplemental Data | | | | | | | | | | | | | | | | |
Net assets, end of period (000) | | $ | 3,495 | | | $ | 3,259 | | | $ | 1,086 | | | $ | 102 | |
| | | | |
Portfolio turnover rate | | | 86 | % | | | 234 | % | | | 190 | % | | | 5 | % |
| | | | |
| | 1 | | Consolidated Financial Highlights. |
| | 2 | | Commencement of operations. |
| | 3 | | Based on average shares outstanding. |
| | 4 | | Distributions for annual periods determined in accordance with federal income tax regulations. |
| | 5 | | Where applicable, excludes the effects of any sales charges and assumes the reinvestment of distributions. |
| | 6 | | Aggregate total return. |
| | 7 | | Excludes expenses incurred indirectly as a result of investments in underlying funds as follows: |
| | | | | | | | | | | | | | | | |
| | | Six Months
Ended
February 28,
20171 | | | Year Ended August 31, | | | Period
August 7,
20142 to
August 31, | |
| | | (Unaudited) | | | 20161 | | | 20151 | | | 2014 | |
| | | | | | | | | | | | | | | | |
Investments in underlying funds | | | 0.17 | % | | | 0.29 | % | | | 0.35 | % | | | 0.41 | %8 |
| | 9 | | Organization costs and audit expenses were not annualized in the calculation of the expense ratios. If these expenses were annualized, the total expenses would have been 7.51%. |
See Notes to Consolidated Financial Statements.
| | | | | | |
| 40 | | BLACKROCK MULTI-MANAGER ALTERNATIVE STRATEGIES FUND | | FEBRUARY 28, 2017 | | |
| | | | |
| Financial Highlights (concluded) | | | | |
| | | | | | | | | | | | | | | | |
| | | Investor C | |
| | | Six Months
Ended
February 28,
20171 | | | Year Ended August 31, | | | Period
August 7,
20142 to
August 31, | |
| | | (Unaudited) | | | 20161 | | | 20151 | | | 2014 | |
| | | | | | | | | | | | | | | | |
Per Share Operating Performance | | | | | | | | | | | | | | | | |
Net asset value, beginning of period | | $ | 9.50 | | | $ | 9.67 | | | $ | 10.05 | | | $ | 10.00 | |
| | | | |
Net investment income (loss)3 | | | 0.00 | 4 | | | (0.02 | ) | | | (0.05 | ) | | | (0.02 | ) |
Net realized and unrealized gain (loss) | | | 0.26 | | | | (0.15 | ) | | | (0.23 | ) | | | 0.07 | |
| | | | |
Net increase (decrease) from investment operations | | | 0.26 | | | | (0.17 | ) | | | (0.28 | ) | | | 0.05 | |
| | | | |
Distributions:5 | | | | | | | | | | | | | | | | |
From net investment income | | | (0.03 | ) | | | — | | | | (0.08 | ) | | | — | |
From net realized gain | | | — | | | | — | | | | (0.02 | ) | | | — | |
| | | | |
Total distributions | | | (0.03 | ) | | | — | | | | (0.10 | ) | | | — | |
| | | | |
Net asset value, end of period | | $ | 9.73 | | | $ | 9.50 | | | $ | 9.67 | | | $ | 10.05 | |
| | | | |
| | | | | | | | | | | | | | | | |
Total Return6 | | | | | | | | | | | | | | | | |
Based on net asset value | | | 2.78 | %7 | | | (1.76 | )% | | | (2.80 | )% | | | 0.50 | %7 |
| | | | |
| | | | | | | | | | | | | | | | |
Ratios to Average Net Assets8 | | | | | | | | | | | | | | | | |
Total expenses | | | 4.24 | %9 | | | 4.33 | % | | | 4.79 | % | | | 5.20 | %9,10 |
| | | | |
Total expenses after fees waived and reimbursed | | | 3.37 | %9 | | | 3.26 | % | | | 3.22 | % | | | 3.44 | %9 |
| | | | |
Total expenses after fees waived and reimbursed and excluding interest expense, dividend expense and broker fees and expenses on short sales | | | 2.86 | %9 | | | 2.71 | % | | | 2.85 | % | | | 3.35 | %9 |
| | | | |
Net investment income (loss) | | | 0.00 | %9,11 | | | (0.23 | )% | | | (0.49 | )% | | | (2.23 | )%9 |
| | | | |
| | | | | | | | | | | | | | | | |
Supplemental Data | | | | | | | | | | | | | | | | |
Net assets, end of period (000) | | $ | 383 | | | $ | 556 | | | $ | 640 | | | $ | 101 | |
| | | | |
Portfolio turnover rate | | | 86 | % | | | 234 | % | | | 190 | % | | | 5 | % |
| | | | |
| | 1 | | Consolidated Financial Highlights. |
| | 2 | | Commencement of operations. |
| | 3 | | Based on average shares outstanding. |
| | 4 | | Amount is less than $0.005 per share. |
| | 5 | | Distributions for annual periods determined in accordance with federal income tax regulations. |
| | 6 | | Where applicable, excludes the effects of any sales charges and assumes the reinvestment of distributions. |
| | 7 | | Aggregate total return. |
| | 8 | | Excludes expenses incurred indirectly as a result of investments in underlying funds as follows: |
| | | | | | | | | | | | | | | | |
| | | Six Months
Ended
February 28,
20171 | | | Year Ended August 31, | | | Period
August 7,
20142 to
August 31, | |
| | | (Unaudited) | | | 20161 | | | 20151 | | | 2014 | |
| | | | | | | | | | | | | | | | |
Investments in underlying funds | | | 0.17 | % | | | 0.29 | % | | | 0.35 | % | | | 0.41 | %8 |
| | 10 | | Organization costs and audit expenses were not annualized in the calculation of the expense ratios. If these expenses were annualized, the total expenses for would have been 8.27%. |
| | 11 | | Amount is less than 0.005%. |
See Notes to Consolidated Financial Statements.
| | | | | | |
| | | BLACKROCK MULTI-MANAGER ALTERNATIVE STRATEGIES FUND | | FEBRUARY 28, 2017 | | 41 |
| | | | |
| Notes to Consolidated Financial Statements (Unaudited) | | | | |
1. Organization:
BlackRock FundsSM (the “Trust”) is registered under the Investment Company Act of 1940, as amended (the “1940 Act”), as an open-end management investment company. The Trust is organized as a Massachusetts business trust. These financial statements relate to one series of the Trust, BlackRock Multi-Manager Alternative Strategies Fund (the “Fund”). The Fund is classified as non-diversified.
The Fund offers multiple classes of shares. All classes of shares have identical voting, dividend, liquidation and other rights and are subject to the same terms and conditions, except that certain classes bear expenses related to the shareholder servicing and distribution of such shares. Institutional Shares are sold only to certain eligible investors. Investor A and Investor C Shares are generally available through financial intermediaries. Each class has exclusive voting rights with respect to matters relating to its shareholder servicing and distribution expenditures.
| | | | | | |
| Share Class | | Initial Sales Charge | | CDSC | | Conversion
Privilege |
Institutional Shares | | No | | No | | None |
Investor A Shares | | Yes | | No1 | | None |
Investor C Shares | | No | | Yes | | None |
| | 1 | | Investor A Shares may be subject to a contingent deferred sales charge (“CDSC”) for certain redemptions where no initial sales charge was paid at the time of purchase. |
The Fund, together with certain other registered investment companies advised by BlackRock Advisors, LLC (the “Manager”) or its affiliates, is included in a complex of open-end funds referred to as the Equity-Liquidity Complex.
Basis of Consolidation: The accompanying consolidated financial statements of the Fund include the account of Cayman Multi-Manager Alternatives Fund, Ltd. (the “Subsidiary”), which is a wholly-owned subsidiary of the Fund and primarily invests in commodity-related instruments and other derivatives. The Subsidiary enables the Fund to hold these commodity-related instruments and satisfy regulated investment company tax requirements. The Fund may invest up to 25% of its total assets in the Subsidiary. The net assets of the Subsidiary as of period end were $1,264,820, which is 1.2% of the Fund’s consolidated net assets. Intercompany accounts and transactions, if any, have been eliminated. The Subsidiary is subject to the same investment policies and restrictions that apply to the Fund, except that the Subsidiary may invest without limitation in commodity-related instruments.
2. Significant Accounting Policies:
The financial statements are prepared in conformity with accounting principles generally accepted in the United States of America (“U.S. GAAP”), which may require management to make estimates and assumptions that affect the reported amounts of assets and liabilities in the financial statements, disclosure of contingent assets and liabilities at the date of the financial statements and the reported amounts of increases and decreases in net assets from operations during the reporting period. Actual results could differ from those estimates. The Fund is considered an investment company under U.S. GAAP and follows the accounting and reporting guidance applicable to investment companies. Below is a summary of significant accounting policies:
Foreign Currency: The Fund’s books and records are maintained in U.S. dollars. Purchases and sales of investments are recorded at the rates of exchange prevailing on the respective dates of such transactions. Generally, when the U.S. dollar rises in value against a foreign currency, the investments denominated in that currency will lose value; the opposite effect occurs if the U.S. dollar falls in relative value.
The Fund does not isolate the portion of the results of operations arising as a result of changes in the exchange rates from the changes in the market prices of investments held or sold for financial reporting purposes. Accordingly, the effects of changes in exchange rates on investments are not segregated in the Consolidated Statement of Operations from the effects of changes in market prices of those investments, but are included as a component of net realized and unrealized gain (loss) from investments. The Fund reports realized currency gains (losses) on foreign currency related transactions as components of net realized gain (loss) for financial reporting purposes, whereas such components are generally treated as ordinary income for federal income tax purposes.
Defensive Positions: Investment policies may vary for temporary defensive purposes during periods in which the investment adviser believes that conditions in the securities markets or other economic, financial or political conditions warrant. Under such conditions, the Fund may invest up to 100% of its total assets in U.S. Government securities, certificates of deposit, repurchase agreements that involve purchases of debt securities, bankers’ acceptances and other bank obligations, commercial paper, money market funds and/or other debt securities, or may hold its assets in cash. The investment adviser applies this defensive posture as applicable and is consistent with the Fund’s investment policies.
Segregation and Collateralization: In cases where the Fund enters into certain investments (e.g., futures contracts, forward foreign currency exchange contracts, options written, swaps and short sales) that would be treated as “senior securities” for 1940 Act purposes, the Fund may segregate or designate on its books and records cash or liquid assets having a market value at least equal to the amount of its future obligations under such investments. Doing so allows the investment to be excluded from treatment as a “senior security.” Furthermore, if required by an exchange or counterparty agreement, the Fund may be required to deliver/deposit cash and/or securities to/with an exchange, or broker-dealer or custodian as collateral for certain investments or obligations.
| | | | | | |
| 42 | | BLACKROCK MULTI-MANAGER ALTERNATIVE STRATEGIES FUND | | FEBRUARY 28, 2017 | | |
| | | | |
| Notes to Consolidated Financial Statements (continued) | | | | |
Investment Transactions and Investment Income: For financial reporting purposes, investment transactions are recorded on the dates the transactions are entered into (the trade dates). Realized gains and losses on investment transactions are determined on the identified cost basis. Dividend income is recorded on the ex-dividend date. Dividends from foreign securities where the ex-dividend date may have passed are subsequently recorded when the Fund is informed of the ex-dividend date. Under the applicable foreign tax laws, a withholding tax at various rates may be imposed on capital gains, dividends and interest. Upon notification from issuers, some of the dividend income received from a real estate investment trust may be redesignated as a reduction of cost of the related investment and/or realized gain. Interest income, including amortization and accretion of premiums and discounts on debt securities, is recognized on the accrual basis. Income, expenses and realized and unrealized gains and losses are allocated daily to each class based on its relative net assets.
Distributions: Distributions paid by the Fund are recorded on the ex-dividend date. The character and timing of distributions are determined in accordance with federal income tax regulations, which may differ from U.S. GAAP.
Net income and realized gains from investments held by the Subsidiary are treated as ordinary income for tax purposes. If a net loss is realized by the Subsidiary in any taxable year, the loss will generally not be available to offset the Fund’s ordinary income and/or capital gains for that year.
Recent Accounting Standard: In November 2016, the Financial Accounting Standards Board issued Accounting Standards Update “Restricted Cash” which will require entities to include the total of cash, cash equivalents, restricted cash, and restricted cash equivalents in the beginning and ending cash balances in the Consolidated Statement of Cash Flows. The guidance will be applied retrospectively and is effective for fiscal years beginning after December 15, 2017, and interim periods within those years. Management is evaluating the impact, if any, of this guidance on the Fund’s presentation in the Consolidated Statement of Cash Flows.
Indemnifications: In the normal course of business, the Fund enters into contracts that contain a variety of representations that provide general indemnification. The Fund’s maximum exposure under these arrangements is unknown because it involves future potential claims against the Fund, which cannot be predicted with any certainty.
Other: Expenses directly related to the Fund or its classes are charged to the Fund or the applicable class. Other operating expenses shared by several funds, including other funds managed by the Manager, are prorated among those funds on the basis of relative net assets or other appropriate methods. Expenses directly related to the Fund and other shared expenses prorated to the Fund are allocated daily to each class based on its relative net assets or other appropriate methods.
The Fund has an arrangement with its custodian whereby credits are earned on uninvested cash balances, which could be used to reduce custody fees and/or overdraft charges. The Fund may incur charges on certain uninvested cash balances and overdrafts, subject to certain conditions.
3. Investment Valuation and Fair Value Measurements:
Investment Valuation Policies: The Fund’s investments are valued at fair value (also referred to as “market value” within the financial statements) as of the close of trading on the New York Stock Exchange (“NYSE”) (generally 4:00 p.m., Eastern time). U.S. GAAP defines fair value as the price the Fund would receive to sell an asset or pay to transfer a liability in an orderly transaction between market participants at the measurement date. The Fund determines the fair values of its financial instruments using various independent dealers or pricing services under policies approved by the Board of Trustees of the Fund (the “Board”). The BlackRock Global Valuation Methodologies Committee (the “Global Valuation Committee”) is the committee formed by management to develop global pricing policies and procedures and to oversee the pricing function for all financial instruments.
Fair Value Inputs and Methodologies: The following methods and inputs are used to establish the fair value of the Fund’s assets and liabilities:
| • | | Equity investments traded on a recognized securities exchange are valued at the official closing price each day, if available. For equity investments traded on more than one exchange, the official closing price on the exchange where the stock is primarily traded is used. Equity investments traded on a recognized exchange for which there were no sales on that day may be valued at the last available bid (long positions) or ask (short positions) price. |
| • | | Fixed-income securities for which market quotations are readily available are generally valued using the last available bid prices or current market quotations provided by independent dealers or third party pricing services. Floating rate loan interests are valued at the mean of the bid prices from one or more independent brokers or dealers as obtained from a third party pricing service. Pricing services generally value fixed-income securities assuming orderly transactions of an institutional round lot size, but the Fund may hold or transact in such securities in smaller, odd lot sizes. Odd lots often trade at lower prices than institutional round lots. The pricing services may use matrix pricing or valuation models that utilize certain inputs and assumptions to derive values, including transaction data (e.g., recent representative bids and offers), credit quality information, perceived market movements, news, and other relevant information. Certain fixed-income securities, including asset-backed and mortgage related securities may be valued based on valuation models that consider the estimated cash flows of each tranche of the entity, establish a benchmark yield and develop |
| | | | | | |
| | | BLACKROCK MULTI-MANAGER ALTERNATIVE STRATEGIES FUND | | FEBRUARY 28, 2017 | | 43 |
| | | | |
| Notes to Consolidated Financial Statements (continued) | | | | |
| | an estimated tranche specific spread to the benchmark yield based on the unique attributes of the tranche. The amortized cost method of valuation may be used with respect to debt obligations with sixty days or less remaining to maturity unless the Manager determines such method does not represent fair value. |
Generally, trading in foreign instruments is substantially completed each day at various times prior to the close of trading on the NYSE. Occasionally, events affecting the values of such instruments may occur between the foreign market close and the close of trading on the NYSE that may not be reflected in the computation of the Fund’s net assets. Each business day, the Fund uses a pricing service to assist with the valuation of certain foreign exchange-traded equity securities and foreign exchange-traded over-the-counter (“OTC”) options (the “Systematic Fair Value Price”). Using current market factors, the Systematic Fair Value Price is designed to value such foreign securities and foreign options at fair value as of the close of trading on the NYSE, which follows the close of the local markets.
| • | | Municipal investments (including commitments to purchase such investments on a “when-issued” basis) are valued on the basis of prices provided by dealers or pricing services. In determining the value of a particular investment, pricing services may use certain information with respect to transactions in such investments, quotations from dealers, pricing matrixes, market transactions in comparable investments and information with respect to various relationships between investments. |
| • | | Investments in open-end U.S. mutual funds are valued at NAV each business day. |
| • | | Futures contracts traded on exchanges are valued at their last sale price. |
| • | | Securities and other assets and liabilities denominated in foreign currencies are translated into U.S. dollars using exchange rates determined as of the close of trading on the NYSE. Forward foreign currency exchange contracts are valued at the mean between the bid and ask prices and are determined as of the close of trading on the NYSE. Interpolated values are derived when the settlement date of the contract is an interim date for which quotations are not available. |
| • | | Exchange-traded options are valued at the mean between the last bid and ask prices at the close of the options market in which the options trade. An exchange-traded option for which there is no mean price is valued at the last bid (long positions) or ask (short positions) price. If no bid or ask price is available, the prior day’s price will be used, unless it is determined that the prior day’s price no longer reflects the fair value of the option. OTC options are valued by an independent pricing service using a mathematical model, which incorporates a number of market data factors, such as the trades and prices of the underlying instruments. |
| • | | Swap agreements are valued utilizing quotes received daily by the Fund’s pricing service or through brokers, which are derived using daily swap curves and models that incorporate a number of market data factors, such as discounted cash flows, trades and values of the underlying reference instruments. |
If events (e.g., a company announcement, market volatility or a natural disaster) occur that are expected to materially affect the value of such investments, or in the event that the application of these methods of valuation results in a price for an investment that is deemed not to be representative of the market value of such investment, or if a price is not available, the investment will be valued by the Global Valuation Committee, or its delegate, in accordance with a policy approved by the Board as reflecting fair value (“Fair Valued Investments”). The fair valuation approaches that may be used by the Global Valuation Committee will include Market approach, Income approach and Cost approach. Valuation techniques such as discounted cash flow, use of market comparables and matrix pricing are types of valuation approaches and typically used in determining fair value. When determining the price for Fair Valued Investments, the Global Valuation Committee, or its delegate, seeks to determine the price that the Fund might reasonably expect to receive or pay from the current sale or purchase of that asset or liability in an arm’s-length transaction. Fair value determinations shall be based upon all available factors that the Global Valuation Committee, or its delegate, deems relevant and consistent with the principles of fair value measurement.
The Global Valuation Committee, or its delegate, employs various methods for calibrating valuation approaches for investments where an active market does not exist, including regular due diligence of the Fund’s pricing vendors, regular reviews of key inputs and assumptions, transactional back-testing or disposition analysis to compare unrealized gains and losses to realized gains and losses, reviews of missing or stale prices and large movements in market values and reviews of any market related activity. The pricing of all Fair Valued Investments is subsequently reported to the Board or a committee thereof on a quarterly basis. As a result of the inherent uncertainty in valuation of these investments, the fair values may differ from the values that would have been used had an active market existed.
| | | | | | |
| 44 | | BLACKROCK MULTI-MANAGER ALTERNATIVE STRATEGIES FUND | | FEBRUARY 28, 2017 | | |
| | | | |
| Notes to Consolidated Financial Statements (continued) | | | | |
For investments in equity or debt issued by privately-held companies or funds (“Private Company” or collectively, the “Private Companies”) and other Fair Valued Investments, the fair valuation approaches that are used by third party pricing services utilize one or a combination of, but not limited to, the following inputs.
| | | | | | |
| | | | | | Standard Inputs Generally Considered By Third Party Pricing Services |
| | |
Market approach | | | (i | ) | | recent market transactions, including subsequent rounds of financing, in the underlying investment or comparable issuers; |
| | | (ii | ) | | recapitalizations and other transactions across the capital structure; and |
| | | | (iii | ) | | market multiples of comparable issuers. |
| | |
Income approach | | | (i | ) | | future cash flows discounted to present and adjusted as appropriate for liquidity, credit, and/or market risks; |
| | | (ii | ) | | quoted prices for similar investments or assets in active markets; and |
| | | | (iii | ) | | other risk factors, such as interest rates, yield curves, volatilities, prepayment speeds, loss severities, credit risks, recovery rates, liquidation amounts and/or default rates. |
| | |
Cost approach | | | (i | ) | | audited or unaudited financial statements, investor communications and financial or operational metrics issued by the Private Company; |
| | | (ii | ) | | changes in the valuation of relevant indices or publicly traded companies comparable to the Private Company; |
| | | (iii | ) | | relevant news and other public sources; and |
| | | | (iv | ) | | known secondary market transactions in the Private Company’s interests and merger or acquisition activity in companies comparable to the Private Company. |
Investments in series of preferred stock issued by Private Companies are typically valued utilizing Market approach in determining the enterprise value of the company. Such investments often contain rights and preferences that differ from other series of preferred and common stock of the same issuer. Valuation techniques such as an option pricing model (“OPM”), a probability weighted expected return model (“PWERM”) or a hybrid of those techniques are used in allocating enterprise value of the company, as deemed appropriate under the circumstances. The use of OPM and PWERM techniques involve a determination of the exit scenarios of the investment in order to appropriately allocate the enterprise value of the company among the various parts of its capital structure.
The Private Companies are not subject to the public company disclosure, timing, and reporting standards as other investments held by the Fund. Typically, the most recently available information by a Private Company is as of a date that is earlier than the date the Fund is calculating its NAV. This factor may result in a difference between the value of the investment and the price the Fund could receive upon the sale of the investment.
Fair Value Hierarchy: Various inputs are used in determining the fair value of investments and derivative financial instruments. These inputs to valuation techniques are categorized into a fair value hierarchy consisting of three broad levels for financial statement purposes as follows:
| | • | | Level 1 — unadjusted price quotations in active markets/exchanges for identical assets or liabilities that the Fund has the ability to access |
| | • | | Level 2 — other observable inputs (including, but not limited to, quoted prices for similar assets or liabilities in markets that are active, quoted prices for identical or similar assets or liabilities in markets that are not active, inputs other than quoted prices that are observable for the assets or liabilities (such as interest rates, yield curves, volatilities, prepayment speeds, loss severities, credit risks and default rates) or other market-corroborated inputs) |
| | • | | Level 3 — unobservable inputs based on the best information available in the circumstances, to the extent observable inputs are not available (including the Fund’s own assumptions used in determining the fair value of investments and derivative financial instruments) |
The hierarchy gives the highest priority to unadjusted quoted prices in active markets for identical assets or liabilities (Level 1 measurements) and the lowest priority to unobservable inputs (Level 3 measurements). Accordingly, the degree of judgment exercised in determining fair value is greatest for instruments categorized in Level 3. The inputs used to measure fair value may fall into different levels of the fair value hierarchy. In such cases, for disclosure purposes, the fair value hierarchy classification is determined based on the lowest level input that is significant to the fair value measurement in its entirety. Investments classified within Level 3 have significant unobservable inputs used by the Global Valuation Committee in determining the price for Fair Valued Investments. Level 3 investments include equity or debt issued by Private Companies. There may not be a secondary market, and/or there are a limited number of investors. Level 3 investments may also be adjusted to reflect illiquidity and/or non-transferability, with the amount of such discount estimated by the Global Valuation Committee in the absence of market information.
Changes in valuation techniques may result in transfers into or out of an assigned level within the hierarchy. In accordance with the Fund’s policy, transfers between different levels of the fair value hierarchy are deemed to have occurred as of the beginning of the reporting period. The categorization of a
| | | | | | |
| | | BLACKROCK MULTI-MANAGER ALTERNATIVE STRATEGIES FUND | | FEBRUARY 28, 2017 | | 45 |
| | | | |
| Notes to Consolidated Financial Statements (continued) | | | | |
value determined for investments and derivative financial instruments is based on the pricing transparency of the investments and derivative financial instruments and is not necessarily an indication of the risks associated with investing in those securities.
4. Securities and Other Investments:
Asset-Backed and Mortgage-Backed Securities: Asset-backed securities are generally issued as pass-through certificates or as debt instruments. Asset-backed securities issued as pass-through certificates represent undivided fractional ownership interests in an underlying pool of assets. Asset-backed securities issued as debt instruments, which are also known as collateralized obligations, are typically issued as the debt of a special purpose entity organized solely for the purpose of owning such assets and issuing such debt. Asset-backed securities are often backed by a pool of assets representing the obligations of a number of different parties. The yield characteristics of certain asset-backed securities may differ from traditional debt securities. One such major difference is that all or a principal part of the obligations may be prepaid at any time because the underlying assets (i.e., loans) may be prepaid at any time. As a result, a decrease in interest rates in the market may result in increases in the level of prepayments as borrowers, particularly mortgagors, refinance and repay their loans. An increased prepayment rate with respect to an asset-backed security will have the effect of shortening the maturity of the security. In addition, the Fund may subsequently have to reinvest the proceeds at lower interest rates. If the Fund has purchased such an asset-backed security at a premium, a faster than anticipated prepayment rate could result in a loss of principal to the extent of the premium paid.
For mortgage pass-through securities (the “Mortgage Assets”) there are a number of important differences among the agencies and instrumentalities of the U.S. Government that issue mortgage-related securities and among the securities that they issue. For example, mortgage-related securities guaranteed by Ginnie Mae are guaranteed as to the timely payment of principal and interest by Ginnie Mae and such guarantee is backed by the full faith and credit of the United States. However, mortgage-related securities issued by Freddie Mac and Fannie Mae, including Freddie Mac and Fannie Mae guaranteed mortgage pass-through certificates, which are solely the obligations of Freddie Mac and Fannie Mae, are not backed by or entitled to the full faith and credit of the United States, but are supported by the right of the issuer to borrow from the U.S. Treasury.
Non-agency mortgage-backed securities are securities issued by non-governmental issuers and have no direct or indirect government guarantees of payment and are subject to various risks. Non-agency mortgage loans are obligations of the borrowers thereunder only and are not typically insured or guaranteed by any other person or entity. The ability of a borrower to repay a loan is dependent upon the income or assets of the borrower. A number of factors, including a general economic downturn, acts of God, terrorism, social unrest and civil disturbances, may impair a borrower’s ability to repay its loans.
Collateralized Debt Obligations: Collateralized debt obligations (“CDOs”), including collateralized bond obligations (“CBOs”) and collateralized loan obligations (“CLOs”), are types of asset-backed securities. A CDO is an entity that is backed by a diversified pool of debt securities (CBOs) or syndicated bank loans (CLOs). The cash flows of the CDO can be split into multiple segments, called “tranches,” which will vary in risk profile and yield. The riskiest segment is the subordinated or “equity” tranche. This tranche bears the greatest risk of defaults from the underlying assets in the CDO and serves to protect the other, more senior, tranches from default in all but the most severe circumstances. Since it is shielded from defaults by the more junior tranches, a “senior” tranche will typically have higher credit ratings and lower yields than their underlying securities, and often receive investment grade ratings from one or more of the nationally recognized rating agencies. Despite the protection from the more junior tranches, senior tranches can experience substantial losses due to actual defaults, increased sensitivity to future defaults and the disappearance of one or more protecting tranches as a result of changes in the credit profile of the underlying pool of assets.
Multiple Class Pass-Through Securities: Multiple class pass-through securities, including collateralized mortgage obligations (“CMOs”) and commercial mortgage-backed securities, may be issued by Ginnie Mae, U.S. Government agencies or instrumentalities or by trusts formed by private originators of, or investors in, mortgage loans. In general, CMOs are debt obligations of a legal entity that are collateralized by a pool of residential or commercial mortgage loans or Mortgage Assets. The payments on these are used to make payments on the CMOs or multiple pass-through securities. Multiple class pass-through securities represent direct ownership interests in the Mortgage Assets. Classes of CMOs include interest only (“IOs”), principal only (“POs”), planned amortization classes and targeted amortization classes. IOs and POs are stripped mortgage-backed securities representing interests in a pool of mortgages, the cash flow from which has been separated into interest and principal components. IOs receive the interest portion of the cash flow while POs receive the principal portion. IOs and POs can be extremely volatile in response to changes in interest rates. As interest rates rise and fall, the value of IOs tends to move in the same direction as interest rates. POs perform best when prepayments on the underlying mortgages rise since this increases the rate at which the principal is returned and the yield to maturity on the PO. When payments on mortgages underlying a PO are slower than anticipated, the life of the PO is lengthened and the yield to maturity is reduced. If the underlying Mortgage Assets experience greater than anticipated prepayments of principal, the Fund’s initial investment in the IOs may not fully recoup.
Stripped Mortgage-Backed Securities: Stripped mortgage-backed securities are typically issued by the U.S. Government, its agencies and instrumentalities. Stripped mortgage-backed securities are usually structured with two classes that receive different proportions of the interest (IOs) and principal (POs) distributions on a pool of Mortgage Assets. Stripped mortgage-backed securities may be privately issued.
| | | | | | |
| 46 | | BLACKROCK MULTI-MANAGER ALTERNATIVE STRATEGIES FUND | | FEBRUARY 28, 2017 | | |
| | | | |
| Notes to Consolidated Financial Statements (continued) | | | | |
Zero-Coupon Bonds: Zero-coupon bonds are normally issued at a significant discount from face value and do not provide for periodic interest payments. These bonds may experience greater volatility in market value than other debt obligations of similar maturity which provide for regular interest payments.
Capital Securities and Trust Preferred Securities: Capital securities, including trust preferred securities, are typically issued by corporations, generally in the form of interest-bearing notes with preferred securities characteristics. In the case of trust preferred securities, an affiliated business trust of a corporation issues these securities, generally in the form of beneficial interests in subordinated debentures or similarly structured securities. The securities can be structured with either a fixed or adjustable coupon that can have either a perpetual or stated maturity date. For trust preferred securities, the issuing bank or corporation pays interest to the trust, which is then distributed to holders of these securities as a dividend. Dividends can be deferred without creating an event of default or acceleration, although maturity cannot take place unless all cumulative payment obligations have been met. The deferral of payments does not affect the purchase or sale of these securities in the open market. Payments on these securities are treated as interest rather than dividends for federal income tax purposes. These securities generally are rated below that of the issuing company’s senior debt securities and are freely callable at the issuer’s option.
Preferred Stock: Preferred stock has a preference over common stock in liquidation (and generally in receiving dividends as well), but is subordinated to the liabilities of the issuer in all respects. As a general rule, the market value of preferred stock with a fixed dividend rate and no conversion element varies inversely with interest rates and perceived credit risk, while the market price of convertible preferred stock generally also reflects some element of conversion value. Because preferred stock is junior to debt securities and other obligations of the issuer, deterioration in the credit quality of the issuer will cause greater changes in the value of a preferred stock than in a more senior debt security with similar stated yield characteristics. Unlike interest payments on debt securities, preferred stock dividends are payable only if declared by the issuer’s board of directors. Preferred stock also may be subject to optional or mandatory redemption provisions.
Warrants: Warrants entitle the Fund to purchase a specified number of shares of common stock and are non-income producing. The purchase price and number of shares are subject to adjustment under certain conditions until the expiration date of the warrants, if any. If the price of the underlying stock does not rise above the strike price before the warrant expires, the warrant generally expires without any value and the Fund will lose any amount it paid for the warrant. Thus, investments in warrants may involve more risk than investments in common stock. Warrants may trade in the same markets as their underlying stock; however, the price of the warrant does not necessarily move with the price of the underlying stock.
Floating Rate Loan Interests: Floating rate loan interests are typically issued to companies (the “borrower”) by banks, other financial institutions, or privately and publicly offered corporations (the “lender”). Floating rate loan interests are generally non-investment grade, often involve borrowers whose financial condition is troubled or uncertain and companies that are highly leveraged or in bankruptcy proceedings. In addition, transactions in floating rate loan interests may settle on a delayed basis, which may result to proceeds from the sale to not be readily available for the Fund to make additional investments or meet its redemption obligations. Floating rate loan interests may include fully funded term loans or revolving lines of credit. Floating rate loan interests are typically senior in the corporate capital structure of the borrower. Floating rate loan interests generally pay interest at rates that are periodically determined by reference to a base lending rate plus a premium. Since the rates reset only periodically, changes in prevailing interest rates (and particularly sudden and significant changes) can be expected to cause some fluctuations in the NAV of the Fund to the extent that it invests in floating rate loan interest. The base lending rates are generally the lending rate offered by one or more European banks, such as the London Inter-bank Offered Rate (“LIBOR”), the prime rate offered by one or more U.S. banks or the certificate of deposit rate. Floating rate loan interests may involve foreign borrowers, and investments may be denominated in foreign currencies. These investments are treated as investments in debt securities for purposes of the Fund’s investment policies.
When the Fund purchases a floating rate loan interest, it may receive a facility fee and when it sells a floating rate loan interest, it may pay a facility fee. On an ongoing basis, the Fund may receive a commitment fee based on the undrawn portion of the underlying line of credit amount of a floating rate loan interest. Facility and commitment fees are typically amortized to income over the term of the loan or term of the commitment, respectively. Consent and amendment fees are recorded to income as earned. Prepayment penalty fees, which may be received by the Fund upon the prepayment of a floating rate loan interest by a borrower, are recorded as realized gains. The Fund may invest in multiple series or tranches of a loan. A different series or tranche may have varying terms and carry different associated risks.
Floating rate loan interests are usually freely callable at the borrower’s option. The Fund may invest in such loans in the form of participations in loans (“Participations”) or assignments (“Assignments”) of all or a portion of loans from third parties. Participations typically will result in the Fund having a contractual relationship only with the lender, not with the borrower. The Fund has the right to receive payments of principal, interest and any fees to which it is entitled only from the lender selling the Participation and only upon receipt by the lender of the payments from the borrower. In connection with purchasing Participations, the Fund generally will have no right to enforce compliance by the borrower with the terms of the loan agreement, nor any rights of offset against the borrower. The Fund may not benefit directly from any collateral supporting the loan in which it has purchased the Participation. As a result, the Fund assumes the credit risk of both the borrower and the lender that is selling the Participation. The Fund’s investment in loan participation interests involves the risk of insolvency of the financial intermediaries who are parties to the transactions. In the event of the insolvency of the lender selling the Participation, the Fund may be treated as a general creditor of the lender and may not benefit from any offset between
| | | | | | |
| | | BLACKROCK MULTI-MANAGER ALTERNATIVE STRATEGIES FUND | | FEBRUARY 28, 2017 | | 47 |
| | | | |
| Notes to Consolidated Financial Statements (continued) | | | | |
the lender and the borrower. Assignments typically result in the Fund having a direct contractual relationship with the borrower, and the Fund may enforce compliance by the borrower with the terms of the loan agreement.
Short Sales Transactions (Corporate Bonds): In short sale transactions, the Fund sells a security it does not hold in anticipation of a decline in the market price of that security. When the Fund makes a short sale, it will borrow the security sold short and deliver the fixed-income security to the counterparty to which it sold the security short. An amount equal to the proceeds received by the Fund is reflected as an asset and an equivalent liability. The amount of the liability is subsequently marked-to-market to reflect the market value of the short sale. The Fund is required to repay the counterparty interest on the security sold short, which, if applicable, is shown as interest expense in the Consolidated Statement of Operations. The Fund is exposed to market risk based on the amount, if any, that the market value of the security increases beyond the market value at which the position was sold. Thus, a short sale of a security involves the risk that instead of declining, the price of the security sold short will rise. The short sale of securities involves the possibility of an unlimited loss since there is an unlimited potential for the market price of the security sold short to increase. A gain is limited to the price at which the Fund sold the security short. A realized gain or loss is recognized upon the termination of a short sale if the market price is either less than or greater than the proceeds originally received. There is no assurance that the Fund will be able to close out a short position at a particular time or at an acceptable price.
Short Sales Transactions (Investments Sold Short): In short sale transaction, the Fund sells a security it does not hold in anticipation of a decline in the market price of that security. When the Fund makes a short sale, it will borrow the security sold short from a broker/counterparty and deliver the security to the purchaser. To close out a short position, the Fund delivers the same security to the broker and records a liability to reflect the obligation to return the security to the broker. The amount of the liability is subsequently marked-to-market to reflect the market value of the short sale. The Fund maintains a segregated account of securities or deposits cash with the broker-dealer as collateral for the short sales. Cash deposited with the broker is recorded as an asset in the Consolidated Statement of Assets and Liabilities. Securities segregated as collateral are denoted in the Consolidated Schedule of Investments. The Fund may pay a financing fee for the difference between the market value of the short position and the cash collateral deposited with the broker which would be recorded as interest expense. The Fund is required to repay the counterparty any dividends received on the security sold short, which, if applicable, is shown as dividend expense in the Consolidated Statement of Operations. The Fund may pay a fee on the assets borrowed from the counterparty, which, if applicable, is shown as broker fees and expenses on short sales in the Consolidated Statement of Operations. The Fund is exposed to market risk based on the amount, if any, that the market value of the security increases beyond the market value at which the position was sold. Thus, a short sale of a security involves the risk that instead of declining, the price of the security sold short will rise. The short sale of securities involves the possibility of an unlimited loss since there is an unlimited potential for the market price of the security sold short to increase. A gain, limited to the price at which the Fund sold the security short. A realized gain or loss is recognized upon the termination of a short sale if the market price is either less than or greater than the proceeds originally received. There is no assurance that the Fund will be able to close out a short position at a particular time or at an acceptable price.
5. Derivative Financial Instruments:
The Fund engages in various portfolio investment strategies using derivative contracts both to increase the returns of the Fund and/or to manage its exposure to certain risks such as credit risk, equity risk, interest rate risk, foreign currency exchange rate risk, commodity price risk or other risks (e.g., inflation risk). Derivative financial instruments categorized by risk exposure are included in the Consolidated Schedule of Investments. These contracts may be transacted on an exchange or OTC.
Futures Contracts: The Fund invests in long and/or short positions in futures and options on futures contracts to gain exposure to, or manage exposure to, changes in interest rates (interest rate risk), changes in the value of equity securities (equity risk) or foreign currencies (foreign currency exchange rate risk).
Futures contracts are agreements between the Fund and a counterparty to buy or sell a specific quantity of an underlying instrument at a specified price and on a specified date. Depending on the terms of a contract, it is settled either through physical delivery of the underlying instrument on the settlement date or by payment of a cash amount on the settlement date. Upon entering into a futures contract, the Fund is required to deposit initial margin with the broker in the form of cash or securities in an amount that varies depending on a contract’s size and risk profile. The initial margin deposit must then be maintained at an established level over the life of the contract.
Securities deposited as initial margin are designated in the Consolidated Schedule of Investments and cash deposited, if any, is shown as cash pledged for futures contracts in the Consolidated Statement of Assets and Liabilities. Pursuant to the contract, the Fund agrees to receive from or pay to the broker an amount of cash equal to the daily fluctuation in market value of the contract (“variation margin”). Variation margin is recorded as unrealized appreciation (depreciation) and, if any, shown as variation margin receivable (or payable) on futures contracts in the Consolidated Statement of Assets and Liabilities. When the contract is closed, a realized gain or loss is recorded in the Consolidated Statement of Operations equal to the difference between the value of the contract at the time it was opened and the value at the time it was closed. The use of futures contracts involves the risk of an imperfect correlation in the movements in the price of futures contracts and interest, foreign currency exchange rates or underlying assets.
| | | | | | |
| 48 | | BLACKROCK MULTI-MANAGER ALTERNATIVE STRATEGIES FUND | | FEBRUARY 28, 2017 | | |
| | | | |
| Notes to Consolidated Financial Statements (continued) | | | | |
Forward Foreign Currency Exchange Contracts: The Fund enters into forward foreign currency exchange contracts to gain or reduce exposure to foreign currencies (foreign currency exchange rate risk).
A forward foreign currency exchange contract is an agreement between two parties to buy and sell a currency at a set exchange rate on a specified date. These contracts help to manage the overall exposure to the currencies in which some of the investments held by the Fund are denominated and in some cases, may be used to obtain exposure to a particular market.
The contract is marked to market daily and the change in market value is recorded as unrealized appreciation (depreciation) in the Consolidated Statement of Assets and Liabilities. When a contract is closed, a realized gain or loss is recorded in the Consolidated Statement of Operations equal to the difference between the value at the time it was opened and the value at the time it was closed. Non-deliverable forward foreign currency exchange contracts are settled with the counterparty in cash without the delivery of foreign currency. The use of forward foreign currency exchange contracts involves the risk that the value of a forward foreign currency exchange contract changes unfavorably due to movements in the value of the referenced foreign currencies.
Options: The Fund purchases and writes call and put options to increase or decrease its exposure to the risks of underlying instruments, including equity risk, interest rate risk and/or commodity price risk and/or, in the case of options written, to generate gains from options premiums.
A call option gives the purchaser (holder) of the option the right (but not the obligation) to buy, and obligates the seller (writer) to sell (when the option is exercised) the underlying instrument at the exercise or strike price at any time or at a specified time during the option period. A put option gives the holder the right to sell and obligates the writer to buy the underlying instrument at the exercise or strike price at any time or at a specified time during the option period.
Premiums paid on options purchased and premiums received on options written, as well as the daily fluctuation in market value, are included in investments at value – unaffiliated and options written at value, respectively, in the Consolidated Statement of Assets and Liabilities. When an instrument is purchased or sold through the exercise of an option, the premium is offset against the cost or proceeds of the underlying instrument. When an option expires, a realized gain or loss is recorded in the Consolidated Statement of Operations to the extent of the premiums received or paid. When an option is closed or sold, a gain or loss is recorded in the Consolidated Statement of Operations to the extent the cost of the closing transaction exceeds the premiums received or paid). When the Fund writes a call option, such option is typically “covered,” meaning that it holds the underlying instrument subject to being called by the option counterparty. When the Fund writes a put option, such option is covered by cash in an amount sufficient to cover the obligation.
Swaps: The Fund enters into swap contracts to manage exposure to issuers, markets and securities. Such contracts are agreements between the Fund and a counterparty to make periodic net payments on a specified notional amount or a net payment upon termination. Swap agreements are privately negotiated in the OTC market and may be entered into as a bilateral contract (“OTC swaps”) or centrally cleared (“centrally cleared swaps”).
For OTC swaps, any upfront premiums paid and any upfront fees received are shown as swap premiums paid and swap premiums received, respectively, in the Consolidated Statement of Assets and Liabilities and amortized over the term of the contract. The daily fluctuation in market value is recorded as unrealized appreciation (depreciation) on OTC Swaps in the Consolidated Statement of Assets and Liabilities. Payments received or paid are recorded in the Consolidated Statement of Operations as realized gains or losses, respectively. When an OTC swap is terminated, a realized gain or loss is recorded in the Consolidated Statement of Operations equal to the difference between the proceeds from (or cost of) the closing transaction and the Fund’s basis in the contract, if any. Generally, the basis of the contract is the premium received or paid.
In a centrally cleared swap, immediately following execution of the swap contract, the swap contract is novated to a central counterparty (the “CCP”) and the Fund’s counterparty on the swap agreement becomes the CCP. The Fund is required to interface with the CCP through the broker. Upon entering into a centrally cleared swap, the Fund is required to deposit initial margin with the broker in the form of cash or securities in an amount that varies depending on the size and risk profile of the particular swap. Securities deposited as initial margin are designated in the Consolidated Schedule of Investments and cash deposited is shown as cash pledged for centrally cleared swaps in the Consolidated Statement of Assets and Liabilities. Pursuant to the contract, the Fund agrees to receive from or pay to the broker an amount of cash equal to the daily fluctuation in market value of the contract (“variation margin”). Variation margin is recorded as unrealized appreciation (depreciation) and shown as variation margin receivable (or payable) on centrally cleared swaps in the Consolidated Statement of Assets and Liabilities. Payments received from (paid to) the counterparty, including at termination, are recorded as realized gains (losses) in the Consolidated Statement of Operations.
| • | | Credit default swaps — The Fund enters into credit default swaps to manage its exposure to the market or certain sectors of the market, to reduce their risk exposure to defaults of corporate and/or sovereign issuers or to create exposure to corporate and/or sovereign issuers to which it is not otherwise exposed (credit risk). |
| | | | | | |
| | | BLACKROCK MULTI-MANAGER ALTERNATIVE STRATEGIES FUND | | FEBRUARY 28, 2017 | | 49 |
| | | | |
| Notes to Consolidated Financial Statements (continued) | | | | |
The Fund may either buy or sell (write) credit default swaps on single-name issuers (corporate or sovereign), a combination or basket of single-name issuers or traded indexes. Credit default swaps are agreements in which the protection buyer pays fixed periodic payments to the seller in consideration for a promise from the protection seller to make a specific payment should a negative credit event take place with respect to the referenced entity (e.g., bankruptcy, failure to pay, obligation acceleration, repudiation, moratorium or restructuring). As a buyer, if an underlying credit event occurs, the Fund will either (i) receive from the seller an amount equal to the notional amount of the swap and deliver the referenced security or underlying securities comprising the index, or (ii) receive a net settlement of cash equal to the notional amount of the swap less the recovery value of the security or underlying securities comprising the index. As a seller (writer), if an underlying credit event occurs, the Fund will either pay the buyer an amount equal to the notional amount of the swap and take delivery of the referenced security or underlying securities comprising the index or pay a net settlement of cash equal to the notional amount of the swap less the recovery value of the security or underlying securities comprising the index.
| • | | Total return swaps — The Fund enters into total return swaps to obtain exposure to a security or market without owning such security or investing directly in such market or to exchange the risk/return of one market (e.g., fixed income) with another market (e.g., equity or commodity prices) (equity risk, commodity price risk and/or interest rate risk). |
Total return swaps are agreements in which there is an exchange of cash flows whereby one party commits to make payments based on the total return (distributions plus capital gains/losses) of an underlying instrument in exchange for fixed or floating rate interest payments. If the total return of the instrument or index underlying the transaction exceeds or falls short of the offsetting fixed or floating interest rate obligation, the Fund receives payment from or makes a payment to the counterparty.
| • | | Total return basket swaps — The Fund enters into total return swaps to obtain exposure to a portfolio of long and short securities without owning such securities. |
Under the terms of a contract, the swap is designed to function as a portfolio of direct investments in long and short equity positions. This means that the Fund has the ability to trade in and out of these long and short positions within the swap and will receive the economic benefits and risks equivalent to direct investment in these positions, subject to certain adjustments due to events related to the counterparty. Benefits and risks include capital appreciation (depreciation), corporate actions and dividends received and paid, all of which are reflected in the swap’s market value. The market value also includes interest charges and credits (“financing fees”) related to the notional values of the long and short positions and cash balances within the swap. These interest charges and credits are based on a specified benchmark rate plus or minus a specified spread determined based upon the country and/or currency of the positions in the portfolio.
Positions within the swap and financing fees are reset periodically. During a reset, any unrealized appreciation (depreciation) on positions and accrued financing fees become available for cash settlement between the Fund and the counterparty. The amounts that are available for cash settlement are recorded as realized gains or losses in the Consolidated Statement of Operations. Cash settlement in and out of the swap may occur at a reset date or any other date, at the discretion of the Fund and the counterparty, over the life of the agreement. Certain swaps have no stated expiration and can be terminated by either party at any time.
| • | | Interest rate swaps — The Fund enters into interest rate swaps to gain or reduce exposure to interest rates or to manage duration, the yield curve or interest rate (interest rate risk). |
Interest rate swaps are agreements in which one party pays a stream of interest payments, either fixed or floating, in exchange for another party’s stream of interest payments, either fixed or floating, on the same notional amount for a specified period of time. In more complex interest rate swaps, the notional principal amount may decline (or amortize) over time.
Swap transactions involve, to varying degrees, elements of interest rate, credit and market risk in excess of the amounts recognized in the Consolidated Statement of Assets and Liabilities. Such risks involve the possibility that there will be no liquid market for these agreements, that the counterparty to the agreements may default on its obligation to perform or disagree as to the meaning of the contractual terms in the agreements, and that there may be unfavorable changes in interest rates and/or market values associated with these transactions.
Master Netting Arrangements: In order to define its contractual rights and to secure rights that will help it mitigate its counterparty risk, the Fund may enter into an International Swaps and Derivatives Association, Inc. Master Agreement (“ISDA Master Agreement”) or similar agreement with its counterparties. An ISDA Master Agreement is a bilateral agreement between the Fund and a counterparty that governs certain OTC derivatives and typically contains, among other things, collateral posting terms and netting provisions in the event of a default and/or termination event. Under an ISDA Master Agreement, the Fund may, under certain circumstances, offset with the counterparty certain derivative financial instruments’ payables
| | | | | | |
| 50 | | BLACKROCK MULTI-MANAGER ALTERNATIVE STRATEGIES FUND | | FEBRUARY 28, 2017 | | |
| | | | |
| Notes to Consolidated Financial Statements (continued) | | | | |
and/or receivables with collateral held and/or posted and create one single net payment. The provisions of the ISDA Master Agreement typically permit a single net payment in the event of default including the bankruptcy or insolvency of the counterparty. Bankruptcy or insolvency laws of a particular jurisdiction may restrict or prohibit the right of offset in bankruptcy, insolvency or other events. In addition, certain ISDA Master Agreements allow counterparties to terminate derivative contracts prior to maturity in the event the Fund’s net assets decline by a stated percentage or the Fund fails to meet the terms of its ISDA Master Agreements. The result would cause the Fund to accelerate payment of any net liability owed to the counterparty.
Collateral Requirements: For derivatives traded under an ISDA Master Agreement, the collateral requirements are typically calculated by netting the mark-to-market amount for each transaction under such agreement and comparing that amount to the value of any collateral currently pledged by the Fund and the counterparty.
Cash collateral that has been pledged to cover obligations of the Fund and cash collateral received from the counterparty, if any, is reported separately on the Consolidated Statement of Assets and Liabilities as cash pledged as collateral and cash received as collateral, respectively. Non-cash collateral pledged by the Fund, if any, is noted in the Consolidated Schedule of Investments. Generally, the amount of collateral due from or to a counterparty is subject to a certain minimum transfer amount threshold before a transfer is required, which is determined at the close of business of the Fund. Any additional required collateral is delivered to/pledged by the Fund on the next business day. Typically, the counterparty is not permitted to sell, re-pledge or use cash and non-cash collateral it receives. The Fund generally agrees not to use non-cash collateral that it receives but may, absent default or certain other circumstances defined in the underlying ISDA Master Agreement, be permitted to use cash collateral received. In such cases, interest may be paid pursuant to the collateral arrangement with the counterparty. To the extent amounts due to the Fund from its counterparties are not fully collateralized, it bears the risk of loss from counterparty non-performance. Likewise, to the extent the Fund has delivered collateral to a counterparty and stands ready to perform under the terms of its agreement with such counterparty, it bears the risk of loss from a counterparty in the amount of the value of the collateral in the event the counterparty fails to return such collateral. Based on the terms of agreements, collateral may not be required for all derivative contracts.
For financial reporting purposes, the Fund does not offset derivative assets and derivative liabilities that are subject to netting arrangements, if any, in the Consolidated Statement of Assets and Liabilities.
6. Investment Advisory Agreement and Other Transactions with Affiliates:
The PNC Financial Services Group, Inc. is the largest stockholder and an affiliate of BlackRock, Inc. (“BlackRock”) for 1940 Act purposes.
Investment Advisory: The Trust, on behalf of the Fund, entered into an Investment Advisory Agreement with the Manager, the Fund’s investment adviser, an indirect, wholly-owned subsidiary of BlackRock, to provide investment advisory and administration services. The Manager is responsible for the management of the Fund’s portfolio and provides the personnel, facilities, equipment and certain other services necessary to the operations of the Fund.
For such services, the Fund pays the Manager a monthly fee at an annual rate equal to the following percentages of the average daily value of the Fund’s net assets:
| | |
| Average Daily Net Assets | | Investment
Advisory Fee |
First $1 Billion | | 1.80% |
$1 Billion - $3 Billion | | 1.69% |
$3 Billion - $5 Billion | | 1.62% |
$5 Billion - $10 Billion | | 1.57% |
Greater than $10 Billion | | 1.53% |
The Manager provides investment management and other services to the Subsidiary. The Manager does not receive separate compensation from the Subsidiary for providing investment management or administrative services. However, the Fund pays the Manager based on the Fund’s net assets, which includes the assets of the Subsidiary.
With respect to the Fund, the Manager entered into separate sub-advisory agreements with Benefit Street Partners, LLC (“BSP”), GLG Partners LP (“GLG”), Ionic Capital Management LLC (“ION”), LibreMax Capital, LLC (“LMC”), Marathon Asset Management, LP (“Marathon”), Pine River Capital Management L.P. (“Pine River”), QMS Capital Management LP (“QMS”), BlackRock International Limited (“BIL”), BlackRock Asset Management North Asia Limited (“BAMNAL”) and BlackRock (Singapore) Limited (“BRS”). BIL, BAMNAL and BRS are each an affiliate of the Manager. The Manager pays BSP, GLG, ION, LMC, Marathon, Pine River, QMS, BIL, BAMNAL and BRS, for services they provide, a monthly fee that is a percentage of the investment advisory fees paid by the Fund to the Manager.
| | | | | | |
| | | BLACKROCK MULTI-MANAGER ALTERNATIVE STRATEGIES FUND | | FEBRUARY 28, 2017 | | 51 |
| | | | |
| Notes to Consolidated Financial Statements (continued) | | | | |
Service and Distribution Fees: The Trust, on behalf of the Fund, entered into a Distribution Agreement and Distribution and Service Plan with BlackRock Investments, LLC (“BRIL”), an affiliate of the Manager. Pursuant to the Distribution and Service Plan and in accordance with Rule 12b-1 under the 1940 Act, the Fund pays BRIL ongoing service and distribution fees. The fees are accrued daily and paid monthly at annual rates based upon the average daily net assets of the relevant share class of the Fund as follows:
| | | | | | |
| | | Investor A | | Investor C | |
Service Fee | | 0.25% | | | 0.25% | |
Distribution Fee | | — | | | 0.75% | |
BRIL and broker-dealers, pursuant to sub-agreements with BRIL, provide shareholder servicing and distribution services to the Fund. The ongoing service and/or distribution fee compensates BRIL and each broker-dealer for providing shareholder servicing and/or distribution related services to the shareholders.
For the six months ended February 28, 2017, the following table shows the class specific service and distribution fees borne directly by each share class of the Fund:
| | | | |
| Investor A | | Investor C | | Total |
$4,221 | | $2,320 | | $6,541
|
Administration: The Trust, on behalf of the Fund, entered into an Administration Agreement with the Manager, an indirect, wholly-owned subsidiary of BlackRock, to provide administrative services. For these services, the Manager receives an administration fee computed daily and payable monthly, based on a percentage of the average daily net assets of the Fund. The administration fee, which is shown as administration in the Consolidated Statement of Operations, is paid at the annual rates below.
| | |
| Average Daily Net Assets | | Administration Fee |
First $500 Million | | 0.05% |
$500 Million - $1 Billion | | 0.04% |
Greater than $1 Billion | | 0.03% |
The Manager may have, at its discretion, voluntarily waived all or any portion of its administration fees for the Fund or share class, which are included in administration fees waived in the Consolidated Statement of Operations. For the six months ended February 28, 2017, the amount waived was $25,758.
Transfer Agent: Pursuant to written agreements, certain financial intermediaries, some of which may be affiliates, provide the Fund with sub-accounting, recordkeeping, sub-transfer agency and other administrative services with respect to sub-accounts they service. For these services, these entities receive an asset-based fee or an annual fee per shareholder account, which will vary depending on share class and/or net assets.
The Manager maintains a call center that is responsible for providing certain shareholder services to the Fund. Shareholder services include responding to inquiries and processing subscriptions and redemptions based upon instructions from shareholders. For the six months ended February 28, 2017, the Fund reimbursed the Manager the following amounts for costs incurred in running the call center, which are included in transfer agent — class specific in the Consolidated Statement of Operations:
| | | | | | | | |
| Institutional | | Investor A | | Investor C | | Total | |
$114 | | $49 | | $7 | | $ | 170 | |
For the six months ended February 28, 2017, the following table shows the class specific transfer agent fees borne directly by each class of the Fund: | |
| Institutional | | Investor A | | Investor C | | Total | |
$3,077 | | $2,840 | | $582 | | $ | 6,499 | |
Other Fees: For the six months ended February 28, 2017, affiliates earned underwriting discounts, direct commissions and dealer concessions on sales of the Fund’s Investor A Shares of $28.
Expense Limitations, Waivers, Reimbursements and Recoupments: With respect to the Fund, the Manager contractually agreed to waive and/or reimburse fees or expenses in order to limit miscellaneous expenses of the Fund (excluding extraordinary expenses (including litigation expenses) not incurred in the ordinary course of the Fund’s business, if any. The expense limitation as a percentage of average daily net assets is 0.16% for Institutional, Investor A and Investor C Shares. The Manager has agreed not to reduce or discontinue this contractual waiver or reimbursement prior to January 1, 2018 unless approved by the Board, including a majority of the independent trustees, or by a majority of the outstanding voting securities of the Fund. For the six months ended February 28, 2017, the Manager reimbursed expenses of $234,689, which is included in expenses reimbursed by the Manager in the Consolidated Statement of Operations.
| | | | | | |
| 52 | | BLACKROCK MULTI-MANAGER ALTERNATIVE STRATEGIES FUND | | FEBRUARY 28, 2017 | | |
| | | | |
| Notes to Consolidated Financial Statements (continued) | | | | |
These amounts waived and/or reimbursed are shown as transfer agent fees waived — class specific and transfer agent fees reimbursed — class specific, respectively, in the Consolidated Statement of Operations. Class specific expense waivers and/or reimbursements are as follows:
| | | | | | | | | | | | | | | | |
| | | Share Classes | |
| | | Institutional | | | Investor A | | | Investor C | | | Total | |
Transfer agent fees waived | | $ | 93 | | | $ | 49 | | | $ | 7 | | | $ | 149 | |
Transfer agent fees reimbursed | | $ | 2,951 | | | $ | 2,787 | | | $ | 574 | | | $ | 6,312 | |
With respect to the Fund, the Manager voluntarily agreed to waive its investment advisory fees by the amount of investment advisory fees the Fund pays to the Manager indirectly through its investment in affiliated money market funds (the “affiliated money market fund waiver”). This amount is included in fees waived by the Manager in the Consolidated Statement of Operations. For the six months ended February 28, 2017, the amount waived was $290.
The Manager has contractually agreed to waive its advisory fee with respect to any portion of the Fund’s assets invested in affiliated equity and fixed-income mutual funds and effective September 1, 2016, voluntarily agreed to waive its investment advisory fee with respect to any portion of the Fund’s assets invested in affiliated exchange-traded funds that have a contractual management fee. Effective December 29, 2016, the waiver became contractual through December 31, 2017. This contractual agreement may be terminated upon 90 days’ notice by a majority of the Independent Trustees or by a vote of a majority of the outstanding voting securities of the Fund. This amount is included in fees waived by the Manager in the Consolidated Statement of Operations. For the six months ended February 28, 2017, the amount waived was $52,152.
With respect to the contractual expense caps, if during the Fund’s fiscal year the operating expenses of a share class, that at any time during the prior two fiscal years received a waiver and/or reimbursement from the Manager, are less than the expense cap for that share class, the Manager is entitled to be reimbursed by such share class up to the lesser of the following expenses:
| | (a) | The amount of fees waived and/or expenses reimbursed during those prior two fiscal years under the agreement. |
| | (b) | The amount by which the expense cap for that share class exceeds the operating expenses of the share class for the current fiscal year, provided that: |
| | • | | The Fund, of which the share class is a part, has more than $50 million in assets for the fiscal year. |
| | • | | The Manager or an affiliate continues to serve as the Fund’s investment adviser or administrator. |
In the event the expense cap for a share class is changed subsequent to a fiscal year in which the Manager becomes entitled to reimbursement for fees waived or reimbursed, the amount available to reimburse the Manager shall be calculated by reference to the expense cap for that share class in effect at the time the Manager became entitled to receive such reimbursement, rather than the subsequently changed expense cap for that share class.
For the six months ended February 28, 2017, the Manager recouped class specific waivers and/or reimbursements previously recorded by the Fund in the amount of $55 for Institutional Shares.
On February 28, 2017, the Fund level and class specific waivers and/or reimbursements subject to possible future recoupment under the expense limitation agreement are as follows:
| | | | | | | | | | | | |
| | | Expires August 31, | |
| | | 2017 | | | 2018 | | | 2019 | |
Fund Level | | $ | 523,889 | | | $ | 784,596 | | | $ | 260,447 | |
Institutional | | $ | 3,818 | | | $ | 5,864 | | | $ | 3,044 | |
Investor A | | $ | 344 | | | $ | 3,206 | | | $ | 2,836 | |
Investor C | | $ | 144 | | | $ | 382 | | | $ | 581 | |
Interfund Lending: In accordance with an exemptive order (the “Order”) from the U.S. Securities and Exchange Commission, the Fund may participate in a joint lending and borrowing facility for temporary purposes (the “Interfund Lending Program”), subject to compliance with the terms and conditions of the Order, and to the extent permitted by the Fund’s investment policies and restrictions. The Fund is currently permitted to borrow and lend under the Interfund Lending Program.
The Fund may lend in aggregate up to 15% of its net assets, but may not lend more than 5% of its net assets to any one borrowing fund through the Interfund Lending Program. The Fund may not borrow through the Interfund Lending Program or from any other source more than 33 1/3% of its total assets (or any lower threshold provided for by the Fund’s investment restrictions). If the Fund’s total outstanding borrowings exceed 10% of its total assets, each of its outstanding interfund loans will be subject to collateralization of at least 102% of the outstanding principal value of the loan. All interfund loans are for temporary or emergency purposes and the interest rate to be charged will be the average of the highest current overnight repurchase agreement rate available to a lending fund and the bank loan rate, as calculated according to a formula established by the Board.
| | | | | | |
| | | BLACKROCK MULTI-MANAGER ALTERNATIVE STRATEGIES FUND | | FEBRUARY 28, 2017 | | 53 |
| | | | |
| Notes to Consolidated Financial Statements (continued) | | | | |
During the period ended February 28, 2017, the Fund did not participate in the Interfund Lending Program.
Officers and Trustees Fees: Certain officers and/or trustees of the Trust are officers and/or directors of BlackRock or its affiliates. The Fund reimburses the Manager for a portion of the compensation paid to the Fund’s Chief Compliance Officer, which is included in Officer and Trustees in the Consolidated Statement of Operations.
7. Purchases and Sales:
For the six months ended February 28, 2017, purchases and sales of investments, including paydowns and excluding short-term securities, were $58,725,453 and $65,577,608, respectively.
8. Income Tax Information:
It is the Fund’s policy to comply with the requirements of the Internal Revenue Code of 1986, as amended, applicable to regulated investment companies, and to distribute substantially all of its taxable income to its shareholders. Therefore, no federal income tax provision is required.
The Fund files U.S. federal and various state and local tax returns. No income tax returns are currently under examination. The statute of limitations on the Fund’s U.S. federal tax returns generally remains open for the two years ended August 31, 2016 and the period ended August 31, 2014. The statutes of limitations on the Fund’s state and local tax returns may remain open for an additional year depending upon the jurisdiction.
Management has analyzed tax laws and regulations and their application to the Fund as of February 28, 2017, inclusive of the open tax return years, and does not believe that there are any uncertain tax positions that require recognition of a tax liability in the Fund’s financial statements.
As of August 31, 2016, the Fund had a capital loss carryforwards, with no expiration dates, available to offset its future realized capital gains of $2,568,202.
As of February 28, 2017, gross unrealized appreciation and depreciation based on cost for federal income tax purposes were as follows:
| | | | |
Tax cost | | $ | 94,691,067 | |
| | | | |
Gross unrealized appreciation | | $ | 3,619,042 | |
Gross unrealized depreciation | | | (1,945,926 | ) |
| | | | |
Net unrealized appreciation | | $ | 1,673,116 | |
| | | | |
9. Bank Borrowings:
The Trust, on behalf of the Fund, along with certain other funds managed by the Manager and its affiliates (“Participating Funds”), is a party to a 364-day, $2.1 billion credit agreement with a group of lenders. Under this agreement, the Fund may borrow to fund shareholder redemptions. Excluding commitments designated for certain individual funds, the Participating Funds, including the Fund, can borrow up to an aggregate commitment amount of $1.6 billion at any time outstanding, subject to asset coverage and other limitations as specified in the agreement. The credit agreement has the following terms: a fee of 0.12% per annum on unused commitment amounts and interest at a rate equal to the higher of (a) one-month LIBOR (but, in any event, not less than 0.00%) on the date the loan is made plus 0.80% per annum or (b) the Fed Funds rate (but, in any event, not less than 0.00%) in effect from time to time plus 0.80% per annum on amounts borrowed. The agreement expires in April 2017 unless extended or renewed. Participating Funds paid administration, legal and arrangement fees, which, if applicable, are included in miscellaneous expenses in the Consolidated Statement of Operations. These fees were allocated among such funds based upon portions of the aggregate commitment available to them and relative net assets of Participating Funds. During the six months ended February 28, 2017, the Fund did not borrow under the credit agreement.
10. Principal Risks:
In the normal course of business, the Fund invests in securities and enters into transactions where risks exist due to fluctuations in the market (market risk) or failure of the issuer to meet all its obligations, including the ability to pay principal and interest when due (issuer credit risk). The value of securities held by the Fund may decline in response to certain events, including those directly involving the issuers of securities owned by the Fund. Changes arising from the general economy, the overall market and local, regional or global political and/or social instability, as well as currency, interest rate and price fluctuations, may also affect the securities’ value.
Many municipalities insure repayment of their bonds, which may reduce the potential for loss due to credit risk. The market value of these bonds may fluctuate for other reasons, including market perception of the value of such insurance, and there is no guarantee that the insurer will meet its obligation. Inventories of municipal bonds held by brokers and dealers may decrease, which would lessen their ability to make a market in these securities. Such a reduction in market making capacity could potentially decrease the Fund’s ability to buy or sell bonds. As a result, the Fund may sell a security at a lower price, sell other securities to raise cash, or give up an investment opportunity, any of which could have a negative impact on performance. If the Fund needed to sell large blocks of bonds, those sales could further reduce the bonds’ prices and impact performance.
| | | | | | |
| 54 | | BLACKROCK MULTI-MANAGER ALTERNATIVE STRATEGIES FUND | | FEBRUARY 28, 2017 | | |
| | | | |
| Notes to Consolidated Financial Statements (continued) | | | | |
The Fund may be exposed to prepayment risk, which is the risk that borrowers may exercise their option to prepay principal earlier than scheduled during periods of declining interest rates, which would force the Fund to reinvest in lower yielding securities. The Fund may also be exposed to reinvestment risk, which is the risk that income from the Fund’s portfolio will decline if the Fund invests the proceeds from matured, traded or called fixed income securities at market interest rates that are below the Fund portfolio’s current earnings rate.
Valuation Risk: The market values of equities, such as common stocks and preferred securities or equity related investments, such as futures and options, may decline due to general market conditions which are not specifically related to a particular company. They may also decline due to factors which affect a particular industry or industries. The Fund may invest in illiquid investments and may experience difficulty in selling those investments in a timely manner at the price that it believes the investments are worth. Prices may fluctuate widely over short or extended periods in response to company, market or economic news. Markets also tend to move in cycles, with periods of rising and falling prices. This volatility may cause the Fund’s NAV to experience significant increases or decreases over short periods of time. If there is a general decline in the securities and other markets, the NAV of the Fund may lose value, regardless of the individual results of the securities and other instruments in which the Fund invests.
The price the Fund could receive upon the sale of any particular portfolio investment may differ from the Fund’s valuation of the investment, particularly for securities that trade in thin or volatile markets or that are valued using a fair valuation technique or a price provided by an independent pricing service. Changes to significant unobservable inputs and assumptions (i.e., publicly traded company multiples, growth rate, time to exit) due to the lack of observable inputs may significantly impact the resulting fair value and therefore the Fund’s results of operations. As a result, the price received upon the sale of an investment may be less than the value ascribed by the Fund, and the Fund could realize a greater than expected loss or lesser than expected gain upon the sale of the investment. The Fund’s ability to value its investments may also be impacted by technological issues and/or errors by pricing services or other third party service providers.
Counterparty Credit Risk: Similar to issuer credit risk, the Fund may be exposed to counterparty credit risk, or the risk that an entity may fail to or be unable to perform on its commitments related to unsettled or open transactions. The Fund manages counterparty credit risk by entering into transactions only with counterparties that the Manager believes have the financial resources to honor their obligations and by monitoring the financial stability of those counterparties. Financial assets, which potentially expose the Fund to market, issuer and counterparty credit risks, consist principally of financial instruments and receivables due from counterparties. The extent of the Fund’s exposure to market, issuer and counterparty credit risks with respect to these financial assets is approximately their value recorded in the Consolidated Statement of Assets and Liabilities, less any collateral held by the Fund.
A derivative contract may suffer a mark-to-market loss if the value of the contract decreases due to an unfavorable change in the market rates or values of the underlying instrument. Losses can also occur if the counterparty does not perform under the contract.
The Fund’s risk of loss from counterparty credit risk on OTC derivatives is generally limited to the aggregate unrealized gain less the value of any collateral held by the Fund.
For OTC options purchased, the Fund bears the risk of loss in the amount of the premiums paid plus the positive change in market values net of any collateral held by the Fund should the counterparty fail to perform under the contracts. Options written by the Fund do not typically give rise to counterparty credit risk, as options written generally obligate the Fund, and not the counterparty, to perform. The Fund may be exposed to counterparty credit risk with respect to options written to the extent the Fund deposits collateral with its counterparty to a written option.
With exchange-traded options purchased, futures and centrally cleared swaps, there is less counterparty credit risk to the Fund since the exchange or clearinghouse, as counterparty to such instruments, guarantees against a possible default. The clearinghouse stands between the buyer and the seller of the contract; therefore, credit risk is limited to failure of the clearinghouse. While offset rights may exist under applicable law, the Fund does not have a contractual right of offset against a clearing broker or clearinghouse in the event of a default (including the bankruptcy or insolvency). Additionally, credit risk exists in exchange-traded futures and centrally cleared swaps with respect to initial and variation margin that is held in a clearing broker’s customer accounts. While clearing brokers are required to segregate customer margin from their own assets, in the event that a clearing broker becomes insolvent or goes into bankruptcy and at that time there is a shortfall in the aggregate amount of margin held by the clearing broker for all its clients, typically the shortfall would be allocated on a pro rata basis across all the clearing broker’s customers, potentially resulting in losses to the Fund.
Concentration Risk: The Fund invests a significant portion of its assets in fixed income securities and/or uses derivatives tied to the fixed income markets. Changes in market interest rates or economic conditions may affect the value and/or liquidity of such investments. Interest rate risk is the risk that prices of bonds and other fixed income securities will increase as interest rates fall and decrease as interest rates rise. The Fund may be subject to a greater risk of rising interest rates due to the current period of historically low rates.
| | | | | | |
| | | BLACKROCK MULTI-MANAGER ALTERNATIVE STRATEGIES FUND | | FEBRUARY 28, 2017 | | 55 |
| | | | |
| Notes to Consolidated Financial Statements (concluded) | | | | |
11. Capital Share Transactions:
Transactions in capital shares for each class were as follows:
| | | | | | | | | | | | | | | | | | | | |
| | | Six Months Ended
February 28, 2017 | | | | | | Year Ended
August 31, 2016 | |
| Institutional | | Shares | | | Amount | | | | | | Shares | | | Amount | |
Shares sold | | | 2,286 | | | $ | 22,222 | | | | | | | | 368,646 | | | $ | 3,551,267 | |
Shares issued in reinvestment of distributions. | | | 4,188 | | | | 40,546 | | | | | | | | 1,732 | | | | 16,434 | |
Shares redeemed | | | (47,645 | ) | | | (466,128 | ) | | | | | | | (462,839 | ) | | | (4,406,410 | ) |
| | | | | | | | | | | | |
Net decrease | | | (41,171 | ) | | $ | (403,360 | ) | | | | | | | (92,461 | ) | | $ | (838,709 | ) |
| | | | | | | | | | | | |
| | | | | | | | | | | | | | | | | | | | |
Investor A | | | | | | | | | | | | | | | | | | | | |
Shares sold | | | 76,975 | | | $ | 748,557 | | | | | | | | 398,553 | | | $ | 3,768,962 | |
Shares issued in reinvestment of distributions. | | | 4,978 | | | | 48,033 | | | | | | | | 1,217 | | | | 11,518 | |
Shares redeemed | | | (63,196 | ) | | | (614,942 | ) | | | | | | | (172,038 | ) | | | (1,624,039 | ) |
| | | | |
Net increase | | | 18,757 | | | $ | 181,648 | | | | | | | | 227,732 | | | $ | 2,156,441 | |
| | | | | | | | | | | | |
| | | | | | | | | | | | | | | | | | | | |
Investor C | | | | | | | | | | | | | | | | | | | | |
Shares sold | | | 2,330 | | | $ | 22,500 | | | | | | | | 13,211 | | | $ | 125,629 | |
Shares issued in reinvestment of distributions. | | | 110 | | | | 1,060 | | | | | | | | — | | | | — | |
Shares redeemed | | | (21,582 | ) | | | (207,995 | ) | | | | | | | (20,925 | ) | | | (196,505 | ) |
| | | | | | | | | | | | |
Net decrease | | | (19,142 | ) | | $ | (184,435 | ) | | | | | | | (7,714 | ) | | $ | (70,876 | ) |
| | | | | | | | | | | | |
Total Net Increase (Decrease) | | | (41,556 | ) | | $ | (406,147 | ) | | | | | | | 127,557 | | | $ | 1,246,856 | |
| | | | | | | | | | | | |
At February 28, 2017, shares owned by BlackRock HoldCo 2, Inc., an affiliate of the Fund, were as follows:
| | | | |
| Institutional | | Investor A | | Investor C |
| 9,980,000 | | 10,000 | | 10,000 |
12. Subsequent Events:
Management has evaluated the impact of all subsequent events on the Fund through the date the financial statements were issued and has determined that there were no subsequent events requiring adjustment or additional disclosure in the financial statements.
| | | | | | |
| 56 | | BLACKROCK MULTI-MANAGER ALTERNATIVE STRATEGIES FUND | | FEBRUARY 28, 2017 | | |
Rodney D. Johnson, Chair of the Board and Trustee
Susan J. Carter, Trustee
Collette Chilton, Trustee
Neil A. Cotty, Trustee
Cynthia A. Montgomery, Trustee
Joseph P. Platt, Trustee
Robert C. Robb, Jr., Trustee
Mark Stalnecker, Trustee
Kenneth L. Urish, Trustee
Claire A. Walton, Trustee
Frederick W. Winter, Trustee
John M. Perlowski, Trustee, President and Chief Executive Officer
Barbara G. Novick, Trustee
Thomas Callahan, Vice President
Jennifer McGovern, Vice President
Neal J. Andrews, Chief Financial Officer
Jay M. Fife, Treasurer
Charles Park, Chief Compliance Officer
Fernanda Piedra, Anti-Money Laundering Compliance Officer
Benjamin Archibald, Secretary
Effective December 31, 2016, David O. Beim and Dr. Matina S. Horner resigned as Trustees of the Trust.
| | | | | | |
| | | |
Investment Adviser and Administrator BlackRock Advisors, LLC Wilmington, DE 19809 | | Sub-Advisers Benefit Street Partners, LLC New York, NY 10019 | | QMS Capital Management LP Durham, NC 27707 | | Custodian The Bank of New York Mellon New York, NY 10286 |
| | | | | | |
Legal Counsel Sidley Austin LLP New York, NY 10019 | | GLG Partners LP London, W1J 5HB United Kingdom | | BlackRock International Limited Edinburgh, EH3 8BL United Kingdom | | Independent Registered Public Accounting Firm Deloitte & Touche LLP Philadelphia, PA 19103 |
| | | | | | |
Accounting Agent and Transfer Agent BNY Mellon Investment Servicing (US) Inc. Wilmington, DE 19809 | | Ionic Capital Management LLC New York, NY 10017 LibreMax Capital, LLC New York, NY 10022 Marathon Asset Management, LP New York, NY 10036 Pine River Capital Management L.P. Minnetonka, MN 55305 | | BlackRock Asset Management North Asia Limited 2 Queen’s Road Central Hong Kong BlackRock Singapore Limited 079912 Singapore | | Distributor BlackRock Investments, LLC New York, NY 10022 Address of the Trust 100 Bellevue Parkway Wilmington, DE 19809 |
| | | | | | |
| | | BLACKROCK MULTI-MANAGER ALTERNATIVE STRATEGIES FUND | | FEBRUARY 28, 2017 | | 57 |
Householding
The Fund will mail only one copy of shareholder documents, including prospectuses, annual and semi-annual reports and proxy statements, to shareholders with multiple accounts at the same address. This practice is commonly called “householding” and is intended to reduce expenses and eliminate duplicate mailings of shareholder documents. Mailings of your shareholder documents may be householded indefinitely unless you instruct us otherwise. If you do not want the mailing of these documents to be combined with those for other members of your household, please contact the Fund at (800) 441-7762.
Availability of Quarterly Portfolio Schedule of Investments
The Fund files its complete schedule of portfolio holdings with the SEC for the first and third quarters of each fiscal year on Form N-Q. The Fund’s Forms N-Q are available on the SEC’s website at http://www.sec.gov and may also be reviewed and copied at the SEC’s Public Reference Room in Washington, D.C. Information on the operation of the Public Reference Room or how to access documents on the SEC’s website without charge may be obtained by calling (800) SEC-0330. The Fund’s Forms N-Q may also be obtained upon request and without charge by calling (800) 441-7762.
Availability of Proxy Voting Policies and Procedures
A description of the policies and procedures that the Fund uses to determine how to vote proxies relating to portfolio securities is available upon request and without charge (1) by calling (800) 441-7762; (2) at http://www.blackrock.com; and (3) on the SEC’s website at http://www.sec.gov.
Availability of Proxy Voting Record
Information about how the Fund voted proxies relating to securities held in the Fund’s portfolio during the most recent 12-month period ended June 30 is available upon request and without charge (1) at http://www.blackrock.com or by calling (800) 441-7762 and (2) on the SEC’s website at http://www.sec.gov.
BlackRock’s Mutual Fund Family
BlackRock offers a diverse lineup of open-end mutual funds crossing all investment styles and managed by experts in equity, fixed income and tax-exempt investing. Visit http://www.blackrock.com for more information.
Account Information
Call us at (800) 441-7762 from 8:00 AM to 6:00 PM ET on any business day to get information about your account balances, recent transactions and share prices. You can also reach us on the Web at http://www.blackrock.com/funds.
Automatic Investment Plans
Investor Class shareholders who want to invest regularly can arrange to have $50 or more automatically deducted from their checking or savings account and invested in any of the BlackRock funds.
Systematic Withdrawal Plans
Investor Class shareholders can establish a systematic withdrawal plan and receive periodic payments of $50 or more from their BlackRock funds, as long as their account balance is at least $10,000.
Retirement Plans
Shareholders may make investments in conjunction with Traditional, Rollover, Roth, Coverdell, Simple IRA’s, SEP IRA’s and 403(b) Plans.
| | | | | | |
| 58 | | BLACKROCK MULTI-MANAGER ALTERNATIVE STRATEGIES FUND | | FEBRUARY 28, 2017 | | |
| | | | |
| Additional Information (concluded) | | | | |
|
| BlackRock Privacy Principles |
BlackRock is committed to maintaining the privacy of its current and former fund investors and individual clients (collectively, “Clients”) and to safeguarding their non-public personal information. The following information is provided to help you understand what personal information BlackRock collects, how we protect that information and why in certain cases we share such information with select parties.
If you are located in a jurisdiction where specific laws, rules or regulations require BlackRock to provide you with additional or different privacy-related rights beyond what is set forth below, then BlackRock will comply with those specific laws, rules or regulations.
BlackRock obtains or verifies personal non-public information from and about you from different sources, including the following: (i) information we receive from you or, if applicable, your financial intermediary, on applications, forms or other documents; (ii) information about your transactions with us, our affiliates, or others; (iii) information we receive from a consumer reporting agency; and (iv) from visits to our websites.
BlackRock does not sell or disclose to non-affiliated third parties any non-public personal information about its Clients, except as permitted by lawor as is necessary to respond to regulatory requests or to service Client accounts. These non-affiliated third parties are required to protect the confidentiality and security of this information and to use it only for its intended purpose.
We may share information with our affiliates to service your account or to provide you with information about other BlackRock products or services that may be of interest to you. In addition, BlackRock restricts access to non-public personal information about its Clients to those BlackRock employees with a legitimate business need for the information. BlackRock maintains physical, electronic and procedural safeguards that are designed to protect the non-public personal information of its Clients, including procedures relating to the proper storage and disposal of such information.
| | | | | | |
| | | BLACKROCK MULTI-MANAGER ALTERNATIVE STRATEGIES FUND | | FEBRUARY 28, 2017 | | 59 |
This report is intended for current holders. It is not authorized for use as an offer of sale or a solicitation of an offer to buy shares of the Fund unless preceded or accompanied by the Fund’s current prospectus. Past performance results shown in this report should not be considered a representation of future performance. Investment returns and principal value of shares will fluctuate so that shares, when redeemed, may be worth more or less than their original cost. Statements and other information herein are as dated and are subject to change.

| | |
| |
MMAS-2/17-SAR | |  |
| | |
| Item 2 – | | Code of Ethics – Not Applicable to this semi-annual report |
| |
| Item 3 – | | Audit Committee Financial Expert – Not Applicable to this semi-annual report |
| |
| Item 4 – | | Principal Accountant Fees and Services – Not Applicable to this semi-annual report |
| |
| Item 5 – | | Audit Committee of Listed Registrants – Not Applicable |
| |
| Item 6 – | | Investments |
| | (a) The registrant’s Schedule of Investments is included as part of the Report to Stockholders filed under Item 1 of this Form. |
| | (b) Not Applicable due to no such divestments during the semi-annual period covered since the previous Form N-CSR filing. |
| |
| Item 7 – | | Disclosure of Proxy Voting Policies and Procedures for Closed-End Management Investment Companies – Not Applicable |
| |
| Item 8 – | | Portfolio Managers of Closed-End Management Investment Companies – Not Applicable |
| |
| Item 9 – | | Purchases of Equity Securities by Closed-End Management Investment Company and Affiliated Purchasers – Not Applicable |
| |
| Item 10 – | | Submission of Matters to a Vote of Security Holders –There have been no material changes to these procedures. |
| |
| Item 11 – | | Controls and Procedures |
| |
| | (a) – The registrant’s principal executive and principal financial officers, or persons performing similar functions, have concluded that the registrant’s disclosure controls and procedures (as defined in Rule 30a- 3(c) under the Investment Company Act of 1940, as amended (the “1940 Act”)) are effective as of a date within 90 days of the filing of this report based on the evaluation of these controls and procedures required by Rule 30a-3(b) under the 1940 Act and Rule 15d-15(b) under the Securities Exchange Act of 1934, as amended. |
| |
| | (b) – There were no changes in the registrant’s internal control over financial reporting (as defined in Rule 30a-3(d) under the 1940 Act) that occurred during the second fiscal quarter of the period covered by this report that have materially affected, or are reasonably likely to materially affect, the registrant’s internal control over financial reporting. |
| |
| Item 12 – | | Exhibits attached hereto |
| |
| | (a)(1) – Code of Ethics – Not Applicable to this semi-annual report |
| |
| | (a)(2) – Certifications – Attached hereto |
| |
| | (a)(3) – Not Applicable |
| |
| | (b) – Certifications – Attached hereto |
2
Pursuant to the requirements of the Securities Exchange Act of 1934 and the Investment Company Act of 1940, the registrant has duly caused this report to be signed on its behalf by the undersigned, thereunto duly authorized.
BlackRock Funds
| | | | |
| By: | | /s/ John M. Perlowski | | |
| | John M. Perlowski | | |
| | Chief Executive Officer (principal executive officer) of |
| | BlackRock Funds | | |
Date: May 3, 2017
Pursuant to the requirements of the Securities Exchange Act of 1934 and the Investment Company Act of 1940, this report has been signed below by the following persons on behalf of the registrant and in the capacities and on the dates indicated.
| | | | |
| By: | | /s/ John M. Perlowski | | |
| | John M. Perlowski | | |
| | Chief Executive Officer (principal executive officer) of |
| | BlackRock Funds | | |
Date: May 3, 2017
| | | | |
| By: | | /s/ Neal J. Andrews | | |
| | Neal J. Andrews | | |
| | Chief Financial Officer (principal financial officer) of |
| | BlackRock Funds | | |
Date: May 3, 2017
3